Embed Size (px)
Citation preview
This work is licensed under a Creative Commons Attribution-Non Commercial 4.0 International License (http://creativecommons.org/licenses/by-nc/4.0/) and may be adapted or reproduced with attribution to the IRI and for any non-commercial purpose.
Indian Ocean Dipole (IOD)Rainfall Probability Training
March 06, 2017
International Research Institute for Climate and Society (IRI), (2016). El Nino-Southern Oscillation (ENSO) Rainfall Probability Training - Tanzania, March 09, Version 1.0. Palisades: IRI.
ENHANCED NATIONAL CLIMATE SERVICES
Training ModuleTanzaniaMarch 06, 2017Version 1.0

Acknowledgements The ENACTS team, wishes to thank all the individuals and institutions that contributed in the many ways to the preparation of this manual. The shared technical knowledge, experiences, and perspectives have produced a training module that will have a significant positive impact on the capability of strengthening the ENACTS tools in various East African countries. Special thanks are extended to the IRI staff members who collaborated in the preparation of the different manuals: Dr. Pietro Ceccato, Luz Cervantes, John delCorral, Dr. Tufa Dinku, Igor Khomyakov, Aisha Owusu, Yohana Tesfamariam Tekeste and Dr. Madeleine Thomson. The preparation of this manual would not have been possible without the support provided by our donors WHO -‐ Global Framework for Climate Services and UK DfID WISER ENACTS and we extend sincere appreciation to our donors.
CONTENTS
1 Indian Ocean Dipole (IOD) Rainfall Probability Training - Tanzania 11.1 Indian Ocean Dipole (IOD) Impact in Eastern Africa . . . . . . . . . . . . . . . . . . . . . . . . . . 11.2 Overview . . . . . . . . . . . . . . . . . . . . . . . . . . . . . . . . . . . . . . . . . . . . . . . . . 11.3 Definition . . . . . . . . . . . . . . . . . . . . . . . . . . . . . . . . . . . . . . . . . . . . . . . . . 31.4 Interpretation . . . . . . . . . . . . . . . . . . . . . . . . . . . . . . . . . . . . . . . . . . . . . . . 31.5 Access . . . . . . . . . . . . . . . . . . . . . . . . . . . . . . . . . . . . . . . . . . . . . . . . . . 31.6 Case Study - Ethiopia . . . . . . . . . . . . . . . . . . . . . . . . . . . . . . . . . . . . . . . . . . 41.7 Exercise - Tanzania . . . . . . . . . . . . . . . . . . . . . . . . . . . . . . . . . . . . . . . . . . . . 51.8 Quiz . . . . . . . . . . . . . . . . . . . . . . . . . . . . . . . . . . . . . . . . . . . . . . . . . . . 81.9 Summary . . . . . . . . . . . . . . . . . . . . . . . . . . . . . . . . . . . . . . . . . . . . . . . . . 81.10 Reference(s) . . . . . . . . . . . . . . . . . . . . . . . . . . . . . . . . . . . . . . . . . . . . . . . 8
i

ii
CHAPTER
ONE
INDIAN OCEAN DIPOLE (IOD) RAINFALL PROBABILITY TRAINING -TANZANIA
1.1 Indian Ocean Dipole (IOD) Impact in Eastern Africa
Across much of Eastern Africa, the annual cycle of rainfall tends to bi-modal, with rainy seasons in Oct-Dec (the shortrains) and Mar-May (the long rains). Year-to-year variability of the short rains is frequently associated with ENSO(Mason and Goddard 2001) but this connection depends critically on sea surface temperatures in the Indian Ocean,not just the Pacific. El Niño is typically associated with wetter than average conditions while La Nina is frequentlyassociated with drought in short (October, November December; OND) rainy season. An Indian Ocean dipole (IOD;its positive phase manifest as warmer than average SSTs in the west tropical Indian Ocean and cooler than averageSSTs in the east tropical Indian Ocean) is also associated with enhanced short rains; its opposite phase with drier thanaverage conditions. The IOD has been associated with changes in malaria risk in Kenya (Masahiro Hashizume. et al.2009) but its occurrence is often (although not always) linked to ENSO. Variability of the long rains (MAM) does notexhibit any consistent and robust relationship to either ENSO or the IOD on the seasonal time scale (Lyon and DeWitt2012). Thus it is observed that the two rainy seasons in East Africa act independently and there is no statisticallysignificant temporal correlation between rainfall totals in these two seasons (Lyon 2014).
1.2 Overview
Why was it developed?
• The (IOD) Indian Ocean Dipole Rainfall Probability Mappages were initially created to help stakeholders iden-tify whether or not rainfall in their country, region, or district of interest was historically associated with IOD.Where strong relationships exist, rainfall is potentially predictable using IOD informed seasonal climate fore-casts.
What can the IOD Rainfall Probability Maproom be used for?
• Assessing the historical probability of rainfall for a particular season and within a certain IOD phase for aspecific region or district
• Visualizing the spatial extent of IOD climate impacts
What can the IOD Rainfall Probability Maproom NOT be used for?
• Providing information on the current IOD event
1

Indian Ocean Dipole (IOD) Rainfall Probability Training - Tanzania, Release 1.0.0
a)
b)
c)
Fig. 1.1: Positive IOD (a), Neutral IOD (b) and Negative IOD (c) [1]
2 Chapter 1. Indian Ocean Dipole (IOD) Rainfall Probability Training - Tanzania

Indian Ocean Dipole (IOD) Rainfall Probability Training - Tanzania, Release 1.0.0
1.3 Definition
The IOD is defined as the difference between SST anomalies of a West box average (50E-70E, 10S-10N) and anEast box average (90E-110E, 10S-0N). Anomalies are computed for and with respect to the period of rainfall dataavailability (1983-2014). The IOD is categorized in 3 Tercile classes and the positive tercile indicates warmer SSTconditions in the West compared to the East.
Clicking on the map will then display, for the selected point, yearly seasonal rainfall averages time series. The colorsof the bars depict what IOD Tercile it was that year, and the horizontal lines show the historical terciles limits. Thisallows to quickly picture what years fell into what IOD Tercile and into what Rainfall Tercile category.
While the IOD is often referred to as a distinct feature of climate variability, a similar pattern of sea surface temperaturevariations on the Indian Ocean often occurs as a response to ENSO in the Pacific Ocean. That is, the two phenomenaare often related. As a result, one should expect similar impacts of El Niño (La Niña) phase and Positive (Negative)IOD to climate in Eastern and Southern Africa. Therefore, this Maproom doesn’t exhibit an independent feature thatcomes on top of the information that is displayed by the ENSO Maprooms, but rather complementary information thatcan help intricate the delicate cases when ENSO and IOD could be out of sync at some critical seasons.
1.4 Interpretation
Figure 1.3 is an example of the historical probability of seasonal average monthly rainfall product conditioned onPositive IOD Tercile during the July-August-September season, and falling within the upper (wet) one-third (“tercile”)of the 1983-2014 historical distribution in rainfall for Tanzania. Please note that this is not a forecast.
And also please note that when interpreting the graph, each tick represents the beginning of the year (look at Figure1.3).
Jan Jan Jan Jan Jan Jan1985 1990 1995 2000 2005 2010
Time
3040
50 A
djus
ted
Rai
n Fa
ll Es
timat
e [m
m]
Rainfall Tercile 0.66667Rainfall Tercile 0.33333
This tick represents the beginning
of 1982
Fig. 1.2: Explanation on the ticks: Each tick on the time axis (x-axis), marks the beginning of the respective year
1.5 Access
The IOD Rainfall Mapage can be accessed via the Climate Forecast Maproom. http://maproom.meteo.go.tz/maproom/Climatology/Climate_Forecast/IOD_Prob_Precip.html
The Maproom allows you to create an analysis by 3-month period (e.g. Jan-Mar), ENSO state (El Niño, La Niña andNeutral), and rainfall outcome/tercile (wet, normal or dry).
1.3. Definition 3
Indian Ocean Dipole (IOD) Rainfall Probability Training - Tanzania, Release 1.0.0
Tercile Wet iod Positive
28˚E 30˚E 32˚E 34˚E 36˚E 38˚E 40˚E 42˚ELongitude
12˚S
10˚S
8˚S
6˚S
4˚S
2˚S
0˚La
titud
e
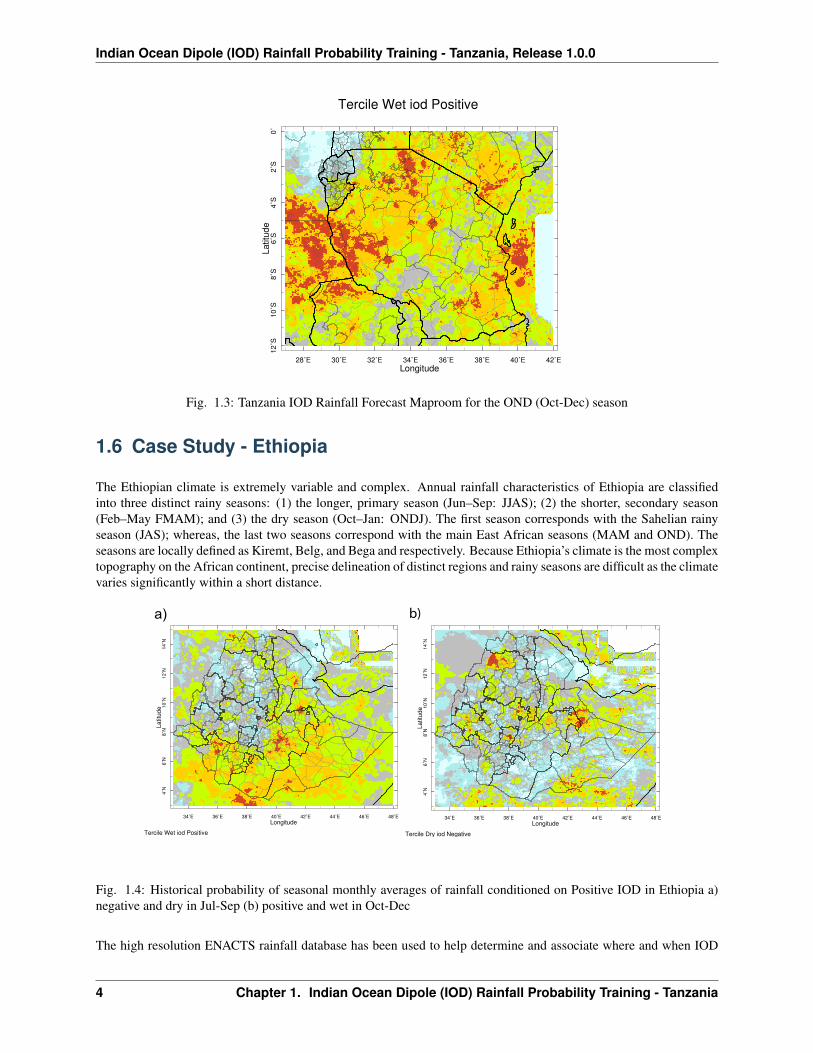
Fig. 1.3: Tanzania IOD Rainfall Forecast Maproom for the OND (Oct-Dec) season
1.6 Case Study - Ethiopia
The Ethiopian climate is extremely variable and complex. Annual rainfall characteristics of Ethiopia are classifiedinto three distinct rainy seasons: (1) the longer, primary season (Jun–Sep: JJAS); (2) the shorter, secondary season(Feb–May FMAM); and (3) the dry season (Oct–Jan: ONDJ). The first season corresponds with the Sahelian rainyseason (JAS); whereas, the last two seasons correspond with the main East African seasons (MAM and OND). Theseasons are locally defined as Kiremt, Belg, and Bega and respectively. Because Ethiopia’s climate is the most complextopography on the African continent, precise delineation of distinct regions and rainy seasons are difficult as the climatevaries significantly within a short distance.
a) b)
Tercile Wet iod Positive
34˚E 36˚E 38˚E 40˚E 42˚E 44˚E 46˚E 48˚ELongitude
4˚N
6˚N
8˚N
10˚N
12˚N
14˚N
Latit
ude
Tercile Dry iod Negative
34˚E 36˚E 38˚E 40˚E 42˚E 44˚E 46˚E 48˚ELongitude
4˚N
6˚N
8˚N
10˚N
12˚N
14˚N
Latit
ude
Fig. 1.4: Historical probability of seasonal monthly averages of rainfall conditioned on Positive IOD in Ethiopia a)negative and dry in Jul-Sep (b) positive and wet in Oct-Dec
The high resolution ENACTS rainfall database has been used to help determine and associate where and when IOD
4 Chapter 1. Indian Ocean Dipole (IOD) Rainfall Probability Training - Tanzania

Indian Ocean Dipole (IOD) Rainfall Probability Training - Tanzania, Release 1.0.0
impacts rainfall in Ethiopia, as seen in Figure 1.4. However, due to the relative short time series of 1983-2010 and therelatively few IOD events, it should be noted that the relationships observed may not be statistically significant.
1.6.1 Examples
Figure 1.5 displays the historical impact of IOD on rainfall via a bar graph product generated after setting the analysiscriteria to the following: (1) Region: Ethiopia; (2) Spatially Average Over: Zone, South Wollo, Amhara, Ethiopia; (3)Season: Jul-Sept; (4) Tercile: Dry; and (5) IOD Tercile: Positive.
Fig. 1.5: July – September Rainfall Conditioned on Positive Dry IOD
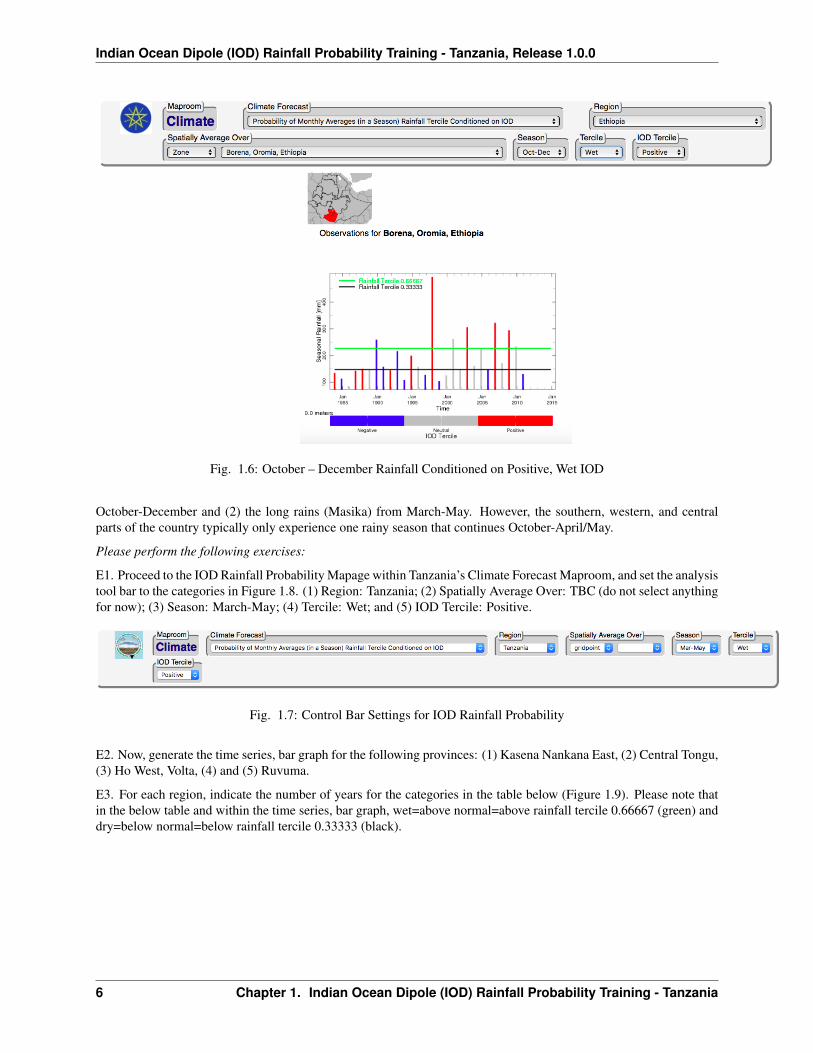
Figure 1.6 displays the historical impact of ENSO on rainfall via a bar graph product generated after setting theanalysis criteria to the following: (1) Region: Ethiopia; (2) Spatially Average Over: Zone, Borena, Oromia, Ethiopia;(3) Season: Oct-Dec; (4) Tercile: Wet; and (5) IOD Tercile: Positive.
As can be seen, this zone was heavily impacted by the 1998 positive IOD which was also an El Niño year withan extreme, above-normal rainfall. Furthermore, Borena has a tendency to have above normal rainfall during manypositive IOD years. However, there are notable positive IOD years when rainfall was normal or below normal.
1.6.2 Case Study Summary
In Ethiopia, the relationship between IOD and rainfall is significant and varies according to season and region.
1.7 Exercise - Tanzania
Tanzania has a tropical climate but has regional variations due to topography. Seasonal rainfall is driven mainly by themigration of the Intertropical Convergence Zone. It migrates southwards through Tanzania in October to December,reaching the south of the country in January and February, and returning northwards in March, April, and May. Thiscauses the north and east of Tanzania to experience two distinct rainy seasons – (1) the short rains (Vuli”) from
1.7. Exercise - Tanzania 5
Indian Ocean Dipole (IOD) Rainfall Probability Training - Tanzania, Release 1.0.0
Fig. 1.6: October – December Rainfall Conditioned on Positive, Wet IOD
October-December and (2) the long rains (Masika) from March-May. However, the southern, western, and centralparts of the country typically only experience one rainy season that continues October-April/May.
Please perform the following exercises:
E1. Proceed to the IOD Rainfall Probability Mapage within Tanzania’s Climate Forecast Maproom, and set the analysistool bar to the categories in Figure 1.8. (1) Region: Tanzania; (2) Spatially Average Over: TBC (do not select anythingfor now); (3) Season: March-May; (4) Tercile: Wet; and (5) IOD Tercile: Positive.
Fig. 1.7: Control Bar Settings for IOD Rainfall Probability
E2. Now, generate the time series, bar graph for the following provinces: (1) Kasena Nankana East, (2) Central Tongu,(3) Ho West, Volta, (4) and (5) Ruvuma.
E3. For each region, indicate the number of years for the categories in the table below (Figure 1.9). Please note thatin the below table and within the time series, bar graph, wet=above normal=above rainfall tercile 0.66667 (green) anddry=below normal=below rainfall tercile 0.33333 (black).
6 Chapter 1. Indian Ocean Dipole (IOD) Rainfall Probability Training - Tanzania
Indian Ocean Dipole (IOD) Rainfall Probability Training - Tanzania, Release 1.0.0
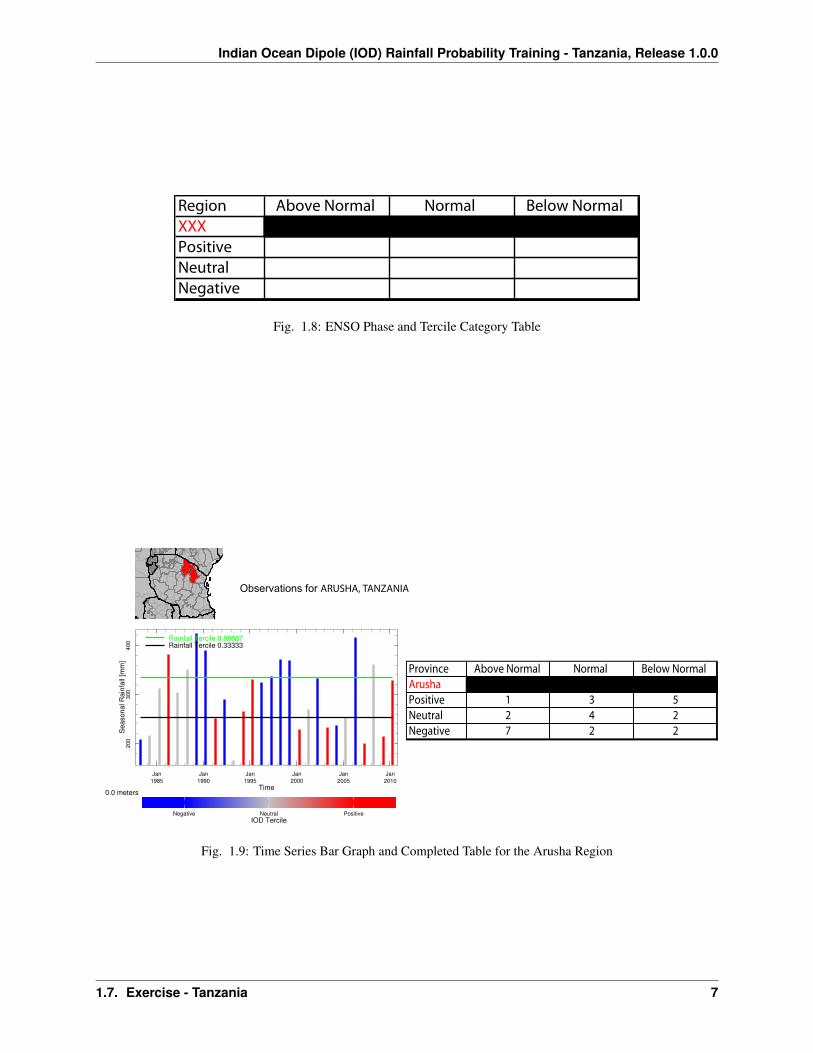
Region Above Normal Normal Below NormalXXXPositiveNeutralNegative
Fig. 1.8: ENSO Phase and Tercile Category Table
Observations for ARUSHA, TANZANIA
Province Above Normal Normal Below NormalArushaPositive 1 3 5Neutral 2 4 2Negative 7 2 2
0.0 meters
Jan Jan Jan Jan Jan Jan1985 1990 1995 2000 2005 2010
Time
200
300
400
Sea
sona
l Rai
nfal
l [m
m]
Rainfall Tercile 0.66667Rainfall Tercile 0.33333
Negative Neutral PositiveIOD Tercile
Fig. 1.9: Time Series Bar Graph and Completed Table for the Arusha Region
1.7. Exercise - Tanzania 7

Indian Ocean Dipole (IOD) Rainfall Probability Training - Tanzania, Release 1.0.0
1.7.1 Example - Kasena Nankana East District (Figure 1.9)
1.8 Quiz
Please answer the following questions using the ENSO Rainfall Probability Mapage, and figures and tables generatedin the previous exercise
Q1. In north and east of Tanzania, which rainy season has an increased possibility to be wetter than normal during apositive IOD? (a) October-December (b) March-May
Q2. What year(s) (if any) was consistently the wettest for all regions examined for Oct-Dec (OND) and associatedwith Positive IOD
Q3. Which region(s) had the highest, above-normal rainfalls associated with Positive IOD for OND?
Q4. How do the magnitudes of rainfall associated with Positive IOD events in Tanzania OND compare with that ofEthiopia OND? (a) Weaker (b) Same (c) Stronger
1.8.1 Quiz - Answers
A1. October-December
A2. 1986, 1997, 2006
A3. Rukwa, Tabora, Lindi, Mtwara provinces.
A4. (b) Stronger
1.9 Summary
IOD impacts the climate of Tanzania during the primary rainy season of October-December, especially within thenorthern and western regions.
1.10 Reference(s)
• Ihara, Chie, Yochanan Kushnir, and Mark A. Cane. “Warming trend of the Indian Ocean SST and Indian Oceandipole from 1880 to 2004.” Journal of Climate 21.10 (2008): 2035-2046.
Images
• http://www.bom.gov.au/climate/iod/ [1]
8 Chapter 1. Indian Ocean Dipole (IOD) Rainfall Probability Training - Tanzania