Embed Size (px)
Citation preview

Annual Report 2004
TV
A G
rou
p I
nc
.•
An
nu
al
Re
po
rt 2
00
4
tva.canoe.comA subsidiary of Quebecor Media Inc.
A KEEN SENSE OF THEPRESENT, A CLEAR
VISION FOR THE FUTURE
A KEEN SENSE OF THEPRESENT, A CLEAR
VISION FOR THE FUTURE

present A keen sense of the
a clear vision for
the future
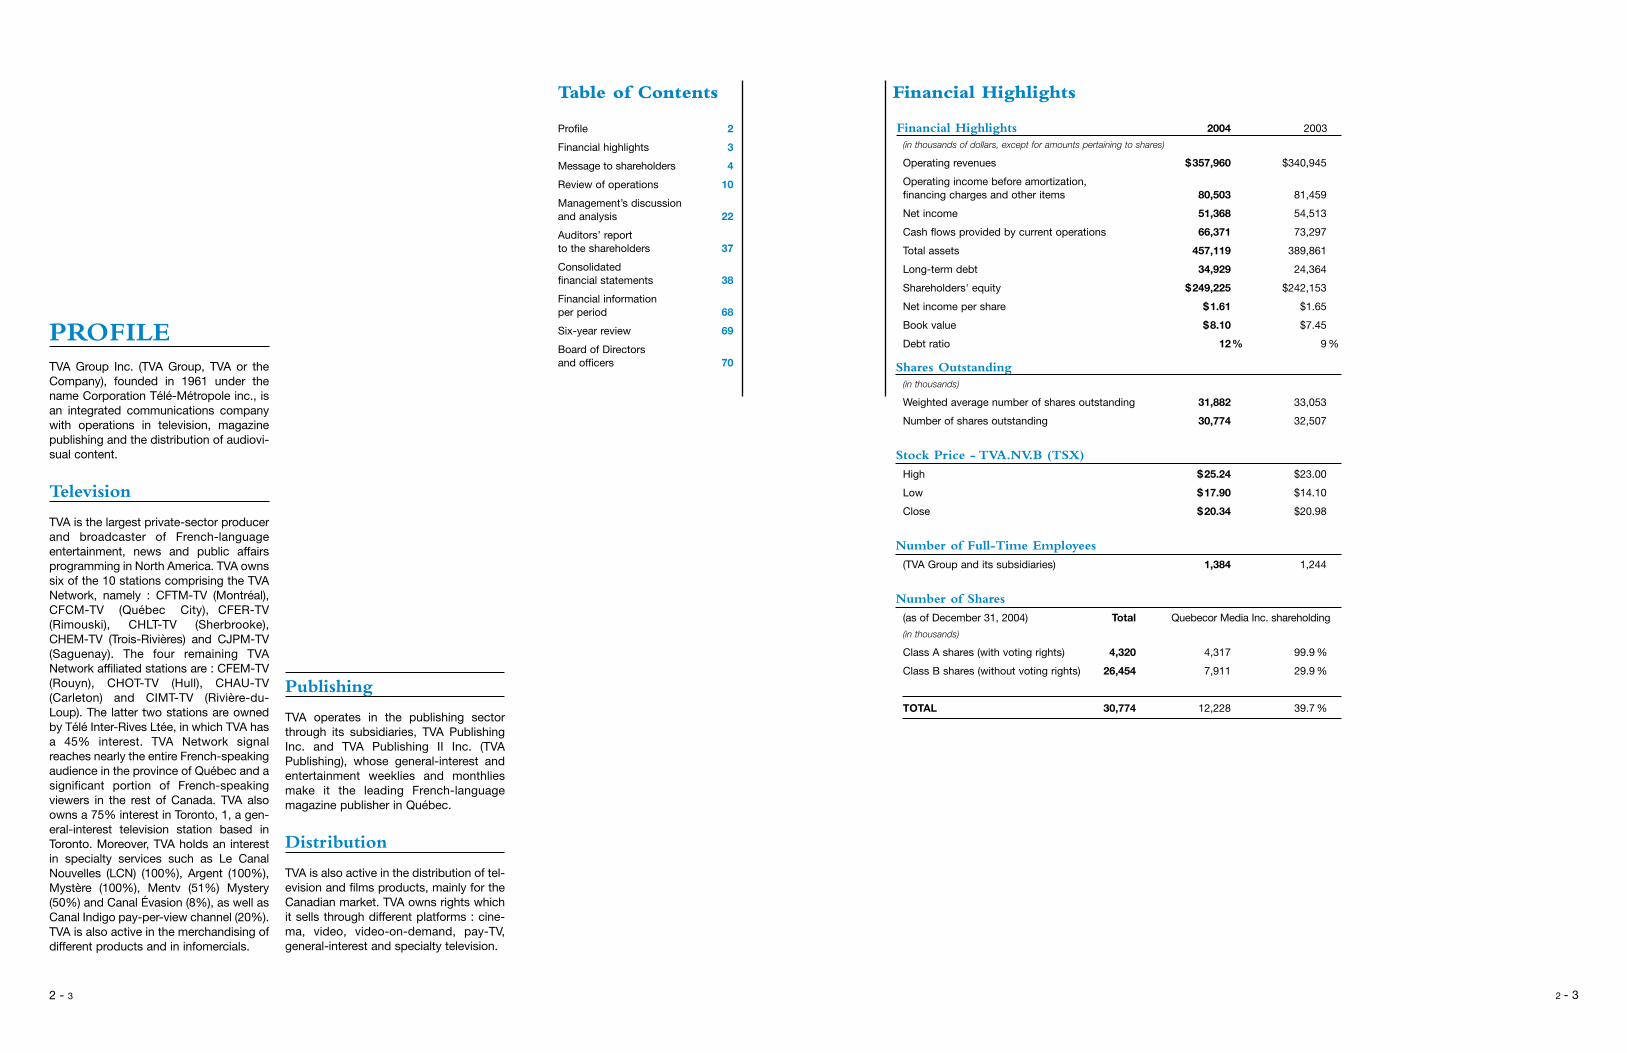
Table of Contents
Profile 2
Financial highlights 3
Message to shareholders 4
Review of operations 10
Management’s discussion and analysis 22
Auditors’ report to the shareholders 37
Consolidated financial statements 38
Financial informationper period 68
Six-year review 69
Board of Directorsand officers 70
Financial Highlights 2004 2003
(in thousands of dollars, except for amounts pertaining to shares)
Operating revenues $357,960 $340,945
Operating income before amortization, financing charges and other items 80,503 81,459
Net income 51,368 54,513
Cash flows provided by current operations 66,371 73,297
Total assets 457,119 389,861
Long-term debt 34,929 24,364
Shareholders' equity $249,225 $242,153
Net income per share $1.61 $1.65
Book value $8.10 $7.45
Debt ratio 12% 9 %
Shares Outstanding (in thousands)
Weighted average number of shares outstanding 31,882 33,053
Number of shares outstanding 30,774 32,507
Stock Price - TVA.NV.B (TSX)
High $25.24 $23.00
Low $17.90 $14.10
Close $20.34 $20.98
Number of Full-Time Employees
(TVA Group and its subsidiaries) 1,384 1,244
Number of Shares
(as of December 31, 2004) Total Quebecor Media Inc. shareholding
(in thousands)
Class A shares (with voting rights) 4,320 4,317 99.9 %
Class B shares (without voting rights) 26,454 7,911 29.9 %
TOTAL 30,774 12,228 39.7 %
2 - 3 2 - 3
PROFILETVA Group Inc. (TVA Group, TVA or theCompany), founded in 1961 under thename Corporation Télé-Métropole inc., isan integrated communications companywith operations in television, magazinepublishing and the distribution of audiovi-sual content.
Television
TVA is the largest private-sector producerand broadcaster of French-languageentertainment, news and public affairsprogramming in North America. TVA ownssix of the 10 stations comprising the TVANetwork, namely : CFTM-TV (Montréal),CFCM-TV (Québec City), CFER-TV(Rimouski), CHLT-TV (Sherbrooke),CHEM-TV (Trois-Rivières) and CJPM-TV(Saguenay). The four remaining TVANetwork affiliated stations are : CFEM-TV(Rouyn), CHOT-TV (Hull), CHAU-TV(Carleton) and CIMT-TV (Rivière-du-Loup). The latter two stations are ownedby Télé Inter-Rives Ltée, in which TVA hasa 45% interest. TVA Network signalreaches nearly the entire French-speakingaudience in the province of Québec and asignificant portion of French-speakingviewers in the rest of Canada. TVA alsoowns a 75% interest in Toronto, 1, a gen-eral-interest television station based inToronto. Moreover, TVA holds an interestin specialty services such as Le CanalNouvelles (LCN) (100%), Argent (100%),Mystère (100%), Mentv (51%) Mystery(50%) and Canal Évasion (8%), as well asCanal Indigo pay-per-view channel (20%).TVA is also active in the merchandising ofdifferent products and in infomercials.
Publishing
TVA operates in the publishing sectorthrough its subsidiaries, TVA PublishingInc. and TVA Publishing II Inc. (TVAPublishing), whose general-interest andentertainment weeklies and monthliesmake it the leading French-languagemagazine publisher in Québec.
Distribution
TVA is also active in the distribution of tel-evision and films products, mainly for theCanadian market. TVA owns rights whichit sells through different platforms : cine-ma, video, video-on-demand, pay-TV,general-interest and specialty television.
Financial Highlights
the presentfor the future
Unique assets for meaningful growth
Once again defying the competition, TVAaccomplished the exceptional feat of placing25 of its shows on the selective list of the 30most-watched programs of 2004, according tothe Bureau of Broadcast Measurement (BBM)ratings. This performance was unmatchedanywhere else in North America. Confoundingall those skeptical of TVA’s enviable position,this accomplishment occurred in an environ-ment in which competition for ways to boostaudience ratings has never before been asintense and persistent. This is true not only forspecialty services and privately owned general-interest broadcasters, but also — and evenmore so — for public television, which, despiteall of its protestations to the contrary, hasaccess to far more significant public fundingthan the financial resources available to privatebroadcasters. And public television does nothesitate to use this money with the obviousgoal of competing directly with all privatebroadcasters for market share.
A sense of television
Once again, STAR ACADÉMIE led the way for TVA in the springof 2004, when it matched — and even surpassed — theaudience ratings posted by its first edition. The show, which will return in the fall of 2005, has become a true televisionphenomenon whose popularity far exceeds that of a successfulvariety show. The show absolutely radiates the energy of itsparticipants’ desire to excel, to be imaginative and creative, tosucceed and to win — all values with which the viewing publicproudly identifies.
TVA improved in every sphere during 2004, remaining theuncontested leader in all programming genres: drama, reality
TV, public affairs, news and public service shows. TVA isnumber one in the morning, afternoon and evening, seven daysa week.
TVA is evolving along with the demands of its public, and itremains abreast of everything that is new in television. Drivenby a longstanding culture of success that inspires all of itsartists and contributors, time after time TVA succeedsunerringly in introducing major changes to its programminglineup that precisely meet the needs and expectations of itsaudiences. 2004’s performance provides a perfect illustration ofthe extent to which TVA’s teams have both a keenunderstanding of the present and a crystal clear vision of thetelevision of tomorrow.
TVA also has a sense of growth
TVA is a growth generator and one of the most important driv-ers of convergence at QUEBECOR MEDIA. Its great strength isinvesting in skills, taking initiatives today that will ensure itmaintains its enviable leadership tomorrow — without, for allthat, conceding an iota of the position it holds today.
Thus it was that at the very moment TVA was experiencing thebest year in its television programming history that the Groupdecided to launch new digital specialty channels and to acquireTORONTO 1. The timing could not have been better: TVAGroup has ample resources to make these investments. Moreimportant, these investments are in the business that TVAknows best — good television — and in areas that willguarantee the Company greater return on the development ofits content.
Therefore, the digital channel MYSTÈRE, launched October 21,2004, represents a genuine opportunity to leverage our greatexpertise in content acquisition and programming. ARGENT is,for its part, a natural extension of LCN, and is certain to benefitfrom the ambition and great talent of our newsroom teams.Finally, TORONTO 1 will allow us to demonstrate once again allof our television programming know-how, while taking into con-sideration the distinctiveness of the anglophone market. Sogrowth, yes, but also — and above all — enhancement of ourexpertise.
A keen sense of the present, a clear vision for the future
4 - 5 4- 5
Message to shareholders
Jean Neveu
Pierre Dion
Pierre DionPresident and Chief Executive Officer
Jean NeveuChairman of the Board
TVA Group reported consolidated operating revenues of $358.0 million for the fiscal year ended December 31, 2004,compared with $340.9 million for the previous year. TheCompany generated consolidated operating income of $80.5million for the year — or $81.8 million if the operating lossesincurred by TORONTO 1 and MYSTÈRE are not included —against $81.5 million for the prior year. In addition, after havinginvested $32.4 million in the TORONTO 1 acquisition and used$41.0 million to repurchase 1,892,500 Class B non-votingshares for cancellation, the Company had long-term debt ofonly $34.9 million at December 31, 2004, compared with $24.4million at the same date of 2003.
Acknowledgements
Our employees — skilled, dedicated and proud to be part of theTVA Group — are the envy of our competitors and we arepleased to have the privilege of sharing with them our passionfor success. We want to take this opportunity to express oursincere gratitude to them.
Special thanks to Serge Gouin for having served as President ofthe Company following Raynald Brière’s departure, and forhaving guided a faultless transition to Pierre Dion.
Our thanks also to the members of the Board of Directors fortheir professionalism and diligence. They make an invaluablecontribution to ensuring that we always emerge winners in anincreasingly complex and competitive industry. We would like toextend special thanks to Pierre Karl Péladeau, AndréBourbonnais and Sylvain Toutant, all of whom left the Board in2004, and bid a warm welcome to Érik Péladeau, FrançoisLaurin and André Tranchemontagne, who joined the Boardduring the year.
We want to express our appreciation to our shareholders forconstantly renewing their confidence in us, and particularlyQUEBECOR MEDIA, whose contribution is a significant asset inthe attainment of our profitability and growth objectives.
The public’s loyalty remains unwavering and inspires us tocontinue to provide content that best meets the needs andexpectations of our various audiences. We want to thank thisfaithful public and our advertisers, who are able to appreciatethe relationship of trust that we have built with our viewers andreaders.
This relationship-building is ongoing, and we remain committedto renewing our successes on all of the new platforms on whichwe deliver our content.
A sense of publishing
The management teams of our publications are motivated bythe same spirit. In a mature and extremely competitive market,TVA PUBLISHING largely succeeded in outpacing thecompetition once again in 2004. The entire magazine publishingmarket suffered in 2004 from shrinking revenues, mainly as aresult of lower newsstand sales. TVA PUBLISHING did notavoid this trend but its profit margins remain among the best inthe industry. Changing consumer habits, particularly regardingnewsstand sales, require that we constantly reinvent ouroffering, invest in new magazine formulas and solicit advertisersmore by, among other things, fully exploiting content synergywith the TVA Network and pooling advertising salesstrategies. With this in mind, in 2004 TVA PUBLISHINGlaunched two new magazines, STAR SYSTÈME andSHOPPING CLIN D’ŒIL , in addit ion to preparing theinauguration of another publication, SENSASS, introducedearly in 2005. Once again, TVA PUBLISHING’s teamsdemonstrated a keen sense of the present, combined with anintuitive vision of tomorrow’s market.
A sense of distribution
Again relying on the production of quality content, TVA renewedits confidence in the distribution market and in its TVA FILMSdivision, which was still being developed in 2004. Its catalogueof new films remains relatively modest and is very sensitive totheir performance in cinemas, which serves generally as aninvestment for eventually benefiting from the lucrative videoand DVD market. As a result, the major films in TVA FILMS’ new catalogue will be distributed more extensively on video and DVD in fiscal 2005. The fact remains that some of themovies, such as INTERN’S ACADEMY and ETERNAL, per-formed disappointingly in cinemas and the success of theQuébec cult film DANS UNE GALAXIE PRÈS DE CHEZ VOUSwas unable to make up for this. We remain determined to makethis division a Québec distribution leader and that is why in2004 we recruited an acknowledged industry professional, YvesDion, to put his vast experience to work to transform TVAFILMS into a leading Canadian distributor.
A sense of cultural reality
Increasingly, the most popular television with Québec’s generalpublic is also becoming the preferred viewing of all of theprovince’s communities. As TVA grows, it wants to constantlybetter reflect the multiethnic nature of its audience. In 2004, acommittee chaired by Honey A. Dresher and composed of 15 well-known figures from 10 different ethnocultural communities
was formed to advise our management teams on ways toachieve this goal.
Nearly 100 actors and artists from Québec’s ethnoculturalcommunities took part in TVA programs in 2004. Stars such asHerby Moreau and Alexandra Diaz joined our teams and thistrend is expected to continue in 2005.
A sense of how to change while staying the same
There were major changes within TVA’s management team in2004, including the departure of Raynald Brière, who had ledthe Company for four years filled with challenges and decisivedevelopments affecting TVA’s positioning for the future. On theheels of Mr. Brière’s departure, Serge Gouin was appointedPresident and Chief Executive Officer, followed by theappointments of Pierre Dion as Executive Vice-President andChief Operating Officer until his recent promotion to Presidentand Chief Executive Officer, Philippe Lapointe as Senior Vice-President, Programming, Claire Syril as President,TVA Publishing, France Lauzière as General Manager,Programming, Serge Fortin as Vice-President, Information andPublic Affairs, TVA and LCN, Serge Bellerose as Senior Vice-President, Specialty Channels and Business Development,Gaétane Wagner as Vice-President, Human Resources,Jocelyn Poirier as Vice-President, Legal Affairs, and Yves Dionas President of TVA Films. This reorganization was intendedto be a happy mixture of promotion from within and recruit-ment of the best people available in our market. Majorchanges unquestionably, but a sole business plan, a sole pas-sion and an across-the-board belief in TVA Group’s culture ofperformance.
Solid results from a strong,growth-oriented company
Once again in 2004, we are proud of the financial results producedby a Company that succeeded in maintaining its market domi-nance, even though we had to increase investments in our con-tent in order to develop solid foundations for our future perfor-mance. Again this year, our advertising revenues — up 8.2% forour Television sector (excluding Toronto 1) and 8.4% for ourPublishing business — grew by more than the advertising marketaverage. Obviously, these results are testimony to the admirableperformance of our programming and our magazines, but theyalso speak to the creativity of our sales teams, which are increasingly adept at leveraging our membership in the QUEBECOR MEDIA family. Our television content costs increasedby 9.2 % in 2004, in order to support our position and our growth.
6 - 7 6 - 7
Message to shareholders
Gaétane WagnerVice-President,
Human Resources
Philippe LapointeSenior Vice-President,
Programming
Serge BelleroseSenior Vice-President,
Specialty Channels and Corporate Development
Reneault PoliquinSenior Vice-President,
Sales
Pierre DionPresident and
Chief Executive Officer
Claire SyrilPresident, TVA Publishing Inc.
Jocelyn PoirierVice-President, Legal Affairs
Paul BuronSenior Vice-President and Chief Financial Officer
Yves DionPresident,TVA FILMS
8 - 9 8 - 9
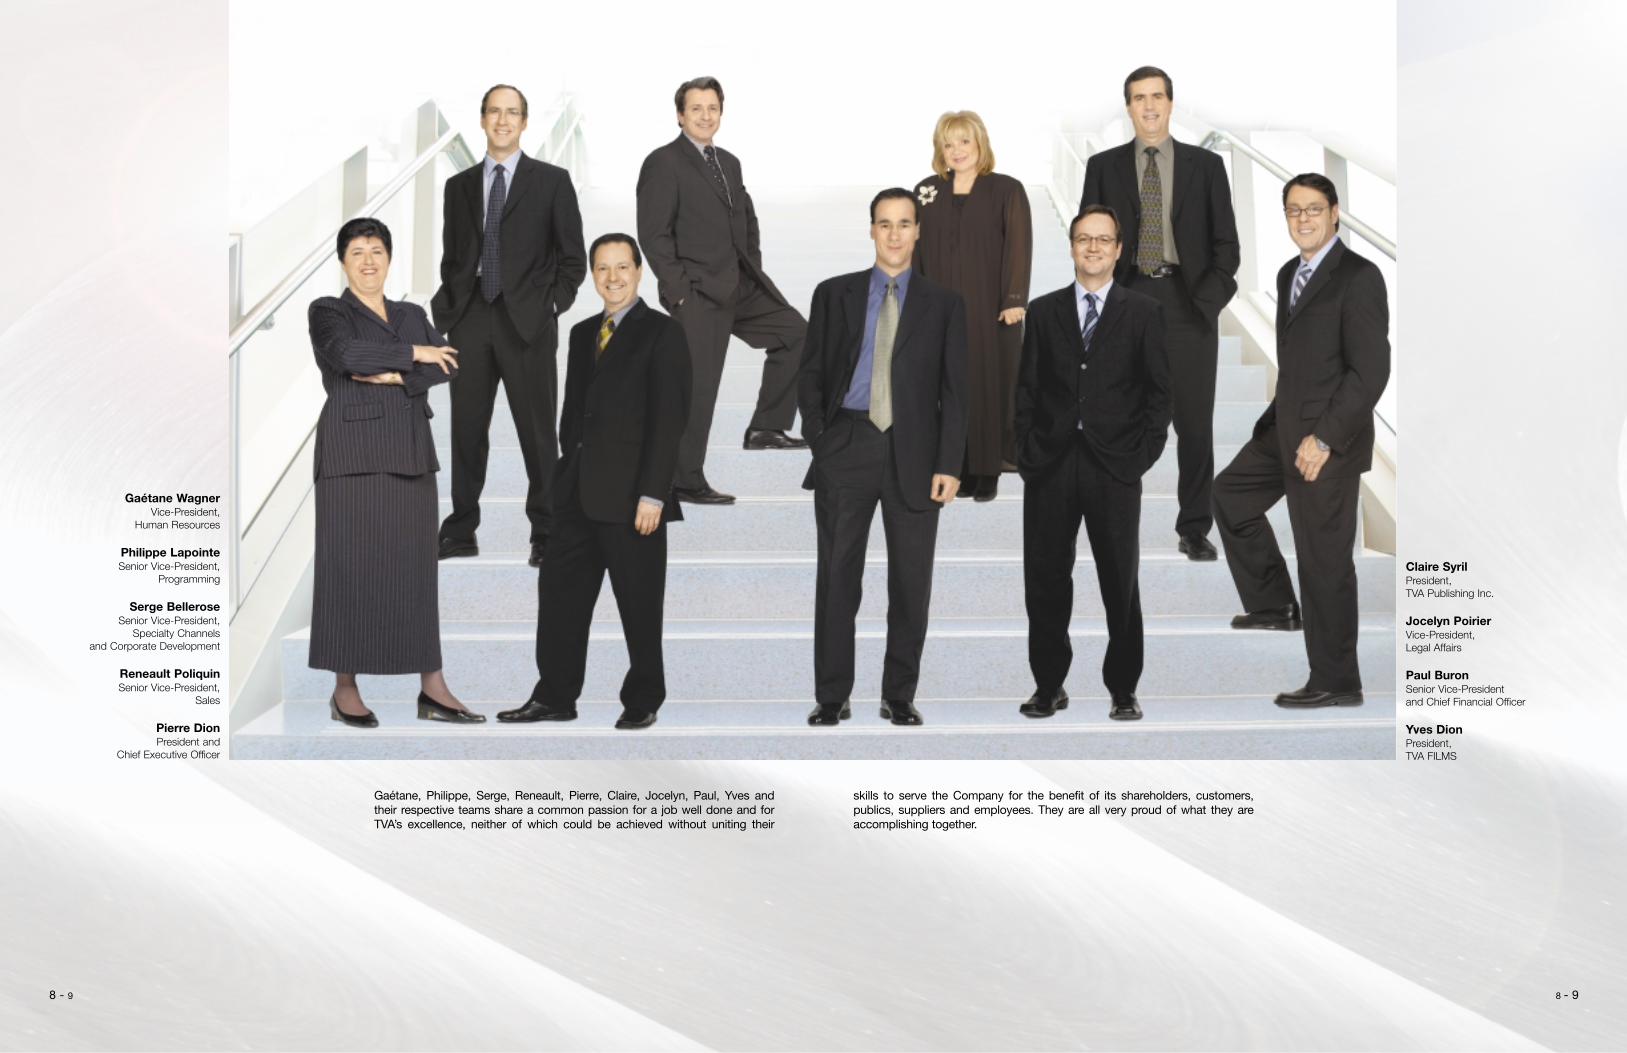
Gaétane, Philippe, Serge, Reneault, Pierre, Claire, Jocelyn, Paul, Yves andtheir respective teams share a common passion for a job well done and forTVA’s excellence, neither of which could be achieved without uniting their
skills to serve the Company for the benefit of its shareholders, customers,publics, suppliers and employees. They are all very proud of what they areaccomplishing together.
Review of operations
On the strength of a network that is better than ever, TVA is focused on growthThe art of creating events
The TVA Network broadcast 28 of the 30best-watched shows during one seasonin 2004 and 25 of the top 30 for the twobiggest viewing seasons of the year —now that’s something! It is, in fact, anamazing feat that reflects the enormousvalue of the programming that TVA offersits viewers during the spring and fallseasons. TVA also managed the stunningachievement of increasing the number ofits shows that attract more than a millionviewers.
The second edition of Star Académiewas the television event of 2004, withmore than three million viewers tuning into the Sunday shows and an average ofmore than two million watching onweekdays. Many other TVA programsalso became must-see events in theirrespective time slots: the fifth season ofFortier was watched by audiencesaveraging 1.6 million, as was Lance etCompte; la reconquête. Series such asHistoires de filles, Km/H and LesPoupées Russes are regularly seen bymore than a million followers. The realityshow Occupation Double dominated
the ratings with a record audience of 2.1 million. Every edition of DemandesSpéciales attracts more than 1.3 millionviewers. All in all, TVA broadcast morethan 48 “millionaire” shows in 2004.Radio-Canada, despite massive recourseto public funds, had only five and TQShad none.
In addition, the great majority of ourshows are the leaders in their time slots,including Salut Bonjour !, Sucré Salé, Mamaison Rona and Le 17 heures, and ournew programs become popular fromtheir very first weeks. These include
100 Détours and Clin d’œil, as well as LeNégociateur, Vice Caché and Le Cœur ases raisons, all introduced early in 2005.
Still the leader
TVA is still the leader, regardless ofchanges made to audience-measurementmethodology. One of the most importantchallenges that TVA successfully tackledin 2004 was adapting its programming tothe BBM’s new survey methodologyusing the Portable PeopleMeter (PPM)technology. With this new methodology,t h e B B M i s n o w a b l e t o p ro v i d ebroadcasters and advert isers with
audience ratings for every minute ofevery show — the day after it airs.Broadcasters are no longer captive totwo main surveys conducted in thespring and fall. This spells the end of thefamous viewing diaries whose resultswould significantly impact programmingstrategies. TVA had to adapt to this newaudience-measurement system and, as aresult, re-examine its programmingstrategy. The results are conclusive: notonly has TVA maintained its leadership, ithas widened its lead over its maincompetitors!
A l t h o u g h T VA’s n e w s c a s t s h a v e
dominated the competition for severalyears, the results for 2004 took us to newheights. Pierre Bruneau and ClaudeCharron regularly attract nearly a millionviewers for their 5 p.m. show and theircolleague Sophie Thibault outdraws allcompetitors in the late evening. But evenmore important than the audience ratings, the quality of TVA’s informationand public affairs shows has finally been recognized for their true value: this wasdemonstrated in their coverage of thesad events in Haiti, as well as federalelection night and the other major eventsthat marked the news during the year.
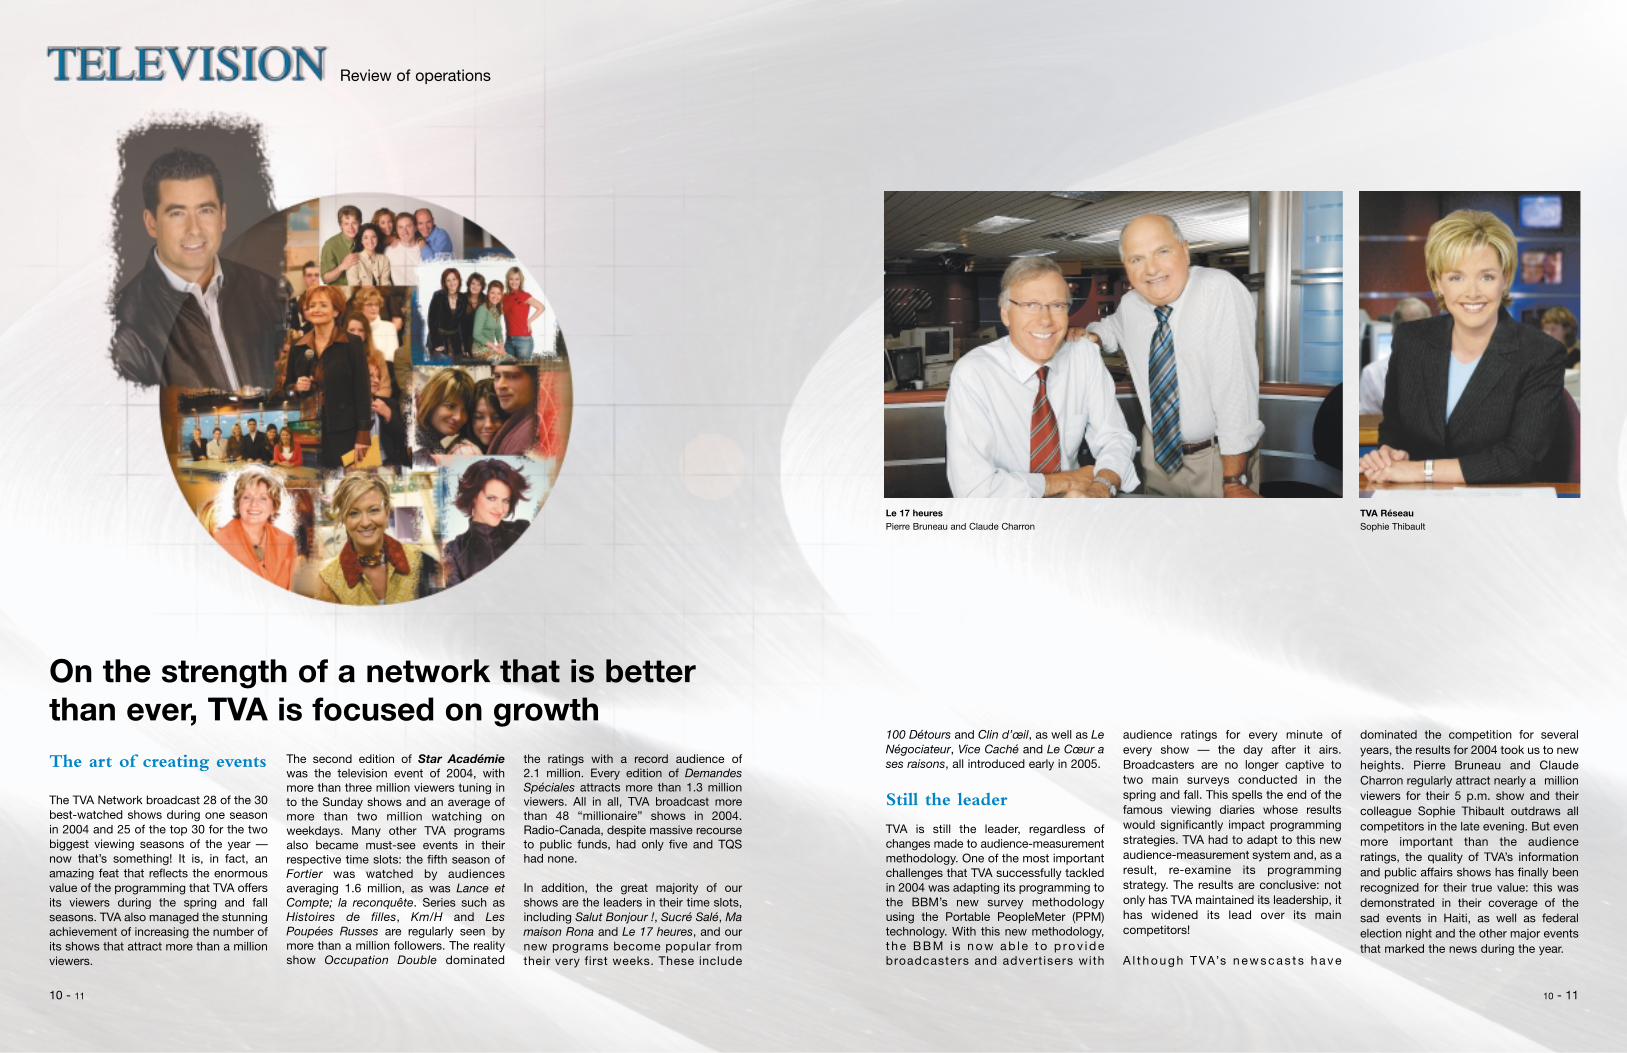
Le 17 heuresPierre Bruneau and Claude Charron
TVA RéseauSophie Thibault
10 - 1110 - 11
Review of operations
TVA: A growing network
In 2004, TVA was much more than NorthAmerica’s largest French-languagebroadcaster, because TVA is now alsoth ree French- language spec ia l t ychannels, (LCN, ARGENT ANDMYSTÈRE), two English-language spe-cialty channels, (MENTV ANDMYSTERY), one English-language gener-al-interest station (TORONTO 1), ahome-shopping channel (SHOPPINGTVA), a subsidiary that produces televi-sion shows (JPL) and another(TVACCÈS) involved in commercial pro-duction. The TVA NETWORK is also 10
regional stations: six owned by TVA andfour affiliates. Thus, TVA’s offering interms of content and advertising opportu-nities is expanding rapidly.
A strong regional presence
TVA Group owns six of the 10 regionalstations that make up the TVANETWORK. They are: CFTM (Montréal),CFCM (Québec City), CHLT (Sherbrooke),CHEM (Trois-Rivières), CJPM(Saguenay)and CFER (Rimouski). Of thefour otheraffiliated stations, two belong to TÉLÉINTER-RIVES LTÉE, in which TVA holds
a 45% interest. It is worth noting that theTVA station is by far the most popular inevery one of these regions. The TVANETWORK signal reaches almost all ofQuébec’s French-speaking audience, aswell as francophone communities in theneighbouring provinces of Ontario andNew Brunswick. TVA also broadcastsacross the rest of Canada, offering fran-cophones outside Québec the opportuni-ty to see the very best of television intheir own language. We receive manycompliments about the quality of theservices we provide to Québec’s regionsand these results motivate our teams toincrease their presence in every area
of the economic and social lives of thecommunities they serve.
TVA’s presence in regional Québec isimportant to the network and we areconstantly building on the information weprovide and on a strong involvement incommunity activities in order to reach ouraud iences and mee t the i r needseffectively.
Our own production team
TVA’s product ion subs id iary, JPLPRODUCTION, produced nearly 1,500
hours of programming for all of our sta-tions in 2004, including the very popularshows Salut, Bonjour! and Les Poupéesrusses, as well as the Gala MétroStar,100 Détours, Devine qui vient ce soir andStar Système. Created in 1965, JPLPRODUCTION has extensive experiencein all areas of television production,including live shows, dramas, varietyshows, game shows and awards galas.In addition to helping fill the specific andvery distinctive needs of our programmingschedule, one of JPL’s strengths is itsoptimal leveraging of the huge productioncapacity of TVA, which has severalexcellently equipped recording studios
staffed by competent artists and artisanswho love their work.
Because it is determined to constantlyimprove service to its clienteles, late in2003 TVA grouped its Montréal andQuébec City commercial productionunits within one division, TVACCÈS. Thisreorganization brings a more direct,customer-focused approach. Assemblingall this know-how and talent helped thisd i v i s i o n g ro w i t s re v e n u e s f ro mcommercial production by nearly 21%and its operating income by more than90% in 2004.
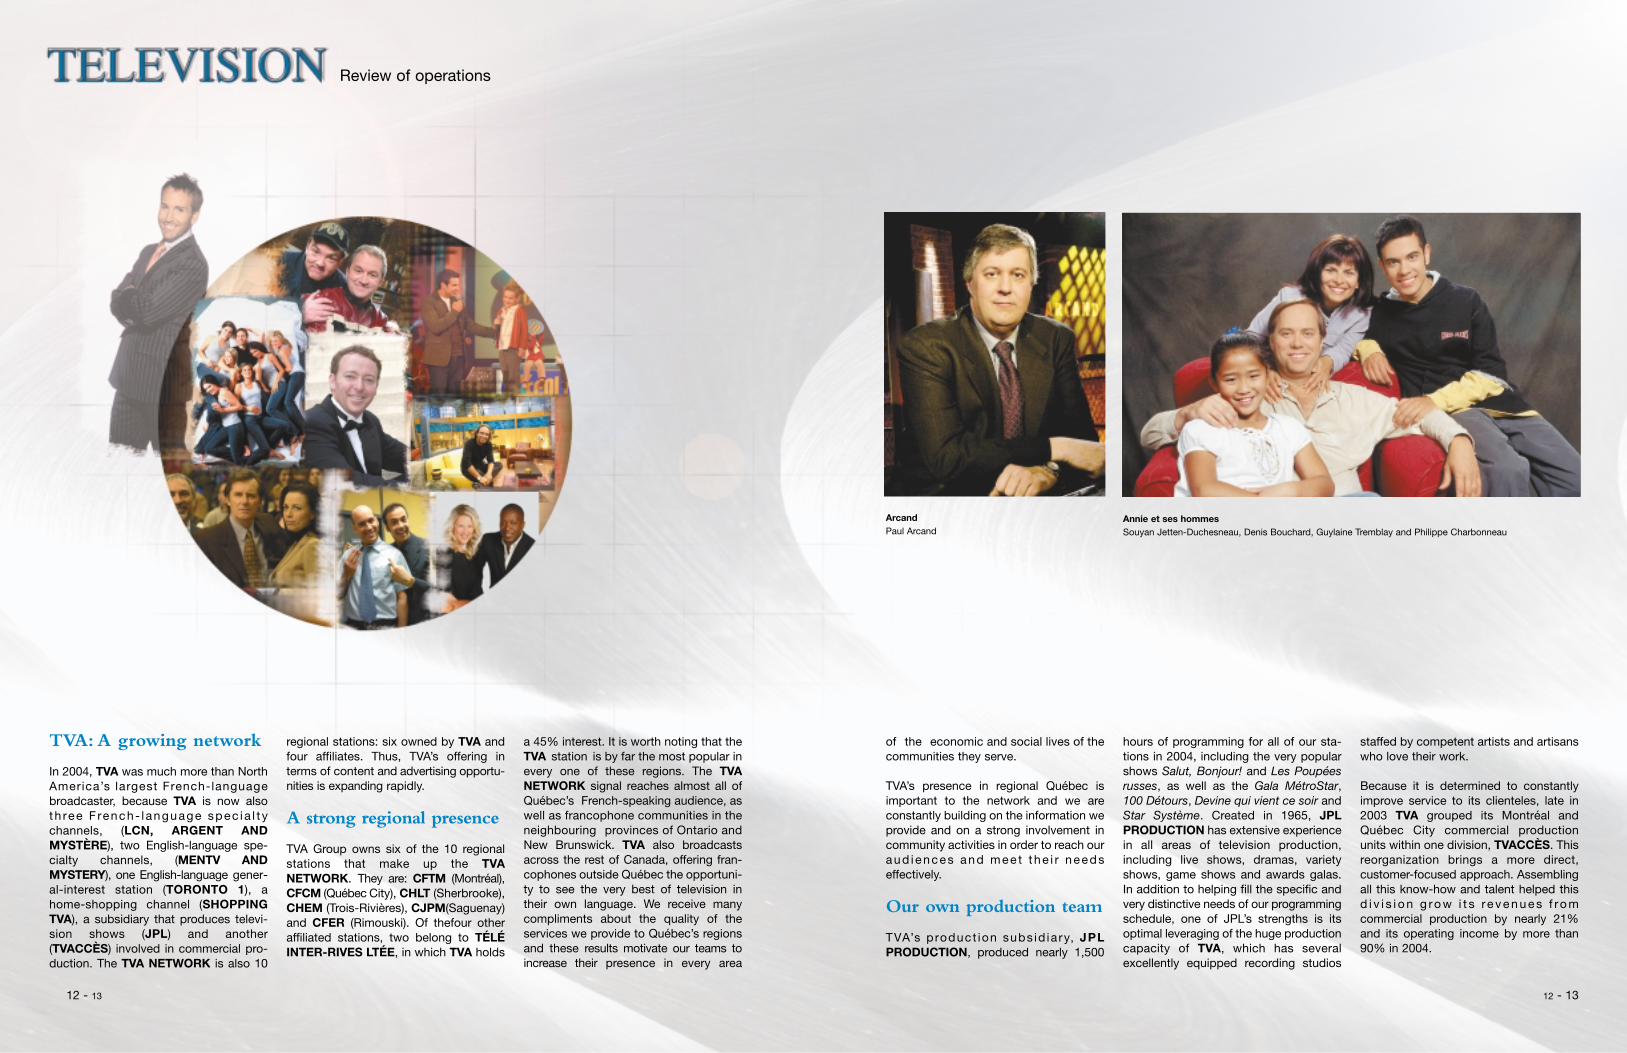
ArcandPaul Arcand
Annie et ses hommesSouyan Jetten-Duchesneau, Denis Bouchard, Guylaine Tremblay and Philippe Charbonneau
12 - 1312 - 13
Review of operations
New specialty channels
On the strength of its successes, its know-how and its expertise, TVA took advantage of some attractive growth opportunities in2004. For instance, it added a new digital specialty channel, MYSTÈRE, to its television portfolio. This channel features movies andmade-for-TV series that are focused on mystery and suspense. Launched on October 21, 2004, MYSTÈRE is already surpassingour audience expectations. Another digital specialty channel recently appeared on the Québec television landscape. Called Argent,it was launched February 21, 2005, and covers all aspects of the economy, business and personal finance. These two new digitalspecialty channels join our all-news channel, LCN, as well as MENTV and MYSTERY, two English-language digital specialty chan-nels owned in partnership with CanWest Global.
LCN
LCN, our all-news channel, continued toimprove in 2004, and now reaches morethan two million viewers weekly. With itscontinually updated 15-minute blocks ofnews, sports and weather, LCN is ideally adapted to the information needs ofa growing segment of the public that wantsto know what is happening in the world atany time of the day or night. LCN’s popu-
larity and its powerful marketing approachdeveloped by our sales teams resulted inan increase of more than 17% in its adver-tising revenues in 2004.
In order to rejuvenate itself and to preparefor the arrival of our new digital channelArgent, several millions of dollars wereinvested in 2004 to strengthen LCNssupporting infrastructure and to improvethe all-news channel’s broadcast image.
These investments were also needed atthe time of ARGENT’s launch on February21, 2005.
Argent
A new digital specialty channel, ARGENTcovers all of the economic, business andpersonal finance news. Obviously, thischannel benefits from the expertise and
knowledge of TVA’s news team, as well asTVA’s presence in every Québec region.ARGENT is developing a unique niche byoffering a business-focused product thathas never before been attempted inQuébec’s television market. We are con-vinced that ARGENT is providing anessential service in Québec’s economy bypromoting its enterprises — from small tolarge — and at the same time explainingand commenting on the business andfinancial news that will impact our eco-nomic future.
Mentv and Mystery
MENTV (51%) and MYSTERY (50%), twoEnglish-language specialty channelslaunched in 2001 in partnership withCanWest Global, continued to progressin accordance with our forecasts in thesmaller, but steadily growing, universe ofdigital television. At year-end, more than750,000 homes subscribed to these two
channels, which are constantly gaining in popularity. Although the advertisingrevenues produced by these twochannels remain insignificant, the lowlevel of their operating losses for 2004leads us to believe that both MENTV andMYSTERY will be excellent investmentsin the medium or long terms.
Mystère
Wholly owned by TVA, this sister channelto Mystery was launched October 21,2004, and features mystery and suspenseprogramming such as OMERTA, SCOOP,FORTIER, LAS VEGAS, KINGDOMHOSPITAL, and more. After only a fewmonths on the air, we are very happy withthe audience ratings for this channel,which has carved itself a market share ofabout 0.3%, despite the fact that only theapproximately 800,000 households inQuébec equipped with a digital decoderare able to receive it.
Shopping TVA
In 2003, we launched a home-shoppingchannel, STV, which provides viewers withinformation on a variety of exclusiveproducts, as well as the opportunity to buythem without leaving the comfort of theirhome. This type of service is very suc-cessful in regions where the public hasless access to big-box stores. STV, whose2004 growth was excellent with a 58%increase in operating revenues and a 16%rise in operating income, was renamedSHOPPING TVA early in 2005. The namechange was accompanied by severalp r o g r a m m i n g a n d m a n a g e m e n tmodifications that are aimed at raisingpublic awareness of this channel.
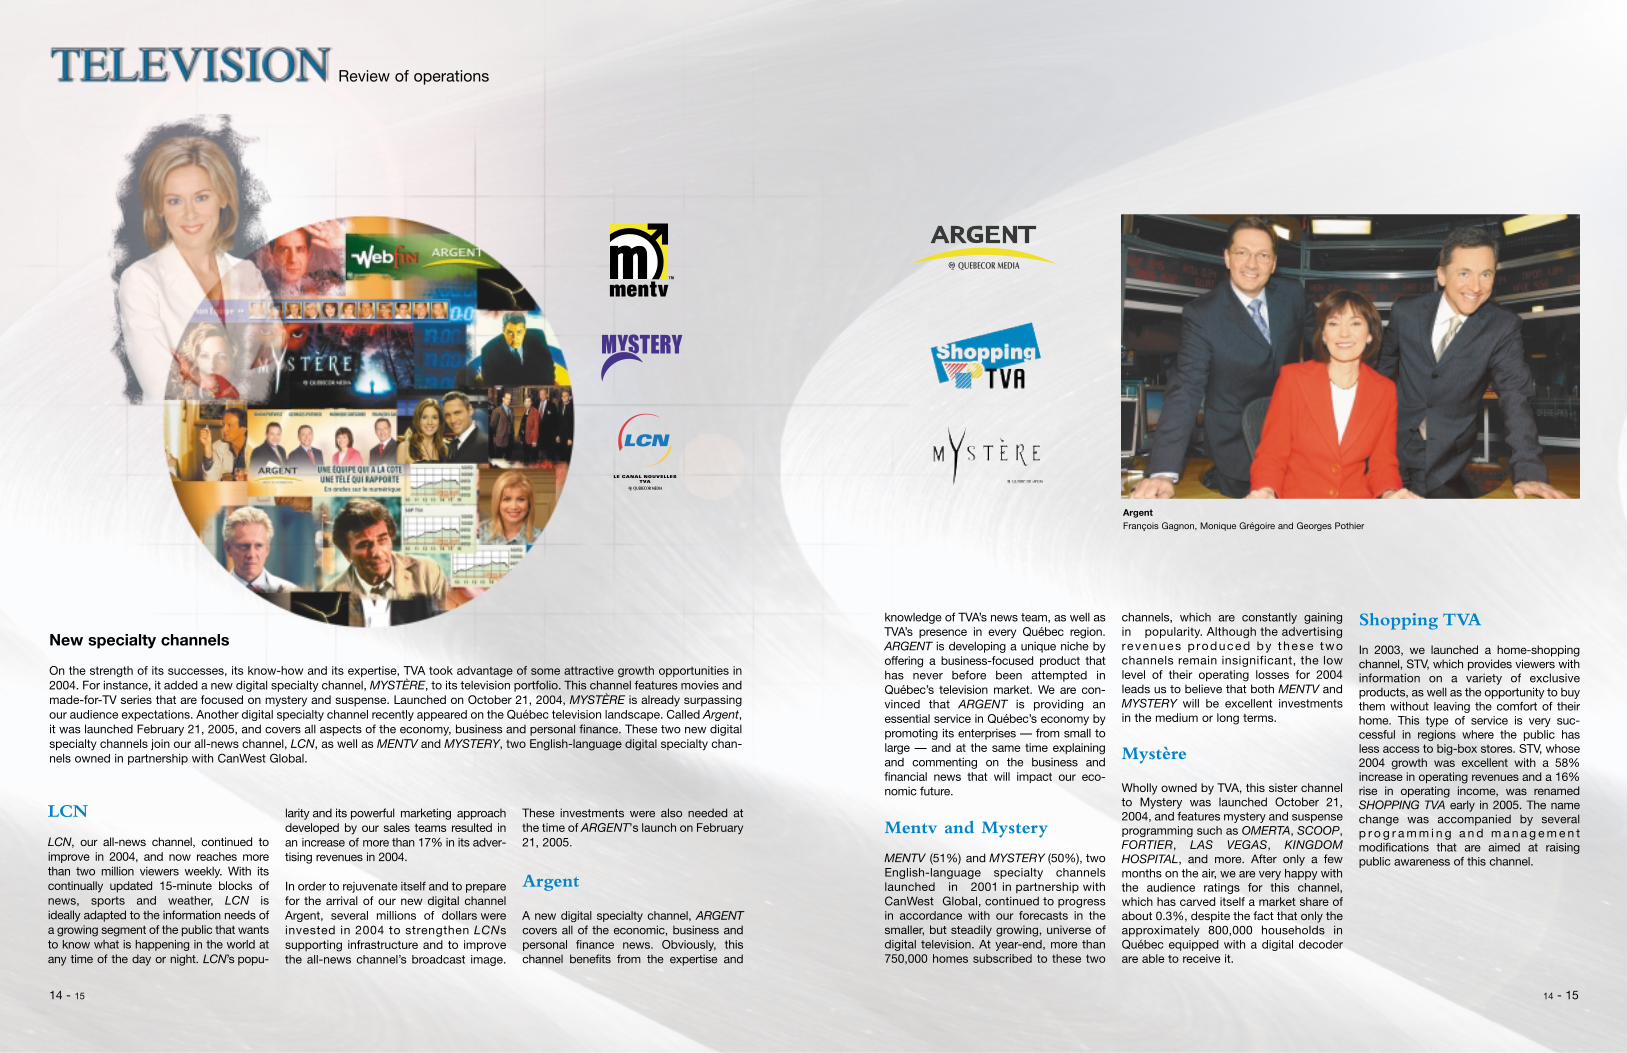
ArgentFrançois Gagnon, Monique Grégoire and Georges Pothier
14 - 1514 - 15
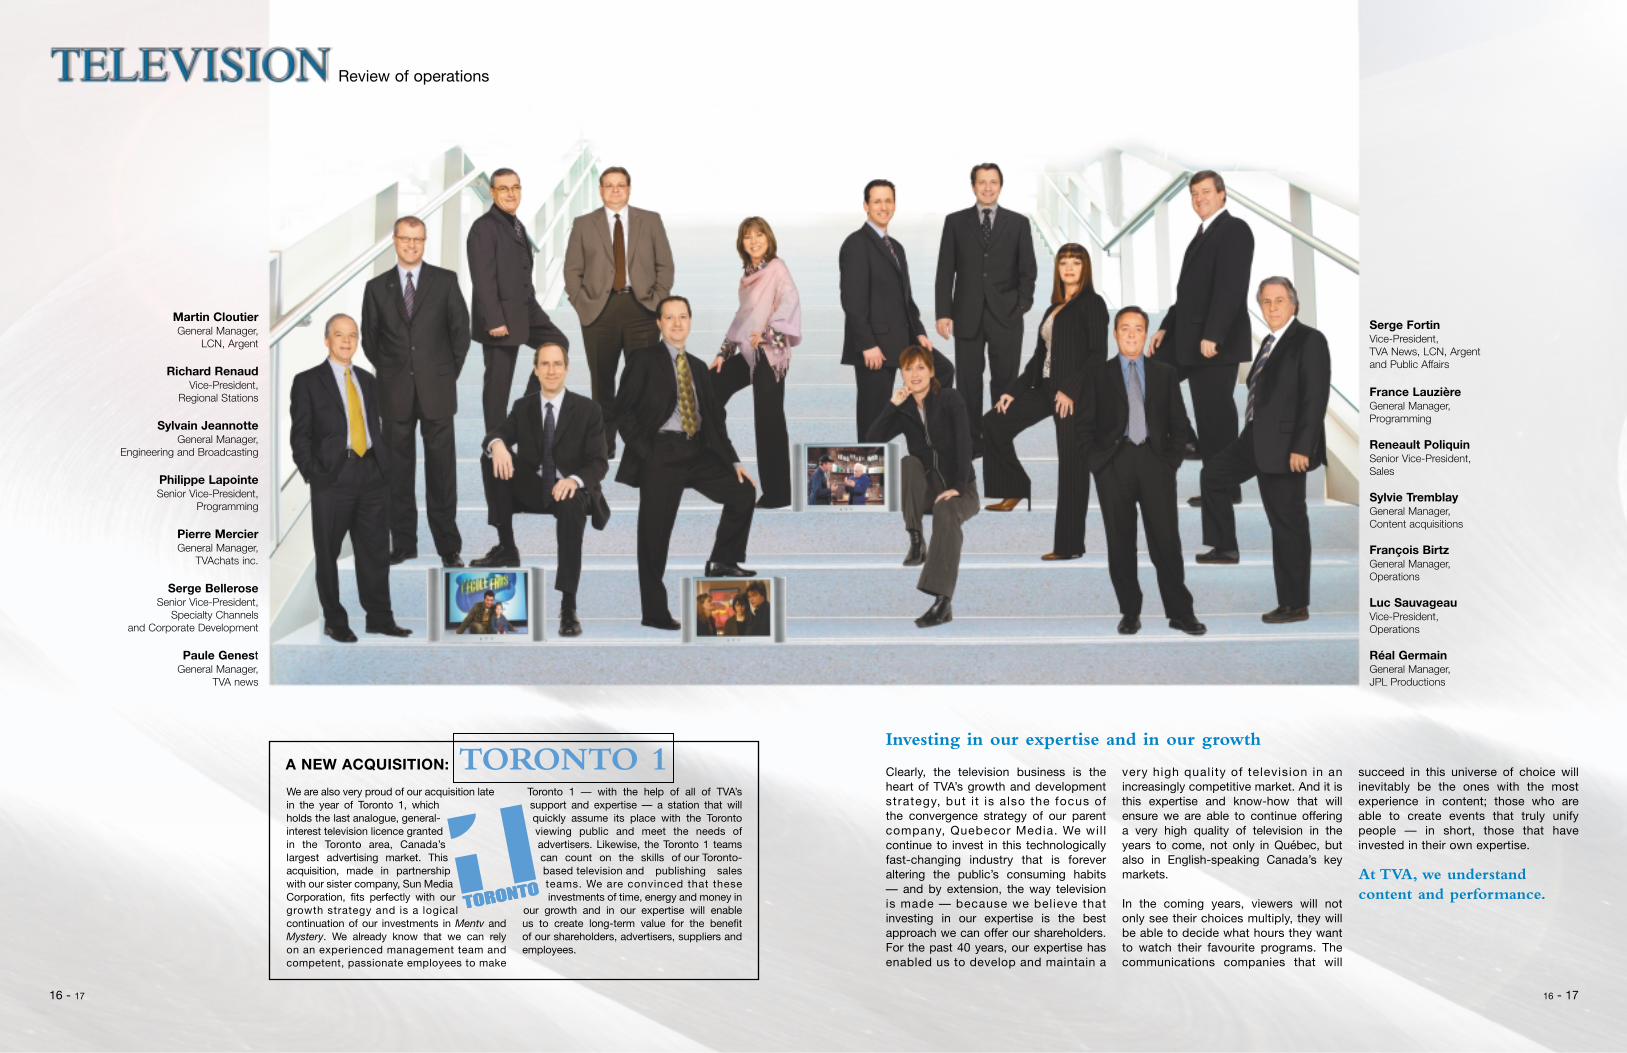
Serge Fortin Vice-President, TVA News, LCN, Argent and Public Affairs
France LauzièreGeneral Manager,Programming
Reneault PoliquinSenior Vice-President, Sales
Sylvie Tremblay General Manager,Content acquisitions
François BirtzGeneral Manager,Operations
Luc SauvageauVice-President, Operations
Réal Germain General Manager,JPL Productions
Martin Cloutier General Manager,
LCN, Argent
Richard RenaudVice-President,
Regional Stations
Sylvain JeannotteGeneral Manager,
Engineering and Broadcasting
Philippe LapointeSenior Vice-President,
Programming
Pierre MercierGeneral Manager,
TVAchats inc.
Serge Bellerose Senior Vice-President,
Specialty Channels and Corporate Development
Paule Genest General Manager,
TVA news
16 - 1716 - 17
We are also very proud of our acquisition latein the year of Toronto 1, whichholds the last analogue, general-interest television licence grantedin the Toronto area, Canada’slargest advertising market. Thisacquisition, made in partnershipwith our sister company, Sun MediaCorporation, fits perfectly with ourgrowth strategy and is a logicalcontinuation of our investments in Mentv andMystery. We already know that we can rely on an experienced management team andcompetent, passionate employees to make
Toronto 1 — with the help of all of TVA’ssupport and expertise — a station that willquickly assume its place with the Torontoviewing public and meet the needs ofadvertisers. Likewise, the Toronto 1 teamscan count on the skills of our Toronto-based television and publishing salesteams. We are convinced that theseinvestments of time, energy and money in
our growth and in our expertise will enable us to create long-term value for the benefit of our shareholders, advertisers, suppliers andemployees.
A NEW ACQUISITION: TORONTO 1 Clearly, the television business is theheart of TVA’s growth and developmentstrategy, but it is also the focus of the convergence strategy of our parentcompany, Quebecor Media. We wil lcontinue to invest in this technologicallyfast-changing industry that is foreveraltering the public’s consuming habits — and by extension, the way television is made — because we believe thatinvesting in our expertise is the bestapproach we can offer our shareholders.For the past 40 years, our expertise hasenabled us to develop and maintain a
very high quality of television in anincreasingly competitive market. And it isthis expertise and know-how that willensure we are able to continue offering a very high quality of television in theyears to come, not only in Québec, butalso in English-speaking Canada’s keymarkets.
In the coming years, viewers will notonly see their choices multiply, they willbe able to decide what hours they wantto watch their favourite programs. Thecommunications companies that will
succeed in this universe of choice willinevitably be the ones with the mostexperience in content; those who areable to create events that truly unifypeople — in short, those that haveinvested in their own expertise.
At TVA, we understand content and performance.
Investing in our expertise and in our growth
Review of operations
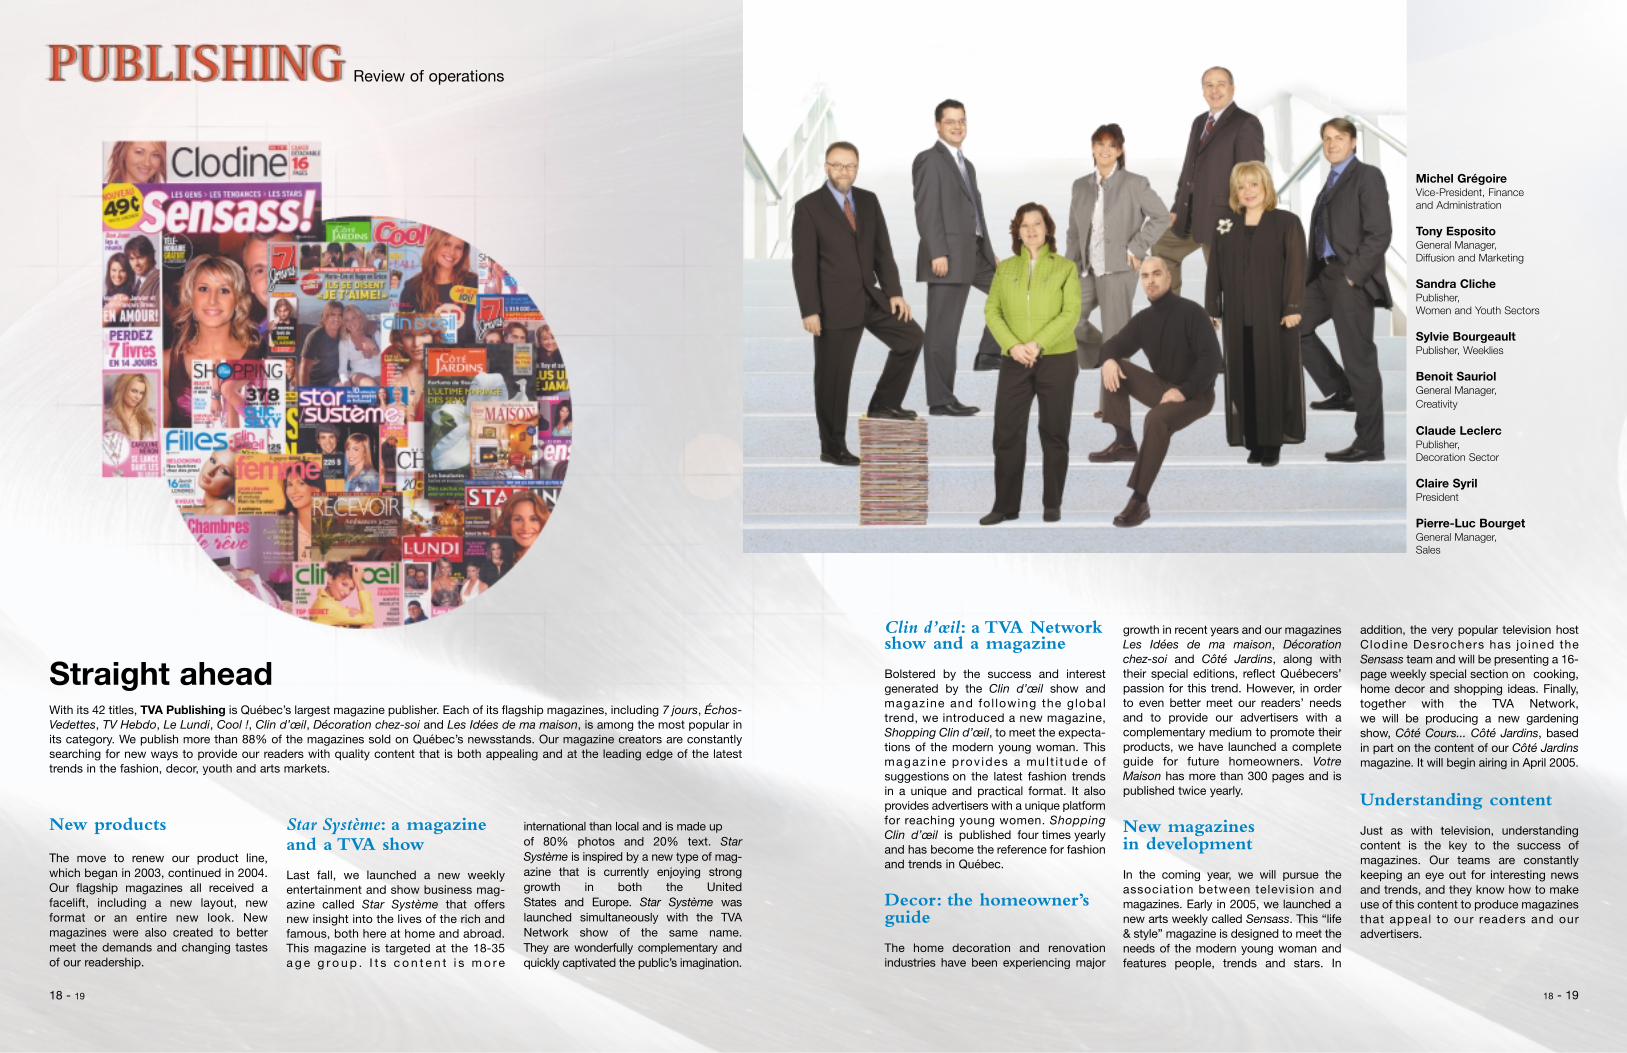
Clin d’œil: a TVA Networkshow and a magazine
Bolstered by the success and interestgenerated by the Clin d’œil show andmagazine and fol lowing the global trend, we introduced a new magazine,Shopping Clin d’œil, to meet the expecta-tions of the modern young woman. Thismagaz ine prov ides a mul t i tude ofsuggestions on the latest fashion trendsin a unique and practical format. It alsoprovides advertisers with a unique platformfor reaching young women. ShoppingClin d’œil is published four times yearlyand has become the reference for fashionand trends in Québec.
Decor: the homeowner’sguide
The home decoration and renovationindustries have been experiencing major
growth in recent years and our magazinesLes Idées de ma maison, Décorationchez-soi and Côté Jardins, along withtheir special editions, reflect Québecers’passion for this trend. However, in orderto even better meet our readers’ needsand to provide our advertisers with acomplementary medium to promote theirproducts, we have launched a completeguide for future homeowners. VotreMaison has more than 300 pages and ispublished twice yearly.
New magazines in development
In the coming year, we will pursue theassociation between television andmagazines. Early in 2005, we launched anew arts weekly called Sensass. This “life& style” magazine is designed to meet theneeds of the modern young woman andfeatures people, trends and stars. In
addition, the very popular television hostClodine Desrochers has joined theSensass team and will be presenting a 16-page weekly special section on cooking,home decor and shopping ideas. Finally,together with the TVA Network, we will be producing a new gardeningshow, Côté Cours... Côté Jardins, basedin part on the content of our Côté Jardinsmagazine. It will begin airing in April 2005.
Understanding content
Just as with television, understandingcontent is the key to the success ofmagazines. Our teams are constantlykeeping an eye out for interesting newsand trends, and they know how to makeuse of this content to produce magazinesthat appeal to our readers and ouradvertisers.
Review of operations
Straight aheadWith its 42 titles, TVA Publishing is Québec’s largest magazine publisher. Each of its flagship magazines, including 7 jours, Échos-Vedettes, TV Hebdo, Le Lundi, Cool !, Clin d’œil, Décoration chez-soi and Les Idées de ma maison, is among the most popular inits category. We publish more than 88% of the magazines sold on Québec’s newsstands. Our magazine creators are constantlysearching for new ways to provide our readers with quality content that is both appealing and at the leading edge of the latesttrends in the fashion, decor, youth and arts markets.
New products
The move to renew our product line,which began in 2003, continued in 2004.Our flagship magazines all received afacelift, including a new layout, newformat or an entire new look. Newmagazines were also created to bettermeet the demands and changing tastesof our readership.
Star Système: a magazineand a TVA show
Last fall, we launched a new weeklyentertainment and show business mag-azine called Star Système that offersnew insight into the lives of the rich andfamous, both here at home and abroad.This magazine is targeted at the 18-35a g e g r o u p . I t s c o n t e n t i s m o r e
international than local and is made up of 80% photos and 20% text. StarSystème is inspired by a new type of mag-azine that is currently enjoying stronggrowth in both the United States and Europe. Star Système waslaunched simultaneously with the TVANetwork show of the same name. They are wonderfully complementary andquickly captivated the public’s imagination.
Michel GrégoireVice-President, Finance and Administration
Tony EspositoGeneral Manager,Diffusion and Marketing
Sandra ClichePublisher,Women and Youth Sectors
Sylvie BourgeaultPublisher, Weeklies
Benoit SauriolGeneral Manager,Creativity
Claude Leclerc Publisher, Decoration Sector
Claire SyrilPresident
Pierre-Luc BourgetGeneral Manager,Sales
18 - 1918 - 19
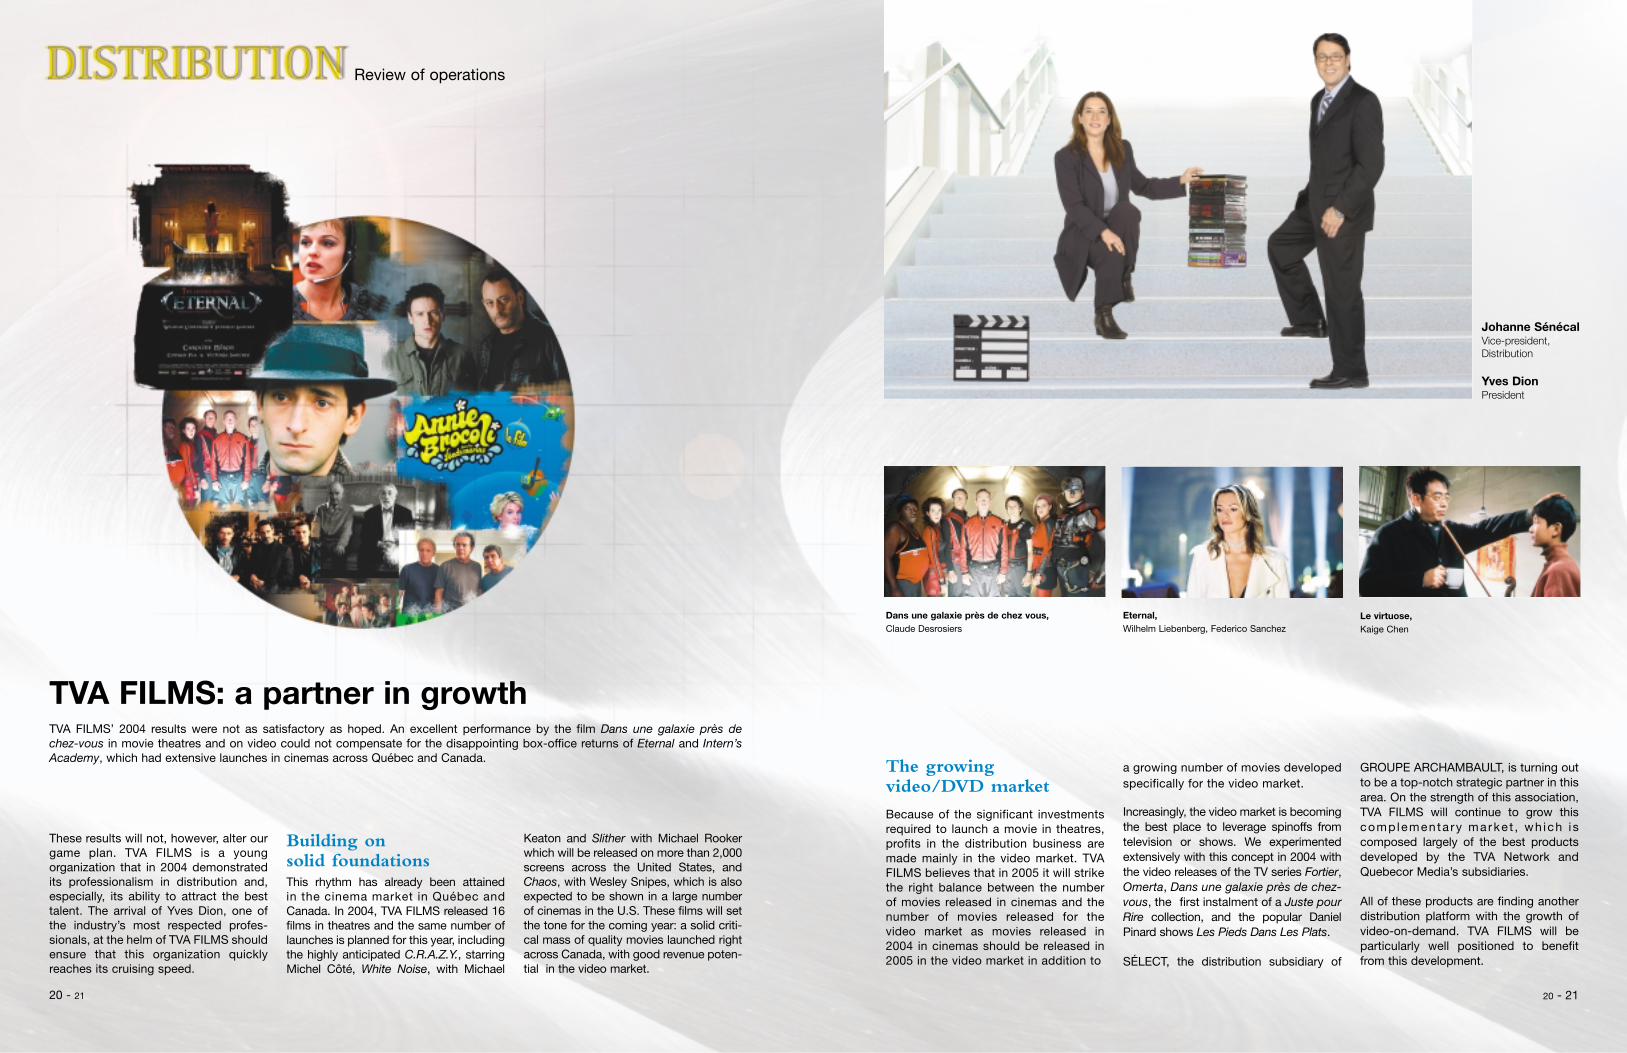
Johanne SénécalVice-president, Distribution
Yves DionPresident
Eternal,Wilhelm Liebenberg, Federico Sanchez
Le virtuose,Kaige Chen
Dans une galaxie près de chez vous,Claude Desrosiers
a growing number of movies developedspecifically for the video market.
Increasingly, the video market is becomingthe best place to leverage spinoffs fromtelevision or shows. We experimentedextensively with this concept in 2004 withthe video releases of the TV series Fortier,Omerta, Dans une galaxie près de chez-vous, the first instalment of a Juste pourRire collection, and the popular DanielPinard shows Les Pieds Dans Les Plats.
SÉLECT, the distribution subsidiary of
GROUPE ARCHAMBAULT, is turning outto be a top-notch strategic partner in thisarea. On the strength of this association,TVA FILMS will continue to grow thiscomplementa ry marke t , wh ich iscomposed largely of the best productsdeveloped by the TVA Network andQuebecor Media’s subsidiaries.
All of these products are finding anotherdistribution platform with the growth ofvideo-on-demand. TVA FILMS will beparticularly well positioned to benefitfrom this development.
The growing video/DVD market
Because of the significant investmentsrequired to launch a movie in theatres,profits in the distribution business aremade mainly in the video market. TVAFILMS believes that in 2005 it will strikethe right balance between the numberof movies released in cinemas and thenumber of movies released for thevideo market as movies released in2004 in cinemas should be released in2005 in the video market in addition to
Review of operations
TVA FILMS: a partner in growthTVA FILMS’ 2004 results were not as satisfactory as hoped. An excellent performance by the film Dans une galaxie près de chez-vous in movie theatres and on video could not compensate for the disappointing box-office returns of Eternal and Intern’sAcademy, which had extensive launches in cinemas across Québec and Canada.
These results will not, however, alter ourgame plan. TVA FILMS is a youngorganization that in 2004 demonstratedits professionalism in distribution and,especially, its ability to attract the besttalent. The arrival of Yves Dion, one ofthe industry’s most respected profes-sionals, at the helm of TVA FILMS shouldensure that this organization quicklyreaches its cruising speed.
Building on solid foundationsThis rhythm has already been attained in the cinema market in Québec andCanada. In 2004, TVA FILMS released 16films in theatres and the same number oflaunches is planned for this year, includingthe highly anticipated C.R.A.Z.Y., starringMichel Côté, White Noise, with Michael
Keaton and Slither with Michael Rookerwhich will be released on more than 2,000screens across the United States, andChaos, with Wesley Snipes, which is alsoexpected to be shown in a large numberof cinemas in the U.S. These films will setthe tone for the coming year: a solid criti-cal mass of quality movies launched rightacross Canada, with good revenue poten-tial in the video market.
20 - 2120 - 21
22 - 23 22 - 23
Management’sdiscussion and analysis
CORPORATE STRUCTURE
TVA Group Inc. is a communications company with operations in three businesssectors: Television, Publishing and Distribution. In the Television sector, TVA producesand broadcasts entertainment, information and public affairs programming, inaddition to its commercial production and home shopping operations. It is theprivately-owned operator of North America’s largest French-language televisionnetwork, in addition to operating three specialty channels and a general-intereststation in Toronto. In the Publishing sector, TVA produces 42 specialty magazines,including six weeklies, making it Québec’s largest publisher of French-languagemagazines. In the Distribution sector, TVA manages a large rights catalogue on allplatforms: cinemas, video, pay television and specialty and general-interest television.
GENERAL
TVA experienced a period of growth in 2004, with the Toronto 1 acquisition and thelaunch of our new digital channel, Mystère. While Mystère is succeeding beyondour expectations, another digital channel, Argent, will be officially launched onFebruary 21, 2005. As for Toronto 1, acquired December 2, 2004, in partnershipwith our sister company Sun Media Corporation, the revival of this station and theintroduction of targeted, interesting programming will require a lot of consideration.On the strength of our current operations and the talent of our management team,we are anticipating this challenge with plenty of enthusiasm and passion.
Following the obvious success of Star Académie and Occupation Double in 2003, webrought them back in 2004 with as much success and two new reality TV shows,Facteurs de Risque and Pour le meilleur et pour le pire were added. In the fictioncategory, the fall programming lineup included Lance et Compte : La Reconquête, thecontinuation of a series that, with the world of professional hockey as its background,instantly recaptured viewer loyalty. Despite increasingly strong competition in theentertainment industry, TVA remained the frontrunner in 2004. The Bureau ofBroadcast Measurement (BBM) PeopleMeter showed that TVA broadcast 25 of the 30best-watched shows in its market in 2004. But these phenomenal results were notachieved without significant investments in programming, and particularly in thelocally produced shows that viewers so desire. However, increasing content costs areof concern, especially because of the decline in government assistance and theinflationary environment created by the state-owned Radio-Canada, which constantlyoutbids its competition when acquiring content. To fight this completely unbalancedcompetition, TVA must constantly improve and continually produce and commissionbetter-quality shows, and it must do so with, with far fewer financial resources.
OPERATING RESULTS
The following Management’s Discussion and Analysis of the financial position andresults of TVA Group’s operations should be read in conjunction with theCompany’s consolidated financial statements.
Operating revenues (in thousands of dollars)
Year ended Year endedDecember 31, December 31,
2004 2003
Television $ 271,216 $ 245,643Publishing 76,268 77,606Distribution 13,242 19,872Intersegment items (2,766) (2,176)
$ 357,960 $ 340,945
TVA’s operating revenues reached a new high of $357,960,000 in fiscal 2004, up 5%over the $340,945,000 reported for the previous year. This increase comesessentially from the Television sector, whose revenues rose by more than 10% overfiscal 2003, an increase of $25,573,000. The Publishing business, for its part, sawits revenues decline slightly, mainly as a result of the far less significant spinoffsfrom the Star Académie television phenomenon. Revenues for the Distributionsector declined because of the lower revenues generated by TVA International’scatalogue, which is now providing only a fraction of this business’s total revenues.In addition, after having launched the movie Dans une galaxie près de chez vous,which generated very good box office receipts, revenues generated by the othermovies launched during the year, including Eternal, Intern’s Academy, Clean, LeLittoral and Jeux d’enfants, were below our expectations.
Earnings before interest, income taxes, depreciation and amortization(EBITDA) (In thousands of dollars)
Year ended Year endedDecember 31, December 31,
2004 2003
Television $ 66,617 $ 63,228Publishing 15,651 19,079Distribution (1,765) (848)
$ 80,503 $ 81,459
Earnings before interest, income taxes, depreciation and amortization (EBITDA)were $80,503,000 for the year ended December 31, 2004, compared with$81,459,000 for the year ended December 31, 2003. This decline is due mainly tothe Publishing sector’s poorer performance. In the Television business, despite theimpact on earnings of the Toronto 1 acquisition on December 2, 2004, and of theMystère launch on October 21, 2004, EBITDA grew by more than 5% during theyear. However, the disappointing performance by the films released in cinemasduring the year is the main reason for the loss recorded by the Distribution sector.
TELEVISION
The growth of 10.4% in the Television sector’s operating revenues is explained by,among other things, the excellent 8.8% increase in advertising revenues, supportedby a programming lineup that produced an average audience increase for 2004 overthe prior year, and by an advertising market that remained favourable throughoutthe entire year. The end of the BBM’s use of TV viewing diaries this past fall in theMontréal area and their replacement by PeopleMeters, which measure viewershipday after day, now allow us to better program our television shows on the basis ofavailable audience and advertising demand. This change in audience measurementmethodology opens up new possibilities as well as new challenges. Our entireprogramming strategy was reviewed in 2004 to take this new reality into account.Sales generated by the home shopping business also advanced strongly during thefiscal year, posting a 58% growth over the previous year. Better marketing of ourproducts and a more varied offering helped us achieve these results. Ourcommercial production division also contributed to our growth, with a 21%improvement in its sales for 2004 over the previous year.
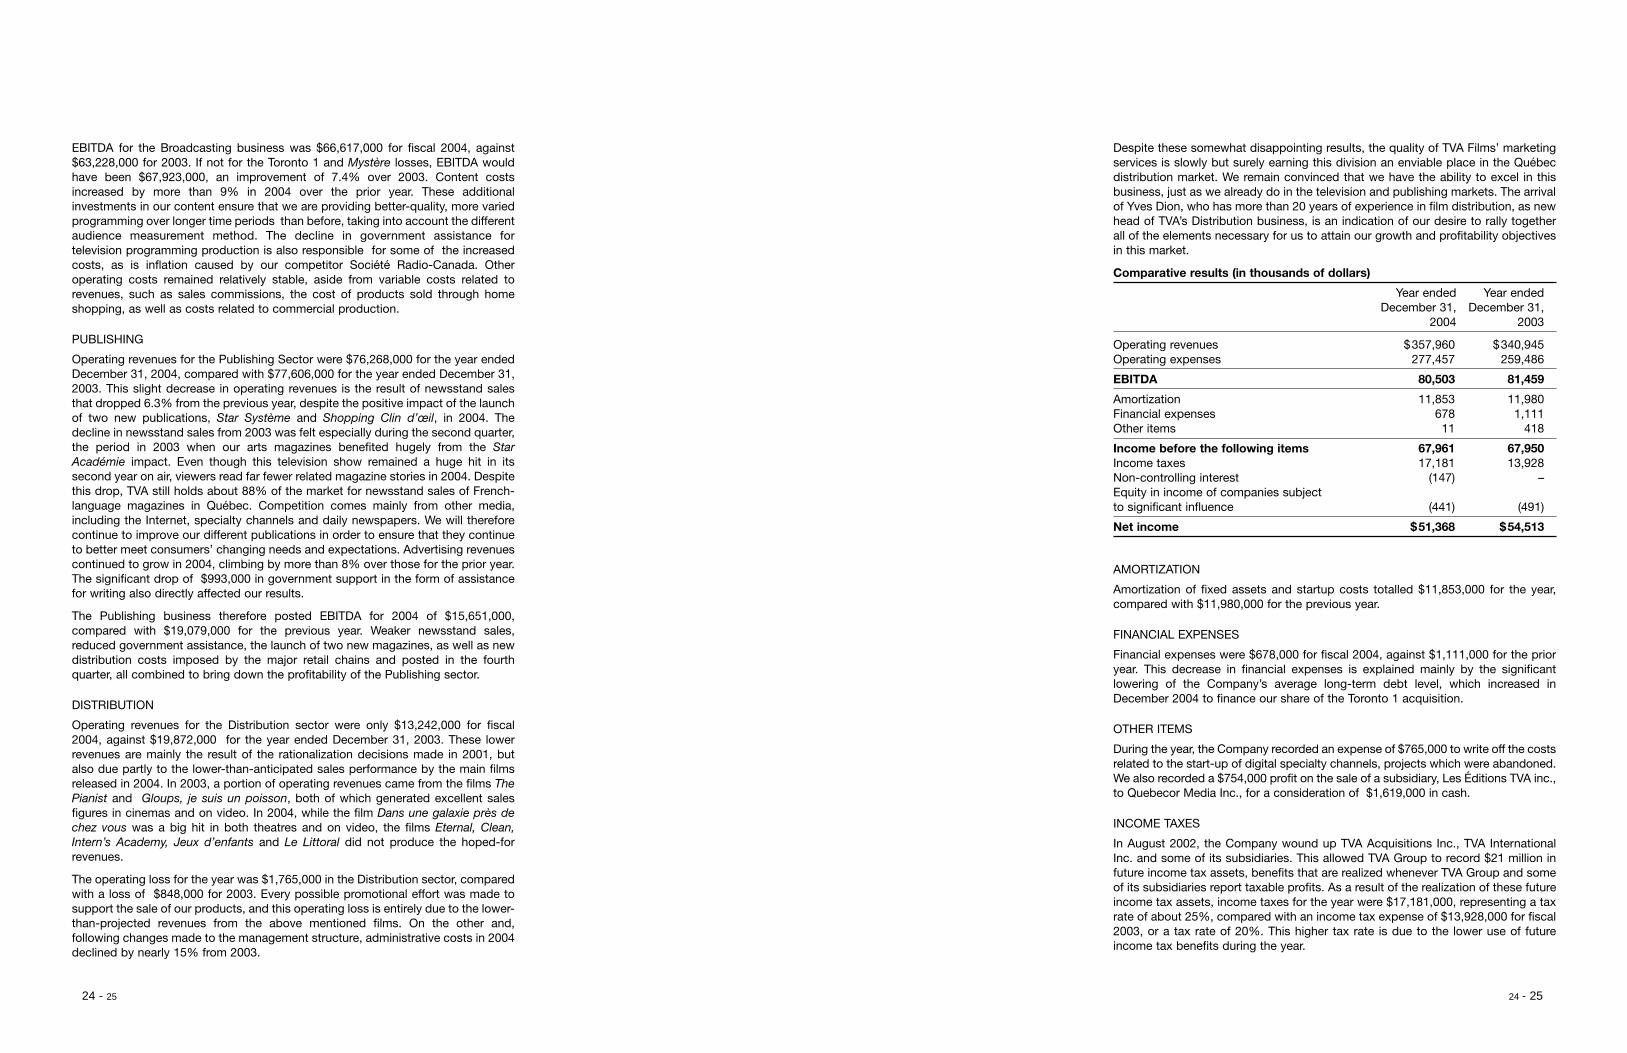
Despite these somewhat disappointing results, the quality of TVA Films’ marketingservices is slowly but surely earning this division an enviable place in the Québecdistribution market. We remain convinced that we have the ability to excel in thisbusiness, just as we already do in the television and publishing markets. The arrivalof Yves Dion, who has more than 20 years of experience in film distribution, as newhead of TVA’s Distribution business, is an indication of our desire to rally togetherall of the elements necessary for us to attain our growth and profitability objectivesin this market.
Comparative results (in thousands of dollars)
Year ended Year endedDecember 31, December 31,
2004 2003
Operating revenues $357,960 $340,945Operating expenses 277,457 259,486
EBITDA 80,503 81,459
Amortization 11,853 11,980Financial expenses 678 1,111Other items 11 418
Income before the following items 67,961 67,950Income taxes 17,181 13,928Non-controlling interest (147) –Equity in income of companies subject to significant influence (441) (491)
Net income $51,368 $54,513
AMORTIZATION
Amortization of fixed assets and startup costs totalled $11,853,000 for the year,compared with $11,980,000 for the previous year.
FINANCIAL EXPENSES
Financial expenses were $678,000 for fiscal 2004, against $1,111,000 for the prioryear. This decrease in financial expenses is explained mainly by the significantlowering of the Company’s average long-term debt level, which increased inDecember 2004 to finance our share of the Toronto 1 acquisition.
OTHER ITEMS
During the year, the Company recorded an expense of $765,000 to write off the costsrelated to the start-up of digital specialty channels, projects which were abandoned.We also recorded a $754,000 profit on the sale of a subsidiary, Les Éditions TVA inc.,to Quebecor Media Inc., for a consideration of $1,619,000 in cash.
INCOME TAXES
In August 2002, the Company wound up TVA Acquisitions Inc., TVA InternationalInc. and some of its subsidiaries. This allowed TVA Group to record $21 million infuture income tax assets, benefits that are realized whenever TVA Group and someof its subsidiaries report taxable profits. As a result of the realization of these futureincome tax assets, income taxes for the year were $17,181,000, representing a taxrate of about 25%, compared with an income tax expense of $13,928,000 for fiscal2003, or a tax rate of 20%. This higher tax rate is due to the lower use of futureincome tax benefits during the year.
24 - 25 24 - 25
EBITDA for the Broadcasting business was $66,617,000 for fiscal 2004, against$63,228,000 for 2003. If not for the Toronto 1 and Mystère losses, EBITDA wouldhave been $67,923,000, an improvement of 7.4% over 2003. Content costsincreased by more than 9% in 2004 over the prior year. These additionalinvestments in our content ensure that we are providing better-quality, more variedprogramming over longer time periods than before, taking into account the differentaudience measurement method. The decline in government assistance fortelevision programming production is also responsible for some of the increasedcosts, as is inflation caused by our competitor Société Radio-Canada. Otheroperating costs remained relatively stable, aside from variable costs related torevenues, such as sales commissions, the cost of products sold through homeshopping, as well as costs related to commercial production.
PUBLISHING
Operating revenues for the Publishing Sector were $76,268,000 for the year endedDecember 31, 2004, compared with $77,606,000 for the year ended December 31,2003. This slight decrease in operating revenues is the result of newsstand salesthat dropped 6.3% from the previous year, despite the positive impact of the launchof two new publications, Star Système and Shopping Clin d’œil, in 2004. Thedecline in newsstand sales from 2003 was felt especially during the second quarter,the period in 2003 when our arts magazines benefited hugely from the StarAcadémie impact. Even though this television show remained a huge hit in itssecond year on air, viewers read far fewer related magazine stories in 2004. Despitethis drop, TVA still holds about 88% of the market for newsstand sales of French-language magazines in Québec. Competition comes mainly from other media,including the Internet, specialty channels and daily newspapers. We will thereforecontinue to improve our different publications in order to ensure that they continueto better meet consumers’ changing needs and expectations. Advertising revenuescontinued to grow in 2004, climbing by more than 8% over those for the prior year.The significant drop of $993,000 in government support in the form of assistancefor writing also directly affected our results.
The Publishing business therefore posted EBITDA for 2004 of $15,651,000,compared with $19,079,000 for the previous year. Weaker newsstand sales,reduced government assistance, the launch of two new magazines, as well as newdistribution costs imposed by the major retail chains and posted in the fourthquarter, all combined to bring down the profitability of the Publishing sector.
DISTRIBUTION
Operating revenues for the Distribution sector were only $13,242,000 for fiscal2004, against $19,872,000 for the year ended December 31, 2003. These lowerrevenues are mainly the result of the rationalization decisions made in 2001, butalso due partly to the lower-than-anticipated sales performance by the main filmsreleased in 2004. In 2003, a portion of operating revenues came from the films ThePianist and Gloups, je suis un poisson, both of which generated excellent salesfigures in cinemas and on video. In 2004, while the film Dans une galaxie près dechez vous was a big hit in both theatres and on video, the films Eternal, Clean,Intern’s Academy, Jeux d’enfants and Le Littoral did not produce the hoped-forrevenues.
The operating loss for the year was $1,765,000 in the Distribution sector, comparedwith a loss of $848,000 for 2003. Every possible promotional effort was made tosupport the sale of our products, and this operating loss is entirely due to the lower-than-projected revenues from the above mentioned films. On the other and,following changes made to the management structure, administrative costs in 2004declined by nearly 15% from 2003.
During the year, the Company acquired tax deductions representing income taxesof about $6,163,000 from Quebecor World Inc., a company under the commoncontrol of its ultimate parent corporation, Quebecor Inc. The entire amount wasrecorded as current income tax assets. Additional tax benefits of $1,820,000 will berecorded in the Company’s results when a new deduction multiple applied to taxdeductions acquired in 2004 is officially enacted. This transaction allowed theCompany to realize a profit of $187,000, which was recorded as contributedsurplus. At December 31, 2004, the Company has an account payable of$5,539,000 to Quebecor World Inc.
NON-CONTROLLING INTEREST
Non-controlling interest is $147,000, representing Sun Media Corporation’s share ofthe Toronto 1 net loss.
EQUITY IN INCOME OF COMPANIES SUBJECT TO SIGNIFICANT INFLUENCE
Following the closure of Netgraphe inc.’s capital on October 31, 2004, and thesubsequent reorganization, TVA owns 13.8% of the outstanding shares ofNetgraphe, now known as Canoe inc. TVA has therefore no longer been reportingequity in Netgraphe’s results since October 31, 2004. Even so, equity in income ofcompanies subject to significant influence for fiscal 2004 was $441,000, comparedwith $491,000 for the previous year.
NET INCOME
TVA Group reported net income of $51,368,000, or $1.61 per share, for its yearended December 31, 2004, compared with net income of $54,513,000, or $1.65 pershare, for the previous year. As a result, return on shareholders’equity was 21% forthe year, against 24% for fiscal 2003.
Calculation of per-share amounts is based on weighted averages of 31,899,585diluted shares outstanding for the fiscal year ended December 31, 2004, and33,115,073 diluted shares outstanding for the year ended December 31, 2003.
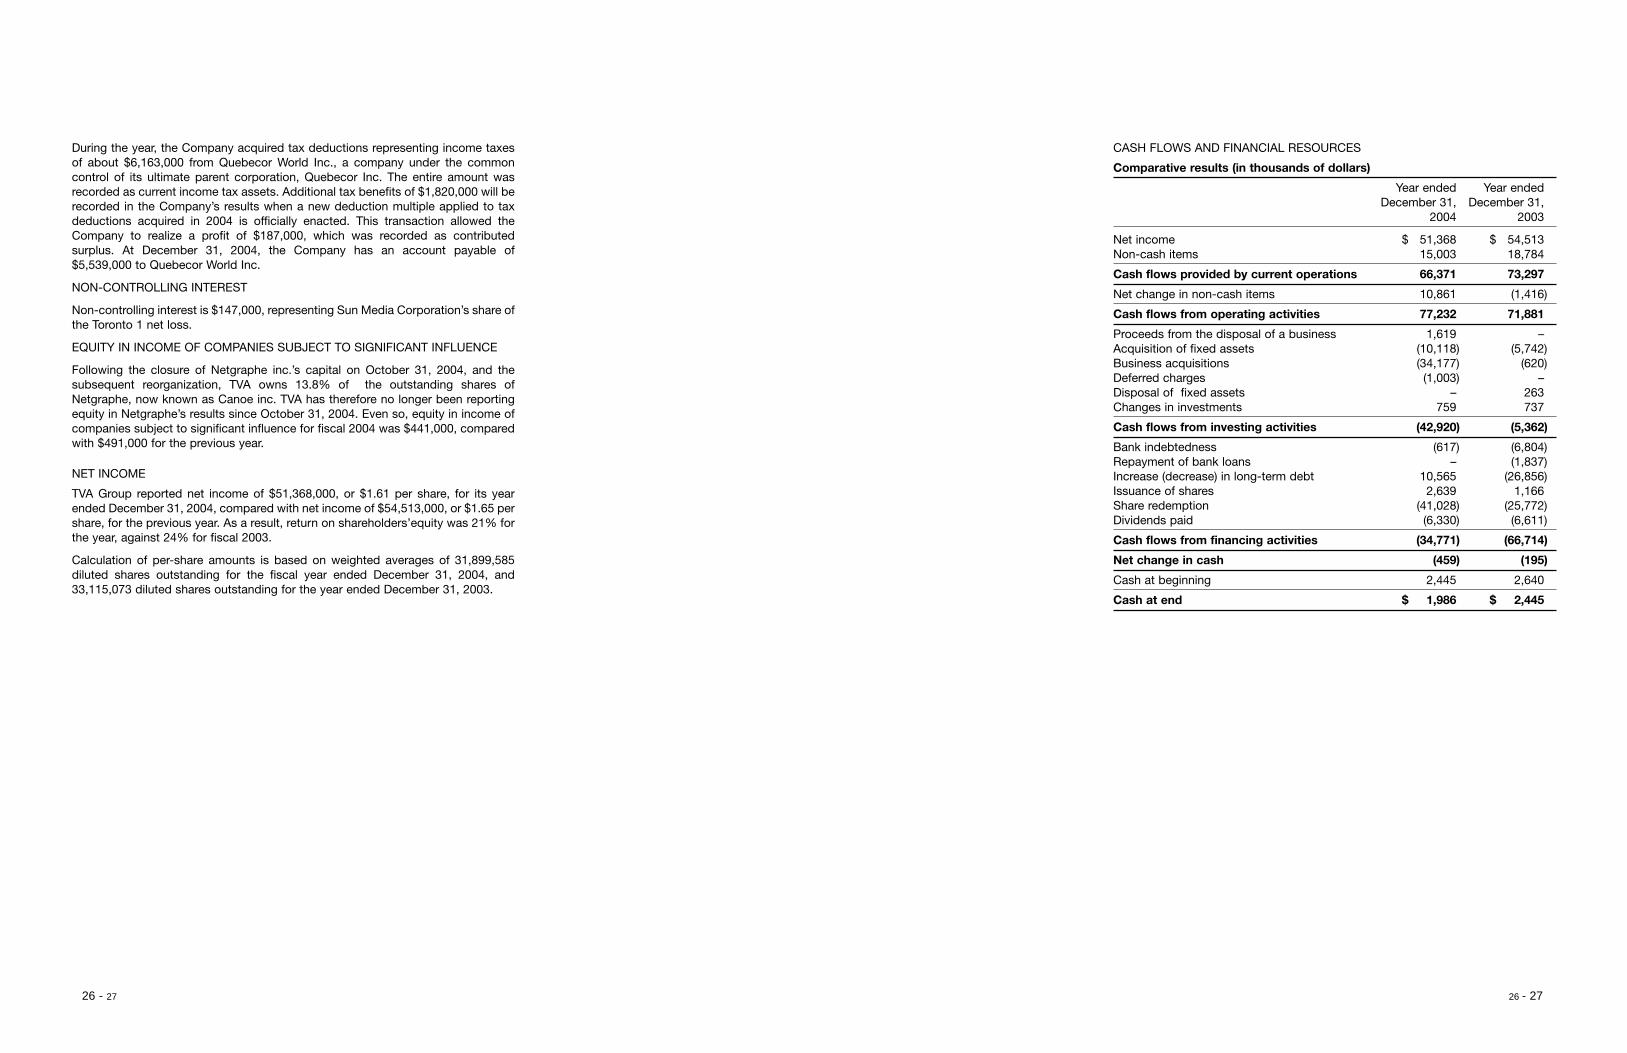
CASH FLOWS AND FINANCIAL RESOURCES
Comparative results (in thousands of dollars)
Year ended Year endedDecember 31, December 31,
2004 2003
Net income $ 51,368 $ 54,513Non-cash items 15,003 18,784
Cash flows provided by current operations 66,371 73,297
Net change in non-cash items 10,861 (1,416)
Cash flows from operating activities 77,232 71,881
Proceeds from the disposal of a business 1,619 –Acquisition of fixed assets (10,118) (5,742)Business acquisitions (34,177) (620)Deferred charges (1,003) –Disposal of fixed assets – 263Changes in investments 759 737
Cash flows from investing activities (42,920) (5,362)
Bank indebtedness (617) (6,804)Repayment of bank loans – (1,837)Increase (decrease) in long-term debt 10,565 (26,856)Issuance of shares 2,639 1,166Share redemption (41,028) (25,772)Dividends paid (6,330) (6,611)
Cash flows from financing activities (34,771) (66,714)
Net change in cash (459) (195)
Cash at beginning 2,445 2,640
Cash at end $ 1,986 $ 2,445
26 - 27 26 - 27
OPERATIONS
Cash flows provided by operations totalled $77,232,000 for fiscal 2004, comparedwith $71,881,000 for 2003. This increase in cash flows provided by operations isdue to changes in non-cash items that generated less cash last year.
INVESTING
On December 2, 2004, following a decision by the Canadian Radio-Television andTelecommunications Commission (CRTC), the Company (75%) and Sun MediaCorporation (25%), a company under the common control of its ultimate parentcorporation, Quebecor Inc., acquired from CHUM Limited all of the shares of3095531 Nova Scotia Company, which owns the operating licence for the Toronto1 television station, for an acquisition price of $43,249,000, comprising an agreed-upon acquisition price of $46,000,000, less a preliminary working capitaladjustment of $3,451,000, plus transaction costs of $700,000. Of this amount,$32,437,000 was paid in cash by the Company, giving it a 75% interest in Toronto1. Sun Media Corporation paid $2,812,000 in cash and transferred to CHUMLimited its 29.9% interest, valued at $8,000,000, in Cable Pulse 24 (CP24), aToronto all-news station, thereby giving it a 25% interest in Toronto 1. Given that theallocation of the purchase price was not completed as at December 31, 2004, theamounts allocated to assets and liabilities may be modified at a later date.
FINANCING
During the year, TVA Group Inc. filed a new offer to repurchase for cancellation, in thenormal course of its activities between June 3, 2004, and June 2, 2005, a maximumof 1,585,593 of the Company’s Class B shares, or about 10% of the total number ofClass B shares outstanding and not held by insiders at the opening of the offer. Duringthe previous fiscal year, TVA Group had also filed notice of intent to repurchase forcancellation, in the normal course of its activities, a maximum of 1,797,708 Class Bshares. During fiscal 2004, the Company redeemed 1,892,500 shares as part of thisprogram for total proceeds of $41,028,000. During the previous fiscal year, TVA Grouphad redeemed 1,452,200 shares for total proceeds of $25,772,000.
On February 11, 2002, the Company reached a new credit agreement consisting ofa revolving-term bank loan of a maximum amount of $135,000,000, bearing interestat the prime rate of a Canadian chartered bank, plus a variable margin based on theratio of total debt to cash flows. During the year, the Company reduced to$65,000,000 from $135,000,000 the amount it can borrow under this creditagreement. As well, the term of this credit agreement had been extended by oneyear during fiscal 2003, bringing it to February 11, 2006. At December 31, 2004, theunused and available balance of revolving credit stood at $29,646,000.
During the year, the Company used $32,437,000 of its revolving credit to finance theToronto 1 acquisition.
FINANCIAL SITUATION
TVA Group’s financial situation is excellent. At December 31, 2004, the consolidateddebt ratio — as measured by the debt-to-capitalization ratio — stood at 12:88,compared with 9:91 at December 31, 2003, and this despite an amount of$41,028,000 invested to repurchase shares and an amount of $34,177,000 investedin business acquisitions. For ratio calculation purposes, the debt includes bankloans, net of cash, and long-term debt.
The Company’s long-term debt stood at $34,929,000 at December 31, 2004,against $24,364,000 at the same date a year earlier, an increase of just$10,565,000 as a result of the aforementioned items.
The Company paid dividends of $0.20 per share during the fiscal year, the sameamount paid during fiscal 2003.
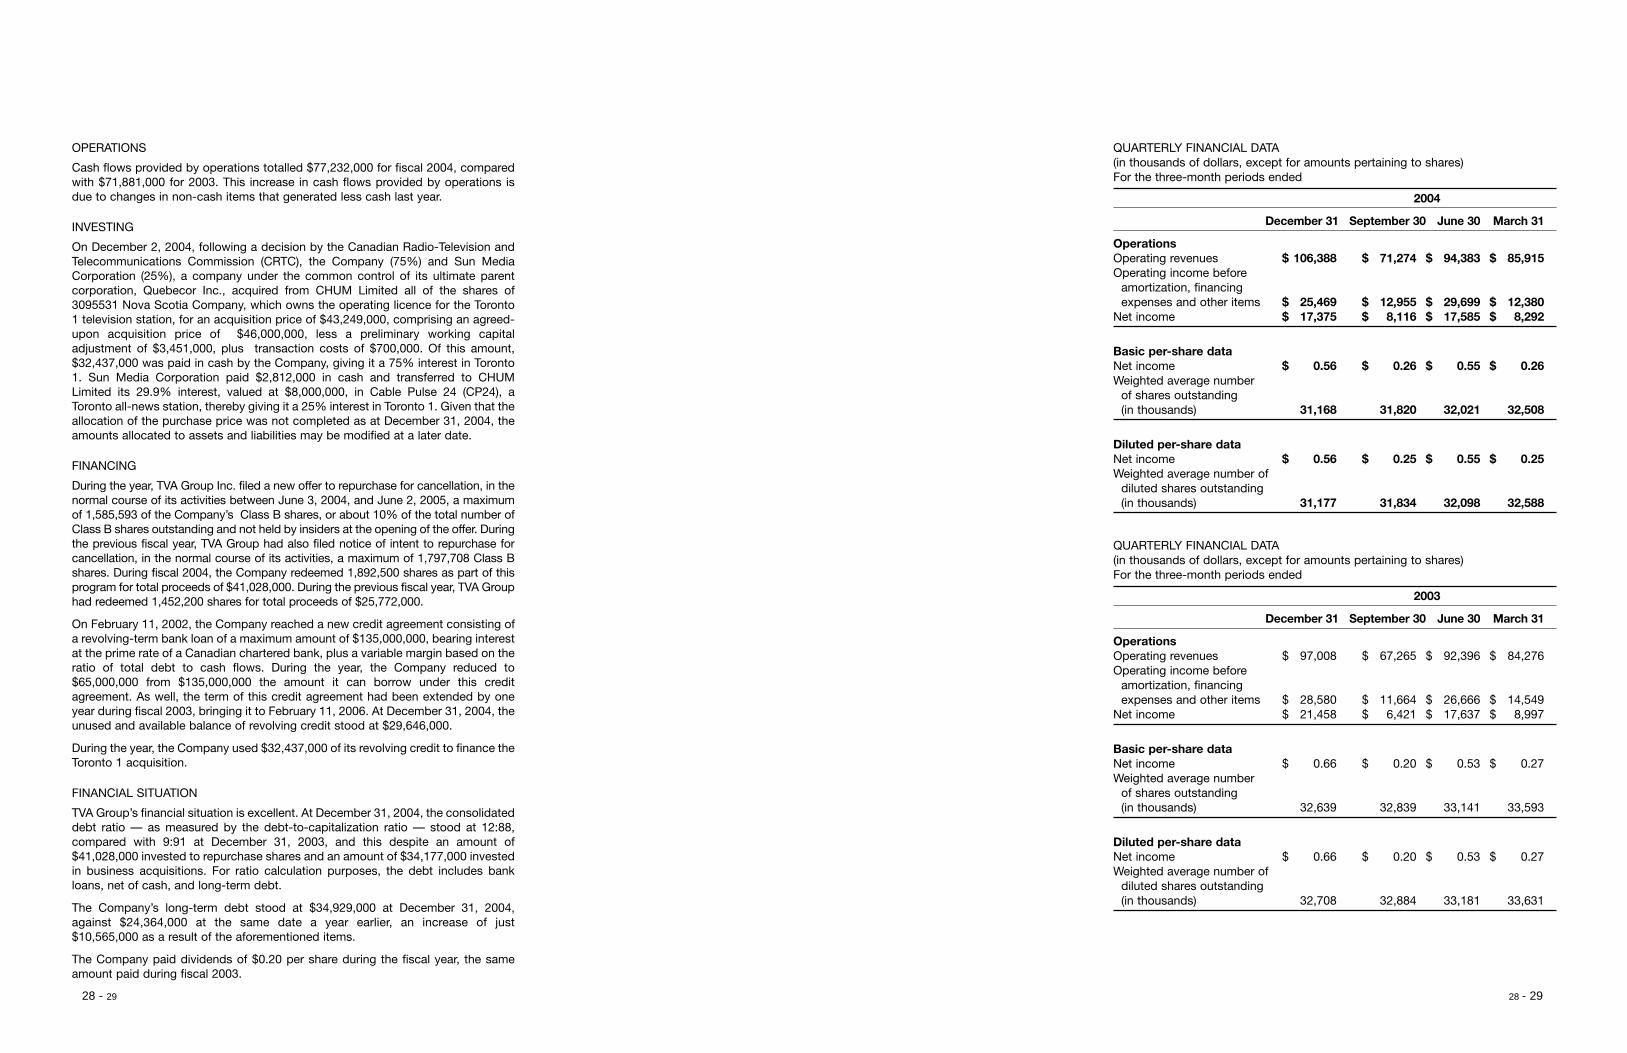
QUARTERLY FINANCIAL DATA(in thousands of dollars, except for amounts pertaining to shares)For the three-month periods ended
2004
December 31 September 30 June 30 March 31
OperationsOperating revenues $ 106,388 $ 71,274 $ 94,383 $ 85,915Operating income before
amortization, financingexpenses and other items $ 25,469 $ 12,955 $ 29,699 $ 12,380
Net income $ 17,375 $ 8,116 $ 17,585 $ 8,292
Basic per-share dataNet income $ 0.56 $ 0.26 $ 0.55 $ 0.26Weighted average number
of shares outstanding (in thousands) 31,168 31,820 32,021 32,508
Diluted per-share dataNet income $ 0.56 $ 0.25 $ 0.55 $ 0.25Weighted average number of
diluted shares outstanding (in thousands) 31,177 31,834 32,098 32,588
QUARTERLY FINANCIAL DATA(in thousands of dollars, except for amounts pertaining to shares)For the three-month periods ended
2003
December 31 September 30 June 30 March 31
OperationsOperating revenues $ 97,008 $ 67,265 $ 92,396 $ 84,276Operating income before
amortization, financingexpenses and other items $ 28,580 $ 11,664 $ 26,666 $ 14,549
Net income $ 21,458 $ 6,421 $ 17,637 $ 8,997
Basic per-share dataNet income $ 0.66 $ 0.20 $ 0.53 $ 0.27Weighted average number
of shares outstanding (in thousands) 32,639 32,839 33,141 33,593
Diluted per-share dataNet income $ 0.66 $ 0.20 $ 0.53 $ 0.27Weighted average number of
diluted shares outstanding (in thousands) 32,708 32,884 33,181 33,631
28 - 29 28 - 29
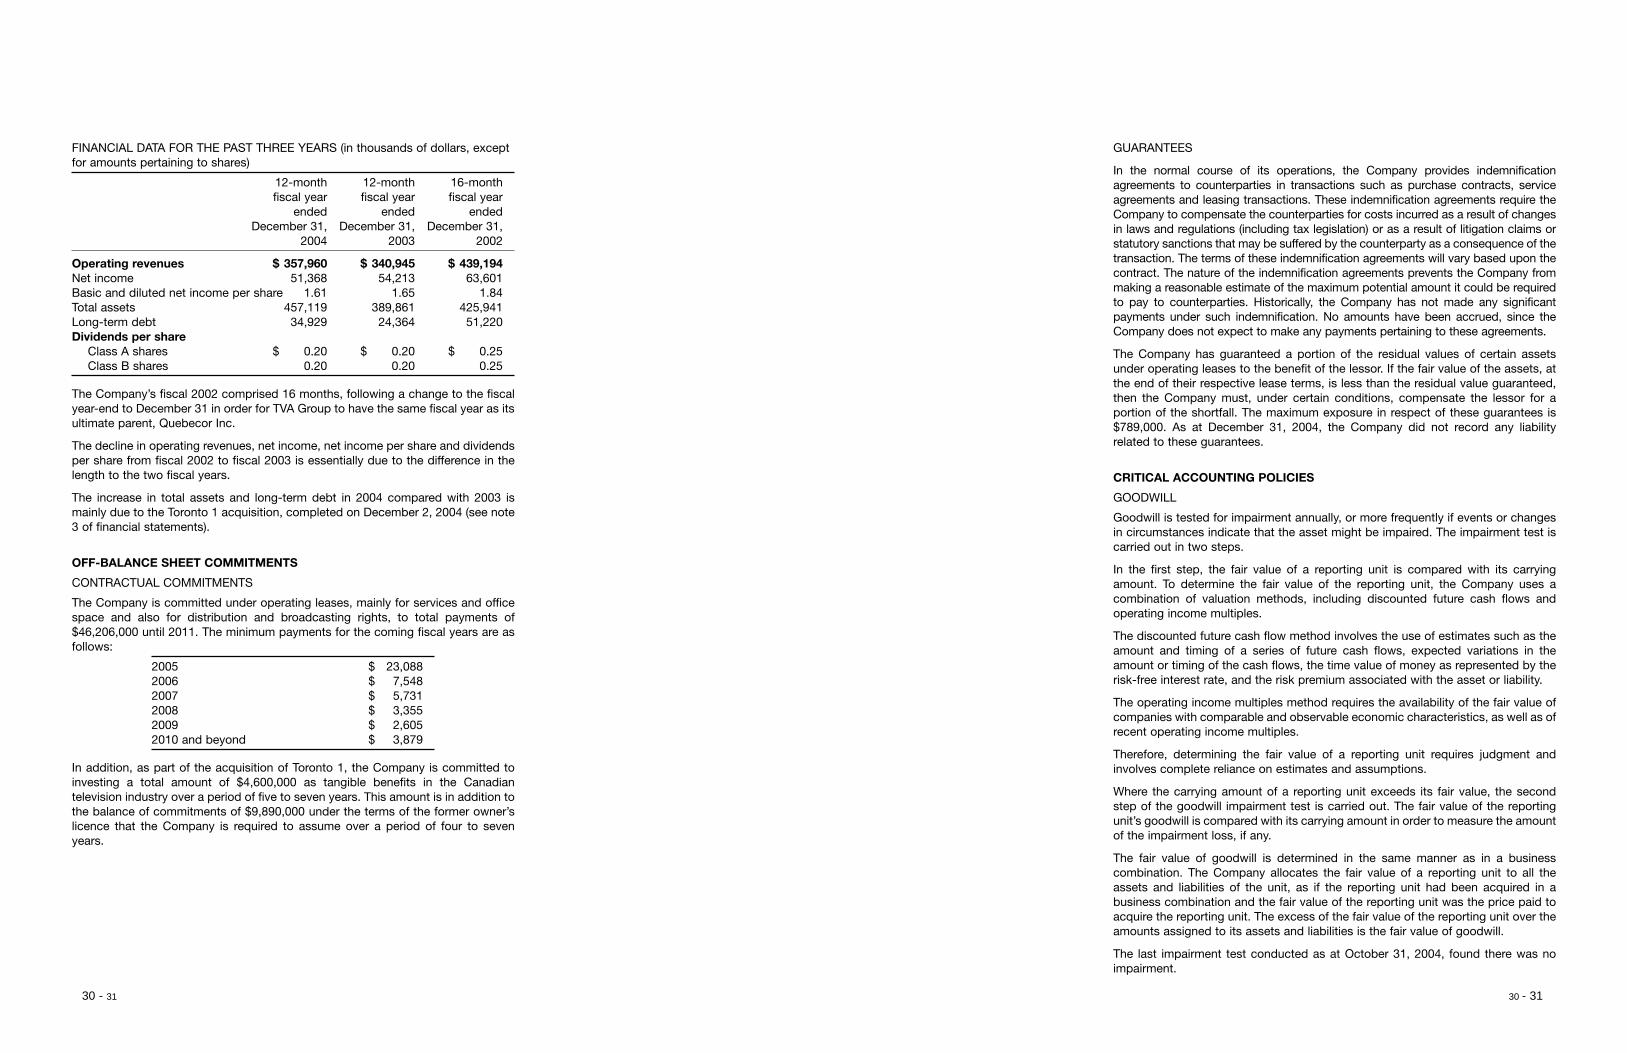
FINANCIAL DATA FOR THE PAST THREE YEARS (in thousands of dollars, exceptfor amounts pertaining to shares)
12-month 12-month 16-monthfiscal year fiscal year fiscal year
ended ended endedDecember 31, December 31, December 31,
2004 2003 2002
Operating revenues $ 357,960 $ 340,945 $ 439,194Net income 51,368 54,213 63,601Basic and diluted net income per share 1.61 1.65 1.84Total assets 457,119 389,861 425,941Long-term debt 34,929 24,364 51,220Dividends per share
Class A shares $ 0.20 $ 0.20 $ 0.25Class B shares 0.20 0.20 0.25
The Company’s fiscal 2002 comprised 16 months, following a change to the fiscalyear-end to December 31 in order for TVA Group to have the same fiscal year as itsultimate parent, Quebecor Inc.
The decline in operating revenues, net income, net income per share and dividendsper share from fiscal 2002 to fiscal 2003 is essentially due to the difference in thelength to the two fiscal years.
The increase in total assets and long-term debt in 2004 compared with 2003 ismainly due to the Toronto 1 acquisition, completed on December 2, 2004 (see note3 of financial statements).
OFF-BALANCE SHEET COMMITMENTS
CONTRACTUAL COMMITMENTS
The Company is committed under operating leases, mainly for services and officespace and also for distribution and broadcasting rights, to total payments of$46,206,000 until 2011. The minimum payments for the coming fiscal years are asfollows:
2005 $ 23,0882006 $ 7,5482007 $ 5,7312008 $ 3,3552009 $ 2,6052010 and beyond $ 3,879
In addition, as part of the acquisition of Toronto 1, the Company is committed toinvesting a total amount of $4,600,000 as tangible benefits in the Canadiantelevision industry over a period of five to seven years. This amount is in addition tothe balance of commitments of $9,890,000 under the terms of the former owner’slicence that the Company is required to assume over a period of four to sevenyears.
GUARANTEES
In the normal course of its operations, the Company provides indemnificationagreements to counterparties in transactions such as purchase contracts, serviceagreements and leasing transactions. These indemnification agreements require theCompany to compensate the counterparties for costs incurred as a result of changesin laws and regulations (including tax legislation) or as a result of litigation claims orstatutory sanctions that may be suffered by the counterparty as a consequence of thetransaction. The terms of these indemnification agreements will vary based upon thecontract. The nature of the indemnification agreements prevents the Company frommaking a reasonable estimate of the maximum potential amount it could be requiredto pay to counterparties. Historically, the Company has not made any significantpayments under such indemnification. No amounts have been accrued, since theCompany does not expect to make any payments pertaining to these agreements.
The Company has guaranteed a portion of the residual values of certain assetsunder operating leases to the benefit of the lessor. If the fair value of the assets, atthe end of their respective lease terms, is less than the residual value guaranteed,then the Company must, under certain conditions, compensate the lessor for aportion of the shortfall. The maximum exposure in respect of these guarantees is$789,000. As at December 31, 2004, the Company did not record any liabilityrelated to these guarantees.
CRITICAL ACCOUNTING POLICIES
GOODWILL
Goodwill is tested for impairment annually, or more frequently if events or changesin circumstances indicate that the asset might be impaired. The impairment test iscarried out in two steps.
In the first step, the fair value of a reporting unit is compared with its carryingamount. To determine the fair value of the reporting unit, the Company uses acombination of valuation methods, including discounted future cash flows andoperating income multiples.
The discounted future cash flow method involves the use of estimates such as theamount and timing of a series of future cash flows, expected variations in theamount or timing of the cash flows, the time value of money as represented by therisk-free interest rate, and the risk premium associated with the asset or liability.
The operating income multiples method requires the availability of the fair value ofcompanies with comparable and observable economic characteristics, as well as ofrecent operating income multiples.
Therefore, determining the fair value of a reporting unit requires judgment andinvolves complete reliance on estimates and assumptions.
Where the carrying amount of a reporting unit exceeds its fair value, the secondstep of the goodwill impairment test is carried out. The fair value of the reportingunit’s goodwill is compared with its carrying amount in order to measure the amountof the impairment loss, if any.
The fair value of goodwill is determined in the same manner as in a businesscombination. The Company allocates the fair value of a reporting unit to all theassets and liabilities of the unit, as if the reporting unit had been acquired in abusiness combination and the fair value of the reporting unit was the price paid toacquire the reporting unit. The excess of the fair value of the reporting unit over theamounts assigned to its assets and liabilities is the fair value of goodwill.
The last impairment test conducted as at October 31, 2004, found there was noimpairment.
30 - 31 30 - 31
LICENCES
Licences include broadcast licences and magazine trademark licences forCanadian operations.
Broadcast licences represent the cost of acquiring rights to operate broadcastingstations and have an indefinite useful life.
These licences are tested for impairment annually or are re-evaluated where eventsor changes in circumstances so require. The carrying value of the licence iscompared with its fair value and any unfavourable variances are charged to theCompany’s results.
The Company uses a combination of valuation methods, including discountedfuture cash flows and operating income multiples.
The discounted future cash flow method involves the use of estimates such as theamount and timing of the cash flows, expected variations in the amount or timingof the cash flows, the time value of money as represented by the risk-free interestrate, and the risk premium associated with the asset or liability.
The operating income multiples method requires the availability of the fair value ofcompanies with comparable and observable economic characteristics, as well as ofrecent operating income multiples.
The impairment test conducted as at October 31, 2004, found no loss of value.
PENSION PLANS AND POST-RETIREMENT BENEFITS
The Company offers its employees defined-benefit and defined-contributionpension plans. The Company’s policy is to maintain its contributions at a sufficientlevel to cover benefits. Actuarial valuations have been performed of the Company’svarious pension plans in the last three years. Pension plan assets are calculated atfair value. Pension plan assets consist of equities and corporate and governmentfixed-income securities.
The Company’s obligations with respect to post-retirement benefits are assessedon the basis of a number of economic and demographic assumptions, which areestablished with the assistance of the Company’s actuaries. Key assumptionsrelate to the discount rate, the expected return on the plan’s assets, and the rate ofincrease in compensation.
The Company considers the assumptions used to be reasonable in view of theinformation available at this time. However, variances from these assumptionscould have a material impact on the costs and obligations of pension plans andpost-retirement benefits in future periods.
FUTURE INCOME TAXES
The Company is required to assess the ultimate realization of the future income taxassets generated from temporary differences between the book basis and tax basisof assets and liabilities and losses carry-forward in the future. This assessment isjudgmental in nature and dependent on assumptions and estimates regarding theavailability and character of future taxable income. The ultimate amount of futureincome tax assets realized could be materially different from the one recorded, asit is influenced by future operating results of the Company.
ACCOUNTING POLICIES
CHANGES IN ACCOUNTING POLICIES
On January 1, 2004, the Company adopted, on a prospective basis, therecommendations in Section 3063 of the CICA Handbook entitled Impairment ofLong-Lived Assets. These recommendations establish standards for therecognition, measurement and disclosure of the impairment of long-lived assetsand stipulate that an impairment loss should be recognized when the carrying valueof a long-lived asset intended for use exceeds the sum of the undiscounted cashflows expected from its use and eventual disposition. The impairment loss is to bemeasured as the excess of the carrying value of the asset over its fair value. Theadoption of the new recommendations had no impact on the Company’s results forthe fiscal year ended December 31, 2004.
In December 2002, the CICA issued the revised Section 3475 of the CICAHandbook, Disposal of Long-Lived Assets and Discontinued Operations. Thissection supersedes the write-down and disposal provisions of Section 3061,Property, Plant and Equipment, for assets to be disposed of by sale or otherwise aswell as former Section 3475, Discontinued Operations, of the CICA Handbook.Section 3475 provides specified criteria for classifying an asset as held-for-sale andrequires assets classified as held-for-sale to be accounted for at the lower of theircarrying amount or fair value, less selling costs. Section 3475 also broadens thescope of businesses that qualify for reporting by including as discontinuedoperations any disposals of a component of an entity for which operating resultsand cash flows can be clearly distinguished from the rest of the Company, andchanges the timing of loss recognition on such operations. The revised standardsin Section 3475 on disposal of long-lived assets and discontinued operations areapplicable to disposal activities initiated under an exit plan committed to on or afterMay 1, 2003. The adoption of these standards did not have an impact on theCompany’s consolidated financial statements for the fiscal year ended December31, 2004.
RISKS AND UNCERTAINTIES
The Company operates in the communications industry, which has a variety of riskfactors and uncertainties. Due to the risks and uncertainties outlined below, theCompany’s operating environment and financial results may be materially affected.
SEASONALITY
The Company’s business is sensitive to general economic cycles and may beadversely affected by the cyclical nature of the markets the Company serves, aswell as by local, regional, national and global economic conditions. Seasonalvariations in retail business influence the Company’s financial results. In addition,because the Company’s operations are labour intensive, its cost structure is highlyfixed. During periods of economic contraction, revenue may decrease while thecost structure remains stable, resulting in decreased earnings.
OPERATIONAL RISKS
Competition for advertising, customers, viewers, listeners, readers and distributionis intense and comes from broadcast television stations and networks and specialtycable channels, radio, local, regional and national newspapers, magazines, directmail, and other communications and advertising media that operate in theCompany’s markets. Competitors include both privately-owned companies andgovernment-owned market participants. In addition, there is increasingconsolidation in the Canadian media industries, and competitors increasinglyinclude market participants with interests in multiple industries and media.
32 - 33 32 - 33

34 - 35
ENVIRONMENTAL RISKS
The Company is subject to a variety of environmental laws and regulations. Failureto comply with present or future laws or regulations could result in substantialliability. Although the Company believes it is in compliance with such laws,regulations and government policies in all material respects, there is no assurancethat all environmental liabilities have been determined.
CREDIT RISKS
The concentration of credit risks with respect to trade receivables is limited due tothe Company’s diverse operations and customer base. As at December 31, 2004,no customer balance represented a significant portion of the Company’sconsolidated trade receivables.
GOVERNMENT REGULATION RISKS
The Company is subject to extensive government regulations mainly through theBroadcasting Act and the Telecommunications Act, both administered by theCanadian Radio-television and Telecommunications Commission (“CRTC”).Changes to the regulations and policies governing television, the introduction ofnew regulations or policies or terms of licence could have a material effect on theCompany’s business, financial condition or results of operations.
GOVERNMENT ASSISTANCE RISKS
The Company takes advantage of several government programs designed tosupport production and distribution of televisual products and movies andmagazine publishing in Canada. Any future changes in the rules of application ofthese government programs may have a significant impact on the Company’soperating results.
The Company is a reporting issuer under the securities legislation of all of theprovinces of Canada; therefore, it is required to file financial statements, amanagement proxy circular and an annual information form with the varioussecurities regulatory authorities. Copies of said documents may be obtained freeof charge on request from the Company or on the Internet at the following address:www.sedar.com.
34 - 35
The accompanying consolidated financial statements of Groupe TVA Inc. and itssubsidiaries are the responsibility of management and have been approved by the Boardof Directors of Groupe TVA Inc.
These financial statements have been prepared by management in conformity withCanadian generally accepted accounting principles and include amounts that are basedon best estimates and judgments.
The management of the Company and of its subsidiaries, in furtherance of the integrityand objectivity of the data in the financial statements, has developed and maintainssystems of internal accounting controls and supports a program of internal audit.Management believes that these systems of internal accounting controls providereasonable assurance that financial records are reliable and form a proper basis for thepreparation of the financial statements and that assets are properly accounted for andsafeguarded, and that the preparation and presentation of other financial information areconsistent with the financial statements.
The Board of Directors carries out its responsibility for the financial statementsprincipally through its Audit Committee, consisting solely of outside directors. The AuditCommittee reviews the Company’s annual and interim consolidated financialstatements, and annual reports and recommends them to the Board of Directors forapproval. The Audit Committee meets with the Company’s management, internalauditors and external auditors to discuss internal controls over the financial reportingprocess, auditing matters and financial reporting issues and formulates the appropriaterecommendations to the Board of Directors. The auditors appointed by the shareholdershave full access to the Audit Committee, with and without management being present.
These financial statements have been examined by the auditors appointed by theshareholders, KPMG LLP, chartered accountants, and their report is presented hereafter.
MANAGEMENT’SREPORT
Paul Buron
Senior Vice-President andChief Financial Officer
Jean Neveu
Chairman of the Board
Montréal, CanadaFebruary 3, 2005
36 - 37 36 - 37
AUDITORS’ REPORT TO THESHAREHOLDERS
We have audited the consolidated balance sheets of TVA Group Inc. as at December 31,2004 and 2003 and the consolidated statements of income, retained earnings and cashflows for the years then ended. These financial statements are the responsibility of theCompany’s management. Our responsibility is to express an opinion on these financialstatements based on our audits.
We conducted our audits in accordance with Canadian generally accepted auditingstandards. Those standards require that we plan and perform an audit to obtainreasonable assurance whether the financial statements are free of materialmisstatement. An audit includes examining, on a test basis, evidence supporting theamounts and disclosures in the financial statements. An audit also includes assessingthe accounting principles used and significant estimates made by management, as wellas evaluating the overall financial statement presentation.
In our opinion, these consolidated financial statements present fairly, in all materialrespects, the financial position of the Company as at December 31, 2004 and 2003 andthe results of its operations and its cash flows for the years then ended in accordancewith Canadian generally accepted accounting principles.
Chartered AccountantsMontreal, CanadaFebruary 3, 2005
38 - 39 38 - 39
Years ended December 31, 2004 and 2003(in thousands of dollars, except per share amounts)
ConsolidatedStatements of Income
December 31, 2004 and 2003(in thousands of dollars)
Consolidated Balance Sheets
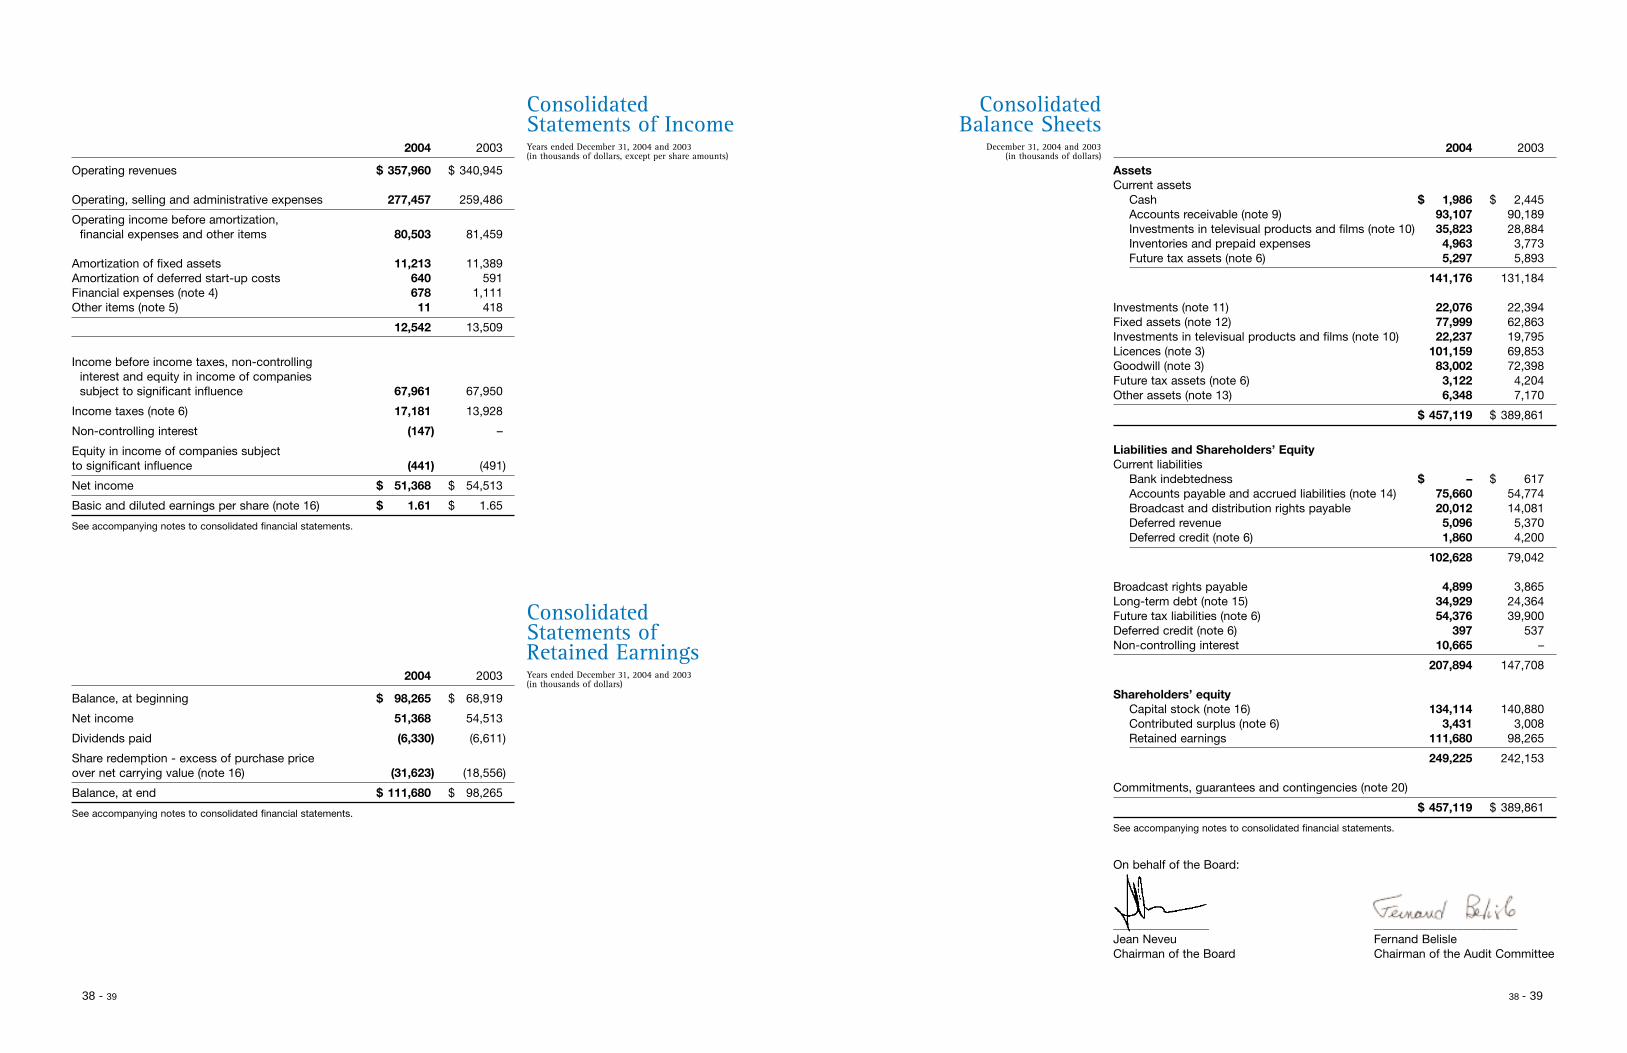
2004 2003
Operating revenues $ 357,960 $ 340,945
Operating, selling and administrative expenses 277,457 259,486
Operating income before amortization,financial expenses and other items 80,503 81,459
Amortization of fixed assets 11,213 11,389Amortization of deferred start-up costs 640 591Financial expenses (note 4) 678 1,111Other items (note 5) 11 418
12,542 13,509
Income before income taxes, non-controlling interest and equity in income of companies subject to significant influence 67,961 67,950
Income taxes (note 6) 17,181 13,928
Non-controlling interest (147) –
Equity in income of companies subject to significant influence (441) (491)
Net income $ 51,368 $ 54,513
Basic and diluted earnings per share (note 16) $ 1.61 $ 1.65
See accompanying notes to consolidated financial statements.
2004 2003
Balance, at beginning $ 98,265 $ 68,919
Net income 51,368 54,513
Dividends paid (6,330) (6,611)
Share redemption - excess of purchase price over net carrying value (note 16) (31,623) (18,556)
Balance, at end $ 111,680 $ 98,265
See accompanying notes to consolidated financial statements.
Years ended December 31, 2004 and 2003(in thousands of dollars)
ConsolidatedStatements ofRetained Earnings
2004 2003
AssetsCurrent assets
Cash $ 1,986 $ 2,445Accounts receivable (note 9) 93,107 90,189Investments in televisual products and films (note 10) 35,823 28,884Inventories and prepaid expenses 4,963 3,773Future tax assets (note 6) 5,297 5,893
141,176 131,184
Investments (note 11) 22,076 22,394Fixed assets (note 12) 77,999 62,863Investments in televisual products and films (note 10) 22,237 19,795Licences (note 3) 101,159 69,853Goodwill (note 3) 83,002 72,398Future tax assets (note 6) 3,122 4,204Other assets (note 13) 6,348 7,170
$ 457,119 $ 389,861
Liabilities and Shareholders’ EquityCurrent liabilities
Bank indebtedness $ – $ 617Accounts payable and accrued liabilities (note 14) 75,660 54,774Broadcast and distribution rights payable 20,012 14,081Deferred revenue 5,096 5,370Deferred credit (note 6) 1,860 4,200
102,628 79,042
Broadcast rights payable 4,899 3,865Long-term debt (note 15) 34,929 24,364Future tax liabilities (note 6) 54,376 39,900Deferred credit (note 6) 397 537Non-controlling interest 10,665 –
207,894 147,708
Shareholders’ equityCapital stock (note 16) 134,114 140,880Contributed surplus (note 6) 3,431 3,008Retained earnings 111,680 98,265
249,225 242,153
Commitments, guarantees and contingencies (note 20)
$ 457,119 $ 389,861
See accompanying notes to consolidated financial statements.
On behalf of the Board:
________________ ________________________Jean Neveu Fernand BelisleChairman of the Board Chairman of the Audit Committee
40 - 41
Years ended December 31, 2004 and 2003(in thousands of dollars.)
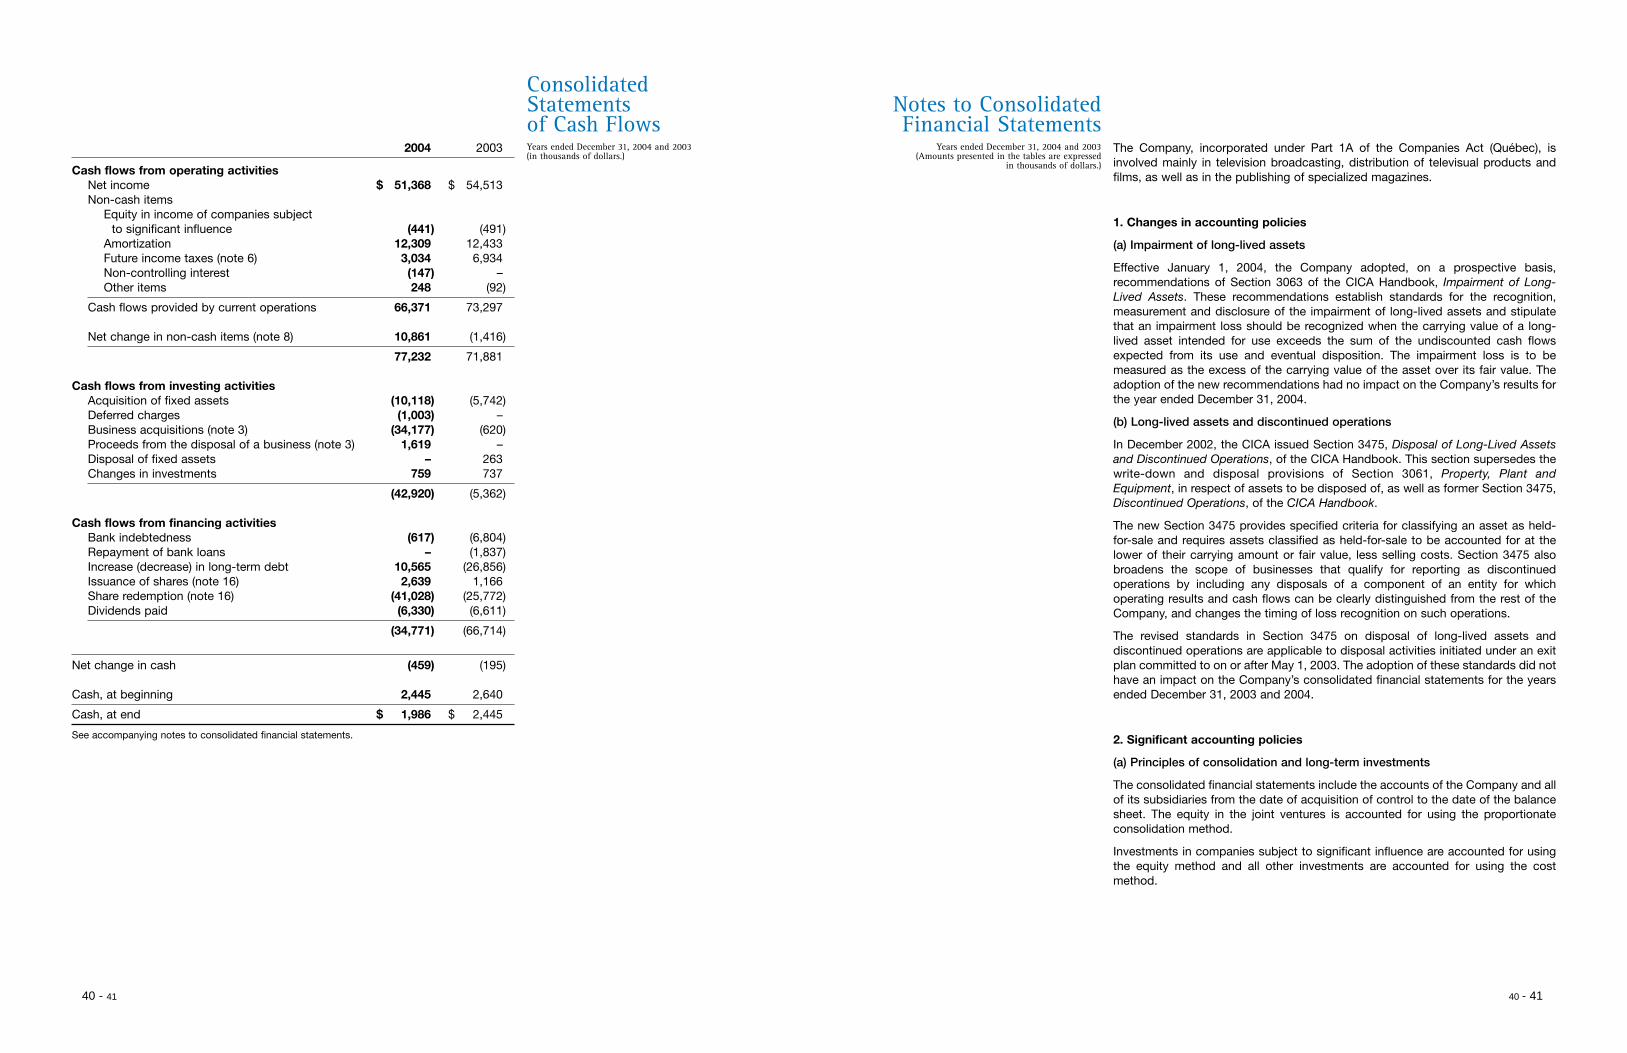
ConsolidatedStatements of Cash Flows
Years ended December 31, 2004 and 2003(Amounts presented in the tables are expressed
in thousands of dollars.)
Notes to ConsolidatedFinancial Statements
The Company, incorporated under Part 1A of the Companies Act (Québec), isinvolved mainly in television broadcasting, distribution of televisual products andfilms, as well as in the publishing of specialized magazines.
1. Changes in accounting policies
(a) Impairment of long-lived assets
Effective January 1, 2004, the Company adopted, on a prospective basis,recommendations of Section 3063 of the CICA Handbook, Impairment of Long-Lived Assets. These recommendations establish standards for the recognition,measurement and disclosure of the impairment of long-lived assets and stipulatethat an impairment loss should be recognized when the carrying value of a long-lived asset intended for use exceeds the sum of the undiscounted cash flowsexpected from its use and eventual disposition. The impairment loss is to bemeasured as the excess of the carrying value of the asset over its fair value. Theadoption of the new recommendations had no impact on the Company’s results forthe year ended December 31, 2004.
(b) Long-lived assets and discontinued operations
In December 2002, the CICA issued Section 3475, Disposal of Long-Lived Assetsand Discontinued Operations, of the CICA Handbook. This section supersedes thewrite-down and disposal provisions of Section 3061, Property, Plant andEquipment, in respect of assets to be disposed of, as well as former Section 3475,Discontinued Operations, of the CICA Handbook.
The new Section 3475 provides specified criteria for classifying an asset as held-for-sale and requires assets classified as held-for-sale to be accounted for at thelower of their carrying amount or fair value, less selling costs. Section 3475 alsobroadens the scope of businesses that qualify for reporting as discontinuedoperations by including any disposals of a component of an entity for whichoperating results and cash flows can be clearly distinguished from the rest of theCompany, and changes the timing of loss recognition on such operations.
The revised standards in Section 3475 on disposal of long-lived assets anddiscontinued operations are applicable to disposal activities initiated under an exitplan committed to on or after May 1, 2003. The adoption of these standards did nothave an impact on the Company’s consolidated financial statements for the yearsended December 31, 2003 and 2004.
2. Significant accounting policies
(a) Principles of consolidation and long-term investments
The consolidated financial statements include the accounts of the Company and allof its subsidiaries from the date of acquisition of control to the date of the balancesheet. The equity in the joint ventures is accounted for using the proportionateconsolidation method.
Investments in companies subject to significant influence are accounted for usingthe equity method and all other investments are accounted for using the costmethod.
40 - 41
2004 2003
Cash flows from operating activitiesNet income $ 51,368 $ 54,513Non-cash items
Equity in income of companies subject to significant influence (441) (491)
Amortization 12,309 12,433Future income taxes (note 6) 3,034 6,934Non-controlling interest (147) –Other items 248 (92)
Cash flows provided by current operations 66,371 73,297
Net change in non-cash items (note 8) 10,861 (1,416)
77,232 71,881
Cash flows from investing activitiesAcquisition of fixed assets (10,118) (5,742)Deferred charges (1,003) –Business acquisitions (note 3) (34,177) (620)Proceeds from the disposal of a business (note 3) 1,619 –Disposal of fixed assets – 263Changes in investments 759 737
(42,920) (5,362)
Cash flows from financing activitiesBank indebtedness (617) (6,804)Repayment of bank loans – (1,837)Increase (decrease) in long-term debt 10,565 (26,856)Issuance of shares (note 16) 2,639 1,166Share redemption (note 16) (41,028) (25,772)Dividends paid (6,330) (6,611)
(34,771) (66,714)
Net change in cash (459) (195)
Cash, at beginning 2,445 2,640
Cash, at end $ 1,986 $ 2,445
See accompanying notes to consolidated financial statements.
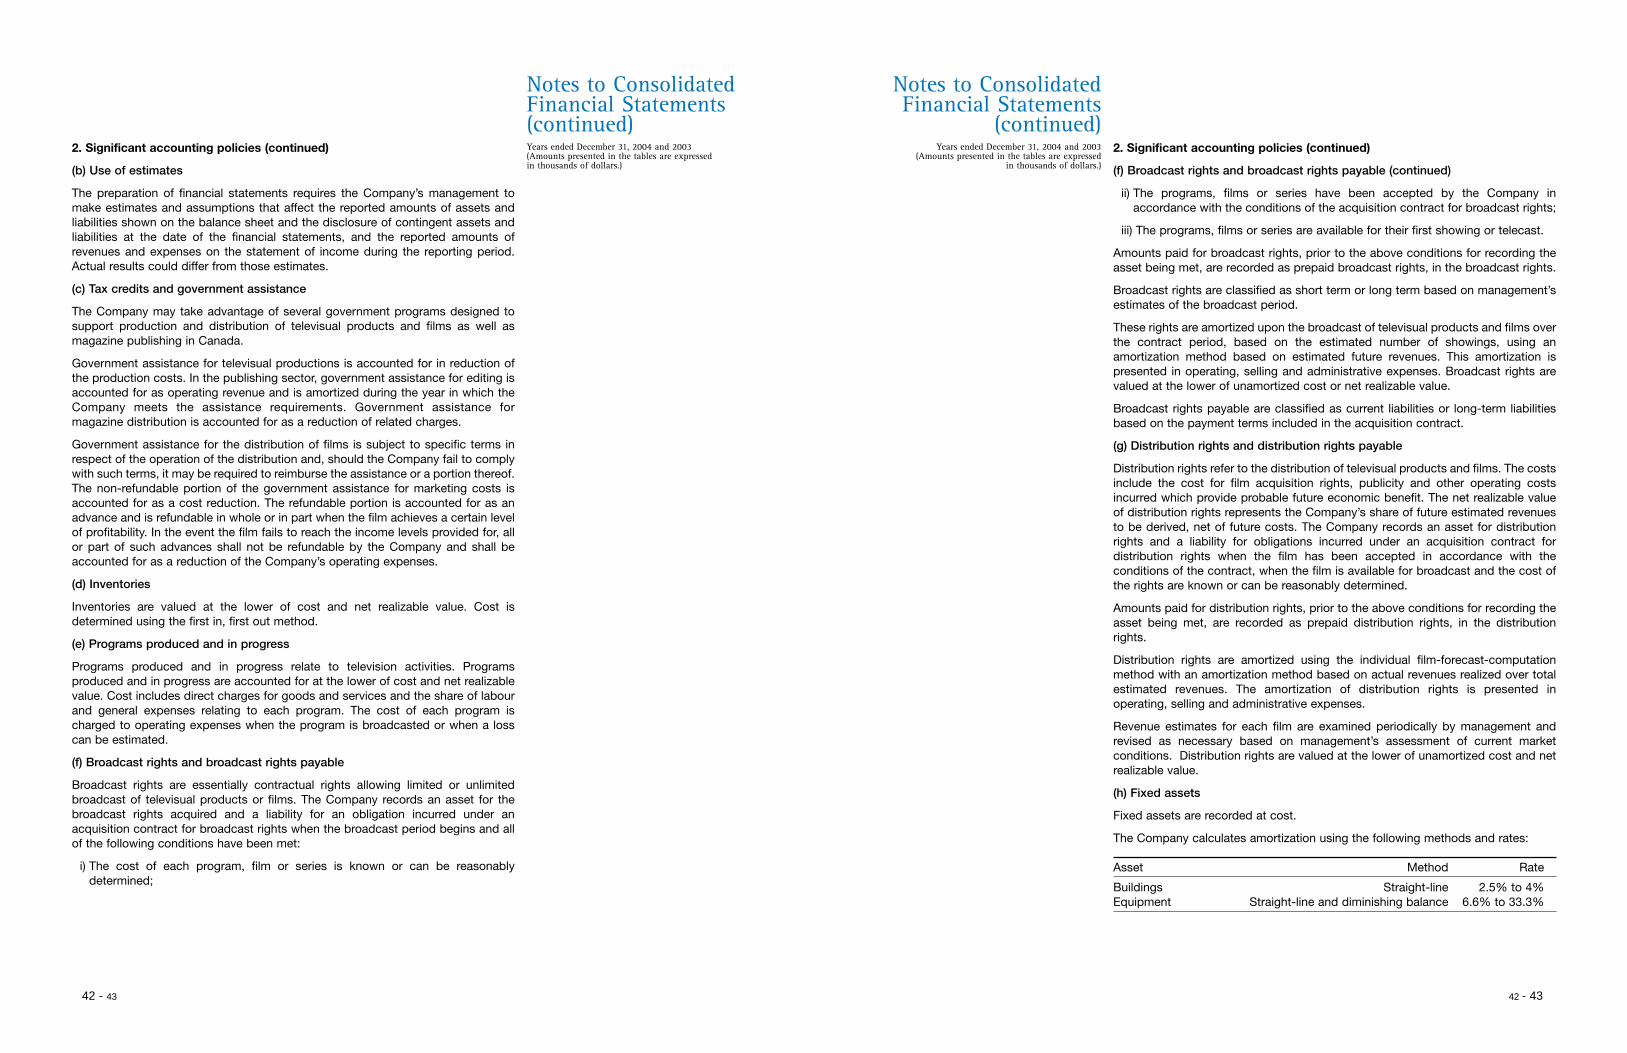
Years ended December 31, 2004 and 2003(Amounts presented in the tables are expressed in thousands of dollars.)
Notes to ConsolidatedFinancial Statements(continued)
Years ended December 31, 2004 and 2003(Amounts presented in the tables are expressed
in thousands of dollars.)
Notes to ConsolidatedFinancial Statements
(continued)2. Significant accounting policies (continued)
(b) Use of estimates
The preparation of financial statements requires the Company’s management tomake estimates and assumptions that affect the reported amounts of assets andliabilities shown on the balance sheet and the disclosure of contingent assets andliabilities at the date of the financial statements, and the reported amounts ofrevenues and expenses on the statement of income during the reporting period.Actual results could differ from those estimates.
(c) Tax credits and government assistance
The Company may take advantage of several government programs designed tosupport production and distribution of televisual products and films as well asmagazine publishing in Canada.
Government assistance for televisual productions is accounted for in reduction ofthe production costs. In the publishing sector, government assistance for editing isaccounted for as operating revenue and is amortized during the year in which theCompany meets the assistance requirements. Government assistance formagazine distribution is accounted for as a reduction of related charges.
Government assistance for the distribution of films is subject to specific terms inrespect of the operation of the distribution and, should the Company fail to complywith such terms, it may be required to reimburse the assistance or a portion thereof.The non-refundable portion of the government assistance for marketing costs isaccounted for as a cost reduction. The refundable portion is accounted for as anadvance and is refundable in whole or in part when the film achieves a certain levelof profitability. In the event the film fails to reach the income levels provided for, allor part of such advances shall not be refundable by the Company and shall beaccounted for as a reduction of the Company’s operating expenses.
(d) Inventories
Inventories are valued at the lower of cost and net realizable value. Cost isdetermined using the first in, first out method.
(e) Programs produced and in progress
Programs produced and in progress relate to television activities. Programsproduced and in progress are accounted for at the lower of cost and net realizablevalue. Cost includes direct charges for goods and services and the share of labourand general expenses relating to each program. The cost of each program ischarged to operating expenses when the program is broadcasted or when a losscan be estimated.
(f) Broadcast rights and broadcast rights payable
Broadcast rights are essentially contractual rights allowing limited or unlimitedbroadcast of televisual products or films. The Company records an asset for thebroadcast rights acquired and a liability for an obligation incurred under anacquisition contract for broadcast rights when the broadcast period begins and allof the following conditions have been met:
i) The cost of each program, film or series is known or can be reasonablydetermined;
2. Significant accounting policies (continued)
(f) Broadcast rights and broadcast rights payable (continued)
ii) The programs, films or series have been accepted by the Company inaccordance with the conditions of the acquisition contract for broadcast rights;
iii) The programs, films or series are available for their first showing or telecast.
Amounts paid for broadcast rights, prior to the above conditions for recording theasset being met, are recorded as prepaid broadcast rights, in the broadcast rights.
Broadcast rights are classified as short term or long term based on management’sestimates of the broadcast period.
These rights are amortized upon the broadcast of televisual products and films overthe contract period, based on the estimated number of showings, using anamortization method based on estimated future revenues. This amortization ispresented in operating, selling and administrative expenses. Broadcast rights arevalued at the lower of unamortized cost or net realizable value.
Broadcast rights payable are classified as current liabilities or long-term liabilitiesbased on the payment terms included in the acquisition contract.
(g) Distribution rights and distribution rights payable
Distribution rights refer to the distribution of televisual products and films. The costsinclude the cost for film acquisition rights, publicity and other operating costsincurred which provide probable future economic benefit. The net realizable valueof distribution rights represents the Company’s share of future estimated revenuesto be derived, net of future costs. The Company records an asset for distributionrights and a liability for obligations incurred under an acquisition contract fordistribution rights when the film has been accepted in accordance with theconditions of the contract, when the film is available for broadcast and the cost ofthe rights are known or can be reasonably determined.
Amounts paid for distribution rights, prior to the above conditions for recording theasset being met, are recorded as prepaid distribution rights, in the distributionrights.
Distribution rights are amortized using the individual film-forecast-computationmethod with an amortization method based on actual revenues realized over totalestimated revenues. The amortization of distribution rights is presented inoperating, selling and administrative expenses.
Revenue estimates for each film are examined periodically by management andrevised as necessary based on management’s assessment of current marketconditions. Distribution rights are valued at the lower of unamortized cost and netrealizable value.
(h) Fixed assets
Fixed assets are recorded at cost.
The Company calculates amortization using the following methods and rates:
Asset Method Rate
Buildings Straight-line 2.5% to 4%Equipment Straight-line and diminishing balance 6.6% to 33.3%
42 - 43 42 - 43
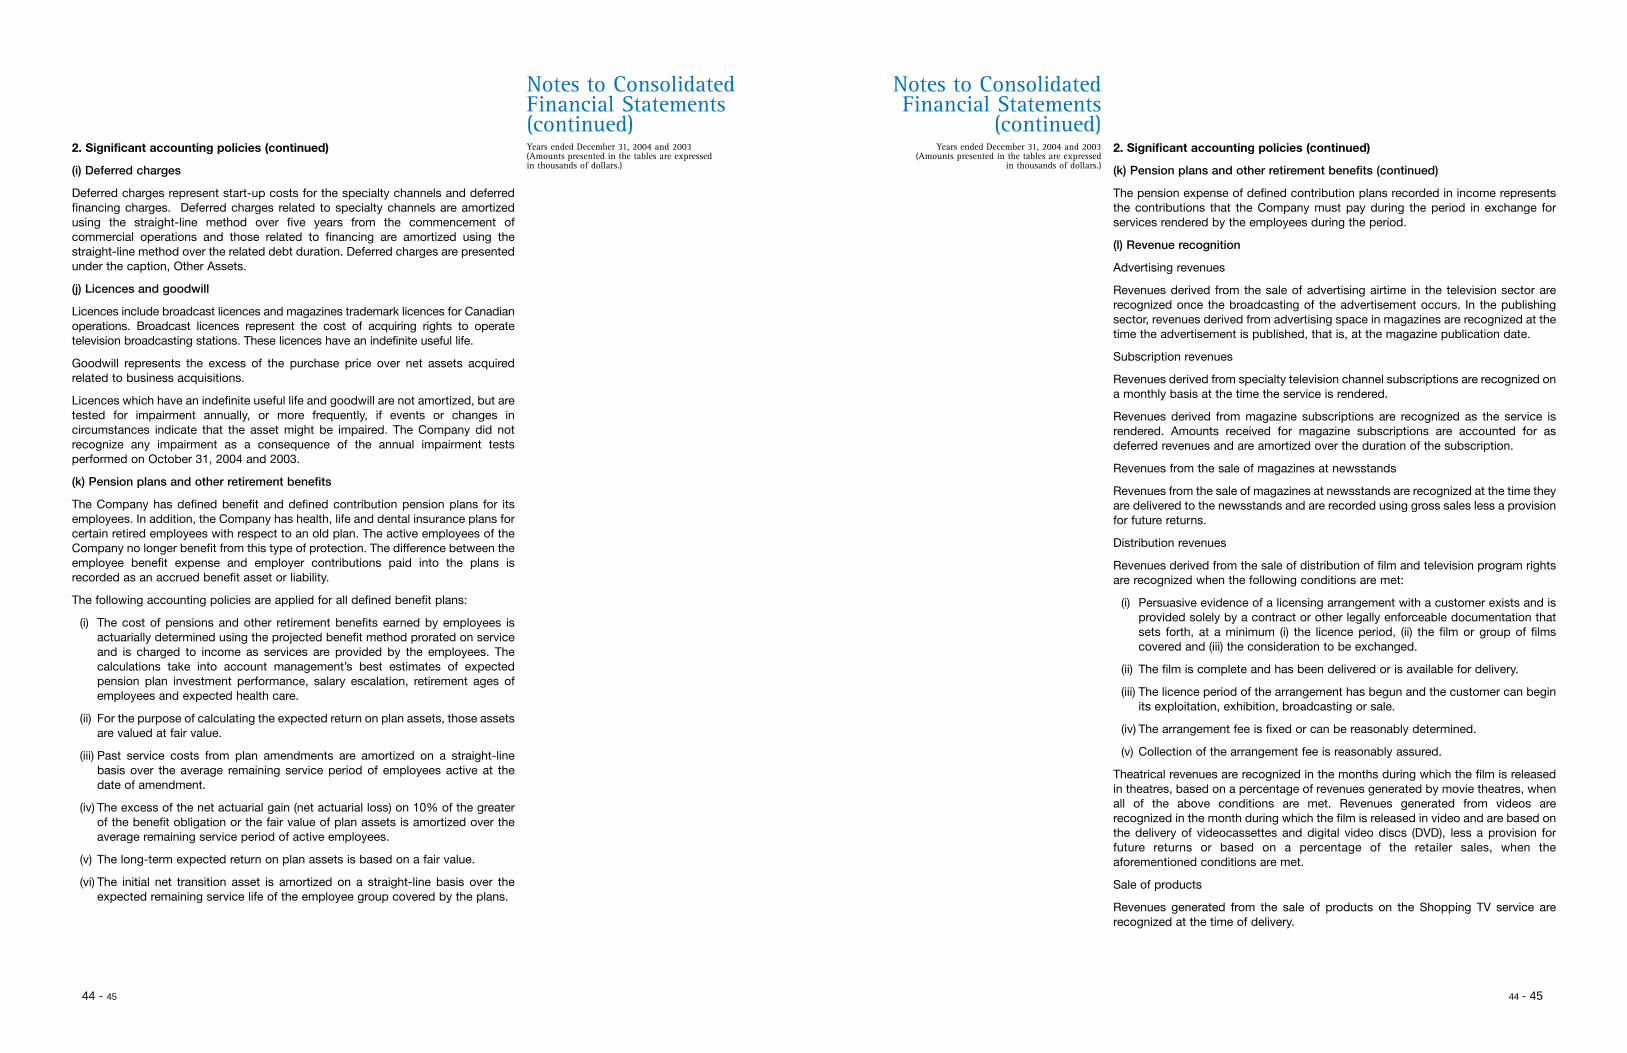
Years ended December 31, 2004 and 2003(Amounts presented in the tables are expressed in thousands of dollars.)
Notes to ConsolidatedFinancial Statements(continued)
Years ended December 31, 2004 and 2003(Amounts presented in the tables are expressed
in thousands of dollars.)
Notes to ConsolidatedFinancial Statements
(continued)2. Significant accounting policies (continued)
(i) Deferred charges
Deferred charges represent start-up costs for the specialty channels and deferredfinancing charges. Deferred charges related to specialty channels are amortizedusing the straight-line method over five years from the commencement ofcommercial operations and those related to financing are amortized using thestraight-line method over the related debt duration. Deferred charges are presentedunder the caption, Other Assets.
(j) Licences and goodwill
Licences include broadcast licences and magazines trademark licences for Canadianoperations. Broadcast licences represent the cost of acquiring rights to operatetelevision broadcasting stations. These licences have an indefinite useful life.
Goodwill represents the excess of the purchase price over net assets acquiredrelated to business acquisitions.
Licences which have an indefinite useful life and goodwill are not amortized, but aretested for impairment annually, or more frequently, if events or changes incircumstances indicate that the asset might be impaired. The Company did notrecognize any impairment as a consequence of the annual impairment testsperformed on October 31, 2004 and 2003.
(k) Pension plans and other retirement benefits
The Company has defined benefit and defined contribution pension plans for itsemployees. In addition, the Company has health, life and dental insurance plans forcertain retired employees with respect to an old plan. The active employees of theCompany no longer benefit from this type of protection. The difference between theemployee benefit expense and employer contributions paid into the plans isrecorded as an accrued benefit asset or liability.
The following accounting policies are applied for all defined benefit plans:
(i) The cost of pensions and other retirement benefits earned by employees isactuarially determined using the projected benefit method prorated on serviceand is charged to income as services are provided by the employees. Thecalculations take into account management’s best estimates of expectedpension plan investment performance, salary escalation, retirement ages ofemployees and expected health care.
(ii) For the purpose of calculating the expected return on plan assets, those assetsare valued at fair value.
(iii) Past service costs from plan amendments are amortized on a straight-linebasis over the average remaining service period of employees active at thedate of amendment.
(iv) The excess of the net actuarial gain (net actuarial loss) on 10% of the greaterof the benefit obligation or the fair value of plan assets is amortized over theaverage remaining service period of active employees.
(v) The long-term expected return on plan assets is based on a fair value.
(vi) The initial net transition asset is amortized on a straight-line basis over theexpected remaining service life of the employee group covered by the plans.
2. Significant accounting policies (continued)
(k) Pension plans and other retirement benefits (continued)
The pension expense of defined contribution plans recorded in income representsthe contributions that the Company must pay during the period in exchange forservices rendered by the employees during the period.
(l) Revenue recognition
Advertising revenues
Revenues derived from the sale of advertising airtime in the television sector arerecognized once the broadcasting of the advertisement occurs. In the publishingsector, revenues derived from advertising space in magazines are recognized at thetime the advertisement is published, that is, at the magazine publication date.
Subscription revenues
Revenues derived from specialty television channel subscriptions are recognized ona monthly basis at the time the service is rendered.
Revenues derived from magazine subscriptions are recognized as the service isrendered. Amounts received for magazine subscriptions are accounted for asdeferred revenues and are amortized over the duration of the subscription.
Revenues from the sale of magazines at newsstands
Revenues from the sale of magazines at newsstands are recognized at the time theyare delivered to the newsstands and are recorded using gross sales less a provisionfor future returns.
Distribution revenues
Revenues derived from the sale of distribution of film and television program rightsare recognized when the following conditions are met:
(i) Persuasive evidence of a licensing arrangement with a customer exists and isprovided solely by a contract or other legally enforceable documentation thatsets forth, at a minimum (i) the licence period, (ii) the film or group of filmscovered and (iii) the consideration to be exchanged.
(ii) The film is complete and has been delivered or is available for delivery.
(iii) The licence period of the arrangement has begun and the customer can beginits exploitation, exhibition, broadcasting or sale.
(iv) The arrangement fee is fixed or can be reasonably determined.
(v) Collection of the arrangement fee is reasonably assured.
Theatrical revenues are recognized in the months during which the film is releasedin theatres, based on a percentage of revenues generated by movie theatres, whenall of the above conditions are met. Revenues generated from videos arerecognized in the month during which the film is released in video and are based onthe delivery of videocassettes and digital video discs (DVD), less a provision forfuture returns or based on a percentage of the retailer sales, when theaforementioned conditions are met.
Sale of products
Revenues generated from the sale of products on the Shopping TV service arerecognized at the time of delivery.
44 - 45 44 - 45
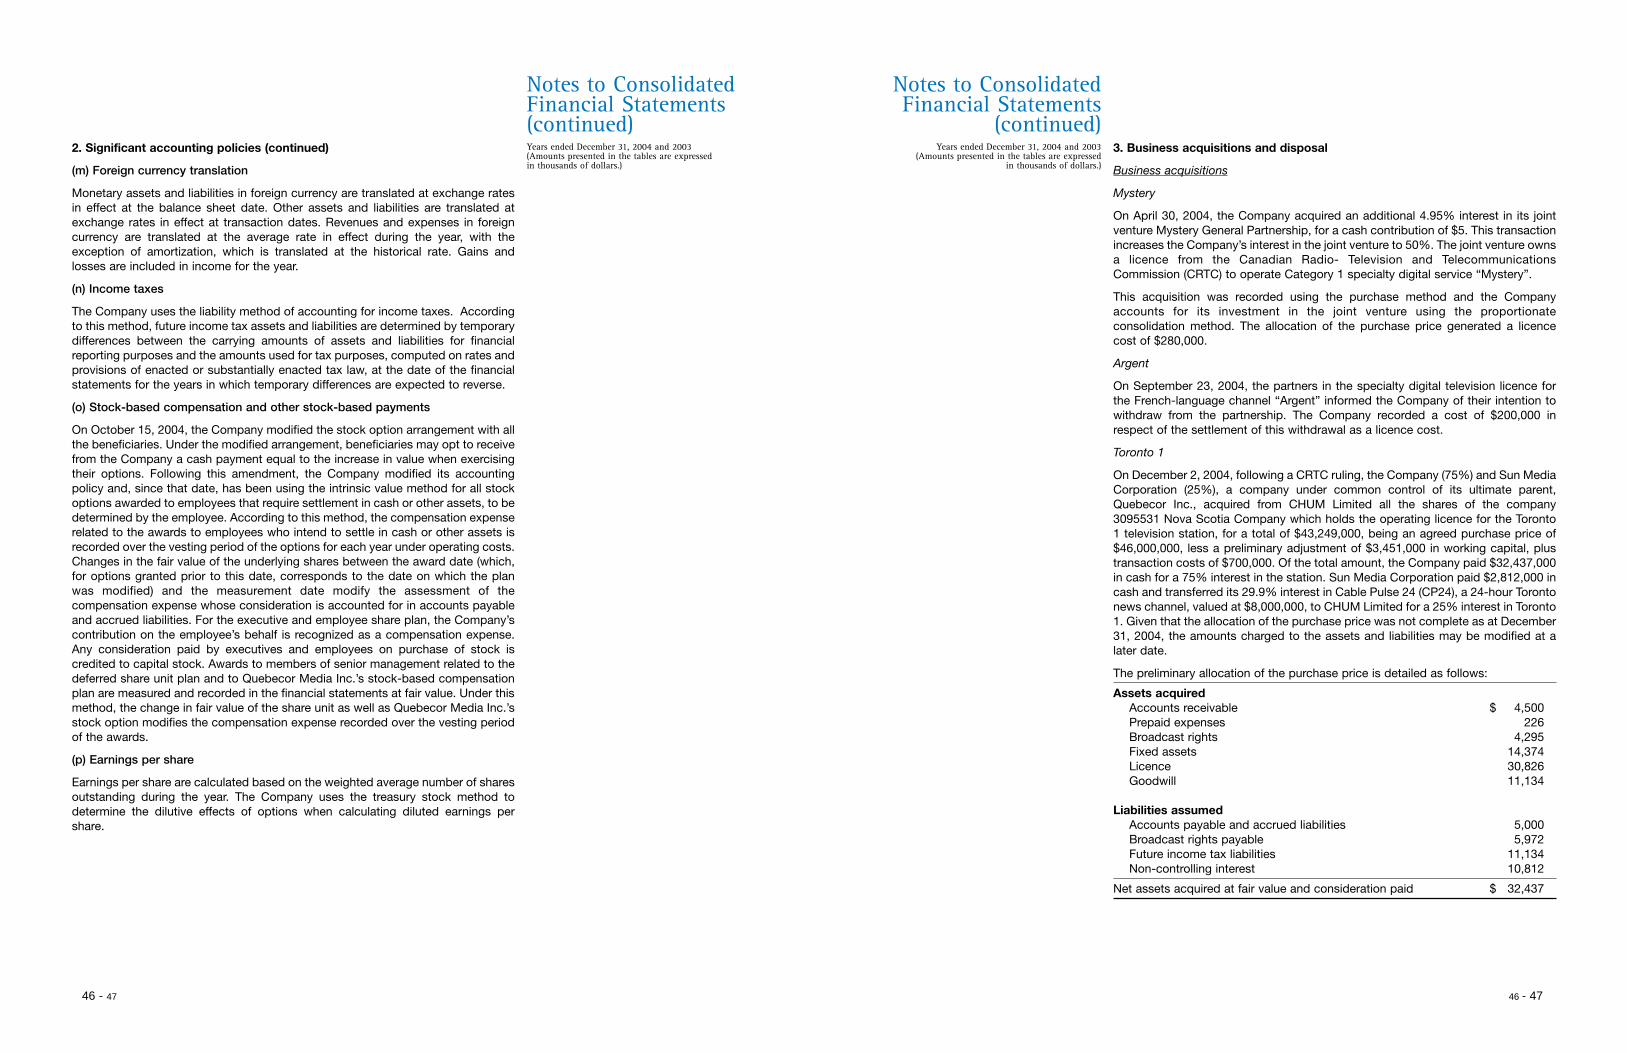
Years ended December 31, 2004 and 2003(Amounts presented in the tables are expressed in thousands of dollars.)
Notes to ConsolidatedFinancial Statements(continued)
Years ended December 31, 2004 and 2003(Amounts presented in the tables are expressed
in thousands of dollars.)
Notes to ConsolidatedFinancial Statements
(continued)2. Significant accounting policies (continued)
(m) Foreign currency translation
Monetary assets and liabilities in foreign currency are translated at exchange ratesin effect at the balance sheet date. Other assets and liabilities are translated atexchange rates in effect at transaction dates. Revenues and expenses in foreigncurrency are translated at the average rate in effect during the year, with theexception of amortization, which is translated at the historical rate. Gains andlosses are included in income for the year.
(n) Income taxes
The Company uses the liability method of accounting for income taxes. Accordingto this method, future income tax assets and liabilities are determined by temporarydifferences between the carrying amounts of assets and liabilities for financialreporting purposes and the amounts used for tax purposes, computed on rates andprovisions of enacted or substantially enacted tax law, at the date of the financialstatements for the years in which temporary differences are expected to reverse.
(o) Stock-based compensation and other stock-based payments
On October 15, 2004, the Company modified the stock option arrangement with allthe beneficiaries. Under the modified arrangement, beneficiaries may opt to receivefrom the Company a cash payment equal to the increase in value when exercisingtheir options. Following this amendment, the Company modified its accountingpolicy and, since that date, has been using the intrinsic value method for all stockoptions awarded to employees that require settlement in cash or other assets, to bedetermined by the employee. According to this method, the compensation expenserelated to the awards to employees who intend to settle in cash or other assets isrecorded over the vesting period of the options for each year under operating costs.Changes in the fair value of the underlying shares between the award date (which,for options granted prior to this date, corresponds to the date on which the planwas modified) and the measurement date modify the assessment of thecompensation expense whose consideration is accounted for in accounts payableand accrued liabilities. For the executive and employee share plan, the Company’scontribution on the employee’s behalf is recognized as a compensation expense.Any consideration paid by executives and employees on purchase of stock iscredited to capital stock. Awards to members of senior management related to thedeferred share unit plan and to Quebecor Media Inc.’s stock-based compensationplan are measured and recorded in the financial statements at fair value. Under thismethod, the change in fair value of the share unit as well as Quebecor Media Inc.’sstock option modifies the compensation expense recorded over the vesting periodof the awards.
(p) Earnings per share
Earnings per share are calculated based on the weighted average number of sharesoutstanding during the year. The Company uses the treasury stock method todetermine the dilutive effects of options when calculating diluted earnings pershare.
3. Business acquisitions and disposal
Business acquisitions
Mystery
On April 30, 2004, the Company acquired an additional 4.95% interest in its jointventure Mystery General Partnership, for a cash contribution of $5. This transactionincreases the Company’s interest in the joint venture to 50%. The joint venture ownsa licence from the Canadian Radio- Television and TelecommunicationsCommission (CRTC) to operate Category 1 specialty digital service “Mystery”.
This acquisition was recorded using the purchase method and the Companyaccounts for its investment in the joint venture using the proportionateconsolidation method. The allocation of the purchase price generated a licencecost of $280,000.
Argent
On September 23, 2004, the partners in the specialty digital television licence forthe French-language channel “Argent” informed the Company of their intention towithdraw from the partnership. The Company recorded a cost of $200,000 inrespect of the settlement of this withdrawal as a licence cost.
Toronto 1
On December 2, 2004, following a CRTC ruling, the Company (75%) and Sun MediaCorporation (25%), a company under common control of its ultimate parent,Quebecor Inc., acquired from CHUM Limited all the shares of the company3095531 Nova Scotia Company which holds the operating licence for the Toronto1 television station, for a total of $43,249,000, being an agreed purchase price of$46,000,000, less a preliminary adjustment of $3,451,000 in working capital, plustransaction costs of $700,000. Of the total amount, the Company paid $32,437,000in cash for a 75% interest in the station. Sun Media Corporation paid $2,812,000 incash and transferred its 29.9% interest in Cable Pulse 24 (CP24), a 24-hour Torontonews channel, valued at $8,000,000, to CHUM Limited for a 25% interest in Toronto1. Given that the allocation of the purchase price was not complete as at December31, 2004, the amounts charged to the assets and liabilities may be modified at alater date.
The preliminary allocation of the purchase price is detailed as follows:
Assets acquiredAccounts receivable $ 4,500Prepaid expenses 226Broadcast rights 4,295Fixed assets 14,374Licence 30,826Goodwill 11,134
Liabilities assumedAccounts payable and accrued liabilities 5,000Broadcast rights payable 5,972Future income tax liabilities 11,134Non-controlling interest 10,812
Net assets acquired at fair value and consideration paid $ 32,437
46 - 47 46 - 47
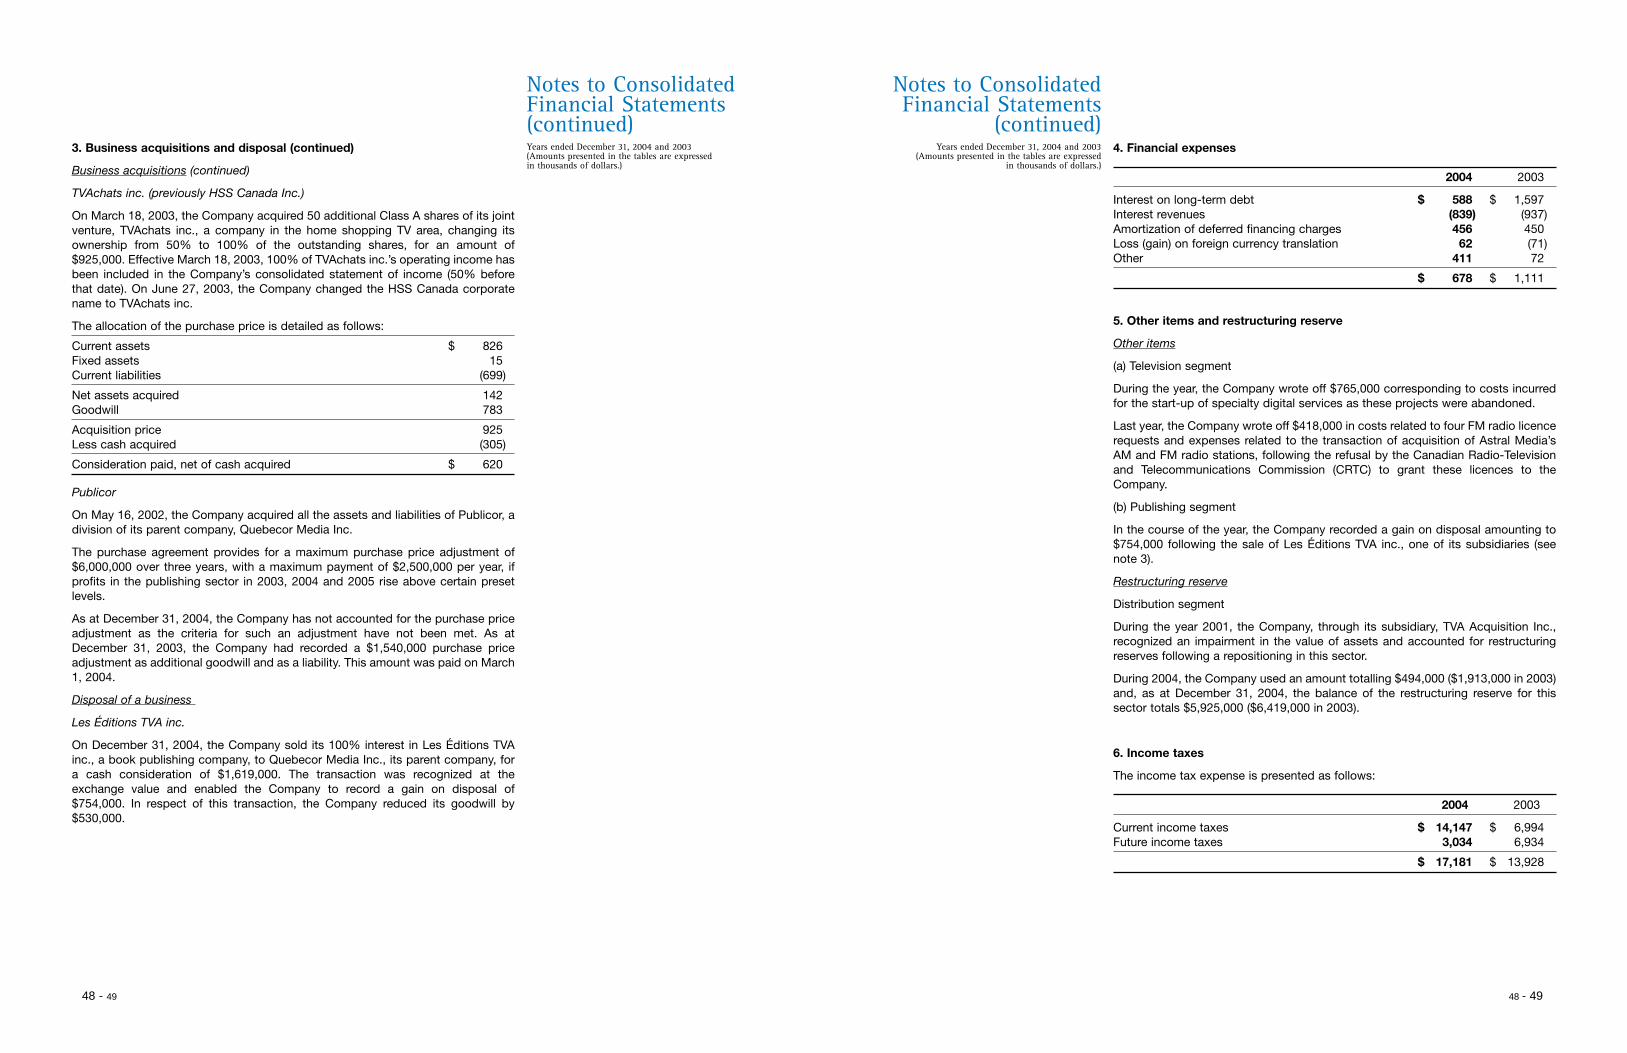
Years ended December 31, 2004 and 2003(Amounts presented in the tables are expressed in thousands of dollars.)
Notes to ConsolidatedFinancial Statements(continued)
Years ended December 31, 2004 and 2003(Amounts presented in the tables are expressed
in thousands of dollars.)
Notes to ConsolidatedFinancial Statements
(continued)3. Business acquisitions and disposal (continued)
Business acquisitions (continued)
TVAchats inc. (previously HSS Canada Inc.)
On March 18, 2003, the Company acquired 50 additional Class A shares of its jointventure, TVAchats inc., a company in the home shopping TV area, changing itsownership from 50% to 100% of the outstanding shares, for an amount of$925,000. Effective March 18, 2003, 100% of TVAchats inc.’s operating income hasbeen included in the Company’s consolidated statement of income (50% beforethat date). On June 27, 2003, the Company changed the HSS Canada corporatename to TVAchats inc.
The allocation of the purchase price is detailed as follows:
Current assets $ 826Fixed assets 15Current liabilities (699)
Net assets acquired 142Goodwill 783
Acquisition price 925Less cash acquired (305)
Consideration paid, net of cash acquired $ 620
Publicor
On May 16, 2002, the Company acquired all the assets and liabilities of Publicor, adivision of its parent company, Quebecor Media Inc.
The purchase agreement provides for a maximum purchase price adjustment of$6,000,000 over three years, with a maximum payment of $2,500,000 per year, ifprofits in the publishing sector in 2003, 2004 and 2005 rise above certain presetlevels.
As at December 31, 2004, the Company has not accounted for the purchase priceadjustment as the criteria for such an adjustment have not been met. As atDecember 31, 2003, the Company had recorded a $1,540,000 purchase priceadjustment as additional goodwill and as a liability. This amount was paid on March1, 2004.
Disposal of a business
Les Éditions TVA inc.
On December 31, 2004, the Company sold its 100% interest in Les Éditions TVAinc., a book publishing company, to Quebecor Media Inc., its parent company, fora cash consideration of $1,619,000. The transaction was recognized at theexchange value and enabled the Company to record a gain on disposal of$754,000. In respect of this transaction, the Company reduced its goodwill by$530,000.
4. Financial expenses
2004 2003
Interest on long-term debt $ 588 $ 1,597Interest revenues (839) (937)Amortization of deferred financing charges 456 450Loss (gain) on foreign currency translation 62 (71)Other 411 72
$ 678 $ 1,111
5. Other items and restructuring reserve
Other items
(a) Television segment
During the year, the Company wrote off $765,000 corresponding to costs incurredfor the start-up of specialty digital services as these projects were abandoned.
Last year, the Company wrote off $418,000 in costs related to four FM radio licencerequests and expenses related to the transaction of acquisition of Astral Media’sAM and FM radio stations, following the refusal by the Canadian Radio-Televisionand Telecommunications Commission (CRTC) to grant these licences to theCompany.
(b) Publishing segment
In the course of the year, the Company recorded a gain on disposal amounting to$754,000 following the sale of Les Éditions TVA inc., one of its subsidiaries (seenote 3).
Restructuring reserve
Distribution segment
During the year 2001, the Company, through its subsidiary, TVA Acquisition Inc.,recognized an impairment in the value of assets and accounted for restructuringreserves following a repositioning in this sector.
During 2004, the Company used an amount totalling $494,000 ($1,913,000 in 2003)and, as at December 31, 2004, the balance of the restructuring reserve for thissector totals $5,925,000 ($6,419,000 in 2003).
6. Income taxes
The income tax expense is presented as follows:
2004 2003
Current income taxes $ 14,147 $ 6,994Future income taxes 3,034 6,934
$ 17,181 $ 13,928
48 - 49 48 - 49
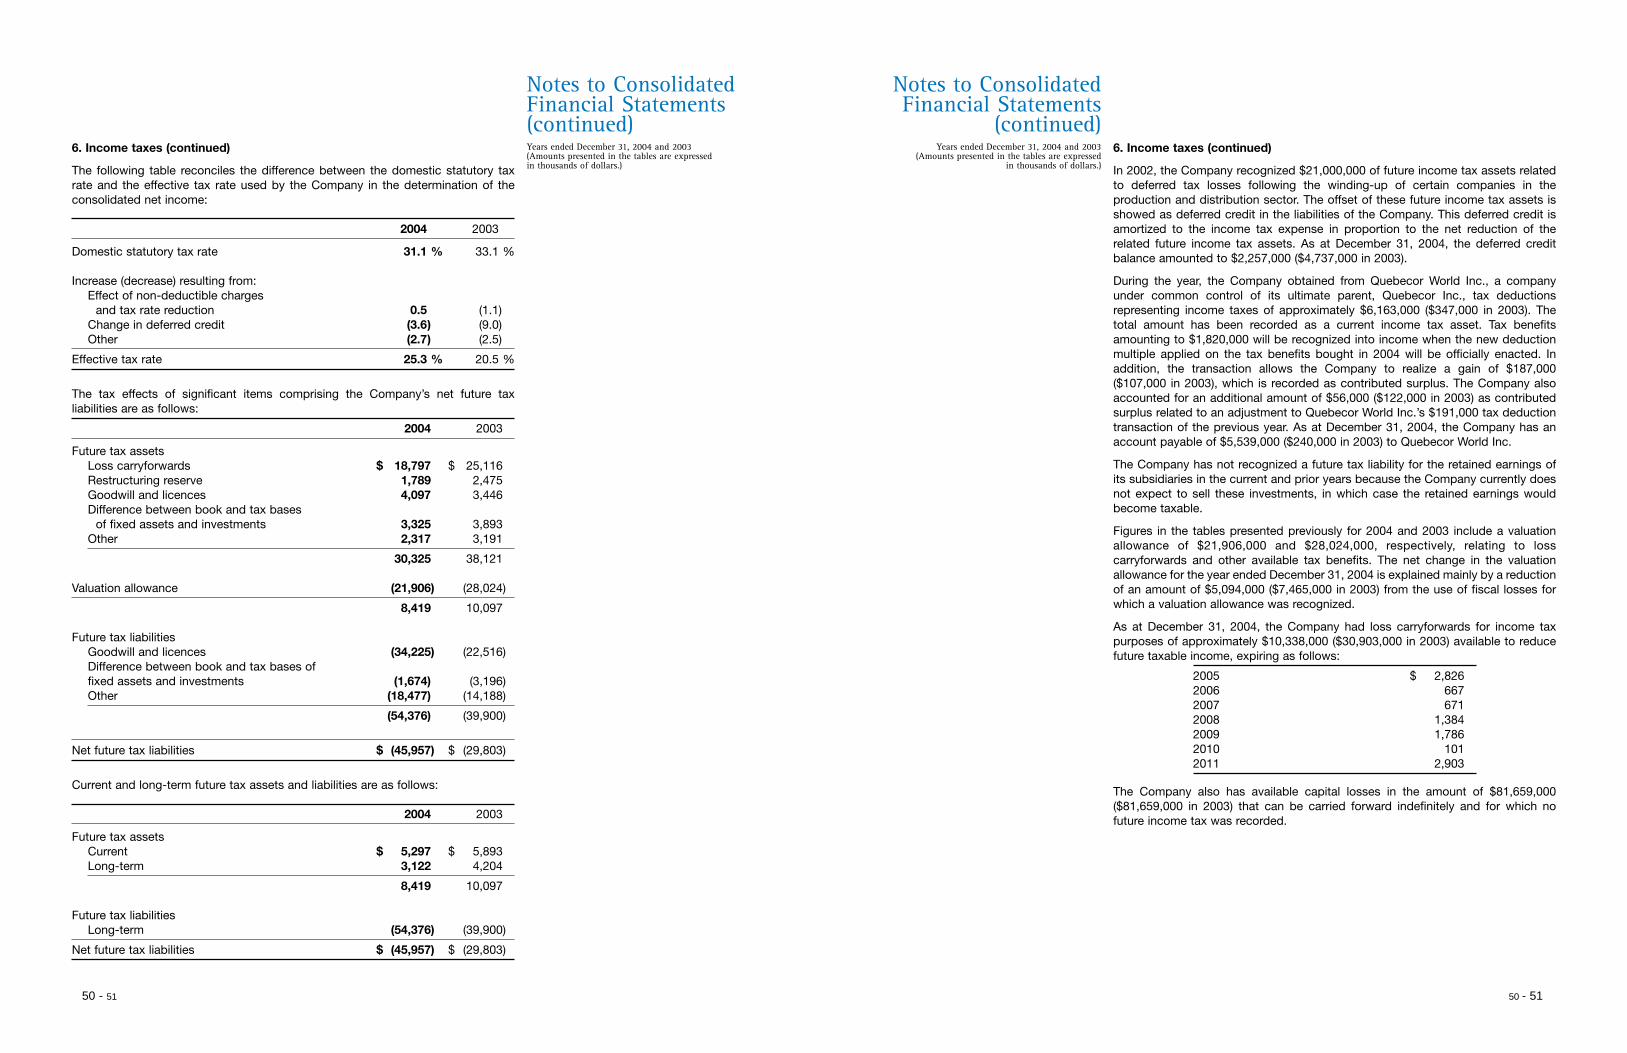
Years ended December 31, 2004 and 2003(Amounts presented in the tables are expressed in thousands of dollars.)
Notes to ConsolidatedFinancial Statements(continued)
Years ended December 31, 2004 and 2003(Amounts presented in the tables are expressed
in thousands of dollars.)
Notes to ConsolidatedFinancial Statements
(continued)6. Income taxes (continued)
The following table reconciles the difference between the domestic statutory taxrate and the effective tax rate used by the Company in the determination of theconsolidated net income:
2004 2003
Domestic statutory tax rate 31.1 % 33.1 %
Increase (decrease) resulting from:Effect of non-deductible charges
and tax rate reduction 0.5 (1.1)Change in deferred credit (3.6) (9.0)Other (2.7) (2.5)
Effective tax rate 25.3 % 20.5 %
The tax effects of significant items comprising the Company’s net future taxliabilities are as follows:
2004 2003
Future tax assetsLoss carryforwards $ 18,797 $ 25,116Restructuring reserve 1,789 2,475Goodwill and licences 4,097 3,446Difference between book and tax bases
of fixed assets and investments 3,325 3,893Other 2,317 3,191
30,325 38,121
Valuation allowance (21,906) (28,024)
8,419 10,097
Future tax liabilitiesGoodwill and licences (34,225) (22,516)Difference between book and tax bases of fixed assets and investments (1,674) (3,196)Other (18,477) (14,188)
(54,376) (39,900)
Net future tax liabilities $ (45,957) $ (29,803)
Current and long-term future tax assets and liabilities are as follows:
2004 2003
Future tax assetsCurrent $ 5,297 $ 5,893Long-term 3,122 4,204
8,419 10,097
Future tax liabilitiesLong-term (54,376) (39,900)
Net future tax liabilities $ (45,957) $ (29,803)
6. Income taxes (continued)
In 2002, the Company recognized $21,000,000 of future income tax assets relatedto deferred tax losses following the winding-up of certain companies in theproduction and distribution sector. The offset of these future income tax assets isshowed as deferred credit in the liabilities of the Company. This deferred credit isamortized to the income tax expense in proportion to the net reduction of therelated future income tax assets. As at December 31, 2004, the deferred creditbalance amounted to $2,257,000 ($4,737,000 in 2003).
During the year, the Company obtained from Quebecor World Inc., a companyunder common control of its ultimate parent, Quebecor Inc., tax deductionsrepresenting income taxes of approximately $6,163,000 ($347,000 in 2003). Thetotal amount has been recorded as a current income tax asset. Tax benefitsamounting to $1,820,000 will be recognized into income when the new deductionmultiple applied on the tax benefits bought in 2004 will be officially enacted. Inaddition, the transaction allows the Company to realize a gain of $187,000($107,000 in 2003), which is recorded as contributed surplus. The Company alsoaccounted for an additional amount of $56,000 ($122,000 in 2003) as contributedsurplus related to an adjustment to Quebecor World Inc.’s $191,000 tax deductiontransaction of the previous year. As at December 31, 2004, the Company has anaccount payable of $5,539,000 ($240,000 in 2003) to Quebecor World Inc.
The Company has not recognized a future tax liability for the retained earnings ofits subsidiaries in the current and prior years because the Company currently doesnot expect to sell these investments, in which case the retained earnings wouldbecome taxable.
Figures in the tables presented previously for 2004 and 2003 include a valuationallowance of $21,906,000 and $28,024,000, respectively, relating to losscarryforwards and other available tax benefits. The net change in the valuationallowance for the year ended December 31, 2004 is explained mainly by a reductionof an amount of $5,094,000 ($7,465,000 in 2003) from the use of fiscal losses forwhich a valuation allowance was recognized.
As at December 31, 2004, the Company had loss carryforwards for income taxpurposes of approximately $10,338,000 ($30,903,000 in 2003) available to reducefuture taxable income, expiring as follows:
2005 $ 2,8262006 6672007 6712008 1,3842009 1,7862010 1012011 2,903
The Company also has available capital losses in the amount of $81,659,000($81,659,000 in 2003) that can be carried forward indefinitely and for which nofuture income tax was recorded.
50 - 51 50 - 51
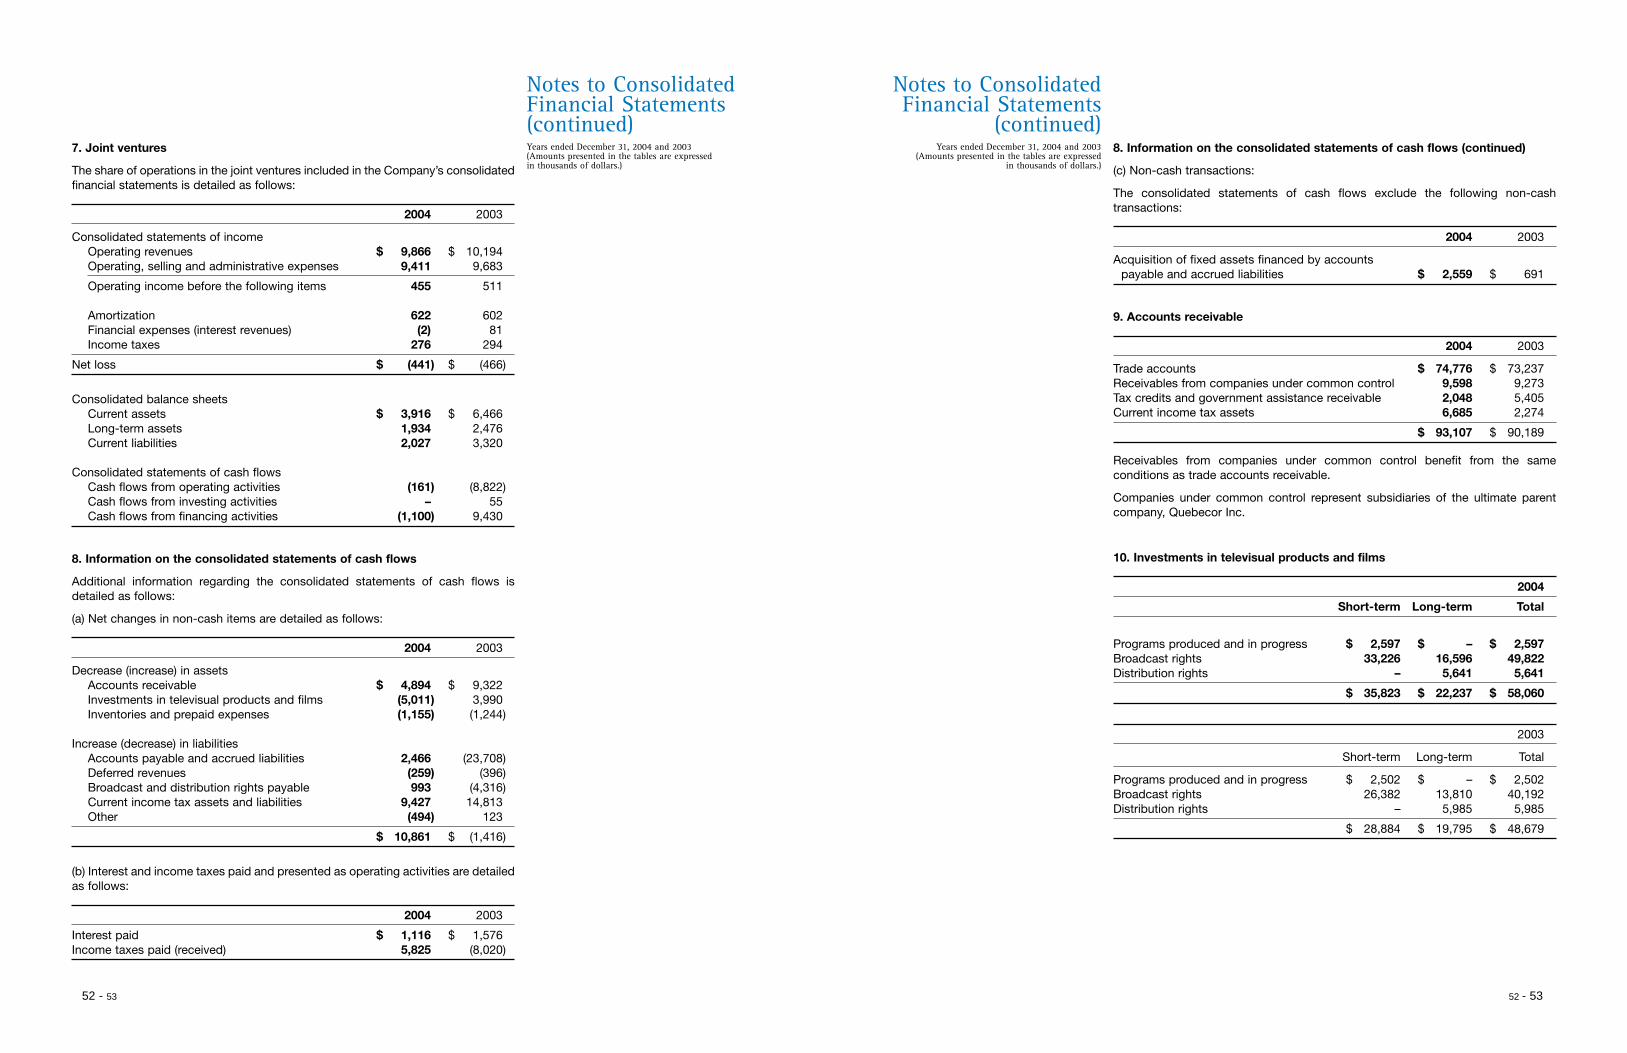
Years ended December 31, 2004 and 2003(Amounts presented in the tables are expressed in thousands of dollars.)
Notes to ConsolidatedFinancial Statements(continued)
Years ended December 31, 2004 and 2003(Amounts presented in the tables are expressed
in thousands of dollars.)
Notes to ConsolidatedFinancial Statements
(continued)7. Joint ventures
The share of operations in the joint ventures included in the Company’s consolidatedfinancial statements is detailed as follows:
2004 2003
Consolidated statements of incomeOperating revenues $ 9,866 $ 10,194Operating, selling and administrative expenses 9,411 9,683
Operating income before the following items 455 511
Amortization 622 602Financial expenses (interest revenues) (2) 81Income taxes 276 294
Net loss $ (441) $ (466)
Consolidated balance sheetsCurrent assets $ 3,916 $ 6,466Long-term assets 1,934 2,476Current liabilities 2,027 3,320
Consolidated statements of cash flowsCash flows from operating activities (161) (8,822)Cash flows from investing activities – 55Cash flows from financing activities (1,100) 9,430
8. Information on the consolidated statements of cash flows
Additional information regarding the consolidated statements of cash flows isdetailed as follows:
(a) Net changes in non-cash items are detailed as follows:
2004 2003
Decrease (increase) in assetsAccounts receivable $ 4,894 $ 9,322Investments in televisual products and films (5,011) 3,990Inventories and prepaid expenses (1,155) (1,244)
Increase (decrease) in liabilitiesAccounts payable and accrued liabilities 2,466 (23,708)Deferred revenues (259) (396)Broadcast and distribution rights payable 993 (4,316)Current income tax assets and liabilities 9,427 14,813Other (494) 123
$ 10,861 $ (1,416)
(b) Interest and income taxes paid and presented as operating activities are detailedas follows:
2004 2003
Interest paid $ 1,116 $ 1,576Income taxes paid (received) 5,825 (8,020)
8. Information on the consolidated statements of cash flows (continued)
(c) Non-cash transactions:
The consolidated statements of cash flows exclude the following non-cashtransactions:
2004 2003
Acquisition of fixed assets financed by accounts payable and accrued liabilities $ 2,559 $ 691
9. Accounts receivable
2004 2003
Trade accounts $ 74,776 $ 73,237Receivables from companies under common control 9,598 9,273Tax credits and government assistance receivable 2,048 5,405Current income tax assets 6,685 2,274
$ 93,107 $ 90,189
Receivables from companies under common control benefit from the sameconditions as trade accounts receivable.
Companies under common control represent subsidiaries of the ultimate parentcompany, Quebecor Inc.
10. Investments in televisual products and films
2004
Short-term Long-term Total
Programs produced and in progress $ 2,597 $ – $ 2,597Broadcast rights 33,226 16,596 49,822Distribution rights – 5,641 5,641
$ 35,823 $ 22,237 $ 58,060
2003
Short-term Long-term Total
Programs produced and in progress $ 2,502 $ – $ 2,502Broadcast rights 26,382 13,810 40,192Distribution rights – 5,985 5,985
$ 28,884 $ 19,795 $ 48,679
52 - 53 52 - 53
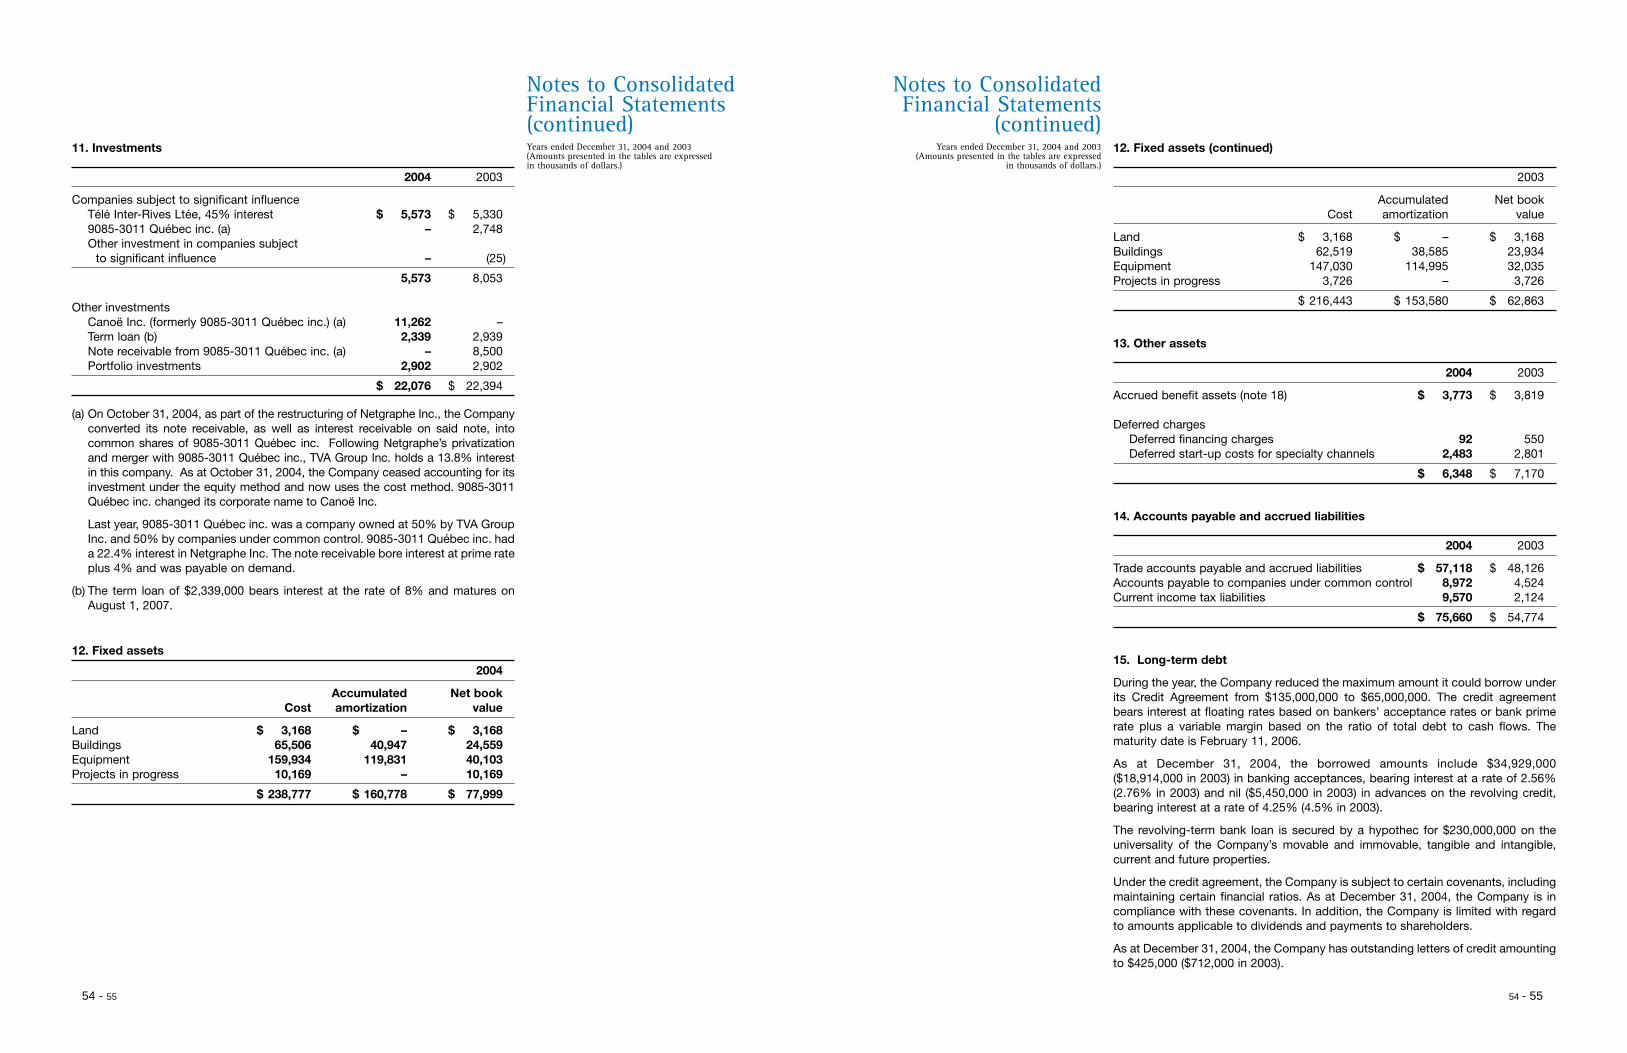
Years ended December 31, 2004 and 2003(Amounts presented in the tables are expressed in thousands of dollars.)
Notes to ConsolidatedFinancial Statements(continued)
Years ended December 31, 2004 and 2003(Amounts presented in the tables are expressed
in thousands of dollars.)
Notes to ConsolidatedFinancial Statements
(continued)11. Investments
2004 2003
Companies subject to significant influenceTélé Inter-Rives Ltée, 45% interest $ 5,573 $ 5,3309085-3011 Québec inc. (a) – 2,748Other investment in companies subject
to significant influence – (25)
5,573 8,053
Other investmentsCanoë Inc. (formerly 9085-3011 Québec inc.) (a) 11,262 –Term loan (b) 2,339 2,939Note receivable from 9085-3011 Québec inc. (a) – 8,500Portfolio investments 2,902 2,902
$ 22,076 $ 22,394
(a) On October 31, 2004, as part of the restructuring of Netgraphe Inc., the Companyconverted its note receivable, as well as interest receivable on said note, intocommon shares of 9085-3011 Québec inc. Following Netgraphe’s privatizationand merger with 9085-3011 Québec inc., TVA Group Inc. holds a 13.8% interestin this company. As at October 31, 2004, the Company ceased accounting for itsinvestment under the equity method and now uses the cost method. 9085-3011Québec inc. changed its corporate name to Canoë Inc.
Last year, 9085-3011 Québec inc. was a company owned at 50% by TVA GroupInc. and 50% by companies under common control. 9085-3011 Québec inc. hada 22.4% interest in Netgraphe Inc. The note receivable bore interest at prime rateplus 4% and was payable on demand.
(b) The term loan of $2,339,000 bears interest at the rate of 8% and matures onAugust 1, 2007.
12. Fixed assets
2004
Accumulated Net bookCost amortization value
Land $ 3,168 $ – $ 3,168Buildings 65,506 40,947 24,559Equipment 159,934 119,831 40,103Projects in progress 10,169 – 10,169
$ 238,777 $ 160,778 $ 77,999
12. Fixed assets (continued)
2003
Accumulated Net bookCost amortization value
Land $ 3,168 $ – $ 3,168Buildings 62,519 38,585 23,934Equipment 147,030 114,995 32,035Projects in progress 3,726 – 3,726
$ 216,443 $ 153,580 $ 62,863
13. Other assets
2004 2003
Accrued benefit assets (note 18) $ 3,773 $ 3,819
Deferred chargesDeferred financing charges 92 550Deferred start-up costs for specialty channels 2,483 2,801
$ 6,348 $ 7,170
14. Accounts payable and accrued liabilities
2004 2003
Trade accounts payable and accrued liabilities $ 57,118 $ 48,126Accounts payable to companies under common control 8,972 4,524Current income tax liabilities 9,570 2,124
$ 75,660 $ 54,774
15. Long-term debt
During the year, the Company reduced the maximum amount it could borrow underits Credit Agreement from $135,000,000 to $65,000,000. The credit agreementbears interest at floating rates based on bankers’ acceptance rates or bank primerate plus a variable margin based on the ratio of total debt to cash flows. Thematurity date is February 11, 2006.
As at December 31, 2004, the borrowed amounts include $34,929,000($18,914,000 in 2003) in banking acceptances, bearing interest at a rate of 2.56%(2.76% in 2003) and nil ($5,450,000 in 2003) in advances on the revolving credit,bearing interest at a rate of 4.25% (4.5% in 2003).
The revolving-term bank loan is secured by a hypothec for $230,000,000 on theuniversality of the Company’s movable and immovable, tangible and intangible,current and future properties.
Under the credit agreement, the Company is subject to certain covenants, includingmaintaining certain financial ratios. As at December 31, 2004, the Company is incompliance with these covenants. In addition, the Company is limited with regardto amounts applicable to dividends and payments to shareholders.
As at December 31, 2004, the Company has outstanding letters of credit amountingto $425,000 ($712,000 in 2003).
54 - 55 54 - 55
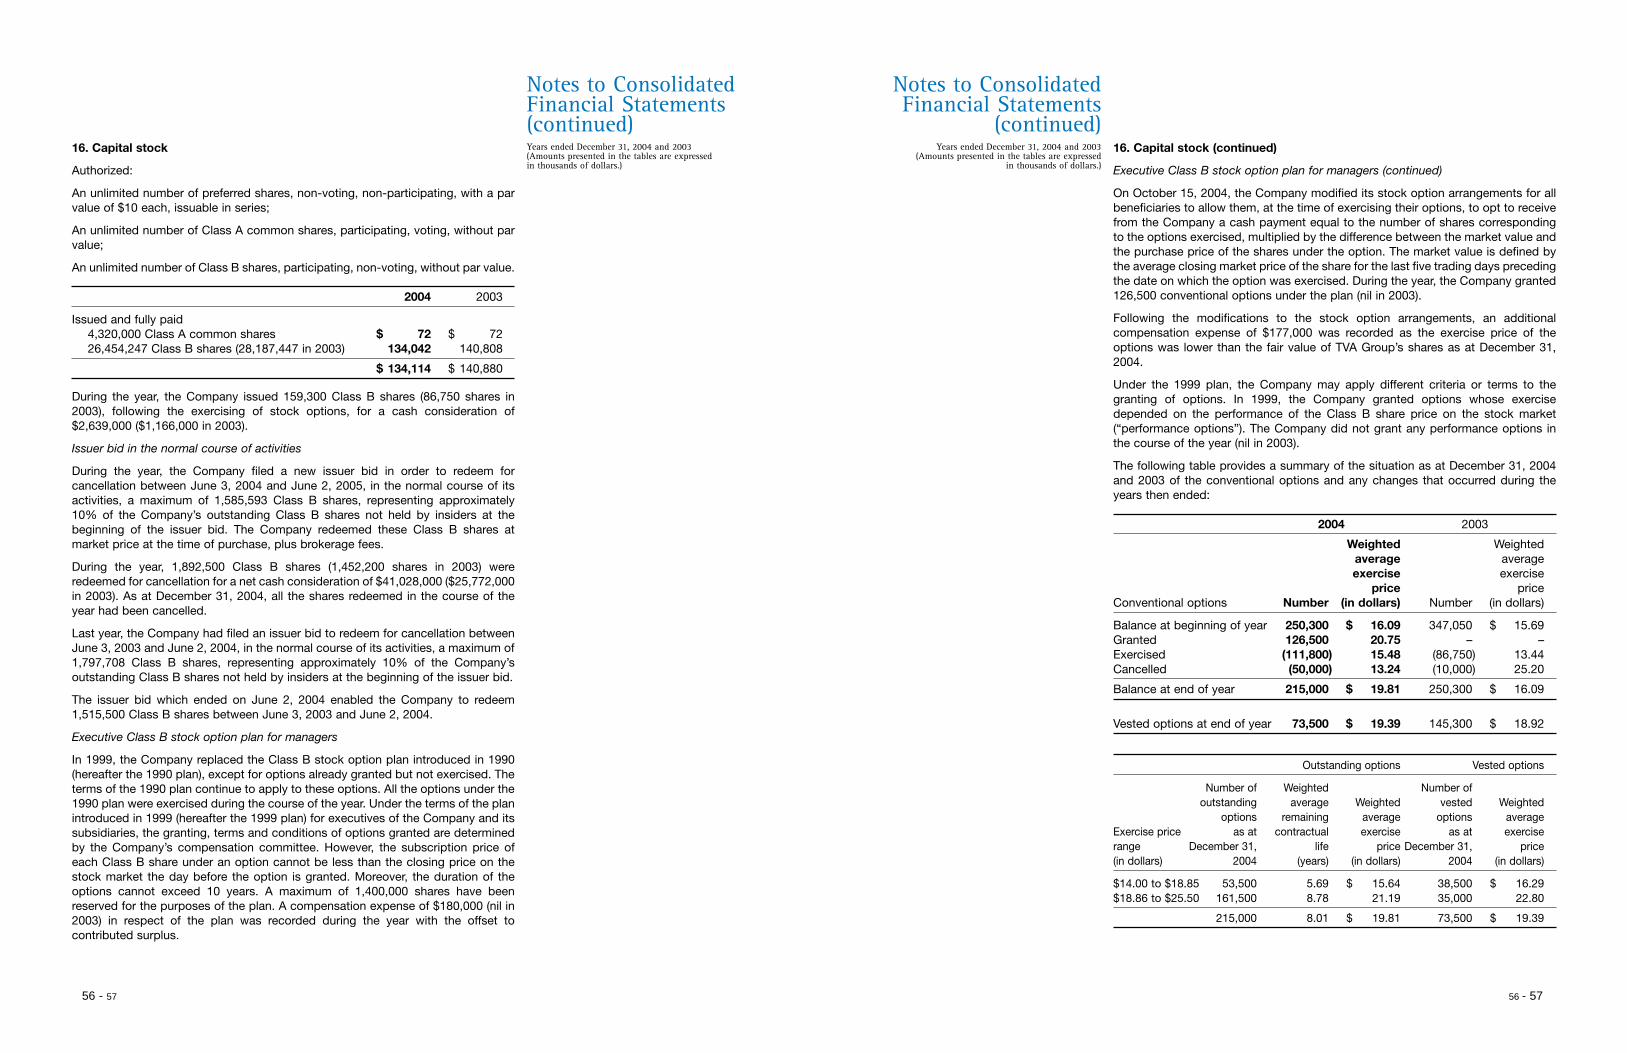
Years ended December 31, 2004 and 2003(Amounts presented in the tables are expressed in thousands of dollars.)
Notes to ConsolidatedFinancial Statements(continued)
Years ended December 31, 2004 and 2003(Amounts presented in the tables are expressed
in thousands of dollars.)
Notes to ConsolidatedFinancial Statements
(continued)16. Capital stock
Authorized:
An unlimited number of preferred shares, non-voting, non-participating, with a parvalue of $10 each, issuable in series;
An unlimited number of Class A common shares, participating, voting, without parvalue;
An unlimited number of Class B shares, participating, non-voting, without par value.
2004 2003
Issued and fully paid4,320,000 Class A common shares $ 72 $ 7226,454,247 Class B shares (28,187,447 in 2003) 134,042 140,808
$ 134,114 $ 140,880
During the year, the Company issued 159,300 Class B shares (86,750 shares in2003), following the exercising of stock options, for a cash consideration of$2,639,000 ($1,166,000 in 2003).
Issuer bid in the normal course of activities
During the year, the Company filed a new issuer bid in order to redeem forcancellation between June 3, 2004 and June 2, 2005, in the normal course of itsactivities, a maximum of 1,585,593 Class B shares, representing approximately10% of the Company’s outstanding Class B shares not held by insiders at thebeginning of the issuer bid. The Company redeemed these Class B shares atmarket price at the time of purchase, plus brokerage fees.
During the year, 1,892,500 Class B shares (1,452,200 shares in 2003) wereredeemed for cancellation for a net cash consideration of $41,028,000 ($25,772,000in 2003). As at December 31, 2004, all the shares redeemed in the course of theyear had been cancelled.
Last year, the Company had filed an issuer bid to redeem for cancellation betweenJune 3, 2003 and June 2, 2004, in the normal course of its activities, a maximum of1,797,708 Class B shares, representing approximately 10% of the Company’soutstanding Class B shares not held by insiders at the beginning of the issuer bid.
The issuer bid which ended on June 2, 2004 enabled the Company to redeem1,515,500 Class B shares between June 3, 2003 and June 2, 2004.
Executive Class B stock option plan for managers
In 1999, the Company replaced the Class B stock option plan introduced in 1990(hereafter the 1990 plan), except for options already granted but not exercised. Theterms of the 1990 plan continue to apply to these options. All the options under the1990 plan were exercised during the course of the year. Under the terms of the planintroduced in 1999 (hereafter the 1999 plan) for executives of the Company and itssubsidiaries, the granting, terms and conditions of options granted are determinedby the Company’s compensation committee. However, the subscription price ofeach Class B share under an option cannot be less than the closing price on thestock market the day before the option is granted. Moreover, the duration of theoptions cannot exceed 10 years. A maximum of 1,400,000 shares have beenreserved for the purposes of the plan. A compensation expense of $180,000 (nil in2003) in respect of the plan was recorded during the year with the offset tocontributed surplus.
16. Capital stock (continued)
Executive Class B stock option plan for managers (continued)
On October 15, 2004, the Company modified its stock option arrangements for allbeneficiaries to allow them, at the time of exercising their options, to opt to receivefrom the Company a cash payment equal to the number of shares correspondingto the options exercised, multiplied by the difference between the market value andthe purchase price of the shares under the option. The market value is defined bythe average closing market price of the share for the last five trading days precedingthe date on which the option was exercised. During the year, the Company granted126,500 conventional options under the plan (nil in 2003).
Following the modifications to the stock option arrangements, an additionalcompensation expense of $177,000 was recorded as the exercise price of theoptions was lower than the fair value of TVA Group’s shares as at December 31,2004.
Under the 1999 plan, the Company may apply different criteria or terms to thegranting of options. In 1999, the Company granted options whose exercisedepended on the performance of the Class B share price on the stock market(“performance options”). The Company did not grant any performance options inthe course of the year (nil in 2003).
The following table provides a summary of the situation as at December 31, 2004and 2003 of the conventional options and any changes that occurred during theyears then ended:
2004 2003
Weighted Weightedaverage averageexercise exercise
price priceConventional options Number (in dollars) Number (in dollars)
Balance at beginning of year 250,300 $ 16.09 347,050 $ 15.69Granted 126,500 20.75 – –Exercised (111,800) 15.48 (86,750) 13.44Cancelled (50,000) 13.24 (10,000) 25.20
Balance at end of year 215,000 $ 19.81 250,300 $ 16.09
Vested options at end of year 73,500 $ 19.39 145,300 $ 18.92
Outstanding options Vested options
Number of Weighted Number ofoutstanding average Weighted vested Weighted
options remaining average options averageExercise price as at contractual exercise as at exerciserange December 31, life price December 31, price(in dollars) 2004 (years) (in dollars) 2004 (in dollars)
$14.00 to $18.85 53,500 5.69 $ 15.64 38,500 $ 16.29$18.86 to $25.50 161,500 8.78 21.19 35,000 22.80
215,000 8.01 $ 19.81 73,500 $ 19.39
56 - 57 56 - 57
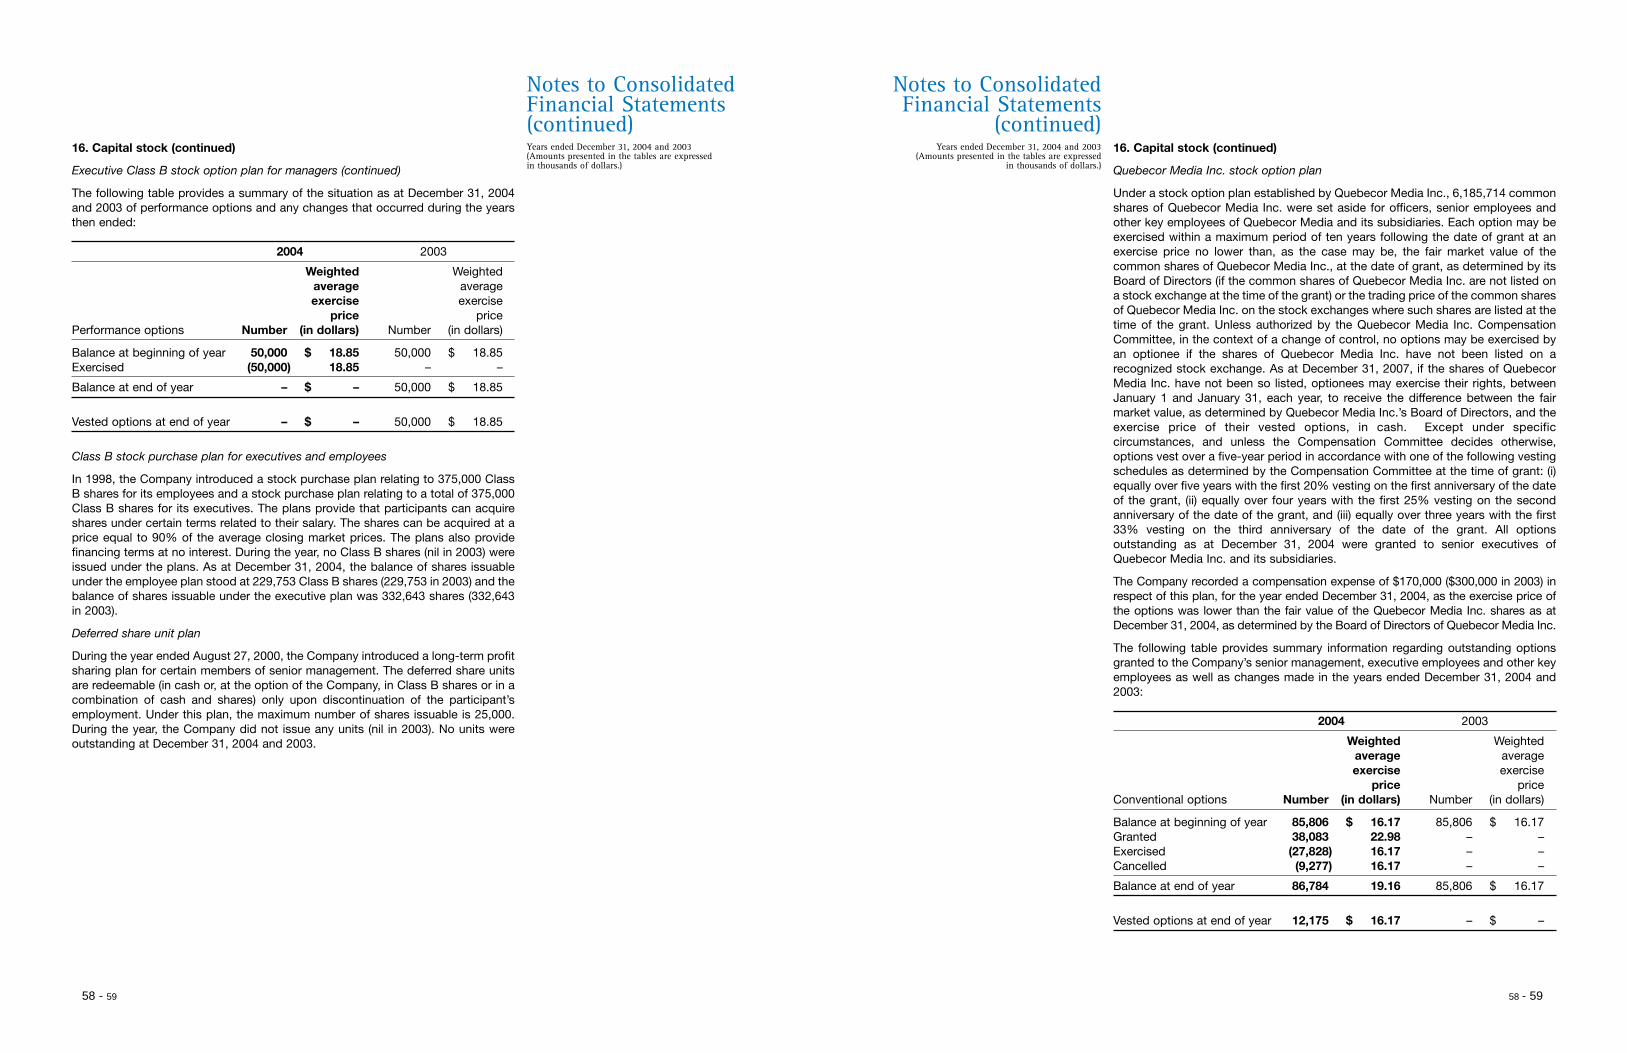
Years ended December 31, 2004 and 2003(Amounts presented in the tables are expressed in thousands of dollars.)
Notes to ConsolidatedFinancial Statements(continued)
Years ended December 31, 2004 and 2003(Amounts presented in the tables are expressed
in thousands of dollars.)
Notes to ConsolidatedFinancial Statements
(continued)16. Capital stock (continued)
Executive Class B stock option plan for managers (continued)
The following table provides a summary of the situation as at December 31, 2004and 2003 of performance options and any changes that occurred during the yearsthen ended:
2004 2003
Weighted Weightedaverage averageexercise exercise
price pricePerformance options Number (in dollars) Number (in dollars)
Balance at beginning of year 50,000 $ 18.85 50,000 $ 18.85Exercised (50,000) 18.85 – –
Balance at end of year – $ – 50,000 $ 18.85
Vested options at end of year – $ – 50,000 $ 18.85
Class B stock purchase plan for executives and employees
In 1998, the Company introduced a stock purchase plan relating to 375,000 ClassB shares for its employees and a stock purchase plan relating to a total of 375,000Class B shares for its executives. The plans provide that participants can acquireshares under certain terms related to their salary. The shares can be acquired at aprice equal to 90% of the average closing market prices. The plans also providefinancing terms at no interest. During the year, no Class B shares (nil in 2003) wereissued under the plans. As at December 31, 2004, the balance of shares issuableunder the employee plan stood at 229,753 Class B shares (229,753 in 2003) and thebalance of shares issuable under the executive plan was 332,643 shares (332,643in 2003).
Deferred share unit plan
During the year ended August 27, 2000, the Company introduced a long-term profitsharing plan for certain members of senior management. The deferred share unitsare redeemable (in cash or, at the option of the Company, in Class B shares or in acombination of cash and shares) only upon discontinuation of the participant’semployment. Under this plan, the maximum number of shares issuable is 25,000.During the year, the Company did not issue any units (nil in 2003). No units wereoutstanding at December 31, 2004 and 2003.
16. Capital stock (continued)
Quebecor Media Inc. stock option plan
Under a stock option plan established by Quebecor Media Inc., 6,185,714 commonshares of Quebecor Media Inc. were set aside for officers, senior employees andother key employees of Quebecor Media and its subsidiaries. Each option may beexercised within a maximum period of ten years following the date of grant at anexercise price no lower than, as the case may be, the fair market value of thecommon shares of Quebecor Media Inc., at the date of grant, as determined by itsBoard of Directors (if the common shares of Quebecor Media Inc. are not listed ona stock exchange at the time of the grant) or the trading price of the common sharesof Quebecor Media Inc. on the stock exchanges where such shares are listed at thetime of the grant. Unless authorized by the Quebecor Media Inc. CompensationCommittee, in the context of a change of control, no options may be exercised byan optionee if the shares of Quebecor Media Inc. have not been listed on arecognized stock exchange. As at December 31, 2007, if the shares of QuebecorMedia Inc. have not been so listed, optionees may exercise their rights, betweenJanuary 1 and January 31, each year, to receive the difference between the fairmarket value, as determined by Quebecor Media Inc.’s Board of Directors, and theexercise price of their vested options, in cash. Except under specificcircumstances, and unless the Compensation Committee decides otherwise,options vest over a five-year period in accordance with one of the following vestingschedules as determined by the Compensation Committee at the time of grant: (i)equally over five years with the first 20% vesting on the first anniversary of the dateof the grant, (ii) equally over four years with the first 25% vesting on the secondanniversary of the date of the grant, and (iii) equally over three years with the first33% vesting on the third anniversary of the date of the grant. All optionsoutstanding as at December 31, 2004 were granted to senior executives ofQuebecor Media Inc. and its subsidiaries.
The Company recorded a compensation expense of $170,000 ($300,000 in 2003) inrespect of this plan, for the year ended December 31, 2004, as the exercise price ofthe options was lower than the fair value of the Quebecor Media Inc. shares as atDecember 31, 2004, as determined by the Board of Directors of Quebecor Media Inc.
The following table provides summary information regarding outstanding optionsgranted to the Company’s senior management, executive employees and other keyemployees as well as changes made in the years ended December 31, 2004 and2003:
2004 2003
Weighted Weightedaverage averageexercise exercise
price priceConventional options Number (in dollars) Number (in dollars)
Balance at beginning of year 85,806 $ 16.17 85,806 $ 16.17Granted 38,083 22.98 – –Exercised (27,828) 16.17 – –Cancelled (9,277) 16.17 – –
Balance at end of year 86,784 19.16 85,806 $ 16.17
Vested options at end of year 12,175 $ 16.17 – $ –
58 - 59 58 - 59
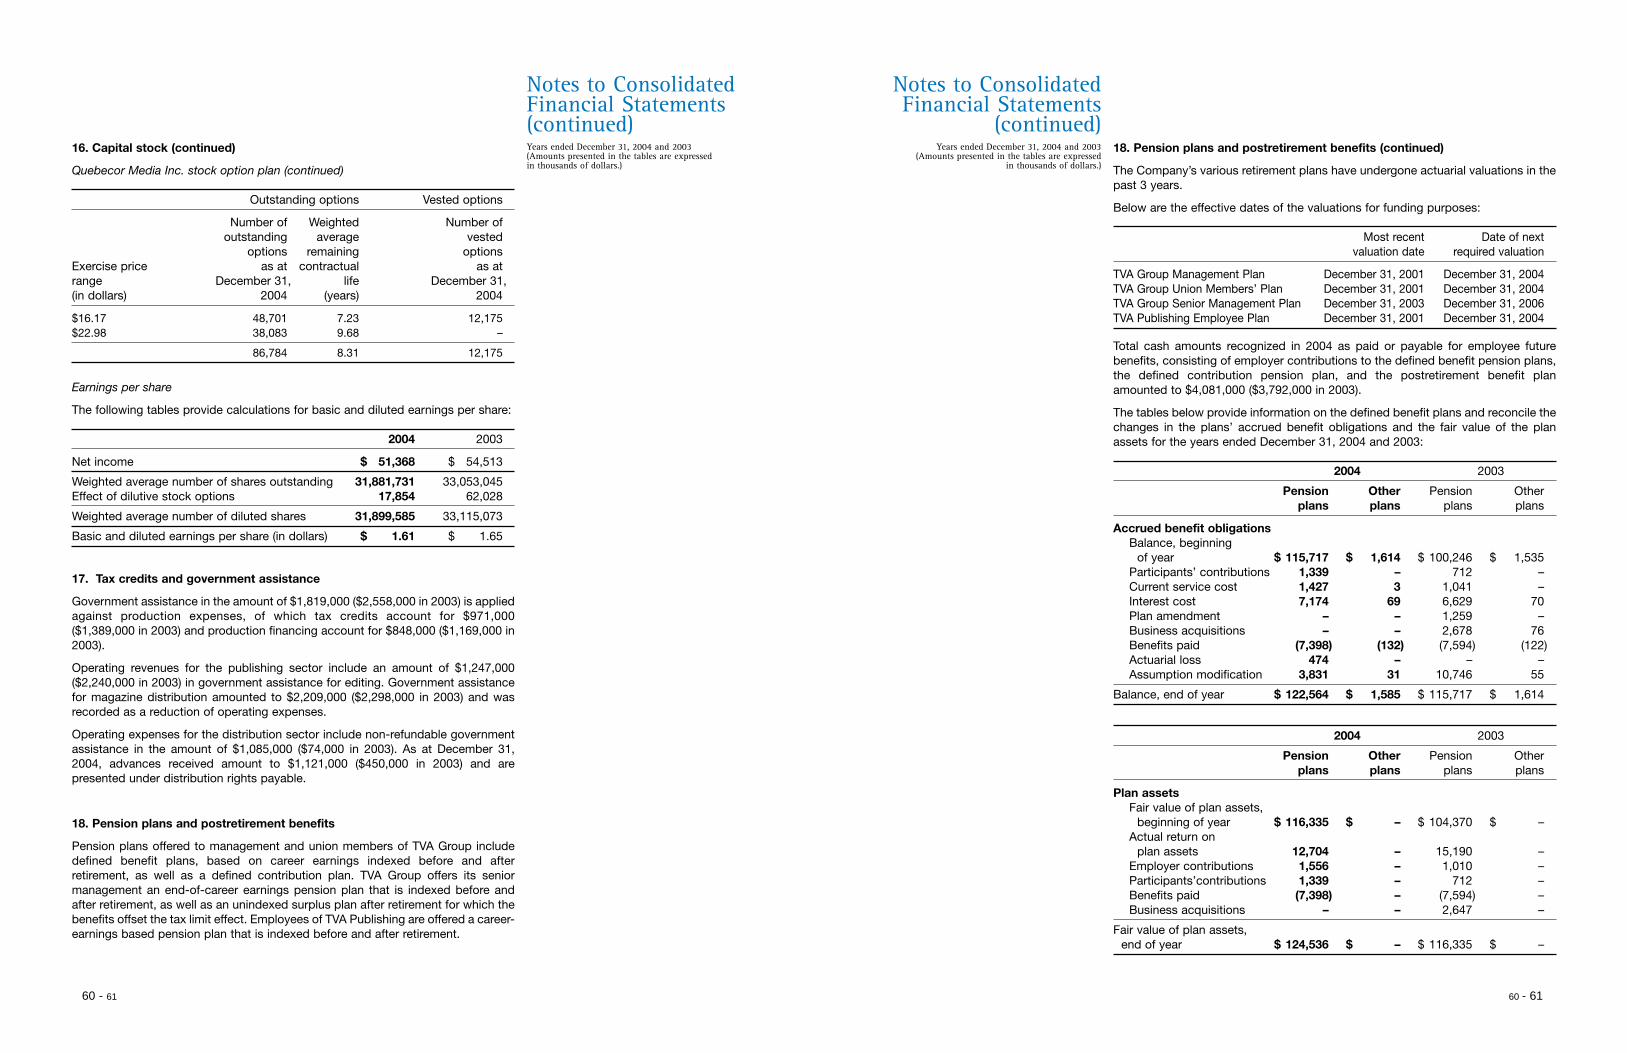
Years ended December 31, 2004 and 2003(Amounts presented in the tables are expressed in thousands of dollars.)
Notes to ConsolidatedFinancial Statements(continued)
Years ended December 31, 2004 and 2003(Amounts presented in the tables are expressed
in thousands of dollars.)
Notes to ConsolidatedFinancial Statements
(continued)16. Capital stock (continued)
Quebecor Media Inc. stock option plan (continued)
Outstanding options Vested options
Number of Weighted Number ofoutstanding average vested
options remaining optionsExercise price as at contractual as atrange December 31, life December 31,(in dollars) 2004 (years) 2004
$16.17 48,701 7.23 12,175$22.98 38,083 9.68 –
86,784 8.31 12,175
Earnings per share
The following tables provide calculations for basic and diluted earnings per share:
2004 2003
Net income $ 51,368 $ 54,513
Weighted average number of shares outstanding 31,881,731 33,053,045Effect of dilutive stock options 17,854 62,028
Weighted average number of diluted shares 31,899,585 33,115,073
Basic and diluted earnings per share (in dollars) $ 1.61 $ 1.65
17. Tax credits and government assistance
Government assistance in the amount of $1,819,000 ($2,558,000 in 2003) is appliedagainst production expenses, of which tax credits account for $971,000($1,389,000 in 2003) and production financing account for $848,000 ($1,169,000 in2003).
Operating revenues for the publishing sector include an amount of $1,247,000($2,240,000 in 2003) in government assistance for editing. Government assistancefor magazine distribution amounted to $2,209,000 ($2,298,000 in 2003) and wasrecorded as a reduction of operating expenses.
Operating expenses for the distribution sector include non-refundable governmentassistance in the amount of $1,085,000 ($74,000 in 2003). As at December 31,2004, advances received amount to $1,121,000 ($450,000 in 2003) and arepresented under distribution rights payable.
18. Pension plans and postretirement benefits
Pension plans offered to management and union members of TVA Group includedefined benefit plans, based on career earnings indexed before and afterretirement, as well as a defined contribution plan. TVA Group offers its seniormanagement an end-of-career earnings pension plan that is indexed before andafter retirement, as well as an unindexed surplus plan after retirement for which thebenefits offset the tax limit effect. Employees of TVA Publishing are offered a career-earnings based pension plan that is indexed before and after retirement.
18. Pension plans and postretirement benefits (continued)
The Company’s various retirement plans have undergone actuarial valuations in thepast 3 years.
Below are the effective dates of the valuations for funding purposes:
Most recent Date of nextvaluation date required valuation
TVA Group Management Plan December 31, 2001 December 31, 2004TVA Group Union Members’ Plan December 31, 2001 December 31, 2004TVA Group Senior Management Plan December 31, 2003 December 31, 2006TVA Publishing Employee Plan December 31, 2001 December 31, 2004
Total cash amounts recognized in 2004 as paid or payable for employee futurebenefits, consisting of employer contributions to the defined benefit pension plans,the defined contribution pension plan, and the postretirement benefit planamounted to $4,081,000 ($3,792,000 in 2003).
The tables below provide information on the defined benefit plans and reconcile thechanges in the plans’ accrued benefit obligations and the fair value of the planassets for the years ended December 31, 2004 and 2003:
2004 2003
Pension Other Pension Otherplans plans plans plans
Accrued benefit obligationsBalance, beginning
of year $ 115,717 $ 1,614 $ 100,246 $ 1,535Participants’ contributions 1,339 – 712 –Current service cost 1,427 3 1,041 –Interest cost 7,174 69 6,629 70Plan amendment – – 1,259 –Business acquisitions – – 2,678 76Benefits paid (7,398) (132) (7,594) (122)Actuarial loss 474 – – –Assumption modification 3,831 31 10,746 55
Balance, end of year $ 122,564 $ 1,585 $ 115,717 $ 1,614
2004 2003
Pension Other Pension Otherplans plans plans plans
Plan assetsFair value of plan assets,
beginning of year $ 116,335 $ – $ 104,370 $ –Actual return on
plan assets 12,704 – 15,190 –Employer contributions 1,556 – 1,010 –Participants’contributions 1,339 – 712 –Benefits paid (7,398) – (7,594) –Business acquisitions – – 2,647 –
Fair value of plan assets,end of year $ 124,536 $ – $ 116,335 $ –
60 - 61 60 - 61
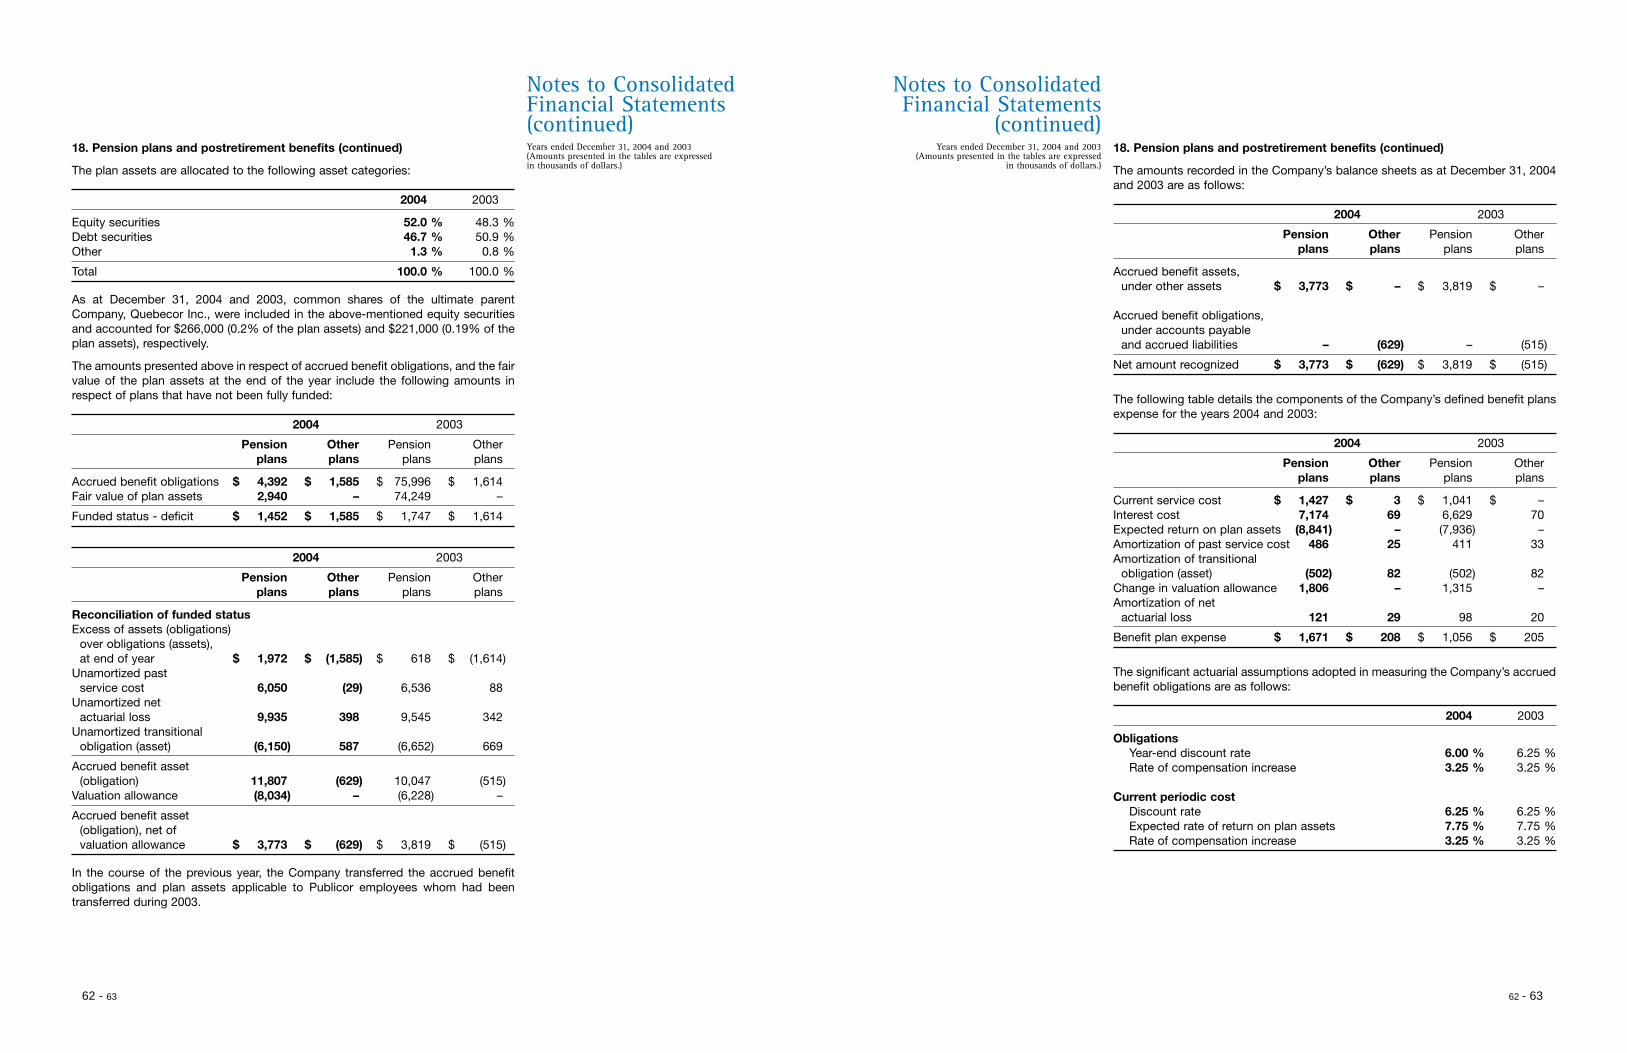
Years ended December 31, 2004 and 2003(Amounts presented in the tables are expressed in thousands of dollars.)
Notes to ConsolidatedFinancial Statements(continued)
Years ended December 31, 2004 and 2003(Amounts presented in the tables are expressed
in thousands of dollars.)
Notes to ConsolidatedFinancial Statements
(continued)18. Pension plans and postretirement benefits (continued)
The plan assets are allocated to the following asset categories:
2004 2003
Equity securities 52.0 % 48.3 %Debt securities 46.7 % 50.9 %Other 1.3 % 0.8 %
Total 100.0 % 100.0 %
As at December 31, 2004 and 2003, common shares of the ultimate parentCompany, Quebecor Inc., were included in the above-mentioned equity securitiesand accounted for $266,000 (0.2% of the plan assets) and $221,000 (0.19% of theplan assets), respectively.
The amounts presented above in respect of accrued benefit obligations, and the fairvalue of the plan assets at the end of the year include the following amounts inrespect of plans that have not been fully funded:
2004 2003
Pension Other Pension Otherplans plans plans plans
Accrued benefit obligations $ 4,392 $ 1,585 $ 75,996 $ 1,614Fair value of plan assets 2,940 – 74,249 –
Funded status - deficit $ 1,452 $ 1,585 $ 1,747 $ 1,614
2004 2003
Pension Other Pension Otherplans plans plans plans
Reconciliation of funded statusExcess of assets (obligations)
over obligations (assets),at end of year $ 1,972 $ (1,585) $ 618 $ (1,614)
Unamortized past service cost 6,050 (29) 6,536 88
Unamortized net actuarial loss 9,935 398 9,545 342
Unamortized transitionalobligation (asset) (6,150) 587 (6,652) 669
Accrued benefit asset (obligation) 11,807 (629) 10,047 (515)
Valuation allowance (8,034) – (6,228) –
Accrued benefit asset(obligation), net of valuation allowance $ 3,773 $ (629) $ 3,819 $ (515)
In the course of the previous year, the Company transferred the accrued benefitobligations and plan assets applicable to Publicor employees whom had beentransferred during 2003.
18. Pension plans and postretirement benefits (continued)
The amounts recorded in the Company’s balance sheets as at December 31, 2004and 2003 are as follows:
2004 2003
Pension Other Pension Otherplans plans plans plans
Accrued benefit assets, under other assets $ 3,773 $ – $ 3,819 $ –
Accrued benefit obligations, under accounts payable and accrued liabilities – (629) – (515)
Net amount recognized $ 3,773 $ (629) $ 3,819 $ (515)
The following table details the components of the Company’s defined benefit plansexpense for the years 2004 and 2003:
2004 2003
Pension Other Pension Otherplans plans plans plans
Current service cost $ 1,427 $ 3 $ 1,041 $ –Interest cost 7,174 69 6,629 70Expected return on plan assets (8,841) – (7,936) –Amortization of past service cost 486 25 411 33Amortization of transitional
obligation (asset) (502) 82 (502) 82Change in valuation allowance 1,806 – 1,315 –Amortization of net
actuarial loss 121 29 98 20
Benefit plan expense $ 1,671 $ 208 $ 1,056 $ 205
The significant actuarial assumptions adopted in measuring the Company’s accruedbenefit obligations are as follows:
2004 2003
ObligationsYear-end discount rate 6.00 % 6.25 %Rate of compensation increase 3.25 % 3.25 %
Current periodic costDiscount rate 6.25 % 6.25 %Expected rate of return on plan assets 7.75 % 7.75 %Rate of compensation increase 3.25 % 3.25 %
62 - 63 62 - 63
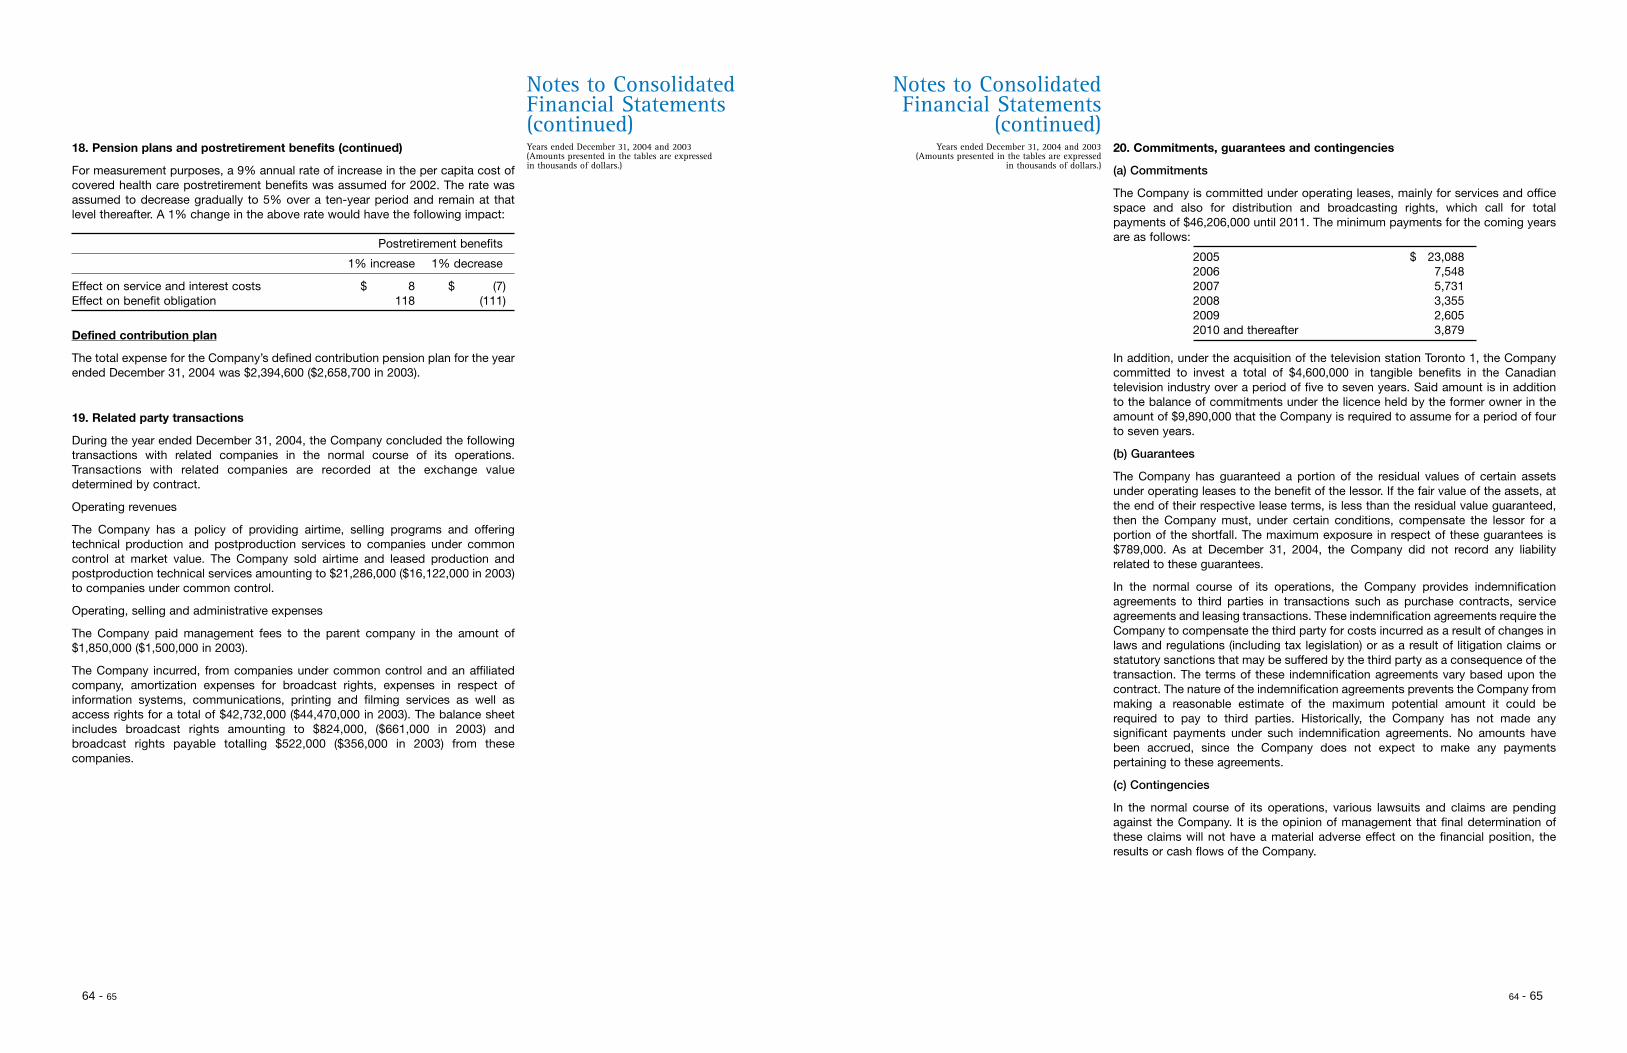
Years ended December 31, 2004 and 2003(Amounts presented in the tables are expressed in thousands of dollars.)
Notes to ConsolidatedFinancial Statements(continued)
Years ended December 31, 2004 and 2003(Amounts presented in the tables are expressed
in thousands of dollars.)
Notes to ConsolidatedFinancial Statements
(continued)18. Pension plans and postretirement benefits (continued)
For measurement purposes, a 9% annual rate of increase in the per capita cost ofcovered health care postretirement benefits was assumed for 2002. The rate wasassumed to decrease gradually to 5% over a ten-year period and remain at thatlevel thereafter. A 1% change in the above rate would have the following impact:
Postretirement benefits
1% increase 1% decrease
Effect on service and interest costs $ 8 $ (7)Effect on benefit obligation 118 (111)
Defined contribution plan
The total expense for the Company’s defined contribution pension plan for the yearended December 31, 2004 was $2,394,600 ($2,658,700 in 2003).
19. Related party transactions
During the year ended December 31, 2004, the Company concluded the followingtransactions with related companies in the normal course of its operations.Transactions with related companies are recorded at the exchange valuedetermined by contract.
Operating revenues
The Company has a policy of providing airtime, selling programs and offeringtechnical production and postproduction services to companies under commoncontrol at market value. The Company sold airtime and leased production andpostproduction technical services amounting to $21,286,000 ($16,122,000 in 2003)to companies under common control.
Operating, selling and administrative expenses
The Company paid management fees to the parent company in the amount of$1,850,000 ($1,500,000 in 2003).
The Company incurred, from companies under common control and an affiliatedcompany, amortization expenses for broadcast rights, expenses in respect ofinformation systems, communications, printing and filming services as well asaccess rights for a total of $42,732,000 ($44,470,000 in 2003). The balance sheetincludes broadcast rights amounting to $824,000, ($661,000 in 2003) andbroadcast rights payable totalling $522,000 ($356,000 in 2003) from thesecompanies.
20. Commitments, guarantees and contingencies
(a) Commitments
The Company is committed under operating leases, mainly for services and officespace and also for distribution and broadcasting rights, which call for totalpayments of $46,206,000 until 2011. The minimum payments for the coming yearsare as follows:
2005 $ 23,0882006 7,5482007 5,7312008 3,3552009 2,6052010 and thereafter 3,879
In addition, under the acquisition of the television station Toronto 1, the Companycommitted to invest a total of $4,600,000 in tangible benefits in the Canadiantelevision industry over a period of five to seven years. Said amount is in additionto the balance of commitments under the licence held by the former owner in theamount of $9,890,000 that the Company is required to assume for a period of fourto seven years.
(b) Guarantees
The Company has guaranteed a portion of the residual values of certain assetsunder operating leases to the benefit of the lessor. If the fair value of the assets, atthe end of their respective lease terms, is less than the residual value guaranteed,then the Company must, under certain conditions, compensate the lessor for aportion of the shortfall. The maximum exposure in respect of these guarantees is$789,000. As at December 31, 2004, the Company did not record any liabilityrelated to these guarantees.
In the normal course of its operations, the Company provides indemnificationagreements to third parties in transactions such as purchase contracts, serviceagreements and leasing transactions. These indemnification agreements require theCompany to compensate the third party for costs incurred as a result of changes inlaws and regulations (including tax legislation) or as a result of litigation claims orstatutory sanctions that may be suffered by the third party as a consequence of thetransaction. The terms of these indemnification agreements vary based upon thecontract. The nature of the indemnification agreements prevents the Company frommaking a reasonable estimate of the maximum potential amount it could berequired to pay to third parties. Historically, the Company has not made anysignificant payments under such indemnification agreements. No amounts havebeen accrued, since the Company does not expect to make any paymentspertaining to these agreements.
(c) Contingencies
In the normal course of its operations, various lawsuits and claims are pendingagainst the Company. It is the opinion of management that final determination ofthese claims will not have a material adverse effect on the financial position, theresults or cash flows of the Company.
64 - 65 64 - 65
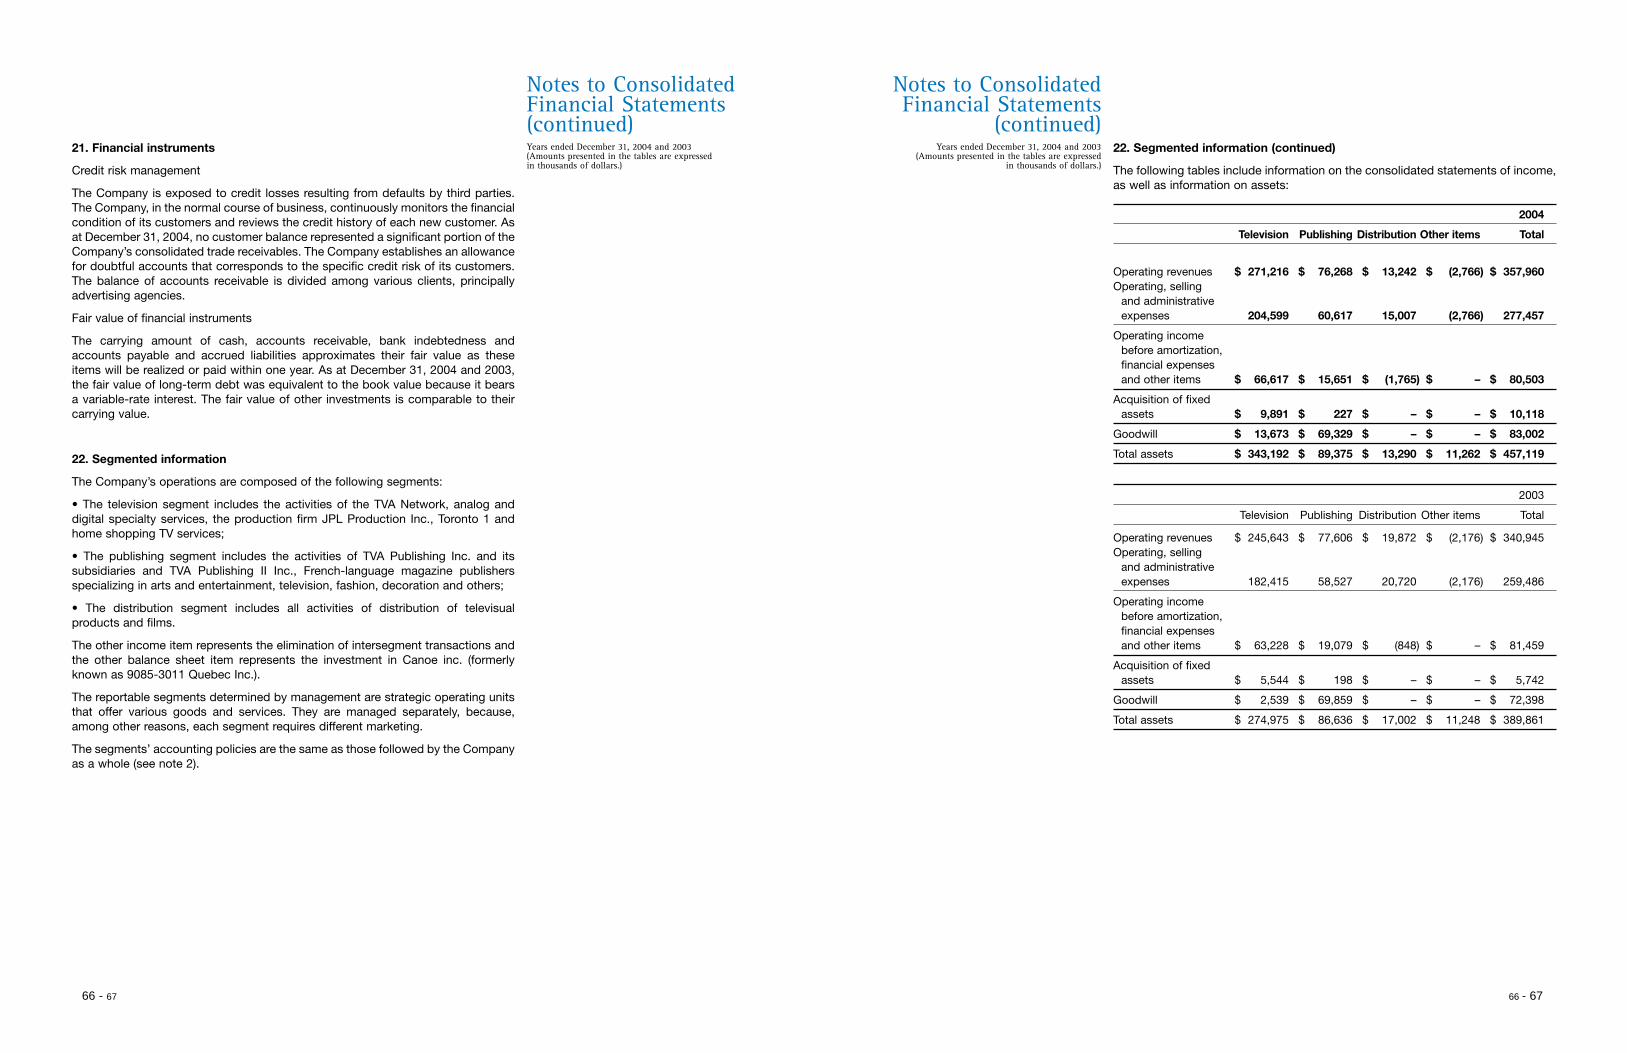
Years ended December 31, 2004 and 2003(Amounts presented in the tables are expressed in thousands of dollars.)
Notes to ConsolidatedFinancial Statements(continued)
Years ended December 31, 2004 and 2003(Amounts presented in the tables are expressed
in thousands of dollars.)
Notes to ConsolidatedFinancial Statements
(continued)21. Financial instruments
Credit risk management
The Company is exposed to credit losses resulting from defaults by third parties.The Company, in the normal course of business, continuously monitors the financialcondition of its customers and reviews the credit history of each new customer. Asat December 31, 2004, no customer balance represented a significant portion of theCompany’s consolidated trade receivables. The Company establishes an allowancefor doubtful accounts that corresponds to the specific credit risk of its customers.The balance of accounts receivable is divided among various clients, principallyadvertising agencies.
Fair value of financial instruments
The carrying amount of cash, accounts receivable, bank indebtedness andaccounts payable and accrued liabilities approximates their fair value as theseitems will be realized or paid within one year. As at December 31, 2004 and 2003,the fair value of long-term debt was equivalent to the book value because it bearsa variable-rate interest. The fair value of other investments is comparable to theircarrying value.
22. Segmented information
The Company’s operations are composed of the following segments:
• The television segment includes the activities of the TVA Network, analog anddigital specialty services, the production firm JPL Production Inc., Toronto 1 andhome shopping TV services;
• The publishing segment includes the activities of TVA Publishing Inc. and itssubsidiaries and TVA Publishing II Inc., French-language magazine publishersspecializing in arts and entertainment, television, fashion, decoration and others;
• The distribution segment includes all activities of distribution of televisualproducts and films.
The other income item represents the elimination of intersegment transactions andthe other balance sheet item represents the investment in Canoe inc. (formerlyknown as 9085-3011 Quebec Inc.).
The reportable segments determined by management are strategic operating unitsthat offer various goods and services. They are managed separately, because,among other reasons, each segment requires different marketing.
The segments’ accounting policies are the same as those followed by the Companyas a whole (see note 2).
22. Segmented information (continued)
The following tables include information on the consolidated statements of income,as well as information on assets:
2004
Television Publishing Distribution Other items Total
Operating revenues $ 271,216 $ 76,268 $ 13,242 $ (2,766) $ 357,960Operating, selling
and administrative expenses 204,599 60,617 15,007 (2,766) 277,457
Operating income before amortization, financial expenses and other items $ 66,617 $ 15,651 $ (1,765) $ – $ 80,503
Acquisition of fixed assets $ 9,891 $ 227 $ – $ – $ 10,118
Goodwill $ 13,673 $ 69,329 $ – $ – $ 83,002
Total assets $ 343,192 $ 89,375 $ 13,290 $ 11,262 $ 457,119
2003
Television Publishing Distribution Other items Total
Operating revenues $ 245,643 $ 77,606 $ 19,872 $ (2,176) $ 340,945Operating, selling
and administrative expenses 182,415 58,527 20,720 (2,176) 259,486
Operating income before amortization, financial expenses and other items $ 63,228 $ 19,079 $ (848) $ – $ 81,459
Acquisition of fixedassets $ 5,544 $ 198 $ – $ – $ 5,742
Goodwill $ 2,539 $ 69,859 $ – $ – $ 72,398
Total assets $ 274,975 $ 86,636 $ 17,002 $ 11,248 $ 389,861
66 - 67 66 - 67
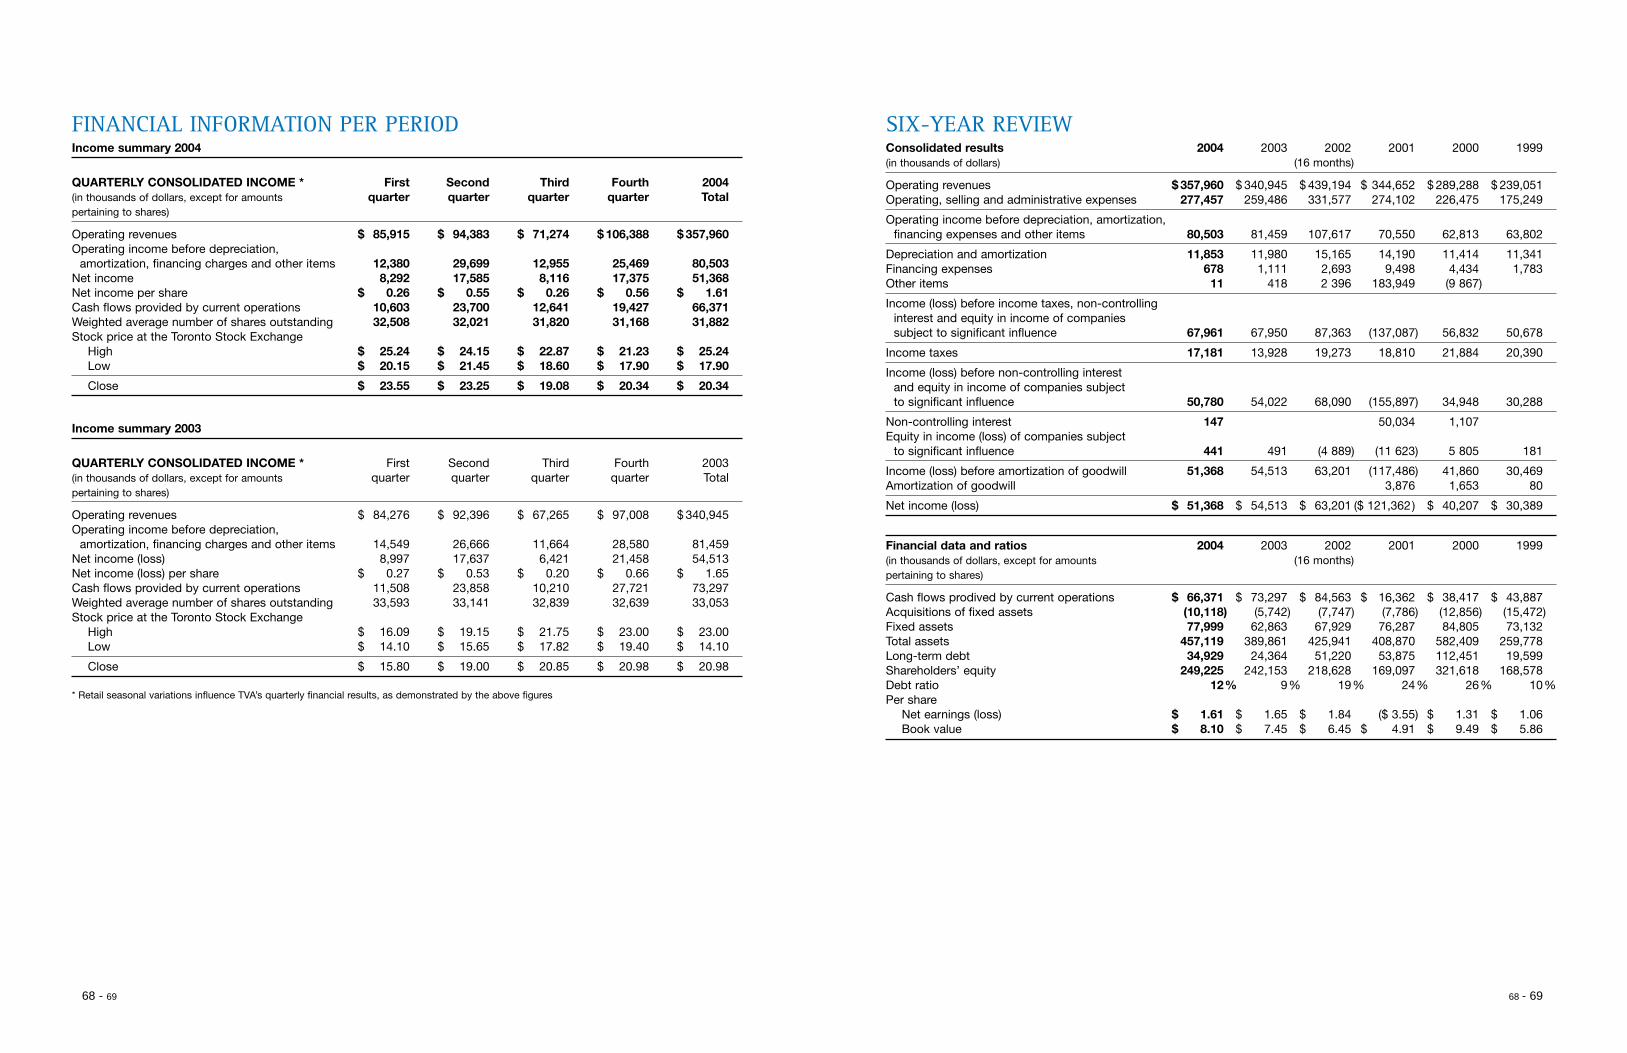
FINANCIAL INFORMATION PER PERIOD SIX-YEAR REVIEW
68 - 69 68 - 69
Consolidated results 2004 2003 2002 2001 2000 1999(in thousands of dollars) (16 months)
Operating revenues $ 357,960 $ 340,945 $ 439,194 $ 344,652 $ 289,288 $ 239,051Operating, selling and administrative expenses 277,457 259,486 331,577 274,102 226,475 175,249
Operating income before depreciation, amortization,financing expenses and other items 80,503 81,459 107,617 70,550 62,813 63,802
Depreciation and amortization 11,853 11,980 15,165 14,190 11,414 11,341Financing expenses 678 1,111 2,693 9,498 4,434 1,783Other items 11 418 2 396 183,949 (9 867)
Income (loss) before income taxes, non-controlling interest and equity in income of companies subject to significant influence 67,961 67,950 87,363 (137,087) 56,832 50,678
Income taxes 17,181 13,928 19,273 18,810 21,884 20,390
Income (loss) before non-controlling interest and equity in income of companies subject to significant influence 50,780 54,022 68,090 (155,897) 34,948 30,288
Non-controlling interest 147 50,034 1,107Equity in income (loss) of companies subject
to significant influence 441 491 (4 889) (11 623) 5 805 181
Income (loss) before amortization of goodwill 51,368 54,513 63,201 (117,486) 41,860 30,469Amortization of goodwill 3,876 1,653 80
Net income (loss) $ 51,368 $ 54,513 $ 63,201 ($ 121,362) $ 40,207 $ 30,389
Financial data and ratios 2004 2003 2002 2001 2000 1999(in thousands of dollars, except for amounts (16 months)pertaining to shares)
Cash flows prodived by current operations $ 66,371 $ 73,297 $ 84,563 $ 16,362 $ 38,417 $ 43,887Acquisitions of fixed assets (10,118) (5,742) (7,747) (7,786) (12,856) (15,472)Fixed assets 77,999 62,863 67,929 76,287 84,805 73,132Total assets 457,119 389,861 425,941 408,870 582,409 259,778Long-term debt 34,929 24,364 51,220 53,875 112,451 19,599Shareholders’ equity 249,225 242,153 218,628 169,097 321,618 168,578Debt ratio 12% 9% 19% 24% 26% 10%Per share
Net earnings (loss) $ 1.61 $ 1.65 $ 1.84 ($ 3.55) $ 1.31 $ 1.06Book value $ 8.10 $ 7.45 $ 6.45 $ 4.91 $ 9.49 $ 5.86
Income summary 2004
QUARTERLY CONSOLIDATED INCOME * First Second Third Fourth 2004(in thousands of dollars, except for amounts quarter quarter quarter quarter Totalpertaining to shares)
Operating revenues $ 85,915 $ 94,383 $ 71,274 $ 106,388 $ 357,960Operating income before depreciation,
amortization, financing charges and other items 12,380 29,699 12,955 25,469 80,503Net income 8,292 17,585 8,116 17,375 51,368Net income per share $ 0.26 $ 0.55 $ 0.26 $ 0.56 $ 1.61Cash flows provided by current operations 10,603 23,700 12,641 19,427 66,371Weighted average number of shares outstanding 32,508 32,021 31,820 31,168 31,882Stock price at the Toronto Stock Exchange
High $ 25.24 $ 24.15 $ 22.87 $ 21.23 $ 25.24Low $ 20.15 $ 21.45 $ 18.60 $ 17.90 $ 17.90
Close $ 23.55 $ 23.25 $ 19.08 $ 20.34 $ 20.34
Income summary 2003
QUARTERLY CONSOLIDATED INCOME * First Second Third Fourth 2003(in thousands of dollars, except for amounts quarter quarter quarter quarter Totalpertaining to shares)
Operating revenues $ 84,276 $ 92,396 $ 67,265 $ 97,008 $ 340,945Operating income before depreciation,
amortization, financing charges and other items 14,549 26,666 11,664 28,580 81,459Net income (loss) 8,997 17,637 6,421 21,458 54,513Net income (loss) per share $ 0.27 $ 0.53 $ 0.20 $ 0.66 $ 1.65Cash flows provided by current operations 11,508 23,858 10,210 27,721 73,297Weighted average number of shares outstanding 33,593 33,141 32,839 32,639 33,053Stock price at the Toronto Stock Exchange
High $ 16.09 $ 19.15 $ 21.75 $ 23.00 $ 23.00Low $ 14.10 $ 15.65 $ 17.82 $ 19.40 $ 14.10
Close $ 15.80 $ 19.00 $ 20.85 $ 20.98 $ 20.98
* Retail seasonal variations influence TVA’s quarterly financial results, as demonstrated by the above figures
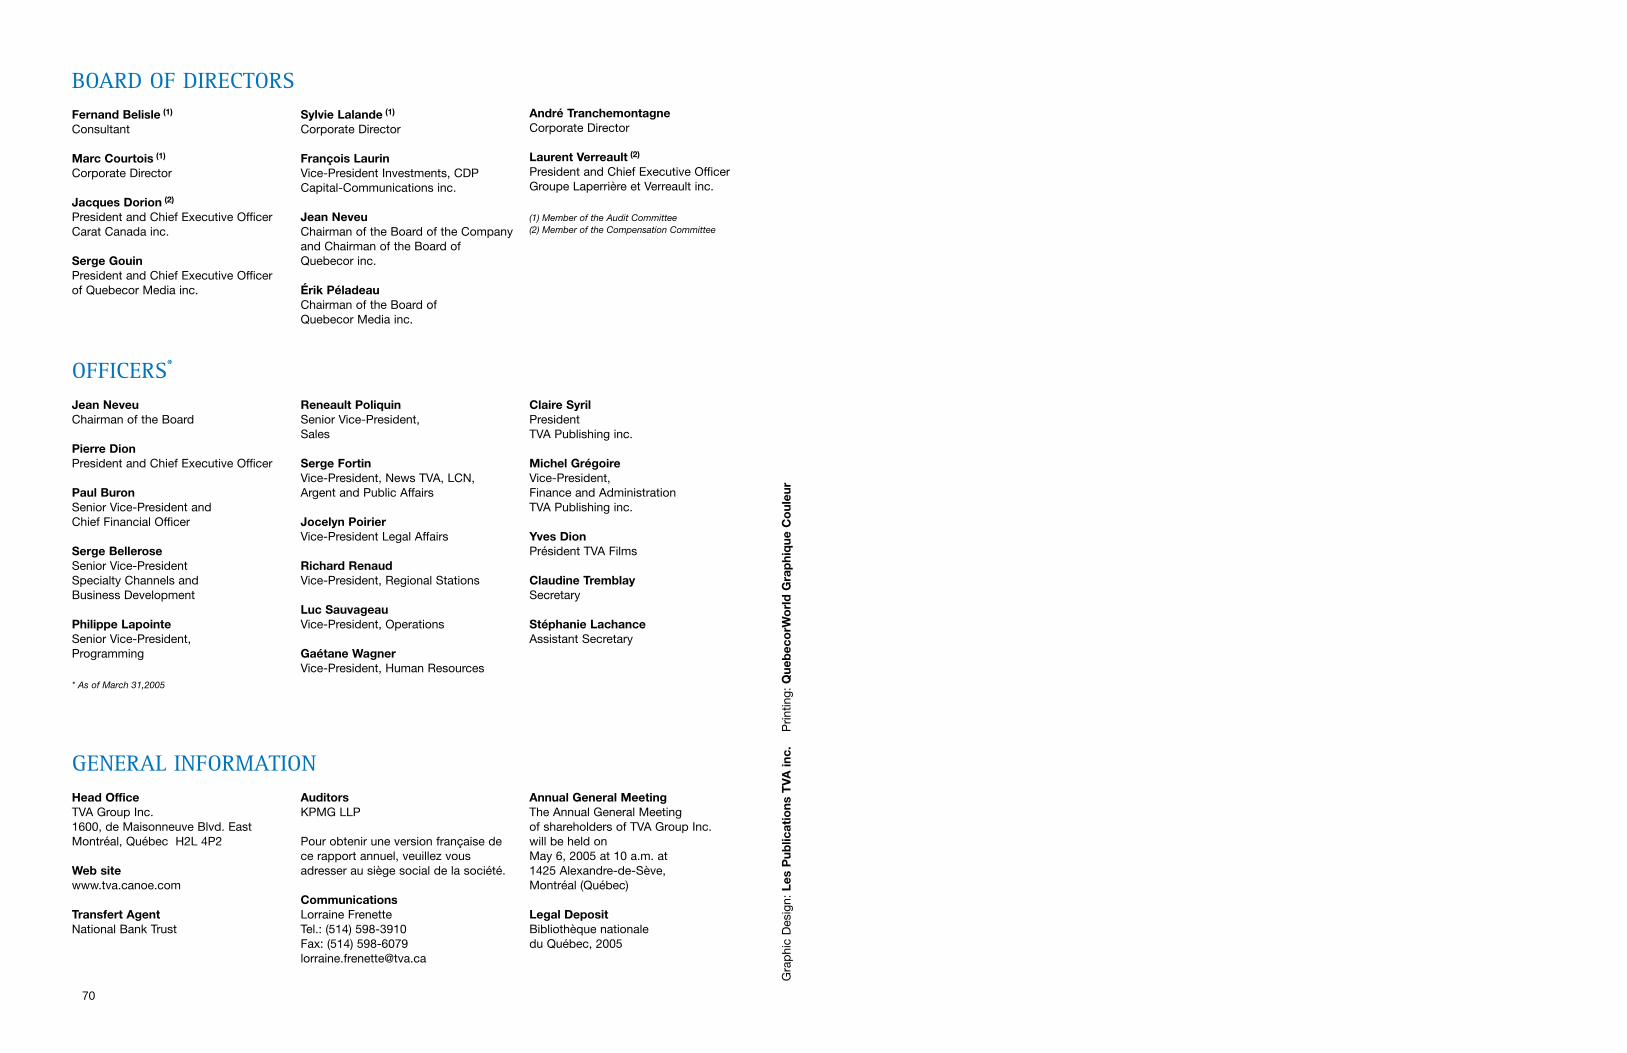
70 - 69
Fernand Belisle (1)
Consultant
Marc Courtois (1)
Corporate Director
Jacques Dorion (2)
President and Chief Executive OfficerCarat Canada inc.
Serge GouinPresident and Chief Executive Officerof Quebecor Media inc.
Sylvie Lalande (1)
Corporate Director
François LaurinVice-President Investments, CDP Capital-Communications inc.
Jean NeveuChairman of the Board of the Companyand Chairman of the Board of Quebecor inc.
Érik PéladeauChairman of the Board of Quebecor Media inc.
André TranchemontagneCorporate Director
Laurent Verreault (2)
President and Chief Executive OfficerGroupe Laperrière et Verreault inc.
(1) Member of the Audit Committee(2) Member of the Compensation Committee
GENERAL INFORMATION
BOARD OF DIRECTORS
OFFICERS*
Jean NeveuChairman of the Board
Pierre DionPresident and Chief Executive Officer
Paul BuronSenior Vice-President andChief Financial Officer
Serge BelleroseSenior Vice-PresidentSpecialty Channels andBusiness Development
Philippe LapointeSenior Vice-President, Programming
* As of March 31,2005
Reneault PoliquinSenior Vice-President, Sales
Serge FortinVice-President, News TVA, LCN, Argent and Public Affairs
Jocelyn PoirierVice-President Legal Affairs
Richard RenaudVice-President, Regional Stations
Luc SauvageauVice-President, Operations
Gaétane WagnerVice-President, Human Resources
Claire SyrilPresidentTVA Publishing inc.
Michel GrégoireVice-President, Finance and AdministrationTVA Publishing inc.
Yves DionPrésident TVA Films
Claudine TremblaySecretary
Stéphanie LachanceAssistant Secretary
Head OfficeTVA Group Inc.1600, de Maisonneuve Blvd. EastMontréal, Québec H2L 4P2
Web sitewww.tva.canoe.com
Transfert AgentNational Bank Trust
AuditorsKPMG LLP
Pour obtenir une version française dece rapport annuel, veuillez vousadresser au siège social de la société.
CommunicationsLorraine FrenetteTel.: (514) 598-3910Fax: (514) [email protected]
Annual General MeetingThe Annual General Meetingof shareholders of TVA Group Inc.will be held onMay 6, 2005 at 10 a.m. at1425 Alexandre-de-Sève,Montréal (Québec)
Legal DepositBibliothèque nationaledu Québec, 2005
Gra
phi
c D
esig
n: L
es P
ublic
atio
ns T
VA in
c.P
rintin
g: Q
ueb
eco
rWo
rld
Gra
phi
que
Co
uleu
r


![ACID – BASE BALANCE HOMEOSTASIS Relative [ ] of hydrogen ions pH – potential hydrogen Normal pH: 7.35 – 7.45 7.45 is alkalosis](https://img.pdfslide.us/doc/110x75/551516f755034673228b4c6b/acid-base-balance-homeostasis-relative-of-hydrogen-ions-ph-potential-hydrogen-normal-ph-735-745-745-is-alkalosis.jpg)