Embed Size (px)
Citation preview
ENGINEERING CHANGE NOTICE P 0 1 0 1 2 s
1 ECN 655640 h l ECN
ECN C8tagoW (m one)
Suppiemrtal 0 Dired Revision
3 OrblMtOh Nam Orglnkrtbn MSIN and Telephone No John Schof ield 7 4 9 00 57 - 12 37 3- 22 4 5
CmaW0id 01 RPP-4826 Rev 0 I NA I NA
4 KiQRquird 5 D10
O Y e s No
0 6 Ropd Tkl0iNoMbdf Order No 17 BldglSyrJFac No Cham0 ECN
38 h d f l i o n of Change RPP-4826 Rev0 provided information on aerosol formation in SSTS during RMCS RPP-4826 Rev1 is a rewrite of this document which adds additional information that was not available when Rev0 was issued Information on aerosol levels estimated from record sample data is deleted and additional information is added on estimation of the filter housing decontamination factor
is rnsw B S B E ~ ~ DOCUIW~~~ 0 yes NO
8 Approval Desbnrtor - - 0 Temponry
Standby Supmdure 0
msgn morimwbn o I 15 DisMbulmn (indude nam MSIN and no of wples) SEE Distribution Sheet
RFI F4SE STAMP
ro EXEAST a-
JAN 24 A-78ooo13-2 (lC497)
Experience wAerosol Generation During PMCS in the 5 5 Waste Tanks 8 bamrt N u m k n Chngd bythis ECN (induder
2006 NA 10 Relatad ECN No() 11 ReMadPONo
ah0t no and rev)
I
i
- 2a Modiflcrtin Wofk
0 Yns (mi oul Blk 12b) No NABlkr 12b
2c 12d)
A-7wOO13-1
12d Rettond to IMI CondWn (Temp or Standby Es only)
12b WDrk hdnp No 12c Moditcation Wodf Cofr$4aterJ
NA NA NA hrign WhorlCo Englnwr Signature (L h r AehwilyICo Englnar SbMtun (L
ample Bit
IC JuIHkatbn(nurkom) CrRerb Chanp 0 D - b n ImPrOwmrt 0
Fadlily h a d h t i o n 0 EviOmIdLal 0
As-Found 0 Faulbl0 Const 0 Conrt EnodOmiwion 0
14b Jurtmution Daelb
1) No USQ required per HNF-IP-0842 Section 5 4 RevllC 2) Revision required due to additional information becoming available
I I 1 ECN (use no from oa 1
Page 2 of 2 ENGINEERING CHANGE NOTICE
6 Design Verification 17 Cost Impact ENGINEERING CONSTRUCTION Required
- I
655640
18 Schedule Impact (days)
0 Yes I Additional 0 $ NA Additional 0 $ NA 1 Improvement 0 NA Ed No Savings 0 $ Savings 0 $ Delay 0
0 SeismidStress Analysis 0 Tank Calibration Manual 0 0 StresdDesign Report 0 Heanh Physics Procedure 0 0 Interface Control Drawing 0 Spares Multiple Unit Listing 0
Conceptual Design Report 0 Installation Procedure 0 Component Index 0 0 Maintenance Procedure ASME Coded Item 0
Procurement Spec 0 Operating Instruction 0 Computer SoRware 0 Vendor Information 0 Operating Procedure 0 Electric Circuit Schedule 0 OM Manual 0 Operational Safety Requirement 0 ICRS Procedure 0
Safety Equipment List 0 Cell Arrangement Drawing 0 Process Flow Chart 0 Radiation Work Permit 0 Essential Material Specification 0 Purchase Requisition 0 Environmental Impact Statement 0 Fac Proc Samp Schedule 0 Tickler File 0 Environmental Report 0 Inspection Plan 0 None Ed Environmental Permit 0 Inventory Adjustment Request 0 0
SDDIDD
Functional Design Criteria
Operating Specification
Criticality Specification 0 Calibration Procedure 0 Test ProcedureslSpecification 0
Equipment Spec
Const Spec Engineering Procedure 0 Human Factor Consideration 0
FSARISAR 0 IEFD Drawing 0 Process Control ManualIPlan 0
0 er ece ocumens ocumen s I e e ow wi no revised by this ECN) Signatures below indicate that the signing t ~ a n i o ~ fa been n d t l t i d ~ ~ ~ h e ~ a ~ e c t e d t d ~ ~ ~ ~ t ~ listed be
Document NumberlRevision Document NumberlRevision Document NumberIRevision
NA NA NA
1 ADorovals Signature Date
U f QA
Safety
Environ
Other
Signature Date
Design Agent
PE
QA
Safety
Design
Environ
Other
DEPARTMENT OF ENERGY
Signature or a Control Number that tracks the Approval Slgnature
ADDITIONAL
DISTRIBUTION SHEET
SAMPLING IN THE HANFORD SINGLE SHELL WASTE TANKS I ECN NO 655640
EDTIECN Text Name MSlN W h All Text Only Appendix Only
Attach Only ~
I EDT No 1 EXPERIENCE WITH A AEROSOL GENERATION DURING ROTARY MODE CORE
RN Dale
T R Farris
RM Boger
S7-12 X
57-12 X
57-12 X
I 8
I JS Schofield I 57-12 I X I I I I
JS Smalley
1EJ Waldo I 57-12 I X I I I I
57-12 X
LL Penn
I JD Criddle Jr I 57-12 I X I I I I
~
S7-03 X
BG Erlandson
JD Guberski
J Luke
PC Miller
R1-51 X
R1-51 X
R1-51 X
R 1 - 5 1 X
I J s Lee I S7-03 1 X I I I 1 M R Kembel I 57-03 I X I I I I
IDL Dyekman I R1-51 I X I I IGN crummel I R1-51 I X I I I I
I RD Gustavson I R1-56 I x I I I I
AsooO-135 (10tQ7)
RPP-4826 Rev 1
EXPERIENCE WITH AEROSOL GENERATION DURING ROTARY MODE CORE SAMPLING IN THE HANFORD SINGLE SHELL WASTE TANKS
J S Schofiald CH2M HILL Hanford Group Inc Richland WA 99352 US Department of Energy Contract DE-ACOB-BBRL13200
EDTECN 655640 uc 2000 Org Code 74900 Charge Code 102249
58 Total Pages B8R Code EW313000
Key Words Aerosols Particulates Rotary Mode Core Sampling
Abstract This document provides data on aerosol concentrations in tank head spaces total mass of aerosols in the tank head space and mass of aerosols sent to the exhauster during Rotary Mode Core Sampling from November 1994 through June 1999 A decontamination factor for the RMCS exhauster filter housing is calculated based on operation data
Microshield is a registered trademark o f Grove Engineering Inc
TRADEMARK DISCLAIMER Rebrenm herein to any spcMc wmmerdai pmdud promu or urvia by tmd name trademark manuhdursr or othemlu dws not nauarlty wnstkth or impty its endorumant nmmmendatbn or hvorlng by the Unitad States Government or any agency thounof or it wntradon or wbwntradon
Prlrdd in t i n Unlul States of America To obtain mples of this doawnen( mnhd Document Control Sorvlai P 0 Sox 950 Maihtop HEM) Rkhbnd WA 99352 Phon (509) 372-2420 Fax (509) 37Mo8B
JAN 24 SOA rsquo Dab
Approved For Public Release
A84040731 (1097)
RECORD OF REVISION
(3) Revision I-
(1) Document Number
R P P - 4 8 2 6 R e v 1 1 Page -
I
I
c
Change Control Record
Authorized for Release
(5) Cog Engr I (6) Cog Mgr Date (4) Description of Change Replace Add and Delete Pages
7) I I I RN Dale I JS Schof i e ld 3DT- 6 2 3 4 1 4
3 C N - 6 5 5 6 4 0 E J Waldo
I
I
I I
A-7320405 (10i97)
RPP-4826 Rev I
EXPERIENCE WITH AEROSOL GENERATION DURING ROTARY MODE CORE SAMPLING IN THE HANFORD SINGLE SHELL
WASTE TANKS
John Schofield CH2M Hill Hanford Group Incorporated
January 2000
RPP-4826 Rev 1
Table of Contents
111
SOL GENERATION DURING ROTARY M WASTE TANKS 1
1
2 RMCS Exhauster Housing NDA RMCS Exhauster HEPA Dose R CGM Filter Paper Analyses
Housing NDA and Record Sample Data Comparison
3
Discussion of Results
APPENDIX A - Estimation Of Aerosols Generated During RMCS Based Upon RMCS Exhauster Housing Non-Destructive Assay A-I
Summary of Method Description Reported NDA Data A-2
A-2
Aerosol Calculatio
B-1
Aerosol Calculatio B-3 Summary of Calcu B-4
c-l
Calculated Tank Head Space Radionuclide Concentrations
Summary of Calculations Aerosol Calculations
APPENDIX D - Estimation of RMCS Exhauster Housing Decontamination Factor Summary of Method D-l
Estimated Aerosol Level Summary of Calculations D-4
APPENDIX E - Tank Waste Radionuclide Concentrations Used for Aerosol Calculations APPENDIX F - Rotary Mode Core Sampling Exhauster and Core Sample D
Basic Operational Data Tank 241-BY-106 1194 to 1294 F-2 Tank 241-BY-106 195 Tank 241-BY-I IO 795
I
RPP-4826 Rev 1
Tank 241-BY-108 795 to 895 F-2 Tank 241-BY-105 895 to Tank 241-SX-101 1297 to 298 F-3 Tank 24I-SX-103498 to F-3 Tank 241-SX-105298 to 598 F-3 Tank 241-SX-I02698 to 798 F-3 Tank 241-S-110 598 to 698 F-3 Tank 241-U-107 698 to 798 Tank 241-BY-105 798 to 898 F-4 Tank 241-TX-113998 to 599 F-4 Tank 241-TX-118 599 to 699
Calculated Data F-6
APPENDIX G - References
List of Figures
Figure 1 Relative Waste Aerosol Concentrations In Tank Head Space 8
List of Tables
Table 1 Summary Of Aerosol Estimation Methods Used Table 2 Summary Of RMCS Aerosol Data Table A-I Exhauster Operating Periods an Table A-2 NDA Data Table A-3 Concentrations And Aerosol Table B- 1 RMCS Exhauster Operating
B-5 Table 8-3 Concentrations And Aerosol Side of RMCS Exhauster B-6 Table C-l Operating Data for Tanks on Which Combustible Gas Monitor Filter Paper Data Were Used for RMCS Aerosol Calculations Table C-2 Combustible Gas Table C-3 Tank Head Spac Table C-4 Aerosol Table D-l Stack E Table D-2 RMCS Exhauster HEPA Filter Aerosol Test Data Table E-1 Tank Contents From TWINS Best Inventory Databa Table F-l Basic RMCS And Exhauster Operational Data
Table B-2 Dose Rate Data and Filter Cs
Table F-2 Tank Dimensional Data Head Space Volumes And Head Space Changeouts during RMCS F-8
ii
RPP-4826 Rev I
Glossary
ABCASH acfin CGM changeout
Ci core DF DOE EPA ERS exhauster g GEA head space HEPA housing kg mCi LFL NDA NISampT NOC PMCS PTE record sample RMCS W C S core RPP scfm segment specific activity TA TB TWINS TWRS
Automated Bar Coding of Air Samples at Hanford actual cubic feet per minute combustible gas monitor the replacement of air in a tank head space with a volume of air equal to the head space volume curie equal to 37Ei-10 disintegrationslsec a top to bottom (or until sampling is halted) collection of segments taken from a tank riser decontamination factor Department of Energy Environmental Protection Agency Environmental Release Summary (database) the exhauster used during RMCS on a tank gram gamma energy analysis the volume of air above the waste surface in a tank high efficiency particulate air the main body of the exhauster containing the filter media kilogram millicurie IE-3 Ci lower flammability limit non destructive assay National Institute of Standards and Technology Notice of Construction push mode core sampling Potential to Emit stack samples taken during RMCS to measure the radionuclides released to the atmosuhere rotary mode core sampling a core taken from a tank with one or more segments taken in RMCS mode River Protection Project standard cubic feet per minute an individual 19 inch long sample or group of samples taken which add up to 19 inches the concentration of a radionuclide in the waste on a mass basis normally in pCUg or mCig tots1 alpha total beta Tank Waste Information Network System Tank Waste Remediation System
averages are based upon the number of RMCS segments Washington State Department of Health
weighted average an average which is weighted based upon a given parameter in this document weighted
WDOH uCi microcurie IE-6 Ci
iii
RPP-4826 Rev I
EXPERIENCE WITH AEROSOL GENERATION DURING ROTARY MODE CORE SAMPLING IN THE HANFORD SINGLE SHELL WASTE TANKS
Summary
This document presents information on aerosol formation in tank head spaces during rotary mode core sampling (RMCS) in single shell waste tanks (SST) at the Hanford Site The mass of aerosols generated during RMCS has been very small The average mass of suspended waste solids present in an SST head space during RMCS was lt01 g The mass of suspended solids sent to an exhauster averaged ltOl g per RMCS segment and lt05 g per RMCS core The results are three orders of magnitude less than assumed in current accident analyses and environmental permit applications The measured decontamination factor (DF) for the RMCS exhauster housing exceeded 70000
Purpose
The purpose of this document is to present estimates based upon RMCS operating experience of the concentration and total mass of waste aerosols present in SST head spaces during RMCS and estimates of the mass of aerosols sent to the exhauster used on the tank This document also evaluates the performance of the RMCS exhausters and provides an estimate of the filter housing decontamination factor Revision 1 of this document is an extensive rewrite of Rev 0 and includes additional information not available when Rev 0 was issued
RMCS using a nitrogen purge gas to cool the bit and provide hydrostatic head pressure was performed between November 1994 and June 1999 All the available data relevant to aerosol formation during RMCS in SSTs was used for this study This document is not an evaluation of aerosol formation processes aerosol dispersion patterns within the tank head space aerosol settling rates or factors affecting removal of particulates from a tank When using the values given in this document to estimate maximum potential quantities released to an exhauster or to account for peak concentrations in a tank head space when evaluating potential accident scenarios engineering judgement should be used as deemed necessary to adjust the values given in this document for conservatism
Introduction
Core sampling is used to obtain 19 inch long samples of radioactive waste in the Hanford single shell waste tanks A 19 inch core sample is a segment A core is made up of all the segments taken as the drill bit passes through the waste A sample may he taken in push mode (PMCS) or rotary mode A segment taken in rotary mode is designated an RMCS segment and a core in which any RMCS segment is taken is designated an RMCS core RMCS is used for tanks in which the waste may be too hard to sample using other methods
Before 1994 core sampling was performed using different liquids that cooled the drill bit during RMCS and provided a hydrostatic head in the drill string during both RMCS and PMCS RMCS sampling was halted in 1990 over safety concerns with flammable gases and organic nitrates in the waste tanks The RMCS equipment was redesigned to a new process that used nitrogen gas to cool the cutting bit The nitrogen flow rate is approximately 30 to 40 scfm (085 to 11 m3min) during periods the drill string is rotating This gas passes through holes in the bit up through the waste and is released to the tank head space Tank head space volumes are in the 50000 to 100000 ft3 (1400 to 2800 mrsquo) range Since the nitrogen purge gas could result in aerosol formation in the tank vapor space an exhauster was included with the RMCS equipment redesign RMCS using the nitrogen purged process has been performed to date during the periods 1194 to 195795 to 1095 and 1297 to 699 From 1297 to 798 RMCS was performed in SX tank farm with the SX tank exhauster providing the ventilation In 94-95 and from 598 through 699 RMCS was performed in BY S U and TX tank farms using an RMCS exhauster
An estimate of the mass of aerosols sent to an exhauster during rotary mode core sampling is needed as a basis for the Potential to Emit (PTE) estimate in environmental permits for the exhausters employed during RMCS Estimates of tank head space mass concentrations and total suspended solids during RMCS are also used in certain accident analyses related to RMCS Since the bit rotation and gas sparging nature of RMCS have a higher potential for aerosol generation than many in-tank activities aerosols generated during RMCS may provide an estimate of the upper limit for the concentration of aerosols to be found in a tank head space during these activities
RPP-4826 Rev 1
There are two current (as of January 2000) Notices of Construction (NOC) approved by the Washington D e p m e n t of Health (WDOH) for exhauster use during RMCS The first WDOH permit is for Exhauster Systems 3 and 4 (referred to as Exhauster B and Exhauster C in this document) during RMCS in a tank that is normally passively ventilated (Reference NOC-3) The second WDOH permit (NOC-4) is for RMCS in SX tank farm using the SX exhauster The Environmental Protection Agency (EPA) has also granted approval for RMCS exhauster use in a tank that is normally passively ventilated (NOC-5) and for RMCS in SX farm with the SX exhauster (NOC-6)
Very conservative assumptions were made on RMCS aerosol quantities for the existing NOCs and safety basis accident analyses These assumptions were made since no operational data were available on aerosol levels when most of these NOCs and accident analyses were prepared WHC 1993 provided the initial estimate of aerosols sent to the exhauster during RMCS Based upon assumptions in this document a value of 1 kg of waste sent to the exhauster per RMCS core was used as the basis for the first two RMCS NOCs (NOC-I and NOC-2) This number was based upon drilling tests in drums of extremely hard and dry simulated saltcake The hard simulant was intended to present a limiting case for RMCS drill bit testing and was not physically representative of actual tank wastes This I kg per RMCS core estimate was modified to 77 g waste per RMCS segment when using the RMCS exhauster (NOC-3 and NOC-5) and 35 g per segment for RMCS in SX farm (NOC-4 and NOC-6)
A value of 600 g of waste in the tank head space was assumed in WHC 1997 for certain RMCS accident analyses This number was based upon earlier conservative assumptions on particulates generated during a large gas release event in Tank 241-101-SY A value of 100 g waste in the head space was used in an update ofthis RMCS accident analysis provided in a revision to the predecessor of HNF 1999 that has been submitted to the Department of Energy (DOE) for approval
After nitrogen-purged RMCS operations commenced in November 1994 it became obvious that the estimates of aerosol generation rates based upon WHC 1993 were very conservative This was evident from in-tank videos that showed very little dust formation and from the lack of any dose rate buildup on the in-tank prefilter (when used) or the exhauster HEPA filters An evaluation was begun in 1997 to use data obtained during or following RMCS operations to estimate actual aerosol generation rates and exhauster filter performance This document provides the results of that evaluation
Aerosol Estimation Methods
Dedicated particulate sampling methods such as employing sticky tapes to capture aerosols for microscopic evaluation or specially designed samplers were not used for this evaluation Funding and personnel were not available for an in-depth study nor was such a study necessary Aerosol quantities were estimated using the best data available from existing sources associated with RMCS (housing dose rates CGM filter papers stack record samples) or easily obtained additional data (housing NDA) Three separate methods were used to provide estimates of the aerosols present in the tank head space or sent to the exhauster The first method used non destructive assay (NDA) of RMCS exhauster filter housings to estimate particulates captured on the filters The second method used the RMCS exhauster HEPA filter dose rates following completion of a core to estimate the mass of waste on the filters The third method estimated the tank head space aerosol concentration based upon analytical data from filter papers located upstream of combustible gas meters (CGMs) employed during RMCS A CGM draws air out of a tank headspace at a constant flow rate during RMCS to monitor for flammable gases
It was not possible to utilize any single method of estimating aerosol quantities for all RMCS sampling events For some sampling events not all data types were available or if available were not useful Reasons for the data not being useful include no RMCS segments taken during the time period evaluated analytical data being below background levels or having an analytical variance gtloo or (for SX tank farm) other tanks being exhausted in parallel or series with the tank being core sampled All calculations conservatively assumed that the background radionuclide concentration in a tank head space was zero and that all radionuclides detected by one of these methods were due solely to RMCS activities
Table 1 lists the RMCS sampling events which provided the data for this document the exhauster that was in service the aerosol estimate methods used for that event and the number of RMCS cores and segments obtained
L
RPP-4826 Rev 1
during the sampling method The data in this document were obtained during RMCS in eleven separate tanks A total of 23 RMCS cores containing 11 5 RMCS segments were obtained The aerosol estimation methods are summarized below
RMCS Exhauster Housing NDA Appendix A describes NDA of RMCS exhauster housings after they were used during RMCS operations from 598 through 699 Gamma assays of the housings were performed to measure the Csrdquorsquo on the prefilter primary HEPA filter and secondary HEPA filter The quantity of Csrdquorsquo present on each was estimated by comparison with the Csrdquorsquo count rate from a known standard measured in an equivalent geomeby The quantity on all three filters was summed to estimate the total in the housing The mass of particulates was obtained by dividing the quantity of present by a weighted average of the Csrdquorsquo concentration of the wastes in the tanks being exhausted With this data average tank head space mass concentrations were calculated as well as the mass per core and per segment sent to the exhauster The mass of waste in a tank head space was calculated by multiplying the tank head space concentration by the tank head space volume A summary ofthe results is given in Table 2 The detailed results are given in Table A-3
RMCS Exhauster HEPA Dose Rate Data Appendix B describes using RMCS exhauster dose rate data to estimate aerosol quantities The dose rate at the ed e of the HEPA filter housing is used to estimate a quantity of Csrdquorsquo on the filter Dividing the quantity of Cs on the filter by a weighted average of the Csrdquorsquo concentration in the wastes of the tanks being exhausted provides the waste mass on the filters With the waste mass known tank head space mass Concentrations can be calculated as well as the mass per core or per segment sent to the exhauster The mass of waste in a tank head space was calculated by multiplying the tank head space concentration by the tank head space volume A summary of the results is given in Table 2 The detailed results are given in Table B- 3 The minimum detection ability ofthe dose rate instruments used is 05 m m r Most RMCS exhauster dose rates following completion of an RMCS core were less than detectable An exhauster housing registered slightly above the minimum detectable limit at 07 mRhr after core sampling on S-l IO U-107 BY-IO5 and TX-I 13 This housing read 08 mRhr after completion of sampling on the next tank TX-I 18
CGM Filter Paper Analyses Appendix C describes using CGM filter paper analytical data to estimate aerosol quantities The filter papers are inserted in-line in front of a CGM where they catch the radionuclides in the tank vapors drawn into the CGM These filter papers were removed and analyzed starting in 1997 For conservatism only sample results with a variance 400 were used These analytical data were divided by the specific activity of the radionuclides present on the filter paper for the tank on which the CGM was being operated This provides an estimate of the aerosol mass concentration in the tank head space since a particulate sample is drawn directly from the tank head space during RMCS With this data the mass of waste in the head space and the mass per core and per segment sent to the exhauster can be calculated The mass of waste in a tank head space was calculated by multiplying the tank head space concentration by the tank head space volume A summary of the results is given in Table 2 The detailed results are given in Table C-4
IF1
RMCS Exhauster Decontamination Factor Estimation Method
The RMCS exhauster filter housing DF was calculated by comparing stack record sampler data with the housing NDA data to calculate an efficiency for the housing The housing contains a prefilter and two HEPA filters in series Table 1 lists the RMCS sampling events which provided the data for estimating the DF
Housing NDA and Record Sample Data Comparison Appendix D uses RMCS exhauster stack record sample data to estimate stack Csrdquorsquo emissions for the same time periods when NDA data were obtained The stack emissions were used with the NDA data to calculate a filter housin DF The only radionuclide shown as present by the NDA was Csrdquorsquo No stack record samples showed Cs were available for seven of the nine stack record samples taken during the time NDA data were obtained For the remaining two samples conservative assumptions were made as to the stack total beta concentration
139 present above detection limits However total beta results above minimum detection limits
3
RPP-4826 Rev I
Stack total beta emissions were converted to CsrsquoI7 emissions using the C S rdquo ~ to total beta ratio for the waste in the tank being sampled The filter housing input was calculated by adding this calculated Csrdquorsquo emission to the quantity shown by NDA to be in the housing Dividing the emissions by the input provided the penetration efficiency Results of the housing efficiency and decontamination factor calculations are provided in Table D-I
Discussion of Results
All calculations were based upon radionuclides measured on the exhauster filters in the tank head space air or in the exhauster stack These radionuclide quantities were divided by the specific activity of waste in the tank to provide mass quantities in the air on the filters or in the exhaust stream Appendix E provides the waste specific activities used in this document along with limitations and potential errors associated with using them
The calculated average mass concentration in a tank head space during RMCS ranged from a low of 77E-6 gm3 based upon exhauster housing NDA data to a high of 4OE-5 gm3 based upon CGM filter paper data The weighted average of all methods was 24E-5 gm Welghted averages used in this document were based upon numbers of RMCS segments obtained during application of that method
The average mass concentration is not the peak concentration as illustrated by Figure I Figure 1 is a representation of relative concentrations only not a plot of measured concentrations during a specific sampling event Lines A and B represent aerosol concentrations at points near the drill string and at the tank outlet to the exhauster respectively Line C represents the calculated average concentration in the tank head space The peak concentration in the air to the exhauster will exceed the average tank head space concentration for short periods oftime It is beyond the scope of this document to provide a detailed spatial and time-dependent analysis of tank aerosol concentrations The methods used in this document provide an estimate of an average tank head space mass concentration only
The average mass of suspended solids in a tank head space was estimated by multiplying the average head space mass concentration by the tank head space volume The calculated average mass of suspended solids in a tank head space during RMCS ranged from a low of I 8E-2 g based upon exhauster housing NDA data to a high of 97E-2 g based upon CGM filter paper data The weighted average of all methods was 56E-2 g Comparing 56E-2 g to the 600 g and 100 g used in accident analysis assumptions it is evident that the accident analyses used peak tank head space mass levels three to four orders of magnitude greater than the average mass level in a tank head space during RMCS
Multiplying an average concentration by the tank head space volume to estimate the mass of suspended solids in the tank head space at a given time makes the simplifying assumption that the tank head space concentration is constant with time and uniform within the head space during RMCS As illustrated by Figure I the tank head space concentration is not constant with time or uniform within the head space When determining a maximum value for mass of solids in a tank head space engineering judgement needs to be applied that evaluates all the parameters involved that could increase or decrease the average mass value provided in this document With all other variables being equal the mass concentration and mass of suspended solids in a tank head space will also be affected hy the volume of the head space and the exhaust flow rate The head space volumes of the tanks sampled to date are typical of SSTs The exhauster flow rate is not expected to change for the RMCS exhauster If additional samples are taken in SX tanks where the exhauster flow rate is higher than in the four SX tanks which have already been sampled the mass present in the tank head space would be expected to be reduced
The calculated mass of waste sent to an exhauster ranged from lows of 18E-1 gRMCS core and 34E-2 W C S segment based upon CGM filter paper data to highs of 59E-I gRMCS core and 1OE-1 gRMCS segment based upon exhauster housing dose rate data The weighted average of all methods was 42E-1 gRMCS core and 69E-2 gRMCS segment Comparing the average to the 1 kgRMCS core and 35-77 glRMCS segment numbers used for the PTE estimates it is evident that the PTE estimates are conservative by at least three orders of magnitude
Results given in this document based upon total beta or Csrsquordquo data are likely more valid than alpha based results due to the higher concentrations of beta-gamma radionuclides in the waste and their greater ease of measurement when
4
RPP-4826 Rev 1
compared to alpha emitters Equal weight is given to all results regardless of whether based upon total al ha total beta or CsI3rsquo data This provides conservative results since the aerosol values based on total beta or CslfPwere normally lower than those based upon alpha results
The mass per segment numbers should be a better indicator of RMCS aerosol emissions from the tank than the mass per core numbers This is because the quantity of aerosols generated in a tank should be proportional to the time of purge gas flow and bit rotation The time of purge gas flow and bit rotation should be proportional to the number of RMCS segments taken Thus the mass of RMCS generated aerosols sent to an exhauster on a given tank should be roughly proportional to the number of RMCS segments obtained from the tank The number of RMCS segments in a core can vary To date the range has been from 1 to 12 RMCS segments per RMCS core The average has been 5 RMCS segments per RMCS core
The results for mass per core or per segment based on NDA and housing dose rate data have a firmer basis than results based upon CGM filter paper data This is because the RMCS exhauster housing NDA and dose rate methods are a direct physical measurement of essentially all the Csrsquordquo released to the exhaust stream during RMCS Aerosol measurements based upon HEPA dose rate are conservative as the filters showed no detectable dose rate for three of the five periods evaluated and barely perceptible readings after the other two
The results for tank head space concentrations and mass of waste in a tank head space during RMCS based on CGM filter paper data have a firmer hasis than results based on housing NDA or dose rate This is because the CGM filter paper data is a direct measurement of the concentration in the air in a tank head space during the time when aerosols are being generated The CGM filter paper data should provide a higher tank head space mass concentration than that calculated by filter housing NDA or dose rate This is because aerosols are only generated during times when the CGM is operating and the CGM operates for less time than the exhauster does Since the concentration is based upon dividing a filter quantity by the volume of gas passing through the filter the volume of gas in proportion to the material on the filter will be less for the CGM filter paper than for an exhauster filter resulting in a higher concentration based on CGM filter paper data A factor is included in the CGM based concentration to account for radionuclides in the dome space that have not settled out or been removed by the exhauster when the CGM is shut Off
The average results for all methods were within reasonable agreement with each other considering all the variables and assumptions involved The filter housing DF is in good agreement with expected values
This document contains seven appendices Appendices A-C provide particulate results based upon RMCS exhauster housing NDA RMCS exhauster housing dose rates and CGM filter paper data Appendix D provides an RMCS exhauster filter housing DF based on housing NDA and stack record sample data Appendix E provides waste specific activities and Appendix F provides the raw data used in Appendices A-D Appendix G provides references for this document
Conclusions
The results in this document are based upon RMCS operating experience from startup of nitrogen-purged RMCS in November 1994 through June 1999 Table 2 summarizes the information presented in the appendices Based upon this information and the lack of any significant aerosol formation seen in in-tank videos it can be concluded that past estimates of aerosol concentrations used for regulatory permits and accident analyses were conservative by a nominal three orders of magnitude
In order to estimate mass releases for regulatory permits the overall emissions with time are needed as a basis for the PTE estimates For future permits the mass per core or mass per segment values in Table 2 can be used directly with conservatism added if deemed appropriate for the tanks to be sampled When estimating maximum concentrations or maximum mass quantities in the tank head space for use in accident analyses additional conservatism needs to be added to the average concentration and mass values in Table 2
5
RPP-4826 Rev I
Tank and Date Sampled
Table 1 Summary Of Aerosol Estimation Methods Used
RMCS Aerosol Estimation Methods Exhauster Number of Used
Housing DF RMCS Cores Riser Used Period6 HEPA CGM NDA and and RMCS
Exhauster Operating Sample Exhauster
NDA Dose Filter RMCS Stack Segments Taken
BY-IO5 1998
No RMCS segments taken from BY-108 or from TX-I 13 Riser 3 using Exhauster B Any material retained on I
the filters during these operating times was assumed to come from next RMCS sampling event with the same exhauster BY-IO5 in 1998 shown as separate exhauster installations since stack record samples were pulled after each riser was sampled
Includes RMCS cores and segments only PMCS cores and segments obtained during exhauster operation not included A total of 23 RMCS cores and 115 RMCS segments were taken between 1194 and 699 The sum of cores and segments is less than sum of cores and segments obtained during data collection periods at lei since more than one aerosol estimation method was used for some sampling periods
One CGM filter paper was used for both cores in SX-102 and for both cores in U-107 3
See Appendix F for explanation of exhauster operating periods
6
RPP-4826 Rev I
Table 2 Summary Of RMCS Aerosol Data
Weighted average based upon number of RMCS segments taken with each method
7
e
Q 0 c 0 0 - 0 VJ 0 L
2
RFP-4826 Rev 1
APPENDIX A
ESTIMATION OF AEROSOLS GENERATED DURING Rh4CS BASED UPON RMCS EXHAUSTER HOUSING NON-DESTRUCTIVE ASSAY
A-0
RPP-4826 Rev I
APPENDIX A - Estimation Of Aerosols Generated During RMCS Based Upon RMCS Exhauster Housing Non-Destructive Assay
Summary of Method
This method of estimating RMCS aerosol quantities uses non-destructive assay (NDA) of the exhauster housing to determine the C S rdquo ~ quantity (Ci) on the filters inside This quantity is then divided by the C S rdquo ~ specific activity (Cig) in the waste for the tank(s) on which the exhauster and the same filters were present during sampling The resulting mass on the filters divided by the volume of air flowing through the exhauster provides an estimate of the average aerosol mass concentration in the air to the exhauster This value was multiplied by the tank head space volume to obtain the average mass of particulates present in the tank head space during RMCS The mass of waste on the filters divided by the number of rotary cores or segments taken provides the mass per core or per segment sent to the exhauster
Description
There are one prefilter and two HEPA filters in series for each RMCS exhauster Particulates captured on the filters contain radionuclides with C S rdquo ~ bein the predominant gamma emitter By performing an NDA of the exhauster housing filters the quantity of Cslg7 in the housing can be estimated This C S rdquo ~ value is then used to back-calculate to a waste mass on the filters using the mass is used to calculate the concentration of particulates in the tank exhaust stream the total suspended solids in the tank head space and the mass of waste sent to the exhauster for each RMCS core or segment taken
Exhauster operations were divided into six operating periods for evaluation in this document These periods are discussed in Appendix F and shown in Table F-I NDA data were obtained for Exhauster Operating Periods 4 5 and 6 Relevant information for these periods is also listed in Table A-I
Period 4 was for Exhauster C use during RMCS for both cores in S-l IO U-107 BY-IO5 and the first core in TX-I 13 The filters and housing were new prior to RMCS in S-110 No filter changeouts were made during this period the accumulated particulates from these RMCS events were retained on the housing prefilter primary HEPA and secondary HEPA
Period 5 was for Exhauster B use during RMCS for the second core in TX-I 13 The filters and housing were new prior to RMCS in TX-113 No filter changeouts were made during this period Exhauster B also ran for a short time during the first core in TX-113 but no RMCS segments were taken when the exhauster was operating Stack record samples (see Appendix D) indicated small levels of aerosols were present in the stack exhaust during this time period Any material collecting on the filters during this time period would show up and be counted as part of the aerosols generated during the 2rdquod RMCS core
Period 6 was for Exhauster C use during RMCS for both cores in TX-I 18 During Period 6 the filters also contained the waste particles from Period 4 No filter changeouts were made durin this period The aerosol mass generated due to RMCS in TX-I 18 was determined from the increase in Cs on the filters between Period 4 and Period 6
A description of the sampling method used for the NDA obtained following Period 4 is provided in Greager 1999 The same method was used for the NDA following Periods 5 and 6 The NDA consisted of a gamma energy analysis of the exhauster housing performed at points adjacent to the prefilter first HEPA and second HEPA The detector was mounted outside the housing and inside a lead collimator The collimator was used to minimize the background count rate and contribution from adjacent filters CsIh was the only radionuclide reported as present The NDA compared the count rates from the exhauster housing with the count rate of an National Institute of Standards and Technology (NISampT) traceable in an equivalent geometry to the RMCS exhauster housing The count rates from housing filter readings were divided by the count rate for the source to give a reported quantity of Cslrdquo on the filters
concentration in the tank waste This filter waste
3 B
source located in the middle of a filter
A- 1
RPP-4826 Rev 1
Two correction factors were applied to the reported filter Csrdquorsquo values for use in this document These are discussed in the following two sections
Reported NDA Data
The NDA results for Period 4 are provided in Greager 1999 The only radionuclide reported as present on the filters was CsI3rsquo The results are restated in Table A-2
The NDA results for Periods 5 and 6 are provided in Diedeker 1999 The only radionuclide reported as present on the filters was Csrdquorsquo The results are restated in Table A-2
Adjusted NDA Data
The reported results are based upon comparing the count rate for a reference point source located in the middle of a mock-up assembly equivalent to the exhauster housing with the count rate from the same detector inside a lead collimator placed outside the actual exhauster housing Limitations with this method include comparison of a point source with a distributed matrix and the inability of the detector to see the entire filter due to the presence of the collimator Correction factors were used to adjust the reported values to account for these two limitations
The first correction factor accounts for comparing a distributed source to the point source standard The reported results were calculated based upon a point source standard since there are no readily available filter standards with a distributed source The material in the filter housing should be fairly evenly distributed through the filter media however so comparing count rates for the filter housing to a point source standard will result in some error To correct for this error shielding calculations were performed on an exhauster housing filter assuming the CSrdquorsquo was evenly distributed throughout the filter media and then again assuming the activity was a point source in the middle of the filter Foust 1999 provides the results of these Microshield dose rate calculations Using the data in Foust 1999 Schofield 2000a shows that the dose rate at the NDA detector location would be about 0625 mFVhrmCi CSrdquorsquo for a point source and 073 mRhrmCi Cslrdquo for a distributed source To adjust the reported NDA results to what they would have been if an actual distributed standard source was available the reported values need to be multiplied by 0625 + 073 = 086
The second correction factor accounts for the detector not being able to see the entire filter contents due to the detector location inside the lead collimator Using basic geometry Schofield 2OOOa estimated the detector has about a 100 view of 608 of a HEPA filter about a 50 view of 264 of the filter and is shielded from the remaining 128 The detector count rate was thus estimated as being approximately 741 o f what it would be if the detector were not collimated To correct the reported results to what they would have been if an uncollimated detector could have been used the reported values need to be multiplied by I + 0741 = 135
Combining the two correction factors gives a single adjustment factor used of 086 x 135 = 116 Per Table A- 2 the total quantity of Csrdquorsquo reported present in the housing for Period 4 was 0430 mCi This quantity was multiplied by 116 to give 050 mCi Csrdquorsquo The reported results for Periods 5 and 6 were revised in the same manner to give 0032 mCi and 064 mCi C~rsquo~rsquorespectiveIy To determine the net increase in Csrdquorsquo for the housing during Period 6 the value from Period 4 was subtracted from the total or 064 - 050 = 014 mCi Csrdquorsquo
Calculation of Mass Quantity on Filters
Calculation of the mass of waste on the filters requires knowledge of the specific activity of the waste on the filters The specific activities used for each exhauster operating period are given in Table A-I The paragraphs below provide a derivation of the specific activities used
The specific activity values for the waste in each tank sampled is given in Table E-I Rh4CS was performed on more than one tank during Period 4 so a weighted average specific activity was used to calculate the waste mass on the filters during this period The weighted average specific activity was calculated based upon the number of RMCS segments taken from each tank sampled The number of RMCS segments obtained during
A-2
RPP-4826 Rev 1
each period for which NDA measurements were made are listed in Table A-I These values were obtained from Table F-I A weighted average specific activity for the waste on the filters in Period 4 was obtained by
[[O 227 mCigl[lO segl+[Ol2lmCigl[lO seg1+[0225 mCigl[l(l seg]+[Ol30 mCig][l2 seg]]+[SO segments] = 0182 mCi Csrdquorsquog
Calculating a weighted average based upon the number of segments assumes aerosol generation is roughly the same per segment and the specific activity of a radionuclide is constant throughout a tank These assumptions are adequate for the purpose oftbis document Aerosol generation can vary with water content waste hardness depth of sample taken nitrogen flow rate and porosity of the waste An in-depth evaluation of these parameters is beyond the scope of this document The impact of these variables is assumed to average out over all the RMCS segments taken The specific activities used do not vary greatly from tank to tank so any variations will not have a significant impact on the final aerosol results See Appendix E for further discussion of limitations on specific activities used in this document
For Period 5 the filters were new at the start and the only tank sampled with the exhauster was TX-I 13 Therefore the specific activity of CsI3rsquo for TX-I 130130 mCig was used
The same exhauster and filters used for Period 4 were used for Period 6 The net increase in Csrdquorsquo for Period 6 was determined by subtracting the Period 4 Csrdquorsquo from the total Since this net increase was only due to TX- 118 the specific activity of Csrdquorsquo for TX-I 180130 mCig was used for the waste added to the filters in Period 6 (Note it is only a coincidence that TX-I 13 and TX-118 have the same nominal Csrdquorsquo concentration)
The total mass of waste on the filters for Period 4 was thus
050 mCi i 0182 mCig waste = 275 g waste in exhauster housing
The mass of waste added to the exhauster for Period 5 was
0032 mCi + 0130 mCig waste = 025 g waste in exhauster housing
The mass of waste added to the exhauster for Period 6 was
(064 mCi - 050 mCi) + 0130 mCig waste = 11 g waste in exhauster housing
Aerosol Calculations
The tank head space particulate concentration was obtained by dividing the mass of waste sent to the exhaust stream by the volume of air sent to the exhauster The volume of air to the exhauster was obtained by multiplying the exhauster flow rate by the exhauster run times for each tank from Table F-I
For the RMCS exhausters the recorded exhauster flow rate is reported in standard cubic feet per minute (scfm) The RMCS exhauster flow rate is controlled to a nominal 200 scfm The exhauster flow rate was corrected to an actual cubic feet per minute (acfm) before calculating the tank head space aerosol concenmtion Table F-l includes the actual cfm flow rates
The calculated flow rates during RMCS for the tanks sampled during Period 4 were 207 acfm (S-1 lo) 206 acfm (U-107) 208 amp 209 acfm (BY-105) and 203 acfm (TX-I 13) The total volume oftank air through the exhauster during Period 4 was thus
[[207 cfm][ 15978 hr]+[206][27385]+[208][13577]+[209][30792]+[203][30230]][60 minh] = 146 E+7 Arsquo
The average tank head space mass concentration during RMCS in the above tanks was
[275 g + 146 E+7 Arsquo] x [35315 ftrsquomrsquo] = 664 E-6 average g waste per m3 in exhauster inlet
A-3
RPP-4826 Rev I
The gas flow rates and average tank head space mass concentrations during RMCS for Periods 5 and 6 were calculated in a similar manner
The average mass of waste in a tank head space during RMCS was calculated by multiplying the tank head space mass concentration by the tank head space volume from Table F-2 as shown below for S-1 I O
[275 g + 146 E+7 Arsquo] x [89100 ftrsquo] = 167E-2 g waste in S-1 IO head space
The particulate quantities in the other tank head spaces were calculated in a similar manner The weighted average mass in a tank head space during Period 4 was based upon the number of segments taken in each tank
The mass sent to the exhauster per RMCS core or per RMCS segment was obtained by dividing the mass of waste sent to the exhaust stream during each period by the numbers of RMCS cores or RMCS segments obtained during the exhauster operating time The average mass of waste sent to the exhauster during Period 4 is thus
275 g waste + 7 rotary cores = 39E-1 g wastelrotary core
and
275 g waste + 50 rotary segments = 55E-2 g wasteirotary segment
The mass of waste to the exhauster per RMCS core and RMCS segment for Periods 5 and 6 were calculated in a similar manner
All data were input to a spreadsheet to perform the calculations Results are provided in Table A-3
Summary of Calculations
Non Destructive Assay was performed on the RMCS exhauster filter housings used during three separate exhauster operating periods during which IO RMCS cores and 65 RMCS segments were obtained from five tanks Weighted averages of the average tank head space mass concentration average mass of suspended solids in a tank head space and average mass sent to the exhauster per RMCS core or segment for the three periods combined were calculated based upon the number of RMCS segments taken during each period Based upon RMCS exhauster housing NDA data the results indicate that
The average tank head space mass concentration during RMCS was 77E-6 g wastelmrsquo The average mass of suspended solids in the tank head space during RMCS was 18E-2 g waste The average mass sent to the exhauster during RMCS was 52E-1 g wastelcore The average mass sent to the exhauster during RMCS was 63E-2 g wasteisegment
A-4
RPP-4826 Rev 1
APPENDIX B
ESTIMATION OF AEROSOLS GENERATED DURING RMCS BASED UPON Rh4CS EXHAUSTER HEPA FILTER DOSE RATES
B-0
RPP-4826 Rev I
APPENDIX B - Estimation Of Aerosols Generated During RMCS Based Upon RMCS Exhauster HEPA Filter Dose Rates
Summary of Method
This method of estimating RMCS aerosol quantities divides the dose rate increase (mRhr) at the side of the RMCS HEPA filter housing by a calculated dose conversion factor (mRhrmCi C S rdquo ~ ) to obtain an approximation of the radionuclide quantity in the housing This radionuclide quantity is divided by the waste specific activity (mCig) to determine the mass of waste on the HEPA filter Dividing the HEPA filter waste mass by the volume of air passing through the filter provides an estimate of the average tank head space particulate concentration during RMCS Multiplying the average tank head space particulate concentration by the tank head space volume gives an estimate of the average mass of suspended particulates in the tank head space during RMCS Dividing the HEPA filter waste mass by the number of RMCS cores or RMCS segments provides the mass per RMCS core or per RMCS segment sent to the exhauster
Description
Particulates in the exhaust stream are removed by the HEPA filter(s) upstream of the exhaust fan The captured particulates contain radionuclides with CSrsquo~rsquo being the predominant gamma emitter As the particulate quantity on the HEPA filter increases the dose rate at the side of the filter housing will increase proportionately By monitoring the HEPA dose rate at the side of the filter housing the quantity of Csrsquordquo on the HEPA can be estimated This C S rdquo ~ value is then used to back-calculate to a waste mass quantity on the filter using the Csrsquordquo concentration in the tank waste This filter waste mass quantity is used to calculate the concentration of particulates in the tank exhaust stream the total suspended solids in the tank head space and the mass of waste sent to the exhauster for each RMCS core or segment taken Although radionuclides will be trapped on both the prefilter and the primary HEPA filter with a very small amount on the secondary HEPA calculations in this section were based upon the simplifying assumption that all the activity was on the primary HEPA filter
During RMCS exhauster operation the dose rate in m M r at the side of the HEPA filter housing is periodically measured with an Eberline RO-3B per procedure to indicate when radioactive particulates are building up on the filter The limit of detection of the RO-3B is 05 mRhr
Exhauster operations were divided into six operating periods for evaluation in this document These periods are discussed in Appendix F and shown in Table F-I Housing dose rate data were obtained for Exhauster Operating Periods I 24 5 and 6 Relevant information for these periods is also listed in Table B-I Dose rate data are available and were used for all tanks on which an RMCS exhauster was present and RMCS samples were taken This includes BY-106 BY-IO5 (1995) BY-I IO S-l I O U-107 BY-IO5 (1998) TX-113 and TX- 1 18 The dose rate at the end of a period was used as the basis for calculating radionuclides on the filters The only operating period for which dose rate data were not used for estimating filter radionuclide content was Period 3 Period 3 was for RMCS in SX farm using the SX exhauster
The dose rate at the side of the SX exhauster HEPA filter housing was measured during RMCS of SX farm tanks (for sampling of tanks SX-lot SX-102 SX-103 and SX-105) but the data are not useful for estimation of aerosol quantities because the SX exhauster draws on 13 tanks in parallel or in series with the tank being core sampled Many of the tanks have a much higher off gas flow rate than the sampled tank In addition there is background radiation in the area of the SX exhauster filter housing making any increase in the housing dose rate during RMCS difficult to detect
Dose Rate Data
The dose rate data for each period is listed in Table 8-2 No dose rates above minimum detectable limits were evident at the sides of any RMCS exhauster in Periods I 2 and 5
Dose rate measurements were less than detectable for Period 4 during sampling of S-l IO and U-107 When sampling on BY-IO5 there were a few readings of 07 m M r but most were ltOS mRhr This variation in
B- 1
RPP-4826 Rev 1
readings is to be expected as the specific instrument person using the instrument and location at which the dose rate is checked can vary with time The final recorded dose rate when sampling was complete on BY-IO5 was lt05 mRhr At the end of Period 4 following completion of the first core in TX-I 13 Exhauster C was listed as having a 07 m M r dose rate
Period 6 used Exhauster C again with the same housing and filters as at the end of Period 4 The final dose rate for this period was 08 m M r
Periods 124 and 5 all began with a new housing and new filters For Periods 12 and 5 it was conservatively assumed that the final dose rate was equal to 05 m M r giving an increase of 05 mRhr for each of these periods For Period 4 the dose rate increase was 07 m M r for this period Since Period 6 used the same housing and filters as Period 4 the increase for Period 6 was 08 - 07 = 01 m M r
The dose rate increase was converted into a CsIh content on the primary filter for each period Foust 1999 provides various dose rates for an RMCS exhauster housing assuming even dispersal of 1 mCi C S rdquo ~ on the first HEPA filter Using these calculations Schofield 2000a estimated a dose rate conversion factor of 16 mRhrmCi C S rdquo ~ at the detector location for an RO-3B The assumption that radionuclides are evenly distributed on the HEPA is a reasonable assumption based upon the exhauster design and the method used to measure the radiation dose rate
Gamma emitting contribute to the dose rate due to bremsstrahlung radiation and other nuclides may provide some small additional dose but the major penetrating dose rate contributor in aged SST waste is CSrdquo~ Ignoring the presence of all radionuclides (including Srm) except C S rdquo ~ in calculating a HEPA filter waste mass will provide a conservative result This is because assuming all radiation present is due to C S rdquo ~ will result in overestimating the C ~ I ~ ~ c o n t e n t of the filter housing which in turn will result in overestimating the waste mass on the HEPA filter
Dividing the HEPA dose rate for each exhauster installation by the dose conversion factor of I 6 mRhrmCi results in an increase of 031 mCi Csrdquorsquo on the RMCS exhauster filters for Periods I 2 and 5044 mCi for period 4 and 0063 mCi for Period 6
Calculation of Mass Quantity on Filters
Dividing the Csrdquorsquo content of the filters by the specific activity of C S rsquo ~ ~ in the waste gives the estimated mass of waste sent to the exhauster The specific activity value used for the waste in each tank sampled is given in Table E-I Since RMCS was performed on more than one tank in Periods 1 and 4 a weighted average specific activity was used for these periods The weighted average specific activity was calculated based upon the number of RMCS segments taken from each tank sampled during that period The number of RhKS segments obtained during each period are listed in Table B-I These data were obtained from the individual tank data in Table F- I Calculations to estimate the specific activity of waste mixtures were performed in the same manner as shown in Appendix A For Periods 2 5 and 6 RMCS samples were taken in only one tank The waste specific activity used for these periods was the specific activity of the tank sampled The specific activities used for each exhauster operating period are given in Table B-I
For all exhauster installations except BY-IO6 in 1994 and 1995 the RMCS exhausters were hooked directly to the waste tank When sampling BY-106 a prefilter was installed in the tank riser between the tank and the exhauster The prefilter was not used for BY-I IO in Period 1 or for any other tank in any other period Thus for Periods 2 4 5 and 6 the mass of waste on the HEPA was assumed equal to the mass of waste leaving the tank risers For Period 1 the mass of waste on the HEPA had to be adjusted for the BY-106 prefilter DF when estimating the combined mass of waste leaving the BY-IO6 and BY-I IO tank risers The mass of waste on the HEPA for Period 1 was
[031 mCi] [IO00 pCimCi] = 310 pCi
[310 pCi Csrdquorsquoon HEPA] + [I77 pCi C S rdquo ~ ~ waste] = 177 gwaste on HEPA
is the predominant radionuclide contributor to filter dose rates Beta emitting Srw can
on HEPA
B-2
RPP-4826 Rev 1
A decontamination factor (DF) of 5 was used to account for radionuclide removal by the BY-IO6 prefilter (see Appendix D for basis ofprefilter DF) There were 1 1 RMCS segments taken from BY-IO6 and 13 from BY- 1 IO The total mass ofwaste assumed to exit the tank risers was therefore
[ I 77 g waste] [ 1 1 + 131 [[I 151 + 131 = 28 g waste from tank risers
The DF of 5 to account for the prefilter is only applicable to the RMCS of BY-IO6 in 1994 and 1995 for all other exhauster periods the mass of waste on the HEPA was equal to the mass of waste sent to the exhauster riser
The mass of waste sent to the exhauster for Period 2 was
[031 mCi] [IO00 pCimCi] = 310 pCi Csrdquorsquo on HEPA
[3 IO pCi C S rdquo ~ on HEPA] + [225 pCi CsiI7g waste] = I 39 g waste from tank
Using the same formula the mass of waste to the exhauster from Periods 4 and 5 was 241 and 240 g respectively and the increase in waste on the filters for Period 6 was 048 g
Aerosol Calculations
The mass sent to the exhauster per RMCS core or per RMCS segment was obtained by dividing the mass of waste leaving the risers by the number of RMCS cores or RMCS segments obtained during the exhauster operating period
The tank head space particulate concentration was obtained by dividing the mass of waste leaving the riser by the volume of gas sent to the exhauster This volume of gas sent to the exhauster was obtained by multiplying the exhauster flow rate by the exhauster run time from Table F-I The calculations for aerosols generated based upon HEPA dose rates use acfm while the exhauster flow is recorded in scfm so the actin flow rates in Table F- 1 were used
The average mass of aerosols in the tank head space was obtained by multiplying the average tank head space particulate concentration by the tank head space volume from Table F-2
Following is an example of how the mass per RMCS core mass per RMCS segment average tank head space mass concentration and average mass of aerosols in the tank head space were calculated for Period 1 Data used are from Tables E-I F-I and F-2
[200 scfm] [2992+2916] [84 + 4591 + 528 = 21 1 acfm to exhauster from BY-IO6 in 11-1294
using same formula results in 210 acfm for BY-IO6 in 195 and 209 acfm for BY-I IO
28 g waste + [((21 1 acfm)(4878 hr)+(21O)(l867)+(209)(1125))(60 minhr)]= 12E-6 g wastelf to risers
[12E-6 amp] [35315 fmrsquo] =43E-5 g wastemrsquoto risers
[12E-6 gftrsquo] [53700 Arsquo in BY-106 head space] =66E-I g waste in BY-IO6 head space during RMCS
[12E-6 piftrsquo] [92000 ftrsquo in BY-110 headspace] = IIE-l g waste in BY-I10 head spaceduring RMCS
[28 g waste] [5 RMCS cores] = 56E-1 g waste per core to riser
[28 g waste] + [24 RMCS segments] = 12E-1 g waste per segment to risei
8-3
RPP-4826 Rev 1
All data were input to a spreadsheet and the mass to exhauster per RMCS core mass to exhauster per RMCS segment average tank head space mass concentration and average mass of aerosols in the tank head space were calculated for each of the RMCS exhauster operating periods in the same manner as shown above Results are given in Table 8-3
Summary of Calculations
RMCS exhauster operations were segregated into five operating periods during which RMCS was performed The Exhauster B data for BY-IO8 and TX-I 13 riser 3 was not used in these calculations as no RMCS was performed when the exhauster was operating Exhausters were operated in seven tanks during which 16 RMCS cores and 92 RMCS segments were obtained Based on RMCS filter housing dose rate data the results indicate that
These values are conservative as the assumed dose rate at the end of RMCS for Periods I 2 and 5 was assumed to be 05 mRhr In addition using a DF of 5 for the BY-IO6 prefilter skews the results high The in-tank prefilters used in both BY-IO6 sampling events showed no detectable contamination
Operatin Periods 4 and 6 were the only periods with exhauster housing dose rates above detectable The 044 mCi Csrsquordquo and 0063 mCi CsIh increase on the filters for these two periods based upon dose rate data correspond to the 050 mCi CsI3rsquo and 014 mCi Csrdquorsquo increase on the filters for these two periods based u on NDA data (see Appendix A) The 031 mCi C S rdquo ~ for Period 5 is significantly above the 0032 mCi Cslrsquolsquofor the same period determined by the NDA but this is due to assuming the housing dose rate was equal to the minimum detectable 05 mRhr
The average tank head space mass concentration during RMCS was 22E-5 g wastem3 The average mass of suspended solids in the tank head space during RMCS was 47E-2 g waste The average mass sent to the exhauster during RMCS was 59E-1 g wastelRMCS core The average mass sent to the exhauster during RMCS was 1OE-1 g wastelRMCS segment
B-4
v m
__ ~~
RPP-4826 Rev 1
APPENDIX C
ESTIMATION OF AEROSOLS GENERATED DURING RMCS BASED UPON CGM IN-LINE FILTER PAPER ANALYSES
c-0
RPP-4826 Rev I
APPENDIX C - Estimation Of Aerosols Generated During RMCS Based Upon CGM In- Line Filter Paper Analyses
Summary of Method
This method of estimating RMCS aerosol quantities uses radionuclide assay data from in-line filter papers located upstream of continuous gas monitors (CGM) sampling the tank air for flammable gases during RMCS The radionuclide content of the filter paper is divided by the waste radionuclide specific activity and the air flow through the CGM to obtain an estimate of the average mass concentration in the tank head space during the time period the CGM is on Multiplying the estimated average tank head space mass concentration by the tank head space volume gives an estimate of the average mass of particulates in the tank head space during RMCS To obtain the mass per RMCS core or per RMCS segment sent to the exhauster the tank head space average mass concentration is multiplied by the volume of gas sent to the exhauster then multiplied by a correction factor to account for particulates in the head space removed by the exhauster when the CGM is not operating and divided by the number of RMCS cores or RMCS segments
Description
During most tank waste intrusive activities performed since 1996 an intrinsically safe CGM located above ground has been used to continually monitor the tank air for flammable gases during in-tank activities The CGM sampling method draws air directly from the tank head space During RMCS the CGM sampling line is placed in the tank dome space The sampling line is located between the sampling riser and the exhaust riser if practical A pump in the CGM draws tank air up through the line at 05 litmin for measurement of the lower flammability limit (LFL) by the CGM A filter paper is installed in the sampling line upstream of the CGM to protect the unit from internal contamination
Following CGM use the CGM filter papers are normally discarded after monitoring them in the field for contamination To help estimate the tank head space particulate levels during RMCS these filter papers were retained and analyzed in the 222-S laboratory following removal from all tanks in which RMCS was performed from the fall of 1997 through April 1999 Data were collected for the four tanks in SX farm in which RMCS was performed and the next four tanks on which the RMCS exhauster was deployed These tanks are listed in Table c-I Reported CGM Data
The CGM operational data used to estimate aerosol levels during RMCS includes CGM operating times CGM flow rates and filter paper analytical data A summary report containing all the field operating data sheets for CGM usage and lab data was prepared following completion of sampling on each tank for all tanks except TX- 113 For TX-I 13 a separate report was prepared following each core These reports are References CGM-I to CGM-9 The CGM data from these reports are provided in Table C-2
There were 14 CGM installations during RMCS when CGM filter papers were collected and analyzed Each of these installations had Csrdquorsquo total alpha and total beta quantities measured on the filter papers resulting in 42 data points Eight of the measurement results were very low and had errors of gt+-loo These values were not used resulting in a net of 34 data points for calculating average head space mass concentrations based upon CGM data
Calculated Tank Head Space Radionuclide Concentrations
To calculate the average tank head space radionuclide concentrations during RMCS the filter paper radionuclide quantities were first divided by an efficiency factor to account for radionuclides which may not have been captured on the paper This adjusted radionuclide value was divided by the volume of tank air passing through the paper to give the average tank head space radionuclide concentration
The efficiency used for most stack samplers onsite is 73 (see Appendix D) Estimates attached to References CGM-I to CGM-9 indicate the CGM filter paper sampling method used should have a sampling efficiency
c- 1
RPP-4826 Rev 1
exceeding 73 For conservatism a sampling efficiency of 50 was assumed in this document for the CGM filter paper method
The estimated Csrdquorsquo total alpha and total beta concentrations in the tank vapor space were calculated by dividing the radionuclide quantity on the filter paper from Table C-2 by the assumed CGM sampling efficiency of 05 and the volume of gas going to the CGM The volume of gas going to the CGM was calculated by multiplying the time of CGM operation from Table C-2 by the CGM flow rate of 500 mlmin For example the calculated SX- 101 head space C~rsquorsquo~concentration based upon analysis of the CGM filter papers used during RMCS of riser 19 is
[[26E-4 pCi + 051 + [[I755 min][500 mlmin]] = 59E-I0pCiml
All radionuclide concentrations were calculated in a similar fashion Results are given in Table C-3 Table C-3 lists the radionuclide concentrations for all 42 data points The eight radionuclide concentrations not used for estimating mass concentrations are noted
Table C-3 also contains the calculated number of tank head space changeouts by the tank exhauster during CGM operation Tank head space changeouts were calculated by multiplying the exhauster flow rates (in actin) from Table F-1 by the CGM run times from Table C-2 and dividing by the tank head space volumes from Table F-2 The number of tank head space changeouts during CGM operation was used when estimating the waste mass sent to the exhauster See Aerosol Calculations section below for explanation
Aerosol Calculations
Average tank head space mass concentrations based upon CGM filter paper data were calculated by dividing the head space radionuclide concentrations from Table C-3 by the waste specific activities for each tank sampled The waste specific activities used came from Table E-I and are listed again in Table C-I The average of the mass concentrations based upon radionuclide data for each tank was used as the average head space mass concentration for that tank For example the calculated SX-IO1 head space mass concentration analysis from the CGM filter papers used during RMCS of riser 19 is
[59E-10 pCi Csrdquorsquoml+ 112 pCi C S rdquo ~ ~ waste] [ 28317 mlftrsquo] = 1 SE-7 g wasteA3 based upon C S rdquo ~
[ I 7E-I I pCi T A M + 504E-1 pCi TAg waste] [ 283 17 mlftrsquo] = 94E-7 g wasteamprsquo based upon Total Alpha
[43E-9 pCi TBml+ 357 pCi TBg waste] [ 28317 mlArsquo] = 34E-7 g wastel based upon Total Beta
[ [ I 5E-7 + 94E-7 + 34E-7 g wasteArsquo] f 31 = 48E-7 g wasteamp
[48E-7 g wastelt ] [3531467 Arsquom3] = 17E-5 g wastemrsquo
All tank head space mass concentrations were calculated in the same manner The results are presented in Table C-4 The weighted average tank head space mass concentration during RMCS was based upon the number of RMCS segments taken for each data point
The average aerosol mass in the head space during RMCS was calculated by multiplying the average tank head space mass concentration by the tank head space volume from Table F-2 For the same data point as above
[48E-7 g waste Arsquo] [115E+5 Arsquo] = 55E-2 g waste in SX-IO1 head space during RMCS
All average mass quantities present in the tank head space during RMCS were calculated in the same manner using a spreadsheet The results are provided in Table C-4 The weighted average mass of waste in a tank head space in Table C-4 was calculated based upon the number of segments obtained for each data point
Estimation of the mass of waste sent to the exhauster per RMCS core or segment requires calculation of the total mass of waste sent to the exhauster Multiplying the average head space concentration during RMCS by the exhauster flow rate (in acfm) and the time of CGM operation will give the mass of waste sent to the exhauster during the CGM time frame only While the large majority of mass of waste aerosols will have exited the tank or
c -2
RPP-4826 Rev I
resettled by the time the CGM is shut off there could be some residual suspended particles remaining These would eventually pass to the exhauster but would not be picked up by the CGM filter since it was not in service An adjustment factor was used as described in the following paragraphs to account for particles that may exit to the exhauster following shut down of the CGM
Particulates are generated by RMCS when purge gas is blowing out the drill string and the bit is rotating under the waste surface This time averages about six minutes per segment Multiplying the number of RMCS segments per core by six minutes per segment and dividing by the number of minutes of CGM operation shows the creation of particulates will only occur during a nominal 3-4 of the time the CGM is operating During RMCS the normal practice is to install the CGM turn it on when personnel enter a tank farm and keep the unit in constant operation for the remainder of the shift When the portable RMCS exhauster is used the exhauster is normally started at least an hour before RMCS is initiated and kept in operation until it is time to halt operations for the week The SX exhauster is kept in constant operation Comparing exhauster operating times from Tables F-l with CGM operating times from Table C-I it can be seen the CGMs are in operation about 3-15 of the time the RMCS exhauster is operating on a tank This time comparison wasnrsquot estimated for the SX exhauster since the SX exhauster is in constant operation
With CGM operation much longer than the time period when particulates could be generated the majority of particulates generated by RMCS should have settled or been exhausted during the CGM operating period Table C-3 shows the tank head space changeouts made by the exhauster during CGM operating periods ranged from 084 to 63 The average was 24 With the CGMs operating 25-33 times longer than the aerosol generation periods and an average of over two tank head space changeouts during CGM operation the large majority of aerosols generated during RMCS will have settled out or been removed by the exhauster by the time the CGM is shut off To account for particulates remaining in the tank head space after the CGM was turned off that are subsequently removed by an exhauster it was conservatively assumed that 20 of the total mass of particles generated during RMCS were not removed from the tank head space during the CGM operating period Therefore the product of the tank head space concentration and the volume of air sent to the exhauster during the time of CGM operation was multiplied by a factor of 125 (lOOl80) to estimate the total mass of waste sent to the exhauster as a result of RMCS This is shown below for the same SX-IO1 riser 19 data point in the above calculations
[48E-7gA3] [IOOmin] [I755 min] [125]= 11E-l gwastetoexhauster
This value was divided by the number of RMCS cores and RMCS segments from Table C-1 to provide the grams per core and grams per segment in Table C-4 as follows
[ I I E- 1 g waste to exhauster] i 1 core = 11 E-I g wastelRMCS core to exhauster
and
[ 1 I E- 1 g waste to exhauster] + 5 segments = 2 I E-2 g wastelRMCS segment to exhauster
All mass per core and mass per segment values were calculated in the same manner using a spreadsheet The results are provided in Table C-4 The weighted average mass per core and mass per segment in Table C-4 were calculated based upon the number of cores or segments obtained for each data point
Summary of Calculations
There were 34 valid CGM filter paper data points from 14 RMCS CGM sampling periods in eight tanks during which I5 RMCS cores and 79 RMCS segments were obtained Based upon CGM filter paper data the results indicate that
The average tank head space mass concentration during RMCS was 4OE-5 g wastem3 The average mass of suspended solids in the tank head space during RMCS was 97E-2 g waste The average mass sent to the exhauster during RMCS was 18E-1 g wastelRMCS core The average mass sent to the exhauster during RMCS was 34E-2 g wastelRMCS segment
c - 3
RPP-4826 Rev 1
Ignoring all CGM filter paper analytical data points with a variance gtloo will result in conservative results These data points indicate negligible radioactivity was present If a value of zero was assigned to each data point with an analytical error of gtloo instead of ignoring the data point the weighted average particulate quantities in Table C-4 would be reduced by about 12
The average tank head space mass concentrations based upon CGM data will be higher than the average tank head space mass concentrations based upon filter housing NDA or dose rate The RMCS exhauster received tank air from the shifts when sampling was performed and during some of the off-shifts when no sampling was done The CGMs were only operated during the shifts when sampling was performed The air concentration drawn into the CGM and the RMCS exhauster should be roughly the came during the operating shifts but somewhat less during the off-shifts Therefore the tank head space concentration will be higher when based upon CGM data This does not impact the mass of waste sent to the exhauster per core or per segment
c -4
I
- ~
RFP-4826 Rev 1
APPENDIX D
ESTIMATION OF Rh4CS EXHAUSTER HOUSING DECONTAMINATION FACTOR
D-0
RFrsquoP-4826 Rev 1
APPENDIX D - Estimation of RMCS Exhauster Housing Decontamination Factor
Summary of Method
This Appendix estimates a Decontamination Factor (DF) for the RMCS exhausters using housing NDA data and applicable stack record sample data The Csrdquorsquo in the exhauster effluent is divided by the C S rdquo ~ in the exhauster inlet to provide a penetration efficiency The reciprocal ofthe penetration efficiency is the DF
Description
Each RMCS exhauster has an isokinetic sampler located on the stack downstream of the blower and HEPA filters A small pomp pulls air from the exhaust stack into a filter paper at a rate proportional to the exhaust flow Radionuclides in the exhaust stream passing through the sample line are caught on the filter paper The stack operating time and flow rate are recorded When the record sample filter paper is removed the filter paper is analyzed in a laboratory for radionuclides The radionuclide concentration in the stack effluent stream is calculated by dividing the quantity of material on the filter paper by the volume of air through the sampler and then dividing again by a factor to compensate for stack sampler and filter paper efficiency
Multiplying the total beta stack effluent concentration by the total off gas flow gives the total beta emissions from the exhauster The total beta emissions are multiplied by the Csrdquorsquo to total beta ratio for the waste in the tank) being exhausted to give an estimate of the C S rdquo ~ emission The C S rdquo ~ on the filters determined by NDA of the housing (see Appendix A) is added to the C S rdquo ~ emissions to give the total C S rdquo ~ input to the filter housing Dividing the emissions by the input gives the filter housing penetration efficiency Subtracting the penetration efficiency from 1 O gives the filter housing efficiency Dividing 1 O by the penetration efficiency gives the DF
RMCS Stack Record Sample Data
RMCS exhauster stack record samples are taken after completion of each sampling event on a tank Normally this is after all cores on that tank have been obtained but for BY-IO5 in 1998 record samples were taken following each core Record samples are also taken at the end of each year All samples are analyzed for total alpha and total beta At the end of each year all the filter papers for that year are composited and analyzed for individual radionuclides Sample results are entered into the Automated Bar Coding of Air Samples at Hanford (ABCASH) and Environmental Release Summary (ERS) databases Several ofthe filter papers from 1998 were reanalyzed using a longer count time to bring the error rate down
Schofield 2000b compiled and evaluated all available RMCS exhauster stack record sample data filtered out the unusable data provided derivation for the stack sampling efficiency factor and summarized the results Most of the data points were so low as to be unusable since the results were either negative or had error variances gtloo
Column 5 of Table D-1 provides the stack effluent concentrations used for calculation of the filter housing DF The stack effluent data in Table D-l come from Schofield 2000b These values include a 073 sampling efficiency factor
Calculation of RMCS Filter Housing Decontamination Factor Based upon Housing Inlet and Outlet Data
The RMCS exhauster housing NDA and stack record sample data available for exhauster Operating Periods 4 5 and 6 were used to estimate an actual DF for the RMCS exhauster housings The housing NDA data is for CSrdquo~ but there are no usable Csrdquorsquo concentrations for the RMCS exhauster outlet The RMCS exhauster stack Csrsquordquo concentrations are either negative have a variance gtloo or are not available Total beta analyses are available however so the stack eftluent C S rdquo ~ concentrations were estimated by multiplying the total beta concentration by the ratio of Csrdquorsquo to total beta in the tank waste
Column 2 of Table D-l lists the increase in CSrsquo~ on the filters for each operating period as determined by NDA This data was obtained from Table A-2
D- 1
RPP-4826 Rev 1
Column 4 of Table D-l lists the stack exhaust volume for each stack record sample period The stack exhaust volume for the exhauster installation on S-l IO was calculated by
[ZOO std ft3min][15978 hrs] [60 minhr] = 199E+6 std ftrsquo
All other stack volumes in Table D-l were calculated the same way Unlike in Appendices A B and C no adjustment was made to change the 200 scfm to actual cfm This is because the RMCS stack record sample concentrations from Table D-3 are based upon a 200 scfm flow rate rather than the actual flow rate Since the concentrations are on the same basis as the flow rate there is no need to correct to acfm
The total beta emissions for the RMCS exhauster stack were calculated by multiplying the volume by the concentration For the same S-l IO data point
[199E+6 ft3] [18E-15 pCiml] [28317mlft3] [mCi1000 pCi] = 1OE-7 mCi total beta
All other total beta emissions in Table D-l were calculated the same way
The Csrdquorsquo to total beta ratio was calculated from data in Table E-I For the same S- l I O data point
326E+5 Ci CsI3rsquo f I 14E+6 Ci total beta = 029 Ci CslhCi total beta = 029 rnCi CsrdquorsquomCi total beta
The Csrsquordquo emission for the same S-l IO data point was thus
[I OE-7 mCi total beta] [029 mCi CsrdquorsquomCi total beta] = 29E-8 mCi Csrdquorsquo
All Csrsquordquo emissions in Table D-l were calculated in the same manner
The penetration efficiency for each operating period was calculated by dividing the exhauster outlet by the filter inlet Csrdquorsquo quantities For operating period 4 this was
[81E-6 mCi] f [5OE-I + 8IE-6 mCi] = 16E-5 = 16E-3
The DF for operating period 4 is
1 + 16E-5 = 62E+4
The overall DF for periods 4 5 and 6 was calculated by dividing the efluent from all three periods by the total filter input
[95E-6 mCi] f [67E-I t 95E-6 mCi] = 14E-5 = 14E-3 penetration efficiency
I - I 4E-5 = 0999986 = 999986 filter efficiency
1 f 14E-5 = 73E+4 decontamination factor based upon housing inlet and eftluent data
Estimation of Housing Decontamination Factor Based upon General Performance Data
HEPA filters are tested at the manufacturer to a minimum 9997 efficiency using a 03 pm monodisperse aerosol After installation HEPA filters are tested in-place per ASME N5 I O to a minimum 9995 efficiency using a polydisperse aerosol with an approximate droplet size distribution of 99 less than 30 pm 50 less than 07 pm and 10 less than 04 pm The RMCS exhauster housing is tested per ASME N510 and is thus required to have a minimum removal eficiency of 9995 for an aerosol with this approximate size distribution The particle size distribution of the waste aerosols generated by RMCS is unknown but it is assumed that the removal efficiency for RMCS generated aerosols was the same as the removal efficiency for the ASME generated test aerosol
D-2
RPP-4826 Rev I
A 9995 efficiency is equivalent to a DF of 2E+3 while a 9997 efficiency is equivalent to a DF of 33E+3 The actual DF for the RMCS exhauster housing is higher than either of these It has two HEPA filters in series even though the minimum efficiency specified in the NOCs for the RMCS exhausters is only equivalent to one HEPA ERDA 1976 recommends using a DF of 3000rdquo for a filter bank where n is the number of HEPA filters in series This would result in a DF of 9E+6 for the RMCS exhauster housing This is unrealistic Using a DF of 9E+6 will calculate to Csrdquorsquo quantities on the HEPA filtersthat are orders of magnitude above what have been shown to be there based upon the measured dose rates and NDA A DF of 9E+6 would mean the dose rate would have to be almost 100 mRhr at the side of the exhauster housing instead of the 05-08 mRhr dose rates encountered The waste particles will not have the same particle size distribution entering the second HEPA filter as when entering the first The majority of the waste particles will be captured on the I rdquo HEPA filter and although the DF for each HEPA if tested individually using the ASME N5 IO aerosol test method may be 3E+3 (or higher) the overall DF of the two filters in series will not be 3000lsquo This is because the particle size distribution entering the Znd HEPA could have a greater percentage of smaller particles than that entering the 1rdquo
NUREG 1995 included an evaluation of a number of different facility stacks at the Hanford site where the HEPA filter upstream air concentrations were estimated using several different methods This report concluded that back-calculation using a value of 3000rdquo overestimated the upstream radionuclide concentration by three to four orders of magnitude when compared to filter NDA data for the nine stacks for which NDA data were obtained and by three orders of magnitude for the two stacks for which upstream air sample data were available Back- calculation using a value of 3000rdquo was shown to be high by four orders of magnitude for the single stack for which a powder release estimate was available Based upon this information the RMCS exhauster dual filter-in-series housings would have a DF of at least three and maybe four orders of magnitude less than 9E+6 or in the 1E+3 to 1 E+4 range A DF of IE+3 would he less than the minimum permissible under the NOC Comparing the older stack data and design with the newer RMCS exhauster design the minimum DF would be expected to be at least 1E+4
Table D-2 provides the available RMCS exhauster aerosol test data This information was obtained from Waldo 1999 Prior to 1998 the RMCS exhauster primary HEPA filter efficiency and either the secondaly HEPA filter or the overall efficiency for both filters were tested Starting in 1998 only the primary and secondary HEPA filter efficiency were measured The overall efficiency of the two filters in series was only measured three times in 11 setups Twice the overall penetration efficiency was lt0002 and the remaining time the only information that could be found was a value of lt005 Most individual filters had a penetration efficiency of 0002 This appears to be about the limit of the detection equipment Based upon Table D-2 data a penetration efficiency of 0002 (99998 efficiency) is normal for a single HEPA and thus a minimum for an RMCS exhauster housing Assuming a 0002 penetration efficiency for the two filters combined calculates to a DF of 5E+4 (equal to 1 +
000002) for the RMCS exhauster housing
In summary the measured DF for the RMCS exhauster housings over the period from May 1998 through June 1999 was about 73E+4 RMCS aerosol testing prior to use indicates a DF of about 5OE+4 for each of the filters separately but their overall efficiency is not measured Referenced data based on older stacks at Hanford indicate the two HEPA RMCS exhauster housing would likely have a DF of at least IE+4
Estimated Aerosol Levels During RMCS Based Upon RMCS Stack Record Sample Data
Revision 0 of this document used the positive record sample results with variance less than 100 to estimate aerosol concentrations in the exhauster inlet using an assumed exhauster housing DF of 5OE+4 This method of estimating aerosols was eliminated from Revision 1 because the stack concentrations were either too low too scattered or too questionable to provide reliable results There were 112 RMCS stack record sample data points evaluated in Schofield 2000b Excluding the total beta sample results used for estimation of the housing DF there were only ten data points remaining with positive values and variances ltloo the remaining data points were either negative had a variance gtloo or the results were not available
For comparison purposes only Schofield 2000b applied the DF of 73E+4 calculated in this document to the data points not used to calculate the exhauster housing DF to estimate aerosol concentrations upstream of the filters The results showed aerosol levels approximately the same as those estimated using NDA dose rate or CGM filter paper data when a value of zero was used for negative sample results or those with a variance gtloo When only
D-3
RPP-4826 Rev 1
the ten positive results with a variance ltloo were used the aerosol levels calculated to be two to five times higher than those estimated using NDA dose rate or CGM filter paper data Because of the variability of data resulting from the extremely low record sample concentrations and the few useable data points estimation of aerosol levels using record sample data was not included in Revision I See Schofield 2000b for further discussion of the use of record sample data to estimate aerosol levels
Summary of Calculations
A total of nine RMCS exhauster stack record sample data points were used to estimate the RMCS exhauster filter housing decontamination factor These data points were obtained when sampling on five tanks during which 10 RMCS cores and 65 RMCS segments were obtained The overall decontamination factor was 73E+4
Estimation of aerosol generation quantities based upon RMCS stack record sample data is possible However results will likely be skewed high if data points that show non-detectable levels of radionuclides present are ignored instead of using a value of zero for the data point
D-4
RPP-4826 Rev 1
APPENDIX E
TANK WASTE RADIONUCLIDE CONCENTRATIONS USED FOR AEROSOL CALCULATIONS
E-0
RPP-4826 Rev 1
APPENDIX E - Tank Waste Radionuclide Concentrations Used for Aerosol Calculations
The RMCS exhauster NDA data HEPA filter dose rate data CGM filter paper data and stack record sample data provide information on the quantity of radionuclides on the exhauster filters in the tank head space or the exhauster stack during RMCS These radioactivity quantities need to be divided by the waste radionuclide concentration specific activity to determine the mass of waste in the tank head space and in the tank gases sent to the exhauster
The mass quantities in this document were calculated using dry basis radionuclide concentrations Waste particles carried into the tank head space by the purge gas could be wet or dry If wet some of the non-chemically bound water will start to evaporate immediately providing the tank relative humidity is 400 The water present in a waste particle may be chemically bound as a hydrate or free The chemically bound water will not readily evaporate therefore even a ldquodryrdquo particle may have some water associated with it It is impractical to measure the actual water content of the waste particulates caught on the CGM filter paper the exhauster HEPA filters or the stack record sample paper Since the quantity of water in the waste particulates is unknown particulate levels were calculated using dry basis radionuclide concentrations Thus all particulate values given in this document are stated on a dry basis
The waste radionuclide concentrations on a dry basis were calculated from data available in the Tank Waste Information Network System (TWINS) The Best Basis InventorylBest Basis Summary numbers were used These values are the most complete and up to date readily available estimates for Hanford waste tank contents but do not include water The information was downloaded from TWINS into a spreadsheet The total chemical total beta and total alpha quantities were summed in the spreadsheet for all the tanks which were sampled and concentrations for Csrdquorsquo Sr9rsquo total beta and total alpha automatically calculated in pCig These concentrations are provided in Table E-I Because lab techniques for measuring gross beta levels only detect beta particles with a minimum decay energy above 150-200 kev only radionuclides with a decay energy of gt-200 kev were included in the total beta numbers
The TWINS radionuclide concentrations were obtained in December 1999 No corrections were made for decay for this document
The CGM filter paper and stack record sample data indicate the measured radionuclide values are not always in the same ratio to each other as given by TWINS nor are all radionuclides detected that TWINS indicates are present Radionuclides can be distributed unevenly in a tank Soluble fission products (primarily Csrsquordquo) are found in the liquid saltcake and in sludges Insoluble fission products and actinides are found largely in sludges as these are primarily chemical precipitates Sludge could be mixed with saltcake be present in a distinct layer at the bottom of a tank or in several layers in the tank depending upon how waste was transferred into a tank Waste particles may thus not have the same specific activity on a microscopic scale as they would have on a macro scale were the tank contents homogenized During RMCS a top to bottom core sample is attempted resulting in the drill bit and purge gas (which causes aerosols to form) passing through most ofthe waste matrix Assuming the aerosol generation rate is approximately constant during drilling the specific activity of a radionuclide in the suspended solids should be roughly the same as the average specific activity of the same radionuclide in the tank waste While the waste specific activity is probably not homogeneous from top to bottom in a tank and the aerosol generation rate will likely also vary it is beyond the scope of this document to provide an in-depth analysis of all the factors affecting aerosol radionuclide concentration Although sample radionuclide data were not always in the same ratio as provided by TWINS for the purpose of this document the simplifying assumption was made that the average tank specific activity is adequate to provide an approximation of the suspended solids specific activity for all radionuclides Average tank individual radionuclide specific activities were used in the preparation of the exhauster NOCs
The aerosol calculations presented in this document are only as accurate as the TWINS data The combined radionuclide content of all Hanford waste tanks is known fairly well since the overall content is based upon reactor production records CsrdquorsquoSrW recovery data and processing plant discharges Thus TWINS data for all tanks combined should be reasonable There are undoubtedly differences between TWINS data and the actual contents of a specific tank While the specific tank radionuclide data from TWINS used in this document may not be exact deviations from the actual concentrations are assumed to balance out over the number of tanks sampled
E- 1
RPP-4826 Rev 1
APPENDIX F
ROTARY MODE CORE SAMPLING EXHAUSTER AND CORE SAMPLE DATA
F-0
RPP-4826 Rev 1
APPENDIX F - Rotary Mode Core Sampling Exhauster and Core Sample Data
This appendix provides the basic data obtained during RMCS operations which was used in preparation of this document
Basic Operational Data
There have been three RMCS exhausters and three RMCS sampling trucks deployed since starmp of nitrogen- purged RMCS in November 1994 The exhausters are formally designated 296-P-32296-P-33 and 296-P-34 These were originally referred to as parts of RMCS Systems 2 3 and 4 respectively in the Notices of Construction (NOC) for these units The exhauster designations were changed for routine field use in 1996 to exhausters A B and C to avoid confusion with core sampling trucks 23 and 4 since any exhauster could be used with any RMCS truck Exhauster A (2) and RMCS Truck2 have not been used for RMCS since 1995 and are no longer in service for core sampling
Rotary mode core sampling has been conducted in four general time frames since 1994 These time frames were separated by down times for equipment modifications or resolution of environmental permitting and safety concerns For ease of analysis in this document exhauster operations were organized into six distinct operating periods Periods I to 6 were grouped based upon times when the same exhauster and same set of HEPA filters were being used These periods thus overlap with the general operating time frames The four operating time frames were
The first time frame lasted from November 1994 to January 1995 RMCS Truck 2 and Exhauster 2 (A) were used on Tank BY-106 along with an in-tank prefilter This tank provided the initial deployment and testing of the nitrogen-purged equipment in a waste tank During this period radiation dose rates were taken at the side of the exhauster housing Stack record samples were taken in December 1994 and January 1995
The second time frame lasted from July 1995 through October 1995 RMCS Trucks 2 and 4 were used with Exhausters 2 and 3 (A and B) on BY-105 BY-IO8 and BY-I IO During this period radiation dose rates were taken at the sides of the exhauster housings Stack record samples were taken after completion of sampling on each tank No RMCS samples were taken from BY-108 all samples were taken in push mode for this tank
The third time frame began when RMCS was restarted in December 1997 Trucks 3 and 4 were used for sampling of SX-101 SX-103 SX-105 and SX-102 with the SX tank farm exhauster providing ventilation The RMCS exhausters were not used During this period radiation dose rates were taken at the sides of the SX exhauster housing as part of HPT routine surveys SX farm exhauster stack record samples were taken when required by normal operating procedures SX record sampler and filter housing dose rate data were not evaluated for this document It would not be practical using filter dose rate or stack record sample data to estimate the RMCS aerosol addition if any to the SX ventilation system The background radiation around the SX filter housing makes measurement of any small increase in dose rate very difficult to detect The number of tanks being ventilated and the involved off-gas header routings (the exhauster is pulling on thirteen tanks in series or in parallel with the tank being sampled) and any in-tank activities in the SX tanks not being sampled would make it impractical to assess what aerosols resulted from RMCS Beginning with RMCS in SX farm radionuclide analyses were performed on the filter papers protecting the CGMs which draw air out of the tank vapor space for flammable gas detection
The fourth time frame began in May 1998 Between 1095 and 598 Exhausters B and C were extensively modified with new filter housings and other equipment to meet new NOC requirements Trucks 3 and 4 were used with Exhausters B and C (3 and 4) on S-l IO U-107 BY-105 TX-113 and TX-I 18 This period marked the first use ofthe RMCS trucks and RMCS exhausters together following resolution of flammable gas concerns and modifications to the exhausters New filters were installed Radiation dose rates were taken at the sides of the exhauster housings Stack record samples
F- 1
RPP-4826 Rev I
were taken after completion of sampling for each exhauster installation Radionuclide analyses were performed on the CGM filter papers for all tanks except TX-118 An NDA was performed on the Exhauster C housing following completion ofthe first core on TX-I 13 The housing filters when assayed contained aerosols captured by the exhauster following RMCS in S-l IO U-107 BY-105 (1998) and the first core of TX-I 13 Another NDA was performed on Exhauster C following both cores in TX-I 18 An NDA was performed following sampling of the second core in TX-I 13 using Exhauster B The time frame ran through early June 1999 No RMCS samples have been taken after June 1999 nor are any planned for the next few years
For the purposes of evaluating aerosol formation based upon RMCS exhauster housing NDA and dose rate data the exhauster operations were grouped into 6 operating periods These periods are shown in Table F-1 and restated in Tables A-I and B-I All tanks sampled in Periods 1 2 4 5 and 6 were exhausted by the same exhauster with the same housing and filters present during that period Period 3 covered the time the SX exhauster was used during RMCS in SX farm
A brief description of each RMCS tank sampling operation is provided below
Tank 241-BY-1061194 to 1294 RMCS using the nitrogen purge gas system with an exhauster was formally begun on 111794 on tank BY-106 riser IOB Exhauster 2 (A)and Truck 2 were used A sintered metal prefilter was inserted in the riser between the tank and the exhauster A total of eight segments were taken in rotary mode and five segments in push mode until sampling was halted on 122194 One RMCS core was obtained The total exhauster run time was 4878 hours The stack record sample was removed and analyzed following this run period Dose rates taken at the side of the exhauster housing during RMCS were all lt05 mRhr The in-tank prefilter was smeared for contamination when removed from the tank with the smears showing less than detectable levels of radionuclides present (Waldo 1999) The prefilter had been washed with an installed spray system prior to removal from the tank but subsequent testing showed the water flow and pressure were too low to have been effective at removing contamination
Tank 241-BY-106195 Following some process modifications RMCS in BY-IO6 riser IOB began again on 11895 Exhauster 2 (A) and Truck 2 were used The sintered metal prefilter was inserted in the riser between the tank and the exhauster RMCS was halted on 12495 over authorization basis and equipment operability issues for RMCS A total of three segments were taken in rotary mode and eleven segments in push mode One RMCS core was obtained The total exhauster run time was 1867 hours The stack record sample was removed and analyzed following this run period Dose rates taken at the side of the exhauster housing during RMCS were all lt O S mRhr The in-tank prefilter was smeared for contamination when removed from the tank with the smears showing less than detectable levels of radionuclides present (Waldo 1999) The prefilter was not washed this time
Tank 241-BY-110795 to 1095 Following resolution of RMCS authorization basis and equipment issues and completion of the fabrication and testing of Trucks 3 and 4 RMCS was begun in BY-I IO on 71195 Exhauster 2 (A) and Truck 2 were used Samples were taken from risers 128 7 128 again and 4 There was no in- tank prefilter used in this or any subsequent RMCS periods Sampling was performed until 102595 when RMCS was halted over flammable gas issues A total of 13 RMCS segments and 56 PMCS segments were taken Three RMCS cores were obtained The total exhauster run time was 1125 hours The stack record sample was removed and analyzed following this run period Dose rates taken at the side of the exhauster housing during RMCS were all lt O S mRhr
Tank 241-BY-108795 to 895 Core sampling was begun in BY-IO8 on 72595 Exhauster 3 (B) and Truck 4 were used Sampling was done in risers 12A and 7 The tank material proved soft enough so that no RMCS segments were required all segments were obtained in push mode although the exhauster was operated during part of the time sampling was performed Sampling was completed 81895 A total of 16 PMCS segments were taken The total exhauster run time was 6617 hours The stack record sample was removed and
F-2
RPP-4826 Rev 1
analyzed following this run period Dose rates taken at the side of the exhauster housing during RMCS were all lt05 mRhr
Tank 241-BY-105895 to 1095 RMCS was begun in BY-I05 riser 12A on 83095 Exhauster 3 (B) and Truck 4 were used This tank has a concrete layer on top about 12-18 inches thick which had to be drilled through Part way through sampling questions arose as to the flammable gas status of the tank and RMCS was halted on 10695 A total of 3 RMCS and 7 PMCS segments were taken One RMCS core was obtained The total exhauster run time was 4413 hours The stack record sample was removed and analyzed following this run period Dose rates taken at the side of the exhauster housing during RMCS were all lt05 mRhr
Tank 241-SX-1011297 to 298 Following resolution of extensive regulatory and authorization basis issues and installation of equipment modifications RMCS started in SX-101 with Truck 4 on 12497 An RMCS exhauster was not used since all SX farm tanks excluding SX-113 and SX-I 15 are ventilated with the SX exhauster Sampling was performed in risers 19 and 4 and was completed on 21098 A total of 9 RMCS and 6 PMCS segments were taken Two RMCS cores were obtained SX exhauster stack record samples and filter housing dose rates were obtained as part of routine operations for the SX exhauster not as part of the RMCS process Filter papers used in the suction line for the CGM were saved and analyzed in the laboratory to estimate the airborne radionuclide concentration in the tank head space Two CGM filter papers were needed for each core as moisture in the tank vapors condensed on the papers in the cold weather and began to restrict tank gas flow to the CGM
Tank 241-SX-103498 to 598 RMCS started in SX-103 with Truck 4 on 42798 The SX exhauster was used for ventilation (see SX- 101 above) Sampling was performed in risers 7 and 1 1 and was completed on 51198 A total of 6 RMCS and 18 PMCS segments were taken Two RMCS cores were obtained During sampling filter papers used in the suction line for the CGM were saved and analyzed in the laboratory to estimate the airborne radionuclide concentration in the tank head space One CGM filter paper was used during each core SX exhauster stack record samples and filter housing dose rates were obtained as part of routine operations for the SX exhauster not as part of the RMCS process
Tank 241-SX-105298 to 598 RMCS started in SX-105 with Truck 3 on 22598 The SX exhauster was used for ventilation (see SX- 101 above) Sampling was performed in risers 6 and 14 and was completed on 51598 A total of 6 RMCS and 20 PMCS segments were taken Two RMCS cores were obtained During sampling filter papers used in the suction line for the CGM were saved and analyzed in the laboratory to estimate the airborne radionuclide concentration in the tank head space Two filter papers were needed for the first core as moisture in the tank vapors condensed on the papers in the cold weather and began to restrict tank gas flow to the CGM One filter paper was used for the second core SX exhauster stack record samples and filter housing dose rates were obtained as part of routine operations for the SX exhauster not as part of the RMCS process
Tank 241-SX-102698 to 798 RMCS started in SX-102 with Truck 4 on 61798 The SX exhauster was used for ventilation (see SX- 101 above) Sampling was performed in risers 8 and 4 and was completed on 7798 A total of 2 RMCS and I8 PMCS segments were taken Two RMCS cores were obtained During sampling filter papers used in the suction line for the CGM were saved and analyzed in the laboratory to estimate the airborne radionuclide concentration in the tank head space One filter paper was used for each core SX exhauster stack record samples and filter housing dose rates were obtained as part of routine operations for the SX exhauster not as part of the RMCS process
Tank 241-S-110598 to 698 RMCS was begun in S-I10 on 51898 Exhauster C (4) and Truck 3 were used This tank marked the first use of an RMCS exhauster since 1995 Sampling was completed on 6498 Risers 6 and 14 were sampled A total of IO RMCS and 8 PMCS segments were taken Two RMCS cores were obtained The
F-3
RPP-4826 Rev I
total exhauster run time was 15978 hours The stack record sample was removed and analyzed following this run period Dose rates taken at the side of the exhauster housing during RMCS were all lt05 mRhr During sampling filter papers used in the suction line for the CGM were saved and analyzed in the laboratory to estimate the airborne radionuclide concentration in the tank head space One filter paper was used for each core Waste particles retained on the exhauster housing filters were part of the inventory subsequently measured by NDA following completion of the first core in TX-I 13
Tank 241-U-107698 to 798 RMCS was begun in U-107 on 61098 Exhauster C and Trucks 3 and 4 were used Sampling was completed on 71598 Risers 7 and 2 were sampled A total of IO RMCS and 19 PMCS segments were taken Two RMCS cores were obtained The total exhauster run time was 27385 hours The stack record sample was removed and analyzed following this run period Dose rates taken at the side of the exhauster housing during RMCS were all 105 mRihr During sampling filter papers used in the suction line for the CGM were saved and analyzed in the laboratory to estimate the airborne radionuclide concentration in the tank head space One filter paper was used for each core Waste particles retained on the exhauster housing filters were part of the inventory subsequently measured by NDA following completion of the first core in TX-I 13
Tank 24l-BY-105798 to 898 RMCS was begun in BY-105 again on 72298 Exhauster C and Trucks 3 and 4 were used Sampling was completed on 82598 Risers 7 and 1 1 B were sampled A total of 18 RMCS and 18 PMCS segments were taken The material was hard enough to require rotary mode sampling all the way to the bottom of the waste but negligible recovery was obtained After RMCS was performed to the waste bottom a PMCS core was taken in the same hole to recover material Two RMCS cores were obtained The exhauster run time was 13577 hours for the first RMCS core and 30792 hours for the second RMCS core Stack record sample information in ABCASH shows 30558 hours operation for the second core but the sampler data sheet shows the time counter was mistakenly reset 234 hours into the run No correction was made to the BY-IO5 2nd core record sample concentration for this document since the error is conservative and results in only slightly higher (ltI) record sample radionuclide concentrations for this core A stack record sample was removed and analyzed following each core giving two record samples for BY-IO5 in 1998 Dose rates taken at the side of the exhauster housing during RMCS were almost all lt05 m R h but a few readings indicated 07 mRihr This variation was assumed due to personnel reading the instrument differently or the fact that the exhauster had been used on enough tanks that by now there was sufficient activity on the filters to cause readings approximately at the background detection level The final reading when both cores were completed was lt05 m R h During sampling filter papers used in the suction line for the CGM were saved and analyzed in the laboratory to estimate the airborne radionuclide concentration in the tank head space One filter paper was used for each core Waste particles retained on the exhauster housing filters were part of the inventory subsequently measured by NDA following completion of the first core in TX-113
Tank 241-TX-113998 to 599 Core sampling was begun in TX-I 13 riser 3 on 92298 Exhauster B (3) and Truck 4 were used at the start This was the first use of Exhauster B since it was modified Exhauster B ran for a total of 8738 hours until being disconnected on 102398 During this time two PMCS segments were taken and no RMCS segments Exhauster C was then installed and operated for 5598 hours from 121098 to 122898 No RMCS or PMCS sampling was performed during this time frame RMCS segments werent taken until 299 Exhauster C ran for a 30230 hours between 122898 and 21299 Sampling was completed on the core from riser 3 on 21299 A total of 12 RMCS segments were obtained during the time Exhauster C was operating Exhauster flow rate for both exhausters was a nominal 200 scfm Stack record samples were taken following Exhauster B removal at the end of 1998 for Exhauster C and following completion ofthe first core with Exhauster C Aerosol calculations were based on only the 30230 hours run time for Exhauster C in 1999 since this was the time period during which RMCS segments were obtained Dose rates taken at the side of the exhauster housing during the short PMCS only sampling period with Exhauster B were all ltOS m R h Dose rates with Exhauster C varied between lt O S mRhr and 07 mRhr The final reading on Exhauster C following completion of the first core was 07 mFUhr During sampling filter papers used in the suction line for the CGM were saved and
F-4
RPP-4826 Rev I
analyzed in the laboratory to estimate the airborne radionuclide concentration in the tank head space One filter paper was used for the core Waste particles retained on the exhauster housing filters were part of the inventory subsequently measured by NDA following completion of this core
Sampling in riser 5 was begun on 41299 using Exhauster B and Truck 3 A total of 6 RMCS and 1 PMCS segments were taken for this core before sampling was halted on 42899 The total exhauster run time for this core was 11712 hours Problems with high vacuum in the tank required the exhauster flow rate to be reduced to 190 scfm to keep the system within pressure limits The stack record sample for the second core was removed and analyzed following the run period Dose rates taken at the side of the exhauster housing during the second core were all lt05 m M r During sampling filter papers used in the suction line for the CGM were saved and analyzed in the laboratory to estimate the airborne radionuclide concentration in the tank head space One filter paper was used An NDA was performed on the exhauster housing following this core The only radionuclides present in the housing were those from this core or what was removed from the tank head space during the non-RMCS activities in this tank from 92298 and 102398
Some clarification may be needed to explain use of the exhauster operating times and NDA dose rate and record sample data obtained during core sampling on TX-I 13 Core sampling was set up for sampling riser 3 on TX-113 in September 1998 with Exhauster B Exhauster B operated for a total of 8738 hours between 92298 and 102298 The stack record sample was removed at the end of this period The ERS database incorrectly shows the exhauster operated between 111698 and 111998 The ABCASH database shows the stack record sample was removed on 111998 The stack record sample showed positive emuent concentrations during this time period with variances 400 No RMCS samples were taken during this period so the data and time werenrsquot included when calculating RMCS aerosol numbers Exhauster B was removed and Exhauster C installed in late November-early December Exhauster C was operated for a total of 5559 hours between 121098 and 122398 The stack record sample was removed on 122898 No sampling was performed during this period so the data and time werenrsquot included when calculating RMCS aerosol numbers Exhauster C was operated for a total of 30218 hours between 122898 and 2899 All the RMCS segments from riser 3 were taken in this time period so only the data and time for this period were included when calculating RMCS aerosol numbers Exhauster B was used during sampling of riser 5 Exhauster B operated for a total of 11712 hours between 41299 and 42899
Tank 241-TX-l18599 to 699 RMCS was begun in TX-I 18 on 5699 Exhauster C (4) and Truck 4 were used Sampling was completed on 6298 Risers 9B and 12B were sampled A total of 9 RMCS segments were taken there were no PMCS segments Two RMCS cores were obtained The total exhauster run time was 21247 hours The stack record sample was removed and analyzed following this run period The maximum dose rate taken at the side of the exhauster housing following RMCS was 08 m M r CGM filter papers were not analyzed An NDA was performed on the exhauster housing following completion of the two cores The exhauster housing contained the same nuclides as for the first NDA (S-110 U-107 BY-105 and TX-I 13 first core) plus those from TX-I 18
The basic core sampling operational data used in this document includes the number of RMCS cores and segments the exhauster run times and flow rates the RMCS exhauster HEPA filter dose rates and tank vapor space temperatures Table F-l lists the basic operational data This information excluding tank vapor space temperature data was obtained from procedural data sheets in the sampling work packages (References W - 1 to WP-23)
Tank temperature data for the tanks ventilated with the RMCS exhausters was obtained from the TWINS database Plots for each tank were prepared for the time RMCS was conducted and the average value of the highest thermocouple located in the tank (the lowest temperature reading) was estimated and used as the average tank head space temperature during the RMCS period
The SX exhauster flow rates listed in Table F-l are estimates only The combined flow rate for SX-IO1 through SX-106 plus SX-109 (7 tanks) averaged 440 cfm during CY 1996 (Kaiser 1997) for an average of 63 cfm per
F-5
RPP-4826 Rev I
tank Based upon inlet flow measurements at the tank inlet HEPA filters (Fanis 1998) the flow through each individual tank (SX-IO1 through SX-106 plus SX-109) was lt55 cfm at the breather filter Assuming an exhaust flow of 100 cfm for each SX farm tank sampled is therefore conservative
Calculated Data
Calculated data include the tank head space volumes conversion of the RMCS exhauster flow rate from scfm to acfm and the number of tank head space changeouts made by an exhauster during RMCS
Tank head space volume includes the dome space volume above the top of the sidewall plus the void space between the waste surface and the top of the sidewall The formula used to calculate tank head space volumes WN
Head Space Volume in A = (DS + [(H) (12) + HI + Hb - H] (V)) - 748
Where DS = dome space volume gal H = height of tank body sidewall above knuckle A HI = height of tank knuckle area in Hb = height oftank bottom below knuckle in H = height of waste in tank in V =27555 galin of waste in SX tanks 2754 gallin in all others
The tank dome space volumes height of tank sidewall above the knuckle height of tank knuckle area and height of tank bottom below the knuckle were obtained from Reynolds 1999 The height of waste in each tank at the time of core sampling was obtained from the TWINS database Tank dimensional and waste level data are given in Table F-2 along with the calculated tank head space volumes
Aerosol calculations for Appendices A-C require exhauster flow rates in actual cubic feet per minute The RMCS exhauster flow rate is controlled and recorded in standard cubic feet per minute The mass flow rate of the exhauster air is measured and internal logic in the exhauster controller calculates what the volumetric flow rate would be if the temperature and pressure in the exhauster inlet were at standard conditions The standard conditions used in the logic controller are 29921 in Hg (760 mm Hg) and 69F (ZIT)
A correction factor is built into the exhauster control logic that assumes an atmospheric pressure of 2927 in Hg the average atmospheric pressure at Hanford The RMCS exhauster will operate at about 1-2 in H20 negative pressure resulting in about a 2916 in Hg pressure in a waste tank when the RMCS exhauster is operating To revise the indicated scfm RMCS exhauster reading to an acfm value the RMCS exhauster scfm flaw rate was multiplied by (29922916)(T+459)528 where Tis the tank head space temperature in OF The tank head space temperatures in Table F-1 were input to the spreadsheet file used for aerosol calculations and converted to acfm The flow rates in acfm are included in Table F-I
The tank head space changeouts when using the RMCS exhauster were calculated by multiplying the exhauster acfm flow rate by the time of exhauster operation and dividing the result by the tank head space volume Tank head space changeouts are listed in Table F-2
F-6
c
gt 2
RPP-4826 Rev 1
APPENDIX G
REFERENCES
G-0
RPP-4826 Rev 1
APPENDIX G - References
Diedeker 1999 NDA of RMCS HEPA Filters L P Diedeker WMH E-Mail to JS Schofield CHG November 29 I999
ERDA 1976 Nuclear Air Cleaning Handbook ERDA 76-21 Buchsted C A Fuller A B and Kahn 1 E Oak Ridge National Laboratory 1976
Farris 1998 Internal Note T R Farris LMHC to J S Schofield LMHC Breather Filter Flow Rates for SX-Farm 31698
Foust 1999 Internal Memo RMCST Exhauster HEPA Filter Dose Rate Calculations D J Foust LMHC to J S Schofield LMHC October 25 1999
Greager 1999 Correspondence No WMH-9954450 Non-Destructive Analysis of the Rotay Mode Core Sample High-Efjiciency Particulate Air Filters E M Greager WMH to P C Miller LMHC June 28 1999 [Transmittal of HNF-4199 Resultsfram NDA Measurement of the 296-P-34 RMCS HEPA Filters]
HNF 1999 HNF-SD-WM-SAR-067 Tank Waste Remediation System Final Safety Analysis Report Rev 1 The revision incorporating RMCS accident analyses was submitted as Addendum 5 to DOE as a change to the FSAR predecessor the Basis for Interim Operation (BIO) LMHC-9857075 80232764-9-KOOl Submittal of Authorization Basis Amendment Package for Rotay and Push Mode Core Sampling in Satisfaction of Perfarmance Agreement TWR 122 Expectations I and 3 D 1 Allen LMHC to A M Umek FDH August 30 1998 Addendum 5 as of mid-January 2000 is waiting for approval by DOE
Kaiser 1997 T D Kaiser LMHC E-Mail to J S Schofield LMHC SX Tank Flow Data 42197
NUREG 1995 Potential Radionuclide Emissionsfrom Stacks on the HanfordSite Part I Dose Assessment Davis W E and Barnett J M Westinghouse Hanford Company from Proceedings of the 23 DOEMRC Nuclear Air Cleaning Conference held July 25-28 1994 February 1995
Schofield 2000a Letter 74910-00-002 Use of Microshield Calculations for RMCS Exhauster Housing for Estimating Radionuclide Quantities on the Filters Using NDA and Dose Rate Measurements I S Schofield CHG to File January 62000
Schofield 2000b Letter 74910-00-003 Rev I RMCS Exhauster Stack RecordSample Data J S Schofield CHG to File January 202000
Reynolds 1999 D R Reynolds LMHC E-Mail to I S Schofield LMHC transmitting Tank Volume Calculations draft of calculations done by Mike Plesha and Reed Hendershot data to be used for RESOLVE computer program for Hanford waste tanks August 3 1999
TWINS Tank Waste Information Network System database available at httptwinspnlgovSOO lhtbinTCDgetTableListexe
Waldo 1999 letter 74910-99-009 RMCS Exhauster Aerosol Test Data E I Waldo to J S Schofield June 22 1999
WHC 1993 WHC-SD-WM-ES-225 Rev I AerosolStudy for the Rotary Mode Exhauster P M Francis Westinghouse Hanford Company April 20 1993
WHC 1997 WHC-SD-WM-SAD-035 Rev Ob A Safety Assessment of Rotary Mode Core Sampling in Flammable Gas Single Shell Tanks Hanford Site Richland Washington August 8 1997
G- I
RPP-4826 Rev I
CGM Data CGM-I Letter PARTICULATE SAMPLING OF 241-SX-IO1 DURING ROTARY MODE CORE SAMPLING D C
Langlois E2 Consulting Engineers to J S Schofield Lockheed Martin Hanford Company March 16 1998
CGM-2 Letter PARTICULATE SAMPLING OF 241-SX-I05 DURING ROTARY MODE CORE SAMPLING D C Langlois E2 Consulting Engineers to J S Schofield Lockheed Martin Hanford Company June 9 1998
CGM-3 Letter PARTICULATE SAMPLING OF 241-SX-103 DURING ROTARY MODE CORE SAMPLING D C Langlois E2 Consulting Engineers to J S Schofield Lockheed Martin Hanford Company June 12 1998
CGM-4 Letter PARTICULATE SAMPLING OF 241-S-110 DURING ROTARYMODE CORESAMPLING D C Langlois E2 Consulting Engineers to J S Schofield Lockheed Martin Hanford Company July 20 1998
CGM-5 Letter PARTICULATE SAMPLING OF 241-SX-102 DURING ROTARY MODE CORE SAMPLING D C Langlois E2 Consulting Engineers to J S Schofield Lockheed Martin Hanford Company July 22 1998
CGM-6 Letter PARTICULATE SAMPLING OF241-U-107 DURING ROTARY MODE CORE SAMPLING D C Langlois E2 Consulting Engineers to J S Schofield Lockheed Martin Hanford Company August 3 1998
CGM-7 Letter PARTICULATE SAMPLING OF 241-BY-105 DURING ROTARY MODE CORESAMPLING D C Langlois E2 Consulting Engineers to 1 S Schofield Lockheed Martin Hanford Company September 17 1998
CGM-8 Letter PARTICULATE SAMPLING OF 241-TX-I13 DURING ROTARY MODE CORESAMPLING D C Langlois E2 Consulting Engineers to J S Schofield Lockheed Martin Hanford Company March 15 1999
CGM-9 Letter PARTICULATE SAMPLING OF 241-TX-113 DURING ROTARY MODE CORE SAMPLING D C Langlois E2 Consulting Engineers to I S Schofield Lockheed Martin Hanford Company May 31 1999
Notices of Construction NOC-I DOEIRL-93-40 Radioactive Air Emissions Program Notice of Construction Rotary Mode Core-Sampling
Truck and Exhauster Approved by Letter AIR 93-707 A W Conklin WDOH to J E Rasmussen DOEIRL 7893
NOC-2 DOEIRL-94-118 Rev 0 Radioactive Air Emissions Program Notice of Construction for the Rotary Mode Core-Sampling Systems Three and Four Approved by Letter AIR 95-603 A W Conklin WDOH to J E Rasmussen DOERL 63095
NOC-3 DOERL-94-118 Rev 1 Radioactive Air Emissions Program Notice of Construction for the Rotary Mode Core-Sampling Systems Three and Four Approved by Letter AIR 98-301 W W Conklin WDOH to I E Rasmussen DOEIRL 3698
NOC-4 DOEIRL-97-70 Radioactive Air Emissions Program Notice of Construction for Rotary Mode Core- Sampling in SX Tank Farm Approved by Letter AIR 97-1 101 A W Conklin WDOH to J E Rasmussen DOEIRL 113097
NOC-5 USEPA Letter OAQ-107 (no title approving DOE submittal 97-EAP-590 dated 72997) A J Frankel USEPA to J E Rasrnussen DOEIRL 8497
NOC-5 USEPA Letter OAQ-107rsquo (nb title approving DOE submittal 97-EAP-723 dated 101797) A J Frankel USEPA to J E Rasmussen DOERL 11498
Note that both letters have ldquoOAQ-107rdquo following ldquoReply to Attn ofrdquo
G-2
RPP-4826 Rev I
Work Packages WP-I ES-94-00808 WP-2 ES-95-00258 WP-3 ES-95-00045 - WP-4 ES-95-00434 - WP-5 ws-97-00173 - WP-6 WS-97-00174 - WP-7 ws-97-00143 - WP-8 WS-97-00144 - WP-9 WS-97-00207 - WP-I 1 WS-97-00208 - WP-12 WS-98-00049 - WP-13 WS-97-00050 - WP-14 WS-97-00224 - WP- I5 WS-97-00225 - WP-16 WS-97-00230 - WP- I7 ws-97-0023 1 - WP-18 ES-97-00452 - WP-19 ES-97-00453 - WP-20 WS-98-00072 - WP-21 WS-98-00073 - WP-22 WS-98-00067 - WP-23 WS-98-00068 -
241-BY-IO6 Perform Rotary Core Sample [Riser IOB] 241-BY-I IO Rotary Core Sample [Risers 12B 7 IZB 41 241-BY-IO8 Obtain Rotary Core Sample [Risers 12A amp 71 241-BY-IO5 Rotary Mode Core Sample [Riser 12A] 241-SX-101 Rotary Mode Core Sample Riser 19 241-SX-101 Rotary Mode Core Sample Riser4 241-SX-103 Rotary Mode Core Sample Riser 7 241-SX-103 Rotary Mode Core Sample Riser I I 241-SX-105 RMCST Obtain Core Sample Riser 6 241-SX-105 RMCST Core Sample Riser 14 241-SX-102 Rotary Mode Core Sample Riser 8 241-SX-102 Rotary Mode Core Sample Riser 4 241-S-1 IO RMCST Obtain Core Sample Riser 6 241-S-1 IO RMCST Obtain Core Sample Riser 14 2414-107 RMCSTCore Sample Riser 7 241-U-107 RMCST Core Sample Riser 2 241-BY-IO5 RMCST Core Sample Riser 7 241-BY-IO5 RMCST Core Sample Riser 1 IB 241-TX-113 Rotary Core Sample Riser 3 241-TX-113 RMCST Core Sample Riser 5 241-TX-I 18 RMCST Core Sample Riser 9B 241-TX-I 18 RMCST Core Sample Riser 128
G-3
RPP-4826 Rev 1
EXPERIENCE WITH AEROSOL GENERATION DURING ROTARY MODE CORE SAMPLING IN THE HANFORD SINGLE SHELL WASTE TANKS
J S Schofiald CH2M HILL Hanford Group Inc Richland WA 99352 US Department of Energy Contract DE-ACOB-BBRL13200
EDTECN 655640 uc 2000 Org Code 74900 Charge Code 102249
58 Total Pages B8R Code EW313000
Key Words Aerosols Particulates Rotary Mode Core Sampling
Abstract This document provides data on aerosol concentrations in tank head spaces total mass of aerosols in the tank head space and mass of aerosols sent to the exhauster during Rotary Mode Core Sampling from November 1994 through June 1999 A decontamination factor for the RMCS exhauster filter housing is calculated based on operation data
Microshield is a registered trademark o f Grove Engineering Inc
TRADEMARK DISCLAIMER Rebrenm herein to any spcMc wmmerdai pmdud promu or urvia by tmd name trademark manuhdursr or othemlu dws not nauarlty wnstkth or impty its endorumant nmmmendatbn or hvorlng by the Unitad States Government or any agency thounof or it wntradon or wbwntradon
Prlrdd in t i n Unlul States of America To obtain mples of this doawnen( mnhd Document Control Sorvlai P 0 Sox 950 Maihtop HEM) Rkhbnd WA 99352 Phon (509) 372-2420 Fax (509) 37Mo8B
JAN 24 SOA rsquo Dab
Approved For Public Release
A84040731 (1097)
RECORD OF REVISION
(3) Revision I-
(1) Document Number
R P P - 4 8 2 6 R e v 1 1 Page -
I
I
c
Change Control Record
Authorized for Release
(5) Cog Engr I (6) Cog Mgr Date (4) Description of Change Replace Add and Delete Pages
7) I I I RN Dale I JS Schof i e ld 3DT- 6 2 3 4 1 4
3 C N - 6 5 5 6 4 0 E J Waldo
I
I
I I
A-7320405 (10i97)
RPP-4826 Rev I
EXPERIENCE WITH AEROSOL GENERATION DURING ROTARY MODE CORE SAMPLING IN THE HANFORD SINGLE SHELL
WASTE TANKS
John Schofield CH2M Hill Hanford Group Incorporated
January 2000
RPP-4826 Rev 1
Table of Contents
111
SOL GENERATION DURING ROTARY M WASTE TANKS 1
1
2 RMCS Exhauster Housing NDA RMCS Exhauster HEPA Dose R CGM Filter Paper Analyses
Housing NDA and Record Sample Data Comparison
3
Discussion of Results
APPENDIX A - Estimation Of Aerosols Generated During RMCS Based Upon RMCS Exhauster Housing Non-Destructive Assay A-I
Summary of Method Description Reported NDA Data A-2
A-2
Aerosol Calculatio
B-1
Aerosol Calculatio B-3 Summary of Calcu B-4
c-l
Calculated Tank Head Space Radionuclide Concentrations
Summary of Calculations Aerosol Calculations
APPENDIX D - Estimation of RMCS Exhauster Housing Decontamination Factor Summary of Method D-l
Estimated Aerosol Level Summary of Calculations D-4
APPENDIX E - Tank Waste Radionuclide Concentrations Used for Aerosol Calculations APPENDIX F - Rotary Mode Core Sampling Exhauster and Core Sample D
Basic Operational Data Tank 241-BY-106 1194 to 1294 F-2 Tank 241-BY-106 195 Tank 241-BY-I IO 795
I
RPP-4826 Rev 1
Tank 241-BY-108 795 to 895 F-2 Tank 241-BY-105 895 to Tank 241-SX-101 1297 to 298 F-3 Tank 24I-SX-103498 to F-3 Tank 241-SX-105298 to 598 F-3 Tank 241-SX-I02698 to 798 F-3 Tank 241-S-110 598 to 698 F-3 Tank 241-U-107 698 to 798 Tank 241-BY-105 798 to 898 F-4 Tank 241-TX-113998 to 599 F-4 Tank 241-TX-118 599 to 699
Calculated Data F-6
APPENDIX G - References
List of Figures
Figure 1 Relative Waste Aerosol Concentrations In Tank Head Space 8
List of Tables
Table 1 Summary Of Aerosol Estimation Methods Used Table 2 Summary Of RMCS Aerosol Data Table A-I Exhauster Operating Periods an Table A-2 NDA Data Table A-3 Concentrations And Aerosol Table B- 1 RMCS Exhauster Operating
B-5 Table 8-3 Concentrations And Aerosol Side of RMCS Exhauster B-6 Table C-l Operating Data for Tanks on Which Combustible Gas Monitor Filter Paper Data Were Used for RMCS Aerosol Calculations Table C-2 Combustible Gas Table C-3 Tank Head Spac Table C-4 Aerosol Table D-l Stack E Table D-2 RMCS Exhauster HEPA Filter Aerosol Test Data Table E-1 Tank Contents From TWINS Best Inventory Databa Table F-l Basic RMCS And Exhauster Operational Data
Table B-2 Dose Rate Data and Filter Cs
Table F-2 Tank Dimensional Data Head Space Volumes And Head Space Changeouts during RMCS F-8
ii
RPP-4826 Rev I
Glossary
ABCASH acfin CGM changeout
Ci core DF DOE EPA ERS exhauster g GEA head space HEPA housing kg mCi LFL NDA NISampT NOC PMCS PTE record sample RMCS W C S core RPP scfm segment specific activity TA TB TWINS TWRS
Automated Bar Coding of Air Samples at Hanford actual cubic feet per minute combustible gas monitor the replacement of air in a tank head space with a volume of air equal to the head space volume curie equal to 37Ei-10 disintegrationslsec a top to bottom (or until sampling is halted) collection of segments taken from a tank riser decontamination factor Department of Energy Environmental Protection Agency Environmental Release Summary (database) the exhauster used during RMCS on a tank gram gamma energy analysis the volume of air above the waste surface in a tank high efficiency particulate air the main body of the exhauster containing the filter media kilogram millicurie IE-3 Ci lower flammability limit non destructive assay National Institute of Standards and Technology Notice of Construction push mode core sampling Potential to Emit stack samples taken during RMCS to measure the radionuclides released to the atmosuhere rotary mode core sampling a core taken from a tank with one or more segments taken in RMCS mode River Protection Project standard cubic feet per minute an individual 19 inch long sample or group of samples taken which add up to 19 inches the concentration of a radionuclide in the waste on a mass basis normally in pCUg or mCig tots1 alpha total beta Tank Waste Information Network System Tank Waste Remediation System
averages are based upon the number of RMCS segments Washington State Department of Health
weighted average an average which is weighted based upon a given parameter in this document weighted
WDOH uCi microcurie IE-6 Ci
iii
RPP-4826 Rev I
EXPERIENCE WITH AEROSOL GENERATION DURING ROTARY MODE CORE SAMPLING IN THE HANFORD SINGLE SHELL WASTE TANKS
Summary
This document presents information on aerosol formation in tank head spaces during rotary mode core sampling (RMCS) in single shell waste tanks (SST) at the Hanford Site The mass of aerosols generated during RMCS has been very small The average mass of suspended waste solids present in an SST head space during RMCS was lt01 g The mass of suspended solids sent to an exhauster averaged ltOl g per RMCS segment and lt05 g per RMCS core The results are three orders of magnitude less than assumed in current accident analyses and environmental permit applications The measured decontamination factor (DF) for the RMCS exhauster housing exceeded 70000
Purpose
The purpose of this document is to present estimates based upon RMCS operating experience of the concentration and total mass of waste aerosols present in SST head spaces during RMCS and estimates of the mass of aerosols sent to the exhauster used on the tank This document also evaluates the performance of the RMCS exhausters and provides an estimate of the filter housing decontamination factor Revision 1 of this document is an extensive rewrite of Rev 0 and includes additional information not available when Rev 0 was issued
RMCS using a nitrogen purge gas to cool the bit and provide hydrostatic head pressure was performed between November 1994 and June 1999 All the available data relevant to aerosol formation during RMCS in SSTs was used for this study This document is not an evaluation of aerosol formation processes aerosol dispersion patterns within the tank head space aerosol settling rates or factors affecting removal of particulates from a tank When using the values given in this document to estimate maximum potential quantities released to an exhauster or to account for peak concentrations in a tank head space when evaluating potential accident scenarios engineering judgement should be used as deemed necessary to adjust the values given in this document for conservatism
Introduction
Core sampling is used to obtain 19 inch long samples of radioactive waste in the Hanford single shell waste tanks A 19 inch core sample is a segment A core is made up of all the segments taken as the drill bit passes through the waste A sample may he taken in push mode (PMCS) or rotary mode A segment taken in rotary mode is designated an RMCS segment and a core in which any RMCS segment is taken is designated an RMCS core RMCS is used for tanks in which the waste may be too hard to sample using other methods
Before 1994 core sampling was performed using different liquids that cooled the drill bit during RMCS and provided a hydrostatic head in the drill string during both RMCS and PMCS RMCS sampling was halted in 1990 over safety concerns with flammable gases and organic nitrates in the waste tanks The RMCS equipment was redesigned to a new process that used nitrogen gas to cool the cutting bit The nitrogen flow rate is approximately 30 to 40 scfm (085 to 11 m3min) during periods the drill string is rotating This gas passes through holes in the bit up through the waste and is released to the tank head space Tank head space volumes are in the 50000 to 100000 ft3 (1400 to 2800 mrsquo) range Since the nitrogen purge gas could result in aerosol formation in the tank vapor space an exhauster was included with the RMCS equipment redesign RMCS using the nitrogen purged process has been performed to date during the periods 1194 to 195795 to 1095 and 1297 to 699 From 1297 to 798 RMCS was performed in SX tank farm with the SX tank exhauster providing the ventilation In 94-95 and from 598 through 699 RMCS was performed in BY S U and TX tank farms using an RMCS exhauster
An estimate of the mass of aerosols sent to an exhauster during rotary mode core sampling is needed as a basis for the Potential to Emit (PTE) estimate in environmental permits for the exhausters employed during RMCS Estimates of tank head space mass concentrations and total suspended solids during RMCS are also used in certain accident analyses related to RMCS Since the bit rotation and gas sparging nature of RMCS have a higher potential for aerosol generation than many in-tank activities aerosols generated during RMCS may provide an estimate of the upper limit for the concentration of aerosols to be found in a tank head space during these activities
RPP-4826 Rev 1
There are two current (as of January 2000) Notices of Construction (NOC) approved by the Washington D e p m e n t of Health (WDOH) for exhauster use during RMCS The first WDOH permit is for Exhauster Systems 3 and 4 (referred to as Exhauster B and Exhauster C in this document) during RMCS in a tank that is normally passively ventilated (Reference NOC-3) The second WDOH permit (NOC-4) is for RMCS in SX tank farm using the SX exhauster The Environmental Protection Agency (EPA) has also granted approval for RMCS exhauster use in a tank that is normally passively ventilated (NOC-5) and for RMCS in SX farm with the SX exhauster (NOC-6)
Very conservative assumptions were made on RMCS aerosol quantities for the existing NOCs and safety basis accident analyses These assumptions were made since no operational data were available on aerosol levels when most of these NOCs and accident analyses were prepared WHC 1993 provided the initial estimate of aerosols sent to the exhauster during RMCS Based upon assumptions in this document a value of 1 kg of waste sent to the exhauster per RMCS core was used as the basis for the first two RMCS NOCs (NOC-I and NOC-2) This number was based upon drilling tests in drums of extremely hard and dry simulated saltcake The hard simulant was intended to present a limiting case for RMCS drill bit testing and was not physically representative of actual tank wastes This I kg per RMCS core estimate was modified to 77 g waste per RMCS segment when using the RMCS exhauster (NOC-3 and NOC-5) and 35 g per segment for RMCS in SX farm (NOC-4 and NOC-6)
A value of 600 g of waste in the tank head space was assumed in WHC 1997 for certain RMCS accident analyses This number was based upon earlier conservative assumptions on particulates generated during a large gas release event in Tank 241-101-SY A value of 100 g waste in the head space was used in an update ofthis RMCS accident analysis provided in a revision to the predecessor of HNF 1999 that has been submitted to the Department of Energy (DOE) for approval
After nitrogen-purged RMCS operations commenced in November 1994 it became obvious that the estimates of aerosol generation rates based upon WHC 1993 were very conservative This was evident from in-tank videos that showed very little dust formation and from the lack of any dose rate buildup on the in-tank prefilter (when used) or the exhauster HEPA filters An evaluation was begun in 1997 to use data obtained during or following RMCS operations to estimate actual aerosol generation rates and exhauster filter performance This document provides the results of that evaluation
Aerosol Estimation Methods
Dedicated particulate sampling methods such as employing sticky tapes to capture aerosols for microscopic evaluation or specially designed samplers were not used for this evaluation Funding and personnel were not available for an in-depth study nor was such a study necessary Aerosol quantities were estimated using the best data available from existing sources associated with RMCS (housing dose rates CGM filter papers stack record samples) or easily obtained additional data (housing NDA) Three separate methods were used to provide estimates of the aerosols present in the tank head space or sent to the exhauster The first method used non destructive assay (NDA) of RMCS exhauster filter housings to estimate particulates captured on the filters The second method used the RMCS exhauster HEPA filter dose rates following completion of a core to estimate the mass of waste on the filters The third method estimated the tank head space aerosol concentration based upon analytical data from filter papers located upstream of combustible gas meters (CGMs) employed during RMCS A CGM draws air out of a tank headspace at a constant flow rate during RMCS to monitor for flammable gases
It was not possible to utilize any single method of estimating aerosol quantities for all RMCS sampling events For some sampling events not all data types were available or if available were not useful Reasons for the data not being useful include no RMCS segments taken during the time period evaluated analytical data being below background levels or having an analytical variance gtloo or (for SX tank farm) other tanks being exhausted in parallel or series with the tank being core sampled All calculations conservatively assumed that the background radionuclide concentration in a tank head space was zero and that all radionuclides detected by one of these methods were due solely to RMCS activities
Table 1 lists the RMCS sampling events which provided the data for this document the exhauster that was in service the aerosol estimate methods used for that event and the number of RMCS cores and segments obtained
L
RPP-4826 Rev 1
during the sampling method The data in this document were obtained during RMCS in eleven separate tanks A total of 23 RMCS cores containing 11 5 RMCS segments were obtained The aerosol estimation methods are summarized below
RMCS Exhauster Housing NDA Appendix A describes NDA of RMCS exhauster housings after they were used during RMCS operations from 598 through 699 Gamma assays of the housings were performed to measure the Csrdquorsquo on the prefilter primary HEPA filter and secondary HEPA filter The quantity of Csrdquorsquo present on each was estimated by comparison with the Csrdquorsquo count rate from a known standard measured in an equivalent geomeby The quantity on all three filters was summed to estimate the total in the housing The mass of particulates was obtained by dividing the quantity of present by a weighted average of the Csrdquorsquo concentration of the wastes in the tanks being exhausted With this data average tank head space mass concentrations were calculated as well as the mass per core and per segment sent to the exhauster The mass of waste in a tank head space was calculated by multiplying the tank head space concentration by the tank head space volume A summary ofthe results is given in Table 2 The detailed results are given in Table A-3
RMCS Exhauster HEPA Dose Rate Data Appendix B describes using RMCS exhauster dose rate data to estimate aerosol quantities The dose rate at the ed e of the HEPA filter housing is used to estimate a quantity of Csrdquorsquo on the filter Dividing the quantity of Cs on the filter by a weighted average of the Csrdquorsquo concentration in the wastes of the tanks being exhausted provides the waste mass on the filters With the waste mass known tank head space mass Concentrations can be calculated as well as the mass per core or per segment sent to the exhauster The mass of waste in a tank head space was calculated by multiplying the tank head space concentration by the tank head space volume A summary of the results is given in Table 2 The detailed results are given in Table B- 3 The minimum detection ability ofthe dose rate instruments used is 05 m m r Most RMCS exhauster dose rates following completion of an RMCS core were less than detectable An exhauster housing registered slightly above the minimum detectable limit at 07 mRhr after core sampling on S-l IO U-107 BY-IO5 and TX-I 13 This housing read 08 mRhr after completion of sampling on the next tank TX-I 18
CGM Filter Paper Analyses Appendix C describes using CGM filter paper analytical data to estimate aerosol quantities The filter papers are inserted in-line in front of a CGM where they catch the radionuclides in the tank vapors drawn into the CGM These filter papers were removed and analyzed starting in 1997 For conservatism only sample results with a variance 400 were used These analytical data were divided by the specific activity of the radionuclides present on the filter paper for the tank on which the CGM was being operated This provides an estimate of the aerosol mass concentration in the tank head space since a particulate sample is drawn directly from the tank head space during RMCS With this data the mass of waste in the head space and the mass per core and per segment sent to the exhauster can be calculated The mass of waste in a tank head space was calculated by multiplying the tank head space concentration by the tank head space volume A summary of the results is given in Table 2 The detailed results are given in Table C-4
IF1
RMCS Exhauster Decontamination Factor Estimation Method
The RMCS exhauster filter housing DF was calculated by comparing stack record sampler data with the housing NDA data to calculate an efficiency for the housing The housing contains a prefilter and two HEPA filters in series Table 1 lists the RMCS sampling events which provided the data for estimating the DF
Housing NDA and Record Sample Data Comparison Appendix D uses RMCS exhauster stack record sample data to estimate stack Csrdquorsquo emissions for the same time periods when NDA data were obtained The stack emissions were used with the NDA data to calculate a filter housin DF The only radionuclide shown as present by the NDA was Csrdquorsquo No stack record samples showed Cs were available for seven of the nine stack record samples taken during the time NDA data were obtained For the remaining two samples conservative assumptions were made as to the stack total beta concentration
139 present above detection limits However total beta results above minimum detection limits
3
RPP-4826 Rev I
Stack total beta emissions were converted to CsrsquoI7 emissions using the C S rdquo ~ to total beta ratio for the waste in the tank being sampled The filter housing input was calculated by adding this calculated Csrdquorsquo emission to the quantity shown by NDA to be in the housing Dividing the emissions by the input provided the penetration efficiency Results of the housing efficiency and decontamination factor calculations are provided in Table D-I
Discussion of Results
All calculations were based upon radionuclides measured on the exhauster filters in the tank head space air or in the exhauster stack These radionuclide quantities were divided by the specific activity of waste in the tank to provide mass quantities in the air on the filters or in the exhaust stream Appendix E provides the waste specific activities used in this document along with limitations and potential errors associated with using them
The calculated average mass concentration in a tank head space during RMCS ranged from a low of 77E-6 gm3 based upon exhauster housing NDA data to a high of 4OE-5 gm3 based upon CGM filter paper data The weighted average of all methods was 24E-5 gm Welghted averages used in this document were based upon numbers of RMCS segments obtained during application of that method
The average mass concentration is not the peak concentration as illustrated by Figure I Figure 1 is a representation of relative concentrations only not a plot of measured concentrations during a specific sampling event Lines A and B represent aerosol concentrations at points near the drill string and at the tank outlet to the exhauster respectively Line C represents the calculated average concentration in the tank head space The peak concentration in the air to the exhauster will exceed the average tank head space concentration for short periods oftime It is beyond the scope of this document to provide a detailed spatial and time-dependent analysis of tank aerosol concentrations The methods used in this document provide an estimate of an average tank head space mass concentration only
The average mass of suspended solids in a tank head space was estimated by multiplying the average head space mass concentration by the tank head space volume The calculated average mass of suspended solids in a tank head space during RMCS ranged from a low of I 8E-2 g based upon exhauster housing NDA data to a high of 97E-2 g based upon CGM filter paper data The weighted average of all methods was 56E-2 g Comparing 56E-2 g to the 600 g and 100 g used in accident analysis assumptions it is evident that the accident analyses used peak tank head space mass levels three to four orders of magnitude greater than the average mass level in a tank head space during RMCS
Multiplying an average concentration by the tank head space volume to estimate the mass of suspended solids in the tank head space at a given time makes the simplifying assumption that the tank head space concentration is constant with time and uniform within the head space during RMCS As illustrated by Figure I the tank head space concentration is not constant with time or uniform within the head space When determining a maximum value for mass of solids in a tank head space engineering judgement needs to be applied that evaluates all the parameters involved that could increase or decrease the average mass value provided in this document With all other variables being equal the mass concentration and mass of suspended solids in a tank head space will also be affected hy the volume of the head space and the exhaust flow rate The head space volumes of the tanks sampled to date are typical of SSTs The exhauster flow rate is not expected to change for the RMCS exhauster If additional samples are taken in SX tanks where the exhauster flow rate is higher than in the four SX tanks which have already been sampled the mass present in the tank head space would be expected to be reduced
The calculated mass of waste sent to an exhauster ranged from lows of 18E-1 gRMCS core and 34E-2 W C S segment based upon CGM filter paper data to highs of 59E-I gRMCS core and 1OE-1 gRMCS segment based upon exhauster housing dose rate data The weighted average of all methods was 42E-1 gRMCS core and 69E-2 gRMCS segment Comparing the average to the 1 kgRMCS core and 35-77 glRMCS segment numbers used for the PTE estimates it is evident that the PTE estimates are conservative by at least three orders of magnitude
Results given in this document based upon total beta or Csrsquordquo data are likely more valid than alpha based results due to the higher concentrations of beta-gamma radionuclides in the waste and their greater ease of measurement when
4
RPP-4826 Rev 1
compared to alpha emitters Equal weight is given to all results regardless of whether based upon total al ha total beta or CsI3rsquo data This provides conservative results since the aerosol values based on total beta or CslfPwere normally lower than those based upon alpha results
The mass per segment numbers should be a better indicator of RMCS aerosol emissions from the tank than the mass per core numbers This is because the quantity of aerosols generated in a tank should be proportional to the time of purge gas flow and bit rotation The time of purge gas flow and bit rotation should be proportional to the number of RMCS segments taken Thus the mass of RMCS generated aerosols sent to an exhauster on a given tank should be roughly proportional to the number of RMCS segments obtained from the tank The number of RMCS segments in a core can vary To date the range has been from 1 to 12 RMCS segments per RMCS core The average has been 5 RMCS segments per RMCS core
The results for mass per core or per segment based on NDA and housing dose rate data have a firmer basis than results based upon CGM filter paper data This is because the RMCS exhauster housing NDA and dose rate methods are a direct physical measurement of essentially all the Csrsquordquo released to the exhaust stream during RMCS Aerosol measurements based upon HEPA dose rate are conservative as the filters showed no detectable dose rate for three of the five periods evaluated and barely perceptible readings after the other two
The results for tank head space concentrations and mass of waste in a tank head space during RMCS based on CGM filter paper data have a firmer hasis than results based on housing NDA or dose rate This is because the CGM filter paper data is a direct measurement of the concentration in the air in a tank head space during the time when aerosols are being generated The CGM filter paper data should provide a higher tank head space mass concentration than that calculated by filter housing NDA or dose rate This is because aerosols are only generated during times when the CGM is operating and the CGM operates for less time than the exhauster does Since the concentration is based upon dividing a filter quantity by the volume of gas passing through the filter the volume of gas in proportion to the material on the filter will be less for the CGM filter paper than for an exhauster filter resulting in a higher concentration based on CGM filter paper data A factor is included in the CGM based concentration to account for radionuclides in the dome space that have not settled out or been removed by the exhauster when the CGM is shut Off
The average results for all methods were within reasonable agreement with each other considering all the variables and assumptions involved The filter housing DF is in good agreement with expected values
This document contains seven appendices Appendices A-C provide particulate results based upon RMCS exhauster housing NDA RMCS exhauster housing dose rates and CGM filter paper data Appendix D provides an RMCS exhauster filter housing DF based on housing NDA and stack record sample data Appendix E provides waste specific activities and Appendix F provides the raw data used in Appendices A-D Appendix G provides references for this document
Conclusions
The results in this document are based upon RMCS operating experience from startup of nitrogen-purged RMCS in November 1994 through June 1999 Table 2 summarizes the information presented in the appendices Based upon this information and the lack of any significant aerosol formation seen in in-tank videos it can be concluded that past estimates of aerosol concentrations used for regulatory permits and accident analyses were conservative by a nominal three orders of magnitude
In order to estimate mass releases for regulatory permits the overall emissions with time are needed as a basis for the PTE estimates For future permits the mass per core or mass per segment values in Table 2 can be used directly with conservatism added if deemed appropriate for the tanks to be sampled When estimating maximum concentrations or maximum mass quantities in the tank head space for use in accident analyses additional conservatism needs to be added to the average concentration and mass values in Table 2
5
RPP-4826 Rev I
Tank and Date Sampled
Table 1 Summary Of Aerosol Estimation Methods Used
RMCS Aerosol Estimation Methods Exhauster Number of Used
Housing DF RMCS Cores Riser Used Period6 HEPA CGM NDA and and RMCS
Exhauster Operating Sample Exhauster
NDA Dose Filter RMCS Stack Segments Taken
BY-IO5 1998
No RMCS segments taken from BY-108 or from TX-I 13 Riser 3 using Exhauster B Any material retained on I
the filters during these operating times was assumed to come from next RMCS sampling event with the same exhauster BY-IO5 in 1998 shown as separate exhauster installations since stack record samples were pulled after each riser was sampled
Includes RMCS cores and segments only PMCS cores and segments obtained during exhauster operation not included A total of 23 RMCS cores and 115 RMCS segments were taken between 1194 and 699 The sum of cores and segments is less than sum of cores and segments obtained during data collection periods at lei since more than one aerosol estimation method was used for some sampling periods
One CGM filter paper was used for both cores in SX-102 and for both cores in U-107 3
See Appendix F for explanation of exhauster operating periods
6
RPP-4826 Rev I
Table 2 Summary Of RMCS Aerosol Data
Weighted average based upon number of RMCS segments taken with each method
7
e
Q 0 c 0 0 - 0 VJ 0 L
2
RFP-4826 Rev 1
APPENDIX A
ESTIMATION OF AEROSOLS GENERATED DURING Rh4CS BASED UPON RMCS EXHAUSTER HOUSING NON-DESTRUCTIVE ASSAY
A-0
RPP-4826 Rev I
APPENDIX A - Estimation Of Aerosols Generated During RMCS Based Upon RMCS Exhauster Housing Non-Destructive Assay
Summary of Method
This method of estimating RMCS aerosol quantities uses non-destructive assay (NDA) of the exhauster housing to determine the C S rdquo ~ quantity (Ci) on the filters inside This quantity is then divided by the C S rdquo ~ specific activity (Cig) in the waste for the tank(s) on which the exhauster and the same filters were present during sampling The resulting mass on the filters divided by the volume of air flowing through the exhauster provides an estimate of the average aerosol mass concentration in the air to the exhauster This value was multiplied by the tank head space volume to obtain the average mass of particulates present in the tank head space during RMCS The mass of waste on the filters divided by the number of rotary cores or segments taken provides the mass per core or per segment sent to the exhauster
Description
There are one prefilter and two HEPA filters in series for each RMCS exhauster Particulates captured on the filters contain radionuclides with C S rdquo ~ bein the predominant gamma emitter By performing an NDA of the exhauster housing filters the quantity of Cslg7 in the housing can be estimated This C S rdquo ~ value is then used to back-calculate to a waste mass on the filters using the mass is used to calculate the concentration of particulates in the tank exhaust stream the total suspended solids in the tank head space and the mass of waste sent to the exhauster for each RMCS core or segment taken
Exhauster operations were divided into six operating periods for evaluation in this document These periods are discussed in Appendix F and shown in Table F-I NDA data were obtained for Exhauster Operating Periods 4 5 and 6 Relevant information for these periods is also listed in Table A-I
Period 4 was for Exhauster C use during RMCS for both cores in S-l IO U-107 BY-IO5 and the first core in TX-I 13 The filters and housing were new prior to RMCS in S-110 No filter changeouts were made during this period the accumulated particulates from these RMCS events were retained on the housing prefilter primary HEPA and secondary HEPA
Period 5 was for Exhauster B use during RMCS for the second core in TX-I 13 The filters and housing were new prior to RMCS in TX-113 No filter changeouts were made during this period Exhauster B also ran for a short time during the first core in TX-113 but no RMCS segments were taken when the exhauster was operating Stack record samples (see Appendix D) indicated small levels of aerosols were present in the stack exhaust during this time period Any material collecting on the filters during this time period would show up and be counted as part of the aerosols generated during the 2rdquod RMCS core
Period 6 was for Exhauster C use during RMCS for both cores in TX-I 18 During Period 6 the filters also contained the waste particles from Period 4 No filter changeouts were made durin this period The aerosol mass generated due to RMCS in TX-I 18 was determined from the increase in Cs on the filters between Period 4 and Period 6
A description of the sampling method used for the NDA obtained following Period 4 is provided in Greager 1999 The same method was used for the NDA following Periods 5 and 6 The NDA consisted of a gamma energy analysis of the exhauster housing performed at points adjacent to the prefilter first HEPA and second HEPA The detector was mounted outside the housing and inside a lead collimator The collimator was used to minimize the background count rate and contribution from adjacent filters CsIh was the only radionuclide reported as present The NDA compared the count rates from the exhauster housing with the count rate of an National Institute of Standards and Technology (NISampT) traceable in an equivalent geometry to the RMCS exhauster housing The count rates from housing filter readings were divided by the count rate for the source to give a reported quantity of Cslrdquo on the filters
concentration in the tank waste This filter waste
3 B
source located in the middle of a filter
A- 1
RPP-4826 Rev 1
Two correction factors were applied to the reported filter Csrdquorsquo values for use in this document These are discussed in the following two sections
Reported NDA Data
The NDA results for Period 4 are provided in Greager 1999 The only radionuclide reported as present on the filters was CsI3rsquo The results are restated in Table A-2
The NDA results for Periods 5 and 6 are provided in Diedeker 1999 The only radionuclide reported as present on the filters was Csrdquorsquo The results are restated in Table A-2
Adjusted NDA Data
The reported results are based upon comparing the count rate for a reference point source located in the middle of a mock-up assembly equivalent to the exhauster housing with the count rate from the same detector inside a lead collimator placed outside the actual exhauster housing Limitations with this method include comparison of a point source with a distributed matrix and the inability of the detector to see the entire filter due to the presence of the collimator Correction factors were used to adjust the reported values to account for these two limitations
The first correction factor accounts for comparing a distributed source to the point source standard The reported results were calculated based upon a point source standard since there are no readily available filter standards with a distributed source The material in the filter housing should be fairly evenly distributed through the filter media however so comparing count rates for the filter housing to a point source standard will result in some error To correct for this error shielding calculations were performed on an exhauster housing filter assuming the CSrdquorsquo was evenly distributed throughout the filter media and then again assuming the activity was a point source in the middle of the filter Foust 1999 provides the results of these Microshield dose rate calculations Using the data in Foust 1999 Schofield 2000a shows that the dose rate at the NDA detector location would be about 0625 mFVhrmCi CSrdquorsquo for a point source and 073 mRhrmCi Cslrdquo for a distributed source To adjust the reported NDA results to what they would have been if an actual distributed standard source was available the reported values need to be multiplied by 0625 + 073 = 086
The second correction factor accounts for the detector not being able to see the entire filter contents due to the detector location inside the lead collimator Using basic geometry Schofield 2OOOa estimated the detector has about a 100 view of 608 of a HEPA filter about a 50 view of 264 of the filter and is shielded from the remaining 128 The detector count rate was thus estimated as being approximately 741 o f what it would be if the detector were not collimated To correct the reported results to what they would have been if an uncollimated detector could have been used the reported values need to be multiplied by I + 0741 = 135
Combining the two correction factors gives a single adjustment factor used of 086 x 135 = 116 Per Table A- 2 the total quantity of Csrdquorsquo reported present in the housing for Period 4 was 0430 mCi This quantity was multiplied by 116 to give 050 mCi Csrdquorsquo The reported results for Periods 5 and 6 were revised in the same manner to give 0032 mCi and 064 mCi C~rsquo~rsquorespectiveIy To determine the net increase in Csrdquorsquo for the housing during Period 6 the value from Period 4 was subtracted from the total or 064 - 050 = 014 mCi Csrdquorsquo
Calculation of Mass Quantity on Filters
Calculation of the mass of waste on the filters requires knowledge of the specific activity of the waste on the filters The specific activities used for each exhauster operating period are given in Table A-I The paragraphs below provide a derivation of the specific activities used
The specific activity values for the waste in each tank sampled is given in Table E-I Rh4CS was performed on more than one tank during Period 4 so a weighted average specific activity was used to calculate the waste mass on the filters during this period The weighted average specific activity was calculated based upon the number of RMCS segments taken from each tank sampled The number of RMCS segments obtained during
A-2
RPP-4826 Rev 1
each period for which NDA measurements were made are listed in Table A-I These values were obtained from Table F-I A weighted average specific activity for the waste on the filters in Period 4 was obtained by
[[O 227 mCigl[lO segl+[Ol2lmCigl[lO seg1+[0225 mCigl[l(l seg]+[Ol30 mCig][l2 seg]]+[SO segments] = 0182 mCi Csrdquorsquog
Calculating a weighted average based upon the number of segments assumes aerosol generation is roughly the same per segment and the specific activity of a radionuclide is constant throughout a tank These assumptions are adequate for the purpose oftbis document Aerosol generation can vary with water content waste hardness depth of sample taken nitrogen flow rate and porosity of the waste An in-depth evaluation of these parameters is beyond the scope of this document The impact of these variables is assumed to average out over all the RMCS segments taken The specific activities used do not vary greatly from tank to tank so any variations will not have a significant impact on the final aerosol results See Appendix E for further discussion of limitations on specific activities used in this document
For Period 5 the filters were new at the start and the only tank sampled with the exhauster was TX-I 13 Therefore the specific activity of CsI3rsquo for TX-I 130130 mCig was used
The same exhauster and filters used for Period 4 were used for Period 6 The net increase in Csrdquorsquo for Period 6 was determined by subtracting the Period 4 Csrdquorsquo from the total Since this net increase was only due to TX- 118 the specific activity of Csrdquorsquo for TX-I 180130 mCig was used for the waste added to the filters in Period 6 (Note it is only a coincidence that TX-I 13 and TX-118 have the same nominal Csrdquorsquo concentration)
The total mass of waste on the filters for Period 4 was thus
050 mCi i 0182 mCig waste = 275 g waste in exhauster housing
The mass of waste added to the exhauster for Period 5 was
0032 mCi + 0130 mCig waste = 025 g waste in exhauster housing
The mass of waste added to the exhauster for Period 6 was
(064 mCi - 050 mCi) + 0130 mCig waste = 11 g waste in exhauster housing
Aerosol Calculations
The tank head space particulate concentration was obtained by dividing the mass of waste sent to the exhaust stream by the volume of air sent to the exhauster The volume of air to the exhauster was obtained by multiplying the exhauster flow rate by the exhauster run times for each tank from Table F-I
For the RMCS exhausters the recorded exhauster flow rate is reported in standard cubic feet per minute (scfm) The RMCS exhauster flow rate is controlled to a nominal 200 scfm The exhauster flow rate was corrected to an actual cubic feet per minute (acfm) before calculating the tank head space aerosol concenmtion Table F-l includes the actual cfm flow rates
The calculated flow rates during RMCS for the tanks sampled during Period 4 were 207 acfm (S-1 lo) 206 acfm (U-107) 208 amp 209 acfm (BY-105) and 203 acfm (TX-I 13) The total volume oftank air through the exhauster during Period 4 was thus
[[207 cfm][ 15978 hr]+[206][27385]+[208][13577]+[209][30792]+[203][30230]][60 minh] = 146 E+7 Arsquo
The average tank head space mass concentration during RMCS in the above tanks was
[275 g + 146 E+7 Arsquo] x [35315 ftrsquomrsquo] = 664 E-6 average g waste per m3 in exhauster inlet
A-3
RPP-4826 Rev I
The gas flow rates and average tank head space mass concentrations during RMCS for Periods 5 and 6 were calculated in a similar manner
The average mass of waste in a tank head space during RMCS was calculated by multiplying the tank head space mass concentration by the tank head space volume from Table F-2 as shown below for S-1 I O
[275 g + 146 E+7 Arsquo] x [89100 ftrsquo] = 167E-2 g waste in S-1 IO head space
The particulate quantities in the other tank head spaces were calculated in a similar manner The weighted average mass in a tank head space during Period 4 was based upon the number of segments taken in each tank
The mass sent to the exhauster per RMCS core or per RMCS segment was obtained by dividing the mass of waste sent to the exhaust stream during each period by the numbers of RMCS cores or RMCS segments obtained during the exhauster operating time The average mass of waste sent to the exhauster during Period 4 is thus
275 g waste + 7 rotary cores = 39E-1 g wastelrotary core
and
275 g waste + 50 rotary segments = 55E-2 g wasteirotary segment
The mass of waste to the exhauster per RMCS core and RMCS segment for Periods 5 and 6 were calculated in a similar manner
All data were input to a spreadsheet to perform the calculations Results are provided in Table A-3
Summary of Calculations
Non Destructive Assay was performed on the RMCS exhauster filter housings used during three separate exhauster operating periods during which IO RMCS cores and 65 RMCS segments were obtained from five tanks Weighted averages of the average tank head space mass concentration average mass of suspended solids in a tank head space and average mass sent to the exhauster per RMCS core or segment for the three periods combined were calculated based upon the number of RMCS segments taken during each period Based upon RMCS exhauster housing NDA data the results indicate that
The average tank head space mass concentration during RMCS was 77E-6 g wastelmrsquo The average mass of suspended solids in the tank head space during RMCS was 18E-2 g waste The average mass sent to the exhauster during RMCS was 52E-1 g wastelcore The average mass sent to the exhauster during RMCS was 63E-2 g wasteisegment
A-4
RPP-4826 Rev 1
APPENDIX B
ESTIMATION OF AEROSOLS GENERATED DURING RMCS BASED UPON Rh4CS EXHAUSTER HEPA FILTER DOSE RATES
B-0
RPP-4826 Rev I
APPENDIX B - Estimation Of Aerosols Generated During RMCS Based Upon RMCS Exhauster HEPA Filter Dose Rates
Summary of Method
This method of estimating RMCS aerosol quantities divides the dose rate increase (mRhr) at the side of the RMCS HEPA filter housing by a calculated dose conversion factor (mRhrmCi C S rdquo ~ ) to obtain an approximation of the radionuclide quantity in the housing This radionuclide quantity is divided by the waste specific activity (mCig) to determine the mass of waste on the HEPA filter Dividing the HEPA filter waste mass by the volume of air passing through the filter provides an estimate of the average tank head space particulate concentration during RMCS Multiplying the average tank head space particulate concentration by the tank head space volume gives an estimate of the average mass of suspended particulates in the tank head space during RMCS Dividing the HEPA filter waste mass by the number of RMCS cores or RMCS segments provides the mass per RMCS core or per RMCS segment sent to the exhauster
Description
Particulates in the exhaust stream are removed by the HEPA filter(s) upstream of the exhaust fan The captured particulates contain radionuclides with CSrsquo~rsquo being the predominant gamma emitter As the particulate quantity on the HEPA filter increases the dose rate at the side of the filter housing will increase proportionately By monitoring the HEPA dose rate at the side of the filter housing the quantity of Csrsquordquo on the HEPA can be estimated This C S rdquo ~ value is then used to back-calculate to a waste mass quantity on the filter using the Csrsquordquo concentration in the tank waste This filter waste mass quantity is used to calculate the concentration of particulates in the tank exhaust stream the total suspended solids in the tank head space and the mass of waste sent to the exhauster for each RMCS core or segment taken Although radionuclides will be trapped on both the prefilter and the primary HEPA filter with a very small amount on the secondary HEPA calculations in this section were based upon the simplifying assumption that all the activity was on the primary HEPA filter
During RMCS exhauster operation the dose rate in m M r at the side of the HEPA filter housing is periodically measured with an Eberline RO-3B per procedure to indicate when radioactive particulates are building up on the filter The limit of detection of the RO-3B is 05 mRhr
Exhauster operations were divided into six operating periods for evaluation in this document These periods are discussed in Appendix F and shown in Table F-I Housing dose rate data were obtained for Exhauster Operating Periods I 24 5 and 6 Relevant information for these periods is also listed in Table B-I Dose rate data are available and were used for all tanks on which an RMCS exhauster was present and RMCS samples were taken This includes BY-106 BY-IO5 (1995) BY-I IO S-l I O U-107 BY-IO5 (1998) TX-113 and TX- 1 18 The dose rate at the end of a period was used as the basis for calculating radionuclides on the filters The only operating period for which dose rate data were not used for estimating filter radionuclide content was Period 3 Period 3 was for RMCS in SX farm using the SX exhauster
The dose rate at the side of the SX exhauster HEPA filter housing was measured during RMCS of SX farm tanks (for sampling of tanks SX-lot SX-102 SX-103 and SX-105) but the data are not useful for estimation of aerosol quantities because the SX exhauster draws on 13 tanks in parallel or in series with the tank being core sampled Many of the tanks have a much higher off gas flow rate than the sampled tank In addition there is background radiation in the area of the SX exhauster filter housing making any increase in the housing dose rate during RMCS difficult to detect
Dose Rate Data
The dose rate data for each period is listed in Table 8-2 No dose rates above minimum detectable limits were evident at the sides of any RMCS exhauster in Periods I 2 and 5
Dose rate measurements were less than detectable for Period 4 during sampling of S-l IO and U-107 When sampling on BY-IO5 there were a few readings of 07 m M r but most were ltOS mRhr This variation in
B- 1
RPP-4826 Rev 1
readings is to be expected as the specific instrument person using the instrument and location at which the dose rate is checked can vary with time The final recorded dose rate when sampling was complete on BY-IO5 was lt05 mRhr At the end of Period 4 following completion of the first core in TX-I 13 Exhauster C was listed as having a 07 m M r dose rate
Period 6 used Exhauster C again with the same housing and filters as at the end of Period 4 The final dose rate for this period was 08 m M r
Periods 124 and 5 all began with a new housing and new filters For Periods 12 and 5 it was conservatively assumed that the final dose rate was equal to 05 m M r giving an increase of 05 mRhr for each of these periods For Period 4 the dose rate increase was 07 m M r for this period Since Period 6 used the same housing and filters as Period 4 the increase for Period 6 was 08 - 07 = 01 m M r
The dose rate increase was converted into a CsIh content on the primary filter for each period Foust 1999 provides various dose rates for an RMCS exhauster housing assuming even dispersal of 1 mCi C S rdquo ~ on the first HEPA filter Using these calculations Schofield 2000a estimated a dose rate conversion factor of 16 mRhrmCi C S rdquo ~ at the detector location for an RO-3B The assumption that radionuclides are evenly distributed on the HEPA is a reasonable assumption based upon the exhauster design and the method used to measure the radiation dose rate
Gamma emitting contribute to the dose rate due to bremsstrahlung radiation and other nuclides may provide some small additional dose but the major penetrating dose rate contributor in aged SST waste is CSrdquo~ Ignoring the presence of all radionuclides (including Srm) except C S rdquo ~ in calculating a HEPA filter waste mass will provide a conservative result This is because assuming all radiation present is due to C S rdquo ~ will result in overestimating the C ~ I ~ ~ c o n t e n t of the filter housing which in turn will result in overestimating the waste mass on the HEPA filter
Dividing the HEPA dose rate for each exhauster installation by the dose conversion factor of I 6 mRhrmCi results in an increase of 031 mCi Csrdquorsquo on the RMCS exhauster filters for Periods I 2 and 5044 mCi for period 4 and 0063 mCi for Period 6
Calculation of Mass Quantity on Filters
Dividing the Csrdquorsquo content of the filters by the specific activity of C S rsquo ~ ~ in the waste gives the estimated mass of waste sent to the exhauster The specific activity value used for the waste in each tank sampled is given in Table E-I Since RMCS was performed on more than one tank in Periods 1 and 4 a weighted average specific activity was used for these periods The weighted average specific activity was calculated based upon the number of RMCS segments taken from each tank sampled during that period The number of RhKS segments obtained during each period are listed in Table B-I These data were obtained from the individual tank data in Table F- I Calculations to estimate the specific activity of waste mixtures were performed in the same manner as shown in Appendix A For Periods 2 5 and 6 RMCS samples were taken in only one tank The waste specific activity used for these periods was the specific activity of the tank sampled The specific activities used for each exhauster operating period are given in Table B-I
For all exhauster installations except BY-IO6 in 1994 and 1995 the RMCS exhausters were hooked directly to the waste tank When sampling BY-106 a prefilter was installed in the tank riser between the tank and the exhauster The prefilter was not used for BY-I IO in Period 1 or for any other tank in any other period Thus for Periods 2 4 5 and 6 the mass of waste on the HEPA was assumed equal to the mass of waste leaving the tank risers For Period 1 the mass of waste on the HEPA had to be adjusted for the BY-106 prefilter DF when estimating the combined mass of waste leaving the BY-IO6 and BY-I IO tank risers The mass of waste on the HEPA for Period 1 was
[031 mCi] [IO00 pCimCi] = 310 pCi
[310 pCi Csrdquorsquoon HEPA] + [I77 pCi C S rdquo ~ ~ waste] = 177 gwaste on HEPA
is the predominant radionuclide contributor to filter dose rates Beta emitting Srw can
on HEPA
B-2
RPP-4826 Rev 1
A decontamination factor (DF) of 5 was used to account for radionuclide removal by the BY-IO6 prefilter (see Appendix D for basis ofprefilter DF) There were 1 1 RMCS segments taken from BY-IO6 and 13 from BY- 1 IO The total mass ofwaste assumed to exit the tank risers was therefore
[ I 77 g waste] [ 1 1 + 131 [[I 151 + 131 = 28 g waste from tank risers
The DF of 5 to account for the prefilter is only applicable to the RMCS of BY-IO6 in 1994 and 1995 for all other exhauster periods the mass of waste on the HEPA was equal to the mass of waste sent to the exhauster riser
The mass of waste sent to the exhauster for Period 2 was
[031 mCi] [IO00 pCimCi] = 310 pCi Csrdquorsquo on HEPA
[3 IO pCi C S rdquo ~ on HEPA] + [225 pCi CsiI7g waste] = I 39 g waste from tank
Using the same formula the mass of waste to the exhauster from Periods 4 and 5 was 241 and 240 g respectively and the increase in waste on the filters for Period 6 was 048 g
Aerosol Calculations
The mass sent to the exhauster per RMCS core or per RMCS segment was obtained by dividing the mass of waste leaving the risers by the number of RMCS cores or RMCS segments obtained during the exhauster operating period
The tank head space particulate concentration was obtained by dividing the mass of waste leaving the riser by the volume of gas sent to the exhauster This volume of gas sent to the exhauster was obtained by multiplying the exhauster flow rate by the exhauster run time from Table F-I The calculations for aerosols generated based upon HEPA dose rates use acfm while the exhauster flow is recorded in scfm so the actin flow rates in Table F- 1 were used
The average mass of aerosols in the tank head space was obtained by multiplying the average tank head space particulate concentration by the tank head space volume from Table F-2
Following is an example of how the mass per RMCS core mass per RMCS segment average tank head space mass concentration and average mass of aerosols in the tank head space were calculated for Period 1 Data used are from Tables E-I F-I and F-2
[200 scfm] [2992+2916] [84 + 4591 + 528 = 21 1 acfm to exhauster from BY-IO6 in 11-1294
using same formula results in 210 acfm for BY-IO6 in 195 and 209 acfm for BY-I IO
28 g waste + [((21 1 acfm)(4878 hr)+(21O)(l867)+(209)(1125))(60 minhr)]= 12E-6 g wastelf to risers
[12E-6 amp] [35315 fmrsquo] =43E-5 g wastemrsquoto risers
[12E-6 gftrsquo] [53700 Arsquo in BY-106 head space] =66E-I g waste in BY-IO6 head space during RMCS
[12E-6 piftrsquo] [92000 ftrsquo in BY-110 headspace] = IIE-l g waste in BY-I10 head spaceduring RMCS
[28 g waste] [5 RMCS cores] = 56E-1 g waste per core to riser
[28 g waste] + [24 RMCS segments] = 12E-1 g waste per segment to risei
8-3
RPP-4826 Rev 1
All data were input to a spreadsheet and the mass to exhauster per RMCS core mass to exhauster per RMCS segment average tank head space mass concentration and average mass of aerosols in the tank head space were calculated for each of the RMCS exhauster operating periods in the same manner as shown above Results are given in Table 8-3
Summary of Calculations
RMCS exhauster operations were segregated into five operating periods during which RMCS was performed The Exhauster B data for BY-IO8 and TX-I 13 riser 3 was not used in these calculations as no RMCS was performed when the exhauster was operating Exhausters were operated in seven tanks during which 16 RMCS cores and 92 RMCS segments were obtained Based on RMCS filter housing dose rate data the results indicate that
These values are conservative as the assumed dose rate at the end of RMCS for Periods I 2 and 5 was assumed to be 05 mRhr In addition using a DF of 5 for the BY-IO6 prefilter skews the results high The in-tank prefilters used in both BY-IO6 sampling events showed no detectable contamination
Operatin Periods 4 and 6 were the only periods with exhauster housing dose rates above detectable The 044 mCi Csrsquordquo and 0063 mCi CsIh increase on the filters for these two periods based upon dose rate data correspond to the 050 mCi CsI3rsquo and 014 mCi Csrdquorsquo increase on the filters for these two periods based u on NDA data (see Appendix A) The 031 mCi C S rdquo ~ for Period 5 is significantly above the 0032 mCi Cslrsquolsquofor the same period determined by the NDA but this is due to assuming the housing dose rate was equal to the minimum detectable 05 mRhr
The average tank head space mass concentration during RMCS was 22E-5 g wastem3 The average mass of suspended solids in the tank head space during RMCS was 47E-2 g waste The average mass sent to the exhauster during RMCS was 59E-1 g wastelRMCS core The average mass sent to the exhauster during RMCS was 1OE-1 g wastelRMCS segment
B-4
v m
__ ~~
RPP-4826 Rev 1
APPENDIX C
ESTIMATION OF AEROSOLS GENERATED DURING RMCS BASED UPON CGM IN-LINE FILTER PAPER ANALYSES
c-0
RPP-4826 Rev I
APPENDIX C - Estimation Of Aerosols Generated During RMCS Based Upon CGM In- Line Filter Paper Analyses
Summary of Method
This method of estimating RMCS aerosol quantities uses radionuclide assay data from in-line filter papers located upstream of continuous gas monitors (CGM) sampling the tank air for flammable gases during RMCS The radionuclide content of the filter paper is divided by the waste radionuclide specific activity and the air flow through the CGM to obtain an estimate of the average mass concentration in the tank head space during the time period the CGM is on Multiplying the estimated average tank head space mass concentration by the tank head space volume gives an estimate of the average mass of particulates in the tank head space during RMCS To obtain the mass per RMCS core or per RMCS segment sent to the exhauster the tank head space average mass concentration is multiplied by the volume of gas sent to the exhauster then multiplied by a correction factor to account for particulates in the head space removed by the exhauster when the CGM is not operating and divided by the number of RMCS cores or RMCS segments
Description
During most tank waste intrusive activities performed since 1996 an intrinsically safe CGM located above ground has been used to continually monitor the tank air for flammable gases during in-tank activities The CGM sampling method draws air directly from the tank head space During RMCS the CGM sampling line is placed in the tank dome space The sampling line is located between the sampling riser and the exhaust riser if practical A pump in the CGM draws tank air up through the line at 05 litmin for measurement of the lower flammability limit (LFL) by the CGM A filter paper is installed in the sampling line upstream of the CGM to protect the unit from internal contamination
Following CGM use the CGM filter papers are normally discarded after monitoring them in the field for contamination To help estimate the tank head space particulate levels during RMCS these filter papers were retained and analyzed in the 222-S laboratory following removal from all tanks in which RMCS was performed from the fall of 1997 through April 1999 Data were collected for the four tanks in SX farm in which RMCS was performed and the next four tanks on which the RMCS exhauster was deployed These tanks are listed in Table c-I Reported CGM Data
The CGM operational data used to estimate aerosol levels during RMCS includes CGM operating times CGM flow rates and filter paper analytical data A summary report containing all the field operating data sheets for CGM usage and lab data was prepared following completion of sampling on each tank for all tanks except TX- 113 For TX-I 13 a separate report was prepared following each core These reports are References CGM-I to CGM-9 The CGM data from these reports are provided in Table C-2
There were 14 CGM installations during RMCS when CGM filter papers were collected and analyzed Each of these installations had Csrdquorsquo total alpha and total beta quantities measured on the filter papers resulting in 42 data points Eight of the measurement results were very low and had errors of gt+-loo These values were not used resulting in a net of 34 data points for calculating average head space mass concentrations based upon CGM data
Calculated Tank Head Space Radionuclide Concentrations
To calculate the average tank head space radionuclide concentrations during RMCS the filter paper radionuclide quantities were first divided by an efficiency factor to account for radionuclides which may not have been captured on the paper This adjusted radionuclide value was divided by the volume of tank air passing through the paper to give the average tank head space radionuclide concentration
The efficiency used for most stack samplers onsite is 73 (see Appendix D) Estimates attached to References CGM-I to CGM-9 indicate the CGM filter paper sampling method used should have a sampling efficiency
c- 1
RPP-4826 Rev 1
exceeding 73 For conservatism a sampling efficiency of 50 was assumed in this document for the CGM filter paper method
The estimated Csrdquorsquo total alpha and total beta concentrations in the tank vapor space were calculated by dividing the radionuclide quantity on the filter paper from Table C-2 by the assumed CGM sampling efficiency of 05 and the volume of gas going to the CGM The volume of gas going to the CGM was calculated by multiplying the time of CGM operation from Table C-2 by the CGM flow rate of 500 mlmin For example the calculated SX- 101 head space C~rsquorsquo~concentration based upon analysis of the CGM filter papers used during RMCS of riser 19 is
[[26E-4 pCi + 051 + [[I755 min][500 mlmin]] = 59E-I0pCiml
All radionuclide concentrations were calculated in a similar fashion Results are given in Table C-3 Table C-3 lists the radionuclide concentrations for all 42 data points The eight radionuclide concentrations not used for estimating mass concentrations are noted
Table C-3 also contains the calculated number of tank head space changeouts by the tank exhauster during CGM operation Tank head space changeouts were calculated by multiplying the exhauster flow rates (in actin) from Table F-1 by the CGM run times from Table C-2 and dividing by the tank head space volumes from Table F-2 The number of tank head space changeouts during CGM operation was used when estimating the waste mass sent to the exhauster See Aerosol Calculations section below for explanation
Aerosol Calculations
Average tank head space mass concentrations based upon CGM filter paper data were calculated by dividing the head space radionuclide concentrations from Table C-3 by the waste specific activities for each tank sampled The waste specific activities used came from Table E-I and are listed again in Table C-I The average of the mass concentrations based upon radionuclide data for each tank was used as the average head space mass concentration for that tank For example the calculated SX-IO1 head space mass concentration analysis from the CGM filter papers used during RMCS of riser 19 is
[59E-10 pCi Csrdquorsquoml+ 112 pCi C S rdquo ~ ~ waste] [ 28317 mlftrsquo] = 1 SE-7 g wasteA3 based upon C S rdquo ~
[ I 7E-I I pCi T A M + 504E-1 pCi TAg waste] [ 283 17 mlftrsquo] = 94E-7 g wasteamprsquo based upon Total Alpha
[43E-9 pCi TBml+ 357 pCi TBg waste] [ 28317 mlArsquo] = 34E-7 g wastel based upon Total Beta
[ [ I 5E-7 + 94E-7 + 34E-7 g wasteArsquo] f 31 = 48E-7 g wasteamp
[48E-7 g wastelt ] [3531467 Arsquom3] = 17E-5 g wastemrsquo
All tank head space mass concentrations were calculated in the same manner The results are presented in Table C-4 The weighted average tank head space mass concentration during RMCS was based upon the number of RMCS segments taken for each data point
The average aerosol mass in the head space during RMCS was calculated by multiplying the average tank head space mass concentration by the tank head space volume from Table F-2 For the same data point as above
[48E-7 g waste Arsquo] [115E+5 Arsquo] = 55E-2 g waste in SX-IO1 head space during RMCS
All average mass quantities present in the tank head space during RMCS were calculated in the same manner using a spreadsheet The results are provided in Table C-4 The weighted average mass of waste in a tank head space in Table C-4 was calculated based upon the number of segments obtained for each data point
Estimation of the mass of waste sent to the exhauster per RMCS core or segment requires calculation of the total mass of waste sent to the exhauster Multiplying the average head space concentration during RMCS by the exhauster flow rate (in acfm) and the time of CGM operation will give the mass of waste sent to the exhauster during the CGM time frame only While the large majority of mass of waste aerosols will have exited the tank or
c -2
RPP-4826 Rev I
resettled by the time the CGM is shut off there could be some residual suspended particles remaining These would eventually pass to the exhauster but would not be picked up by the CGM filter since it was not in service An adjustment factor was used as described in the following paragraphs to account for particles that may exit to the exhauster following shut down of the CGM
Particulates are generated by RMCS when purge gas is blowing out the drill string and the bit is rotating under the waste surface This time averages about six minutes per segment Multiplying the number of RMCS segments per core by six minutes per segment and dividing by the number of minutes of CGM operation shows the creation of particulates will only occur during a nominal 3-4 of the time the CGM is operating During RMCS the normal practice is to install the CGM turn it on when personnel enter a tank farm and keep the unit in constant operation for the remainder of the shift When the portable RMCS exhauster is used the exhauster is normally started at least an hour before RMCS is initiated and kept in operation until it is time to halt operations for the week The SX exhauster is kept in constant operation Comparing exhauster operating times from Tables F-l with CGM operating times from Table C-I it can be seen the CGMs are in operation about 3-15 of the time the RMCS exhauster is operating on a tank This time comparison wasnrsquot estimated for the SX exhauster since the SX exhauster is in constant operation
With CGM operation much longer than the time period when particulates could be generated the majority of particulates generated by RMCS should have settled or been exhausted during the CGM operating period Table C-3 shows the tank head space changeouts made by the exhauster during CGM operating periods ranged from 084 to 63 The average was 24 With the CGMs operating 25-33 times longer than the aerosol generation periods and an average of over two tank head space changeouts during CGM operation the large majority of aerosols generated during RMCS will have settled out or been removed by the exhauster by the time the CGM is shut off To account for particulates remaining in the tank head space after the CGM was turned off that are subsequently removed by an exhauster it was conservatively assumed that 20 of the total mass of particles generated during RMCS were not removed from the tank head space during the CGM operating period Therefore the product of the tank head space concentration and the volume of air sent to the exhauster during the time of CGM operation was multiplied by a factor of 125 (lOOl80) to estimate the total mass of waste sent to the exhauster as a result of RMCS This is shown below for the same SX-IO1 riser 19 data point in the above calculations
[48E-7gA3] [IOOmin] [I755 min] [125]= 11E-l gwastetoexhauster
This value was divided by the number of RMCS cores and RMCS segments from Table C-1 to provide the grams per core and grams per segment in Table C-4 as follows
[ I I E- 1 g waste to exhauster] i 1 core = 11 E-I g wastelRMCS core to exhauster
and
[ 1 I E- 1 g waste to exhauster] + 5 segments = 2 I E-2 g wastelRMCS segment to exhauster
All mass per core and mass per segment values were calculated in the same manner using a spreadsheet The results are provided in Table C-4 The weighted average mass per core and mass per segment in Table C-4 were calculated based upon the number of cores or segments obtained for each data point
Summary of Calculations
There were 34 valid CGM filter paper data points from 14 RMCS CGM sampling periods in eight tanks during which I5 RMCS cores and 79 RMCS segments were obtained Based upon CGM filter paper data the results indicate that
The average tank head space mass concentration during RMCS was 4OE-5 g wastem3 The average mass of suspended solids in the tank head space during RMCS was 97E-2 g waste The average mass sent to the exhauster during RMCS was 18E-1 g wastelRMCS core The average mass sent to the exhauster during RMCS was 34E-2 g wastelRMCS segment
c - 3
RPP-4826 Rev 1
Ignoring all CGM filter paper analytical data points with a variance gtloo will result in conservative results These data points indicate negligible radioactivity was present If a value of zero was assigned to each data point with an analytical error of gtloo instead of ignoring the data point the weighted average particulate quantities in Table C-4 would be reduced by about 12
The average tank head space mass concentrations based upon CGM data will be higher than the average tank head space mass concentrations based upon filter housing NDA or dose rate The RMCS exhauster received tank air from the shifts when sampling was performed and during some of the off-shifts when no sampling was done The CGMs were only operated during the shifts when sampling was performed The air concentration drawn into the CGM and the RMCS exhauster should be roughly the came during the operating shifts but somewhat less during the off-shifts Therefore the tank head space concentration will be higher when based upon CGM data This does not impact the mass of waste sent to the exhauster per core or per segment
c -4
I
- ~
RFP-4826 Rev 1
APPENDIX D
ESTIMATION OF Rh4CS EXHAUSTER HOUSING DECONTAMINATION FACTOR
D-0
RFrsquoP-4826 Rev 1
APPENDIX D - Estimation of RMCS Exhauster Housing Decontamination Factor
Summary of Method
This Appendix estimates a Decontamination Factor (DF) for the RMCS exhausters using housing NDA data and applicable stack record sample data The Csrdquorsquo in the exhauster effluent is divided by the C S rdquo ~ in the exhauster inlet to provide a penetration efficiency The reciprocal ofthe penetration efficiency is the DF
Description
Each RMCS exhauster has an isokinetic sampler located on the stack downstream of the blower and HEPA filters A small pomp pulls air from the exhaust stack into a filter paper at a rate proportional to the exhaust flow Radionuclides in the exhaust stream passing through the sample line are caught on the filter paper The stack operating time and flow rate are recorded When the record sample filter paper is removed the filter paper is analyzed in a laboratory for radionuclides The radionuclide concentration in the stack effluent stream is calculated by dividing the quantity of material on the filter paper by the volume of air through the sampler and then dividing again by a factor to compensate for stack sampler and filter paper efficiency
Multiplying the total beta stack effluent concentration by the total off gas flow gives the total beta emissions from the exhauster The total beta emissions are multiplied by the Csrdquorsquo to total beta ratio for the waste in the tank) being exhausted to give an estimate of the C S rdquo ~ emission The C S rdquo ~ on the filters determined by NDA of the housing (see Appendix A) is added to the C S rdquo ~ emissions to give the total C S rdquo ~ input to the filter housing Dividing the emissions by the input gives the filter housing penetration efficiency Subtracting the penetration efficiency from 1 O gives the filter housing efficiency Dividing 1 O by the penetration efficiency gives the DF
RMCS Stack Record Sample Data
RMCS exhauster stack record samples are taken after completion of each sampling event on a tank Normally this is after all cores on that tank have been obtained but for BY-IO5 in 1998 record samples were taken following each core Record samples are also taken at the end of each year All samples are analyzed for total alpha and total beta At the end of each year all the filter papers for that year are composited and analyzed for individual radionuclides Sample results are entered into the Automated Bar Coding of Air Samples at Hanford (ABCASH) and Environmental Release Summary (ERS) databases Several ofthe filter papers from 1998 were reanalyzed using a longer count time to bring the error rate down
Schofield 2000b compiled and evaluated all available RMCS exhauster stack record sample data filtered out the unusable data provided derivation for the stack sampling efficiency factor and summarized the results Most of the data points were so low as to be unusable since the results were either negative or had error variances gtloo
Column 5 of Table D-1 provides the stack effluent concentrations used for calculation of the filter housing DF The stack effluent data in Table D-l come from Schofield 2000b These values include a 073 sampling efficiency factor
Calculation of RMCS Filter Housing Decontamination Factor Based upon Housing Inlet and Outlet Data
The RMCS exhauster housing NDA and stack record sample data available for exhauster Operating Periods 4 5 and 6 were used to estimate an actual DF for the RMCS exhauster housings The housing NDA data is for CSrdquo~ but there are no usable Csrdquorsquo concentrations for the RMCS exhauster outlet The RMCS exhauster stack Csrsquordquo concentrations are either negative have a variance gtloo or are not available Total beta analyses are available however so the stack eftluent C S rdquo ~ concentrations were estimated by multiplying the total beta concentration by the ratio of Csrdquorsquo to total beta in the tank waste
Column 2 of Table D-l lists the increase in CSrsquo~ on the filters for each operating period as determined by NDA This data was obtained from Table A-2
D- 1
RPP-4826 Rev 1
Column 4 of Table D-l lists the stack exhaust volume for each stack record sample period The stack exhaust volume for the exhauster installation on S-l IO was calculated by
[ZOO std ft3min][15978 hrs] [60 minhr] = 199E+6 std ftrsquo
All other stack volumes in Table D-l were calculated the same way Unlike in Appendices A B and C no adjustment was made to change the 200 scfm to actual cfm This is because the RMCS stack record sample concentrations from Table D-3 are based upon a 200 scfm flow rate rather than the actual flow rate Since the concentrations are on the same basis as the flow rate there is no need to correct to acfm
The total beta emissions for the RMCS exhauster stack were calculated by multiplying the volume by the concentration For the same S-l IO data point
[199E+6 ft3] [18E-15 pCiml] [28317mlft3] [mCi1000 pCi] = 1OE-7 mCi total beta
All other total beta emissions in Table D-l were calculated the same way
The Csrdquorsquo to total beta ratio was calculated from data in Table E-I For the same S- l I O data point
326E+5 Ci CsI3rsquo f I 14E+6 Ci total beta = 029 Ci CslhCi total beta = 029 rnCi CsrdquorsquomCi total beta
The Csrsquordquo emission for the same S-l IO data point was thus
[I OE-7 mCi total beta] [029 mCi CsrdquorsquomCi total beta] = 29E-8 mCi Csrdquorsquo
All Csrsquordquo emissions in Table D-l were calculated in the same manner
The penetration efficiency for each operating period was calculated by dividing the exhauster outlet by the filter inlet Csrdquorsquo quantities For operating period 4 this was
[81E-6 mCi] f [5OE-I + 8IE-6 mCi] = 16E-5 = 16E-3
The DF for operating period 4 is
1 + 16E-5 = 62E+4
The overall DF for periods 4 5 and 6 was calculated by dividing the efluent from all three periods by the total filter input
[95E-6 mCi] f [67E-I t 95E-6 mCi] = 14E-5 = 14E-3 penetration efficiency
I - I 4E-5 = 0999986 = 999986 filter efficiency
1 f 14E-5 = 73E+4 decontamination factor based upon housing inlet and eftluent data
Estimation of Housing Decontamination Factor Based upon General Performance Data
HEPA filters are tested at the manufacturer to a minimum 9997 efficiency using a 03 pm monodisperse aerosol After installation HEPA filters are tested in-place per ASME N5 I O to a minimum 9995 efficiency using a polydisperse aerosol with an approximate droplet size distribution of 99 less than 30 pm 50 less than 07 pm and 10 less than 04 pm The RMCS exhauster housing is tested per ASME N510 and is thus required to have a minimum removal eficiency of 9995 for an aerosol with this approximate size distribution The particle size distribution of the waste aerosols generated by RMCS is unknown but it is assumed that the removal efficiency for RMCS generated aerosols was the same as the removal efficiency for the ASME generated test aerosol
D-2
RPP-4826 Rev I
A 9995 efficiency is equivalent to a DF of 2E+3 while a 9997 efficiency is equivalent to a DF of 33E+3 The actual DF for the RMCS exhauster housing is higher than either of these It has two HEPA filters in series even though the minimum efficiency specified in the NOCs for the RMCS exhausters is only equivalent to one HEPA ERDA 1976 recommends using a DF of 3000rdquo for a filter bank where n is the number of HEPA filters in series This would result in a DF of 9E+6 for the RMCS exhauster housing This is unrealistic Using a DF of 9E+6 will calculate to Csrdquorsquo quantities on the HEPA filtersthat are orders of magnitude above what have been shown to be there based upon the measured dose rates and NDA A DF of 9E+6 would mean the dose rate would have to be almost 100 mRhr at the side of the exhauster housing instead of the 05-08 mRhr dose rates encountered The waste particles will not have the same particle size distribution entering the second HEPA filter as when entering the first The majority of the waste particles will be captured on the I rdquo HEPA filter and although the DF for each HEPA if tested individually using the ASME N5 IO aerosol test method may be 3E+3 (or higher) the overall DF of the two filters in series will not be 3000lsquo This is because the particle size distribution entering the Znd HEPA could have a greater percentage of smaller particles than that entering the 1rdquo
NUREG 1995 included an evaluation of a number of different facility stacks at the Hanford site where the HEPA filter upstream air concentrations were estimated using several different methods This report concluded that back-calculation using a value of 3000rdquo overestimated the upstream radionuclide concentration by three to four orders of magnitude when compared to filter NDA data for the nine stacks for which NDA data were obtained and by three orders of magnitude for the two stacks for which upstream air sample data were available Back- calculation using a value of 3000rdquo was shown to be high by four orders of magnitude for the single stack for which a powder release estimate was available Based upon this information the RMCS exhauster dual filter-in-series housings would have a DF of at least three and maybe four orders of magnitude less than 9E+6 or in the 1E+3 to 1 E+4 range A DF of IE+3 would he less than the minimum permissible under the NOC Comparing the older stack data and design with the newer RMCS exhauster design the minimum DF would be expected to be at least 1E+4
Table D-2 provides the available RMCS exhauster aerosol test data This information was obtained from Waldo 1999 Prior to 1998 the RMCS exhauster primary HEPA filter efficiency and either the secondaly HEPA filter or the overall efficiency for both filters were tested Starting in 1998 only the primary and secondary HEPA filter efficiency were measured The overall efficiency of the two filters in series was only measured three times in 11 setups Twice the overall penetration efficiency was lt0002 and the remaining time the only information that could be found was a value of lt005 Most individual filters had a penetration efficiency of 0002 This appears to be about the limit of the detection equipment Based upon Table D-2 data a penetration efficiency of 0002 (99998 efficiency) is normal for a single HEPA and thus a minimum for an RMCS exhauster housing Assuming a 0002 penetration efficiency for the two filters combined calculates to a DF of 5E+4 (equal to 1 +
000002) for the RMCS exhauster housing
In summary the measured DF for the RMCS exhauster housings over the period from May 1998 through June 1999 was about 73E+4 RMCS aerosol testing prior to use indicates a DF of about 5OE+4 for each of the filters separately but their overall efficiency is not measured Referenced data based on older stacks at Hanford indicate the two HEPA RMCS exhauster housing would likely have a DF of at least IE+4
Estimated Aerosol Levels During RMCS Based Upon RMCS Stack Record Sample Data
Revision 0 of this document used the positive record sample results with variance less than 100 to estimate aerosol concentrations in the exhauster inlet using an assumed exhauster housing DF of 5OE+4 This method of estimating aerosols was eliminated from Revision 1 because the stack concentrations were either too low too scattered or too questionable to provide reliable results There were 112 RMCS stack record sample data points evaluated in Schofield 2000b Excluding the total beta sample results used for estimation of the housing DF there were only ten data points remaining with positive values and variances ltloo the remaining data points were either negative had a variance gtloo or the results were not available
For comparison purposes only Schofield 2000b applied the DF of 73E+4 calculated in this document to the data points not used to calculate the exhauster housing DF to estimate aerosol concentrations upstream of the filters The results showed aerosol levels approximately the same as those estimated using NDA dose rate or CGM filter paper data when a value of zero was used for negative sample results or those with a variance gtloo When only
D-3
RPP-4826 Rev 1
the ten positive results with a variance ltloo were used the aerosol levels calculated to be two to five times higher than those estimated using NDA dose rate or CGM filter paper data Because of the variability of data resulting from the extremely low record sample concentrations and the few useable data points estimation of aerosol levels using record sample data was not included in Revision I See Schofield 2000b for further discussion of the use of record sample data to estimate aerosol levels
Summary of Calculations
A total of nine RMCS exhauster stack record sample data points were used to estimate the RMCS exhauster filter housing decontamination factor These data points were obtained when sampling on five tanks during which 10 RMCS cores and 65 RMCS segments were obtained The overall decontamination factor was 73E+4
Estimation of aerosol generation quantities based upon RMCS stack record sample data is possible However results will likely be skewed high if data points that show non-detectable levels of radionuclides present are ignored instead of using a value of zero for the data point
D-4
RPP-4826 Rev 1
APPENDIX E
TANK WASTE RADIONUCLIDE CONCENTRATIONS USED FOR AEROSOL CALCULATIONS
E-0
RPP-4826 Rev 1
APPENDIX E - Tank Waste Radionuclide Concentrations Used for Aerosol Calculations
The RMCS exhauster NDA data HEPA filter dose rate data CGM filter paper data and stack record sample data provide information on the quantity of radionuclides on the exhauster filters in the tank head space or the exhauster stack during RMCS These radioactivity quantities need to be divided by the waste radionuclide concentration specific activity to determine the mass of waste in the tank head space and in the tank gases sent to the exhauster
The mass quantities in this document were calculated using dry basis radionuclide concentrations Waste particles carried into the tank head space by the purge gas could be wet or dry If wet some of the non-chemically bound water will start to evaporate immediately providing the tank relative humidity is 400 The water present in a waste particle may be chemically bound as a hydrate or free The chemically bound water will not readily evaporate therefore even a ldquodryrdquo particle may have some water associated with it It is impractical to measure the actual water content of the waste particulates caught on the CGM filter paper the exhauster HEPA filters or the stack record sample paper Since the quantity of water in the waste particulates is unknown particulate levels were calculated using dry basis radionuclide concentrations Thus all particulate values given in this document are stated on a dry basis
The waste radionuclide concentrations on a dry basis were calculated from data available in the Tank Waste Information Network System (TWINS) The Best Basis InventorylBest Basis Summary numbers were used These values are the most complete and up to date readily available estimates for Hanford waste tank contents but do not include water The information was downloaded from TWINS into a spreadsheet The total chemical total beta and total alpha quantities were summed in the spreadsheet for all the tanks which were sampled and concentrations for Csrdquorsquo Sr9rsquo total beta and total alpha automatically calculated in pCig These concentrations are provided in Table E-I Because lab techniques for measuring gross beta levels only detect beta particles with a minimum decay energy above 150-200 kev only radionuclides with a decay energy of gt-200 kev were included in the total beta numbers
The TWINS radionuclide concentrations were obtained in December 1999 No corrections were made for decay for this document
The CGM filter paper and stack record sample data indicate the measured radionuclide values are not always in the same ratio to each other as given by TWINS nor are all radionuclides detected that TWINS indicates are present Radionuclides can be distributed unevenly in a tank Soluble fission products (primarily Csrsquordquo) are found in the liquid saltcake and in sludges Insoluble fission products and actinides are found largely in sludges as these are primarily chemical precipitates Sludge could be mixed with saltcake be present in a distinct layer at the bottom of a tank or in several layers in the tank depending upon how waste was transferred into a tank Waste particles may thus not have the same specific activity on a microscopic scale as they would have on a macro scale were the tank contents homogenized During RMCS a top to bottom core sample is attempted resulting in the drill bit and purge gas (which causes aerosols to form) passing through most ofthe waste matrix Assuming the aerosol generation rate is approximately constant during drilling the specific activity of a radionuclide in the suspended solids should be roughly the same as the average specific activity of the same radionuclide in the tank waste While the waste specific activity is probably not homogeneous from top to bottom in a tank and the aerosol generation rate will likely also vary it is beyond the scope of this document to provide an in-depth analysis of all the factors affecting aerosol radionuclide concentration Although sample radionuclide data were not always in the same ratio as provided by TWINS for the purpose of this document the simplifying assumption was made that the average tank specific activity is adequate to provide an approximation of the suspended solids specific activity for all radionuclides Average tank individual radionuclide specific activities were used in the preparation of the exhauster NOCs
The aerosol calculations presented in this document are only as accurate as the TWINS data The combined radionuclide content of all Hanford waste tanks is known fairly well since the overall content is based upon reactor production records CsrdquorsquoSrW recovery data and processing plant discharges Thus TWINS data for all tanks combined should be reasonable There are undoubtedly differences between TWINS data and the actual contents of a specific tank While the specific tank radionuclide data from TWINS used in this document may not be exact deviations from the actual concentrations are assumed to balance out over the number of tanks sampled
E- 1
RPP-4826 Rev 1
APPENDIX F
ROTARY MODE CORE SAMPLING EXHAUSTER AND CORE SAMPLE DATA
F-0
RPP-4826 Rev 1
APPENDIX F - Rotary Mode Core Sampling Exhauster and Core Sample Data
This appendix provides the basic data obtained during RMCS operations which was used in preparation of this document
Basic Operational Data
There have been three RMCS exhausters and three RMCS sampling trucks deployed since starmp of nitrogen- purged RMCS in November 1994 The exhausters are formally designated 296-P-32296-P-33 and 296-P-34 These were originally referred to as parts of RMCS Systems 2 3 and 4 respectively in the Notices of Construction (NOC) for these units The exhauster designations were changed for routine field use in 1996 to exhausters A B and C to avoid confusion with core sampling trucks 23 and 4 since any exhauster could be used with any RMCS truck Exhauster A (2) and RMCS Truck2 have not been used for RMCS since 1995 and are no longer in service for core sampling
Rotary mode core sampling has been conducted in four general time frames since 1994 These time frames were separated by down times for equipment modifications or resolution of environmental permitting and safety concerns For ease of analysis in this document exhauster operations were organized into six distinct operating periods Periods I to 6 were grouped based upon times when the same exhauster and same set of HEPA filters were being used These periods thus overlap with the general operating time frames The four operating time frames were
The first time frame lasted from November 1994 to January 1995 RMCS Truck 2 and Exhauster 2 (A) were used on Tank BY-106 along with an in-tank prefilter This tank provided the initial deployment and testing of the nitrogen-purged equipment in a waste tank During this period radiation dose rates were taken at the side of the exhauster housing Stack record samples were taken in December 1994 and January 1995
The second time frame lasted from July 1995 through October 1995 RMCS Trucks 2 and 4 were used with Exhausters 2 and 3 (A and B) on BY-105 BY-IO8 and BY-I IO During this period radiation dose rates were taken at the sides of the exhauster housings Stack record samples were taken after completion of sampling on each tank No RMCS samples were taken from BY-108 all samples were taken in push mode for this tank
The third time frame began when RMCS was restarted in December 1997 Trucks 3 and 4 were used for sampling of SX-101 SX-103 SX-105 and SX-102 with the SX tank farm exhauster providing ventilation The RMCS exhausters were not used During this period radiation dose rates were taken at the sides of the SX exhauster housing as part of HPT routine surveys SX farm exhauster stack record samples were taken when required by normal operating procedures SX record sampler and filter housing dose rate data were not evaluated for this document It would not be practical using filter dose rate or stack record sample data to estimate the RMCS aerosol addition if any to the SX ventilation system The background radiation around the SX filter housing makes measurement of any small increase in dose rate very difficult to detect The number of tanks being ventilated and the involved off-gas header routings (the exhauster is pulling on thirteen tanks in series or in parallel with the tank being sampled) and any in-tank activities in the SX tanks not being sampled would make it impractical to assess what aerosols resulted from RMCS Beginning with RMCS in SX farm radionuclide analyses were performed on the filter papers protecting the CGMs which draw air out of the tank vapor space for flammable gas detection
The fourth time frame began in May 1998 Between 1095 and 598 Exhausters B and C were extensively modified with new filter housings and other equipment to meet new NOC requirements Trucks 3 and 4 were used with Exhausters B and C (3 and 4) on S-l IO U-107 BY-105 TX-113 and TX-I 18 This period marked the first use ofthe RMCS trucks and RMCS exhausters together following resolution of flammable gas concerns and modifications to the exhausters New filters were installed Radiation dose rates were taken at the sides of the exhauster housings Stack record samples
F- 1
RPP-4826 Rev I
were taken after completion of sampling for each exhauster installation Radionuclide analyses were performed on the CGM filter papers for all tanks except TX-118 An NDA was performed on the Exhauster C housing following completion ofthe first core on TX-I 13 The housing filters when assayed contained aerosols captured by the exhauster following RMCS in S-l IO U-107 BY-105 (1998) and the first core of TX-I 13 Another NDA was performed on Exhauster C following both cores in TX-I 18 An NDA was performed following sampling of the second core in TX-I 13 using Exhauster B The time frame ran through early June 1999 No RMCS samples have been taken after June 1999 nor are any planned for the next few years
For the purposes of evaluating aerosol formation based upon RMCS exhauster housing NDA and dose rate data the exhauster operations were grouped into 6 operating periods These periods are shown in Table F-1 and restated in Tables A-I and B-I All tanks sampled in Periods 1 2 4 5 and 6 were exhausted by the same exhauster with the same housing and filters present during that period Period 3 covered the time the SX exhauster was used during RMCS in SX farm
A brief description of each RMCS tank sampling operation is provided below
Tank 241-BY-1061194 to 1294 RMCS using the nitrogen purge gas system with an exhauster was formally begun on 111794 on tank BY-106 riser IOB Exhauster 2 (A)and Truck 2 were used A sintered metal prefilter was inserted in the riser between the tank and the exhauster A total of eight segments were taken in rotary mode and five segments in push mode until sampling was halted on 122194 One RMCS core was obtained The total exhauster run time was 4878 hours The stack record sample was removed and analyzed following this run period Dose rates taken at the side of the exhauster housing during RMCS were all lt05 mRhr The in-tank prefilter was smeared for contamination when removed from the tank with the smears showing less than detectable levels of radionuclides present (Waldo 1999) The prefilter had been washed with an installed spray system prior to removal from the tank but subsequent testing showed the water flow and pressure were too low to have been effective at removing contamination
Tank 241-BY-106195 Following some process modifications RMCS in BY-IO6 riser IOB began again on 11895 Exhauster 2 (A) and Truck 2 were used The sintered metal prefilter was inserted in the riser between the tank and the exhauster RMCS was halted on 12495 over authorization basis and equipment operability issues for RMCS A total of three segments were taken in rotary mode and eleven segments in push mode One RMCS core was obtained The total exhauster run time was 1867 hours The stack record sample was removed and analyzed following this run period Dose rates taken at the side of the exhauster housing during RMCS were all lt O S mRhr The in-tank prefilter was smeared for contamination when removed from the tank with the smears showing less than detectable levels of radionuclides present (Waldo 1999) The prefilter was not washed this time
Tank 241-BY-110795 to 1095 Following resolution of RMCS authorization basis and equipment issues and completion of the fabrication and testing of Trucks 3 and 4 RMCS was begun in BY-I IO on 71195 Exhauster 2 (A) and Truck 2 were used Samples were taken from risers 128 7 128 again and 4 There was no in- tank prefilter used in this or any subsequent RMCS periods Sampling was performed until 102595 when RMCS was halted over flammable gas issues A total of 13 RMCS segments and 56 PMCS segments were taken Three RMCS cores were obtained The total exhauster run time was 1125 hours The stack record sample was removed and analyzed following this run period Dose rates taken at the side of the exhauster housing during RMCS were all lt O S mRhr
Tank 241-BY-108795 to 895 Core sampling was begun in BY-IO8 on 72595 Exhauster 3 (B) and Truck 4 were used Sampling was done in risers 12A and 7 The tank material proved soft enough so that no RMCS segments were required all segments were obtained in push mode although the exhauster was operated during part of the time sampling was performed Sampling was completed 81895 A total of 16 PMCS segments were taken The total exhauster run time was 6617 hours The stack record sample was removed and
F-2
RPP-4826 Rev 1
analyzed following this run period Dose rates taken at the side of the exhauster housing during RMCS were all lt05 mRhr
Tank 241-BY-105895 to 1095 RMCS was begun in BY-I05 riser 12A on 83095 Exhauster 3 (B) and Truck 4 were used This tank has a concrete layer on top about 12-18 inches thick which had to be drilled through Part way through sampling questions arose as to the flammable gas status of the tank and RMCS was halted on 10695 A total of 3 RMCS and 7 PMCS segments were taken One RMCS core was obtained The total exhauster run time was 4413 hours The stack record sample was removed and analyzed following this run period Dose rates taken at the side of the exhauster housing during RMCS were all lt05 mRhr
Tank 241-SX-1011297 to 298 Following resolution of extensive regulatory and authorization basis issues and installation of equipment modifications RMCS started in SX-101 with Truck 4 on 12497 An RMCS exhauster was not used since all SX farm tanks excluding SX-113 and SX-I 15 are ventilated with the SX exhauster Sampling was performed in risers 19 and 4 and was completed on 21098 A total of 9 RMCS and 6 PMCS segments were taken Two RMCS cores were obtained SX exhauster stack record samples and filter housing dose rates were obtained as part of routine operations for the SX exhauster not as part of the RMCS process Filter papers used in the suction line for the CGM were saved and analyzed in the laboratory to estimate the airborne radionuclide concentration in the tank head space Two CGM filter papers were needed for each core as moisture in the tank vapors condensed on the papers in the cold weather and began to restrict tank gas flow to the CGM
Tank 241-SX-103498 to 598 RMCS started in SX-103 with Truck 4 on 42798 The SX exhauster was used for ventilation (see SX- 101 above) Sampling was performed in risers 7 and 1 1 and was completed on 51198 A total of 6 RMCS and 18 PMCS segments were taken Two RMCS cores were obtained During sampling filter papers used in the suction line for the CGM were saved and analyzed in the laboratory to estimate the airborne radionuclide concentration in the tank head space One CGM filter paper was used during each core SX exhauster stack record samples and filter housing dose rates were obtained as part of routine operations for the SX exhauster not as part of the RMCS process
Tank 241-SX-105298 to 598 RMCS started in SX-105 with Truck 3 on 22598 The SX exhauster was used for ventilation (see SX- 101 above) Sampling was performed in risers 6 and 14 and was completed on 51598 A total of 6 RMCS and 20 PMCS segments were taken Two RMCS cores were obtained During sampling filter papers used in the suction line for the CGM were saved and analyzed in the laboratory to estimate the airborne radionuclide concentration in the tank head space Two filter papers were needed for the first core as moisture in the tank vapors condensed on the papers in the cold weather and began to restrict tank gas flow to the CGM One filter paper was used for the second core SX exhauster stack record samples and filter housing dose rates were obtained as part of routine operations for the SX exhauster not as part of the RMCS process
Tank 241-SX-102698 to 798 RMCS started in SX-102 with Truck 4 on 61798 The SX exhauster was used for ventilation (see SX- 101 above) Sampling was performed in risers 8 and 4 and was completed on 7798 A total of 2 RMCS and I8 PMCS segments were taken Two RMCS cores were obtained During sampling filter papers used in the suction line for the CGM were saved and analyzed in the laboratory to estimate the airborne radionuclide concentration in the tank head space One filter paper was used for each core SX exhauster stack record samples and filter housing dose rates were obtained as part of routine operations for the SX exhauster not as part of the RMCS process
Tank 241-S-110598 to 698 RMCS was begun in S-I10 on 51898 Exhauster C (4) and Truck 3 were used This tank marked the first use of an RMCS exhauster since 1995 Sampling was completed on 6498 Risers 6 and 14 were sampled A total of IO RMCS and 8 PMCS segments were taken Two RMCS cores were obtained The
F-3
RPP-4826 Rev I
total exhauster run time was 15978 hours The stack record sample was removed and analyzed following this run period Dose rates taken at the side of the exhauster housing during RMCS were all lt05 mRhr During sampling filter papers used in the suction line for the CGM were saved and analyzed in the laboratory to estimate the airborne radionuclide concentration in the tank head space One filter paper was used for each core Waste particles retained on the exhauster housing filters were part of the inventory subsequently measured by NDA following completion of the first core in TX-I 13
Tank 241-U-107698 to 798 RMCS was begun in U-107 on 61098 Exhauster C and Trucks 3 and 4 were used Sampling was completed on 71598 Risers 7 and 2 were sampled A total of IO RMCS and 19 PMCS segments were taken Two RMCS cores were obtained The total exhauster run time was 27385 hours The stack record sample was removed and analyzed following this run period Dose rates taken at the side of the exhauster housing during RMCS were all 105 mRihr During sampling filter papers used in the suction line for the CGM were saved and analyzed in the laboratory to estimate the airborne radionuclide concentration in the tank head space One filter paper was used for each core Waste particles retained on the exhauster housing filters were part of the inventory subsequently measured by NDA following completion of the first core in TX-I 13
Tank 24l-BY-105798 to 898 RMCS was begun in BY-105 again on 72298 Exhauster C and Trucks 3 and 4 were used Sampling was completed on 82598 Risers 7 and 1 1 B were sampled A total of 18 RMCS and 18 PMCS segments were taken The material was hard enough to require rotary mode sampling all the way to the bottom of the waste but negligible recovery was obtained After RMCS was performed to the waste bottom a PMCS core was taken in the same hole to recover material Two RMCS cores were obtained The exhauster run time was 13577 hours for the first RMCS core and 30792 hours for the second RMCS core Stack record sample information in ABCASH shows 30558 hours operation for the second core but the sampler data sheet shows the time counter was mistakenly reset 234 hours into the run No correction was made to the BY-IO5 2nd core record sample concentration for this document since the error is conservative and results in only slightly higher (ltI) record sample radionuclide concentrations for this core A stack record sample was removed and analyzed following each core giving two record samples for BY-IO5 in 1998 Dose rates taken at the side of the exhauster housing during RMCS were almost all lt05 m R h but a few readings indicated 07 mRihr This variation was assumed due to personnel reading the instrument differently or the fact that the exhauster had been used on enough tanks that by now there was sufficient activity on the filters to cause readings approximately at the background detection level The final reading when both cores were completed was lt05 m R h During sampling filter papers used in the suction line for the CGM were saved and analyzed in the laboratory to estimate the airborne radionuclide concentration in the tank head space One filter paper was used for each core Waste particles retained on the exhauster housing filters were part of the inventory subsequently measured by NDA following completion of the first core in TX-113
Tank 241-TX-113998 to 599 Core sampling was begun in TX-I 13 riser 3 on 92298 Exhauster B (3) and Truck 4 were used at the start This was the first use of Exhauster B since it was modified Exhauster B ran for a total of 8738 hours until being disconnected on 102398 During this time two PMCS segments were taken and no RMCS segments Exhauster C was then installed and operated for 5598 hours from 121098 to 122898 No RMCS or PMCS sampling was performed during this time frame RMCS segments werent taken until 299 Exhauster C ran for a 30230 hours between 122898 and 21299 Sampling was completed on the core from riser 3 on 21299 A total of 12 RMCS segments were obtained during the time Exhauster C was operating Exhauster flow rate for both exhausters was a nominal 200 scfm Stack record samples were taken following Exhauster B removal at the end of 1998 for Exhauster C and following completion ofthe first core with Exhauster C Aerosol calculations were based on only the 30230 hours run time for Exhauster C in 1999 since this was the time period during which RMCS segments were obtained Dose rates taken at the side of the exhauster housing during the short PMCS only sampling period with Exhauster B were all ltOS m R h Dose rates with Exhauster C varied between lt O S mRhr and 07 mRhr The final reading on Exhauster C following completion of the first core was 07 mFUhr During sampling filter papers used in the suction line for the CGM were saved and
F-4
RPP-4826 Rev I
analyzed in the laboratory to estimate the airborne radionuclide concentration in the tank head space One filter paper was used for the core Waste particles retained on the exhauster housing filters were part of the inventory subsequently measured by NDA following completion of this core
Sampling in riser 5 was begun on 41299 using Exhauster B and Truck 3 A total of 6 RMCS and 1 PMCS segments were taken for this core before sampling was halted on 42899 The total exhauster run time for this core was 11712 hours Problems with high vacuum in the tank required the exhauster flow rate to be reduced to 190 scfm to keep the system within pressure limits The stack record sample for the second core was removed and analyzed following the run period Dose rates taken at the side of the exhauster housing during the second core were all lt05 m M r During sampling filter papers used in the suction line for the CGM were saved and analyzed in the laboratory to estimate the airborne radionuclide concentration in the tank head space One filter paper was used An NDA was performed on the exhauster housing following this core The only radionuclides present in the housing were those from this core or what was removed from the tank head space during the non-RMCS activities in this tank from 92298 and 102398
Some clarification may be needed to explain use of the exhauster operating times and NDA dose rate and record sample data obtained during core sampling on TX-I 13 Core sampling was set up for sampling riser 3 on TX-113 in September 1998 with Exhauster B Exhauster B operated for a total of 8738 hours between 92298 and 102298 The stack record sample was removed at the end of this period The ERS database incorrectly shows the exhauster operated between 111698 and 111998 The ABCASH database shows the stack record sample was removed on 111998 The stack record sample showed positive emuent concentrations during this time period with variances 400 No RMCS samples were taken during this period so the data and time werenrsquot included when calculating RMCS aerosol numbers Exhauster B was removed and Exhauster C installed in late November-early December Exhauster C was operated for a total of 5559 hours between 121098 and 122398 The stack record sample was removed on 122898 No sampling was performed during this period so the data and time werenrsquot included when calculating RMCS aerosol numbers Exhauster C was operated for a total of 30218 hours between 122898 and 2899 All the RMCS segments from riser 3 were taken in this time period so only the data and time for this period were included when calculating RMCS aerosol numbers Exhauster B was used during sampling of riser 5 Exhauster B operated for a total of 11712 hours between 41299 and 42899
Tank 241-TX-l18599 to 699 RMCS was begun in TX-I 18 on 5699 Exhauster C (4) and Truck 4 were used Sampling was completed on 6298 Risers 9B and 12B were sampled A total of 9 RMCS segments were taken there were no PMCS segments Two RMCS cores were obtained The total exhauster run time was 21247 hours The stack record sample was removed and analyzed following this run period The maximum dose rate taken at the side of the exhauster housing following RMCS was 08 m M r CGM filter papers were not analyzed An NDA was performed on the exhauster housing following completion of the two cores The exhauster housing contained the same nuclides as for the first NDA (S-110 U-107 BY-105 and TX-I 13 first core) plus those from TX-I 18
The basic core sampling operational data used in this document includes the number of RMCS cores and segments the exhauster run times and flow rates the RMCS exhauster HEPA filter dose rates and tank vapor space temperatures Table F-l lists the basic operational data This information excluding tank vapor space temperature data was obtained from procedural data sheets in the sampling work packages (References W - 1 to WP-23)
Tank temperature data for the tanks ventilated with the RMCS exhausters was obtained from the TWINS database Plots for each tank were prepared for the time RMCS was conducted and the average value of the highest thermocouple located in the tank (the lowest temperature reading) was estimated and used as the average tank head space temperature during the RMCS period
The SX exhauster flow rates listed in Table F-l are estimates only The combined flow rate for SX-IO1 through SX-106 plus SX-109 (7 tanks) averaged 440 cfm during CY 1996 (Kaiser 1997) for an average of 63 cfm per
F-5
RPP-4826 Rev I
tank Based upon inlet flow measurements at the tank inlet HEPA filters (Fanis 1998) the flow through each individual tank (SX-IO1 through SX-106 plus SX-109) was lt55 cfm at the breather filter Assuming an exhaust flow of 100 cfm for each SX farm tank sampled is therefore conservative
Calculated Data
Calculated data include the tank head space volumes conversion of the RMCS exhauster flow rate from scfm to acfm and the number of tank head space changeouts made by an exhauster during RMCS
Tank head space volume includes the dome space volume above the top of the sidewall plus the void space between the waste surface and the top of the sidewall The formula used to calculate tank head space volumes WN
Head Space Volume in A = (DS + [(H) (12) + HI + Hb - H] (V)) - 748
Where DS = dome space volume gal H = height of tank body sidewall above knuckle A HI = height of tank knuckle area in Hb = height oftank bottom below knuckle in H = height of waste in tank in V =27555 galin of waste in SX tanks 2754 gallin in all others
The tank dome space volumes height of tank sidewall above the knuckle height of tank knuckle area and height of tank bottom below the knuckle were obtained from Reynolds 1999 The height of waste in each tank at the time of core sampling was obtained from the TWINS database Tank dimensional and waste level data are given in Table F-2 along with the calculated tank head space volumes
Aerosol calculations for Appendices A-C require exhauster flow rates in actual cubic feet per minute The RMCS exhauster flow rate is controlled and recorded in standard cubic feet per minute The mass flow rate of the exhauster air is measured and internal logic in the exhauster controller calculates what the volumetric flow rate would be if the temperature and pressure in the exhauster inlet were at standard conditions The standard conditions used in the logic controller are 29921 in Hg (760 mm Hg) and 69F (ZIT)
A correction factor is built into the exhauster control logic that assumes an atmospheric pressure of 2927 in Hg the average atmospheric pressure at Hanford The RMCS exhauster will operate at about 1-2 in H20 negative pressure resulting in about a 2916 in Hg pressure in a waste tank when the RMCS exhauster is operating To revise the indicated scfm RMCS exhauster reading to an acfm value the RMCS exhauster scfm flaw rate was multiplied by (29922916)(T+459)528 where Tis the tank head space temperature in OF The tank head space temperatures in Table F-1 were input to the spreadsheet file used for aerosol calculations and converted to acfm The flow rates in acfm are included in Table F-I
The tank head space changeouts when using the RMCS exhauster were calculated by multiplying the exhauster acfm flow rate by the time of exhauster operation and dividing the result by the tank head space volume Tank head space changeouts are listed in Table F-2
F-6
c
gt 2
RPP-4826 Rev 1
APPENDIX G
REFERENCES
G-0
RPP-4826 Rev 1
APPENDIX G - References
Diedeker 1999 NDA of RMCS HEPA Filters L P Diedeker WMH E-Mail to JS Schofield CHG November 29 I999
ERDA 1976 Nuclear Air Cleaning Handbook ERDA 76-21 Buchsted C A Fuller A B and Kahn 1 E Oak Ridge National Laboratory 1976
Farris 1998 Internal Note T R Farris LMHC to J S Schofield LMHC Breather Filter Flow Rates for SX-Farm 31698
Foust 1999 Internal Memo RMCST Exhauster HEPA Filter Dose Rate Calculations D J Foust LMHC to J S Schofield LMHC October 25 1999
Greager 1999 Correspondence No WMH-9954450 Non-Destructive Analysis of the Rotay Mode Core Sample High-Efjiciency Particulate Air Filters E M Greager WMH to P C Miller LMHC June 28 1999 [Transmittal of HNF-4199 Resultsfram NDA Measurement of the 296-P-34 RMCS HEPA Filters]
HNF 1999 HNF-SD-WM-SAR-067 Tank Waste Remediation System Final Safety Analysis Report Rev 1 The revision incorporating RMCS accident analyses was submitted as Addendum 5 to DOE as a change to the FSAR predecessor the Basis for Interim Operation (BIO) LMHC-9857075 80232764-9-KOOl Submittal of Authorization Basis Amendment Package for Rotay and Push Mode Core Sampling in Satisfaction of Perfarmance Agreement TWR 122 Expectations I and 3 D 1 Allen LMHC to A M Umek FDH August 30 1998 Addendum 5 as of mid-January 2000 is waiting for approval by DOE
Kaiser 1997 T D Kaiser LMHC E-Mail to J S Schofield LMHC SX Tank Flow Data 42197
NUREG 1995 Potential Radionuclide Emissionsfrom Stacks on the HanfordSite Part I Dose Assessment Davis W E and Barnett J M Westinghouse Hanford Company from Proceedings of the 23 DOEMRC Nuclear Air Cleaning Conference held July 25-28 1994 February 1995
Schofield 2000a Letter 74910-00-002 Use of Microshield Calculations for RMCS Exhauster Housing for Estimating Radionuclide Quantities on the Filters Using NDA and Dose Rate Measurements I S Schofield CHG to File January 62000
Schofield 2000b Letter 74910-00-003 Rev I RMCS Exhauster Stack RecordSample Data J S Schofield CHG to File January 202000
Reynolds 1999 D R Reynolds LMHC E-Mail to I S Schofield LMHC transmitting Tank Volume Calculations draft of calculations done by Mike Plesha and Reed Hendershot data to be used for RESOLVE computer program for Hanford waste tanks August 3 1999
TWINS Tank Waste Information Network System database available at httptwinspnlgovSOO lhtbinTCDgetTableListexe
Waldo 1999 letter 74910-99-009 RMCS Exhauster Aerosol Test Data E I Waldo to J S Schofield June 22 1999
WHC 1993 WHC-SD-WM-ES-225 Rev I AerosolStudy for the Rotary Mode Exhauster P M Francis Westinghouse Hanford Company April 20 1993
WHC 1997 WHC-SD-WM-SAD-035 Rev Ob A Safety Assessment of Rotary Mode Core Sampling in Flammable Gas Single Shell Tanks Hanford Site Richland Washington August 8 1997
G- I
RPP-4826 Rev I
CGM Data CGM-I Letter PARTICULATE SAMPLING OF 241-SX-IO1 DURING ROTARY MODE CORE SAMPLING D C
Langlois E2 Consulting Engineers to J S Schofield Lockheed Martin Hanford Company March 16 1998
CGM-2 Letter PARTICULATE SAMPLING OF 241-SX-I05 DURING ROTARY MODE CORE SAMPLING D C Langlois E2 Consulting Engineers to J S Schofield Lockheed Martin Hanford Company June 9 1998
CGM-3 Letter PARTICULATE SAMPLING OF 241-SX-103 DURING ROTARY MODE CORE SAMPLING D C Langlois E2 Consulting Engineers to J S Schofield Lockheed Martin Hanford Company June 12 1998
CGM-4 Letter PARTICULATE SAMPLING OF 241-S-110 DURING ROTARYMODE CORESAMPLING D C Langlois E2 Consulting Engineers to J S Schofield Lockheed Martin Hanford Company July 20 1998
CGM-5 Letter PARTICULATE SAMPLING OF 241-SX-102 DURING ROTARY MODE CORE SAMPLING D C Langlois E2 Consulting Engineers to J S Schofield Lockheed Martin Hanford Company July 22 1998
CGM-6 Letter PARTICULATE SAMPLING OF241-U-107 DURING ROTARY MODE CORE SAMPLING D C Langlois E2 Consulting Engineers to J S Schofield Lockheed Martin Hanford Company August 3 1998
CGM-7 Letter PARTICULATE SAMPLING OF 241-BY-105 DURING ROTARY MODE CORESAMPLING D C Langlois E2 Consulting Engineers to 1 S Schofield Lockheed Martin Hanford Company September 17 1998
CGM-8 Letter PARTICULATE SAMPLING OF 241-TX-I13 DURING ROTARY MODE CORESAMPLING D C Langlois E2 Consulting Engineers to J S Schofield Lockheed Martin Hanford Company March 15 1999
CGM-9 Letter PARTICULATE SAMPLING OF 241-TX-113 DURING ROTARY MODE CORE SAMPLING D C Langlois E2 Consulting Engineers to I S Schofield Lockheed Martin Hanford Company May 31 1999
Notices of Construction NOC-I DOEIRL-93-40 Radioactive Air Emissions Program Notice of Construction Rotary Mode Core-Sampling
Truck and Exhauster Approved by Letter AIR 93-707 A W Conklin WDOH to J E Rasmussen DOEIRL 7893
NOC-2 DOEIRL-94-118 Rev 0 Radioactive Air Emissions Program Notice of Construction for the Rotary Mode Core-Sampling Systems Three and Four Approved by Letter AIR 95-603 A W Conklin WDOH to J E Rasmussen DOERL 63095
NOC-3 DOERL-94-118 Rev 1 Radioactive Air Emissions Program Notice of Construction for the Rotary Mode Core-Sampling Systems Three and Four Approved by Letter AIR 98-301 W W Conklin WDOH to I E Rasmussen DOEIRL 3698
NOC-4 DOEIRL-97-70 Radioactive Air Emissions Program Notice of Construction for Rotary Mode Core- Sampling in SX Tank Farm Approved by Letter AIR 97-1 101 A W Conklin WDOH to J E Rasmussen DOEIRL 113097
NOC-5 USEPA Letter OAQ-107 (no title approving DOE submittal 97-EAP-590 dated 72997) A J Frankel USEPA to J E Rasrnussen DOEIRL 8497
NOC-5 USEPA Letter OAQ-107rsquo (nb title approving DOE submittal 97-EAP-723 dated 101797) A J Frankel USEPA to J E Rasmussen DOERL 11498
Note that both letters have ldquoOAQ-107rdquo following ldquoReply to Attn ofrdquo
G-2
RPP-4826 Rev I
Work Packages WP-I ES-94-00808 WP-2 ES-95-00258 WP-3 ES-95-00045 - WP-4 ES-95-00434 - WP-5 ws-97-00173 - WP-6 WS-97-00174 - WP-7 ws-97-00143 - WP-8 WS-97-00144 - WP-9 WS-97-00207 - WP-I 1 WS-97-00208 - WP-12 WS-98-00049 - WP-13 WS-97-00050 - WP-14 WS-97-00224 - WP- I5 WS-97-00225 - WP-16 WS-97-00230 - WP- I7 ws-97-0023 1 - WP-18 ES-97-00452 - WP-19 ES-97-00453 - WP-20 WS-98-00072 - WP-21 WS-98-00073 - WP-22 WS-98-00067 - WP-23 WS-98-00068 -
241-BY-IO6 Perform Rotary Core Sample [Riser IOB] 241-BY-I IO Rotary Core Sample [Risers 12B 7 IZB 41 241-BY-IO8 Obtain Rotary Core Sample [Risers 12A amp 71 241-BY-IO5 Rotary Mode Core Sample [Riser 12A] 241-SX-101 Rotary Mode Core Sample Riser 19 241-SX-101 Rotary Mode Core Sample Riser4 241-SX-103 Rotary Mode Core Sample Riser 7 241-SX-103 Rotary Mode Core Sample Riser I I 241-SX-105 RMCST Obtain Core Sample Riser 6 241-SX-105 RMCST Core Sample Riser 14 241-SX-102 Rotary Mode Core Sample Riser 8 241-SX-102 Rotary Mode Core Sample Riser 4 241-S-1 IO RMCST Obtain Core Sample Riser 6 241-S-1 IO RMCST Obtain Core Sample Riser 14 2414-107 RMCSTCore Sample Riser 7 241-U-107 RMCST Core Sample Riser 2 241-BY-IO5 RMCST Core Sample Riser 7 241-BY-IO5 RMCST Core Sample Riser 1 IB 241-TX-113 Rotary Core Sample Riser 3 241-TX-113 RMCST Core Sample Riser 5 241-TX-I 18 RMCST Core Sample Riser 9B 241-TX-I 18 RMCST Core Sample Riser 128
G-3
RPP-4826 Rev I
EXPERIENCE WITH AEROSOL GENERATION DURING ROTARY MODE CORE SAMPLING IN THE HANFORD SINGLE SHELL
WASTE TANKS
John Schofield CH2M Hill Hanford Group Incorporated
January 2000
RPP-4826 Rev 1
Table of Contents
111
SOL GENERATION DURING ROTARY M WASTE TANKS 1
1
2 RMCS Exhauster Housing NDA RMCS Exhauster HEPA Dose R CGM Filter Paper Analyses
Housing NDA and Record Sample Data Comparison
3
Discussion of Results
APPENDIX A - Estimation Of Aerosols Generated During RMCS Based Upon RMCS Exhauster Housing Non-Destructive Assay A-I
Summary of Method Description Reported NDA Data A-2
A-2
Aerosol Calculatio
B-1
Aerosol Calculatio B-3 Summary of Calcu B-4
c-l
Calculated Tank Head Space Radionuclide Concentrations
Summary of Calculations Aerosol Calculations
APPENDIX D - Estimation of RMCS Exhauster Housing Decontamination Factor Summary of Method D-l
Estimated Aerosol Level Summary of Calculations D-4
APPENDIX E - Tank Waste Radionuclide Concentrations Used for Aerosol Calculations APPENDIX F - Rotary Mode Core Sampling Exhauster and Core Sample D
Basic Operational Data Tank 241-BY-106 1194 to 1294 F-2 Tank 241-BY-106 195 Tank 241-BY-I IO 795
I
RPP-4826 Rev 1
Tank 241-BY-108 795 to 895 F-2 Tank 241-BY-105 895 to Tank 241-SX-101 1297 to 298 F-3 Tank 24I-SX-103498 to F-3 Tank 241-SX-105298 to 598 F-3 Tank 241-SX-I02698 to 798 F-3 Tank 241-S-110 598 to 698 F-3 Tank 241-U-107 698 to 798 Tank 241-BY-105 798 to 898 F-4 Tank 241-TX-113998 to 599 F-4 Tank 241-TX-118 599 to 699
Calculated Data F-6
APPENDIX G - References
List of Figures
Figure 1 Relative Waste Aerosol Concentrations In Tank Head Space 8
List of Tables
Table 1 Summary Of Aerosol Estimation Methods Used Table 2 Summary Of RMCS Aerosol Data Table A-I Exhauster Operating Periods an Table A-2 NDA Data Table A-3 Concentrations And Aerosol Table B- 1 RMCS Exhauster Operating
B-5 Table 8-3 Concentrations And Aerosol Side of RMCS Exhauster B-6 Table C-l Operating Data for Tanks on Which Combustible Gas Monitor Filter Paper Data Were Used for RMCS Aerosol Calculations Table C-2 Combustible Gas Table C-3 Tank Head Spac Table C-4 Aerosol Table D-l Stack E Table D-2 RMCS Exhauster HEPA Filter Aerosol Test Data Table E-1 Tank Contents From TWINS Best Inventory Databa Table F-l Basic RMCS And Exhauster Operational Data
Table B-2 Dose Rate Data and Filter Cs
Table F-2 Tank Dimensional Data Head Space Volumes And Head Space Changeouts during RMCS F-8
ii
RPP-4826 Rev I
Glossary
ABCASH acfin CGM changeout
Ci core DF DOE EPA ERS exhauster g GEA head space HEPA housing kg mCi LFL NDA NISampT NOC PMCS PTE record sample RMCS W C S core RPP scfm segment specific activity TA TB TWINS TWRS
Automated Bar Coding of Air Samples at Hanford actual cubic feet per minute combustible gas monitor the replacement of air in a tank head space with a volume of air equal to the head space volume curie equal to 37Ei-10 disintegrationslsec a top to bottom (or until sampling is halted) collection of segments taken from a tank riser decontamination factor Department of Energy Environmental Protection Agency Environmental Release Summary (database) the exhauster used during RMCS on a tank gram gamma energy analysis the volume of air above the waste surface in a tank high efficiency particulate air the main body of the exhauster containing the filter media kilogram millicurie IE-3 Ci lower flammability limit non destructive assay National Institute of Standards and Technology Notice of Construction push mode core sampling Potential to Emit stack samples taken during RMCS to measure the radionuclides released to the atmosuhere rotary mode core sampling a core taken from a tank with one or more segments taken in RMCS mode River Protection Project standard cubic feet per minute an individual 19 inch long sample or group of samples taken which add up to 19 inches the concentration of a radionuclide in the waste on a mass basis normally in pCUg or mCig tots1 alpha total beta Tank Waste Information Network System Tank Waste Remediation System
averages are based upon the number of RMCS segments Washington State Department of Health
weighted average an average which is weighted based upon a given parameter in this document weighted
WDOH uCi microcurie IE-6 Ci
iii
RPP-4826 Rev I
EXPERIENCE WITH AEROSOL GENERATION DURING ROTARY MODE CORE SAMPLING IN THE HANFORD SINGLE SHELL WASTE TANKS
Summary
This document presents information on aerosol formation in tank head spaces during rotary mode core sampling (RMCS) in single shell waste tanks (SST) at the Hanford Site The mass of aerosols generated during RMCS has been very small The average mass of suspended waste solids present in an SST head space during RMCS was lt01 g The mass of suspended solids sent to an exhauster averaged ltOl g per RMCS segment and lt05 g per RMCS core The results are three orders of magnitude less than assumed in current accident analyses and environmental permit applications The measured decontamination factor (DF) for the RMCS exhauster housing exceeded 70000
Purpose
The purpose of this document is to present estimates based upon RMCS operating experience of the concentration and total mass of waste aerosols present in SST head spaces during RMCS and estimates of the mass of aerosols sent to the exhauster used on the tank This document also evaluates the performance of the RMCS exhausters and provides an estimate of the filter housing decontamination factor Revision 1 of this document is an extensive rewrite of Rev 0 and includes additional information not available when Rev 0 was issued
RMCS using a nitrogen purge gas to cool the bit and provide hydrostatic head pressure was performed between November 1994 and June 1999 All the available data relevant to aerosol formation during RMCS in SSTs was used for this study This document is not an evaluation of aerosol formation processes aerosol dispersion patterns within the tank head space aerosol settling rates or factors affecting removal of particulates from a tank When using the values given in this document to estimate maximum potential quantities released to an exhauster or to account for peak concentrations in a tank head space when evaluating potential accident scenarios engineering judgement should be used as deemed necessary to adjust the values given in this document for conservatism
Introduction
Core sampling is used to obtain 19 inch long samples of radioactive waste in the Hanford single shell waste tanks A 19 inch core sample is a segment A core is made up of all the segments taken as the drill bit passes through the waste A sample may he taken in push mode (PMCS) or rotary mode A segment taken in rotary mode is designated an RMCS segment and a core in which any RMCS segment is taken is designated an RMCS core RMCS is used for tanks in which the waste may be too hard to sample using other methods
Before 1994 core sampling was performed using different liquids that cooled the drill bit during RMCS and provided a hydrostatic head in the drill string during both RMCS and PMCS RMCS sampling was halted in 1990 over safety concerns with flammable gases and organic nitrates in the waste tanks The RMCS equipment was redesigned to a new process that used nitrogen gas to cool the cutting bit The nitrogen flow rate is approximately 30 to 40 scfm (085 to 11 m3min) during periods the drill string is rotating This gas passes through holes in the bit up through the waste and is released to the tank head space Tank head space volumes are in the 50000 to 100000 ft3 (1400 to 2800 mrsquo) range Since the nitrogen purge gas could result in aerosol formation in the tank vapor space an exhauster was included with the RMCS equipment redesign RMCS using the nitrogen purged process has been performed to date during the periods 1194 to 195795 to 1095 and 1297 to 699 From 1297 to 798 RMCS was performed in SX tank farm with the SX tank exhauster providing the ventilation In 94-95 and from 598 through 699 RMCS was performed in BY S U and TX tank farms using an RMCS exhauster
An estimate of the mass of aerosols sent to an exhauster during rotary mode core sampling is needed as a basis for the Potential to Emit (PTE) estimate in environmental permits for the exhausters employed during RMCS Estimates of tank head space mass concentrations and total suspended solids during RMCS are also used in certain accident analyses related to RMCS Since the bit rotation and gas sparging nature of RMCS have a higher potential for aerosol generation than many in-tank activities aerosols generated during RMCS may provide an estimate of the upper limit for the concentration of aerosols to be found in a tank head space during these activities
RPP-4826 Rev 1
There are two current (as of January 2000) Notices of Construction (NOC) approved by the Washington D e p m e n t of Health (WDOH) for exhauster use during RMCS The first WDOH permit is for Exhauster Systems 3 and 4 (referred to as Exhauster B and Exhauster C in this document) during RMCS in a tank that is normally passively ventilated (Reference NOC-3) The second WDOH permit (NOC-4) is for RMCS in SX tank farm using the SX exhauster The Environmental Protection Agency (EPA) has also granted approval for RMCS exhauster use in a tank that is normally passively ventilated (NOC-5) and for RMCS in SX farm with the SX exhauster (NOC-6)
Very conservative assumptions were made on RMCS aerosol quantities for the existing NOCs and safety basis accident analyses These assumptions were made since no operational data were available on aerosol levels when most of these NOCs and accident analyses were prepared WHC 1993 provided the initial estimate of aerosols sent to the exhauster during RMCS Based upon assumptions in this document a value of 1 kg of waste sent to the exhauster per RMCS core was used as the basis for the first two RMCS NOCs (NOC-I and NOC-2) This number was based upon drilling tests in drums of extremely hard and dry simulated saltcake The hard simulant was intended to present a limiting case for RMCS drill bit testing and was not physically representative of actual tank wastes This I kg per RMCS core estimate was modified to 77 g waste per RMCS segment when using the RMCS exhauster (NOC-3 and NOC-5) and 35 g per segment for RMCS in SX farm (NOC-4 and NOC-6)
A value of 600 g of waste in the tank head space was assumed in WHC 1997 for certain RMCS accident analyses This number was based upon earlier conservative assumptions on particulates generated during a large gas release event in Tank 241-101-SY A value of 100 g waste in the head space was used in an update ofthis RMCS accident analysis provided in a revision to the predecessor of HNF 1999 that has been submitted to the Department of Energy (DOE) for approval
After nitrogen-purged RMCS operations commenced in November 1994 it became obvious that the estimates of aerosol generation rates based upon WHC 1993 were very conservative This was evident from in-tank videos that showed very little dust formation and from the lack of any dose rate buildup on the in-tank prefilter (when used) or the exhauster HEPA filters An evaluation was begun in 1997 to use data obtained during or following RMCS operations to estimate actual aerosol generation rates and exhauster filter performance This document provides the results of that evaluation
Aerosol Estimation Methods
Dedicated particulate sampling methods such as employing sticky tapes to capture aerosols for microscopic evaluation or specially designed samplers were not used for this evaluation Funding and personnel were not available for an in-depth study nor was such a study necessary Aerosol quantities were estimated using the best data available from existing sources associated with RMCS (housing dose rates CGM filter papers stack record samples) or easily obtained additional data (housing NDA) Three separate methods were used to provide estimates of the aerosols present in the tank head space or sent to the exhauster The first method used non destructive assay (NDA) of RMCS exhauster filter housings to estimate particulates captured on the filters The second method used the RMCS exhauster HEPA filter dose rates following completion of a core to estimate the mass of waste on the filters The third method estimated the tank head space aerosol concentration based upon analytical data from filter papers located upstream of combustible gas meters (CGMs) employed during RMCS A CGM draws air out of a tank headspace at a constant flow rate during RMCS to monitor for flammable gases
It was not possible to utilize any single method of estimating aerosol quantities for all RMCS sampling events For some sampling events not all data types were available or if available were not useful Reasons for the data not being useful include no RMCS segments taken during the time period evaluated analytical data being below background levels or having an analytical variance gtloo or (for SX tank farm) other tanks being exhausted in parallel or series with the tank being core sampled All calculations conservatively assumed that the background radionuclide concentration in a tank head space was zero and that all radionuclides detected by one of these methods were due solely to RMCS activities
Table 1 lists the RMCS sampling events which provided the data for this document the exhauster that was in service the aerosol estimate methods used for that event and the number of RMCS cores and segments obtained
L
RPP-4826 Rev 1
during the sampling method The data in this document were obtained during RMCS in eleven separate tanks A total of 23 RMCS cores containing 11 5 RMCS segments were obtained The aerosol estimation methods are summarized below
RMCS Exhauster Housing NDA Appendix A describes NDA of RMCS exhauster housings after they were used during RMCS operations from 598 through 699 Gamma assays of the housings were performed to measure the Csrdquorsquo on the prefilter primary HEPA filter and secondary HEPA filter The quantity of Csrdquorsquo present on each was estimated by comparison with the Csrdquorsquo count rate from a known standard measured in an equivalent geomeby The quantity on all three filters was summed to estimate the total in the housing The mass of particulates was obtained by dividing the quantity of present by a weighted average of the Csrdquorsquo concentration of the wastes in the tanks being exhausted With this data average tank head space mass concentrations were calculated as well as the mass per core and per segment sent to the exhauster The mass of waste in a tank head space was calculated by multiplying the tank head space concentration by the tank head space volume A summary ofthe results is given in Table 2 The detailed results are given in Table A-3
RMCS Exhauster HEPA Dose Rate Data Appendix B describes using RMCS exhauster dose rate data to estimate aerosol quantities The dose rate at the ed e of the HEPA filter housing is used to estimate a quantity of Csrdquorsquo on the filter Dividing the quantity of Cs on the filter by a weighted average of the Csrdquorsquo concentration in the wastes of the tanks being exhausted provides the waste mass on the filters With the waste mass known tank head space mass Concentrations can be calculated as well as the mass per core or per segment sent to the exhauster The mass of waste in a tank head space was calculated by multiplying the tank head space concentration by the tank head space volume A summary of the results is given in Table 2 The detailed results are given in Table B- 3 The minimum detection ability ofthe dose rate instruments used is 05 m m r Most RMCS exhauster dose rates following completion of an RMCS core were less than detectable An exhauster housing registered slightly above the minimum detectable limit at 07 mRhr after core sampling on S-l IO U-107 BY-IO5 and TX-I 13 This housing read 08 mRhr after completion of sampling on the next tank TX-I 18
CGM Filter Paper Analyses Appendix C describes using CGM filter paper analytical data to estimate aerosol quantities The filter papers are inserted in-line in front of a CGM where they catch the radionuclides in the tank vapors drawn into the CGM These filter papers were removed and analyzed starting in 1997 For conservatism only sample results with a variance 400 were used These analytical data were divided by the specific activity of the radionuclides present on the filter paper for the tank on which the CGM was being operated This provides an estimate of the aerosol mass concentration in the tank head space since a particulate sample is drawn directly from the tank head space during RMCS With this data the mass of waste in the head space and the mass per core and per segment sent to the exhauster can be calculated The mass of waste in a tank head space was calculated by multiplying the tank head space concentration by the tank head space volume A summary of the results is given in Table 2 The detailed results are given in Table C-4
IF1
RMCS Exhauster Decontamination Factor Estimation Method
The RMCS exhauster filter housing DF was calculated by comparing stack record sampler data with the housing NDA data to calculate an efficiency for the housing The housing contains a prefilter and two HEPA filters in series Table 1 lists the RMCS sampling events which provided the data for estimating the DF
Housing NDA and Record Sample Data Comparison Appendix D uses RMCS exhauster stack record sample data to estimate stack Csrdquorsquo emissions for the same time periods when NDA data were obtained The stack emissions were used with the NDA data to calculate a filter housin DF The only radionuclide shown as present by the NDA was Csrdquorsquo No stack record samples showed Cs were available for seven of the nine stack record samples taken during the time NDA data were obtained For the remaining two samples conservative assumptions were made as to the stack total beta concentration
139 present above detection limits However total beta results above minimum detection limits
3
RPP-4826 Rev I
Stack total beta emissions were converted to CsrsquoI7 emissions using the C S rdquo ~ to total beta ratio for the waste in the tank being sampled The filter housing input was calculated by adding this calculated Csrdquorsquo emission to the quantity shown by NDA to be in the housing Dividing the emissions by the input provided the penetration efficiency Results of the housing efficiency and decontamination factor calculations are provided in Table D-I
Discussion of Results
All calculations were based upon radionuclides measured on the exhauster filters in the tank head space air or in the exhauster stack These radionuclide quantities were divided by the specific activity of waste in the tank to provide mass quantities in the air on the filters or in the exhaust stream Appendix E provides the waste specific activities used in this document along with limitations and potential errors associated with using them
The calculated average mass concentration in a tank head space during RMCS ranged from a low of 77E-6 gm3 based upon exhauster housing NDA data to a high of 4OE-5 gm3 based upon CGM filter paper data The weighted average of all methods was 24E-5 gm Welghted averages used in this document were based upon numbers of RMCS segments obtained during application of that method
The average mass concentration is not the peak concentration as illustrated by Figure I Figure 1 is a representation of relative concentrations only not a plot of measured concentrations during a specific sampling event Lines A and B represent aerosol concentrations at points near the drill string and at the tank outlet to the exhauster respectively Line C represents the calculated average concentration in the tank head space The peak concentration in the air to the exhauster will exceed the average tank head space concentration for short periods oftime It is beyond the scope of this document to provide a detailed spatial and time-dependent analysis of tank aerosol concentrations The methods used in this document provide an estimate of an average tank head space mass concentration only
The average mass of suspended solids in a tank head space was estimated by multiplying the average head space mass concentration by the tank head space volume The calculated average mass of suspended solids in a tank head space during RMCS ranged from a low of I 8E-2 g based upon exhauster housing NDA data to a high of 97E-2 g based upon CGM filter paper data The weighted average of all methods was 56E-2 g Comparing 56E-2 g to the 600 g and 100 g used in accident analysis assumptions it is evident that the accident analyses used peak tank head space mass levels three to four orders of magnitude greater than the average mass level in a tank head space during RMCS
Multiplying an average concentration by the tank head space volume to estimate the mass of suspended solids in the tank head space at a given time makes the simplifying assumption that the tank head space concentration is constant with time and uniform within the head space during RMCS As illustrated by Figure I the tank head space concentration is not constant with time or uniform within the head space When determining a maximum value for mass of solids in a tank head space engineering judgement needs to be applied that evaluates all the parameters involved that could increase or decrease the average mass value provided in this document With all other variables being equal the mass concentration and mass of suspended solids in a tank head space will also be affected hy the volume of the head space and the exhaust flow rate The head space volumes of the tanks sampled to date are typical of SSTs The exhauster flow rate is not expected to change for the RMCS exhauster If additional samples are taken in SX tanks where the exhauster flow rate is higher than in the four SX tanks which have already been sampled the mass present in the tank head space would be expected to be reduced
The calculated mass of waste sent to an exhauster ranged from lows of 18E-1 gRMCS core and 34E-2 W C S segment based upon CGM filter paper data to highs of 59E-I gRMCS core and 1OE-1 gRMCS segment based upon exhauster housing dose rate data The weighted average of all methods was 42E-1 gRMCS core and 69E-2 gRMCS segment Comparing the average to the 1 kgRMCS core and 35-77 glRMCS segment numbers used for the PTE estimates it is evident that the PTE estimates are conservative by at least three orders of magnitude
Results given in this document based upon total beta or Csrsquordquo data are likely more valid than alpha based results due to the higher concentrations of beta-gamma radionuclides in the waste and their greater ease of measurement when
4
RPP-4826 Rev 1
compared to alpha emitters Equal weight is given to all results regardless of whether based upon total al ha total beta or CsI3rsquo data This provides conservative results since the aerosol values based on total beta or CslfPwere normally lower than those based upon alpha results
The mass per segment numbers should be a better indicator of RMCS aerosol emissions from the tank than the mass per core numbers This is because the quantity of aerosols generated in a tank should be proportional to the time of purge gas flow and bit rotation The time of purge gas flow and bit rotation should be proportional to the number of RMCS segments taken Thus the mass of RMCS generated aerosols sent to an exhauster on a given tank should be roughly proportional to the number of RMCS segments obtained from the tank The number of RMCS segments in a core can vary To date the range has been from 1 to 12 RMCS segments per RMCS core The average has been 5 RMCS segments per RMCS core
The results for mass per core or per segment based on NDA and housing dose rate data have a firmer basis than results based upon CGM filter paper data This is because the RMCS exhauster housing NDA and dose rate methods are a direct physical measurement of essentially all the Csrsquordquo released to the exhaust stream during RMCS Aerosol measurements based upon HEPA dose rate are conservative as the filters showed no detectable dose rate for three of the five periods evaluated and barely perceptible readings after the other two
The results for tank head space concentrations and mass of waste in a tank head space during RMCS based on CGM filter paper data have a firmer hasis than results based on housing NDA or dose rate This is because the CGM filter paper data is a direct measurement of the concentration in the air in a tank head space during the time when aerosols are being generated The CGM filter paper data should provide a higher tank head space mass concentration than that calculated by filter housing NDA or dose rate This is because aerosols are only generated during times when the CGM is operating and the CGM operates for less time than the exhauster does Since the concentration is based upon dividing a filter quantity by the volume of gas passing through the filter the volume of gas in proportion to the material on the filter will be less for the CGM filter paper than for an exhauster filter resulting in a higher concentration based on CGM filter paper data A factor is included in the CGM based concentration to account for radionuclides in the dome space that have not settled out or been removed by the exhauster when the CGM is shut Off
The average results for all methods were within reasonable agreement with each other considering all the variables and assumptions involved The filter housing DF is in good agreement with expected values
This document contains seven appendices Appendices A-C provide particulate results based upon RMCS exhauster housing NDA RMCS exhauster housing dose rates and CGM filter paper data Appendix D provides an RMCS exhauster filter housing DF based on housing NDA and stack record sample data Appendix E provides waste specific activities and Appendix F provides the raw data used in Appendices A-D Appendix G provides references for this document
Conclusions
The results in this document are based upon RMCS operating experience from startup of nitrogen-purged RMCS in November 1994 through June 1999 Table 2 summarizes the information presented in the appendices Based upon this information and the lack of any significant aerosol formation seen in in-tank videos it can be concluded that past estimates of aerosol concentrations used for regulatory permits and accident analyses were conservative by a nominal three orders of magnitude
In order to estimate mass releases for regulatory permits the overall emissions with time are needed as a basis for the PTE estimates For future permits the mass per core or mass per segment values in Table 2 can be used directly with conservatism added if deemed appropriate for the tanks to be sampled When estimating maximum concentrations or maximum mass quantities in the tank head space for use in accident analyses additional conservatism needs to be added to the average concentration and mass values in Table 2
5
RPP-4826 Rev I
Tank and Date Sampled
Table 1 Summary Of Aerosol Estimation Methods Used
RMCS Aerosol Estimation Methods Exhauster Number of Used
Housing DF RMCS Cores Riser Used Period6 HEPA CGM NDA and and RMCS
Exhauster Operating Sample Exhauster
NDA Dose Filter RMCS Stack Segments Taken
BY-IO5 1998
No RMCS segments taken from BY-108 or from TX-I 13 Riser 3 using Exhauster B Any material retained on I
the filters during these operating times was assumed to come from next RMCS sampling event with the same exhauster BY-IO5 in 1998 shown as separate exhauster installations since stack record samples were pulled after each riser was sampled
Includes RMCS cores and segments only PMCS cores and segments obtained during exhauster operation not included A total of 23 RMCS cores and 115 RMCS segments were taken between 1194 and 699 The sum of cores and segments is less than sum of cores and segments obtained during data collection periods at lei since more than one aerosol estimation method was used for some sampling periods
One CGM filter paper was used for both cores in SX-102 and for both cores in U-107 3
See Appendix F for explanation of exhauster operating periods
6
RPP-4826 Rev I
Table 2 Summary Of RMCS Aerosol Data
Weighted average based upon number of RMCS segments taken with each method
7
e
Q 0 c 0 0 - 0 VJ 0 L
2
RFP-4826 Rev 1
APPENDIX A
ESTIMATION OF AEROSOLS GENERATED DURING Rh4CS BASED UPON RMCS EXHAUSTER HOUSING NON-DESTRUCTIVE ASSAY
A-0
RPP-4826 Rev I
APPENDIX A - Estimation Of Aerosols Generated During RMCS Based Upon RMCS Exhauster Housing Non-Destructive Assay
Summary of Method
This method of estimating RMCS aerosol quantities uses non-destructive assay (NDA) of the exhauster housing to determine the C S rdquo ~ quantity (Ci) on the filters inside This quantity is then divided by the C S rdquo ~ specific activity (Cig) in the waste for the tank(s) on which the exhauster and the same filters were present during sampling The resulting mass on the filters divided by the volume of air flowing through the exhauster provides an estimate of the average aerosol mass concentration in the air to the exhauster This value was multiplied by the tank head space volume to obtain the average mass of particulates present in the tank head space during RMCS The mass of waste on the filters divided by the number of rotary cores or segments taken provides the mass per core or per segment sent to the exhauster
Description
There are one prefilter and two HEPA filters in series for each RMCS exhauster Particulates captured on the filters contain radionuclides with C S rdquo ~ bein the predominant gamma emitter By performing an NDA of the exhauster housing filters the quantity of Cslg7 in the housing can be estimated This C S rdquo ~ value is then used to back-calculate to a waste mass on the filters using the mass is used to calculate the concentration of particulates in the tank exhaust stream the total suspended solids in the tank head space and the mass of waste sent to the exhauster for each RMCS core or segment taken
Exhauster operations were divided into six operating periods for evaluation in this document These periods are discussed in Appendix F and shown in Table F-I NDA data were obtained for Exhauster Operating Periods 4 5 and 6 Relevant information for these periods is also listed in Table A-I
Period 4 was for Exhauster C use during RMCS for both cores in S-l IO U-107 BY-IO5 and the first core in TX-I 13 The filters and housing were new prior to RMCS in S-110 No filter changeouts were made during this period the accumulated particulates from these RMCS events were retained on the housing prefilter primary HEPA and secondary HEPA
Period 5 was for Exhauster B use during RMCS for the second core in TX-I 13 The filters and housing were new prior to RMCS in TX-113 No filter changeouts were made during this period Exhauster B also ran for a short time during the first core in TX-113 but no RMCS segments were taken when the exhauster was operating Stack record samples (see Appendix D) indicated small levels of aerosols were present in the stack exhaust during this time period Any material collecting on the filters during this time period would show up and be counted as part of the aerosols generated during the 2rdquod RMCS core
Period 6 was for Exhauster C use during RMCS for both cores in TX-I 18 During Period 6 the filters also contained the waste particles from Period 4 No filter changeouts were made durin this period The aerosol mass generated due to RMCS in TX-I 18 was determined from the increase in Cs on the filters between Period 4 and Period 6
A description of the sampling method used for the NDA obtained following Period 4 is provided in Greager 1999 The same method was used for the NDA following Periods 5 and 6 The NDA consisted of a gamma energy analysis of the exhauster housing performed at points adjacent to the prefilter first HEPA and second HEPA The detector was mounted outside the housing and inside a lead collimator The collimator was used to minimize the background count rate and contribution from adjacent filters CsIh was the only radionuclide reported as present The NDA compared the count rates from the exhauster housing with the count rate of an National Institute of Standards and Technology (NISampT) traceable in an equivalent geometry to the RMCS exhauster housing The count rates from housing filter readings were divided by the count rate for the source to give a reported quantity of Cslrdquo on the filters
concentration in the tank waste This filter waste
3 B
source located in the middle of a filter
A- 1
RPP-4826 Rev 1
Two correction factors were applied to the reported filter Csrdquorsquo values for use in this document These are discussed in the following two sections
Reported NDA Data
The NDA results for Period 4 are provided in Greager 1999 The only radionuclide reported as present on the filters was CsI3rsquo The results are restated in Table A-2
The NDA results for Periods 5 and 6 are provided in Diedeker 1999 The only radionuclide reported as present on the filters was Csrdquorsquo The results are restated in Table A-2
Adjusted NDA Data
The reported results are based upon comparing the count rate for a reference point source located in the middle of a mock-up assembly equivalent to the exhauster housing with the count rate from the same detector inside a lead collimator placed outside the actual exhauster housing Limitations with this method include comparison of a point source with a distributed matrix and the inability of the detector to see the entire filter due to the presence of the collimator Correction factors were used to adjust the reported values to account for these two limitations
The first correction factor accounts for comparing a distributed source to the point source standard The reported results were calculated based upon a point source standard since there are no readily available filter standards with a distributed source The material in the filter housing should be fairly evenly distributed through the filter media however so comparing count rates for the filter housing to a point source standard will result in some error To correct for this error shielding calculations were performed on an exhauster housing filter assuming the CSrdquorsquo was evenly distributed throughout the filter media and then again assuming the activity was a point source in the middle of the filter Foust 1999 provides the results of these Microshield dose rate calculations Using the data in Foust 1999 Schofield 2000a shows that the dose rate at the NDA detector location would be about 0625 mFVhrmCi CSrdquorsquo for a point source and 073 mRhrmCi Cslrdquo for a distributed source To adjust the reported NDA results to what they would have been if an actual distributed standard source was available the reported values need to be multiplied by 0625 + 073 = 086
The second correction factor accounts for the detector not being able to see the entire filter contents due to the detector location inside the lead collimator Using basic geometry Schofield 2OOOa estimated the detector has about a 100 view of 608 of a HEPA filter about a 50 view of 264 of the filter and is shielded from the remaining 128 The detector count rate was thus estimated as being approximately 741 o f what it would be if the detector were not collimated To correct the reported results to what they would have been if an uncollimated detector could have been used the reported values need to be multiplied by I + 0741 = 135
Combining the two correction factors gives a single adjustment factor used of 086 x 135 = 116 Per Table A- 2 the total quantity of Csrdquorsquo reported present in the housing for Period 4 was 0430 mCi This quantity was multiplied by 116 to give 050 mCi Csrdquorsquo The reported results for Periods 5 and 6 were revised in the same manner to give 0032 mCi and 064 mCi C~rsquo~rsquorespectiveIy To determine the net increase in Csrdquorsquo for the housing during Period 6 the value from Period 4 was subtracted from the total or 064 - 050 = 014 mCi Csrdquorsquo
Calculation of Mass Quantity on Filters
Calculation of the mass of waste on the filters requires knowledge of the specific activity of the waste on the filters The specific activities used for each exhauster operating period are given in Table A-I The paragraphs below provide a derivation of the specific activities used
The specific activity values for the waste in each tank sampled is given in Table E-I Rh4CS was performed on more than one tank during Period 4 so a weighted average specific activity was used to calculate the waste mass on the filters during this period The weighted average specific activity was calculated based upon the number of RMCS segments taken from each tank sampled The number of RMCS segments obtained during
A-2
RPP-4826 Rev 1
each period for which NDA measurements were made are listed in Table A-I These values were obtained from Table F-I A weighted average specific activity for the waste on the filters in Period 4 was obtained by
[[O 227 mCigl[lO segl+[Ol2lmCigl[lO seg1+[0225 mCigl[l(l seg]+[Ol30 mCig][l2 seg]]+[SO segments] = 0182 mCi Csrdquorsquog
Calculating a weighted average based upon the number of segments assumes aerosol generation is roughly the same per segment and the specific activity of a radionuclide is constant throughout a tank These assumptions are adequate for the purpose oftbis document Aerosol generation can vary with water content waste hardness depth of sample taken nitrogen flow rate and porosity of the waste An in-depth evaluation of these parameters is beyond the scope of this document The impact of these variables is assumed to average out over all the RMCS segments taken The specific activities used do not vary greatly from tank to tank so any variations will not have a significant impact on the final aerosol results See Appendix E for further discussion of limitations on specific activities used in this document
For Period 5 the filters were new at the start and the only tank sampled with the exhauster was TX-I 13 Therefore the specific activity of CsI3rsquo for TX-I 130130 mCig was used
The same exhauster and filters used for Period 4 were used for Period 6 The net increase in Csrdquorsquo for Period 6 was determined by subtracting the Period 4 Csrdquorsquo from the total Since this net increase was only due to TX- 118 the specific activity of Csrdquorsquo for TX-I 180130 mCig was used for the waste added to the filters in Period 6 (Note it is only a coincidence that TX-I 13 and TX-118 have the same nominal Csrdquorsquo concentration)
The total mass of waste on the filters for Period 4 was thus
050 mCi i 0182 mCig waste = 275 g waste in exhauster housing
The mass of waste added to the exhauster for Period 5 was
0032 mCi + 0130 mCig waste = 025 g waste in exhauster housing
The mass of waste added to the exhauster for Period 6 was
(064 mCi - 050 mCi) + 0130 mCig waste = 11 g waste in exhauster housing
Aerosol Calculations
The tank head space particulate concentration was obtained by dividing the mass of waste sent to the exhaust stream by the volume of air sent to the exhauster The volume of air to the exhauster was obtained by multiplying the exhauster flow rate by the exhauster run times for each tank from Table F-I
For the RMCS exhausters the recorded exhauster flow rate is reported in standard cubic feet per minute (scfm) The RMCS exhauster flow rate is controlled to a nominal 200 scfm The exhauster flow rate was corrected to an actual cubic feet per minute (acfm) before calculating the tank head space aerosol concenmtion Table F-l includes the actual cfm flow rates
The calculated flow rates during RMCS for the tanks sampled during Period 4 were 207 acfm (S-1 lo) 206 acfm (U-107) 208 amp 209 acfm (BY-105) and 203 acfm (TX-I 13) The total volume oftank air through the exhauster during Period 4 was thus
[[207 cfm][ 15978 hr]+[206][27385]+[208][13577]+[209][30792]+[203][30230]][60 minh] = 146 E+7 Arsquo
The average tank head space mass concentration during RMCS in the above tanks was
[275 g + 146 E+7 Arsquo] x [35315 ftrsquomrsquo] = 664 E-6 average g waste per m3 in exhauster inlet
A-3
RPP-4826 Rev I
The gas flow rates and average tank head space mass concentrations during RMCS for Periods 5 and 6 were calculated in a similar manner
The average mass of waste in a tank head space during RMCS was calculated by multiplying the tank head space mass concentration by the tank head space volume from Table F-2 as shown below for S-1 I O
[275 g + 146 E+7 Arsquo] x [89100 ftrsquo] = 167E-2 g waste in S-1 IO head space
The particulate quantities in the other tank head spaces were calculated in a similar manner The weighted average mass in a tank head space during Period 4 was based upon the number of segments taken in each tank
The mass sent to the exhauster per RMCS core or per RMCS segment was obtained by dividing the mass of waste sent to the exhaust stream during each period by the numbers of RMCS cores or RMCS segments obtained during the exhauster operating time The average mass of waste sent to the exhauster during Period 4 is thus
275 g waste + 7 rotary cores = 39E-1 g wastelrotary core
and
275 g waste + 50 rotary segments = 55E-2 g wasteirotary segment
The mass of waste to the exhauster per RMCS core and RMCS segment for Periods 5 and 6 were calculated in a similar manner
All data were input to a spreadsheet to perform the calculations Results are provided in Table A-3
Summary of Calculations
Non Destructive Assay was performed on the RMCS exhauster filter housings used during three separate exhauster operating periods during which IO RMCS cores and 65 RMCS segments were obtained from five tanks Weighted averages of the average tank head space mass concentration average mass of suspended solids in a tank head space and average mass sent to the exhauster per RMCS core or segment for the three periods combined were calculated based upon the number of RMCS segments taken during each period Based upon RMCS exhauster housing NDA data the results indicate that
The average tank head space mass concentration during RMCS was 77E-6 g wastelmrsquo The average mass of suspended solids in the tank head space during RMCS was 18E-2 g waste The average mass sent to the exhauster during RMCS was 52E-1 g wastelcore The average mass sent to the exhauster during RMCS was 63E-2 g wasteisegment
A-4
RPP-4826 Rev 1
APPENDIX B
ESTIMATION OF AEROSOLS GENERATED DURING RMCS BASED UPON Rh4CS EXHAUSTER HEPA FILTER DOSE RATES
B-0
RPP-4826 Rev I
APPENDIX B - Estimation Of Aerosols Generated During RMCS Based Upon RMCS Exhauster HEPA Filter Dose Rates
Summary of Method
This method of estimating RMCS aerosol quantities divides the dose rate increase (mRhr) at the side of the RMCS HEPA filter housing by a calculated dose conversion factor (mRhrmCi C S rdquo ~ ) to obtain an approximation of the radionuclide quantity in the housing This radionuclide quantity is divided by the waste specific activity (mCig) to determine the mass of waste on the HEPA filter Dividing the HEPA filter waste mass by the volume of air passing through the filter provides an estimate of the average tank head space particulate concentration during RMCS Multiplying the average tank head space particulate concentration by the tank head space volume gives an estimate of the average mass of suspended particulates in the tank head space during RMCS Dividing the HEPA filter waste mass by the number of RMCS cores or RMCS segments provides the mass per RMCS core or per RMCS segment sent to the exhauster
Description
Particulates in the exhaust stream are removed by the HEPA filter(s) upstream of the exhaust fan The captured particulates contain radionuclides with CSrsquo~rsquo being the predominant gamma emitter As the particulate quantity on the HEPA filter increases the dose rate at the side of the filter housing will increase proportionately By monitoring the HEPA dose rate at the side of the filter housing the quantity of Csrsquordquo on the HEPA can be estimated This C S rdquo ~ value is then used to back-calculate to a waste mass quantity on the filter using the Csrsquordquo concentration in the tank waste This filter waste mass quantity is used to calculate the concentration of particulates in the tank exhaust stream the total suspended solids in the tank head space and the mass of waste sent to the exhauster for each RMCS core or segment taken Although radionuclides will be trapped on both the prefilter and the primary HEPA filter with a very small amount on the secondary HEPA calculations in this section were based upon the simplifying assumption that all the activity was on the primary HEPA filter
During RMCS exhauster operation the dose rate in m M r at the side of the HEPA filter housing is periodically measured with an Eberline RO-3B per procedure to indicate when radioactive particulates are building up on the filter The limit of detection of the RO-3B is 05 mRhr
Exhauster operations were divided into six operating periods for evaluation in this document These periods are discussed in Appendix F and shown in Table F-I Housing dose rate data were obtained for Exhauster Operating Periods I 24 5 and 6 Relevant information for these periods is also listed in Table B-I Dose rate data are available and were used for all tanks on which an RMCS exhauster was present and RMCS samples were taken This includes BY-106 BY-IO5 (1995) BY-I IO S-l I O U-107 BY-IO5 (1998) TX-113 and TX- 1 18 The dose rate at the end of a period was used as the basis for calculating radionuclides on the filters The only operating period for which dose rate data were not used for estimating filter radionuclide content was Period 3 Period 3 was for RMCS in SX farm using the SX exhauster
The dose rate at the side of the SX exhauster HEPA filter housing was measured during RMCS of SX farm tanks (for sampling of tanks SX-lot SX-102 SX-103 and SX-105) but the data are not useful for estimation of aerosol quantities because the SX exhauster draws on 13 tanks in parallel or in series with the tank being core sampled Many of the tanks have a much higher off gas flow rate than the sampled tank In addition there is background radiation in the area of the SX exhauster filter housing making any increase in the housing dose rate during RMCS difficult to detect
Dose Rate Data
The dose rate data for each period is listed in Table 8-2 No dose rates above minimum detectable limits were evident at the sides of any RMCS exhauster in Periods I 2 and 5
Dose rate measurements were less than detectable for Period 4 during sampling of S-l IO and U-107 When sampling on BY-IO5 there were a few readings of 07 m M r but most were ltOS mRhr This variation in
B- 1
RPP-4826 Rev 1
readings is to be expected as the specific instrument person using the instrument and location at which the dose rate is checked can vary with time The final recorded dose rate when sampling was complete on BY-IO5 was lt05 mRhr At the end of Period 4 following completion of the first core in TX-I 13 Exhauster C was listed as having a 07 m M r dose rate
Period 6 used Exhauster C again with the same housing and filters as at the end of Period 4 The final dose rate for this period was 08 m M r
Periods 124 and 5 all began with a new housing and new filters For Periods 12 and 5 it was conservatively assumed that the final dose rate was equal to 05 m M r giving an increase of 05 mRhr for each of these periods For Period 4 the dose rate increase was 07 m M r for this period Since Period 6 used the same housing and filters as Period 4 the increase for Period 6 was 08 - 07 = 01 m M r
The dose rate increase was converted into a CsIh content on the primary filter for each period Foust 1999 provides various dose rates for an RMCS exhauster housing assuming even dispersal of 1 mCi C S rdquo ~ on the first HEPA filter Using these calculations Schofield 2000a estimated a dose rate conversion factor of 16 mRhrmCi C S rdquo ~ at the detector location for an RO-3B The assumption that radionuclides are evenly distributed on the HEPA is a reasonable assumption based upon the exhauster design and the method used to measure the radiation dose rate
Gamma emitting contribute to the dose rate due to bremsstrahlung radiation and other nuclides may provide some small additional dose but the major penetrating dose rate contributor in aged SST waste is CSrdquo~ Ignoring the presence of all radionuclides (including Srm) except C S rdquo ~ in calculating a HEPA filter waste mass will provide a conservative result This is because assuming all radiation present is due to C S rdquo ~ will result in overestimating the C ~ I ~ ~ c o n t e n t of the filter housing which in turn will result in overestimating the waste mass on the HEPA filter
Dividing the HEPA dose rate for each exhauster installation by the dose conversion factor of I 6 mRhrmCi results in an increase of 031 mCi Csrdquorsquo on the RMCS exhauster filters for Periods I 2 and 5044 mCi for period 4 and 0063 mCi for Period 6
Calculation of Mass Quantity on Filters
Dividing the Csrdquorsquo content of the filters by the specific activity of C S rsquo ~ ~ in the waste gives the estimated mass of waste sent to the exhauster The specific activity value used for the waste in each tank sampled is given in Table E-I Since RMCS was performed on more than one tank in Periods 1 and 4 a weighted average specific activity was used for these periods The weighted average specific activity was calculated based upon the number of RMCS segments taken from each tank sampled during that period The number of RhKS segments obtained during each period are listed in Table B-I These data were obtained from the individual tank data in Table F- I Calculations to estimate the specific activity of waste mixtures were performed in the same manner as shown in Appendix A For Periods 2 5 and 6 RMCS samples were taken in only one tank The waste specific activity used for these periods was the specific activity of the tank sampled The specific activities used for each exhauster operating period are given in Table B-I
For all exhauster installations except BY-IO6 in 1994 and 1995 the RMCS exhausters were hooked directly to the waste tank When sampling BY-106 a prefilter was installed in the tank riser between the tank and the exhauster The prefilter was not used for BY-I IO in Period 1 or for any other tank in any other period Thus for Periods 2 4 5 and 6 the mass of waste on the HEPA was assumed equal to the mass of waste leaving the tank risers For Period 1 the mass of waste on the HEPA had to be adjusted for the BY-106 prefilter DF when estimating the combined mass of waste leaving the BY-IO6 and BY-I IO tank risers The mass of waste on the HEPA for Period 1 was
[031 mCi] [IO00 pCimCi] = 310 pCi
[310 pCi Csrdquorsquoon HEPA] + [I77 pCi C S rdquo ~ ~ waste] = 177 gwaste on HEPA
is the predominant radionuclide contributor to filter dose rates Beta emitting Srw can
on HEPA
B-2
RPP-4826 Rev 1
A decontamination factor (DF) of 5 was used to account for radionuclide removal by the BY-IO6 prefilter (see Appendix D for basis ofprefilter DF) There were 1 1 RMCS segments taken from BY-IO6 and 13 from BY- 1 IO The total mass ofwaste assumed to exit the tank risers was therefore
[ I 77 g waste] [ 1 1 + 131 [[I 151 + 131 = 28 g waste from tank risers
The DF of 5 to account for the prefilter is only applicable to the RMCS of BY-IO6 in 1994 and 1995 for all other exhauster periods the mass of waste on the HEPA was equal to the mass of waste sent to the exhauster riser
The mass of waste sent to the exhauster for Period 2 was
[031 mCi] [IO00 pCimCi] = 310 pCi Csrdquorsquo on HEPA
[3 IO pCi C S rdquo ~ on HEPA] + [225 pCi CsiI7g waste] = I 39 g waste from tank
Using the same formula the mass of waste to the exhauster from Periods 4 and 5 was 241 and 240 g respectively and the increase in waste on the filters for Period 6 was 048 g
Aerosol Calculations
The mass sent to the exhauster per RMCS core or per RMCS segment was obtained by dividing the mass of waste leaving the risers by the number of RMCS cores or RMCS segments obtained during the exhauster operating period
The tank head space particulate concentration was obtained by dividing the mass of waste leaving the riser by the volume of gas sent to the exhauster This volume of gas sent to the exhauster was obtained by multiplying the exhauster flow rate by the exhauster run time from Table F-I The calculations for aerosols generated based upon HEPA dose rates use acfm while the exhauster flow is recorded in scfm so the actin flow rates in Table F- 1 were used
The average mass of aerosols in the tank head space was obtained by multiplying the average tank head space particulate concentration by the tank head space volume from Table F-2
Following is an example of how the mass per RMCS core mass per RMCS segment average tank head space mass concentration and average mass of aerosols in the tank head space were calculated for Period 1 Data used are from Tables E-I F-I and F-2
[200 scfm] [2992+2916] [84 + 4591 + 528 = 21 1 acfm to exhauster from BY-IO6 in 11-1294
using same formula results in 210 acfm for BY-IO6 in 195 and 209 acfm for BY-I IO
28 g waste + [((21 1 acfm)(4878 hr)+(21O)(l867)+(209)(1125))(60 minhr)]= 12E-6 g wastelf to risers
[12E-6 amp] [35315 fmrsquo] =43E-5 g wastemrsquoto risers
[12E-6 gftrsquo] [53700 Arsquo in BY-106 head space] =66E-I g waste in BY-IO6 head space during RMCS
[12E-6 piftrsquo] [92000 ftrsquo in BY-110 headspace] = IIE-l g waste in BY-I10 head spaceduring RMCS
[28 g waste] [5 RMCS cores] = 56E-1 g waste per core to riser
[28 g waste] + [24 RMCS segments] = 12E-1 g waste per segment to risei
8-3
RPP-4826 Rev 1
All data were input to a spreadsheet and the mass to exhauster per RMCS core mass to exhauster per RMCS segment average tank head space mass concentration and average mass of aerosols in the tank head space were calculated for each of the RMCS exhauster operating periods in the same manner as shown above Results are given in Table 8-3
Summary of Calculations
RMCS exhauster operations were segregated into five operating periods during which RMCS was performed The Exhauster B data for BY-IO8 and TX-I 13 riser 3 was not used in these calculations as no RMCS was performed when the exhauster was operating Exhausters were operated in seven tanks during which 16 RMCS cores and 92 RMCS segments were obtained Based on RMCS filter housing dose rate data the results indicate that
These values are conservative as the assumed dose rate at the end of RMCS for Periods I 2 and 5 was assumed to be 05 mRhr In addition using a DF of 5 for the BY-IO6 prefilter skews the results high The in-tank prefilters used in both BY-IO6 sampling events showed no detectable contamination
Operatin Periods 4 and 6 were the only periods with exhauster housing dose rates above detectable The 044 mCi Csrsquordquo and 0063 mCi CsIh increase on the filters for these two periods based upon dose rate data correspond to the 050 mCi CsI3rsquo and 014 mCi Csrdquorsquo increase on the filters for these two periods based u on NDA data (see Appendix A) The 031 mCi C S rdquo ~ for Period 5 is significantly above the 0032 mCi Cslrsquolsquofor the same period determined by the NDA but this is due to assuming the housing dose rate was equal to the minimum detectable 05 mRhr
The average tank head space mass concentration during RMCS was 22E-5 g wastem3 The average mass of suspended solids in the tank head space during RMCS was 47E-2 g waste The average mass sent to the exhauster during RMCS was 59E-1 g wastelRMCS core The average mass sent to the exhauster during RMCS was 1OE-1 g wastelRMCS segment
B-4
v m
__ ~~
RPP-4826 Rev 1
APPENDIX C
ESTIMATION OF AEROSOLS GENERATED DURING RMCS BASED UPON CGM IN-LINE FILTER PAPER ANALYSES
c-0
RPP-4826 Rev I
APPENDIX C - Estimation Of Aerosols Generated During RMCS Based Upon CGM In- Line Filter Paper Analyses
Summary of Method
This method of estimating RMCS aerosol quantities uses radionuclide assay data from in-line filter papers located upstream of continuous gas monitors (CGM) sampling the tank air for flammable gases during RMCS The radionuclide content of the filter paper is divided by the waste radionuclide specific activity and the air flow through the CGM to obtain an estimate of the average mass concentration in the tank head space during the time period the CGM is on Multiplying the estimated average tank head space mass concentration by the tank head space volume gives an estimate of the average mass of particulates in the tank head space during RMCS To obtain the mass per RMCS core or per RMCS segment sent to the exhauster the tank head space average mass concentration is multiplied by the volume of gas sent to the exhauster then multiplied by a correction factor to account for particulates in the head space removed by the exhauster when the CGM is not operating and divided by the number of RMCS cores or RMCS segments
Description
During most tank waste intrusive activities performed since 1996 an intrinsically safe CGM located above ground has been used to continually monitor the tank air for flammable gases during in-tank activities The CGM sampling method draws air directly from the tank head space During RMCS the CGM sampling line is placed in the tank dome space The sampling line is located between the sampling riser and the exhaust riser if practical A pump in the CGM draws tank air up through the line at 05 litmin for measurement of the lower flammability limit (LFL) by the CGM A filter paper is installed in the sampling line upstream of the CGM to protect the unit from internal contamination
Following CGM use the CGM filter papers are normally discarded after monitoring them in the field for contamination To help estimate the tank head space particulate levels during RMCS these filter papers were retained and analyzed in the 222-S laboratory following removal from all tanks in which RMCS was performed from the fall of 1997 through April 1999 Data were collected for the four tanks in SX farm in which RMCS was performed and the next four tanks on which the RMCS exhauster was deployed These tanks are listed in Table c-I Reported CGM Data
The CGM operational data used to estimate aerosol levels during RMCS includes CGM operating times CGM flow rates and filter paper analytical data A summary report containing all the field operating data sheets for CGM usage and lab data was prepared following completion of sampling on each tank for all tanks except TX- 113 For TX-I 13 a separate report was prepared following each core These reports are References CGM-I to CGM-9 The CGM data from these reports are provided in Table C-2
There were 14 CGM installations during RMCS when CGM filter papers were collected and analyzed Each of these installations had Csrdquorsquo total alpha and total beta quantities measured on the filter papers resulting in 42 data points Eight of the measurement results were very low and had errors of gt+-loo These values were not used resulting in a net of 34 data points for calculating average head space mass concentrations based upon CGM data
Calculated Tank Head Space Radionuclide Concentrations
To calculate the average tank head space radionuclide concentrations during RMCS the filter paper radionuclide quantities were first divided by an efficiency factor to account for radionuclides which may not have been captured on the paper This adjusted radionuclide value was divided by the volume of tank air passing through the paper to give the average tank head space radionuclide concentration
The efficiency used for most stack samplers onsite is 73 (see Appendix D) Estimates attached to References CGM-I to CGM-9 indicate the CGM filter paper sampling method used should have a sampling efficiency
c- 1
RPP-4826 Rev 1
exceeding 73 For conservatism a sampling efficiency of 50 was assumed in this document for the CGM filter paper method
The estimated Csrdquorsquo total alpha and total beta concentrations in the tank vapor space were calculated by dividing the radionuclide quantity on the filter paper from Table C-2 by the assumed CGM sampling efficiency of 05 and the volume of gas going to the CGM The volume of gas going to the CGM was calculated by multiplying the time of CGM operation from Table C-2 by the CGM flow rate of 500 mlmin For example the calculated SX- 101 head space C~rsquorsquo~concentration based upon analysis of the CGM filter papers used during RMCS of riser 19 is
[[26E-4 pCi + 051 + [[I755 min][500 mlmin]] = 59E-I0pCiml
All radionuclide concentrations were calculated in a similar fashion Results are given in Table C-3 Table C-3 lists the radionuclide concentrations for all 42 data points The eight radionuclide concentrations not used for estimating mass concentrations are noted
Table C-3 also contains the calculated number of tank head space changeouts by the tank exhauster during CGM operation Tank head space changeouts were calculated by multiplying the exhauster flow rates (in actin) from Table F-1 by the CGM run times from Table C-2 and dividing by the tank head space volumes from Table F-2 The number of tank head space changeouts during CGM operation was used when estimating the waste mass sent to the exhauster See Aerosol Calculations section below for explanation
Aerosol Calculations
Average tank head space mass concentrations based upon CGM filter paper data were calculated by dividing the head space radionuclide concentrations from Table C-3 by the waste specific activities for each tank sampled The waste specific activities used came from Table E-I and are listed again in Table C-I The average of the mass concentrations based upon radionuclide data for each tank was used as the average head space mass concentration for that tank For example the calculated SX-IO1 head space mass concentration analysis from the CGM filter papers used during RMCS of riser 19 is
[59E-10 pCi Csrdquorsquoml+ 112 pCi C S rdquo ~ ~ waste] [ 28317 mlftrsquo] = 1 SE-7 g wasteA3 based upon C S rdquo ~
[ I 7E-I I pCi T A M + 504E-1 pCi TAg waste] [ 283 17 mlftrsquo] = 94E-7 g wasteamprsquo based upon Total Alpha
[43E-9 pCi TBml+ 357 pCi TBg waste] [ 28317 mlArsquo] = 34E-7 g wastel based upon Total Beta
[ [ I 5E-7 + 94E-7 + 34E-7 g wasteArsquo] f 31 = 48E-7 g wasteamp
[48E-7 g wastelt ] [3531467 Arsquom3] = 17E-5 g wastemrsquo
All tank head space mass concentrations were calculated in the same manner The results are presented in Table C-4 The weighted average tank head space mass concentration during RMCS was based upon the number of RMCS segments taken for each data point
The average aerosol mass in the head space during RMCS was calculated by multiplying the average tank head space mass concentration by the tank head space volume from Table F-2 For the same data point as above
[48E-7 g waste Arsquo] [115E+5 Arsquo] = 55E-2 g waste in SX-IO1 head space during RMCS
All average mass quantities present in the tank head space during RMCS were calculated in the same manner using a spreadsheet The results are provided in Table C-4 The weighted average mass of waste in a tank head space in Table C-4 was calculated based upon the number of segments obtained for each data point
Estimation of the mass of waste sent to the exhauster per RMCS core or segment requires calculation of the total mass of waste sent to the exhauster Multiplying the average head space concentration during RMCS by the exhauster flow rate (in acfm) and the time of CGM operation will give the mass of waste sent to the exhauster during the CGM time frame only While the large majority of mass of waste aerosols will have exited the tank or
c -2
RPP-4826 Rev I
resettled by the time the CGM is shut off there could be some residual suspended particles remaining These would eventually pass to the exhauster but would not be picked up by the CGM filter since it was not in service An adjustment factor was used as described in the following paragraphs to account for particles that may exit to the exhauster following shut down of the CGM
Particulates are generated by RMCS when purge gas is blowing out the drill string and the bit is rotating under the waste surface This time averages about six minutes per segment Multiplying the number of RMCS segments per core by six minutes per segment and dividing by the number of minutes of CGM operation shows the creation of particulates will only occur during a nominal 3-4 of the time the CGM is operating During RMCS the normal practice is to install the CGM turn it on when personnel enter a tank farm and keep the unit in constant operation for the remainder of the shift When the portable RMCS exhauster is used the exhauster is normally started at least an hour before RMCS is initiated and kept in operation until it is time to halt operations for the week The SX exhauster is kept in constant operation Comparing exhauster operating times from Tables F-l with CGM operating times from Table C-I it can be seen the CGMs are in operation about 3-15 of the time the RMCS exhauster is operating on a tank This time comparison wasnrsquot estimated for the SX exhauster since the SX exhauster is in constant operation
With CGM operation much longer than the time period when particulates could be generated the majority of particulates generated by RMCS should have settled or been exhausted during the CGM operating period Table C-3 shows the tank head space changeouts made by the exhauster during CGM operating periods ranged from 084 to 63 The average was 24 With the CGMs operating 25-33 times longer than the aerosol generation periods and an average of over two tank head space changeouts during CGM operation the large majority of aerosols generated during RMCS will have settled out or been removed by the exhauster by the time the CGM is shut off To account for particulates remaining in the tank head space after the CGM was turned off that are subsequently removed by an exhauster it was conservatively assumed that 20 of the total mass of particles generated during RMCS were not removed from the tank head space during the CGM operating period Therefore the product of the tank head space concentration and the volume of air sent to the exhauster during the time of CGM operation was multiplied by a factor of 125 (lOOl80) to estimate the total mass of waste sent to the exhauster as a result of RMCS This is shown below for the same SX-IO1 riser 19 data point in the above calculations
[48E-7gA3] [IOOmin] [I755 min] [125]= 11E-l gwastetoexhauster
This value was divided by the number of RMCS cores and RMCS segments from Table C-1 to provide the grams per core and grams per segment in Table C-4 as follows
[ I I E- 1 g waste to exhauster] i 1 core = 11 E-I g wastelRMCS core to exhauster
and
[ 1 I E- 1 g waste to exhauster] + 5 segments = 2 I E-2 g wastelRMCS segment to exhauster
All mass per core and mass per segment values were calculated in the same manner using a spreadsheet The results are provided in Table C-4 The weighted average mass per core and mass per segment in Table C-4 were calculated based upon the number of cores or segments obtained for each data point
Summary of Calculations
There were 34 valid CGM filter paper data points from 14 RMCS CGM sampling periods in eight tanks during which I5 RMCS cores and 79 RMCS segments were obtained Based upon CGM filter paper data the results indicate that
The average tank head space mass concentration during RMCS was 4OE-5 g wastem3 The average mass of suspended solids in the tank head space during RMCS was 97E-2 g waste The average mass sent to the exhauster during RMCS was 18E-1 g wastelRMCS core The average mass sent to the exhauster during RMCS was 34E-2 g wastelRMCS segment
c - 3
RPP-4826 Rev 1
Ignoring all CGM filter paper analytical data points with a variance gtloo will result in conservative results These data points indicate negligible radioactivity was present If a value of zero was assigned to each data point with an analytical error of gtloo instead of ignoring the data point the weighted average particulate quantities in Table C-4 would be reduced by about 12
The average tank head space mass concentrations based upon CGM data will be higher than the average tank head space mass concentrations based upon filter housing NDA or dose rate The RMCS exhauster received tank air from the shifts when sampling was performed and during some of the off-shifts when no sampling was done The CGMs were only operated during the shifts when sampling was performed The air concentration drawn into the CGM and the RMCS exhauster should be roughly the came during the operating shifts but somewhat less during the off-shifts Therefore the tank head space concentration will be higher when based upon CGM data This does not impact the mass of waste sent to the exhauster per core or per segment
c -4
I
- ~
RFP-4826 Rev 1
APPENDIX D
ESTIMATION OF Rh4CS EXHAUSTER HOUSING DECONTAMINATION FACTOR
D-0
RFrsquoP-4826 Rev 1
APPENDIX D - Estimation of RMCS Exhauster Housing Decontamination Factor
Summary of Method
This Appendix estimates a Decontamination Factor (DF) for the RMCS exhausters using housing NDA data and applicable stack record sample data The Csrdquorsquo in the exhauster effluent is divided by the C S rdquo ~ in the exhauster inlet to provide a penetration efficiency The reciprocal ofthe penetration efficiency is the DF
Description
Each RMCS exhauster has an isokinetic sampler located on the stack downstream of the blower and HEPA filters A small pomp pulls air from the exhaust stack into a filter paper at a rate proportional to the exhaust flow Radionuclides in the exhaust stream passing through the sample line are caught on the filter paper The stack operating time and flow rate are recorded When the record sample filter paper is removed the filter paper is analyzed in a laboratory for radionuclides The radionuclide concentration in the stack effluent stream is calculated by dividing the quantity of material on the filter paper by the volume of air through the sampler and then dividing again by a factor to compensate for stack sampler and filter paper efficiency
Multiplying the total beta stack effluent concentration by the total off gas flow gives the total beta emissions from the exhauster The total beta emissions are multiplied by the Csrdquorsquo to total beta ratio for the waste in the tank) being exhausted to give an estimate of the C S rdquo ~ emission The C S rdquo ~ on the filters determined by NDA of the housing (see Appendix A) is added to the C S rdquo ~ emissions to give the total C S rdquo ~ input to the filter housing Dividing the emissions by the input gives the filter housing penetration efficiency Subtracting the penetration efficiency from 1 O gives the filter housing efficiency Dividing 1 O by the penetration efficiency gives the DF
RMCS Stack Record Sample Data
RMCS exhauster stack record samples are taken after completion of each sampling event on a tank Normally this is after all cores on that tank have been obtained but for BY-IO5 in 1998 record samples were taken following each core Record samples are also taken at the end of each year All samples are analyzed for total alpha and total beta At the end of each year all the filter papers for that year are composited and analyzed for individual radionuclides Sample results are entered into the Automated Bar Coding of Air Samples at Hanford (ABCASH) and Environmental Release Summary (ERS) databases Several ofthe filter papers from 1998 were reanalyzed using a longer count time to bring the error rate down
Schofield 2000b compiled and evaluated all available RMCS exhauster stack record sample data filtered out the unusable data provided derivation for the stack sampling efficiency factor and summarized the results Most of the data points were so low as to be unusable since the results were either negative or had error variances gtloo
Column 5 of Table D-1 provides the stack effluent concentrations used for calculation of the filter housing DF The stack effluent data in Table D-l come from Schofield 2000b These values include a 073 sampling efficiency factor
Calculation of RMCS Filter Housing Decontamination Factor Based upon Housing Inlet and Outlet Data
The RMCS exhauster housing NDA and stack record sample data available for exhauster Operating Periods 4 5 and 6 were used to estimate an actual DF for the RMCS exhauster housings The housing NDA data is for CSrdquo~ but there are no usable Csrdquorsquo concentrations for the RMCS exhauster outlet The RMCS exhauster stack Csrsquordquo concentrations are either negative have a variance gtloo or are not available Total beta analyses are available however so the stack eftluent C S rdquo ~ concentrations were estimated by multiplying the total beta concentration by the ratio of Csrdquorsquo to total beta in the tank waste
Column 2 of Table D-l lists the increase in CSrsquo~ on the filters for each operating period as determined by NDA This data was obtained from Table A-2
D- 1
RPP-4826 Rev 1
Column 4 of Table D-l lists the stack exhaust volume for each stack record sample period The stack exhaust volume for the exhauster installation on S-l IO was calculated by
[ZOO std ft3min][15978 hrs] [60 minhr] = 199E+6 std ftrsquo
All other stack volumes in Table D-l were calculated the same way Unlike in Appendices A B and C no adjustment was made to change the 200 scfm to actual cfm This is because the RMCS stack record sample concentrations from Table D-3 are based upon a 200 scfm flow rate rather than the actual flow rate Since the concentrations are on the same basis as the flow rate there is no need to correct to acfm
The total beta emissions for the RMCS exhauster stack were calculated by multiplying the volume by the concentration For the same S-l IO data point
[199E+6 ft3] [18E-15 pCiml] [28317mlft3] [mCi1000 pCi] = 1OE-7 mCi total beta
All other total beta emissions in Table D-l were calculated the same way
The Csrdquorsquo to total beta ratio was calculated from data in Table E-I For the same S- l I O data point
326E+5 Ci CsI3rsquo f I 14E+6 Ci total beta = 029 Ci CslhCi total beta = 029 rnCi CsrdquorsquomCi total beta
The Csrsquordquo emission for the same S-l IO data point was thus
[I OE-7 mCi total beta] [029 mCi CsrdquorsquomCi total beta] = 29E-8 mCi Csrdquorsquo
All Csrsquordquo emissions in Table D-l were calculated in the same manner
The penetration efficiency for each operating period was calculated by dividing the exhauster outlet by the filter inlet Csrdquorsquo quantities For operating period 4 this was
[81E-6 mCi] f [5OE-I + 8IE-6 mCi] = 16E-5 = 16E-3
The DF for operating period 4 is
1 + 16E-5 = 62E+4
The overall DF for periods 4 5 and 6 was calculated by dividing the efluent from all three periods by the total filter input
[95E-6 mCi] f [67E-I t 95E-6 mCi] = 14E-5 = 14E-3 penetration efficiency
I - I 4E-5 = 0999986 = 999986 filter efficiency
1 f 14E-5 = 73E+4 decontamination factor based upon housing inlet and eftluent data
Estimation of Housing Decontamination Factor Based upon General Performance Data
HEPA filters are tested at the manufacturer to a minimum 9997 efficiency using a 03 pm monodisperse aerosol After installation HEPA filters are tested in-place per ASME N5 I O to a minimum 9995 efficiency using a polydisperse aerosol with an approximate droplet size distribution of 99 less than 30 pm 50 less than 07 pm and 10 less than 04 pm The RMCS exhauster housing is tested per ASME N510 and is thus required to have a minimum removal eficiency of 9995 for an aerosol with this approximate size distribution The particle size distribution of the waste aerosols generated by RMCS is unknown but it is assumed that the removal efficiency for RMCS generated aerosols was the same as the removal efficiency for the ASME generated test aerosol
D-2
RPP-4826 Rev I
A 9995 efficiency is equivalent to a DF of 2E+3 while a 9997 efficiency is equivalent to a DF of 33E+3 The actual DF for the RMCS exhauster housing is higher than either of these It has two HEPA filters in series even though the minimum efficiency specified in the NOCs for the RMCS exhausters is only equivalent to one HEPA ERDA 1976 recommends using a DF of 3000rdquo for a filter bank where n is the number of HEPA filters in series This would result in a DF of 9E+6 for the RMCS exhauster housing This is unrealistic Using a DF of 9E+6 will calculate to Csrdquorsquo quantities on the HEPA filtersthat are orders of magnitude above what have been shown to be there based upon the measured dose rates and NDA A DF of 9E+6 would mean the dose rate would have to be almost 100 mRhr at the side of the exhauster housing instead of the 05-08 mRhr dose rates encountered The waste particles will not have the same particle size distribution entering the second HEPA filter as when entering the first The majority of the waste particles will be captured on the I rdquo HEPA filter and although the DF for each HEPA if tested individually using the ASME N5 IO aerosol test method may be 3E+3 (or higher) the overall DF of the two filters in series will not be 3000lsquo This is because the particle size distribution entering the Znd HEPA could have a greater percentage of smaller particles than that entering the 1rdquo
NUREG 1995 included an evaluation of a number of different facility stacks at the Hanford site where the HEPA filter upstream air concentrations were estimated using several different methods This report concluded that back-calculation using a value of 3000rdquo overestimated the upstream radionuclide concentration by three to four orders of magnitude when compared to filter NDA data for the nine stacks for which NDA data were obtained and by three orders of magnitude for the two stacks for which upstream air sample data were available Back- calculation using a value of 3000rdquo was shown to be high by four orders of magnitude for the single stack for which a powder release estimate was available Based upon this information the RMCS exhauster dual filter-in-series housings would have a DF of at least three and maybe four orders of magnitude less than 9E+6 or in the 1E+3 to 1 E+4 range A DF of IE+3 would he less than the minimum permissible under the NOC Comparing the older stack data and design with the newer RMCS exhauster design the minimum DF would be expected to be at least 1E+4
Table D-2 provides the available RMCS exhauster aerosol test data This information was obtained from Waldo 1999 Prior to 1998 the RMCS exhauster primary HEPA filter efficiency and either the secondaly HEPA filter or the overall efficiency for both filters were tested Starting in 1998 only the primary and secondary HEPA filter efficiency were measured The overall efficiency of the two filters in series was only measured three times in 11 setups Twice the overall penetration efficiency was lt0002 and the remaining time the only information that could be found was a value of lt005 Most individual filters had a penetration efficiency of 0002 This appears to be about the limit of the detection equipment Based upon Table D-2 data a penetration efficiency of 0002 (99998 efficiency) is normal for a single HEPA and thus a minimum for an RMCS exhauster housing Assuming a 0002 penetration efficiency for the two filters combined calculates to a DF of 5E+4 (equal to 1 +
000002) for the RMCS exhauster housing
In summary the measured DF for the RMCS exhauster housings over the period from May 1998 through June 1999 was about 73E+4 RMCS aerosol testing prior to use indicates a DF of about 5OE+4 for each of the filters separately but their overall efficiency is not measured Referenced data based on older stacks at Hanford indicate the two HEPA RMCS exhauster housing would likely have a DF of at least IE+4
Estimated Aerosol Levels During RMCS Based Upon RMCS Stack Record Sample Data
Revision 0 of this document used the positive record sample results with variance less than 100 to estimate aerosol concentrations in the exhauster inlet using an assumed exhauster housing DF of 5OE+4 This method of estimating aerosols was eliminated from Revision 1 because the stack concentrations were either too low too scattered or too questionable to provide reliable results There were 112 RMCS stack record sample data points evaluated in Schofield 2000b Excluding the total beta sample results used for estimation of the housing DF there were only ten data points remaining with positive values and variances ltloo the remaining data points were either negative had a variance gtloo or the results were not available
For comparison purposes only Schofield 2000b applied the DF of 73E+4 calculated in this document to the data points not used to calculate the exhauster housing DF to estimate aerosol concentrations upstream of the filters The results showed aerosol levels approximately the same as those estimated using NDA dose rate or CGM filter paper data when a value of zero was used for negative sample results or those with a variance gtloo When only
D-3
RPP-4826 Rev 1
the ten positive results with a variance ltloo were used the aerosol levels calculated to be two to five times higher than those estimated using NDA dose rate or CGM filter paper data Because of the variability of data resulting from the extremely low record sample concentrations and the few useable data points estimation of aerosol levels using record sample data was not included in Revision I See Schofield 2000b for further discussion of the use of record sample data to estimate aerosol levels
Summary of Calculations
A total of nine RMCS exhauster stack record sample data points were used to estimate the RMCS exhauster filter housing decontamination factor These data points were obtained when sampling on five tanks during which 10 RMCS cores and 65 RMCS segments were obtained The overall decontamination factor was 73E+4
Estimation of aerosol generation quantities based upon RMCS stack record sample data is possible However results will likely be skewed high if data points that show non-detectable levels of radionuclides present are ignored instead of using a value of zero for the data point
D-4
RPP-4826 Rev 1
APPENDIX E
TANK WASTE RADIONUCLIDE CONCENTRATIONS USED FOR AEROSOL CALCULATIONS
E-0
RPP-4826 Rev 1
APPENDIX E - Tank Waste Radionuclide Concentrations Used for Aerosol Calculations
The RMCS exhauster NDA data HEPA filter dose rate data CGM filter paper data and stack record sample data provide information on the quantity of radionuclides on the exhauster filters in the tank head space or the exhauster stack during RMCS These radioactivity quantities need to be divided by the waste radionuclide concentration specific activity to determine the mass of waste in the tank head space and in the tank gases sent to the exhauster
The mass quantities in this document were calculated using dry basis radionuclide concentrations Waste particles carried into the tank head space by the purge gas could be wet or dry If wet some of the non-chemically bound water will start to evaporate immediately providing the tank relative humidity is 400 The water present in a waste particle may be chemically bound as a hydrate or free The chemically bound water will not readily evaporate therefore even a ldquodryrdquo particle may have some water associated with it It is impractical to measure the actual water content of the waste particulates caught on the CGM filter paper the exhauster HEPA filters or the stack record sample paper Since the quantity of water in the waste particulates is unknown particulate levels were calculated using dry basis radionuclide concentrations Thus all particulate values given in this document are stated on a dry basis
The waste radionuclide concentrations on a dry basis were calculated from data available in the Tank Waste Information Network System (TWINS) The Best Basis InventorylBest Basis Summary numbers were used These values are the most complete and up to date readily available estimates for Hanford waste tank contents but do not include water The information was downloaded from TWINS into a spreadsheet The total chemical total beta and total alpha quantities were summed in the spreadsheet for all the tanks which were sampled and concentrations for Csrdquorsquo Sr9rsquo total beta and total alpha automatically calculated in pCig These concentrations are provided in Table E-I Because lab techniques for measuring gross beta levels only detect beta particles with a minimum decay energy above 150-200 kev only radionuclides with a decay energy of gt-200 kev were included in the total beta numbers
The TWINS radionuclide concentrations were obtained in December 1999 No corrections were made for decay for this document
The CGM filter paper and stack record sample data indicate the measured radionuclide values are not always in the same ratio to each other as given by TWINS nor are all radionuclides detected that TWINS indicates are present Radionuclides can be distributed unevenly in a tank Soluble fission products (primarily Csrsquordquo) are found in the liquid saltcake and in sludges Insoluble fission products and actinides are found largely in sludges as these are primarily chemical precipitates Sludge could be mixed with saltcake be present in a distinct layer at the bottom of a tank or in several layers in the tank depending upon how waste was transferred into a tank Waste particles may thus not have the same specific activity on a microscopic scale as they would have on a macro scale were the tank contents homogenized During RMCS a top to bottom core sample is attempted resulting in the drill bit and purge gas (which causes aerosols to form) passing through most ofthe waste matrix Assuming the aerosol generation rate is approximately constant during drilling the specific activity of a radionuclide in the suspended solids should be roughly the same as the average specific activity of the same radionuclide in the tank waste While the waste specific activity is probably not homogeneous from top to bottom in a tank and the aerosol generation rate will likely also vary it is beyond the scope of this document to provide an in-depth analysis of all the factors affecting aerosol radionuclide concentration Although sample radionuclide data were not always in the same ratio as provided by TWINS for the purpose of this document the simplifying assumption was made that the average tank specific activity is adequate to provide an approximation of the suspended solids specific activity for all radionuclides Average tank individual radionuclide specific activities were used in the preparation of the exhauster NOCs
The aerosol calculations presented in this document are only as accurate as the TWINS data The combined radionuclide content of all Hanford waste tanks is known fairly well since the overall content is based upon reactor production records CsrdquorsquoSrW recovery data and processing plant discharges Thus TWINS data for all tanks combined should be reasonable There are undoubtedly differences between TWINS data and the actual contents of a specific tank While the specific tank radionuclide data from TWINS used in this document may not be exact deviations from the actual concentrations are assumed to balance out over the number of tanks sampled
E- 1
RPP-4826 Rev 1
APPENDIX F
ROTARY MODE CORE SAMPLING EXHAUSTER AND CORE SAMPLE DATA
F-0
RPP-4826 Rev 1
APPENDIX F - Rotary Mode Core Sampling Exhauster and Core Sample Data
This appendix provides the basic data obtained during RMCS operations which was used in preparation of this document
Basic Operational Data
There have been three RMCS exhausters and three RMCS sampling trucks deployed since starmp of nitrogen- purged RMCS in November 1994 The exhausters are formally designated 296-P-32296-P-33 and 296-P-34 These were originally referred to as parts of RMCS Systems 2 3 and 4 respectively in the Notices of Construction (NOC) for these units The exhauster designations were changed for routine field use in 1996 to exhausters A B and C to avoid confusion with core sampling trucks 23 and 4 since any exhauster could be used with any RMCS truck Exhauster A (2) and RMCS Truck2 have not been used for RMCS since 1995 and are no longer in service for core sampling
Rotary mode core sampling has been conducted in four general time frames since 1994 These time frames were separated by down times for equipment modifications or resolution of environmental permitting and safety concerns For ease of analysis in this document exhauster operations were organized into six distinct operating periods Periods I to 6 were grouped based upon times when the same exhauster and same set of HEPA filters were being used These periods thus overlap with the general operating time frames The four operating time frames were
The first time frame lasted from November 1994 to January 1995 RMCS Truck 2 and Exhauster 2 (A) were used on Tank BY-106 along with an in-tank prefilter This tank provided the initial deployment and testing of the nitrogen-purged equipment in a waste tank During this period radiation dose rates were taken at the side of the exhauster housing Stack record samples were taken in December 1994 and January 1995
The second time frame lasted from July 1995 through October 1995 RMCS Trucks 2 and 4 were used with Exhausters 2 and 3 (A and B) on BY-105 BY-IO8 and BY-I IO During this period radiation dose rates were taken at the sides of the exhauster housings Stack record samples were taken after completion of sampling on each tank No RMCS samples were taken from BY-108 all samples were taken in push mode for this tank
The third time frame began when RMCS was restarted in December 1997 Trucks 3 and 4 were used for sampling of SX-101 SX-103 SX-105 and SX-102 with the SX tank farm exhauster providing ventilation The RMCS exhausters were not used During this period radiation dose rates were taken at the sides of the SX exhauster housing as part of HPT routine surveys SX farm exhauster stack record samples were taken when required by normal operating procedures SX record sampler and filter housing dose rate data were not evaluated for this document It would not be practical using filter dose rate or stack record sample data to estimate the RMCS aerosol addition if any to the SX ventilation system The background radiation around the SX filter housing makes measurement of any small increase in dose rate very difficult to detect The number of tanks being ventilated and the involved off-gas header routings (the exhauster is pulling on thirteen tanks in series or in parallel with the tank being sampled) and any in-tank activities in the SX tanks not being sampled would make it impractical to assess what aerosols resulted from RMCS Beginning with RMCS in SX farm radionuclide analyses were performed on the filter papers protecting the CGMs which draw air out of the tank vapor space for flammable gas detection
The fourth time frame began in May 1998 Between 1095 and 598 Exhausters B and C were extensively modified with new filter housings and other equipment to meet new NOC requirements Trucks 3 and 4 were used with Exhausters B and C (3 and 4) on S-l IO U-107 BY-105 TX-113 and TX-I 18 This period marked the first use ofthe RMCS trucks and RMCS exhausters together following resolution of flammable gas concerns and modifications to the exhausters New filters were installed Radiation dose rates were taken at the sides of the exhauster housings Stack record samples
F- 1
RPP-4826 Rev I
were taken after completion of sampling for each exhauster installation Radionuclide analyses were performed on the CGM filter papers for all tanks except TX-118 An NDA was performed on the Exhauster C housing following completion ofthe first core on TX-I 13 The housing filters when assayed contained aerosols captured by the exhauster following RMCS in S-l IO U-107 BY-105 (1998) and the first core of TX-I 13 Another NDA was performed on Exhauster C following both cores in TX-I 18 An NDA was performed following sampling of the second core in TX-I 13 using Exhauster B The time frame ran through early June 1999 No RMCS samples have been taken after June 1999 nor are any planned for the next few years
For the purposes of evaluating aerosol formation based upon RMCS exhauster housing NDA and dose rate data the exhauster operations were grouped into 6 operating periods These periods are shown in Table F-1 and restated in Tables A-I and B-I All tanks sampled in Periods 1 2 4 5 and 6 were exhausted by the same exhauster with the same housing and filters present during that period Period 3 covered the time the SX exhauster was used during RMCS in SX farm
A brief description of each RMCS tank sampling operation is provided below
Tank 241-BY-1061194 to 1294 RMCS using the nitrogen purge gas system with an exhauster was formally begun on 111794 on tank BY-106 riser IOB Exhauster 2 (A)and Truck 2 were used A sintered metal prefilter was inserted in the riser between the tank and the exhauster A total of eight segments were taken in rotary mode and five segments in push mode until sampling was halted on 122194 One RMCS core was obtained The total exhauster run time was 4878 hours The stack record sample was removed and analyzed following this run period Dose rates taken at the side of the exhauster housing during RMCS were all lt05 mRhr The in-tank prefilter was smeared for contamination when removed from the tank with the smears showing less than detectable levels of radionuclides present (Waldo 1999) The prefilter had been washed with an installed spray system prior to removal from the tank but subsequent testing showed the water flow and pressure were too low to have been effective at removing contamination
Tank 241-BY-106195 Following some process modifications RMCS in BY-IO6 riser IOB began again on 11895 Exhauster 2 (A) and Truck 2 were used The sintered metal prefilter was inserted in the riser between the tank and the exhauster RMCS was halted on 12495 over authorization basis and equipment operability issues for RMCS A total of three segments were taken in rotary mode and eleven segments in push mode One RMCS core was obtained The total exhauster run time was 1867 hours The stack record sample was removed and analyzed following this run period Dose rates taken at the side of the exhauster housing during RMCS were all lt O S mRhr The in-tank prefilter was smeared for contamination when removed from the tank with the smears showing less than detectable levels of radionuclides present (Waldo 1999) The prefilter was not washed this time
Tank 241-BY-110795 to 1095 Following resolution of RMCS authorization basis and equipment issues and completion of the fabrication and testing of Trucks 3 and 4 RMCS was begun in BY-I IO on 71195 Exhauster 2 (A) and Truck 2 were used Samples were taken from risers 128 7 128 again and 4 There was no in- tank prefilter used in this or any subsequent RMCS periods Sampling was performed until 102595 when RMCS was halted over flammable gas issues A total of 13 RMCS segments and 56 PMCS segments were taken Three RMCS cores were obtained The total exhauster run time was 1125 hours The stack record sample was removed and analyzed following this run period Dose rates taken at the side of the exhauster housing during RMCS were all lt O S mRhr
Tank 241-BY-108795 to 895 Core sampling was begun in BY-IO8 on 72595 Exhauster 3 (B) and Truck 4 were used Sampling was done in risers 12A and 7 The tank material proved soft enough so that no RMCS segments were required all segments were obtained in push mode although the exhauster was operated during part of the time sampling was performed Sampling was completed 81895 A total of 16 PMCS segments were taken The total exhauster run time was 6617 hours The stack record sample was removed and
F-2
RPP-4826 Rev 1
analyzed following this run period Dose rates taken at the side of the exhauster housing during RMCS were all lt05 mRhr
Tank 241-BY-105895 to 1095 RMCS was begun in BY-I05 riser 12A on 83095 Exhauster 3 (B) and Truck 4 were used This tank has a concrete layer on top about 12-18 inches thick which had to be drilled through Part way through sampling questions arose as to the flammable gas status of the tank and RMCS was halted on 10695 A total of 3 RMCS and 7 PMCS segments were taken One RMCS core was obtained The total exhauster run time was 4413 hours The stack record sample was removed and analyzed following this run period Dose rates taken at the side of the exhauster housing during RMCS were all lt05 mRhr
Tank 241-SX-1011297 to 298 Following resolution of extensive regulatory and authorization basis issues and installation of equipment modifications RMCS started in SX-101 with Truck 4 on 12497 An RMCS exhauster was not used since all SX farm tanks excluding SX-113 and SX-I 15 are ventilated with the SX exhauster Sampling was performed in risers 19 and 4 and was completed on 21098 A total of 9 RMCS and 6 PMCS segments were taken Two RMCS cores were obtained SX exhauster stack record samples and filter housing dose rates were obtained as part of routine operations for the SX exhauster not as part of the RMCS process Filter papers used in the suction line for the CGM were saved and analyzed in the laboratory to estimate the airborne radionuclide concentration in the tank head space Two CGM filter papers were needed for each core as moisture in the tank vapors condensed on the papers in the cold weather and began to restrict tank gas flow to the CGM
Tank 241-SX-103498 to 598 RMCS started in SX-103 with Truck 4 on 42798 The SX exhauster was used for ventilation (see SX- 101 above) Sampling was performed in risers 7 and 1 1 and was completed on 51198 A total of 6 RMCS and 18 PMCS segments were taken Two RMCS cores were obtained During sampling filter papers used in the suction line for the CGM were saved and analyzed in the laboratory to estimate the airborne radionuclide concentration in the tank head space One CGM filter paper was used during each core SX exhauster stack record samples and filter housing dose rates were obtained as part of routine operations for the SX exhauster not as part of the RMCS process
Tank 241-SX-105298 to 598 RMCS started in SX-105 with Truck 3 on 22598 The SX exhauster was used for ventilation (see SX- 101 above) Sampling was performed in risers 6 and 14 and was completed on 51598 A total of 6 RMCS and 20 PMCS segments were taken Two RMCS cores were obtained During sampling filter papers used in the suction line for the CGM were saved and analyzed in the laboratory to estimate the airborne radionuclide concentration in the tank head space Two filter papers were needed for the first core as moisture in the tank vapors condensed on the papers in the cold weather and began to restrict tank gas flow to the CGM One filter paper was used for the second core SX exhauster stack record samples and filter housing dose rates were obtained as part of routine operations for the SX exhauster not as part of the RMCS process
Tank 241-SX-102698 to 798 RMCS started in SX-102 with Truck 4 on 61798 The SX exhauster was used for ventilation (see SX- 101 above) Sampling was performed in risers 8 and 4 and was completed on 7798 A total of 2 RMCS and I8 PMCS segments were taken Two RMCS cores were obtained During sampling filter papers used in the suction line for the CGM were saved and analyzed in the laboratory to estimate the airborne radionuclide concentration in the tank head space One filter paper was used for each core SX exhauster stack record samples and filter housing dose rates were obtained as part of routine operations for the SX exhauster not as part of the RMCS process
Tank 241-S-110598 to 698 RMCS was begun in S-I10 on 51898 Exhauster C (4) and Truck 3 were used This tank marked the first use of an RMCS exhauster since 1995 Sampling was completed on 6498 Risers 6 and 14 were sampled A total of IO RMCS and 8 PMCS segments were taken Two RMCS cores were obtained The
F-3
RPP-4826 Rev I
total exhauster run time was 15978 hours The stack record sample was removed and analyzed following this run period Dose rates taken at the side of the exhauster housing during RMCS were all lt05 mRhr During sampling filter papers used in the suction line for the CGM were saved and analyzed in the laboratory to estimate the airborne radionuclide concentration in the tank head space One filter paper was used for each core Waste particles retained on the exhauster housing filters were part of the inventory subsequently measured by NDA following completion of the first core in TX-I 13
Tank 241-U-107698 to 798 RMCS was begun in U-107 on 61098 Exhauster C and Trucks 3 and 4 were used Sampling was completed on 71598 Risers 7 and 2 were sampled A total of IO RMCS and 19 PMCS segments were taken Two RMCS cores were obtained The total exhauster run time was 27385 hours The stack record sample was removed and analyzed following this run period Dose rates taken at the side of the exhauster housing during RMCS were all 105 mRihr During sampling filter papers used in the suction line for the CGM were saved and analyzed in the laboratory to estimate the airborne radionuclide concentration in the tank head space One filter paper was used for each core Waste particles retained on the exhauster housing filters were part of the inventory subsequently measured by NDA following completion of the first core in TX-I 13
Tank 24l-BY-105798 to 898 RMCS was begun in BY-105 again on 72298 Exhauster C and Trucks 3 and 4 were used Sampling was completed on 82598 Risers 7 and 1 1 B were sampled A total of 18 RMCS and 18 PMCS segments were taken The material was hard enough to require rotary mode sampling all the way to the bottom of the waste but negligible recovery was obtained After RMCS was performed to the waste bottom a PMCS core was taken in the same hole to recover material Two RMCS cores were obtained The exhauster run time was 13577 hours for the first RMCS core and 30792 hours for the second RMCS core Stack record sample information in ABCASH shows 30558 hours operation for the second core but the sampler data sheet shows the time counter was mistakenly reset 234 hours into the run No correction was made to the BY-IO5 2nd core record sample concentration for this document since the error is conservative and results in only slightly higher (ltI) record sample radionuclide concentrations for this core A stack record sample was removed and analyzed following each core giving two record samples for BY-IO5 in 1998 Dose rates taken at the side of the exhauster housing during RMCS were almost all lt05 m R h but a few readings indicated 07 mRihr This variation was assumed due to personnel reading the instrument differently or the fact that the exhauster had been used on enough tanks that by now there was sufficient activity on the filters to cause readings approximately at the background detection level The final reading when both cores were completed was lt05 m R h During sampling filter papers used in the suction line for the CGM were saved and analyzed in the laboratory to estimate the airborne radionuclide concentration in the tank head space One filter paper was used for each core Waste particles retained on the exhauster housing filters were part of the inventory subsequently measured by NDA following completion of the first core in TX-113
Tank 241-TX-113998 to 599 Core sampling was begun in TX-I 13 riser 3 on 92298 Exhauster B (3) and Truck 4 were used at the start This was the first use of Exhauster B since it was modified Exhauster B ran for a total of 8738 hours until being disconnected on 102398 During this time two PMCS segments were taken and no RMCS segments Exhauster C was then installed and operated for 5598 hours from 121098 to 122898 No RMCS or PMCS sampling was performed during this time frame RMCS segments werent taken until 299 Exhauster C ran for a 30230 hours between 122898 and 21299 Sampling was completed on the core from riser 3 on 21299 A total of 12 RMCS segments were obtained during the time Exhauster C was operating Exhauster flow rate for both exhausters was a nominal 200 scfm Stack record samples were taken following Exhauster B removal at the end of 1998 for Exhauster C and following completion ofthe first core with Exhauster C Aerosol calculations were based on only the 30230 hours run time for Exhauster C in 1999 since this was the time period during which RMCS segments were obtained Dose rates taken at the side of the exhauster housing during the short PMCS only sampling period with Exhauster B were all ltOS m R h Dose rates with Exhauster C varied between lt O S mRhr and 07 mRhr The final reading on Exhauster C following completion of the first core was 07 mFUhr During sampling filter papers used in the suction line for the CGM were saved and
F-4
RPP-4826 Rev I
analyzed in the laboratory to estimate the airborne radionuclide concentration in the tank head space One filter paper was used for the core Waste particles retained on the exhauster housing filters were part of the inventory subsequently measured by NDA following completion of this core
Sampling in riser 5 was begun on 41299 using Exhauster B and Truck 3 A total of 6 RMCS and 1 PMCS segments were taken for this core before sampling was halted on 42899 The total exhauster run time for this core was 11712 hours Problems with high vacuum in the tank required the exhauster flow rate to be reduced to 190 scfm to keep the system within pressure limits The stack record sample for the second core was removed and analyzed following the run period Dose rates taken at the side of the exhauster housing during the second core were all lt05 m M r During sampling filter papers used in the suction line for the CGM were saved and analyzed in the laboratory to estimate the airborne radionuclide concentration in the tank head space One filter paper was used An NDA was performed on the exhauster housing following this core The only radionuclides present in the housing were those from this core or what was removed from the tank head space during the non-RMCS activities in this tank from 92298 and 102398
Some clarification may be needed to explain use of the exhauster operating times and NDA dose rate and record sample data obtained during core sampling on TX-I 13 Core sampling was set up for sampling riser 3 on TX-113 in September 1998 with Exhauster B Exhauster B operated for a total of 8738 hours between 92298 and 102298 The stack record sample was removed at the end of this period The ERS database incorrectly shows the exhauster operated between 111698 and 111998 The ABCASH database shows the stack record sample was removed on 111998 The stack record sample showed positive emuent concentrations during this time period with variances 400 No RMCS samples were taken during this period so the data and time werenrsquot included when calculating RMCS aerosol numbers Exhauster B was removed and Exhauster C installed in late November-early December Exhauster C was operated for a total of 5559 hours between 121098 and 122398 The stack record sample was removed on 122898 No sampling was performed during this period so the data and time werenrsquot included when calculating RMCS aerosol numbers Exhauster C was operated for a total of 30218 hours between 122898 and 2899 All the RMCS segments from riser 3 were taken in this time period so only the data and time for this period were included when calculating RMCS aerosol numbers Exhauster B was used during sampling of riser 5 Exhauster B operated for a total of 11712 hours between 41299 and 42899
Tank 241-TX-l18599 to 699 RMCS was begun in TX-I 18 on 5699 Exhauster C (4) and Truck 4 were used Sampling was completed on 6298 Risers 9B and 12B were sampled A total of 9 RMCS segments were taken there were no PMCS segments Two RMCS cores were obtained The total exhauster run time was 21247 hours The stack record sample was removed and analyzed following this run period The maximum dose rate taken at the side of the exhauster housing following RMCS was 08 m M r CGM filter papers were not analyzed An NDA was performed on the exhauster housing following completion of the two cores The exhauster housing contained the same nuclides as for the first NDA (S-110 U-107 BY-105 and TX-I 13 first core) plus those from TX-I 18
The basic core sampling operational data used in this document includes the number of RMCS cores and segments the exhauster run times and flow rates the RMCS exhauster HEPA filter dose rates and tank vapor space temperatures Table F-l lists the basic operational data This information excluding tank vapor space temperature data was obtained from procedural data sheets in the sampling work packages (References W - 1 to WP-23)
Tank temperature data for the tanks ventilated with the RMCS exhausters was obtained from the TWINS database Plots for each tank were prepared for the time RMCS was conducted and the average value of the highest thermocouple located in the tank (the lowest temperature reading) was estimated and used as the average tank head space temperature during the RMCS period
The SX exhauster flow rates listed in Table F-l are estimates only The combined flow rate for SX-IO1 through SX-106 plus SX-109 (7 tanks) averaged 440 cfm during CY 1996 (Kaiser 1997) for an average of 63 cfm per
F-5
RPP-4826 Rev I
tank Based upon inlet flow measurements at the tank inlet HEPA filters (Fanis 1998) the flow through each individual tank (SX-IO1 through SX-106 plus SX-109) was lt55 cfm at the breather filter Assuming an exhaust flow of 100 cfm for each SX farm tank sampled is therefore conservative
Calculated Data
Calculated data include the tank head space volumes conversion of the RMCS exhauster flow rate from scfm to acfm and the number of tank head space changeouts made by an exhauster during RMCS
Tank head space volume includes the dome space volume above the top of the sidewall plus the void space between the waste surface and the top of the sidewall The formula used to calculate tank head space volumes WN
Head Space Volume in A = (DS + [(H) (12) + HI + Hb - H] (V)) - 748
Where DS = dome space volume gal H = height of tank body sidewall above knuckle A HI = height of tank knuckle area in Hb = height oftank bottom below knuckle in H = height of waste in tank in V =27555 galin of waste in SX tanks 2754 gallin in all others
The tank dome space volumes height of tank sidewall above the knuckle height of tank knuckle area and height of tank bottom below the knuckle were obtained from Reynolds 1999 The height of waste in each tank at the time of core sampling was obtained from the TWINS database Tank dimensional and waste level data are given in Table F-2 along with the calculated tank head space volumes
Aerosol calculations for Appendices A-C require exhauster flow rates in actual cubic feet per minute The RMCS exhauster flow rate is controlled and recorded in standard cubic feet per minute The mass flow rate of the exhauster air is measured and internal logic in the exhauster controller calculates what the volumetric flow rate would be if the temperature and pressure in the exhauster inlet were at standard conditions The standard conditions used in the logic controller are 29921 in Hg (760 mm Hg) and 69F (ZIT)
A correction factor is built into the exhauster control logic that assumes an atmospheric pressure of 2927 in Hg the average atmospheric pressure at Hanford The RMCS exhauster will operate at about 1-2 in H20 negative pressure resulting in about a 2916 in Hg pressure in a waste tank when the RMCS exhauster is operating To revise the indicated scfm RMCS exhauster reading to an acfm value the RMCS exhauster scfm flaw rate was multiplied by (29922916)(T+459)528 where Tis the tank head space temperature in OF The tank head space temperatures in Table F-1 were input to the spreadsheet file used for aerosol calculations and converted to acfm The flow rates in acfm are included in Table F-I
The tank head space changeouts when using the RMCS exhauster were calculated by multiplying the exhauster acfm flow rate by the time of exhauster operation and dividing the result by the tank head space volume Tank head space changeouts are listed in Table F-2
F-6
c
gt 2
RPP-4826 Rev 1
APPENDIX G
REFERENCES
G-0
RPP-4826 Rev 1
APPENDIX G - References
Diedeker 1999 NDA of RMCS HEPA Filters L P Diedeker WMH E-Mail to JS Schofield CHG November 29 I999
ERDA 1976 Nuclear Air Cleaning Handbook ERDA 76-21 Buchsted C A Fuller A B and Kahn 1 E Oak Ridge National Laboratory 1976
Farris 1998 Internal Note T R Farris LMHC to J S Schofield LMHC Breather Filter Flow Rates for SX-Farm 31698
Foust 1999 Internal Memo RMCST Exhauster HEPA Filter Dose Rate Calculations D J Foust LMHC to J S Schofield LMHC October 25 1999
Greager 1999 Correspondence No WMH-9954450 Non-Destructive Analysis of the Rotay Mode Core Sample High-Efjiciency Particulate Air Filters E M Greager WMH to P C Miller LMHC June 28 1999 [Transmittal of HNF-4199 Resultsfram NDA Measurement of the 296-P-34 RMCS HEPA Filters]
HNF 1999 HNF-SD-WM-SAR-067 Tank Waste Remediation System Final Safety Analysis Report Rev 1 The revision incorporating RMCS accident analyses was submitted as Addendum 5 to DOE as a change to the FSAR predecessor the Basis for Interim Operation (BIO) LMHC-9857075 80232764-9-KOOl Submittal of Authorization Basis Amendment Package for Rotay and Push Mode Core Sampling in Satisfaction of Perfarmance Agreement TWR 122 Expectations I and 3 D 1 Allen LMHC to A M Umek FDH August 30 1998 Addendum 5 as of mid-January 2000 is waiting for approval by DOE
Kaiser 1997 T D Kaiser LMHC E-Mail to J S Schofield LMHC SX Tank Flow Data 42197
NUREG 1995 Potential Radionuclide Emissionsfrom Stacks on the HanfordSite Part I Dose Assessment Davis W E and Barnett J M Westinghouse Hanford Company from Proceedings of the 23 DOEMRC Nuclear Air Cleaning Conference held July 25-28 1994 February 1995
Schofield 2000a Letter 74910-00-002 Use of Microshield Calculations for RMCS Exhauster Housing for Estimating Radionuclide Quantities on the Filters Using NDA and Dose Rate Measurements I S Schofield CHG to File January 62000
Schofield 2000b Letter 74910-00-003 Rev I RMCS Exhauster Stack RecordSample Data J S Schofield CHG to File January 202000
Reynolds 1999 D R Reynolds LMHC E-Mail to I S Schofield LMHC transmitting Tank Volume Calculations draft of calculations done by Mike Plesha and Reed Hendershot data to be used for RESOLVE computer program for Hanford waste tanks August 3 1999
TWINS Tank Waste Information Network System database available at httptwinspnlgovSOO lhtbinTCDgetTableListexe
Waldo 1999 letter 74910-99-009 RMCS Exhauster Aerosol Test Data E I Waldo to J S Schofield June 22 1999
WHC 1993 WHC-SD-WM-ES-225 Rev I AerosolStudy for the Rotary Mode Exhauster P M Francis Westinghouse Hanford Company April 20 1993
WHC 1997 WHC-SD-WM-SAD-035 Rev Ob A Safety Assessment of Rotary Mode Core Sampling in Flammable Gas Single Shell Tanks Hanford Site Richland Washington August 8 1997
G- I
RPP-4826 Rev I
CGM Data CGM-I Letter PARTICULATE SAMPLING OF 241-SX-IO1 DURING ROTARY MODE CORE SAMPLING D C
Langlois E2 Consulting Engineers to J S Schofield Lockheed Martin Hanford Company March 16 1998
CGM-2 Letter PARTICULATE SAMPLING OF 241-SX-I05 DURING ROTARY MODE CORE SAMPLING D C Langlois E2 Consulting Engineers to J S Schofield Lockheed Martin Hanford Company June 9 1998
CGM-3 Letter PARTICULATE SAMPLING OF 241-SX-103 DURING ROTARY MODE CORE SAMPLING D C Langlois E2 Consulting Engineers to J S Schofield Lockheed Martin Hanford Company June 12 1998
CGM-4 Letter PARTICULATE SAMPLING OF 241-S-110 DURING ROTARYMODE CORESAMPLING D C Langlois E2 Consulting Engineers to J S Schofield Lockheed Martin Hanford Company July 20 1998
CGM-5 Letter PARTICULATE SAMPLING OF 241-SX-102 DURING ROTARY MODE CORE SAMPLING D C Langlois E2 Consulting Engineers to J S Schofield Lockheed Martin Hanford Company July 22 1998
CGM-6 Letter PARTICULATE SAMPLING OF241-U-107 DURING ROTARY MODE CORE SAMPLING D C Langlois E2 Consulting Engineers to J S Schofield Lockheed Martin Hanford Company August 3 1998
CGM-7 Letter PARTICULATE SAMPLING OF 241-BY-105 DURING ROTARY MODE CORESAMPLING D C Langlois E2 Consulting Engineers to 1 S Schofield Lockheed Martin Hanford Company September 17 1998
CGM-8 Letter PARTICULATE SAMPLING OF 241-TX-I13 DURING ROTARY MODE CORESAMPLING D C Langlois E2 Consulting Engineers to J S Schofield Lockheed Martin Hanford Company March 15 1999
CGM-9 Letter PARTICULATE SAMPLING OF 241-TX-113 DURING ROTARY MODE CORE SAMPLING D C Langlois E2 Consulting Engineers to I S Schofield Lockheed Martin Hanford Company May 31 1999
Notices of Construction NOC-I DOEIRL-93-40 Radioactive Air Emissions Program Notice of Construction Rotary Mode Core-Sampling
Truck and Exhauster Approved by Letter AIR 93-707 A W Conklin WDOH to J E Rasmussen DOEIRL 7893
NOC-2 DOEIRL-94-118 Rev 0 Radioactive Air Emissions Program Notice of Construction for the Rotary Mode Core-Sampling Systems Three and Four Approved by Letter AIR 95-603 A W Conklin WDOH to J E Rasmussen DOERL 63095
NOC-3 DOERL-94-118 Rev 1 Radioactive Air Emissions Program Notice of Construction for the Rotary Mode Core-Sampling Systems Three and Four Approved by Letter AIR 98-301 W W Conklin WDOH to I E Rasmussen DOEIRL 3698
NOC-4 DOEIRL-97-70 Radioactive Air Emissions Program Notice of Construction for Rotary Mode Core- Sampling in SX Tank Farm Approved by Letter AIR 97-1 101 A W Conklin WDOH to J E Rasmussen DOEIRL 113097
NOC-5 USEPA Letter OAQ-107 (no title approving DOE submittal 97-EAP-590 dated 72997) A J Frankel USEPA to J E Rasrnussen DOEIRL 8497
NOC-5 USEPA Letter OAQ-107rsquo (nb title approving DOE submittal 97-EAP-723 dated 101797) A J Frankel USEPA to J E Rasmussen DOERL 11498
Note that both letters have ldquoOAQ-107rdquo following ldquoReply to Attn ofrdquo
G-2
RPP-4826 Rev I
Work Packages WP-I ES-94-00808 WP-2 ES-95-00258 WP-3 ES-95-00045 - WP-4 ES-95-00434 - WP-5 ws-97-00173 - WP-6 WS-97-00174 - WP-7 ws-97-00143 - WP-8 WS-97-00144 - WP-9 WS-97-00207 - WP-I 1 WS-97-00208 - WP-12 WS-98-00049 - WP-13 WS-97-00050 - WP-14 WS-97-00224 - WP- I5 WS-97-00225 - WP-16 WS-97-00230 - WP- I7 ws-97-0023 1 - WP-18 ES-97-00452 - WP-19 ES-97-00453 - WP-20 WS-98-00072 - WP-21 WS-98-00073 - WP-22 WS-98-00067 - WP-23 WS-98-00068 -
241-BY-IO6 Perform Rotary Core Sample [Riser IOB] 241-BY-I IO Rotary Core Sample [Risers 12B 7 IZB 41 241-BY-IO8 Obtain Rotary Core Sample [Risers 12A amp 71 241-BY-IO5 Rotary Mode Core Sample [Riser 12A] 241-SX-101 Rotary Mode Core Sample Riser 19 241-SX-101 Rotary Mode Core Sample Riser4 241-SX-103 Rotary Mode Core Sample Riser 7 241-SX-103 Rotary Mode Core Sample Riser I I 241-SX-105 RMCST Obtain Core Sample Riser 6 241-SX-105 RMCST Core Sample Riser 14 241-SX-102 Rotary Mode Core Sample Riser 8 241-SX-102 Rotary Mode Core Sample Riser 4 241-S-1 IO RMCST Obtain Core Sample Riser 6 241-S-1 IO RMCST Obtain Core Sample Riser 14 2414-107 RMCSTCore Sample Riser 7 241-U-107 RMCST Core Sample Riser 2 241-BY-IO5 RMCST Core Sample Riser 7 241-BY-IO5 RMCST Core Sample Riser 1 IB 241-TX-113 Rotary Core Sample Riser 3 241-TX-113 RMCST Core Sample Riser 5 241-TX-I 18 RMCST Core Sample Riser 9B 241-TX-I 18 RMCST Core Sample Riser 128
G-3
RPP-4826 Rev 1
Tank 241-BY-108 795 to 895 F-2 Tank 241-BY-105 895 to Tank 241-SX-101 1297 to 298 F-3 Tank 24I-SX-103498 to F-3 Tank 241-SX-105298 to 598 F-3 Tank 241-SX-I02698 to 798 F-3 Tank 241-S-110 598 to 698 F-3 Tank 241-U-107 698 to 798 Tank 241-BY-105 798 to 898 F-4 Tank 241-TX-113998 to 599 F-4 Tank 241-TX-118 599 to 699
Calculated Data F-6
APPENDIX G - References
List of Figures
Figure 1 Relative Waste Aerosol Concentrations In Tank Head Space 8
List of Tables
Table 1 Summary Of Aerosol Estimation Methods Used Table 2 Summary Of RMCS Aerosol Data Table A-I Exhauster Operating Periods an Table A-2 NDA Data Table A-3 Concentrations And Aerosol Table B- 1 RMCS Exhauster Operating
B-5 Table 8-3 Concentrations And Aerosol Side of RMCS Exhauster B-6 Table C-l Operating Data for Tanks on Which Combustible Gas Monitor Filter Paper Data Were Used for RMCS Aerosol Calculations Table C-2 Combustible Gas Table C-3 Tank Head Spac Table C-4 Aerosol Table D-l Stack E Table D-2 RMCS Exhauster HEPA Filter Aerosol Test Data Table E-1 Tank Contents From TWINS Best Inventory Databa Table F-l Basic RMCS And Exhauster Operational Data
Table B-2 Dose Rate Data and Filter Cs
Table F-2 Tank Dimensional Data Head Space Volumes And Head Space Changeouts during RMCS F-8
ii
RPP-4826 Rev I
Glossary
ABCASH acfin CGM changeout
Ci core DF DOE EPA ERS exhauster g GEA head space HEPA housing kg mCi LFL NDA NISampT NOC PMCS PTE record sample RMCS W C S core RPP scfm segment specific activity TA TB TWINS TWRS
Automated Bar Coding of Air Samples at Hanford actual cubic feet per minute combustible gas monitor the replacement of air in a tank head space with a volume of air equal to the head space volume curie equal to 37Ei-10 disintegrationslsec a top to bottom (or until sampling is halted) collection of segments taken from a tank riser decontamination factor Department of Energy Environmental Protection Agency Environmental Release Summary (database) the exhauster used during RMCS on a tank gram gamma energy analysis the volume of air above the waste surface in a tank high efficiency particulate air the main body of the exhauster containing the filter media kilogram millicurie IE-3 Ci lower flammability limit non destructive assay National Institute of Standards and Technology Notice of Construction push mode core sampling Potential to Emit stack samples taken during RMCS to measure the radionuclides released to the atmosuhere rotary mode core sampling a core taken from a tank with one or more segments taken in RMCS mode River Protection Project standard cubic feet per minute an individual 19 inch long sample or group of samples taken which add up to 19 inches the concentration of a radionuclide in the waste on a mass basis normally in pCUg or mCig tots1 alpha total beta Tank Waste Information Network System Tank Waste Remediation System
averages are based upon the number of RMCS segments Washington State Department of Health
weighted average an average which is weighted based upon a given parameter in this document weighted
WDOH uCi microcurie IE-6 Ci
iii
RPP-4826 Rev I
EXPERIENCE WITH AEROSOL GENERATION DURING ROTARY MODE CORE SAMPLING IN THE HANFORD SINGLE SHELL WASTE TANKS
Summary
This document presents information on aerosol formation in tank head spaces during rotary mode core sampling (RMCS) in single shell waste tanks (SST) at the Hanford Site The mass of aerosols generated during RMCS has been very small The average mass of suspended waste solids present in an SST head space during RMCS was lt01 g The mass of suspended solids sent to an exhauster averaged ltOl g per RMCS segment and lt05 g per RMCS core The results are three orders of magnitude less than assumed in current accident analyses and environmental permit applications The measured decontamination factor (DF) for the RMCS exhauster housing exceeded 70000
Purpose
The purpose of this document is to present estimates based upon RMCS operating experience of the concentration and total mass of waste aerosols present in SST head spaces during RMCS and estimates of the mass of aerosols sent to the exhauster used on the tank This document also evaluates the performance of the RMCS exhausters and provides an estimate of the filter housing decontamination factor Revision 1 of this document is an extensive rewrite of Rev 0 and includes additional information not available when Rev 0 was issued
RMCS using a nitrogen purge gas to cool the bit and provide hydrostatic head pressure was performed between November 1994 and June 1999 All the available data relevant to aerosol formation during RMCS in SSTs was used for this study This document is not an evaluation of aerosol formation processes aerosol dispersion patterns within the tank head space aerosol settling rates or factors affecting removal of particulates from a tank When using the values given in this document to estimate maximum potential quantities released to an exhauster or to account for peak concentrations in a tank head space when evaluating potential accident scenarios engineering judgement should be used as deemed necessary to adjust the values given in this document for conservatism
Introduction
Core sampling is used to obtain 19 inch long samples of radioactive waste in the Hanford single shell waste tanks A 19 inch core sample is a segment A core is made up of all the segments taken as the drill bit passes through the waste A sample may he taken in push mode (PMCS) or rotary mode A segment taken in rotary mode is designated an RMCS segment and a core in which any RMCS segment is taken is designated an RMCS core RMCS is used for tanks in which the waste may be too hard to sample using other methods
Before 1994 core sampling was performed using different liquids that cooled the drill bit during RMCS and provided a hydrostatic head in the drill string during both RMCS and PMCS RMCS sampling was halted in 1990 over safety concerns with flammable gases and organic nitrates in the waste tanks The RMCS equipment was redesigned to a new process that used nitrogen gas to cool the cutting bit The nitrogen flow rate is approximately 30 to 40 scfm (085 to 11 m3min) during periods the drill string is rotating This gas passes through holes in the bit up through the waste and is released to the tank head space Tank head space volumes are in the 50000 to 100000 ft3 (1400 to 2800 mrsquo) range Since the nitrogen purge gas could result in aerosol formation in the tank vapor space an exhauster was included with the RMCS equipment redesign RMCS using the nitrogen purged process has been performed to date during the periods 1194 to 195795 to 1095 and 1297 to 699 From 1297 to 798 RMCS was performed in SX tank farm with the SX tank exhauster providing the ventilation In 94-95 and from 598 through 699 RMCS was performed in BY S U and TX tank farms using an RMCS exhauster
An estimate of the mass of aerosols sent to an exhauster during rotary mode core sampling is needed as a basis for the Potential to Emit (PTE) estimate in environmental permits for the exhausters employed during RMCS Estimates of tank head space mass concentrations and total suspended solids during RMCS are also used in certain accident analyses related to RMCS Since the bit rotation and gas sparging nature of RMCS have a higher potential for aerosol generation than many in-tank activities aerosols generated during RMCS may provide an estimate of the upper limit for the concentration of aerosols to be found in a tank head space during these activities
RPP-4826 Rev 1
There are two current (as of January 2000) Notices of Construction (NOC) approved by the Washington D e p m e n t of Health (WDOH) for exhauster use during RMCS The first WDOH permit is for Exhauster Systems 3 and 4 (referred to as Exhauster B and Exhauster C in this document) during RMCS in a tank that is normally passively ventilated (Reference NOC-3) The second WDOH permit (NOC-4) is for RMCS in SX tank farm using the SX exhauster The Environmental Protection Agency (EPA) has also granted approval for RMCS exhauster use in a tank that is normally passively ventilated (NOC-5) and for RMCS in SX farm with the SX exhauster (NOC-6)
Very conservative assumptions were made on RMCS aerosol quantities for the existing NOCs and safety basis accident analyses These assumptions were made since no operational data were available on aerosol levels when most of these NOCs and accident analyses were prepared WHC 1993 provided the initial estimate of aerosols sent to the exhauster during RMCS Based upon assumptions in this document a value of 1 kg of waste sent to the exhauster per RMCS core was used as the basis for the first two RMCS NOCs (NOC-I and NOC-2) This number was based upon drilling tests in drums of extremely hard and dry simulated saltcake The hard simulant was intended to present a limiting case for RMCS drill bit testing and was not physically representative of actual tank wastes This I kg per RMCS core estimate was modified to 77 g waste per RMCS segment when using the RMCS exhauster (NOC-3 and NOC-5) and 35 g per segment for RMCS in SX farm (NOC-4 and NOC-6)
A value of 600 g of waste in the tank head space was assumed in WHC 1997 for certain RMCS accident analyses This number was based upon earlier conservative assumptions on particulates generated during a large gas release event in Tank 241-101-SY A value of 100 g waste in the head space was used in an update ofthis RMCS accident analysis provided in a revision to the predecessor of HNF 1999 that has been submitted to the Department of Energy (DOE) for approval
After nitrogen-purged RMCS operations commenced in November 1994 it became obvious that the estimates of aerosol generation rates based upon WHC 1993 were very conservative This was evident from in-tank videos that showed very little dust formation and from the lack of any dose rate buildup on the in-tank prefilter (when used) or the exhauster HEPA filters An evaluation was begun in 1997 to use data obtained during or following RMCS operations to estimate actual aerosol generation rates and exhauster filter performance This document provides the results of that evaluation
Aerosol Estimation Methods
Dedicated particulate sampling methods such as employing sticky tapes to capture aerosols for microscopic evaluation or specially designed samplers were not used for this evaluation Funding and personnel were not available for an in-depth study nor was such a study necessary Aerosol quantities were estimated using the best data available from existing sources associated with RMCS (housing dose rates CGM filter papers stack record samples) or easily obtained additional data (housing NDA) Three separate methods were used to provide estimates of the aerosols present in the tank head space or sent to the exhauster The first method used non destructive assay (NDA) of RMCS exhauster filter housings to estimate particulates captured on the filters The second method used the RMCS exhauster HEPA filter dose rates following completion of a core to estimate the mass of waste on the filters The third method estimated the tank head space aerosol concentration based upon analytical data from filter papers located upstream of combustible gas meters (CGMs) employed during RMCS A CGM draws air out of a tank headspace at a constant flow rate during RMCS to monitor for flammable gases
It was not possible to utilize any single method of estimating aerosol quantities for all RMCS sampling events For some sampling events not all data types were available or if available were not useful Reasons for the data not being useful include no RMCS segments taken during the time period evaluated analytical data being below background levels or having an analytical variance gtloo or (for SX tank farm) other tanks being exhausted in parallel or series with the tank being core sampled All calculations conservatively assumed that the background radionuclide concentration in a tank head space was zero and that all radionuclides detected by one of these methods were due solely to RMCS activities
Table 1 lists the RMCS sampling events which provided the data for this document the exhauster that was in service the aerosol estimate methods used for that event and the number of RMCS cores and segments obtained
L
RPP-4826 Rev 1
during the sampling method The data in this document were obtained during RMCS in eleven separate tanks A total of 23 RMCS cores containing 11 5 RMCS segments were obtained The aerosol estimation methods are summarized below
RMCS Exhauster Housing NDA Appendix A describes NDA of RMCS exhauster housings after they were used during RMCS operations from 598 through 699 Gamma assays of the housings were performed to measure the Csrdquorsquo on the prefilter primary HEPA filter and secondary HEPA filter The quantity of Csrdquorsquo present on each was estimated by comparison with the Csrdquorsquo count rate from a known standard measured in an equivalent geomeby The quantity on all three filters was summed to estimate the total in the housing The mass of particulates was obtained by dividing the quantity of present by a weighted average of the Csrdquorsquo concentration of the wastes in the tanks being exhausted With this data average tank head space mass concentrations were calculated as well as the mass per core and per segment sent to the exhauster The mass of waste in a tank head space was calculated by multiplying the tank head space concentration by the tank head space volume A summary ofthe results is given in Table 2 The detailed results are given in Table A-3
RMCS Exhauster HEPA Dose Rate Data Appendix B describes using RMCS exhauster dose rate data to estimate aerosol quantities The dose rate at the ed e of the HEPA filter housing is used to estimate a quantity of Csrdquorsquo on the filter Dividing the quantity of Cs on the filter by a weighted average of the Csrdquorsquo concentration in the wastes of the tanks being exhausted provides the waste mass on the filters With the waste mass known tank head space mass Concentrations can be calculated as well as the mass per core or per segment sent to the exhauster The mass of waste in a tank head space was calculated by multiplying the tank head space concentration by the tank head space volume A summary of the results is given in Table 2 The detailed results are given in Table B- 3 The minimum detection ability ofthe dose rate instruments used is 05 m m r Most RMCS exhauster dose rates following completion of an RMCS core were less than detectable An exhauster housing registered slightly above the minimum detectable limit at 07 mRhr after core sampling on S-l IO U-107 BY-IO5 and TX-I 13 This housing read 08 mRhr after completion of sampling on the next tank TX-I 18
CGM Filter Paper Analyses Appendix C describes using CGM filter paper analytical data to estimate aerosol quantities The filter papers are inserted in-line in front of a CGM where they catch the radionuclides in the tank vapors drawn into the CGM These filter papers were removed and analyzed starting in 1997 For conservatism only sample results with a variance 400 were used These analytical data were divided by the specific activity of the radionuclides present on the filter paper for the tank on which the CGM was being operated This provides an estimate of the aerosol mass concentration in the tank head space since a particulate sample is drawn directly from the tank head space during RMCS With this data the mass of waste in the head space and the mass per core and per segment sent to the exhauster can be calculated The mass of waste in a tank head space was calculated by multiplying the tank head space concentration by the tank head space volume A summary of the results is given in Table 2 The detailed results are given in Table C-4
IF1
RMCS Exhauster Decontamination Factor Estimation Method
The RMCS exhauster filter housing DF was calculated by comparing stack record sampler data with the housing NDA data to calculate an efficiency for the housing The housing contains a prefilter and two HEPA filters in series Table 1 lists the RMCS sampling events which provided the data for estimating the DF
Housing NDA and Record Sample Data Comparison Appendix D uses RMCS exhauster stack record sample data to estimate stack Csrdquorsquo emissions for the same time periods when NDA data were obtained The stack emissions were used with the NDA data to calculate a filter housin DF The only radionuclide shown as present by the NDA was Csrdquorsquo No stack record samples showed Cs were available for seven of the nine stack record samples taken during the time NDA data were obtained For the remaining two samples conservative assumptions were made as to the stack total beta concentration
139 present above detection limits However total beta results above minimum detection limits
3
RPP-4826 Rev I
Stack total beta emissions were converted to CsrsquoI7 emissions using the C S rdquo ~ to total beta ratio for the waste in the tank being sampled The filter housing input was calculated by adding this calculated Csrdquorsquo emission to the quantity shown by NDA to be in the housing Dividing the emissions by the input provided the penetration efficiency Results of the housing efficiency and decontamination factor calculations are provided in Table D-I
Discussion of Results
All calculations were based upon radionuclides measured on the exhauster filters in the tank head space air or in the exhauster stack These radionuclide quantities were divided by the specific activity of waste in the tank to provide mass quantities in the air on the filters or in the exhaust stream Appendix E provides the waste specific activities used in this document along with limitations and potential errors associated with using them
The calculated average mass concentration in a tank head space during RMCS ranged from a low of 77E-6 gm3 based upon exhauster housing NDA data to a high of 4OE-5 gm3 based upon CGM filter paper data The weighted average of all methods was 24E-5 gm Welghted averages used in this document were based upon numbers of RMCS segments obtained during application of that method
The average mass concentration is not the peak concentration as illustrated by Figure I Figure 1 is a representation of relative concentrations only not a plot of measured concentrations during a specific sampling event Lines A and B represent aerosol concentrations at points near the drill string and at the tank outlet to the exhauster respectively Line C represents the calculated average concentration in the tank head space The peak concentration in the air to the exhauster will exceed the average tank head space concentration for short periods oftime It is beyond the scope of this document to provide a detailed spatial and time-dependent analysis of tank aerosol concentrations The methods used in this document provide an estimate of an average tank head space mass concentration only
The average mass of suspended solids in a tank head space was estimated by multiplying the average head space mass concentration by the tank head space volume The calculated average mass of suspended solids in a tank head space during RMCS ranged from a low of I 8E-2 g based upon exhauster housing NDA data to a high of 97E-2 g based upon CGM filter paper data The weighted average of all methods was 56E-2 g Comparing 56E-2 g to the 600 g and 100 g used in accident analysis assumptions it is evident that the accident analyses used peak tank head space mass levels three to four orders of magnitude greater than the average mass level in a tank head space during RMCS
Multiplying an average concentration by the tank head space volume to estimate the mass of suspended solids in the tank head space at a given time makes the simplifying assumption that the tank head space concentration is constant with time and uniform within the head space during RMCS As illustrated by Figure I the tank head space concentration is not constant with time or uniform within the head space When determining a maximum value for mass of solids in a tank head space engineering judgement needs to be applied that evaluates all the parameters involved that could increase or decrease the average mass value provided in this document With all other variables being equal the mass concentration and mass of suspended solids in a tank head space will also be affected hy the volume of the head space and the exhaust flow rate The head space volumes of the tanks sampled to date are typical of SSTs The exhauster flow rate is not expected to change for the RMCS exhauster If additional samples are taken in SX tanks where the exhauster flow rate is higher than in the four SX tanks which have already been sampled the mass present in the tank head space would be expected to be reduced
The calculated mass of waste sent to an exhauster ranged from lows of 18E-1 gRMCS core and 34E-2 W C S segment based upon CGM filter paper data to highs of 59E-I gRMCS core and 1OE-1 gRMCS segment based upon exhauster housing dose rate data The weighted average of all methods was 42E-1 gRMCS core and 69E-2 gRMCS segment Comparing the average to the 1 kgRMCS core and 35-77 glRMCS segment numbers used for the PTE estimates it is evident that the PTE estimates are conservative by at least three orders of magnitude
Results given in this document based upon total beta or Csrsquordquo data are likely more valid than alpha based results due to the higher concentrations of beta-gamma radionuclides in the waste and their greater ease of measurement when
4
RPP-4826 Rev 1
compared to alpha emitters Equal weight is given to all results regardless of whether based upon total al ha total beta or CsI3rsquo data This provides conservative results since the aerosol values based on total beta or CslfPwere normally lower than those based upon alpha results
The mass per segment numbers should be a better indicator of RMCS aerosol emissions from the tank than the mass per core numbers This is because the quantity of aerosols generated in a tank should be proportional to the time of purge gas flow and bit rotation The time of purge gas flow and bit rotation should be proportional to the number of RMCS segments taken Thus the mass of RMCS generated aerosols sent to an exhauster on a given tank should be roughly proportional to the number of RMCS segments obtained from the tank The number of RMCS segments in a core can vary To date the range has been from 1 to 12 RMCS segments per RMCS core The average has been 5 RMCS segments per RMCS core
The results for mass per core or per segment based on NDA and housing dose rate data have a firmer basis than results based upon CGM filter paper data This is because the RMCS exhauster housing NDA and dose rate methods are a direct physical measurement of essentially all the Csrsquordquo released to the exhaust stream during RMCS Aerosol measurements based upon HEPA dose rate are conservative as the filters showed no detectable dose rate for three of the five periods evaluated and barely perceptible readings after the other two
The results for tank head space concentrations and mass of waste in a tank head space during RMCS based on CGM filter paper data have a firmer hasis than results based on housing NDA or dose rate This is because the CGM filter paper data is a direct measurement of the concentration in the air in a tank head space during the time when aerosols are being generated The CGM filter paper data should provide a higher tank head space mass concentration than that calculated by filter housing NDA or dose rate This is because aerosols are only generated during times when the CGM is operating and the CGM operates for less time than the exhauster does Since the concentration is based upon dividing a filter quantity by the volume of gas passing through the filter the volume of gas in proportion to the material on the filter will be less for the CGM filter paper than for an exhauster filter resulting in a higher concentration based on CGM filter paper data A factor is included in the CGM based concentration to account for radionuclides in the dome space that have not settled out or been removed by the exhauster when the CGM is shut Off
The average results for all methods were within reasonable agreement with each other considering all the variables and assumptions involved The filter housing DF is in good agreement with expected values
This document contains seven appendices Appendices A-C provide particulate results based upon RMCS exhauster housing NDA RMCS exhauster housing dose rates and CGM filter paper data Appendix D provides an RMCS exhauster filter housing DF based on housing NDA and stack record sample data Appendix E provides waste specific activities and Appendix F provides the raw data used in Appendices A-D Appendix G provides references for this document
Conclusions
The results in this document are based upon RMCS operating experience from startup of nitrogen-purged RMCS in November 1994 through June 1999 Table 2 summarizes the information presented in the appendices Based upon this information and the lack of any significant aerosol formation seen in in-tank videos it can be concluded that past estimates of aerosol concentrations used for regulatory permits and accident analyses were conservative by a nominal three orders of magnitude
In order to estimate mass releases for regulatory permits the overall emissions with time are needed as a basis for the PTE estimates For future permits the mass per core or mass per segment values in Table 2 can be used directly with conservatism added if deemed appropriate for the tanks to be sampled When estimating maximum concentrations or maximum mass quantities in the tank head space for use in accident analyses additional conservatism needs to be added to the average concentration and mass values in Table 2
5
RPP-4826 Rev I
Tank and Date Sampled
Table 1 Summary Of Aerosol Estimation Methods Used
RMCS Aerosol Estimation Methods Exhauster Number of Used
Housing DF RMCS Cores Riser Used Period6 HEPA CGM NDA and and RMCS
Exhauster Operating Sample Exhauster
NDA Dose Filter RMCS Stack Segments Taken
BY-IO5 1998
No RMCS segments taken from BY-108 or from TX-I 13 Riser 3 using Exhauster B Any material retained on I
the filters during these operating times was assumed to come from next RMCS sampling event with the same exhauster BY-IO5 in 1998 shown as separate exhauster installations since stack record samples were pulled after each riser was sampled
Includes RMCS cores and segments only PMCS cores and segments obtained during exhauster operation not included A total of 23 RMCS cores and 115 RMCS segments were taken between 1194 and 699 The sum of cores and segments is less than sum of cores and segments obtained during data collection periods at lei since more than one aerosol estimation method was used for some sampling periods
One CGM filter paper was used for both cores in SX-102 and for both cores in U-107 3
See Appendix F for explanation of exhauster operating periods
6
RPP-4826 Rev I
Table 2 Summary Of RMCS Aerosol Data
Weighted average based upon number of RMCS segments taken with each method
7
e
Q 0 c 0 0 - 0 VJ 0 L
2
RFP-4826 Rev 1
APPENDIX A
ESTIMATION OF AEROSOLS GENERATED DURING Rh4CS BASED UPON RMCS EXHAUSTER HOUSING NON-DESTRUCTIVE ASSAY
A-0
RPP-4826 Rev I
APPENDIX A - Estimation Of Aerosols Generated During RMCS Based Upon RMCS Exhauster Housing Non-Destructive Assay
Summary of Method
This method of estimating RMCS aerosol quantities uses non-destructive assay (NDA) of the exhauster housing to determine the C S rdquo ~ quantity (Ci) on the filters inside This quantity is then divided by the C S rdquo ~ specific activity (Cig) in the waste for the tank(s) on which the exhauster and the same filters were present during sampling The resulting mass on the filters divided by the volume of air flowing through the exhauster provides an estimate of the average aerosol mass concentration in the air to the exhauster This value was multiplied by the tank head space volume to obtain the average mass of particulates present in the tank head space during RMCS The mass of waste on the filters divided by the number of rotary cores or segments taken provides the mass per core or per segment sent to the exhauster
Description
There are one prefilter and two HEPA filters in series for each RMCS exhauster Particulates captured on the filters contain radionuclides with C S rdquo ~ bein the predominant gamma emitter By performing an NDA of the exhauster housing filters the quantity of Cslg7 in the housing can be estimated This C S rdquo ~ value is then used to back-calculate to a waste mass on the filters using the mass is used to calculate the concentration of particulates in the tank exhaust stream the total suspended solids in the tank head space and the mass of waste sent to the exhauster for each RMCS core or segment taken
Exhauster operations were divided into six operating periods for evaluation in this document These periods are discussed in Appendix F and shown in Table F-I NDA data were obtained for Exhauster Operating Periods 4 5 and 6 Relevant information for these periods is also listed in Table A-I
Period 4 was for Exhauster C use during RMCS for both cores in S-l IO U-107 BY-IO5 and the first core in TX-I 13 The filters and housing were new prior to RMCS in S-110 No filter changeouts were made during this period the accumulated particulates from these RMCS events were retained on the housing prefilter primary HEPA and secondary HEPA
Period 5 was for Exhauster B use during RMCS for the second core in TX-I 13 The filters and housing were new prior to RMCS in TX-113 No filter changeouts were made during this period Exhauster B also ran for a short time during the first core in TX-113 but no RMCS segments were taken when the exhauster was operating Stack record samples (see Appendix D) indicated small levels of aerosols were present in the stack exhaust during this time period Any material collecting on the filters during this time period would show up and be counted as part of the aerosols generated during the 2rdquod RMCS core
Period 6 was for Exhauster C use during RMCS for both cores in TX-I 18 During Period 6 the filters also contained the waste particles from Period 4 No filter changeouts were made durin this period The aerosol mass generated due to RMCS in TX-I 18 was determined from the increase in Cs on the filters between Period 4 and Period 6
A description of the sampling method used for the NDA obtained following Period 4 is provided in Greager 1999 The same method was used for the NDA following Periods 5 and 6 The NDA consisted of a gamma energy analysis of the exhauster housing performed at points adjacent to the prefilter first HEPA and second HEPA The detector was mounted outside the housing and inside a lead collimator The collimator was used to minimize the background count rate and contribution from adjacent filters CsIh was the only radionuclide reported as present The NDA compared the count rates from the exhauster housing with the count rate of an National Institute of Standards and Technology (NISampT) traceable in an equivalent geometry to the RMCS exhauster housing The count rates from housing filter readings were divided by the count rate for the source to give a reported quantity of Cslrdquo on the filters
concentration in the tank waste This filter waste
3 B
source located in the middle of a filter
A- 1
RPP-4826 Rev 1
Two correction factors were applied to the reported filter Csrdquorsquo values for use in this document These are discussed in the following two sections
Reported NDA Data
The NDA results for Period 4 are provided in Greager 1999 The only radionuclide reported as present on the filters was CsI3rsquo The results are restated in Table A-2
The NDA results for Periods 5 and 6 are provided in Diedeker 1999 The only radionuclide reported as present on the filters was Csrdquorsquo The results are restated in Table A-2
Adjusted NDA Data
The reported results are based upon comparing the count rate for a reference point source located in the middle of a mock-up assembly equivalent to the exhauster housing with the count rate from the same detector inside a lead collimator placed outside the actual exhauster housing Limitations with this method include comparison of a point source with a distributed matrix and the inability of the detector to see the entire filter due to the presence of the collimator Correction factors were used to adjust the reported values to account for these two limitations
The first correction factor accounts for comparing a distributed source to the point source standard The reported results were calculated based upon a point source standard since there are no readily available filter standards with a distributed source The material in the filter housing should be fairly evenly distributed through the filter media however so comparing count rates for the filter housing to a point source standard will result in some error To correct for this error shielding calculations were performed on an exhauster housing filter assuming the CSrdquorsquo was evenly distributed throughout the filter media and then again assuming the activity was a point source in the middle of the filter Foust 1999 provides the results of these Microshield dose rate calculations Using the data in Foust 1999 Schofield 2000a shows that the dose rate at the NDA detector location would be about 0625 mFVhrmCi CSrdquorsquo for a point source and 073 mRhrmCi Cslrdquo for a distributed source To adjust the reported NDA results to what they would have been if an actual distributed standard source was available the reported values need to be multiplied by 0625 + 073 = 086
The second correction factor accounts for the detector not being able to see the entire filter contents due to the detector location inside the lead collimator Using basic geometry Schofield 2OOOa estimated the detector has about a 100 view of 608 of a HEPA filter about a 50 view of 264 of the filter and is shielded from the remaining 128 The detector count rate was thus estimated as being approximately 741 o f what it would be if the detector were not collimated To correct the reported results to what they would have been if an uncollimated detector could have been used the reported values need to be multiplied by I + 0741 = 135
Combining the two correction factors gives a single adjustment factor used of 086 x 135 = 116 Per Table A- 2 the total quantity of Csrdquorsquo reported present in the housing for Period 4 was 0430 mCi This quantity was multiplied by 116 to give 050 mCi Csrdquorsquo The reported results for Periods 5 and 6 were revised in the same manner to give 0032 mCi and 064 mCi C~rsquo~rsquorespectiveIy To determine the net increase in Csrdquorsquo for the housing during Period 6 the value from Period 4 was subtracted from the total or 064 - 050 = 014 mCi Csrdquorsquo
Calculation of Mass Quantity on Filters
Calculation of the mass of waste on the filters requires knowledge of the specific activity of the waste on the filters The specific activities used for each exhauster operating period are given in Table A-I The paragraphs below provide a derivation of the specific activities used
The specific activity values for the waste in each tank sampled is given in Table E-I Rh4CS was performed on more than one tank during Period 4 so a weighted average specific activity was used to calculate the waste mass on the filters during this period The weighted average specific activity was calculated based upon the number of RMCS segments taken from each tank sampled The number of RMCS segments obtained during
A-2
RPP-4826 Rev 1
each period for which NDA measurements were made are listed in Table A-I These values were obtained from Table F-I A weighted average specific activity for the waste on the filters in Period 4 was obtained by
[[O 227 mCigl[lO segl+[Ol2lmCigl[lO seg1+[0225 mCigl[l(l seg]+[Ol30 mCig][l2 seg]]+[SO segments] = 0182 mCi Csrdquorsquog
Calculating a weighted average based upon the number of segments assumes aerosol generation is roughly the same per segment and the specific activity of a radionuclide is constant throughout a tank These assumptions are adequate for the purpose oftbis document Aerosol generation can vary with water content waste hardness depth of sample taken nitrogen flow rate and porosity of the waste An in-depth evaluation of these parameters is beyond the scope of this document The impact of these variables is assumed to average out over all the RMCS segments taken The specific activities used do not vary greatly from tank to tank so any variations will not have a significant impact on the final aerosol results See Appendix E for further discussion of limitations on specific activities used in this document
For Period 5 the filters were new at the start and the only tank sampled with the exhauster was TX-I 13 Therefore the specific activity of CsI3rsquo for TX-I 130130 mCig was used
The same exhauster and filters used for Period 4 were used for Period 6 The net increase in Csrdquorsquo for Period 6 was determined by subtracting the Period 4 Csrdquorsquo from the total Since this net increase was only due to TX- 118 the specific activity of Csrdquorsquo for TX-I 180130 mCig was used for the waste added to the filters in Period 6 (Note it is only a coincidence that TX-I 13 and TX-118 have the same nominal Csrdquorsquo concentration)
The total mass of waste on the filters for Period 4 was thus
050 mCi i 0182 mCig waste = 275 g waste in exhauster housing
The mass of waste added to the exhauster for Period 5 was
0032 mCi + 0130 mCig waste = 025 g waste in exhauster housing
The mass of waste added to the exhauster for Period 6 was
(064 mCi - 050 mCi) + 0130 mCig waste = 11 g waste in exhauster housing
Aerosol Calculations
The tank head space particulate concentration was obtained by dividing the mass of waste sent to the exhaust stream by the volume of air sent to the exhauster The volume of air to the exhauster was obtained by multiplying the exhauster flow rate by the exhauster run times for each tank from Table F-I
For the RMCS exhausters the recorded exhauster flow rate is reported in standard cubic feet per minute (scfm) The RMCS exhauster flow rate is controlled to a nominal 200 scfm The exhauster flow rate was corrected to an actual cubic feet per minute (acfm) before calculating the tank head space aerosol concenmtion Table F-l includes the actual cfm flow rates
The calculated flow rates during RMCS for the tanks sampled during Period 4 were 207 acfm (S-1 lo) 206 acfm (U-107) 208 amp 209 acfm (BY-105) and 203 acfm (TX-I 13) The total volume oftank air through the exhauster during Period 4 was thus
[[207 cfm][ 15978 hr]+[206][27385]+[208][13577]+[209][30792]+[203][30230]][60 minh] = 146 E+7 Arsquo
The average tank head space mass concentration during RMCS in the above tanks was
[275 g + 146 E+7 Arsquo] x [35315 ftrsquomrsquo] = 664 E-6 average g waste per m3 in exhauster inlet
A-3
RPP-4826 Rev I
The gas flow rates and average tank head space mass concentrations during RMCS for Periods 5 and 6 were calculated in a similar manner
The average mass of waste in a tank head space during RMCS was calculated by multiplying the tank head space mass concentration by the tank head space volume from Table F-2 as shown below for S-1 I O
[275 g + 146 E+7 Arsquo] x [89100 ftrsquo] = 167E-2 g waste in S-1 IO head space
The particulate quantities in the other tank head spaces were calculated in a similar manner The weighted average mass in a tank head space during Period 4 was based upon the number of segments taken in each tank
The mass sent to the exhauster per RMCS core or per RMCS segment was obtained by dividing the mass of waste sent to the exhaust stream during each period by the numbers of RMCS cores or RMCS segments obtained during the exhauster operating time The average mass of waste sent to the exhauster during Period 4 is thus
275 g waste + 7 rotary cores = 39E-1 g wastelrotary core
and
275 g waste + 50 rotary segments = 55E-2 g wasteirotary segment
The mass of waste to the exhauster per RMCS core and RMCS segment for Periods 5 and 6 were calculated in a similar manner
All data were input to a spreadsheet to perform the calculations Results are provided in Table A-3
Summary of Calculations
Non Destructive Assay was performed on the RMCS exhauster filter housings used during three separate exhauster operating periods during which IO RMCS cores and 65 RMCS segments were obtained from five tanks Weighted averages of the average tank head space mass concentration average mass of suspended solids in a tank head space and average mass sent to the exhauster per RMCS core or segment for the three periods combined were calculated based upon the number of RMCS segments taken during each period Based upon RMCS exhauster housing NDA data the results indicate that
The average tank head space mass concentration during RMCS was 77E-6 g wastelmrsquo The average mass of suspended solids in the tank head space during RMCS was 18E-2 g waste The average mass sent to the exhauster during RMCS was 52E-1 g wastelcore The average mass sent to the exhauster during RMCS was 63E-2 g wasteisegment
A-4
RPP-4826 Rev 1
APPENDIX B
ESTIMATION OF AEROSOLS GENERATED DURING RMCS BASED UPON Rh4CS EXHAUSTER HEPA FILTER DOSE RATES
B-0
RPP-4826 Rev I
APPENDIX B - Estimation Of Aerosols Generated During RMCS Based Upon RMCS Exhauster HEPA Filter Dose Rates
Summary of Method
This method of estimating RMCS aerosol quantities divides the dose rate increase (mRhr) at the side of the RMCS HEPA filter housing by a calculated dose conversion factor (mRhrmCi C S rdquo ~ ) to obtain an approximation of the radionuclide quantity in the housing This radionuclide quantity is divided by the waste specific activity (mCig) to determine the mass of waste on the HEPA filter Dividing the HEPA filter waste mass by the volume of air passing through the filter provides an estimate of the average tank head space particulate concentration during RMCS Multiplying the average tank head space particulate concentration by the tank head space volume gives an estimate of the average mass of suspended particulates in the tank head space during RMCS Dividing the HEPA filter waste mass by the number of RMCS cores or RMCS segments provides the mass per RMCS core or per RMCS segment sent to the exhauster
Description
Particulates in the exhaust stream are removed by the HEPA filter(s) upstream of the exhaust fan The captured particulates contain radionuclides with CSrsquo~rsquo being the predominant gamma emitter As the particulate quantity on the HEPA filter increases the dose rate at the side of the filter housing will increase proportionately By monitoring the HEPA dose rate at the side of the filter housing the quantity of Csrsquordquo on the HEPA can be estimated This C S rdquo ~ value is then used to back-calculate to a waste mass quantity on the filter using the Csrsquordquo concentration in the tank waste This filter waste mass quantity is used to calculate the concentration of particulates in the tank exhaust stream the total suspended solids in the tank head space and the mass of waste sent to the exhauster for each RMCS core or segment taken Although radionuclides will be trapped on both the prefilter and the primary HEPA filter with a very small amount on the secondary HEPA calculations in this section were based upon the simplifying assumption that all the activity was on the primary HEPA filter
During RMCS exhauster operation the dose rate in m M r at the side of the HEPA filter housing is periodically measured with an Eberline RO-3B per procedure to indicate when radioactive particulates are building up on the filter The limit of detection of the RO-3B is 05 mRhr
Exhauster operations were divided into six operating periods for evaluation in this document These periods are discussed in Appendix F and shown in Table F-I Housing dose rate data were obtained for Exhauster Operating Periods I 24 5 and 6 Relevant information for these periods is also listed in Table B-I Dose rate data are available and were used for all tanks on which an RMCS exhauster was present and RMCS samples were taken This includes BY-106 BY-IO5 (1995) BY-I IO S-l I O U-107 BY-IO5 (1998) TX-113 and TX- 1 18 The dose rate at the end of a period was used as the basis for calculating radionuclides on the filters The only operating period for which dose rate data were not used for estimating filter radionuclide content was Period 3 Period 3 was for RMCS in SX farm using the SX exhauster
The dose rate at the side of the SX exhauster HEPA filter housing was measured during RMCS of SX farm tanks (for sampling of tanks SX-lot SX-102 SX-103 and SX-105) but the data are not useful for estimation of aerosol quantities because the SX exhauster draws on 13 tanks in parallel or in series with the tank being core sampled Many of the tanks have a much higher off gas flow rate than the sampled tank In addition there is background radiation in the area of the SX exhauster filter housing making any increase in the housing dose rate during RMCS difficult to detect
Dose Rate Data
The dose rate data for each period is listed in Table 8-2 No dose rates above minimum detectable limits were evident at the sides of any RMCS exhauster in Periods I 2 and 5
Dose rate measurements were less than detectable for Period 4 during sampling of S-l IO and U-107 When sampling on BY-IO5 there were a few readings of 07 m M r but most were ltOS mRhr This variation in
B- 1
RPP-4826 Rev 1
readings is to be expected as the specific instrument person using the instrument and location at which the dose rate is checked can vary with time The final recorded dose rate when sampling was complete on BY-IO5 was lt05 mRhr At the end of Period 4 following completion of the first core in TX-I 13 Exhauster C was listed as having a 07 m M r dose rate
Period 6 used Exhauster C again with the same housing and filters as at the end of Period 4 The final dose rate for this period was 08 m M r
Periods 124 and 5 all began with a new housing and new filters For Periods 12 and 5 it was conservatively assumed that the final dose rate was equal to 05 m M r giving an increase of 05 mRhr for each of these periods For Period 4 the dose rate increase was 07 m M r for this period Since Period 6 used the same housing and filters as Period 4 the increase for Period 6 was 08 - 07 = 01 m M r
The dose rate increase was converted into a CsIh content on the primary filter for each period Foust 1999 provides various dose rates for an RMCS exhauster housing assuming even dispersal of 1 mCi C S rdquo ~ on the first HEPA filter Using these calculations Schofield 2000a estimated a dose rate conversion factor of 16 mRhrmCi C S rdquo ~ at the detector location for an RO-3B The assumption that radionuclides are evenly distributed on the HEPA is a reasonable assumption based upon the exhauster design and the method used to measure the radiation dose rate
Gamma emitting contribute to the dose rate due to bremsstrahlung radiation and other nuclides may provide some small additional dose but the major penetrating dose rate contributor in aged SST waste is CSrdquo~ Ignoring the presence of all radionuclides (including Srm) except C S rdquo ~ in calculating a HEPA filter waste mass will provide a conservative result This is because assuming all radiation present is due to C S rdquo ~ will result in overestimating the C ~ I ~ ~ c o n t e n t of the filter housing which in turn will result in overestimating the waste mass on the HEPA filter
Dividing the HEPA dose rate for each exhauster installation by the dose conversion factor of I 6 mRhrmCi results in an increase of 031 mCi Csrdquorsquo on the RMCS exhauster filters for Periods I 2 and 5044 mCi for period 4 and 0063 mCi for Period 6
Calculation of Mass Quantity on Filters
Dividing the Csrdquorsquo content of the filters by the specific activity of C S rsquo ~ ~ in the waste gives the estimated mass of waste sent to the exhauster The specific activity value used for the waste in each tank sampled is given in Table E-I Since RMCS was performed on more than one tank in Periods 1 and 4 a weighted average specific activity was used for these periods The weighted average specific activity was calculated based upon the number of RMCS segments taken from each tank sampled during that period The number of RhKS segments obtained during each period are listed in Table B-I These data were obtained from the individual tank data in Table F- I Calculations to estimate the specific activity of waste mixtures were performed in the same manner as shown in Appendix A For Periods 2 5 and 6 RMCS samples were taken in only one tank The waste specific activity used for these periods was the specific activity of the tank sampled The specific activities used for each exhauster operating period are given in Table B-I
For all exhauster installations except BY-IO6 in 1994 and 1995 the RMCS exhausters were hooked directly to the waste tank When sampling BY-106 a prefilter was installed in the tank riser between the tank and the exhauster The prefilter was not used for BY-I IO in Period 1 or for any other tank in any other period Thus for Periods 2 4 5 and 6 the mass of waste on the HEPA was assumed equal to the mass of waste leaving the tank risers For Period 1 the mass of waste on the HEPA had to be adjusted for the BY-106 prefilter DF when estimating the combined mass of waste leaving the BY-IO6 and BY-I IO tank risers The mass of waste on the HEPA for Period 1 was
[031 mCi] [IO00 pCimCi] = 310 pCi
[310 pCi Csrdquorsquoon HEPA] + [I77 pCi C S rdquo ~ ~ waste] = 177 gwaste on HEPA
is the predominant radionuclide contributor to filter dose rates Beta emitting Srw can
on HEPA
B-2
RPP-4826 Rev 1
A decontamination factor (DF) of 5 was used to account for radionuclide removal by the BY-IO6 prefilter (see Appendix D for basis ofprefilter DF) There were 1 1 RMCS segments taken from BY-IO6 and 13 from BY- 1 IO The total mass ofwaste assumed to exit the tank risers was therefore
[ I 77 g waste] [ 1 1 + 131 [[I 151 + 131 = 28 g waste from tank risers
The DF of 5 to account for the prefilter is only applicable to the RMCS of BY-IO6 in 1994 and 1995 for all other exhauster periods the mass of waste on the HEPA was equal to the mass of waste sent to the exhauster riser
The mass of waste sent to the exhauster for Period 2 was
[031 mCi] [IO00 pCimCi] = 310 pCi Csrdquorsquo on HEPA
[3 IO pCi C S rdquo ~ on HEPA] + [225 pCi CsiI7g waste] = I 39 g waste from tank
Using the same formula the mass of waste to the exhauster from Periods 4 and 5 was 241 and 240 g respectively and the increase in waste on the filters for Period 6 was 048 g
Aerosol Calculations
The mass sent to the exhauster per RMCS core or per RMCS segment was obtained by dividing the mass of waste leaving the risers by the number of RMCS cores or RMCS segments obtained during the exhauster operating period
The tank head space particulate concentration was obtained by dividing the mass of waste leaving the riser by the volume of gas sent to the exhauster This volume of gas sent to the exhauster was obtained by multiplying the exhauster flow rate by the exhauster run time from Table F-I The calculations for aerosols generated based upon HEPA dose rates use acfm while the exhauster flow is recorded in scfm so the actin flow rates in Table F- 1 were used
The average mass of aerosols in the tank head space was obtained by multiplying the average tank head space particulate concentration by the tank head space volume from Table F-2
Following is an example of how the mass per RMCS core mass per RMCS segment average tank head space mass concentration and average mass of aerosols in the tank head space were calculated for Period 1 Data used are from Tables E-I F-I and F-2
[200 scfm] [2992+2916] [84 + 4591 + 528 = 21 1 acfm to exhauster from BY-IO6 in 11-1294
using same formula results in 210 acfm for BY-IO6 in 195 and 209 acfm for BY-I IO
28 g waste + [((21 1 acfm)(4878 hr)+(21O)(l867)+(209)(1125))(60 minhr)]= 12E-6 g wastelf to risers
[12E-6 amp] [35315 fmrsquo] =43E-5 g wastemrsquoto risers
[12E-6 gftrsquo] [53700 Arsquo in BY-106 head space] =66E-I g waste in BY-IO6 head space during RMCS
[12E-6 piftrsquo] [92000 ftrsquo in BY-110 headspace] = IIE-l g waste in BY-I10 head spaceduring RMCS
[28 g waste] [5 RMCS cores] = 56E-1 g waste per core to riser
[28 g waste] + [24 RMCS segments] = 12E-1 g waste per segment to risei
8-3
RPP-4826 Rev 1
All data were input to a spreadsheet and the mass to exhauster per RMCS core mass to exhauster per RMCS segment average tank head space mass concentration and average mass of aerosols in the tank head space were calculated for each of the RMCS exhauster operating periods in the same manner as shown above Results are given in Table 8-3
Summary of Calculations
RMCS exhauster operations were segregated into five operating periods during which RMCS was performed The Exhauster B data for BY-IO8 and TX-I 13 riser 3 was not used in these calculations as no RMCS was performed when the exhauster was operating Exhausters were operated in seven tanks during which 16 RMCS cores and 92 RMCS segments were obtained Based on RMCS filter housing dose rate data the results indicate that
These values are conservative as the assumed dose rate at the end of RMCS for Periods I 2 and 5 was assumed to be 05 mRhr In addition using a DF of 5 for the BY-IO6 prefilter skews the results high The in-tank prefilters used in both BY-IO6 sampling events showed no detectable contamination
Operatin Periods 4 and 6 were the only periods with exhauster housing dose rates above detectable The 044 mCi Csrsquordquo and 0063 mCi CsIh increase on the filters for these two periods based upon dose rate data correspond to the 050 mCi CsI3rsquo and 014 mCi Csrdquorsquo increase on the filters for these two periods based u on NDA data (see Appendix A) The 031 mCi C S rdquo ~ for Period 5 is significantly above the 0032 mCi Cslrsquolsquofor the same period determined by the NDA but this is due to assuming the housing dose rate was equal to the minimum detectable 05 mRhr
The average tank head space mass concentration during RMCS was 22E-5 g wastem3 The average mass of suspended solids in the tank head space during RMCS was 47E-2 g waste The average mass sent to the exhauster during RMCS was 59E-1 g wastelRMCS core The average mass sent to the exhauster during RMCS was 1OE-1 g wastelRMCS segment
B-4
v m
__ ~~
RPP-4826 Rev 1
APPENDIX C
ESTIMATION OF AEROSOLS GENERATED DURING RMCS BASED UPON CGM IN-LINE FILTER PAPER ANALYSES
c-0
RPP-4826 Rev I
APPENDIX C - Estimation Of Aerosols Generated During RMCS Based Upon CGM In- Line Filter Paper Analyses
Summary of Method
This method of estimating RMCS aerosol quantities uses radionuclide assay data from in-line filter papers located upstream of continuous gas monitors (CGM) sampling the tank air for flammable gases during RMCS The radionuclide content of the filter paper is divided by the waste radionuclide specific activity and the air flow through the CGM to obtain an estimate of the average mass concentration in the tank head space during the time period the CGM is on Multiplying the estimated average tank head space mass concentration by the tank head space volume gives an estimate of the average mass of particulates in the tank head space during RMCS To obtain the mass per RMCS core or per RMCS segment sent to the exhauster the tank head space average mass concentration is multiplied by the volume of gas sent to the exhauster then multiplied by a correction factor to account for particulates in the head space removed by the exhauster when the CGM is not operating and divided by the number of RMCS cores or RMCS segments
Description
During most tank waste intrusive activities performed since 1996 an intrinsically safe CGM located above ground has been used to continually monitor the tank air for flammable gases during in-tank activities The CGM sampling method draws air directly from the tank head space During RMCS the CGM sampling line is placed in the tank dome space The sampling line is located between the sampling riser and the exhaust riser if practical A pump in the CGM draws tank air up through the line at 05 litmin for measurement of the lower flammability limit (LFL) by the CGM A filter paper is installed in the sampling line upstream of the CGM to protect the unit from internal contamination
Following CGM use the CGM filter papers are normally discarded after monitoring them in the field for contamination To help estimate the tank head space particulate levels during RMCS these filter papers were retained and analyzed in the 222-S laboratory following removal from all tanks in which RMCS was performed from the fall of 1997 through April 1999 Data were collected for the four tanks in SX farm in which RMCS was performed and the next four tanks on which the RMCS exhauster was deployed These tanks are listed in Table c-I Reported CGM Data
The CGM operational data used to estimate aerosol levels during RMCS includes CGM operating times CGM flow rates and filter paper analytical data A summary report containing all the field operating data sheets for CGM usage and lab data was prepared following completion of sampling on each tank for all tanks except TX- 113 For TX-I 13 a separate report was prepared following each core These reports are References CGM-I to CGM-9 The CGM data from these reports are provided in Table C-2
There were 14 CGM installations during RMCS when CGM filter papers were collected and analyzed Each of these installations had Csrdquorsquo total alpha and total beta quantities measured on the filter papers resulting in 42 data points Eight of the measurement results were very low and had errors of gt+-loo These values were not used resulting in a net of 34 data points for calculating average head space mass concentrations based upon CGM data
Calculated Tank Head Space Radionuclide Concentrations
To calculate the average tank head space radionuclide concentrations during RMCS the filter paper radionuclide quantities were first divided by an efficiency factor to account for radionuclides which may not have been captured on the paper This adjusted radionuclide value was divided by the volume of tank air passing through the paper to give the average tank head space radionuclide concentration
The efficiency used for most stack samplers onsite is 73 (see Appendix D) Estimates attached to References CGM-I to CGM-9 indicate the CGM filter paper sampling method used should have a sampling efficiency
c- 1
RPP-4826 Rev 1
exceeding 73 For conservatism a sampling efficiency of 50 was assumed in this document for the CGM filter paper method
The estimated Csrdquorsquo total alpha and total beta concentrations in the tank vapor space were calculated by dividing the radionuclide quantity on the filter paper from Table C-2 by the assumed CGM sampling efficiency of 05 and the volume of gas going to the CGM The volume of gas going to the CGM was calculated by multiplying the time of CGM operation from Table C-2 by the CGM flow rate of 500 mlmin For example the calculated SX- 101 head space C~rsquorsquo~concentration based upon analysis of the CGM filter papers used during RMCS of riser 19 is
[[26E-4 pCi + 051 + [[I755 min][500 mlmin]] = 59E-I0pCiml
All radionuclide concentrations were calculated in a similar fashion Results are given in Table C-3 Table C-3 lists the radionuclide concentrations for all 42 data points The eight radionuclide concentrations not used for estimating mass concentrations are noted
Table C-3 also contains the calculated number of tank head space changeouts by the tank exhauster during CGM operation Tank head space changeouts were calculated by multiplying the exhauster flow rates (in actin) from Table F-1 by the CGM run times from Table C-2 and dividing by the tank head space volumes from Table F-2 The number of tank head space changeouts during CGM operation was used when estimating the waste mass sent to the exhauster See Aerosol Calculations section below for explanation
Aerosol Calculations
Average tank head space mass concentrations based upon CGM filter paper data were calculated by dividing the head space radionuclide concentrations from Table C-3 by the waste specific activities for each tank sampled The waste specific activities used came from Table E-I and are listed again in Table C-I The average of the mass concentrations based upon radionuclide data for each tank was used as the average head space mass concentration for that tank For example the calculated SX-IO1 head space mass concentration analysis from the CGM filter papers used during RMCS of riser 19 is
[59E-10 pCi Csrdquorsquoml+ 112 pCi C S rdquo ~ ~ waste] [ 28317 mlftrsquo] = 1 SE-7 g wasteA3 based upon C S rdquo ~
[ I 7E-I I pCi T A M + 504E-1 pCi TAg waste] [ 283 17 mlftrsquo] = 94E-7 g wasteamprsquo based upon Total Alpha
[43E-9 pCi TBml+ 357 pCi TBg waste] [ 28317 mlArsquo] = 34E-7 g wastel based upon Total Beta
[ [ I 5E-7 + 94E-7 + 34E-7 g wasteArsquo] f 31 = 48E-7 g wasteamp
[48E-7 g wastelt ] [3531467 Arsquom3] = 17E-5 g wastemrsquo
All tank head space mass concentrations were calculated in the same manner The results are presented in Table C-4 The weighted average tank head space mass concentration during RMCS was based upon the number of RMCS segments taken for each data point
The average aerosol mass in the head space during RMCS was calculated by multiplying the average tank head space mass concentration by the tank head space volume from Table F-2 For the same data point as above
[48E-7 g waste Arsquo] [115E+5 Arsquo] = 55E-2 g waste in SX-IO1 head space during RMCS
All average mass quantities present in the tank head space during RMCS were calculated in the same manner using a spreadsheet The results are provided in Table C-4 The weighted average mass of waste in a tank head space in Table C-4 was calculated based upon the number of segments obtained for each data point
Estimation of the mass of waste sent to the exhauster per RMCS core or segment requires calculation of the total mass of waste sent to the exhauster Multiplying the average head space concentration during RMCS by the exhauster flow rate (in acfm) and the time of CGM operation will give the mass of waste sent to the exhauster during the CGM time frame only While the large majority of mass of waste aerosols will have exited the tank or
c -2
RPP-4826 Rev I
resettled by the time the CGM is shut off there could be some residual suspended particles remaining These would eventually pass to the exhauster but would not be picked up by the CGM filter since it was not in service An adjustment factor was used as described in the following paragraphs to account for particles that may exit to the exhauster following shut down of the CGM
Particulates are generated by RMCS when purge gas is blowing out the drill string and the bit is rotating under the waste surface This time averages about six minutes per segment Multiplying the number of RMCS segments per core by six minutes per segment and dividing by the number of minutes of CGM operation shows the creation of particulates will only occur during a nominal 3-4 of the time the CGM is operating During RMCS the normal practice is to install the CGM turn it on when personnel enter a tank farm and keep the unit in constant operation for the remainder of the shift When the portable RMCS exhauster is used the exhauster is normally started at least an hour before RMCS is initiated and kept in operation until it is time to halt operations for the week The SX exhauster is kept in constant operation Comparing exhauster operating times from Tables F-l with CGM operating times from Table C-I it can be seen the CGMs are in operation about 3-15 of the time the RMCS exhauster is operating on a tank This time comparison wasnrsquot estimated for the SX exhauster since the SX exhauster is in constant operation
With CGM operation much longer than the time period when particulates could be generated the majority of particulates generated by RMCS should have settled or been exhausted during the CGM operating period Table C-3 shows the tank head space changeouts made by the exhauster during CGM operating periods ranged from 084 to 63 The average was 24 With the CGMs operating 25-33 times longer than the aerosol generation periods and an average of over two tank head space changeouts during CGM operation the large majority of aerosols generated during RMCS will have settled out or been removed by the exhauster by the time the CGM is shut off To account for particulates remaining in the tank head space after the CGM was turned off that are subsequently removed by an exhauster it was conservatively assumed that 20 of the total mass of particles generated during RMCS were not removed from the tank head space during the CGM operating period Therefore the product of the tank head space concentration and the volume of air sent to the exhauster during the time of CGM operation was multiplied by a factor of 125 (lOOl80) to estimate the total mass of waste sent to the exhauster as a result of RMCS This is shown below for the same SX-IO1 riser 19 data point in the above calculations
[48E-7gA3] [IOOmin] [I755 min] [125]= 11E-l gwastetoexhauster
This value was divided by the number of RMCS cores and RMCS segments from Table C-1 to provide the grams per core and grams per segment in Table C-4 as follows
[ I I E- 1 g waste to exhauster] i 1 core = 11 E-I g wastelRMCS core to exhauster
and
[ 1 I E- 1 g waste to exhauster] + 5 segments = 2 I E-2 g wastelRMCS segment to exhauster
All mass per core and mass per segment values were calculated in the same manner using a spreadsheet The results are provided in Table C-4 The weighted average mass per core and mass per segment in Table C-4 were calculated based upon the number of cores or segments obtained for each data point
Summary of Calculations
There were 34 valid CGM filter paper data points from 14 RMCS CGM sampling periods in eight tanks during which I5 RMCS cores and 79 RMCS segments were obtained Based upon CGM filter paper data the results indicate that
The average tank head space mass concentration during RMCS was 4OE-5 g wastem3 The average mass of suspended solids in the tank head space during RMCS was 97E-2 g waste The average mass sent to the exhauster during RMCS was 18E-1 g wastelRMCS core The average mass sent to the exhauster during RMCS was 34E-2 g wastelRMCS segment
c - 3
RPP-4826 Rev 1
Ignoring all CGM filter paper analytical data points with a variance gtloo will result in conservative results These data points indicate negligible radioactivity was present If a value of zero was assigned to each data point with an analytical error of gtloo instead of ignoring the data point the weighted average particulate quantities in Table C-4 would be reduced by about 12
The average tank head space mass concentrations based upon CGM data will be higher than the average tank head space mass concentrations based upon filter housing NDA or dose rate The RMCS exhauster received tank air from the shifts when sampling was performed and during some of the off-shifts when no sampling was done The CGMs were only operated during the shifts when sampling was performed The air concentration drawn into the CGM and the RMCS exhauster should be roughly the came during the operating shifts but somewhat less during the off-shifts Therefore the tank head space concentration will be higher when based upon CGM data This does not impact the mass of waste sent to the exhauster per core or per segment
c -4
I
- ~
RFP-4826 Rev 1
APPENDIX D
ESTIMATION OF Rh4CS EXHAUSTER HOUSING DECONTAMINATION FACTOR
D-0
RFrsquoP-4826 Rev 1
APPENDIX D - Estimation of RMCS Exhauster Housing Decontamination Factor
Summary of Method
This Appendix estimates a Decontamination Factor (DF) for the RMCS exhausters using housing NDA data and applicable stack record sample data The Csrdquorsquo in the exhauster effluent is divided by the C S rdquo ~ in the exhauster inlet to provide a penetration efficiency The reciprocal ofthe penetration efficiency is the DF
Description
Each RMCS exhauster has an isokinetic sampler located on the stack downstream of the blower and HEPA filters A small pomp pulls air from the exhaust stack into a filter paper at a rate proportional to the exhaust flow Radionuclides in the exhaust stream passing through the sample line are caught on the filter paper The stack operating time and flow rate are recorded When the record sample filter paper is removed the filter paper is analyzed in a laboratory for radionuclides The radionuclide concentration in the stack effluent stream is calculated by dividing the quantity of material on the filter paper by the volume of air through the sampler and then dividing again by a factor to compensate for stack sampler and filter paper efficiency
Multiplying the total beta stack effluent concentration by the total off gas flow gives the total beta emissions from the exhauster The total beta emissions are multiplied by the Csrdquorsquo to total beta ratio for the waste in the tank) being exhausted to give an estimate of the C S rdquo ~ emission The C S rdquo ~ on the filters determined by NDA of the housing (see Appendix A) is added to the C S rdquo ~ emissions to give the total C S rdquo ~ input to the filter housing Dividing the emissions by the input gives the filter housing penetration efficiency Subtracting the penetration efficiency from 1 O gives the filter housing efficiency Dividing 1 O by the penetration efficiency gives the DF
RMCS Stack Record Sample Data
RMCS exhauster stack record samples are taken after completion of each sampling event on a tank Normally this is after all cores on that tank have been obtained but for BY-IO5 in 1998 record samples were taken following each core Record samples are also taken at the end of each year All samples are analyzed for total alpha and total beta At the end of each year all the filter papers for that year are composited and analyzed for individual radionuclides Sample results are entered into the Automated Bar Coding of Air Samples at Hanford (ABCASH) and Environmental Release Summary (ERS) databases Several ofthe filter papers from 1998 were reanalyzed using a longer count time to bring the error rate down
Schofield 2000b compiled and evaluated all available RMCS exhauster stack record sample data filtered out the unusable data provided derivation for the stack sampling efficiency factor and summarized the results Most of the data points were so low as to be unusable since the results were either negative or had error variances gtloo
Column 5 of Table D-1 provides the stack effluent concentrations used for calculation of the filter housing DF The stack effluent data in Table D-l come from Schofield 2000b These values include a 073 sampling efficiency factor
Calculation of RMCS Filter Housing Decontamination Factor Based upon Housing Inlet and Outlet Data
The RMCS exhauster housing NDA and stack record sample data available for exhauster Operating Periods 4 5 and 6 were used to estimate an actual DF for the RMCS exhauster housings The housing NDA data is for CSrdquo~ but there are no usable Csrdquorsquo concentrations for the RMCS exhauster outlet The RMCS exhauster stack Csrsquordquo concentrations are either negative have a variance gtloo or are not available Total beta analyses are available however so the stack eftluent C S rdquo ~ concentrations were estimated by multiplying the total beta concentration by the ratio of Csrdquorsquo to total beta in the tank waste
Column 2 of Table D-l lists the increase in CSrsquo~ on the filters for each operating period as determined by NDA This data was obtained from Table A-2
D- 1
RPP-4826 Rev 1
Column 4 of Table D-l lists the stack exhaust volume for each stack record sample period The stack exhaust volume for the exhauster installation on S-l IO was calculated by
[ZOO std ft3min][15978 hrs] [60 minhr] = 199E+6 std ftrsquo
All other stack volumes in Table D-l were calculated the same way Unlike in Appendices A B and C no adjustment was made to change the 200 scfm to actual cfm This is because the RMCS stack record sample concentrations from Table D-3 are based upon a 200 scfm flow rate rather than the actual flow rate Since the concentrations are on the same basis as the flow rate there is no need to correct to acfm
The total beta emissions for the RMCS exhauster stack were calculated by multiplying the volume by the concentration For the same S-l IO data point
[199E+6 ft3] [18E-15 pCiml] [28317mlft3] [mCi1000 pCi] = 1OE-7 mCi total beta
All other total beta emissions in Table D-l were calculated the same way
The Csrdquorsquo to total beta ratio was calculated from data in Table E-I For the same S- l I O data point
326E+5 Ci CsI3rsquo f I 14E+6 Ci total beta = 029 Ci CslhCi total beta = 029 rnCi CsrdquorsquomCi total beta
The Csrsquordquo emission for the same S-l IO data point was thus
[I OE-7 mCi total beta] [029 mCi CsrdquorsquomCi total beta] = 29E-8 mCi Csrdquorsquo
All Csrsquordquo emissions in Table D-l were calculated in the same manner
The penetration efficiency for each operating period was calculated by dividing the exhauster outlet by the filter inlet Csrdquorsquo quantities For operating period 4 this was
[81E-6 mCi] f [5OE-I + 8IE-6 mCi] = 16E-5 = 16E-3
The DF for operating period 4 is
1 + 16E-5 = 62E+4
The overall DF for periods 4 5 and 6 was calculated by dividing the efluent from all three periods by the total filter input
[95E-6 mCi] f [67E-I t 95E-6 mCi] = 14E-5 = 14E-3 penetration efficiency
I - I 4E-5 = 0999986 = 999986 filter efficiency
1 f 14E-5 = 73E+4 decontamination factor based upon housing inlet and eftluent data
Estimation of Housing Decontamination Factor Based upon General Performance Data
HEPA filters are tested at the manufacturer to a minimum 9997 efficiency using a 03 pm monodisperse aerosol After installation HEPA filters are tested in-place per ASME N5 I O to a minimum 9995 efficiency using a polydisperse aerosol with an approximate droplet size distribution of 99 less than 30 pm 50 less than 07 pm and 10 less than 04 pm The RMCS exhauster housing is tested per ASME N510 and is thus required to have a minimum removal eficiency of 9995 for an aerosol with this approximate size distribution The particle size distribution of the waste aerosols generated by RMCS is unknown but it is assumed that the removal efficiency for RMCS generated aerosols was the same as the removal efficiency for the ASME generated test aerosol
D-2
RPP-4826 Rev I
A 9995 efficiency is equivalent to a DF of 2E+3 while a 9997 efficiency is equivalent to a DF of 33E+3 The actual DF for the RMCS exhauster housing is higher than either of these It has two HEPA filters in series even though the minimum efficiency specified in the NOCs for the RMCS exhausters is only equivalent to one HEPA ERDA 1976 recommends using a DF of 3000rdquo for a filter bank where n is the number of HEPA filters in series This would result in a DF of 9E+6 for the RMCS exhauster housing This is unrealistic Using a DF of 9E+6 will calculate to Csrdquorsquo quantities on the HEPA filtersthat are orders of magnitude above what have been shown to be there based upon the measured dose rates and NDA A DF of 9E+6 would mean the dose rate would have to be almost 100 mRhr at the side of the exhauster housing instead of the 05-08 mRhr dose rates encountered The waste particles will not have the same particle size distribution entering the second HEPA filter as when entering the first The majority of the waste particles will be captured on the I rdquo HEPA filter and although the DF for each HEPA if tested individually using the ASME N5 IO aerosol test method may be 3E+3 (or higher) the overall DF of the two filters in series will not be 3000lsquo This is because the particle size distribution entering the Znd HEPA could have a greater percentage of smaller particles than that entering the 1rdquo
NUREG 1995 included an evaluation of a number of different facility stacks at the Hanford site where the HEPA filter upstream air concentrations were estimated using several different methods This report concluded that back-calculation using a value of 3000rdquo overestimated the upstream radionuclide concentration by three to four orders of magnitude when compared to filter NDA data for the nine stacks for which NDA data were obtained and by three orders of magnitude for the two stacks for which upstream air sample data were available Back- calculation using a value of 3000rdquo was shown to be high by four orders of magnitude for the single stack for which a powder release estimate was available Based upon this information the RMCS exhauster dual filter-in-series housings would have a DF of at least three and maybe four orders of magnitude less than 9E+6 or in the 1E+3 to 1 E+4 range A DF of IE+3 would he less than the minimum permissible under the NOC Comparing the older stack data and design with the newer RMCS exhauster design the minimum DF would be expected to be at least 1E+4
Table D-2 provides the available RMCS exhauster aerosol test data This information was obtained from Waldo 1999 Prior to 1998 the RMCS exhauster primary HEPA filter efficiency and either the secondaly HEPA filter or the overall efficiency for both filters were tested Starting in 1998 only the primary and secondary HEPA filter efficiency were measured The overall efficiency of the two filters in series was only measured three times in 11 setups Twice the overall penetration efficiency was lt0002 and the remaining time the only information that could be found was a value of lt005 Most individual filters had a penetration efficiency of 0002 This appears to be about the limit of the detection equipment Based upon Table D-2 data a penetration efficiency of 0002 (99998 efficiency) is normal for a single HEPA and thus a minimum for an RMCS exhauster housing Assuming a 0002 penetration efficiency for the two filters combined calculates to a DF of 5E+4 (equal to 1 +
000002) for the RMCS exhauster housing
In summary the measured DF for the RMCS exhauster housings over the period from May 1998 through June 1999 was about 73E+4 RMCS aerosol testing prior to use indicates a DF of about 5OE+4 for each of the filters separately but their overall efficiency is not measured Referenced data based on older stacks at Hanford indicate the two HEPA RMCS exhauster housing would likely have a DF of at least IE+4
Estimated Aerosol Levels During RMCS Based Upon RMCS Stack Record Sample Data
Revision 0 of this document used the positive record sample results with variance less than 100 to estimate aerosol concentrations in the exhauster inlet using an assumed exhauster housing DF of 5OE+4 This method of estimating aerosols was eliminated from Revision 1 because the stack concentrations were either too low too scattered or too questionable to provide reliable results There were 112 RMCS stack record sample data points evaluated in Schofield 2000b Excluding the total beta sample results used for estimation of the housing DF there were only ten data points remaining with positive values and variances ltloo the remaining data points were either negative had a variance gtloo or the results were not available
For comparison purposes only Schofield 2000b applied the DF of 73E+4 calculated in this document to the data points not used to calculate the exhauster housing DF to estimate aerosol concentrations upstream of the filters The results showed aerosol levels approximately the same as those estimated using NDA dose rate or CGM filter paper data when a value of zero was used for negative sample results or those with a variance gtloo When only
D-3
RPP-4826 Rev 1
the ten positive results with a variance ltloo were used the aerosol levels calculated to be two to five times higher than those estimated using NDA dose rate or CGM filter paper data Because of the variability of data resulting from the extremely low record sample concentrations and the few useable data points estimation of aerosol levels using record sample data was not included in Revision I See Schofield 2000b for further discussion of the use of record sample data to estimate aerosol levels
Summary of Calculations
A total of nine RMCS exhauster stack record sample data points were used to estimate the RMCS exhauster filter housing decontamination factor These data points were obtained when sampling on five tanks during which 10 RMCS cores and 65 RMCS segments were obtained The overall decontamination factor was 73E+4
Estimation of aerosol generation quantities based upon RMCS stack record sample data is possible However results will likely be skewed high if data points that show non-detectable levels of radionuclides present are ignored instead of using a value of zero for the data point
D-4
RPP-4826 Rev 1
APPENDIX E
TANK WASTE RADIONUCLIDE CONCENTRATIONS USED FOR AEROSOL CALCULATIONS
E-0
RPP-4826 Rev 1
APPENDIX E - Tank Waste Radionuclide Concentrations Used for Aerosol Calculations
The RMCS exhauster NDA data HEPA filter dose rate data CGM filter paper data and stack record sample data provide information on the quantity of radionuclides on the exhauster filters in the tank head space or the exhauster stack during RMCS These radioactivity quantities need to be divided by the waste radionuclide concentration specific activity to determine the mass of waste in the tank head space and in the tank gases sent to the exhauster
The mass quantities in this document were calculated using dry basis radionuclide concentrations Waste particles carried into the tank head space by the purge gas could be wet or dry If wet some of the non-chemically bound water will start to evaporate immediately providing the tank relative humidity is 400 The water present in a waste particle may be chemically bound as a hydrate or free The chemically bound water will not readily evaporate therefore even a ldquodryrdquo particle may have some water associated with it It is impractical to measure the actual water content of the waste particulates caught on the CGM filter paper the exhauster HEPA filters or the stack record sample paper Since the quantity of water in the waste particulates is unknown particulate levels were calculated using dry basis radionuclide concentrations Thus all particulate values given in this document are stated on a dry basis
The waste radionuclide concentrations on a dry basis were calculated from data available in the Tank Waste Information Network System (TWINS) The Best Basis InventorylBest Basis Summary numbers were used These values are the most complete and up to date readily available estimates for Hanford waste tank contents but do not include water The information was downloaded from TWINS into a spreadsheet The total chemical total beta and total alpha quantities were summed in the spreadsheet for all the tanks which were sampled and concentrations for Csrdquorsquo Sr9rsquo total beta and total alpha automatically calculated in pCig These concentrations are provided in Table E-I Because lab techniques for measuring gross beta levels only detect beta particles with a minimum decay energy above 150-200 kev only radionuclides with a decay energy of gt-200 kev were included in the total beta numbers
The TWINS radionuclide concentrations were obtained in December 1999 No corrections were made for decay for this document
The CGM filter paper and stack record sample data indicate the measured radionuclide values are not always in the same ratio to each other as given by TWINS nor are all radionuclides detected that TWINS indicates are present Radionuclides can be distributed unevenly in a tank Soluble fission products (primarily Csrsquordquo) are found in the liquid saltcake and in sludges Insoluble fission products and actinides are found largely in sludges as these are primarily chemical precipitates Sludge could be mixed with saltcake be present in a distinct layer at the bottom of a tank or in several layers in the tank depending upon how waste was transferred into a tank Waste particles may thus not have the same specific activity on a microscopic scale as they would have on a macro scale were the tank contents homogenized During RMCS a top to bottom core sample is attempted resulting in the drill bit and purge gas (which causes aerosols to form) passing through most ofthe waste matrix Assuming the aerosol generation rate is approximately constant during drilling the specific activity of a radionuclide in the suspended solids should be roughly the same as the average specific activity of the same radionuclide in the tank waste While the waste specific activity is probably not homogeneous from top to bottom in a tank and the aerosol generation rate will likely also vary it is beyond the scope of this document to provide an in-depth analysis of all the factors affecting aerosol radionuclide concentration Although sample radionuclide data were not always in the same ratio as provided by TWINS for the purpose of this document the simplifying assumption was made that the average tank specific activity is adequate to provide an approximation of the suspended solids specific activity for all radionuclides Average tank individual radionuclide specific activities were used in the preparation of the exhauster NOCs
The aerosol calculations presented in this document are only as accurate as the TWINS data The combined radionuclide content of all Hanford waste tanks is known fairly well since the overall content is based upon reactor production records CsrdquorsquoSrW recovery data and processing plant discharges Thus TWINS data for all tanks combined should be reasonable There are undoubtedly differences between TWINS data and the actual contents of a specific tank While the specific tank radionuclide data from TWINS used in this document may not be exact deviations from the actual concentrations are assumed to balance out over the number of tanks sampled
E- 1
RPP-4826 Rev 1
APPENDIX F
ROTARY MODE CORE SAMPLING EXHAUSTER AND CORE SAMPLE DATA
F-0
RPP-4826 Rev 1
APPENDIX F - Rotary Mode Core Sampling Exhauster and Core Sample Data
This appendix provides the basic data obtained during RMCS operations which was used in preparation of this document
Basic Operational Data
There have been three RMCS exhausters and three RMCS sampling trucks deployed since starmp of nitrogen- purged RMCS in November 1994 The exhausters are formally designated 296-P-32296-P-33 and 296-P-34 These were originally referred to as parts of RMCS Systems 2 3 and 4 respectively in the Notices of Construction (NOC) for these units The exhauster designations were changed for routine field use in 1996 to exhausters A B and C to avoid confusion with core sampling trucks 23 and 4 since any exhauster could be used with any RMCS truck Exhauster A (2) and RMCS Truck2 have not been used for RMCS since 1995 and are no longer in service for core sampling
Rotary mode core sampling has been conducted in four general time frames since 1994 These time frames were separated by down times for equipment modifications or resolution of environmental permitting and safety concerns For ease of analysis in this document exhauster operations were organized into six distinct operating periods Periods I to 6 were grouped based upon times when the same exhauster and same set of HEPA filters were being used These periods thus overlap with the general operating time frames The four operating time frames were
The first time frame lasted from November 1994 to January 1995 RMCS Truck 2 and Exhauster 2 (A) were used on Tank BY-106 along with an in-tank prefilter This tank provided the initial deployment and testing of the nitrogen-purged equipment in a waste tank During this period radiation dose rates were taken at the side of the exhauster housing Stack record samples were taken in December 1994 and January 1995
The second time frame lasted from July 1995 through October 1995 RMCS Trucks 2 and 4 were used with Exhausters 2 and 3 (A and B) on BY-105 BY-IO8 and BY-I IO During this period radiation dose rates were taken at the sides of the exhauster housings Stack record samples were taken after completion of sampling on each tank No RMCS samples were taken from BY-108 all samples were taken in push mode for this tank
The third time frame began when RMCS was restarted in December 1997 Trucks 3 and 4 were used for sampling of SX-101 SX-103 SX-105 and SX-102 with the SX tank farm exhauster providing ventilation The RMCS exhausters were not used During this period radiation dose rates were taken at the sides of the SX exhauster housing as part of HPT routine surveys SX farm exhauster stack record samples were taken when required by normal operating procedures SX record sampler and filter housing dose rate data were not evaluated for this document It would not be practical using filter dose rate or stack record sample data to estimate the RMCS aerosol addition if any to the SX ventilation system The background radiation around the SX filter housing makes measurement of any small increase in dose rate very difficult to detect The number of tanks being ventilated and the involved off-gas header routings (the exhauster is pulling on thirteen tanks in series or in parallel with the tank being sampled) and any in-tank activities in the SX tanks not being sampled would make it impractical to assess what aerosols resulted from RMCS Beginning with RMCS in SX farm radionuclide analyses were performed on the filter papers protecting the CGMs which draw air out of the tank vapor space for flammable gas detection
The fourth time frame began in May 1998 Between 1095 and 598 Exhausters B and C were extensively modified with new filter housings and other equipment to meet new NOC requirements Trucks 3 and 4 were used with Exhausters B and C (3 and 4) on S-l IO U-107 BY-105 TX-113 and TX-I 18 This period marked the first use ofthe RMCS trucks and RMCS exhausters together following resolution of flammable gas concerns and modifications to the exhausters New filters were installed Radiation dose rates were taken at the sides of the exhauster housings Stack record samples
F- 1
RPP-4826 Rev I
were taken after completion of sampling for each exhauster installation Radionuclide analyses were performed on the CGM filter papers for all tanks except TX-118 An NDA was performed on the Exhauster C housing following completion ofthe first core on TX-I 13 The housing filters when assayed contained aerosols captured by the exhauster following RMCS in S-l IO U-107 BY-105 (1998) and the first core of TX-I 13 Another NDA was performed on Exhauster C following both cores in TX-I 18 An NDA was performed following sampling of the second core in TX-I 13 using Exhauster B The time frame ran through early June 1999 No RMCS samples have been taken after June 1999 nor are any planned for the next few years
For the purposes of evaluating aerosol formation based upon RMCS exhauster housing NDA and dose rate data the exhauster operations were grouped into 6 operating periods These periods are shown in Table F-1 and restated in Tables A-I and B-I All tanks sampled in Periods 1 2 4 5 and 6 were exhausted by the same exhauster with the same housing and filters present during that period Period 3 covered the time the SX exhauster was used during RMCS in SX farm
A brief description of each RMCS tank sampling operation is provided below
Tank 241-BY-1061194 to 1294 RMCS using the nitrogen purge gas system with an exhauster was formally begun on 111794 on tank BY-106 riser IOB Exhauster 2 (A)and Truck 2 were used A sintered metal prefilter was inserted in the riser between the tank and the exhauster A total of eight segments were taken in rotary mode and five segments in push mode until sampling was halted on 122194 One RMCS core was obtained The total exhauster run time was 4878 hours The stack record sample was removed and analyzed following this run period Dose rates taken at the side of the exhauster housing during RMCS were all lt05 mRhr The in-tank prefilter was smeared for contamination when removed from the tank with the smears showing less than detectable levels of radionuclides present (Waldo 1999) The prefilter had been washed with an installed spray system prior to removal from the tank but subsequent testing showed the water flow and pressure were too low to have been effective at removing contamination
Tank 241-BY-106195 Following some process modifications RMCS in BY-IO6 riser IOB began again on 11895 Exhauster 2 (A) and Truck 2 were used The sintered metal prefilter was inserted in the riser between the tank and the exhauster RMCS was halted on 12495 over authorization basis and equipment operability issues for RMCS A total of three segments were taken in rotary mode and eleven segments in push mode One RMCS core was obtained The total exhauster run time was 1867 hours The stack record sample was removed and analyzed following this run period Dose rates taken at the side of the exhauster housing during RMCS were all lt O S mRhr The in-tank prefilter was smeared for contamination when removed from the tank with the smears showing less than detectable levels of radionuclides present (Waldo 1999) The prefilter was not washed this time
Tank 241-BY-110795 to 1095 Following resolution of RMCS authorization basis and equipment issues and completion of the fabrication and testing of Trucks 3 and 4 RMCS was begun in BY-I IO on 71195 Exhauster 2 (A) and Truck 2 were used Samples were taken from risers 128 7 128 again and 4 There was no in- tank prefilter used in this or any subsequent RMCS periods Sampling was performed until 102595 when RMCS was halted over flammable gas issues A total of 13 RMCS segments and 56 PMCS segments were taken Three RMCS cores were obtained The total exhauster run time was 1125 hours The stack record sample was removed and analyzed following this run period Dose rates taken at the side of the exhauster housing during RMCS were all lt O S mRhr
Tank 241-BY-108795 to 895 Core sampling was begun in BY-IO8 on 72595 Exhauster 3 (B) and Truck 4 were used Sampling was done in risers 12A and 7 The tank material proved soft enough so that no RMCS segments were required all segments were obtained in push mode although the exhauster was operated during part of the time sampling was performed Sampling was completed 81895 A total of 16 PMCS segments were taken The total exhauster run time was 6617 hours The stack record sample was removed and
F-2
RPP-4826 Rev 1
analyzed following this run period Dose rates taken at the side of the exhauster housing during RMCS were all lt05 mRhr
Tank 241-BY-105895 to 1095 RMCS was begun in BY-I05 riser 12A on 83095 Exhauster 3 (B) and Truck 4 were used This tank has a concrete layer on top about 12-18 inches thick which had to be drilled through Part way through sampling questions arose as to the flammable gas status of the tank and RMCS was halted on 10695 A total of 3 RMCS and 7 PMCS segments were taken One RMCS core was obtained The total exhauster run time was 4413 hours The stack record sample was removed and analyzed following this run period Dose rates taken at the side of the exhauster housing during RMCS were all lt05 mRhr
Tank 241-SX-1011297 to 298 Following resolution of extensive regulatory and authorization basis issues and installation of equipment modifications RMCS started in SX-101 with Truck 4 on 12497 An RMCS exhauster was not used since all SX farm tanks excluding SX-113 and SX-I 15 are ventilated with the SX exhauster Sampling was performed in risers 19 and 4 and was completed on 21098 A total of 9 RMCS and 6 PMCS segments were taken Two RMCS cores were obtained SX exhauster stack record samples and filter housing dose rates were obtained as part of routine operations for the SX exhauster not as part of the RMCS process Filter papers used in the suction line for the CGM were saved and analyzed in the laboratory to estimate the airborne radionuclide concentration in the tank head space Two CGM filter papers were needed for each core as moisture in the tank vapors condensed on the papers in the cold weather and began to restrict tank gas flow to the CGM
Tank 241-SX-103498 to 598 RMCS started in SX-103 with Truck 4 on 42798 The SX exhauster was used for ventilation (see SX- 101 above) Sampling was performed in risers 7 and 1 1 and was completed on 51198 A total of 6 RMCS and 18 PMCS segments were taken Two RMCS cores were obtained During sampling filter papers used in the suction line for the CGM were saved and analyzed in the laboratory to estimate the airborne radionuclide concentration in the tank head space One CGM filter paper was used during each core SX exhauster stack record samples and filter housing dose rates were obtained as part of routine operations for the SX exhauster not as part of the RMCS process
Tank 241-SX-105298 to 598 RMCS started in SX-105 with Truck 3 on 22598 The SX exhauster was used for ventilation (see SX- 101 above) Sampling was performed in risers 6 and 14 and was completed on 51598 A total of 6 RMCS and 20 PMCS segments were taken Two RMCS cores were obtained During sampling filter papers used in the suction line for the CGM were saved and analyzed in the laboratory to estimate the airborne radionuclide concentration in the tank head space Two filter papers were needed for the first core as moisture in the tank vapors condensed on the papers in the cold weather and began to restrict tank gas flow to the CGM One filter paper was used for the second core SX exhauster stack record samples and filter housing dose rates were obtained as part of routine operations for the SX exhauster not as part of the RMCS process
Tank 241-SX-102698 to 798 RMCS started in SX-102 with Truck 4 on 61798 The SX exhauster was used for ventilation (see SX- 101 above) Sampling was performed in risers 8 and 4 and was completed on 7798 A total of 2 RMCS and I8 PMCS segments were taken Two RMCS cores were obtained During sampling filter papers used in the suction line for the CGM were saved and analyzed in the laboratory to estimate the airborne radionuclide concentration in the tank head space One filter paper was used for each core SX exhauster stack record samples and filter housing dose rates were obtained as part of routine operations for the SX exhauster not as part of the RMCS process
Tank 241-S-110598 to 698 RMCS was begun in S-I10 on 51898 Exhauster C (4) and Truck 3 were used This tank marked the first use of an RMCS exhauster since 1995 Sampling was completed on 6498 Risers 6 and 14 were sampled A total of IO RMCS and 8 PMCS segments were taken Two RMCS cores were obtained The
F-3
RPP-4826 Rev I
total exhauster run time was 15978 hours The stack record sample was removed and analyzed following this run period Dose rates taken at the side of the exhauster housing during RMCS were all lt05 mRhr During sampling filter papers used in the suction line for the CGM were saved and analyzed in the laboratory to estimate the airborne radionuclide concentration in the tank head space One filter paper was used for each core Waste particles retained on the exhauster housing filters were part of the inventory subsequently measured by NDA following completion of the first core in TX-I 13
Tank 241-U-107698 to 798 RMCS was begun in U-107 on 61098 Exhauster C and Trucks 3 and 4 were used Sampling was completed on 71598 Risers 7 and 2 were sampled A total of IO RMCS and 19 PMCS segments were taken Two RMCS cores were obtained The total exhauster run time was 27385 hours The stack record sample was removed and analyzed following this run period Dose rates taken at the side of the exhauster housing during RMCS were all 105 mRihr During sampling filter papers used in the suction line for the CGM were saved and analyzed in the laboratory to estimate the airborne radionuclide concentration in the tank head space One filter paper was used for each core Waste particles retained on the exhauster housing filters were part of the inventory subsequently measured by NDA following completion of the first core in TX-I 13
Tank 24l-BY-105798 to 898 RMCS was begun in BY-105 again on 72298 Exhauster C and Trucks 3 and 4 were used Sampling was completed on 82598 Risers 7 and 1 1 B were sampled A total of 18 RMCS and 18 PMCS segments were taken The material was hard enough to require rotary mode sampling all the way to the bottom of the waste but negligible recovery was obtained After RMCS was performed to the waste bottom a PMCS core was taken in the same hole to recover material Two RMCS cores were obtained The exhauster run time was 13577 hours for the first RMCS core and 30792 hours for the second RMCS core Stack record sample information in ABCASH shows 30558 hours operation for the second core but the sampler data sheet shows the time counter was mistakenly reset 234 hours into the run No correction was made to the BY-IO5 2nd core record sample concentration for this document since the error is conservative and results in only slightly higher (ltI) record sample radionuclide concentrations for this core A stack record sample was removed and analyzed following each core giving two record samples for BY-IO5 in 1998 Dose rates taken at the side of the exhauster housing during RMCS were almost all lt05 m R h but a few readings indicated 07 mRihr This variation was assumed due to personnel reading the instrument differently or the fact that the exhauster had been used on enough tanks that by now there was sufficient activity on the filters to cause readings approximately at the background detection level The final reading when both cores were completed was lt05 m R h During sampling filter papers used in the suction line for the CGM were saved and analyzed in the laboratory to estimate the airborne radionuclide concentration in the tank head space One filter paper was used for each core Waste particles retained on the exhauster housing filters were part of the inventory subsequently measured by NDA following completion of the first core in TX-113
Tank 241-TX-113998 to 599 Core sampling was begun in TX-I 13 riser 3 on 92298 Exhauster B (3) and Truck 4 were used at the start This was the first use of Exhauster B since it was modified Exhauster B ran for a total of 8738 hours until being disconnected on 102398 During this time two PMCS segments were taken and no RMCS segments Exhauster C was then installed and operated for 5598 hours from 121098 to 122898 No RMCS or PMCS sampling was performed during this time frame RMCS segments werent taken until 299 Exhauster C ran for a 30230 hours between 122898 and 21299 Sampling was completed on the core from riser 3 on 21299 A total of 12 RMCS segments were obtained during the time Exhauster C was operating Exhauster flow rate for both exhausters was a nominal 200 scfm Stack record samples were taken following Exhauster B removal at the end of 1998 for Exhauster C and following completion ofthe first core with Exhauster C Aerosol calculations were based on only the 30230 hours run time for Exhauster C in 1999 since this was the time period during which RMCS segments were obtained Dose rates taken at the side of the exhauster housing during the short PMCS only sampling period with Exhauster B were all ltOS m R h Dose rates with Exhauster C varied between lt O S mRhr and 07 mRhr The final reading on Exhauster C following completion of the first core was 07 mFUhr During sampling filter papers used in the suction line for the CGM were saved and
F-4
RPP-4826 Rev I
analyzed in the laboratory to estimate the airborne radionuclide concentration in the tank head space One filter paper was used for the core Waste particles retained on the exhauster housing filters were part of the inventory subsequently measured by NDA following completion of this core
Sampling in riser 5 was begun on 41299 using Exhauster B and Truck 3 A total of 6 RMCS and 1 PMCS segments were taken for this core before sampling was halted on 42899 The total exhauster run time for this core was 11712 hours Problems with high vacuum in the tank required the exhauster flow rate to be reduced to 190 scfm to keep the system within pressure limits The stack record sample for the second core was removed and analyzed following the run period Dose rates taken at the side of the exhauster housing during the second core were all lt05 m M r During sampling filter papers used in the suction line for the CGM were saved and analyzed in the laboratory to estimate the airborne radionuclide concentration in the tank head space One filter paper was used An NDA was performed on the exhauster housing following this core The only radionuclides present in the housing were those from this core or what was removed from the tank head space during the non-RMCS activities in this tank from 92298 and 102398
Some clarification may be needed to explain use of the exhauster operating times and NDA dose rate and record sample data obtained during core sampling on TX-I 13 Core sampling was set up for sampling riser 3 on TX-113 in September 1998 with Exhauster B Exhauster B operated for a total of 8738 hours between 92298 and 102298 The stack record sample was removed at the end of this period The ERS database incorrectly shows the exhauster operated between 111698 and 111998 The ABCASH database shows the stack record sample was removed on 111998 The stack record sample showed positive emuent concentrations during this time period with variances 400 No RMCS samples were taken during this period so the data and time werenrsquot included when calculating RMCS aerosol numbers Exhauster B was removed and Exhauster C installed in late November-early December Exhauster C was operated for a total of 5559 hours between 121098 and 122398 The stack record sample was removed on 122898 No sampling was performed during this period so the data and time werenrsquot included when calculating RMCS aerosol numbers Exhauster C was operated for a total of 30218 hours between 122898 and 2899 All the RMCS segments from riser 3 were taken in this time period so only the data and time for this period were included when calculating RMCS aerosol numbers Exhauster B was used during sampling of riser 5 Exhauster B operated for a total of 11712 hours between 41299 and 42899
Tank 241-TX-l18599 to 699 RMCS was begun in TX-I 18 on 5699 Exhauster C (4) and Truck 4 were used Sampling was completed on 6298 Risers 9B and 12B were sampled A total of 9 RMCS segments were taken there were no PMCS segments Two RMCS cores were obtained The total exhauster run time was 21247 hours The stack record sample was removed and analyzed following this run period The maximum dose rate taken at the side of the exhauster housing following RMCS was 08 m M r CGM filter papers were not analyzed An NDA was performed on the exhauster housing following completion of the two cores The exhauster housing contained the same nuclides as for the first NDA (S-110 U-107 BY-105 and TX-I 13 first core) plus those from TX-I 18
The basic core sampling operational data used in this document includes the number of RMCS cores and segments the exhauster run times and flow rates the RMCS exhauster HEPA filter dose rates and tank vapor space temperatures Table F-l lists the basic operational data This information excluding tank vapor space temperature data was obtained from procedural data sheets in the sampling work packages (References W - 1 to WP-23)
Tank temperature data for the tanks ventilated with the RMCS exhausters was obtained from the TWINS database Plots for each tank were prepared for the time RMCS was conducted and the average value of the highest thermocouple located in the tank (the lowest temperature reading) was estimated and used as the average tank head space temperature during the RMCS period
The SX exhauster flow rates listed in Table F-l are estimates only The combined flow rate for SX-IO1 through SX-106 plus SX-109 (7 tanks) averaged 440 cfm during CY 1996 (Kaiser 1997) for an average of 63 cfm per
F-5
RPP-4826 Rev I
tank Based upon inlet flow measurements at the tank inlet HEPA filters (Fanis 1998) the flow through each individual tank (SX-IO1 through SX-106 plus SX-109) was lt55 cfm at the breather filter Assuming an exhaust flow of 100 cfm for each SX farm tank sampled is therefore conservative
Calculated Data
Calculated data include the tank head space volumes conversion of the RMCS exhauster flow rate from scfm to acfm and the number of tank head space changeouts made by an exhauster during RMCS
Tank head space volume includes the dome space volume above the top of the sidewall plus the void space between the waste surface and the top of the sidewall The formula used to calculate tank head space volumes WN
Head Space Volume in A = (DS + [(H) (12) + HI + Hb - H] (V)) - 748
Where DS = dome space volume gal H = height of tank body sidewall above knuckle A HI = height of tank knuckle area in Hb = height oftank bottom below knuckle in H = height of waste in tank in V =27555 galin of waste in SX tanks 2754 gallin in all others
The tank dome space volumes height of tank sidewall above the knuckle height of tank knuckle area and height of tank bottom below the knuckle were obtained from Reynolds 1999 The height of waste in each tank at the time of core sampling was obtained from the TWINS database Tank dimensional and waste level data are given in Table F-2 along with the calculated tank head space volumes
Aerosol calculations for Appendices A-C require exhauster flow rates in actual cubic feet per minute The RMCS exhauster flow rate is controlled and recorded in standard cubic feet per minute The mass flow rate of the exhauster air is measured and internal logic in the exhauster controller calculates what the volumetric flow rate would be if the temperature and pressure in the exhauster inlet were at standard conditions The standard conditions used in the logic controller are 29921 in Hg (760 mm Hg) and 69F (ZIT)
A correction factor is built into the exhauster control logic that assumes an atmospheric pressure of 2927 in Hg the average atmospheric pressure at Hanford The RMCS exhauster will operate at about 1-2 in H20 negative pressure resulting in about a 2916 in Hg pressure in a waste tank when the RMCS exhauster is operating To revise the indicated scfm RMCS exhauster reading to an acfm value the RMCS exhauster scfm flaw rate was multiplied by (29922916)(T+459)528 where Tis the tank head space temperature in OF The tank head space temperatures in Table F-1 were input to the spreadsheet file used for aerosol calculations and converted to acfm The flow rates in acfm are included in Table F-I
The tank head space changeouts when using the RMCS exhauster were calculated by multiplying the exhauster acfm flow rate by the time of exhauster operation and dividing the result by the tank head space volume Tank head space changeouts are listed in Table F-2
F-6
c
gt 2
RPP-4826 Rev 1
APPENDIX G
REFERENCES
G-0
RPP-4826 Rev 1
APPENDIX G - References
Diedeker 1999 NDA of RMCS HEPA Filters L P Diedeker WMH E-Mail to JS Schofield CHG November 29 I999
ERDA 1976 Nuclear Air Cleaning Handbook ERDA 76-21 Buchsted C A Fuller A B and Kahn 1 E Oak Ridge National Laboratory 1976
Farris 1998 Internal Note T R Farris LMHC to J S Schofield LMHC Breather Filter Flow Rates for SX-Farm 31698
Foust 1999 Internal Memo RMCST Exhauster HEPA Filter Dose Rate Calculations D J Foust LMHC to J S Schofield LMHC October 25 1999
Greager 1999 Correspondence No WMH-9954450 Non-Destructive Analysis of the Rotay Mode Core Sample High-Efjiciency Particulate Air Filters E M Greager WMH to P C Miller LMHC June 28 1999 [Transmittal of HNF-4199 Resultsfram NDA Measurement of the 296-P-34 RMCS HEPA Filters]
HNF 1999 HNF-SD-WM-SAR-067 Tank Waste Remediation System Final Safety Analysis Report Rev 1 The revision incorporating RMCS accident analyses was submitted as Addendum 5 to DOE as a change to the FSAR predecessor the Basis for Interim Operation (BIO) LMHC-9857075 80232764-9-KOOl Submittal of Authorization Basis Amendment Package for Rotay and Push Mode Core Sampling in Satisfaction of Perfarmance Agreement TWR 122 Expectations I and 3 D 1 Allen LMHC to A M Umek FDH August 30 1998 Addendum 5 as of mid-January 2000 is waiting for approval by DOE
Kaiser 1997 T D Kaiser LMHC E-Mail to J S Schofield LMHC SX Tank Flow Data 42197
NUREG 1995 Potential Radionuclide Emissionsfrom Stacks on the HanfordSite Part I Dose Assessment Davis W E and Barnett J M Westinghouse Hanford Company from Proceedings of the 23 DOEMRC Nuclear Air Cleaning Conference held July 25-28 1994 February 1995
Schofield 2000a Letter 74910-00-002 Use of Microshield Calculations for RMCS Exhauster Housing for Estimating Radionuclide Quantities on the Filters Using NDA and Dose Rate Measurements I S Schofield CHG to File January 62000
Schofield 2000b Letter 74910-00-003 Rev I RMCS Exhauster Stack RecordSample Data J S Schofield CHG to File January 202000
Reynolds 1999 D R Reynolds LMHC E-Mail to I S Schofield LMHC transmitting Tank Volume Calculations draft of calculations done by Mike Plesha and Reed Hendershot data to be used for RESOLVE computer program for Hanford waste tanks August 3 1999
TWINS Tank Waste Information Network System database available at httptwinspnlgovSOO lhtbinTCDgetTableListexe
Waldo 1999 letter 74910-99-009 RMCS Exhauster Aerosol Test Data E I Waldo to J S Schofield June 22 1999
WHC 1993 WHC-SD-WM-ES-225 Rev I AerosolStudy for the Rotary Mode Exhauster P M Francis Westinghouse Hanford Company April 20 1993
WHC 1997 WHC-SD-WM-SAD-035 Rev Ob A Safety Assessment of Rotary Mode Core Sampling in Flammable Gas Single Shell Tanks Hanford Site Richland Washington August 8 1997
G- I
RPP-4826 Rev I
CGM Data CGM-I Letter PARTICULATE SAMPLING OF 241-SX-IO1 DURING ROTARY MODE CORE SAMPLING D C
Langlois E2 Consulting Engineers to J S Schofield Lockheed Martin Hanford Company March 16 1998
CGM-2 Letter PARTICULATE SAMPLING OF 241-SX-I05 DURING ROTARY MODE CORE SAMPLING D C Langlois E2 Consulting Engineers to J S Schofield Lockheed Martin Hanford Company June 9 1998
CGM-3 Letter PARTICULATE SAMPLING OF 241-SX-103 DURING ROTARY MODE CORE SAMPLING D C Langlois E2 Consulting Engineers to J S Schofield Lockheed Martin Hanford Company June 12 1998
CGM-4 Letter PARTICULATE SAMPLING OF 241-S-110 DURING ROTARYMODE CORESAMPLING D C Langlois E2 Consulting Engineers to J S Schofield Lockheed Martin Hanford Company July 20 1998
CGM-5 Letter PARTICULATE SAMPLING OF 241-SX-102 DURING ROTARY MODE CORE SAMPLING D C Langlois E2 Consulting Engineers to J S Schofield Lockheed Martin Hanford Company July 22 1998
CGM-6 Letter PARTICULATE SAMPLING OF241-U-107 DURING ROTARY MODE CORE SAMPLING D C Langlois E2 Consulting Engineers to J S Schofield Lockheed Martin Hanford Company August 3 1998
CGM-7 Letter PARTICULATE SAMPLING OF 241-BY-105 DURING ROTARY MODE CORESAMPLING D C Langlois E2 Consulting Engineers to 1 S Schofield Lockheed Martin Hanford Company September 17 1998
CGM-8 Letter PARTICULATE SAMPLING OF 241-TX-I13 DURING ROTARY MODE CORESAMPLING D C Langlois E2 Consulting Engineers to J S Schofield Lockheed Martin Hanford Company March 15 1999
CGM-9 Letter PARTICULATE SAMPLING OF 241-TX-113 DURING ROTARY MODE CORE SAMPLING D C Langlois E2 Consulting Engineers to I S Schofield Lockheed Martin Hanford Company May 31 1999
Notices of Construction NOC-I DOEIRL-93-40 Radioactive Air Emissions Program Notice of Construction Rotary Mode Core-Sampling
Truck and Exhauster Approved by Letter AIR 93-707 A W Conklin WDOH to J E Rasmussen DOEIRL 7893
NOC-2 DOEIRL-94-118 Rev 0 Radioactive Air Emissions Program Notice of Construction for the Rotary Mode Core-Sampling Systems Three and Four Approved by Letter AIR 95-603 A W Conklin WDOH to J E Rasmussen DOERL 63095
NOC-3 DOERL-94-118 Rev 1 Radioactive Air Emissions Program Notice of Construction for the Rotary Mode Core-Sampling Systems Three and Four Approved by Letter AIR 98-301 W W Conklin WDOH to I E Rasmussen DOEIRL 3698
NOC-4 DOEIRL-97-70 Radioactive Air Emissions Program Notice of Construction for Rotary Mode Core- Sampling in SX Tank Farm Approved by Letter AIR 97-1 101 A W Conklin WDOH to J E Rasmussen DOEIRL 113097
NOC-5 USEPA Letter OAQ-107 (no title approving DOE submittal 97-EAP-590 dated 72997) A J Frankel USEPA to J E Rasrnussen DOEIRL 8497
NOC-5 USEPA Letter OAQ-107rsquo (nb title approving DOE submittal 97-EAP-723 dated 101797) A J Frankel USEPA to J E Rasmussen DOERL 11498
Note that both letters have ldquoOAQ-107rdquo following ldquoReply to Attn ofrdquo
G-2
RPP-4826 Rev I
Work Packages WP-I ES-94-00808 WP-2 ES-95-00258 WP-3 ES-95-00045 - WP-4 ES-95-00434 - WP-5 ws-97-00173 - WP-6 WS-97-00174 - WP-7 ws-97-00143 - WP-8 WS-97-00144 - WP-9 WS-97-00207 - WP-I 1 WS-97-00208 - WP-12 WS-98-00049 - WP-13 WS-97-00050 - WP-14 WS-97-00224 - WP- I5 WS-97-00225 - WP-16 WS-97-00230 - WP- I7 ws-97-0023 1 - WP-18 ES-97-00452 - WP-19 ES-97-00453 - WP-20 WS-98-00072 - WP-21 WS-98-00073 - WP-22 WS-98-00067 - WP-23 WS-98-00068 -
241-BY-IO6 Perform Rotary Core Sample [Riser IOB] 241-BY-I IO Rotary Core Sample [Risers 12B 7 IZB 41 241-BY-IO8 Obtain Rotary Core Sample [Risers 12A amp 71 241-BY-IO5 Rotary Mode Core Sample [Riser 12A] 241-SX-101 Rotary Mode Core Sample Riser 19 241-SX-101 Rotary Mode Core Sample Riser4 241-SX-103 Rotary Mode Core Sample Riser 7 241-SX-103 Rotary Mode Core Sample Riser I I 241-SX-105 RMCST Obtain Core Sample Riser 6 241-SX-105 RMCST Core Sample Riser 14 241-SX-102 Rotary Mode Core Sample Riser 8 241-SX-102 Rotary Mode Core Sample Riser 4 241-S-1 IO RMCST Obtain Core Sample Riser 6 241-S-1 IO RMCST Obtain Core Sample Riser 14 2414-107 RMCSTCore Sample Riser 7 241-U-107 RMCST Core Sample Riser 2 241-BY-IO5 RMCST Core Sample Riser 7 241-BY-IO5 RMCST Core Sample Riser 1 IB 241-TX-113 Rotary Core Sample Riser 3 241-TX-113 RMCST Core Sample Riser 5 241-TX-I 18 RMCST Core Sample Riser 9B 241-TX-I 18 RMCST Core Sample Riser 128
G-3
RPP-4826 Rev I
EXPERIENCE WITH AEROSOL GENERATION DURING ROTARY MODE CORE SAMPLING IN THE HANFORD SINGLE SHELL WASTE TANKS
Summary
This document presents information on aerosol formation in tank head spaces during rotary mode core sampling (RMCS) in single shell waste tanks (SST) at the Hanford Site The mass of aerosols generated during RMCS has been very small The average mass of suspended waste solids present in an SST head space during RMCS was lt01 g The mass of suspended solids sent to an exhauster averaged ltOl g per RMCS segment and lt05 g per RMCS core The results are three orders of magnitude less than assumed in current accident analyses and environmental permit applications The measured decontamination factor (DF) for the RMCS exhauster housing exceeded 70000
Purpose
The purpose of this document is to present estimates based upon RMCS operating experience of the concentration and total mass of waste aerosols present in SST head spaces during RMCS and estimates of the mass of aerosols sent to the exhauster used on the tank This document also evaluates the performance of the RMCS exhausters and provides an estimate of the filter housing decontamination factor Revision 1 of this document is an extensive rewrite of Rev 0 and includes additional information not available when Rev 0 was issued
RMCS using a nitrogen purge gas to cool the bit and provide hydrostatic head pressure was performed between November 1994 and June 1999 All the available data relevant to aerosol formation during RMCS in SSTs was used for this study This document is not an evaluation of aerosol formation processes aerosol dispersion patterns within the tank head space aerosol settling rates or factors affecting removal of particulates from a tank When using the values given in this document to estimate maximum potential quantities released to an exhauster or to account for peak concentrations in a tank head space when evaluating potential accident scenarios engineering judgement should be used as deemed necessary to adjust the values given in this document for conservatism
Introduction
Core sampling is used to obtain 19 inch long samples of radioactive waste in the Hanford single shell waste tanks A 19 inch core sample is a segment A core is made up of all the segments taken as the drill bit passes through the waste A sample may he taken in push mode (PMCS) or rotary mode A segment taken in rotary mode is designated an RMCS segment and a core in which any RMCS segment is taken is designated an RMCS core RMCS is used for tanks in which the waste may be too hard to sample using other methods
Before 1994 core sampling was performed using different liquids that cooled the drill bit during RMCS and provided a hydrostatic head in the drill string during both RMCS and PMCS RMCS sampling was halted in 1990 over safety concerns with flammable gases and organic nitrates in the waste tanks The RMCS equipment was redesigned to a new process that used nitrogen gas to cool the cutting bit The nitrogen flow rate is approximately 30 to 40 scfm (085 to 11 m3min) during periods the drill string is rotating This gas passes through holes in the bit up through the waste and is released to the tank head space Tank head space volumes are in the 50000 to 100000 ft3 (1400 to 2800 mrsquo) range Since the nitrogen purge gas could result in aerosol formation in the tank vapor space an exhauster was included with the RMCS equipment redesign RMCS using the nitrogen purged process has been performed to date during the periods 1194 to 195795 to 1095 and 1297 to 699 From 1297 to 798 RMCS was performed in SX tank farm with the SX tank exhauster providing the ventilation In 94-95 and from 598 through 699 RMCS was performed in BY S U and TX tank farms using an RMCS exhauster
An estimate of the mass of aerosols sent to an exhauster during rotary mode core sampling is needed as a basis for the Potential to Emit (PTE) estimate in environmental permits for the exhausters employed during RMCS Estimates of tank head space mass concentrations and total suspended solids during RMCS are also used in certain accident analyses related to RMCS Since the bit rotation and gas sparging nature of RMCS have a higher potential for aerosol generation than many in-tank activities aerosols generated during RMCS may provide an estimate of the upper limit for the concentration of aerosols to be found in a tank head space during these activities
RPP-4826 Rev 1
There are two current (as of January 2000) Notices of Construction (NOC) approved by the Washington D e p m e n t of Health (WDOH) for exhauster use during RMCS The first WDOH permit is for Exhauster Systems 3 and 4 (referred to as Exhauster B and Exhauster C in this document) during RMCS in a tank that is normally passively ventilated (Reference NOC-3) The second WDOH permit (NOC-4) is for RMCS in SX tank farm using the SX exhauster The Environmental Protection Agency (EPA) has also granted approval for RMCS exhauster use in a tank that is normally passively ventilated (NOC-5) and for RMCS in SX farm with the SX exhauster (NOC-6)
Very conservative assumptions were made on RMCS aerosol quantities for the existing NOCs and safety basis accident analyses These assumptions were made since no operational data were available on aerosol levels when most of these NOCs and accident analyses were prepared WHC 1993 provided the initial estimate of aerosols sent to the exhauster during RMCS Based upon assumptions in this document a value of 1 kg of waste sent to the exhauster per RMCS core was used as the basis for the first two RMCS NOCs (NOC-I and NOC-2) This number was based upon drilling tests in drums of extremely hard and dry simulated saltcake The hard simulant was intended to present a limiting case for RMCS drill bit testing and was not physically representative of actual tank wastes This I kg per RMCS core estimate was modified to 77 g waste per RMCS segment when using the RMCS exhauster (NOC-3 and NOC-5) and 35 g per segment for RMCS in SX farm (NOC-4 and NOC-6)
A value of 600 g of waste in the tank head space was assumed in WHC 1997 for certain RMCS accident analyses This number was based upon earlier conservative assumptions on particulates generated during a large gas release event in Tank 241-101-SY A value of 100 g waste in the head space was used in an update ofthis RMCS accident analysis provided in a revision to the predecessor of HNF 1999 that has been submitted to the Department of Energy (DOE) for approval
After nitrogen-purged RMCS operations commenced in November 1994 it became obvious that the estimates of aerosol generation rates based upon WHC 1993 were very conservative This was evident from in-tank videos that showed very little dust formation and from the lack of any dose rate buildup on the in-tank prefilter (when used) or the exhauster HEPA filters An evaluation was begun in 1997 to use data obtained during or following RMCS operations to estimate actual aerosol generation rates and exhauster filter performance This document provides the results of that evaluation
Aerosol Estimation Methods
Dedicated particulate sampling methods such as employing sticky tapes to capture aerosols for microscopic evaluation or specially designed samplers were not used for this evaluation Funding and personnel were not available for an in-depth study nor was such a study necessary Aerosol quantities were estimated using the best data available from existing sources associated with RMCS (housing dose rates CGM filter papers stack record samples) or easily obtained additional data (housing NDA) Three separate methods were used to provide estimates of the aerosols present in the tank head space or sent to the exhauster The first method used non destructive assay (NDA) of RMCS exhauster filter housings to estimate particulates captured on the filters The second method used the RMCS exhauster HEPA filter dose rates following completion of a core to estimate the mass of waste on the filters The third method estimated the tank head space aerosol concentration based upon analytical data from filter papers located upstream of combustible gas meters (CGMs) employed during RMCS A CGM draws air out of a tank headspace at a constant flow rate during RMCS to monitor for flammable gases
It was not possible to utilize any single method of estimating aerosol quantities for all RMCS sampling events For some sampling events not all data types were available or if available were not useful Reasons for the data not being useful include no RMCS segments taken during the time period evaluated analytical data being below background levels or having an analytical variance gtloo or (for SX tank farm) other tanks being exhausted in parallel or series with the tank being core sampled All calculations conservatively assumed that the background radionuclide concentration in a tank head space was zero and that all radionuclides detected by one of these methods were due solely to RMCS activities
Table 1 lists the RMCS sampling events which provided the data for this document the exhauster that was in service the aerosol estimate methods used for that event and the number of RMCS cores and segments obtained
L
RPP-4826 Rev 1
during the sampling method The data in this document were obtained during RMCS in eleven separate tanks A total of 23 RMCS cores containing 11 5 RMCS segments were obtained The aerosol estimation methods are summarized below
RMCS Exhauster Housing NDA Appendix A describes NDA of RMCS exhauster housings after they were used during RMCS operations from 598 through 699 Gamma assays of the housings were performed to measure the Csrdquorsquo on the prefilter primary HEPA filter and secondary HEPA filter The quantity of Csrdquorsquo present on each was estimated by comparison with the Csrdquorsquo count rate from a known standard measured in an equivalent geomeby The quantity on all three filters was summed to estimate the total in the housing The mass of particulates was obtained by dividing the quantity of present by a weighted average of the Csrdquorsquo concentration of the wastes in the tanks being exhausted With this data average tank head space mass concentrations were calculated as well as the mass per core and per segment sent to the exhauster The mass of waste in a tank head space was calculated by multiplying the tank head space concentration by the tank head space volume A summary ofthe results is given in Table 2 The detailed results are given in Table A-3
RMCS Exhauster HEPA Dose Rate Data Appendix B describes using RMCS exhauster dose rate data to estimate aerosol quantities The dose rate at the ed e of the HEPA filter housing is used to estimate a quantity of Csrdquorsquo on the filter Dividing the quantity of Cs on the filter by a weighted average of the Csrdquorsquo concentration in the wastes of the tanks being exhausted provides the waste mass on the filters With the waste mass known tank head space mass Concentrations can be calculated as well as the mass per core or per segment sent to the exhauster The mass of waste in a tank head space was calculated by multiplying the tank head space concentration by the tank head space volume A summary of the results is given in Table 2 The detailed results are given in Table B- 3 The minimum detection ability ofthe dose rate instruments used is 05 m m r Most RMCS exhauster dose rates following completion of an RMCS core were less than detectable An exhauster housing registered slightly above the minimum detectable limit at 07 mRhr after core sampling on S-l IO U-107 BY-IO5 and TX-I 13 This housing read 08 mRhr after completion of sampling on the next tank TX-I 18
CGM Filter Paper Analyses Appendix C describes using CGM filter paper analytical data to estimate aerosol quantities The filter papers are inserted in-line in front of a CGM where they catch the radionuclides in the tank vapors drawn into the CGM These filter papers were removed and analyzed starting in 1997 For conservatism only sample results with a variance 400 were used These analytical data were divided by the specific activity of the radionuclides present on the filter paper for the tank on which the CGM was being operated This provides an estimate of the aerosol mass concentration in the tank head space since a particulate sample is drawn directly from the tank head space during RMCS With this data the mass of waste in the head space and the mass per core and per segment sent to the exhauster can be calculated The mass of waste in a tank head space was calculated by multiplying the tank head space concentration by the tank head space volume A summary of the results is given in Table 2 The detailed results are given in Table C-4
IF1
RMCS Exhauster Decontamination Factor Estimation Method
The RMCS exhauster filter housing DF was calculated by comparing stack record sampler data with the housing NDA data to calculate an efficiency for the housing The housing contains a prefilter and two HEPA filters in series Table 1 lists the RMCS sampling events which provided the data for estimating the DF
Housing NDA and Record Sample Data Comparison Appendix D uses RMCS exhauster stack record sample data to estimate stack Csrdquorsquo emissions for the same time periods when NDA data were obtained The stack emissions were used with the NDA data to calculate a filter housin DF The only radionuclide shown as present by the NDA was Csrdquorsquo No stack record samples showed Cs were available for seven of the nine stack record samples taken during the time NDA data were obtained For the remaining two samples conservative assumptions were made as to the stack total beta concentration
139 present above detection limits However total beta results above minimum detection limits
3
RPP-4826 Rev I
Stack total beta emissions were converted to CsrsquoI7 emissions using the C S rdquo ~ to total beta ratio for the waste in the tank being sampled The filter housing input was calculated by adding this calculated Csrdquorsquo emission to the quantity shown by NDA to be in the housing Dividing the emissions by the input provided the penetration efficiency Results of the housing efficiency and decontamination factor calculations are provided in Table D-I
Discussion of Results
All calculations were based upon radionuclides measured on the exhauster filters in the tank head space air or in the exhauster stack These radionuclide quantities were divided by the specific activity of waste in the tank to provide mass quantities in the air on the filters or in the exhaust stream Appendix E provides the waste specific activities used in this document along with limitations and potential errors associated with using them
The calculated average mass concentration in a tank head space during RMCS ranged from a low of 77E-6 gm3 based upon exhauster housing NDA data to a high of 4OE-5 gm3 based upon CGM filter paper data The weighted average of all methods was 24E-5 gm Welghted averages used in this document were based upon numbers of RMCS segments obtained during application of that method
The average mass concentration is not the peak concentration as illustrated by Figure I Figure 1 is a representation of relative concentrations only not a plot of measured concentrations during a specific sampling event Lines A and B represent aerosol concentrations at points near the drill string and at the tank outlet to the exhauster respectively Line C represents the calculated average concentration in the tank head space The peak concentration in the air to the exhauster will exceed the average tank head space concentration for short periods oftime It is beyond the scope of this document to provide a detailed spatial and time-dependent analysis of tank aerosol concentrations The methods used in this document provide an estimate of an average tank head space mass concentration only
The average mass of suspended solids in a tank head space was estimated by multiplying the average head space mass concentration by the tank head space volume The calculated average mass of suspended solids in a tank head space during RMCS ranged from a low of I 8E-2 g based upon exhauster housing NDA data to a high of 97E-2 g based upon CGM filter paper data The weighted average of all methods was 56E-2 g Comparing 56E-2 g to the 600 g and 100 g used in accident analysis assumptions it is evident that the accident analyses used peak tank head space mass levels three to four orders of magnitude greater than the average mass level in a tank head space during RMCS
Multiplying an average concentration by the tank head space volume to estimate the mass of suspended solids in the tank head space at a given time makes the simplifying assumption that the tank head space concentration is constant with time and uniform within the head space during RMCS As illustrated by Figure I the tank head space concentration is not constant with time or uniform within the head space When determining a maximum value for mass of solids in a tank head space engineering judgement needs to be applied that evaluates all the parameters involved that could increase or decrease the average mass value provided in this document With all other variables being equal the mass concentration and mass of suspended solids in a tank head space will also be affected hy the volume of the head space and the exhaust flow rate The head space volumes of the tanks sampled to date are typical of SSTs The exhauster flow rate is not expected to change for the RMCS exhauster If additional samples are taken in SX tanks where the exhauster flow rate is higher than in the four SX tanks which have already been sampled the mass present in the tank head space would be expected to be reduced
The calculated mass of waste sent to an exhauster ranged from lows of 18E-1 gRMCS core and 34E-2 W C S segment based upon CGM filter paper data to highs of 59E-I gRMCS core and 1OE-1 gRMCS segment based upon exhauster housing dose rate data The weighted average of all methods was 42E-1 gRMCS core and 69E-2 gRMCS segment Comparing the average to the 1 kgRMCS core and 35-77 glRMCS segment numbers used for the PTE estimates it is evident that the PTE estimates are conservative by at least three orders of magnitude
Results given in this document based upon total beta or Csrsquordquo data are likely more valid than alpha based results due to the higher concentrations of beta-gamma radionuclides in the waste and their greater ease of measurement when
4
RPP-4826 Rev 1
compared to alpha emitters Equal weight is given to all results regardless of whether based upon total al ha total beta or CsI3rsquo data This provides conservative results since the aerosol values based on total beta or CslfPwere normally lower than those based upon alpha results
The mass per segment numbers should be a better indicator of RMCS aerosol emissions from the tank than the mass per core numbers This is because the quantity of aerosols generated in a tank should be proportional to the time of purge gas flow and bit rotation The time of purge gas flow and bit rotation should be proportional to the number of RMCS segments taken Thus the mass of RMCS generated aerosols sent to an exhauster on a given tank should be roughly proportional to the number of RMCS segments obtained from the tank The number of RMCS segments in a core can vary To date the range has been from 1 to 12 RMCS segments per RMCS core The average has been 5 RMCS segments per RMCS core
The results for mass per core or per segment based on NDA and housing dose rate data have a firmer basis than results based upon CGM filter paper data This is because the RMCS exhauster housing NDA and dose rate methods are a direct physical measurement of essentially all the Csrsquordquo released to the exhaust stream during RMCS Aerosol measurements based upon HEPA dose rate are conservative as the filters showed no detectable dose rate for three of the five periods evaluated and barely perceptible readings after the other two
The results for tank head space concentrations and mass of waste in a tank head space during RMCS based on CGM filter paper data have a firmer hasis than results based on housing NDA or dose rate This is because the CGM filter paper data is a direct measurement of the concentration in the air in a tank head space during the time when aerosols are being generated The CGM filter paper data should provide a higher tank head space mass concentration than that calculated by filter housing NDA or dose rate This is because aerosols are only generated during times when the CGM is operating and the CGM operates for less time than the exhauster does Since the concentration is based upon dividing a filter quantity by the volume of gas passing through the filter the volume of gas in proportion to the material on the filter will be less for the CGM filter paper than for an exhauster filter resulting in a higher concentration based on CGM filter paper data A factor is included in the CGM based concentration to account for radionuclides in the dome space that have not settled out or been removed by the exhauster when the CGM is shut Off
The average results for all methods were within reasonable agreement with each other considering all the variables and assumptions involved The filter housing DF is in good agreement with expected values
This document contains seven appendices Appendices A-C provide particulate results based upon RMCS exhauster housing NDA RMCS exhauster housing dose rates and CGM filter paper data Appendix D provides an RMCS exhauster filter housing DF based on housing NDA and stack record sample data Appendix E provides waste specific activities and Appendix F provides the raw data used in Appendices A-D Appendix G provides references for this document
Conclusions
The results in this document are based upon RMCS operating experience from startup of nitrogen-purged RMCS in November 1994 through June 1999 Table 2 summarizes the information presented in the appendices Based upon this information and the lack of any significant aerosol formation seen in in-tank videos it can be concluded that past estimates of aerosol concentrations used for regulatory permits and accident analyses were conservative by a nominal three orders of magnitude
In order to estimate mass releases for regulatory permits the overall emissions with time are needed as a basis for the PTE estimates For future permits the mass per core or mass per segment values in Table 2 can be used directly with conservatism added if deemed appropriate for the tanks to be sampled When estimating maximum concentrations or maximum mass quantities in the tank head space for use in accident analyses additional conservatism needs to be added to the average concentration and mass values in Table 2
5
RPP-4826 Rev I
Tank and Date Sampled
Table 1 Summary Of Aerosol Estimation Methods Used
RMCS Aerosol Estimation Methods Exhauster Number of Used
Housing DF RMCS Cores Riser Used Period6 HEPA CGM NDA and and RMCS
Exhauster Operating Sample Exhauster
NDA Dose Filter RMCS Stack Segments Taken
BY-IO5 1998
No RMCS segments taken from BY-108 or from TX-I 13 Riser 3 using Exhauster B Any material retained on I
the filters during these operating times was assumed to come from next RMCS sampling event with the same exhauster BY-IO5 in 1998 shown as separate exhauster installations since stack record samples were pulled after each riser was sampled
Includes RMCS cores and segments only PMCS cores and segments obtained during exhauster operation not included A total of 23 RMCS cores and 115 RMCS segments were taken between 1194 and 699 The sum of cores and segments is less than sum of cores and segments obtained during data collection periods at lei since more than one aerosol estimation method was used for some sampling periods
One CGM filter paper was used for both cores in SX-102 and for both cores in U-107 3
See Appendix F for explanation of exhauster operating periods
6
RPP-4826 Rev I
Table 2 Summary Of RMCS Aerosol Data
Weighted average based upon number of RMCS segments taken with each method
7
e
Q 0 c 0 0 - 0 VJ 0 L
2
RFP-4826 Rev 1
APPENDIX A
ESTIMATION OF AEROSOLS GENERATED DURING Rh4CS BASED UPON RMCS EXHAUSTER HOUSING NON-DESTRUCTIVE ASSAY
A-0
RPP-4826 Rev I
APPENDIX A - Estimation Of Aerosols Generated During RMCS Based Upon RMCS Exhauster Housing Non-Destructive Assay
Summary of Method
This method of estimating RMCS aerosol quantities uses non-destructive assay (NDA) of the exhauster housing to determine the C S rdquo ~ quantity (Ci) on the filters inside This quantity is then divided by the C S rdquo ~ specific activity (Cig) in the waste for the tank(s) on which the exhauster and the same filters were present during sampling The resulting mass on the filters divided by the volume of air flowing through the exhauster provides an estimate of the average aerosol mass concentration in the air to the exhauster This value was multiplied by the tank head space volume to obtain the average mass of particulates present in the tank head space during RMCS The mass of waste on the filters divided by the number of rotary cores or segments taken provides the mass per core or per segment sent to the exhauster
Description
There are one prefilter and two HEPA filters in series for each RMCS exhauster Particulates captured on the filters contain radionuclides with C S rdquo ~ bein the predominant gamma emitter By performing an NDA of the exhauster housing filters the quantity of Cslg7 in the housing can be estimated This C S rdquo ~ value is then used to back-calculate to a waste mass on the filters using the mass is used to calculate the concentration of particulates in the tank exhaust stream the total suspended solids in the tank head space and the mass of waste sent to the exhauster for each RMCS core or segment taken
Exhauster operations were divided into six operating periods for evaluation in this document These periods are discussed in Appendix F and shown in Table F-I NDA data were obtained for Exhauster Operating Periods 4 5 and 6 Relevant information for these periods is also listed in Table A-I
Period 4 was for Exhauster C use during RMCS for both cores in S-l IO U-107 BY-IO5 and the first core in TX-I 13 The filters and housing were new prior to RMCS in S-110 No filter changeouts were made during this period the accumulated particulates from these RMCS events were retained on the housing prefilter primary HEPA and secondary HEPA
Period 5 was for Exhauster B use during RMCS for the second core in TX-I 13 The filters and housing were new prior to RMCS in TX-113 No filter changeouts were made during this period Exhauster B also ran for a short time during the first core in TX-113 but no RMCS segments were taken when the exhauster was operating Stack record samples (see Appendix D) indicated small levels of aerosols were present in the stack exhaust during this time period Any material collecting on the filters during this time period would show up and be counted as part of the aerosols generated during the 2rdquod RMCS core
Period 6 was for Exhauster C use during RMCS for both cores in TX-I 18 During Period 6 the filters also contained the waste particles from Period 4 No filter changeouts were made durin this period The aerosol mass generated due to RMCS in TX-I 18 was determined from the increase in Cs on the filters between Period 4 and Period 6
A description of the sampling method used for the NDA obtained following Period 4 is provided in Greager 1999 The same method was used for the NDA following Periods 5 and 6 The NDA consisted of a gamma energy analysis of the exhauster housing performed at points adjacent to the prefilter first HEPA and second HEPA The detector was mounted outside the housing and inside a lead collimator The collimator was used to minimize the background count rate and contribution from adjacent filters CsIh was the only radionuclide reported as present The NDA compared the count rates from the exhauster housing with the count rate of an National Institute of Standards and Technology (NISampT) traceable in an equivalent geometry to the RMCS exhauster housing The count rates from housing filter readings were divided by the count rate for the source to give a reported quantity of Cslrdquo on the filters
concentration in the tank waste This filter waste
3 B
source located in the middle of a filter
A- 1
RPP-4826 Rev 1
Two correction factors were applied to the reported filter Csrdquorsquo values for use in this document These are discussed in the following two sections
Reported NDA Data
The NDA results for Period 4 are provided in Greager 1999 The only radionuclide reported as present on the filters was CsI3rsquo The results are restated in Table A-2
The NDA results for Periods 5 and 6 are provided in Diedeker 1999 The only radionuclide reported as present on the filters was Csrdquorsquo The results are restated in Table A-2
Adjusted NDA Data
The reported results are based upon comparing the count rate for a reference point source located in the middle of a mock-up assembly equivalent to the exhauster housing with the count rate from the same detector inside a lead collimator placed outside the actual exhauster housing Limitations with this method include comparison of a point source with a distributed matrix and the inability of the detector to see the entire filter due to the presence of the collimator Correction factors were used to adjust the reported values to account for these two limitations
The first correction factor accounts for comparing a distributed source to the point source standard The reported results were calculated based upon a point source standard since there are no readily available filter standards with a distributed source The material in the filter housing should be fairly evenly distributed through the filter media however so comparing count rates for the filter housing to a point source standard will result in some error To correct for this error shielding calculations were performed on an exhauster housing filter assuming the CSrdquorsquo was evenly distributed throughout the filter media and then again assuming the activity was a point source in the middle of the filter Foust 1999 provides the results of these Microshield dose rate calculations Using the data in Foust 1999 Schofield 2000a shows that the dose rate at the NDA detector location would be about 0625 mFVhrmCi CSrdquorsquo for a point source and 073 mRhrmCi Cslrdquo for a distributed source To adjust the reported NDA results to what they would have been if an actual distributed standard source was available the reported values need to be multiplied by 0625 + 073 = 086
The second correction factor accounts for the detector not being able to see the entire filter contents due to the detector location inside the lead collimator Using basic geometry Schofield 2OOOa estimated the detector has about a 100 view of 608 of a HEPA filter about a 50 view of 264 of the filter and is shielded from the remaining 128 The detector count rate was thus estimated as being approximately 741 o f what it would be if the detector were not collimated To correct the reported results to what they would have been if an uncollimated detector could have been used the reported values need to be multiplied by I + 0741 = 135
Combining the two correction factors gives a single adjustment factor used of 086 x 135 = 116 Per Table A- 2 the total quantity of Csrdquorsquo reported present in the housing for Period 4 was 0430 mCi This quantity was multiplied by 116 to give 050 mCi Csrdquorsquo The reported results for Periods 5 and 6 were revised in the same manner to give 0032 mCi and 064 mCi C~rsquo~rsquorespectiveIy To determine the net increase in Csrdquorsquo for the housing during Period 6 the value from Period 4 was subtracted from the total or 064 - 050 = 014 mCi Csrdquorsquo
Calculation of Mass Quantity on Filters
Calculation of the mass of waste on the filters requires knowledge of the specific activity of the waste on the filters The specific activities used for each exhauster operating period are given in Table A-I The paragraphs below provide a derivation of the specific activities used
The specific activity values for the waste in each tank sampled is given in Table E-I Rh4CS was performed on more than one tank during Period 4 so a weighted average specific activity was used to calculate the waste mass on the filters during this period The weighted average specific activity was calculated based upon the number of RMCS segments taken from each tank sampled The number of RMCS segments obtained during
A-2
RPP-4826 Rev 1
each period for which NDA measurements were made are listed in Table A-I These values were obtained from Table F-I A weighted average specific activity for the waste on the filters in Period 4 was obtained by
[[O 227 mCigl[lO segl+[Ol2lmCigl[lO seg1+[0225 mCigl[l(l seg]+[Ol30 mCig][l2 seg]]+[SO segments] = 0182 mCi Csrdquorsquog
Calculating a weighted average based upon the number of segments assumes aerosol generation is roughly the same per segment and the specific activity of a radionuclide is constant throughout a tank These assumptions are adequate for the purpose oftbis document Aerosol generation can vary with water content waste hardness depth of sample taken nitrogen flow rate and porosity of the waste An in-depth evaluation of these parameters is beyond the scope of this document The impact of these variables is assumed to average out over all the RMCS segments taken The specific activities used do not vary greatly from tank to tank so any variations will not have a significant impact on the final aerosol results See Appendix E for further discussion of limitations on specific activities used in this document
For Period 5 the filters were new at the start and the only tank sampled with the exhauster was TX-I 13 Therefore the specific activity of CsI3rsquo for TX-I 130130 mCig was used
The same exhauster and filters used for Period 4 were used for Period 6 The net increase in Csrdquorsquo for Period 6 was determined by subtracting the Period 4 Csrdquorsquo from the total Since this net increase was only due to TX- 118 the specific activity of Csrdquorsquo for TX-I 180130 mCig was used for the waste added to the filters in Period 6 (Note it is only a coincidence that TX-I 13 and TX-118 have the same nominal Csrdquorsquo concentration)
The total mass of waste on the filters for Period 4 was thus
050 mCi i 0182 mCig waste = 275 g waste in exhauster housing
The mass of waste added to the exhauster for Period 5 was
0032 mCi + 0130 mCig waste = 025 g waste in exhauster housing
The mass of waste added to the exhauster for Period 6 was
(064 mCi - 050 mCi) + 0130 mCig waste = 11 g waste in exhauster housing
Aerosol Calculations
The tank head space particulate concentration was obtained by dividing the mass of waste sent to the exhaust stream by the volume of air sent to the exhauster The volume of air to the exhauster was obtained by multiplying the exhauster flow rate by the exhauster run times for each tank from Table F-I
For the RMCS exhausters the recorded exhauster flow rate is reported in standard cubic feet per minute (scfm) The RMCS exhauster flow rate is controlled to a nominal 200 scfm The exhauster flow rate was corrected to an actual cubic feet per minute (acfm) before calculating the tank head space aerosol concenmtion Table F-l includes the actual cfm flow rates
The calculated flow rates during RMCS for the tanks sampled during Period 4 were 207 acfm (S-1 lo) 206 acfm (U-107) 208 amp 209 acfm (BY-105) and 203 acfm (TX-I 13) The total volume oftank air through the exhauster during Period 4 was thus
[[207 cfm][ 15978 hr]+[206][27385]+[208][13577]+[209][30792]+[203][30230]][60 minh] = 146 E+7 Arsquo
The average tank head space mass concentration during RMCS in the above tanks was
[275 g + 146 E+7 Arsquo] x [35315 ftrsquomrsquo] = 664 E-6 average g waste per m3 in exhauster inlet
A-3
RPP-4826 Rev I
The gas flow rates and average tank head space mass concentrations during RMCS for Periods 5 and 6 were calculated in a similar manner
The average mass of waste in a tank head space during RMCS was calculated by multiplying the tank head space mass concentration by the tank head space volume from Table F-2 as shown below for S-1 I O
[275 g + 146 E+7 Arsquo] x [89100 ftrsquo] = 167E-2 g waste in S-1 IO head space
The particulate quantities in the other tank head spaces were calculated in a similar manner The weighted average mass in a tank head space during Period 4 was based upon the number of segments taken in each tank
The mass sent to the exhauster per RMCS core or per RMCS segment was obtained by dividing the mass of waste sent to the exhaust stream during each period by the numbers of RMCS cores or RMCS segments obtained during the exhauster operating time The average mass of waste sent to the exhauster during Period 4 is thus
275 g waste + 7 rotary cores = 39E-1 g wastelrotary core
and
275 g waste + 50 rotary segments = 55E-2 g wasteirotary segment
The mass of waste to the exhauster per RMCS core and RMCS segment for Periods 5 and 6 were calculated in a similar manner
All data were input to a spreadsheet to perform the calculations Results are provided in Table A-3
Summary of Calculations
Non Destructive Assay was performed on the RMCS exhauster filter housings used during three separate exhauster operating periods during which IO RMCS cores and 65 RMCS segments were obtained from five tanks Weighted averages of the average tank head space mass concentration average mass of suspended solids in a tank head space and average mass sent to the exhauster per RMCS core or segment for the three periods combined were calculated based upon the number of RMCS segments taken during each period Based upon RMCS exhauster housing NDA data the results indicate that
The average tank head space mass concentration during RMCS was 77E-6 g wastelmrsquo The average mass of suspended solids in the tank head space during RMCS was 18E-2 g waste The average mass sent to the exhauster during RMCS was 52E-1 g wastelcore The average mass sent to the exhauster during RMCS was 63E-2 g wasteisegment
A-4
RPP-4826 Rev 1
APPENDIX B
ESTIMATION OF AEROSOLS GENERATED DURING RMCS BASED UPON Rh4CS EXHAUSTER HEPA FILTER DOSE RATES
B-0
RPP-4826 Rev I
APPENDIX B - Estimation Of Aerosols Generated During RMCS Based Upon RMCS Exhauster HEPA Filter Dose Rates
Summary of Method
This method of estimating RMCS aerosol quantities divides the dose rate increase (mRhr) at the side of the RMCS HEPA filter housing by a calculated dose conversion factor (mRhrmCi C S rdquo ~ ) to obtain an approximation of the radionuclide quantity in the housing This radionuclide quantity is divided by the waste specific activity (mCig) to determine the mass of waste on the HEPA filter Dividing the HEPA filter waste mass by the volume of air passing through the filter provides an estimate of the average tank head space particulate concentration during RMCS Multiplying the average tank head space particulate concentration by the tank head space volume gives an estimate of the average mass of suspended particulates in the tank head space during RMCS Dividing the HEPA filter waste mass by the number of RMCS cores or RMCS segments provides the mass per RMCS core or per RMCS segment sent to the exhauster
Description
Particulates in the exhaust stream are removed by the HEPA filter(s) upstream of the exhaust fan The captured particulates contain radionuclides with CSrsquo~rsquo being the predominant gamma emitter As the particulate quantity on the HEPA filter increases the dose rate at the side of the filter housing will increase proportionately By monitoring the HEPA dose rate at the side of the filter housing the quantity of Csrsquordquo on the HEPA can be estimated This C S rdquo ~ value is then used to back-calculate to a waste mass quantity on the filter using the Csrsquordquo concentration in the tank waste This filter waste mass quantity is used to calculate the concentration of particulates in the tank exhaust stream the total suspended solids in the tank head space and the mass of waste sent to the exhauster for each RMCS core or segment taken Although radionuclides will be trapped on both the prefilter and the primary HEPA filter with a very small amount on the secondary HEPA calculations in this section were based upon the simplifying assumption that all the activity was on the primary HEPA filter
During RMCS exhauster operation the dose rate in m M r at the side of the HEPA filter housing is periodically measured with an Eberline RO-3B per procedure to indicate when radioactive particulates are building up on the filter The limit of detection of the RO-3B is 05 mRhr
Exhauster operations were divided into six operating periods for evaluation in this document These periods are discussed in Appendix F and shown in Table F-I Housing dose rate data were obtained for Exhauster Operating Periods I 24 5 and 6 Relevant information for these periods is also listed in Table B-I Dose rate data are available and were used for all tanks on which an RMCS exhauster was present and RMCS samples were taken This includes BY-106 BY-IO5 (1995) BY-I IO S-l I O U-107 BY-IO5 (1998) TX-113 and TX- 1 18 The dose rate at the end of a period was used as the basis for calculating radionuclides on the filters The only operating period for which dose rate data were not used for estimating filter radionuclide content was Period 3 Period 3 was for RMCS in SX farm using the SX exhauster
The dose rate at the side of the SX exhauster HEPA filter housing was measured during RMCS of SX farm tanks (for sampling of tanks SX-lot SX-102 SX-103 and SX-105) but the data are not useful for estimation of aerosol quantities because the SX exhauster draws on 13 tanks in parallel or in series with the tank being core sampled Many of the tanks have a much higher off gas flow rate than the sampled tank In addition there is background radiation in the area of the SX exhauster filter housing making any increase in the housing dose rate during RMCS difficult to detect
Dose Rate Data
The dose rate data for each period is listed in Table 8-2 No dose rates above minimum detectable limits were evident at the sides of any RMCS exhauster in Periods I 2 and 5
Dose rate measurements were less than detectable for Period 4 during sampling of S-l IO and U-107 When sampling on BY-IO5 there were a few readings of 07 m M r but most were ltOS mRhr This variation in
B- 1
RPP-4826 Rev 1
readings is to be expected as the specific instrument person using the instrument and location at which the dose rate is checked can vary with time The final recorded dose rate when sampling was complete on BY-IO5 was lt05 mRhr At the end of Period 4 following completion of the first core in TX-I 13 Exhauster C was listed as having a 07 m M r dose rate
Period 6 used Exhauster C again with the same housing and filters as at the end of Period 4 The final dose rate for this period was 08 m M r
Periods 124 and 5 all began with a new housing and new filters For Periods 12 and 5 it was conservatively assumed that the final dose rate was equal to 05 m M r giving an increase of 05 mRhr for each of these periods For Period 4 the dose rate increase was 07 m M r for this period Since Period 6 used the same housing and filters as Period 4 the increase for Period 6 was 08 - 07 = 01 m M r
The dose rate increase was converted into a CsIh content on the primary filter for each period Foust 1999 provides various dose rates for an RMCS exhauster housing assuming even dispersal of 1 mCi C S rdquo ~ on the first HEPA filter Using these calculations Schofield 2000a estimated a dose rate conversion factor of 16 mRhrmCi C S rdquo ~ at the detector location for an RO-3B The assumption that radionuclides are evenly distributed on the HEPA is a reasonable assumption based upon the exhauster design and the method used to measure the radiation dose rate
Gamma emitting contribute to the dose rate due to bremsstrahlung radiation and other nuclides may provide some small additional dose but the major penetrating dose rate contributor in aged SST waste is CSrdquo~ Ignoring the presence of all radionuclides (including Srm) except C S rdquo ~ in calculating a HEPA filter waste mass will provide a conservative result This is because assuming all radiation present is due to C S rdquo ~ will result in overestimating the C ~ I ~ ~ c o n t e n t of the filter housing which in turn will result in overestimating the waste mass on the HEPA filter
Dividing the HEPA dose rate for each exhauster installation by the dose conversion factor of I 6 mRhrmCi results in an increase of 031 mCi Csrdquorsquo on the RMCS exhauster filters for Periods I 2 and 5044 mCi for period 4 and 0063 mCi for Period 6
Calculation of Mass Quantity on Filters
Dividing the Csrdquorsquo content of the filters by the specific activity of C S rsquo ~ ~ in the waste gives the estimated mass of waste sent to the exhauster The specific activity value used for the waste in each tank sampled is given in Table E-I Since RMCS was performed on more than one tank in Periods 1 and 4 a weighted average specific activity was used for these periods The weighted average specific activity was calculated based upon the number of RMCS segments taken from each tank sampled during that period The number of RhKS segments obtained during each period are listed in Table B-I These data were obtained from the individual tank data in Table F- I Calculations to estimate the specific activity of waste mixtures were performed in the same manner as shown in Appendix A For Periods 2 5 and 6 RMCS samples were taken in only one tank The waste specific activity used for these periods was the specific activity of the tank sampled The specific activities used for each exhauster operating period are given in Table B-I
For all exhauster installations except BY-IO6 in 1994 and 1995 the RMCS exhausters were hooked directly to the waste tank When sampling BY-106 a prefilter was installed in the tank riser between the tank and the exhauster The prefilter was not used for BY-I IO in Period 1 or for any other tank in any other period Thus for Periods 2 4 5 and 6 the mass of waste on the HEPA was assumed equal to the mass of waste leaving the tank risers For Period 1 the mass of waste on the HEPA had to be adjusted for the BY-106 prefilter DF when estimating the combined mass of waste leaving the BY-IO6 and BY-I IO tank risers The mass of waste on the HEPA for Period 1 was
[031 mCi] [IO00 pCimCi] = 310 pCi
[310 pCi Csrdquorsquoon HEPA] + [I77 pCi C S rdquo ~ ~ waste] = 177 gwaste on HEPA
is the predominant radionuclide contributor to filter dose rates Beta emitting Srw can
on HEPA
B-2
RPP-4826 Rev 1
A decontamination factor (DF) of 5 was used to account for radionuclide removal by the BY-IO6 prefilter (see Appendix D for basis ofprefilter DF) There were 1 1 RMCS segments taken from BY-IO6 and 13 from BY- 1 IO The total mass ofwaste assumed to exit the tank risers was therefore
[ I 77 g waste] [ 1 1 + 131 [[I 151 + 131 = 28 g waste from tank risers
The DF of 5 to account for the prefilter is only applicable to the RMCS of BY-IO6 in 1994 and 1995 for all other exhauster periods the mass of waste on the HEPA was equal to the mass of waste sent to the exhauster riser
The mass of waste sent to the exhauster for Period 2 was
[031 mCi] [IO00 pCimCi] = 310 pCi Csrdquorsquo on HEPA
[3 IO pCi C S rdquo ~ on HEPA] + [225 pCi CsiI7g waste] = I 39 g waste from tank
Using the same formula the mass of waste to the exhauster from Periods 4 and 5 was 241 and 240 g respectively and the increase in waste on the filters for Period 6 was 048 g
Aerosol Calculations
The mass sent to the exhauster per RMCS core or per RMCS segment was obtained by dividing the mass of waste leaving the risers by the number of RMCS cores or RMCS segments obtained during the exhauster operating period
The tank head space particulate concentration was obtained by dividing the mass of waste leaving the riser by the volume of gas sent to the exhauster This volume of gas sent to the exhauster was obtained by multiplying the exhauster flow rate by the exhauster run time from Table F-I The calculations for aerosols generated based upon HEPA dose rates use acfm while the exhauster flow is recorded in scfm so the actin flow rates in Table F- 1 were used
The average mass of aerosols in the tank head space was obtained by multiplying the average tank head space particulate concentration by the tank head space volume from Table F-2
Following is an example of how the mass per RMCS core mass per RMCS segment average tank head space mass concentration and average mass of aerosols in the tank head space were calculated for Period 1 Data used are from Tables E-I F-I and F-2
[200 scfm] [2992+2916] [84 + 4591 + 528 = 21 1 acfm to exhauster from BY-IO6 in 11-1294
using same formula results in 210 acfm for BY-IO6 in 195 and 209 acfm for BY-I IO
28 g waste + [((21 1 acfm)(4878 hr)+(21O)(l867)+(209)(1125))(60 minhr)]= 12E-6 g wastelf to risers
[12E-6 amp] [35315 fmrsquo] =43E-5 g wastemrsquoto risers
[12E-6 gftrsquo] [53700 Arsquo in BY-106 head space] =66E-I g waste in BY-IO6 head space during RMCS
[12E-6 piftrsquo] [92000 ftrsquo in BY-110 headspace] = IIE-l g waste in BY-I10 head spaceduring RMCS
[28 g waste] [5 RMCS cores] = 56E-1 g waste per core to riser
[28 g waste] + [24 RMCS segments] = 12E-1 g waste per segment to risei
8-3
RPP-4826 Rev 1
All data were input to a spreadsheet and the mass to exhauster per RMCS core mass to exhauster per RMCS segment average tank head space mass concentration and average mass of aerosols in the tank head space were calculated for each of the RMCS exhauster operating periods in the same manner as shown above Results are given in Table 8-3
Summary of Calculations
RMCS exhauster operations were segregated into five operating periods during which RMCS was performed The Exhauster B data for BY-IO8 and TX-I 13 riser 3 was not used in these calculations as no RMCS was performed when the exhauster was operating Exhausters were operated in seven tanks during which 16 RMCS cores and 92 RMCS segments were obtained Based on RMCS filter housing dose rate data the results indicate that
These values are conservative as the assumed dose rate at the end of RMCS for Periods I 2 and 5 was assumed to be 05 mRhr In addition using a DF of 5 for the BY-IO6 prefilter skews the results high The in-tank prefilters used in both BY-IO6 sampling events showed no detectable contamination
Operatin Periods 4 and 6 were the only periods with exhauster housing dose rates above detectable The 044 mCi Csrsquordquo and 0063 mCi CsIh increase on the filters for these two periods based upon dose rate data correspond to the 050 mCi CsI3rsquo and 014 mCi Csrdquorsquo increase on the filters for these two periods based u on NDA data (see Appendix A) The 031 mCi C S rdquo ~ for Period 5 is significantly above the 0032 mCi Cslrsquolsquofor the same period determined by the NDA but this is due to assuming the housing dose rate was equal to the minimum detectable 05 mRhr
The average tank head space mass concentration during RMCS was 22E-5 g wastem3 The average mass of suspended solids in the tank head space during RMCS was 47E-2 g waste The average mass sent to the exhauster during RMCS was 59E-1 g wastelRMCS core The average mass sent to the exhauster during RMCS was 1OE-1 g wastelRMCS segment
B-4
v m
__ ~~
RPP-4826 Rev 1
APPENDIX C
ESTIMATION OF AEROSOLS GENERATED DURING RMCS BASED UPON CGM IN-LINE FILTER PAPER ANALYSES
c-0
RPP-4826 Rev I
APPENDIX C - Estimation Of Aerosols Generated During RMCS Based Upon CGM In- Line Filter Paper Analyses
Summary of Method
This method of estimating RMCS aerosol quantities uses radionuclide assay data from in-line filter papers located upstream of continuous gas monitors (CGM) sampling the tank air for flammable gases during RMCS The radionuclide content of the filter paper is divided by the waste radionuclide specific activity and the air flow through the CGM to obtain an estimate of the average mass concentration in the tank head space during the time period the CGM is on Multiplying the estimated average tank head space mass concentration by the tank head space volume gives an estimate of the average mass of particulates in the tank head space during RMCS To obtain the mass per RMCS core or per RMCS segment sent to the exhauster the tank head space average mass concentration is multiplied by the volume of gas sent to the exhauster then multiplied by a correction factor to account for particulates in the head space removed by the exhauster when the CGM is not operating and divided by the number of RMCS cores or RMCS segments
Description
During most tank waste intrusive activities performed since 1996 an intrinsically safe CGM located above ground has been used to continually monitor the tank air for flammable gases during in-tank activities The CGM sampling method draws air directly from the tank head space During RMCS the CGM sampling line is placed in the tank dome space The sampling line is located between the sampling riser and the exhaust riser if practical A pump in the CGM draws tank air up through the line at 05 litmin for measurement of the lower flammability limit (LFL) by the CGM A filter paper is installed in the sampling line upstream of the CGM to protect the unit from internal contamination
Following CGM use the CGM filter papers are normally discarded after monitoring them in the field for contamination To help estimate the tank head space particulate levels during RMCS these filter papers were retained and analyzed in the 222-S laboratory following removal from all tanks in which RMCS was performed from the fall of 1997 through April 1999 Data were collected for the four tanks in SX farm in which RMCS was performed and the next four tanks on which the RMCS exhauster was deployed These tanks are listed in Table c-I Reported CGM Data
The CGM operational data used to estimate aerosol levels during RMCS includes CGM operating times CGM flow rates and filter paper analytical data A summary report containing all the field operating data sheets for CGM usage and lab data was prepared following completion of sampling on each tank for all tanks except TX- 113 For TX-I 13 a separate report was prepared following each core These reports are References CGM-I to CGM-9 The CGM data from these reports are provided in Table C-2
There were 14 CGM installations during RMCS when CGM filter papers were collected and analyzed Each of these installations had Csrdquorsquo total alpha and total beta quantities measured on the filter papers resulting in 42 data points Eight of the measurement results were very low and had errors of gt+-loo These values were not used resulting in a net of 34 data points for calculating average head space mass concentrations based upon CGM data
Calculated Tank Head Space Radionuclide Concentrations
To calculate the average tank head space radionuclide concentrations during RMCS the filter paper radionuclide quantities were first divided by an efficiency factor to account for radionuclides which may not have been captured on the paper This adjusted radionuclide value was divided by the volume of tank air passing through the paper to give the average tank head space radionuclide concentration
The efficiency used for most stack samplers onsite is 73 (see Appendix D) Estimates attached to References CGM-I to CGM-9 indicate the CGM filter paper sampling method used should have a sampling efficiency
c- 1
RPP-4826 Rev 1
exceeding 73 For conservatism a sampling efficiency of 50 was assumed in this document for the CGM filter paper method
The estimated Csrdquorsquo total alpha and total beta concentrations in the tank vapor space were calculated by dividing the radionuclide quantity on the filter paper from Table C-2 by the assumed CGM sampling efficiency of 05 and the volume of gas going to the CGM The volume of gas going to the CGM was calculated by multiplying the time of CGM operation from Table C-2 by the CGM flow rate of 500 mlmin For example the calculated SX- 101 head space C~rsquorsquo~concentration based upon analysis of the CGM filter papers used during RMCS of riser 19 is
[[26E-4 pCi + 051 + [[I755 min][500 mlmin]] = 59E-I0pCiml
All radionuclide concentrations were calculated in a similar fashion Results are given in Table C-3 Table C-3 lists the radionuclide concentrations for all 42 data points The eight radionuclide concentrations not used for estimating mass concentrations are noted
Table C-3 also contains the calculated number of tank head space changeouts by the tank exhauster during CGM operation Tank head space changeouts were calculated by multiplying the exhauster flow rates (in actin) from Table F-1 by the CGM run times from Table C-2 and dividing by the tank head space volumes from Table F-2 The number of tank head space changeouts during CGM operation was used when estimating the waste mass sent to the exhauster See Aerosol Calculations section below for explanation
Aerosol Calculations
Average tank head space mass concentrations based upon CGM filter paper data were calculated by dividing the head space radionuclide concentrations from Table C-3 by the waste specific activities for each tank sampled The waste specific activities used came from Table E-I and are listed again in Table C-I The average of the mass concentrations based upon radionuclide data for each tank was used as the average head space mass concentration for that tank For example the calculated SX-IO1 head space mass concentration analysis from the CGM filter papers used during RMCS of riser 19 is
[59E-10 pCi Csrdquorsquoml+ 112 pCi C S rdquo ~ ~ waste] [ 28317 mlftrsquo] = 1 SE-7 g wasteA3 based upon C S rdquo ~
[ I 7E-I I pCi T A M + 504E-1 pCi TAg waste] [ 283 17 mlftrsquo] = 94E-7 g wasteamprsquo based upon Total Alpha
[43E-9 pCi TBml+ 357 pCi TBg waste] [ 28317 mlArsquo] = 34E-7 g wastel based upon Total Beta
[ [ I 5E-7 + 94E-7 + 34E-7 g wasteArsquo] f 31 = 48E-7 g wasteamp
[48E-7 g wastelt ] [3531467 Arsquom3] = 17E-5 g wastemrsquo
All tank head space mass concentrations were calculated in the same manner The results are presented in Table C-4 The weighted average tank head space mass concentration during RMCS was based upon the number of RMCS segments taken for each data point
The average aerosol mass in the head space during RMCS was calculated by multiplying the average tank head space mass concentration by the tank head space volume from Table F-2 For the same data point as above
[48E-7 g waste Arsquo] [115E+5 Arsquo] = 55E-2 g waste in SX-IO1 head space during RMCS
All average mass quantities present in the tank head space during RMCS were calculated in the same manner using a spreadsheet The results are provided in Table C-4 The weighted average mass of waste in a tank head space in Table C-4 was calculated based upon the number of segments obtained for each data point
Estimation of the mass of waste sent to the exhauster per RMCS core or segment requires calculation of the total mass of waste sent to the exhauster Multiplying the average head space concentration during RMCS by the exhauster flow rate (in acfm) and the time of CGM operation will give the mass of waste sent to the exhauster during the CGM time frame only While the large majority of mass of waste aerosols will have exited the tank or
c -2
RPP-4826 Rev I
resettled by the time the CGM is shut off there could be some residual suspended particles remaining These would eventually pass to the exhauster but would not be picked up by the CGM filter since it was not in service An adjustment factor was used as described in the following paragraphs to account for particles that may exit to the exhauster following shut down of the CGM
Particulates are generated by RMCS when purge gas is blowing out the drill string and the bit is rotating under the waste surface This time averages about six minutes per segment Multiplying the number of RMCS segments per core by six minutes per segment and dividing by the number of minutes of CGM operation shows the creation of particulates will only occur during a nominal 3-4 of the time the CGM is operating During RMCS the normal practice is to install the CGM turn it on when personnel enter a tank farm and keep the unit in constant operation for the remainder of the shift When the portable RMCS exhauster is used the exhauster is normally started at least an hour before RMCS is initiated and kept in operation until it is time to halt operations for the week The SX exhauster is kept in constant operation Comparing exhauster operating times from Tables F-l with CGM operating times from Table C-I it can be seen the CGMs are in operation about 3-15 of the time the RMCS exhauster is operating on a tank This time comparison wasnrsquot estimated for the SX exhauster since the SX exhauster is in constant operation
With CGM operation much longer than the time period when particulates could be generated the majority of particulates generated by RMCS should have settled or been exhausted during the CGM operating period Table C-3 shows the tank head space changeouts made by the exhauster during CGM operating periods ranged from 084 to 63 The average was 24 With the CGMs operating 25-33 times longer than the aerosol generation periods and an average of over two tank head space changeouts during CGM operation the large majority of aerosols generated during RMCS will have settled out or been removed by the exhauster by the time the CGM is shut off To account for particulates remaining in the tank head space after the CGM was turned off that are subsequently removed by an exhauster it was conservatively assumed that 20 of the total mass of particles generated during RMCS were not removed from the tank head space during the CGM operating period Therefore the product of the tank head space concentration and the volume of air sent to the exhauster during the time of CGM operation was multiplied by a factor of 125 (lOOl80) to estimate the total mass of waste sent to the exhauster as a result of RMCS This is shown below for the same SX-IO1 riser 19 data point in the above calculations
[48E-7gA3] [IOOmin] [I755 min] [125]= 11E-l gwastetoexhauster
This value was divided by the number of RMCS cores and RMCS segments from Table C-1 to provide the grams per core and grams per segment in Table C-4 as follows
[ I I E- 1 g waste to exhauster] i 1 core = 11 E-I g wastelRMCS core to exhauster
and
[ 1 I E- 1 g waste to exhauster] + 5 segments = 2 I E-2 g wastelRMCS segment to exhauster
All mass per core and mass per segment values were calculated in the same manner using a spreadsheet The results are provided in Table C-4 The weighted average mass per core and mass per segment in Table C-4 were calculated based upon the number of cores or segments obtained for each data point
Summary of Calculations
There were 34 valid CGM filter paper data points from 14 RMCS CGM sampling periods in eight tanks during which I5 RMCS cores and 79 RMCS segments were obtained Based upon CGM filter paper data the results indicate that
The average tank head space mass concentration during RMCS was 4OE-5 g wastem3 The average mass of suspended solids in the tank head space during RMCS was 97E-2 g waste The average mass sent to the exhauster during RMCS was 18E-1 g wastelRMCS core The average mass sent to the exhauster during RMCS was 34E-2 g wastelRMCS segment
c - 3
RPP-4826 Rev 1
Ignoring all CGM filter paper analytical data points with a variance gtloo will result in conservative results These data points indicate negligible radioactivity was present If a value of zero was assigned to each data point with an analytical error of gtloo instead of ignoring the data point the weighted average particulate quantities in Table C-4 would be reduced by about 12
The average tank head space mass concentrations based upon CGM data will be higher than the average tank head space mass concentrations based upon filter housing NDA or dose rate The RMCS exhauster received tank air from the shifts when sampling was performed and during some of the off-shifts when no sampling was done The CGMs were only operated during the shifts when sampling was performed The air concentration drawn into the CGM and the RMCS exhauster should be roughly the came during the operating shifts but somewhat less during the off-shifts Therefore the tank head space concentration will be higher when based upon CGM data This does not impact the mass of waste sent to the exhauster per core or per segment
c -4
I
- ~
RFP-4826 Rev 1
APPENDIX D
ESTIMATION OF Rh4CS EXHAUSTER HOUSING DECONTAMINATION FACTOR
D-0
RFrsquoP-4826 Rev 1
APPENDIX D - Estimation of RMCS Exhauster Housing Decontamination Factor
Summary of Method
This Appendix estimates a Decontamination Factor (DF) for the RMCS exhausters using housing NDA data and applicable stack record sample data The Csrdquorsquo in the exhauster effluent is divided by the C S rdquo ~ in the exhauster inlet to provide a penetration efficiency The reciprocal ofthe penetration efficiency is the DF
Description
Each RMCS exhauster has an isokinetic sampler located on the stack downstream of the blower and HEPA filters A small pomp pulls air from the exhaust stack into a filter paper at a rate proportional to the exhaust flow Radionuclides in the exhaust stream passing through the sample line are caught on the filter paper The stack operating time and flow rate are recorded When the record sample filter paper is removed the filter paper is analyzed in a laboratory for radionuclides The radionuclide concentration in the stack effluent stream is calculated by dividing the quantity of material on the filter paper by the volume of air through the sampler and then dividing again by a factor to compensate for stack sampler and filter paper efficiency
Multiplying the total beta stack effluent concentration by the total off gas flow gives the total beta emissions from the exhauster The total beta emissions are multiplied by the Csrdquorsquo to total beta ratio for the waste in the tank) being exhausted to give an estimate of the C S rdquo ~ emission The C S rdquo ~ on the filters determined by NDA of the housing (see Appendix A) is added to the C S rdquo ~ emissions to give the total C S rdquo ~ input to the filter housing Dividing the emissions by the input gives the filter housing penetration efficiency Subtracting the penetration efficiency from 1 O gives the filter housing efficiency Dividing 1 O by the penetration efficiency gives the DF
RMCS Stack Record Sample Data
RMCS exhauster stack record samples are taken after completion of each sampling event on a tank Normally this is after all cores on that tank have been obtained but for BY-IO5 in 1998 record samples were taken following each core Record samples are also taken at the end of each year All samples are analyzed for total alpha and total beta At the end of each year all the filter papers for that year are composited and analyzed for individual radionuclides Sample results are entered into the Automated Bar Coding of Air Samples at Hanford (ABCASH) and Environmental Release Summary (ERS) databases Several ofthe filter papers from 1998 were reanalyzed using a longer count time to bring the error rate down
Schofield 2000b compiled and evaluated all available RMCS exhauster stack record sample data filtered out the unusable data provided derivation for the stack sampling efficiency factor and summarized the results Most of the data points were so low as to be unusable since the results were either negative or had error variances gtloo
Column 5 of Table D-1 provides the stack effluent concentrations used for calculation of the filter housing DF The stack effluent data in Table D-l come from Schofield 2000b These values include a 073 sampling efficiency factor
Calculation of RMCS Filter Housing Decontamination Factor Based upon Housing Inlet and Outlet Data
The RMCS exhauster housing NDA and stack record sample data available for exhauster Operating Periods 4 5 and 6 were used to estimate an actual DF for the RMCS exhauster housings The housing NDA data is for CSrdquo~ but there are no usable Csrdquorsquo concentrations for the RMCS exhauster outlet The RMCS exhauster stack Csrsquordquo concentrations are either negative have a variance gtloo or are not available Total beta analyses are available however so the stack eftluent C S rdquo ~ concentrations were estimated by multiplying the total beta concentration by the ratio of Csrdquorsquo to total beta in the tank waste
Column 2 of Table D-l lists the increase in CSrsquo~ on the filters for each operating period as determined by NDA This data was obtained from Table A-2
D- 1
RPP-4826 Rev 1
Column 4 of Table D-l lists the stack exhaust volume for each stack record sample period The stack exhaust volume for the exhauster installation on S-l IO was calculated by
[ZOO std ft3min][15978 hrs] [60 minhr] = 199E+6 std ftrsquo
All other stack volumes in Table D-l were calculated the same way Unlike in Appendices A B and C no adjustment was made to change the 200 scfm to actual cfm This is because the RMCS stack record sample concentrations from Table D-3 are based upon a 200 scfm flow rate rather than the actual flow rate Since the concentrations are on the same basis as the flow rate there is no need to correct to acfm
The total beta emissions for the RMCS exhauster stack were calculated by multiplying the volume by the concentration For the same S-l IO data point
[199E+6 ft3] [18E-15 pCiml] [28317mlft3] [mCi1000 pCi] = 1OE-7 mCi total beta
All other total beta emissions in Table D-l were calculated the same way
The Csrdquorsquo to total beta ratio was calculated from data in Table E-I For the same S- l I O data point
326E+5 Ci CsI3rsquo f I 14E+6 Ci total beta = 029 Ci CslhCi total beta = 029 rnCi CsrdquorsquomCi total beta
The Csrsquordquo emission for the same S-l IO data point was thus
[I OE-7 mCi total beta] [029 mCi CsrdquorsquomCi total beta] = 29E-8 mCi Csrdquorsquo
All Csrsquordquo emissions in Table D-l were calculated in the same manner
The penetration efficiency for each operating period was calculated by dividing the exhauster outlet by the filter inlet Csrdquorsquo quantities For operating period 4 this was
[81E-6 mCi] f [5OE-I + 8IE-6 mCi] = 16E-5 = 16E-3
The DF for operating period 4 is
1 + 16E-5 = 62E+4
The overall DF for periods 4 5 and 6 was calculated by dividing the efluent from all three periods by the total filter input
[95E-6 mCi] f [67E-I t 95E-6 mCi] = 14E-5 = 14E-3 penetration efficiency
I - I 4E-5 = 0999986 = 999986 filter efficiency
1 f 14E-5 = 73E+4 decontamination factor based upon housing inlet and eftluent data
Estimation of Housing Decontamination Factor Based upon General Performance Data
HEPA filters are tested at the manufacturer to a minimum 9997 efficiency using a 03 pm monodisperse aerosol After installation HEPA filters are tested in-place per ASME N5 I O to a minimum 9995 efficiency using a polydisperse aerosol with an approximate droplet size distribution of 99 less than 30 pm 50 less than 07 pm and 10 less than 04 pm The RMCS exhauster housing is tested per ASME N510 and is thus required to have a minimum removal eficiency of 9995 for an aerosol with this approximate size distribution The particle size distribution of the waste aerosols generated by RMCS is unknown but it is assumed that the removal efficiency for RMCS generated aerosols was the same as the removal efficiency for the ASME generated test aerosol
D-2
RPP-4826 Rev I
A 9995 efficiency is equivalent to a DF of 2E+3 while a 9997 efficiency is equivalent to a DF of 33E+3 The actual DF for the RMCS exhauster housing is higher than either of these It has two HEPA filters in series even though the minimum efficiency specified in the NOCs for the RMCS exhausters is only equivalent to one HEPA ERDA 1976 recommends using a DF of 3000rdquo for a filter bank where n is the number of HEPA filters in series This would result in a DF of 9E+6 for the RMCS exhauster housing This is unrealistic Using a DF of 9E+6 will calculate to Csrdquorsquo quantities on the HEPA filtersthat are orders of magnitude above what have been shown to be there based upon the measured dose rates and NDA A DF of 9E+6 would mean the dose rate would have to be almost 100 mRhr at the side of the exhauster housing instead of the 05-08 mRhr dose rates encountered The waste particles will not have the same particle size distribution entering the second HEPA filter as when entering the first The majority of the waste particles will be captured on the I rdquo HEPA filter and although the DF for each HEPA if tested individually using the ASME N5 IO aerosol test method may be 3E+3 (or higher) the overall DF of the two filters in series will not be 3000lsquo This is because the particle size distribution entering the Znd HEPA could have a greater percentage of smaller particles than that entering the 1rdquo
NUREG 1995 included an evaluation of a number of different facility stacks at the Hanford site where the HEPA filter upstream air concentrations were estimated using several different methods This report concluded that back-calculation using a value of 3000rdquo overestimated the upstream radionuclide concentration by three to four orders of magnitude when compared to filter NDA data for the nine stacks for which NDA data were obtained and by three orders of magnitude for the two stacks for which upstream air sample data were available Back- calculation using a value of 3000rdquo was shown to be high by four orders of magnitude for the single stack for which a powder release estimate was available Based upon this information the RMCS exhauster dual filter-in-series housings would have a DF of at least three and maybe four orders of magnitude less than 9E+6 or in the 1E+3 to 1 E+4 range A DF of IE+3 would he less than the minimum permissible under the NOC Comparing the older stack data and design with the newer RMCS exhauster design the minimum DF would be expected to be at least 1E+4
Table D-2 provides the available RMCS exhauster aerosol test data This information was obtained from Waldo 1999 Prior to 1998 the RMCS exhauster primary HEPA filter efficiency and either the secondaly HEPA filter or the overall efficiency for both filters were tested Starting in 1998 only the primary and secondary HEPA filter efficiency were measured The overall efficiency of the two filters in series was only measured three times in 11 setups Twice the overall penetration efficiency was lt0002 and the remaining time the only information that could be found was a value of lt005 Most individual filters had a penetration efficiency of 0002 This appears to be about the limit of the detection equipment Based upon Table D-2 data a penetration efficiency of 0002 (99998 efficiency) is normal for a single HEPA and thus a minimum for an RMCS exhauster housing Assuming a 0002 penetration efficiency for the two filters combined calculates to a DF of 5E+4 (equal to 1 +
000002) for the RMCS exhauster housing
In summary the measured DF for the RMCS exhauster housings over the period from May 1998 through June 1999 was about 73E+4 RMCS aerosol testing prior to use indicates a DF of about 5OE+4 for each of the filters separately but their overall efficiency is not measured Referenced data based on older stacks at Hanford indicate the two HEPA RMCS exhauster housing would likely have a DF of at least IE+4
Estimated Aerosol Levels During RMCS Based Upon RMCS Stack Record Sample Data
Revision 0 of this document used the positive record sample results with variance less than 100 to estimate aerosol concentrations in the exhauster inlet using an assumed exhauster housing DF of 5OE+4 This method of estimating aerosols was eliminated from Revision 1 because the stack concentrations were either too low too scattered or too questionable to provide reliable results There were 112 RMCS stack record sample data points evaluated in Schofield 2000b Excluding the total beta sample results used for estimation of the housing DF there were only ten data points remaining with positive values and variances ltloo the remaining data points were either negative had a variance gtloo or the results were not available
For comparison purposes only Schofield 2000b applied the DF of 73E+4 calculated in this document to the data points not used to calculate the exhauster housing DF to estimate aerosol concentrations upstream of the filters The results showed aerosol levels approximately the same as those estimated using NDA dose rate or CGM filter paper data when a value of zero was used for negative sample results or those with a variance gtloo When only
D-3
RPP-4826 Rev 1
the ten positive results with a variance ltloo were used the aerosol levels calculated to be two to five times higher than those estimated using NDA dose rate or CGM filter paper data Because of the variability of data resulting from the extremely low record sample concentrations and the few useable data points estimation of aerosol levels using record sample data was not included in Revision I See Schofield 2000b for further discussion of the use of record sample data to estimate aerosol levels
Summary of Calculations
A total of nine RMCS exhauster stack record sample data points were used to estimate the RMCS exhauster filter housing decontamination factor These data points were obtained when sampling on five tanks during which 10 RMCS cores and 65 RMCS segments were obtained The overall decontamination factor was 73E+4
Estimation of aerosol generation quantities based upon RMCS stack record sample data is possible However results will likely be skewed high if data points that show non-detectable levels of radionuclides present are ignored instead of using a value of zero for the data point
D-4
RPP-4826 Rev 1
APPENDIX E
TANK WASTE RADIONUCLIDE CONCENTRATIONS USED FOR AEROSOL CALCULATIONS
E-0
RPP-4826 Rev 1
APPENDIX E - Tank Waste Radionuclide Concentrations Used for Aerosol Calculations
The RMCS exhauster NDA data HEPA filter dose rate data CGM filter paper data and stack record sample data provide information on the quantity of radionuclides on the exhauster filters in the tank head space or the exhauster stack during RMCS These radioactivity quantities need to be divided by the waste radionuclide concentration specific activity to determine the mass of waste in the tank head space and in the tank gases sent to the exhauster
The mass quantities in this document were calculated using dry basis radionuclide concentrations Waste particles carried into the tank head space by the purge gas could be wet or dry If wet some of the non-chemically bound water will start to evaporate immediately providing the tank relative humidity is 400 The water present in a waste particle may be chemically bound as a hydrate or free The chemically bound water will not readily evaporate therefore even a ldquodryrdquo particle may have some water associated with it It is impractical to measure the actual water content of the waste particulates caught on the CGM filter paper the exhauster HEPA filters or the stack record sample paper Since the quantity of water in the waste particulates is unknown particulate levels were calculated using dry basis radionuclide concentrations Thus all particulate values given in this document are stated on a dry basis
The waste radionuclide concentrations on a dry basis were calculated from data available in the Tank Waste Information Network System (TWINS) The Best Basis InventorylBest Basis Summary numbers were used These values are the most complete and up to date readily available estimates for Hanford waste tank contents but do not include water The information was downloaded from TWINS into a spreadsheet The total chemical total beta and total alpha quantities were summed in the spreadsheet for all the tanks which were sampled and concentrations for Csrdquorsquo Sr9rsquo total beta and total alpha automatically calculated in pCig These concentrations are provided in Table E-I Because lab techniques for measuring gross beta levels only detect beta particles with a minimum decay energy above 150-200 kev only radionuclides with a decay energy of gt-200 kev were included in the total beta numbers
The TWINS radionuclide concentrations were obtained in December 1999 No corrections were made for decay for this document
The CGM filter paper and stack record sample data indicate the measured radionuclide values are not always in the same ratio to each other as given by TWINS nor are all radionuclides detected that TWINS indicates are present Radionuclides can be distributed unevenly in a tank Soluble fission products (primarily Csrsquordquo) are found in the liquid saltcake and in sludges Insoluble fission products and actinides are found largely in sludges as these are primarily chemical precipitates Sludge could be mixed with saltcake be present in a distinct layer at the bottom of a tank or in several layers in the tank depending upon how waste was transferred into a tank Waste particles may thus not have the same specific activity on a microscopic scale as they would have on a macro scale were the tank contents homogenized During RMCS a top to bottom core sample is attempted resulting in the drill bit and purge gas (which causes aerosols to form) passing through most ofthe waste matrix Assuming the aerosol generation rate is approximately constant during drilling the specific activity of a radionuclide in the suspended solids should be roughly the same as the average specific activity of the same radionuclide in the tank waste While the waste specific activity is probably not homogeneous from top to bottom in a tank and the aerosol generation rate will likely also vary it is beyond the scope of this document to provide an in-depth analysis of all the factors affecting aerosol radionuclide concentration Although sample radionuclide data were not always in the same ratio as provided by TWINS for the purpose of this document the simplifying assumption was made that the average tank specific activity is adequate to provide an approximation of the suspended solids specific activity for all radionuclides Average tank individual radionuclide specific activities were used in the preparation of the exhauster NOCs
The aerosol calculations presented in this document are only as accurate as the TWINS data The combined radionuclide content of all Hanford waste tanks is known fairly well since the overall content is based upon reactor production records CsrdquorsquoSrW recovery data and processing plant discharges Thus TWINS data for all tanks combined should be reasonable There are undoubtedly differences between TWINS data and the actual contents of a specific tank While the specific tank radionuclide data from TWINS used in this document may not be exact deviations from the actual concentrations are assumed to balance out over the number of tanks sampled
E- 1
RPP-4826 Rev 1
APPENDIX F
ROTARY MODE CORE SAMPLING EXHAUSTER AND CORE SAMPLE DATA
F-0
RPP-4826 Rev 1
APPENDIX F - Rotary Mode Core Sampling Exhauster and Core Sample Data
This appendix provides the basic data obtained during RMCS operations which was used in preparation of this document
Basic Operational Data
There have been three RMCS exhausters and three RMCS sampling trucks deployed since starmp of nitrogen- purged RMCS in November 1994 The exhausters are formally designated 296-P-32296-P-33 and 296-P-34 These were originally referred to as parts of RMCS Systems 2 3 and 4 respectively in the Notices of Construction (NOC) for these units The exhauster designations were changed for routine field use in 1996 to exhausters A B and C to avoid confusion with core sampling trucks 23 and 4 since any exhauster could be used with any RMCS truck Exhauster A (2) and RMCS Truck2 have not been used for RMCS since 1995 and are no longer in service for core sampling
Rotary mode core sampling has been conducted in four general time frames since 1994 These time frames were separated by down times for equipment modifications or resolution of environmental permitting and safety concerns For ease of analysis in this document exhauster operations were organized into six distinct operating periods Periods I to 6 were grouped based upon times when the same exhauster and same set of HEPA filters were being used These periods thus overlap with the general operating time frames The four operating time frames were
The first time frame lasted from November 1994 to January 1995 RMCS Truck 2 and Exhauster 2 (A) were used on Tank BY-106 along with an in-tank prefilter This tank provided the initial deployment and testing of the nitrogen-purged equipment in a waste tank During this period radiation dose rates were taken at the side of the exhauster housing Stack record samples were taken in December 1994 and January 1995
The second time frame lasted from July 1995 through October 1995 RMCS Trucks 2 and 4 were used with Exhausters 2 and 3 (A and B) on BY-105 BY-IO8 and BY-I IO During this period radiation dose rates were taken at the sides of the exhauster housings Stack record samples were taken after completion of sampling on each tank No RMCS samples were taken from BY-108 all samples were taken in push mode for this tank
The third time frame began when RMCS was restarted in December 1997 Trucks 3 and 4 were used for sampling of SX-101 SX-103 SX-105 and SX-102 with the SX tank farm exhauster providing ventilation The RMCS exhausters were not used During this period radiation dose rates were taken at the sides of the SX exhauster housing as part of HPT routine surveys SX farm exhauster stack record samples were taken when required by normal operating procedures SX record sampler and filter housing dose rate data were not evaluated for this document It would not be practical using filter dose rate or stack record sample data to estimate the RMCS aerosol addition if any to the SX ventilation system The background radiation around the SX filter housing makes measurement of any small increase in dose rate very difficult to detect The number of tanks being ventilated and the involved off-gas header routings (the exhauster is pulling on thirteen tanks in series or in parallel with the tank being sampled) and any in-tank activities in the SX tanks not being sampled would make it impractical to assess what aerosols resulted from RMCS Beginning with RMCS in SX farm radionuclide analyses were performed on the filter papers protecting the CGMs which draw air out of the tank vapor space for flammable gas detection
The fourth time frame began in May 1998 Between 1095 and 598 Exhausters B and C were extensively modified with new filter housings and other equipment to meet new NOC requirements Trucks 3 and 4 were used with Exhausters B and C (3 and 4) on S-l IO U-107 BY-105 TX-113 and TX-I 18 This period marked the first use ofthe RMCS trucks and RMCS exhausters together following resolution of flammable gas concerns and modifications to the exhausters New filters were installed Radiation dose rates were taken at the sides of the exhauster housings Stack record samples
F- 1
RPP-4826 Rev I
were taken after completion of sampling for each exhauster installation Radionuclide analyses were performed on the CGM filter papers for all tanks except TX-118 An NDA was performed on the Exhauster C housing following completion ofthe first core on TX-I 13 The housing filters when assayed contained aerosols captured by the exhauster following RMCS in S-l IO U-107 BY-105 (1998) and the first core of TX-I 13 Another NDA was performed on Exhauster C following both cores in TX-I 18 An NDA was performed following sampling of the second core in TX-I 13 using Exhauster B The time frame ran through early June 1999 No RMCS samples have been taken after June 1999 nor are any planned for the next few years
For the purposes of evaluating aerosol formation based upon RMCS exhauster housing NDA and dose rate data the exhauster operations were grouped into 6 operating periods These periods are shown in Table F-1 and restated in Tables A-I and B-I All tanks sampled in Periods 1 2 4 5 and 6 were exhausted by the same exhauster with the same housing and filters present during that period Period 3 covered the time the SX exhauster was used during RMCS in SX farm
A brief description of each RMCS tank sampling operation is provided below
Tank 241-BY-1061194 to 1294 RMCS using the nitrogen purge gas system with an exhauster was formally begun on 111794 on tank BY-106 riser IOB Exhauster 2 (A)and Truck 2 were used A sintered metal prefilter was inserted in the riser between the tank and the exhauster A total of eight segments were taken in rotary mode and five segments in push mode until sampling was halted on 122194 One RMCS core was obtained The total exhauster run time was 4878 hours The stack record sample was removed and analyzed following this run period Dose rates taken at the side of the exhauster housing during RMCS were all lt05 mRhr The in-tank prefilter was smeared for contamination when removed from the tank with the smears showing less than detectable levels of radionuclides present (Waldo 1999) The prefilter had been washed with an installed spray system prior to removal from the tank but subsequent testing showed the water flow and pressure were too low to have been effective at removing contamination
Tank 241-BY-106195 Following some process modifications RMCS in BY-IO6 riser IOB began again on 11895 Exhauster 2 (A) and Truck 2 were used The sintered metal prefilter was inserted in the riser between the tank and the exhauster RMCS was halted on 12495 over authorization basis and equipment operability issues for RMCS A total of three segments were taken in rotary mode and eleven segments in push mode One RMCS core was obtained The total exhauster run time was 1867 hours The stack record sample was removed and analyzed following this run period Dose rates taken at the side of the exhauster housing during RMCS were all lt O S mRhr The in-tank prefilter was smeared for contamination when removed from the tank with the smears showing less than detectable levels of radionuclides present (Waldo 1999) The prefilter was not washed this time
Tank 241-BY-110795 to 1095 Following resolution of RMCS authorization basis and equipment issues and completion of the fabrication and testing of Trucks 3 and 4 RMCS was begun in BY-I IO on 71195 Exhauster 2 (A) and Truck 2 were used Samples were taken from risers 128 7 128 again and 4 There was no in- tank prefilter used in this or any subsequent RMCS periods Sampling was performed until 102595 when RMCS was halted over flammable gas issues A total of 13 RMCS segments and 56 PMCS segments were taken Three RMCS cores were obtained The total exhauster run time was 1125 hours The stack record sample was removed and analyzed following this run period Dose rates taken at the side of the exhauster housing during RMCS were all lt O S mRhr
Tank 241-BY-108795 to 895 Core sampling was begun in BY-IO8 on 72595 Exhauster 3 (B) and Truck 4 were used Sampling was done in risers 12A and 7 The tank material proved soft enough so that no RMCS segments were required all segments were obtained in push mode although the exhauster was operated during part of the time sampling was performed Sampling was completed 81895 A total of 16 PMCS segments were taken The total exhauster run time was 6617 hours The stack record sample was removed and
F-2
RPP-4826 Rev 1
analyzed following this run period Dose rates taken at the side of the exhauster housing during RMCS were all lt05 mRhr
Tank 241-BY-105895 to 1095 RMCS was begun in BY-I05 riser 12A on 83095 Exhauster 3 (B) and Truck 4 were used This tank has a concrete layer on top about 12-18 inches thick which had to be drilled through Part way through sampling questions arose as to the flammable gas status of the tank and RMCS was halted on 10695 A total of 3 RMCS and 7 PMCS segments were taken One RMCS core was obtained The total exhauster run time was 4413 hours The stack record sample was removed and analyzed following this run period Dose rates taken at the side of the exhauster housing during RMCS were all lt05 mRhr
Tank 241-SX-1011297 to 298 Following resolution of extensive regulatory and authorization basis issues and installation of equipment modifications RMCS started in SX-101 with Truck 4 on 12497 An RMCS exhauster was not used since all SX farm tanks excluding SX-113 and SX-I 15 are ventilated with the SX exhauster Sampling was performed in risers 19 and 4 and was completed on 21098 A total of 9 RMCS and 6 PMCS segments were taken Two RMCS cores were obtained SX exhauster stack record samples and filter housing dose rates were obtained as part of routine operations for the SX exhauster not as part of the RMCS process Filter papers used in the suction line for the CGM were saved and analyzed in the laboratory to estimate the airborne radionuclide concentration in the tank head space Two CGM filter papers were needed for each core as moisture in the tank vapors condensed on the papers in the cold weather and began to restrict tank gas flow to the CGM
Tank 241-SX-103498 to 598 RMCS started in SX-103 with Truck 4 on 42798 The SX exhauster was used for ventilation (see SX- 101 above) Sampling was performed in risers 7 and 1 1 and was completed on 51198 A total of 6 RMCS and 18 PMCS segments were taken Two RMCS cores were obtained During sampling filter papers used in the suction line for the CGM were saved and analyzed in the laboratory to estimate the airborne radionuclide concentration in the tank head space One CGM filter paper was used during each core SX exhauster stack record samples and filter housing dose rates were obtained as part of routine operations for the SX exhauster not as part of the RMCS process
Tank 241-SX-105298 to 598 RMCS started in SX-105 with Truck 3 on 22598 The SX exhauster was used for ventilation (see SX- 101 above) Sampling was performed in risers 6 and 14 and was completed on 51598 A total of 6 RMCS and 20 PMCS segments were taken Two RMCS cores were obtained During sampling filter papers used in the suction line for the CGM were saved and analyzed in the laboratory to estimate the airborne radionuclide concentration in the tank head space Two filter papers were needed for the first core as moisture in the tank vapors condensed on the papers in the cold weather and began to restrict tank gas flow to the CGM One filter paper was used for the second core SX exhauster stack record samples and filter housing dose rates were obtained as part of routine operations for the SX exhauster not as part of the RMCS process
Tank 241-SX-102698 to 798 RMCS started in SX-102 with Truck 4 on 61798 The SX exhauster was used for ventilation (see SX- 101 above) Sampling was performed in risers 8 and 4 and was completed on 7798 A total of 2 RMCS and I8 PMCS segments were taken Two RMCS cores were obtained During sampling filter papers used in the suction line for the CGM were saved and analyzed in the laboratory to estimate the airborne radionuclide concentration in the tank head space One filter paper was used for each core SX exhauster stack record samples and filter housing dose rates were obtained as part of routine operations for the SX exhauster not as part of the RMCS process
Tank 241-S-110598 to 698 RMCS was begun in S-I10 on 51898 Exhauster C (4) and Truck 3 were used This tank marked the first use of an RMCS exhauster since 1995 Sampling was completed on 6498 Risers 6 and 14 were sampled A total of IO RMCS and 8 PMCS segments were taken Two RMCS cores were obtained The
F-3
RPP-4826 Rev I
total exhauster run time was 15978 hours The stack record sample was removed and analyzed following this run period Dose rates taken at the side of the exhauster housing during RMCS were all lt05 mRhr During sampling filter papers used in the suction line for the CGM were saved and analyzed in the laboratory to estimate the airborne radionuclide concentration in the tank head space One filter paper was used for each core Waste particles retained on the exhauster housing filters were part of the inventory subsequently measured by NDA following completion of the first core in TX-I 13
Tank 241-U-107698 to 798 RMCS was begun in U-107 on 61098 Exhauster C and Trucks 3 and 4 were used Sampling was completed on 71598 Risers 7 and 2 were sampled A total of IO RMCS and 19 PMCS segments were taken Two RMCS cores were obtained The total exhauster run time was 27385 hours The stack record sample was removed and analyzed following this run period Dose rates taken at the side of the exhauster housing during RMCS were all 105 mRihr During sampling filter papers used in the suction line for the CGM were saved and analyzed in the laboratory to estimate the airborne radionuclide concentration in the tank head space One filter paper was used for each core Waste particles retained on the exhauster housing filters were part of the inventory subsequently measured by NDA following completion of the first core in TX-I 13
Tank 24l-BY-105798 to 898 RMCS was begun in BY-105 again on 72298 Exhauster C and Trucks 3 and 4 were used Sampling was completed on 82598 Risers 7 and 1 1 B were sampled A total of 18 RMCS and 18 PMCS segments were taken The material was hard enough to require rotary mode sampling all the way to the bottom of the waste but negligible recovery was obtained After RMCS was performed to the waste bottom a PMCS core was taken in the same hole to recover material Two RMCS cores were obtained The exhauster run time was 13577 hours for the first RMCS core and 30792 hours for the second RMCS core Stack record sample information in ABCASH shows 30558 hours operation for the second core but the sampler data sheet shows the time counter was mistakenly reset 234 hours into the run No correction was made to the BY-IO5 2nd core record sample concentration for this document since the error is conservative and results in only slightly higher (ltI) record sample radionuclide concentrations for this core A stack record sample was removed and analyzed following each core giving two record samples for BY-IO5 in 1998 Dose rates taken at the side of the exhauster housing during RMCS were almost all lt05 m R h but a few readings indicated 07 mRihr This variation was assumed due to personnel reading the instrument differently or the fact that the exhauster had been used on enough tanks that by now there was sufficient activity on the filters to cause readings approximately at the background detection level The final reading when both cores were completed was lt05 m R h During sampling filter papers used in the suction line for the CGM were saved and analyzed in the laboratory to estimate the airborne radionuclide concentration in the tank head space One filter paper was used for each core Waste particles retained on the exhauster housing filters were part of the inventory subsequently measured by NDA following completion of the first core in TX-113
Tank 241-TX-113998 to 599 Core sampling was begun in TX-I 13 riser 3 on 92298 Exhauster B (3) and Truck 4 were used at the start This was the first use of Exhauster B since it was modified Exhauster B ran for a total of 8738 hours until being disconnected on 102398 During this time two PMCS segments were taken and no RMCS segments Exhauster C was then installed and operated for 5598 hours from 121098 to 122898 No RMCS or PMCS sampling was performed during this time frame RMCS segments werent taken until 299 Exhauster C ran for a 30230 hours between 122898 and 21299 Sampling was completed on the core from riser 3 on 21299 A total of 12 RMCS segments were obtained during the time Exhauster C was operating Exhauster flow rate for both exhausters was a nominal 200 scfm Stack record samples were taken following Exhauster B removal at the end of 1998 for Exhauster C and following completion ofthe first core with Exhauster C Aerosol calculations were based on only the 30230 hours run time for Exhauster C in 1999 since this was the time period during which RMCS segments were obtained Dose rates taken at the side of the exhauster housing during the short PMCS only sampling period with Exhauster B were all ltOS m R h Dose rates with Exhauster C varied between lt O S mRhr and 07 mRhr The final reading on Exhauster C following completion of the first core was 07 mFUhr During sampling filter papers used in the suction line for the CGM were saved and
F-4
RPP-4826 Rev I
analyzed in the laboratory to estimate the airborne radionuclide concentration in the tank head space One filter paper was used for the core Waste particles retained on the exhauster housing filters were part of the inventory subsequently measured by NDA following completion of this core
Sampling in riser 5 was begun on 41299 using Exhauster B and Truck 3 A total of 6 RMCS and 1 PMCS segments were taken for this core before sampling was halted on 42899 The total exhauster run time for this core was 11712 hours Problems with high vacuum in the tank required the exhauster flow rate to be reduced to 190 scfm to keep the system within pressure limits The stack record sample for the second core was removed and analyzed following the run period Dose rates taken at the side of the exhauster housing during the second core were all lt05 m M r During sampling filter papers used in the suction line for the CGM were saved and analyzed in the laboratory to estimate the airborne radionuclide concentration in the tank head space One filter paper was used An NDA was performed on the exhauster housing following this core The only radionuclides present in the housing were those from this core or what was removed from the tank head space during the non-RMCS activities in this tank from 92298 and 102398
Some clarification may be needed to explain use of the exhauster operating times and NDA dose rate and record sample data obtained during core sampling on TX-I 13 Core sampling was set up for sampling riser 3 on TX-113 in September 1998 with Exhauster B Exhauster B operated for a total of 8738 hours between 92298 and 102298 The stack record sample was removed at the end of this period The ERS database incorrectly shows the exhauster operated between 111698 and 111998 The ABCASH database shows the stack record sample was removed on 111998 The stack record sample showed positive emuent concentrations during this time period with variances 400 No RMCS samples were taken during this period so the data and time werenrsquot included when calculating RMCS aerosol numbers Exhauster B was removed and Exhauster C installed in late November-early December Exhauster C was operated for a total of 5559 hours between 121098 and 122398 The stack record sample was removed on 122898 No sampling was performed during this period so the data and time werenrsquot included when calculating RMCS aerosol numbers Exhauster C was operated for a total of 30218 hours between 122898 and 2899 All the RMCS segments from riser 3 were taken in this time period so only the data and time for this period were included when calculating RMCS aerosol numbers Exhauster B was used during sampling of riser 5 Exhauster B operated for a total of 11712 hours between 41299 and 42899
Tank 241-TX-l18599 to 699 RMCS was begun in TX-I 18 on 5699 Exhauster C (4) and Truck 4 were used Sampling was completed on 6298 Risers 9B and 12B were sampled A total of 9 RMCS segments were taken there were no PMCS segments Two RMCS cores were obtained The total exhauster run time was 21247 hours The stack record sample was removed and analyzed following this run period The maximum dose rate taken at the side of the exhauster housing following RMCS was 08 m M r CGM filter papers were not analyzed An NDA was performed on the exhauster housing following completion of the two cores The exhauster housing contained the same nuclides as for the first NDA (S-110 U-107 BY-105 and TX-I 13 first core) plus those from TX-I 18
The basic core sampling operational data used in this document includes the number of RMCS cores and segments the exhauster run times and flow rates the RMCS exhauster HEPA filter dose rates and tank vapor space temperatures Table F-l lists the basic operational data This information excluding tank vapor space temperature data was obtained from procedural data sheets in the sampling work packages (References W - 1 to WP-23)
Tank temperature data for the tanks ventilated with the RMCS exhausters was obtained from the TWINS database Plots for each tank were prepared for the time RMCS was conducted and the average value of the highest thermocouple located in the tank (the lowest temperature reading) was estimated and used as the average tank head space temperature during the RMCS period
The SX exhauster flow rates listed in Table F-l are estimates only The combined flow rate for SX-IO1 through SX-106 plus SX-109 (7 tanks) averaged 440 cfm during CY 1996 (Kaiser 1997) for an average of 63 cfm per
F-5
RPP-4826 Rev I
tank Based upon inlet flow measurements at the tank inlet HEPA filters (Fanis 1998) the flow through each individual tank (SX-IO1 through SX-106 plus SX-109) was lt55 cfm at the breather filter Assuming an exhaust flow of 100 cfm for each SX farm tank sampled is therefore conservative
Calculated Data
Calculated data include the tank head space volumes conversion of the RMCS exhauster flow rate from scfm to acfm and the number of tank head space changeouts made by an exhauster during RMCS
Tank head space volume includes the dome space volume above the top of the sidewall plus the void space between the waste surface and the top of the sidewall The formula used to calculate tank head space volumes WN
Head Space Volume in A = (DS + [(H) (12) + HI + Hb - H] (V)) - 748
Where DS = dome space volume gal H = height of tank body sidewall above knuckle A HI = height of tank knuckle area in Hb = height oftank bottom below knuckle in H = height of waste in tank in V =27555 galin of waste in SX tanks 2754 gallin in all others
The tank dome space volumes height of tank sidewall above the knuckle height of tank knuckle area and height of tank bottom below the knuckle were obtained from Reynolds 1999 The height of waste in each tank at the time of core sampling was obtained from the TWINS database Tank dimensional and waste level data are given in Table F-2 along with the calculated tank head space volumes
Aerosol calculations for Appendices A-C require exhauster flow rates in actual cubic feet per minute The RMCS exhauster flow rate is controlled and recorded in standard cubic feet per minute The mass flow rate of the exhauster air is measured and internal logic in the exhauster controller calculates what the volumetric flow rate would be if the temperature and pressure in the exhauster inlet were at standard conditions The standard conditions used in the logic controller are 29921 in Hg (760 mm Hg) and 69F (ZIT)
A correction factor is built into the exhauster control logic that assumes an atmospheric pressure of 2927 in Hg the average atmospheric pressure at Hanford The RMCS exhauster will operate at about 1-2 in H20 negative pressure resulting in about a 2916 in Hg pressure in a waste tank when the RMCS exhauster is operating To revise the indicated scfm RMCS exhauster reading to an acfm value the RMCS exhauster scfm flaw rate was multiplied by (29922916)(T+459)528 where Tis the tank head space temperature in OF The tank head space temperatures in Table F-1 were input to the spreadsheet file used for aerosol calculations and converted to acfm The flow rates in acfm are included in Table F-I
The tank head space changeouts when using the RMCS exhauster were calculated by multiplying the exhauster acfm flow rate by the time of exhauster operation and dividing the result by the tank head space volume Tank head space changeouts are listed in Table F-2
F-6
c
gt 2
RPP-4826 Rev 1
APPENDIX G
REFERENCES
G-0
RPP-4826 Rev 1
APPENDIX G - References
Diedeker 1999 NDA of RMCS HEPA Filters L P Diedeker WMH E-Mail to JS Schofield CHG November 29 I999
ERDA 1976 Nuclear Air Cleaning Handbook ERDA 76-21 Buchsted C A Fuller A B and Kahn 1 E Oak Ridge National Laboratory 1976
Farris 1998 Internal Note T R Farris LMHC to J S Schofield LMHC Breather Filter Flow Rates for SX-Farm 31698
Foust 1999 Internal Memo RMCST Exhauster HEPA Filter Dose Rate Calculations D J Foust LMHC to J S Schofield LMHC October 25 1999
Greager 1999 Correspondence No WMH-9954450 Non-Destructive Analysis of the Rotay Mode Core Sample High-Efjiciency Particulate Air Filters E M Greager WMH to P C Miller LMHC June 28 1999 [Transmittal of HNF-4199 Resultsfram NDA Measurement of the 296-P-34 RMCS HEPA Filters]
HNF 1999 HNF-SD-WM-SAR-067 Tank Waste Remediation System Final Safety Analysis Report Rev 1 The revision incorporating RMCS accident analyses was submitted as Addendum 5 to DOE as a change to the FSAR predecessor the Basis for Interim Operation (BIO) LMHC-9857075 80232764-9-KOOl Submittal of Authorization Basis Amendment Package for Rotay and Push Mode Core Sampling in Satisfaction of Perfarmance Agreement TWR 122 Expectations I and 3 D 1 Allen LMHC to A M Umek FDH August 30 1998 Addendum 5 as of mid-January 2000 is waiting for approval by DOE
Kaiser 1997 T D Kaiser LMHC E-Mail to J S Schofield LMHC SX Tank Flow Data 42197
NUREG 1995 Potential Radionuclide Emissionsfrom Stacks on the HanfordSite Part I Dose Assessment Davis W E and Barnett J M Westinghouse Hanford Company from Proceedings of the 23 DOEMRC Nuclear Air Cleaning Conference held July 25-28 1994 February 1995
Schofield 2000a Letter 74910-00-002 Use of Microshield Calculations for RMCS Exhauster Housing for Estimating Radionuclide Quantities on the Filters Using NDA and Dose Rate Measurements I S Schofield CHG to File January 62000
Schofield 2000b Letter 74910-00-003 Rev I RMCS Exhauster Stack RecordSample Data J S Schofield CHG to File January 202000
Reynolds 1999 D R Reynolds LMHC E-Mail to I S Schofield LMHC transmitting Tank Volume Calculations draft of calculations done by Mike Plesha and Reed Hendershot data to be used for RESOLVE computer program for Hanford waste tanks August 3 1999
TWINS Tank Waste Information Network System database available at httptwinspnlgovSOO lhtbinTCDgetTableListexe
Waldo 1999 letter 74910-99-009 RMCS Exhauster Aerosol Test Data E I Waldo to J S Schofield June 22 1999
WHC 1993 WHC-SD-WM-ES-225 Rev I AerosolStudy for the Rotary Mode Exhauster P M Francis Westinghouse Hanford Company April 20 1993
WHC 1997 WHC-SD-WM-SAD-035 Rev Ob A Safety Assessment of Rotary Mode Core Sampling in Flammable Gas Single Shell Tanks Hanford Site Richland Washington August 8 1997
G- I
RPP-4826 Rev I
CGM Data CGM-I Letter PARTICULATE SAMPLING OF 241-SX-IO1 DURING ROTARY MODE CORE SAMPLING D C
Langlois E2 Consulting Engineers to J S Schofield Lockheed Martin Hanford Company March 16 1998
CGM-2 Letter PARTICULATE SAMPLING OF 241-SX-I05 DURING ROTARY MODE CORE SAMPLING D C Langlois E2 Consulting Engineers to J S Schofield Lockheed Martin Hanford Company June 9 1998
CGM-3 Letter PARTICULATE SAMPLING OF 241-SX-103 DURING ROTARY MODE CORE SAMPLING D C Langlois E2 Consulting Engineers to J S Schofield Lockheed Martin Hanford Company June 12 1998
CGM-4 Letter PARTICULATE SAMPLING OF 241-S-110 DURING ROTARYMODE CORESAMPLING D C Langlois E2 Consulting Engineers to J S Schofield Lockheed Martin Hanford Company July 20 1998
CGM-5 Letter PARTICULATE SAMPLING OF 241-SX-102 DURING ROTARY MODE CORE SAMPLING D C Langlois E2 Consulting Engineers to J S Schofield Lockheed Martin Hanford Company July 22 1998
CGM-6 Letter PARTICULATE SAMPLING OF241-U-107 DURING ROTARY MODE CORE SAMPLING D C Langlois E2 Consulting Engineers to J S Schofield Lockheed Martin Hanford Company August 3 1998
CGM-7 Letter PARTICULATE SAMPLING OF 241-BY-105 DURING ROTARY MODE CORESAMPLING D C Langlois E2 Consulting Engineers to 1 S Schofield Lockheed Martin Hanford Company September 17 1998
CGM-8 Letter PARTICULATE SAMPLING OF 241-TX-I13 DURING ROTARY MODE CORESAMPLING D C Langlois E2 Consulting Engineers to J S Schofield Lockheed Martin Hanford Company March 15 1999
CGM-9 Letter PARTICULATE SAMPLING OF 241-TX-113 DURING ROTARY MODE CORE SAMPLING D C Langlois E2 Consulting Engineers to I S Schofield Lockheed Martin Hanford Company May 31 1999
Notices of Construction NOC-I DOEIRL-93-40 Radioactive Air Emissions Program Notice of Construction Rotary Mode Core-Sampling
Truck and Exhauster Approved by Letter AIR 93-707 A W Conklin WDOH to J E Rasmussen DOEIRL 7893
NOC-2 DOEIRL-94-118 Rev 0 Radioactive Air Emissions Program Notice of Construction for the Rotary Mode Core-Sampling Systems Three and Four Approved by Letter AIR 95-603 A W Conklin WDOH to J E Rasmussen DOERL 63095
NOC-3 DOERL-94-118 Rev 1 Radioactive Air Emissions Program Notice of Construction for the Rotary Mode Core-Sampling Systems Three and Four Approved by Letter AIR 98-301 W W Conklin WDOH to I E Rasmussen DOEIRL 3698
NOC-4 DOEIRL-97-70 Radioactive Air Emissions Program Notice of Construction for Rotary Mode Core- Sampling in SX Tank Farm Approved by Letter AIR 97-1 101 A W Conklin WDOH to J E Rasmussen DOEIRL 113097
NOC-5 USEPA Letter OAQ-107 (no title approving DOE submittal 97-EAP-590 dated 72997) A J Frankel USEPA to J E Rasrnussen DOEIRL 8497
NOC-5 USEPA Letter OAQ-107rsquo (nb title approving DOE submittal 97-EAP-723 dated 101797) A J Frankel USEPA to J E Rasmussen DOERL 11498
Note that both letters have ldquoOAQ-107rdquo following ldquoReply to Attn ofrdquo
G-2
RPP-4826 Rev I
Work Packages WP-I ES-94-00808 WP-2 ES-95-00258 WP-3 ES-95-00045 - WP-4 ES-95-00434 - WP-5 ws-97-00173 - WP-6 WS-97-00174 - WP-7 ws-97-00143 - WP-8 WS-97-00144 - WP-9 WS-97-00207 - WP-I 1 WS-97-00208 - WP-12 WS-98-00049 - WP-13 WS-97-00050 - WP-14 WS-97-00224 - WP- I5 WS-97-00225 - WP-16 WS-97-00230 - WP- I7 ws-97-0023 1 - WP-18 ES-97-00452 - WP-19 ES-97-00453 - WP-20 WS-98-00072 - WP-21 WS-98-00073 - WP-22 WS-98-00067 - WP-23 WS-98-00068 -
241-BY-IO6 Perform Rotary Core Sample [Riser IOB] 241-BY-I IO Rotary Core Sample [Risers 12B 7 IZB 41 241-BY-IO8 Obtain Rotary Core Sample [Risers 12A amp 71 241-BY-IO5 Rotary Mode Core Sample [Riser 12A] 241-SX-101 Rotary Mode Core Sample Riser 19 241-SX-101 Rotary Mode Core Sample Riser4 241-SX-103 Rotary Mode Core Sample Riser 7 241-SX-103 Rotary Mode Core Sample Riser I I 241-SX-105 RMCST Obtain Core Sample Riser 6 241-SX-105 RMCST Core Sample Riser 14 241-SX-102 Rotary Mode Core Sample Riser 8 241-SX-102 Rotary Mode Core Sample Riser 4 241-S-1 IO RMCST Obtain Core Sample Riser 6 241-S-1 IO RMCST Obtain Core Sample Riser 14 2414-107 RMCSTCore Sample Riser 7 241-U-107 RMCST Core Sample Riser 2 241-BY-IO5 RMCST Core Sample Riser 7 241-BY-IO5 RMCST Core Sample Riser 1 IB 241-TX-113 Rotary Core Sample Riser 3 241-TX-113 RMCST Core Sample Riser 5 241-TX-I 18 RMCST Core Sample Riser 9B 241-TX-I 18 RMCST Core Sample Riser 128
G-3
RPP-4826 Rev 1
during the sampling method The data in this document were obtained during RMCS in eleven separate tanks A total of 23 RMCS cores containing 11 5 RMCS segments were obtained The aerosol estimation methods are summarized below
RMCS Exhauster Housing NDA Appendix A describes NDA of RMCS exhauster housings after they were used during RMCS operations from 598 through 699 Gamma assays of the housings were performed to measure the Csrdquorsquo on the prefilter primary HEPA filter and secondary HEPA filter The quantity of Csrdquorsquo present on each was estimated by comparison with the Csrdquorsquo count rate from a known standard measured in an equivalent geomeby The quantity on all three filters was summed to estimate the total in the housing The mass of particulates was obtained by dividing the quantity of present by a weighted average of the Csrdquorsquo concentration of the wastes in the tanks being exhausted With this data average tank head space mass concentrations were calculated as well as the mass per core and per segment sent to the exhauster The mass of waste in a tank head space was calculated by multiplying the tank head space concentration by the tank head space volume A summary ofthe results is given in Table 2 The detailed results are given in Table A-3
RMCS Exhauster HEPA Dose Rate Data Appendix B describes using RMCS exhauster dose rate data to estimate aerosol quantities The dose rate at the ed e of the HEPA filter housing is used to estimate a quantity of Csrdquorsquo on the filter Dividing the quantity of Cs on the filter by a weighted average of the Csrdquorsquo concentration in the wastes of the tanks being exhausted provides the waste mass on the filters With the waste mass known tank head space mass Concentrations can be calculated as well as the mass per core or per segment sent to the exhauster The mass of waste in a tank head space was calculated by multiplying the tank head space concentration by the tank head space volume A summary of the results is given in Table 2 The detailed results are given in Table B- 3 The minimum detection ability ofthe dose rate instruments used is 05 m m r Most RMCS exhauster dose rates following completion of an RMCS core were less than detectable An exhauster housing registered slightly above the minimum detectable limit at 07 mRhr after core sampling on S-l IO U-107 BY-IO5 and TX-I 13 This housing read 08 mRhr after completion of sampling on the next tank TX-I 18
CGM Filter Paper Analyses Appendix C describes using CGM filter paper analytical data to estimate aerosol quantities The filter papers are inserted in-line in front of a CGM where they catch the radionuclides in the tank vapors drawn into the CGM These filter papers were removed and analyzed starting in 1997 For conservatism only sample results with a variance 400 were used These analytical data were divided by the specific activity of the radionuclides present on the filter paper for the tank on which the CGM was being operated This provides an estimate of the aerosol mass concentration in the tank head space since a particulate sample is drawn directly from the tank head space during RMCS With this data the mass of waste in the head space and the mass per core and per segment sent to the exhauster can be calculated The mass of waste in a tank head space was calculated by multiplying the tank head space concentration by the tank head space volume A summary of the results is given in Table 2 The detailed results are given in Table C-4
IF1
RMCS Exhauster Decontamination Factor Estimation Method
The RMCS exhauster filter housing DF was calculated by comparing stack record sampler data with the housing NDA data to calculate an efficiency for the housing The housing contains a prefilter and two HEPA filters in series Table 1 lists the RMCS sampling events which provided the data for estimating the DF
Housing NDA and Record Sample Data Comparison Appendix D uses RMCS exhauster stack record sample data to estimate stack Csrdquorsquo emissions for the same time periods when NDA data were obtained The stack emissions were used with the NDA data to calculate a filter housin DF The only radionuclide shown as present by the NDA was Csrdquorsquo No stack record samples showed Cs were available for seven of the nine stack record samples taken during the time NDA data were obtained For the remaining two samples conservative assumptions were made as to the stack total beta concentration
139 present above detection limits However total beta results above minimum detection limits
3
RPP-4826 Rev I
Stack total beta emissions were converted to CsrsquoI7 emissions using the C S rdquo ~ to total beta ratio for the waste in the tank being sampled The filter housing input was calculated by adding this calculated Csrdquorsquo emission to the quantity shown by NDA to be in the housing Dividing the emissions by the input provided the penetration efficiency Results of the housing efficiency and decontamination factor calculations are provided in Table D-I
Discussion of Results
All calculations were based upon radionuclides measured on the exhauster filters in the tank head space air or in the exhauster stack These radionuclide quantities were divided by the specific activity of waste in the tank to provide mass quantities in the air on the filters or in the exhaust stream Appendix E provides the waste specific activities used in this document along with limitations and potential errors associated with using them
The calculated average mass concentration in a tank head space during RMCS ranged from a low of 77E-6 gm3 based upon exhauster housing NDA data to a high of 4OE-5 gm3 based upon CGM filter paper data The weighted average of all methods was 24E-5 gm Welghted averages used in this document were based upon numbers of RMCS segments obtained during application of that method
The average mass concentration is not the peak concentration as illustrated by Figure I Figure 1 is a representation of relative concentrations only not a plot of measured concentrations during a specific sampling event Lines A and B represent aerosol concentrations at points near the drill string and at the tank outlet to the exhauster respectively Line C represents the calculated average concentration in the tank head space The peak concentration in the air to the exhauster will exceed the average tank head space concentration for short periods oftime It is beyond the scope of this document to provide a detailed spatial and time-dependent analysis of tank aerosol concentrations The methods used in this document provide an estimate of an average tank head space mass concentration only
The average mass of suspended solids in a tank head space was estimated by multiplying the average head space mass concentration by the tank head space volume The calculated average mass of suspended solids in a tank head space during RMCS ranged from a low of I 8E-2 g based upon exhauster housing NDA data to a high of 97E-2 g based upon CGM filter paper data The weighted average of all methods was 56E-2 g Comparing 56E-2 g to the 600 g and 100 g used in accident analysis assumptions it is evident that the accident analyses used peak tank head space mass levels three to four orders of magnitude greater than the average mass level in a tank head space during RMCS
Multiplying an average concentration by the tank head space volume to estimate the mass of suspended solids in the tank head space at a given time makes the simplifying assumption that the tank head space concentration is constant with time and uniform within the head space during RMCS As illustrated by Figure I the tank head space concentration is not constant with time or uniform within the head space When determining a maximum value for mass of solids in a tank head space engineering judgement needs to be applied that evaluates all the parameters involved that could increase or decrease the average mass value provided in this document With all other variables being equal the mass concentration and mass of suspended solids in a tank head space will also be affected hy the volume of the head space and the exhaust flow rate The head space volumes of the tanks sampled to date are typical of SSTs The exhauster flow rate is not expected to change for the RMCS exhauster If additional samples are taken in SX tanks where the exhauster flow rate is higher than in the four SX tanks which have already been sampled the mass present in the tank head space would be expected to be reduced
The calculated mass of waste sent to an exhauster ranged from lows of 18E-1 gRMCS core and 34E-2 W C S segment based upon CGM filter paper data to highs of 59E-I gRMCS core and 1OE-1 gRMCS segment based upon exhauster housing dose rate data The weighted average of all methods was 42E-1 gRMCS core and 69E-2 gRMCS segment Comparing the average to the 1 kgRMCS core and 35-77 glRMCS segment numbers used for the PTE estimates it is evident that the PTE estimates are conservative by at least three orders of magnitude
Results given in this document based upon total beta or Csrsquordquo data are likely more valid than alpha based results due to the higher concentrations of beta-gamma radionuclides in the waste and their greater ease of measurement when
4
RPP-4826 Rev 1
compared to alpha emitters Equal weight is given to all results regardless of whether based upon total al ha total beta or CsI3rsquo data This provides conservative results since the aerosol values based on total beta or CslfPwere normally lower than those based upon alpha results
The mass per segment numbers should be a better indicator of RMCS aerosol emissions from the tank than the mass per core numbers This is because the quantity of aerosols generated in a tank should be proportional to the time of purge gas flow and bit rotation The time of purge gas flow and bit rotation should be proportional to the number of RMCS segments taken Thus the mass of RMCS generated aerosols sent to an exhauster on a given tank should be roughly proportional to the number of RMCS segments obtained from the tank The number of RMCS segments in a core can vary To date the range has been from 1 to 12 RMCS segments per RMCS core The average has been 5 RMCS segments per RMCS core
The results for mass per core or per segment based on NDA and housing dose rate data have a firmer basis than results based upon CGM filter paper data This is because the RMCS exhauster housing NDA and dose rate methods are a direct physical measurement of essentially all the Csrsquordquo released to the exhaust stream during RMCS Aerosol measurements based upon HEPA dose rate are conservative as the filters showed no detectable dose rate for three of the five periods evaluated and barely perceptible readings after the other two
The results for tank head space concentrations and mass of waste in a tank head space during RMCS based on CGM filter paper data have a firmer hasis than results based on housing NDA or dose rate This is because the CGM filter paper data is a direct measurement of the concentration in the air in a tank head space during the time when aerosols are being generated The CGM filter paper data should provide a higher tank head space mass concentration than that calculated by filter housing NDA or dose rate This is because aerosols are only generated during times when the CGM is operating and the CGM operates for less time than the exhauster does Since the concentration is based upon dividing a filter quantity by the volume of gas passing through the filter the volume of gas in proportion to the material on the filter will be less for the CGM filter paper than for an exhauster filter resulting in a higher concentration based on CGM filter paper data A factor is included in the CGM based concentration to account for radionuclides in the dome space that have not settled out or been removed by the exhauster when the CGM is shut Off
The average results for all methods were within reasonable agreement with each other considering all the variables and assumptions involved The filter housing DF is in good agreement with expected values
This document contains seven appendices Appendices A-C provide particulate results based upon RMCS exhauster housing NDA RMCS exhauster housing dose rates and CGM filter paper data Appendix D provides an RMCS exhauster filter housing DF based on housing NDA and stack record sample data Appendix E provides waste specific activities and Appendix F provides the raw data used in Appendices A-D Appendix G provides references for this document
Conclusions
The results in this document are based upon RMCS operating experience from startup of nitrogen-purged RMCS in November 1994 through June 1999 Table 2 summarizes the information presented in the appendices Based upon this information and the lack of any significant aerosol formation seen in in-tank videos it can be concluded that past estimates of aerosol concentrations used for regulatory permits and accident analyses were conservative by a nominal three orders of magnitude
In order to estimate mass releases for regulatory permits the overall emissions with time are needed as a basis for the PTE estimates For future permits the mass per core or mass per segment values in Table 2 can be used directly with conservatism added if deemed appropriate for the tanks to be sampled When estimating maximum concentrations or maximum mass quantities in the tank head space for use in accident analyses additional conservatism needs to be added to the average concentration and mass values in Table 2
5
RPP-4826 Rev I
Tank and Date Sampled
Table 1 Summary Of Aerosol Estimation Methods Used
RMCS Aerosol Estimation Methods Exhauster Number of Used
Housing DF RMCS Cores Riser Used Period6 HEPA CGM NDA and and RMCS
Exhauster Operating Sample Exhauster
NDA Dose Filter RMCS Stack Segments Taken
BY-IO5 1998
No RMCS segments taken from BY-108 or from TX-I 13 Riser 3 using Exhauster B Any material retained on I
the filters during these operating times was assumed to come from next RMCS sampling event with the same exhauster BY-IO5 in 1998 shown as separate exhauster installations since stack record samples were pulled after each riser was sampled
Includes RMCS cores and segments only PMCS cores and segments obtained during exhauster operation not included A total of 23 RMCS cores and 115 RMCS segments were taken between 1194 and 699 The sum of cores and segments is less than sum of cores and segments obtained during data collection periods at lei since more than one aerosol estimation method was used for some sampling periods
One CGM filter paper was used for both cores in SX-102 and for both cores in U-107 3
See Appendix F for explanation of exhauster operating periods
6
RPP-4826 Rev I
Table 2 Summary Of RMCS Aerosol Data
Weighted average based upon number of RMCS segments taken with each method
7
e
Q 0 c 0 0 - 0 VJ 0 L
2
RFP-4826 Rev 1
APPENDIX A
ESTIMATION OF AEROSOLS GENERATED DURING Rh4CS BASED UPON RMCS EXHAUSTER HOUSING NON-DESTRUCTIVE ASSAY
A-0
RPP-4826 Rev I
APPENDIX A - Estimation Of Aerosols Generated During RMCS Based Upon RMCS Exhauster Housing Non-Destructive Assay
Summary of Method
This method of estimating RMCS aerosol quantities uses non-destructive assay (NDA) of the exhauster housing to determine the C S rdquo ~ quantity (Ci) on the filters inside This quantity is then divided by the C S rdquo ~ specific activity (Cig) in the waste for the tank(s) on which the exhauster and the same filters were present during sampling The resulting mass on the filters divided by the volume of air flowing through the exhauster provides an estimate of the average aerosol mass concentration in the air to the exhauster This value was multiplied by the tank head space volume to obtain the average mass of particulates present in the tank head space during RMCS The mass of waste on the filters divided by the number of rotary cores or segments taken provides the mass per core or per segment sent to the exhauster
Description
There are one prefilter and two HEPA filters in series for each RMCS exhauster Particulates captured on the filters contain radionuclides with C S rdquo ~ bein the predominant gamma emitter By performing an NDA of the exhauster housing filters the quantity of Cslg7 in the housing can be estimated This C S rdquo ~ value is then used to back-calculate to a waste mass on the filters using the mass is used to calculate the concentration of particulates in the tank exhaust stream the total suspended solids in the tank head space and the mass of waste sent to the exhauster for each RMCS core or segment taken
Exhauster operations were divided into six operating periods for evaluation in this document These periods are discussed in Appendix F and shown in Table F-I NDA data were obtained for Exhauster Operating Periods 4 5 and 6 Relevant information for these periods is also listed in Table A-I
Period 4 was for Exhauster C use during RMCS for both cores in S-l IO U-107 BY-IO5 and the first core in TX-I 13 The filters and housing were new prior to RMCS in S-110 No filter changeouts were made during this period the accumulated particulates from these RMCS events were retained on the housing prefilter primary HEPA and secondary HEPA
Period 5 was for Exhauster B use during RMCS for the second core in TX-I 13 The filters and housing were new prior to RMCS in TX-113 No filter changeouts were made during this period Exhauster B also ran for a short time during the first core in TX-113 but no RMCS segments were taken when the exhauster was operating Stack record samples (see Appendix D) indicated small levels of aerosols were present in the stack exhaust during this time period Any material collecting on the filters during this time period would show up and be counted as part of the aerosols generated during the 2rdquod RMCS core
Period 6 was for Exhauster C use during RMCS for both cores in TX-I 18 During Period 6 the filters also contained the waste particles from Period 4 No filter changeouts were made durin this period The aerosol mass generated due to RMCS in TX-I 18 was determined from the increase in Cs on the filters between Period 4 and Period 6
A description of the sampling method used for the NDA obtained following Period 4 is provided in Greager 1999 The same method was used for the NDA following Periods 5 and 6 The NDA consisted of a gamma energy analysis of the exhauster housing performed at points adjacent to the prefilter first HEPA and second HEPA The detector was mounted outside the housing and inside a lead collimator The collimator was used to minimize the background count rate and contribution from adjacent filters CsIh was the only radionuclide reported as present The NDA compared the count rates from the exhauster housing with the count rate of an National Institute of Standards and Technology (NISampT) traceable in an equivalent geometry to the RMCS exhauster housing The count rates from housing filter readings were divided by the count rate for the source to give a reported quantity of Cslrdquo on the filters
concentration in the tank waste This filter waste
3 B
source located in the middle of a filter
A- 1
RPP-4826 Rev 1
Two correction factors were applied to the reported filter Csrdquorsquo values for use in this document These are discussed in the following two sections
Reported NDA Data
The NDA results for Period 4 are provided in Greager 1999 The only radionuclide reported as present on the filters was CsI3rsquo The results are restated in Table A-2
The NDA results for Periods 5 and 6 are provided in Diedeker 1999 The only radionuclide reported as present on the filters was Csrdquorsquo The results are restated in Table A-2
Adjusted NDA Data
The reported results are based upon comparing the count rate for a reference point source located in the middle of a mock-up assembly equivalent to the exhauster housing with the count rate from the same detector inside a lead collimator placed outside the actual exhauster housing Limitations with this method include comparison of a point source with a distributed matrix and the inability of the detector to see the entire filter due to the presence of the collimator Correction factors were used to adjust the reported values to account for these two limitations
The first correction factor accounts for comparing a distributed source to the point source standard The reported results were calculated based upon a point source standard since there are no readily available filter standards with a distributed source The material in the filter housing should be fairly evenly distributed through the filter media however so comparing count rates for the filter housing to a point source standard will result in some error To correct for this error shielding calculations were performed on an exhauster housing filter assuming the CSrdquorsquo was evenly distributed throughout the filter media and then again assuming the activity was a point source in the middle of the filter Foust 1999 provides the results of these Microshield dose rate calculations Using the data in Foust 1999 Schofield 2000a shows that the dose rate at the NDA detector location would be about 0625 mFVhrmCi CSrdquorsquo for a point source and 073 mRhrmCi Cslrdquo for a distributed source To adjust the reported NDA results to what they would have been if an actual distributed standard source was available the reported values need to be multiplied by 0625 + 073 = 086
The second correction factor accounts for the detector not being able to see the entire filter contents due to the detector location inside the lead collimator Using basic geometry Schofield 2OOOa estimated the detector has about a 100 view of 608 of a HEPA filter about a 50 view of 264 of the filter and is shielded from the remaining 128 The detector count rate was thus estimated as being approximately 741 o f what it would be if the detector were not collimated To correct the reported results to what they would have been if an uncollimated detector could have been used the reported values need to be multiplied by I + 0741 = 135
Combining the two correction factors gives a single adjustment factor used of 086 x 135 = 116 Per Table A- 2 the total quantity of Csrdquorsquo reported present in the housing for Period 4 was 0430 mCi This quantity was multiplied by 116 to give 050 mCi Csrdquorsquo The reported results for Periods 5 and 6 were revised in the same manner to give 0032 mCi and 064 mCi C~rsquo~rsquorespectiveIy To determine the net increase in Csrdquorsquo for the housing during Period 6 the value from Period 4 was subtracted from the total or 064 - 050 = 014 mCi Csrdquorsquo
Calculation of Mass Quantity on Filters
Calculation of the mass of waste on the filters requires knowledge of the specific activity of the waste on the filters The specific activities used for each exhauster operating period are given in Table A-I The paragraphs below provide a derivation of the specific activities used
The specific activity values for the waste in each tank sampled is given in Table E-I Rh4CS was performed on more than one tank during Period 4 so a weighted average specific activity was used to calculate the waste mass on the filters during this period The weighted average specific activity was calculated based upon the number of RMCS segments taken from each tank sampled The number of RMCS segments obtained during
A-2
RPP-4826 Rev 1
each period for which NDA measurements were made are listed in Table A-I These values were obtained from Table F-I A weighted average specific activity for the waste on the filters in Period 4 was obtained by
[[O 227 mCigl[lO segl+[Ol2lmCigl[lO seg1+[0225 mCigl[l(l seg]+[Ol30 mCig][l2 seg]]+[SO segments] = 0182 mCi Csrdquorsquog
Calculating a weighted average based upon the number of segments assumes aerosol generation is roughly the same per segment and the specific activity of a radionuclide is constant throughout a tank These assumptions are adequate for the purpose oftbis document Aerosol generation can vary with water content waste hardness depth of sample taken nitrogen flow rate and porosity of the waste An in-depth evaluation of these parameters is beyond the scope of this document The impact of these variables is assumed to average out over all the RMCS segments taken The specific activities used do not vary greatly from tank to tank so any variations will not have a significant impact on the final aerosol results See Appendix E for further discussion of limitations on specific activities used in this document
For Period 5 the filters were new at the start and the only tank sampled with the exhauster was TX-I 13 Therefore the specific activity of CsI3rsquo for TX-I 130130 mCig was used
The same exhauster and filters used for Period 4 were used for Period 6 The net increase in Csrdquorsquo for Period 6 was determined by subtracting the Period 4 Csrdquorsquo from the total Since this net increase was only due to TX- 118 the specific activity of Csrdquorsquo for TX-I 180130 mCig was used for the waste added to the filters in Period 6 (Note it is only a coincidence that TX-I 13 and TX-118 have the same nominal Csrdquorsquo concentration)
The total mass of waste on the filters for Period 4 was thus
050 mCi i 0182 mCig waste = 275 g waste in exhauster housing
The mass of waste added to the exhauster for Period 5 was
0032 mCi + 0130 mCig waste = 025 g waste in exhauster housing
The mass of waste added to the exhauster for Period 6 was
(064 mCi - 050 mCi) + 0130 mCig waste = 11 g waste in exhauster housing
Aerosol Calculations
The tank head space particulate concentration was obtained by dividing the mass of waste sent to the exhaust stream by the volume of air sent to the exhauster The volume of air to the exhauster was obtained by multiplying the exhauster flow rate by the exhauster run times for each tank from Table F-I
For the RMCS exhausters the recorded exhauster flow rate is reported in standard cubic feet per minute (scfm) The RMCS exhauster flow rate is controlled to a nominal 200 scfm The exhauster flow rate was corrected to an actual cubic feet per minute (acfm) before calculating the tank head space aerosol concenmtion Table F-l includes the actual cfm flow rates
The calculated flow rates during RMCS for the tanks sampled during Period 4 were 207 acfm (S-1 lo) 206 acfm (U-107) 208 amp 209 acfm (BY-105) and 203 acfm (TX-I 13) The total volume oftank air through the exhauster during Period 4 was thus
[[207 cfm][ 15978 hr]+[206][27385]+[208][13577]+[209][30792]+[203][30230]][60 minh] = 146 E+7 Arsquo
The average tank head space mass concentration during RMCS in the above tanks was
[275 g + 146 E+7 Arsquo] x [35315 ftrsquomrsquo] = 664 E-6 average g waste per m3 in exhauster inlet
A-3
RPP-4826 Rev I
The gas flow rates and average tank head space mass concentrations during RMCS for Periods 5 and 6 were calculated in a similar manner
The average mass of waste in a tank head space during RMCS was calculated by multiplying the tank head space mass concentration by the tank head space volume from Table F-2 as shown below for S-1 I O
[275 g + 146 E+7 Arsquo] x [89100 ftrsquo] = 167E-2 g waste in S-1 IO head space
The particulate quantities in the other tank head spaces were calculated in a similar manner The weighted average mass in a tank head space during Period 4 was based upon the number of segments taken in each tank
The mass sent to the exhauster per RMCS core or per RMCS segment was obtained by dividing the mass of waste sent to the exhaust stream during each period by the numbers of RMCS cores or RMCS segments obtained during the exhauster operating time The average mass of waste sent to the exhauster during Period 4 is thus
275 g waste + 7 rotary cores = 39E-1 g wastelrotary core
and
275 g waste + 50 rotary segments = 55E-2 g wasteirotary segment
The mass of waste to the exhauster per RMCS core and RMCS segment for Periods 5 and 6 were calculated in a similar manner
All data were input to a spreadsheet to perform the calculations Results are provided in Table A-3
Summary of Calculations
Non Destructive Assay was performed on the RMCS exhauster filter housings used during three separate exhauster operating periods during which IO RMCS cores and 65 RMCS segments were obtained from five tanks Weighted averages of the average tank head space mass concentration average mass of suspended solids in a tank head space and average mass sent to the exhauster per RMCS core or segment for the three periods combined were calculated based upon the number of RMCS segments taken during each period Based upon RMCS exhauster housing NDA data the results indicate that
The average tank head space mass concentration during RMCS was 77E-6 g wastelmrsquo The average mass of suspended solids in the tank head space during RMCS was 18E-2 g waste The average mass sent to the exhauster during RMCS was 52E-1 g wastelcore The average mass sent to the exhauster during RMCS was 63E-2 g wasteisegment
A-4
RPP-4826 Rev 1
APPENDIX B
ESTIMATION OF AEROSOLS GENERATED DURING RMCS BASED UPON Rh4CS EXHAUSTER HEPA FILTER DOSE RATES
B-0
RPP-4826 Rev I
APPENDIX B - Estimation Of Aerosols Generated During RMCS Based Upon RMCS Exhauster HEPA Filter Dose Rates
Summary of Method
This method of estimating RMCS aerosol quantities divides the dose rate increase (mRhr) at the side of the RMCS HEPA filter housing by a calculated dose conversion factor (mRhrmCi C S rdquo ~ ) to obtain an approximation of the radionuclide quantity in the housing This radionuclide quantity is divided by the waste specific activity (mCig) to determine the mass of waste on the HEPA filter Dividing the HEPA filter waste mass by the volume of air passing through the filter provides an estimate of the average tank head space particulate concentration during RMCS Multiplying the average tank head space particulate concentration by the tank head space volume gives an estimate of the average mass of suspended particulates in the tank head space during RMCS Dividing the HEPA filter waste mass by the number of RMCS cores or RMCS segments provides the mass per RMCS core or per RMCS segment sent to the exhauster
Description
Particulates in the exhaust stream are removed by the HEPA filter(s) upstream of the exhaust fan The captured particulates contain radionuclides with CSrsquo~rsquo being the predominant gamma emitter As the particulate quantity on the HEPA filter increases the dose rate at the side of the filter housing will increase proportionately By monitoring the HEPA dose rate at the side of the filter housing the quantity of Csrsquordquo on the HEPA can be estimated This C S rdquo ~ value is then used to back-calculate to a waste mass quantity on the filter using the Csrsquordquo concentration in the tank waste This filter waste mass quantity is used to calculate the concentration of particulates in the tank exhaust stream the total suspended solids in the tank head space and the mass of waste sent to the exhauster for each RMCS core or segment taken Although radionuclides will be trapped on both the prefilter and the primary HEPA filter with a very small amount on the secondary HEPA calculations in this section were based upon the simplifying assumption that all the activity was on the primary HEPA filter
During RMCS exhauster operation the dose rate in m M r at the side of the HEPA filter housing is periodically measured with an Eberline RO-3B per procedure to indicate when radioactive particulates are building up on the filter The limit of detection of the RO-3B is 05 mRhr
Exhauster operations were divided into six operating periods for evaluation in this document These periods are discussed in Appendix F and shown in Table F-I Housing dose rate data were obtained for Exhauster Operating Periods I 24 5 and 6 Relevant information for these periods is also listed in Table B-I Dose rate data are available and were used for all tanks on which an RMCS exhauster was present and RMCS samples were taken This includes BY-106 BY-IO5 (1995) BY-I IO S-l I O U-107 BY-IO5 (1998) TX-113 and TX- 1 18 The dose rate at the end of a period was used as the basis for calculating radionuclides on the filters The only operating period for which dose rate data were not used for estimating filter radionuclide content was Period 3 Period 3 was for RMCS in SX farm using the SX exhauster
The dose rate at the side of the SX exhauster HEPA filter housing was measured during RMCS of SX farm tanks (for sampling of tanks SX-lot SX-102 SX-103 and SX-105) but the data are not useful for estimation of aerosol quantities because the SX exhauster draws on 13 tanks in parallel or in series with the tank being core sampled Many of the tanks have a much higher off gas flow rate than the sampled tank In addition there is background radiation in the area of the SX exhauster filter housing making any increase in the housing dose rate during RMCS difficult to detect
Dose Rate Data
The dose rate data for each period is listed in Table 8-2 No dose rates above minimum detectable limits were evident at the sides of any RMCS exhauster in Periods I 2 and 5
Dose rate measurements were less than detectable for Period 4 during sampling of S-l IO and U-107 When sampling on BY-IO5 there were a few readings of 07 m M r but most were ltOS mRhr This variation in
B- 1
RPP-4826 Rev 1
readings is to be expected as the specific instrument person using the instrument and location at which the dose rate is checked can vary with time The final recorded dose rate when sampling was complete on BY-IO5 was lt05 mRhr At the end of Period 4 following completion of the first core in TX-I 13 Exhauster C was listed as having a 07 m M r dose rate
Period 6 used Exhauster C again with the same housing and filters as at the end of Period 4 The final dose rate for this period was 08 m M r
Periods 124 and 5 all began with a new housing and new filters For Periods 12 and 5 it was conservatively assumed that the final dose rate was equal to 05 m M r giving an increase of 05 mRhr for each of these periods For Period 4 the dose rate increase was 07 m M r for this period Since Period 6 used the same housing and filters as Period 4 the increase for Period 6 was 08 - 07 = 01 m M r
The dose rate increase was converted into a CsIh content on the primary filter for each period Foust 1999 provides various dose rates for an RMCS exhauster housing assuming even dispersal of 1 mCi C S rdquo ~ on the first HEPA filter Using these calculations Schofield 2000a estimated a dose rate conversion factor of 16 mRhrmCi C S rdquo ~ at the detector location for an RO-3B The assumption that radionuclides are evenly distributed on the HEPA is a reasonable assumption based upon the exhauster design and the method used to measure the radiation dose rate
Gamma emitting contribute to the dose rate due to bremsstrahlung radiation and other nuclides may provide some small additional dose but the major penetrating dose rate contributor in aged SST waste is CSrdquo~ Ignoring the presence of all radionuclides (including Srm) except C S rdquo ~ in calculating a HEPA filter waste mass will provide a conservative result This is because assuming all radiation present is due to C S rdquo ~ will result in overestimating the C ~ I ~ ~ c o n t e n t of the filter housing which in turn will result in overestimating the waste mass on the HEPA filter
Dividing the HEPA dose rate for each exhauster installation by the dose conversion factor of I 6 mRhrmCi results in an increase of 031 mCi Csrdquorsquo on the RMCS exhauster filters for Periods I 2 and 5044 mCi for period 4 and 0063 mCi for Period 6
Calculation of Mass Quantity on Filters
Dividing the Csrdquorsquo content of the filters by the specific activity of C S rsquo ~ ~ in the waste gives the estimated mass of waste sent to the exhauster The specific activity value used for the waste in each tank sampled is given in Table E-I Since RMCS was performed on more than one tank in Periods 1 and 4 a weighted average specific activity was used for these periods The weighted average specific activity was calculated based upon the number of RMCS segments taken from each tank sampled during that period The number of RhKS segments obtained during each period are listed in Table B-I These data were obtained from the individual tank data in Table F- I Calculations to estimate the specific activity of waste mixtures were performed in the same manner as shown in Appendix A For Periods 2 5 and 6 RMCS samples were taken in only one tank The waste specific activity used for these periods was the specific activity of the tank sampled The specific activities used for each exhauster operating period are given in Table B-I
For all exhauster installations except BY-IO6 in 1994 and 1995 the RMCS exhausters were hooked directly to the waste tank When sampling BY-106 a prefilter was installed in the tank riser between the tank and the exhauster The prefilter was not used for BY-I IO in Period 1 or for any other tank in any other period Thus for Periods 2 4 5 and 6 the mass of waste on the HEPA was assumed equal to the mass of waste leaving the tank risers For Period 1 the mass of waste on the HEPA had to be adjusted for the BY-106 prefilter DF when estimating the combined mass of waste leaving the BY-IO6 and BY-I IO tank risers The mass of waste on the HEPA for Period 1 was
[031 mCi] [IO00 pCimCi] = 310 pCi
[310 pCi Csrdquorsquoon HEPA] + [I77 pCi C S rdquo ~ ~ waste] = 177 gwaste on HEPA
is the predominant radionuclide contributor to filter dose rates Beta emitting Srw can
on HEPA
B-2
RPP-4826 Rev 1
A decontamination factor (DF) of 5 was used to account for radionuclide removal by the BY-IO6 prefilter (see Appendix D for basis ofprefilter DF) There were 1 1 RMCS segments taken from BY-IO6 and 13 from BY- 1 IO The total mass ofwaste assumed to exit the tank risers was therefore
[ I 77 g waste] [ 1 1 + 131 [[I 151 + 131 = 28 g waste from tank risers
The DF of 5 to account for the prefilter is only applicable to the RMCS of BY-IO6 in 1994 and 1995 for all other exhauster periods the mass of waste on the HEPA was equal to the mass of waste sent to the exhauster riser
The mass of waste sent to the exhauster for Period 2 was
[031 mCi] [IO00 pCimCi] = 310 pCi Csrdquorsquo on HEPA
[3 IO pCi C S rdquo ~ on HEPA] + [225 pCi CsiI7g waste] = I 39 g waste from tank
Using the same formula the mass of waste to the exhauster from Periods 4 and 5 was 241 and 240 g respectively and the increase in waste on the filters for Period 6 was 048 g
Aerosol Calculations
The mass sent to the exhauster per RMCS core or per RMCS segment was obtained by dividing the mass of waste leaving the risers by the number of RMCS cores or RMCS segments obtained during the exhauster operating period
The tank head space particulate concentration was obtained by dividing the mass of waste leaving the riser by the volume of gas sent to the exhauster This volume of gas sent to the exhauster was obtained by multiplying the exhauster flow rate by the exhauster run time from Table F-I The calculations for aerosols generated based upon HEPA dose rates use acfm while the exhauster flow is recorded in scfm so the actin flow rates in Table F- 1 were used
The average mass of aerosols in the tank head space was obtained by multiplying the average tank head space particulate concentration by the tank head space volume from Table F-2
Following is an example of how the mass per RMCS core mass per RMCS segment average tank head space mass concentration and average mass of aerosols in the tank head space were calculated for Period 1 Data used are from Tables E-I F-I and F-2
[200 scfm] [2992+2916] [84 + 4591 + 528 = 21 1 acfm to exhauster from BY-IO6 in 11-1294
using same formula results in 210 acfm for BY-IO6 in 195 and 209 acfm for BY-I IO
28 g waste + [((21 1 acfm)(4878 hr)+(21O)(l867)+(209)(1125))(60 minhr)]= 12E-6 g wastelf to risers
[12E-6 amp] [35315 fmrsquo] =43E-5 g wastemrsquoto risers
[12E-6 gftrsquo] [53700 Arsquo in BY-106 head space] =66E-I g waste in BY-IO6 head space during RMCS
[12E-6 piftrsquo] [92000 ftrsquo in BY-110 headspace] = IIE-l g waste in BY-I10 head spaceduring RMCS
[28 g waste] [5 RMCS cores] = 56E-1 g waste per core to riser
[28 g waste] + [24 RMCS segments] = 12E-1 g waste per segment to risei
8-3
RPP-4826 Rev 1
All data were input to a spreadsheet and the mass to exhauster per RMCS core mass to exhauster per RMCS segment average tank head space mass concentration and average mass of aerosols in the tank head space were calculated for each of the RMCS exhauster operating periods in the same manner as shown above Results are given in Table 8-3
Summary of Calculations
RMCS exhauster operations were segregated into five operating periods during which RMCS was performed The Exhauster B data for BY-IO8 and TX-I 13 riser 3 was not used in these calculations as no RMCS was performed when the exhauster was operating Exhausters were operated in seven tanks during which 16 RMCS cores and 92 RMCS segments were obtained Based on RMCS filter housing dose rate data the results indicate that
These values are conservative as the assumed dose rate at the end of RMCS for Periods I 2 and 5 was assumed to be 05 mRhr In addition using a DF of 5 for the BY-IO6 prefilter skews the results high The in-tank prefilters used in both BY-IO6 sampling events showed no detectable contamination
Operatin Periods 4 and 6 were the only periods with exhauster housing dose rates above detectable The 044 mCi Csrsquordquo and 0063 mCi CsIh increase on the filters for these two periods based upon dose rate data correspond to the 050 mCi CsI3rsquo and 014 mCi Csrdquorsquo increase on the filters for these two periods based u on NDA data (see Appendix A) The 031 mCi C S rdquo ~ for Period 5 is significantly above the 0032 mCi Cslrsquolsquofor the same period determined by the NDA but this is due to assuming the housing dose rate was equal to the minimum detectable 05 mRhr
The average tank head space mass concentration during RMCS was 22E-5 g wastem3 The average mass of suspended solids in the tank head space during RMCS was 47E-2 g waste The average mass sent to the exhauster during RMCS was 59E-1 g wastelRMCS core The average mass sent to the exhauster during RMCS was 1OE-1 g wastelRMCS segment
B-4
v m
__ ~~
RPP-4826 Rev 1
APPENDIX C
ESTIMATION OF AEROSOLS GENERATED DURING RMCS BASED UPON CGM IN-LINE FILTER PAPER ANALYSES
c-0
RPP-4826 Rev I
APPENDIX C - Estimation Of Aerosols Generated During RMCS Based Upon CGM In- Line Filter Paper Analyses
Summary of Method
This method of estimating RMCS aerosol quantities uses radionuclide assay data from in-line filter papers located upstream of continuous gas monitors (CGM) sampling the tank air for flammable gases during RMCS The radionuclide content of the filter paper is divided by the waste radionuclide specific activity and the air flow through the CGM to obtain an estimate of the average mass concentration in the tank head space during the time period the CGM is on Multiplying the estimated average tank head space mass concentration by the tank head space volume gives an estimate of the average mass of particulates in the tank head space during RMCS To obtain the mass per RMCS core or per RMCS segment sent to the exhauster the tank head space average mass concentration is multiplied by the volume of gas sent to the exhauster then multiplied by a correction factor to account for particulates in the head space removed by the exhauster when the CGM is not operating and divided by the number of RMCS cores or RMCS segments
Description
During most tank waste intrusive activities performed since 1996 an intrinsically safe CGM located above ground has been used to continually monitor the tank air for flammable gases during in-tank activities The CGM sampling method draws air directly from the tank head space During RMCS the CGM sampling line is placed in the tank dome space The sampling line is located between the sampling riser and the exhaust riser if practical A pump in the CGM draws tank air up through the line at 05 litmin for measurement of the lower flammability limit (LFL) by the CGM A filter paper is installed in the sampling line upstream of the CGM to protect the unit from internal contamination
Following CGM use the CGM filter papers are normally discarded after monitoring them in the field for contamination To help estimate the tank head space particulate levels during RMCS these filter papers were retained and analyzed in the 222-S laboratory following removal from all tanks in which RMCS was performed from the fall of 1997 through April 1999 Data were collected for the four tanks in SX farm in which RMCS was performed and the next four tanks on which the RMCS exhauster was deployed These tanks are listed in Table c-I Reported CGM Data
The CGM operational data used to estimate aerosol levels during RMCS includes CGM operating times CGM flow rates and filter paper analytical data A summary report containing all the field operating data sheets for CGM usage and lab data was prepared following completion of sampling on each tank for all tanks except TX- 113 For TX-I 13 a separate report was prepared following each core These reports are References CGM-I to CGM-9 The CGM data from these reports are provided in Table C-2
There were 14 CGM installations during RMCS when CGM filter papers were collected and analyzed Each of these installations had Csrdquorsquo total alpha and total beta quantities measured on the filter papers resulting in 42 data points Eight of the measurement results were very low and had errors of gt+-loo These values were not used resulting in a net of 34 data points for calculating average head space mass concentrations based upon CGM data
Calculated Tank Head Space Radionuclide Concentrations
To calculate the average tank head space radionuclide concentrations during RMCS the filter paper radionuclide quantities were first divided by an efficiency factor to account for radionuclides which may not have been captured on the paper This adjusted radionuclide value was divided by the volume of tank air passing through the paper to give the average tank head space radionuclide concentration
The efficiency used for most stack samplers onsite is 73 (see Appendix D) Estimates attached to References CGM-I to CGM-9 indicate the CGM filter paper sampling method used should have a sampling efficiency
c- 1
RPP-4826 Rev 1
exceeding 73 For conservatism a sampling efficiency of 50 was assumed in this document for the CGM filter paper method
The estimated Csrdquorsquo total alpha and total beta concentrations in the tank vapor space were calculated by dividing the radionuclide quantity on the filter paper from Table C-2 by the assumed CGM sampling efficiency of 05 and the volume of gas going to the CGM The volume of gas going to the CGM was calculated by multiplying the time of CGM operation from Table C-2 by the CGM flow rate of 500 mlmin For example the calculated SX- 101 head space C~rsquorsquo~concentration based upon analysis of the CGM filter papers used during RMCS of riser 19 is
[[26E-4 pCi + 051 + [[I755 min][500 mlmin]] = 59E-I0pCiml
All radionuclide concentrations were calculated in a similar fashion Results are given in Table C-3 Table C-3 lists the radionuclide concentrations for all 42 data points The eight radionuclide concentrations not used for estimating mass concentrations are noted
Table C-3 also contains the calculated number of tank head space changeouts by the tank exhauster during CGM operation Tank head space changeouts were calculated by multiplying the exhauster flow rates (in actin) from Table F-1 by the CGM run times from Table C-2 and dividing by the tank head space volumes from Table F-2 The number of tank head space changeouts during CGM operation was used when estimating the waste mass sent to the exhauster See Aerosol Calculations section below for explanation
Aerosol Calculations
Average tank head space mass concentrations based upon CGM filter paper data were calculated by dividing the head space radionuclide concentrations from Table C-3 by the waste specific activities for each tank sampled The waste specific activities used came from Table E-I and are listed again in Table C-I The average of the mass concentrations based upon radionuclide data for each tank was used as the average head space mass concentration for that tank For example the calculated SX-IO1 head space mass concentration analysis from the CGM filter papers used during RMCS of riser 19 is
[59E-10 pCi Csrdquorsquoml+ 112 pCi C S rdquo ~ ~ waste] [ 28317 mlftrsquo] = 1 SE-7 g wasteA3 based upon C S rdquo ~
[ I 7E-I I pCi T A M + 504E-1 pCi TAg waste] [ 283 17 mlftrsquo] = 94E-7 g wasteamprsquo based upon Total Alpha
[43E-9 pCi TBml+ 357 pCi TBg waste] [ 28317 mlArsquo] = 34E-7 g wastel based upon Total Beta
[ [ I 5E-7 + 94E-7 + 34E-7 g wasteArsquo] f 31 = 48E-7 g wasteamp
[48E-7 g wastelt ] [3531467 Arsquom3] = 17E-5 g wastemrsquo
All tank head space mass concentrations were calculated in the same manner The results are presented in Table C-4 The weighted average tank head space mass concentration during RMCS was based upon the number of RMCS segments taken for each data point
The average aerosol mass in the head space during RMCS was calculated by multiplying the average tank head space mass concentration by the tank head space volume from Table F-2 For the same data point as above
[48E-7 g waste Arsquo] [115E+5 Arsquo] = 55E-2 g waste in SX-IO1 head space during RMCS
All average mass quantities present in the tank head space during RMCS were calculated in the same manner using a spreadsheet The results are provided in Table C-4 The weighted average mass of waste in a tank head space in Table C-4 was calculated based upon the number of segments obtained for each data point
Estimation of the mass of waste sent to the exhauster per RMCS core or segment requires calculation of the total mass of waste sent to the exhauster Multiplying the average head space concentration during RMCS by the exhauster flow rate (in acfm) and the time of CGM operation will give the mass of waste sent to the exhauster during the CGM time frame only While the large majority of mass of waste aerosols will have exited the tank or
c -2
RPP-4826 Rev I
resettled by the time the CGM is shut off there could be some residual suspended particles remaining These would eventually pass to the exhauster but would not be picked up by the CGM filter since it was not in service An adjustment factor was used as described in the following paragraphs to account for particles that may exit to the exhauster following shut down of the CGM
Particulates are generated by RMCS when purge gas is blowing out the drill string and the bit is rotating under the waste surface This time averages about six minutes per segment Multiplying the number of RMCS segments per core by six minutes per segment and dividing by the number of minutes of CGM operation shows the creation of particulates will only occur during a nominal 3-4 of the time the CGM is operating During RMCS the normal practice is to install the CGM turn it on when personnel enter a tank farm and keep the unit in constant operation for the remainder of the shift When the portable RMCS exhauster is used the exhauster is normally started at least an hour before RMCS is initiated and kept in operation until it is time to halt operations for the week The SX exhauster is kept in constant operation Comparing exhauster operating times from Tables F-l with CGM operating times from Table C-I it can be seen the CGMs are in operation about 3-15 of the time the RMCS exhauster is operating on a tank This time comparison wasnrsquot estimated for the SX exhauster since the SX exhauster is in constant operation
With CGM operation much longer than the time period when particulates could be generated the majority of particulates generated by RMCS should have settled or been exhausted during the CGM operating period Table C-3 shows the tank head space changeouts made by the exhauster during CGM operating periods ranged from 084 to 63 The average was 24 With the CGMs operating 25-33 times longer than the aerosol generation periods and an average of over two tank head space changeouts during CGM operation the large majority of aerosols generated during RMCS will have settled out or been removed by the exhauster by the time the CGM is shut off To account for particulates remaining in the tank head space after the CGM was turned off that are subsequently removed by an exhauster it was conservatively assumed that 20 of the total mass of particles generated during RMCS were not removed from the tank head space during the CGM operating period Therefore the product of the tank head space concentration and the volume of air sent to the exhauster during the time of CGM operation was multiplied by a factor of 125 (lOOl80) to estimate the total mass of waste sent to the exhauster as a result of RMCS This is shown below for the same SX-IO1 riser 19 data point in the above calculations
[48E-7gA3] [IOOmin] [I755 min] [125]= 11E-l gwastetoexhauster
This value was divided by the number of RMCS cores and RMCS segments from Table C-1 to provide the grams per core and grams per segment in Table C-4 as follows
[ I I E- 1 g waste to exhauster] i 1 core = 11 E-I g wastelRMCS core to exhauster
and
[ 1 I E- 1 g waste to exhauster] + 5 segments = 2 I E-2 g wastelRMCS segment to exhauster
All mass per core and mass per segment values were calculated in the same manner using a spreadsheet The results are provided in Table C-4 The weighted average mass per core and mass per segment in Table C-4 were calculated based upon the number of cores or segments obtained for each data point
Summary of Calculations
There were 34 valid CGM filter paper data points from 14 RMCS CGM sampling periods in eight tanks during which I5 RMCS cores and 79 RMCS segments were obtained Based upon CGM filter paper data the results indicate that
The average tank head space mass concentration during RMCS was 4OE-5 g wastem3 The average mass of suspended solids in the tank head space during RMCS was 97E-2 g waste The average mass sent to the exhauster during RMCS was 18E-1 g wastelRMCS core The average mass sent to the exhauster during RMCS was 34E-2 g wastelRMCS segment
c - 3
RPP-4826 Rev 1
Ignoring all CGM filter paper analytical data points with a variance gtloo will result in conservative results These data points indicate negligible radioactivity was present If a value of zero was assigned to each data point with an analytical error of gtloo instead of ignoring the data point the weighted average particulate quantities in Table C-4 would be reduced by about 12
The average tank head space mass concentrations based upon CGM data will be higher than the average tank head space mass concentrations based upon filter housing NDA or dose rate The RMCS exhauster received tank air from the shifts when sampling was performed and during some of the off-shifts when no sampling was done The CGMs were only operated during the shifts when sampling was performed The air concentration drawn into the CGM and the RMCS exhauster should be roughly the came during the operating shifts but somewhat less during the off-shifts Therefore the tank head space concentration will be higher when based upon CGM data This does not impact the mass of waste sent to the exhauster per core or per segment
c -4
I
- ~
RFP-4826 Rev 1
APPENDIX D
ESTIMATION OF Rh4CS EXHAUSTER HOUSING DECONTAMINATION FACTOR
D-0
RFrsquoP-4826 Rev 1
APPENDIX D - Estimation of RMCS Exhauster Housing Decontamination Factor
Summary of Method
This Appendix estimates a Decontamination Factor (DF) for the RMCS exhausters using housing NDA data and applicable stack record sample data The Csrdquorsquo in the exhauster effluent is divided by the C S rdquo ~ in the exhauster inlet to provide a penetration efficiency The reciprocal ofthe penetration efficiency is the DF
Description
Each RMCS exhauster has an isokinetic sampler located on the stack downstream of the blower and HEPA filters A small pomp pulls air from the exhaust stack into a filter paper at a rate proportional to the exhaust flow Radionuclides in the exhaust stream passing through the sample line are caught on the filter paper The stack operating time and flow rate are recorded When the record sample filter paper is removed the filter paper is analyzed in a laboratory for radionuclides The radionuclide concentration in the stack effluent stream is calculated by dividing the quantity of material on the filter paper by the volume of air through the sampler and then dividing again by a factor to compensate for stack sampler and filter paper efficiency
Multiplying the total beta stack effluent concentration by the total off gas flow gives the total beta emissions from the exhauster The total beta emissions are multiplied by the Csrdquorsquo to total beta ratio for the waste in the tank) being exhausted to give an estimate of the C S rdquo ~ emission The C S rdquo ~ on the filters determined by NDA of the housing (see Appendix A) is added to the C S rdquo ~ emissions to give the total C S rdquo ~ input to the filter housing Dividing the emissions by the input gives the filter housing penetration efficiency Subtracting the penetration efficiency from 1 O gives the filter housing efficiency Dividing 1 O by the penetration efficiency gives the DF
RMCS Stack Record Sample Data
RMCS exhauster stack record samples are taken after completion of each sampling event on a tank Normally this is after all cores on that tank have been obtained but for BY-IO5 in 1998 record samples were taken following each core Record samples are also taken at the end of each year All samples are analyzed for total alpha and total beta At the end of each year all the filter papers for that year are composited and analyzed for individual radionuclides Sample results are entered into the Automated Bar Coding of Air Samples at Hanford (ABCASH) and Environmental Release Summary (ERS) databases Several ofthe filter papers from 1998 were reanalyzed using a longer count time to bring the error rate down
Schofield 2000b compiled and evaluated all available RMCS exhauster stack record sample data filtered out the unusable data provided derivation for the stack sampling efficiency factor and summarized the results Most of the data points were so low as to be unusable since the results were either negative or had error variances gtloo
Column 5 of Table D-1 provides the stack effluent concentrations used for calculation of the filter housing DF The stack effluent data in Table D-l come from Schofield 2000b These values include a 073 sampling efficiency factor
Calculation of RMCS Filter Housing Decontamination Factor Based upon Housing Inlet and Outlet Data
The RMCS exhauster housing NDA and stack record sample data available for exhauster Operating Periods 4 5 and 6 were used to estimate an actual DF for the RMCS exhauster housings The housing NDA data is for CSrdquo~ but there are no usable Csrdquorsquo concentrations for the RMCS exhauster outlet The RMCS exhauster stack Csrsquordquo concentrations are either negative have a variance gtloo or are not available Total beta analyses are available however so the stack eftluent C S rdquo ~ concentrations were estimated by multiplying the total beta concentration by the ratio of Csrdquorsquo to total beta in the tank waste
Column 2 of Table D-l lists the increase in CSrsquo~ on the filters for each operating period as determined by NDA This data was obtained from Table A-2
D- 1
RPP-4826 Rev 1
Column 4 of Table D-l lists the stack exhaust volume for each stack record sample period The stack exhaust volume for the exhauster installation on S-l IO was calculated by
[ZOO std ft3min][15978 hrs] [60 minhr] = 199E+6 std ftrsquo
All other stack volumes in Table D-l were calculated the same way Unlike in Appendices A B and C no adjustment was made to change the 200 scfm to actual cfm This is because the RMCS stack record sample concentrations from Table D-3 are based upon a 200 scfm flow rate rather than the actual flow rate Since the concentrations are on the same basis as the flow rate there is no need to correct to acfm
The total beta emissions for the RMCS exhauster stack were calculated by multiplying the volume by the concentration For the same S-l IO data point
[199E+6 ft3] [18E-15 pCiml] [28317mlft3] [mCi1000 pCi] = 1OE-7 mCi total beta
All other total beta emissions in Table D-l were calculated the same way
The Csrdquorsquo to total beta ratio was calculated from data in Table E-I For the same S- l I O data point
326E+5 Ci CsI3rsquo f I 14E+6 Ci total beta = 029 Ci CslhCi total beta = 029 rnCi CsrdquorsquomCi total beta
The Csrsquordquo emission for the same S-l IO data point was thus
[I OE-7 mCi total beta] [029 mCi CsrdquorsquomCi total beta] = 29E-8 mCi Csrdquorsquo
All Csrsquordquo emissions in Table D-l were calculated in the same manner
The penetration efficiency for each operating period was calculated by dividing the exhauster outlet by the filter inlet Csrdquorsquo quantities For operating period 4 this was
[81E-6 mCi] f [5OE-I + 8IE-6 mCi] = 16E-5 = 16E-3
The DF for operating period 4 is
1 + 16E-5 = 62E+4
The overall DF for periods 4 5 and 6 was calculated by dividing the efluent from all three periods by the total filter input
[95E-6 mCi] f [67E-I t 95E-6 mCi] = 14E-5 = 14E-3 penetration efficiency
I - I 4E-5 = 0999986 = 999986 filter efficiency
1 f 14E-5 = 73E+4 decontamination factor based upon housing inlet and eftluent data
Estimation of Housing Decontamination Factor Based upon General Performance Data
HEPA filters are tested at the manufacturer to a minimum 9997 efficiency using a 03 pm monodisperse aerosol After installation HEPA filters are tested in-place per ASME N5 I O to a minimum 9995 efficiency using a polydisperse aerosol with an approximate droplet size distribution of 99 less than 30 pm 50 less than 07 pm and 10 less than 04 pm The RMCS exhauster housing is tested per ASME N510 and is thus required to have a minimum removal eficiency of 9995 for an aerosol with this approximate size distribution The particle size distribution of the waste aerosols generated by RMCS is unknown but it is assumed that the removal efficiency for RMCS generated aerosols was the same as the removal efficiency for the ASME generated test aerosol
D-2
RPP-4826 Rev I
A 9995 efficiency is equivalent to a DF of 2E+3 while a 9997 efficiency is equivalent to a DF of 33E+3 The actual DF for the RMCS exhauster housing is higher than either of these It has two HEPA filters in series even though the minimum efficiency specified in the NOCs for the RMCS exhausters is only equivalent to one HEPA ERDA 1976 recommends using a DF of 3000rdquo for a filter bank where n is the number of HEPA filters in series This would result in a DF of 9E+6 for the RMCS exhauster housing This is unrealistic Using a DF of 9E+6 will calculate to Csrdquorsquo quantities on the HEPA filtersthat are orders of magnitude above what have been shown to be there based upon the measured dose rates and NDA A DF of 9E+6 would mean the dose rate would have to be almost 100 mRhr at the side of the exhauster housing instead of the 05-08 mRhr dose rates encountered The waste particles will not have the same particle size distribution entering the second HEPA filter as when entering the first The majority of the waste particles will be captured on the I rdquo HEPA filter and although the DF for each HEPA if tested individually using the ASME N5 IO aerosol test method may be 3E+3 (or higher) the overall DF of the two filters in series will not be 3000lsquo This is because the particle size distribution entering the Znd HEPA could have a greater percentage of smaller particles than that entering the 1rdquo
NUREG 1995 included an evaluation of a number of different facility stacks at the Hanford site where the HEPA filter upstream air concentrations were estimated using several different methods This report concluded that back-calculation using a value of 3000rdquo overestimated the upstream radionuclide concentration by three to four orders of magnitude when compared to filter NDA data for the nine stacks for which NDA data were obtained and by three orders of magnitude for the two stacks for which upstream air sample data were available Back- calculation using a value of 3000rdquo was shown to be high by four orders of magnitude for the single stack for which a powder release estimate was available Based upon this information the RMCS exhauster dual filter-in-series housings would have a DF of at least three and maybe four orders of magnitude less than 9E+6 or in the 1E+3 to 1 E+4 range A DF of IE+3 would he less than the minimum permissible under the NOC Comparing the older stack data and design with the newer RMCS exhauster design the minimum DF would be expected to be at least 1E+4
Table D-2 provides the available RMCS exhauster aerosol test data This information was obtained from Waldo 1999 Prior to 1998 the RMCS exhauster primary HEPA filter efficiency and either the secondaly HEPA filter or the overall efficiency for both filters were tested Starting in 1998 only the primary and secondary HEPA filter efficiency were measured The overall efficiency of the two filters in series was only measured three times in 11 setups Twice the overall penetration efficiency was lt0002 and the remaining time the only information that could be found was a value of lt005 Most individual filters had a penetration efficiency of 0002 This appears to be about the limit of the detection equipment Based upon Table D-2 data a penetration efficiency of 0002 (99998 efficiency) is normal for a single HEPA and thus a minimum for an RMCS exhauster housing Assuming a 0002 penetration efficiency for the two filters combined calculates to a DF of 5E+4 (equal to 1 +
000002) for the RMCS exhauster housing
In summary the measured DF for the RMCS exhauster housings over the period from May 1998 through June 1999 was about 73E+4 RMCS aerosol testing prior to use indicates a DF of about 5OE+4 for each of the filters separately but their overall efficiency is not measured Referenced data based on older stacks at Hanford indicate the two HEPA RMCS exhauster housing would likely have a DF of at least IE+4
Estimated Aerosol Levels During RMCS Based Upon RMCS Stack Record Sample Data
Revision 0 of this document used the positive record sample results with variance less than 100 to estimate aerosol concentrations in the exhauster inlet using an assumed exhauster housing DF of 5OE+4 This method of estimating aerosols was eliminated from Revision 1 because the stack concentrations were either too low too scattered or too questionable to provide reliable results There were 112 RMCS stack record sample data points evaluated in Schofield 2000b Excluding the total beta sample results used for estimation of the housing DF there were only ten data points remaining with positive values and variances ltloo the remaining data points were either negative had a variance gtloo or the results were not available
For comparison purposes only Schofield 2000b applied the DF of 73E+4 calculated in this document to the data points not used to calculate the exhauster housing DF to estimate aerosol concentrations upstream of the filters The results showed aerosol levels approximately the same as those estimated using NDA dose rate or CGM filter paper data when a value of zero was used for negative sample results or those with a variance gtloo When only
D-3
RPP-4826 Rev 1
the ten positive results with a variance ltloo were used the aerosol levels calculated to be two to five times higher than those estimated using NDA dose rate or CGM filter paper data Because of the variability of data resulting from the extremely low record sample concentrations and the few useable data points estimation of aerosol levels using record sample data was not included in Revision I See Schofield 2000b for further discussion of the use of record sample data to estimate aerosol levels
Summary of Calculations
A total of nine RMCS exhauster stack record sample data points were used to estimate the RMCS exhauster filter housing decontamination factor These data points were obtained when sampling on five tanks during which 10 RMCS cores and 65 RMCS segments were obtained The overall decontamination factor was 73E+4
Estimation of aerosol generation quantities based upon RMCS stack record sample data is possible However results will likely be skewed high if data points that show non-detectable levels of radionuclides present are ignored instead of using a value of zero for the data point
D-4
RPP-4826 Rev 1
APPENDIX E
TANK WASTE RADIONUCLIDE CONCENTRATIONS USED FOR AEROSOL CALCULATIONS
E-0
RPP-4826 Rev 1
APPENDIX E - Tank Waste Radionuclide Concentrations Used for Aerosol Calculations
The RMCS exhauster NDA data HEPA filter dose rate data CGM filter paper data and stack record sample data provide information on the quantity of radionuclides on the exhauster filters in the tank head space or the exhauster stack during RMCS These radioactivity quantities need to be divided by the waste radionuclide concentration specific activity to determine the mass of waste in the tank head space and in the tank gases sent to the exhauster
The mass quantities in this document were calculated using dry basis radionuclide concentrations Waste particles carried into the tank head space by the purge gas could be wet or dry If wet some of the non-chemically bound water will start to evaporate immediately providing the tank relative humidity is 400 The water present in a waste particle may be chemically bound as a hydrate or free The chemically bound water will not readily evaporate therefore even a ldquodryrdquo particle may have some water associated with it It is impractical to measure the actual water content of the waste particulates caught on the CGM filter paper the exhauster HEPA filters or the stack record sample paper Since the quantity of water in the waste particulates is unknown particulate levels were calculated using dry basis radionuclide concentrations Thus all particulate values given in this document are stated on a dry basis
The waste radionuclide concentrations on a dry basis were calculated from data available in the Tank Waste Information Network System (TWINS) The Best Basis InventorylBest Basis Summary numbers were used These values are the most complete and up to date readily available estimates for Hanford waste tank contents but do not include water The information was downloaded from TWINS into a spreadsheet The total chemical total beta and total alpha quantities were summed in the spreadsheet for all the tanks which were sampled and concentrations for Csrdquorsquo Sr9rsquo total beta and total alpha automatically calculated in pCig These concentrations are provided in Table E-I Because lab techniques for measuring gross beta levels only detect beta particles with a minimum decay energy above 150-200 kev only radionuclides with a decay energy of gt-200 kev were included in the total beta numbers
The TWINS radionuclide concentrations were obtained in December 1999 No corrections were made for decay for this document
The CGM filter paper and stack record sample data indicate the measured radionuclide values are not always in the same ratio to each other as given by TWINS nor are all radionuclides detected that TWINS indicates are present Radionuclides can be distributed unevenly in a tank Soluble fission products (primarily Csrsquordquo) are found in the liquid saltcake and in sludges Insoluble fission products and actinides are found largely in sludges as these are primarily chemical precipitates Sludge could be mixed with saltcake be present in a distinct layer at the bottom of a tank or in several layers in the tank depending upon how waste was transferred into a tank Waste particles may thus not have the same specific activity on a microscopic scale as they would have on a macro scale were the tank contents homogenized During RMCS a top to bottom core sample is attempted resulting in the drill bit and purge gas (which causes aerosols to form) passing through most ofthe waste matrix Assuming the aerosol generation rate is approximately constant during drilling the specific activity of a radionuclide in the suspended solids should be roughly the same as the average specific activity of the same radionuclide in the tank waste While the waste specific activity is probably not homogeneous from top to bottom in a tank and the aerosol generation rate will likely also vary it is beyond the scope of this document to provide an in-depth analysis of all the factors affecting aerosol radionuclide concentration Although sample radionuclide data were not always in the same ratio as provided by TWINS for the purpose of this document the simplifying assumption was made that the average tank specific activity is adequate to provide an approximation of the suspended solids specific activity for all radionuclides Average tank individual radionuclide specific activities were used in the preparation of the exhauster NOCs
The aerosol calculations presented in this document are only as accurate as the TWINS data The combined radionuclide content of all Hanford waste tanks is known fairly well since the overall content is based upon reactor production records CsrdquorsquoSrW recovery data and processing plant discharges Thus TWINS data for all tanks combined should be reasonable There are undoubtedly differences between TWINS data and the actual contents of a specific tank While the specific tank radionuclide data from TWINS used in this document may not be exact deviations from the actual concentrations are assumed to balance out over the number of tanks sampled
E- 1
RPP-4826 Rev 1
APPENDIX F
ROTARY MODE CORE SAMPLING EXHAUSTER AND CORE SAMPLE DATA
F-0
RPP-4826 Rev 1
APPENDIX F - Rotary Mode Core Sampling Exhauster and Core Sample Data
This appendix provides the basic data obtained during RMCS operations which was used in preparation of this document
Basic Operational Data
There have been three RMCS exhausters and three RMCS sampling trucks deployed since starmp of nitrogen- purged RMCS in November 1994 The exhausters are formally designated 296-P-32296-P-33 and 296-P-34 These were originally referred to as parts of RMCS Systems 2 3 and 4 respectively in the Notices of Construction (NOC) for these units The exhauster designations were changed for routine field use in 1996 to exhausters A B and C to avoid confusion with core sampling trucks 23 and 4 since any exhauster could be used with any RMCS truck Exhauster A (2) and RMCS Truck2 have not been used for RMCS since 1995 and are no longer in service for core sampling
Rotary mode core sampling has been conducted in four general time frames since 1994 These time frames were separated by down times for equipment modifications or resolution of environmental permitting and safety concerns For ease of analysis in this document exhauster operations were organized into six distinct operating periods Periods I to 6 were grouped based upon times when the same exhauster and same set of HEPA filters were being used These periods thus overlap with the general operating time frames The four operating time frames were
The first time frame lasted from November 1994 to January 1995 RMCS Truck 2 and Exhauster 2 (A) were used on Tank BY-106 along with an in-tank prefilter This tank provided the initial deployment and testing of the nitrogen-purged equipment in a waste tank During this period radiation dose rates were taken at the side of the exhauster housing Stack record samples were taken in December 1994 and January 1995
The second time frame lasted from July 1995 through October 1995 RMCS Trucks 2 and 4 were used with Exhausters 2 and 3 (A and B) on BY-105 BY-IO8 and BY-I IO During this period radiation dose rates were taken at the sides of the exhauster housings Stack record samples were taken after completion of sampling on each tank No RMCS samples were taken from BY-108 all samples were taken in push mode for this tank
The third time frame began when RMCS was restarted in December 1997 Trucks 3 and 4 were used for sampling of SX-101 SX-103 SX-105 and SX-102 with the SX tank farm exhauster providing ventilation The RMCS exhausters were not used During this period radiation dose rates were taken at the sides of the SX exhauster housing as part of HPT routine surveys SX farm exhauster stack record samples were taken when required by normal operating procedures SX record sampler and filter housing dose rate data were not evaluated for this document It would not be practical using filter dose rate or stack record sample data to estimate the RMCS aerosol addition if any to the SX ventilation system The background radiation around the SX filter housing makes measurement of any small increase in dose rate very difficult to detect The number of tanks being ventilated and the involved off-gas header routings (the exhauster is pulling on thirteen tanks in series or in parallel with the tank being sampled) and any in-tank activities in the SX tanks not being sampled would make it impractical to assess what aerosols resulted from RMCS Beginning with RMCS in SX farm radionuclide analyses were performed on the filter papers protecting the CGMs which draw air out of the tank vapor space for flammable gas detection
The fourth time frame began in May 1998 Between 1095 and 598 Exhausters B and C were extensively modified with new filter housings and other equipment to meet new NOC requirements Trucks 3 and 4 were used with Exhausters B and C (3 and 4) on S-l IO U-107 BY-105 TX-113 and TX-I 18 This period marked the first use ofthe RMCS trucks and RMCS exhausters together following resolution of flammable gas concerns and modifications to the exhausters New filters were installed Radiation dose rates were taken at the sides of the exhauster housings Stack record samples
F- 1
RPP-4826 Rev I
were taken after completion of sampling for each exhauster installation Radionuclide analyses were performed on the CGM filter papers for all tanks except TX-118 An NDA was performed on the Exhauster C housing following completion ofthe first core on TX-I 13 The housing filters when assayed contained aerosols captured by the exhauster following RMCS in S-l IO U-107 BY-105 (1998) and the first core of TX-I 13 Another NDA was performed on Exhauster C following both cores in TX-I 18 An NDA was performed following sampling of the second core in TX-I 13 using Exhauster B The time frame ran through early June 1999 No RMCS samples have been taken after June 1999 nor are any planned for the next few years
For the purposes of evaluating aerosol formation based upon RMCS exhauster housing NDA and dose rate data the exhauster operations were grouped into 6 operating periods These periods are shown in Table F-1 and restated in Tables A-I and B-I All tanks sampled in Periods 1 2 4 5 and 6 were exhausted by the same exhauster with the same housing and filters present during that period Period 3 covered the time the SX exhauster was used during RMCS in SX farm
A brief description of each RMCS tank sampling operation is provided below
Tank 241-BY-1061194 to 1294 RMCS using the nitrogen purge gas system with an exhauster was formally begun on 111794 on tank BY-106 riser IOB Exhauster 2 (A)and Truck 2 were used A sintered metal prefilter was inserted in the riser between the tank and the exhauster A total of eight segments were taken in rotary mode and five segments in push mode until sampling was halted on 122194 One RMCS core was obtained The total exhauster run time was 4878 hours The stack record sample was removed and analyzed following this run period Dose rates taken at the side of the exhauster housing during RMCS were all lt05 mRhr The in-tank prefilter was smeared for contamination when removed from the tank with the smears showing less than detectable levels of radionuclides present (Waldo 1999) The prefilter had been washed with an installed spray system prior to removal from the tank but subsequent testing showed the water flow and pressure were too low to have been effective at removing contamination
Tank 241-BY-106195 Following some process modifications RMCS in BY-IO6 riser IOB began again on 11895 Exhauster 2 (A) and Truck 2 were used The sintered metal prefilter was inserted in the riser between the tank and the exhauster RMCS was halted on 12495 over authorization basis and equipment operability issues for RMCS A total of three segments were taken in rotary mode and eleven segments in push mode One RMCS core was obtained The total exhauster run time was 1867 hours The stack record sample was removed and analyzed following this run period Dose rates taken at the side of the exhauster housing during RMCS were all lt O S mRhr The in-tank prefilter was smeared for contamination when removed from the tank with the smears showing less than detectable levels of radionuclides present (Waldo 1999) The prefilter was not washed this time
Tank 241-BY-110795 to 1095 Following resolution of RMCS authorization basis and equipment issues and completion of the fabrication and testing of Trucks 3 and 4 RMCS was begun in BY-I IO on 71195 Exhauster 2 (A) and Truck 2 were used Samples were taken from risers 128 7 128 again and 4 There was no in- tank prefilter used in this or any subsequent RMCS periods Sampling was performed until 102595 when RMCS was halted over flammable gas issues A total of 13 RMCS segments and 56 PMCS segments were taken Three RMCS cores were obtained The total exhauster run time was 1125 hours The stack record sample was removed and analyzed following this run period Dose rates taken at the side of the exhauster housing during RMCS were all lt O S mRhr
Tank 241-BY-108795 to 895 Core sampling was begun in BY-IO8 on 72595 Exhauster 3 (B) and Truck 4 were used Sampling was done in risers 12A and 7 The tank material proved soft enough so that no RMCS segments were required all segments were obtained in push mode although the exhauster was operated during part of the time sampling was performed Sampling was completed 81895 A total of 16 PMCS segments were taken The total exhauster run time was 6617 hours The stack record sample was removed and
F-2
RPP-4826 Rev 1
analyzed following this run period Dose rates taken at the side of the exhauster housing during RMCS were all lt05 mRhr
Tank 241-BY-105895 to 1095 RMCS was begun in BY-I05 riser 12A on 83095 Exhauster 3 (B) and Truck 4 were used This tank has a concrete layer on top about 12-18 inches thick which had to be drilled through Part way through sampling questions arose as to the flammable gas status of the tank and RMCS was halted on 10695 A total of 3 RMCS and 7 PMCS segments were taken One RMCS core was obtained The total exhauster run time was 4413 hours The stack record sample was removed and analyzed following this run period Dose rates taken at the side of the exhauster housing during RMCS were all lt05 mRhr
Tank 241-SX-1011297 to 298 Following resolution of extensive regulatory and authorization basis issues and installation of equipment modifications RMCS started in SX-101 with Truck 4 on 12497 An RMCS exhauster was not used since all SX farm tanks excluding SX-113 and SX-I 15 are ventilated with the SX exhauster Sampling was performed in risers 19 and 4 and was completed on 21098 A total of 9 RMCS and 6 PMCS segments were taken Two RMCS cores were obtained SX exhauster stack record samples and filter housing dose rates were obtained as part of routine operations for the SX exhauster not as part of the RMCS process Filter papers used in the suction line for the CGM were saved and analyzed in the laboratory to estimate the airborne radionuclide concentration in the tank head space Two CGM filter papers were needed for each core as moisture in the tank vapors condensed on the papers in the cold weather and began to restrict tank gas flow to the CGM
Tank 241-SX-103498 to 598 RMCS started in SX-103 with Truck 4 on 42798 The SX exhauster was used for ventilation (see SX- 101 above) Sampling was performed in risers 7 and 1 1 and was completed on 51198 A total of 6 RMCS and 18 PMCS segments were taken Two RMCS cores were obtained During sampling filter papers used in the suction line for the CGM were saved and analyzed in the laboratory to estimate the airborne radionuclide concentration in the tank head space One CGM filter paper was used during each core SX exhauster stack record samples and filter housing dose rates were obtained as part of routine operations for the SX exhauster not as part of the RMCS process
Tank 241-SX-105298 to 598 RMCS started in SX-105 with Truck 3 on 22598 The SX exhauster was used for ventilation (see SX- 101 above) Sampling was performed in risers 6 and 14 and was completed on 51598 A total of 6 RMCS and 20 PMCS segments were taken Two RMCS cores were obtained During sampling filter papers used in the suction line for the CGM were saved and analyzed in the laboratory to estimate the airborne radionuclide concentration in the tank head space Two filter papers were needed for the first core as moisture in the tank vapors condensed on the papers in the cold weather and began to restrict tank gas flow to the CGM One filter paper was used for the second core SX exhauster stack record samples and filter housing dose rates were obtained as part of routine operations for the SX exhauster not as part of the RMCS process
Tank 241-SX-102698 to 798 RMCS started in SX-102 with Truck 4 on 61798 The SX exhauster was used for ventilation (see SX- 101 above) Sampling was performed in risers 8 and 4 and was completed on 7798 A total of 2 RMCS and I8 PMCS segments were taken Two RMCS cores were obtained During sampling filter papers used in the suction line for the CGM were saved and analyzed in the laboratory to estimate the airborne radionuclide concentration in the tank head space One filter paper was used for each core SX exhauster stack record samples and filter housing dose rates were obtained as part of routine operations for the SX exhauster not as part of the RMCS process
Tank 241-S-110598 to 698 RMCS was begun in S-I10 on 51898 Exhauster C (4) and Truck 3 were used This tank marked the first use of an RMCS exhauster since 1995 Sampling was completed on 6498 Risers 6 and 14 were sampled A total of IO RMCS and 8 PMCS segments were taken Two RMCS cores were obtained The
F-3
RPP-4826 Rev I
total exhauster run time was 15978 hours The stack record sample was removed and analyzed following this run period Dose rates taken at the side of the exhauster housing during RMCS were all lt05 mRhr During sampling filter papers used in the suction line for the CGM were saved and analyzed in the laboratory to estimate the airborne radionuclide concentration in the tank head space One filter paper was used for each core Waste particles retained on the exhauster housing filters were part of the inventory subsequently measured by NDA following completion of the first core in TX-I 13
Tank 241-U-107698 to 798 RMCS was begun in U-107 on 61098 Exhauster C and Trucks 3 and 4 were used Sampling was completed on 71598 Risers 7 and 2 were sampled A total of IO RMCS and 19 PMCS segments were taken Two RMCS cores were obtained The total exhauster run time was 27385 hours The stack record sample was removed and analyzed following this run period Dose rates taken at the side of the exhauster housing during RMCS were all 105 mRihr During sampling filter papers used in the suction line for the CGM were saved and analyzed in the laboratory to estimate the airborne radionuclide concentration in the tank head space One filter paper was used for each core Waste particles retained on the exhauster housing filters were part of the inventory subsequently measured by NDA following completion of the first core in TX-I 13
Tank 24l-BY-105798 to 898 RMCS was begun in BY-105 again on 72298 Exhauster C and Trucks 3 and 4 were used Sampling was completed on 82598 Risers 7 and 1 1 B were sampled A total of 18 RMCS and 18 PMCS segments were taken The material was hard enough to require rotary mode sampling all the way to the bottom of the waste but negligible recovery was obtained After RMCS was performed to the waste bottom a PMCS core was taken in the same hole to recover material Two RMCS cores were obtained The exhauster run time was 13577 hours for the first RMCS core and 30792 hours for the second RMCS core Stack record sample information in ABCASH shows 30558 hours operation for the second core but the sampler data sheet shows the time counter was mistakenly reset 234 hours into the run No correction was made to the BY-IO5 2nd core record sample concentration for this document since the error is conservative and results in only slightly higher (ltI) record sample radionuclide concentrations for this core A stack record sample was removed and analyzed following each core giving two record samples for BY-IO5 in 1998 Dose rates taken at the side of the exhauster housing during RMCS were almost all lt05 m R h but a few readings indicated 07 mRihr This variation was assumed due to personnel reading the instrument differently or the fact that the exhauster had been used on enough tanks that by now there was sufficient activity on the filters to cause readings approximately at the background detection level The final reading when both cores were completed was lt05 m R h During sampling filter papers used in the suction line for the CGM were saved and analyzed in the laboratory to estimate the airborne radionuclide concentration in the tank head space One filter paper was used for each core Waste particles retained on the exhauster housing filters were part of the inventory subsequently measured by NDA following completion of the first core in TX-113
Tank 241-TX-113998 to 599 Core sampling was begun in TX-I 13 riser 3 on 92298 Exhauster B (3) and Truck 4 were used at the start This was the first use of Exhauster B since it was modified Exhauster B ran for a total of 8738 hours until being disconnected on 102398 During this time two PMCS segments were taken and no RMCS segments Exhauster C was then installed and operated for 5598 hours from 121098 to 122898 No RMCS or PMCS sampling was performed during this time frame RMCS segments werent taken until 299 Exhauster C ran for a 30230 hours between 122898 and 21299 Sampling was completed on the core from riser 3 on 21299 A total of 12 RMCS segments were obtained during the time Exhauster C was operating Exhauster flow rate for both exhausters was a nominal 200 scfm Stack record samples were taken following Exhauster B removal at the end of 1998 for Exhauster C and following completion ofthe first core with Exhauster C Aerosol calculations were based on only the 30230 hours run time for Exhauster C in 1999 since this was the time period during which RMCS segments were obtained Dose rates taken at the side of the exhauster housing during the short PMCS only sampling period with Exhauster B were all ltOS m R h Dose rates with Exhauster C varied between lt O S mRhr and 07 mRhr The final reading on Exhauster C following completion of the first core was 07 mFUhr During sampling filter papers used in the suction line for the CGM were saved and
F-4
RPP-4826 Rev I
analyzed in the laboratory to estimate the airborne radionuclide concentration in the tank head space One filter paper was used for the core Waste particles retained on the exhauster housing filters were part of the inventory subsequently measured by NDA following completion of this core
Sampling in riser 5 was begun on 41299 using Exhauster B and Truck 3 A total of 6 RMCS and 1 PMCS segments were taken for this core before sampling was halted on 42899 The total exhauster run time for this core was 11712 hours Problems with high vacuum in the tank required the exhauster flow rate to be reduced to 190 scfm to keep the system within pressure limits The stack record sample for the second core was removed and analyzed following the run period Dose rates taken at the side of the exhauster housing during the second core were all lt05 m M r During sampling filter papers used in the suction line for the CGM were saved and analyzed in the laboratory to estimate the airborne radionuclide concentration in the tank head space One filter paper was used An NDA was performed on the exhauster housing following this core The only radionuclides present in the housing were those from this core or what was removed from the tank head space during the non-RMCS activities in this tank from 92298 and 102398
Some clarification may be needed to explain use of the exhauster operating times and NDA dose rate and record sample data obtained during core sampling on TX-I 13 Core sampling was set up for sampling riser 3 on TX-113 in September 1998 with Exhauster B Exhauster B operated for a total of 8738 hours between 92298 and 102298 The stack record sample was removed at the end of this period The ERS database incorrectly shows the exhauster operated between 111698 and 111998 The ABCASH database shows the stack record sample was removed on 111998 The stack record sample showed positive emuent concentrations during this time period with variances 400 No RMCS samples were taken during this period so the data and time werenrsquot included when calculating RMCS aerosol numbers Exhauster B was removed and Exhauster C installed in late November-early December Exhauster C was operated for a total of 5559 hours between 121098 and 122398 The stack record sample was removed on 122898 No sampling was performed during this period so the data and time werenrsquot included when calculating RMCS aerosol numbers Exhauster C was operated for a total of 30218 hours between 122898 and 2899 All the RMCS segments from riser 3 were taken in this time period so only the data and time for this period were included when calculating RMCS aerosol numbers Exhauster B was used during sampling of riser 5 Exhauster B operated for a total of 11712 hours between 41299 and 42899
Tank 241-TX-l18599 to 699 RMCS was begun in TX-I 18 on 5699 Exhauster C (4) and Truck 4 were used Sampling was completed on 6298 Risers 9B and 12B were sampled A total of 9 RMCS segments were taken there were no PMCS segments Two RMCS cores were obtained The total exhauster run time was 21247 hours The stack record sample was removed and analyzed following this run period The maximum dose rate taken at the side of the exhauster housing following RMCS was 08 m M r CGM filter papers were not analyzed An NDA was performed on the exhauster housing following completion of the two cores The exhauster housing contained the same nuclides as for the first NDA (S-110 U-107 BY-105 and TX-I 13 first core) plus those from TX-I 18
The basic core sampling operational data used in this document includes the number of RMCS cores and segments the exhauster run times and flow rates the RMCS exhauster HEPA filter dose rates and tank vapor space temperatures Table F-l lists the basic operational data This information excluding tank vapor space temperature data was obtained from procedural data sheets in the sampling work packages (References W - 1 to WP-23)
Tank temperature data for the tanks ventilated with the RMCS exhausters was obtained from the TWINS database Plots for each tank were prepared for the time RMCS was conducted and the average value of the highest thermocouple located in the tank (the lowest temperature reading) was estimated and used as the average tank head space temperature during the RMCS period
The SX exhauster flow rates listed in Table F-l are estimates only The combined flow rate for SX-IO1 through SX-106 plus SX-109 (7 tanks) averaged 440 cfm during CY 1996 (Kaiser 1997) for an average of 63 cfm per
F-5
RPP-4826 Rev I
tank Based upon inlet flow measurements at the tank inlet HEPA filters (Fanis 1998) the flow through each individual tank (SX-IO1 through SX-106 plus SX-109) was lt55 cfm at the breather filter Assuming an exhaust flow of 100 cfm for each SX farm tank sampled is therefore conservative
Calculated Data
Calculated data include the tank head space volumes conversion of the RMCS exhauster flow rate from scfm to acfm and the number of tank head space changeouts made by an exhauster during RMCS
Tank head space volume includes the dome space volume above the top of the sidewall plus the void space between the waste surface and the top of the sidewall The formula used to calculate tank head space volumes WN
Head Space Volume in A = (DS + [(H) (12) + HI + Hb - H] (V)) - 748
Where DS = dome space volume gal H = height of tank body sidewall above knuckle A HI = height of tank knuckle area in Hb = height oftank bottom below knuckle in H = height of waste in tank in V =27555 galin of waste in SX tanks 2754 gallin in all others
The tank dome space volumes height of tank sidewall above the knuckle height of tank knuckle area and height of tank bottom below the knuckle were obtained from Reynolds 1999 The height of waste in each tank at the time of core sampling was obtained from the TWINS database Tank dimensional and waste level data are given in Table F-2 along with the calculated tank head space volumes
Aerosol calculations for Appendices A-C require exhauster flow rates in actual cubic feet per minute The RMCS exhauster flow rate is controlled and recorded in standard cubic feet per minute The mass flow rate of the exhauster air is measured and internal logic in the exhauster controller calculates what the volumetric flow rate would be if the temperature and pressure in the exhauster inlet were at standard conditions The standard conditions used in the logic controller are 29921 in Hg (760 mm Hg) and 69F (ZIT)
A correction factor is built into the exhauster control logic that assumes an atmospheric pressure of 2927 in Hg the average atmospheric pressure at Hanford The RMCS exhauster will operate at about 1-2 in H20 negative pressure resulting in about a 2916 in Hg pressure in a waste tank when the RMCS exhauster is operating To revise the indicated scfm RMCS exhauster reading to an acfm value the RMCS exhauster scfm flaw rate was multiplied by (29922916)(T+459)528 where Tis the tank head space temperature in OF The tank head space temperatures in Table F-1 were input to the spreadsheet file used for aerosol calculations and converted to acfm The flow rates in acfm are included in Table F-I
The tank head space changeouts when using the RMCS exhauster were calculated by multiplying the exhauster acfm flow rate by the time of exhauster operation and dividing the result by the tank head space volume Tank head space changeouts are listed in Table F-2
F-6
c
gt 2
RPP-4826 Rev 1
APPENDIX G
REFERENCES
G-0
RPP-4826 Rev 1
APPENDIX G - References
Diedeker 1999 NDA of RMCS HEPA Filters L P Diedeker WMH E-Mail to JS Schofield CHG November 29 I999
ERDA 1976 Nuclear Air Cleaning Handbook ERDA 76-21 Buchsted C A Fuller A B and Kahn 1 E Oak Ridge National Laboratory 1976
Farris 1998 Internal Note T R Farris LMHC to J S Schofield LMHC Breather Filter Flow Rates for SX-Farm 31698
Foust 1999 Internal Memo RMCST Exhauster HEPA Filter Dose Rate Calculations D J Foust LMHC to J S Schofield LMHC October 25 1999
Greager 1999 Correspondence No WMH-9954450 Non-Destructive Analysis of the Rotay Mode Core Sample High-Efjiciency Particulate Air Filters E M Greager WMH to P C Miller LMHC June 28 1999 [Transmittal of HNF-4199 Resultsfram NDA Measurement of the 296-P-34 RMCS HEPA Filters]
HNF 1999 HNF-SD-WM-SAR-067 Tank Waste Remediation System Final Safety Analysis Report Rev 1 The revision incorporating RMCS accident analyses was submitted as Addendum 5 to DOE as a change to the FSAR predecessor the Basis for Interim Operation (BIO) LMHC-9857075 80232764-9-KOOl Submittal of Authorization Basis Amendment Package for Rotay and Push Mode Core Sampling in Satisfaction of Perfarmance Agreement TWR 122 Expectations I and 3 D 1 Allen LMHC to A M Umek FDH August 30 1998 Addendum 5 as of mid-January 2000 is waiting for approval by DOE
Kaiser 1997 T D Kaiser LMHC E-Mail to J S Schofield LMHC SX Tank Flow Data 42197
NUREG 1995 Potential Radionuclide Emissionsfrom Stacks on the HanfordSite Part I Dose Assessment Davis W E and Barnett J M Westinghouse Hanford Company from Proceedings of the 23 DOEMRC Nuclear Air Cleaning Conference held July 25-28 1994 February 1995
Schofield 2000a Letter 74910-00-002 Use of Microshield Calculations for RMCS Exhauster Housing for Estimating Radionuclide Quantities on the Filters Using NDA and Dose Rate Measurements I S Schofield CHG to File January 62000
Schofield 2000b Letter 74910-00-003 Rev I RMCS Exhauster Stack RecordSample Data J S Schofield CHG to File January 202000
Reynolds 1999 D R Reynolds LMHC E-Mail to I S Schofield LMHC transmitting Tank Volume Calculations draft of calculations done by Mike Plesha and Reed Hendershot data to be used for RESOLVE computer program for Hanford waste tanks August 3 1999
TWINS Tank Waste Information Network System database available at httptwinspnlgovSOO lhtbinTCDgetTableListexe
Waldo 1999 letter 74910-99-009 RMCS Exhauster Aerosol Test Data E I Waldo to J S Schofield June 22 1999
WHC 1993 WHC-SD-WM-ES-225 Rev I AerosolStudy for the Rotary Mode Exhauster P M Francis Westinghouse Hanford Company April 20 1993
WHC 1997 WHC-SD-WM-SAD-035 Rev Ob A Safety Assessment of Rotary Mode Core Sampling in Flammable Gas Single Shell Tanks Hanford Site Richland Washington August 8 1997
G- I
RPP-4826 Rev I
CGM Data CGM-I Letter PARTICULATE SAMPLING OF 241-SX-IO1 DURING ROTARY MODE CORE SAMPLING D C
Langlois E2 Consulting Engineers to J S Schofield Lockheed Martin Hanford Company March 16 1998
CGM-2 Letter PARTICULATE SAMPLING OF 241-SX-I05 DURING ROTARY MODE CORE SAMPLING D C Langlois E2 Consulting Engineers to J S Schofield Lockheed Martin Hanford Company June 9 1998
CGM-3 Letter PARTICULATE SAMPLING OF 241-SX-103 DURING ROTARY MODE CORE SAMPLING D C Langlois E2 Consulting Engineers to J S Schofield Lockheed Martin Hanford Company June 12 1998
CGM-4 Letter PARTICULATE SAMPLING OF 241-S-110 DURING ROTARYMODE CORESAMPLING D C Langlois E2 Consulting Engineers to J S Schofield Lockheed Martin Hanford Company July 20 1998
CGM-5 Letter PARTICULATE SAMPLING OF 241-SX-102 DURING ROTARY MODE CORE SAMPLING D C Langlois E2 Consulting Engineers to J S Schofield Lockheed Martin Hanford Company July 22 1998
CGM-6 Letter PARTICULATE SAMPLING OF241-U-107 DURING ROTARY MODE CORE SAMPLING D C Langlois E2 Consulting Engineers to J S Schofield Lockheed Martin Hanford Company August 3 1998
CGM-7 Letter PARTICULATE SAMPLING OF 241-BY-105 DURING ROTARY MODE CORESAMPLING D C Langlois E2 Consulting Engineers to 1 S Schofield Lockheed Martin Hanford Company September 17 1998
CGM-8 Letter PARTICULATE SAMPLING OF 241-TX-I13 DURING ROTARY MODE CORESAMPLING D C Langlois E2 Consulting Engineers to J S Schofield Lockheed Martin Hanford Company March 15 1999
CGM-9 Letter PARTICULATE SAMPLING OF 241-TX-113 DURING ROTARY MODE CORE SAMPLING D C Langlois E2 Consulting Engineers to I S Schofield Lockheed Martin Hanford Company May 31 1999
Notices of Construction NOC-I DOEIRL-93-40 Radioactive Air Emissions Program Notice of Construction Rotary Mode Core-Sampling
Truck and Exhauster Approved by Letter AIR 93-707 A W Conklin WDOH to J E Rasmussen DOEIRL 7893
NOC-2 DOEIRL-94-118 Rev 0 Radioactive Air Emissions Program Notice of Construction for the Rotary Mode Core-Sampling Systems Three and Four Approved by Letter AIR 95-603 A W Conklin WDOH to J E Rasmussen DOERL 63095
NOC-3 DOERL-94-118 Rev 1 Radioactive Air Emissions Program Notice of Construction for the Rotary Mode Core-Sampling Systems Three and Four Approved by Letter AIR 98-301 W W Conklin WDOH to I E Rasmussen DOEIRL 3698
NOC-4 DOEIRL-97-70 Radioactive Air Emissions Program Notice of Construction for Rotary Mode Core- Sampling in SX Tank Farm Approved by Letter AIR 97-1 101 A W Conklin WDOH to J E Rasmussen DOEIRL 113097
NOC-5 USEPA Letter OAQ-107 (no title approving DOE submittal 97-EAP-590 dated 72997) A J Frankel USEPA to J E Rasrnussen DOEIRL 8497
NOC-5 USEPA Letter OAQ-107rsquo (nb title approving DOE submittal 97-EAP-723 dated 101797) A J Frankel USEPA to J E Rasmussen DOERL 11498
Note that both letters have ldquoOAQ-107rdquo following ldquoReply to Attn ofrdquo
G-2
RPP-4826 Rev I
Work Packages WP-I ES-94-00808 WP-2 ES-95-00258 WP-3 ES-95-00045 - WP-4 ES-95-00434 - WP-5 ws-97-00173 - WP-6 WS-97-00174 - WP-7 ws-97-00143 - WP-8 WS-97-00144 - WP-9 WS-97-00207 - WP-I 1 WS-97-00208 - WP-12 WS-98-00049 - WP-13 WS-97-00050 - WP-14 WS-97-00224 - WP- I5 WS-97-00225 - WP-16 WS-97-00230 - WP- I7 ws-97-0023 1 - WP-18 ES-97-00452 - WP-19 ES-97-00453 - WP-20 WS-98-00072 - WP-21 WS-98-00073 - WP-22 WS-98-00067 - WP-23 WS-98-00068 -
241-BY-IO6 Perform Rotary Core Sample [Riser IOB] 241-BY-I IO Rotary Core Sample [Risers 12B 7 IZB 41 241-BY-IO8 Obtain Rotary Core Sample [Risers 12A amp 71 241-BY-IO5 Rotary Mode Core Sample [Riser 12A] 241-SX-101 Rotary Mode Core Sample Riser 19 241-SX-101 Rotary Mode Core Sample Riser4 241-SX-103 Rotary Mode Core Sample Riser 7 241-SX-103 Rotary Mode Core Sample Riser I I 241-SX-105 RMCST Obtain Core Sample Riser 6 241-SX-105 RMCST Core Sample Riser 14 241-SX-102 Rotary Mode Core Sample Riser 8 241-SX-102 Rotary Mode Core Sample Riser 4 241-S-1 IO RMCST Obtain Core Sample Riser 6 241-S-1 IO RMCST Obtain Core Sample Riser 14 2414-107 RMCSTCore Sample Riser 7 241-U-107 RMCST Core Sample Riser 2 241-BY-IO5 RMCST Core Sample Riser 7 241-BY-IO5 RMCST Core Sample Riser 1 IB 241-TX-113 Rotary Core Sample Riser 3 241-TX-113 RMCST Core Sample Riser 5 241-TX-I 18 RMCST Core Sample Riser 9B 241-TX-I 18 RMCST Core Sample Riser 128
G-3
RPP-4826 Rev I
Stack total beta emissions were converted to CsrsquoI7 emissions using the C S rdquo ~ to total beta ratio for the waste in the tank being sampled The filter housing input was calculated by adding this calculated Csrdquorsquo emission to the quantity shown by NDA to be in the housing Dividing the emissions by the input provided the penetration efficiency Results of the housing efficiency and decontamination factor calculations are provided in Table D-I
Discussion of Results
All calculations were based upon radionuclides measured on the exhauster filters in the tank head space air or in the exhauster stack These radionuclide quantities were divided by the specific activity of waste in the tank to provide mass quantities in the air on the filters or in the exhaust stream Appendix E provides the waste specific activities used in this document along with limitations and potential errors associated with using them
The calculated average mass concentration in a tank head space during RMCS ranged from a low of 77E-6 gm3 based upon exhauster housing NDA data to a high of 4OE-5 gm3 based upon CGM filter paper data The weighted average of all methods was 24E-5 gm Welghted averages used in this document were based upon numbers of RMCS segments obtained during application of that method
The average mass concentration is not the peak concentration as illustrated by Figure I Figure 1 is a representation of relative concentrations only not a plot of measured concentrations during a specific sampling event Lines A and B represent aerosol concentrations at points near the drill string and at the tank outlet to the exhauster respectively Line C represents the calculated average concentration in the tank head space The peak concentration in the air to the exhauster will exceed the average tank head space concentration for short periods oftime It is beyond the scope of this document to provide a detailed spatial and time-dependent analysis of tank aerosol concentrations The methods used in this document provide an estimate of an average tank head space mass concentration only
The average mass of suspended solids in a tank head space was estimated by multiplying the average head space mass concentration by the tank head space volume The calculated average mass of suspended solids in a tank head space during RMCS ranged from a low of I 8E-2 g based upon exhauster housing NDA data to a high of 97E-2 g based upon CGM filter paper data The weighted average of all methods was 56E-2 g Comparing 56E-2 g to the 600 g and 100 g used in accident analysis assumptions it is evident that the accident analyses used peak tank head space mass levels three to four orders of magnitude greater than the average mass level in a tank head space during RMCS
Multiplying an average concentration by the tank head space volume to estimate the mass of suspended solids in the tank head space at a given time makes the simplifying assumption that the tank head space concentration is constant with time and uniform within the head space during RMCS As illustrated by Figure I the tank head space concentration is not constant with time or uniform within the head space When determining a maximum value for mass of solids in a tank head space engineering judgement needs to be applied that evaluates all the parameters involved that could increase or decrease the average mass value provided in this document With all other variables being equal the mass concentration and mass of suspended solids in a tank head space will also be affected hy the volume of the head space and the exhaust flow rate The head space volumes of the tanks sampled to date are typical of SSTs The exhauster flow rate is not expected to change for the RMCS exhauster If additional samples are taken in SX tanks where the exhauster flow rate is higher than in the four SX tanks which have already been sampled the mass present in the tank head space would be expected to be reduced
The calculated mass of waste sent to an exhauster ranged from lows of 18E-1 gRMCS core and 34E-2 W C S segment based upon CGM filter paper data to highs of 59E-I gRMCS core and 1OE-1 gRMCS segment based upon exhauster housing dose rate data The weighted average of all methods was 42E-1 gRMCS core and 69E-2 gRMCS segment Comparing the average to the 1 kgRMCS core and 35-77 glRMCS segment numbers used for the PTE estimates it is evident that the PTE estimates are conservative by at least three orders of magnitude
Results given in this document based upon total beta or Csrsquordquo data are likely more valid than alpha based results due to the higher concentrations of beta-gamma radionuclides in the waste and their greater ease of measurement when
4
RPP-4826 Rev 1
compared to alpha emitters Equal weight is given to all results regardless of whether based upon total al ha total beta or CsI3rsquo data This provides conservative results since the aerosol values based on total beta or CslfPwere normally lower than those based upon alpha results
The mass per segment numbers should be a better indicator of RMCS aerosol emissions from the tank than the mass per core numbers This is because the quantity of aerosols generated in a tank should be proportional to the time of purge gas flow and bit rotation The time of purge gas flow and bit rotation should be proportional to the number of RMCS segments taken Thus the mass of RMCS generated aerosols sent to an exhauster on a given tank should be roughly proportional to the number of RMCS segments obtained from the tank The number of RMCS segments in a core can vary To date the range has been from 1 to 12 RMCS segments per RMCS core The average has been 5 RMCS segments per RMCS core
The results for mass per core or per segment based on NDA and housing dose rate data have a firmer basis than results based upon CGM filter paper data This is because the RMCS exhauster housing NDA and dose rate methods are a direct physical measurement of essentially all the Csrsquordquo released to the exhaust stream during RMCS Aerosol measurements based upon HEPA dose rate are conservative as the filters showed no detectable dose rate for three of the five periods evaluated and barely perceptible readings after the other two
The results for tank head space concentrations and mass of waste in a tank head space during RMCS based on CGM filter paper data have a firmer hasis than results based on housing NDA or dose rate This is because the CGM filter paper data is a direct measurement of the concentration in the air in a tank head space during the time when aerosols are being generated The CGM filter paper data should provide a higher tank head space mass concentration than that calculated by filter housing NDA or dose rate This is because aerosols are only generated during times when the CGM is operating and the CGM operates for less time than the exhauster does Since the concentration is based upon dividing a filter quantity by the volume of gas passing through the filter the volume of gas in proportion to the material on the filter will be less for the CGM filter paper than for an exhauster filter resulting in a higher concentration based on CGM filter paper data A factor is included in the CGM based concentration to account for radionuclides in the dome space that have not settled out or been removed by the exhauster when the CGM is shut Off
The average results for all methods were within reasonable agreement with each other considering all the variables and assumptions involved The filter housing DF is in good agreement with expected values
This document contains seven appendices Appendices A-C provide particulate results based upon RMCS exhauster housing NDA RMCS exhauster housing dose rates and CGM filter paper data Appendix D provides an RMCS exhauster filter housing DF based on housing NDA and stack record sample data Appendix E provides waste specific activities and Appendix F provides the raw data used in Appendices A-D Appendix G provides references for this document
Conclusions
The results in this document are based upon RMCS operating experience from startup of nitrogen-purged RMCS in November 1994 through June 1999 Table 2 summarizes the information presented in the appendices Based upon this information and the lack of any significant aerosol formation seen in in-tank videos it can be concluded that past estimates of aerosol concentrations used for regulatory permits and accident analyses were conservative by a nominal three orders of magnitude
In order to estimate mass releases for regulatory permits the overall emissions with time are needed as a basis for the PTE estimates For future permits the mass per core or mass per segment values in Table 2 can be used directly with conservatism added if deemed appropriate for the tanks to be sampled When estimating maximum concentrations or maximum mass quantities in the tank head space for use in accident analyses additional conservatism needs to be added to the average concentration and mass values in Table 2
5
RPP-4826 Rev I
Tank and Date Sampled
Table 1 Summary Of Aerosol Estimation Methods Used
RMCS Aerosol Estimation Methods Exhauster Number of Used
Housing DF RMCS Cores Riser Used Period6 HEPA CGM NDA and and RMCS
Exhauster Operating Sample Exhauster
NDA Dose Filter RMCS Stack Segments Taken
BY-IO5 1998
No RMCS segments taken from BY-108 or from TX-I 13 Riser 3 using Exhauster B Any material retained on I
the filters during these operating times was assumed to come from next RMCS sampling event with the same exhauster BY-IO5 in 1998 shown as separate exhauster installations since stack record samples were pulled after each riser was sampled
Includes RMCS cores and segments only PMCS cores and segments obtained during exhauster operation not included A total of 23 RMCS cores and 115 RMCS segments were taken between 1194 and 699 The sum of cores and segments is less than sum of cores and segments obtained during data collection periods at lei since more than one aerosol estimation method was used for some sampling periods
One CGM filter paper was used for both cores in SX-102 and for both cores in U-107 3
See Appendix F for explanation of exhauster operating periods
6
RPP-4826 Rev I
Table 2 Summary Of RMCS Aerosol Data
Weighted average based upon number of RMCS segments taken with each method
7
e
Q 0 c 0 0 - 0 VJ 0 L
2
RFP-4826 Rev 1
APPENDIX A
ESTIMATION OF AEROSOLS GENERATED DURING Rh4CS BASED UPON RMCS EXHAUSTER HOUSING NON-DESTRUCTIVE ASSAY
A-0
RPP-4826 Rev I
APPENDIX A - Estimation Of Aerosols Generated During RMCS Based Upon RMCS Exhauster Housing Non-Destructive Assay
Summary of Method
This method of estimating RMCS aerosol quantities uses non-destructive assay (NDA) of the exhauster housing to determine the C S rdquo ~ quantity (Ci) on the filters inside This quantity is then divided by the C S rdquo ~ specific activity (Cig) in the waste for the tank(s) on which the exhauster and the same filters were present during sampling The resulting mass on the filters divided by the volume of air flowing through the exhauster provides an estimate of the average aerosol mass concentration in the air to the exhauster This value was multiplied by the tank head space volume to obtain the average mass of particulates present in the tank head space during RMCS The mass of waste on the filters divided by the number of rotary cores or segments taken provides the mass per core or per segment sent to the exhauster
Description
There are one prefilter and two HEPA filters in series for each RMCS exhauster Particulates captured on the filters contain radionuclides with C S rdquo ~ bein the predominant gamma emitter By performing an NDA of the exhauster housing filters the quantity of Cslg7 in the housing can be estimated This C S rdquo ~ value is then used to back-calculate to a waste mass on the filters using the mass is used to calculate the concentration of particulates in the tank exhaust stream the total suspended solids in the tank head space and the mass of waste sent to the exhauster for each RMCS core or segment taken
Exhauster operations were divided into six operating periods for evaluation in this document These periods are discussed in Appendix F and shown in Table F-I NDA data were obtained for Exhauster Operating Periods 4 5 and 6 Relevant information for these periods is also listed in Table A-I
Period 4 was for Exhauster C use during RMCS for both cores in S-l IO U-107 BY-IO5 and the first core in TX-I 13 The filters and housing were new prior to RMCS in S-110 No filter changeouts were made during this period the accumulated particulates from these RMCS events were retained on the housing prefilter primary HEPA and secondary HEPA
Period 5 was for Exhauster B use during RMCS for the second core in TX-I 13 The filters and housing were new prior to RMCS in TX-113 No filter changeouts were made during this period Exhauster B also ran for a short time during the first core in TX-113 but no RMCS segments were taken when the exhauster was operating Stack record samples (see Appendix D) indicated small levels of aerosols were present in the stack exhaust during this time period Any material collecting on the filters during this time period would show up and be counted as part of the aerosols generated during the 2rdquod RMCS core
Period 6 was for Exhauster C use during RMCS for both cores in TX-I 18 During Period 6 the filters also contained the waste particles from Period 4 No filter changeouts were made durin this period The aerosol mass generated due to RMCS in TX-I 18 was determined from the increase in Cs on the filters between Period 4 and Period 6
A description of the sampling method used for the NDA obtained following Period 4 is provided in Greager 1999 The same method was used for the NDA following Periods 5 and 6 The NDA consisted of a gamma energy analysis of the exhauster housing performed at points adjacent to the prefilter first HEPA and second HEPA The detector was mounted outside the housing and inside a lead collimator The collimator was used to minimize the background count rate and contribution from adjacent filters CsIh was the only radionuclide reported as present The NDA compared the count rates from the exhauster housing with the count rate of an National Institute of Standards and Technology (NISampT) traceable in an equivalent geometry to the RMCS exhauster housing The count rates from housing filter readings were divided by the count rate for the source to give a reported quantity of Cslrdquo on the filters
concentration in the tank waste This filter waste
3 B
source located in the middle of a filter
A- 1
RPP-4826 Rev 1
Two correction factors were applied to the reported filter Csrdquorsquo values for use in this document These are discussed in the following two sections
Reported NDA Data
The NDA results for Period 4 are provided in Greager 1999 The only radionuclide reported as present on the filters was CsI3rsquo The results are restated in Table A-2
The NDA results for Periods 5 and 6 are provided in Diedeker 1999 The only radionuclide reported as present on the filters was Csrdquorsquo The results are restated in Table A-2
Adjusted NDA Data
The reported results are based upon comparing the count rate for a reference point source located in the middle of a mock-up assembly equivalent to the exhauster housing with the count rate from the same detector inside a lead collimator placed outside the actual exhauster housing Limitations with this method include comparison of a point source with a distributed matrix and the inability of the detector to see the entire filter due to the presence of the collimator Correction factors were used to adjust the reported values to account for these two limitations
The first correction factor accounts for comparing a distributed source to the point source standard The reported results were calculated based upon a point source standard since there are no readily available filter standards with a distributed source The material in the filter housing should be fairly evenly distributed through the filter media however so comparing count rates for the filter housing to a point source standard will result in some error To correct for this error shielding calculations were performed on an exhauster housing filter assuming the CSrdquorsquo was evenly distributed throughout the filter media and then again assuming the activity was a point source in the middle of the filter Foust 1999 provides the results of these Microshield dose rate calculations Using the data in Foust 1999 Schofield 2000a shows that the dose rate at the NDA detector location would be about 0625 mFVhrmCi CSrdquorsquo for a point source and 073 mRhrmCi Cslrdquo for a distributed source To adjust the reported NDA results to what they would have been if an actual distributed standard source was available the reported values need to be multiplied by 0625 + 073 = 086
The second correction factor accounts for the detector not being able to see the entire filter contents due to the detector location inside the lead collimator Using basic geometry Schofield 2OOOa estimated the detector has about a 100 view of 608 of a HEPA filter about a 50 view of 264 of the filter and is shielded from the remaining 128 The detector count rate was thus estimated as being approximately 741 o f what it would be if the detector were not collimated To correct the reported results to what they would have been if an uncollimated detector could have been used the reported values need to be multiplied by I + 0741 = 135
Combining the two correction factors gives a single adjustment factor used of 086 x 135 = 116 Per Table A- 2 the total quantity of Csrdquorsquo reported present in the housing for Period 4 was 0430 mCi This quantity was multiplied by 116 to give 050 mCi Csrdquorsquo The reported results for Periods 5 and 6 were revised in the same manner to give 0032 mCi and 064 mCi C~rsquo~rsquorespectiveIy To determine the net increase in Csrdquorsquo for the housing during Period 6 the value from Period 4 was subtracted from the total or 064 - 050 = 014 mCi Csrdquorsquo
Calculation of Mass Quantity on Filters
Calculation of the mass of waste on the filters requires knowledge of the specific activity of the waste on the filters The specific activities used for each exhauster operating period are given in Table A-I The paragraphs below provide a derivation of the specific activities used
The specific activity values for the waste in each tank sampled is given in Table E-I Rh4CS was performed on more than one tank during Period 4 so a weighted average specific activity was used to calculate the waste mass on the filters during this period The weighted average specific activity was calculated based upon the number of RMCS segments taken from each tank sampled The number of RMCS segments obtained during
A-2
RPP-4826 Rev 1
each period for which NDA measurements were made are listed in Table A-I These values were obtained from Table F-I A weighted average specific activity for the waste on the filters in Period 4 was obtained by
[[O 227 mCigl[lO segl+[Ol2lmCigl[lO seg1+[0225 mCigl[l(l seg]+[Ol30 mCig][l2 seg]]+[SO segments] = 0182 mCi Csrdquorsquog
Calculating a weighted average based upon the number of segments assumes aerosol generation is roughly the same per segment and the specific activity of a radionuclide is constant throughout a tank These assumptions are adequate for the purpose oftbis document Aerosol generation can vary with water content waste hardness depth of sample taken nitrogen flow rate and porosity of the waste An in-depth evaluation of these parameters is beyond the scope of this document The impact of these variables is assumed to average out over all the RMCS segments taken The specific activities used do not vary greatly from tank to tank so any variations will not have a significant impact on the final aerosol results See Appendix E for further discussion of limitations on specific activities used in this document
For Period 5 the filters were new at the start and the only tank sampled with the exhauster was TX-I 13 Therefore the specific activity of CsI3rsquo for TX-I 130130 mCig was used
The same exhauster and filters used for Period 4 were used for Period 6 The net increase in Csrdquorsquo for Period 6 was determined by subtracting the Period 4 Csrdquorsquo from the total Since this net increase was only due to TX- 118 the specific activity of Csrdquorsquo for TX-I 180130 mCig was used for the waste added to the filters in Period 6 (Note it is only a coincidence that TX-I 13 and TX-118 have the same nominal Csrdquorsquo concentration)
The total mass of waste on the filters for Period 4 was thus
050 mCi i 0182 mCig waste = 275 g waste in exhauster housing
The mass of waste added to the exhauster for Period 5 was
0032 mCi + 0130 mCig waste = 025 g waste in exhauster housing
The mass of waste added to the exhauster for Period 6 was
(064 mCi - 050 mCi) + 0130 mCig waste = 11 g waste in exhauster housing
Aerosol Calculations
The tank head space particulate concentration was obtained by dividing the mass of waste sent to the exhaust stream by the volume of air sent to the exhauster The volume of air to the exhauster was obtained by multiplying the exhauster flow rate by the exhauster run times for each tank from Table F-I
For the RMCS exhausters the recorded exhauster flow rate is reported in standard cubic feet per minute (scfm) The RMCS exhauster flow rate is controlled to a nominal 200 scfm The exhauster flow rate was corrected to an actual cubic feet per minute (acfm) before calculating the tank head space aerosol concenmtion Table F-l includes the actual cfm flow rates
The calculated flow rates during RMCS for the tanks sampled during Period 4 were 207 acfm (S-1 lo) 206 acfm (U-107) 208 amp 209 acfm (BY-105) and 203 acfm (TX-I 13) The total volume oftank air through the exhauster during Period 4 was thus
[[207 cfm][ 15978 hr]+[206][27385]+[208][13577]+[209][30792]+[203][30230]][60 minh] = 146 E+7 Arsquo
The average tank head space mass concentration during RMCS in the above tanks was
[275 g + 146 E+7 Arsquo] x [35315 ftrsquomrsquo] = 664 E-6 average g waste per m3 in exhauster inlet
A-3
RPP-4826 Rev I
The gas flow rates and average tank head space mass concentrations during RMCS for Periods 5 and 6 were calculated in a similar manner
The average mass of waste in a tank head space during RMCS was calculated by multiplying the tank head space mass concentration by the tank head space volume from Table F-2 as shown below for S-1 I O
[275 g + 146 E+7 Arsquo] x [89100 ftrsquo] = 167E-2 g waste in S-1 IO head space
The particulate quantities in the other tank head spaces were calculated in a similar manner The weighted average mass in a tank head space during Period 4 was based upon the number of segments taken in each tank
The mass sent to the exhauster per RMCS core or per RMCS segment was obtained by dividing the mass of waste sent to the exhaust stream during each period by the numbers of RMCS cores or RMCS segments obtained during the exhauster operating time The average mass of waste sent to the exhauster during Period 4 is thus
275 g waste + 7 rotary cores = 39E-1 g wastelrotary core
and
275 g waste + 50 rotary segments = 55E-2 g wasteirotary segment
The mass of waste to the exhauster per RMCS core and RMCS segment for Periods 5 and 6 were calculated in a similar manner
All data were input to a spreadsheet to perform the calculations Results are provided in Table A-3
Summary of Calculations
Non Destructive Assay was performed on the RMCS exhauster filter housings used during three separate exhauster operating periods during which IO RMCS cores and 65 RMCS segments were obtained from five tanks Weighted averages of the average tank head space mass concentration average mass of suspended solids in a tank head space and average mass sent to the exhauster per RMCS core or segment for the three periods combined were calculated based upon the number of RMCS segments taken during each period Based upon RMCS exhauster housing NDA data the results indicate that
The average tank head space mass concentration during RMCS was 77E-6 g wastelmrsquo The average mass of suspended solids in the tank head space during RMCS was 18E-2 g waste The average mass sent to the exhauster during RMCS was 52E-1 g wastelcore The average mass sent to the exhauster during RMCS was 63E-2 g wasteisegment
A-4
RPP-4826 Rev 1
APPENDIX B
ESTIMATION OF AEROSOLS GENERATED DURING RMCS BASED UPON Rh4CS EXHAUSTER HEPA FILTER DOSE RATES
B-0
RPP-4826 Rev I
APPENDIX B - Estimation Of Aerosols Generated During RMCS Based Upon RMCS Exhauster HEPA Filter Dose Rates
Summary of Method
This method of estimating RMCS aerosol quantities divides the dose rate increase (mRhr) at the side of the RMCS HEPA filter housing by a calculated dose conversion factor (mRhrmCi C S rdquo ~ ) to obtain an approximation of the radionuclide quantity in the housing This radionuclide quantity is divided by the waste specific activity (mCig) to determine the mass of waste on the HEPA filter Dividing the HEPA filter waste mass by the volume of air passing through the filter provides an estimate of the average tank head space particulate concentration during RMCS Multiplying the average tank head space particulate concentration by the tank head space volume gives an estimate of the average mass of suspended particulates in the tank head space during RMCS Dividing the HEPA filter waste mass by the number of RMCS cores or RMCS segments provides the mass per RMCS core or per RMCS segment sent to the exhauster
Description
Particulates in the exhaust stream are removed by the HEPA filter(s) upstream of the exhaust fan The captured particulates contain radionuclides with CSrsquo~rsquo being the predominant gamma emitter As the particulate quantity on the HEPA filter increases the dose rate at the side of the filter housing will increase proportionately By monitoring the HEPA dose rate at the side of the filter housing the quantity of Csrsquordquo on the HEPA can be estimated This C S rdquo ~ value is then used to back-calculate to a waste mass quantity on the filter using the Csrsquordquo concentration in the tank waste This filter waste mass quantity is used to calculate the concentration of particulates in the tank exhaust stream the total suspended solids in the tank head space and the mass of waste sent to the exhauster for each RMCS core or segment taken Although radionuclides will be trapped on both the prefilter and the primary HEPA filter with a very small amount on the secondary HEPA calculations in this section were based upon the simplifying assumption that all the activity was on the primary HEPA filter
During RMCS exhauster operation the dose rate in m M r at the side of the HEPA filter housing is periodically measured with an Eberline RO-3B per procedure to indicate when radioactive particulates are building up on the filter The limit of detection of the RO-3B is 05 mRhr
Exhauster operations were divided into six operating periods for evaluation in this document These periods are discussed in Appendix F and shown in Table F-I Housing dose rate data were obtained for Exhauster Operating Periods I 24 5 and 6 Relevant information for these periods is also listed in Table B-I Dose rate data are available and were used for all tanks on which an RMCS exhauster was present and RMCS samples were taken This includes BY-106 BY-IO5 (1995) BY-I IO S-l I O U-107 BY-IO5 (1998) TX-113 and TX- 1 18 The dose rate at the end of a period was used as the basis for calculating radionuclides on the filters The only operating period for which dose rate data were not used for estimating filter radionuclide content was Period 3 Period 3 was for RMCS in SX farm using the SX exhauster
The dose rate at the side of the SX exhauster HEPA filter housing was measured during RMCS of SX farm tanks (for sampling of tanks SX-lot SX-102 SX-103 and SX-105) but the data are not useful for estimation of aerosol quantities because the SX exhauster draws on 13 tanks in parallel or in series with the tank being core sampled Many of the tanks have a much higher off gas flow rate than the sampled tank In addition there is background radiation in the area of the SX exhauster filter housing making any increase in the housing dose rate during RMCS difficult to detect
Dose Rate Data
The dose rate data for each period is listed in Table 8-2 No dose rates above minimum detectable limits were evident at the sides of any RMCS exhauster in Periods I 2 and 5
Dose rate measurements were less than detectable for Period 4 during sampling of S-l IO and U-107 When sampling on BY-IO5 there were a few readings of 07 m M r but most were ltOS mRhr This variation in
B- 1
RPP-4826 Rev 1
readings is to be expected as the specific instrument person using the instrument and location at which the dose rate is checked can vary with time The final recorded dose rate when sampling was complete on BY-IO5 was lt05 mRhr At the end of Period 4 following completion of the first core in TX-I 13 Exhauster C was listed as having a 07 m M r dose rate
Period 6 used Exhauster C again with the same housing and filters as at the end of Period 4 The final dose rate for this period was 08 m M r
Periods 124 and 5 all began with a new housing and new filters For Periods 12 and 5 it was conservatively assumed that the final dose rate was equal to 05 m M r giving an increase of 05 mRhr for each of these periods For Period 4 the dose rate increase was 07 m M r for this period Since Period 6 used the same housing and filters as Period 4 the increase for Period 6 was 08 - 07 = 01 m M r
The dose rate increase was converted into a CsIh content on the primary filter for each period Foust 1999 provides various dose rates for an RMCS exhauster housing assuming even dispersal of 1 mCi C S rdquo ~ on the first HEPA filter Using these calculations Schofield 2000a estimated a dose rate conversion factor of 16 mRhrmCi C S rdquo ~ at the detector location for an RO-3B The assumption that radionuclides are evenly distributed on the HEPA is a reasonable assumption based upon the exhauster design and the method used to measure the radiation dose rate
Gamma emitting contribute to the dose rate due to bremsstrahlung radiation and other nuclides may provide some small additional dose but the major penetrating dose rate contributor in aged SST waste is CSrdquo~ Ignoring the presence of all radionuclides (including Srm) except C S rdquo ~ in calculating a HEPA filter waste mass will provide a conservative result This is because assuming all radiation present is due to C S rdquo ~ will result in overestimating the C ~ I ~ ~ c o n t e n t of the filter housing which in turn will result in overestimating the waste mass on the HEPA filter
Dividing the HEPA dose rate for each exhauster installation by the dose conversion factor of I 6 mRhrmCi results in an increase of 031 mCi Csrdquorsquo on the RMCS exhauster filters for Periods I 2 and 5044 mCi for period 4 and 0063 mCi for Period 6
Calculation of Mass Quantity on Filters
Dividing the Csrdquorsquo content of the filters by the specific activity of C S rsquo ~ ~ in the waste gives the estimated mass of waste sent to the exhauster The specific activity value used for the waste in each tank sampled is given in Table E-I Since RMCS was performed on more than one tank in Periods 1 and 4 a weighted average specific activity was used for these periods The weighted average specific activity was calculated based upon the number of RMCS segments taken from each tank sampled during that period The number of RhKS segments obtained during each period are listed in Table B-I These data were obtained from the individual tank data in Table F- I Calculations to estimate the specific activity of waste mixtures were performed in the same manner as shown in Appendix A For Periods 2 5 and 6 RMCS samples were taken in only one tank The waste specific activity used for these periods was the specific activity of the tank sampled The specific activities used for each exhauster operating period are given in Table B-I
For all exhauster installations except BY-IO6 in 1994 and 1995 the RMCS exhausters were hooked directly to the waste tank When sampling BY-106 a prefilter was installed in the tank riser between the tank and the exhauster The prefilter was not used for BY-I IO in Period 1 or for any other tank in any other period Thus for Periods 2 4 5 and 6 the mass of waste on the HEPA was assumed equal to the mass of waste leaving the tank risers For Period 1 the mass of waste on the HEPA had to be adjusted for the BY-106 prefilter DF when estimating the combined mass of waste leaving the BY-IO6 and BY-I IO tank risers The mass of waste on the HEPA for Period 1 was
[031 mCi] [IO00 pCimCi] = 310 pCi
[310 pCi Csrdquorsquoon HEPA] + [I77 pCi C S rdquo ~ ~ waste] = 177 gwaste on HEPA
is the predominant radionuclide contributor to filter dose rates Beta emitting Srw can
on HEPA
B-2
RPP-4826 Rev 1
A decontamination factor (DF) of 5 was used to account for radionuclide removal by the BY-IO6 prefilter (see Appendix D for basis ofprefilter DF) There were 1 1 RMCS segments taken from BY-IO6 and 13 from BY- 1 IO The total mass ofwaste assumed to exit the tank risers was therefore
[ I 77 g waste] [ 1 1 + 131 [[I 151 + 131 = 28 g waste from tank risers
The DF of 5 to account for the prefilter is only applicable to the RMCS of BY-IO6 in 1994 and 1995 for all other exhauster periods the mass of waste on the HEPA was equal to the mass of waste sent to the exhauster riser
The mass of waste sent to the exhauster for Period 2 was
[031 mCi] [IO00 pCimCi] = 310 pCi Csrdquorsquo on HEPA
[3 IO pCi C S rdquo ~ on HEPA] + [225 pCi CsiI7g waste] = I 39 g waste from tank
Using the same formula the mass of waste to the exhauster from Periods 4 and 5 was 241 and 240 g respectively and the increase in waste on the filters for Period 6 was 048 g
Aerosol Calculations
The mass sent to the exhauster per RMCS core or per RMCS segment was obtained by dividing the mass of waste leaving the risers by the number of RMCS cores or RMCS segments obtained during the exhauster operating period
The tank head space particulate concentration was obtained by dividing the mass of waste leaving the riser by the volume of gas sent to the exhauster This volume of gas sent to the exhauster was obtained by multiplying the exhauster flow rate by the exhauster run time from Table F-I The calculations for aerosols generated based upon HEPA dose rates use acfm while the exhauster flow is recorded in scfm so the actin flow rates in Table F- 1 were used
The average mass of aerosols in the tank head space was obtained by multiplying the average tank head space particulate concentration by the tank head space volume from Table F-2
Following is an example of how the mass per RMCS core mass per RMCS segment average tank head space mass concentration and average mass of aerosols in the tank head space were calculated for Period 1 Data used are from Tables E-I F-I and F-2
[200 scfm] [2992+2916] [84 + 4591 + 528 = 21 1 acfm to exhauster from BY-IO6 in 11-1294
using same formula results in 210 acfm for BY-IO6 in 195 and 209 acfm for BY-I IO
28 g waste + [((21 1 acfm)(4878 hr)+(21O)(l867)+(209)(1125))(60 minhr)]= 12E-6 g wastelf to risers
[12E-6 amp] [35315 fmrsquo] =43E-5 g wastemrsquoto risers
[12E-6 gftrsquo] [53700 Arsquo in BY-106 head space] =66E-I g waste in BY-IO6 head space during RMCS
[12E-6 piftrsquo] [92000 ftrsquo in BY-110 headspace] = IIE-l g waste in BY-I10 head spaceduring RMCS
[28 g waste] [5 RMCS cores] = 56E-1 g waste per core to riser
[28 g waste] + [24 RMCS segments] = 12E-1 g waste per segment to risei
8-3
RPP-4826 Rev 1
All data were input to a spreadsheet and the mass to exhauster per RMCS core mass to exhauster per RMCS segment average tank head space mass concentration and average mass of aerosols in the tank head space were calculated for each of the RMCS exhauster operating periods in the same manner as shown above Results are given in Table 8-3
Summary of Calculations
RMCS exhauster operations were segregated into five operating periods during which RMCS was performed The Exhauster B data for BY-IO8 and TX-I 13 riser 3 was not used in these calculations as no RMCS was performed when the exhauster was operating Exhausters were operated in seven tanks during which 16 RMCS cores and 92 RMCS segments were obtained Based on RMCS filter housing dose rate data the results indicate that
These values are conservative as the assumed dose rate at the end of RMCS for Periods I 2 and 5 was assumed to be 05 mRhr In addition using a DF of 5 for the BY-IO6 prefilter skews the results high The in-tank prefilters used in both BY-IO6 sampling events showed no detectable contamination
Operatin Periods 4 and 6 were the only periods with exhauster housing dose rates above detectable The 044 mCi Csrsquordquo and 0063 mCi CsIh increase on the filters for these two periods based upon dose rate data correspond to the 050 mCi CsI3rsquo and 014 mCi Csrdquorsquo increase on the filters for these two periods based u on NDA data (see Appendix A) The 031 mCi C S rdquo ~ for Period 5 is significantly above the 0032 mCi Cslrsquolsquofor the same period determined by the NDA but this is due to assuming the housing dose rate was equal to the minimum detectable 05 mRhr
The average tank head space mass concentration during RMCS was 22E-5 g wastem3 The average mass of suspended solids in the tank head space during RMCS was 47E-2 g waste The average mass sent to the exhauster during RMCS was 59E-1 g wastelRMCS core The average mass sent to the exhauster during RMCS was 1OE-1 g wastelRMCS segment
B-4
v m
__ ~~
RPP-4826 Rev 1
APPENDIX C
ESTIMATION OF AEROSOLS GENERATED DURING RMCS BASED UPON CGM IN-LINE FILTER PAPER ANALYSES
c-0
RPP-4826 Rev I
APPENDIX C - Estimation Of Aerosols Generated During RMCS Based Upon CGM In- Line Filter Paper Analyses
Summary of Method
This method of estimating RMCS aerosol quantities uses radionuclide assay data from in-line filter papers located upstream of continuous gas monitors (CGM) sampling the tank air for flammable gases during RMCS The radionuclide content of the filter paper is divided by the waste radionuclide specific activity and the air flow through the CGM to obtain an estimate of the average mass concentration in the tank head space during the time period the CGM is on Multiplying the estimated average tank head space mass concentration by the tank head space volume gives an estimate of the average mass of particulates in the tank head space during RMCS To obtain the mass per RMCS core or per RMCS segment sent to the exhauster the tank head space average mass concentration is multiplied by the volume of gas sent to the exhauster then multiplied by a correction factor to account for particulates in the head space removed by the exhauster when the CGM is not operating and divided by the number of RMCS cores or RMCS segments
Description
During most tank waste intrusive activities performed since 1996 an intrinsically safe CGM located above ground has been used to continually monitor the tank air for flammable gases during in-tank activities The CGM sampling method draws air directly from the tank head space During RMCS the CGM sampling line is placed in the tank dome space The sampling line is located between the sampling riser and the exhaust riser if practical A pump in the CGM draws tank air up through the line at 05 litmin for measurement of the lower flammability limit (LFL) by the CGM A filter paper is installed in the sampling line upstream of the CGM to protect the unit from internal contamination
Following CGM use the CGM filter papers are normally discarded after monitoring them in the field for contamination To help estimate the tank head space particulate levels during RMCS these filter papers were retained and analyzed in the 222-S laboratory following removal from all tanks in which RMCS was performed from the fall of 1997 through April 1999 Data were collected for the four tanks in SX farm in which RMCS was performed and the next four tanks on which the RMCS exhauster was deployed These tanks are listed in Table c-I Reported CGM Data
The CGM operational data used to estimate aerosol levels during RMCS includes CGM operating times CGM flow rates and filter paper analytical data A summary report containing all the field operating data sheets for CGM usage and lab data was prepared following completion of sampling on each tank for all tanks except TX- 113 For TX-I 13 a separate report was prepared following each core These reports are References CGM-I to CGM-9 The CGM data from these reports are provided in Table C-2
There were 14 CGM installations during RMCS when CGM filter papers were collected and analyzed Each of these installations had Csrdquorsquo total alpha and total beta quantities measured on the filter papers resulting in 42 data points Eight of the measurement results were very low and had errors of gt+-loo These values were not used resulting in a net of 34 data points for calculating average head space mass concentrations based upon CGM data
Calculated Tank Head Space Radionuclide Concentrations
To calculate the average tank head space radionuclide concentrations during RMCS the filter paper radionuclide quantities were first divided by an efficiency factor to account for radionuclides which may not have been captured on the paper This adjusted radionuclide value was divided by the volume of tank air passing through the paper to give the average tank head space radionuclide concentration
The efficiency used for most stack samplers onsite is 73 (see Appendix D) Estimates attached to References CGM-I to CGM-9 indicate the CGM filter paper sampling method used should have a sampling efficiency
c- 1
RPP-4826 Rev 1
exceeding 73 For conservatism a sampling efficiency of 50 was assumed in this document for the CGM filter paper method
The estimated Csrdquorsquo total alpha and total beta concentrations in the tank vapor space were calculated by dividing the radionuclide quantity on the filter paper from Table C-2 by the assumed CGM sampling efficiency of 05 and the volume of gas going to the CGM The volume of gas going to the CGM was calculated by multiplying the time of CGM operation from Table C-2 by the CGM flow rate of 500 mlmin For example the calculated SX- 101 head space C~rsquorsquo~concentration based upon analysis of the CGM filter papers used during RMCS of riser 19 is
[[26E-4 pCi + 051 + [[I755 min][500 mlmin]] = 59E-I0pCiml
All radionuclide concentrations were calculated in a similar fashion Results are given in Table C-3 Table C-3 lists the radionuclide concentrations for all 42 data points The eight radionuclide concentrations not used for estimating mass concentrations are noted
Table C-3 also contains the calculated number of tank head space changeouts by the tank exhauster during CGM operation Tank head space changeouts were calculated by multiplying the exhauster flow rates (in actin) from Table F-1 by the CGM run times from Table C-2 and dividing by the tank head space volumes from Table F-2 The number of tank head space changeouts during CGM operation was used when estimating the waste mass sent to the exhauster See Aerosol Calculations section below for explanation
Aerosol Calculations
Average tank head space mass concentrations based upon CGM filter paper data were calculated by dividing the head space radionuclide concentrations from Table C-3 by the waste specific activities for each tank sampled The waste specific activities used came from Table E-I and are listed again in Table C-I The average of the mass concentrations based upon radionuclide data for each tank was used as the average head space mass concentration for that tank For example the calculated SX-IO1 head space mass concentration analysis from the CGM filter papers used during RMCS of riser 19 is
[59E-10 pCi Csrdquorsquoml+ 112 pCi C S rdquo ~ ~ waste] [ 28317 mlftrsquo] = 1 SE-7 g wasteA3 based upon C S rdquo ~
[ I 7E-I I pCi T A M + 504E-1 pCi TAg waste] [ 283 17 mlftrsquo] = 94E-7 g wasteamprsquo based upon Total Alpha
[43E-9 pCi TBml+ 357 pCi TBg waste] [ 28317 mlArsquo] = 34E-7 g wastel based upon Total Beta
[ [ I 5E-7 + 94E-7 + 34E-7 g wasteArsquo] f 31 = 48E-7 g wasteamp
[48E-7 g wastelt ] [3531467 Arsquom3] = 17E-5 g wastemrsquo
All tank head space mass concentrations were calculated in the same manner The results are presented in Table C-4 The weighted average tank head space mass concentration during RMCS was based upon the number of RMCS segments taken for each data point
The average aerosol mass in the head space during RMCS was calculated by multiplying the average tank head space mass concentration by the tank head space volume from Table F-2 For the same data point as above
[48E-7 g waste Arsquo] [115E+5 Arsquo] = 55E-2 g waste in SX-IO1 head space during RMCS
All average mass quantities present in the tank head space during RMCS were calculated in the same manner using a spreadsheet The results are provided in Table C-4 The weighted average mass of waste in a tank head space in Table C-4 was calculated based upon the number of segments obtained for each data point
Estimation of the mass of waste sent to the exhauster per RMCS core or segment requires calculation of the total mass of waste sent to the exhauster Multiplying the average head space concentration during RMCS by the exhauster flow rate (in acfm) and the time of CGM operation will give the mass of waste sent to the exhauster during the CGM time frame only While the large majority of mass of waste aerosols will have exited the tank or
c -2
RPP-4826 Rev I
resettled by the time the CGM is shut off there could be some residual suspended particles remaining These would eventually pass to the exhauster but would not be picked up by the CGM filter since it was not in service An adjustment factor was used as described in the following paragraphs to account for particles that may exit to the exhauster following shut down of the CGM
Particulates are generated by RMCS when purge gas is blowing out the drill string and the bit is rotating under the waste surface This time averages about six minutes per segment Multiplying the number of RMCS segments per core by six minutes per segment and dividing by the number of minutes of CGM operation shows the creation of particulates will only occur during a nominal 3-4 of the time the CGM is operating During RMCS the normal practice is to install the CGM turn it on when personnel enter a tank farm and keep the unit in constant operation for the remainder of the shift When the portable RMCS exhauster is used the exhauster is normally started at least an hour before RMCS is initiated and kept in operation until it is time to halt operations for the week The SX exhauster is kept in constant operation Comparing exhauster operating times from Tables F-l with CGM operating times from Table C-I it can be seen the CGMs are in operation about 3-15 of the time the RMCS exhauster is operating on a tank This time comparison wasnrsquot estimated for the SX exhauster since the SX exhauster is in constant operation
With CGM operation much longer than the time period when particulates could be generated the majority of particulates generated by RMCS should have settled or been exhausted during the CGM operating period Table C-3 shows the tank head space changeouts made by the exhauster during CGM operating periods ranged from 084 to 63 The average was 24 With the CGMs operating 25-33 times longer than the aerosol generation periods and an average of over two tank head space changeouts during CGM operation the large majority of aerosols generated during RMCS will have settled out or been removed by the exhauster by the time the CGM is shut off To account for particulates remaining in the tank head space after the CGM was turned off that are subsequently removed by an exhauster it was conservatively assumed that 20 of the total mass of particles generated during RMCS were not removed from the tank head space during the CGM operating period Therefore the product of the tank head space concentration and the volume of air sent to the exhauster during the time of CGM operation was multiplied by a factor of 125 (lOOl80) to estimate the total mass of waste sent to the exhauster as a result of RMCS This is shown below for the same SX-IO1 riser 19 data point in the above calculations
[48E-7gA3] [IOOmin] [I755 min] [125]= 11E-l gwastetoexhauster
This value was divided by the number of RMCS cores and RMCS segments from Table C-1 to provide the grams per core and grams per segment in Table C-4 as follows
[ I I E- 1 g waste to exhauster] i 1 core = 11 E-I g wastelRMCS core to exhauster
and
[ 1 I E- 1 g waste to exhauster] + 5 segments = 2 I E-2 g wastelRMCS segment to exhauster
All mass per core and mass per segment values were calculated in the same manner using a spreadsheet The results are provided in Table C-4 The weighted average mass per core and mass per segment in Table C-4 were calculated based upon the number of cores or segments obtained for each data point
Summary of Calculations
There were 34 valid CGM filter paper data points from 14 RMCS CGM sampling periods in eight tanks during which I5 RMCS cores and 79 RMCS segments were obtained Based upon CGM filter paper data the results indicate that
The average tank head space mass concentration during RMCS was 4OE-5 g wastem3 The average mass of suspended solids in the tank head space during RMCS was 97E-2 g waste The average mass sent to the exhauster during RMCS was 18E-1 g wastelRMCS core The average mass sent to the exhauster during RMCS was 34E-2 g wastelRMCS segment
c - 3
RPP-4826 Rev 1
Ignoring all CGM filter paper analytical data points with a variance gtloo will result in conservative results These data points indicate negligible radioactivity was present If a value of zero was assigned to each data point with an analytical error of gtloo instead of ignoring the data point the weighted average particulate quantities in Table C-4 would be reduced by about 12
The average tank head space mass concentrations based upon CGM data will be higher than the average tank head space mass concentrations based upon filter housing NDA or dose rate The RMCS exhauster received tank air from the shifts when sampling was performed and during some of the off-shifts when no sampling was done The CGMs were only operated during the shifts when sampling was performed The air concentration drawn into the CGM and the RMCS exhauster should be roughly the came during the operating shifts but somewhat less during the off-shifts Therefore the tank head space concentration will be higher when based upon CGM data This does not impact the mass of waste sent to the exhauster per core or per segment
c -4
I
- ~
RFP-4826 Rev 1
APPENDIX D
ESTIMATION OF Rh4CS EXHAUSTER HOUSING DECONTAMINATION FACTOR
D-0
RFrsquoP-4826 Rev 1
APPENDIX D - Estimation of RMCS Exhauster Housing Decontamination Factor
Summary of Method
This Appendix estimates a Decontamination Factor (DF) for the RMCS exhausters using housing NDA data and applicable stack record sample data The Csrdquorsquo in the exhauster effluent is divided by the C S rdquo ~ in the exhauster inlet to provide a penetration efficiency The reciprocal ofthe penetration efficiency is the DF
Description
Each RMCS exhauster has an isokinetic sampler located on the stack downstream of the blower and HEPA filters A small pomp pulls air from the exhaust stack into a filter paper at a rate proportional to the exhaust flow Radionuclides in the exhaust stream passing through the sample line are caught on the filter paper The stack operating time and flow rate are recorded When the record sample filter paper is removed the filter paper is analyzed in a laboratory for radionuclides The radionuclide concentration in the stack effluent stream is calculated by dividing the quantity of material on the filter paper by the volume of air through the sampler and then dividing again by a factor to compensate for stack sampler and filter paper efficiency
Multiplying the total beta stack effluent concentration by the total off gas flow gives the total beta emissions from the exhauster The total beta emissions are multiplied by the Csrdquorsquo to total beta ratio for the waste in the tank) being exhausted to give an estimate of the C S rdquo ~ emission The C S rdquo ~ on the filters determined by NDA of the housing (see Appendix A) is added to the C S rdquo ~ emissions to give the total C S rdquo ~ input to the filter housing Dividing the emissions by the input gives the filter housing penetration efficiency Subtracting the penetration efficiency from 1 O gives the filter housing efficiency Dividing 1 O by the penetration efficiency gives the DF
RMCS Stack Record Sample Data
RMCS exhauster stack record samples are taken after completion of each sampling event on a tank Normally this is after all cores on that tank have been obtained but for BY-IO5 in 1998 record samples were taken following each core Record samples are also taken at the end of each year All samples are analyzed for total alpha and total beta At the end of each year all the filter papers for that year are composited and analyzed for individual radionuclides Sample results are entered into the Automated Bar Coding of Air Samples at Hanford (ABCASH) and Environmental Release Summary (ERS) databases Several ofthe filter papers from 1998 were reanalyzed using a longer count time to bring the error rate down
Schofield 2000b compiled and evaluated all available RMCS exhauster stack record sample data filtered out the unusable data provided derivation for the stack sampling efficiency factor and summarized the results Most of the data points were so low as to be unusable since the results were either negative or had error variances gtloo
Column 5 of Table D-1 provides the stack effluent concentrations used for calculation of the filter housing DF The stack effluent data in Table D-l come from Schofield 2000b These values include a 073 sampling efficiency factor
Calculation of RMCS Filter Housing Decontamination Factor Based upon Housing Inlet and Outlet Data
The RMCS exhauster housing NDA and stack record sample data available for exhauster Operating Periods 4 5 and 6 were used to estimate an actual DF for the RMCS exhauster housings The housing NDA data is for CSrdquo~ but there are no usable Csrdquorsquo concentrations for the RMCS exhauster outlet The RMCS exhauster stack Csrsquordquo concentrations are either negative have a variance gtloo or are not available Total beta analyses are available however so the stack eftluent C S rdquo ~ concentrations were estimated by multiplying the total beta concentration by the ratio of Csrdquorsquo to total beta in the tank waste
Column 2 of Table D-l lists the increase in CSrsquo~ on the filters for each operating period as determined by NDA This data was obtained from Table A-2
D- 1
RPP-4826 Rev 1
Column 4 of Table D-l lists the stack exhaust volume for each stack record sample period The stack exhaust volume for the exhauster installation on S-l IO was calculated by
[ZOO std ft3min][15978 hrs] [60 minhr] = 199E+6 std ftrsquo
All other stack volumes in Table D-l were calculated the same way Unlike in Appendices A B and C no adjustment was made to change the 200 scfm to actual cfm This is because the RMCS stack record sample concentrations from Table D-3 are based upon a 200 scfm flow rate rather than the actual flow rate Since the concentrations are on the same basis as the flow rate there is no need to correct to acfm
The total beta emissions for the RMCS exhauster stack were calculated by multiplying the volume by the concentration For the same S-l IO data point
[199E+6 ft3] [18E-15 pCiml] [28317mlft3] [mCi1000 pCi] = 1OE-7 mCi total beta
All other total beta emissions in Table D-l were calculated the same way
The Csrdquorsquo to total beta ratio was calculated from data in Table E-I For the same S- l I O data point
326E+5 Ci CsI3rsquo f I 14E+6 Ci total beta = 029 Ci CslhCi total beta = 029 rnCi CsrdquorsquomCi total beta
The Csrsquordquo emission for the same S-l IO data point was thus
[I OE-7 mCi total beta] [029 mCi CsrdquorsquomCi total beta] = 29E-8 mCi Csrdquorsquo
All Csrsquordquo emissions in Table D-l were calculated in the same manner
The penetration efficiency for each operating period was calculated by dividing the exhauster outlet by the filter inlet Csrdquorsquo quantities For operating period 4 this was
[81E-6 mCi] f [5OE-I + 8IE-6 mCi] = 16E-5 = 16E-3
The DF for operating period 4 is
1 + 16E-5 = 62E+4
The overall DF for periods 4 5 and 6 was calculated by dividing the efluent from all three periods by the total filter input
[95E-6 mCi] f [67E-I t 95E-6 mCi] = 14E-5 = 14E-3 penetration efficiency
I - I 4E-5 = 0999986 = 999986 filter efficiency
1 f 14E-5 = 73E+4 decontamination factor based upon housing inlet and eftluent data
Estimation of Housing Decontamination Factor Based upon General Performance Data
HEPA filters are tested at the manufacturer to a minimum 9997 efficiency using a 03 pm monodisperse aerosol After installation HEPA filters are tested in-place per ASME N5 I O to a minimum 9995 efficiency using a polydisperse aerosol with an approximate droplet size distribution of 99 less than 30 pm 50 less than 07 pm and 10 less than 04 pm The RMCS exhauster housing is tested per ASME N510 and is thus required to have a minimum removal eficiency of 9995 for an aerosol with this approximate size distribution The particle size distribution of the waste aerosols generated by RMCS is unknown but it is assumed that the removal efficiency for RMCS generated aerosols was the same as the removal efficiency for the ASME generated test aerosol
D-2
RPP-4826 Rev I
A 9995 efficiency is equivalent to a DF of 2E+3 while a 9997 efficiency is equivalent to a DF of 33E+3 The actual DF for the RMCS exhauster housing is higher than either of these It has two HEPA filters in series even though the minimum efficiency specified in the NOCs for the RMCS exhausters is only equivalent to one HEPA ERDA 1976 recommends using a DF of 3000rdquo for a filter bank where n is the number of HEPA filters in series This would result in a DF of 9E+6 for the RMCS exhauster housing This is unrealistic Using a DF of 9E+6 will calculate to Csrdquorsquo quantities on the HEPA filtersthat are orders of magnitude above what have been shown to be there based upon the measured dose rates and NDA A DF of 9E+6 would mean the dose rate would have to be almost 100 mRhr at the side of the exhauster housing instead of the 05-08 mRhr dose rates encountered The waste particles will not have the same particle size distribution entering the second HEPA filter as when entering the first The majority of the waste particles will be captured on the I rdquo HEPA filter and although the DF for each HEPA if tested individually using the ASME N5 IO aerosol test method may be 3E+3 (or higher) the overall DF of the two filters in series will not be 3000lsquo This is because the particle size distribution entering the Znd HEPA could have a greater percentage of smaller particles than that entering the 1rdquo
NUREG 1995 included an evaluation of a number of different facility stacks at the Hanford site where the HEPA filter upstream air concentrations were estimated using several different methods This report concluded that back-calculation using a value of 3000rdquo overestimated the upstream radionuclide concentration by three to four orders of magnitude when compared to filter NDA data for the nine stacks for which NDA data were obtained and by three orders of magnitude for the two stacks for which upstream air sample data were available Back- calculation using a value of 3000rdquo was shown to be high by four orders of magnitude for the single stack for which a powder release estimate was available Based upon this information the RMCS exhauster dual filter-in-series housings would have a DF of at least three and maybe four orders of magnitude less than 9E+6 or in the 1E+3 to 1 E+4 range A DF of IE+3 would he less than the minimum permissible under the NOC Comparing the older stack data and design with the newer RMCS exhauster design the minimum DF would be expected to be at least 1E+4
Table D-2 provides the available RMCS exhauster aerosol test data This information was obtained from Waldo 1999 Prior to 1998 the RMCS exhauster primary HEPA filter efficiency and either the secondaly HEPA filter or the overall efficiency for both filters were tested Starting in 1998 only the primary and secondary HEPA filter efficiency were measured The overall efficiency of the two filters in series was only measured three times in 11 setups Twice the overall penetration efficiency was lt0002 and the remaining time the only information that could be found was a value of lt005 Most individual filters had a penetration efficiency of 0002 This appears to be about the limit of the detection equipment Based upon Table D-2 data a penetration efficiency of 0002 (99998 efficiency) is normal for a single HEPA and thus a minimum for an RMCS exhauster housing Assuming a 0002 penetration efficiency for the two filters combined calculates to a DF of 5E+4 (equal to 1 +
000002) for the RMCS exhauster housing
In summary the measured DF for the RMCS exhauster housings over the period from May 1998 through June 1999 was about 73E+4 RMCS aerosol testing prior to use indicates a DF of about 5OE+4 for each of the filters separately but their overall efficiency is not measured Referenced data based on older stacks at Hanford indicate the two HEPA RMCS exhauster housing would likely have a DF of at least IE+4
Estimated Aerosol Levels During RMCS Based Upon RMCS Stack Record Sample Data
Revision 0 of this document used the positive record sample results with variance less than 100 to estimate aerosol concentrations in the exhauster inlet using an assumed exhauster housing DF of 5OE+4 This method of estimating aerosols was eliminated from Revision 1 because the stack concentrations were either too low too scattered or too questionable to provide reliable results There were 112 RMCS stack record sample data points evaluated in Schofield 2000b Excluding the total beta sample results used for estimation of the housing DF there were only ten data points remaining with positive values and variances ltloo the remaining data points were either negative had a variance gtloo or the results were not available
For comparison purposes only Schofield 2000b applied the DF of 73E+4 calculated in this document to the data points not used to calculate the exhauster housing DF to estimate aerosol concentrations upstream of the filters The results showed aerosol levels approximately the same as those estimated using NDA dose rate or CGM filter paper data when a value of zero was used for negative sample results or those with a variance gtloo When only
D-3
RPP-4826 Rev 1
the ten positive results with a variance ltloo were used the aerosol levels calculated to be two to five times higher than those estimated using NDA dose rate or CGM filter paper data Because of the variability of data resulting from the extremely low record sample concentrations and the few useable data points estimation of aerosol levels using record sample data was not included in Revision I See Schofield 2000b for further discussion of the use of record sample data to estimate aerosol levels
Summary of Calculations
A total of nine RMCS exhauster stack record sample data points were used to estimate the RMCS exhauster filter housing decontamination factor These data points were obtained when sampling on five tanks during which 10 RMCS cores and 65 RMCS segments were obtained The overall decontamination factor was 73E+4
Estimation of aerosol generation quantities based upon RMCS stack record sample data is possible However results will likely be skewed high if data points that show non-detectable levels of radionuclides present are ignored instead of using a value of zero for the data point
D-4
RPP-4826 Rev 1
APPENDIX E
TANK WASTE RADIONUCLIDE CONCENTRATIONS USED FOR AEROSOL CALCULATIONS
E-0
RPP-4826 Rev 1
APPENDIX E - Tank Waste Radionuclide Concentrations Used for Aerosol Calculations
The RMCS exhauster NDA data HEPA filter dose rate data CGM filter paper data and stack record sample data provide information on the quantity of radionuclides on the exhauster filters in the tank head space or the exhauster stack during RMCS These radioactivity quantities need to be divided by the waste radionuclide concentration specific activity to determine the mass of waste in the tank head space and in the tank gases sent to the exhauster
The mass quantities in this document were calculated using dry basis radionuclide concentrations Waste particles carried into the tank head space by the purge gas could be wet or dry If wet some of the non-chemically bound water will start to evaporate immediately providing the tank relative humidity is 400 The water present in a waste particle may be chemically bound as a hydrate or free The chemically bound water will not readily evaporate therefore even a ldquodryrdquo particle may have some water associated with it It is impractical to measure the actual water content of the waste particulates caught on the CGM filter paper the exhauster HEPA filters or the stack record sample paper Since the quantity of water in the waste particulates is unknown particulate levels were calculated using dry basis radionuclide concentrations Thus all particulate values given in this document are stated on a dry basis
The waste radionuclide concentrations on a dry basis were calculated from data available in the Tank Waste Information Network System (TWINS) The Best Basis InventorylBest Basis Summary numbers were used These values are the most complete and up to date readily available estimates for Hanford waste tank contents but do not include water The information was downloaded from TWINS into a spreadsheet The total chemical total beta and total alpha quantities were summed in the spreadsheet for all the tanks which were sampled and concentrations for Csrdquorsquo Sr9rsquo total beta and total alpha automatically calculated in pCig These concentrations are provided in Table E-I Because lab techniques for measuring gross beta levels only detect beta particles with a minimum decay energy above 150-200 kev only radionuclides with a decay energy of gt-200 kev were included in the total beta numbers
The TWINS radionuclide concentrations were obtained in December 1999 No corrections were made for decay for this document
The CGM filter paper and stack record sample data indicate the measured radionuclide values are not always in the same ratio to each other as given by TWINS nor are all radionuclides detected that TWINS indicates are present Radionuclides can be distributed unevenly in a tank Soluble fission products (primarily Csrsquordquo) are found in the liquid saltcake and in sludges Insoluble fission products and actinides are found largely in sludges as these are primarily chemical precipitates Sludge could be mixed with saltcake be present in a distinct layer at the bottom of a tank or in several layers in the tank depending upon how waste was transferred into a tank Waste particles may thus not have the same specific activity on a microscopic scale as they would have on a macro scale were the tank contents homogenized During RMCS a top to bottom core sample is attempted resulting in the drill bit and purge gas (which causes aerosols to form) passing through most ofthe waste matrix Assuming the aerosol generation rate is approximately constant during drilling the specific activity of a radionuclide in the suspended solids should be roughly the same as the average specific activity of the same radionuclide in the tank waste While the waste specific activity is probably not homogeneous from top to bottom in a tank and the aerosol generation rate will likely also vary it is beyond the scope of this document to provide an in-depth analysis of all the factors affecting aerosol radionuclide concentration Although sample radionuclide data were not always in the same ratio as provided by TWINS for the purpose of this document the simplifying assumption was made that the average tank specific activity is adequate to provide an approximation of the suspended solids specific activity for all radionuclides Average tank individual radionuclide specific activities were used in the preparation of the exhauster NOCs
The aerosol calculations presented in this document are only as accurate as the TWINS data The combined radionuclide content of all Hanford waste tanks is known fairly well since the overall content is based upon reactor production records CsrdquorsquoSrW recovery data and processing plant discharges Thus TWINS data for all tanks combined should be reasonable There are undoubtedly differences between TWINS data and the actual contents of a specific tank While the specific tank radionuclide data from TWINS used in this document may not be exact deviations from the actual concentrations are assumed to balance out over the number of tanks sampled
E- 1
RPP-4826 Rev 1
APPENDIX F
ROTARY MODE CORE SAMPLING EXHAUSTER AND CORE SAMPLE DATA
F-0
RPP-4826 Rev 1
APPENDIX F - Rotary Mode Core Sampling Exhauster and Core Sample Data
This appendix provides the basic data obtained during RMCS operations which was used in preparation of this document
Basic Operational Data
There have been three RMCS exhausters and three RMCS sampling trucks deployed since starmp of nitrogen- purged RMCS in November 1994 The exhausters are formally designated 296-P-32296-P-33 and 296-P-34 These were originally referred to as parts of RMCS Systems 2 3 and 4 respectively in the Notices of Construction (NOC) for these units The exhauster designations were changed for routine field use in 1996 to exhausters A B and C to avoid confusion with core sampling trucks 23 and 4 since any exhauster could be used with any RMCS truck Exhauster A (2) and RMCS Truck2 have not been used for RMCS since 1995 and are no longer in service for core sampling
Rotary mode core sampling has been conducted in four general time frames since 1994 These time frames were separated by down times for equipment modifications or resolution of environmental permitting and safety concerns For ease of analysis in this document exhauster operations were organized into six distinct operating periods Periods I to 6 were grouped based upon times when the same exhauster and same set of HEPA filters were being used These periods thus overlap with the general operating time frames The four operating time frames were
The first time frame lasted from November 1994 to January 1995 RMCS Truck 2 and Exhauster 2 (A) were used on Tank BY-106 along with an in-tank prefilter This tank provided the initial deployment and testing of the nitrogen-purged equipment in a waste tank During this period radiation dose rates were taken at the side of the exhauster housing Stack record samples were taken in December 1994 and January 1995
The second time frame lasted from July 1995 through October 1995 RMCS Trucks 2 and 4 were used with Exhausters 2 and 3 (A and B) on BY-105 BY-IO8 and BY-I IO During this period radiation dose rates were taken at the sides of the exhauster housings Stack record samples were taken after completion of sampling on each tank No RMCS samples were taken from BY-108 all samples were taken in push mode for this tank
The third time frame began when RMCS was restarted in December 1997 Trucks 3 and 4 were used for sampling of SX-101 SX-103 SX-105 and SX-102 with the SX tank farm exhauster providing ventilation The RMCS exhausters were not used During this period radiation dose rates were taken at the sides of the SX exhauster housing as part of HPT routine surveys SX farm exhauster stack record samples were taken when required by normal operating procedures SX record sampler and filter housing dose rate data were not evaluated for this document It would not be practical using filter dose rate or stack record sample data to estimate the RMCS aerosol addition if any to the SX ventilation system The background radiation around the SX filter housing makes measurement of any small increase in dose rate very difficult to detect The number of tanks being ventilated and the involved off-gas header routings (the exhauster is pulling on thirteen tanks in series or in parallel with the tank being sampled) and any in-tank activities in the SX tanks not being sampled would make it impractical to assess what aerosols resulted from RMCS Beginning with RMCS in SX farm radionuclide analyses were performed on the filter papers protecting the CGMs which draw air out of the tank vapor space for flammable gas detection
The fourth time frame began in May 1998 Between 1095 and 598 Exhausters B and C were extensively modified with new filter housings and other equipment to meet new NOC requirements Trucks 3 and 4 were used with Exhausters B and C (3 and 4) on S-l IO U-107 BY-105 TX-113 and TX-I 18 This period marked the first use ofthe RMCS trucks and RMCS exhausters together following resolution of flammable gas concerns and modifications to the exhausters New filters were installed Radiation dose rates were taken at the sides of the exhauster housings Stack record samples
F- 1
RPP-4826 Rev I
were taken after completion of sampling for each exhauster installation Radionuclide analyses were performed on the CGM filter papers for all tanks except TX-118 An NDA was performed on the Exhauster C housing following completion ofthe first core on TX-I 13 The housing filters when assayed contained aerosols captured by the exhauster following RMCS in S-l IO U-107 BY-105 (1998) and the first core of TX-I 13 Another NDA was performed on Exhauster C following both cores in TX-I 18 An NDA was performed following sampling of the second core in TX-I 13 using Exhauster B The time frame ran through early June 1999 No RMCS samples have been taken after June 1999 nor are any planned for the next few years
For the purposes of evaluating aerosol formation based upon RMCS exhauster housing NDA and dose rate data the exhauster operations were grouped into 6 operating periods These periods are shown in Table F-1 and restated in Tables A-I and B-I All tanks sampled in Periods 1 2 4 5 and 6 were exhausted by the same exhauster with the same housing and filters present during that period Period 3 covered the time the SX exhauster was used during RMCS in SX farm
A brief description of each RMCS tank sampling operation is provided below
Tank 241-BY-1061194 to 1294 RMCS using the nitrogen purge gas system with an exhauster was formally begun on 111794 on tank BY-106 riser IOB Exhauster 2 (A)and Truck 2 were used A sintered metal prefilter was inserted in the riser between the tank and the exhauster A total of eight segments were taken in rotary mode and five segments in push mode until sampling was halted on 122194 One RMCS core was obtained The total exhauster run time was 4878 hours The stack record sample was removed and analyzed following this run period Dose rates taken at the side of the exhauster housing during RMCS were all lt05 mRhr The in-tank prefilter was smeared for contamination when removed from the tank with the smears showing less than detectable levels of radionuclides present (Waldo 1999) The prefilter had been washed with an installed spray system prior to removal from the tank but subsequent testing showed the water flow and pressure were too low to have been effective at removing contamination
Tank 241-BY-106195 Following some process modifications RMCS in BY-IO6 riser IOB began again on 11895 Exhauster 2 (A) and Truck 2 were used The sintered metal prefilter was inserted in the riser between the tank and the exhauster RMCS was halted on 12495 over authorization basis and equipment operability issues for RMCS A total of three segments were taken in rotary mode and eleven segments in push mode One RMCS core was obtained The total exhauster run time was 1867 hours The stack record sample was removed and analyzed following this run period Dose rates taken at the side of the exhauster housing during RMCS were all lt O S mRhr The in-tank prefilter was smeared for contamination when removed from the tank with the smears showing less than detectable levels of radionuclides present (Waldo 1999) The prefilter was not washed this time
Tank 241-BY-110795 to 1095 Following resolution of RMCS authorization basis and equipment issues and completion of the fabrication and testing of Trucks 3 and 4 RMCS was begun in BY-I IO on 71195 Exhauster 2 (A) and Truck 2 were used Samples were taken from risers 128 7 128 again and 4 There was no in- tank prefilter used in this or any subsequent RMCS periods Sampling was performed until 102595 when RMCS was halted over flammable gas issues A total of 13 RMCS segments and 56 PMCS segments were taken Three RMCS cores were obtained The total exhauster run time was 1125 hours The stack record sample was removed and analyzed following this run period Dose rates taken at the side of the exhauster housing during RMCS were all lt O S mRhr
Tank 241-BY-108795 to 895 Core sampling was begun in BY-IO8 on 72595 Exhauster 3 (B) and Truck 4 were used Sampling was done in risers 12A and 7 The tank material proved soft enough so that no RMCS segments were required all segments were obtained in push mode although the exhauster was operated during part of the time sampling was performed Sampling was completed 81895 A total of 16 PMCS segments were taken The total exhauster run time was 6617 hours The stack record sample was removed and
F-2
RPP-4826 Rev 1
analyzed following this run period Dose rates taken at the side of the exhauster housing during RMCS were all lt05 mRhr
Tank 241-BY-105895 to 1095 RMCS was begun in BY-I05 riser 12A on 83095 Exhauster 3 (B) and Truck 4 were used This tank has a concrete layer on top about 12-18 inches thick which had to be drilled through Part way through sampling questions arose as to the flammable gas status of the tank and RMCS was halted on 10695 A total of 3 RMCS and 7 PMCS segments were taken One RMCS core was obtained The total exhauster run time was 4413 hours The stack record sample was removed and analyzed following this run period Dose rates taken at the side of the exhauster housing during RMCS were all lt05 mRhr
Tank 241-SX-1011297 to 298 Following resolution of extensive regulatory and authorization basis issues and installation of equipment modifications RMCS started in SX-101 with Truck 4 on 12497 An RMCS exhauster was not used since all SX farm tanks excluding SX-113 and SX-I 15 are ventilated with the SX exhauster Sampling was performed in risers 19 and 4 and was completed on 21098 A total of 9 RMCS and 6 PMCS segments were taken Two RMCS cores were obtained SX exhauster stack record samples and filter housing dose rates were obtained as part of routine operations for the SX exhauster not as part of the RMCS process Filter papers used in the suction line for the CGM were saved and analyzed in the laboratory to estimate the airborne radionuclide concentration in the tank head space Two CGM filter papers were needed for each core as moisture in the tank vapors condensed on the papers in the cold weather and began to restrict tank gas flow to the CGM
Tank 241-SX-103498 to 598 RMCS started in SX-103 with Truck 4 on 42798 The SX exhauster was used for ventilation (see SX- 101 above) Sampling was performed in risers 7 and 1 1 and was completed on 51198 A total of 6 RMCS and 18 PMCS segments were taken Two RMCS cores were obtained During sampling filter papers used in the suction line for the CGM were saved and analyzed in the laboratory to estimate the airborne radionuclide concentration in the tank head space One CGM filter paper was used during each core SX exhauster stack record samples and filter housing dose rates were obtained as part of routine operations for the SX exhauster not as part of the RMCS process
Tank 241-SX-105298 to 598 RMCS started in SX-105 with Truck 3 on 22598 The SX exhauster was used for ventilation (see SX- 101 above) Sampling was performed in risers 6 and 14 and was completed on 51598 A total of 6 RMCS and 20 PMCS segments were taken Two RMCS cores were obtained During sampling filter papers used in the suction line for the CGM were saved and analyzed in the laboratory to estimate the airborne radionuclide concentration in the tank head space Two filter papers were needed for the first core as moisture in the tank vapors condensed on the papers in the cold weather and began to restrict tank gas flow to the CGM One filter paper was used for the second core SX exhauster stack record samples and filter housing dose rates were obtained as part of routine operations for the SX exhauster not as part of the RMCS process
Tank 241-SX-102698 to 798 RMCS started in SX-102 with Truck 4 on 61798 The SX exhauster was used for ventilation (see SX- 101 above) Sampling was performed in risers 8 and 4 and was completed on 7798 A total of 2 RMCS and I8 PMCS segments were taken Two RMCS cores were obtained During sampling filter papers used in the suction line for the CGM were saved and analyzed in the laboratory to estimate the airborne radionuclide concentration in the tank head space One filter paper was used for each core SX exhauster stack record samples and filter housing dose rates were obtained as part of routine operations for the SX exhauster not as part of the RMCS process
Tank 241-S-110598 to 698 RMCS was begun in S-I10 on 51898 Exhauster C (4) and Truck 3 were used This tank marked the first use of an RMCS exhauster since 1995 Sampling was completed on 6498 Risers 6 and 14 were sampled A total of IO RMCS and 8 PMCS segments were taken Two RMCS cores were obtained The
F-3
RPP-4826 Rev I
total exhauster run time was 15978 hours The stack record sample was removed and analyzed following this run period Dose rates taken at the side of the exhauster housing during RMCS were all lt05 mRhr During sampling filter papers used in the suction line for the CGM were saved and analyzed in the laboratory to estimate the airborne radionuclide concentration in the tank head space One filter paper was used for each core Waste particles retained on the exhauster housing filters were part of the inventory subsequently measured by NDA following completion of the first core in TX-I 13
Tank 241-U-107698 to 798 RMCS was begun in U-107 on 61098 Exhauster C and Trucks 3 and 4 were used Sampling was completed on 71598 Risers 7 and 2 were sampled A total of IO RMCS and 19 PMCS segments were taken Two RMCS cores were obtained The total exhauster run time was 27385 hours The stack record sample was removed and analyzed following this run period Dose rates taken at the side of the exhauster housing during RMCS were all 105 mRihr During sampling filter papers used in the suction line for the CGM were saved and analyzed in the laboratory to estimate the airborne radionuclide concentration in the tank head space One filter paper was used for each core Waste particles retained on the exhauster housing filters were part of the inventory subsequently measured by NDA following completion of the first core in TX-I 13
Tank 24l-BY-105798 to 898 RMCS was begun in BY-105 again on 72298 Exhauster C and Trucks 3 and 4 were used Sampling was completed on 82598 Risers 7 and 1 1 B were sampled A total of 18 RMCS and 18 PMCS segments were taken The material was hard enough to require rotary mode sampling all the way to the bottom of the waste but negligible recovery was obtained After RMCS was performed to the waste bottom a PMCS core was taken in the same hole to recover material Two RMCS cores were obtained The exhauster run time was 13577 hours for the first RMCS core and 30792 hours for the second RMCS core Stack record sample information in ABCASH shows 30558 hours operation for the second core but the sampler data sheet shows the time counter was mistakenly reset 234 hours into the run No correction was made to the BY-IO5 2nd core record sample concentration for this document since the error is conservative and results in only slightly higher (ltI) record sample radionuclide concentrations for this core A stack record sample was removed and analyzed following each core giving two record samples for BY-IO5 in 1998 Dose rates taken at the side of the exhauster housing during RMCS were almost all lt05 m R h but a few readings indicated 07 mRihr This variation was assumed due to personnel reading the instrument differently or the fact that the exhauster had been used on enough tanks that by now there was sufficient activity on the filters to cause readings approximately at the background detection level The final reading when both cores were completed was lt05 m R h During sampling filter papers used in the suction line for the CGM were saved and analyzed in the laboratory to estimate the airborne radionuclide concentration in the tank head space One filter paper was used for each core Waste particles retained on the exhauster housing filters were part of the inventory subsequently measured by NDA following completion of the first core in TX-113
Tank 241-TX-113998 to 599 Core sampling was begun in TX-I 13 riser 3 on 92298 Exhauster B (3) and Truck 4 were used at the start This was the first use of Exhauster B since it was modified Exhauster B ran for a total of 8738 hours until being disconnected on 102398 During this time two PMCS segments were taken and no RMCS segments Exhauster C was then installed and operated for 5598 hours from 121098 to 122898 No RMCS or PMCS sampling was performed during this time frame RMCS segments werent taken until 299 Exhauster C ran for a 30230 hours between 122898 and 21299 Sampling was completed on the core from riser 3 on 21299 A total of 12 RMCS segments were obtained during the time Exhauster C was operating Exhauster flow rate for both exhausters was a nominal 200 scfm Stack record samples were taken following Exhauster B removal at the end of 1998 for Exhauster C and following completion ofthe first core with Exhauster C Aerosol calculations were based on only the 30230 hours run time for Exhauster C in 1999 since this was the time period during which RMCS segments were obtained Dose rates taken at the side of the exhauster housing during the short PMCS only sampling period with Exhauster B were all ltOS m R h Dose rates with Exhauster C varied between lt O S mRhr and 07 mRhr The final reading on Exhauster C following completion of the first core was 07 mFUhr During sampling filter papers used in the suction line for the CGM were saved and
F-4
RPP-4826 Rev I
analyzed in the laboratory to estimate the airborne radionuclide concentration in the tank head space One filter paper was used for the core Waste particles retained on the exhauster housing filters were part of the inventory subsequently measured by NDA following completion of this core
Sampling in riser 5 was begun on 41299 using Exhauster B and Truck 3 A total of 6 RMCS and 1 PMCS segments were taken for this core before sampling was halted on 42899 The total exhauster run time for this core was 11712 hours Problems with high vacuum in the tank required the exhauster flow rate to be reduced to 190 scfm to keep the system within pressure limits The stack record sample for the second core was removed and analyzed following the run period Dose rates taken at the side of the exhauster housing during the second core were all lt05 m M r During sampling filter papers used in the suction line for the CGM were saved and analyzed in the laboratory to estimate the airborne radionuclide concentration in the tank head space One filter paper was used An NDA was performed on the exhauster housing following this core The only radionuclides present in the housing were those from this core or what was removed from the tank head space during the non-RMCS activities in this tank from 92298 and 102398
Some clarification may be needed to explain use of the exhauster operating times and NDA dose rate and record sample data obtained during core sampling on TX-I 13 Core sampling was set up for sampling riser 3 on TX-113 in September 1998 with Exhauster B Exhauster B operated for a total of 8738 hours between 92298 and 102298 The stack record sample was removed at the end of this period The ERS database incorrectly shows the exhauster operated between 111698 and 111998 The ABCASH database shows the stack record sample was removed on 111998 The stack record sample showed positive emuent concentrations during this time period with variances 400 No RMCS samples were taken during this period so the data and time werenrsquot included when calculating RMCS aerosol numbers Exhauster B was removed and Exhauster C installed in late November-early December Exhauster C was operated for a total of 5559 hours between 121098 and 122398 The stack record sample was removed on 122898 No sampling was performed during this period so the data and time werenrsquot included when calculating RMCS aerosol numbers Exhauster C was operated for a total of 30218 hours between 122898 and 2899 All the RMCS segments from riser 3 were taken in this time period so only the data and time for this period were included when calculating RMCS aerosol numbers Exhauster B was used during sampling of riser 5 Exhauster B operated for a total of 11712 hours between 41299 and 42899
Tank 241-TX-l18599 to 699 RMCS was begun in TX-I 18 on 5699 Exhauster C (4) and Truck 4 were used Sampling was completed on 6298 Risers 9B and 12B were sampled A total of 9 RMCS segments were taken there were no PMCS segments Two RMCS cores were obtained The total exhauster run time was 21247 hours The stack record sample was removed and analyzed following this run period The maximum dose rate taken at the side of the exhauster housing following RMCS was 08 m M r CGM filter papers were not analyzed An NDA was performed on the exhauster housing following completion of the two cores The exhauster housing contained the same nuclides as for the first NDA (S-110 U-107 BY-105 and TX-I 13 first core) plus those from TX-I 18
The basic core sampling operational data used in this document includes the number of RMCS cores and segments the exhauster run times and flow rates the RMCS exhauster HEPA filter dose rates and tank vapor space temperatures Table F-l lists the basic operational data This information excluding tank vapor space temperature data was obtained from procedural data sheets in the sampling work packages (References W - 1 to WP-23)
Tank temperature data for the tanks ventilated with the RMCS exhausters was obtained from the TWINS database Plots for each tank were prepared for the time RMCS was conducted and the average value of the highest thermocouple located in the tank (the lowest temperature reading) was estimated and used as the average tank head space temperature during the RMCS period
The SX exhauster flow rates listed in Table F-l are estimates only The combined flow rate for SX-IO1 through SX-106 plus SX-109 (7 tanks) averaged 440 cfm during CY 1996 (Kaiser 1997) for an average of 63 cfm per
F-5
RPP-4826 Rev I
tank Based upon inlet flow measurements at the tank inlet HEPA filters (Fanis 1998) the flow through each individual tank (SX-IO1 through SX-106 plus SX-109) was lt55 cfm at the breather filter Assuming an exhaust flow of 100 cfm for each SX farm tank sampled is therefore conservative
Calculated Data
Calculated data include the tank head space volumes conversion of the RMCS exhauster flow rate from scfm to acfm and the number of tank head space changeouts made by an exhauster during RMCS
Tank head space volume includes the dome space volume above the top of the sidewall plus the void space between the waste surface and the top of the sidewall The formula used to calculate tank head space volumes WN
Head Space Volume in A = (DS + [(H) (12) + HI + Hb - H] (V)) - 748
Where DS = dome space volume gal H = height of tank body sidewall above knuckle A HI = height of tank knuckle area in Hb = height oftank bottom below knuckle in H = height of waste in tank in V =27555 galin of waste in SX tanks 2754 gallin in all others
The tank dome space volumes height of tank sidewall above the knuckle height of tank knuckle area and height of tank bottom below the knuckle were obtained from Reynolds 1999 The height of waste in each tank at the time of core sampling was obtained from the TWINS database Tank dimensional and waste level data are given in Table F-2 along with the calculated tank head space volumes
Aerosol calculations for Appendices A-C require exhauster flow rates in actual cubic feet per minute The RMCS exhauster flow rate is controlled and recorded in standard cubic feet per minute The mass flow rate of the exhauster air is measured and internal logic in the exhauster controller calculates what the volumetric flow rate would be if the temperature and pressure in the exhauster inlet were at standard conditions The standard conditions used in the logic controller are 29921 in Hg (760 mm Hg) and 69F (ZIT)
A correction factor is built into the exhauster control logic that assumes an atmospheric pressure of 2927 in Hg the average atmospheric pressure at Hanford The RMCS exhauster will operate at about 1-2 in H20 negative pressure resulting in about a 2916 in Hg pressure in a waste tank when the RMCS exhauster is operating To revise the indicated scfm RMCS exhauster reading to an acfm value the RMCS exhauster scfm flaw rate was multiplied by (29922916)(T+459)528 where Tis the tank head space temperature in OF The tank head space temperatures in Table F-1 were input to the spreadsheet file used for aerosol calculations and converted to acfm The flow rates in acfm are included in Table F-I
The tank head space changeouts when using the RMCS exhauster were calculated by multiplying the exhauster acfm flow rate by the time of exhauster operation and dividing the result by the tank head space volume Tank head space changeouts are listed in Table F-2
F-6
c
gt 2
RPP-4826 Rev 1
APPENDIX G
REFERENCES
G-0
RPP-4826 Rev 1
APPENDIX G - References
Diedeker 1999 NDA of RMCS HEPA Filters L P Diedeker WMH E-Mail to JS Schofield CHG November 29 I999
ERDA 1976 Nuclear Air Cleaning Handbook ERDA 76-21 Buchsted C A Fuller A B and Kahn 1 E Oak Ridge National Laboratory 1976
Farris 1998 Internal Note T R Farris LMHC to J S Schofield LMHC Breather Filter Flow Rates for SX-Farm 31698
Foust 1999 Internal Memo RMCST Exhauster HEPA Filter Dose Rate Calculations D J Foust LMHC to J S Schofield LMHC October 25 1999
Greager 1999 Correspondence No WMH-9954450 Non-Destructive Analysis of the Rotay Mode Core Sample High-Efjiciency Particulate Air Filters E M Greager WMH to P C Miller LMHC June 28 1999 [Transmittal of HNF-4199 Resultsfram NDA Measurement of the 296-P-34 RMCS HEPA Filters]
HNF 1999 HNF-SD-WM-SAR-067 Tank Waste Remediation System Final Safety Analysis Report Rev 1 The revision incorporating RMCS accident analyses was submitted as Addendum 5 to DOE as a change to the FSAR predecessor the Basis for Interim Operation (BIO) LMHC-9857075 80232764-9-KOOl Submittal of Authorization Basis Amendment Package for Rotay and Push Mode Core Sampling in Satisfaction of Perfarmance Agreement TWR 122 Expectations I and 3 D 1 Allen LMHC to A M Umek FDH August 30 1998 Addendum 5 as of mid-January 2000 is waiting for approval by DOE
Kaiser 1997 T D Kaiser LMHC E-Mail to J S Schofield LMHC SX Tank Flow Data 42197
NUREG 1995 Potential Radionuclide Emissionsfrom Stacks on the HanfordSite Part I Dose Assessment Davis W E and Barnett J M Westinghouse Hanford Company from Proceedings of the 23 DOEMRC Nuclear Air Cleaning Conference held July 25-28 1994 February 1995
Schofield 2000a Letter 74910-00-002 Use of Microshield Calculations for RMCS Exhauster Housing for Estimating Radionuclide Quantities on the Filters Using NDA and Dose Rate Measurements I S Schofield CHG to File January 62000
Schofield 2000b Letter 74910-00-003 Rev I RMCS Exhauster Stack RecordSample Data J S Schofield CHG to File January 202000
Reynolds 1999 D R Reynolds LMHC E-Mail to I S Schofield LMHC transmitting Tank Volume Calculations draft of calculations done by Mike Plesha and Reed Hendershot data to be used for RESOLVE computer program for Hanford waste tanks August 3 1999
TWINS Tank Waste Information Network System database available at httptwinspnlgovSOO lhtbinTCDgetTableListexe
Waldo 1999 letter 74910-99-009 RMCS Exhauster Aerosol Test Data E I Waldo to J S Schofield June 22 1999
WHC 1993 WHC-SD-WM-ES-225 Rev I AerosolStudy for the Rotary Mode Exhauster P M Francis Westinghouse Hanford Company April 20 1993
WHC 1997 WHC-SD-WM-SAD-035 Rev Ob A Safety Assessment of Rotary Mode Core Sampling in Flammable Gas Single Shell Tanks Hanford Site Richland Washington August 8 1997
G- I
RPP-4826 Rev I
CGM Data CGM-I Letter PARTICULATE SAMPLING OF 241-SX-IO1 DURING ROTARY MODE CORE SAMPLING D C
Langlois E2 Consulting Engineers to J S Schofield Lockheed Martin Hanford Company March 16 1998
CGM-2 Letter PARTICULATE SAMPLING OF 241-SX-I05 DURING ROTARY MODE CORE SAMPLING D C Langlois E2 Consulting Engineers to J S Schofield Lockheed Martin Hanford Company June 9 1998
CGM-3 Letter PARTICULATE SAMPLING OF 241-SX-103 DURING ROTARY MODE CORE SAMPLING D C Langlois E2 Consulting Engineers to J S Schofield Lockheed Martin Hanford Company June 12 1998
CGM-4 Letter PARTICULATE SAMPLING OF 241-S-110 DURING ROTARYMODE CORESAMPLING D C Langlois E2 Consulting Engineers to J S Schofield Lockheed Martin Hanford Company July 20 1998
CGM-5 Letter PARTICULATE SAMPLING OF 241-SX-102 DURING ROTARY MODE CORE SAMPLING D C Langlois E2 Consulting Engineers to J S Schofield Lockheed Martin Hanford Company July 22 1998
CGM-6 Letter PARTICULATE SAMPLING OF241-U-107 DURING ROTARY MODE CORE SAMPLING D C Langlois E2 Consulting Engineers to J S Schofield Lockheed Martin Hanford Company August 3 1998
CGM-7 Letter PARTICULATE SAMPLING OF 241-BY-105 DURING ROTARY MODE CORESAMPLING D C Langlois E2 Consulting Engineers to 1 S Schofield Lockheed Martin Hanford Company September 17 1998
CGM-8 Letter PARTICULATE SAMPLING OF 241-TX-I13 DURING ROTARY MODE CORESAMPLING D C Langlois E2 Consulting Engineers to J S Schofield Lockheed Martin Hanford Company March 15 1999
CGM-9 Letter PARTICULATE SAMPLING OF 241-TX-113 DURING ROTARY MODE CORE SAMPLING D C Langlois E2 Consulting Engineers to I S Schofield Lockheed Martin Hanford Company May 31 1999
Notices of Construction NOC-I DOEIRL-93-40 Radioactive Air Emissions Program Notice of Construction Rotary Mode Core-Sampling
Truck and Exhauster Approved by Letter AIR 93-707 A W Conklin WDOH to J E Rasmussen DOEIRL 7893
NOC-2 DOEIRL-94-118 Rev 0 Radioactive Air Emissions Program Notice of Construction for the Rotary Mode Core-Sampling Systems Three and Four Approved by Letter AIR 95-603 A W Conklin WDOH to J E Rasmussen DOERL 63095
NOC-3 DOERL-94-118 Rev 1 Radioactive Air Emissions Program Notice of Construction for the Rotary Mode Core-Sampling Systems Three and Four Approved by Letter AIR 98-301 W W Conklin WDOH to I E Rasmussen DOEIRL 3698
NOC-4 DOEIRL-97-70 Radioactive Air Emissions Program Notice of Construction for Rotary Mode Core- Sampling in SX Tank Farm Approved by Letter AIR 97-1 101 A W Conklin WDOH to J E Rasmussen DOEIRL 113097
NOC-5 USEPA Letter OAQ-107 (no title approving DOE submittal 97-EAP-590 dated 72997) A J Frankel USEPA to J E Rasrnussen DOEIRL 8497
NOC-5 USEPA Letter OAQ-107rsquo (nb title approving DOE submittal 97-EAP-723 dated 101797) A J Frankel USEPA to J E Rasmussen DOERL 11498
Note that both letters have ldquoOAQ-107rdquo following ldquoReply to Attn ofrdquo
G-2
RPP-4826 Rev I
Work Packages WP-I ES-94-00808 WP-2 ES-95-00258 WP-3 ES-95-00045 - WP-4 ES-95-00434 - WP-5 ws-97-00173 - WP-6 WS-97-00174 - WP-7 ws-97-00143 - WP-8 WS-97-00144 - WP-9 WS-97-00207 - WP-I 1 WS-97-00208 - WP-12 WS-98-00049 - WP-13 WS-97-00050 - WP-14 WS-97-00224 - WP- I5 WS-97-00225 - WP-16 WS-97-00230 - WP- I7 ws-97-0023 1 - WP-18 ES-97-00452 - WP-19 ES-97-00453 - WP-20 WS-98-00072 - WP-21 WS-98-00073 - WP-22 WS-98-00067 - WP-23 WS-98-00068 -
241-BY-IO6 Perform Rotary Core Sample [Riser IOB] 241-BY-I IO Rotary Core Sample [Risers 12B 7 IZB 41 241-BY-IO8 Obtain Rotary Core Sample [Risers 12A amp 71 241-BY-IO5 Rotary Mode Core Sample [Riser 12A] 241-SX-101 Rotary Mode Core Sample Riser 19 241-SX-101 Rotary Mode Core Sample Riser4 241-SX-103 Rotary Mode Core Sample Riser 7 241-SX-103 Rotary Mode Core Sample Riser I I 241-SX-105 RMCST Obtain Core Sample Riser 6 241-SX-105 RMCST Core Sample Riser 14 241-SX-102 Rotary Mode Core Sample Riser 8 241-SX-102 Rotary Mode Core Sample Riser 4 241-S-1 IO RMCST Obtain Core Sample Riser 6 241-S-1 IO RMCST Obtain Core Sample Riser 14 2414-107 RMCSTCore Sample Riser 7 241-U-107 RMCST Core Sample Riser 2 241-BY-IO5 RMCST Core Sample Riser 7 241-BY-IO5 RMCST Core Sample Riser 1 IB 241-TX-113 Rotary Core Sample Riser 3 241-TX-113 RMCST Core Sample Riser 5 241-TX-I 18 RMCST Core Sample Riser 9B 241-TX-I 18 RMCST Core Sample Riser 128
G-3
RPP-4826 Rev 1
compared to alpha emitters Equal weight is given to all results regardless of whether based upon total al ha total beta or CsI3rsquo data This provides conservative results since the aerosol values based on total beta or CslfPwere normally lower than those based upon alpha results
The mass per segment numbers should be a better indicator of RMCS aerosol emissions from the tank than the mass per core numbers This is because the quantity of aerosols generated in a tank should be proportional to the time of purge gas flow and bit rotation The time of purge gas flow and bit rotation should be proportional to the number of RMCS segments taken Thus the mass of RMCS generated aerosols sent to an exhauster on a given tank should be roughly proportional to the number of RMCS segments obtained from the tank The number of RMCS segments in a core can vary To date the range has been from 1 to 12 RMCS segments per RMCS core The average has been 5 RMCS segments per RMCS core
The results for mass per core or per segment based on NDA and housing dose rate data have a firmer basis than results based upon CGM filter paper data This is because the RMCS exhauster housing NDA and dose rate methods are a direct physical measurement of essentially all the Csrsquordquo released to the exhaust stream during RMCS Aerosol measurements based upon HEPA dose rate are conservative as the filters showed no detectable dose rate for three of the five periods evaluated and barely perceptible readings after the other two
The results for tank head space concentrations and mass of waste in a tank head space during RMCS based on CGM filter paper data have a firmer hasis than results based on housing NDA or dose rate This is because the CGM filter paper data is a direct measurement of the concentration in the air in a tank head space during the time when aerosols are being generated The CGM filter paper data should provide a higher tank head space mass concentration than that calculated by filter housing NDA or dose rate This is because aerosols are only generated during times when the CGM is operating and the CGM operates for less time than the exhauster does Since the concentration is based upon dividing a filter quantity by the volume of gas passing through the filter the volume of gas in proportion to the material on the filter will be less for the CGM filter paper than for an exhauster filter resulting in a higher concentration based on CGM filter paper data A factor is included in the CGM based concentration to account for radionuclides in the dome space that have not settled out or been removed by the exhauster when the CGM is shut Off
The average results for all methods were within reasonable agreement with each other considering all the variables and assumptions involved The filter housing DF is in good agreement with expected values
This document contains seven appendices Appendices A-C provide particulate results based upon RMCS exhauster housing NDA RMCS exhauster housing dose rates and CGM filter paper data Appendix D provides an RMCS exhauster filter housing DF based on housing NDA and stack record sample data Appendix E provides waste specific activities and Appendix F provides the raw data used in Appendices A-D Appendix G provides references for this document
Conclusions
The results in this document are based upon RMCS operating experience from startup of nitrogen-purged RMCS in November 1994 through June 1999 Table 2 summarizes the information presented in the appendices Based upon this information and the lack of any significant aerosol formation seen in in-tank videos it can be concluded that past estimates of aerosol concentrations used for regulatory permits and accident analyses were conservative by a nominal three orders of magnitude
In order to estimate mass releases for regulatory permits the overall emissions with time are needed as a basis for the PTE estimates For future permits the mass per core or mass per segment values in Table 2 can be used directly with conservatism added if deemed appropriate for the tanks to be sampled When estimating maximum concentrations or maximum mass quantities in the tank head space for use in accident analyses additional conservatism needs to be added to the average concentration and mass values in Table 2
5
RPP-4826 Rev I
Tank and Date Sampled
Table 1 Summary Of Aerosol Estimation Methods Used
RMCS Aerosol Estimation Methods Exhauster Number of Used
Housing DF RMCS Cores Riser Used Period6 HEPA CGM NDA and and RMCS
Exhauster Operating Sample Exhauster
NDA Dose Filter RMCS Stack Segments Taken
BY-IO5 1998
No RMCS segments taken from BY-108 or from TX-I 13 Riser 3 using Exhauster B Any material retained on I
the filters during these operating times was assumed to come from next RMCS sampling event with the same exhauster BY-IO5 in 1998 shown as separate exhauster installations since stack record samples were pulled after each riser was sampled
Includes RMCS cores and segments only PMCS cores and segments obtained during exhauster operation not included A total of 23 RMCS cores and 115 RMCS segments were taken between 1194 and 699 The sum of cores and segments is less than sum of cores and segments obtained during data collection periods at lei since more than one aerosol estimation method was used for some sampling periods
One CGM filter paper was used for both cores in SX-102 and for both cores in U-107 3
See Appendix F for explanation of exhauster operating periods
6
RPP-4826 Rev I
Table 2 Summary Of RMCS Aerosol Data
Weighted average based upon number of RMCS segments taken with each method
7
e
Q 0 c 0 0 - 0 VJ 0 L
2
RFP-4826 Rev 1
APPENDIX A
ESTIMATION OF AEROSOLS GENERATED DURING Rh4CS BASED UPON RMCS EXHAUSTER HOUSING NON-DESTRUCTIVE ASSAY
A-0
RPP-4826 Rev I
APPENDIX A - Estimation Of Aerosols Generated During RMCS Based Upon RMCS Exhauster Housing Non-Destructive Assay
Summary of Method
This method of estimating RMCS aerosol quantities uses non-destructive assay (NDA) of the exhauster housing to determine the C S rdquo ~ quantity (Ci) on the filters inside This quantity is then divided by the C S rdquo ~ specific activity (Cig) in the waste for the tank(s) on which the exhauster and the same filters were present during sampling The resulting mass on the filters divided by the volume of air flowing through the exhauster provides an estimate of the average aerosol mass concentration in the air to the exhauster This value was multiplied by the tank head space volume to obtain the average mass of particulates present in the tank head space during RMCS The mass of waste on the filters divided by the number of rotary cores or segments taken provides the mass per core or per segment sent to the exhauster
Description
There are one prefilter and two HEPA filters in series for each RMCS exhauster Particulates captured on the filters contain radionuclides with C S rdquo ~ bein the predominant gamma emitter By performing an NDA of the exhauster housing filters the quantity of Cslg7 in the housing can be estimated This C S rdquo ~ value is then used to back-calculate to a waste mass on the filters using the mass is used to calculate the concentration of particulates in the tank exhaust stream the total suspended solids in the tank head space and the mass of waste sent to the exhauster for each RMCS core or segment taken
Exhauster operations were divided into six operating periods for evaluation in this document These periods are discussed in Appendix F and shown in Table F-I NDA data were obtained for Exhauster Operating Periods 4 5 and 6 Relevant information for these periods is also listed in Table A-I
Period 4 was for Exhauster C use during RMCS for both cores in S-l IO U-107 BY-IO5 and the first core in TX-I 13 The filters and housing were new prior to RMCS in S-110 No filter changeouts were made during this period the accumulated particulates from these RMCS events were retained on the housing prefilter primary HEPA and secondary HEPA
Period 5 was for Exhauster B use during RMCS for the second core in TX-I 13 The filters and housing were new prior to RMCS in TX-113 No filter changeouts were made during this period Exhauster B also ran for a short time during the first core in TX-113 but no RMCS segments were taken when the exhauster was operating Stack record samples (see Appendix D) indicated small levels of aerosols were present in the stack exhaust during this time period Any material collecting on the filters during this time period would show up and be counted as part of the aerosols generated during the 2rdquod RMCS core
Period 6 was for Exhauster C use during RMCS for both cores in TX-I 18 During Period 6 the filters also contained the waste particles from Period 4 No filter changeouts were made durin this period The aerosol mass generated due to RMCS in TX-I 18 was determined from the increase in Cs on the filters between Period 4 and Period 6
A description of the sampling method used for the NDA obtained following Period 4 is provided in Greager 1999 The same method was used for the NDA following Periods 5 and 6 The NDA consisted of a gamma energy analysis of the exhauster housing performed at points adjacent to the prefilter first HEPA and second HEPA The detector was mounted outside the housing and inside a lead collimator The collimator was used to minimize the background count rate and contribution from adjacent filters CsIh was the only radionuclide reported as present The NDA compared the count rates from the exhauster housing with the count rate of an National Institute of Standards and Technology (NISampT) traceable in an equivalent geometry to the RMCS exhauster housing The count rates from housing filter readings were divided by the count rate for the source to give a reported quantity of Cslrdquo on the filters
concentration in the tank waste This filter waste
3 B
source located in the middle of a filter
A- 1
RPP-4826 Rev 1
Two correction factors were applied to the reported filter Csrdquorsquo values for use in this document These are discussed in the following two sections
Reported NDA Data
The NDA results for Period 4 are provided in Greager 1999 The only radionuclide reported as present on the filters was CsI3rsquo The results are restated in Table A-2
The NDA results for Periods 5 and 6 are provided in Diedeker 1999 The only radionuclide reported as present on the filters was Csrdquorsquo The results are restated in Table A-2
Adjusted NDA Data
The reported results are based upon comparing the count rate for a reference point source located in the middle of a mock-up assembly equivalent to the exhauster housing with the count rate from the same detector inside a lead collimator placed outside the actual exhauster housing Limitations with this method include comparison of a point source with a distributed matrix and the inability of the detector to see the entire filter due to the presence of the collimator Correction factors were used to adjust the reported values to account for these two limitations
The first correction factor accounts for comparing a distributed source to the point source standard The reported results were calculated based upon a point source standard since there are no readily available filter standards with a distributed source The material in the filter housing should be fairly evenly distributed through the filter media however so comparing count rates for the filter housing to a point source standard will result in some error To correct for this error shielding calculations were performed on an exhauster housing filter assuming the CSrdquorsquo was evenly distributed throughout the filter media and then again assuming the activity was a point source in the middle of the filter Foust 1999 provides the results of these Microshield dose rate calculations Using the data in Foust 1999 Schofield 2000a shows that the dose rate at the NDA detector location would be about 0625 mFVhrmCi CSrdquorsquo for a point source and 073 mRhrmCi Cslrdquo for a distributed source To adjust the reported NDA results to what they would have been if an actual distributed standard source was available the reported values need to be multiplied by 0625 + 073 = 086
The second correction factor accounts for the detector not being able to see the entire filter contents due to the detector location inside the lead collimator Using basic geometry Schofield 2OOOa estimated the detector has about a 100 view of 608 of a HEPA filter about a 50 view of 264 of the filter and is shielded from the remaining 128 The detector count rate was thus estimated as being approximately 741 o f what it would be if the detector were not collimated To correct the reported results to what they would have been if an uncollimated detector could have been used the reported values need to be multiplied by I + 0741 = 135
Combining the two correction factors gives a single adjustment factor used of 086 x 135 = 116 Per Table A- 2 the total quantity of Csrdquorsquo reported present in the housing for Period 4 was 0430 mCi This quantity was multiplied by 116 to give 050 mCi Csrdquorsquo The reported results for Periods 5 and 6 were revised in the same manner to give 0032 mCi and 064 mCi C~rsquo~rsquorespectiveIy To determine the net increase in Csrdquorsquo for the housing during Period 6 the value from Period 4 was subtracted from the total or 064 - 050 = 014 mCi Csrdquorsquo
Calculation of Mass Quantity on Filters
Calculation of the mass of waste on the filters requires knowledge of the specific activity of the waste on the filters The specific activities used for each exhauster operating period are given in Table A-I The paragraphs below provide a derivation of the specific activities used
The specific activity values for the waste in each tank sampled is given in Table E-I Rh4CS was performed on more than one tank during Period 4 so a weighted average specific activity was used to calculate the waste mass on the filters during this period The weighted average specific activity was calculated based upon the number of RMCS segments taken from each tank sampled The number of RMCS segments obtained during
A-2
RPP-4826 Rev 1
each period for which NDA measurements were made are listed in Table A-I These values were obtained from Table F-I A weighted average specific activity for the waste on the filters in Period 4 was obtained by
[[O 227 mCigl[lO segl+[Ol2lmCigl[lO seg1+[0225 mCigl[l(l seg]+[Ol30 mCig][l2 seg]]+[SO segments] = 0182 mCi Csrdquorsquog
Calculating a weighted average based upon the number of segments assumes aerosol generation is roughly the same per segment and the specific activity of a radionuclide is constant throughout a tank These assumptions are adequate for the purpose oftbis document Aerosol generation can vary with water content waste hardness depth of sample taken nitrogen flow rate and porosity of the waste An in-depth evaluation of these parameters is beyond the scope of this document The impact of these variables is assumed to average out over all the RMCS segments taken The specific activities used do not vary greatly from tank to tank so any variations will not have a significant impact on the final aerosol results See Appendix E for further discussion of limitations on specific activities used in this document
For Period 5 the filters were new at the start and the only tank sampled with the exhauster was TX-I 13 Therefore the specific activity of CsI3rsquo for TX-I 130130 mCig was used
The same exhauster and filters used for Period 4 were used for Period 6 The net increase in Csrdquorsquo for Period 6 was determined by subtracting the Period 4 Csrdquorsquo from the total Since this net increase was only due to TX- 118 the specific activity of Csrdquorsquo for TX-I 180130 mCig was used for the waste added to the filters in Period 6 (Note it is only a coincidence that TX-I 13 and TX-118 have the same nominal Csrdquorsquo concentration)
The total mass of waste on the filters for Period 4 was thus
050 mCi i 0182 mCig waste = 275 g waste in exhauster housing
The mass of waste added to the exhauster for Period 5 was
0032 mCi + 0130 mCig waste = 025 g waste in exhauster housing
The mass of waste added to the exhauster for Period 6 was
(064 mCi - 050 mCi) + 0130 mCig waste = 11 g waste in exhauster housing
Aerosol Calculations
The tank head space particulate concentration was obtained by dividing the mass of waste sent to the exhaust stream by the volume of air sent to the exhauster The volume of air to the exhauster was obtained by multiplying the exhauster flow rate by the exhauster run times for each tank from Table F-I
For the RMCS exhausters the recorded exhauster flow rate is reported in standard cubic feet per minute (scfm) The RMCS exhauster flow rate is controlled to a nominal 200 scfm The exhauster flow rate was corrected to an actual cubic feet per minute (acfm) before calculating the tank head space aerosol concenmtion Table F-l includes the actual cfm flow rates
The calculated flow rates during RMCS for the tanks sampled during Period 4 were 207 acfm (S-1 lo) 206 acfm (U-107) 208 amp 209 acfm (BY-105) and 203 acfm (TX-I 13) The total volume oftank air through the exhauster during Period 4 was thus
[[207 cfm][ 15978 hr]+[206][27385]+[208][13577]+[209][30792]+[203][30230]][60 minh] = 146 E+7 Arsquo
The average tank head space mass concentration during RMCS in the above tanks was
[275 g + 146 E+7 Arsquo] x [35315 ftrsquomrsquo] = 664 E-6 average g waste per m3 in exhauster inlet
A-3
RPP-4826 Rev I
The gas flow rates and average tank head space mass concentrations during RMCS for Periods 5 and 6 were calculated in a similar manner
The average mass of waste in a tank head space during RMCS was calculated by multiplying the tank head space mass concentration by the tank head space volume from Table F-2 as shown below for S-1 I O
[275 g + 146 E+7 Arsquo] x [89100 ftrsquo] = 167E-2 g waste in S-1 IO head space
The particulate quantities in the other tank head spaces were calculated in a similar manner The weighted average mass in a tank head space during Period 4 was based upon the number of segments taken in each tank
The mass sent to the exhauster per RMCS core or per RMCS segment was obtained by dividing the mass of waste sent to the exhaust stream during each period by the numbers of RMCS cores or RMCS segments obtained during the exhauster operating time The average mass of waste sent to the exhauster during Period 4 is thus
275 g waste + 7 rotary cores = 39E-1 g wastelrotary core
and
275 g waste + 50 rotary segments = 55E-2 g wasteirotary segment
The mass of waste to the exhauster per RMCS core and RMCS segment for Periods 5 and 6 were calculated in a similar manner
All data were input to a spreadsheet to perform the calculations Results are provided in Table A-3
Summary of Calculations
Non Destructive Assay was performed on the RMCS exhauster filter housings used during three separate exhauster operating periods during which IO RMCS cores and 65 RMCS segments were obtained from five tanks Weighted averages of the average tank head space mass concentration average mass of suspended solids in a tank head space and average mass sent to the exhauster per RMCS core or segment for the three periods combined were calculated based upon the number of RMCS segments taken during each period Based upon RMCS exhauster housing NDA data the results indicate that
The average tank head space mass concentration during RMCS was 77E-6 g wastelmrsquo The average mass of suspended solids in the tank head space during RMCS was 18E-2 g waste The average mass sent to the exhauster during RMCS was 52E-1 g wastelcore The average mass sent to the exhauster during RMCS was 63E-2 g wasteisegment
A-4
RPP-4826 Rev 1
APPENDIX B
ESTIMATION OF AEROSOLS GENERATED DURING RMCS BASED UPON Rh4CS EXHAUSTER HEPA FILTER DOSE RATES
B-0
RPP-4826 Rev I
APPENDIX B - Estimation Of Aerosols Generated During RMCS Based Upon RMCS Exhauster HEPA Filter Dose Rates
Summary of Method
This method of estimating RMCS aerosol quantities divides the dose rate increase (mRhr) at the side of the RMCS HEPA filter housing by a calculated dose conversion factor (mRhrmCi C S rdquo ~ ) to obtain an approximation of the radionuclide quantity in the housing This radionuclide quantity is divided by the waste specific activity (mCig) to determine the mass of waste on the HEPA filter Dividing the HEPA filter waste mass by the volume of air passing through the filter provides an estimate of the average tank head space particulate concentration during RMCS Multiplying the average tank head space particulate concentration by the tank head space volume gives an estimate of the average mass of suspended particulates in the tank head space during RMCS Dividing the HEPA filter waste mass by the number of RMCS cores or RMCS segments provides the mass per RMCS core or per RMCS segment sent to the exhauster
Description
Particulates in the exhaust stream are removed by the HEPA filter(s) upstream of the exhaust fan The captured particulates contain radionuclides with CSrsquo~rsquo being the predominant gamma emitter As the particulate quantity on the HEPA filter increases the dose rate at the side of the filter housing will increase proportionately By monitoring the HEPA dose rate at the side of the filter housing the quantity of Csrsquordquo on the HEPA can be estimated This C S rdquo ~ value is then used to back-calculate to a waste mass quantity on the filter using the Csrsquordquo concentration in the tank waste This filter waste mass quantity is used to calculate the concentration of particulates in the tank exhaust stream the total suspended solids in the tank head space and the mass of waste sent to the exhauster for each RMCS core or segment taken Although radionuclides will be trapped on both the prefilter and the primary HEPA filter with a very small amount on the secondary HEPA calculations in this section were based upon the simplifying assumption that all the activity was on the primary HEPA filter
During RMCS exhauster operation the dose rate in m M r at the side of the HEPA filter housing is periodically measured with an Eberline RO-3B per procedure to indicate when radioactive particulates are building up on the filter The limit of detection of the RO-3B is 05 mRhr
Exhauster operations were divided into six operating periods for evaluation in this document These periods are discussed in Appendix F and shown in Table F-I Housing dose rate data were obtained for Exhauster Operating Periods I 24 5 and 6 Relevant information for these periods is also listed in Table B-I Dose rate data are available and were used for all tanks on which an RMCS exhauster was present and RMCS samples were taken This includes BY-106 BY-IO5 (1995) BY-I IO S-l I O U-107 BY-IO5 (1998) TX-113 and TX- 1 18 The dose rate at the end of a period was used as the basis for calculating radionuclides on the filters The only operating period for which dose rate data were not used for estimating filter radionuclide content was Period 3 Period 3 was for RMCS in SX farm using the SX exhauster
The dose rate at the side of the SX exhauster HEPA filter housing was measured during RMCS of SX farm tanks (for sampling of tanks SX-lot SX-102 SX-103 and SX-105) but the data are not useful for estimation of aerosol quantities because the SX exhauster draws on 13 tanks in parallel or in series with the tank being core sampled Many of the tanks have a much higher off gas flow rate than the sampled tank In addition there is background radiation in the area of the SX exhauster filter housing making any increase in the housing dose rate during RMCS difficult to detect
Dose Rate Data
The dose rate data for each period is listed in Table 8-2 No dose rates above minimum detectable limits were evident at the sides of any RMCS exhauster in Periods I 2 and 5
Dose rate measurements were less than detectable for Period 4 during sampling of S-l IO and U-107 When sampling on BY-IO5 there were a few readings of 07 m M r but most were ltOS mRhr This variation in
B- 1
RPP-4826 Rev 1
readings is to be expected as the specific instrument person using the instrument and location at which the dose rate is checked can vary with time The final recorded dose rate when sampling was complete on BY-IO5 was lt05 mRhr At the end of Period 4 following completion of the first core in TX-I 13 Exhauster C was listed as having a 07 m M r dose rate
Period 6 used Exhauster C again with the same housing and filters as at the end of Period 4 The final dose rate for this period was 08 m M r
Periods 124 and 5 all began with a new housing and new filters For Periods 12 and 5 it was conservatively assumed that the final dose rate was equal to 05 m M r giving an increase of 05 mRhr for each of these periods For Period 4 the dose rate increase was 07 m M r for this period Since Period 6 used the same housing and filters as Period 4 the increase for Period 6 was 08 - 07 = 01 m M r
The dose rate increase was converted into a CsIh content on the primary filter for each period Foust 1999 provides various dose rates for an RMCS exhauster housing assuming even dispersal of 1 mCi C S rdquo ~ on the first HEPA filter Using these calculations Schofield 2000a estimated a dose rate conversion factor of 16 mRhrmCi C S rdquo ~ at the detector location for an RO-3B The assumption that radionuclides are evenly distributed on the HEPA is a reasonable assumption based upon the exhauster design and the method used to measure the radiation dose rate
Gamma emitting contribute to the dose rate due to bremsstrahlung radiation and other nuclides may provide some small additional dose but the major penetrating dose rate contributor in aged SST waste is CSrdquo~ Ignoring the presence of all radionuclides (including Srm) except C S rdquo ~ in calculating a HEPA filter waste mass will provide a conservative result This is because assuming all radiation present is due to C S rdquo ~ will result in overestimating the C ~ I ~ ~ c o n t e n t of the filter housing which in turn will result in overestimating the waste mass on the HEPA filter
Dividing the HEPA dose rate for each exhauster installation by the dose conversion factor of I 6 mRhrmCi results in an increase of 031 mCi Csrdquorsquo on the RMCS exhauster filters for Periods I 2 and 5044 mCi for period 4 and 0063 mCi for Period 6
Calculation of Mass Quantity on Filters
Dividing the Csrdquorsquo content of the filters by the specific activity of C S rsquo ~ ~ in the waste gives the estimated mass of waste sent to the exhauster The specific activity value used for the waste in each tank sampled is given in Table E-I Since RMCS was performed on more than one tank in Periods 1 and 4 a weighted average specific activity was used for these periods The weighted average specific activity was calculated based upon the number of RMCS segments taken from each tank sampled during that period The number of RhKS segments obtained during each period are listed in Table B-I These data were obtained from the individual tank data in Table F- I Calculations to estimate the specific activity of waste mixtures were performed in the same manner as shown in Appendix A For Periods 2 5 and 6 RMCS samples were taken in only one tank The waste specific activity used for these periods was the specific activity of the tank sampled The specific activities used for each exhauster operating period are given in Table B-I
For all exhauster installations except BY-IO6 in 1994 and 1995 the RMCS exhausters were hooked directly to the waste tank When sampling BY-106 a prefilter was installed in the tank riser between the tank and the exhauster The prefilter was not used for BY-I IO in Period 1 or for any other tank in any other period Thus for Periods 2 4 5 and 6 the mass of waste on the HEPA was assumed equal to the mass of waste leaving the tank risers For Period 1 the mass of waste on the HEPA had to be adjusted for the BY-106 prefilter DF when estimating the combined mass of waste leaving the BY-IO6 and BY-I IO tank risers The mass of waste on the HEPA for Period 1 was
[031 mCi] [IO00 pCimCi] = 310 pCi
[310 pCi Csrdquorsquoon HEPA] + [I77 pCi C S rdquo ~ ~ waste] = 177 gwaste on HEPA
is the predominant radionuclide contributor to filter dose rates Beta emitting Srw can
on HEPA
B-2
RPP-4826 Rev 1
A decontamination factor (DF) of 5 was used to account for radionuclide removal by the BY-IO6 prefilter (see Appendix D for basis ofprefilter DF) There were 1 1 RMCS segments taken from BY-IO6 and 13 from BY- 1 IO The total mass ofwaste assumed to exit the tank risers was therefore
[ I 77 g waste] [ 1 1 + 131 [[I 151 + 131 = 28 g waste from tank risers
The DF of 5 to account for the prefilter is only applicable to the RMCS of BY-IO6 in 1994 and 1995 for all other exhauster periods the mass of waste on the HEPA was equal to the mass of waste sent to the exhauster riser
The mass of waste sent to the exhauster for Period 2 was
[031 mCi] [IO00 pCimCi] = 310 pCi Csrdquorsquo on HEPA
[3 IO pCi C S rdquo ~ on HEPA] + [225 pCi CsiI7g waste] = I 39 g waste from tank
Using the same formula the mass of waste to the exhauster from Periods 4 and 5 was 241 and 240 g respectively and the increase in waste on the filters for Period 6 was 048 g
Aerosol Calculations
The mass sent to the exhauster per RMCS core or per RMCS segment was obtained by dividing the mass of waste leaving the risers by the number of RMCS cores or RMCS segments obtained during the exhauster operating period
The tank head space particulate concentration was obtained by dividing the mass of waste leaving the riser by the volume of gas sent to the exhauster This volume of gas sent to the exhauster was obtained by multiplying the exhauster flow rate by the exhauster run time from Table F-I The calculations for aerosols generated based upon HEPA dose rates use acfm while the exhauster flow is recorded in scfm so the actin flow rates in Table F- 1 were used
The average mass of aerosols in the tank head space was obtained by multiplying the average tank head space particulate concentration by the tank head space volume from Table F-2
Following is an example of how the mass per RMCS core mass per RMCS segment average tank head space mass concentration and average mass of aerosols in the tank head space were calculated for Period 1 Data used are from Tables E-I F-I and F-2
[200 scfm] [2992+2916] [84 + 4591 + 528 = 21 1 acfm to exhauster from BY-IO6 in 11-1294
using same formula results in 210 acfm for BY-IO6 in 195 and 209 acfm for BY-I IO
28 g waste + [((21 1 acfm)(4878 hr)+(21O)(l867)+(209)(1125))(60 minhr)]= 12E-6 g wastelf to risers
[12E-6 amp] [35315 fmrsquo] =43E-5 g wastemrsquoto risers
[12E-6 gftrsquo] [53700 Arsquo in BY-106 head space] =66E-I g waste in BY-IO6 head space during RMCS
[12E-6 piftrsquo] [92000 ftrsquo in BY-110 headspace] = IIE-l g waste in BY-I10 head spaceduring RMCS
[28 g waste] [5 RMCS cores] = 56E-1 g waste per core to riser
[28 g waste] + [24 RMCS segments] = 12E-1 g waste per segment to risei
8-3
RPP-4826 Rev 1
All data were input to a spreadsheet and the mass to exhauster per RMCS core mass to exhauster per RMCS segment average tank head space mass concentration and average mass of aerosols in the tank head space were calculated for each of the RMCS exhauster operating periods in the same manner as shown above Results are given in Table 8-3
Summary of Calculations
RMCS exhauster operations were segregated into five operating periods during which RMCS was performed The Exhauster B data for BY-IO8 and TX-I 13 riser 3 was not used in these calculations as no RMCS was performed when the exhauster was operating Exhausters were operated in seven tanks during which 16 RMCS cores and 92 RMCS segments were obtained Based on RMCS filter housing dose rate data the results indicate that
These values are conservative as the assumed dose rate at the end of RMCS for Periods I 2 and 5 was assumed to be 05 mRhr In addition using a DF of 5 for the BY-IO6 prefilter skews the results high The in-tank prefilters used in both BY-IO6 sampling events showed no detectable contamination
Operatin Periods 4 and 6 were the only periods with exhauster housing dose rates above detectable The 044 mCi Csrsquordquo and 0063 mCi CsIh increase on the filters for these two periods based upon dose rate data correspond to the 050 mCi CsI3rsquo and 014 mCi Csrdquorsquo increase on the filters for these two periods based u on NDA data (see Appendix A) The 031 mCi C S rdquo ~ for Period 5 is significantly above the 0032 mCi Cslrsquolsquofor the same period determined by the NDA but this is due to assuming the housing dose rate was equal to the minimum detectable 05 mRhr
The average tank head space mass concentration during RMCS was 22E-5 g wastem3 The average mass of suspended solids in the tank head space during RMCS was 47E-2 g waste The average mass sent to the exhauster during RMCS was 59E-1 g wastelRMCS core The average mass sent to the exhauster during RMCS was 1OE-1 g wastelRMCS segment
B-4
v m
__ ~~
RPP-4826 Rev 1
APPENDIX C
ESTIMATION OF AEROSOLS GENERATED DURING RMCS BASED UPON CGM IN-LINE FILTER PAPER ANALYSES
c-0
RPP-4826 Rev I
APPENDIX C - Estimation Of Aerosols Generated During RMCS Based Upon CGM In- Line Filter Paper Analyses
Summary of Method
This method of estimating RMCS aerosol quantities uses radionuclide assay data from in-line filter papers located upstream of continuous gas monitors (CGM) sampling the tank air for flammable gases during RMCS The radionuclide content of the filter paper is divided by the waste radionuclide specific activity and the air flow through the CGM to obtain an estimate of the average mass concentration in the tank head space during the time period the CGM is on Multiplying the estimated average tank head space mass concentration by the tank head space volume gives an estimate of the average mass of particulates in the tank head space during RMCS To obtain the mass per RMCS core or per RMCS segment sent to the exhauster the tank head space average mass concentration is multiplied by the volume of gas sent to the exhauster then multiplied by a correction factor to account for particulates in the head space removed by the exhauster when the CGM is not operating and divided by the number of RMCS cores or RMCS segments
Description
During most tank waste intrusive activities performed since 1996 an intrinsically safe CGM located above ground has been used to continually monitor the tank air for flammable gases during in-tank activities The CGM sampling method draws air directly from the tank head space During RMCS the CGM sampling line is placed in the tank dome space The sampling line is located between the sampling riser and the exhaust riser if practical A pump in the CGM draws tank air up through the line at 05 litmin for measurement of the lower flammability limit (LFL) by the CGM A filter paper is installed in the sampling line upstream of the CGM to protect the unit from internal contamination
Following CGM use the CGM filter papers are normally discarded after monitoring them in the field for contamination To help estimate the tank head space particulate levels during RMCS these filter papers were retained and analyzed in the 222-S laboratory following removal from all tanks in which RMCS was performed from the fall of 1997 through April 1999 Data were collected for the four tanks in SX farm in which RMCS was performed and the next four tanks on which the RMCS exhauster was deployed These tanks are listed in Table c-I Reported CGM Data
The CGM operational data used to estimate aerosol levels during RMCS includes CGM operating times CGM flow rates and filter paper analytical data A summary report containing all the field operating data sheets for CGM usage and lab data was prepared following completion of sampling on each tank for all tanks except TX- 113 For TX-I 13 a separate report was prepared following each core These reports are References CGM-I to CGM-9 The CGM data from these reports are provided in Table C-2
There were 14 CGM installations during RMCS when CGM filter papers were collected and analyzed Each of these installations had Csrdquorsquo total alpha and total beta quantities measured on the filter papers resulting in 42 data points Eight of the measurement results were very low and had errors of gt+-loo These values were not used resulting in a net of 34 data points for calculating average head space mass concentrations based upon CGM data
Calculated Tank Head Space Radionuclide Concentrations
To calculate the average tank head space radionuclide concentrations during RMCS the filter paper radionuclide quantities were first divided by an efficiency factor to account for radionuclides which may not have been captured on the paper This adjusted radionuclide value was divided by the volume of tank air passing through the paper to give the average tank head space radionuclide concentration
The efficiency used for most stack samplers onsite is 73 (see Appendix D) Estimates attached to References CGM-I to CGM-9 indicate the CGM filter paper sampling method used should have a sampling efficiency
c- 1
RPP-4826 Rev 1
exceeding 73 For conservatism a sampling efficiency of 50 was assumed in this document for the CGM filter paper method
The estimated Csrdquorsquo total alpha and total beta concentrations in the tank vapor space were calculated by dividing the radionuclide quantity on the filter paper from Table C-2 by the assumed CGM sampling efficiency of 05 and the volume of gas going to the CGM The volume of gas going to the CGM was calculated by multiplying the time of CGM operation from Table C-2 by the CGM flow rate of 500 mlmin For example the calculated SX- 101 head space C~rsquorsquo~concentration based upon analysis of the CGM filter papers used during RMCS of riser 19 is
[[26E-4 pCi + 051 + [[I755 min][500 mlmin]] = 59E-I0pCiml
All radionuclide concentrations were calculated in a similar fashion Results are given in Table C-3 Table C-3 lists the radionuclide concentrations for all 42 data points The eight radionuclide concentrations not used for estimating mass concentrations are noted
Table C-3 also contains the calculated number of tank head space changeouts by the tank exhauster during CGM operation Tank head space changeouts were calculated by multiplying the exhauster flow rates (in actin) from Table F-1 by the CGM run times from Table C-2 and dividing by the tank head space volumes from Table F-2 The number of tank head space changeouts during CGM operation was used when estimating the waste mass sent to the exhauster See Aerosol Calculations section below for explanation
Aerosol Calculations
Average tank head space mass concentrations based upon CGM filter paper data were calculated by dividing the head space radionuclide concentrations from Table C-3 by the waste specific activities for each tank sampled The waste specific activities used came from Table E-I and are listed again in Table C-I The average of the mass concentrations based upon radionuclide data for each tank was used as the average head space mass concentration for that tank For example the calculated SX-IO1 head space mass concentration analysis from the CGM filter papers used during RMCS of riser 19 is
[59E-10 pCi Csrdquorsquoml+ 112 pCi C S rdquo ~ ~ waste] [ 28317 mlftrsquo] = 1 SE-7 g wasteA3 based upon C S rdquo ~
[ I 7E-I I pCi T A M + 504E-1 pCi TAg waste] [ 283 17 mlftrsquo] = 94E-7 g wasteamprsquo based upon Total Alpha
[43E-9 pCi TBml+ 357 pCi TBg waste] [ 28317 mlArsquo] = 34E-7 g wastel based upon Total Beta
[ [ I 5E-7 + 94E-7 + 34E-7 g wasteArsquo] f 31 = 48E-7 g wasteamp
[48E-7 g wastelt ] [3531467 Arsquom3] = 17E-5 g wastemrsquo
All tank head space mass concentrations were calculated in the same manner The results are presented in Table C-4 The weighted average tank head space mass concentration during RMCS was based upon the number of RMCS segments taken for each data point
The average aerosol mass in the head space during RMCS was calculated by multiplying the average tank head space mass concentration by the tank head space volume from Table F-2 For the same data point as above
[48E-7 g waste Arsquo] [115E+5 Arsquo] = 55E-2 g waste in SX-IO1 head space during RMCS
All average mass quantities present in the tank head space during RMCS were calculated in the same manner using a spreadsheet The results are provided in Table C-4 The weighted average mass of waste in a tank head space in Table C-4 was calculated based upon the number of segments obtained for each data point
Estimation of the mass of waste sent to the exhauster per RMCS core or segment requires calculation of the total mass of waste sent to the exhauster Multiplying the average head space concentration during RMCS by the exhauster flow rate (in acfm) and the time of CGM operation will give the mass of waste sent to the exhauster during the CGM time frame only While the large majority of mass of waste aerosols will have exited the tank or
c -2
RPP-4826 Rev I
resettled by the time the CGM is shut off there could be some residual suspended particles remaining These would eventually pass to the exhauster but would not be picked up by the CGM filter since it was not in service An adjustment factor was used as described in the following paragraphs to account for particles that may exit to the exhauster following shut down of the CGM
Particulates are generated by RMCS when purge gas is blowing out the drill string and the bit is rotating under the waste surface This time averages about six minutes per segment Multiplying the number of RMCS segments per core by six minutes per segment and dividing by the number of minutes of CGM operation shows the creation of particulates will only occur during a nominal 3-4 of the time the CGM is operating During RMCS the normal practice is to install the CGM turn it on when personnel enter a tank farm and keep the unit in constant operation for the remainder of the shift When the portable RMCS exhauster is used the exhauster is normally started at least an hour before RMCS is initiated and kept in operation until it is time to halt operations for the week The SX exhauster is kept in constant operation Comparing exhauster operating times from Tables F-l with CGM operating times from Table C-I it can be seen the CGMs are in operation about 3-15 of the time the RMCS exhauster is operating on a tank This time comparison wasnrsquot estimated for the SX exhauster since the SX exhauster is in constant operation
With CGM operation much longer than the time period when particulates could be generated the majority of particulates generated by RMCS should have settled or been exhausted during the CGM operating period Table C-3 shows the tank head space changeouts made by the exhauster during CGM operating periods ranged from 084 to 63 The average was 24 With the CGMs operating 25-33 times longer than the aerosol generation periods and an average of over two tank head space changeouts during CGM operation the large majority of aerosols generated during RMCS will have settled out or been removed by the exhauster by the time the CGM is shut off To account for particulates remaining in the tank head space after the CGM was turned off that are subsequently removed by an exhauster it was conservatively assumed that 20 of the total mass of particles generated during RMCS were not removed from the tank head space during the CGM operating period Therefore the product of the tank head space concentration and the volume of air sent to the exhauster during the time of CGM operation was multiplied by a factor of 125 (lOOl80) to estimate the total mass of waste sent to the exhauster as a result of RMCS This is shown below for the same SX-IO1 riser 19 data point in the above calculations
[48E-7gA3] [IOOmin] [I755 min] [125]= 11E-l gwastetoexhauster
This value was divided by the number of RMCS cores and RMCS segments from Table C-1 to provide the grams per core and grams per segment in Table C-4 as follows
[ I I E- 1 g waste to exhauster] i 1 core = 11 E-I g wastelRMCS core to exhauster
and
[ 1 I E- 1 g waste to exhauster] + 5 segments = 2 I E-2 g wastelRMCS segment to exhauster
All mass per core and mass per segment values were calculated in the same manner using a spreadsheet The results are provided in Table C-4 The weighted average mass per core and mass per segment in Table C-4 were calculated based upon the number of cores or segments obtained for each data point
Summary of Calculations
There were 34 valid CGM filter paper data points from 14 RMCS CGM sampling periods in eight tanks during which I5 RMCS cores and 79 RMCS segments were obtained Based upon CGM filter paper data the results indicate that
The average tank head space mass concentration during RMCS was 4OE-5 g wastem3 The average mass of suspended solids in the tank head space during RMCS was 97E-2 g waste The average mass sent to the exhauster during RMCS was 18E-1 g wastelRMCS core The average mass sent to the exhauster during RMCS was 34E-2 g wastelRMCS segment
c - 3
RPP-4826 Rev 1
Ignoring all CGM filter paper analytical data points with a variance gtloo will result in conservative results These data points indicate negligible radioactivity was present If a value of zero was assigned to each data point with an analytical error of gtloo instead of ignoring the data point the weighted average particulate quantities in Table C-4 would be reduced by about 12
The average tank head space mass concentrations based upon CGM data will be higher than the average tank head space mass concentrations based upon filter housing NDA or dose rate The RMCS exhauster received tank air from the shifts when sampling was performed and during some of the off-shifts when no sampling was done The CGMs were only operated during the shifts when sampling was performed The air concentration drawn into the CGM and the RMCS exhauster should be roughly the came during the operating shifts but somewhat less during the off-shifts Therefore the tank head space concentration will be higher when based upon CGM data This does not impact the mass of waste sent to the exhauster per core or per segment
c -4
I
- ~
RFP-4826 Rev 1
APPENDIX D
ESTIMATION OF Rh4CS EXHAUSTER HOUSING DECONTAMINATION FACTOR
D-0
RFrsquoP-4826 Rev 1
APPENDIX D - Estimation of RMCS Exhauster Housing Decontamination Factor
Summary of Method
This Appendix estimates a Decontamination Factor (DF) for the RMCS exhausters using housing NDA data and applicable stack record sample data The Csrdquorsquo in the exhauster effluent is divided by the C S rdquo ~ in the exhauster inlet to provide a penetration efficiency The reciprocal ofthe penetration efficiency is the DF
Description
Each RMCS exhauster has an isokinetic sampler located on the stack downstream of the blower and HEPA filters A small pomp pulls air from the exhaust stack into a filter paper at a rate proportional to the exhaust flow Radionuclides in the exhaust stream passing through the sample line are caught on the filter paper The stack operating time and flow rate are recorded When the record sample filter paper is removed the filter paper is analyzed in a laboratory for radionuclides The radionuclide concentration in the stack effluent stream is calculated by dividing the quantity of material on the filter paper by the volume of air through the sampler and then dividing again by a factor to compensate for stack sampler and filter paper efficiency
Multiplying the total beta stack effluent concentration by the total off gas flow gives the total beta emissions from the exhauster The total beta emissions are multiplied by the Csrdquorsquo to total beta ratio for the waste in the tank) being exhausted to give an estimate of the C S rdquo ~ emission The C S rdquo ~ on the filters determined by NDA of the housing (see Appendix A) is added to the C S rdquo ~ emissions to give the total C S rdquo ~ input to the filter housing Dividing the emissions by the input gives the filter housing penetration efficiency Subtracting the penetration efficiency from 1 O gives the filter housing efficiency Dividing 1 O by the penetration efficiency gives the DF
RMCS Stack Record Sample Data
RMCS exhauster stack record samples are taken after completion of each sampling event on a tank Normally this is after all cores on that tank have been obtained but for BY-IO5 in 1998 record samples were taken following each core Record samples are also taken at the end of each year All samples are analyzed for total alpha and total beta At the end of each year all the filter papers for that year are composited and analyzed for individual radionuclides Sample results are entered into the Automated Bar Coding of Air Samples at Hanford (ABCASH) and Environmental Release Summary (ERS) databases Several ofthe filter papers from 1998 were reanalyzed using a longer count time to bring the error rate down
Schofield 2000b compiled and evaluated all available RMCS exhauster stack record sample data filtered out the unusable data provided derivation for the stack sampling efficiency factor and summarized the results Most of the data points were so low as to be unusable since the results were either negative or had error variances gtloo
Column 5 of Table D-1 provides the stack effluent concentrations used for calculation of the filter housing DF The stack effluent data in Table D-l come from Schofield 2000b These values include a 073 sampling efficiency factor
Calculation of RMCS Filter Housing Decontamination Factor Based upon Housing Inlet and Outlet Data
The RMCS exhauster housing NDA and stack record sample data available for exhauster Operating Periods 4 5 and 6 were used to estimate an actual DF for the RMCS exhauster housings The housing NDA data is for CSrdquo~ but there are no usable Csrdquorsquo concentrations for the RMCS exhauster outlet The RMCS exhauster stack Csrsquordquo concentrations are either negative have a variance gtloo or are not available Total beta analyses are available however so the stack eftluent C S rdquo ~ concentrations were estimated by multiplying the total beta concentration by the ratio of Csrdquorsquo to total beta in the tank waste
Column 2 of Table D-l lists the increase in CSrsquo~ on the filters for each operating period as determined by NDA This data was obtained from Table A-2
D- 1
RPP-4826 Rev 1
Column 4 of Table D-l lists the stack exhaust volume for each stack record sample period The stack exhaust volume for the exhauster installation on S-l IO was calculated by
[ZOO std ft3min][15978 hrs] [60 minhr] = 199E+6 std ftrsquo
All other stack volumes in Table D-l were calculated the same way Unlike in Appendices A B and C no adjustment was made to change the 200 scfm to actual cfm This is because the RMCS stack record sample concentrations from Table D-3 are based upon a 200 scfm flow rate rather than the actual flow rate Since the concentrations are on the same basis as the flow rate there is no need to correct to acfm
The total beta emissions for the RMCS exhauster stack were calculated by multiplying the volume by the concentration For the same S-l IO data point
[199E+6 ft3] [18E-15 pCiml] [28317mlft3] [mCi1000 pCi] = 1OE-7 mCi total beta
All other total beta emissions in Table D-l were calculated the same way
The Csrdquorsquo to total beta ratio was calculated from data in Table E-I For the same S- l I O data point
326E+5 Ci CsI3rsquo f I 14E+6 Ci total beta = 029 Ci CslhCi total beta = 029 rnCi CsrdquorsquomCi total beta
The Csrsquordquo emission for the same S-l IO data point was thus
[I OE-7 mCi total beta] [029 mCi CsrdquorsquomCi total beta] = 29E-8 mCi Csrdquorsquo
All Csrsquordquo emissions in Table D-l were calculated in the same manner
The penetration efficiency for each operating period was calculated by dividing the exhauster outlet by the filter inlet Csrdquorsquo quantities For operating period 4 this was
[81E-6 mCi] f [5OE-I + 8IE-6 mCi] = 16E-5 = 16E-3
The DF for operating period 4 is
1 + 16E-5 = 62E+4
The overall DF for periods 4 5 and 6 was calculated by dividing the efluent from all three periods by the total filter input
[95E-6 mCi] f [67E-I t 95E-6 mCi] = 14E-5 = 14E-3 penetration efficiency
I - I 4E-5 = 0999986 = 999986 filter efficiency
1 f 14E-5 = 73E+4 decontamination factor based upon housing inlet and eftluent data
Estimation of Housing Decontamination Factor Based upon General Performance Data
HEPA filters are tested at the manufacturer to a minimum 9997 efficiency using a 03 pm monodisperse aerosol After installation HEPA filters are tested in-place per ASME N5 I O to a minimum 9995 efficiency using a polydisperse aerosol with an approximate droplet size distribution of 99 less than 30 pm 50 less than 07 pm and 10 less than 04 pm The RMCS exhauster housing is tested per ASME N510 and is thus required to have a minimum removal eficiency of 9995 for an aerosol with this approximate size distribution The particle size distribution of the waste aerosols generated by RMCS is unknown but it is assumed that the removal efficiency for RMCS generated aerosols was the same as the removal efficiency for the ASME generated test aerosol
D-2
RPP-4826 Rev I
A 9995 efficiency is equivalent to a DF of 2E+3 while a 9997 efficiency is equivalent to a DF of 33E+3 The actual DF for the RMCS exhauster housing is higher than either of these It has two HEPA filters in series even though the minimum efficiency specified in the NOCs for the RMCS exhausters is only equivalent to one HEPA ERDA 1976 recommends using a DF of 3000rdquo for a filter bank where n is the number of HEPA filters in series This would result in a DF of 9E+6 for the RMCS exhauster housing This is unrealistic Using a DF of 9E+6 will calculate to Csrdquorsquo quantities on the HEPA filtersthat are orders of magnitude above what have been shown to be there based upon the measured dose rates and NDA A DF of 9E+6 would mean the dose rate would have to be almost 100 mRhr at the side of the exhauster housing instead of the 05-08 mRhr dose rates encountered The waste particles will not have the same particle size distribution entering the second HEPA filter as when entering the first The majority of the waste particles will be captured on the I rdquo HEPA filter and although the DF for each HEPA if tested individually using the ASME N5 IO aerosol test method may be 3E+3 (or higher) the overall DF of the two filters in series will not be 3000lsquo This is because the particle size distribution entering the Znd HEPA could have a greater percentage of smaller particles than that entering the 1rdquo
NUREG 1995 included an evaluation of a number of different facility stacks at the Hanford site where the HEPA filter upstream air concentrations were estimated using several different methods This report concluded that back-calculation using a value of 3000rdquo overestimated the upstream radionuclide concentration by three to four orders of magnitude when compared to filter NDA data for the nine stacks for which NDA data were obtained and by three orders of magnitude for the two stacks for which upstream air sample data were available Back- calculation using a value of 3000rdquo was shown to be high by four orders of magnitude for the single stack for which a powder release estimate was available Based upon this information the RMCS exhauster dual filter-in-series housings would have a DF of at least three and maybe four orders of magnitude less than 9E+6 or in the 1E+3 to 1 E+4 range A DF of IE+3 would he less than the minimum permissible under the NOC Comparing the older stack data and design with the newer RMCS exhauster design the minimum DF would be expected to be at least 1E+4
Table D-2 provides the available RMCS exhauster aerosol test data This information was obtained from Waldo 1999 Prior to 1998 the RMCS exhauster primary HEPA filter efficiency and either the secondaly HEPA filter or the overall efficiency for both filters were tested Starting in 1998 only the primary and secondary HEPA filter efficiency were measured The overall efficiency of the two filters in series was only measured three times in 11 setups Twice the overall penetration efficiency was lt0002 and the remaining time the only information that could be found was a value of lt005 Most individual filters had a penetration efficiency of 0002 This appears to be about the limit of the detection equipment Based upon Table D-2 data a penetration efficiency of 0002 (99998 efficiency) is normal for a single HEPA and thus a minimum for an RMCS exhauster housing Assuming a 0002 penetration efficiency for the two filters combined calculates to a DF of 5E+4 (equal to 1 +
000002) for the RMCS exhauster housing
In summary the measured DF for the RMCS exhauster housings over the period from May 1998 through June 1999 was about 73E+4 RMCS aerosol testing prior to use indicates a DF of about 5OE+4 for each of the filters separately but their overall efficiency is not measured Referenced data based on older stacks at Hanford indicate the two HEPA RMCS exhauster housing would likely have a DF of at least IE+4
Estimated Aerosol Levels During RMCS Based Upon RMCS Stack Record Sample Data
Revision 0 of this document used the positive record sample results with variance less than 100 to estimate aerosol concentrations in the exhauster inlet using an assumed exhauster housing DF of 5OE+4 This method of estimating aerosols was eliminated from Revision 1 because the stack concentrations were either too low too scattered or too questionable to provide reliable results There were 112 RMCS stack record sample data points evaluated in Schofield 2000b Excluding the total beta sample results used for estimation of the housing DF there were only ten data points remaining with positive values and variances ltloo the remaining data points were either negative had a variance gtloo or the results were not available
For comparison purposes only Schofield 2000b applied the DF of 73E+4 calculated in this document to the data points not used to calculate the exhauster housing DF to estimate aerosol concentrations upstream of the filters The results showed aerosol levels approximately the same as those estimated using NDA dose rate or CGM filter paper data when a value of zero was used for negative sample results or those with a variance gtloo When only
D-3
RPP-4826 Rev 1
the ten positive results with a variance ltloo were used the aerosol levels calculated to be two to five times higher than those estimated using NDA dose rate or CGM filter paper data Because of the variability of data resulting from the extremely low record sample concentrations and the few useable data points estimation of aerosol levels using record sample data was not included in Revision I See Schofield 2000b for further discussion of the use of record sample data to estimate aerosol levels
Summary of Calculations
A total of nine RMCS exhauster stack record sample data points were used to estimate the RMCS exhauster filter housing decontamination factor These data points were obtained when sampling on five tanks during which 10 RMCS cores and 65 RMCS segments were obtained The overall decontamination factor was 73E+4
Estimation of aerosol generation quantities based upon RMCS stack record sample data is possible However results will likely be skewed high if data points that show non-detectable levels of radionuclides present are ignored instead of using a value of zero for the data point
D-4
RPP-4826 Rev 1
APPENDIX E
TANK WASTE RADIONUCLIDE CONCENTRATIONS USED FOR AEROSOL CALCULATIONS
E-0
RPP-4826 Rev 1
APPENDIX E - Tank Waste Radionuclide Concentrations Used for Aerosol Calculations
The RMCS exhauster NDA data HEPA filter dose rate data CGM filter paper data and stack record sample data provide information on the quantity of radionuclides on the exhauster filters in the tank head space or the exhauster stack during RMCS These radioactivity quantities need to be divided by the waste radionuclide concentration specific activity to determine the mass of waste in the tank head space and in the tank gases sent to the exhauster
The mass quantities in this document were calculated using dry basis radionuclide concentrations Waste particles carried into the tank head space by the purge gas could be wet or dry If wet some of the non-chemically bound water will start to evaporate immediately providing the tank relative humidity is 400 The water present in a waste particle may be chemically bound as a hydrate or free The chemically bound water will not readily evaporate therefore even a ldquodryrdquo particle may have some water associated with it It is impractical to measure the actual water content of the waste particulates caught on the CGM filter paper the exhauster HEPA filters or the stack record sample paper Since the quantity of water in the waste particulates is unknown particulate levels were calculated using dry basis radionuclide concentrations Thus all particulate values given in this document are stated on a dry basis
The waste radionuclide concentrations on a dry basis were calculated from data available in the Tank Waste Information Network System (TWINS) The Best Basis InventorylBest Basis Summary numbers were used These values are the most complete and up to date readily available estimates for Hanford waste tank contents but do not include water The information was downloaded from TWINS into a spreadsheet The total chemical total beta and total alpha quantities were summed in the spreadsheet for all the tanks which were sampled and concentrations for Csrdquorsquo Sr9rsquo total beta and total alpha automatically calculated in pCig These concentrations are provided in Table E-I Because lab techniques for measuring gross beta levels only detect beta particles with a minimum decay energy above 150-200 kev only radionuclides with a decay energy of gt-200 kev were included in the total beta numbers
The TWINS radionuclide concentrations were obtained in December 1999 No corrections were made for decay for this document
The CGM filter paper and stack record sample data indicate the measured radionuclide values are not always in the same ratio to each other as given by TWINS nor are all radionuclides detected that TWINS indicates are present Radionuclides can be distributed unevenly in a tank Soluble fission products (primarily Csrsquordquo) are found in the liquid saltcake and in sludges Insoluble fission products and actinides are found largely in sludges as these are primarily chemical precipitates Sludge could be mixed with saltcake be present in a distinct layer at the bottom of a tank or in several layers in the tank depending upon how waste was transferred into a tank Waste particles may thus not have the same specific activity on a microscopic scale as they would have on a macro scale were the tank contents homogenized During RMCS a top to bottom core sample is attempted resulting in the drill bit and purge gas (which causes aerosols to form) passing through most ofthe waste matrix Assuming the aerosol generation rate is approximately constant during drilling the specific activity of a radionuclide in the suspended solids should be roughly the same as the average specific activity of the same radionuclide in the tank waste While the waste specific activity is probably not homogeneous from top to bottom in a tank and the aerosol generation rate will likely also vary it is beyond the scope of this document to provide an in-depth analysis of all the factors affecting aerosol radionuclide concentration Although sample radionuclide data were not always in the same ratio as provided by TWINS for the purpose of this document the simplifying assumption was made that the average tank specific activity is adequate to provide an approximation of the suspended solids specific activity for all radionuclides Average tank individual radionuclide specific activities were used in the preparation of the exhauster NOCs
The aerosol calculations presented in this document are only as accurate as the TWINS data The combined radionuclide content of all Hanford waste tanks is known fairly well since the overall content is based upon reactor production records CsrdquorsquoSrW recovery data and processing plant discharges Thus TWINS data for all tanks combined should be reasonable There are undoubtedly differences between TWINS data and the actual contents of a specific tank While the specific tank radionuclide data from TWINS used in this document may not be exact deviations from the actual concentrations are assumed to balance out over the number of tanks sampled
E- 1
RPP-4826 Rev 1
APPENDIX F
ROTARY MODE CORE SAMPLING EXHAUSTER AND CORE SAMPLE DATA
F-0
RPP-4826 Rev 1
APPENDIX F - Rotary Mode Core Sampling Exhauster and Core Sample Data
This appendix provides the basic data obtained during RMCS operations which was used in preparation of this document
Basic Operational Data
There have been three RMCS exhausters and three RMCS sampling trucks deployed since starmp of nitrogen- purged RMCS in November 1994 The exhausters are formally designated 296-P-32296-P-33 and 296-P-34 These were originally referred to as parts of RMCS Systems 2 3 and 4 respectively in the Notices of Construction (NOC) for these units The exhauster designations were changed for routine field use in 1996 to exhausters A B and C to avoid confusion with core sampling trucks 23 and 4 since any exhauster could be used with any RMCS truck Exhauster A (2) and RMCS Truck2 have not been used for RMCS since 1995 and are no longer in service for core sampling
Rotary mode core sampling has been conducted in four general time frames since 1994 These time frames were separated by down times for equipment modifications or resolution of environmental permitting and safety concerns For ease of analysis in this document exhauster operations were organized into six distinct operating periods Periods I to 6 were grouped based upon times when the same exhauster and same set of HEPA filters were being used These periods thus overlap with the general operating time frames The four operating time frames were
The first time frame lasted from November 1994 to January 1995 RMCS Truck 2 and Exhauster 2 (A) were used on Tank BY-106 along with an in-tank prefilter This tank provided the initial deployment and testing of the nitrogen-purged equipment in a waste tank During this period radiation dose rates were taken at the side of the exhauster housing Stack record samples were taken in December 1994 and January 1995
The second time frame lasted from July 1995 through October 1995 RMCS Trucks 2 and 4 were used with Exhausters 2 and 3 (A and B) on BY-105 BY-IO8 and BY-I IO During this period radiation dose rates were taken at the sides of the exhauster housings Stack record samples were taken after completion of sampling on each tank No RMCS samples were taken from BY-108 all samples were taken in push mode for this tank
The third time frame began when RMCS was restarted in December 1997 Trucks 3 and 4 were used for sampling of SX-101 SX-103 SX-105 and SX-102 with the SX tank farm exhauster providing ventilation The RMCS exhausters were not used During this period radiation dose rates were taken at the sides of the SX exhauster housing as part of HPT routine surveys SX farm exhauster stack record samples were taken when required by normal operating procedures SX record sampler and filter housing dose rate data were not evaluated for this document It would not be practical using filter dose rate or stack record sample data to estimate the RMCS aerosol addition if any to the SX ventilation system The background radiation around the SX filter housing makes measurement of any small increase in dose rate very difficult to detect The number of tanks being ventilated and the involved off-gas header routings (the exhauster is pulling on thirteen tanks in series or in parallel with the tank being sampled) and any in-tank activities in the SX tanks not being sampled would make it impractical to assess what aerosols resulted from RMCS Beginning with RMCS in SX farm radionuclide analyses were performed on the filter papers protecting the CGMs which draw air out of the tank vapor space for flammable gas detection
The fourth time frame began in May 1998 Between 1095 and 598 Exhausters B and C were extensively modified with new filter housings and other equipment to meet new NOC requirements Trucks 3 and 4 were used with Exhausters B and C (3 and 4) on S-l IO U-107 BY-105 TX-113 and TX-I 18 This period marked the first use ofthe RMCS trucks and RMCS exhausters together following resolution of flammable gas concerns and modifications to the exhausters New filters were installed Radiation dose rates were taken at the sides of the exhauster housings Stack record samples
F- 1
RPP-4826 Rev I
were taken after completion of sampling for each exhauster installation Radionuclide analyses were performed on the CGM filter papers for all tanks except TX-118 An NDA was performed on the Exhauster C housing following completion ofthe first core on TX-I 13 The housing filters when assayed contained aerosols captured by the exhauster following RMCS in S-l IO U-107 BY-105 (1998) and the first core of TX-I 13 Another NDA was performed on Exhauster C following both cores in TX-I 18 An NDA was performed following sampling of the second core in TX-I 13 using Exhauster B The time frame ran through early June 1999 No RMCS samples have been taken after June 1999 nor are any planned for the next few years
For the purposes of evaluating aerosol formation based upon RMCS exhauster housing NDA and dose rate data the exhauster operations were grouped into 6 operating periods These periods are shown in Table F-1 and restated in Tables A-I and B-I All tanks sampled in Periods 1 2 4 5 and 6 were exhausted by the same exhauster with the same housing and filters present during that period Period 3 covered the time the SX exhauster was used during RMCS in SX farm
A brief description of each RMCS tank sampling operation is provided below
Tank 241-BY-1061194 to 1294 RMCS using the nitrogen purge gas system with an exhauster was formally begun on 111794 on tank BY-106 riser IOB Exhauster 2 (A)and Truck 2 were used A sintered metal prefilter was inserted in the riser between the tank and the exhauster A total of eight segments were taken in rotary mode and five segments in push mode until sampling was halted on 122194 One RMCS core was obtained The total exhauster run time was 4878 hours The stack record sample was removed and analyzed following this run period Dose rates taken at the side of the exhauster housing during RMCS were all lt05 mRhr The in-tank prefilter was smeared for contamination when removed from the tank with the smears showing less than detectable levels of radionuclides present (Waldo 1999) The prefilter had been washed with an installed spray system prior to removal from the tank but subsequent testing showed the water flow and pressure were too low to have been effective at removing contamination
Tank 241-BY-106195 Following some process modifications RMCS in BY-IO6 riser IOB began again on 11895 Exhauster 2 (A) and Truck 2 were used The sintered metal prefilter was inserted in the riser between the tank and the exhauster RMCS was halted on 12495 over authorization basis and equipment operability issues for RMCS A total of three segments were taken in rotary mode and eleven segments in push mode One RMCS core was obtained The total exhauster run time was 1867 hours The stack record sample was removed and analyzed following this run period Dose rates taken at the side of the exhauster housing during RMCS were all lt O S mRhr The in-tank prefilter was smeared for contamination when removed from the tank with the smears showing less than detectable levels of radionuclides present (Waldo 1999) The prefilter was not washed this time
Tank 241-BY-110795 to 1095 Following resolution of RMCS authorization basis and equipment issues and completion of the fabrication and testing of Trucks 3 and 4 RMCS was begun in BY-I IO on 71195 Exhauster 2 (A) and Truck 2 were used Samples were taken from risers 128 7 128 again and 4 There was no in- tank prefilter used in this or any subsequent RMCS periods Sampling was performed until 102595 when RMCS was halted over flammable gas issues A total of 13 RMCS segments and 56 PMCS segments were taken Three RMCS cores were obtained The total exhauster run time was 1125 hours The stack record sample was removed and analyzed following this run period Dose rates taken at the side of the exhauster housing during RMCS were all lt O S mRhr
Tank 241-BY-108795 to 895 Core sampling was begun in BY-IO8 on 72595 Exhauster 3 (B) and Truck 4 were used Sampling was done in risers 12A and 7 The tank material proved soft enough so that no RMCS segments were required all segments were obtained in push mode although the exhauster was operated during part of the time sampling was performed Sampling was completed 81895 A total of 16 PMCS segments were taken The total exhauster run time was 6617 hours The stack record sample was removed and
F-2
RPP-4826 Rev 1
analyzed following this run period Dose rates taken at the side of the exhauster housing during RMCS were all lt05 mRhr
Tank 241-BY-105895 to 1095 RMCS was begun in BY-I05 riser 12A on 83095 Exhauster 3 (B) and Truck 4 were used This tank has a concrete layer on top about 12-18 inches thick which had to be drilled through Part way through sampling questions arose as to the flammable gas status of the tank and RMCS was halted on 10695 A total of 3 RMCS and 7 PMCS segments were taken One RMCS core was obtained The total exhauster run time was 4413 hours The stack record sample was removed and analyzed following this run period Dose rates taken at the side of the exhauster housing during RMCS were all lt05 mRhr
Tank 241-SX-1011297 to 298 Following resolution of extensive regulatory and authorization basis issues and installation of equipment modifications RMCS started in SX-101 with Truck 4 on 12497 An RMCS exhauster was not used since all SX farm tanks excluding SX-113 and SX-I 15 are ventilated with the SX exhauster Sampling was performed in risers 19 and 4 and was completed on 21098 A total of 9 RMCS and 6 PMCS segments were taken Two RMCS cores were obtained SX exhauster stack record samples and filter housing dose rates were obtained as part of routine operations for the SX exhauster not as part of the RMCS process Filter papers used in the suction line for the CGM were saved and analyzed in the laboratory to estimate the airborne radionuclide concentration in the tank head space Two CGM filter papers were needed for each core as moisture in the tank vapors condensed on the papers in the cold weather and began to restrict tank gas flow to the CGM
Tank 241-SX-103498 to 598 RMCS started in SX-103 with Truck 4 on 42798 The SX exhauster was used for ventilation (see SX- 101 above) Sampling was performed in risers 7 and 1 1 and was completed on 51198 A total of 6 RMCS and 18 PMCS segments were taken Two RMCS cores were obtained During sampling filter papers used in the suction line for the CGM were saved and analyzed in the laboratory to estimate the airborne radionuclide concentration in the tank head space One CGM filter paper was used during each core SX exhauster stack record samples and filter housing dose rates were obtained as part of routine operations for the SX exhauster not as part of the RMCS process
Tank 241-SX-105298 to 598 RMCS started in SX-105 with Truck 3 on 22598 The SX exhauster was used for ventilation (see SX- 101 above) Sampling was performed in risers 6 and 14 and was completed on 51598 A total of 6 RMCS and 20 PMCS segments were taken Two RMCS cores were obtained During sampling filter papers used in the suction line for the CGM were saved and analyzed in the laboratory to estimate the airborne radionuclide concentration in the tank head space Two filter papers were needed for the first core as moisture in the tank vapors condensed on the papers in the cold weather and began to restrict tank gas flow to the CGM One filter paper was used for the second core SX exhauster stack record samples and filter housing dose rates were obtained as part of routine operations for the SX exhauster not as part of the RMCS process
Tank 241-SX-102698 to 798 RMCS started in SX-102 with Truck 4 on 61798 The SX exhauster was used for ventilation (see SX- 101 above) Sampling was performed in risers 8 and 4 and was completed on 7798 A total of 2 RMCS and I8 PMCS segments were taken Two RMCS cores were obtained During sampling filter papers used in the suction line for the CGM were saved and analyzed in the laboratory to estimate the airborne radionuclide concentration in the tank head space One filter paper was used for each core SX exhauster stack record samples and filter housing dose rates were obtained as part of routine operations for the SX exhauster not as part of the RMCS process
Tank 241-S-110598 to 698 RMCS was begun in S-I10 on 51898 Exhauster C (4) and Truck 3 were used This tank marked the first use of an RMCS exhauster since 1995 Sampling was completed on 6498 Risers 6 and 14 were sampled A total of IO RMCS and 8 PMCS segments were taken Two RMCS cores were obtained The
F-3
RPP-4826 Rev I
total exhauster run time was 15978 hours The stack record sample was removed and analyzed following this run period Dose rates taken at the side of the exhauster housing during RMCS were all lt05 mRhr During sampling filter papers used in the suction line for the CGM were saved and analyzed in the laboratory to estimate the airborne radionuclide concentration in the tank head space One filter paper was used for each core Waste particles retained on the exhauster housing filters were part of the inventory subsequently measured by NDA following completion of the first core in TX-I 13
Tank 241-U-107698 to 798 RMCS was begun in U-107 on 61098 Exhauster C and Trucks 3 and 4 were used Sampling was completed on 71598 Risers 7 and 2 were sampled A total of IO RMCS and 19 PMCS segments were taken Two RMCS cores were obtained The total exhauster run time was 27385 hours The stack record sample was removed and analyzed following this run period Dose rates taken at the side of the exhauster housing during RMCS were all 105 mRihr During sampling filter papers used in the suction line for the CGM were saved and analyzed in the laboratory to estimate the airborne radionuclide concentration in the tank head space One filter paper was used for each core Waste particles retained on the exhauster housing filters were part of the inventory subsequently measured by NDA following completion of the first core in TX-I 13
Tank 24l-BY-105798 to 898 RMCS was begun in BY-105 again on 72298 Exhauster C and Trucks 3 and 4 were used Sampling was completed on 82598 Risers 7 and 1 1 B were sampled A total of 18 RMCS and 18 PMCS segments were taken The material was hard enough to require rotary mode sampling all the way to the bottom of the waste but negligible recovery was obtained After RMCS was performed to the waste bottom a PMCS core was taken in the same hole to recover material Two RMCS cores were obtained The exhauster run time was 13577 hours for the first RMCS core and 30792 hours for the second RMCS core Stack record sample information in ABCASH shows 30558 hours operation for the second core but the sampler data sheet shows the time counter was mistakenly reset 234 hours into the run No correction was made to the BY-IO5 2nd core record sample concentration for this document since the error is conservative and results in only slightly higher (ltI) record sample radionuclide concentrations for this core A stack record sample was removed and analyzed following each core giving two record samples for BY-IO5 in 1998 Dose rates taken at the side of the exhauster housing during RMCS were almost all lt05 m R h but a few readings indicated 07 mRihr This variation was assumed due to personnel reading the instrument differently or the fact that the exhauster had been used on enough tanks that by now there was sufficient activity on the filters to cause readings approximately at the background detection level The final reading when both cores were completed was lt05 m R h During sampling filter papers used in the suction line for the CGM were saved and analyzed in the laboratory to estimate the airborne radionuclide concentration in the tank head space One filter paper was used for each core Waste particles retained on the exhauster housing filters were part of the inventory subsequently measured by NDA following completion of the first core in TX-113
Tank 241-TX-113998 to 599 Core sampling was begun in TX-I 13 riser 3 on 92298 Exhauster B (3) and Truck 4 were used at the start This was the first use of Exhauster B since it was modified Exhauster B ran for a total of 8738 hours until being disconnected on 102398 During this time two PMCS segments were taken and no RMCS segments Exhauster C was then installed and operated for 5598 hours from 121098 to 122898 No RMCS or PMCS sampling was performed during this time frame RMCS segments werent taken until 299 Exhauster C ran for a 30230 hours between 122898 and 21299 Sampling was completed on the core from riser 3 on 21299 A total of 12 RMCS segments were obtained during the time Exhauster C was operating Exhauster flow rate for both exhausters was a nominal 200 scfm Stack record samples were taken following Exhauster B removal at the end of 1998 for Exhauster C and following completion ofthe first core with Exhauster C Aerosol calculations were based on only the 30230 hours run time for Exhauster C in 1999 since this was the time period during which RMCS segments were obtained Dose rates taken at the side of the exhauster housing during the short PMCS only sampling period with Exhauster B were all ltOS m R h Dose rates with Exhauster C varied between lt O S mRhr and 07 mRhr The final reading on Exhauster C following completion of the first core was 07 mFUhr During sampling filter papers used in the suction line for the CGM were saved and
F-4
RPP-4826 Rev I
analyzed in the laboratory to estimate the airborne radionuclide concentration in the tank head space One filter paper was used for the core Waste particles retained on the exhauster housing filters were part of the inventory subsequently measured by NDA following completion of this core
Sampling in riser 5 was begun on 41299 using Exhauster B and Truck 3 A total of 6 RMCS and 1 PMCS segments were taken for this core before sampling was halted on 42899 The total exhauster run time for this core was 11712 hours Problems with high vacuum in the tank required the exhauster flow rate to be reduced to 190 scfm to keep the system within pressure limits The stack record sample for the second core was removed and analyzed following the run period Dose rates taken at the side of the exhauster housing during the second core were all lt05 m M r During sampling filter papers used in the suction line for the CGM were saved and analyzed in the laboratory to estimate the airborne radionuclide concentration in the tank head space One filter paper was used An NDA was performed on the exhauster housing following this core The only radionuclides present in the housing were those from this core or what was removed from the tank head space during the non-RMCS activities in this tank from 92298 and 102398
Some clarification may be needed to explain use of the exhauster operating times and NDA dose rate and record sample data obtained during core sampling on TX-I 13 Core sampling was set up for sampling riser 3 on TX-113 in September 1998 with Exhauster B Exhauster B operated for a total of 8738 hours between 92298 and 102298 The stack record sample was removed at the end of this period The ERS database incorrectly shows the exhauster operated between 111698 and 111998 The ABCASH database shows the stack record sample was removed on 111998 The stack record sample showed positive emuent concentrations during this time period with variances 400 No RMCS samples were taken during this period so the data and time werenrsquot included when calculating RMCS aerosol numbers Exhauster B was removed and Exhauster C installed in late November-early December Exhauster C was operated for a total of 5559 hours between 121098 and 122398 The stack record sample was removed on 122898 No sampling was performed during this period so the data and time werenrsquot included when calculating RMCS aerosol numbers Exhauster C was operated for a total of 30218 hours between 122898 and 2899 All the RMCS segments from riser 3 were taken in this time period so only the data and time for this period were included when calculating RMCS aerosol numbers Exhauster B was used during sampling of riser 5 Exhauster B operated for a total of 11712 hours between 41299 and 42899
Tank 241-TX-l18599 to 699 RMCS was begun in TX-I 18 on 5699 Exhauster C (4) and Truck 4 were used Sampling was completed on 6298 Risers 9B and 12B were sampled A total of 9 RMCS segments were taken there were no PMCS segments Two RMCS cores were obtained The total exhauster run time was 21247 hours The stack record sample was removed and analyzed following this run period The maximum dose rate taken at the side of the exhauster housing following RMCS was 08 m M r CGM filter papers were not analyzed An NDA was performed on the exhauster housing following completion of the two cores The exhauster housing contained the same nuclides as for the first NDA (S-110 U-107 BY-105 and TX-I 13 first core) plus those from TX-I 18
The basic core sampling operational data used in this document includes the number of RMCS cores and segments the exhauster run times and flow rates the RMCS exhauster HEPA filter dose rates and tank vapor space temperatures Table F-l lists the basic operational data This information excluding tank vapor space temperature data was obtained from procedural data sheets in the sampling work packages (References W - 1 to WP-23)
Tank temperature data for the tanks ventilated with the RMCS exhausters was obtained from the TWINS database Plots for each tank were prepared for the time RMCS was conducted and the average value of the highest thermocouple located in the tank (the lowest temperature reading) was estimated and used as the average tank head space temperature during the RMCS period
The SX exhauster flow rates listed in Table F-l are estimates only The combined flow rate for SX-IO1 through SX-106 plus SX-109 (7 tanks) averaged 440 cfm during CY 1996 (Kaiser 1997) for an average of 63 cfm per
F-5
RPP-4826 Rev I
tank Based upon inlet flow measurements at the tank inlet HEPA filters (Fanis 1998) the flow through each individual tank (SX-IO1 through SX-106 plus SX-109) was lt55 cfm at the breather filter Assuming an exhaust flow of 100 cfm for each SX farm tank sampled is therefore conservative
Calculated Data
Calculated data include the tank head space volumes conversion of the RMCS exhauster flow rate from scfm to acfm and the number of tank head space changeouts made by an exhauster during RMCS
Tank head space volume includes the dome space volume above the top of the sidewall plus the void space between the waste surface and the top of the sidewall The formula used to calculate tank head space volumes WN
Head Space Volume in A = (DS + [(H) (12) + HI + Hb - H] (V)) - 748
Where DS = dome space volume gal H = height of tank body sidewall above knuckle A HI = height of tank knuckle area in Hb = height oftank bottom below knuckle in H = height of waste in tank in V =27555 galin of waste in SX tanks 2754 gallin in all others
The tank dome space volumes height of tank sidewall above the knuckle height of tank knuckle area and height of tank bottom below the knuckle were obtained from Reynolds 1999 The height of waste in each tank at the time of core sampling was obtained from the TWINS database Tank dimensional and waste level data are given in Table F-2 along with the calculated tank head space volumes
Aerosol calculations for Appendices A-C require exhauster flow rates in actual cubic feet per minute The RMCS exhauster flow rate is controlled and recorded in standard cubic feet per minute The mass flow rate of the exhauster air is measured and internal logic in the exhauster controller calculates what the volumetric flow rate would be if the temperature and pressure in the exhauster inlet were at standard conditions The standard conditions used in the logic controller are 29921 in Hg (760 mm Hg) and 69F (ZIT)
A correction factor is built into the exhauster control logic that assumes an atmospheric pressure of 2927 in Hg the average atmospheric pressure at Hanford The RMCS exhauster will operate at about 1-2 in H20 negative pressure resulting in about a 2916 in Hg pressure in a waste tank when the RMCS exhauster is operating To revise the indicated scfm RMCS exhauster reading to an acfm value the RMCS exhauster scfm flaw rate was multiplied by (29922916)(T+459)528 where Tis the tank head space temperature in OF The tank head space temperatures in Table F-1 were input to the spreadsheet file used for aerosol calculations and converted to acfm The flow rates in acfm are included in Table F-I
The tank head space changeouts when using the RMCS exhauster were calculated by multiplying the exhauster acfm flow rate by the time of exhauster operation and dividing the result by the tank head space volume Tank head space changeouts are listed in Table F-2
F-6
c
gt 2
RPP-4826 Rev 1
APPENDIX G
REFERENCES
G-0
RPP-4826 Rev 1
APPENDIX G - References
Diedeker 1999 NDA of RMCS HEPA Filters L P Diedeker WMH E-Mail to JS Schofield CHG November 29 I999
ERDA 1976 Nuclear Air Cleaning Handbook ERDA 76-21 Buchsted C A Fuller A B and Kahn 1 E Oak Ridge National Laboratory 1976
Farris 1998 Internal Note T R Farris LMHC to J S Schofield LMHC Breather Filter Flow Rates for SX-Farm 31698
Foust 1999 Internal Memo RMCST Exhauster HEPA Filter Dose Rate Calculations D J Foust LMHC to J S Schofield LMHC October 25 1999
Greager 1999 Correspondence No WMH-9954450 Non-Destructive Analysis of the Rotay Mode Core Sample High-Efjiciency Particulate Air Filters E M Greager WMH to P C Miller LMHC June 28 1999 [Transmittal of HNF-4199 Resultsfram NDA Measurement of the 296-P-34 RMCS HEPA Filters]
HNF 1999 HNF-SD-WM-SAR-067 Tank Waste Remediation System Final Safety Analysis Report Rev 1 The revision incorporating RMCS accident analyses was submitted as Addendum 5 to DOE as a change to the FSAR predecessor the Basis for Interim Operation (BIO) LMHC-9857075 80232764-9-KOOl Submittal of Authorization Basis Amendment Package for Rotay and Push Mode Core Sampling in Satisfaction of Perfarmance Agreement TWR 122 Expectations I and 3 D 1 Allen LMHC to A M Umek FDH August 30 1998 Addendum 5 as of mid-January 2000 is waiting for approval by DOE
Kaiser 1997 T D Kaiser LMHC E-Mail to J S Schofield LMHC SX Tank Flow Data 42197
NUREG 1995 Potential Radionuclide Emissionsfrom Stacks on the HanfordSite Part I Dose Assessment Davis W E and Barnett J M Westinghouse Hanford Company from Proceedings of the 23 DOEMRC Nuclear Air Cleaning Conference held July 25-28 1994 February 1995
Schofield 2000a Letter 74910-00-002 Use of Microshield Calculations for RMCS Exhauster Housing for Estimating Radionuclide Quantities on the Filters Using NDA and Dose Rate Measurements I S Schofield CHG to File January 62000
Schofield 2000b Letter 74910-00-003 Rev I RMCS Exhauster Stack RecordSample Data J S Schofield CHG to File January 202000
Reynolds 1999 D R Reynolds LMHC E-Mail to I S Schofield LMHC transmitting Tank Volume Calculations draft of calculations done by Mike Plesha and Reed Hendershot data to be used for RESOLVE computer program for Hanford waste tanks August 3 1999
TWINS Tank Waste Information Network System database available at httptwinspnlgovSOO lhtbinTCDgetTableListexe
Waldo 1999 letter 74910-99-009 RMCS Exhauster Aerosol Test Data E I Waldo to J S Schofield June 22 1999
WHC 1993 WHC-SD-WM-ES-225 Rev I AerosolStudy for the Rotary Mode Exhauster P M Francis Westinghouse Hanford Company April 20 1993
WHC 1997 WHC-SD-WM-SAD-035 Rev Ob A Safety Assessment of Rotary Mode Core Sampling in Flammable Gas Single Shell Tanks Hanford Site Richland Washington August 8 1997
G- I
RPP-4826 Rev I
CGM Data CGM-I Letter PARTICULATE SAMPLING OF 241-SX-IO1 DURING ROTARY MODE CORE SAMPLING D C
Langlois E2 Consulting Engineers to J S Schofield Lockheed Martin Hanford Company March 16 1998
CGM-2 Letter PARTICULATE SAMPLING OF 241-SX-I05 DURING ROTARY MODE CORE SAMPLING D C Langlois E2 Consulting Engineers to J S Schofield Lockheed Martin Hanford Company June 9 1998
CGM-3 Letter PARTICULATE SAMPLING OF 241-SX-103 DURING ROTARY MODE CORE SAMPLING D C Langlois E2 Consulting Engineers to J S Schofield Lockheed Martin Hanford Company June 12 1998
CGM-4 Letter PARTICULATE SAMPLING OF 241-S-110 DURING ROTARYMODE CORESAMPLING D C Langlois E2 Consulting Engineers to J S Schofield Lockheed Martin Hanford Company July 20 1998
CGM-5 Letter PARTICULATE SAMPLING OF 241-SX-102 DURING ROTARY MODE CORE SAMPLING D C Langlois E2 Consulting Engineers to J S Schofield Lockheed Martin Hanford Company July 22 1998
CGM-6 Letter PARTICULATE SAMPLING OF241-U-107 DURING ROTARY MODE CORE SAMPLING D C Langlois E2 Consulting Engineers to J S Schofield Lockheed Martin Hanford Company August 3 1998
CGM-7 Letter PARTICULATE SAMPLING OF 241-BY-105 DURING ROTARY MODE CORESAMPLING D C Langlois E2 Consulting Engineers to 1 S Schofield Lockheed Martin Hanford Company September 17 1998
CGM-8 Letter PARTICULATE SAMPLING OF 241-TX-I13 DURING ROTARY MODE CORESAMPLING D C Langlois E2 Consulting Engineers to J S Schofield Lockheed Martin Hanford Company March 15 1999
CGM-9 Letter PARTICULATE SAMPLING OF 241-TX-113 DURING ROTARY MODE CORE SAMPLING D C Langlois E2 Consulting Engineers to I S Schofield Lockheed Martin Hanford Company May 31 1999
Notices of Construction NOC-I DOEIRL-93-40 Radioactive Air Emissions Program Notice of Construction Rotary Mode Core-Sampling
Truck and Exhauster Approved by Letter AIR 93-707 A W Conklin WDOH to J E Rasmussen DOEIRL 7893
NOC-2 DOEIRL-94-118 Rev 0 Radioactive Air Emissions Program Notice of Construction for the Rotary Mode Core-Sampling Systems Three and Four Approved by Letter AIR 95-603 A W Conklin WDOH to J E Rasmussen DOERL 63095
NOC-3 DOERL-94-118 Rev 1 Radioactive Air Emissions Program Notice of Construction for the Rotary Mode Core-Sampling Systems Three and Four Approved by Letter AIR 98-301 W W Conklin WDOH to I E Rasmussen DOEIRL 3698
NOC-4 DOEIRL-97-70 Radioactive Air Emissions Program Notice of Construction for Rotary Mode Core- Sampling in SX Tank Farm Approved by Letter AIR 97-1 101 A W Conklin WDOH to J E Rasmussen DOEIRL 113097
NOC-5 USEPA Letter OAQ-107 (no title approving DOE submittal 97-EAP-590 dated 72997) A J Frankel USEPA to J E Rasrnussen DOEIRL 8497
NOC-5 USEPA Letter OAQ-107rsquo (nb title approving DOE submittal 97-EAP-723 dated 101797) A J Frankel USEPA to J E Rasmussen DOERL 11498
Note that both letters have ldquoOAQ-107rdquo following ldquoReply to Attn ofrdquo
G-2
RPP-4826 Rev I
Work Packages WP-I ES-94-00808 WP-2 ES-95-00258 WP-3 ES-95-00045 - WP-4 ES-95-00434 - WP-5 ws-97-00173 - WP-6 WS-97-00174 - WP-7 ws-97-00143 - WP-8 WS-97-00144 - WP-9 WS-97-00207 - WP-I 1 WS-97-00208 - WP-12 WS-98-00049 - WP-13 WS-97-00050 - WP-14 WS-97-00224 - WP- I5 WS-97-00225 - WP-16 WS-97-00230 - WP- I7 ws-97-0023 1 - WP-18 ES-97-00452 - WP-19 ES-97-00453 - WP-20 WS-98-00072 - WP-21 WS-98-00073 - WP-22 WS-98-00067 - WP-23 WS-98-00068 -
241-BY-IO6 Perform Rotary Core Sample [Riser IOB] 241-BY-I IO Rotary Core Sample [Risers 12B 7 IZB 41 241-BY-IO8 Obtain Rotary Core Sample [Risers 12A amp 71 241-BY-IO5 Rotary Mode Core Sample [Riser 12A] 241-SX-101 Rotary Mode Core Sample Riser 19 241-SX-101 Rotary Mode Core Sample Riser4 241-SX-103 Rotary Mode Core Sample Riser 7 241-SX-103 Rotary Mode Core Sample Riser I I 241-SX-105 RMCST Obtain Core Sample Riser 6 241-SX-105 RMCST Core Sample Riser 14 241-SX-102 Rotary Mode Core Sample Riser 8 241-SX-102 Rotary Mode Core Sample Riser 4 241-S-1 IO RMCST Obtain Core Sample Riser 6 241-S-1 IO RMCST Obtain Core Sample Riser 14 2414-107 RMCSTCore Sample Riser 7 241-U-107 RMCST Core Sample Riser 2 241-BY-IO5 RMCST Core Sample Riser 7 241-BY-IO5 RMCST Core Sample Riser 1 IB 241-TX-113 Rotary Core Sample Riser 3 241-TX-113 RMCST Core Sample Riser 5 241-TX-I 18 RMCST Core Sample Riser 9B 241-TX-I 18 RMCST Core Sample Riser 128
G-3
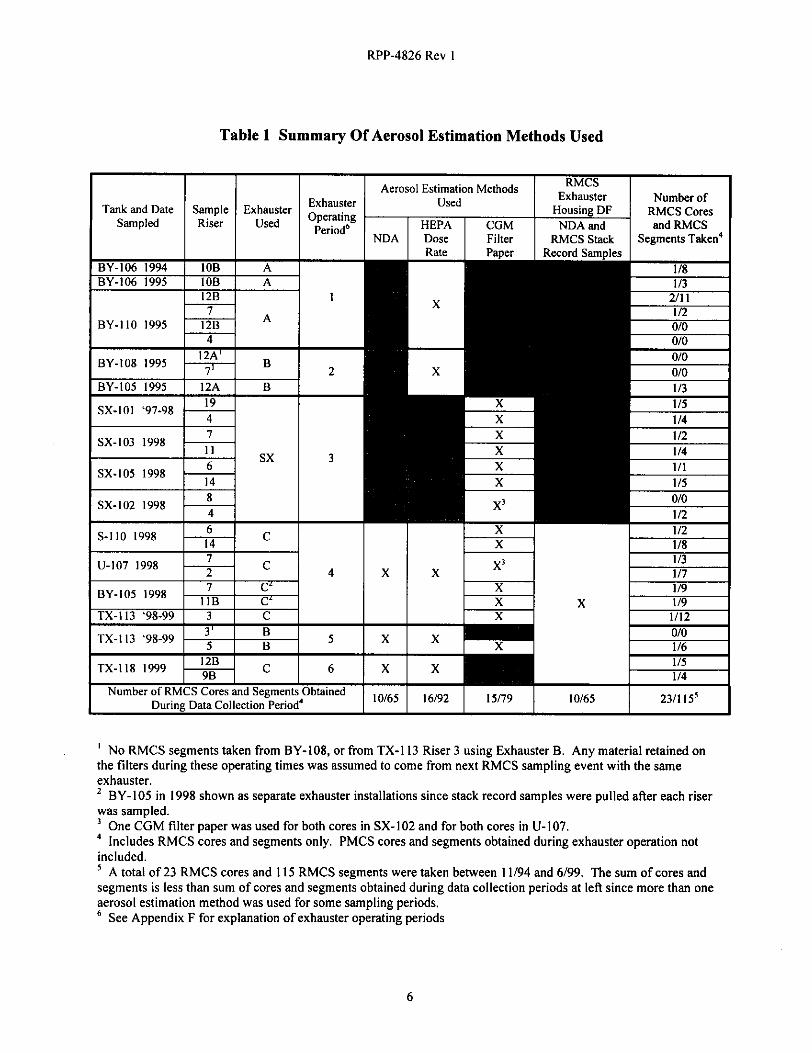
RPP-4826 Rev I
Tank and Date Sampled
Table 1 Summary Of Aerosol Estimation Methods Used
RMCS Aerosol Estimation Methods Exhauster Number of Used
Housing DF RMCS Cores Riser Used Period6 HEPA CGM NDA and and RMCS
Exhauster Operating Sample Exhauster
NDA Dose Filter RMCS Stack Segments Taken
BY-IO5 1998
No RMCS segments taken from BY-108 or from TX-I 13 Riser 3 using Exhauster B Any material retained on I
the filters during these operating times was assumed to come from next RMCS sampling event with the same exhauster BY-IO5 in 1998 shown as separate exhauster installations since stack record samples were pulled after each riser was sampled
Includes RMCS cores and segments only PMCS cores and segments obtained during exhauster operation not included A total of 23 RMCS cores and 115 RMCS segments were taken between 1194 and 699 The sum of cores and segments is less than sum of cores and segments obtained during data collection periods at lei since more than one aerosol estimation method was used for some sampling periods
One CGM filter paper was used for both cores in SX-102 and for both cores in U-107 3
See Appendix F for explanation of exhauster operating periods
6
RPP-4826 Rev I
Table 2 Summary Of RMCS Aerosol Data
Weighted average based upon number of RMCS segments taken with each method
7
e
Q 0 c 0 0 - 0 VJ 0 L
2
RFP-4826 Rev 1
APPENDIX A
ESTIMATION OF AEROSOLS GENERATED DURING Rh4CS BASED UPON RMCS EXHAUSTER HOUSING NON-DESTRUCTIVE ASSAY
A-0
RPP-4826 Rev I
APPENDIX A - Estimation Of Aerosols Generated During RMCS Based Upon RMCS Exhauster Housing Non-Destructive Assay
Summary of Method
This method of estimating RMCS aerosol quantities uses non-destructive assay (NDA) of the exhauster housing to determine the C S rdquo ~ quantity (Ci) on the filters inside This quantity is then divided by the C S rdquo ~ specific activity (Cig) in the waste for the tank(s) on which the exhauster and the same filters were present during sampling The resulting mass on the filters divided by the volume of air flowing through the exhauster provides an estimate of the average aerosol mass concentration in the air to the exhauster This value was multiplied by the tank head space volume to obtain the average mass of particulates present in the tank head space during RMCS The mass of waste on the filters divided by the number of rotary cores or segments taken provides the mass per core or per segment sent to the exhauster
Description
There are one prefilter and two HEPA filters in series for each RMCS exhauster Particulates captured on the filters contain radionuclides with C S rdquo ~ bein the predominant gamma emitter By performing an NDA of the exhauster housing filters the quantity of Cslg7 in the housing can be estimated This C S rdquo ~ value is then used to back-calculate to a waste mass on the filters using the mass is used to calculate the concentration of particulates in the tank exhaust stream the total suspended solids in the tank head space and the mass of waste sent to the exhauster for each RMCS core or segment taken
Exhauster operations were divided into six operating periods for evaluation in this document These periods are discussed in Appendix F and shown in Table F-I NDA data were obtained for Exhauster Operating Periods 4 5 and 6 Relevant information for these periods is also listed in Table A-I
Period 4 was for Exhauster C use during RMCS for both cores in S-l IO U-107 BY-IO5 and the first core in TX-I 13 The filters and housing were new prior to RMCS in S-110 No filter changeouts were made during this period the accumulated particulates from these RMCS events were retained on the housing prefilter primary HEPA and secondary HEPA
Period 5 was for Exhauster B use during RMCS for the second core in TX-I 13 The filters and housing were new prior to RMCS in TX-113 No filter changeouts were made during this period Exhauster B also ran for a short time during the first core in TX-113 but no RMCS segments were taken when the exhauster was operating Stack record samples (see Appendix D) indicated small levels of aerosols were present in the stack exhaust during this time period Any material collecting on the filters during this time period would show up and be counted as part of the aerosols generated during the 2rdquod RMCS core
Period 6 was for Exhauster C use during RMCS for both cores in TX-I 18 During Period 6 the filters also contained the waste particles from Period 4 No filter changeouts were made durin this period The aerosol mass generated due to RMCS in TX-I 18 was determined from the increase in Cs on the filters between Period 4 and Period 6
A description of the sampling method used for the NDA obtained following Period 4 is provided in Greager 1999 The same method was used for the NDA following Periods 5 and 6 The NDA consisted of a gamma energy analysis of the exhauster housing performed at points adjacent to the prefilter first HEPA and second HEPA The detector was mounted outside the housing and inside a lead collimator The collimator was used to minimize the background count rate and contribution from adjacent filters CsIh was the only radionuclide reported as present The NDA compared the count rates from the exhauster housing with the count rate of an National Institute of Standards and Technology (NISampT) traceable in an equivalent geometry to the RMCS exhauster housing The count rates from housing filter readings were divided by the count rate for the source to give a reported quantity of Cslrdquo on the filters
concentration in the tank waste This filter waste
3 B
source located in the middle of a filter
A- 1
RPP-4826 Rev 1
Two correction factors were applied to the reported filter Csrdquorsquo values for use in this document These are discussed in the following two sections
Reported NDA Data
The NDA results for Period 4 are provided in Greager 1999 The only radionuclide reported as present on the filters was CsI3rsquo The results are restated in Table A-2
The NDA results for Periods 5 and 6 are provided in Diedeker 1999 The only radionuclide reported as present on the filters was Csrdquorsquo The results are restated in Table A-2
Adjusted NDA Data
The reported results are based upon comparing the count rate for a reference point source located in the middle of a mock-up assembly equivalent to the exhauster housing with the count rate from the same detector inside a lead collimator placed outside the actual exhauster housing Limitations with this method include comparison of a point source with a distributed matrix and the inability of the detector to see the entire filter due to the presence of the collimator Correction factors were used to adjust the reported values to account for these two limitations
The first correction factor accounts for comparing a distributed source to the point source standard The reported results were calculated based upon a point source standard since there are no readily available filter standards with a distributed source The material in the filter housing should be fairly evenly distributed through the filter media however so comparing count rates for the filter housing to a point source standard will result in some error To correct for this error shielding calculations were performed on an exhauster housing filter assuming the CSrdquorsquo was evenly distributed throughout the filter media and then again assuming the activity was a point source in the middle of the filter Foust 1999 provides the results of these Microshield dose rate calculations Using the data in Foust 1999 Schofield 2000a shows that the dose rate at the NDA detector location would be about 0625 mFVhrmCi CSrdquorsquo for a point source and 073 mRhrmCi Cslrdquo for a distributed source To adjust the reported NDA results to what they would have been if an actual distributed standard source was available the reported values need to be multiplied by 0625 + 073 = 086
The second correction factor accounts for the detector not being able to see the entire filter contents due to the detector location inside the lead collimator Using basic geometry Schofield 2OOOa estimated the detector has about a 100 view of 608 of a HEPA filter about a 50 view of 264 of the filter and is shielded from the remaining 128 The detector count rate was thus estimated as being approximately 741 o f what it would be if the detector were not collimated To correct the reported results to what they would have been if an uncollimated detector could have been used the reported values need to be multiplied by I + 0741 = 135
Combining the two correction factors gives a single adjustment factor used of 086 x 135 = 116 Per Table A- 2 the total quantity of Csrdquorsquo reported present in the housing for Period 4 was 0430 mCi This quantity was multiplied by 116 to give 050 mCi Csrdquorsquo The reported results for Periods 5 and 6 were revised in the same manner to give 0032 mCi and 064 mCi C~rsquo~rsquorespectiveIy To determine the net increase in Csrdquorsquo for the housing during Period 6 the value from Period 4 was subtracted from the total or 064 - 050 = 014 mCi Csrdquorsquo
Calculation of Mass Quantity on Filters
Calculation of the mass of waste on the filters requires knowledge of the specific activity of the waste on the filters The specific activities used for each exhauster operating period are given in Table A-I The paragraphs below provide a derivation of the specific activities used
The specific activity values for the waste in each tank sampled is given in Table E-I Rh4CS was performed on more than one tank during Period 4 so a weighted average specific activity was used to calculate the waste mass on the filters during this period The weighted average specific activity was calculated based upon the number of RMCS segments taken from each tank sampled The number of RMCS segments obtained during
A-2
RPP-4826 Rev 1
each period for which NDA measurements were made are listed in Table A-I These values were obtained from Table F-I A weighted average specific activity for the waste on the filters in Period 4 was obtained by
[[O 227 mCigl[lO segl+[Ol2lmCigl[lO seg1+[0225 mCigl[l(l seg]+[Ol30 mCig][l2 seg]]+[SO segments] = 0182 mCi Csrdquorsquog
Calculating a weighted average based upon the number of segments assumes aerosol generation is roughly the same per segment and the specific activity of a radionuclide is constant throughout a tank These assumptions are adequate for the purpose oftbis document Aerosol generation can vary with water content waste hardness depth of sample taken nitrogen flow rate and porosity of the waste An in-depth evaluation of these parameters is beyond the scope of this document The impact of these variables is assumed to average out over all the RMCS segments taken The specific activities used do not vary greatly from tank to tank so any variations will not have a significant impact on the final aerosol results See Appendix E for further discussion of limitations on specific activities used in this document
For Period 5 the filters were new at the start and the only tank sampled with the exhauster was TX-I 13 Therefore the specific activity of CsI3rsquo for TX-I 130130 mCig was used
The same exhauster and filters used for Period 4 were used for Period 6 The net increase in Csrdquorsquo for Period 6 was determined by subtracting the Period 4 Csrdquorsquo from the total Since this net increase was only due to TX- 118 the specific activity of Csrdquorsquo for TX-I 180130 mCig was used for the waste added to the filters in Period 6 (Note it is only a coincidence that TX-I 13 and TX-118 have the same nominal Csrdquorsquo concentration)
The total mass of waste on the filters for Period 4 was thus
050 mCi i 0182 mCig waste = 275 g waste in exhauster housing
The mass of waste added to the exhauster for Period 5 was
0032 mCi + 0130 mCig waste = 025 g waste in exhauster housing
The mass of waste added to the exhauster for Period 6 was
(064 mCi - 050 mCi) + 0130 mCig waste = 11 g waste in exhauster housing
Aerosol Calculations
The tank head space particulate concentration was obtained by dividing the mass of waste sent to the exhaust stream by the volume of air sent to the exhauster The volume of air to the exhauster was obtained by multiplying the exhauster flow rate by the exhauster run times for each tank from Table F-I
For the RMCS exhausters the recorded exhauster flow rate is reported in standard cubic feet per minute (scfm) The RMCS exhauster flow rate is controlled to a nominal 200 scfm The exhauster flow rate was corrected to an actual cubic feet per minute (acfm) before calculating the tank head space aerosol concenmtion Table F-l includes the actual cfm flow rates
The calculated flow rates during RMCS for the tanks sampled during Period 4 were 207 acfm (S-1 lo) 206 acfm (U-107) 208 amp 209 acfm (BY-105) and 203 acfm (TX-I 13) The total volume oftank air through the exhauster during Period 4 was thus
[[207 cfm][ 15978 hr]+[206][27385]+[208][13577]+[209][30792]+[203][30230]][60 minh] = 146 E+7 Arsquo
The average tank head space mass concentration during RMCS in the above tanks was
[275 g + 146 E+7 Arsquo] x [35315 ftrsquomrsquo] = 664 E-6 average g waste per m3 in exhauster inlet
A-3
RPP-4826 Rev I
The gas flow rates and average tank head space mass concentrations during RMCS for Periods 5 and 6 were calculated in a similar manner
The average mass of waste in a tank head space during RMCS was calculated by multiplying the tank head space mass concentration by the tank head space volume from Table F-2 as shown below for S-1 I O
[275 g + 146 E+7 Arsquo] x [89100 ftrsquo] = 167E-2 g waste in S-1 IO head space
The particulate quantities in the other tank head spaces were calculated in a similar manner The weighted average mass in a tank head space during Period 4 was based upon the number of segments taken in each tank
The mass sent to the exhauster per RMCS core or per RMCS segment was obtained by dividing the mass of waste sent to the exhaust stream during each period by the numbers of RMCS cores or RMCS segments obtained during the exhauster operating time The average mass of waste sent to the exhauster during Period 4 is thus
275 g waste + 7 rotary cores = 39E-1 g wastelrotary core
and
275 g waste + 50 rotary segments = 55E-2 g wasteirotary segment
The mass of waste to the exhauster per RMCS core and RMCS segment for Periods 5 and 6 were calculated in a similar manner
All data were input to a spreadsheet to perform the calculations Results are provided in Table A-3
Summary of Calculations
Non Destructive Assay was performed on the RMCS exhauster filter housings used during three separate exhauster operating periods during which IO RMCS cores and 65 RMCS segments were obtained from five tanks Weighted averages of the average tank head space mass concentration average mass of suspended solids in a tank head space and average mass sent to the exhauster per RMCS core or segment for the three periods combined were calculated based upon the number of RMCS segments taken during each period Based upon RMCS exhauster housing NDA data the results indicate that
The average tank head space mass concentration during RMCS was 77E-6 g wastelmrsquo The average mass of suspended solids in the tank head space during RMCS was 18E-2 g waste The average mass sent to the exhauster during RMCS was 52E-1 g wastelcore The average mass sent to the exhauster during RMCS was 63E-2 g wasteisegment
A-4
RPP-4826 Rev 1
APPENDIX B
ESTIMATION OF AEROSOLS GENERATED DURING RMCS BASED UPON Rh4CS EXHAUSTER HEPA FILTER DOSE RATES
B-0
RPP-4826 Rev I
APPENDIX B - Estimation Of Aerosols Generated During RMCS Based Upon RMCS Exhauster HEPA Filter Dose Rates
Summary of Method
This method of estimating RMCS aerosol quantities divides the dose rate increase (mRhr) at the side of the RMCS HEPA filter housing by a calculated dose conversion factor (mRhrmCi C S rdquo ~ ) to obtain an approximation of the radionuclide quantity in the housing This radionuclide quantity is divided by the waste specific activity (mCig) to determine the mass of waste on the HEPA filter Dividing the HEPA filter waste mass by the volume of air passing through the filter provides an estimate of the average tank head space particulate concentration during RMCS Multiplying the average tank head space particulate concentration by the tank head space volume gives an estimate of the average mass of suspended particulates in the tank head space during RMCS Dividing the HEPA filter waste mass by the number of RMCS cores or RMCS segments provides the mass per RMCS core or per RMCS segment sent to the exhauster
Description
Particulates in the exhaust stream are removed by the HEPA filter(s) upstream of the exhaust fan The captured particulates contain radionuclides with CSrsquo~rsquo being the predominant gamma emitter As the particulate quantity on the HEPA filter increases the dose rate at the side of the filter housing will increase proportionately By monitoring the HEPA dose rate at the side of the filter housing the quantity of Csrsquordquo on the HEPA can be estimated This C S rdquo ~ value is then used to back-calculate to a waste mass quantity on the filter using the Csrsquordquo concentration in the tank waste This filter waste mass quantity is used to calculate the concentration of particulates in the tank exhaust stream the total suspended solids in the tank head space and the mass of waste sent to the exhauster for each RMCS core or segment taken Although radionuclides will be trapped on both the prefilter and the primary HEPA filter with a very small amount on the secondary HEPA calculations in this section were based upon the simplifying assumption that all the activity was on the primary HEPA filter
During RMCS exhauster operation the dose rate in m M r at the side of the HEPA filter housing is periodically measured with an Eberline RO-3B per procedure to indicate when radioactive particulates are building up on the filter The limit of detection of the RO-3B is 05 mRhr
Exhauster operations were divided into six operating periods for evaluation in this document These periods are discussed in Appendix F and shown in Table F-I Housing dose rate data were obtained for Exhauster Operating Periods I 24 5 and 6 Relevant information for these periods is also listed in Table B-I Dose rate data are available and were used for all tanks on which an RMCS exhauster was present and RMCS samples were taken This includes BY-106 BY-IO5 (1995) BY-I IO S-l I O U-107 BY-IO5 (1998) TX-113 and TX- 1 18 The dose rate at the end of a period was used as the basis for calculating radionuclides on the filters The only operating period for which dose rate data were not used for estimating filter radionuclide content was Period 3 Period 3 was for RMCS in SX farm using the SX exhauster
The dose rate at the side of the SX exhauster HEPA filter housing was measured during RMCS of SX farm tanks (for sampling of tanks SX-lot SX-102 SX-103 and SX-105) but the data are not useful for estimation of aerosol quantities because the SX exhauster draws on 13 tanks in parallel or in series with the tank being core sampled Many of the tanks have a much higher off gas flow rate than the sampled tank In addition there is background radiation in the area of the SX exhauster filter housing making any increase in the housing dose rate during RMCS difficult to detect
Dose Rate Data
The dose rate data for each period is listed in Table 8-2 No dose rates above minimum detectable limits were evident at the sides of any RMCS exhauster in Periods I 2 and 5
Dose rate measurements were less than detectable for Period 4 during sampling of S-l IO and U-107 When sampling on BY-IO5 there were a few readings of 07 m M r but most were ltOS mRhr This variation in
B- 1
RPP-4826 Rev 1
readings is to be expected as the specific instrument person using the instrument and location at which the dose rate is checked can vary with time The final recorded dose rate when sampling was complete on BY-IO5 was lt05 mRhr At the end of Period 4 following completion of the first core in TX-I 13 Exhauster C was listed as having a 07 m M r dose rate
Period 6 used Exhauster C again with the same housing and filters as at the end of Period 4 The final dose rate for this period was 08 m M r
Periods 124 and 5 all began with a new housing and new filters For Periods 12 and 5 it was conservatively assumed that the final dose rate was equal to 05 m M r giving an increase of 05 mRhr for each of these periods For Period 4 the dose rate increase was 07 m M r for this period Since Period 6 used the same housing and filters as Period 4 the increase for Period 6 was 08 - 07 = 01 m M r
The dose rate increase was converted into a CsIh content on the primary filter for each period Foust 1999 provides various dose rates for an RMCS exhauster housing assuming even dispersal of 1 mCi C S rdquo ~ on the first HEPA filter Using these calculations Schofield 2000a estimated a dose rate conversion factor of 16 mRhrmCi C S rdquo ~ at the detector location for an RO-3B The assumption that radionuclides are evenly distributed on the HEPA is a reasonable assumption based upon the exhauster design and the method used to measure the radiation dose rate
Gamma emitting contribute to the dose rate due to bremsstrahlung radiation and other nuclides may provide some small additional dose but the major penetrating dose rate contributor in aged SST waste is CSrdquo~ Ignoring the presence of all radionuclides (including Srm) except C S rdquo ~ in calculating a HEPA filter waste mass will provide a conservative result This is because assuming all radiation present is due to C S rdquo ~ will result in overestimating the C ~ I ~ ~ c o n t e n t of the filter housing which in turn will result in overestimating the waste mass on the HEPA filter
Dividing the HEPA dose rate for each exhauster installation by the dose conversion factor of I 6 mRhrmCi results in an increase of 031 mCi Csrdquorsquo on the RMCS exhauster filters for Periods I 2 and 5044 mCi for period 4 and 0063 mCi for Period 6
Calculation of Mass Quantity on Filters
Dividing the Csrdquorsquo content of the filters by the specific activity of C S rsquo ~ ~ in the waste gives the estimated mass of waste sent to the exhauster The specific activity value used for the waste in each tank sampled is given in Table E-I Since RMCS was performed on more than one tank in Periods 1 and 4 a weighted average specific activity was used for these periods The weighted average specific activity was calculated based upon the number of RMCS segments taken from each tank sampled during that period The number of RhKS segments obtained during each period are listed in Table B-I These data were obtained from the individual tank data in Table F- I Calculations to estimate the specific activity of waste mixtures were performed in the same manner as shown in Appendix A For Periods 2 5 and 6 RMCS samples were taken in only one tank The waste specific activity used for these periods was the specific activity of the tank sampled The specific activities used for each exhauster operating period are given in Table B-I
For all exhauster installations except BY-IO6 in 1994 and 1995 the RMCS exhausters were hooked directly to the waste tank When sampling BY-106 a prefilter was installed in the tank riser between the tank and the exhauster The prefilter was not used for BY-I IO in Period 1 or for any other tank in any other period Thus for Periods 2 4 5 and 6 the mass of waste on the HEPA was assumed equal to the mass of waste leaving the tank risers For Period 1 the mass of waste on the HEPA had to be adjusted for the BY-106 prefilter DF when estimating the combined mass of waste leaving the BY-IO6 and BY-I IO tank risers The mass of waste on the HEPA for Period 1 was
[031 mCi] [IO00 pCimCi] = 310 pCi
[310 pCi Csrdquorsquoon HEPA] + [I77 pCi C S rdquo ~ ~ waste] = 177 gwaste on HEPA
is the predominant radionuclide contributor to filter dose rates Beta emitting Srw can
on HEPA
B-2
RPP-4826 Rev 1
A decontamination factor (DF) of 5 was used to account for radionuclide removal by the BY-IO6 prefilter (see Appendix D for basis ofprefilter DF) There were 1 1 RMCS segments taken from BY-IO6 and 13 from BY- 1 IO The total mass ofwaste assumed to exit the tank risers was therefore
[ I 77 g waste] [ 1 1 + 131 [[I 151 + 131 = 28 g waste from tank risers
The DF of 5 to account for the prefilter is only applicable to the RMCS of BY-IO6 in 1994 and 1995 for all other exhauster periods the mass of waste on the HEPA was equal to the mass of waste sent to the exhauster riser
The mass of waste sent to the exhauster for Period 2 was
[031 mCi] [IO00 pCimCi] = 310 pCi Csrdquorsquo on HEPA
[3 IO pCi C S rdquo ~ on HEPA] + [225 pCi CsiI7g waste] = I 39 g waste from tank
Using the same formula the mass of waste to the exhauster from Periods 4 and 5 was 241 and 240 g respectively and the increase in waste on the filters for Period 6 was 048 g
Aerosol Calculations
The mass sent to the exhauster per RMCS core or per RMCS segment was obtained by dividing the mass of waste leaving the risers by the number of RMCS cores or RMCS segments obtained during the exhauster operating period
The tank head space particulate concentration was obtained by dividing the mass of waste leaving the riser by the volume of gas sent to the exhauster This volume of gas sent to the exhauster was obtained by multiplying the exhauster flow rate by the exhauster run time from Table F-I The calculations for aerosols generated based upon HEPA dose rates use acfm while the exhauster flow is recorded in scfm so the actin flow rates in Table F- 1 were used
The average mass of aerosols in the tank head space was obtained by multiplying the average tank head space particulate concentration by the tank head space volume from Table F-2
Following is an example of how the mass per RMCS core mass per RMCS segment average tank head space mass concentration and average mass of aerosols in the tank head space were calculated for Period 1 Data used are from Tables E-I F-I and F-2
[200 scfm] [2992+2916] [84 + 4591 + 528 = 21 1 acfm to exhauster from BY-IO6 in 11-1294
using same formula results in 210 acfm for BY-IO6 in 195 and 209 acfm for BY-I IO
28 g waste + [((21 1 acfm)(4878 hr)+(21O)(l867)+(209)(1125))(60 minhr)]= 12E-6 g wastelf to risers
[12E-6 amp] [35315 fmrsquo] =43E-5 g wastemrsquoto risers
[12E-6 gftrsquo] [53700 Arsquo in BY-106 head space] =66E-I g waste in BY-IO6 head space during RMCS
[12E-6 piftrsquo] [92000 ftrsquo in BY-110 headspace] = IIE-l g waste in BY-I10 head spaceduring RMCS
[28 g waste] [5 RMCS cores] = 56E-1 g waste per core to riser
[28 g waste] + [24 RMCS segments] = 12E-1 g waste per segment to risei
8-3
RPP-4826 Rev 1
All data were input to a spreadsheet and the mass to exhauster per RMCS core mass to exhauster per RMCS segment average tank head space mass concentration and average mass of aerosols in the tank head space were calculated for each of the RMCS exhauster operating periods in the same manner as shown above Results are given in Table 8-3
Summary of Calculations
RMCS exhauster operations were segregated into five operating periods during which RMCS was performed The Exhauster B data for BY-IO8 and TX-I 13 riser 3 was not used in these calculations as no RMCS was performed when the exhauster was operating Exhausters were operated in seven tanks during which 16 RMCS cores and 92 RMCS segments were obtained Based on RMCS filter housing dose rate data the results indicate that
These values are conservative as the assumed dose rate at the end of RMCS for Periods I 2 and 5 was assumed to be 05 mRhr In addition using a DF of 5 for the BY-IO6 prefilter skews the results high The in-tank prefilters used in both BY-IO6 sampling events showed no detectable contamination
Operatin Periods 4 and 6 were the only periods with exhauster housing dose rates above detectable The 044 mCi Csrsquordquo and 0063 mCi CsIh increase on the filters for these two periods based upon dose rate data correspond to the 050 mCi CsI3rsquo and 014 mCi Csrdquorsquo increase on the filters for these two periods based u on NDA data (see Appendix A) The 031 mCi C S rdquo ~ for Period 5 is significantly above the 0032 mCi Cslrsquolsquofor the same period determined by the NDA but this is due to assuming the housing dose rate was equal to the minimum detectable 05 mRhr
The average tank head space mass concentration during RMCS was 22E-5 g wastem3 The average mass of suspended solids in the tank head space during RMCS was 47E-2 g waste The average mass sent to the exhauster during RMCS was 59E-1 g wastelRMCS core The average mass sent to the exhauster during RMCS was 1OE-1 g wastelRMCS segment
B-4
v m
__ ~~
RPP-4826 Rev 1
APPENDIX C
ESTIMATION OF AEROSOLS GENERATED DURING RMCS BASED UPON CGM IN-LINE FILTER PAPER ANALYSES
c-0
RPP-4826 Rev I
APPENDIX C - Estimation Of Aerosols Generated During RMCS Based Upon CGM In- Line Filter Paper Analyses
Summary of Method
This method of estimating RMCS aerosol quantities uses radionuclide assay data from in-line filter papers located upstream of continuous gas monitors (CGM) sampling the tank air for flammable gases during RMCS The radionuclide content of the filter paper is divided by the waste radionuclide specific activity and the air flow through the CGM to obtain an estimate of the average mass concentration in the tank head space during the time period the CGM is on Multiplying the estimated average tank head space mass concentration by the tank head space volume gives an estimate of the average mass of particulates in the tank head space during RMCS To obtain the mass per RMCS core or per RMCS segment sent to the exhauster the tank head space average mass concentration is multiplied by the volume of gas sent to the exhauster then multiplied by a correction factor to account for particulates in the head space removed by the exhauster when the CGM is not operating and divided by the number of RMCS cores or RMCS segments
Description
During most tank waste intrusive activities performed since 1996 an intrinsically safe CGM located above ground has been used to continually monitor the tank air for flammable gases during in-tank activities The CGM sampling method draws air directly from the tank head space During RMCS the CGM sampling line is placed in the tank dome space The sampling line is located between the sampling riser and the exhaust riser if practical A pump in the CGM draws tank air up through the line at 05 litmin for measurement of the lower flammability limit (LFL) by the CGM A filter paper is installed in the sampling line upstream of the CGM to protect the unit from internal contamination
Following CGM use the CGM filter papers are normally discarded after monitoring them in the field for contamination To help estimate the tank head space particulate levels during RMCS these filter papers were retained and analyzed in the 222-S laboratory following removal from all tanks in which RMCS was performed from the fall of 1997 through April 1999 Data were collected for the four tanks in SX farm in which RMCS was performed and the next four tanks on which the RMCS exhauster was deployed These tanks are listed in Table c-I Reported CGM Data
The CGM operational data used to estimate aerosol levels during RMCS includes CGM operating times CGM flow rates and filter paper analytical data A summary report containing all the field operating data sheets for CGM usage and lab data was prepared following completion of sampling on each tank for all tanks except TX- 113 For TX-I 13 a separate report was prepared following each core These reports are References CGM-I to CGM-9 The CGM data from these reports are provided in Table C-2
There were 14 CGM installations during RMCS when CGM filter papers were collected and analyzed Each of these installations had Csrdquorsquo total alpha and total beta quantities measured on the filter papers resulting in 42 data points Eight of the measurement results were very low and had errors of gt+-loo These values were not used resulting in a net of 34 data points for calculating average head space mass concentrations based upon CGM data
Calculated Tank Head Space Radionuclide Concentrations
To calculate the average tank head space radionuclide concentrations during RMCS the filter paper radionuclide quantities were first divided by an efficiency factor to account for radionuclides which may not have been captured on the paper This adjusted radionuclide value was divided by the volume of tank air passing through the paper to give the average tank head space radionuclide concentration
The efficiency used for most stack samplers onsite is 73 (see Appendix D) Estimates attached to References CGM-I to CGM-9 indicate the CGM filter paper sampling method used should have a sampling efficiency
c- 1
RPP-4826 Rev 1
exceeding 73 For conservatism a sampling efficiency of 50 was assumed in this document for the CGM filter paper method
The estimated Csrdquorsquo total alpha and total beta concentrations in the tank vapor space were calculated by dividing the radionuclide quantity on the filter paper from Table C-2 by the assumed CGM sampling efficiency of 05 and the volume of gas going to the CGM The volume of gas going to the CGM was calculated by multiplying the time of CGM operation from Table C-2 by the CGM flow rate of 500 mlmin For example the calculated SX- 101 head space C~rsquorsquo~concentration based upon analysis of the CGM filter papers used during RMCS of riser 19 is
[[26E-4 pCi + 051 + [[I755 min][500 mlmin]] = 59E-I0pCiml
All radionuclide concentrations were calculated in a similar fashion Results are given in Table C-3 Table C-3 lists the radionuclide concentrations for all 42 data points The eight radionuclide concentrations not used for estimating mass concentrations are noted
Table C-3 also contains the calculated number of tank head space changeouts by the tank exhauster during CGM operation Tank head space changeouts were calculated by multiplying the exhauster flow rates (in actin) from Table F-1 by the CGM run times from Table C-2 and dividing by the tank head space volumes from Table F-2 The number of tank head space changeouts during CGM operation was used when estimating the waste mass sent to the exhauster See Aerosol Calculations section below for explanation
Aerosol Calculations
Average tank head space mass concentrations based upon CGM filter paper data were calculated by dividing the head space radionuclide concentrations from Table C-3 by the waste specific activities for each tank sampled The waste specific activities used came from Table E-I and are listed again in Table C-I The average of the mass concentrations based upon radionuclide data for each tank was used as the average head space mass concentration for that tank For example the calculated SX-IO1 head space mass concentration analysis from the CGM filter papers used during RMCS of riser 19 is
[59E-10 pCi Csrdquorsquoml+ 112 pCi C S rdquo ~ ~ waste] [ 28317 mlftrsquo] = 1 SE-7 g wasteA3 based upon C S rdquo ~
[ I 7E-I I pCi T A M + 504E-1 pCi TAg waste] [ 283 17 mlftrsquo] = 94E-7 g wasteamprsquo based upon Total Alpha
[43E-9 pCi TBml+ 357 pCi TBg waste] [ 28317 mlArsquo] = 34E-7 g wastel based upon Total Beta
[ [ I 5E-7 + 94E-7 + 34E-7 g wasteArsquo] f 31 = 48E-7 g wasteamp
[48E-7 g wastelt ] [3531467 Arsquom3] = 17E-5 g wastemrsquo
All tank head space mass concentrations were calculated in the same manner The results are presented in Table C-4 The weighted average tank head space mass concentration during RMCS was based upon the number of RMCS segments taken for each data point
The average aerosol mass in the head space during RMCS was calculated by multiplying the average tank head space mass concentration by the tank head space volume from Table F-2 For the same data point as above
[48E-7 g waste Arsquo] [115E+5 Arsquo] = 55E-2 g waste in SX-IO1 head space during RMCS
All average mass quantities present in the tank head space during RMCS were calculated in the same manner using a spreadsheet The results are provided in Table C-4 The weighted average mass of waste in a tank head space in Table C-4 was calculated based upon the number of segments obtained for each data point
Estimation of the mass of waste sent to the exhauster per RMCS core or segment requires calculation of the total mass of waste sent to the exhauster Multiplying the average head space concentration during RMCS by the exhauster flow rate (in acfm) and the time of CGM operation will give the mass of waste sent to the exhauster during the CGM time frame only While the large majority of mass of waste aerosols will have exited the tank or
c -2
RPP-4826 Rev I
resettled by the time the CGM is shut off there could be some residual suspended particles remaining These would eventually pass to the exhauster but would not be picked up by the CGM filter since it was not in service An adjustment factor was used as described in the following paragraphs to account for particles that may exit to the exhauster following shut down of the CGM
Particulates are generated by RMCS when purge gas is blowing out the drill string and the bit is rotating under the waste surface This time averages about six minutes per segment Multiplying the number of RMCS segments per core by six minutes per segment and dividing by the number of minutes of CGM operation shows the creation of particulates will only occur during a nominal 3-4 of the time the CGM is operating During RMCS the normal practice is to install the CGM turn it on when personnel enter a tank farm and keep the unit in constant operation for the remainder of the shift When the portable RMCS exhauster is used the exhauster is normally started at least an hour before RMCS is initiated and kept in operation until it is time to halt operations for the week The SX exhauster is kept in constant operation Comparing exhauster operating times from Tables F-l with CGM operating times from Table C-I it can be seen the CGMs are in operation about 3-15 of the time the RMCS exhauster is operating on a tank This time comparison wasnrsquot estimated for the SX exhauster since the SX exhauster is in constant operation
With CGM operation much longer than the time period when particulates could be generated the majority of particulates generated by RMCS should have settled or been exhausted during the CGM operating period Table C-3 shows the tank head space changeouts made by the exhauster during CGM operating periods ranged from 084 to 63 The average was 24 With the CGMs operating 25-33 times longer than the aerosol generation periods and an average of over two tank head space changeouts during CGM operation the large majority of aerosols generated during RMCS will have settled out or been removed by the exhauster by the time the CGM is shut off To account for particulates remaining in the tank head space after the CGM was turned off that are subsequently removed by an exhauster it was conservatively assumed that 20 of the total mass of particles generated during RMCS were not removed from the tank head space during the CGM operating period Therefore the product of the tank head space concentration and the volume of air sent to the exhauster during the time of CGM operation was multiplied by a factor of 125 (lOOl80) to estimate the total mass of waste sent to the exhauster as a result of RMCS This is shown below for the same SX-IO1 riser 19 data point in the above calculations
[48E-7gA3] [IOOmin] [I755 min] [125]= 11E-l gwastetoexhauster
This value was divided by the number of RMCS cores and RMCS segments from Table C-1 to provide the grams per core and grams per segment in Table C-4 as follows
[ I I E- 1 g waste to exhauster] i 1 core = 11 E-I g wastelRMCS core to exhauster
and
[ 1 I E- 1 g waste to exhauster] + 5 segments = 2 I E-2 g wastelRMCS segment to exhauster
All mass per core and mass per segment values were calculated in the same manner using a spreadsheet The results are provided in Table C-4 The weighted average mass per core and mass per segment in Table C-4 were calculated based upon the number of cores or segments obtained for each data point
Summary of Calculations
There were 34 valid CGM filter paper data points from 14 RMCS CGM sampling periods in eight tanks during which I5 RMCS cores and 79 RMCS segments were obtained Based upon CGM filter paper data the results indicate that
The average tank head space mass concentration during RMCS was 4OE-5 g wastem3 The average mass of suspended solids in the tank head space during RMCS was 97E-2 g waste The average mass sent to the exhauster during RMCS was 18E-1 g wastelRMCS core The average mass sent to the exhauster during RMCS was 34E-2 g wastelRMCS segment
c - 3
RPP-4826 Rev 1
Ignoring all CGM filter paper analytical data points with a variance gtloo will result in conservative results These data points indicate negligible radioactivity was present If a value of zero was assigned to each data point with an analytical error of gtloo instead of ignoring the data point the weighted average particulate quantities in Table C-4 would be reduced by about 12
The average tank head space mass concentrations based upon CGM data will be higher than the average tank head space mass concentrations based upon filter housing NDA or dose rate The RMCS exhauster received tank air from the shifts when sampling was performed and during some of the off-shifts when no sampling was done The CGMs were only operated during the shifts when sampling was performed The air concentration drawn into the CGM and the RMCS exhauster should be roughly the came during the operating shifts but somewhat less during the off-shifts Therefore the tank head space concentration will be higher when based upon CGM data This does not impact the mass of waste sent to the exhauster per core or per segment
c -4
I
- ~
RFP-4826 Rev 1
APPENDIX D
ESTIMATION OF Rh4CS EXHAUSTER HOUSING DECONTAMINATION FACTOR
D-0
RFrsquoP-4826 Rev 1
APPENDIX D - Estimation of RMCS Exhauster Housing Decontamination Factor
Summary of Method
This Appendix estimates a Decontamination Factor (DF) for the RMCS exhausters using housing NDA data and applicable stack record sample data The Csrdquorsquo in the exhauster effluent is divided by the C S rdquo ~ in the exhauster inlet to provide a penetration efficiency The reciprocal ofthe penetration efficiency is the DF
Description
Each RMCS exhauster has an isokinetic sampler located on the stack downstream of the blower and HEPA filters A small pomp pulls air from the exhaust stack into a filter paper at a rate proportional to the exhaust flow Radionuclides in the exhaust stream passing through the sample line are caught on the filter paper The stack operating time and flow rate are recorded When the record sample filter paper is removed the filter paper is analyzed in a laboratory for radionuclides The radionuclide concentration in the stack effluent stream is calculated by dividing the quantity of material on the filter paper by the volume of air through the sampler and then dividing again by a factor to compensate for stack sampler and filter paper efficiency
Multiplying the total beta stack effluent concentration by the total off gas flow gives the total beta emissions from the exhauster The total beta emissions are multiplied by the Csrdquorsquo to total beta ratio for the waste in the tank) being exhausted to give an estimate of the C S rdquo ~ emission The C S rdquo ~ on the filters determined by NDA of the housing (see Appendix A) is added to the C S rdquo ~ emissions to give the total C S rdquo ~ input to the filter housing Dividing the emissions by the input gives the filter housing penetration efficiency Subtracting the penetration efficiency from 1 O gives the filter housing efficiency Dividing 1 O by the penetration efficiency gives the DF
RMCS Stack Record Sample Data
RMCS exhauster stack record samples are taken after completion of each sampling event on a tank Normally this is after all cores on that tank have been obtained but for BY-IO5 in 1998 record samples were taken following each core Record samples are also taken at the end of each year All samples are analyzed for total alpha and total beta At the end of each year all the filter papers for that year are composited and analyzed for individual radionuclides Sample results are entered into the Automated Bar Coding of Air Samples at Hanford (ABCASH) and Environmental Release Summary (ERS) databases Several ofthe filter papers from 1998 were reanalyzed using a longer count time to bring the error rate down
Schofield 2000b compiled and evaluated all available RMCS exhauster stack record sample data filtered out the unusable data provided derivation for the stack sampling efficiency factor and summarized the results Most of the data points were so low as to be unusable since the results were either negative or had error variances gtloo
Column 5 of Table D-1 provides the stack effluent concentrations used for calculation of the filter housing DF The stack effluent data in Table D-l come from Schofield 2000b These values include a 073 sampling efficiency factor
Calculation of RMCS Filter Housing Decontamination Factor Based upon Housing Inlet and Outlet Data
The RMCS exhauster housing NDA and stack record sample data available for exhauster Operating Periods 4 5 and 6 were used to estimate an actual DF for the RMCS exhauster housings The housing NDA data is for CSrdquo~ but there are no usable Csrdquorsquo concentrations for the RMCS exhauster outlet The RMCS exhauster stack Csrsquordquo concentrations are either negative have a variance gtloo or are not available Total beta analyses are available however so the stack eftluent C S rdquo ~ concentrations were estimated by multiplying the total beta concentration by the ratio of Csrdquorsquo to total beta in the tank waste
Column 2 of Table D-l lists the increase in CSrsquo~ on the filters for each operating period as determined by NDA This data was obtained from Table A-2
D- 1
RPP-4826 Rev 1
Column 4 of Table D-l lists the stack exhaust volume for each stack record sample period The stack exhaust volume for the exhauster installation on S-l IO was calculated by
[ZOO std ft3min][15978 hrs] [60 minhr] = 199E+6 std ftrsquo
All other stack volumes in Table D-l were calculated the same way Unlike in Appendices A B and C no adjustment was made to change the 200 scfm to actual cfm This is because the RMCS stack record sample concentrations from Table D-3 are based upon a 200 scfm flow rate rather than the actual flow rate Since the concentrations are on the same basis as the flow rate there is no need to correct to acfm
The total beta emissions for the RMCS exhauster stack were calculated by multiplying the volume by the concentration For the same S-l IO data point
[199E+6 ft3] [18E-15 pCiml] [28317mlft3] [mCi1000 pCi] = 1OE-7 mCi total beta
All other total beta emissions in Table D-l were calculated the same way
The Csrdquorsquo to total beta ratio was calculated from data in Table E-I For the same S- l I O data point
326E+5 Ci CsI3rsquo f I 14E+6 Ci total beta = 029 Ci CslhCi total beta = 029 rnCi CsrdquorsquomCi total beta
The Csrsquordquo emission for the same S-l IO data point was thus
[I OE-7 mCi total beta] [029 mCi CsrdquorsquomCi total beta] = 29E-8 mCi Csrdquorsquo
All Csrsquordquo emissions in Table D-l were calculated in the same manner
The penetration efficiency for each operating period was calculated by dividing the exhauster outlet by the filter inlet Csrdquorsquo quantities For operating period 4 this was
[81E-6 mCi] f [5OE-I + 8IE-6 mCi] = 16E-5 = 16E-3
The DF for operating period 4 is
1 + 16E-5 = 62E+4
The overall DF for periods 4 5 and 6 was calculated by dividing the efluent from all three periods by the total filter input
[95E-6 mCi] f [67E-I t 95E-6 mCi] = 14E-5 = 14E-3 penetration efficiency
I - I 4E-5 = 0999986 = 999986 filter efficiency
1 f 14E-5 = 73E+4 decontamination factor based upon housing inlet and eftluent data
Estimation of Housing Decontamination Factor Based upon General Performance Data
HEPA filters are tested at the manufacturer to a minimum 9997 efficiency using a 03 pm monodisperse aerosol After installation HEPA filters are tested in-place per ASME N5 I O to a minimum 9995 efficiency using a polydisperse aerosol with an approximate droplet size distribution of 99 less than 30 pm 50 less than 07 pm and 10 less than 04 pm The RMCS exhauster housing is tested per ASME N510 and is thus required to have a minimum removal eficiency of 9995 for an aerosol with this approximate size distribution The particle size distribution of the waste aerosols generated by RMCS is unknown but it is assumed that the removal efficiency for RMCS generated aerosols was the same as the removal efficiency for the ASME generated test aerosol
D-2
RPP-4826 Rev I
A 9995 efficiency is equivalent to a DF of 2E+3 while a 9997 efficiency is equivalent to a DF of 33E+3 The actual DF for the RMCS exhauster housing is higher than either of these It has two HEPA filters in series even though the minimum efficiency specified in the NOCs for the RMCS exhausters is only equivalent to one HEPA ERDA 1976 recommends using a DF of 3000rdquo for a filter bank where n is the number of HEPA filters in series This would result in a DF of 9E+6 for the RMCS exhauster housing This is unrealistic Using a DF of 9E+6 will calculate to Csrdquorsquo quantities on the HEPA filtersthat are orders of magnitude above what have been shown to be there based upon the measured dose rates and NDA A DF of 9E+6 would mean the dose rate would have to be almost 100 mRhr at the side of the exhauster housing instead of the 05-08 mRhr dose rates encountered The waste particles will not have the same particle size distribution entering the second HEPA filter as when entering the first The majority of the waste particles will be captured on the I rdquo HEPA filter and although the DF for each HEPA if tested individually using the ASME N5 IO aerosol test method may be 3E+3 (or higher) the overall DF of the two filters in series will not be 3000lsquo This is because the particle size distribution entering the Znd HEPA could have a greater percentage of smaller particles than that entering the 1rdquo
NUREG 1995 included an evaluation of a number of different facility stacks at the Hanford site where the HEPA filter upstream air concentrations were estimated using several different methods This report concluded that back-calculation using a value of 3000rdquo overestimated the upstream radionuclide concentration by three to four orders of magnitude when compared to filter NDA data for the nine stacks for which NDA data were obtained and by three orders of magnitude for the two stacks for which upstream air sample data were available Back- calculation using a value of 3000rdquo was shown to be high by four orders of magnitude for the single stack for which a powder release estimate was available Based upon this information the RMCS exhauster dual filter-in-series housings would have a DF of at least three and maybe four orders of magnitude less than 9E+6 or in the 1E+3 to 1 E+4 range A DF of IE+3 would he less than the minimum permissible under the NOC Comparing the older stack data and design with the newer RMCS exhauster design the minimum DF would be expected to be at least 1E+4
Table D-2 provides the available RMCS exhauster aerosol test data This information was obtained from Waldo 1999 Prior to 1998 the RMCS exhauster primary HEPA filter efficiency and either the secondaly HEPA filter or the overall efficiency for both filters were tested Starting in 1998 only the primary and secondary HEPA filter efficiency were measured The overall efficiency of the two filters in series was only measured three times in 11 setups Twice the overall penetration efficiency was lt0002 and the remaining time the only information that could be found was a value of lt005 Most individual filters had a penetration efficiency of 0002 This appears to be about the limit of the detection equipment Based upon Table D-2 data a penetration efficiency of 0002 (99998 efficiency) is normal for a single HEPA and thus a minimum for an RMCS exhauster housing Assuming a 0002 penetration efficiency for the two filters combined calculates to a DF of 5E+4 (equal to 1 +
000002) for the RMCS exhauster housing
In summary the measured DF for the RMCS exhauster housings over the period from May 1998 through June 1999 was about 73E+4 RMCS aerosol testing prior to use indicates a DF of about 5OE+4 for each of the filters separately but their overall efficiency is not measured Referenced data based on older stacks at Hanford indicate the two HEPA RMCS exhauster housing would likely have a DF of at least IE+4
Estimated Aerosol Levels During RMCS Based Upon RMCS Stack Record Sample Data
Revision 0 of this document used the positive record sample results with variance less than 100 to estimate aerosol concentrations in the exhauster inlet using an assumed exhauster housing DF of 5OE+4 This method of estimating aerosols was eliminated from Revision 1 because the stack concentrations were either too low too scattered or too questionable to provide reliable results There were 112 RMCS stack record sample data points evaluated in Schofield 2000b Excluding the total beta sample results used for estimation of the housing DF there were only ten data points remaining with positive values and variances ltloo the remaining data points were either negative had a variance gtloo or the results were not available
For comparison purposes only Schofield 2000b applied the DF of 73E+4 calculated in this document to the data points not used to calculate the exhauster housing DF to estimate aerosol concentrations upstream of the filters The results showed aerosol levels approximately the same as those estimated using NDA dose rate or CGM filter paper data when a value of zero was used for negative sample results or those with a variance gtloo When only
D-3
RPP-4826 Rev 1
the ten positive results with a variance ltloo were used the aerosol levels calculated to be two to five times higher than those estimated using NDA dose rate or CGM filter paper data Because of the variability of data resulting from the extremely low record sample concentrations and the few useable data points estimation of aerosol levels using record sample data was not included in Revision I See Schofield 2000b for further discussion of the use of record sample data to estimate aerosol levels
Summary of Calculations
A total of nine RMCS exhauster stack record sample data points were used to estimate the RMCS exhauster filter housing decontamination factor These data points were obtained when sampling on five tanks during which 10 RMCS cores and 65 RMCS segments were obtained The overall decontamination factor was 73E+4
Estimation of aerosol generation quantities based upon RMCS stack record sample data is possible However results will likely be skewed high if data points that show non-detectable levels of radionuclides present are ignored instead of using a value of zero for the data point
D-4
RPP-4826 Rev 1
APPENDIX E
TANK WASTE RADIONUCLIDE CONCENTRATIONS USED FOR AEROSOL CALCULATIONS
E-0
RPP-4826 Rev 1
APPENDIX E - Tank Waste Radionuclide Concentrations Used for Aerosol Calculations
The RMCS exhauster NDA data HEPA filter dose rate data CGM filter paper data and stack record sample data provide information on the quantity of radionuclides on the exhauster filters in the tank head space or the exhauster stack during RMCS These radioactivity quantities need to be divided by the waste radionuclide concentration specific activity to determine the mass of waste in the tank head space and in the tank gases sent to the exhauster
The mass quantities in this document were calculated using dry basis radionuclide concentrations Waste particles carried into the tank head space by the purge gas could be wet or dry If wet some of the non-chemically bound water will start to evaporate immediately providing the tank relative humidity is 400 The water present in a waste particle may be chemically bound as a hydrate or free The chemically bound water will not readily evaporate therefore even a ldquodryrdquo particle may have some water associated with it It is impractical to measure the actual water content of the waste particulates caught on the CGM filter paper the exhauster HEPA filters or the stack record sample paper Since the quantity of water in the waste particulates is unknown particulate levels were calculated using dry basis radionuclide concentrations Thus all particulate values given in this document are stated on a dry basis
The waste radionuclide concentrations on a dry basis were calculated from data available in the Tank Waste Information Network System (TWINS) The Best Basis InventorylBest Basis Summary numbers were used These values are the most complete and up to date readily available estimates for Hanford waste tank contents but do not include water The information was downloaded from TWINS into a spreadsheet The total chemical total beta and total alpha quantities were summed in the spreadsheet for all the tanks which were sampled and concentrations for Csrdquorsquo Sr9rsquo total beta and total alpha automatically calculated in pCig These concentrations are provided in Table E-I Because lab techniques for measuring gross beta levels only detect beta particles with a minimum decay energy above 150-200 kev only radionuclides with a decay energy of gt-200 kev were included in the total beta numbers
The TWINS radionuclide concentrations were obtained in December 1999 No corrections were made for decay for this document
The CGM filter paper and stack record sample data indicate the measured radionuclide values are not always in the same ratio to each other as given by TWINS nor are all radionuclides detected that TWINS indicates are present Radionuclides can be distributed unevenly in a tank Soluble fission products (primarily Csrsquordquo) are found in the liquid saltcake and in sludges Insoluble fission products and actinides are found largely in sludges as these are primarily chemical precipitates Sludge could be mixed with saltcake be present in a distinct layer at the bottom of a tank or in several layers in the tank depending upon how waste was transferred into a tank Waste particles may thus not have the same specific activity on a microscopic scale as they would have on a macro scale were the tank contents homogenized During RMCS a top to bottom core sample is attempted resulting in the drill bit and purge gas (which causes aerosols to form) passing through most ofthe waste matrix Assuming the aerosol generation rate is approximately constant during drilling the specific activity of a radionuclide in the suspended solids should be roughly the same as the average specific activity of the same radionuclide in the tank waste While the waste specific activity is probably not homogeneous from top to bottom in a tank and the aerosol generation rate will likely also vary it is beyond the scope of this document to provide an in-depth analysis of all the factors affecting aerosol radionuclide concentration Although sample radionuclide data were not always in the same ratio as provided by TWINS for the purpose of this document the simplifying assumption was made that the average tank specific activity is adequate to provide an approximation of the suspended solids specific activity for all radionuclides Average tank individual radionuclide specific activities were used in the preparation of the exhauster NOCs
The aerosol calculations presented in this document are only as accurate as the TWINS data The combined radionuclide content of all Hanford waste tanks is known fairly well since the overall content is based upon reactor production records CsrdquorsquoSrW recovery data and processing plant discharges Thus TWINS data for all tanks combined should be reasonable There are undoubtedly differences between TWINS data and the actual contents of a specific tank While the specific tank radionuclide data from TWINS used in this document may not be exact deviations from the actual concentrations are assumed to balance out over the number of tanks sampled
E- 1
RPP-4826 Rev 1
APPENDIX F
ROTARY MODE CORE SAMPLING EXHAUSTER AND CORE SAMPLE DATA
F-0
RPP-4826 Rev 1
APPENDIX F - Rotary Mode Core Sampling Exhauster and Core Sample Data
This appendix provides the basic data obtained during RMCS operations which was used in preparation of this document
Basic Operational Data
There have been three RMCS exhausters and three RMCS sampling trucks deployed since starmp of nitrogen- purged RMCS in November 1994 The exhausters are formally designated 296-P-32296-P-33 and 296-P-34 These were originally referred to as parts of RMCS Systems 2 3 and 4 respectively in the Notices of Construction (NOC) for these units The exhauster designations were changed for routine field use in 1996 to exhausters A B and C to avoid confusion with core sampling trucks 23 and 4 since any exhauster could be used with any RMCS truck Exhauster A (2) and RMCS Truck2 have not been used for RMCS since 1995 and are no longer in service for core sampling
Rotary mode core sampling has been conducted in four general time frames since 1994 These time frames were separated by down times for equipment modifications or resolution of environmental permitting and safety concerns For ease of analysis in this document exhauster operations were organized into six distinct operating periods Periods I to 6 were grouped based upon times when the same exhauster and same set of HEPA filters were being used These periods thus overlap with the general operating time frames The four operating time frames were
The first time frame lasted from November 1994 to January 1995 RMCS Truck 2 and Exhauster 2 (A) were used on Tank BY-106 along with an in-tank prefilter This tank provided the initial deployment and testing of the nitrogen-purged equipment in a waste tank During this period radiation dose rates were taken at the side of the exhauster housing Stack record samples were taken in December 1994 and January 1995
The second time frame lasted from July 1995 through October 1995 RMCS Trucks 2 and 4 were used with Exhausters 2 and 3 (A and B) on BY-105 BY-IO8 and BY-I IO During this period radiation dose rates were taken at the sides of the exhauster housings Stack record samples were taken after completion of sampling on each tank No RMCS samples were taken from BY-108 all samples were taken in push mode for this tank
The third time frame began when RMCS was restarted in December 1997 Trucks 3 and 4 were used for sampling of SX-101 SX-103 SX-105 and SX-102 with the SX tank farm exhauster providing ventilation The RMCS exhausters were not used During this period radiation dose rates were taken at the sides of the SX exhauster housing as part of HPT routine surveys SX farm exhauster stack record samples were taken when required by normal operating procedures SX record sampler and filter housing dose rate data were not evaluated for this document It would not be practical using filter dose rate or stack record sample data to estimate the RMCS aerosol addition if any to the SX ventilation system The background radiation around the SX filter housing makes measurement of any small increase in dose rate very difficult to detect The number of tanks being ventilated and the involved off-gas header routings (the exhauster is pulling on thirteen tanks in series or in parallel with the tank being sampled) and any in-tank activities in the SX tanks not being sampled would make it impractical to assess what aerosols resulted from RMCS Beginning with RMCS in SX farm radionuclide analyses were performed on the filter papers protecting the CGMs which draw air out of the tank vapor space for flammable gas detection
The fourth time frame began in May 1998 Between 1095 and 598 Exhausters B and C were extensively modified with new filter housings and other equipment to meet new NOC requirements Trucks 3 and 4 were used with Exhausters B and C (3 and 4) on S-l IO U-107 BY-105 TX-113 and TX-I 18 This period marked the first use ofthe RMCS trucks and RMCS exhausters together following resolution of flammable gas concerns and modifications to the exhausters New filters were installed Radiation dose rates were taken at the sides of the exhauster housings Stack record samples
F- 1
RPP-4826 Rev I
were taken after completion of sampling for each exhauster installation Radionuclide analyses were performed on the CGM filter papers for all tanks except TX-118 An NDA was performed on the Exhauster C housing following completion ofthe first core on TX-I 13 The housing filters when assayed contained aerosols captured by the exhauster following RMCS in S-l IO U-107 BY-105 (1998) and the first core of TX-I 13 Another NDA was performed on Exhauster C following both cores in TX-I 18 An NDA was performed following sampling of the second core in TX-I 13 using Exhauster B The time frame ran through early June 1999 No RMCS samples have been taken after June 1999 nor are any planned for the next few years
For the purposes of evaluating aerosol formation based upon RMCS exhauster housing NDA and dose rate data the exhauster operations were grouped into 6 operating periods These periods are shown in Table F-1 and restated in Tables A-I and B-I All tanks sampled in Periods 1 2 4 5 and 6 were exhausted by the same exhauster with the same housing and filters present during that period Period 3 covered the time the SX exhauster was used during RMCS in SX farm
A brief description of each RMCS tank sampling operation is provided below
Tank 241-BY-1061194 to 1294 RMCS using the nitrogen purge gas system with an exhauster was formally begun on 111794 on tank BY-106 riser IOB Exhauster 2 (A)and Truck 2 were used A sintered metal prefilter was inserted in the riser between the tank and the exhauster A total of eight segments were taken in rotary mode and five segments in push mode until sampling was halted on 122194 One RMCS core was obtained The total exhauster run time was 4878 hours The stack record sample was removed and analyzed following this run period Dose rates taken at the side of the exhauster housing during RMCS were all lt05 mRhr The in-tank prefilter was smeared for contamination when removed from the tank with the smears showing less than detectable levels of radionuclides present (Waldo 1999) The prefilter had been washed with an installed spray system prior to removal from the tank but subsequent testing showed the water flow and pressure were too low to have been effective at removing contamination
Tank 241-BY-106195 Following some process modifications RMCS in BY-IO6 riser IOB began again on 11895 Exhauster 2 (A) and Truck 2 were used The sintered metal prefilter was inserted in the riser between the tank and the exhauster RMCS was halted on 12495 over authorization basis and equipment operability issues for RMCS A total of three segments were taken in rotary mode and eleven segments in push mode One RMCS core was obtained The total exhauster run time was 1867 hours The stack record sample was removed and analyzed following this run period Dose rates taken at the side of the exhauster housing during RMCS were all lt O S mRhr The in-tank prefilter was smeared for contamination when removed from the tank with the smears showing less than detectable levels of radionuclides present (Waldo 1999) The prefilter was not washed this time
Tank 241-BY-110795 to 1095 Following resolution of RMCS authorization basis and equipment issues and completion of the fabrication and testing of Trucks 3 and 4 RMCS was begun in BY-I IO on 71195 Exhauster 2 (A) and Truck 2 were used Samples were taken from risers 128 7 128 again and 4 There was no in- tank prefilter used in this or any subsequent RMCS periods Sampling was performed until 102595 when RMCS was halted over flammable gas issues A total of 13 RMCS segments and 56 PMCS segments were taken Three RMCS cores were obtained The total exhauster run time was 1125 hours The stack record sample was removed and analyzed following this run period Dose rates taken at the side of the exhauster housing during RMCS were all lt O S mRhr
Tank 241-BY-108795 to 895 Core sampling was begun in BY-IO8 on 72595 Exhauster 3 (B) and Truck 4 were used Sampling was done in risers 12A and 7 The tank material proved soft enough so that no RMCS segments were required all segments were obtained in push mode although the exhauster was operated during part of the time sampling was performed Sampling was completed 81895 A total of 16 PMCS segments were taken The total exhauster run time was 6617 hours The stack record sample was removed and
F-2
RPP-4826 Rev 1
analyzed following this run period Dose rates taken at the side of the exhauster housing during RMCS were all lt05 mRhr
Tank 241-BY-105895 to 1095 RMCS was begun in BY-I05 riser 12A on 83095 Exhauster 3 (B) and Truck 4 were used This tank has a concrete layer on top about 12-18 inches thick which had to be drilled through Part way through sampling questions arose as to the flammable gas status of the tank and RMCS was halted on 10695 A total of 3 RMCS and 7 PMCS segments were taken One RMCS core was obtained The total exhauster run time was 4413 hours The stack record sample was removed and analyzed following this run period Dose rates taken at the side of the exhauster housing during RMCS were all lt05 mRhr
Tank 241-SX-1011297 to 298 Following resolution of extensive regulatory and authorization basis issues and installation of equipment modifications RMCS started in SX-101 with Truck 4 on 12497 An RMCS exhauster was not used since all SX farm tanks excluding SX-113 and SX-I 15 are ventilated with the SX exhauster Sampling was performed in risers 19 and 4 and was completed on 21098 A total of 9 RMCS and 6 PMCS segments were taken Two RMCS cores were obtained SX exhauster stack record samples and filter housing dose rates were obtained as part of routine operations for the SX exhauster not as part of the RMCS process Filter papers used in the suction line for the CGM were saved and analyzed in the laboratory to estimate the airborne radionuclide concentration in the tank head space Two CGM filter papers were needed for each core as moisture in the tank vapors condensed on the papers in the cold weather and began to restrict tank gas flow to the CGM
Tank 241-SX-103498 to 598 RMCS started in SX-103 with Truck 4 on 42798 The SX exhauster was used for ventilation (see SX- 101 above) Sampling was performed in risers 7 and 1 1 and was completed on 51198 A total of 6 RMCS and 18 PMCS segments were taken Two RMCS cores were obtained During sampling filter papers used in the suction line for the CGM were saved and analyzed in the laboratory to estimate the airborne radionuclide concentration in the tank head space One CGM filter paper was used during each core SX exhauster stack record samples and filter housing dose rates were obtained as part of routine operations for the SX exhauster not as part of the RMCS process
Tank 241-SX-105298 to 598 RMCS started in SX-105 with Truck 3 on 22598 The SX exhauster was used for ventilation (see SX- 101 above) Sampling was performed in risers 6 and 14 and was completed on 51598 A total of 6 RMCS and 20 PMCS segments were taken Two RMCS cores were obtained During sampling filter papers used in the suction line for the CGM were saved and analyzed in the laboratory to estimate the airborne radionuclide concentration in the tank head space Two filter papers were needed for the first core as moisture in the tank vapors condensed on the papers in the cold weather and began to restrict tank gas flow to the CGM One filter paper was used for the second core SX exhauster stack record samples and filter housing dose rates were obtained as part of routine operations for the SX exhauster not as part of the RMCS process
Tank 241-SX-102698 to 798 RMCS started in SX-102 with Truck 4 on 61798 The SX exhauster was used for ventilation (see SX- 101 above) Sampling was performed in risers 8 and 4 and was completed on 7798 A total of 2 RMCS and I8 PMCS segments were taken Two RMCS cores were obtained During sampling filter papers used in the suction line for the CGM were saved and analyzed in the laboratory to estimate the airborne radionuclide concentration in the tank head space One filter paper was used for each core SX exhauster stack record samples and filter housing dose rates were obtained as part of routine operations for the SX exhauster not as part of the RMCS process
Tank 241-S-110598 to 698 RMCS was begun in S-I10 on 51898 Exhauster C (4) and Truck 3 were used This tank marked the first use of an RMCS exhauster since 1995 Sampling was completed on 6498 Risers 6 and 14 were sampled A total of IO RMCS and 8 PMCS segments were taken Two RMCS cores were obtained The
F-3
RPP-4826 Rev I
total exhauster run time was 15978 hours The stack record sample was removed and analyzed following this run period Dose rates taken at the side of the exhauster housing during RMCS were all lt05 mRhr During sampling filter papers used in the suction line for the CGM were saved and analyzed in the laboratory to estimate the airborne radionuclide concentration in the tank head space One filter paper was used for each core Waste particles retained on the exhauster housing filters were part of the inventory subsequently measured by NDA following completion of the first core in TX-I 13
Tank 241-U-107698 to 798 RMCS was begun in U-107 on 61098 Exhauster C and Trucks 3 and 4 were used Sampling was completed on 71598 Risers 7 and 2 were sampled A total of IO RMCS and 19 PMCS segments were taken Two RMCS cores were obtained The total exhauster run time was 27385 hours The stack record sample was removed and analyzed following this run period Dose rates taken at the side of the exhauster housing during RMCS were all 105 mRihr During sampling filter papers used in the suction line for the CGM were saved and analyzed in the laboratory to estimate the airborne radionuclide concentration in the tank head space One filter paper was used for each core Waste particles retained on the exhauster housing filters were part of the inventory subsequently measured by NDA following completion of the first core in TX-I 13
Tank 24l-BY-105798 to 898 RMCS was begun in BY-105 again on 72298 Exhauster C and Trucks 3 and 4 were used Sampling was completed on 82598 Risers 7 and 1 1 B were sampled A total of 18 RMCS and 18 PMCS segments were taken The material was hard enough to require rotary mode sampling all the way to the bottom of the waste but negligible recovery was obtained After RMCS was performed to the waste bottom a PMCS core was taken in the same hole to recover material Two RMCS cores were obtained The exhauster run time was 13577 hours for the first RMCS core and 30792 hours for the second RMCS core Stack record sample information in ABCASH shows 30558 hours operation for the second core but the sampler data sheet shows the time counter was mistakenly reset 234 hours into the run No correction was made to the BY-IO5 2nd core record sample concentration for this document since the error is conservative and results in only slightly higher (ltI) record sample radionuclide concentrations for this core A stack record sample was removed and analyzed following each core giving two record samples for BY-IO5 in 1998 Dose rates taken at the side of the exhauster housing during RMCS were almost all lt05 m R h but a few readings indicated 07 mRihr This variation was assumed due to personnel reading the instrument differently or the fact that the exhauster had been used on enough tanks that by now there was sufficient activity on the filters to cause readings approximately at the background detection level The final reading when both cores were completed was lt05 m R h During sampling filter papers used in the suction line for the CGM were saved and analyzed in the laboratory to estimate the airborne radionuclide concentration in the tank head space One filter paper was used for each core Waste particles retained on the exhauster housing filters were part of the inventory subsequently measured by NDA following completion of the first core in TX-113
Tank 241-TX-113998 to 599 Core sampling was begun in TX-I 13 riser 3 on 92298 Exhauster B (3) and Truck 4 were used at the start This was the first use of Exhauster B since it was modified Exhauster B ran for a total of 8738 hours until being disconnected on 102398 During this time two PMCS segments were taken and no RMCS segments Exhauster C was then installed and operated for 5598 hours from 121098 to 122898 No RMCS or PMCS sampling was performed during this time frame RMCS segments werent taken until 299 Exhauster C ran for a 30230 hours between 122898 and 21299 Sampling was completed on the core from riser 3 on 21299 A total of 12 RMCS segments were obtained during the time Exhauster C was operating Exhauster flow rate for both exhausters was a nominal 200 scfm Stack record samples were taken following Exhauster B removal at the end of 1998 for Exhauster C and following completion ofthe first core with Exhauster C Aerosol calculations were based on only the 30230 hours run time for Exhauster C in 1999 since this was the time period during which RMCS segments were obtained Dose rates taken at the side of the exhauster housing during the short PMCS only sampling period with Exhauster B were all ltOS m R h Dose rates with Exhauster C varied between lt O S mRhr and 07 mRhr The final reading on Exhauster C following completion of the first core was 07 mFUhr During sampling filter papers used in the suction line for the CGM were saved and
F-4
RPP-4826 Rev I
analyzed in the laboratory to estimate the airborne radionuclide concentration in the tank head space One filter paper was used for the core Waste particles retained on the exhauster housing filters were part of the inventory subsequently measured by NDA following completion of this core
Sampling in riser 5 was begun on 41299 using Exhauster B and Truck 3 A total of 6 RMCS and 1 PMCS segments were taken for this core before sampling was halted on 42899 The total exhauster run time for this core was 11712 hours Problems with high vacuum in the tank required the exhauster flow rate to be reduced to 190 scfm to keep the system within pressure limits The stack record sample for the second core was removed and analyzed following the run period Dose rates taken at the side of the exhauster housing during the second core were all lt05 m M r During sampling filter papers used in the suction line for the CGM were saved and analyzed in the laboratory to estimate the airborne radionuclide concentration in the tank head space One filter paper was used An NDA was performed on the exhauster housing following this core The only radionuclides present in the housing were those from this core or what was removed from the tank head space during the non-RMCS activities in this tank from 92298 and 102398
Some clarification may be needed to explain use of the exhauster operating times and NDA dose rate and record sample data obtained during core sampling on TX-I 13 Core sampling was set up for sampling riser 3 on TX-113 in September 1998 with Exhauster B Exhauster B operated for a total of 8738 hours between 92298 and 102298 The stack record sample was removed at the end of this period The ERS database incorrectly shows the exhauster operated between 111698 and 111998 The ABCASH database shows the stack record sample was removed on 111998 The stack record sample showed positive emuent concentrations during this time period with variances 400 No RMCS samples were taken during this period so the data and time werenrsquot included when calculating RMCS aerosol numbers Exhauster B was removed and Exhauster C installed in late November-early December Exhauster C was operated for a total of 5559 hours between 121098 and 122398 The stack record sample was removed on 122898 No sampling was performed during this period so the data and time werenrsquot included when calculating RMCS aerosol numbers Exhauster C was operated for a total of 30218 hours between 122898 and 2899 All the RMCS segments from riser 3 were taken in this time period so only the data and time for this period were included when calculating RMCS aerosol numbers Exhauster B was used during sampling of riser 5 Exhauster B operated for a total of 11712 hours between 41299 and 42899
Tank 241-TX-l18599 to 699 RMCS was begun in TX-I 18 on 5699 Exhauster C (4) and Truck 4 were used Sampling was completed on 6298 Risers 9B and 12B were sampled A total of 9 RMCS segments were taken there were no PMCS segments Two RMCS cores were obtained The total exhauster run time was 21247 hours The stack record sample was removed and analyzed following this run period The maximum dose rate taken at the side of the exhauster housing following RMCS was 08 m M r CGM filter papers were not analyzed An NDA was performed on the exhauster housing following completion of the two cores The exhauster housing contained the same nuclides as for the first NDA (S-110 U-107 BY-105 and TX-I 13 first core) plus those from TX-I 18
The basic core sampling operational data used in this document includes the number of RMCS cores and segments the exhauster run times and flow rates the RMCS exhauster HEPA filter dose rates and tank vapor space temperatures Table F-l lists the basic operational data This information excluding tank vapor space temperature data was obtained from procedural data sheets in the sampling work packages (References W - 1 to WP-23)
Tank temperature data for the tanks ventilated with the RMCS exhausters was obtained from the TWINS database Plots for each tank were prepared for the time RMCS was conducted and the average value of the highest thermocouple located in the tank (the lowest temperature reading) was estimated and used as the average tank head space temperature during the RMCS period
The SX exhauster flow rates listed in Table F-l are estimates only The combined flow rate for SX-IO1 through SX-106 plus SX-109 (7 tanks) averaged 440 cfm during CY 1996 (Kaiser 1997) for an average of 63 cfm per
F-5
RPP-4826 Rev I
tank Based upon inlet flow measurements at the tank inlet HEPA filters (Fanis 1998) the flow through each individual tank (SX-IO1 through SX-106 plus SX-109) was lt55 cfm at the breather filter Assuming an exhaust flow of 100 cfm for each SX farm tank sampled is therefore conservative
Calculated Data
Calculated data include the tank head space volumes conversion of the RMCS exhauster flow rate from scfm to acfm and the number of tank head space changeouts made by an exhauster during RMCS
Tank head space volume includes the dome space volume above the top of the sidewall plus the void space between the waste surface and the top of the sidewall The formula used to calculate tank head space volumes WN
Head Space Volume in A = (DS + [(H) (12) + HI + Hb - H] (V)) - 748
Where DS = dome space volume gal H = height of tank body sidewall above knuckle A HI = height of tank knuckle area in Hb = height oftank bottom below knuckle in H = height of waste in tank in V =27555 galin of waste in SX tanks 2754 gallin in all others
The tank dome space volumes height of tank sidewall above the knuckle height of tank knuckle area and height of tank bottom below the knuckle were obtained from Reynolds 1999 The height of waste in each tank at the time of core sampling was obtained from the TWINS database Tank dimensional and waste level data are given in Table F-2 along with the calculated tank head space volumes
Aerosol calculations for Appendices A-C require exhauster flow rates in actual cubic feet per minute The RMCS exhauster flow rate is controlled and recorded in standard cubic feet per minute The mass flow rate of the exhauster air is measured and internal logic in the exhauster controller calculates what the volumetric flow rate would be if the temperature and pressure in the exhauster inlet were at standard conditions The standard conditions used in the logic controller are 29921 in Hg (760 mm Hg) and 69F (ZIT)
A correction factor is built into the exhauster control logic that assumes an atmospheric pressure of 2927 in Hg the average atmospheric pressure at Hanford The RMCS exhauster will operate at about 1-2 in H20 negative pressure resulting in about a 2916 in Hg pressure in a waste tank when the RMCS exhauster is operating To revise the indicated scfm RMCS exhauster reading to an acfm value the RMCS exhauster scfm flaw rate was multiplied by (29922916)(T+459)528 where Tis the tank head space temperature in OF The tank head space temperatures in Table F-1 were input to the spreadsheet file used for aerosol calculations and converted to acfm The flow rates in acfm are included in Table F-I
The tank head space changeouts when using the RMCS exhauster were calculated by multiplying the exhauster acfm flow rate by the time of exhauster operation and dividing the result by the tank head space volume Tank head space changeouts are listed in Table F-2
F-6
c
gt 2
RPP-4826 Rev 1
APPENDIX G
REFERENCES
G-0
RPP-4826 Rev 1
APPENDIX G - References
Diedeker 1999 NDA of RMCS HEPA Filters L P Diedeker WMH E-Mail to JS Schofield CHG November 29 I999
ERDA 1976 Nuclear Air Cleaning Handbook ERDA 76-21 Buchsted C A Fuller A B and Kahn 1 E Oak Ridge National Laboratory 1976
Farris 1998 Internal Note T R Farris LMHC to J S Schofield LMHC Breather Filter Flow Rates for SX-Farm 31698
Foust 1999 Internal Memo RMCST Exhauster HEPA Filter Dose Rate Calculations D J Foust LMHC to J S Schofield LMHC October 25 1999
Greager 1999 Correspondence No WMH-9954450 Non-Destructive Analysis of the Rotay Mode Core Sample High-Efjiciency Particulate Air Filters E M Greager WMH to P C Miller LMHC June 28 1999 [Transmittal of HNF-4199 Resultsfram NDA Measurement of the 296-P-34 RMCS HEPA Filters]
HNF 1999 HNF-SD-WM-SAR-067 Tank Waste Remediation System Final Safety Analysis Report Rev 1 The revision incorporating RMCS accident analyses was submitted as Addendum 5 to DOE as a change to the FSAR predecessor the Basis for Interim Operation (BIO) LMHC-9857075 80232764-9-KOOl Submittal of Authorization Basis Amendment Package for Rotay and Push Mode Core Sampling in Satisfaction of Perfarmance Agreement TWR 122 Expectations I and 3 D 1 Allen LMHC to A M Umek FDH August 30 1998 Addendum 5 as of mid-January 2000 is waiting for approval by DOE
Kaiser 1997 T D Kaiser LMHC E-Mail to J S Schofield LMHC SX Tank Flow Data 42197
NUREG 1995 Potential Radionuclide Emissionsfrom Stacks on the HanfordSite Part I Dose Assessment Davis W E and Barnett J M Westinghouse Hanford Company from Proceedings of the 23 DOEMRC Nuclear Air Cleaning Conference held July 25-28 1994 February 1995
Schofield 2000a Letter 74910-00-002 Use of Microshield Calculations for RMCS Exhauster Housing for Estimating Radionuclide Quantities on the Filters Using NDA and Dose Rate Measurements I S Schofield CHG to File January 62000
Schofield 2000b Letter 74910-00-003 Rev I RMCS Exhauster Stack RecordSample Data J S Schofield CHG to File January 202000
Reynolds 1999 D R Reynolds LMHC E-Mail to I S Schofield LMHC transmitting Tank Volume Calculations draft of calculations done by Mike Plesha and Reed Hendershot data to be used for RESOLVE computer program for Hanford waste tanks August 3 1999
TWINS Tank Waste Information Network System database available at httptwinspnlgovSOO lhtbinTCDgetTableListexe
Waldo 1999 letter 74910-99-009 RMCS Exhauster Aerosol Test Data E I Waldo to J S Schofield June 22 1999
WHC 1993 WHC-SD-WM-ES-225 Rev I AerosolStudy for the Rotary Mode Exhauster P M Francis Westinghouse Hanford Company April 20 1993
WHC 1997 WHC-SD-WM-SAD-035 Rev Ob A Safety Assessment of Rotary Mode Core Sampling in Flammable Gas Single Shell Tanks Hanford Site Richland Washington August 8 1997
G- I
RPP-4826 Rev I
CGM Data CGM-I Letter PARTICULATE SAMPLING OF 241-SX-IO1 DURING ROTARY MODE CORE SAMPLING D C
Langlois E2 Consulting Engineers to J S Schofield Lockheed Martin Hanford Company March 16 1998
CGM-2 Letter PARTICULATE SAMPLING OF 241-SX-I05 DURING ROTARY MODE CORE SAMPLING D C Langlois E2 Consulting Engineers to J S Schofield Lockheed Martin Hanford Company June 9 1998
CGM-3 Letter PARTICULATE SAMPLING OF 241-SX-103 DURING ROTARY MODE CORE SAMPLING D C Langlois E2 Consulting Engineers to J S Schofield Lockheed Martin Hanford Company June 12 1998
CGM-4 Letter PARTICULATE SAMPLING OF 241-S-110 DURING ROTARYMODE CORESAMPLING D C Langlois E2 Consulting Engineers to J S Schofield Lockheed Martin Hanford Company July 20 1998
CGM-5 Letter PARTICULATE SAMPLING OF 241-SX-102 DURING ROTARY MODE CORE SAMPLING D C Langlois E2 Consulting Engineers to J S Schofield Lockheed Martin Hanford Company July 22 1998
CGM-6 Letter PARTICULATE SAMPLING OF241-U-107 DURING ROTARY MODE CORE SAMPLING D C Langlois E2 Consulting Engineers to J S Schofield Lockheed Martin Hanford Company August 3 1998
CGM-7 Letter PARTICULATE SAMPLING OF 241-BY-105 DURING ROTARY MODE CORESAMPLING D C Langlois E2 Consulting Engineers to 1 S Schofield Lockheed Martin Hanford Company September 17 1998
CGM-8 Letter PARTICULATE SAMPLING OF 241-TX-I13 DURING ROTARY MODE CORESAMPLING D C Langlois E2 Consulting Engineers to J S Schofield Lockheed Martin Hanford Company March 15 1999
CGM-9 Letter PARTICULATE SAMPLING OF 241-TX-113 DURING ROTARY MODE CORE SAMPLING D C Langlois E2 Consulting Engineers to I S Schofield Lockheed Martin Hanford Company May 31 1999
Notices of Construction NOC-I DOEIRL-93-40 Radioactive Air Emissions Program Notice of Construction Rotary Mode Core-Sampling
Truck and Exhauster Approved by Letter AIR 93-707 A W Conklin WDOH to J E Rasmussen DOEIRL 7893
NOC-2 DOEIRL-94-118 Rev 0 Radioactive Air Emissions Program Notice of Construction for the Rotary Mode Core-Sampling Systems Three and Four Approved by Letter AIR 95-603 A W Conklin WDOH to J E Rasmussen DOERL 63095
NOC-3 DOERL-94-118 Rev 1 Radioactive Air Emissions Program Notice of Construction for the Rotary Mode Core-Sampling Systems Three and Four Approved by Letter AIR 98-301 W W Conklin WDOH to I E Rasmussen DOEIRL 3698
NOC-4 DOEIRL-97-70 Radioactive Air Emissions Program Notice of Construction for Rotary Mode Core- Sampling in SX Tank Farm Approved by Letter AIR 97-1 101 A W Conklin WDOH to J E Rasmussen DOEIRL 113097
NOC-5 USEPA Letter OAQ-107 (no title approving DOE submittal 97-EAP-590 dated 72997) A J Frankel USEPA to J E Rasrnussen DOEIRL 8497
NOC-5 USEPA Letter OAQ-107rsquo (nb title approving DOE submittal 97-EAP-723 dated 101797) A J Frankel USEPA to J E Rasmussen DOERL 11498
Note that both letters have ldquoOAQ-107rdquo following ldquoReply to Attn ofrdquo
G-2
RPP-4826 Rev I
Work Packages WP-I ES-94-00808 WP-2 ES-95-00258 WP-3 ES-95-00045 - WP-4 ES-95-00434 - WP-5 ws-97-00173 - WP-6 WS-97-00174 - WP-7 ws-97-00143 - WP-8 WS-97-00144 - WP-9 WS-97-00207 - WP-I 1 WS-97-00208 - WP-12 WS-98-00049 - WP-13 WS-97-00050 - WP-14 WS-97-00224 - WP- I5 WS-97-00225 - WP-16 WS-97-00230 - WP- I7 ws-97-0023 1 - WP-18 ES-97-00452 - WP-19 ES-97-00453 - WP-20 WS-98-00072 - WP-21 WS-98-00073 - WP-22 WS-98-00067 - WP-23 WS-98-00068 -
241-BY-IO6 Perform Rotary Core Sample [Riser IOB] 241-BY-I IO Rotary Core Sample [Risers 12B 7 IZB 41 241-BY-IO8 Obtain Rotary Core Sample [Risers 12A amp 71 241-BY-IO5 Rotary Mode Core Sample [Riser 12A] 241-SX-101 Rotary Mode Core Sample Riser 19 241-SX-101 Rotary Mode Core Sample Riser4 241-SX-103 Rotary Mode Core Sample Riser 7 241-SX-103 Rotary Mode Core Sample Riser I I 241-SX-105 RMCST Obtain Core Sample Riser 6 241-SX-105 RMCST Core Sample Riser 14 241-SX-102 Rotary Mode Core Sample Riser 8 241-SX-102 Rotary Mode Core Sample Riser 4 241-S-1 IO RMCST Obtain Core Sample Riser 6 241-S-1 IO RMCST Obtain Core Sample Riser 14 2414-107 RMCSTCore Sample Riser 7 241-U-107 RMCST Core Sample Riser 2 241-BY-IO5 RMCST Core Sample Riser 7 241-BY-IO5 RMCST Core Sample Riser 1 IB 241-TX-113 Rotary Core Sample Riser 3 241-TX-113 RMCST Core Sample Riser 5 241-TX-I 18 RMCST Core Sample Riser 9B 241-TX-I 18 RMCST Core Sample Riser 128
G-3
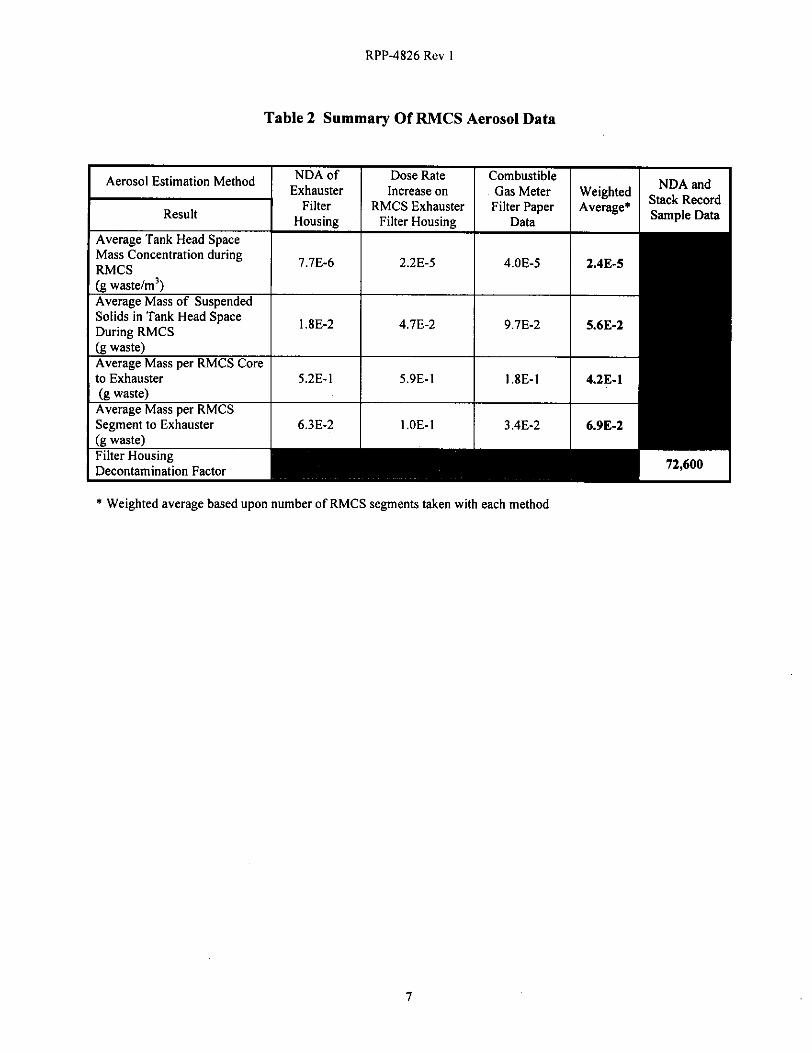
RPP-4826 Rev I
Table 2 Summary Of RMCS Aerosol Data
Weighted average based upon number of RMCS segments taken with each method
7
e
Q 0 c 0 0 - 0 VJ 0 L
2
RFP-4826 Rev 1
APPENDIX A
ESTIMATION OF AEROSOLS GENERATED DURING Rh4CS BASED UPON RMCS EXHAUSTER HOUSING NON-DESTRUCTIVE ASSAY
A-0
RPP-4826 Rev I
APPENDIX A - Estimation Of Aerosols Generated During RMCS Based Upon RMCS Exhauster Housing Non-Destructive Assay
Summary of Method
This method of estimating RMCS aerosol quantities uses non-destructive assay (NDA) of the exhauster housing to determine the C S rdquo ~ quantity (Ci) on the filters inside This quantity is then divided by the C S rdquo ~ specific activity (Cig) in the waste for the tank(s) on which the exhauster and the same filters were present during sampling The resulting mass on the filters divided by the volume of air flowing through the exhauster provides an estimate of the average aerosol mass concentration in the air to the exhauster This value was multiplied by the tank head space volume to obtain the average mass of particulates present in the tank head space during RMCS The mass of waste on the filters divided by the number of rotary cores or segments taken provides the mass per core or per segment sent to the exhauster
Description
There are one prefilter and two HEPA filters in series for each RMCS exhauster Particulates captured on the filters contain radionuclides with C S rdquo ~ bein the predominant gamma emitter By performing an NDA of the exhauster housing filters the quantity of Cslg7 in the housing can be estimated This C S rdquo ~ value is then used to back-calculate to a waste mass on the filters using the mass is used to calculate the concentration of particulates in the tank exhaust stream the total suspended solids in the tank head space and the mass of waste sent to the exhauster for each RMCS core or segment taken
Exhauster operations were divided into six operating periods for evaluation in this document These periods are discussed in Appendix F and shown in Table F-I NDA data were obtained for Exhauster Operating Periods 4 5 and 6 Relevant information for these periods is also listed in Table A-I
Period 4 was for Exhauster C use during RMCS for both cores in S-l IO U-107 BY-IO5 and the first core in TX-I 13 The filters and housing were new prior to RMCS in S-110 No filter changeouts were made during this period the accumulated particulates from these RMCS events were retained on the housing prefilter primary HEPA and secondary HEPA
Period 5 was for Exhauster B use during RMCS for the second core in TX-I 13 The filters and housing were new prior to RMCS in TX-113 No filter changeouts were made during this period Exhauster B also ran for a short time during the first core in TX-113 but no RMCS segments were taken when the exhauster was operating Stack record samples (see Appendix D) indicated small levels of aerosols were present in the stack exhaust during this time period Any material collecting on the filters during this time period would show up and be counted as part of the aerosols generated during the 2rdquod RMCS core
Period 6 was for Exhauster C use during RMCS for both cores in TX-I 18 During Period 6 the filters also contained the waste particles from Period 4 No filter changeouts were made durin this period The aerosol mass generated due to RMCS in TX-I 18 was determined from the increase in Cs on the filters between Period 4 and Period 6
A description of the sampling method used for the NDA obtained following Period 4 is provided in Greager 1999 The same method was used for the NDA following Periods 5 and 6 The NDA consisted of a gamma energy analysis of the exhauster housing performed at points adjacent to the prefilter first HEPA and second HEPA The detector was mounted outside the housing and inside a lead collimator The collimator was used to minimize the background count rate and contribution from adjacent filters CsIh was the only radionuclide reported as present The NDA compared the count rates from the exhauster housing with the count rate of an National Institute of Standards and Technology (NISampT) traceable in an equivalent geometry to the RMCS exhauster housing The count rates from housing filter readings were divided by the count rate for the source to give a reported quantity of Cslrdquo on the filters
concentration in the tank waste This filter waste
3 B
source located in the middle of a filter
A- 1
RPP-4826 Rev 1
Two correction factors were applied to the reported filter Csrdquorsquo values for use in this document These are discussed in the following two sections
Reported NDA Data
The NDA results for Period 4 are provided in Greager 1999 The only radionuclide reported as present on the filters was CsI3rsquo The results are restated in Table A-2
The NDA results for Periods 5 and 6 are provided in Diedeker 1999 The only radionuclide reported as present on the filters was Csrdquorsquo The results are restated in Table A-2
Adjusted NDA Data
The reported results are based upon comparing the count rate for a reference point source located in the middle of a mock-up assembly equivalent to the exhauster housing with the count rate from the same detector inside a lead collimator placed outside the actual exhauster housing Limitations with this method include comparison of a point source with a distributed matrix and the inability of the detector to see the entire filter due to the presence of the collimator Correction factors were used to adjust the reported values to account for these two limitations
The first correction factor accounts for comparing a distributed source to the point source standard The reported results were calculated based upon a point source standard since there are no readily available filter standards with a distributed source The material in the filter housing should be fairly evenly distributed through the filter media however so comparing count rates for the filter housing to a point source standard will result in some error To correct for this error shielding calculations were performed on an exhauster housing filter assuming the CSrdquorsquo was evenly distributed throughout the filter media and then again assuming the activity was a point source in the middle of the filter Foust 1999 provides the results of these Microshield dose rate calculations Using the data in Foust 1999 Schofield 2000a shows that the dose rate at the NDA detector location would be about 0625 mFVhrmCi CSrdquorsquo for a point source and 073 mRhrmCi Cslrdquo for a distributed source To adjust the reported NDA results to what they would have been if an actual distributed standard source was available the reported values need to be multiplied by 0625 + 073 = 086
The second correction factor accounts for the detector not being able to see the entire filter contents due to the detector location inside the lead collimator Using basic geometry Schofield 2OOOa estimated the detector has about a 100 view of 608 of a HEPA filter about a 50 view of 264 of the filter and is shielded from the remaining 128 The detector count rate was thus estimated as being approximately 741 o f what it would be if the detector were not collimated To correct the reported results to what they would have been if an uncollimated detector could have been used the reported values need to be multiplied by I + 0741 = 135
Combining the two correction factors gives a single adjustment factor used of 086 x 135 = 116 Per Table A- 2 the total quantity of Csrdquorsquo reported present in the housing for Period 4 was 0430 mCi This quantity was multiplied by 116 to give 050 mCi Csrdquorsquo The reported results for Periods 5 and 6 were revised in the same manner to give 0032 mCi and 064 mCi C~rsquo~rsquorespectiveIy To determine the net increase in Csrdquorsquo for the housing during Period 6 the value from Period 4 was subtracted from the total or 064 - 050 = 014 mCi Csrdquorsquo
Calculation of Mass Quantity on Filters
Calculation of the mass of waste on the filters requires knowledge of the specific activity of the waste on the filters The specific activities used for each exhauster operating period are given in Table A-I The paragraphs below provide a derivation of the specific activities used
The specific activity values for the waste in each tank sampled is given in Table E-I Rh4CS was performed on more than one tank during Period 4 so a weighted average specific activity was used to calculate the waste mass on the filters during this period The weighted average specific activity was calculated based upon the number of RMCS segments taken from each tank sampled The number of RMCS segments obtained during
A-2
RPP-4826 Rev 1
each period for which NDA measurements were made are listed in Table A-I These values were obtained from Table F-I A weighted average specific activity for the waste on the filters in Period 4 was obtained by
[[O 227 mCigl[lO segl+[Ol2lmCigl[lO seg1+[0225 mCigl[l(l seg]+[Ol30 mCig][l2 seg]]+[SO segments] = 0182 mCi Csrdquorsquog
Calculating a weighted average based upon the number of segments assumes aerosol generation is roughly the same per segment and the specific activity of a radionuclide is constant throughout a tank These assumptions are adequate for the purpose oftbis document Aerosol generation can vary with water content waste hardness depth of sample taken nitrogen flow rate and porosity of the waste An in-depth evaluation of these parameters is beyond the scope of this document The impact of these variables is assumed to average out over all the RMCS segments taken The specific activities used do not vary greatly from tank to tank so any variations will not have a significant impact on the final aerosol results See Appendix E for further discussion of limitations on specific activities used in this document
For Period 5 the filters were new at the start and the only tank sampled with the exhauster was TX-I 13 Therefore the specific activity of CsI3rsquo for TX-I 130130 mCig was used
The same exhauster and filters used for Period 4 were used for Period 6 The net increase in Csrdquorsquo for Period 6 was determined by subtracting the Period 4 Csrdquorsquo from the total Since this net increase was only due to TX- 118 the specific activity of Csrdquorsquo for TX-I 180130 mCig was used for the waste added to the filters in Period 6 (Note it is only a coincidence that TX-I 13 and TX-118 have the same nominal Csrdquorsquo concentration)
The total mass of waste on the filters for Period 4 was thus
050 mCi i 0182 mCig waste = 275 g waste in exhauster housing
The mass of waste added to the exhauster for Period 5 was
0032 mCi + 0130 mCig waste = 025 g waste in exhauster housing
The mass of waste added to the exhauster for Period 6 was
(064 mCi - 050 mCi) + 0130 mCig waste = 11 g waste in exhauster housing
Aerosol Calculations
The tank head space particulate concentration was obtained by dividing the mass of waste sent to the exhaust stream by the volume of air sent to the exhauster The volume of air to the exhauster was obtained by multiplying the exhauster flow rate by the exhauster run times for each tank from Table F-I
For the RMCS exhausters the recorded exhauster flow rate is reported in standard cubic feet per minute (scfm) The RMCS exhauster flow rate is controlled to a nominal 200 scfm The exhauster flow rate was corrected to an actual cubic feet per minute (acfm) before calculating the tank head space aerosol concenmtion Table F-l includes the actual cfm flow rates
The calculated flow rates during RMCS for the tanks sampled during Period 4 were 207 acfm (S-1 lo) 206 acfm (U-107) 208 amp 209 acfm (BY-105) and 203 acfm (TX-I 13) The total volume oftank air through the exhauster during Period 4 was thus
[[207 cfm][ 15978 hr]+[206][27385]+[208][13577]+[209][30792]+[203][30230]][60 minh] = 146 E+7 Arsquo
The average tank head space mass concentration during RMCS in the above tanks was
[275 g + 146 E+7 Arsquo] x [35315 ftrsquomrsquo] = 664 E-6 average g waste per m3 in exhauster inlet
A-3
RPP-4826 Rev I
The gas flow rates and average tank head space mass concentrations during RMCS for Periods 5 and 6 were calculated in a similar manner
The average mass of waste in a tank head space during RMCS was calculated by multiplying the tank head space mass concentration by the tank head space volume from Table F-2 as shown below for S-1 I O
[275 g + 146 E+7 Arsquo] x [89100 ftrsquo] = 167E-2 g waste in S-1 IO head space
The particulate quantities in the other tank head spaces were calculated in a similar manner The weighted average mass in a tank head space during Period 4 was based upon the number of segments taken in each tank
The mass sent to the exhauster per RMCS core or per RMCS segment was obtained by dividing the mass of waste sent to the exhaust stream during each period by the numbers of RMCS cores or RMCS segments obtained during the exhauster operating time The average mass of waste sent to the exhauster during Period 4 is thus
275 g waste + 7 rotary cores = 39E-1 g wastelrotary core
and
275 g waste + 50 rotary segments = 55E-2 g wasteirotary segment
The mass of waste to the exhauster per RMCS core and RMCS segment for Periods 5 and 6 were calculated in a similar manner
All data were input to a spreadsheet to perform the calculations Results are provided in Table A-3
Summary of Calculations
Non Destructive Assay was performed on the RMCS exhauster filter housings used during three separate exhauster operating periods during which IO RMCS cores and 65 RMCS segments were obtained from five tanks Weighted averages of the average tank head space mass concentration average mass of suspended solids in a tank head space and average mass sent to the exhauster per RMCS core or segment for the three periods combined were calculated based upon the number of RMCS segments taken during each period Based upon RMCS exhauster housing NDA data the results indicate that
The average tank head space mass concentration during RMCS was 77E-6 g wastelmrsquo The average mass of suspended solids in the tank head space during RMCS was 18E-2 g waste The average mass sent to the exhauster during RMCS was 52E-1 g wastelcore The average mass sent to the exhauster during RMCS was 63E-2 g wasteisegment
A-4
RPP-4826 Rev 1
APPENDIX B
ESTIMATION OF AEROSOLS GENERATED DURING RMCS BASED UPON Rh4CS EXHAUSTER HEPA FILTER DOSE RATES
B-0
RPP-4826 Rev I
APPENDIX B - Estimation Of Aerosols Generated During RMCS Based Upon RMCS Exhauster HEPA Filter Dose Rates
Summary of Method
This method of estimating RMCS aerosol quantities divides the dose rate increase (mRhr) at the side of the RMCS HEPA filter housing by a calculated dose conversion factor (mRhrmCi C S rdquo ~ ) to obtain an approximation of the radionuclide quantity in the housing This radionuclide quantity is divided by the waste specific activity (mCig) to determine the mass of waste on the HEPA filter Dividing the HEPA filter waste mass by the volume of air passing through the filter provides an estimate of the average tank head space particulate concentration during RMCS Multiplying the average tank head space particulate concentration by the tank head space volume gives an estimate of the average mass of suspended particulates in the tank head space during RMCS Dividing the HEPA filter waste mass by the number of RMCS cores or RMCS segments provides the mass per RMCS core or per RMCS segment sent to the exhauster
Description
Particulates in the exhaust stream are removed by the HEPA filter(s) upstream of the exhaust fan The captured particulates contain radionuclides with CSrsquo~rsquo being the predominant gamma emitter As the particulate quantity on the HEPA filter increases the dose rate at the side of the filter housing will increase proportionately By monitoring the HEPA dose rate at the side of the filter housing the quantity of Csrsquordquo on the HEPA can be estimated This C S rdquo ~ value is then used to back-calculate to a waste mass quantity on the filter using the Csrsquordquo concentration in the tank waste This filter waste mass quantity is used to calculate the concentration of particulates in the tank exhaust stream the total suspended solids in the tank head space and the mass of waste sent to the exhauster for each RMCS core or segment taken Although radionuclides will be trapped on both the prefilter and the primary HEPA filter with a very small amount on the secondary HEPA calculations in this section were based upon the simplifying assumption that all the activity was on the primary HEPA filter
During RMCS exhauster operation the dose rate in m M r at the side of the HEPA filter housing is periodically measured with an Eberline RO-3B per procedure to indicate when radioactive particulates are building up on the filter The limit of detection of the RO-3B is 05 mRhr
Exhauster operations were divided into six operating periods for evaluation in this document These periods are discussed in Appendix F and shown in Table F-I Housing dose rate data were obtained for Exhauster Operating Periods I 24 5 and 6 Relevant information for these periods is also listed in Table B-I Dose rate data are available and were used for all tanks on which an RMCS exhauster was present and RMCS samples were taken This includes BY-106 BY-IO5 (1995) BY-I IO S-l I O U-107 BY-IO5 (1998) TX-113 and TX- 1 18 The dose rate at the end of a period was used as the basis for calculating radionuclides on the filters The only operating period for which dose rate data were not used for estimating filter radionuclide content was Period 3 Period 3 was for RMCS in SX farm using the SX exhauster
The dose rate at the side of the SX exhauster HEPA filter housing was measured during RMCS of SX farm tanks (for sampling of tanks SX-lot SX-102 SX-103 and SX-105) but the data are not useful for estimation of aerosol quantities because the SX exhauster draws on 13 tanks in parallel or in series with the tank being core sampled Many of the tanks have a much higher off gas flow rate than the sampled tank In addition there is background radiation in the area of the SX exhauster filter housing making any increase in the housing dose rate during RMCS difficult to detect
Dose Rate Data
The dose rate data for each period is listed in Table 8-2 No dose rates above minimum detectable limits were evident at the sides of any RMCS exhauster in Periods I 2 and 5
Dose rate measurements were less than detectable for Period 4 during sampling of S-l IO and U-107 When sampling on BY-IO5 there were a few readings of 07 m M r but most were ltOS mRhr This variation in
B- 1
RPP-4826 Rev 1
readings is to be expected as the specific instrument person using the instrument and location at which the dose rate is checked can vary with time The final recorded dose rate when sampling was complete on BY-IO5 was lt05 mRhr At the end of Period 4 following completion of the first core in TX-I 13 Exhauster C was listed as having a 07 m M r dose rate
Period 6 used Exhauster C again with the same housing and filters as at the end of Period 4 The final dose rate for this period was 08 m M r
Periods 124 and 5 all began with a new housing and new filters For Periods 12 and 5 it was conservatively assumed that the final dose rate was equal to 05 m M r giving an increase of 05 mRhr for each of these periods For Period 4 the dose rate increase was 07 m M r for this period Since Period 6 used the same housing and filters as Period 4 the increase for Period 6 was 08 - 07 = 01 m M r
The dose rate increase was converted into a CsIh content on the primary filter for each period Foust 1999 provides various dose rates for an RMCS exhauster housing assuming even dispersal of 1 mCi C S rdquo ~ on the first HEPA filter Using these calculations Schofield 2000a estimated a dose rate conversion factor of 16 mRhrmCi C S rdquo ~ at the detector location for an RO-3B The assumption that radionuclides are evenly distributed on the HEPA is a reasonable assumption based upon the exhauster design and the method used to measure the radiation dose rate
Gamma emitting contribute to the dose rate due to bremsstrahlung radiation and other nuclides may provide some small additional dose but the major penetrating dose rate contributor in aged SST waste is CSrdquo~ Ignoring the presence of all radionuclides (including Srm) except C S rdquo ~ in calculating a HEPA filter waste mass will provide a conservative result This is because assuming all radiation present is due to C S rdquo ~ will result in overestimating the C ~ I ~ ~ c o n t e n t of the filter housing which in turn will result in overestimating the waste mass on the HEPA filter
Dividing the HEPA dose rate for each exhauster installation by the dose conversion factor of I 6 mRhrmCi results in an increase of 031 mCi Csrdquorsquo on the RMCS exhauster filters for Periods I 2 and 5044 mCi for period 4 and 0063 mCi for Period 6
Calculation of Mass Quantity on Filters
Dividing the Csrdquorsquo content of the filters by the specific activity of C S rsquo ~ ~ in the waste gives the estimated mass of waste sent to the exhauster The specific activity value used for the waste in each tank sampled is given in Table E-I Since RMCS was performed on more than one tank in Periods 1 and 4 a weighted average specific activity was used for these periods The weighted average specific activity was calculated based upon the number of RMCS segments taken from each tank sampled during that period The number of RhKS segments obtained during each period are listed in Table B-I These data were obtained from the individual tank data in Table F- I Calculations to estimate the specific activity of waste mixtures were performed in the same manner as shown in Appendix A For Periods 2 5 and 6 RMCS samples were taken in only one tank The waste specific activity used for these periods was the specific activity of the tank sampled The specific activities used for each exhauster operating period are given in Table B-I
For all exhauster installations except BY-IO6 in 1994 and 1995 the RMCS exhausters were hooked directly to the waste tank When sampling BY-106 a prefilter was installed in the tank riser between the tank and the exhauster The prefilter was not used for BY-I IO in Period 1 or for any other tank in any other period Thus for Periods 2 4 5 and 6 the mass of waste on the HEPA was assumed equal to the mass of waste leaving the tank risers For Period 1 the mass of waste on the HEPA had to be adjusted for the BY-106 prefilter DF when estimating the combined mass of waste leaving the BY-IO6 and BY-I IO tank risers The mass of waste on the HEPA for Period 1 was
[031 mCi] [IO00 pCimCi] = 310 pCi
[310 pCi Csrdquorsquoon HEPA] + [I77 pCi C S rdquo ~ ~ waste] = 177 gwaste on HEPA
is the predominant radionuclide contributor to filter dose rates Beta emitting Srw can
on HEPA
B-2
RPP-4826 Rev 1
A decontamination factor (DF) of 5 was used to account for radionuclide removal by the BY-IO6 prefilter (see Appendix D for basis ofprefilter DF) There were 1 1 RMCS segments taken from BY-IO6 and 13 from BY- 1 IO The total mass ofwaste assumed to exit the tank risers was therefore
[ I 77 g waste] [ 1 1 + 131 [[I 151 + 131 = 28 g waste from tank risers
The DF of 5 to account for the prefilter is only applicable to the RMCS of BY-IO6 in 1994 and 1995 for all other exhauster periods the mass of waste on the HEPA was equal to the mass of waste sent to the exhauster riser
The mass of waste sent to the exhauster for Period 2 was
[031 mCi] [IO00 pCimCi] = 310 pCi Csrdquorsquo on HEPA
[3 IO pCi C S rdquo ~ on HEPA] + [225 pCi CsiI7g waste] = I 39 g waste from tank
Using the same formula the mass of waste to the exhauster from Periods 4 and 5 was 241 and 240 g respectively and the increase in waste on the filters for Period 6 was 048 g
Aerosol Calculations
The mass sent to the exhauster per RMCS core or per RMCS segment was obtained by dividing the mass of waste leaving the risers by the number of RMCS cores or RMCS segments obtained during the exhauster operating period
The tank head space particulate concentration was obtained by dividing the mass of waste leaving the riser by the volume of gas sent to the exhauster This volume of gas sent to the exhauster was obtained by multiplying the exhauster flow rate by the exhauster run time from Table F-I The calculations for aerosols generated based upon HEPA dose rates use acfm while the exhauster flow is recorded in scfm so the actin flow rates in Table F- 1 were used
The average mass of aerosols in the tank head space was obtained by multiplying the average tank head space particulate concentration by the tank head space volume from Table F-2
Following is an example of how the mass per RMCS core mass per RMCS segment average tank head space mass concentration and average mass of aerosols in the tank head space were calculated for Period 1 Data used are from Tables E-I F-I and F-2
[200 scfm] [2992+2916] [84 + 4591 + 528 = 21 1 acfm to exhauster from BY-IO6 in 11-1294
using same formula results in 210 acfm for BY-IO6 in 195 and 209 acfm for BY-I IO
28 g waste + [((21 1 acfm)(4878 hr)+(21O)(l867)+(209)(1125))(60 minhr)]= 12E-6 g wastelf to risers
[12E-6 amp] [35315 fmrsquo] =43E-5 g wastemrsquoto risers
[12E-6 gftrsquo] [53700 Arsquo in BY-106 head space] =66E-I g waste in BY-IO6 head space during RMCS
[12E-6 piftrsquo] [92000 ftrsquo in BY-110 headspace] = IIE-l g waste in BY-I10 head spaceduring RMCS
[28 g waste] [5 RMCS cores] = 56E-1 g waste per core to riser
[28 g waste] + [24 RMCS segments] = 12E-1 g waste per segment to risei
8-3
RPP-4826 Rev 1
All data were input to a spreadsheet and the mass to exhauster per RMCS core mass to exhauster per RMCS segment average tank head space mass concentration and average mass of aerosols in the tank head space were calculated for each of the RMCS exhauster operating periods in the same manner as shown above Results are given in Table 8-3
Summary of Calculations
RMCS exhauster operations were segregated into five operating periods during which RMCS was performed The Exhauster B data for BY-IO8 and TX-I 13 riser 3 was not used in these calculations as no RMCS was performed when the exhauster was operating Exhausters were operated in seven tanks during which 16 RMCS cores and 92 RMCS segments were obtained Based on RMCS filter housing dose rate data the results indicate that
These values are conservative as the assumed dose rate at the end of RMCS for Periods I 2 and 5 was assumed to be 05 mRhr In addition using a DF of 5 for the BY-IO6 prefilter skews the results high The in-tank prefilters used in both BY-IO6 sampling events showed no detectable contamination
Operatin Periods 4 and 6 were the only periods with exhauster housing dose rates above detectable The 044 mCi Csrsquordquo and 0063 mCi CsIh increase on the filters for these two periods based upon dose rate data correspond to the 050 mCi CsI3rsquo and 014 mCi Csrdquorsquo increase on the filters for these two periods based u on NDA data (see Appendix A) The 031 mCi C S rdquo ~ for Period 5 is significantly above the 0032 mCi Cslrsquolsquofor the same period determined by the NDA but this is due to assuming the housing dose rate was equal to the minimum detectable 05 mRhr
The average tank head space mass concentration during RMCS was 22E-5 g wastem3 The average mass of suspended solids in the tank head space during RMCS was 47E-2 g waste The average mass sent to the exhauster during RMCS was 59E-1 g wastelRMCS core The average mass sent to the exhauster during RMCS was 1OE-1 g wastelRMCS segment
B-4
v m
__ ~~
RPP-4826 Rev 1
APPENDIX C
ESTIMATION OF AEROSOLS GENERATED DURING RMCS BASED UPON CGM IN-LINE FILTER PAPER ANALYSES
c-0
RPP-4826 Rev I
APPENDIX C - Estimation Of Aerosols Generated During RMCS Based Upon CGM In- Line Filter Paper Analyses
Summary of Method
This method of estimating RMCS aerosol quantities uses radionuclide assay data from in-line filter papers located upstream of continuous gas monitors (CGM) sampling the tank air for flammable gases during RMCS The radionuclide content of the filter paper is divided by the waste radionuclide specific activity and the air flow through the CGM to obtain an estimate of the average mass concentration in the tank head space during the time period the CGM is on Multiplying the estimated average tank head space mass concentration by the tank head space volume gives an estimate of the average mass of particulates in the tank head space during RMCS To obtain the mass per RMCS core or per RMCS segment sent to the exhauster the tank head space average mass concentration is multiplied by the volume of gas sent to the exhauster then multiplied by a correction factor to account for particulates in the head space removed by the exhauster when the CGM is not operating and divided by the number of RMCS cores or RMCS segments
Description
During most tank waste intrusive activities performed since 1996 an intrinsically safe CGM located above ground has been used to continually monitor the tank air for flammable gases during in-tank activities The CGM sampling method draws air directly from the tank head space During RMCS the CGM sampling line is placed in the tank dome space The sampling line is located between the sampling riser and the exhaust riser if practical A pump in the CGM draws tank air up through the line at 05 litmin for measurement of the lower flammability limit (LFL) by the CGM A filter paper is installed in the sampling line upstream of the CGM to protect the unit from internal contamination
Following CGM use the CGM filter papers are normally discarded after monitoring them in the field for contamination To help estimate the tank head space particulate levels during RMCS these filter papers were retained and analyzed in the 222-S laboratory following removal from all tanks in which RMCS was performed from the fall of 1997 through April 1999 Data were collected for the four tanks in SX farm in which RMCS was performed and the next four tanks on which the RMCS exhauster was deployed These tanks are listed in Table c-I Reported CGM Data
The CGM operational data used to estimate aerosol levels during RMCS includes CGM operating times CGM flow rates and filter paper analytical data A summary report containing all the field operating data sheets for CGM usage and lab data was prepared following completion of sampling on each tank for all tanks except TX- 113 For TX-I 13 a separate report was prepared following each core These reports are References CGM-I to CGM-9 The CGM data from these reports are provided in Table C-2
There were 14 CGM installations during RMCS when CGM filter papers were collected and analyzed Each of these installations had Csrdquorsquo total alpha and total beta quantities measured on the filter papers resulting in 42 data points Eight of the measurement results were very low and had errors of gt+-loo These values were not used resulting in a net of 34 data points for calculating average head space mass concentrations based upon CGM data
Calculated Tank Head Space Radionuclide Concentrations
To calculate the average tank head space radionuclide concentrations during RMCS the filter paper radionuclide quantities were first divided by an efficiency factor to account for radionuclides which may not have been captured on the paper This adjusted radionuclide value was divided by the volume of tank air passing through the paper to give the average tank head space radionuclide concentration
The efficiency used for most stack samplers onsite is 73 (see Appendix D) Estimates attached to References CGM-I to CGM-9 indicate the CGM filter paper sampling method used should have a sampling efficiency
c- 1
RPP-4826 Rev 1
exceeding 73 For conservatism a sampling efficiency of 50 was assumed in this document for the CGM filter paper method
The estimated Csrdquorsquo total alpha and total beta concentrations in the tank vapor space were calculated by dividing the radionuclide quantity on the filter paper from Table C-2 by the assumed CGM sampling efficiency of 05 and the volume of gas going to the CGM The volume of gas going to the CGM was calculated by multiplying the time of CGM operation from Table C-2 by the CGM flow rate of 500 mlmin For example the calculated SX- 101 head space C~rsquorsquo~concentration based upon analysis of the CGM filter papers used during RMCS of riser 19 is
[[26E-4 pCi + 051 + [[I755 min][500 mlmin]] = 59E-I0pCiml
All radionuclide concentrations were calculated in a similar fashion Results are given in Table C-3 Table C-3 lists the radionuclide concentrations for all 42 data points The eight radionuclide concentrations not used for estimating mass concentrations are noted
Table C-3 also contains the calculated number of tank head space changeouts by the tank exhauster during CGM operation Tank head space changeouts were calculated by multiplying the exhauster flow rates (in actin) from Table F-1 by the CGM run times from Table C-2 and dividing by the tank head space volumes from Table F-2 The number of tank head space changeouts during CGM operation was used when estimating the waste mass sent to the exhauster See Aerosol Calculations section below for explanation
Aerosol Calculations
Average tank head space mass concentrations based upon CGM filter paper data were calculated by dividing the head space radionuclide concentrations from Table C-3 by the waste specific activities for each tank sampled The waste specific activities used came from Table E-I and are listed again in Table C-I The average of the mass concentrations based upon radionuclide data for each tank was used as the average head space mass concentration for that tank For example the calculated SX-IO1 head space mass concentration analysis from the CGM filter papers used during RMCS of riser 19 is
[59E-10 pCi Csrdquorsquoml+ 112 pCi C S rdquo ~ ~ waste] [ 28317 mlftrsquo] = 1 SE-7 g wasteA3 based upon C S rdquo ~
[ I 7E-I I pCi T A M + 504E-1 pCi TAg waste] [ 283 17 mlftrsquo] = 94E-7 g wasteamprsquo based upon Total Alpha
[43E-9 pCi TBml+ 357 pCi TBg waste] [ 28317 mlArsquo] = 34E-7 g wastel based upon Total Beta
[ [ I 5E-7 + 94E-7 + 34E-7 g wasteArsquo] f 31 = 48E-7 g wasteamp
[48E-7 g wastelt ] [3531467 Arsquom3] = 17E-5 g wastemrsquo
All tank head space mass concentrations were calculated in the same manner The results are presented in Table C-4 The weighted average tank head space mass concentration during RMCS was based upon the number of RMCS segments taken for each data point
The average aerosol mass in the head space during RMCS was calculated by multiplying the average tank head space mass concentration by the tank head space volume from Table F-2 For the same data point as above
[48E-7 g waste Arsquo] [115E+5 Arsquo] = 55E-2 g waste in SX-IO1 head space during RMCS
All average mass quantities present in the tank head space during RMCS were calculated in the same manner using a spreadsheet The results are provided in Table C-4 The weighted average mass of waste in a tank head space in Table C-4 was calculated based upon the number of segments obtained for each data point
Estimation of the mass of waste sent to the exhauster per RMCS core or segment requires calculation of the total mass of waste sent to the exhauster Multiplying the average head space concentration during RMCS by the exhauster flow rate (in acfm) and the time of CGM operation will give the mass of waste sent to the exhauster during the CGM time frame only While the large majority of mass of waste aerosols will have exited the tank or
c -2
RPP-4826 Rev I
resettled by the time the CGM is shut off there could be some residual suspended particles remaining These would eventually pass to the exhauster but would not be picked up by the CGM filter since it was not in service An adjustment factor was used as described in the following paragraphs to account for particles that may exit to the exhauster following shut down of the CGM
Particulates are generated by RMCS when purge gas is blowing out the drill string and the bit is rotating under the waste surface This time averages about six minutes per segment Multiplying the number of RMCS segments per core by six minutes per segment and dividing by the number of minutes of CGM operation shows the creation of particulates will only occur during a nominal 3-4 of the time the CGM is operating During RMCS the normal practice is to install the CGM turn it on when personnel enter a tank farm and keep the unit in constant operation for the remainder of the shift When the portable RMCS exhauster is used the exhauster is normally started at least an hour before RMCS is initiated and kept in operation until it is time to halt operations for the week The SX exhauster is kept in constant operation Comparing exhauster operating times from Tables F-l with CGM operating times from Table C-I it can be seen the CGMs are in operation about 3-15 of the time the RMCS exhauster is operating on a tank This time comparison wasnrsquot estimated for the SX exhauster since the SX exhauster is in constant operation
With CGM operation much longer than the time period when particulates could be generated the majority of particulates generated by RMCS should have settled or been exhausted during the CGM operating period Table C-3 shows the tank head space changeouts made by the exhauster during CGM operating periods ranged from 084 to 63 The average was 24 With the CGMs operating 25-33 times longer than the aerosol generation periods and an average of over two tank head space changeouts during CGM operation the large majority of aerosols generated during RMCS will have settled out or been removed by the exhauster by the time the CGM is shut off To account for particulates remaining in the tank head space after the CGM was turned off that are subsequently removed by an exhauster it was conservatively assumed that 20 of the total mass of particles generated during RMCS were not removed from the tank head space during the CGM operating period Therefore the product of the tank head space concentration and the volume of air sent to the exhauster during the time of CGM operation was multiplied by a factor of 125 (lOOl80) to estimate the total mass of waste sent to the exhauster as a result of RMCS This is shown below for the same SX-IO1 riser 19 data point in the above calculations
[48E-7gA3] [IOOmin] [I755 min] [125]= 11E-l gwastetoexhauster
This value was divided by the number of RMCS cores and RMCS segments from Table C-1 to provide the grams per core and grams per segment in Table C-4 as follows
[ I I E- 1 g waste to exhauster] i 1 core = 11 E-I g wastelRMCS core to exhauster
and
[ 1 I E- 1 g waste to exhauster] + 5 segments = 2 I E-2 g wastelRMCS segment to exhauster
All mass per core and mass per segment values were calculated in the same manner using a spreadsheet The results are provided in Table C-4 The weighted average mass per core and mass per segment in Table C-4 were calculated based upon the number of cores or segments obtained for each data point
Summary of Calculations
There were 34 valid CGM filter paper data points from 14 RMCS CGM sampling periods in eight tanks during which I5 RMCS cores and 79 RMCS segments were obtained Based upon CGM filter paper data the results indicate that
The average tank head space mass concentration during RMCS was 4OE-5 g wastem3 The average mass of suspended solids in the tank head space during RMCS was 97E-2 g waste The average mass sent to the exhauster during RMCS was 18E-1 g wastelRMCS core The average mass sent to the exhauster during RMCS was 34E-2 g wastelRMCS segment
c - 3
RPP-4826 Rev 1
Ignoring all CGM filter paper analytical data points with a variance gtloo will result in conservative results These data points indicate negligible radioactivity was present If a value of zero was assigned to each data point with an analytical error of gtloo instead of ignoring the data point the weighted average particulate quantities in Table C-4 would be reduced by about 12
The average tank head space mass concentrations based upon CGM data will be higher than the average tank head space mass concentrations based upon filter housing NDA or dose rate The RMCS exhauster received tank air from the shifts when sampling was performed and during some of the off-shifts when no sampling was done The CGMs were only operated during the shifts when sampling was performed The air concentration drawn into the CGM and the RMCS exhauster should be roughly the came during the operating shifts but somewhat less during the off-shifts Therefore the tank head space concentration will be higher when based upon CGM data This does not impact the mass of waste sent to the exhauster per core or per segment
c -4
I
- ~
RFP-4826 Rev 1
APPENDIX D
ESTIMATION OF Rh4CS EXHAUSTER HOUSING DECONTAMINATION FACTOR
D-0
RFrsquoP-4826 Rev 1
APPENDIX D - Estimation of RMCS Exhauster Housing Decontamination Factor
Summary of Method
This Appendix estimates a Decontamination Factor (DF) for the RMCS exhausters using housing NDA data and applicable stack record sample data The Csrdquorsquo in the exhauster effluent is divided by the C S rdquo ~ in the exhauster inlet to provide a penetration efficiency The reciprocal ofthe penetration efficiency is the DF
Description
Each RMCS exhauster has an isokinetic sampler located on the stack downstream of the blower and HEPA filters A small pomp pulls air from the exhaust stack into a filter paper at a rate proportional to the exhaust flow Radionuclides in the exhaust stream passing through the sample line are caught on the filter paper The stack operating time and flow rate are recorded When the record sample filter paper is removed the filter paper is analyzed in a laboratory for radionuclides The radionuclide concentration in the stack effluent stream is calculated by dividing the quantity of material on the filter paper by the volume of air through the sampler and then dividing again by a factor to compensate for stack sampler and filter paper efficiency
Multiplying the total beta stack effluent concentration by the total off gas flow gives the total beta emissions from the exhauster The total beta emissions are multiplied by the Csrdquorsquo to total beta ratio for the waste in the tank) being exhausted to give an estimate of the C S rdquo ~ emission The C S rdquo ~ on the filters determined by NDA of the housing (see Appendix A) is added to the C S rdquo ~ emissions to give the total C S rdquo ~ input to the filter housing Dividing the emissions by the input gives the filter housing penetration efficiency Subtracting the penetration efficiency from 1 O gives the filter housing efficiency Dividing 1 O by the penetration efficiency gives the DF
RMCS Stack Record Sample Data
RMCS exhauster stack record samples are taken after completion of each sampling event on a tank Normally this is after all cores on that tank have been obtained but for BY-IO5 in 1998 record samples were taken following each core Record samples are also taken at the end of each year All samples are analyzed for total alpha and total beta At the end of each year all the filter papers for that year are composited and analyzed for individual radionuclides Sample results are entered into the Automated Bar Coding of Air Samples at Hanford (ABCASH) and Environmental Release Summary (ERS) databases Several ofthe filter papers from 1998 were reanalyzed using a longer count time to bring the error rate down
Schofield 2000b compiled and evaluated all available RMCS exhauster stack record sample data filtered out the unusable data provided derivation for the stack sampling efficiency factor and summarized the results Most of the data points were so low as to be unusable since the results were either negative or had error variances gtloo
Column 5 of Table D-1 provides the stack effluent concentrations used for calculation of the filter housing DF The stack effluent data in Table D-l come from Schofield 2000b These values include a 073 sampling efficiency factor
Calculation of RMCS Filter Housing Decontamination Factor Based upon Housing Inlet and Outlet Data
The RMCS exhauster housing NDA and stack record sample data available for exhauster Operating Periods 4 5 and 6 were used to estimate an actual DF for the RMCS exhauster housings The housing NDA data is for CSrdquo~ but there are no usable Csrdquorsquo concentrations for the RMCS exhauster outlet The RMCS exhauster stack Csrsquordquo concentrations are either negative have a variance gtloo or are not available Total beta analyses are available however so the stack eftluent C S rdquo ~ concentrations were estimated by multiplying the total beta concentration by the ratio of Csrdquorsquo to total beta in the tank waste
Column 2 of Table D-l lists the increase in CSrsquo~ on the filters for each operating period as determined by NDA This data was obtained from Table A-2
D- 1
RPP-4826 Rev 1
Column 4 of Table D-l lists the stack exhaust volume for each stack record sample period The stack exhaust volume for the exhauster installation on S-l IO was calculated by
[ZOO std ft3min][15978 hrs] [60 minhr] = 199E+6 std ftrsquo
All other stack volumes in Table D-l were calculated the same way Unlike in Appendices A B and C no adjustment was made to change the 200 scfm to actual cfm This is because the RMCS stack record sample concentrations from Table D-3 are based upon a 200 scfm flow rate rather than the actual flow rate Since the concentrations are on the same basis as the flow rate there is no need to correct to acfm
The total beta emissions for the RMCS exhauster stack were calculated by multiplying the volume by the concentration For the same S-l IO data point
[199E+6 ft3] [18E-15 pCiml] [28317mlft3] [mCi1000 pCi] = 1OE-7 mCi total beta
All other total beta emissions in Table D-l were calculated the same way
The Csrdquorsquo to total beta ratio was calculated from data in Table E-I For the same S- l I O data point
326E+5 Ci CsI3rsquo f I 14E+6 Ci total beta = 029 Ci CslhCi total beta = 029 rnCi CsrdquorsquomCi total beta
The Csrsquordquo emission for the same S-l IO data point was thus
[I OE-7 mCi total beta] [029 mCi CsrdquorsquomCi total beta] = 29E-8 mCi Csrdquorsquo
All Csrsquordquo emissions in Table D-l were calculated in the same manner
The penetration efficiency for each operating period was calculated by dividing the exhauster outlet by the filter inlet Csrdquorsquo quantities For operating period 4 this was
[81E-6 mCi] f [5OE-I + 8IE-6 mCi] = 16E-5 = 16E-3
The DF for operating period 4 is
1 + 16E-5 = 62E+4
The overall DF for periods 4 5 and 6 was calculated by dividing the efluent from all three periods by the total filter input
[95E-6 mCi] f [67E-I t 95E-6 mCi] = 14E-5 = 14E-3 penetration efficiency
I - I 4E-5 = 0999986 = 999986 filter efficiency
1 f 14E-5 = 73E+4 decontamination factor based upon housing inlet and eftluent data
Estimation of Housing Decontamination Factor Based upon General Performance Data
HEPA filters are tested at the manufacturer to a minimum 9997 efficiency using a 03 pm monodisperse aerosol After installation HEPA filters are tested in-place per ASME N5 I O to a minimum 9995 efficiency using a polydisperse aerosol with an approximate droplet size distribution of 99 less than 30 pm 50 less than 07 pm and 10 less than 04 pm The RMCS exhauster housing is tested per ASME N510 and is thus required to have a minimum removal eficiency of 9995 for an aerosol with this approximate size distribution The particle size distribution of the waste aerosols generated by RMCS is unknown but it is assumed that the removal efficiency for RMCS generated aerosols was the same as the removal efficiency for the ASME generated test aerosol
D-2
RPP-4826 Rev I
A 9995 efficiency is equivalent to a DF of 2E+3 while a 9997 efficiency is equivalent to a DF of 33E+3 The actual DF for the RMCS exhauster housing is higher than either of these It has two HEPA filters in series even though the minimum efficiency specified in the NOCs for the RMCS exhausters is only equivalent to one HEPA ERDA 1976 recommends using a DF of 3000rdquo for a filter bank where n is the number of HEPA filters in series This would result in a DF of 9E+6 for the RMCS exhauster housing This is unrealistic Using a DF of 9E+6 will calculate to Csrdquorsquo quantities on the HEPA filtersthat are orders of magnitude above what have been shown to be there based upon the measured dose rates and NDA A DF of 9E+6 would mean the dose rate would have to be almost 100 mRhr at the side of the exhauster housing instead of the 05-08 mRhr dose rates encountered The waste particles will not have the same particle size distribution entering the second HEPA filter as when entering the first The majority of the waste particles will be captured on the I rdquo HEPA filter and although the DF for each HEPA if tested individually using the ASME N5 IO aerosol test method may be 3E+3 (or higher) the overall DF of the two filters in series will not be 3000lsquo This is because the particle size distribution entering the Znd HEPA could have a greater percentage of smaller particles than that entering the 1rdquo
NUREG 1995 included an evaluation of a number of different facility stacks at the Hanford site where the HEPA filter upstream air concentrations were estimated using several different methods This report concluded that back-calculation using a value of 3000rdquo overestimated the upstream radionuclide concentration by three to four orders of magnitude when compared to filter NDA data for the nine stacks for which NDA data were obtained and by three orders of magnitude for the two stacks for which upstream air sample data were available Back- calculation using a value of 3000rdquo was shown to be high by four orders of magnitude for the single stack for which a powder release estimate was available Based upon this information the RMCS exhauster dual filter-in-series housings would have a DF of at least three and maybe four orders of magnitude less than 9E+6 or in the 1E+3 to 1 E+4 range A DF of IE+3 would he less than the minimum permissible under the NOC Comparing the older stack data and design with the newer RMCS exhauster design the minimum DF would be expected to be at least 1E+4
Table D-2 provides the available RMCS exhauster aerosol test data This information was obtained from Waldo 1999 Prior to 1998 the RMCS exhauster primary HEPA filter efficiency and either the secondaly HEPA filter or the overall efficiency for both filters were tested Starting in 1998 only the primary and secondary HEPA filter efficiency were measured The overall efficiency of the two filters in series was only measured three times in 11 setups Twice the overall penetration efficiency was lt0002 and the remaining time the only information that could be found was a value of lt005 Most individual filters had a penetration efficiency of 0002 This appears to be about the limit of the detection equipment Based upon Table D-2 data a penetration efficiency of 0002 (99998 efficiency) is normal for a single HEPA and thus a minimum for an RMCS exhauster housing Assuming a 0002 penetration efficiency for the two filters combined calculates to a DF of 5E+4 (equal to 1 +
000002) for the RMCS exhauster housing
In summary the measured DF for the RMCS exhauster housings over the period from May 1998 through June 1999 was about 73E+4 RMCS aerosol testing prior to use indicates a DF of about 5OE+4 for each of the filters separately but their overall efficiency is not measured Referenced data based on older stacks at Hanford indicate the two HEPA RMCS exhauster housing would likely have a DF of at least IE+4
Estimated Aerosol Levels During RMCS Based Upon RMCS Stack Record Sample Data
Revision 0 of this document used the positive record sample results with variance less than 100 to estimate aerosol concentrations in the exhauster inlet using an assumed exhauster housing DF of 5OE+4 This method of estimating aerosols was eliminated from Revision 1 because the stack concentrations were either too low too scattered or too questionable to provide reliable results There were 112 RMCS stack record sample data points evaluated in Schofield 2000b Excluding the total beta sample results used for estimation of the housing DF there were only ten data points remaining with positive values and variances ltloo the remaining data points were either negative had a variance gtloo or the results were not available
For comparison purposes only Schofield 2000b applied the DF of 73E+4 calculated in this document to the data points not used to calculate the exhauster housing DF to estimate aerosol concentrations upstream of the filters The results showed aerosol levels approximately the same as those estimated using NDA dose rate or CGM filter paper data when a value of zero was used for negative sample results or those with a variance gtloo When only
D-3
RPP-4826 Rev 1
the ten positive results with a variance ltloo were used the aerosol levels calculated to be two to five times higher than those estimated using NDA dose rate or CGM filter paper data Because of the variability of data resulting from the extremely low record sample concentrations and the few useable data points estimation of aerosol levels using record sample data was not included in Revision I See Schofield 2000b for further discussion of the use of record sample data to estimate aerosol levels
Summary of Calculations
A total of nine RMCS exhauster stack record sample data points were used to estimate the RMCS exhauster filter housing decontamination factor These data points were obtained when sampling on five tanks during which 10 RMCS cores and 65 RMCS segments were obtained The overall decontamination factor was 73E+4
Estimation of aerosol generation quantities based upon RMCS stack record sample data is possible However results will likely be skewed high if data points that show non-detectable levels of radionuclides present are ignored instead of using a value of zero for the data point
D-4
RPP-4826 Rev 1
APPENDIX E
TANK WASTE RADIONUCLIDE CONCENTRATIONS USED FOR AEROSOL CALCULATIONS
E-0
RPP-4826 Rev 1
APPENDIX E - Tank Waste Radionuclide Concentrations Used for Aerosol Calculations
The RMCS exhauster NDA data HEPA filter dose rate data CGM filter paper data and stack record sample data provide information on the quantity of radionuclides on the exhauster filters in the tank head space or the exhauster stack during RMCS These radioactivity quantities need to be divided by the waste radionuclide concentration specific activity to determine the mass of waste in the tank head space and in the tank gases sent to the exhauster
The mass quantities in this document were calculated using dry basis radionuclide concentrations Waste particles carried into the tank head space by the purge gas could be wet or dry If wet some of the non-chemically bound water will start to evaporate immediately providing the tank relative humidity is 400 The water present in a waste particle may be chemically bound as a hydrate or free The chemically bound water will not readily evaporate therefore even a ldquodryrdquo particle may have some water associated with it It is impractical to measure the actual water content of the waste particulates caught on the CGM filter paper the exhauster HEPA filters or the stack record sample paper Since the quantity of water in the waste particulates is unknown particulate levels were calculated using dry basis radionuclide concentrations Thus all particulate values given in this document are stated on a dry basis
The waste radionuclide concentrations on a dry basis were calculated from data available in the Tank Waste Information Network System (TWINS) The Best Basis InventorylBest Basis Summary numbers were used These values are the most complete and up to date readily available estimates for Hanford waste tank contents but do not include water The information was downloaded from TWINS into a spreadsheet The total chemical total beta and total alpha quantities were summed in the spreadsheet for all the tanks which were sampled and concentrations for Csrdquorsquo Sr9rsquo total beta and total alpha automatically calculated in pCig These concentrations are provided in Table E-I Because lab techniques for measuring gross beta levels only detect beta particles with a minimum decay energy above 150-200 kev only radionuclides with a decay energy of gt-200 kev were included in the total beta numbers
The TWINS radionuclide concentrations were obtained in December 1999 No corrections were made for decay for this document
The CGM filter paper and stack record sample data indicate the measured radionuclide values are not always in the same ratio to each other as given by TWINS nor are all radionuclides detected that TWINS indicates are present Radionuclides can be distributed unevenly in a tank Soluble fission products (primarily Csrsquordquo) are found in the liquid saltcake and in sludges Insoluble fission products and actinides are found largely in sludges as these are primarily chemical precipitates Sludge could be mixed with saltcake be present in a distinct layer at the bottom of a tank or in several layers in the tank depending upon how waste was transferred into a tank Waste particles may thus not have the same specific activity on a microscopic scale as they would have on a macro scale were the tank contents homogenized During RMCS a top to bottom core sample is attempted resulting in the drill bit and purge gas (which causes aerosols to form) passing through most ofthe waste matrix Assuming the aerosol generation rate is approximately constant during drilling the specific activity of a radionuclide in the suspended solids should be roughly the same as the average specific activity of the same radionuclide in the tank waste While the waste specific activity is probably not homogeneous from top to bottom in a tank and the aerosol generation rate will likely also vary it is beyond the scope of this document to provide an in-depth analysis of all the factors affecting aerosol radionuclide concentration Although sample radionuclide data were not always in the same ratio as provided by TWINS for the purpose of this document the simplifying assumption was made that the average tank specific activity is adequate to provide an approximation of the suspended solids specific activity for all radionuclides Average tank individual radionuclide specific activities were used in the preparation of the exhauster NOCs
The aerosol calculations presented in this document are only as accurate as the TWINS data The combined radionuclide content of all Hanford waste tanks is known fairly well since the overall content is based upon reactor production records CsrdquorsquoSrW recovery data and processing plant discharges Thus TWINS data for all tanks combined should be reasonable There are undoubtedly differences between TWINS data and the actual contents of a specific tank While the specific tank radionuclide data from TWINS used in this document may not be exact deviations from the actual concentrations are assumed to balance out over the number of tanks sampled
E- 1
RPP-4826 Rev 1
APPENDIX F
ROTARY MODE CORE SAMPLING EXHAUSTER AND CORE SAMPLE DATA
F-0
RPP-4826 Rev 1
APPENDIX F - Rotary Mode Core Sampling Exhauster and Core Sample Data
This appendix provides the basic data obtained during RMCS operations which was used in preparation of this document
Basic Operational Data
There have been three RMCS exhausters and three RMCS sampling trucks deployed since starmp of nitrogen- purged RMCS in November 1994 The exhausters are formally designated 296-P-32296-P-33 and 296-P-34 These were originally referred to as parts of RMCS Systems 2 3 and 4 respectively in the Notices of Construction (NOC) for these units The exhauster designations were changed for routine field use in 1996 to exhausters A B and C to avoid confusion with core sampling trucks 23 and 4 since any exhauster could be used with any RMCS truck Exhauster A (2) and RMCS Truck2 have not been used for RMCS since 1995 and are no longer in service for core sampling
Rotary mode core sampling has been conducted in four general time frames since 1994 These time frames were separated by down times for equipment modifications or resolution of environmental permitting and safety concerns For ease of analysis in this document exhauster operations were organized into six distinct operating periods Periods I to 6 were grouped based upon times when the same exhauster and same set of HEPA filters were being used These periods thus overlap with the general operating time frames The four operating time frames were
The first time frame lasted from November 1994 to January 1995 RMCS Truck 2 and Exhauster 2 (A) were used on Tank BY-106 along with an in-tank prefilter This tank provided the initial deployment and testing of the nitrogen-purged equipment in a waste tank During this period radiation dose rates were taken at the side of the exhauster housing Stack record samples were taken in December 1994 and January 1995
The second time frame lasted from July 1995 through October 1995 RMCS Trucks 2 and 4 were used with Exhausters 2 and 3 (A and B) on BY-105 BY-IO8 and BY-I IO During this period radiation dose rates were taken at the sides of the exhauster housings Stack record samples were taken after completion of sampling on each tank No RMCS samples were taken from BY-108 all samples were taken in push mode for this tank
The third time frame began when RMCS was restarted in December 1997 Trucks 3 and 4 were used for sampling of SX-101 SX-103 SX-105 and SX-102 with the SX tank farm exhauster providing ventilation The RMCS exhausters were not used During this period radiation dose rates were taken at the sides of the SX exhauster housing as part of HPT routine surveys SX farm exhauster stack record samples were taken when required by normal operating procedures SX record sampler and filter housing dose rate data were not evaluated for this document It would not be practical using filter dose rate or stack record sample data to estimate the RMCS aerosol addition if any to the SX ventilation system The background radiation around the SX filter housing makes measurement of any small increase in dose rate very difficult to detect The number of tanks being ventilated and the involved off-gas header routings (the exhauster is pulling on thirteen tanks in series or in parallel with the tank being sampled) and any in-tank activities in the SX tanks not being sampled would make it impractical to assess what aerosols resulted from RMCS Beginning with RMCS in SX farm radionuclide analyses were performed on the filter papers protecting the CGMs which draw air out of the tank vapor space for flammable gas detection
The fourth time frame began in May 1998 Between 1095 and 598 Exhausters B and C were extensively modified with new filter housings and other equipment to meet new NOC requirements Trucks 3 and 4 were used with Exhausters B and C (3 and 4) on S-l IO U-107 BY-105 TX-113 and TX-I 18 This period marked the first use ofthe RMCS trucks and RMCS exhausters together following resolution of flammable gas concerns and modifications to the exhausters New filters were installed Radiation dose rates were taken at the sides of the exhauster housings Stack record samples
F- 1
RPP-4826 Rev I
were taken after completion of sampling for each exhauster installation Radionuclide analyses were performed on the CGM filter papers for all tanks except TX-118 An NDA was performed on the Exhauster C housing following completion ofthe first core on TX-I 13 The housing filters when assayed contained aerosols captured by the exhauster following RMCS in S-l IO U-107 BY-105 (1998) and the first core of TX-I 13 Another NDA was performed on Exhauster C following both cores in TX-I 18 An NDA was performed following sampling of the second core in TX-I 13 using Exhauster B The time frame ran through early June 1999 No RMCS samples have been taken after June 1999 nor are any planned for the next few years
For the purposes of evaluating aerosol formation based upon RMCS exhauster housing NDA and dose rate data the exhauster operations were grouped into 6 operating periods These periods are shown in Table F-1 and restated in Tables A-I and B-I All tanks sampled in Periods 1 2 4 5 and 6 were exhausted by the same exhauster with the same housing and filters present during that period Period 3 covered the time the SX exhauster was used during RMCS in SX farm
A brief description of each RMCS tank sampling operation is provided below
Tank 241-BY-1061194 to 1294 RMCS using the nitrogen purge gas system with an exhauster was formally begun on 111794 on tank BY-106 riser IOB Exhauster 2 (A)and Truck 2 were used A sintered metal prefilter was inserted in the riser between the tank and the exhauster A total of eight segments were taken in rotary mode and five segments in push mode until sampling was halted on 122194 One RMCS core was obtained The total exhauster run time was 4878 hours The stack record sample was removed and analyzed following this run period Dose rates taken at the side of the exhauster housing during RMCS were all lt05 mRhr The in-tank prefilter was smeared for contamination when removed from the tank with the smears showing less than detectable levels of radionuclides present (Waldo 1999) The prefilter had been washed with an installed spray system prior to removal from the tank but subsequent testing showed the water flow and pressure were too low to have been effective at removing contamination
Tank 241-BY-106195 Following some process modifications RMCS in BY-IO6 riser IOB began again on 11895 Exhauster 2 (A) and Truck 2 were used The sintered metal prefilter was inserted in the riser between the tank and the exhauster RMCS was halted on 12495 over authorization basis and equipment operability issues for RMCS A total of three segments were taken in rotary mode and eleven segments in push mode One RMCS core was obtained The total exhauster run time was 1867 hours The stack record sample was removed and analyzed following this run period Dose rates taken at the side of the exhauster housing during RMCS were all lt O S mRhr The in-tank prefilter was smeared for contamination when removed from the tank with the smears showing less than detectable levels of radionuclides present (Waldo 1999) The prefilter was not washed this time
Tank 241-BY-110795 to 1095 Following resolution of RMCS authorization basis and equipment issues and completion of the fabrication and testing of Trucks 3 and 4 RMCS was begun in BY-I IO on 71195 Exhauster 2 (A) and Truck 2 were used Samples were taken from risers 128 7 128 again and 4 There was no in- tank prefilter used in this or any subsequent RMCS periods Sampling was performed until 102595 when RMCS was halted over flammable gas issues A total of 13 RMCS segments and 56 PMCS segments were taken Three RMCS cores were obtained The total exhauster run time was 1125 hours The stack record sample was removed and analyzed following this run period Dose rates taken at the side of the exhauster housing during RMCS were all lt O S mRhr
Tank 241-BY-108795 to 895 Core sampling was begun in BY-IO8 on 72595 Exhauster 3 (B) and Truck 4 were used Sampling was done in risers 12A and 7 The tank material proved soft enough so that no RMCS segments were required all segments were obtained in push mode although the exhauster was operated during part of the time sampling was performed Sampling was completed 81895 A total of 16 PMCS segments were taken The total exhauster run time was 6617 hours The stack record sample was removed and
F-2
RPP-4826 Rev 1
analyzed following this run period Dose rates taken at the side of the exhauster housing during RMCS were all lt05 mRhr
Tank 241-BY-105895 to 1095 RMCS was begun in BY-I05 riser 12A on 83095 Exhauster 3 (B) and Truck 4 were used This tank has a concrete layer on top about 12-18 inches thick which had to be drilled through Part way through sampling questions arose as to the flammable gas status of the tank and RMCS was halted on 10695 A total of 3 RMCS and 7 PMCS segments were taken One RMCS core was obtained The total exhauster run time was 4413 hours The stack record sample was removed and analyzed following this run period Dose rates taken at the side of the exhauster housing during RMCS were all lt05 mRhr
Tank 241-SX-1011297 to 298 Following resolution of extensive regulatory and authorization basis issues and installation of equipment modifications RMCS started in SX-101 with Truck 4 on 12497 An RMCS exhauster was not used since all SX farm tanks excluding SX-113 and SX-I 15 are ventilated with the SX exhauster Sampling was performed in risers 19 and 4 and was completed on 21098 A total of 9 RMCS and 6 PMCS segments were taken Two RMCS cores were obtained SX exhauster stack record samples and filter housing dose rates were obtained as part of routine operations for the SX exhauster not as part of the RMCS process Filter papers used in the suction line for the CGM were saved and analyzed in the laboratory to estimate the airborne radionuclide concentration in the tank head space Two CGM filter papers were needed for each core as moisture in the tank vapors condensed on the papers in the cold weather and began to restrict tank gas flow to the CGM
Tank 241-SX-103498 to 598 RMCS started in SX-103 with Truck 4 on 42798 The SX exhauster was used for ventilation (see SX- 101 above) Sampling was performed in risers 7 and 1 1 and was completed on 51198 A total of 6 RMCS and 18 PMCS segments were taken Two RMCS cores were obtained During sampling filter papers used in the suction line for the CGM were saved and analyzed in the laboratory to estimate the airborne radionuclide concentration in the tank head space One CGM filter paper was used during each core SX exhauster stack record samples and filter housing dose rates were obtained as part of routine operations for the SX exhauster not as part of the RMCS process
Tank 241-SX-105298 to 598 RMCS started in SX-105 with Truck 3 on 22598 The SX exhauster was used for ventilation (see SX- 101 above) Sampling was performed in risers 6 and 14 and was completed on 51598 A total of 6 RMCS and 20 PMCS segments were taken Two RMCS cores were obtained During sampling filter papers used in the suction line for the CGM were saved and analyzed in the laboratory to estimate the airborne radionuclide concentration in the tank head space Two filter papers were needed for the first core as moisture in the tank vapors condensed on the papers in the cold weather and began to restrict tank gas flow to the CGM One filter paper was used for the second core SX exhauster stack record samples and filter housing dose rates were obtained as part of routine operations for the SX exhauster not as part of the RMCS process
Tank 241-SX-102698 to 798 RMCS started in SX-102 with Truck 4 on 61798 The SX exhauster was used for ventilation (see SX- 101 above) Sampling was performed in risers 8 and 4 and was completed on 7798 A total of 2 RMCS and I8 PMCS segments were taken Two RMCS cores were obtained During sampling filter papers used in the suction line for the CGM were saved and analyzed in the laboratory to estimate the airborne radionuclide concentration in the tank head space One filter paper was used for each core SX exhauster stack record samples and filter housing dose rates were obtained as part of routine operations for the SX exhauster not as part of the RMCS process
Tank 241-S-110598 to 698 RMCS was begun in S-I10 on 51898 Exhauster C (4) and Truck 3 were used This tank marked the first use of an RMCS exhauster since 1995 Sampling was completed on 6498 Risers 6 and 14 were sampled A total of IO RMCS and 8 PMCS segments were taken Two RMCS cores were obtained The
F-3
RPP-4826 Rev I
total exhauster run time was 15978 hours The stack record sample was removed and analyzed following this run period Dose rates taken at the side of the exhauster housing during RMCS were all lt05 mRhr During sampling filter papers used in the suction line for the CGM were saved and analyzed in the laboratory to estimate the airborne radionuclide concentration in the tank head space One filter paper was used for each core Waste particles retained on the exhauster housing filters were part of the inventory subsequently measured by NDA following completion of the first core in TX-I 13
Tank 241-U-107698 to 798 RMCS was begun in U-107 on 61098 Exhauster C and Trucks 3 and 4 were used Sampling was completed on 71598 Risers 7 and 2 were sampled A total of IO RMCS and 19 PMCS segments were taken Two RMCS cores were obtained The total exhauster run time was 27385 hours The stack record sample was removed and analyzed following this run period Dose rates taken at the side of the exhauster housing during RMCS were all 105 mRihr During sampling filter papers used in the suction line for the CGM were saved and analyzed in the laboratory to estimate the airborne radionuclide concentration in the tank head space One filter paper was used for each core Waste particles retained on the exhauster housing filters were part of the inventory subsequently measured by NDA following completion of the first core in TX-I 13
Tank 24l-BY-105798 to 898 RMCS was begun in BY-105 again on 72298 Exhauster C and Trucks 3 and 4 were used Sampling was completed on 82598 Risers 7 and 1 1 B were sampled A total of 18 RMCS and 18 PMCS segments were taken The material was hard enough to require rotary mode sampling all the way to the bottom of the waste but negligible recovery was obtained After RMCS was performed to the waste bottom a PMCS core was taken in the same hole to recover material Two RMCS cores were obtained The exhauster run time was 13577 hours for the first RMCS core and 30792 hours for the second RMCS core Stack record sample information in ABCASH shows 30558 hours operation for the second core but the sampler data sheet shows the time counter was mistakenly reset 234 hours into the run No correction was made to the BY-IO5 2nd core record sample concentration for this document since the error is conservative and results in only slightly higher (ltI) record sample radionuclide concentrations for this core A stack record sample was removed and analyzed following each core giving two record samples for BY-IO5 in 1998 Dose rates taken at the side of the exhauster housing during RMCS were almost all lt05 m R h but a few readings indicated 07 mRihr This variation was assumed due to personnel reading the instrument differently or the fact that the exhauster had been used on enough tanks that by now there was sufficient activity on the filters to cause readings approximately at the background detection level The final reading when both cores were completed was lt05 m R h During sampling filter papers used in the suction line for the CGM were saved and analyzed in the laboratory to estimate the airborne radionuclide concentration in the tank head space One filter paper was used for each core Waste particles retained on the exhauster housing filters were part of the inventory subsequently measured by NDA following completion of the first core in TX-113
Tank 241-TX-113998 to 599 Core sampling was begun in TX-I 13 riser 3 on 92298 Exhauster B (3) and Truck 4 were used at the start This was the first use of Exhauster B since it was modified Exhauster B ran for a total of 8738 hours until being disconnected on 102398 During this time two PMCS segments were taken and no RMCS segments Exhauster C was then installed and operated for 5598 hours from 121098 to 122898 No RMCS or PMCS sampling was performed during this time frame RMCS segments werent taken until 299 Exhauster C ran for a 30230 hours between 122898 and 21299 Sampling was completed on the core from riser 3 on 21299 A total of 12 RMCS segments were obtained during the time Exhauster C was operating Exhauster flow rate for both exhausters was a nominal 200 scfm Stack record samples were taken following Exhauster B removal at the end of 1998 for Exhauster C and following completion ofthe first core with Exhauster C Aerosol calculations were based on only the 30230 hours run time for Exhauster C in 1999 since this was the time period during which RMCS segments were obtained Dose rates taken at the side of the exhauster housing during the short PMCS only sampling period with Exhauster B were all ltOS m R h Dose rates with Exhauster C varied between lt O S mRhr and 07 mRhr The final reading on Exhauster C following completion of the first core was 07 mFUhr During sampling filter papers used in the suction line for the CGM were saved and
F-4
RPP-4826 Rev I
analyzed in the laboratory to estimate the airborne radionuclide concentration in the tank head space One filter paper was used for the core Waste particles retained on the exhauster housing filters were part of the inventory subsequently measured by NDA following completion of this core
Sampling in riser 5 was begun on 41299 using Exhauster B and Truck 3 A total of 6 RMCS and 1 PMCS segments were taken for this core before sampling was halted on 42899 The total exhauster run time for this core was 11712 hours Problems with high vacuum in the tank required the exhauster flow rate to be reduced to 190 scfm to keep the system within pressure limits The stack record sample for the second core was removed and analyzed following the run period Dose rates taken at the side of the exhauster housing during the second core were all lt05 m M r During sampling filter papers used in the suction line for the CGM were saved and analyzed in the laboratory to estimate the airborne radionuclide concentration in the tank head space One filter paper was used An NDA was performed on the exhauster housing following this core The only radionuclides present in the housing were those from this core or what was removed from the tank head space during the non-RMCS activities in this tank from 92298 and 102398
Some clarification may be needed to explain use of the exhauster operating times and NDA dose rate and record sample data obtained during core sampling on TX-I 13 Core sampling was set up for sampling riser 3 on TX-113 in September 1998 with Exhauster B Exhauster B operated for a total of 8738 hours between 92298 and 102298 The stack record sample was removed at the end of this period The ERS database incorrectly shows the exhauster operated between 111698 and 111998 The ABCASH database shows the stack record sample was removed on 111998 The stack record sample showed positive emuent concentrations during this time period with variances 400 No RMCS samples were taken during this period so the data and time werenrsquot included when calculating RMCS aerosol numbers Exhauster B was removed and Exhauster C installed in late November-early December Exhauster C was operated for a total of 5559 hours between 121098 and 122398 The stack record sample was removed on 122898 No sampling was performed during this period so the data and time werenrsquot included when calculating RMCS aerosol numbers Exhauster C was operated for a total of 30218 hours between 122898 and 2899 All the RMCS segments from riser 3 were taken in this time period so only the data and time for this period were included when calculating RMCS aerosol numbers Exhauster B was used during sampling of riser 5 Exhauster B operated for a total of 11712 hours between 41299 and 42899
Tank 241-TX-l18599 to 699 RMCS was begun in TX-I 18 on 5699 Exhauster C (4) and Truck 4 were used Sampling was completed on 6298 Risers 9B and 12B were sampled A total of 9 RMCS segments were taken there were no PMCS segments Two RMCS cores were obtained The total exhauster run time was 21247 hours The stack record sample was removed and analyzed following this run period The maximum dose rate taken at the side of the exhauster housing following RMCS was 08 m M r CGM filter papers were not analyzed An NDA was performed on the exhauster housing following completion of the two cores The exhauster housing contained the same nuclides as for the first NDA (S-110 U-107 BY-105 and TX-I 13 first core) plus those from TX-I 18
The basic core sampling operational data used in this document includes the number of RMCS cores and segments the exhauster run times and flow rates the RMCS exhauster HEPA filter dose rates and tank vapor space temperatures Table F-l lists the basic operational data This information excluding tank vapor space temperature data was obtained from procedural data sheets in the sampling work packages (References W - 1 to WP-23)
Tank temperature data for the tanks ventilated with the RMCS exhausters was obtained from the TWINS database Plots for each tank were prepared for the time RMCS was conducted and the average value of the highest thermocouple located in the tank (the lowest temperature reading) was estimated and used as the average tank head space temperature during the RMCS period
The SX exhauster flow rates listed in Table F-l are estimates only The combined flow rate for SX-IO1 through SX-106 plus SX-109 (7 tanks) averaged 440 cfm during CY 1996 (Kaiser 1997) for an average of 63 cfm per
F-5
RPP-4826 Rev I
tank Based upon inlet flow measurements at the tank inlet HEPA filters (Fanis 1998) the flow through each individual tank (SX-IO1 through SX-106 plus SX-109) was lt55 cfm at the breather filter Assuming an exhaust flow of 100 cfm for each SX farm tank sampled is therefore conservative
Calculated Data
Calculated data include the tank head space volumes conversion of the RMCS exhauster flow rate from scfm to acfm and the number of tank head space changeouts made by an exhauster during RMCS
Tank head space volume includes the dome space volume above the top of the sidewall plus the void space between the waste surface and the top of the sidewall The formula used to calculate tank head space volumes WN
Head Space Volume in A = (DS + [(H) (12) + HI + Hb - H] (V)) - 748
Where DS = dome space volume gal H = height of tank body sidewall above knuckle A HI = height of tank knuckle area in Hb = height oftank bottom below knuckle in H = height of waste in tank in V =27555 galin of waste in SX tanks 2754 gallin in all others
The tank dome space volumes height of tank sidewall above the knuckle height of tank knuckle area and height of tank bottom below the knuckle were obtained from Reynolds 1999 The height of waste in each tank at the time of core sampling was obtained from the TWINS database Tank dimensional and waste level data are given in Table F-2 along with the calculated tank head space volumes
Aerosol calculations for Appendices A-C require exhauster flow rates in actual cubic feet per minute The RMCS exhauster flow rate is controlled and recorded in standard cubic feet per minute The mass flow rate of the exhauster air is measured and internal logic in the exhauster controller calculates what the volumetric flow rate would be if the temperature and pressure in the exhauster inlet were at standard conditions The standard conditions used in the logic controller are 29921 in Hg (760 mm Hg) and 69F (ZIT)
A correction factor is built into the exhauster control logic that assumes an atmospheric pressure of 2927 in Hg the average atmospheric pressure at Hanford The RMCS exhauster will operate at about 1-2 in H20 negative pressure resulting in about a 2916 in Hg pressure in a waste tank when the RMCS exhauster is operating To revise the indicated scfm RMCS exhauster reading to an acfm value the RMCS exhauster scfm flaw rate was multiplied by (29922916)(T+459)528 where Tis the tank head space temperature in OF The tank head space temperatures in Table F-1 were input to the spreadsheet file used for aerosol calculations and converted to acfm The flow rates in acfm are included in Table F-I
The tank head space changeouts when using the RMCS exhauster were calculated by multiplying the exhauster acfm flow rate by the time of exhauster operation and dividing the result by the tank head space volume Tank head space changeouts are listed in Table F-2
F-6
c
gt 2
RPP-4826 Rev 1
APPENDIX G
REFERENCES
G-0
RPP-4826 Rev 1
APPENDIX G - References
Diedeker 1999 NDA of RMCS HEPA Filters L P Diedeker WMH E-Mail to JS Schofield CHG November 29 I999
ERDA 1976 Nuclear Air Cleaning Handbook ERDA 76-21 Buchsted C A Fuller A B and Kahn 1 E Oak Ridge National Laboratory 1976
Farris 1998 Internal Note T R Farris LMHC to J S Schofield LMHC Breather Filter Flow Rates for SX-Farm 31698
Foust 1999 Internal Memo RMCST Exhauster HEPA Filter Dose Rate Calculations D J Foust LMHC to J S Schofield LMHC October 25 1999
Greager 1999 Correspondence No WMH-9954450 Non-Destructive Analysis of the Rotay Mode Core Sample High-Efjiciency Particulate Air Filters E M Greager WMH to P C Miller LMHC June 28 1999 [Transmittal of HNF-4199 Resultsfram NDA Measurement of the 296-P-34 RMCS HEPA Filters]
HNF 1999 HNF-SD-WM-SAR-067 Tank Waste Remediation System Final Safety Analysis Report Rev 1 The revision incorporating RMCS accident analyses was submitted as Addendum 5 to DOE as a change to the FSAR predecessor the Basis for Interim Operation (BIO) LMHC-9857075 80232764-9-KOOl Submittal of Authorization Basis Amendment Package for Rotay and Push Mode Core Sampling in Satisfaction of Perfarmance Agreement TWR 122 Expectations I and 3 D 1 Allen LMHC to A M Umek FDH August 30 1998 Addendum 5 as of mid-January 2000 is waiting for approval by DOE
Kaiser 1997 T D Kaiser LMHC E-Mail to J S Schofield LMHC SX Tank Flow Data 42197
NUREG 1995 Potential Radionuclide Emissionsfrom Stacks on the HanfordSite Part I Dose Assessment Davis W E and Barnett J M Westinghouse Hanford Company from Proceedings of the 23 DOEMRC Nuclear Air Cleaning Conference held July 25-28 1994 February 1995
Schofield 2000a Letter 74910-00-002 Use of Microshield Calculations for RMCS Exhauster Housing for Estimating Radionuclide Quantities on the Filters Using NDA and Dose Rate Measurements I S Schofield CHG to File January 62000
Schofield 2000b Letter 74910-00-003 Rev I RMCS Exhauster Stack RecordSample Data J S Schofield CHG to File January 202000
Reynolds 1999 D R Reynolds LMHC E-Mail to I S Schofield LMHC transmitting Tank Volume Calculations draft of calculations done by Mike Plesha and Reed Hendershot data to be used for RESOLVE computer program for Hanford waste tanks August 3 1999
TWINS Tank Waste Information Network System database available at httptwinspnlgovSOO lhtbinTCDgetTableListexe
Waldo 1999 letter 74910-99-009 RMCS Exhauster Aerosol Test Data E I Waldo to J S Schofield June 22 1999
WHC 1993 WHC-SD-WM-ES-225 Rev I AerosolStudy for the Rotary Mode Exhauster P M Francis Westinghouse Hanford Company April 20 1993
WHC 1997 WHC-SD-WM-SAD-035 Rev Ob A Safety Assessment of Rotary Mode Core Sampling in Flammable Gas Single Shell Tanks Hanford Site Richland Washington August 8 1997
G- I
RPP-4826 Rev I
CGM Data CGM-I Letter PARTICULATE SAMPLING OF 241-SX-IO1 DURING ROTARY MODE CORE SAMPLING D C
Langlois E2 Consulting Engineers to J S Schofield Lockheed Martin Hanford Company March 16 1998
CGM-2 Letter PARTICULATE SAMPLING OF 241-SX-I05 DURING ROTARY MODE CORE SAMPLING D C Langlois E2 Consulting Engineers to J S Schofield Lockheed Martin Hanford Company June 9 1998
CGM-3 Letter PARTICULATE SAMPLING OF 241-SX-103 DURING ROTARY MODE CORE SAMPLING D C Langlois E2 Consulting Engineers to J S Schofield Lockheed Martin Hanford Company June 12 1998
CGM-4 Letter PARTICULATE SAMPLING OF 241-S-110 DURING ROTARYMODE CORESAMPLING D C Langlois E2 Consulting Engineers to J S Schofield Lockheed Martin Hanford Company July 20 1998
CGM-5 Letter PARTICULATE SAMPLING OF 241-SX-102 DURING ROTARY MODE CORE SAMPLING D C Langlois E2 Consulting Engineers to J S Schofield Lockheed Martin Hanford Company July 22 1998
CGM-6 Letter PARTICULATE SAMPLING OF241-U-107 DURING ROTARY MODE CORE SAMPLING D C Langlois E2 Consulting Engineers to J S Schofield Lockheed Martin Hanford Company August 3 1998
CGM-7 Letter PARTICULATE SAMPLING OF 241-BY-105 DURING ROTARY MODE CORESAMPLING D C Langlois E2 Consulting Engineers to 1 S Schofield Lockheed Martin Hanford Company September 17 1998
CGM-8 Letter PARTICULATE SAMPLING OF 241-TX-I13 DURING ROTARY MODE CORESAMPLING D C Langlois E2 Consulting Engineers to J S Schofield Lockheed Martin Hanford Company March 15 1999
CGM-9 Letter PARTICULATE SAMPLING OF 241-TX-113 DURING ROTARY MODE CORE SAMPLING D C Langlois E2 Consulting Engineers to I S Schofield Lockheed Martin Hanford Company May 31 1999
Notices of Construction NOC-I DOEIRL-93-40 Radioactive Air Emissions Program Notice of Construction Rotary Mode Core-Sampling
Truck and Exhauster Approved by Letter AIR 93-707 A W Conklin WDOH to J E Rasmussen DOEIRL 7893
NOC-2 DOEIRL-94-118 Rev 0 Radioactive Air Emissions Program Notice of Construction for the Rotary Mode Core-Sampling Systems Three and Four Approved by Letter AIR 95-603 A W Conklin WDOH to J E Rasmussen DOERL 63095
NOC-3 DOERL-94-118 Rev 1 Radioactive Air Emissions Program Notice of Construction for the Rotary Mode Core-Sampling Systems Three and Four Approved by Letter AIR 98-301 W W Conklin WDOH to I E Rasmussen DOEIRL 3698
NOC-4 DOEIRL-97-70 Radioactive Air Emissions Program Notice of Construction for Rotary Mode Core- Sampling in SX Tank Farm Approved by Letter AIR 97-1 101 A W Conklin WDOH to J E Rasmussen DOEIRL 113097
NOC-5 USEPA Letter OAQ-107 (no title approving DOE submittal 97-EAP-590 dated 72997) A J Frankel USEPA to J E Rasrnussen DOEIRL 8497
NOC-5 USEPA Letter OAQ-107rsquo (nb title approving DOE submittal 97-EAP-723 dated 101797) A J Frankel USEPA to J E Rasmussen DOERL 11498
Note that both letters have ldquoOAQ-107rdquo following ldquoReply to Attn ofrdquo
G-2
RPP-4826 Rev I
Work Packages WP-I ES-94-00808 WP-2 ES-95-00258 WP-3 ES-95-00045 - WP-4 ES-95-00434 - WP-5 ws-97-00173 - WP-6 WS-97-00174 - WP-7 ws-97-00143 - WP-8 WS-97-00144 - WP-9 WS-97-00207 - WP-I 1 WS-97-00208 - WP-12 WS-98-00049 - WP-13 WS-97-00050 - WP-14 WS-97-00224 - WP- I5 WS-97-00225 - WP-16 WS-97-00230 - WP- I7 ws-97-0023 1 - WP-18 ES-97-00452 - WP-19 ES-97-00453 - WP-20 WS-98-00072 - WP-21 WS-98-00073 - WP-22 WS-98-00067 - WP-23 WS-98-00068 -
241-BY-IO6 Perform Rotary Core Sample [Riser IOB] 241-BY-I IO Rotary Core Sample [Risers 12B 7 IZB 41 241-BY-IO8 Obtain Rotary Core Sample [Risers 12A amp 71 241-BY-IO5 Rotary Mode Core Sample [Riser 12A] 241-SX-101 Rotary Mode Core Sample Riser 19 241-SX-101 Rotary Mode Core Sample Riser4 241-SX-103 Rotary Mode Core Sample Riser 7 241-SX-103 Rotary Mode Core Sample Riser I I 241-SX-105 RMCST Obtain Core Sample Riser 6 241-SX-105 RMCST Core Sample Riser 14 241-SX-102 Rotary Mode Core Sample Riser 8 241-SX-102 Rotary Mode Core Sample Riser 4 241-S-1 IO RMCST Obtain Core Sample Riser 6 241-S-1 IO RMCST Obtain Core Sample Riser 14 2414-107 RMCSTCore Sample Riser 7 241-U-107 RMCST Core Sample Riser 2 241-BY-IO5 RMCST Core Sample Riser 7 241-BY-IO5 RMCST Core Sample Riser 1 IB 241-TX-113 Rotary Core Sample Riser 3 241-TX-113 RMCST Core Sample Riser 5 241-TX-I 18 RMCST Core Sample Riser 9B 241-TX-I 18 RMCST Core Sample Riser 128
G-3
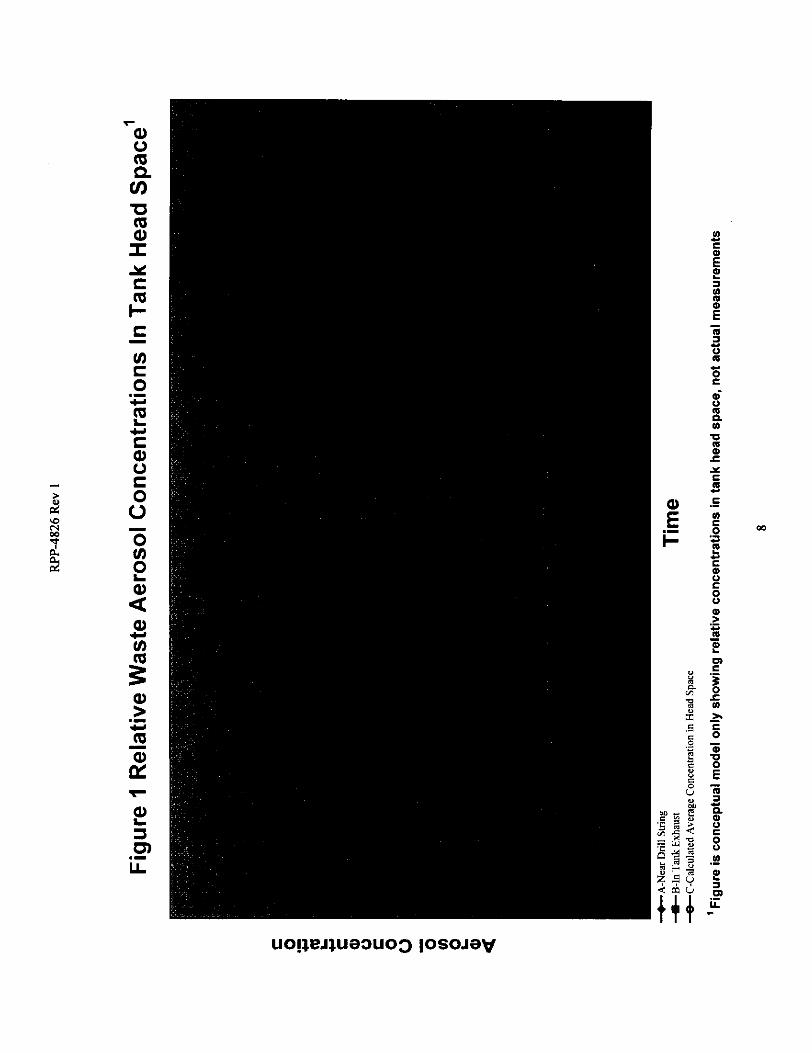
RFP-4826 Rev 1
APPENDIX A
ESTIMATION OF AEROSOLS GENERATED DURING Rh4CS BASED UPON RMCS EXHAUSTER HOUSING NON-DESTRUCTIVE ASSAY
A-0
RPP-4826 Rev I
APPENDIX A - Estimation Of Aerosols Generated During RMCS Based Upon RMCS Exhauster Housing Non-Destructive Assay
Summary of Method
This method of estimating RMCS aerosol quantities uses non-destructive assay (NDA) of the exhauster housing to determine the C S rdquo ~ quantity (Ci) on the filters inside This quantity is then divided by the C S rdquo ~ specific activity (Cig) in the waste for the tank(s) on which the exhauster and the same filters were present during sampling The resulting mass on the filters divided by the volume of air flowing through the exhauster provides an estimate of the average aerosol mass concentration in the air to the exhauster This value was multiplied by the tank head space volume to obtain the average mass of particulates present in the tank head space during RMCS The mass of waste on the filters divided by the number of rotary cores or segments taken provides the mass per core or per segment sent to the exhauster
Description
There are one prefilter and two HEPA filters in series for each RMCS exhauster Particulates captured on the filters contain radionuclides with C S rdquo ~ bein the predominant gamma emitter By performing an NDA of the exhauster housing filters the quantity of Cslg7 in the housing can be estimated This C S rdquo ~ value is then used to back-calculate to a waste mass on the filters using the mass is used to calculate the concentration of particulates in the tank exhaust stream the total suspended solids in the tank head space and the mass of waste sent to the exhauster for each RMCS core or segment taken
Exhauster operations were divided into six operating periods for evaluation in this document These periods are discussed in Appendix F and shown in Table F-I NDA data were obtained for Exhauster Operating Periods 4 5 and 6 Relevant information for these periods is also listed in Table A-I
Period 4 was for Exhauster C use during RMCS for both cores in S-l IO U-107 BY-IO5 and the first core in TX-I 13 The filters and housing were new prior to RMCS in S-110 No filter changeouts were made during this period the accumulated particulates from these RMCS events were retained on the housing prefilter primary HEPA and secondary HEPA
Period 5 was for Exhauster B use during RMCS for the second core in TX-I 13 The filters and housing were new prior to RMCS in TX-113 No filter changeouts were made during this period Exhauster B also ran for a short time during the first core in TX-113 but no RMCS segments were taken when the exhauster was operating Stack record samples (see Appendix D) indicated small levels of aerosols were present in the stack exhaust during this time period Any material collecting on the filters during this time period would show up and be counted as part of the aerosols generated during the 2rdquod RMCS core
Period 6 was for Exhauster C use during RMCS for both cores in TX-I 18 During Period 6 the filters also contained the waste particles from Period 4 No filter changeouts were made durin this period The aerosol mass generated due to RMCS in TX-I 18 was determined from the increase in Cs on the filters between Period 4 and Period 6
A description of the sampling method used for the NDA obtained following Period 4 is provided in Greager 1999 The same method was used for the NDA following Periods 5 and 6 The NDA consisted of a gamma energy analysis of the exhauster housing performed at points adjacent to the prefilter first HEPA and second HEPA The detector was mounted outside the housing and inside a lead collimator The collimator was used to minimize the background count rate and contribution from adjacent filters CsIh was the only radionuclide reported as present The NDA compared the count rates from the exhauster housing with the count rate of an National Institute of Standards and Technology (NISampT) traceable in an equivalent geometry to the RMCS exhauster housing The count rates from housing filter readings were divided by the count rate for the source to give a reported quantity of Cslrdquo on the filters
concentration in the tank waste This filter waste
3 B
source located in the middle of a filter
A- 1
RPP-4826 Rev 1
Two correction factors were applied to the reported filter Csrdquorsquo values for use in this document These are discussed in the following two sections
Reported NDA Data
The NDA results for Period 4 are provided in Greager 1999 The only radionuclide reported as present on the filters was CsI3rsquo The results are restated in Table A-2
The NDA results for Periods 5 and 6 are provided in Diedeker 1999 The only radionuclide reported as present on the filters was Csrdquorsquo The results are restated in Table A-2
Adjusted NDA Data
The reported results are based upon comparing the count rate for a reference point source located in the middle of a mock-up assembly equivalent to the exhauster housing with the count rate from the same detector inside a lead collimator placed outside the actual exhauster housing Limitations with this method include comparison of a point source with a distributed matrix and the inability of the detector to see the entire filter due to the presence of the collimator Correction factors were used to adjust the reported values to account for these two limitations
The first correction factor accounts for comparing a distributed source to the point source standard The reported results were calculated based upon a point source standard since there are no readily available filter standards with a distributed source The material in the filter housing should be fairly evenly distributed through the filter media however so comparing count rates for the filter housing to a point source standard will result in some error To correct for this error shielding calculations were performed on an exhauster housing filter assuming the CSrdquorsquo was evenly distributed throughout the filter media and then again assuming the activity was a point source in the middle of the filter Foust 1999 provides the results of these Microshield dose rate calculations Using the data in Foust 1999 Schofield 2000a shows that the dose rate at the NDA detector location would be about 0625 mFVhrmCi CSrdquorsquo for a point source and 073 mRhrmCi Cslrdquo for a distributed source To adjust the reported NDA results to what they would have been if an actual distributed standard source was available the reported values need to be multiplied by 0625 + 073 = 086
The second correction factor accounts for the detector not being able to see the entire filter contents due to the detector location inside the lead collimator Using basic geometry Schofield 2OOOa estimated the detector has about a 100 view of 608 of a HEPA filter about a 50 view of 264 of the filter and is shielded from the remaining 128 The detector count rate was thus estimated as being approximately 741 o f what it would be if the detector were not collimated To correct the reported results to what they would have been if an uncollimated detector could have been used the reported values need to be multiplied by I + 0741 = 135
Combining the two correction factors gives a single adjustment factor used of 086 x 135 = 116 Per Table A- 2 the total quantity of Csrdquorsquo reported present in the housing for Period 4 was 0430 mCi This quantity was multiplied by 116 to give 050 mCi Csrdquorsquo The reported results for Periods 5 and 6 were revised in the same manner to give 0032 mCi and 064 mCi C~rsquo~rsquorespectiveIy To determine the net increase in Csrdquorsquo for the housing during Period 6 the value from Period 4 was subtracted from the total or 064 - 050 = 014 mCi Csrdquorsquo
Calculation of Mass Quantity on Filters
Calculation of the mass of waste on the filters requires knowledge of the specific activity of the waste on the filters The specific activities used for each exhauster operating period are given in Table A-I The paragraphs below provide a derivation of the specific activities used
The specific activity values for the waste in each tank sampled is given in Table E-I Rh4CS was performed on more than one tank during Period 4 so a weighted average specific activity was used to calculate the waste mass on the filters during this period The weighted average specific activity was calculated based upon the number of RMCS segments taken from each tank sampled The number of RMCS segments obtained during
A-2
RPP-4826 Rev 1
each period for which NDA measurements were made are listed in Table A-I These values were obtained from Table F-I A weighted average specific activity for the waste on the filters in Period 4 was obtained by
[[O 227 mCigl[lO segl+[Ol2lmCigl[lO seg1+[0225 mCigl[l(l seg]+[Ol30 mCig][l2 seg]]+[SO segments] = 0182 mCi Csrdquorsquog
Calculating a weighted average based upon the number of segments assumes aerosol generation is roughly the same per segment and the specific activity of a radionuclide is constant throughout a tank These assumptions are adequate for the purpose oftbis document Aerosol generation can vary with water content waste hardness depth of sample taken nitrogen flow rate and porosity of the waste An in-depth evaluation of these parameters is beyond the scope of this document The impact of these variables is assumed to average out over all the RMCS segments taken The specific activities used do not vary greatly from tank to tank so any variations will not have a significant impact on the final aerosol results See Appendix E for further discussion of limitations on specific activities used in this document
For Period 5 the filters were new at the start and the only tank sampled with the exhauster was TX-I 13 Therefore the specific activity of CsI3rsquo for TX-I 130130 mCig was used
The same exhauster and filters used for Period 4 were used for Period 6 The net increase in Csrdquorsquo for Period 6 was determined by subtracting the Period 4 Csrdquorsquo from the total Since this net increase was only due to TX- 118 the specific activity of Csrdquorsquo for TX-I 180130 mCig was used for the waste added to the filters in Period 6 (Note it is only a coincidence that TX-I 13 and TX-118 have the same nominal Csrdquorsquo concentration)
The total mass of waste on the filters for Period 4 was thus
050 mCi i 0182 mCig waste = 275 g waste in exhauster housing
The mass of waste added to the exhauster for Period 5 was
0032 mCi + 0130 mCig waste = 025 g waste in exhauster housing
The mass of waste added to the exhauster for Period 6 was
(064 mCi - 050 mCi) + 0130 mCig waste = 11 g waste in exhauster housing
Aerosol Calculations
The tank head space particulate concentration was obtained by dividing the mass of waste sent to the exhaust stream by the volume of air sent to the exhauster The volume of air to the exhauster was obtained by multiplying the exhauster flow rate by the exhauster run times for each tank from Table F-I
For the RMCS exhausters the recorded exhauster flow rate is reported in standard cubic feet per minute (scfm) The RMCS exhauster flow rate is controlled to a nominal 200 scfm The exhauster flow rate was corrected to an actual cubic feet per minute (acfm) before calculating the tank head space aerosol concenmtion Table F-l includes the actual cfm flow rates
The calculated flow rates during RMCS for the tanks sampled during Period 4 were 207 acfm (S-1 lo) 206 acfm (U-107) 208 amp 209 acfm (BY-105) and 203 acfm (TX-I 13) The total volume oftank air through the exhauster during Period 4 was thus
[[207 cfm][ 15978 hr]+[206][27385]+[208][13577]+[209][30792]+[203][30230]][60 minh] = 146 E+7 Arsquo
The average tank head space mass concentration during RMCS in the above tanks was
[275 g + 146 E+7 Arsquo] x [35315 ftrsquomrsquo] = 664 E-6 average g waste per m3 in exhauster inlet
A-3
RPP-4826 Rev I
The gas flow rates and average tank head space mass concentrations during RMCS for Periods 5 and 6 were calculated in a similar manner
The average mass of waste in a tank head space during RMCS was calculated by multiplying the tank head space mass concentration by the tank head space volume from Table F-2 as shown below for S-1 I O
[275 g + 146 E+7 Arsquo] x [89100 ftrsquo] = 167E-2 g waste in S-1 IO head space
The particulate quantities in the other tank head spaces were calculated in a similar manner The weighted average mass in a tank head space during Period 4 was based upon the number of segments taken in each tank
The mass sent to the exhauster per RMCS core or per RMCS segment was obtained by dividing the mass of waste sent to the exhaust stream during each period by the numbers of RMCS cores or RMCS segments obtained during the exhauster operating time The average mass of waste sent to the exhauster during Period 4 is thus
275 g waste + 7 rotary cores = 39E-1 g wastelrotary core
and
275 g waste + 50 rotary segments = 55E-2 g wasteirotary segment
The mass of waste to the exhauster per RMCS core and RMCS segment for Periods 5 and 6 were calculated in a similar manner
All data were input to a spreadsheet to perform the calculations Results are provided in Table A-3
Summary of Calculations
Non Destructive Assay was performed on the RMCS exhauster filter housings used during three separate exhauster operating periods during which IO RMCS cores and 65 RMCS segments were obtained from five tanks Weighted averages of the average tank head space mass concentration average mass of suspended solids in a tank head space and average mass sent to the exhauster per RMCS core or segment for the three periods combined were calculated based upon the number of RMCS segments taken during each period Based upon RMCS exhauster housing NDA data the results indicate that
The average tank head space mass concentration during RMCS was 77E-6 g wastelmrsquo The average mass of suspended solids in the tank head space during RMCS was 18E-2 g waste The average mass sent to the exhauster during RMCS was 52E-1 g wastelcore The average mass sent to the exhauster during RMCS was 63E-2 g wasteisegment
A-4
RPP-4826 Rev 1
APPENDIX B
ESTIMATION OF AEROSOLS GENERATED DURING RMCS BASED UPON Rh4CS EXHAUSTER HEPA FILTER DOSE RATES
B-0
RPP-4826 Rev I
APPENDIX B - Estimation Of Aerosols Generated During RMCS Based Upon RMCS Exhauster HEPA Filter Dose Rates
Summary of Method
This method of estimating RMCS aerosol quantities divides the dose rate increase (mRhr) at the side of the RMCS HEPA filter housing by a calculated dose conversion factor (mRhrmCi C S rdquo ~ ) to obtain an approximation of the radionuclide quantity in the housing This radionuclide quantity is divided by the waste specific activity (mCig) to determine the mass of waste on the HEPA filter Dividing the HEPA filter waste mass by the volume of air passing through the filter provides an estimate of the average tank head space particulate concentration during RMCS Multiplying the average tank head space particulate concentration by the tank head space volume gives an estimate of the average mass of suspended particulates in the tank head space during RMCS Dividing the HEPA filter waste mass by the number of RMCS cores or RMCS segments provides the mass per RMCS core or per RMCS segment sent to the exhauster
Description
Particulates in the exhaust stream are removed by the HEPA filter(s) upstream of the exhaust fan The captured particulates contain radionuclides with CSrsquo~rsquo being the predominant gamma emitter As the particulate quantity on the HEPA filter increases the dose rate at the side of the filter housing will increase proportionately By monitoring the HEPA dose rate at the side of the filter housing the quantity of Csrsquordquo on the HEPA can be estimated This C S rdquo ~ value is then used to back-calculate to a waste mass quantity on the filter using the Csrsquordquo concentration in the tank waste This filter waste mass quantity is used to calculate the concentration of particulates in the tank exhaust stream the total suspended solids in the tank head space and the mass of waste sent to the exhauster for each RMCS core or segment taken Although radionuclides will be trapped on both the prefilter and the primary HEPA filter with a very small amount on the secondary HEPA calculations in this section were based upon the simplifying assumption that all the activity was on the primary HEPA filter
During RMCS exhauster operation the dose rate in m M r at the side of the HEPA filter housing is periodically measured with an Eberline RO-3B per procedure to indicate when radioactive particulates are building up on the filter The limit of detection of the RO-3B is 05 mRhr
Exhauster operations were divided into six operating periods for evaluation in this document These periods are discussed in Appendix F and shown in Table F-I Housing dose rate data were obtained for Exhauster Operating Periods I 24 5 and 6 Relevant information for these periods is also listed in Table B-I Dose rate data are available and were used for all tanks on which an RMCS exhauster was present and RMCS samples were taken This includes BY-106 BY-IO5 (1995) BY-I IO S-l I O U-107 BY-IO5 (1998) TX-113 and TX- 1 18 The dose rate at the end of a period was used as the basis for calculating radionuclides on the filters The only operating period for which dose rate data were not used for estimating filter radionuclide content was Period 3 Period 3 was for RMCS in SX farm using the SX exhauster
The dose rate at the side of the SX exhauster HEPA filter housing was measured during RMCS of SX farm tanks (for sampling of tanks SX-lot SX-102 SX-103 and SX-105) but the data are not useful for estimation of aerosol quantities because the SX exhauster draws on 13 tanks in parallel or in series with the tank being core sampled Many of the tanks have a much higher off gas flow rate than the sampled tank In addition there is background radiation in the area of the SX exhauster filter housing making any increase in the housing dose rate during RMCS difficult to detect
Dose Rate Data
The dose rate data for each period is listed in Table 8-2 No dose rates above minimum detectable limits were evident at the sides of any RMCS exhauster in Periods I 2 and 5
Dose rate measurements were less than detectable for Period 4 during sampling of S-l IO and U-107 When sampling on BY-IO5 there were a few readings of 07 m M r but most were ltOS mRhr This variation in
B- 1
RPP-4826 Rev 1
readings is to be expected as the specific instrument person using the instrument and location at which the dose rate is checked can vary with time The final recorded dose rate when sampling was complete on BY-IO5 was lt05 mRhr At the end of Period 4 following completion of the first core in TX-I 13 Exhauster C was listed as having a 07 m M r dose rate
Period 6 used Exhauster C again with the same housing and filters as at the end of Period 4 The final dose rate for this period was 08 m M r
Periods 124 and 5 all began with a new housing and new filters For Periods 12 and 5 it was conservatively assumed that the final dose rate was equal to 05 m M r giving an increase of 05 mRhr for each of these periods For Period 4 the dose rate increase was 07 m M r for this period Since Period 6 used the same housing and filters as Period 4 the increase for Period 6 was 08 - 07 = 01 m M r
The dose rate increase was converted into a CsIh content on the primary filter for each period Foust 1999 provides various dose rates for an RMCS exhauster housing assuming even dispersal of 1 mCi C S rdquo ~ on the first HEPA filter Using these calculations Schofield 2000a estimated a dose rate conversion factor of 16 mRhrmCi C S rdquo ~ at the detector location for an RO-3B The assumption that radionuclides are evenly distributed on the HEPA is a reasonable assumption based upon the exhauster design and the method used to measure the radiation dose rate
Gamma emitting contribute to the dose rate due to bremsstrahlung radiation and other nuclides may provide some small additional dose but the major penetrating dose rate contributor in aged SST waste is CSrdquo~ Ignoring the presence of all radionuclides (including Srm) except C S rdquo ~ in calculating a HEPA filter waste mass will provide a conservative result This is because assuming all radiation present is due to C S rdquo ~ will result in overestimating the C ~ I ~ ~ c o n t e n t of the filter housing which in turn will result in overestimating the waste mass on the HEPA filter
Dividing the HEPA dose rate for each exhauster installation by the dose conversion factor of I 6 mRhrmCi results in an increase of 031 mCi Csrdquorsquo on the RMCS exhauster filters for Periods I 2 and 5044 mCi for period 4 and 0063 mCi for Period 6
Calculation of Mass Quantity on Filters
Dividing the Csrdquorsquo content of the filters by the specific activity of C S rsquo ~ ~ in the waste gives the estimated mass of waste sent to the exhauster The specific activity value used for the waste in each tank sampled is given in Table E-I Since RMCS was performed on more than one tank in Periods 1 and 4 a weighted average specific activity was used for these periods The weighted average specific activity was calculated based upon the number of RMCS segments taken from each tank sampled during that period The number of RhKS segments obtained during each period are listed in Table B-I These data were obtained from the individual tank data in Table F- I Calculations to estimate the specific activity of waste mixtures were performed in the same manner as shown in Appendix A For Periods 2 5 and 6 RMCS samples were taken in only one tank The waste specific activity used for these periods was the specific activity of the tank sampled The specific activities used for each exhauster operating period are given in Table B-I
For all exhauster installations except BY-IO6 in 1994 and 1995 the RMCS exhausters were hooked directly to the waste tank When sampling BY-106 a prefilter was installed in the tank riser between the tank and the exhauster The prefilter was not used for BY-I IO in Period 1 or for any other tank in any other period Thus for Periods 2 4 5 and 6 the mass of waste on the HEPA was assumed equal to the mass of waste leaving the tank risers For Period 1 the mass of waste on the HEPA had to be adjusted for the BY-106 prefilter DF when estimating the combined mass of waste leaving the BY-IO6 and BY-I IO tank risers The mass of waste on the HEPA for Period 1 was
[031 mCi] [IO00 pCimCi] = 310 pCi
[310 pCi Csrdquorsquoon HEPA] + [I77 pCi C S rdquo ~ ~ waste] = 177 gwaste on HEPA
is the predominant radionuclide contributor to filter dose rates Beta emitting Srw can
on HEPA
B-2
RPP-4826 Rev 1
A decontamination factor (DF) of 5 was used to account for radionuclide removal by the BY-IO6 prefilter (see Appendix D for basis ofprefilter DF) There were 1 1 RMCS segments taken from BY-IO6 and 13 from BY- 1 IO The total mass ofwaste assumed to exit the tank risers was therefore
[ I 77 g waste] [ 1 1 + 131 [[I 151 + 131 = 28 g waste from tank risers
The DF of 5 to account for the prefilter is only applicable to the RMCS of BY-IO6 in 1994 and 1995 for all other exhauster periods the mass of waste on the HEPA was equal to the mass of waste sent to the exhauster riser
The mass of waste sent to the exhauster for Period 2 was
[031 mCi] [IO00 pCimCi] = 310 pCi Csrdquorsquo on HEPA
[3 IO pCi C S rdquo ~ on HEPA] + [225 pCi CsiI7g waste] = I 39 g waste from tank
Using the same formula the mass of waste to the exhauster from Periods 4 and 5 was 241 and 240 g respectively and the increase in waste on the filters for Period 6 was 048 g
Aerosol Calculations
The mass sent to the exhauster per RMCS core or per RMCS segment was obtained by dividing the mass of waste leaving the risers by the number of RMCS cores or RMCS segments obtained during the exhauster operating period
The tank head space particulate concentration was obtained by dividing the mass of waste leaving the riser by the volume of gas sent to the exhauster This volume of gas sent to the exhauster was obtained by multiplying the exhauster flow rate by the exhauster run time from Table F-I The calculations for aerosols generated based upon HEPA dose rates use acfm while the exhauster flow is recorded in scfm so the actin flow rates in Table F- 1 were used
The average mass of aerosols in the tank head space was obtained by multiplying the average tank head space particulate concentration by the tank head space volume from Table F-2
Following is an example of how the mass per RMCS core mass per RMCS segment average tank head space mass concentration and average mass of aerosols in the tank head space were calculated for Period 1 Data used are from Tables E-I F-I and F-2
[200 scfm] [2992+2916] [84 + 4591 + 528 = 21 1 acfm to exhauster from BY-IO6 in 11-1294
using same formula results in 210 acfm for BY-IO6 in 195 and 209 acfm for BY-I IO
28 g waste + [((21 1 acfm)(4878 hr)+(21O)(l867)+(209)(1125))(60 minhr)]= 12E-6 g wastelf to risers
[12E-6 amp] [35315 fmrsquo] =43E-5 g wastemrsquoto risers
[12E-6 gftrsquo] [53700 Arsquo in BY-106 head space] =66E-I g waste in BY-IO6 head space during RMCS
[12E-6 piftrsquo] [92000 ftrsquo in BY-110 headspace] = IIE-l g waste in BY-I10 head spaceduring RMCS
[28 g waste] [5 RMCS cores] = 56E-1 g waste per core to riser
[28 g waste] + [24 RMCS segments] = 12E-1 g waste per segment to risei
8-3
RPP-4826 Rev 1
All data were input to a spreadsheet and the mass to exhauster per RMCS core mass to exhauster per RMCS segment average tank head space mass concentration and average mass of aerosols in the tank head space were calculated for each of the RMCS exhauster operating periods in the same manner as shown above Results are given in Table 8-3
Summary of Calculations
RMCS exhauster operations were segregated into five operating periods during which RMCS was performed The Exhauster B data for BY-IO8 and TX-I 13 riser 3 was not used in these calculations as no RMCS was performed when the exhauster was operating Exhausters were operated in seven tanks during which 16 RMCS cores and 92 RMCS segments were obtained Based on RMCS filter housing dose rate data the results indicate that
These values are conservative as the assumed dose rate at the end of RMCS for Periods I 2 and 5 was assumed to be 05 mRhr In addition using a DF of 5 for the BY-IO6 prefilter skews the results high The in-tank prefilters used in both BY-IO6 sampling events showed no detectable contamination
Operatin Periods 4 and 6 were the only periods with exhauster housing dose rates above detectable The 044 mCi Csrsquordquo and 0063 mCi CsIh increase on the filters for these two periods based upon dose rate data correspond to the 050 mCi CsI3rsquo and 014 mCi Csrdquorsquo increase on the filters for these two periods based u on NDA data (see Appendix A) The 031 mCi C S rdquo ~ for Period 5 is significantly above the 0032 mCi Cslrsquolsquofor the same period determined by the NDA but this is due to assuming the housing dose rate was equal to the minimum detectable 05 mRhr
The average tank head space mass concentration during RMCS was 22E-5 g wastem3 The average mass of suspended solids in the tank head space during RMCS was 47E-2 g waste The average mass sent to the exhauster during RMCS was 59E-1 g wastelRMCS core The average mass sent to the exhauster during RMCS was 1OE-1 g wastelRMCS segment
B-4
v m
__ ~~
RPP-4826 Rev 1
APPENDIX C
ESTIMATION OF AEROSOLS GENERATED DURING RMCS BASED UPON CGM IN-LINE FILTER PAPER ANALYSES
c-0
RPP-4826 Rev I
APPENDIX C - Estimation Of Aerosols Generated During RMCS Based Upon CGM In- Line Filter Paper Analyses
Summary of Method
This method of estimating RMCS aerosol quantities uses radionuclide assay data from in-line filter papers located upstream of continuous gas monitors (CGM) sampling the tank air for flammable gases during RMCS The radionuclide content of the filter paper is divided by the waste radionuclide specific activity and the air flow through the CGM to obtain an estimate of the average mass concentration in the tank head space during the time period the CGM is on Multiplying the estimated average tank head space mass concentration by the tank head space volume gives an estimate of the average mass of particulates in the tank head space during RMCS To obtain the mass per RMCS core or per RMCS segment sent to the exhauster the tank head space average mass concentration is multiplied by the volume of gas sent to the exhauster then multiplied by a correction factor to account for particulates in the head space removed by the exhauster when the CGM is not operating and divided by the number of RMCS cores or RMCS segments
Description
During most tank waste intrusive activities performed since 1996 an intrinsically safe CGM located above ground has been used to continually monitor the tank air for flammable gases during in-tank activities The CGM sampling method draws air directly from the tank head space During RMCS the CGM sampling line is placed in the tank dome space The sampling line is located between the sampling riser and the exhaust riser if practical A pump in the CGM draws tank air up through the line at 05 litmin for measurement of the lower flammability limit (LFL) by the CGM A filter paper is installed in the sampling line upstream of the CGM to protect the unit from internal contamination
Following CGM use the CGM filter papers are normally discarded after monitoring them in the field for contamination To help estimate the tank head space particulate levels during RMCS these filter papers were retained and analyzed in the 222-S laboratory following removal from all tanks in which RMCS was performed from the fall of 1997 through April 1999 Data were collected for the four tanks in SX farm in which RMCS was performed and the next four tanks on which the RMCS exhauster was deployed These tanks are listed in Table c-I Reported CGM Data
The CGM operational data used to estimate aerosol levels during RMCS includes CGM operating times CGM flow rates and filter paper analytical data A summary report containing all the field operating data sheets for CGM usage and lab data was prepared following completion of sampling on each tank for all tanks except TX- 113 For TX-I 13 a separate report was prepared following each core These reports are References CGM-I to CGM-9 The CGM data from these reports are provided in Table C-2
There were 14 CGM installations during RMCS when CGM filter papers were collected and analyzed Each of these installations had Csrdquorsquo total alpha and total beta quantities measured on the filter papers resulting in 42 data points Eight of the measurement results were very low and had errors of gt+-loo These values were not used resulting in a net of 34 data points for calculating average head space mass concentrations based upon CGM data
Calculated Tank Head Space Radionuclide Concentrations
To calculate the average tank head space radionuclide concentrations during RMCS the filter paper radionuclide quantities were first divided by an efficiency factor to account for radionuclides which may not have been captured on the paper This adjusted radionuclide value was divided by the volume of tank air passing through the paper to give the average tank head space radionuclide concentration
The efficiency used for most stack samplers onsite is 73 (see Appendix D) Estimates attached to References CGM-I to CGM-9 indicate the CGM filter paper sampling method used should have a sampling efficiency
c- 1
RPP-4826 Rev 1
exceeding 73 For conservatism a sampling efficiency of 50 was assumed in this document for the CGM filter paper method
The estimated Csrdquorsquo total alpha and total beta concentrations in the tank vapor space were calculated by dividing the radionuclide quantity on the filter paper from Table C-2 by the assumed CGM sampling efficiency of 05 and the volume of gas going to the CGM The volume of gas going to the CGM was calculated by multiplying the time of CGM operation from Table C-2 by the CGM flow rate of 500 mlmin For example the calculated SX- 101 head space C~rsquorsquo~concentration based upon analysis of the CGM filter papers used during RMCS of riser 19 is
[[26E-4 pCi + 051 + [[I755 min][500 mlmin]] = 59E-I0pCiml
All radionuclide concentrations were calculated in a similar fashion Results are given in Table C-3 Table C-3 lists the radionuclide concentrations for all 42 data points The eight radionuclide concentrations not used for estimating mass concentrations are noted
Table C-3 also contains the calculated number of tank head space changeouts by the tank exhauster during CGM operation Tank head space changeouts were calculated by multiplying the exhauster flow rates (in actin) from Table F-1 by the CGM run times from Table C-2 and dividing by the tank head space volumes from Table F-2 The number of tank head space changeouts during CGM operation was used when estimating the waste mass sent to the exhauster See Aerosol Calculations section below for explanation
Aerosol Calculations
Average tank head space mass concentrations based upon CGM filter paper data were calculated by dividing the head space radionuclide concentrations from Table C-3 by the waste specific activities for each tank sampled The waste specific activities used came from Table E-I and are listed again in Table C-I The average of the mass concentrations based upon radionuclide data for each tank was used as the average head space mass concentration for that tank For example the calculated SX-IO1 head space mass concentration analysis from the CGM filter papers used during RMCS of riser 19 is
[59E-10 pCi Csrdquorsquoml+ 112 pCi C S rdquo ~ ~ waste] [ 28317 mlftrsquo] = 1 SE-7 g wasteA3 based upon C S rdquo ~
[ I 7E-I I pCi T A M + 504E-1 pCi TAg waste] [ 283 17 mlftrsquo] = 94E-7 g wasteamprsquo based upon Total Alpha
[43E-9 pCi TBml+ 357 pCi TBg waste] [ 28317 mlArsquo] = 34E-7 g wastel based upon Total Beta
[ [ I 5E-7 + 94E-7 + 34E-7 g wasteArsquo] f 31 = 48E-7 g wasteamp
[48E-7 g wastelt ] [3531467 Arsquom3] = 17E-5 g wastemrsquo
All tank head space mass concentrations were calculated in the same manner The results are presented in Table C-4 The weighted average tank head space mass concentration during RMCS was based upon the number of RMCS segments taken for each data point
The average aerosol mass in the head space during RMCS was calculated by multiplying the average tank head space mass concentration by the tank head space volume from Table F-2 For the same data point as above
[48E-7 g waste Arsquo] [115E+5 Arsquo] = 55E-2 g waste in SX-IO1 head space during RMCS
All average mass quantities present in the tank head space during RMCS were calculated in the same manner using a spreadsheet The results are provided in Table C-4 The weighted average mass of waste in a tank head space in Table C-4 was calculated based upon the number of segments obtained for each data point
Estimation of the mass of waste sent to the exhauster per RMCS core or segment requires calculation of the total mass of waste sent to the exhauster Multiplying the average head space concentration during RMCS by the exhauster flow rate (in acfm) and the time of CGM operation will give the mass of waste sent to the exhauster during the CGM time frame only While the large majority of mass of waste aerosols will have exited the tank or
c -2
RPP-4826 Rev I
resettled by the time the CGM is shut off there could be some residual suspended particles remaining These would eventually pass to the exhauster but would not be picked up by the CGM filter since it was not in service An adjustment factor was used as described in the following paragraphs to account for particles that may exit to the exhauster following shut down of the CGM
Particulates are generated by RMCS when purge gas is blowing out the drill string and the bit is rotating under the waste surface This time averages about six minutes per segment Multiplying the number of RMCS segments per core by six minutes per segment and dividing by the number of minutes of CGM operation shows the creation of particulates will only occur during a nominal 3-4 of the time the CGM is operating During RMCS the normal practice is to install the CGM turn it on when personnel enter a tank farm and keep the unit in constant operation for the remainder of the shift When the portable RMCS exhauster is used the exhauster is normally started at least an hour before RMCS is initiated and kept in operation until it is time to halt operations for the week The SX exhauster is kept in constant operation Comparing exhauster operating times from Tables F-l with CGM operating times from Table C-I it can be seen the CGMs are in operation about 3-15 of the time the RMCS exhauster is operating on a tank This time comparison wasnrsquot estimated for the SX exhauster since the SX exhauster is in constant operation
With CGM operation much longer than the time period when particulates could be generated the majority of particulates generated by RMCS should have settled or been exhausted during the CGM operating period Table C-3 shows the tank head space changeouts made by the exhauster during CGM operating periods ranged from 084 to 63 The average was 24 With the CGMs operating 25-33 times longer than the aerosol generation periods and an average of over two tank head space changeouts during CGM operation the large majority of aerosols generated during RMCS will have settled out or been removed by the exhauster by the time the CGM is shut off To account for particulates remaining in the tank head space after the CGM was turned off that are subsequently removed by an exhauster it was conservatively assumed that 20 of the total mass of particles generated during RMCS were not removed from the tank head space during the CGM operating period Therefore the product of the tank head space concentration and the volume of air sent to the exhauster during the time of CGM operation was multiplied by a factor of 125 (lOOl80) to estimate the total mass of waste sent to the exhauster as a result of RMCS This is shown below for the same SX-IO1 riser 19 data point in the above calculations
[48E-7gA3] [IOOmin] [I755 min] [125]= 11E-l gwastetoexhauster
This value was divided by the number of RMCS cores and RMCS segments from Table C-1 to provide the grams per core and grams per segment in Table C-4 as follows
[ I I E- 1 g waste to exhauster] i 1 core = 11 E-I g wastelRMCS core to exhauster
and
[ 1 I E- 1 g waste to exhauster] + 5 segments = 2 I E-2 g wastelRMCS segment to exhauster
All mass per core and mass per segment values were calculated in the same manner using a spreadsheet The results are provided in Table C-4 The weighted average mass per core and mass per segment in Table C-4 were calculated based upon the number of cores or segments obtained for each data point
Summary of Calculations
There were 34 valid CGM filter paper data points from 14 RMCS CGM sampling periods in eight tanks during which I5 RMCS cores and 79 RMCS segments were obtained Based upon CGM filter paper data the results indicate that
The average tank head space mass concentration during RMCS was 4OE-5 g wastem3 The average mass of suspended solids in the tank head space during RMCS was 97E-2 g waste The average mass sent to the exhauster during RMCS was 18E-1 g wastelRMCS core The average mass sent to the exhauster during RMCS was 34E-2 g wastelRMCS segment
c - 3
RPP-4826 Rev 1
Ignoring all CGM filter paper analytical data points with a variance gtloo will result in conservative results These data points indicate negligible radioactivity was present If a value of zero was assigned to each data point with an analytical error of gtloo instead of ignoring the data point the weighted average particulate quantities in Table C-4 would be reduced by about 12
The average tank head space mass concentrations based upon CGM data will be higher than the average tank head space mass concentrations based upon filter housing NDA or dose rate The RMCS exhauster received tank air from the shifts when sampling was performed and during some of the off-shifts when no sampling was done The CGMs were only operated during the shifts when sampling was performed The air concentration drawn into the CGM and the RMCS exhauster should be roughly the came during the operating shifts but somewhat less during the off-shifts Therefore the tank head space concentration will be higher when based upon CGM data This does not impact the mass of waste sent to the exhauster per core or per segment
c -4
I
- ~
RFP-4826 Rev 1
APPENDIX D
ESTIMATION OF Rh4CS EXHAUSTER HOUSING DECONTAMINATION FACTOR
D-0
RFrsquoP-4826 Rev 1
APPENDIX D - Estimation of RMCS Exhauster Housing Decontamination Factor
Summary of Method
This Appendix estimates a Decontamination Factor (DF) for the RMCS exhausters using housing NDA data and applicable stack record sample data The Csrdquorsquo in the exhauster effluent is divided by the C S rdquo ~ in the exhauster inlet to provide a penetration efficiency The reciprocal ofthe penetration efficiency is the DF
Description
Each RMCS exhauster has an isokinetic sampler located on the stack downstream of the blower and HEPA filters A small pomp pulls air from the exhaust stack into a filter paper at a rate proportional to the exhaust flow Radionuclides in the exhaust stream passing through the sample line are caught on the filter paper The stack operating time and flow rate are recorded When the record sample filter paper is removed the filter paper is analyzed in a laboratory for radionuclides The radionuclide concentration in the stack effluent stream is calculated by dividing the quantity of material on the filter paper by the volume of air through the sampler and then dividing again by a factor to compensate for stack sampler and filter paper efficiency
Multiplying the total beta stack effluent concentration by the total off gas flow gives the total beta emissions from the exhauster The total beta emissions are multiplied by the Csrdquorsquo to total beta ratio for the waste in the tank) being exhausted to give an estimate of the C S rdquo ~ emission The C S rdquo ~ on the filters determined by NDA of the housing (see Appendix A) is added to the C S rdquo ~ emissions to give the total C S rdquo ~ input to the filter housing Dividing the emissions by the input gives the filter housing penetration efficiency Subtracting the penetration efficiency from 1 O gives the filter housing efficiency Dividing 1 O by the penetration efficiency gives the DF
RMCS Stack Record Sample Data
RMCS exhauster stack record samples are taken after completion of each sampling event on a tank Normally this is after all cores on that tank have been obtained but for BY-IO5 in 1998 record samples were taken following each core Record samples are also taken at the end of each year All samples are analyzed for total alpha and total beta At the end of each year all the filter papers for that year are composited and analyzed for individual radionuclides Sample results are entered into the Automated Bar Coding of Air Samples at Hanford (ABCASH) and Environmental Release Summary (ERS) databases Several ofthe filter papers from 1998 were reanalyzed using a longer count time to bring the error rate down
Schofield 2000b compiled and evaluated all available RMCS exhauster stack record sample data filtered out the unusable data provided derivation for the stack sampling efficiency factor and summarized the results Most of the data points were so low as to be unusable since the results were either negative or had error variances gtloo
Column 5 of Table D-1 provides the stack effluent concentrations used for calculation of the filter housing DF The stack effluent data in Table D-l come from Schofield 2000b These values include a 073 sampling efficiency factor
Calculation of RMCS Filter Housing Decontamination Factor Based upon Housing Inlet and Outlet Data
The RMCS exhauster housing NDA and stack record sample data available for exhauster Operating Periods 4 5 and 6 were used to estimate an actual DF for the RMCS exhauster housings The housing NDA data is for CSrdquo~ but there are no usable Csrdquorsquo concentrations for the RMCS exhauster outlet The RMCS exhauster stack Csrsquordquo concentrations are either negative have a variance gtloo or are not available Total beta analyses are available however so the stack eftluent C S rdquo ~ concentrations were estimated by multiplying the total beta concentration by the ratio of Csrdquorsquo to total beta in the tank waste
Column 2 of Table D-l lists the increase in CSrsquo~ on the filters for each operating period as determined by NDA This data was obtained from Table A-2
D- 1
RPP-4826 Rev 1
Column 4 of Table D-l lists the stack exhaust volume for each stack record sample period The stack exhaust volume for the exhauster installation on S-l IO was calculated by
[ZOO std ft3min][15978 hrs] [60 minhr] = 199E+6 std ftrsquo
All other stack volumes in Table D-l were calculated the same way Unlike in Appendices A B and C no adjustment was made to change the 200 scfm to actual cfm This is because the RMCS stack record sample concentrations from Table D-3 are based upon a 200 scfm flow rate rather than the actual flow rate Since the concentrations are on the same basis as the flow rate there is no need to correct to acfm
The total beta emissions for the RMCS exhauster stack were calculated by multiplying the volume by the concentration For the same S-l IO data point
[199E+6 ft3] [18E-15 pCiml] [28317mlft3] [mCi1000 pCi] = 1OE-7 mCi total beta
All other total beta emissions in Table D-l were calculated the same way
The Csrdquorsquo to total beta ratio was calculated from data in Table E-I For the same S- l I O data point
326E+5 Ci CsI3rsquo f I 14E+6 Ci total beta = 029 Ci CslhCi total beta = 029 rnCi CsrdquorsquomCi total beta
The Csrsquordquo emission for the same S-l IO data point was thus
[I OE-7 mCi total beta] [029 mCi CsrdquorsquomCi total beta] = 29E-8 mCi Csrdquorsquo
All Csrsquordquo emissions in Table D-l were calculated in the same manner
The penetration efficiency for each operating period was calculated by dividing the exhauster outlet by the filter inlet Csrdquorsquo quantities For operating period 4 this was
[81E-6 mCi] f [5OE-I + 8IE-6 mCi] = 16E-5 = 16E-3
The DF for operating period 4 is
1 + 16E-5 = 62E+4
The overall DF for periods 4 5 and 6 was calculated by dividing the efluent from all three periods by the total filter input
[95E-6 mCi] f [67E-I t 95E-6 mCi] = 14E-5 = 14E-3 penetration efficiency
I - I 4E-5 = 0999986 = 999986 filter efficiency
1 f 14E-5 = 73E+4 decontamination factor based upon housing inlet and eftluent data
Estimation of Housing Decontamination Factor Based upon General Performance Data
HEPA filters are tested at the manufacturer to a minimum 9997 efficiency using a 03 pm monodisperse aerosol After installation HEPA filters are tested in-place per ASME N5 I O to a minimum 9995 efficiency using a polydisperse aerosol with an approximate droplet size distribution of 99 less than 30 pm 50 less than 07 pm and 10 less than 04 pm The RMCS exhauster housing is tested per ASME N510 and is thus required to have a minimum removal eficiency of 9995 for an aerosol with this approximate size distribution The particle size distribution of the waste aerosols generated by RMCS is unknown but it is assumed that the removal efficiency for RMCS generated aerosols was the same as the removal efficiency for the ASME generated test aerosol
D-2
RPP-4826 Rev I
A 9995 efficiency is equivalent to a DF of 2E+3 while a 9997 efficiency is equivalent to a DF of 33E+3 The actual DF for the RMCS exhauster housing is higher than either of these It has two HEPA filters in series even though the minimum efficiency specified in the NOCs for the RMCS exhausters is only equivalent to one HEPA ERDA 1976 recommends using a DF of 3000rdquo for a filter bank where n is the number of HEPA filters in series This would result in a DF of 9E+6 for the RMCS exhauster housing This is unrealistic Using a DF of 9E+6 will calculate to Csrdquorsquo quantities on the HEPA filtersthat are orders of magnitude above what have been shown to be there based upon the measured dose rates and NDA A DF of 9E+6 would mean the dose rate would have to be almost 100 mRhr at the side of the exhauster housing instead of the 05-08 mRhr dose rates encountered The waste particles will not have the same particle size distribution entering the second HEPA filter as when entering the first The majority of the waste particles will be captured on the I rdquo HEPA filter and although the DF for each HEPA if tested individually using the ASME N5 IO aerosol test method may be 3E+3 (or higher) the overall DF of the two filters in series will not be 3000lsquo This is because the particle size distribution entering the Znd HEPA could have a greater percentage of smaller particles than that entering the 1rdquo
NUREG 1995 included an evaluation of a number of different facility stacks at the Hanford site where the HEPA filter upstream air concentrations were estimated using several different methods This report concluded that back-calculation using a value of 3000rdquo overestimated the upstream radionuclide concentration by three to four orders of magnitude when compared to filter NDA data for the nine stacks for which NDA data were obtained and by three orders of magnitude for the two stacks for which upstream air sample data were available Back- calculation using a value of 3000rdquo was shown to be high by four orders of magnitude for the single stack for which a powder release estimate was available Based upon this information the RMCS exhauster dual filter-in-series housings would have a DF of at least three and maybe four orders of magnitude less than 9E+6 or in the 1E+3 to 1 E+4 range A DF of IE+3 would he less than the minimum permissible under the NOC Comparing the older stack data and design with the newer RMCS exhauster design the minimum DF would be expected to be at least 1E+4
Table D-2 provides the available RMCS exhauster aerosol test data This information was obtained from Waldo 1999 Prior to 1998 the RMCS exhauster primary HEPA filter efficiency and either the secondaly HEPA filter or the overall efficiency for both filters were tested Starting in 1998 only the primary and secondary HEPA filter efficiency were measured The overall efficiency of the two filters in series was only measured three times in 11 setups Twice the overall penetration efficiency was lt0002 and the remaining time the only information that could be found was a value of lt005 Most individual filters had a penetration efficiency of 0002 This appears to be about the limit of the detection equipment Based upon Table D-2 data a penetration efficiency of 0002 (99998 efficiency) is normal for a single HEPA and thus a minimum for an RMCS exhauster housing Assuming a 0002 penetration efficiency for the two filters combined calculates to a DF of 5E+4 (equal to 1 +
000002) for the RMCS exhauster housing
In summary the measured DF for the RMCS exhauster housings over the period from May 1998 through June 1999 was about 73E+4 RMCS aerosol testing prior to use indicates a DF of about 5OE+4 for each of the filters separately but their overall efficiency is not measured Referenced data based on older stacks at Hanford indicate the two HEPA RMCS exhauster housing would likely have a DF of at least IE+4
Estimated Aerosol Levels During RMCS Based Upon RMCS Stack Record Sample Data
Revision 0 of this document used the positive record sample results with variance less than 100 to estimate aerosol concentrations in the exhauster inlet using an assumed exhauster housing DF of 5OE+4 This method of estimating aerosols was eliminated from Revision 1 because the stack concentrations were either too low too scattered or too questionable to provide reliable results There were 112 RMCS stack record sample data points evaluated in Schofield 2000b Excluding the total beta sample results used for estimation of the housing DF there were only ten data points remaining with positive values and variances ltloo the remaining data points were either negative had a variance gtloo or the results were not available
For comparison purposes only Schofield 2000b applied the DF of 73E+4 calculated in this document to the data points not used to calculate the exhauster housing DF to estimate aerosol concentrations upstream of the filters The results showed aerosol levels approximately the same as those estimated using NDA dose rate or CGM filter paper data when a value of zero was used for negative sample results or those with a variance gtloo When only
D-3
RPP-4826 Rev 1
the ten positive results with a variance ltloo were used the aerosol levels calculated to be two to five times higher than those estimated using NDA dose rate or CGM filter paper data Because of the variability of data resulting from the extremely low record sample concentrations and the few useable data points estimation of aerosol levels using record sample data was not included in Revision I See Schofield 2000b for further discussion of the use of record sample data to estimate aerosol levels
Summary of Calculations
A total of nine RMCS exhauster stack record sample data points were used to estimate the RMCS exhauster filter housing decontamination factor These data points were obtained when sampling on five tanks during which 10 RMCS cores and 65 RMCS segments were obtained The overall decontamination factor was 73E+4
Estimation of aerosol generation quantities based upon RMCS stack record sample data is possible However results will likely be skewed high if data points that show non-detectable levels of radionuclides present are ignored instead of using a value of zero for the data point
D-4
RPP-4826 Rev 1
APPENDIX E
TANK WASTE RADIONUCLIDE CONCENTRATIONS USED FOR AEROSOL CALCULATIONS
E-0
RPP-4826 Rev 1
APPENDIX E - Tank Waste Radionuclide Concentrations Used for Aerosol Calculations
The RMCS exhauster NDA data HEPA filter dose rate data CGM filter paper data and stack record sample data provide information on the quantity of radionuclides on the exhauster filters in the tank head space or the exhauster stack during RMCS These radioactivity quantities need to be divided by the waste radionuclide concentration specific activity to determine the mass of waste in the tank head space and in the tank gases sent to the exhauster
The mass quantities in this document were calculated using dry basis radionuclide concentrations Waste particles carried into the tank head space by the purge gas could be wet or dry If wet some of the non-chemically bound water will start to evaporate immediately providing the tank relative humidity is 400 The water present in a waste particle may be chemically bound as a hydrate or free The chemically bound water will not readily evaporate therefore even a ldquodryrdquo particle may have some water associated with it It is impractical to measure the actual water content of the waste particulates caught on the CGM filter paper the exhauster HEPA filters or the stack record sample paper Since the quantity of water in the waste particulates is unknown particulate levels were calculated using dry basis radionuclide concentrations Thus all particulate values given in this document are stated on a dry basis
The waste radionuclide concentrations on a dry basis were calculated from data available in the Tank Waste Information Network System (TWINS) The Best Basis InventorylBest Basis Summary numbers were used These values are the most complete and up to date readily available estimates for Hanford waste tank contents but do not include water The information was downloaded from TWINS into a spreadsheet The total chemical total beta and total alpha quantities were summed in the spreadsheet for all the tanks which were sampled and concentrations for Csrdquorsquo Sr9rsquo total beta and total alpha automatically calculated in pCig These concentrations are provided in Table E-I Because lab techniques for measuring gross beta levels only detect beta particles with a minimum decay energy above 150-200 kev only radionuclides with a decay energy of gt-200 kev were included in the total beta numbers
The TWINS radionuclide concentrations were obtained in December 1999 No corrections were made for decay for this document
The CGM filter paper and stack record sample data indicate the measured radionuclide values are not always in the same ratio to each other as given by TWINS nor are all radionuclides detected that TWINS indicates are present Radionuclides can be distributed unevenly in a tank Soluble fission products (primarily Csrsquordquo) are found in the liquid saltcake and in sludges Insoluble fission products and actinides are found largely in sludges as these are primarily chemical precipitates Sludge could be mixed with saltcake be present in a distinct layer at the bottom of a tank or in several layers in the tank depending upon how waste was transferred into a tank Waste particles may thus not have the same specific activity on a microscopic scale as they would have on a macro scale were the tank contents homogenized During RMCS a top to bottom core sample is attempted resulting in the drill bit and purge gas (which causes aerosols to form) passing through most ofthe waste matrix Assuming the aerosol generation rate is approximately constant during drilling the specific activity of a radionuclide in the suspended solids should be roughly the same as the average specific activity of the same radionuclide in the tank waste While the waste specific activity is probably not homogeneous from top to bottom in a tank and the aerosol generation rate will likely also vary it is beyond the scope of this document to provide an in-depth analysis of all the factors affecting aerosol radionuclide concentration Although sample radionuclide data were not always in the same ratio as provided by TWINS for the purpose of this document the simplifying assumption was made that the average tank specific activity is adequate to provide an approximation of the suspended solids specific activity for all radionuclides Average tank individual radionuclide specific activities were used in the preparation of the exhauster NOCs
The aerosol calculations presented in this document are only as accurate as the TWINS data The combined radionuclide content of all Hanford waste tanks is known fairly well since the overall content is based upon reactor production records CsrdquorsquoSrW recovery data and processing plant discharges Thus TWINS data for all tanks combined should be reasonable There are undoubtedly differences between TWINS data and the actual contents of a specific tank While the specific tank radionuclide data from TWINS used in this document may not be exact deviations from the actual concentrations are assumed to balance out over the number of tanks sampled
E- 1
RPP-4826 Rev 1
APPENDIX F
ROTARY MODE CORE SAMPLING EXHAUSTER AND CORE SAMPLE DATA
F-0
RPP-4826 Rev 1
APPENDIX F - Rotary Mode Core Sampling Exhauster and Core Sample Data
This appendix provides the basic data obtained during RMCS operations which was used in preparation of this document
Basic Operational Data
There have been three RMCS exhausters and three RMCS sampling trucks deployed since starmp of nitrogen- purged RMCS in November 1994 The exhausters are formally designated 296-P-32296-P-33 and 296-P-34 These were originally referred to as parts of RMCS Systems 2 3 and 4 respectively in the Notices of Construction (NOC) for these units The exhauster designations were changed for routine field use in 1996 to exhausters A B and C to avoid confusion with core sampling trucks 23 and 4 since any exhauster could be used with any RMCS truck Exhauster A (2) and RMCS Truck2 have not been used for RMCS since 1995 and are no longer in service for core sampling
Rotary mode core sampling has been conducted in four general time frames since 1994 These time frames were separated by down times for equipment modifications or resolution of environmental permitting and safety concerns For ease of analysis in this document exhauster operations were organized into six distinct operating periods Periods I to 6 were grouped based upon times when the same exhauster and same set of HEPA filters were being used These periods thus overlap with the general operating time frames The four operating time frames were
The first time frame lasted from November 1994 to January 1995 RMCS Truck 2 and Exhauster 2 (A) were used on Tank BY-106 along with an in-tank prefilter This tank provided the initial deployment and testing of the nitrogen-purged equipment in a waste tank During this period radiation dose rates were taken at the side of the exhauster housing Stack record samples were taken in December 1994 and January 1995
The second time frame lasted from July 1995 through October 1995 RMCS Trucks 2 and 4 were used with Exhausters 2 and 3 (A and B) on BY-105 BY-IO8 and BY-I IO During this period radiation dose rates were taken at the sides of the exhauster housings Stack record samples were taken after completion of sampling on each tank No RMCS samples were taken from BY-108 all samples were taken in push mode for this tank
The third time frame began when RMCS was restarted in December 1997 Trucks 3 and 4 were used for sampling of SX-101 SX-103 SX-105 and SX-102 with the SX tank farm exhauster providing ventilation The RMCS exhausters were not used During this period radiation dose rates were taken at the sides of the SX exhauster housing as part of HPT routine surveys SX farm exhauster stack record samples were taken when required by normal operating procedures SX record sampler and filter housing dose rate data were not evaluated for this document It would not be practical using filter dose rate or stack record sample data to estimate the RMCS aerosol addition if any to the SX ventilation system The background radiation around the SX filter housing makes measurement of any small increase in dose rate very difficult to detect The number of tanks being ventilated and the involved off-gas header routings (the exhauster is pulling on thirteen tanks in series or in parallel with the tank being sampled) and any in-tank activities in the SX tanks not being sampled would make it impractical to assess what aerosols resulted from RMCS Beginning with RMCS in SX farm radionuclide analyses were performed on the filter papers protecting the CGMs which draw air out of the tank vapor space for flammable gas detection
The fourth time frame began in May 1998 Between 1095 and 598 Exhausters B and C were extensively modified with new filter housings and other equipment to meet new NOC requirements Trucks 3 and 4 were used with Exhausters B and C (3 and 4) on S-l IO U-107 BY-105 TX-113 and TX-I 18 This period marked the first use ofthe RMCS trucks and RMCS exhausters together following resolution of flammable gas concerns and modifications to the exhausters New filters were installed Radiation dose rates were taken at the sides of the exhauster housings Stack record samples
F- 1
RPP-4826 Rev I
were taken after completion of sampling for each exhauster installation Radionuclide analyses were performed on the CGM filter papers for all tanks except TX-118 An NDA was performed on the Exhauster C housing following completion ofthe first core on TX-I 13 The housing filters when assayed contained aerosols captured by the exhauster following RMCS in S-l IO U-107 BY-105 (1998) and the first core of TX-I 13 Another NDA was performed on Exhauster C following both cores in TX-I 18 An NDA was performed following sampling of the second core in TX-I 13 using Exhauster B The time frame ran through early June 1999 No RMCS samples have been taken after June 1999 nor are any planned for the next few years
For the purposes of evaluating aerosol formation based upon RMCS exhauster housing NDA and dose rate data the exhauster operations were grouped into 6 operating periods These periods are shown in Table F-1 and restated in Tables A-I and B-I All tanks sampled in Periods 1 2 4 5 and 6 were exhausted by the same exhauster with the same housing and filters present during that period Period 3 covered the time the SX exhauster was used during RMCS in SX farm
A brief description of each RMCS tank sampling operation is provided below
Tank 241-BY-1061194 to 1294 RMCS using the nitrogen purge gas system with an exhauster was formally begun on 111794 on tank BY-106 riser IOB Exhauster 2 (A)and Truck 2 were used A sintered metal prefilter was inserted in the riser between the tank and the exhauster A total of eight segments were taken in rotary mode and five segments in push mode until sampling was halted on 122194 One RMCS core was obtained The total exhauster run time was 4878 hours The stack record sample was removed and analyzed following this run period Dose rates taken at the side of the exhauster housing during RMCS were all lt05 mRhr The in-tank prefilter was smeared for contamination when removed from the tank with the smears showing less than detectable levels of radionuclides present (Waldo 1999) The prefilter had been washed with an installed spray system prior to removal from the tank but subsequent testing showed the water flow and pressure were too low to have been effective at removing contamination
Tank 241-BY-106195 Following some process modifications RMCS in BY-IO6 riser IOB began again on 11895 Exhauster 2 (A) and Truck 2 were used The sintered metal prefilter was inserted in the riser between the tank and the exhauster RMCS was halted on 12495 over authorization basis and equipment operability issues for RMCS A total of three segments were taken in rotary mode and eleven segments in push mode One RMCS core was obtained The total exhauster run time was 1867 hours The stack record sample was removed and analyzed following this run period Dose rates taken at the side of the exhauster housing during RMCS were all lt O S mRhr The in-tank prefilter was smeared for contamination when removed from the tank with the smears showing less than detectable levels of radionuclides present (Waldo 1999) The prefilter was not washed this time
Tank 241-BY-110795 to 1095 Following resolution of RMCS authorization basis and equipment issues and completion of the fabrication and testing of Trucks 3 and 4 RMCS was begun in BY-I IO on 71195 Exhauster 2 (A) and Truck 2 were used Samples were taken from risers 128 7 128 again and 4 There was no in- tank prefilter used in this or any subsequent RMCS periods Sampling was performed until 102595 when RMCS was halted over flammable gas issues A total of 13 RMCS segments and 56 PMCS segments were taken Three RMCS cores were obtained The total exhauster run time was 1125 hours The stack record sample was removed and analyzed following this run period Dose rates taken at the side of the exhauster housing during RMCS were all lt O S mRhr
Tank 241-BY-108795 to 895 Core sampling was begun in BY-IO8 on 72595 Exhauster 3 (B) and Truck 4 were used Sampling was done in risers 12A and 7 The tank material proved soft enough so that no RMCS segments were required all segments were obtained in push mode although the exhauster was operated during part of the time sampling was performed Sampling was completed 81895 A total of 16 PMCS segments were taken The total exhauster run time was 6617 hours The stack record sample was removed and
F-2
RPP-4826 Rev 1
analyzed following this run period Dose rates taken at the side of the exhauster housing during RMCS were all lt05 mRhr
Tank 241-BY-105895 to 1095 RMCS was begun in BY-I05 riser 12A on 83095 Exhauster 3 (B) and Truck 4 were used This tank has a concrete layer on top about 12-18 inches thick which had to be drilled through Part way through sampling questions arose as to the flammable gas status of the tank and RMCS was halted on 10695 A total of 3 RMCS and 7 PMCS segments were taken One RMCS core was obtained The total exhauster run time was 4413 hours The stack record sample was removed and analyzed following this run period Dose rates taken at the side of the exhauster housing during RMCS were all lt05 mRhr
Tank 241-SX-1011297 to 298 Following resolution of extensive regulatory and authorization basis issues and installation of equipment modifications RMCS started in SX-101 with Truck 4 on 12497 An RMCS exhauster was not used since all SX farm tanks excluding SX-113 and SX-I 15 are ventilated with the SX exhauster Sampling was performed in risers 19 and 4 and was completed on 21098 A total of 9 RMCS and 6 PMCS segments were taken Two RMCS cores were obtained SX exhauster stack record samples and filter housing dose rates were obtained as part of routine operations for the SX exhauster not as part of the RMCS process Filter papers used in the suction line for the CGM were saved and analyzed in the laboratory to estimate the airborne radionuclide concentration in the tank head space Two CGM filter papers were needed for each core as moisture in the tank vapors condensed on the papers in the cold weather and began to restrict tank gas flow to the CGM
Tank 241-SX-103498 to 598 RMCS started in SX-103 with Truck 4 on 42798 The SX exhauster was used for ventilation (see SX- 101 above) Sampling was performed in risers 7 and 1 1 and was completed on 51198 A total of 6 RMCS and 18 PMCS segments were taken Two RMCS cores were obtained During sampling filter papers used in the suction line for the CGM were saved and analyzed in the laboratory to estimate the airborne radionuclide concentration in the tank head space One CGM filter paper was used during each core SX exhauster stack record samples and filter housing dose rates were obtained as part of routine operations for the SX exhauster not as part of the RMCS process
Tank 241-SX-105298 to 598 RMCS started in SX-105 with Truck 3 on 22598 The SX exhauster was used for ventilation (see SX- 101 above) Sampling was performed in risers 6 and 14 and was completed on 51598 A total of 6 RMCS and 20 PMCS segments were taken Two RMCS cores were obtained During sampling filter papers used in the suction line for the CGM were saved and analyzed in the laboratory to estimate the airborne radionuclide concentration in the tank head space Two filter papers were needed for the first core as moisture in the tank vapors condensed on the papers in the cold weather and began to restrict tank gas flow to the CGM One filter paper was used for the second core SX exhauster stack record samples and filter housing dose rates were obtained as part of routine operations for the SX exhauster not as part of the RMCS process
Tank 241-SX-102698 to 798 RMCS started in SX-102 with Truck 4 on 61798 The SX exhauster was used for ventilation (see SX- 101 above) Sampling was performed in risers 8 and 4 and was completed on 7798 A total of 2 RMCS and I8 PMCS segments were taken Two RMCS cores were obtained During sampling filter papers used in the suction line for the CGM were saved and analyzed in the laboratory to estimate the airborne radionuclide concentration in the tank head space One filter paper was used for each core SX exhauster stack record samples and filter housing dose rates were obtained as part of routine operations for the SX exhauster not as part of the RMCS process
Tank 241-S-110598 to 698 RMCS was begun in S-I10 on 51898 Exhauster C (4) and Truck 3 were used This tank marked the first use of an RMCS exhauster since 1995 Sampling was completed on 6498 Risers 6 and 14 were sampled A total of IO RMCS and 8 PMCS segments were taken Two RMCS cores were obtained The
F-3
RPP-4826 Rev I
total exhauster run time was 15978 hours The stack record sample was removed and analyzed following this run period Dose rates taken at the side of the exhauster housing during RMCS were all lt05 mRhr During sampling filter papers used in the suction line for the CGM were saved and analyzed in the laboratory to estimate the airborne radionuclide concentration in the tank head space One filter paper was used for each core Waste particles retained on the exhauster housing filters were part of the inventory subsequently measured by NDA following completion of the first core in TX-I 13
Tank 241-U-107698 to 798 RMCS was begun in U-107 on 61098 Exhauster C and Trucks 3 and 4 were used Sampling was completed on 71598 Risers 7 and 2 were sampled A total of IO RMCS and 19 PMCS segments were taken Two RMCS cores were obtained The total exhauster run time was 27385 hours The stack record sample was removed and analyzed following this run period Dose rates taken at the side of the exhauster housing during RMCS were all 105 mRihr During sampling filter papers used in the suction line for the CGM were saved and analyzed in the laboratory to estimate the airborne radionuclide concentration in the tank head space One filter paper was used for each core Waste particles retained on the exhauster housing filters were part of the inventory subsequently measured by NDA following completion of the first core in TX-I 13
Tank 24l-BY-105798 to 898 RMCS was begun in BY-105 again on 72298 Exhauster C and Trucks 3 and 4 were used Sampling was completed on 82598 Risers 7 and 1 1 B were sampled A total of 18 RMCS and 18 PMCS segments were taken The material was hard enough to require rotary mode sampling all the way to the bottom of the waste but negligible recovery was obtained After RMCS was performed to the waste bottom a PMCS core was taken in the same hole to recover material Two RMCS cores were obtained The exhauster run time was 13577 hours for the first RMCS core and 30792 hours for the second RMCS core Stack record sample information in ABCASH shows 30558 hours operation for the second core but the sampler data sheet shows the time counter was mistakenly reset 234 hours into the run No correction was made to the BY-IO5 2nd core record sample concentration for this document since the error is conservative and results in only slightly higher (ltI) record sample radionuclide concentrations for this core A stack record sample was removed and analyzed following each core giving two record samples for BY-IO5 in 1998 Dose rates taken at the side of the exhauster housing during RMCS were almost all lt05 m R h but a few readings indicated 07 mRihr This variation was assumed due to personnel reading the instrument differently or the fact that the exhauster had been used on enough tanks that by now there was sufficient activity on the filters to cause readings approximately at the background detection level The final reading when both cores were completed was lt05 m R h During sampling filter papers used in the suction line for the CGM were saved and analyzed in the laboratory to estimate the airborne radionuclide concentration in the tank head space One filter paper was used for each core Waste particles retained on the exhauster housing filters were part of the inventory subsequently measured by NDA following completion of the first core in TX-113
Tank 241-TX-113998 to 599 Core sampling was begun in TX-I 13 riser 3 on 92298 Exhauster B (3) and Truck 4 were used at the start This was the first use of Exhauster B since it was modified Exhauster B ran for a total of 8738 hours until being disconnected on 102398 During this time two PMCS segments were taken and no RMCS segments Exhauster C was then installed and operated for 5598 hours from 121098 to 122898 No RMCS or PMCS sampling was performed during this time frame RMCS segments werent taken until 299 Exhauster C ran for a 30230 hours between 122898 and 21299 Sampling was completed on the core from riser 3 on 21299 A total of 12 RMCS segments were obtained during the time Exhauster C was operating Exhauster flow rate for both exhausters was a nominal 200 scfm Stack record samples were taken following Exhauster B removal at the end of 1998 for Exhauster C and following completion ofthe first core with Exhauster C Aerosol calculations were based on only the 30230 hours run time for Exhauster C in 1999 since this was the time period during which RMCS segments were obtained Dose rates taken at the side of the exhauster housing during the short PMCS only sampling period with Exhauster B were all ltOS m R h Dose rates with Exhauster C varied between lt O S mRhr and 07 mRhr The final reading on Exhauster C following completion of the first core was 07 mFUhr During sampling filter papers used in the suction line for the CGM were saved and
F-4
RPP-4826 Rev I
analyzed in the laboratory to estimate the airborne radionuclide concentration in the tank head space One filter paper was used for the core Waste particles retained on the exhauster housing filters were part of the inventory subsequently measured by NDA following completion of this core
Sampling in riser 5 was begun on 41299 using Exhauster B and Truck 3 A total of 6 RMCS and 1 PMCS segments were taken for this core before sampling was halted on 42899 The total exhauster run time for this core was 11712 hours Problems with high vacuum in the tank required the exhauster flow rate to be reduced to 190 scfm to keep the system within pressure limits The stack record sample for the second core was removed and analyzed following the run period Dose rates taken at the side of the exhauster housing during the second core were all lt05 m M r During sampling filter papers used in the suction line for the CGM were saved and analyzed in the laboratory to estimate the airborne radionuclide concentration in the tank head space One filter paper was used An NDA was performed on the exhauster housing following this core The only radionuclides present in the housing were those from this core or what was removed from the tank head space during the non-RMCS activities in this tank from 92298 and 102398
Some clarification may be needed to explain use of the exhauster operating times and NDA dose rate and record sample data obtained during core sampling on TX-I 13 Core sampling was set up for sampling riser 3 on TX-113 in September 1998 with Exhauster B Exhauster B operated for a total of 8738 hours between 92298 and 102298 The stack record sample was removed at the end of this period The ERS database incorrectly shows the exhauster operated between 111698 and 111998 The ABCASH database shows the stack record sample was removed on 111998 The stack record sample showed positive emuent concentrations during this time period with variances 400 No RMCS samples were taken during this period so the data and time werenrsquot included when calculating RMCS aerosol numbers Exhauster B was removed and Exhauster C installed in late November-early December Exhauster C was operated for a total of 5559 hours between 121098 and 122398 The stack record sample was removed on 122898 No sampling was performed during this period so the data and time werenrsquot included when calculating RMCS aerosol numbers Exhauster C was operated for a total of 30218 hours between 122898 and 2899 All the RMCS segments from riser 3 were taken in this time period so only the data and time for this period were included when calculating RMCS aerosol numbers Exhauster B was used during sampling of riser 5 Exhauster B operated for a total of 11712 hours between 41299 and 42899
Tank 241-TX-l18599 to 699 RMCS was begun in TX-I 18 on 5699 Exhauster C (4) and Truck 4 were used Sampling was completed on 6298 Risers 9B and 12B were sampled A total of 9 RMCS segments were taken there were no PMCS segments Two RMCS cores were obtained The total exhauster run time was 21247 hours The stack record sample was removed and analyzed following this run period The maximum dose rate taken at the side of the exhauster housing following RMCS was 08 m M r CGM filter papers were not analyzed An NDA was performed on the exhauster housing following completion of the two cores The exhauster housing contained the same nuclides as for the first NDA (S-110 U-107 BY-105 and TX-I 13 first core) plus those from TX-I 18
The basic core sampling operational data used in this document includes the number of RMCS cores and segments the exhauster run times and flow rates the RMCS exhauster HEPA filter dose rates and tank vapor space temperatures Table F-l lists the basic operational data This information excluding tank vapor space temperature data was obtained from procedural data sheets in the sampling work packages (References W - 1 to WP-23)
Tank temperature data for the tanks ventilated with the RMCS exhausters was obtained from the TWINS database Plots for each tank were prepared for the time RMCS was conducted and the average value of the highest thermocouple located in the tank (the lowest temperature reading) was estimated and used as the average tank head space temperature during the RMCS period
The SX exhauster flow rates listed in Table F-l are estimates only The combined flow rate for SX-IO1 through SX-106 plus SX-109 (7 tanks) averaged 440 cfm during CY 1996 (Kaiser 1997) for an average of 63 cfm per
F-5
RPP-4826 Rev I
tank Based upon inlet flow measurements at the tank inlet HEPA filters (Fanis 1998) the flow through each individual tank (SX-IO1 through SX-106 plus SX-109) was lt55 cfm at the breather filter Assuming an exhaust flow of 100 cfm for each SX farm tank sampled is therefore conservative
Calculated Data
Calculated data include the tank head space volumes conversion of the RMCS exhauster flow rate from scfm to acfm and the number of tank head space changeouts made by an exhauster during RMCS
Tank head space volume includes the dome space volume above the top of the sidewall plus the void space between the waste surface and the top of the sidewall The formula used to calculate tank head space volumes WN
Head Space Volume in A = (DS + [(H) (12) + HI + Hb - H] (V)) - 748
Where DS = dome space volume gal H = height of tank body sidewall above knuckle A HI = height of tank knuckle area in Hb = height oftank bottom below knuckle in H = height of waste in tank in V =27555 galin of waste in SX tanks 2754 gallin in all others
The tank dome space volumes height of tank sidewall above the knuckle height of tank knuckle area and height of tank bottom below the knuckle were obtained from Reynolds 1999 The height of waste in each tank at the time of core sampling was obtained from the TWINS database Tank dimensional and waste level data are given in Table F-2 along with the calculated tank head space volumes
Aerosol calculations for Appendices A-C require exhauster flow rates in actual cubic feet per minute The RMCS exhauster flow rate is controlled and recorded in standard cubic feet per minute The mass flow rate of the exhauster air is measured and internal logic in the exhauster controller calculates what the volumetric flow rate would be if the temperature and pressure in the exhauster inlet were at standard conditions The standard conditions used in the logic controller are 29921 in Hg (760 mm Hg) and 69F (ZIT)
A correction factor is built into the exhauster control logic that assumes an atmospheric pressure of 2927 in Hg the average atmospheric pressure at Hanford The RMCS exhauster will operate at about 1-2 in H20 negative pressure resulting in about a 2916 in Hg pressure in a waste tank when the RMCS exhauster is operating To revise the indicated scfm RMCS exhauster reading to an acfm value the RMCS exhauster scfm flaw rate was multiplied by (29922916)(T+459)528 where Tis the tank head space temperature in OF The tank head space temperatures in Table F-1 were input to the spreadsheet file used for aerosol calculations and converted to acfm The flow rates in acfm are included in Table F-I
The tank head space changeouts when using the RMCS exhauster were calculated by multiplying the exhauster acfm flow rate by the time of exhauster operation and dividing the result by the tank head space volume Tank head space changeouts are listed in Table F-2
F-6
c
gt 2
RPP-4826 Rev 1
APPENDIX G
REFERENCES
G-0
RPP-4826 Rev 1
APPENDIX G - References
Diedeker 1999 NDA of RMCS HEPA Filters L P Diedeker WMH E-Mail to JS Schofield CHG November 29 I999
ERDA 1976 Nuclear Air Cleaning Handbook ERDA 76-21 Buchsted C A Fuller A B and Kahn 1 E Oak Ridge National Laboratory 1976
Farris 1998 Internal Note T R Farris LMHC to J S Schofield LMHC Breather Filter Flow Rates for SX-Farm 31698
Foust 1999 Internal Memo RMCST Exhauster HEPA Filter Dose Rate Calculations D J Foust LMHC to J S Schofield LMHC October 25 1999
Greager 1999 Correspondence No WMH-9954450 Non-Destructive Analysis of the Rotay Mode Core Sample High-Efjiciency Particulate Air Filters E M Greager WMH to P C Miller LMHC June 28 1999 [Transmittal of HNF-4199 Resultsfram NDA Measurement of the 296-P-34 RMCS HEPA Filters]
HNF 1999 HNF-SD-WM-SAR-067 Tank Waste Remediation System Final Safety Analysis Report Rev 1 The revision incorporating RMCS accident analyses was submitted as Addendum 5 to DOE as a change to the FSAR predecessor the Basis for Interim Operation (BIO) LMHC-9857075 80232764-9-KOOl Submittal of Authorization Basis Amendment Package for Rotay and Push Mode Core Sampling in Satisfaction of Perfarmance Agreement TWR 122 Expectations I and 3 D 1 Allen LMHC to A M Umek FDH August 30 1998 Addendum 5 as of mid-January 2000 is waiting for approval by DOE
Kaiser 1997 T D Kaiser LMHC E-Mail to J S Schofield LMHC SX Tank Flow Data 42197
NUREG 1995 Potential Radionuclide Emissionsfrom Stacks on the HanfordSite Part I Dose Assessment Davis W E and Barnett J M Westinghouse Hanford Company from Proceedings of the 23 DOEMRC Nuclear Air Cleaning Conference held July 25-28 1994 February 1995
Schofield 2000a Letter 74910-00-002 Use of Microshield Calculations for RMCS Exhauster Housing for Estimating Radionuclide Quantities on the Filters Using NDA and Dose Rate Measurements I S Schofield CHG to File January 62000
Schofield 2000b Letter 74910-00-003 Rev I RMCS Exhauster Stack RecordSample Data J S Schofield CHG to File January 202000
Reynolds 1999 D R Reynolds LMHC E-Mail to I S Schofield LMHC transmitting Tank Volume Calculations draft of calculations done by Mike Plesha and Reed Hendershot data to be used for RESOLVE computer program for Hanford waste tanks August 3 1999
TWINS Tank Waste Information Network System database available at httptwinspnlgovSOO lhtbinTCDgetTableListexe
Waldo 1999 letter 74910-99-009 RMCS Exhauster Aerosol Test Data E I Waldo to J S Schofield June 22 1999
WHC 1993 WHC-SD-WM-ES-225 Rev I AerosolStudy for the Rotary Mode Exhauster P M Francis Westinghouse Hanford Company April 20 1993
WHC 1997 WHC-SD-WM-SAD-035 Rev Ob A Safety Assessment of Rotary Mode Core Sampling in Flammable Gas Single Shell Tanks Hanford Site Richland Washington August 8 1997
G- I
RPP-4826 Rev I
CGM Data CGM-I Letter PARTICULATE SAMPLING OF 241-SX-IO1 DURING ROTARY MODE CORE SAMPLING D C
Langlois E2 Consulting Engineers to J S Schofield Lockheed Martin Hanford Company March 16 1998
CGM-2 Letter PARTICULATE SAMPLING OF 241-SX-I05 DURING ROTARY MODE CORE SAMPLING D C Langlois E2 Consulting Engineers to J S Schofield Lockheed Martin Hanford Company June 9 1998
CGM-3 Letter PARTICULATE SAMPLING OF 241-SX-103 DURING ROTARY MODE CORE SAMPLING D C Langlois E2 Consulting Engineers to J S Schofield Lockheed Martin Hanford Company June 12 1998
CGM-4 Letter PARTICULATE SAMPLING OF 241-S-110 DURING ROTARYMODE CORESAMPLING D C Langlois E2 Consulting Engineers to J S Schofield Lockheed Martin Hanford Company July 20 1998
CGM-5 Letter PARTICULATE SAMPLING OF 241-SX-102 DURING ROTARY MODE CORE SAMPLING D C Langlois E2 Consulting Engineers to J S Schofield Lockheed Martin Hanford Company July 22 1998
CGM-6 Letter PARTICULATE SAMPLING OF241-U-107 DURING ROTARY MODE CORE SAMPLING D C Langlois E2 Consulting Engineers to J S Schofield Lockheed Martin Hanford Company August 3 1998
CGM-7 Letter PARTICULATE SAMPLING OF 241-BY-105 DURING ROTARY MODE CORESAMPLING D C Langlois E2 Consulting Engineers to 1 S Schofield Lockheed Martin Hanford Company September 17 1998
CGM-8 Letter PARTICULATE SAMPLING OF 241-TX-I13 DURING ROTARY MODE CORESAMPLING D C Langlois E2 Consulting Engineers to J S Schofield Lockheed Martin Hanford Company March 15 1999
CGM-9 Letter PARTICULATE SAMPLING OF 241-TX-113 DURING ROTARY MODE CORE SAMPLING D C Langlois E2 Consulting Engineers to I S Schofield Lockheed Martin Hanford Company May 31 1999
Notices of Construction NOC-I DOEIRL-93-40 Radioactive Air Emissions Program Notice of Construction Rotary Mode Core-Sampling
Truck and Exhauster Approved by Letter AIR 93-707 A W Conklin WDOH to J E Rasmussen DOEIRL 7893
NOC-2 DOEIRL-94-118 Rev 0 Radioactive Air Emissions Program Notice of Construction for the Rotary Mode Core-Sampling Systems Three and Four Approved by Letter AIR 95-603 A W Conklin WDOH to J E Rasmussen DOERL 63095
NOC-3 DOERL-94-118 Rev 1 Radioactive Air Emissions Program Notice of Construction for the Rotary Mode Core-Sampling Systems Three and Four Approved by Letter AIR 98-301 W W Conklin WDOH to I E Rasmussen DOEIRL 3698
NOC-4 DOEIRL-97-70 Radioactive Air Emissions Program Notice of Construction for Rotary Mode Core- Sampling in SX Tank Farm Approved by Letter AIR 97-1 101 A W Conklin WDOH to J E Rasmussen DOEIRL 113097
NOC-5 USEPA Letter OAQ-107 (no title approving DOE submittal 97-EAP-590 dated 72997) A J Frankel USEPA to J E Rasrnussen DOEIRL 8497
NOC-5 USEPA Letter OAQ-107rsquo (nb title approving DOE submittal 97-EAP-723 dated 101797) A J Frankel USEPA to J E Rasmussen DOERL 11498
Note that both letters have ldquoOAQ-107rdquo following ldquoReply to Attn ofrdquo
G-2
RPP-4826 Rev I
Work Packages WP-I ES-94-00808 WP-2 ES-95-00258 WP-3 ES-95-00045 - WP-4 ES-95-00434 - WP-5 ws-97-00173 - WP-6 WS-97-00174 - WP-7 ws-97-00143 - WP-8 WS-97-00144 - WP-9 WS-97-00207 - WP-I 1 WS-97-00208 - WP-12 WS-98-00049 - WP-13 WS-97-00050 - WP-14 WS-97-00224 - WP- I5 WS-97-00225 - WP-16 WS-97-00230 - WP- I7 ws-97-0023 1 - WP-18 ES-97-00452 - WP-19 ES-97-00453 - WP-20 WS-98-00072 - WP-21 WS-98-00073 - WP-22 WS-98-00067 - WP-23 WS-98-00068 -
241-BY-IO6 Perform Rotary Core Sample [Riser IOB] 241-BY-I IO Rotary Core Sample [Risers 12B 7 IZB 41 241-BY-IO8 Obtain Rotary Core Sample [Risers 12A amp 71 241-BY-IO5 Rotary Mode Core Sample [Riser 12A] 241-SX-101 Rotary Mode Core Sample Riser 19 241-SX-101 Rotary Mode Core Sample Riser4 241-SX-103 Rotary Mode Core Sample Riser 7 241-SX-103 Rotary Mode Core Sample Riser I I 241-SX-105 RMCST Obtain Core Sample Riser 6 241-SX-105 RMCST Core Sample Riser 14 241-SX-102 Rotary Mode Core Sample Riser 8 241-SX-102 Rotary Mode Core Sample Riser 4 241-S-1 IO RMCST Obtain Core Sample Riser 6 241-S-1 IO RMCST Obtain Core Sample Riser 14 2414-107 RMCSTCore Sample Riser 7 241-U-107 RMCST Core Sample Riser 2 241-BY-IO5 RMCST Core Sample Riser 7 241-BY-IO5 RMCST Core Sample Riser 1 IB 241-TX-113 Rotary Core Sample Riser 3 241-TX-113 RMCST Core Sample Riser 5 241-TX-I 18 RMCST Core Sample Riser 9B 241-TX-I 18 RMCST Core Sample Riser 128
G-3
RPP-4826 Rev I
APPENDIX A - Estimation Of Aerosols Generated During RMCS Based Upon RMCS Exhauster Housing Non-Destructive Assay
Summary of Method
This method of estimating RMCS aerosol quantities uses non-destructive assay (NDA) of the exhauster housing to determine the C S rdquo ~ quantity (Ci) on the filters inside This quantity is then divided by the C S rdquo ~ specific activity (Cig) in the waste for the tank(s) on which the exhauster and the same filters were present during sampling The resulting mass on the filters divided by the volume of air flowing through the exhauster provides an estimate of the average aerosol mass concentration in the air to the exhauster This value was multiplied by the tank head space volume to obtain the average mass of particulates present in the tank head space during RMCS The mass of waste on the filters divided by the number of rotary cores or segments taken provides the mass per core or per segment sent to the exhauster
Description
There are one prefilter and two HEPA filters in series for each RMCS exhauster Particulates captured on the filters contain radionuclides with C S rdquo ~ bein the predominant gamma emitter By performing an NDA of the exhauster housing filters the quantity of Cslg7 in the housing can be estimated This C S rdquo ~ value is then used to back-calculate to a waste mass on the filters using the mass is used to calculate the concentration of particulates in the tank exhaust stream the total suspended solids in the tank head space and the mass of waste sent to the exhauster for each RMCS core or segment taken
Exhauster operations were divided into six operating periods for evaluation in this document These periods are discussed in Appendix F and shown in Table F-I NDA data were obtained for Exhauster Operating Periods 4 5 and 6 Relevant information for these periods is also listed in Table A-I
Period 4 was for Exhauster C use during RMCS for both cores in S-l IO U-107 BY-IO5 and the first core in TX-I 13 The filters and housing were new prior to RMCS in S-110 No filter changeouts were made during this period the accumulated particulates from these RMCS events were retained on the housing prefilter primary HEPA and secondary HEPA
Period 5 was for Exhauster B use during RMCS for the second core in TX-I 13 The filters and housing were new prior to RMCS in TX-113 No filter changeouts were made during this period Exhauster B also ran for a short time during the first core in TX-113 but no RMCS segments were taken when the exhauster was operating Stack record samples (see Appendix D) indicated small levels of aerosols were present in the stack exhaust during this time period Any material collecting on the filters during this time period would show up and be counted as part of the aerosols generated during the 2rdquod RMCS core
Period 6 was for Exhauster C use during RMCS for both cores in TX-I 18 During Period 6 the filters also contained the waste particles from Period 4 No filter changeouts were made durin this period The aerosol mass generated due to RMCS in TX-I 18 was determined from the increase in Cs on the filters between Period 4 and Period 6
A description of the sampling method used for the NDA obtained following Period 4 is provided in Greager 1999 The same method was used for the NDA following Periods 5 and 6 The NDA consisted of a gamma energy analysis of the exhauster housing performed at points adjacent to the prefilter first HEPA and second HEPA The detector was mounted outside the housing and inside a lead collimator The collimator was used to minimize the background count rate and contribution from adjacent filters CsIh was the only radionuclide reported as present The NDA compared the count rates from the exhauster housing with the count rate of an National Institute of Standards and Technology (NISampT) traceable in an equivalent geometry to the RMCS exhauster housing The count rates from housing filter readings were divided by the count rate for the source to give a reported quantity of Cslrdquo on the filters
concentration in the tank waste This filter waste
3 B
source located in the middle of a filter
A- 1
RPP-4826 Rev 1
Two correction factors were applied to the reported filter Csrdquorsquo values for use in this document These are discussed in the following two sections
Reported NDA Data
The NDA results for Period 4 are provided in Greager 1999 The only radionuclide reported as present on the filters was CsI3rsquo The results are restated in Table A-2
The NDA results for Periods 5 and 6 are provided in Diedeker 1999 The only radionuclide reported as present on the filters was Csrdquorsquo The results are restated in Table A-2
Adjusted NDA Data
The reported results are based upon comparing the count rate for a reference point source located in the middle of a mock-up assembly equivalent to the exhauster housing with the count rate from the same detector inside a lead collimator placed outside the actual exhauster housing Limitations with this method include comparison of a point source with a distributed matrix and the inability of the detector to see the entire filter due to the presence of the collimator Correction factors were used to adjust the reported values to account for these two limitations
The first correction factor accounts for comparing a distributed source to the point source standard The reported results were calculated based upon a point source standard since there are no readily available filter standards with a distributed source The material in the filter housing should be fairly evenly distributed through the filter media however so comparing count rates for the filter housing to a point source standard will result in some error To correct for this error shielding calculations were performed on an exhauster housing filter assuming the CSrdquorsquo was evenly distributed throughout the filter media and then again assuming the activity was a point source in the middle of the filter Foust 1999 provides the results of these Microshield dose rate calculations Using the data in Foust 1999 Schofield 2000a shows that the dose rate at the NDA detector location would be about 0625 mFVhrmCi CSrdquorsquo for a point source and 073 mRhrmCi Cslrdquo for a distributed source To adjust the reported NDA results to what they would have been if an actual distributed standard source was available the reported values need to be multiplied by 0625 + 073 = 086
The second correction factor accounts for the detector not being able to see the entire filter contents due to the detector location inside the lead collimator Using basic geometry Schofield 2OOOa estimated the detector has about a 100 view of 608 of a HEPA filter about a 50 view of 264 of the filter and is shielded from the remaining 128 The detector count rate was thus estimated as being approximately 741 o f what it would be if the detector were not collimated To correct the reported results to what they would have been if an uncollimated detector could have been used the reported values need to be multiplied by I + 0741 = 135
Combining the two correction factors gives a single adjustment factor used of 086 x 135 = 116 Per Table A- 2 the total quantity of Csrdquorsquo reported present in the housing for Period 4 was 0430 mCi This quantity was multiplied by 116 to give 050 mCi Csrdquorsquo The reported results for Periods 5 and 6 were revised in the same manner to give 0032 mCi and 064 mCi C~rsquo~rsquorespectiveIy To determine the net increase in Csrdquorsquo for the housing during Period 6 the value from Period 4 was subtracted from the total or 064 - 050 = 014 mCi Csrdquorsquo
Calculation of Mass Quantity on Filters
Calculation of the mass of waste on the filters requires knowledge of the specific activity of the waste on the filters The specific activities used for each exhauster operating period are given in Table A-I The paragraphs below provide a derivation of the specific activities used
The specific activity values for the waste in each tank sampled is given in Table E-I Rh4CS was performed on more than one tank during Period 4 so a weighted average specific activity was used to calculate the waste mass on the filters during this period The weighted average specific activity was calculated based upon the number of RMCS segments taken from each tank sampled The number of RMCS segments obtained during
A-2
RPP-4826 Rev 1
each period for which NDA measurements were made are listed in Table A-I These values were obtained from Table F-I A weighted average specific activity for the waste on the filters in Period 4 was obtained by
[[O 227 mCigl[lO segl+[Ol2lmCigl[lO seg1+[0225 mCigl[l(l seg]+[Ol30 mCig][l2 seg]]+[SO segments] = 0182 mCi Csrdquorsquog
Calculating a weighted average based upon the number of segments assumes aerosol generation is roughly the same per segment and the specific activity of a radionuclide is constant throughout a tank These assumptions are adequate for the purpose oftbis document Aerosol generation can vary with water content waste hardness depth of sample taken nitrogen flow rate and porosity of the waste An in-depth evaluation of these parameters is beyond the scope of this document The impact of these variables is assumed to average out over all the RMCS segments taken The specific activities used do not vary greatly from tank to tank so any variations will not have a significant impact on the final aerosol results See Appendix E for further discussion of limitations on specific activities used in this document
For Period 5 the filters were new at the start and the only tank sampled with the exhauster was TX-I 13 Therefore the specific activity of CsI3rsquo for TX-I 130130 mCig was used
The same exhauster and filters used for Period 4 were used for Period 6 The net increase in Csrdquorsquo for Period 6 was determined by subtracting the Period 4 Csrdquorsquo from the total Since this net increase was only due to TX- 118 the specific activity of Csrdquorsquo for TX-I 180130 mCig was used for the waste added to the filters in Period 6 (Note it is only a coincidence that TX-I 13 and TX-118 have the same nominal Csrdquorsquo concentration)
The total mass of waste on the filters for Period 4 was thus
050 mCi i 0182 mCig waste = 275 g waste in exhauster housing
The mass of waste added to the exhauster for Period 5 was
0032 mCi + 0130 mCig waste = 025 g waste in exhauster housing
The mass of waste added to the exhauster for Period 6 was
(064 mCi - 050 mCi) + 0130 mCig waste = 11 g waste in exhauster housing
Aerosol Calculations
The tank head space particulate concentration was obtained by dividing the mass of waste sent to the exhaust stream by the volume of air sent to the exhauster The volume of air to the exhauster was obtained by multiplying the exhauster flow rate by the exhauster run times for each tank from Table F-I
For the RMCS exhausters the recorded exhauster flow rate is reported in standard cubic feet per minute (scfm) The RMCS exhauster flow rate is controlled to a nominal 200 scfm The exhauster flow rate was corrected to an actual cubic feet per minute (acfm) before calculating the tank head space aerosol concenmtion Table F-l includes the actual cfm flow rates
The calculated flow rates during RMCS for the tanks sampled during Period 4 were 207 acfm (S-1 lo) 206 acfm (U-107) 208 amp 209 acfm (BY-105) and 203 acfm (TX-I 13) The total volume oftank air through the exhauster during Period 4 was thus
[[207 cfm][ 15978 hr]+[206][27385]+[208][13577]+[209][30792]+[203][30230]][60 minh] = 146 E+7 Arsquo
The average tank head space mass concentration during RMCS in the above tanks was
[275 g + 146 E+7 Arsquo] x [35315 ftrsquomrsquo] = 664 E-6 average g waste per m3 in exhauster inlet
A-3
RPP-4826 Rev I
The gas flow rates and average tank head space mass concentrations during RMCS for Periods 5 and 6 were calculated in a similar manner
The average mass of waste in a tank head space during RMCS was calculated by multiplying the tank head space mass concentration by the tank head space volume from Table F-2 as shown below for S-1 I O
[275 g + 146 E+7 Arsquo] x [89100 ftrsquo] = 167E-2 g waste in S-1 IO head space
The particulate quantities in the other tank head spaces were calculated in a similar manner The weighted average mass in a tank head space during Period 4 was based upon the number of segments taken in each tank
The mass sent to the exhauster per RMCS core or per RMCS segment was obtained by dividing the mass of waste sent to the exhaust stream during each period by the numbers of RMCS cores or RMCS segments obtained during the exhauster operating time The average mass of waste sent to the exhauster during Period 4 is thus
275 g waste + 7 rotary cores = 39E-1 g wastelrotary core
and
275 g waste + 50 rotary segments = 55E-2 g wasteirotary segment
The mass of waste to the exhauster per RMCS core and RMCS segment for Periods 5 and 6 were calculated in a similar manner
All data were input to a spreadsheet to perform the calculations Results are provided in Table A-3
Summary of Calculations
Non Destructive Assay was performed on the RMCS exhauster filter housings used during three separate exhauster operating periods during which IO RMCS cores and 65 RMCS segments were obtained from five tanks Weighted averages of the average tank head space mass concentration average mass of suspended solids in a tank head space and average mass sent to the exhauster per RMCS core or segment for the three periods combined were calculated based upon the number of RMCS segments taken during each period Based upon RMCS exhauster housing NDA data the results indicate that
The average tank head space mass concentration during RMCS was 77E-6 g wastelmrsquo The average mass of suspended solids in the tank head space during RMCS was 18E-2 g waste The average mass sent to the exhauster during RMCS was 52E-1 g wastelcore The average mass sent to the exhauster during RMCS was 63E-2 g wasteisegment
A-4
RPP-4826 Rev 1
APPENDIX B
ESTIMATION OF AEROSOLS GENERATED DURING RMCS BASED UPON Rh4CS EXHAUSTER HEPA FILTER DOSE RATES
B-0
RPP-4826 Rev I
APPENDIX B - Estimation Of Aerosols Generated During RMCS Based Upon RMCS Exhauster HEPA Filter Dose Rates
Summary of Method
This method of estimating RMCS aerosol quantities divides the dose rate increase (mRhr) at the side of the RMCS HEPA filter housing by a calculated dose conversion factor (mRhrmCi C S rdquo ~ ) to obtain an approximation of the radionuclide quantity in the housing This radionuclide quantity is divided by the waste specific activity (mCig) to determine the mass of waste on the HEPA filter Dividing the HEPA filter waste mass by the volume of air passing through the filter provides an estimate of the average tank head space particulate concentration during RMCS Multiplying the average tank head space particulate concentration by the tank head space volume gives an estimate of the average mass of suspended particulates in the tank head space during RMCS Dividing the HEPA filter waste mass by the number of RMCS cores or RMCS segments provides the mass per RMCS core or per RMCS segment sent to the exhauster
Description
Particulates in the exhaust stream are removed by the HEPA filter(s) upstream of the exhaust fan The captured particulates contain radionuclides with CSrsquo~rsquo being the predominant gamma emitter As the particulate quantity on the HEPA filter increases the dose rate at the side of the filter housing will increase proportionately By monitoring the HEPA dose rate at the side of the filter housing the quantity of Csrsquordquo on the HEPA can be estimated This C S rdquo ~ value is then used to back-calculate to a waste mass quantity on the filter using the Csrsquordquo concentration in the tank waste This filter waste mass quantity is used to calculate the concentration of particulates in the tank exhaust stream the total suspended solids in the tank head space and the mass of waste sent to the exhauster for each RMCS core or segment taken Although radionuclides will be trapped on both the prefilter and the primary HEPA filter with a very small amount on the secondary HEPA calculations in this section were based upon the simplifying assumption that all the activity was on the primary HEPA filter
During RMCS exhauster operation the dose rate in m M r at the side of the HEPA filter housing is periodically measured with an Eberline RO-3B per procedure to indicate when radioactive particulates are building up on the filter The limit of detection of the RO-3B is 05 mRhr
Exhauster operations were divided into six operating periods for evaluation in this document These periods are discussed in Appendix F and shown in Table F-I Housing dose rate data were obtained for Exhauster Operating Periods I 24 5 and 6 Relevant information for these periods is also listed in Table B-I Dose rate data are available and were used for all tanks on which an RMCS exhauster was present and RMCS samples were taken This includes BY-106 BY-IO5 (1995) BY-I IO S-l I O U-107 BY-IO5 (1998) TX-113 and TX- 1 18 The dose rate at the end of a period was used as the basis for calculating radionuclides on the filters The only operating period for which dose rate data were not used for estimating filter radionuclide content was Period 3 Period 3 was for RMCS in SX farm using the SX exhauster
The dose rate at the side of the SX exhauster HEPA filter housing was measured during RMCS of SX farm tanks (for sampling of tanks SX-lot SX-102 SX-103 and SX-105) but the data are not useful for estimation of aerosol quantities because the SX exhauster draws on 13 tanks in parallel or in series with the tank being core sampled Many of the tanks have a much higher off gas flow rate than the sampled tank In addition there is background radiation in the area of the SX exhauster filter housing making any increase in the housing dose rate during RMCS difficult to detect
Dose Rate Data
The dose rate data for each period is listed in Table 8-2 No dose rates above minimum detectable limits were evident at the sides of any RMCS exhauster in Periods I 2 and 5
Dose rate measurements were less than detectable for Period 4 during sampling of S-l IO and U-107 When sampling on BY-IO5 there were a few readings of 07 m M r but most were ltOS mRhr This variation in
B- 1
RPP-4826 Rev 1
readings is to be expected as the specific instrument person using the instrument and location at which the dose rate is checked can vary with time The final recorded dose rate when sampling was complete on BY-IO5 was lt05 mRhr At the end of Period 4 following completion of the first core in TX-I 13 Exhauster C was listed as having a 07 m M r dose rate
Period 6 used Exhauster C again with the same housing and filters as at the end of Period 4 The final dose rate for this period was 08 m M r
Periods 124 and 5 all began with a new housing and new filters For Periods 12 and 5 it was conservatively assumed that the final dose rate was equal to 05 m M r giving an increase of 05 mRhr for each of these periods For Period 4 the dose rate increase was 07 m M r for this period Since Period 6 used the same housing and filters as Period 4 the increase for Period 6 was 08 - 07 = 01 m M r
The dose rate increase was converted into a CsIh content on the primary filter for each period Foust 1999 provides various dose rates for an RMCS exhauster housing assuming even dispersal of 1 mCi C S rdquo ~ on the first HEPA filter Using these calculations Schofield 2000a estimated a dose rate conversion factor of 16 mRhrmCi C S rdquo ~ at the detector location for an RO-3B The assumption that radionuclides are evenly distributed on the HEPA is a reasonable assumption based upon the exhauster design and the method used to measure the radiation dose rate
Gamma emitting contribute to the dose rate due to bremsstrahlung radiation and other nuclides may provide some small additional dose but the major penetrating dose rate contributor in aged SST waste is CSrdquo~ Ignoring the presence of all radionuclides (including Srm) except C S rdquo ~ in calculating a HEPA filter waste mass will provide a conservative result This is because assuming all radiation present is due to C S rdquo ~ will result in overestimating the C ~ I ~ ~ c o n t e n t of the filter housing which in turn will result in overestimating the waste mass on the HEPA filter
Dividing the HEPA dose rate for each exhauster installation by the dose conversion factor of I 6 mRhrmCi results in an increase of 031 mCi Csrdquorsquo on the RMCS exhauster filters for Periods I 2 and 5044 mCi for period 4 and 0063 mCi for Period 6
Calculation of Mass Quantity on Filters
Dividing the Csrdquorsquo content of the filters by the specific activity of C S rsquo ~ ~ in the waste gives the estimated mass of waste sent to the exhauster The specific activity value used for the waste in each tank sampled is given in Table E-I Since RMCS was performed on more than one tank in Periods 1 and 4 a weighted average specific activity was used for these periods The weighted average specific activity was calculated based upon the number of RMCS segments taken from each tank sampled during that period The number of RhKS segments obtained during each period are listed in Table B-I These data were obtained from the individual tank data in Table F- I Calculations to estimate the specific activity of waste mixtures were performed in the same manner as shown in Appendix A For Periods 2 5 and 6 RMCS samples were taken in only one tank The waste specific activity used for these periods was the specific activity of the tank sampled The specific activities used for each exhauster operating period are given in Table B-I
For all exhauster installations except BY-IO6 in 1994 and 1995 the RMCS exhausters were hooked directly to the waste tank When sampling BY-106 a prefilter was installed in the tank riser between the tank and the exhauster The prefilter was not used for BY-I IO in Period 1 or for any other tank in any other period Thus for Periods 2 4 5 and 6 the mass of waste on the HEPA was assumed equal to the mass of waste leaving the tank risers For Period 1 the mass of waste on the HEPA had to be adjusted for the BY-106 prefilter DF when estimating the combined mass of waste leaving the BY-IO6 and BY-I IO tank risers The mass of waste on the HEPA for Period 1 was
[031 mCi] [IO00 pCimCi] = 310 pCi
[310 pCi Csrdquorsquoon HEPA] + [I77 pCi C S rdquo ~ ~ waste] = 177 gwaste on HEPA
is the predominant radionuclide contributor to filter dose rates Beta emitting Srw can
on HEPA
B-2
RPP-4826 Rev 1
A decontamination factor (DF) of 5 was used to account for radionuclide removal by the BY-IO6 prefilter (see Appendix D for basis ofprefilter DF) There were 1 1 RMCS segments taken from BY-IO6 and 13 from BY- 1 IO The total mass ofwaste assumed to exit the tank risers was therefore
[ I 77 g waste] [ 1 1 + 131 [[I 151 + 131 = 28 g waste from tank risers
The DF of 5 to account for the prefilter is only applicable to the RMCS of BY-IO6 in 1994 and 1995 for all other exhauster periods the mass of waste on the HEPA was equal to the mass of waste sent to the exhauster riser
The mass of waste sent to the exhauster for Period 2 was
[031 mCi] [IO00 pCimCi] = 310 pCi Csrdquorsquo on HEPA
[3 IO pCi C S rdquo ~ on HEPA] + [225 pCi CsiI7g waste] = I 39 g waste from tank
Using the same formula the mass of waste to the exhauster from Periods 4 and 5 was 241 and 240 g respectively and the increase in waste on the filters for Period 6 was 048 g
Aerosol Calculations
The mass sent to the exhauster per RMCS core or per RMCS segment was obtained by dividing the mass of waste leaving the risers by the number of RMCS cores or RMCS segments obtained during the exhauster operating period
The tank head space particulate concentration was obtained by dividing the mass of waste leaving the riser by the volume of gas sent to the exhauster This volume of gas sent to the exhauster was obtained by multiplying the exhauster flow rate by the exhauster run time from Table F-I The calculations for aerosols generated based upon HEPA dose rates use acfm while the exhauster flow is recorded in scfm so the actin flow rates in Table F- 1 were used
The average mass of aerosols in the tank head space was obtained by multiplying the average tank head space particulate concentration by the tank head space volume from Table F-2
Following is an example of how the mass per RMCS core mass per RMCS segment average tank head space mass concentration and average mass of aerosols in the tank head space were calculated for Period 1 Data used are from Tables E-I F-I and F-2
[200 scfm] [2992+2916] [84 + 4591 + 528 = 21 1 acfm to exhauster from BY-IO6 in 11-1294
using same formula results in 210 acfm for BY-IO6 in 195 and 209 acfm for BY-I IO
28 g waste + [((21 1 acfm)(4878 hr)+(21O)(l867)+(209)(1125))(60 minhr)]= 12E-6 g wastelf to risers
[12E-6 amp] [35315 fmrsquo] =43E-5 g wastemrsquoto risers
[12E-6 gftrsquo] [53700 Arsquo in BY-106 head space] =66E-I g waste in BY-IO6 head space during RMCS
[12E-6 piftrsquo] [92000 ftrsquo in BY-110 headspace] = IIE-l g waste in BY-I10 head spaceduring RMCS
[28 g waste] [5 RMCS cores] = 56E-1 g waste per core to riser
[28 g waste] + [24 RMCS segments] = 12E-1 g waste per segment to risei
8-3
RPP-4826 Rev 1
All data were input to a spreadsheet and the mass to exhauster per RMCS core mass to exhauster per RMCS segment average tank head space mass concentration and average mass of aerosols in the tank head space were calculated for each of the RMCS exhauster operating periods in the same manner as shown above Results are given in Table 8-3
Summary of Calculations
RMCS exhauster operations were segregated into five operating periods during which RMCS was performed The Exhauster B data for BY-IO8 and TX-I 13 riser 3 was not used in these calculations as no RMCS was performed when the exhauster was operating Exhausters were operated in seven tanks during which 16 RMCS cores and 92 RMCS segments were obtained Based on RMCS filter housing dose rate data the results indicate that
These values are conservative as the assumed dose rate at the end of RMCS for Periods I 2 and 5 was assumed to be 05 mRhr In addition using a DF of 5 for the BY-IO6 prefilter skews the results high The in-tank prefilters used in both BY-IO6 sampling events showed no detectable contamination
Operatin Periods 4 and 6 were the only periods with exhauster housing dose rates above detectable The 044 mCi Csrsquordquo and 0063 mCi CsIh increase on the filters for these two periods based upon dose rate data correspond to the 050 mCi CsI3rsquo and 014 mCi Csrdquorsquo increase on the filters for these two periods based u on NDA data (see Appendix A) The 031 mCi C S rdquo ~ for Period 5 is significantly above the 0032 mCi Cslrsquolsquofor the same period determined by the NDA but this is due to assuming the housing dose rate was equal to the minimum detectable 05 mRhr
The average tank head space mass concentration during RMCS was 22E-5 g wastem3 The average mass of suspended solids in the tank head space during RMCS was 47E-2 g waste The average mass sent to the exhauster during RMCS was 59E-1 g wastelRMCS core The average mass sent to the exhauster during RMCS was 1OE-1 g wastelRMCS segment
B-4
v m
__ ~~
RPP-4826 Rev 1
APPENDIX C
ESTIMATION OF AEROSOLS GENERATED DURING RMCS BASED UPON CGM IN-LINE FILTER PAPER ANALYSES
c-0
RPP-4826 Rev I
APPENDIX C - Estimation Of Aerosols Generated During RMCS Based Upon CGM In- Line Filter Paper Analyses
Summary of Method
This method of estimating RMCS aerosol quantities uses radionuclide assay data from in-line filter papers located upstream of continuous gas monitors (CGM) sampling the tank air for flammable gases during RMCS The radionuclide content of the filter paper is divided by the waste radionuclide specific activity and the air flow through the CGM to obtain an estimate of the average mass concentration in the tank head space during the time period the CGM is on Multiplying the estimated average tank head space mass concentration by the tank head space volume gives an estimate of the average mass of particulates in the tank head space during RMCS To obtain the mass per RMCS core or per RMCS segment sent to the exhauster the tank head space average mass concentration is multiplied by the volume of gas sent to the exhauster then multiplied by a correction factor to account for particulates in the head space removed by the exhauster when the CGM is not operating and divided by the number of RMCS cores or RMCS segments
Description
During most tank waste intrusive activities performed since 1996 an intrinsically safe CGM located above ground has been used to continually monitor the tank air for flammable gases during in-tank activities The CGM sampling method draws air directly from the tank head space During RMCS the CGM sampling line is placed in the tank dome space The sampling line is located between the sampling riser and the exhaust riser if practical A pump in the CGM draws tank air up through the line at 05 litmin for measurement of the lower flammability limit (LFL) by the CGM A filter paper is installed in the sampling line upstream of the CGM to protect the unit from internal contamination
Following CGM use the CGM filter papers are normally discarded after monitoring them in the field for contamination To help estimate the tank head space particulate levels during RMCS these filter papers were retained and analyzed in the 222-S laboratory following removal from all tanks in which RMCS was performed from the fall of 1997 through April 1999 Data were collected for the four tanks in SX farm in which RMCS was performed and the next four tanks on which the RMCS exhauster was deployed These tanks are listed in Table c-I Reported CGM Data
The CGM operational data used to estimate aerosol levels during RMCS includes CGM operating times CGM flow rates and filter paper analytical data A summary report containing all the field operating data sheets for CGM usage and lab data was prepared following completion of sampling on each tank for all tanks except TX- 113 For TX-I 13 a separate report was prepared following each core These reports are References CGM-I to CGM-9 The CGM data from these reports are provided in Table C-2
There were 14 CGM installations during RMCS when CGM filter papers were collected and analyzed Each of these installations had Csrdquorsquo total alpha and total beta quantities measured on the filter papers resulting in 42 data points Eight of the measurement results were very low and had errors of gt+-loo These values were not used resulting in a net of 34 data points for calculating average head space mass concentrations based upon CGM data
Calculated Tank Head Space Radionuclide Concentrations
To calculate the average tank head space radionuclide concentrations during RMCS the filter paper radionuclide quantities were first divided by an efficiency factor to account for radionuclides which may not have been captured on the paper This adjusted radionuclide value was divided by the volume of tank air passing through the paper to give the average tank head space radionuclide concentration
The efficiency used for most stack samplers onsite is 73 (see Appendix D) Estimates attached to References CGM-I to CGM-9 indicate the CGM filter paper sampling method used should have a sampling efficiency
c- 1
RPP-4826 Rev 1
exceeding 73 For conservatism a sampling efficiency of 50 was assumed in this document for the CGM filter paper method
The estimated Csrdquorsquo total alpha and total beta concentrations in the tank vapor space were calculated by dividing the radionuclide quantity on the filter paper from Table C-2 by the assumed CGM sampling efficiency of 05 and the volume of gas going to the CGM The volume of gas going to the CGM was calculated by multiplying the time of CGM operation from Table C-2 by the CGM flow rate of 500 mlmin For example the calculated SX- 101 head space C~rsquorsquo~concentration based upon analysis of the CGM filter papers used during RMCS of riser 19 is
[[26E-4 pCi + 051 + [[I755 min][500 mlmin]] = 59E-I0pCiml
All radionuclide concentrations were calculated in a similar fashion Results are given in Table C-3 Table C-3 lists the radionuclide concentrations for all 42 data points The eight radionuclide concentrations not used for estimating mass concentrations are noted
Table C-3 also contains the calculated number of tank head space changeouts by the tank exhauster during CGM operation Tank head space changeouts were calculated by multiplying the exhauster flow rates (in actin) from Table F-1 by the CGM run times from Table C-2 and dividing by the tank head space volumes from Table F-2 The number of tank head space changeouts during CGM operation was used when estimating the waste mass sent to the exhauster See Aerosol Calculations section below for explanation
Aerosol Calculations
Average tank head space mass concentrations based upon CGM filter paper data were calculated by dividing the head space radionuclide concentrations from Table C-3 by the waste specific activities for each tank sampled The waste specific activities used came from Table E-I and are listed again in Table C-I The average of the mass concentrations based upon radionuclide data for each tank was used as the average head space mass concentration for that tank For example the calculated SX-IO1 head space mass concentration analysis from the CGM filter papers used during RMCS of riser 19 is
[59E-10 pCi Csrdquorsquoml+ 112 pCi C S rdquo ~ ~ waste] [ 28317 mlftrsquo] = 1 SE-7 g wasteA3 based upon C S rdquo ~
[ I 7E-I I pCi T A M + 504E-1 pCi TAg waste] [ 283 17 mlftrsquo] = 94E-7 g wasteamprsquo based upon Total Alpha
[43E-9 pCi TBml+ 357 pCi TBg waste] [ 28317 mlArsquo] = 34E-7 g wastel based upon Total Beta
[ [ I 5E-7 + 94E-7 + 34E-7 g wasteArsquo] f 31 = 48E-7 g wasteamp
[48E-7 g wastelt ] [3531467 Arsquom3] = 17E-5 g wastemrsquo
All tank head space mass concentrations were calculated in the same manner The results are presented in Table C-4 The weighted average tank head space mass concentration during RMCS was based upon the number of RMCS segments taken for each data point
The average aerosol mass in the head space during RMCS was calculated by multiplying the average tank head space mass concentration by the tank head space volume from Table F-2 For the same data point as above
[48E-7 g waste Arsquo] [115E+5 Arsquo] = 55E-2 g waste in SX-IO1 head space during RMCS
All average mass quantities present in the tank head space during RMCS were calculated in the same manner using a spreadsheet The results are provided in Table C-4 The weighted average mass of waste in a tank head space in Table C-4 was calculated based upon the number of segments obtained for each data point
Estimation of the mass of waste sent to the exhauster per RMCS core or segment requires calculation of the total mass of waste sent to the exhauster Multiplying the average head space concentration during RMCS by the exhauster flow rate (in acfm) and the time of CGM operation will give the mass of waste sent to the exhauster during the CGM time frame only While the large majority of mass of waste aerosols will have exited the tank or
c -2
RPP-4826 Rev I
resettled by the time the CGM is shut off there could be some residual suspended particles remaining These would eventually pass to the exhauster but would not be picked up by the CGM filter since it was not in service An adjustment factor was used as described in the following paragraphs to account for particles that may exit to the exhauster following shut down of the CGM
Particulates are generated by RMCS when purge gas is blowing out the drill string and the bit is rotating under the waste surface This time averages about six minutes per segment Multiplying the number of RMCS segments per core by six minutes per segment and dividing by the number of minutes of CGM operation shows the creation of particulates will only occur during a nominal 3-4 of the time the CGM is operating During RMCS the normal practice is to install the CGM turn it on when personnel enter a tank farm and keep the unit in constant operation for the remainder of the shift When the portable RMCS exhauster is used the exhauster is normally started at least an hour before RMCS is initiated and kept in operation until it is time to halt operations for the week The SX exhauster is kept in constant operation Comparing exhauster operating times from Tables F-l with CGM operating times from Table C-I it can be seen the CGMs are in operation about 3-15 of the time the RMCS exhauster is operating on a tank This time comparison wasnrsquot estimated for the SX exhauster since the SX exhauster is in constant operation
With CGM operation much longer than the time period when particulates could be generated the majority of particulates generated by RMCS should have settled or been exhausted during the CGM operating period Table C-3 shows the tank head space changeouts made by the exhauster during CGM operating periods ranged from 084 to 63 The average was 24 With the CGMs operating 25-33 times longer than the aerosol generation periods and an average of over two tank head space changeouts during CGM operation the large majority of aerosols generated during RMCS will have settled out or been removed by the exhauster by the time the CGM is shut off To account for particulates remaining in the tank head space after the CGM was turned off that are subsequently removed by an exhauster it was conservatively assumed that 20 of the total mass of particles generated during RMCS were not removed from the tank head space during the CGM operating period Therefore the product of the tank head space concentration and the volume of air sent to the exhauster during the time of CGM operation was multiplied by a factor of 125 (lOOl80) to estimate the total mass of waste sent to the exhauster as a result of RMCS This is shown below for the same SX-IO1 riser 19 data point in the above calculations
[48E-7gA3] [IOOmin] [I755 min] [125]= 11E-l gwastetoexhauster
This value was divided by the number of RMCS cores and RMCS segments from Table C-1 to provide the grams per core and grams per segment in Table C-4 as follows
[ I I E- 1 g waste to exhauster] i 1 core = 11 E-I g wastelRMCS core to exhauster
and
[ 1 I E- 1 g waste to exhauster] + 5 segments = 2 I E-2 g wastelRMCS segment to exhauster
All mass per core and mass per segment values were calculated in the same manner using a spreadsheet The results are provided in Table C-4 The weighted average mass per core and mass per segment in Table C-4 were calculated based upon the number of cores or segments obtained for each data point
Summary of Calculations
There were 34 valid CGM filter paper data points from 14 RMCS CGM sampling periods in eight tanks during which I5 RMCS cores and 79 RMCS segments were obtained Based upon CGM filter paper data the results indicate that
The average tank head space mass concentration during RMCS was 4OE-5 g wastem3 The average mass of suspended solids in the tank head space during RMCS was 97E-2 g waste The average mass sent to the exhauster during RMCS was 18E-1 g wastelRMCS core The average mass sent to the exhauster during RMCS was 34E-2 g wastelRMCS segment
c - 3
RPP-4826 Rev 1
Ignoring all CGM filter paper analytical data points with a variance gtloo will result in conservative results These data points indicate negligible radioactivity was present If a value of zero was assigned to each data point with an analytical error of gtloo instead of ignoring the data point the weighted average particulate quantities in Table C-4 would be reduced by about 12
The average tank head space mass concentrations based upon CGM data will be higher than the average tank head space mass concentrations based upon filter housing NDA or dose rate The RMCS exhauster received tank air from the shifts when sampling was performed and during some of the off-shifts when no sampling was done The CGMs were only operated during the shifts when sampling was performed The air concentration drawn into the CGM and the RMCS exhauster should be roughly the came during the operating shifts but somewhat less during the off-shifts Therefore the tank head space concentration will be higher when based upon CGM data This does not impact the mass of waste sent to the exhauster per core or per segment
c -4
I
- ~
RFP-4826 Rev 1
APPENDIX D
ESTIMATION OF Rh4CS EXHAUSTER HOUSING DECONTAMINATION FACTOR
D-0
RFrsquoP-4826 Rev 1
APPENDIX D - Estimation of RMCS Exhauster Housing Decontamination Factor
Summary of Method
This Appendix estimates a Decontamination Factor (DF) for the RMCS exhausters using housing NDA data and applicable stack record sample data The Csrdquorsquo in the exhauster effluent is divided by the C S rdquo ~ in the exhauster inlet to provide a penetration efficiency The reciprocal ofthe penetration efficiency is the DF
Description
Each RMCS exhauster has an isokinetic sampler located on the stack downstream of the blower and HEPA filters A small pomp pulls air from the exhaust stack into a filter paper at a rate proportional to the exhaust flow Radionuclides in the exhaust stream passing through the sample line are caught on the filter paper The stack operating time and flow rate are recorded When the record sample filter paper is removed the filter paper is analyzed in a laboratory for radionuclides The radionuclide concentration in the stack effluent stream is calculated by dividing the quantity of material on the filter paper by the volume of air through the sampler and then dividing again by a factor to compensate for stack sampler and filter paper efficiency
Multiplying the total beta stack effluent concentration by the total off gas flow gives the total beta emissions from the exhauster The total beta emissions are multiplied by the Csrdquorsquo to total beta ratio for the waste in the tank) being exhausted to give an estimate of the C S rdquo ~ emission The C S rdquo ~ on the filters determined by NDA of the housing (see Appendix A) is added to the C S rdquo ~ emissions to give the total C S rdquo ~ input to the filter housing Dividing the emissions by the input gives the filter housing penetration efficiency Subtracting the penetration efficiency from 1 O gives the filter housing efficiency Dividing 1 O by the penetration efficiency gives the DF
RMCS Stack Record Sample Data
RMCS exhauster stack record samples are taken after completion of each sampling event on a tank Normally this is after all cores on that tank have been obtained but for BY-IO5 in 1998 record samples were taken following each core Record samples are also taken at the end of each year All samples are analyzed for total alpha and total beta At the end of each year all the filter papers for that year are composited and analyzed for individual radionuclides Sample results are entered into the Automated Bar Coding of Air Samples at Hanford (ABCASH) and Environmental Release Summary (ERS) databases Several ofthe filter papers from 1998 were reanalyzed using a longer count time to bring the error rate down
Schofield 2000b compiled and evaluated all available RMCS exhauster stack record sample data filtered out the unusable data provided derivation for the stack sampling efficiency factor and summarized the results Most of the data points were so low as to be unusable since the results were either negative or had error variances gtloo
Column 5 of Table D-1 provides the stack effluent concentrations used for calculation of the filter housing DF The stack effluent data in Table D-l come from Schofield 2000b These values include a 073 sampling efficiency factor
Calculation of RMCS Filter Housing Decontamination Factor Based upon Housing Inlet and Outlet Data
The RMCS exhauster housing NDA and stack record sample data available for exhauster Operating Periods 4 5 and 6 were used to estimate an actual DF for the RMCS exhauster housings The housing NDA data is for CSrdquo~ but there are no usable Csrdquorsquo concentrations for the RMCS exhauster outlet The RMCS exhauster stack Csrsquordquo concentrations are either negative have a variance gtloo or are not available Total beta analyses are available however so the stack eftluent C S rdquo ~ concentrations were estimated by multiplying the total beta concentration by the ratio of Csrdquorsquo to total beta in the tank waste
Column 2 of Table D-l lists the increase in CSrsquo~ on the filters for each operating period as determined by NDA This data was obtained from Table A-2
D- 1
RPP-4826 Rev 1
Column 4 of Table D-l lists the stack exhaust volume for each stack record sample period The stack exhaust volume for the exhauster installation on S-l IO was calculated by
[ZOO std ft3min][15978 hrs] [60 minhr] = 199E+6 std ftrsquo
All other stack volumes in Table D-l were calculated the same way Unlike in Appendices A B and C no adjustment was made to change the 200 scfm to actual cfm This is because the RMCS stack record sample concentrations from Table D-3 are based upon a 200 scfm flow rate rather than the actual flow rate Since the concentrations are on the same basis as the flow rate there is no need to correct to acfm
The total beta emissions for the RMCS exhauster stack were calculated by multiplying the volume by the concentration For the same S-l IO data point
[199E+6 ft3] [18E-15 pCiml] [28317mlft3] [mCi1000 pCi] = 1OE-7 mCi total beta
All other total beta emissions in Table D-l were calculated the same way
The Csrdquorsquo to total beta ratio was calculated from data in Table E-I For the same S- l I O data point
326E+5 Ci CsI3rsquo f I 14E+6 Ci total beta = 029 Ci CslhCi total beta = 029 rnCi CsrdquorsquomCi total beta
The Csrsquordquo emission for the same S-l IO data point was thus
[I OE-7 mCi total beta] [029 mCi CsrdquorsquomCi total beta] = 29E-8 mCi Csrdquorsquo
All Csrsquordquo emissions in Table D-l were calculated in the same manner
The penetration efficiency for each operating period was calculated by dividing the exhauster outlet by the filter inlet Csrdquorsquo quantities For operating period 4 this was
[81E-6 mCi] f [5OE-I + 8IE-6 mCi] = 16E-5 = 16E-3
The DF for operating period 4 is
1 + 16E-5 = 62E+4
The overall DF for periods 4 5 and 6 was calculated by dividing the efluent from all three periods by the total filter input
[95E-6 mCi] f [67E-I t 95E-6 mCi] = 14E-5 = 14E-3 penetration efficiency
I - I 4E-5 = 0999986 = 999986 filter efficiency
1 f 14E-5 = 73E+4 decontamination factor based upon housing inlet and eftluent data
Estimation of Housing Decontamination Factor Based upon General Performance Data
HEPA filters are tested at the manufacturer to a minimum 9997 efficiency using a 03 pm monodisperse aerosol After installation HEPA filters are tested in-place per ASME N5 I O to a minimum 9995 efficiency using a polydisperse aerosol with an approximate droplet size distribution of 99 less than 30 pm 50 less than 07 pm and 10 less than 04 pm The RMCS exhauster housing is tested per ASME N510 and is thus required to have a minimum removal eficiency of 9995 for an aerosol with this approximate size distribution The particle size distribution of the waste aerosols generated by RMCS is unknown but it is assumed that the removal efficiency for RMCS generated aerosols was the same as the removal efficiency for the ASME generated test aerosol
D-2
RPP-4826 Rev I
A 9995 efficiency is equivalent to a DF of 2E+3 while a 9997 efficiency is equivalent to a DF of 33E+3 The actual DF for the RMCS exhauster housing is higher than either of these It has two HEPA filters in series even though the minimum efficiency specified in the NOCs for the RMCS exhausters is only equivalent to one HEPA ERDA 1976 recommends using a DF of 3000rdquo for a filter bank where n is the number of HEPA filters in series This would result in a DF of 9E+6 for the RMCS exhauster housing This is unrealistic Using a DF of 9E+6 will calculate to Csrdquorsquo quantities on the HEPA filtersthat are orders of magnitude above what have been shown to be there based upon the measured dose rates and NDA A DF of 9E+6 would mean the dose rate would have to be almost 100 mRhr at the side of the exhauster housing instead of the 05-08 mRhr dose rates encountered The waste particles will not have the same particle size distribution entering the second HEPA filter as when entering the first The majority of the waste particles will be captured on the I rdquo HEPA filter and although the DF for each HEPA if tested individually using the ASME N5 IO aerosol test method may be 3E+3 (or higher) the overall DF of the two filters in series will not be 3000lsquo This is because the particle size distribution entering the Znd HEPA could have a greater percentage of smaller particles than that entering the 1rdquo
NUREG 1995 included an evaluation of a number of different facility stacks at the Hanford site where the HEPA filter upstream air concentrations were estimated using several different methods This report concluded that back-calculation using a value of 3000rdquo overestimated the upstream radionuclide concentration by three to four orders of magnitude when compared to filter NDA data for the nine stacks for which NDA data were obtained and by three orders of magnitude for the two stacks for which upstream air sample data were available Back- calculation using a value of 3000rdquo was shown to be high by four orders of magnitude for the single stack for which a powder release estimate was available Based upon this information the RMCS exhauster dual filter-in-series housings would have a DF of at least three and maybe four orders of magnitude less than 9E+6 or in the 1E+3 to 1 E+4 range A DF of IE+3 would he less than the minimum permissible under the NOC Comparing the older stack data and design with the newer RMCS exhauster design the minimum DF would be expected to be at least 1E+4
Table D-2 provides the available RMCS exhauster aerosol test data This information was obtained from Waldo 1999 Prior to 1998 the RMCS exhauster primary HEPA filter efficiency and either the secondaly HEPA filter or the overall efficiency for both filters were tested Starting in 1998 only the primary and secondary HEPA filter efficiency were measured The overall efficiency of the two filters in series was only measured three times in 11 setups Twice the overall penetration efficiency was lt0002 and the remaining time the only information that could be found was a value of lt005 Most individual filters had a penetration efficiency of 0002 This appears to be about the limit of the detection equipment Based upon Table D-2 data a penetration efficiency of 0002 (99998 efficiency) is normal for a single HEPA and thus a minimum for an RMCS exhauster housing Assuming a 0002 penetration efficiency for the two filters combined calculates to a DF of 5E+4 (equal to 1 +
000002) for the RMCS exhauster housing
In summary the measured DF for the RMCS exhauster housings over the period from May 1998 through June 1999 was about 73E+4 RMCS aerosol testing prior to use indicates a DF of about 5OE+4 for each of the filters separately but their overall efficiency is not measured Referenced data based on older stacks at Hanford indicate the two HEPA RMCS exhauster housing would likely have a DF of at least IE+4
Estimated Aerosol Levels During RMCS Based Upon RMCS Stack Record Sample Data
Revision 0 of this document used the positive record sample results with variance less than 100 to estimate aerosol concentrations in the exhauster inlet using an assumed exhauster housing DF of 5OE+4 This method of estimating aerosols was eliminated from Revision 1 because the stack concentrations were either too low too scattered or too questionable to provide reliable results There were 112 RMCS stack record sample data points evaluated in Schofield 2000b Excluding the total beta sample results used for estimation of the housing DF there were only ten data points remaining with positive values and variances ltloo the remaining data points were either negative had a variance gtloo or the results were not available
For comparison purposes only Schofield 2000b applied the DF of 73E+4 calculated in this document to the data points not used to calculate the exhauster housing DF to estimate aerosol concentrations upstream of the filters The results showed aerosol levels approximately the same as those estimated using NDA dose rate or CGM filter paper data when a value of zero was used for negative sample results or those with a variance gtloo When only
D-3
RPP-4826 Rev 1
the ten positive results with a variance ltloo were used the aerosol levels calculated to be two to five times higher than those estimated using NDA dose rate or CGM filter paper data Because of the variability of data resulting from the extremely low record sample concentrations and the few useable data points estimation of aerosol levels using record sample data was not included in Revision I See Schofield 2000b for further discussion of the use of record sample data to estimate aerosol levels
Summary of Calculations
A total of nine RMCS exhauster stack record sample data points were used to estimate the RMCS exhauster filter housing decontamination factor These data points were obtained when sampling on five tanks during which 10 RMCS cores and 65 RMCS segments were obtained The overall decontamination factor was 73E+4
Estimation of aerosol generation quantities based upon RMCS stack record sample data is possible However results will likely be skewed high if data points that show non-detectable levels of radionuclides present are ignored instead of using a value of zero for the data point
D-4
RPP-4826 Rev 1
APPENDIX E
TANK WASTE RADIONUCLIDE CONCENTRATIONS USED FOR AEROSOL CALCULATIONS
E-0
RPP-4826 Rev 1
APPENDIX E - Tank Waste Radionuclide Concentrations Used for Aerosol Calculations
The RMCS exhauster NDA data HEPA filter dose rate data CGM filter paper data and stack record sample data provide information on the quantity of radionuclides on the exhauster filters in the tank head space or the exhauster stack during RMCS These radioactivity quantities need to be divided by the waste radionuclide concentration specific activity to determine the mass of waste in the tank head space and in the tank gases sent to the exhauster
The mass quantities in this document were calculated using dry basis radionuclide concentrations Waste particles carried into the tank head space by the purge gas could be wet or dry If wet some of the non-chemically bound water will start to evaporate immediately providing the tank relative humidity is 400 The water present in a waste particle may be chemically bound as a hydrate or free The chemically bound water will not readily evaporate therefore even a ldquodryrdquo particle may have some water associated with it It is impractical to measure the actual water content of the waste particulates caught on the CGM filter paper the exhauster HEPA filters or the stack record sample paper Since the quantity of water in the waste particulates is unknown particulate levels were calculated using dry basis radionuclide concentrations Thus all particulate values given in this document are stated on a dry basis
The waste radionuclide concentrations on a dry basis were calculated from data available in the Tank Waste Information Network System (TWINS) The Best Basis InventorylBest Basis Summary numbers were used These values are the most complete and up to date readily available estimates for Hanford waste tank contents but do not include water The information was downloaded from TWINS into a spreadsheet The total chemical total beta and total alpha quantities were summed in the spreadsheet for all the tanks which were sampled and concentrations for Csrdquorsquo Sr9rsquo total beta and total alpha automatically calculated in pCig These concentrations are provided in Table E-I Because lab techniques for measuring gross beta levels only detect beta particles with a minimum decay energy above 150-200 kev only radionuclides with a decay energy of gt-200 kev were included in the total beta numbers
The TWINS radionuclide concentrations were obtained in December 1999 No corrections were made for decay for this document
The CGM filter paper and stack record sample data indicate the measured radionuclide values are not always in the same ratio to each other as given by TWINS nor are all radionuclides detected that TWINS indicates are present Radionuclides can be distributed unevenly in a tank Soluble fission products (primarily Csrsquordquo) are found in the liquid saltcake and in sludges Insoluble fission products and actinides are found largely in sludges as these are primarily chemical precipitates Sludge could be mixed with saltcake be present in a distinct layer at the bottom of a tank or in several layers in the tank depending upon how waste was transferred into a tank Waste particles may thus not have the same specific activity on a microscopic scale as they would have on a macro scale were the tank contents homogenized During RMCS a top to bottom core sample is attempted resulting in the drill bit and purge gas (which causes aerosols to form) passing through most ofthe waste matrix Assuming the aerosol generation rate is approximately constant during drilling the specific activity of a radionuclide in the suspended solids should be roughly the same as the average specific activity of the same radionuclide in the tank waste While the waste specific activity is probably not homogeneous from top to bottom in a tank and the aerosol generation rate will likely also vary it is beyond the scope of this document to provide an in-depth analysis of all the factors affecting aerosol radionuclide concentration Although sample radionuclide data were not always in the same ratio as provided by TWINS for the purpose of this document the simplifying assumption was made that the average tank specific activity is adequate to provide an approximation of the suspended solids specific activity for all radionuclides Average tank individual radionuclide specific activities were used in the preparation of the exhauster NOCs
The aerosol calculations presented in this document are only as accurate as the TWINS data The combined radionuclide content of all Hanford waste tanks is known fairly well since the overall content is based upon reactor production records CsrdquorsquoSrW recovery data and processing plant discharges Thus TWINS data for all tanks combined should be reasonable There are undoubtedly differences between TWINS data and the actual contents of a specific tank While the specific tank radionuclide data from TWINS used in this document may not be exact deviations from the actual concentrations are assumed to balance out over the number of tanks sampled
E- 1
RPP-4826 Rev 1
APPENDIX F
ROTARY MODE CORE SAMPLING EXHAUSTER AND CORE SAMPLE DATA
F-0
RPP-4826 Rev 1
APPENDIX F - Rotary Mode Core Sampling Exhauster and Core Sample Data
This appendix provides the basic data obtained during RMCS operations which was used in preparation of this document
Basic Operational Data
There have been three RMCS exhausters and three RMCS sampling trucks deployed since starmp of nitrogen- purged RMCS in November 1994 The exhausters are formally designated 296-P-32296-P-33 and 296-P-34 These were originally referred to as parts of RMCS Systems 2 3 and 4 respectively in the Notices of Construction (NOC) for these units The exhauster designations were changed for routine field use in 1996 to exhausters A B and C to avoid confusion with core sampling trucks 23 and 4 since any exhauster could be used with any RMCS truck Exhauster A (2) and RMCS Truck2 have not been used for RMCS since 1995 and are no longer in service for core sampling
Rotary mode core sampling has been conducted in four general time frames since 1994 These time frames were separated by down times for equipment modifications or resolution of environmental permitting and safety concerns For ease of analysis in this document exhauster operations were organized into six distinct operating periods Periods I to 6 were grouped based upon times when the same exhauster and same set of HEPA filters were being used These periods thus overlap with the general operating time frames The four operating time frames were
The first time frame lasted from November 1994 to January 1995 RMCS Truck 2 and Exhauster 2 (A) were used on Tank BY-106 along with an in-tank prefilter This tank provided the initial deployment and testing of the nitrogen-purged equipment in a waste tank During this period radiation dose rates were taken at the side of the exhauster housing Stack record samples were taken in December 1994 and January 1995
The second time frame lasted from July 1995 through October 1995 RMCS Trucks 2 and 4 were used with Exhausters 2 and 3 (A and B) on BY-105 BY-IO8 and BY-I IO During this period radiation dose rates were taken at the sides of the exhauster housings Stack record samples were taken after completion of sampling on each tank No RMCS samples were taken from BY-108 all samples were taken in push mode for this tank
The third time frame began when RMCS was restarted in December 1997 Trucks 3 and 4 were used for sampling of SX-101 SX-103 SX-105 and SX-102 with the SX tank farm exhauster providing ventilation The RMCS exhausters were not used During this period radiation dose rates were taken at the sides of the SX exhauster housing as part of HPT routine surveys SX farm exhauster stack record samples were taken when required by normal operating procedures SX record sampler and filter housing dose rate data were not evaluated for this document It would not be practical using filter dose rate or stack record sample data to estimate the RMCS aerosol addition if any to the SX ventilation system The background radiation around the SX filter housing makes measurement of any small increase in dose rate very difficult to detect The number of tanks being ventilated and the involved off-gas header routings (the exhauster is pulling on thirteen tanks in series or in parallel with the tank being sampled) and any in-tank activities in the SX tanks not being sampled would make it impractical to assess what aerosols resulted from RMCS Beginning with RMCS in SX farm radionuclide analyses were performed on the filter papers protecting the CGMs which draw air out of the tank vapor space for flammable gas detection
The fourth time frame began in May 1998 Between 1095 and 598 Exhausters B and C were extensively modified with new filter housings and other equipment to meet new NOC requirements Trucks 3 and 4 were used with Exhausters B and C (3 and 4) on S-l IO U-107 BY-105 TX-113 and TX-I 18 This period marked the first use ofthe RMCS trucks and RMCS exhausters together following resolution of flammable gas concerns and modifications to the exhausters New filters were installed Radiation dose rates were taken at the sides of the exhauster housings Stack record samples
F- 1
RPP-4826 Rev I
were taken after completion of sampling for each exhauster installation Radionuclide analyses were performed on the CGM filter papers for all tanks except TX-118 An NDA was performed on the Exhauster C housing following completion ofthe first core on TX-I 13 The housing filters when assayed contained aerosols captured by the exhauster following RMCS in S-l IO U-107 BY-105 (1998) and the first core of TX-I 13 Another NDA was performed on Exhauster C following both cores in TX-I 18 An NDA was performed following sampling of the second core in TX-I 13 using Exhauster B The time frame ran through early June 1999 No RMCS samples have been taken after June 1999 nor are any planned for the next few years
For the purposes of evaluating aerosol formation based upon RMCS exhauster housing NDA and dose rate data the exhauster operations were grouped into 6 operating periods These periods are shown in Table F-1 and restated in Tables A-I and B-I All tanks sampled in Periods 1 2 4 5 and 6 were exhausted by the same exhauster with the same housing and filters present during that period Period 3 covered the time the SX exhauster was used during RMCS in SX farm
A brief description of each RMCS tank sampling operation is provided below
Tank 241-BY-1061194 to 1294 RMCS using the nitrogen purge gas system with an exhauster was formally begun on 111794 on tank BY-106 riser IOB Exhauster 2 (A)and Truck 2 were used A sintered metal prefilter was inserted in the riser between the tank and the exhauster A total of eight segments were taken in rotary mode and five segments in push mode until sampling was halted on 122194 One RMCS core was obtained The total exhauster run time was 4878 hours The stack record sample was removed and analyzed following this run period Dose rates taken at the side of the exhauster housing during RMCS were all lt05 mRhr The in-tank prefilter was smeared for contamination when removed from the tank with the smears showing less than detectable levels of radionuclides present (Waldo 1999) The prefilter had been washed with an installed spray system prior to removal from the tank but subsequent testing showed the water flow and pressure were too low to have been effective at removing contamination
Tank 241-BY-106195 Following some process modifications RMCS in BY-IO6 riser IOB began again on 11895 Exhauster 2 (A) and Truck 2 were used The sintered metal prefilter was inserted in the riser between the tank and the exhauster RMCS was halted on 12495 over authorization basis and equipment operability issues for RMCS A total of three segments were taken in rotary mode and eleven segments in push mode One RMCS core was obtained The total exhauster run time was 1867 hours The stack record sample was removed and analyzed following this run period Dose rates taken at the side of the exhauster housing during RMCS were all lt O S mRhr The in-tank prefilter was smeared for contamination when removed from the tank with the smears showing less than detectable levels of radionuclides present (Waldo 1999) The prefilter was not washed this time
Tank 241-BY-110795 to 1095 Following resolution of RMCS authorization basis and equipment issues and completion of the fabrication and testing of Trucks 3 and 4 RMCS was begun in BY-I IO on 71195 Exhauster 2 (A) and Truck 2 were used Samples were taken from risers 128 7 128 again and 4 There was no in- tank prefilter used in this or any subsequent RMCS periods Sampling was performed until 102595 when RMCS was halted over flammable gas issues A total of 13 RMCS segments and 56 PMCS segments were taken Three RMCS cores were obtained The total exhauster run time was 1125 hours The stack record sample was removed and analyzed following this run period Dose rates taken at the side of the exhauster housing during RMCS were all lt O S mRhr
Tank 241-BY-108795 to 895 Core sampling was begun in BY-IO8 on 72595 Exhauster 3 (B) and Truck 4 were used Sampling was done in risers 12A and 7 The tank material proved soft enough so that no RMCS segments were required all segments were obtained in push mode although the exhauster was operated during part of the time sampling was performed Sampling was completed 81895 A total of 16 PMCS segments were taken The total exhauster run time was 6617 hours The stack record sample was removed and
F-2
RPP-4826 Rev 1
analyzed following this run period Dose rates taken at the side of the exhauster housing during RMCS were all lt05 mRhr
Tank 241-BY-105895 to 1095 RMCS was begun in BY-I05 riser 12A on 83095 Exhauster 3 (B) and Truck 4 were used This tank has a concrete layer on top about 12-18 inches thick which had to be drilled through Part way through sampling questions arose as to the flammable gas status of the tank and RMCS was halted on 10695 A total of 3 RMCS and 7 PMCS segments were taken One RMCS core was obtained The total exhauster run time was 4413 hours The stack record sample was removed and analyzed following this run period Dose rates taken at the side of the exhauster housing during RMCS were all lt05 mRhr
Tank 241-SX-1011297 to 298 Following resolution of extensive regulatory and authorization basis issues and installation of equipment modifications RMCS started in SX-101 with Truck 4 on 12497 An RMCS exhauster was not used since all SX farm tanks excluding SX-113 and SX-I 15 are ventilated with the SX exhauster Sampling was performed in risers 19 and 4 and was completed on 21098 A total of 9 RMCS and 6 PMCS segments were taken Two RMCS cores were obtained SX exhauster stack record samples and filter housing dose rates were obtained as part of routine operations for the SX exhauster not as part of the RMCS process Filter papers used in the suction line for the CGM were saved and analyzed in the laboratory to estimate the airborne radionuclide concentration in the tank head space Two CGM filter papers were needed for each core as moisture in the tank vapors condensed on the papers in the cold weather and began to restrict tank gas flow to the CGM
Tank 241-SX-103498 to 598 RMCS started in SX-103 with Truck 4 on 42798 The SX exhauster was used for ventilation (see SX- 101 above) Sampling was performed in risers 7 and 1 1 and was completed on 51198 A total of 6 RMCS and 18 PMCS segments were taken Two RMCS cores were obtained During sampling filter papers used in the suction line for the CGM were saved and analyzed in the laboratory to estimate the airborne radionuclide concentration in the tank head space One CGM filter paper was used during each core SX exhauster stack record samples and filter housing dose rates were obtained as part of routine operations for the SX exhauster not as part of the RMCS process
Tank 241-SX-105298 to 598 RMCS started in SX-105 with Truck 3 on 22598 The SX exhauster was used for ventilation (see SX- 101 above) Sampling was performed in risers 6 and 14 and was completed on 51598 A total of 6 RMCS and 20 PMCS segments were taken Two RMCS cores were obtained During sampling filter papers used in the suction line for the CGM were saved and analyzed in the laboratory to estimate the airborne radionuclide concentration in the tank head space Two filter papers were needed for the first core as moisture in the tank vapors condensed on the papers in the cold weather and began to restrict tank gas flow to the CGM One filter paper was used for the second core SX exhauster stack record samples and filter housing dose rates were obtained as part of routine operations for the SX exhauster not as part of the RMCS process
Tank 241-SX-102698 to 798 RMCS started in SX-102 with Truck 4 on 61798 The SX exhauster was used for ventilation (see SX- 101 above) Sampling was performed in risers 8 and 4 and was completed on 7798 A total of 2 RMCS and I8 PMCS segments were taken Two RMCS cores were obtained During sampling filter papers used in the suction line for the CGM were saved and analyzed in the laboratory to estimate the airborne radionuclide concentration in the tank head space One filter paper was used for each core SX exhauster stack record samples and filter housing dose rates were obtained as part of routine operations for the SX exhauster not as part of the RMCS process
Tank 241-S-110598 to 698 RMCS was begun in S-I10 on 51898 Exhauster C (4) and Truck 3 were used This tank marked the first use of an RMCS exhauster since 1995 Sampling was completed on 6498 Risers 6 and 14 were sampled A total of IO RMCS and 8 PMCS segments were taken Two RMCS cores were obtained The
F-3
RPP-4826 Rev I
total exhauster run time was 15978 hours The stack record sample was removed and analyzed following this run period Dose rates taken at the side of the exhauster housing during RMCS were all lt05 mRhr During sampling filter papers used in the suction line for the CGM were saved and analyzed in the laboratory to estimate the airborne radionuclide concentration in the tank head space One filter paper was used for each core Waste particles retained on the exhauster housing filters were part of the inventory subsequently measured by NDA following completion of the first core in TX-I 13
Tank 241-U-107698 to 798 RMCS was begun in U-107 on 61098 Exhauster C and Trucks 3 and 4 were used Sampling was completed on 71598 Risers 7 and 2 were sampled A total of IO RMCS and 19 PMCS segments were taken Two RMCS cores were obtained The total exhauster run time was 27385 hours The stack record sample was removed and analyzed following this run period Dose rates taken at the side of the exhauster housing during RMCS were all 105 mRihr During sampling filter papers used in the suction line for the CGM were saved and analyzed in the laboratory to estimate the airborne radionuclide concentration in the tank head space One filter paper was used for each core Waste particles retained on the exhauster housing filters were part of the inventory subsequently measured by NDA following completion of the first core in TX-I 13
Tank 24l-BY-105798 to 898 RMCS was begun in BY-105 again on 72298 Exhauster C and Trucks 3 and 4 were used Sampling was completed on 82598 Risers 7 and 1 1 B were sampled A total of 18 RMCS and 18 PMCS segments were taken The material was hard enough to require rotary mode sampling all the way to the bottom of the waste but negligible recovery was obtained After RMCS was performed to the waste bottom a PMCS core was taken in the same hole to recover material Two RMCS cores were obtained The exhauster run time was 13577 hours for the first RMCS core and 30792 hours for the second RMCS core Stack record sample information in ABCASH shows 30558 hours operation for the second core but the sampler data sheet shows the time counter was mistakenly reset 234 hours into the run No correction was made to the BY-IO5 2nd core record sample concentration for this document since the error is conservative and results in only slightly higher (ltI) record sample radionuclide concentrations for this core A stack record sample was removed and analyzed following each core giving two record samples for BY-IO5 in 1998 Dose rates taken at the side of the exhauster housing during RMCS were almost all lt05 m R h but a few readings indicated 07 mRihr This variation was assumed due to personnel reading the instrument differently or the fact that the exhauster had been used on enough tanks that by now there was sufficient activity on the filters to cause readings approximately at the background detection level The final reading when both cores were completed was lt05 m R h During sampling filter papers used in the suction line for the CGM were saved and analyzed in the laboratory to estimate the airborne radionuclide concentration in the tank head space One filter paper was used for each core Waste particles retained on the exhauster housing filters were part of the inventory subsequently measured by NDA following completion of the first core in TX-113
Tank 241-TX-113998 to 599 Core sampling was begun in TX-I 13 riser 3 on 92298 Exhauster B (3) and Truck 4 were used at the start This was the first use of Exhauster B since it was modified Exhauster B ran for a total of 8738 hours until being disconnected on 102398 During this time two PMCS segments were taken and no RMCS segments Exhauster C was then installed and operated for 5598 hours from 121098 to 122898 No RMCS or PMCS sampling was performed during this time frame RMCS segments werent taken until 299 Exhauster C ran for a 30230 hours between 122898 and 21299 Sampling was completed on the core from riser 3 on 21299 A total of 12 RMCS segments were obtained during the time Exhauster C was operating Exhauster flow rate for both exhausters was a nominal 200 scfm Stack record samples were taken following Exhauster B removal at the end of 1998 for Exhauster C and following completion ofthe first core with Exhauster C Aerosol calculations were based on only the 30230 hours run time for Exhauster C in 1999 since this was the time period during which RMCS segments were obtained Dose rates taken at the side of the exhauster housing during the short PMCS only sampling period with Exhauster B were all ltOS m R h Dose rates with Exhauster C varied between lt O S mRhr and 07 mRhr The final reading on Exhauster C following completion of the first core was 07 mFUhr During sampling filter papers used in the suction line for the CGM were saved and
F-4
RPP-4826 Rev I
analyzed in the laboratory to estimate the airborne radionuclide concentration in the tank head space One filter paper was used for the core Waste particles retained on the exhauster housing filters were part of the inventory subsequently measured by NDA following completion of this core
Sampling in riser 5 was begun on 41299 using Exhauster B and Truck 3 A total of 6 RMCS and 1 PMCS segments were taken for this core before sampling was halted on 42899 The total exhauster run time for this core was 11712 hours Problems with high vacuum in the tank required the exhauster flow rate to be reduced to 190 scfm to keep the system within pressure limits The stack record sample for the second core was removed and analyzed following the run period Dose rates taken at the side of the exhauster housing during the second core were all lt05 m M r During sampling filter papers used in the suction line for the CGM were saved and analyzed in the laboratory to estimate the airborne radionuclide concentration in the tank head space One filter paper was used An NDA was performed on the exhauster housing following this core The only radionuclides present in the housing were those from this core or what was removed from the tank head space during the non-RMCS activities in this tank from 92298 and 102398
Some clarification may be needed to explain use of the exhauster operating times and NDA dose rate and record sample data obtained during core sampling on TX-I 13 Core sampling was set up for sampling riser 3 on TX-113 in September 1998 with Exhauster B Exhauster B operated for a total of 8738 hours between 92298 and 102298 The stack record sample was removed at the end of this period The ERS database incorrectly shows the exhauster operated between 111698 and 111998 The ABCASH database shows the stack record sample was removed on 111998 The stack record sample showed positive emuent concentrations during this time period with variances 400 No RMCS samples were taken during this period so the data and time werenrsquot included when calculating RMCS aerosol numbers Exhauster B was removed and Exhauster C installed in late November-early December Exhauster C was operated for a total of 5559 hours between 121098 and 122398 The stack record sample was removed on 122898 No sampling was performed during this period so the data and time werenrsquot included when calculating RMCS aerosol numbers Exhauster C was operated for a total of 30218 hours between 122898 and 2899 All the RMCS segments from riser 3 were taken in this time period so only the data and time for this period were included when calculating RMCS aerosol numbers Exhauster B was used during sampling of riser 5 Exhauster B operated for a total of 11712 hours between 41299 and 42899
Tank 241-TX-l18599 to 699 RMCS was begun in TX-I 18 on 5699 Exhauster C (4) and Truck 4 were used Sampling was completed on 6298 Risers 9B and 12B were sampled A total of 9 RMCS segments were taken there were no PMCS segments Two RMCS cores were obtained The total exhauster run time was 21247 hours The stack record sample was removed and analyzed following this run period The maximum dose rate taken at the side of the exhauster housing following RMCS was 08 m M r CGM filter papers were not analyzed An NDA was performed on the exhauster housing following completion of the two cores The exhauster housing contained the same nuclides as for the first NDA (S-110 U-107 BY-105 and TX-I 13 first core) plus those from TX-I 18
The basic core sampling operational data used in this document includes the number of RMCS cores and segments the exhauster run times and flow rates the RMCS exhauster HEPA filter dose rates and tank vapor space temperatures Table F-l lists the basic operational data This information excluding tank vapor space temperature data was obtained from procedural data sheets in the sampling work packages (References W - 1 to WP-23)
Tank temperature data for the tanks ventilated with the RMCS exhausters was obtained from the TWINS database Plots for each tank were prepared for the time RMCS was conducted and the average value of the highest thermocouple located in the tank (the lowest temperature reading) was estimated and used as the average tank head space temperature during the RMCS period
The SX exhauster flow rates listed in Table F-l are estimates only The combined flow rate for SX-IO1 through SX-106 plus SX-109 (7 tanks) averaged 440 cfm during CY 1996 (Kaiser 1997) for an average of 63 cfm per
F-5
RPP-4826 Rev I
tank Based upon inlet flow measurements at the tank inlet HEPA filters (Fanis 1998) the flow through each individual tank (SX-IO1 through SX-106 plus SX-109) was lt55 cfm at the breather filter Assuming an exhaust flow of 100 cfm for each SX farm tank sampled is therefore conservative
Calculated Data
Calculated data include the tank head space volumes conversion of the RMCS exhauster flow rate from scfm to acfm and the number of tank head space changeouts made by an exhauster during RMCS
Tank head space volume includes the dome space volume above the top of the sidewall plus the void space between the waste surface and the top of the sidewall The formula used to calculate tank head space volumes WN
Head Space Volume in A = (DS + [(H) (12) + HI + Hb - H] (V)) - 748
Where DS = dome space volume gal H = height of tank body sidewall above knuckle A HI = height of tank knuckle area in Hb = height oftank bottom below knuckle in H = height of waste in tank in V =27555 galin of waste in SX tanks 2754 gallin in all others
The tank dome space volumes height of tank sidewall above the knuckle height of tank knuckle area and height of tank bottom below the knuckle were obtained from Reynolds 1999 The height of waste in each tank at the time of core sampling was obtained from the TWINS database Tank dimensional and waste level data are given in Table F-2 along with the calculated tank head space volumes
Aerosol calculations for Appendices A-C require exhauster flow rates in actual cubic feet per minute The RMCS exhauster flow rate is controlled and recorded in standard cubic feet per minute The mass flow rate of the exhauster air is measured and internal logic in the exhauster controller calculates what the volumetric flow rate would be if the temperature and pressure in the exhauster inlet were at standard conditions The standard conditions used in the logic controller are 29921 in Hg (760 mm Hg) and 69F (ZIT)
A correction factor is built into the exhauster control logic that assumes an atmospheric pressure of 2927 in Hg the average atmospheric pressure at Hanford The RMCS exhauster will operate at about 1-2 in H20 negative pressure resulting in about a 2916 in Hg pressure in a waste tank when the RMCS exhauster is operating To revise the indicated scfm RMCS exhauster reading to an acfm value the RMCS exhauster scfm flaw rate was multiplied by (29922916)(T+459)528 where Tis the tank head space temperature in OF The tank head space temperatures in Table F-1 were input to the spreadsheet file used for aerosol calculations and converted to acfm The flow rates in acfm are included in Table F-I
The tank head space changeouts when using the RMCS exhauster were calculated by multiplying the exhauster acfm flow rate by the time of exhauster operation and dividing the result by the tank head space volume Tank head space changeouts are listed in Table F-2
F-6
c
gt 2
RPP-4826 Rev 1
APPENDIX G
REFERENCES
G-0
RPP-4826 Rev 1
APPENDIX G - References
Diedeker 1999 NDA of RMCS HEPA Filters L P Diedeker WMH E-Mail to JS Schofield CHG November 29 I999
ERDA 1976 Nuclear Air Cleaning Handbook ERDA 76-21 Buchsted C A Fuller A B and Kahn 1 E Oak Ridge National Laboratory 1976
Farris 1998 Internal Note T R Farris LMHC to J S Schofield LMHC Breather Filter Flow Rates for SX-Farm 31698
Foust 1999 Internal Memo RMCST Exhauster HEPA Filter Dose Rate Calculations D J Foust LMHC to J S Schofield LMHC October 25 1999
Greager 1999 Correspondence No WMH-9954450 Non-Destructive Analysis of the Rotay Mode Core Sample High-Efjiciency Particulate Air Filters E M Greager WMH to P C Miller LMHC June 28 1999 [Transmittal of HNF-4199 Resultsfram NDA Measurement of the 296-P-34 RMCS HEPA Filters]
HNF 1999 HNF-SD-WM-SAR-067 Tank Waste Remediation System Final Safety Analysis Report Rev 1 The revision incorporating RMCS accident analyses was submitted as Addendum 5 to DOE as a change to the FSAR predecessor the Basis for Interim Operation (BIO) LMHC-9857075 80232764-9-KOOl Submittal of Authorization Basis Amendment Package for Rotay and Push Mode Core Sampling in Satisfaction of Perfarmance Agreement TWR 122 Expectations I and 3 D 1 Allen LMHC to A M Umek FDH August 30 1998 Addendum 5 as of mid-January 2000 is waiting for approval by DOE
Kaiser 1997 T D Kaiser LMHC E-Mail to J S Schofield LMHC SX Tank Flow Data 42197
NUREG 1995 Potential Radionuclide Emissionsfrom Stacks on the HanfordSite Part I Dose Assessment Davis W E and Barnett J M Westinghouse Hanford Company from Proceedings of the 23 DOEMRC Nuclear Air Cleaning Conference held July 25-28 1994 February 1995
Schofield 2000a Letter 74910-00-002 Use of Microshield Calculations for RMCS Exhauster Housing for Estimating Radionuclide Quantities on the Filters Using NDA and Dose Rate Measurements I S Schofield CHG to File January 62000
Schofield 2000b Letter 74910-00-003 Rev I RMCS Exhauster Stack RecordSample Data J S Schofield CHG to File January 202000
Reynolds 1999 D R Reynolds LMHC E-Mail to I S Schofield LMHC transmitting Tank Volume Calculations draft of calculations done by Mike Plesha and Reed Hendershot data to be used for RESOLVE computer program for Hanford waste tanks August 3 1999
TWINS Tank Waste Information Network System database available at httptwinspnlgovSOO lhtbinTCDgetTableListexe
Waldo 1999 letter 74910-99-009 RMCS Exhauster Aerosol Test Data E I Waldo to J S Schofield June 22 1999
WHC 1993 WHC-SD-WM-ES-225 Rev I AerosolStudy for the Rotary Mode Exhauster P M Francis Westinghouse Hanford Company April 20 1993
WHC 1997 WHC-SD-WM-SAD-035 Rev Ob A Safety Assessment of Rotary Mode Core Sampling in Flammable Gas Single Shell Tanks Hanford Site Richland Washington August 8 1997
G- I
RPP-4826 Rev I
CGM Data CGM-I Letter PARTICULATE SAMPLING OF 241-SX-IO1 DURING ROTARY MODE CORE SAMPLING D C
Langlois E2 Consulting Engineers to J S Schofield Lockheed Martin Hanford Company March 16 1998
CGM-2 Letter PARTICULATE SAMPLING OF 241-SX-I05 DURING ROTARY MODE CORE SAMPLING D C Langlois E2 Consulting Engineers to J S Schofield Lockheed Martin Hanford Company June 9 1998
CGM-3 Letter PARTICULATE SAMPLING OF 241-SX-103 DURING ROTARY MODE CORE SAMPLING D C Langlois E2 Consulting Engineers to J S Schofield Lockheed Martin Hanford Company June 12 1998
CGM-4 Letter PARTICULATE SAMPLING OF 241-S-110 DURING ROTARYMODE CORESAMPLING D C Langlois E2 Consulting Engineers to J S Schofield Lockheed Martin Hanford Company July 20 1998
CGM-5 Letter PARTICULATE SAMPLING OF 241-SX-102 DURING ROTARY MODE CORE SAMPLING D C Langlois E2 Consulting Engineers to J S Schofield Lockheed Martin Hanford Company July 22 1998
CGM-6 Letter PARTICULATE SAMPLING OF241-U-107 DURING ROTARY MODE CORE SAMPLING D C Langlois E2 Consulting Engineers to J S Schofield Lockheed Martin Hanford Company August 3 1998
CGM-7 Letter PARTICULATE SAMPLING OF 241-BY-105 DURING ROTARY MODE CORESAMPLING D C Langlois E2 Consulting Engineers to 1 S Schofield Lockheed Martin Hanford Company September 17 1998
CGM-8 Letter PARTICULATE SAMPLING OF 241-TX-I13 DURING ROTARY MODE CORESAMPLING D C Langlois E2 Consulting Engineers to J S Schofield Lockheed Martin Hanford Company March 15 1999
CGM-9 Letter PARTICULATE SAMPLING OF 241-TX-113 DURING ROTARY MODE CORE SAMPLING D C Langlois E2 Consulting Engineers to I S Schofield Lockheed Martin Hanford Company May 31 1999
Notices of Construction NOC-I DOEIRL-93-40 Radioactive Air Emissions Program Notice of Construction Rotary Mode Core-Sampling
Truck and Exhauster Approved by Letter AIR 93-707 A W Conklin WDOH to J E Rasmussen DOEIRL 7893
NOC-2 DOEIRL-94-118 Rev 0 Radioactive Air Emissions Program Notice of Construction for the Rotary Mode Core-Sampling Systems Three and Four Approved by Letter AIR 95-603 A W Conklin WDOH to J E Rasmussen DOERL 63095
NOC-3 DOERL-94-118 Rev 1 Radioactive Air Emissions Program Notice of Construction for the Rotary Mode Core-Sampling Systems Three and Four Approved by Letter AIR 98-301 W W Conklin WDOH to I E Rasmussen DOEIRL 3698
NOC-4 DOEIRL-97-70 Radioactive Air Emissions Program Notice of Construction for Rotary Mode Core- Sampling in SX Tank Farm Approved by Letter AIR 97-1 101 A W Conklin WDOH to J E Rasmussen DOEIRL 113097
NOC-5 USEPA Letter OAQ-107 (no title approving DOE submittal 97-EAP-590 dated 72997) A J Frankel USEPA to J E Rasrnussen DOEIRL 8497
NOC-5 USEPA Letter OAQ-107rsquo (nb title approving DOE submittal 97-EAP-723 dated 101797) A J Frankel USEPA to J E Rasmussen DOERL 11498
Note that both letters have ldquoOAQ-107rdquo following ldquoReply to Attn ofrdquo
G-2
RPP-4826 Rev I
Work Packages WP-I ES-94-00808 WP-2 ES-95-00258 WP-3 ES-95-00045 - WP-4 ES-95-00434 - WP-5 ws-97-00173 - WP-6 WS-97-00174 - WP-7 ws-97-00143 - WP-8 WS-97-00144 - WP-9 WS-97-00207 - WP-I 1 WS-97-00208 - WP-12 WS-98-00049 - WP-13 WS-97-00050 - WP-14 WS-97-00224 - WP- I5 WS-97-00225 - WP-16 WS-97-00230 - WP- I7 ws-97-0023 1 - WP-18 ES-97-00452 - WP-19 ES-97-00453 - WP-20 WS-98-00072 - WP-21 WS-98-00073 - WP-22 WS-98-00067 - WP-23 WS-98-00068 -
241-BY-IO6 Perform Rotary Core Sample [Riser IOB] 241-BY-I IO Rotary Core Sample [Risers 12B 7 IZB 41 241-BY-IO8 Obtain Rotary Core Sample [Risers 12A amp 71 241-BY-IO5 Rotary Mode Core Sample [Riser 12A] 241-SX-101 Rotary Mode Core Sample Riser 19 241-SX-101 Rotary Mode Core Sample Riser4 241-SX-103 Rotary Mode Core Sample Riser 7 241-SX-103 Rotary Mode Core Sample Riser I I 241-SX-105 RMCST Obtain Core Sample Riser 6 241-SX-105 RMCST Core Sample Riser 14 241-SX-102 Rotary Mode Core Sample Riser 8 241-SX-102 Rotary Mode Core Sample Riser 4 241-S-1 IO RMCST Obtain Core Sample Riser 6 241-S-1 IO RMCST Obtain Core Sample Riser 14 2414-107 RMCSTCore Sample Riser 7 241-U-107 RMCST Core Sample Riser 2 241-BY-IO5 RMCST Core Sample Riser 7 241-BY-IO5 RMCST Core Sample Riser 1 IB 241-TX-113 Rotary Core Sample Riser 3 241-TX-113 RMCST Core Sample Riser 5 241-TX-I 18 RMCST Core Sample Riser 9B 241-TX-I 18 RMCST Core Sample Riser 128
G-3
RPP-4826 Rev 1
each period for which NDA measurements were made are listed in Table A-I These values were obtained from Table F-I A weighted average specific activity for the waste on the filters in Period 4 was obtained by
[[O 227 mCigl[lO segl+[Ol2lmCigl[lO seg1+[0225 mCigl[l(l seg]+[Ol30 mCig][l2 seg]]+[SO segments] = 0182 mCi Csrdquorsquog
Calculating a weighted average based upon the number of segments assumes aerosol generation is roughly the same per segment and the specific activity of a radionuclide is constant throughout a tank These assumptions are adequate for the purpose oftbis document Aerosol generation can vary with water content waste hardness depth of sample taken nitrogen flow rate and porosity of the waste An in-depth evaluation of these parameters is beyond the scope of this document The impact of these variables is assumed to average out over all the RMCS segments taken The specific activities used do not vary greatly from tank to tank so any variations will not have a significant impact on the final aerosol results See Appendix E for further discussion of limitations on specific activities used in this document
For Period 5 the filters were new at the start and the only tank sampled with the exhauster was TX-I 13 Therefore the specific activity of CsI3rsquo for TX-I 130130 mCig was used
The same exhauster and filters used for Period 4 were used for Period 6 The net increase in Csrdquorsquo for Period 6 was determined by subtracting the Period 4 Csrdquorsquo from the total Since this net increase was only due to TX- 118 the specific activity of Csrdquorsquo for TX-I 180130 mCig was used for the waste added to the filters in Period 6 (Note it is only a coincidence that TX-I 13 and TX-118 have the same nominal Csrdquorsquo concentration)
The total mass of waste on the filters for Period 4 was thus
050 mCi i 0182 mCig waste = 275 g waste in exhauster housing
The mass of waste added to the exhauster for Period 5 was
0032 mCi + 0130 mCig waste = 025 g waste in exhauster housing
The mass of waste added to the exhauster for Period 6 was
(064 mCi - 050 mCi) + 0130 mCig waste = 11 g waste in exhauster housing
Aerosol Calculations
The tank head space particulate concentration was obtained by dividing the mass of waste sent to the exhaust stream by the volume of air sent to the exhauster The volume of air to the exhauster was obtained by multiplying the exhauster flow rate by the exhauster run times for each tank from Table F-I
For the RMCS exhausters the recorded exhauster flow rate is reported in standard cubic feet per minute (scfm) The RMCS exhauster flow rate is controlled to a nominal 200 scfm The exhauster flow rate was corrected to an actual cubic feet per minute (acfm) before calculating the tank head space aerosol concenmtion Table F-l includes the actual cfm flow rates
The calculated flow rates during RMCS for the tanks sampled during Period 4 were 207 acfm (S-1 lo) 206 acfm (U-107) 208 amp 209 acfm (BY-105) and 203 acfm (TX-I 13) The total volume oftank air through the exhauster during Period 4 was thus
[[207 cfm][ 15978 hr]+[206][27385]+[208][13577]+[209][30792]+[203][30230]][60 minh] = 146 E+7 Arsquo
The average tank head space mass concentration during RMCS in the above tanks was
[275 g + 146 E+7 Arsquo] x [35315 ftrsquomrsquo] = 664 E-6 average g waste per m3 in exhauster inlet
A-3
RPP-4826 Rev I
The gas flow rates and average tank head space mass concentrations during RMCS for Periods 5 and 6 were calculated in a similar manner
The average mass of waste in a tank head space during RMCS was calculated by multiplying the tank head space mass concentration by the tank head space volume from Table F-2 as shown below for S-1 I O
[275 g + 146 E+7 Arsquo] x [89100 ftrsquo] = 167E-2 g waste in S-1 IO head space
The particulate quantities in the other tank head spaces were calculated in a similar manner The weighted average mass in a tank head space during Period 4 was based upon the number of segments taken in each tank
The mass sent to the exhauster per RMCS core or per RMCS segment was obtained by dividing the mass of waste sent to the exhaust stream during each period by the numbers of RMCS cores or RMCS segments obtained during the exhauster operating time The average mass of waste sent to the exhauster during Period 4 is thus
275 g waste + 7 rotary cores = 39E-1 g wastelrotary core
and
275 g waste + 50 rotary segments = 55E-2 g wasteirotary segment
The mass of waste to the exhauster per RMCS core and RMCS segment for Periods 5 and 6 were calculated in a similar manner
All data were input to a spreadsheet to perform the calculations Results are provided in Table A-3
Summary of Calculations
Non Destructive Assay was performed on the RMCS exhauster filter housings used during three separate exhauster operating periods during which IO RMCS cores and 65 RMCS segments were obtained from five tanks Weighted averages of the average tank head space mass concentration average mass of suspended solids in a tank head space and average mass sent to the exhauster per RMCS core or segment for the three periods combined were calculated based upon the number of RMCS segments taken during each period Based upon RMCS exhauster housing NDA data the results indicate that
The average tank head space mass concentration during RMCS was 77E-6 g wastelmrsquo The average mass of suspended solids in the tank head space during RMCS was 18E-2 g waste The average mass sent to the exhauster during RMCS was 52E-1 g wastelcore The average mass sent to the exhauster during RMCS was 63E-2 g wasteisegment
A-4
RPP-4826 Rev 1
APPENDIX B
ESTIMATION OF AEROSOLS GENERATED DURING RMCS BASED UPON Rh4CS EXHAUSTER HEPA FILTER DOSE RATES
B-0
RPP-4826 Rev I
APPENDIX B - Estimation Of Aerosols Generated During RMCS Based Upon RMCS Exhauster HEPA Filter Dose Rates
Summary of Method
This method of estimating RMCS aerosol quantities divides the dose rate increase (mRhr) at the side of the RMCS HEPA filter housing by a calculated dose conversion factor (mRhrmCi C S rdquo ~ ) to obtain an approximation of the radionuclide quantity in the housing This radionuclide quantity is divided by the waste specific activity (mCig) to determine the mass of waste on the HEPA filter Dividing the HEPA filter waste mass by the volume of air passing through the filter provides an estimate of the average tank head space particulate concentration during RMCS Multiplying the average tank head space particulate concentration by the tank head space volume gives an estimate of the average mass of suspended particulates in the tank head space during RMCS Dividing the HEPA filter waste mass by the number of RMCS cores or RMCS segments provides the mass per RMCS core or per RMCS segment sent to the exhauster
Description
Particulates in the exhaust stream are removed by the HEPA filter(s) upstream of the exhaust fan The captured particulates contain radionuclides with CSrsquo~rsquo being the predominant gamma emitter As the particulate quantity on the HEPA filter increases the dose rate at the side of the filter housing will increase proportionately By monitoring the HEPA dose rate at the side of the filter housing the quantity of Csrsquordquo on the HEPA can be estimated This C S rdquo ~ value is then used to back-calculate to a waste mass quantity on the filter using the Csrsquordquo concentration in the tank waste This filter waste mass quantity is used to calculate the concentration of particulates in the tank exhaust stream the total suspended solids in the tank head space and the mass of waste sent to the exhauster for each RMCS core or segment taken Although radionuclides will be trapped on both the prefilter and the primary HEPA filter with a very small amount on the secondary HEPA calculations in this section were based upon the simplifying assumption that all the activity was on the primary HEPA filter
During RMCS exhauster operation the dose rate in m M r at the side of the HEPA filter housing is periodically measured with an Eberline RO-3B per procedure to indicate when radioactive particulates are building up on the filter The limit of detection of the RO-3B is 05 mRhr
Exhauster operations were divided into six operating periods for evaluation in this document These periods are discussed in Appendix F and shown in Table F-I Housing dose rate data were obtained for Exhauster Operating Periods I 24 5 and 6 Relevant information for these periods is also listed in Table B-I Dose rate data are available and were used for all tanks on which an RMCS exhauster was present and RMCS samples were taken This includes BY-106 BY-IO5 (1995) BY-I IO S-l I O U-107 BY-IO5 (1998) TX-113 and TX- 1 18 The dose rate at the end of a period was used as the basis for calculating radionuclides on the filters The only operating period for which dose rate data were not used for estimating filter radionuclide content was Period 3 Period 3 was for RMCS in SX farm using the SX exhauster
The dose rate at the side of the SX exhauster HEPA filter housing was measured during RMCS of SX farm tanks (for sampling of tanks SX-lot SX-102 SX-103 and SX-105) but the data are not useful for estimation of aerosol quantities because the SX exhauster draws on 13 tanks in parallel or in series with the tank being core sampled Many of the tanks have a much higher off gas flow rate than the sampled tank In addition there is background radiation in the area of the SX exhauster filter housing making any increase in the housing dose rate during RMCS difficult to detect
Dose Rate Data
The dose rate data for each period is listed in Table 8-2 No dose rates above minimum detectable limits were evident at the sides of any RMCS exhauster in Periods I 2 and 5
Dose rate measurements were less than detectable for Period 4 during sampling of S-l IO and U-107 When sampling on BY-IO5 there were a few readings of 07 m M r but most were ltOS mRhr This variation in
B- 1
RPP-4826 Rev 1
readings is to be expected as the specific instrument person using the instrument and location at which the dose rate is checked can vary with time The final recorded dose rate when sampling was complete on BY-IO5 was lt05 mRhr At the end of Period 4 following completion of the first core in TX-I 13 Exhauster C was listed as having a 07 m M r dose rate
Period 6 used Exhauster C again with the same housing and filters as at the end of Period 4 The final dose rate for this period was 08 m M r
Periods 124 and 5 all began with a new housing and new filters For Periods 12 and 5 it was conservatively assumed that the final dose rate was equal to 05 m M r giving an increase of 05 mRhr for each of these periods For Period 4 the dose rate increase was 07 m M r for this period Since Period 6 used the same housing and filters as Period 4 the increase for Period 6 was 08 - 07 = 01 m M r
The dose rate increase was converted into a CsIh content on the primary filter for each period Foust 1999 provides various dose rates for an RMCS exhauster housing assuming even dispersal of 1 mCi C S rdquo ~ on the first HEPA filter Using these calculations Schofield 2000a estimated a dose rate conversion factor of 16 mRhrmCi C S rdquo ~ at the detector location for an RO-3B The assumption that radionuclides are evenly distributed on the HEPA is a reasonable assumption based upon the exhauster design and the method used to measure the radiation dose rate
Gamma emitting contribute to the dose rate due to bremsstrahlung radiation and other nuclides may provide some small additional dose but the major penetrating dose rate contributor in aged SST waste is CSrdquo~ Ignoring the presence of all radionuclides (including Srm) except C S rdquo ~ in calculating a HEPA filter waste mass will provide a conservative result This is because assuming all radiation present is due to C S rdquo ~ will result in overestimating the C ~ I ~ ~ c o n t e n t of the filter housing which in turn will result in overestimating the waste mass on the HEPA filter
Dividing the HEPA dose rate for each exhauster installation by the dose conversion factor of I 6 mRhrmCi results in an increase of 031 mCi Csrdquorsquo on the RMCS exhauster filters for Periods I 2 and 5044 mCi for period 4 and 0063 mCi for Period 6
Calculation of Mass Quantity on Filters
Dividing the Csrdquorsquo content of the filters by the specific activity of C S rsquo ~ ~ in the waste gives the estimated mass of waste sent to the exhauster The specific activity value used for the waste in each tank sampled is given in Table E-I Since RMCS was performed on more than one tank in Periods 1 and 4 a weighted average specific activity was used for these periods The weighted average specific activity was calculated based upon the number of RMCS segments taken from each tank sampled during that period The number of RhKS segments obtained during each period are listed in Table B-I These data were obtained from the individual tank data in Table F- I Calculations to estimate the specific activity of waste mixtures were performed in the same manner as shown in Appendix A For Periods 2 5 and 6 RMCS samples were taken in only one tank The waste specific activity used for these periods was the specific activity of the tank sampled The specific activities used for each exhauster operating period are given in Table B-I
For all exhauster installations except BY-IO6 in 1994 and 1995 the RMCS exhausters were hooked directly to the waste tank When sampling BY-106 a prefilter was installed in the tank riser between the tank and the exhauster The prefilter was not used for BY-I IO in Period 1 or for any other tank in any other period Thus for Periods 2 4 5 and 6 the mass of waste on the HEPA was assumed equal to the mass of waste leaving the tank risers For Period 1 the mass of waste on the HEPA had to be adjusted for the BY-106 prefilter DF when estimating the combined mass of waste leaving the BY-IO6 and BY-I IO tank risers The mass of waste on the HEPA for Period 1 was
[031 mCi] [IO00 pCimCi] = 310 pCi
[310 pCi Csrdquorsquoon HEPA] + [I77 pCi C S rdquo ~ ~ waste] = 177 gwaste on HEPA
is the predominant radionuclide contributor to filter dose rates Beta emitting Srw can
on HEPA
B-2
RPP-4826 Rev 1
A decontamination factor (DF) of 5 was used to account for radionuclide removal by the BY-IO6 prefilter (see Appendix D for basis ofprefilter DF) There were 1 1 RMCS segments taken from BY-IO6 and 13 from BY- 1 IO The total mass ofwaste assumed to exit the tank risers was therefore
[ I 77 g waste] [ 1 1 + 131 [[I 151 + 131 = 28 g waste from tank risers
The DF of 5 to account for the prefilter is only applicable to the RMCS of BY-IO6 in 1994 and 1995 for all other exhauster periods the mass of waste on the HEPA was equal to the mass of waste sent to the exhauster riser
The mass of waste sent to the exhauster for Period 2 was
[031 mCi] [IO00 pCimCi] = 310 pCi Csrdquorsquo on HEPA
[3 IO pCi C S rdquo ~ on HEPA] + [225 pCi CsiI7g waste] = I 39 g waste from tank
Using the same formula the mass of waste to the exhauster from Periods 4 and 5 was 241 and 240 g respectively and the increase in waste on the filters for Period 6 was 048 g
Aerosol Calculations
The mass sent to the exhauster per RMCS core or per RMCS segment was obtained by dividing the mass of waste leaving the risers by the number of RMCS cores or RMCS segments obtained during the exhauster operating period
The tank head space particulate concentration was obtained by dividing the mass of waste leaving the riser by the volume of gas sent to the exhauster This volume of gas sent to the exhauster was obtained by multiplying the exhauster flow rate by the exhauster run time from Table F-I The calculations for aerosols generated based upon HEPA dose rates use acfm while the exhauster flow is recorded in scfm so the actin flow rates in Table F- 1 were used
The average mass of aerosols in the tank head space was obtained by multiplying the average tank head space particulate concentration by the tank head space volume from Table F-2
Following is an example of how the mass per RMCS core mass per RMCS segment average tank head space mass concentration and average mass of aerosols in the tank head space were calculated for Period 1 Data used are from Tables E-I F-I and F-2
[200 scfm] [2992+2916] [84 + 4591 + 528 = 21 1 acfm to exhauster from BY-IO6 in 11-1294
using same formula results in 210 acfm for BY-IO6 in 195 and 209 acfm for BY-I IO
28 g waste + [((21 1 acfm)(4878 hr)+(21O)(l867)+(209)(1125))(60 minhr)]= 12E-6 g wastelf to risers
[12E-6 amp] [35315 fmrsquo] =43E-5 g wastemrsquoto risers
[12E-6 gftrsquo] [53700 Arsquo in BY-106 head space] =66E-I g waste in BY-IO6 head space during RMCS
[12E-6 piftrsquo] [92000 ftrsquo in BY-110 headspace] = IIE-l g waste in BY-I10 head spaceduring RMCS
[28 g waste] [5 RMCS cores] = 56E-1 g waste per core to riser
[28 g waste] + [24 RMCS segments] = 12E-1 g waste per segment to risei
8-3
RPP-4826 Rev 1
All data were input to a spreadsheet and the mass to exhauster per RMCS core mass to exhauster per RMCS segment average tank head space mass concentration and average mass of aerosols in the tank head space were calculated for each of the RMCS exhauster operating periods in the same manner as shown above Results are given in Table 8-3
Summary of Calculations
RMCS exhauster operations were segregated into five operating periods during which RMCS was performed The Exhauster B data for BY-IO8 and TX-I 13 riser 3 was not used in these calculations as no RMCS was performed when the exhauster was operating Exhausters were operated in seven tanks during which 16 RMCS cores and 92 RMCS segments were obtained Based on RMCS filter housing dose rate data the results indicate that
These values are conservative as the assumed dose rate at the end of RMCS for Periods I 2 and 5 was assumed to be 05 mRhr In addition using a DF of 5 for the BY-IO6 prefilter skews the results high The in-tank prefilters used in both BY-IO6 sampling events showed no detectable contamination
Operatin Periods 4 and 6 were the only periods with exhauster housing dose rates above detectable The 044 mCi Csrsquordquo and 0063 mCi CsIh increase on the filters for these two periods based upon dose rate data correspond to the 050 mCi CsI3rsquo and 014 mCi Csrdquorsquo increase on the filters for these two periods based u on NDA data (see Appendix A) The 031 mCi C S rdquo ~ for Period 5 is significantly above the 0032 mCi Cslrsquolsquofor the same period determined by the NDA but this is due to assuming the housing dose rate was equal to the minimum detectable 05 mRhr
The average tank head space mass concentration during RMCS was 22E-5 g wastem3 The average mass of suspended solids in the tank head space during RMCS was 47E-2 g waste The average mass sent to the exhauster during RMCS was 59E-1 g wastelRMCS core The average mass sent to the exhauster during RMCS was 1OE-1 g wastelRMCS segment
B-4
v m
__ ~~
RPP-4826 Rev 1
APPENDIX C
ESTIMATION OF AEROSOLS GENERATED DURING RMCS BASED UPON CGM IN-LINE FILTER PAPER ANALYSES
c-0
RPP-4826 Rev I
APPENDIX C - Estimation Of Aerosols Generated During RMCS Based Upon CGM In- Line Filter Paper Analyses
Summary of Method
This method of estimating RMCS aerosol quantities uses radionuclide assay data from in-line filter papers located upstream of continuous gas monitors (CGM) sampling the tank air for flammable gases during RMCS The radionuclide content of the filter paper is divided by the waste radionuclide specific activity and the air flow through the CGM to obtain an estimate of the average mass concentration in the tank head space during the time period the CGM is on Multiplying the estimated average tank head space mass concentration by the tank head space volume gives an estimate of the average mass of particulates in the tank head space during RMCS To obtain the mass per RMCS core or per RMCS segment sent to the exhauster the tank head space average mass concentration is multiplied by the volume of gas sent to the exhauster then multiplied by a correction factor to account for particulates in the head space removed by the exhauster when the CGM is not operating and divided by the number of RMCS cores or RMCS segments
Description
During most tank waste intrusive activities performed since 1996 an intrinsically safe CGM located above ground has been used to continually monitor the tank air for flammable gases during in-tank activities The CGM sampling method draws air directly from the tank head space During RMCS the CGM sampling line is placed in the tank dome space The sampling line is located between the sampling riser and the exhaust riser if practical A pump in the CGM draws tank air up through the line at 05 litmin for measurement of the lower flammability limit (LFL) by the CGM A filter paper is installed in the sampling line upstream of the CGM to protect the unit from internal contamination
Following CGM use the CGM filter papers are normally discarded after monitoring them in the field for contamination To help estimate the tank head space particulate levels during RMCS these filter papers were retained and analyzed in the 222-S laboratory following removal from all tanks in which RMCS was performed from the fall of 1997 through April 1999 Data were collected for the four tanks in SX farm in which RMCS was performed and the next four tanks on which the RMCS exhauster was deployed These tanks are listed in Table c-I Reported CGM Data
The CGM operational data used to estimate aerosol levels during RMCS includes CGM operating times CGM flow rates and filter paper analytical data A summary report containing all the field operating data sheets for CGM usage and lab data was prepared following completion of sampling on each tank for all tanks except TX- 113 For TX-I 13 a separate report was prepared following each core These reports are References CGM-I to CGM-9 The CGM data from these reports are provided in Table C-2
There were 14 CGM installations during RMCS when CGM filter papers were collected and analyzed Each of these installations had Csrdquorsquo total alpha and total beta quantities measured on the filter papers resulting in 42 data points Eight of the measurement results were very low and had errors of gt+-loo These values were not used resulting in a net of 34 data points for calculating average head space mass concentrations based upon CGM data
Calculated Tank Head Space Radionuclide Concentrations
To calculate the average tank head space radionuclide concentrations during RMCS the filter paper radionuclide quantities were first divided by an efficiency factor to account for radionuclides which may not have been captured on the paper This adjusted radionuclide value was divided by the volume of tank air passing through the paper to give the average tank head space radionuclide concentration
The efficiency used for most stack samplers onsite is 73 (see Appendix D) Estimates attached to References CGM-I to CGM-9 indicate the CGM filter paper sampling method used should have a sampling efficiency
c- 1
RPP-4826 Rev 1
exceeding 73 For conservatism a sampling efficiency of 50 was assumed in this document for the CGM filter paper method
The estimated Csrdquorsquo total alpha and total beta concentrations in the tank vapor space were calculated by dividing the radionuclide quantity on the filter paper from Table C-2 by the assumed CGM sampling efficiency of 05 and the volume of gas going to the CGM The volume of gas going to the CGM was calculated by multiplying the time of CGM operation from Table C-2 by the CGM flow rate of 500 mlmin For example the calculated SX- 101 head space C~rsquorsquo~concentration based upon analysis of the CGM filter papers used during RMCS of riser 19 is
[[26E-4 pCi + 051 + [[I755 min][500 mlmin]] = 59E-I0pCiml
All radionuclide concentrations were calculated in a similar fashion Results are given in Table C-3 Table C-3 lists the radionuclide concentrations for all 42 data points The eight radionuclide concentrations not used for estimating mass concentrations are noted
Table C-3 also contains the calculated number of tank head space changeouts by the tank exhauster during CGM operation Tank head space changeouts were calculated by multiplying the exhauster flow rates (in actin) from Table F-1 by the CGM run times from Table C-2 and dividing by the tank head space volumes from Table F-2 The number of tank head space changeouts during CGM operation was used when estimating the waste mass sent to the exhauster See Aerosol Calculations section below for explanation
Aerosol Calculations
Average tank head space mass concentrations based upon CGM filter paper data were calculated by dividing the head space radionuclide concentrations from Table C-3 by the waste specific activities for each tank sampled The waste specific activities used came from Table E-I and are listed again in Table C-I The average of the mass concentrations based upon radionuclide data for each tank was used as the average head space mass concentration for that tank For example the calculated SX-IO1 head space mass concentration analysis from the CGM filter papers used during RMCS of riser 19 is
[59E-10 pCi Csrdquorsquoml+ 112 pCi C S rdquo ~ ~ waste] [ 28317 mlftrsquo] = 1 SE-7 g wasteA3 based upon C S rdquo ~
[ I 7E-I I pCi T A M + 504E-1 pCi TAg waste] [ 283 17 mlftrsquo] = 94E-7 g wasteamprsquo based upon Total Alpha
[43E-9 pCi TBml+ 357 pCi TBg waste] [ 28317 mlArsquo] = 34E-7 g wastel based upon Total Beta
[ [ I 5E-7 + 94E-7 + 34E-7 g wasteArsquo] f 31 = 48E-7 g wasteamp
[48E-7 g wastelt ] [3531467 Arsquom3] = 17E-5 g wastemrsquo
All tank head space mass concentrations were calculated in the same manner The results are presented in Table C-4 The weighted average tank head space mass concentration during RMCS was based upon the number of RMCS segments taken for each data point
The average aerosol mass in the head space during RMCS was calculated by multiplying the average tank head space mass concentration by the tank head space volume from Table F-2 For the same data point as above
[48E-7 g waste Arsquo] [115E+5 Arsquo] = 55E-2 g waste in SX-IO1 head space during RMCS
All average mass quantities present in the tank head space during RMCS were calculated in the same manner using a spreadsheet The results are provided in Table C-4 The weighted average mass of waste in a tank head space in Table C-4 was calculated based upon the number of segments obtained for each data point
Estimation of the mass of waste sent to the exhauster per RMCS core or segment requires calculation of the total mass of waste sent to the exhauster Multiplying the average head space concentration during RMCS by the exhauster flow rate (in acfm) and the time of CGM operation will give the mass of waste sent to the exhauster during the CGM time frame only While the large majority of mass of waste aerosols will have exited the tank or
c -2
RPP-4826 Rev I
resettled by the time the CGM is shut off there could be some residual suspended particles remaining These would eventually pass to the exhauster but would not be picked up by the CGM filter since it was not in service An adjustment factor was used as described in the following paragraphs to account for particles that may exit to the exhauster following shut down of the CGM
Particulates are generated by RMCS when purge gas is blowing out the drill string and the bit is rotating under the waste surface This time averages about six minutes per segment Multiplying the number of RMCS segments per core by six minutes per segment and dividing by the number of minutes of CGM operation shows the creation of particulates will only occur during a nominal 3-4 of the time the CGM is operating During RMCS the normal practice is to install the CGM turn it on when personnel enter a tank farm and keep the unit in constant operation for the remainder of the shift When the portable RMCS exhauster is used the exhauster is normally started at least an hour before RMCS is initiated and kept in operation until it is time to halt operations for the week The SX exhauster is kept in constant operation Comparing exhauster operating times from Tables F-l with CGM operating times from Table C-I it can be seen the CGMs are in operation about 3-15 of the time the RMCS exhauster is operating on a tank This time comparison wasnrsquot estimated for the SX exhauster since the SX exhauster is in constant operation
With CGM operation much longer than the time period when particulates could be generated the majority of particulates generated by RMCS should have settled or been exhausted during the CGM operating period Table C-3 shows the tank head space changeouts made by the exhauster during CGM operating periods ranged from 084 to 63 The average was 24 With the CGMs operating 25-33 times longer than the aerosol generation periods and an average of over two tank head space changeouts during CGM operation the large majority of aerosols generated during RMCS will have settled out or been removed by the exhauster by the time the CGM is shut off To account for particulates remaining in the tank head space after the CGM was turned off that are subsequently removed by an exhauster it was conservatively assumed that 20 of the total mass of particles generated during RMCS were not removed from the tank head space during the CGM operating period Therefore the product of the tank head space concentration and the volume of air sent to the exhauster during the time of CGM operation was multiplied by a factor of 125 (lOOl80) to estimate the total mass of waste sent to the exhauster as a result of RMCS This is shown below for the same SX-IO1 riser 19 data point in the above calculations
[48E-7gA3] [IOOmin] [I755 min] [125]= 11E-l gwastetoexhauster
This value was divided by the number of RMCS cores and RMCS segments from Table C-1 to provide the grams per core and grams per segment in Table C-4 as follows
[ I I E- 1 g waste to exhauster] i 1 core = 11 E-I g wastelRMCS core to exhauster
and
[ 1 I E- 1 g waste to exhauster] + 5 segments = 2 I E-2 g wastelRMCS segment to exhauster
All mass per core and mass per segment values were calculated in the same manner using a spreadsheet The results are provided in Table C-4 The weighted average mass per core and mass per segment in Table C-4 were calculated based upon the number of cores or segments obtained for each data point
Summary of Calculations
There were 34 valid CGM filter paper data points from 14 RMCS CGM sampling periods in eight tanks during which I5 RMCS cores and 79 RMCS segments were obtained Based upon CGM filter paper data the results indicate that
The average tank head space mass concentration during RMCS was 4OE-5 g wastem3 The average mass of suspended solids in the tank head space during RMCS was 97E-2 g waste The average mass sent to the exhauster during RMCS was 18E-1 g wastelRMCS core The average mass sent to the exhauster during RMCS was 34E-2 g wastelRMCS segment
c - 3
RPP-4826 Rev 1
Ignoring all CGM filter paper analytical data points with a variance gtloo will result in conservative results These data points indicate negligible radioactivity was present If a value of zero was assigned to each data point with an analytical error of gtloo instead of ignoring the data point the weighted average particulate quantities in Table C-4 would be reduced by about 12
The average tank head space mass concentrations based upon CGM data will be higher than the average tank head space mass concentrations based upon filter housing NDA or dose rate The RMCS exhauster received tank air from the shifts when sampling was performed and during some of the off-shifts when no sampling was done The CGMs were only operated during the shifts when sampling was performed The air concentration drawn into the CGM and the RMCS exhauster should be roughly the came during the operating shifts but somewhat less during the off-shifts Therefore the tank head space concentration will be higher when based upon CGM data This does not impact the mass of waste sent to the exhauster per core or per segment
c -4
I
- ~
RFP-4826 Rev 1
APPENDIX D
ESTIMATION OF Rh4CS EXHAUSTER HOUSING DECONTAMINATION FACTOR
D-0
RFrsquoP-4826 Rev 1
APPENDIX D - Estimation of RMCS Exhauster Housing Decontamination Factor
Summary of Method
This Appendix estimates a Decontamination Factor (DF) for the RMCS exhausters using housing NDA data and applicable stack record sample data The Csrdquorsquo in the exhauster effluent is divided by the C S rdquo ~ in the exhauster inlet to provide a penetration efficiency The reciprocal ofthe penetration efficiency is the DF
Description
Each RMCS exhauster has an isokinetic sampler located on the stack downstream of the blower and HEPA filters A small pomp pulls air from the exhaust stack into a filter paper at a rate proportional to the exhaust flow Radionuclides in the exhaust stream passing through the sample line are caught on the filter paper The stack operating time and flow rate are recorded When the record sample filter paper is removed the filter paper is analyzed in a laboratory for radionuclides The radionuclide concentration in the stack effluent stream is calculated by dividing the quantity of material on the filter paper by the volume of air through the sampler and then dividing again by a factor to compensate for stack sampler and filter paper efficiency
Multiplying the total beta stack effluent concentration by the total off gas flow gives the total beta emissions from the exhauster The total beta emissions are multiplied by the Csrdquorsquo to total beta ratio for the waste in the tank) being exhausted to give an estimate of the C S rdquo ~ emission The C S rdquo ~ on the filters determined by NDA of the housing (see Appendix A) is added to the C S rdquo ~ emissions to give the total C S rdquo ~ input to the filter housing Dividing the emissions by the input gives the filter housing penetration efficiency Subtracting the penetration efficiency from 1 O gives the filter housing efficiency Dividing 1 O by the penetration efficiency gives the DF
RMCS Stack Record Sample Data
RMCS exhauster stack record samples are taken after completion of each sampling event on a tank Normally this is after all cores on that tank have been obtained but for BY-IO5 in 1998 record samples were taken following each core Record samples are also taken at the end of each year All samples are analyzed for total alpha and total beta At the end of each year all the filter papers for that year are composited and analyzed for individual radionuclides Sample results are entered into the Automated Bar Coding of Air Samples at Hanford (ABCASH) and Environmental Release Summary (ERS) databases Several ofthe filter papers from 1998 were reanalyzed using a longer count time to bring the error rate down
Schofield 2000b compiled and evaluated all available RMCS exhauster stack record sample data filtered out the unusable data provided derivation for the stack sampling efficiency factor and summarized the results Most of the data points were so low as to be unusable since the results were either negative or had error variances gtloo
Column 5 of Table D-1 provides the stack effluent concentrations used for calculation of the filter housing DF The stack effluent data in Table D-l come from Schofield 2000b These values include a 073 sampling efficiency factor
Calculation of RMCS Filter Housing Decontamination Factor Based upon Housing Inlet and Outlet Data
The RMCS exhauster housing NDA and stack record sample data available for exhauster Operating Periods 4 5 and 6 were used to estimate an actual DF for the RMCS exhauster housings The housing NDA data is for CSrdquo~ but there are no usable Csrdquorsquo concentrations for the RMCS exhauster outlet The RMCS exhauster stack Csrsquordquo concentrations are either negative have a variance gtloo or are not available Total beta analyses are available however so the stack eftluent C S rdquo ~ concentrations were estimated by multiplying the total beta concentration by the ratio of Csrdquorsquo to total beta in the tank waste
Column 2 of Table D-l lists the increase in CSrsquo~ on the filters for each operating period as determined by NDA This data was obtained from Table A-2
D- 1
RPP-4826 Rev 1
Column 4 of Table D-l lists the stack exhaust volume for each stack record sample period The stack exhaust volume for the exhauster installation on S-l IO was calculated by
[ZOO std ft3min][15978 hrs] [60 minhr] = 199E+6 std ftrsquo
All other stack volumes in Table D-l were calculated the same way Unlike in Appendices A B and C no adjustment was made to change the 200 scfm to actual cfm This is because the RMCS stack record sample concentrations from Table D-3 are based upon a 200 scfm flow rate rather than the actual flow rate Since the concentrations are on the same basis as the flow rate there is no need to correct to acfm
The total beta emissions for the RMCS exhauster stack were calculated by multiplying the volume by the concentration For the same S-l IO data point
[199E+6 ft3] [18E-15 pCiml] [28317mlft3] [mCi1000 pCi] = 1OE-7 mCi total beta
All other total beta emissions in Table D-l were calculated the same way
The Csrdquorsquo to total beta ratio was calculated from data in Table E-I For the same S- l I O data point
326E+5 Ci CsI3rsquo f I 14E+6 Ci total beta = 029 Ci CslhCi total beta = 029 rnCi CsrdquorsquomCi total beta
The Csrsquordquo emission for the same S-l IO data point was thus
[I OE-7 mCi total beta] [029 mCi CsrdquorsquomCi total beta] = 29E-8 mCi Csrdquorsquo
All Csrsquordquo emissions in Table D-l were calculated in the same manner
The penetration efficiency for each operating period was calculated by dividing the exhauster outlet by the filter inlet Csrdquorsquo quantities For operating period 4 this was
[81E-6 mCi] f [5OE-I + 8IE-6 mCi] = 16E-5 = 16E-3
The DF for operating period 4 is
1 + 16E-5 = 62E+4
The overall DF for periods 4 5 and 6 was calculated by dividing the efluent from all three periods by the total filter input
[95E-6 mCi] f [67E-I t 95E-6 mCi] = 14E-5 = 14E-3 penetration efficiency
I - I 4E-5 = 0999986 = 999986 filter efficiency
1 f 14E-5 = 73E+4 decontamination factor based upon housing inlet and eftluent data
Estimation of Housing Decontamination Factor Based upon General Performance Data
HEPA filters are tested at the manufacturer to a minimum 9997 efficiency using a 03 pm monodisperse aerosol After installation HEPA filters are tested in-place per ASME N5 I O to a minimum 9995 efficiency using a polydisperse aerosol with an approximate droplet size distribution of 99 less than 30 pm 50 less than 07 pm and 10 less than 04 pm The RMCS exhauster housing is tested per ASME N510 and is thus required to have a minimum removal eficiency of 9995 for an aerosol with this approximate size distribution The particle size distribution of the waste aerosols generated by RMCS is unknown but it is assumed that the removal efficiency for RMCS generated aerosols was the same as the removal efficiency for the ASME generated test aerosol
D-2
RPP-4826 Rev I
A 9995 efficiency is equivalent to a DF of 2E+3 while a 9997 efficiency is equivalent to a DF of 33E+3 The actual DF for the RMCS exhauster housing is higher than either of these It has two HEPA filters in series even though the minimum efficiency specified in the NOCs for the RMCS exhausters is only equivalent to one HEPA ERDA 1976 recommends using a DF of 3000rdquo for a filter bank where n is the number of HEPA filters in series This would result in a DF of 9E+6 for the RMCS exhauster housing This is unrealistic Using a DF of 9E+6 will calculate to Csrdquorsquo quantities on the HEPA filtersthat are orders of magnitude above what have been shown to be there based upon the measured dose rates and NDA A DF of 9E+6 would mean the dose rate would have to be almost 100 mRhr at the side of the exhauster housing instead of the 05-08 mRhr dose rates encountered The waste particles will not have the same particle size distribution entering the second HEPA filter as when entering the first The majority of the waste particles will be captured on the I rdquo HEPA filter and although the DF for each HEPA if tested individually using the ASME N5 IO aerosol test method may be 3E+3 (or higher) the overall DF of the two filters in series will not be 3000lsquo This is because the particle size distribution entering the Znd HEPA could have a greater percentage of smaller particles than that entering the 1rdquo
NUREG 1995 included an evaluation of a number of different facility stacks at the Hanford site where the HEPA filter upstream air concentrations were estimated using several different methods This report concluded that back-calculation using a value of 3000rdquo overestimated the upstream radionuclide concentration by three to four orders of magnitude when compared to filter NDA data for the nine stacks for which NDA data were obtained and by three orders of magnitude for the two stacks for which upstream air sample data were available Back- calculation using a value of 3000rdquo was shown to be high by four orders of magnitude for the single stack for which a powder release estimate was available Based upon this information the RMCS exhauster dual filter-in-series housings would have a DF of at least three and maybe four orders of magnitude less than 9E+6 or in the 1E+3 to 1 E+4 range A DF of IE+3 would he less than the minimum permissible under the NOC Comparing the older stack data and design with the newer RMCS exhauster design the minimum DF would be expected to be at least 1E+4
Table D-2 provides the available RMCS exhauster aerosol test data This information was obtained from Waldo 1999 Prior to 1998 the RMCS exhauster primary HEPA filter efficiency and either the secondaly HEPA filter or the overall efficiency for both filters were tested Starting in 1998 only the primary and secondary HEPA filter efficiency were measured The overall efficiency of the two filters in series was only measured three times in 11 setups Twice the overall penetration efficiency was lt0002 and the remaining time the only information that could be found was a value of lt005 Most individual filters had a penetration efficiency of 0002 This appears to be about the limit of the detection equipment Based upon Table D-2 data a penetration efficiency of 0002 (99998 efficiency) is normal for a single HEPA and thus a minimum for an RMCS exhauster housing Assuming a 0002 penetration efficiency for the two filters combined calculates to a DF of 5E+4 (equal to 1 +
000002) for the RMCS exhauster housing
In summary the measured DF for the RMCS exhauster housings over the period from May 1998 through June 1999 was about 73E+4 RMCS aerosol testing prior to use indicates a DF of about 5OE+4 for each of the filters separately but their overall efficiency is not measured Referenced data based on older stacks at Hanford indicate the two HEPA RMCS exhauster housing would likely have a DF of at least IE+4
Estimated Aerosol Levels During RMCS Based Upon RMCS Stack Record Sample Data
Revision 0 of this document used the positive record sample results with variance less than 100 to estimate aerosol concentrations in the exhauster inlet using an assumed exhauster housing DF of 5OE+4 This method of estimating aerosols was eliminated from Revision 1 because the stack concentrations were either too low too scattered or too questionable to provide reliable results There were 112 RMCS stack record sample data points evaluated in Schofield 2000b Excluding the total beta sample results used for estimation of the housing DF there were only ten data points remaining with positive values and variances ltloo the remaining data points were either negative had a variance gtloo or the results were not available
For comparison purposes only Schofield 2000b applied the DF of 73E+4 calculated in this document to the data points not used to calculate the exhauster housing DF to estimate aerosol concentrations upstream of the filters The results showed aerosol levels approximately the same as those estimated using NDA dose rate or CGM filter paper data when a value of zero was used for negative sample results or those with a variance gtloo When only
D-3
RPP-4826 Rev 1
the ten positive results with a variance ltloo were used the aerosol levels calculated to be two to five times higher than those estimated using NDA dose rate or CGM filter paper data Because of the variability of data resulting from the extremely low record sample concentrations and the few useable data points estimation of aerosol levels using record sample data was not included in Revision I See Schofield 2000b for further discussion of the use of record sample data to estimate aerosol levels
Summary of Calculations
A total of nine RMCS exhauster stack record sample data points were used to estimate the RMCS exhauster filter housing decontamination factor These data points were obtained when sampling on five tanks during which 10 RMCS cores and 65 RMCS segments were obtained The overall decontamination factor was 73E+4
Estimation of aerosol generation quantities based upon RMCS stack record sample data is possible However results will likely be skewed high if data points that show non-detectable levels of radionuclides present are ignored instead of using a value of zero for the data point
D-4
RPP-4826 Rev 1
APPENDIX E
TANK WASTE RADIONUCLIDE CONCENTRATIONS USED FOR AEROSOL CALCULATIONS
E-0
RPP-4826 Rev 1
APPENDIX E - Tank Waste Radionuclide Concentrations Used for Aerosol Calculations
The RMCS exhauster NDA data HEPA filter dose rate data CGM filter paper data and stack record sample data provide information on the quantity of radionuclides on the exhauster filters in the tank head space or the exhauster stack during RMCS These radioactivity quantities need to be divided by the waste radionuclide concentration specific activity to determine the mass of waste in the tank head space and in the tank gases sent to the exhauster
The mass quantities in this document were calculated using dry basis radionuclide concentrations Waste particles carried into the tank head space by the purge gas could be wet or dry If wet some of the non-chemically bound water will start to evaporate immediately providing the tank relative humidity is 400 The water present in a waste particle may be chemically bound as a hydrate or free The chemically bound water will not readily evaporate therefore even a ldquodryrdquo particle may have some water associated with it It is impractical to measure the actual water content of the waste particulates caught on the CGM filter paper the exhauster HEPA filters or the stack record sample paper Since the quantity of water in the waste particulates is unknown particulate levels were calculated using dry basis radionuclide concentrations Thus all particulate values given in this document are stated on a dry basis
The waste radionuclide concentrations on a dry basis were calculated from data available in the Tank Waste Information Network System (TWINS) The Best Basis InventorylBest Basis Summary numbers were used These values are the most complete and up to date readily available estimates for Hanford waste tank contents but do not include water The information was downloaded from TWINS into a spreadsheet The total chemical total beta and total alpha quantities were summed in the spreadsheet for all the tanks which were sampled and concentrations for Csrdquorsquo Sr9rsquo total beta and total alpha automatically calculated in pCig These concentrations are provided in Table E-I Because lab techniques for measuring gross beta levels only detect beta particles with a minimum decay energy above 150-200 kev only radionuclides with a decay energy of gt-200 kev were included in the total beta numbers
The TWINS radionuclide concentrations were obtained in December 1999 No corrections were made for decay for this document
The CGM filter paper and stack record sample data indicate the measured radionuclide values are not always in the same ratio to each other as given by TWINS nor are all radionuclides detected that TWINS indicates are present Radionuclides can be distributed unevenly in a tank Soluble fission products (primarily Csrsquordquo) are found in the liquid saltcake and in sludges Insoluble fission products and actinides are found largely in sludges as these are primarily chemical precipitates Sludge could be mixed with saltcake be present in a distinct layer at the bottom of a tank or in several layers in the tank depending upon how waste was transferred into a tank Waste particles may thus not have the same specific activity on a microscopic scale as they would have on a macro scale were the tank contents homogenized During RMCS a top to bottom core sample is attempted resulting in the drill bit and purge gas (which causes aerosols to form) passing through most ofthe waste matrix Assuming the aerosol generation rate is approximately constant during drilling the specific activity of a radionuclide in the suspended solids should be roughly the same as the average specific activity of the same radionuclide in the tank waste While the waste specific activity is probably not homogeneous from top to bottom in a tank and the aerosol generation rate will likely also vary it is beyond the scope of this document to provide an in-depth analysis of all the factors affecting aerosol radionuclide concentration Although sample radionuclide data were not always in the same ratio as provided by TWINS for the purpose of this document the simplifying assumption was made that the average tank specific activity is adequate to provide an approximation of the suspended solids specific activity for all radionuclides Average tank individual radionuclide specific activities were used in the preparation of the exhauster NOCs
The aerosol calculations presented in this document are only as accurate as the TWINS data The combined radionuclide content of all Hanford waste tanks is known fairly well since the overall content is based upon reactor production records CsrdquorsquoSrW recovery data and processing plant discharges Thus TWINS data for all tanks combined should be reasonable There are undoubtedly differences between TWINS data and the actual contents of a specific tank While the specific tank radionuclide data from TWINS used in this document may not be exact deviations from the actual concentrations are assumed to balance out over the number of tanks sampled
E- 1
RPP-4826 Rev 1
APPENDIX F
ROTARY MODE CORE SAMPLING EXHAUSTER AND CORE SAMPLE DATA
F-0
RPP-4826 Rev 1
APPENDIX F - Rotary Mode Core Sampling Exhauster and Core Sample Data
This appendix provides the basic data obtained during RMCS operations which was used in preparation of this document
Basic Operational Data
There have been three RMCS exhausters and three RMCS sampling trucks deployed since starmp of nitrogen- purged RMCS in November 1994 The exhausters are formally designated 296-P-32296-P-33 and 296-P-34 These were originally referred to as parts of RMCS Systems 2 3 and 4 respectively in the Notices of Construction (NOC) for these units The exhauster designations were changed for routine field use in 1996 to exhausters A B and C to avoid confusion with core sampling trucks 23 and 4 since any exhauster could be used with any RMCS truck Exhauster A (2) and RMCS Truck2 have not been used for RMCS since 1995 and are no longer in service for core sampling
Rotary mode core sampling has been conducted in four general time frames since 1994 These time frames were separated by down times for equipment modifications or resolution of environmental permitting and safety concerns For ease of analysis in this document exhauster operations were organized into six distinct operating periods Periods I to 6 were grouped based upon times when the same exhauster and same set of HEPA filters were being used These periods thus overlap with the general operating time frames The four operating time frames were
The first time frame lasted from November 1994 to January 1995 RMCS Truck 2 and Exhauster 2 (A) were used on Tank BY-106 along with an in-tank prefilter This tank provided the initial deployment and testing of the nitrogen-purged equipment in a waste tank During this period radiation dose rates were taken at the side of the exhauster housing Stack record samples were taken in December 1994 and January 1995
The second time frame lasted from July 1995 through October 1995 RMCS Trucks 2 and 4 were used with Exhausters 2 and 3 (A and B) on BY-105 BY-IO8 and BY-I IO During this period radiation dose rates were taken at the sides of the exhauster housings Stack record samples were taken after completion of sampling on each tank No RMCS samples were taken from BY-108 all samples were taken in push mode for this tank
The third time frame began when RMCS was restarted in December 1997 Trucks 3 and 4 were used for sampling of SX-101 SX-103 SX-105 and SX-102 with the SX tank farm exhauster providing ventilation The RMCS exhausters were not used During this period radiation dose rates were taken at the sides of the SX exhauster housing as part of HPT routine surveys SX farm exhauster stack record samples were taken when required by normal operating procedures SX record sampler and filter housing dose rate data were not evaluated for this document It would not be practical using filter dose rate or stack record sample data to estimate the RMCS aerosol addition if any to the SX ventilation system The background radiation around the SX filter housing makes measurement of any small increase in dose rate very difficult to detect The number of tanks being ventilated and the involved off-gas header routings (the exhauster is pulling on thirteen tanks in series or in parallel with the tank being sampled) and any in-tank activities in the SX tanks not being sampled would make it impractical to assess what aerosols resulted from RMCS Beginning with RMCS in SX farm radionuclide analyses were performed on the filter papers protecting the CGMs which draw air out of the tank vapor space for flammable gas detection
The fourth time frame began in May 1998 Between 1095 and 598 Exhausters B and C were extensively modified with new filter housings and other equipment to meet new NOC requirements Trucks 3 and 4 were used with Exhausters B and C (3 and 4) on S-l IO U-107 BY-105 TX-113 and TX-I 18 This period marked the first use ofthe RMCS trucks and RMCS exhausters together following resolution of flammable gas concerns and modifications to the exhausters New filters were installed Radiation dose rates were taken at the sides of the exhauster housings Stack record samples
F- 1
RPP-4826 Rev I
were taken after completion of sampling for each exhauster installation Radionuclide analyses were performed on the CGM filter papers for all tanks except TX-118 An NDA was performed on the Exhauster C housing following completion ofthe first core on TX-I 13 The housing filters when assayed contained aerosols captured by the exhauster following RMCS in S-l IO U-107 BY-105 (1998) and the first core of TX-I 13 Another NDA was performed on Exhauster C following both cores in TX-I 18 An NDA was performed following sampling of the second core in TX-I 13 using Exhauster B The time frame ran through early June 1999 No RMCS samples have been taken after June 1999 nor are any planned for the next few years
For the purposes of evaluating aerosol formation based upon RMCS exhauster housing NDA and dose rate data the exhauster operations were grouped into 6 operating periods These periods are shown in Table F-1 and restated in Tables A-I and B-I All tanks sampled in Periods 1 2 4 5 and 6 were exhausted by the same exhauster with the same housing and filters present during that period Period 3 covered the time the SX exhauster was used during RMCS in SX farm
A brief description of each RMCS tank sampling operation is provided below
Tank 241-BY-1061194 to 1294 RMCS using the nitrogen purge gas system with an exhauster was formally begun on 111794 on tank BY-106 riser IOB Exhauster 2 (A)and Truck 2 were used A sintered metal prefilter was inserted in the riser between the tank and the exhauster A total of eight segments were taken in rotary mode and five segments in push mode until sampling was halted on 122194 One RMCS core was obtained The total exhauster run time was 4878 hours The stack record sample was removed and analyzed following this run period Dose rates taken at the side of the exhauster housing during RMCS were all lt05 mRhr The in-tank prefilter was smeared for contamination when removed from the tank with the smears showing less than detectable levels of radionuclides present (Waldo 1999) The prefilter had been washed with an installed spray system prior to removal from the tank but subsequent testing showed the water flow and pressure were too low to have been effective at removing contamination
Tank 241-BY-106195 Following some process modifications RMCS in BY-IO6 riser IOB began again on 11895 Exhauster 2 (A) and Truck 2 were used The sintered metal prefilter was inserted in the riser between the tank and the exhauster RMCS was halted on 12495 over authorization basis and equipment operability issues for RMCS A total of three segments were taken in rotary mode and eleven segments in push mode One RMCS core was obtained The total exhauster run time was 1867 hours The stack record sample was removed and analyzed following this run period Dose rates taken at the side of the exhauster housing during RMCS were all lt O S mRhr The in-tank prefilter was smeared for contamination when removed from the tank with the smears showing less than detectable levels of radionuclides present (Waldo 1999) The prefilter was not washed this time
Tank 241-BY-110795 to 1095 Following resolution of RMCS authorization basis and equipment issues and completion of the fabrication and testing of Trucks 3 and 4 RMCS was begun in BY-I IO on 71195 Exhauster 2 (A) and Truck 2 were used Samples were taken from risers 128 7 128 again and 4 There was no in- tank prefilter used in this or any subsequent RMCS periods Sampling was performed until 102595 when RMCS was halted over flammable gas issues A total of 13 RMCS segments and 56 PMCS segments were taken Three RMCS cores were obtained The total exhauster run time was 1125 hours The stack record sample was removed and analyzed following this run period Dose rates taken at the side of the exhauster housing during RMCS were all lt O S mRhr
Tank 241-BY-108795 to 895 Core sampling was begun in BY-IO8 on 72595 Exhauster 3 (B) and Truck 4 were used Sampling was done in risers 12A and 7 The tank material proved soft enough so that no RMCS segments were required all segments were obtained in push mode although the exhauster was operated during part of the time sampling was performed Sampling was completed 81895 A total of 16 PMCS segments were taken The total exhauster run time was 6617 hours The stack record sample was removed and
F-2
RPP-4826 Rev 1
analyzed following this run period Dose rates taken at the side of the exhauster housing during RMCS were all lt05 mRhr
Tank 241-BY-105895 to 1095 RMCS was begun in BY-I05 riser 12A on 83095 Exhauster 3 (B) and Truck 4 were used This tank has a concrete layer on top about 12-18 inches thick which had to be drilled through Part way through sampling questions arose as to the flammable gas status of the tank and RMCS was halted on 10695 A total of 3 RMCS and 7 PMCS segments were taken One RMCS core was obtained The total exhauster run time was 4413 hours The stack record sample was removed and analyzed following this run period Dose rates taken at the side of the exhauster housing during RMCS were all lt05 mRhr
Tank 241-SX-1011297 to 298 Following resolution of extensive regulatory and authorization basis issues and installation of equipment modifications RMCS started in SX-101 with Truck 4 on 12497 An RMCS exhauster was not used since all SX farm tanks excluding SX-113 and SX-I 15 are ventilated with the SX exhauster Sampling was performed in risers 19 and 4 and was completed on 21098 A total of 9 RMCS and 6 PMCS segments were taken Two RMCS cores were obtained SX exhauster stack record samples and filter housing dose rates were obtained as part of routine operations for the SX exhauster not as part of the RMCS process Filter papers used in the suction line for the CGM were saved and analyzed in the laboratory to estimate the airborne radionuclide concentration in the tank head space Two CGM filter papers were needed for each core as moisture in the tank vapors condensed on the papers in the cold weather and began to restrict tank gas flow to the CGM
Tank 241-SX-103498 to 598 RMCS started in SX-103 with Truck 4 on 42798 The SX exhauster was used for ventilation (see SX- 101 above) Sampling was performed in risers 7 and 1 1 and was completed on 51198 A total of 6 RMCS and 18 PMCS segments were taken Two RMCS cores were obtained During sampling filter papers used in the suction line for the CGM were saved and analyzed in the laboratory to estimate the airborne radionuclide concentration in the tank head space One CGM filter paper was used during each core SX exhauster stack record samples and filter housing dose rates were obtained as part of routine operations for the SX exhauster not as part of the RMCS process
Tank 241-SX-105298 to 598 RMCS started in SX-105 with Truck 3 on 22598 The SX exhauster was used for ventilation (see SX- 101 above) Sampling was performed in risers 6 and 14 and was completed on 51598 A total of 6 RMCS and 20 PMCS segments were taken Two RMCS cores were obtained During sampling filter papers used in the suction line for the CGM were saved and analyzed in the laboratory to estimate the airborne radionuclide concentration in the tank head space Two filter papers were needed for the first core as moisture in the tank vapors condensed on the papers in the cold weather and began to restrict tank gas flow to the CGM One filter paper was used for the second core SX exhauster stack record samples and filter housing dose rates were obtained as part of routine operations for the SX exhauster not as part of the RMCS process
Tank 241-SX-102698 to 798 RMCS started in SX-102 with Truck 4 on 61798 The SX exhauster was used for ventilation (see SX- 101 above) Sampling was performed in risers 8 and 4 and was completed on 7798 A total of 2 RMCS and I8 PMCS segments were taken Two RMCS cores were obtained During sampling filter papers used in the suction line for the CGM were saved and analyzed in the laboratory to estimate the airborne radionuclide concentration in the tank head space One filter paper was used for each core SX exhauster stack record samples and filter housing dose rates were obtained as part of routine operations for the SX exhauster not as part of the RMCS process
Tank 241-S-110598 to 698 RMCS was begun in S-I10 on 51898 Exhauster C (4) and Truck 3 were used This tank marked the first use of an RMCS exhauster since 1995 Sampling was completed on 6498 Risers 6 and 14 were sampled A total of IO RMCS and 8 PMCS segments were taken Two RMCS cores were obtained The
F-3
RPP-4826 Rev I
total exhauster run time was 15978 hours The stack record sample was removed and analyzed following this run period Dose rates taken at the side of the exhauster housing during RMCS were all lt05 mRhr During sampling filter papers used in the suction line for the CGM were saved and analyzed in the laboratory to estimate the airborne radionuclide concentration in the tank head space One filter paper was used for each core Waste particles retained on the exhauster housing filters were part of the inventory subsequently measured by NDA following completion of the first core in TX-I 13
Tank 241-U-107698 to 798 RMCS was begun in U-107 on 61098 Exhauster C and Trucks 3 and 4 were used Sampling was completed on 71598 Risers 7 and 2 were sampled A total of IO RMCS and 19 PMCS segments were taken Two RMCS cores were obtained The total exhauster run time was 27385 hours The stack record sample was removed and analyzed following this run period Dose rates taken at the side of the exhauster housing during RMCS were all 105 mRihr During sampling filter papers used in the suction line for the CGM were saved and analyzed in the laboratory to estimate the airborne radionuclide concentration in the tank head space One filter paper was used for each core Waste particles retained on the exhauster housing filters were part of the inventory subsequently measured by NDA following completion of the first core in TX-I 13
Tank 24l-BY-105798 to 898 RMCS was begun in BY-105 again on 72298 Exhauster C and Trucks 3 and 4 were used Sampling was completed on 82598 Risers 7 and 1 1 B were sampled A total of 18 RMCS and 18 PMCS segments were taken The material was hard enough to require rotary mode sampling all the way to the bottom of the waste but negligible recovery was obtained After RMCS was performed to the waste bottom a PMCS core was taken in the same hole to recover material Two RMCS cores were obtained The exhauster run time was 13577 hours for the first RMCS core and 30792 hours for the second RMCS core Stack record sample information in ABCASH shows 30558 hours operation for the second core but the sampler data sheet shows the time counter was mistakenly reset 234 hours into the run No correction was made to the BY-IO5 2nd core record sample concentration for this document since the error is conservative and results in only slightly higher (ltI) record sample radionuclide concentrations for this core A stack record sample was removed and analyzed following each core giving two record samples for BY-IO5 in 1998 Dose rates taken at the side of the exhauster housing during RMCS were almost all lt05 m R h but a few readings indicated 07 mRihr This variation was assumed due to personnel reading the instrument differently or the fact that the exhauster had been used on enough tanks that by now there was sufficient activity on the filters to cause readings approximately at the background detection level The final reading when both cores were completed was lt05 m R h During sampling filter papers used in the suction line for the CGM were saved and analyzed in the laboratory to estimate the airborne radionuclide concentration in the tank head space One filter paper was used for each core Waste particles retained on the exhauster housing filters were part of the inventory subsequently measured by NDA following completion of the first core in TX-113
Tank 241-TX-113998 to 599 Core sampling was begun in TX-I 13 riser 3 on 92298 Exhauster B (3) and Truck 4 were used at the start This was the first use of Exhauster B since it was modified Exhauster B ran for a total of 8738 hours until being disconnected on 102398 During this time two PMCS segments were taken and no RMCS segments Exhauster C was then installed and operated for 5598 hours from 121098 to 122898 No RMCS or PMCS sampling was performed during this time frame RMCS segments werent taken until 299 Exhauster C ran for a 30230 hours between 122898 and 21299 Sampling was completed on the core from riser 3 on 21299 A total of 12 RMCS segments were obtained during the time Exhauster C was operating Exhauster flow rate for both exhausters was a nominal 200 scfm Stack record samples were taken following Exhauster B removal at the end of 1998 for Exhauster C and following completion ofthe first core with Exhauster C Aerosol calculations were based on only the 30230 hours run time for Exhauster C in 1999 since this was the time period during which RMCS segments were obtained Dose rates taken at the side of the exhauster housing during the short PMCS only sampling period with Exhauster B were all ltOS m R h Dose rates with Exhauster C varied between lt O S mRhr and 07 mRhr The final reading on Exhauster C following completion of the first core was 07 mFUhr During sampling filter papers used in the suction line for the CGM were saved and
F-4
RPP-4826 Rev I
analyzed in the laboratory to estimate the airborne radionuclide concentration in the tank head space One filter paper was used for the core Waste particles retained on the exhauster housing filters were part of the inventory subsequently measured by NDA following completion of this core
Sampling in riser 5 was begun on 41299 using Exhauster B and Truck 3 A total of 6 RMCS and 1 PMCS segments were taken for this core before sampling was halted on 42899 The total exhauster run time for this core was 11712 hours Problems with high vacuum in the tank required the exhauster flow rate to be reduced to 190 scfm to keep the system within pressure limits The stack record sample for the second core was removed and analyzed following the run period Dose rates taken at the side of the exhauster housing during the second core were all lt05 m M r During sampling filter papers used in the suction line for the CGM were saved and analyzed in the laboratory to estimate the airborne radionuclide concentration in the tank head space One filter paper was used An NDA was performed on the exhauster housing following this core The only radionuclides present in the housing were those from this core or what was removed from the tank head space during the non-RMCS activities in this tank from 92298 and 102398
Some clarification may be needed to explain use of the exhauster operating times and NDA dose rate and record sample data obtained during core sampling on TX-I 13 Core sampling was set up for sampling riser 3 on TX-113 in September 1998 with Exhauster B Exhauster B operated for a total of 8738 hours between 92298 and 102298 The stack record sample was removed at the end of this period The ERS database incorrectly shows the exhauster operated between 111698 and 111998 The ABCASH database shows the stack record sample was removed on 111998 The stack record sample showed positive emuent concentrations during this time period with variances 400 No RMCS samples were taken during this period so the data and time werenrsquot included when calculating RMCS aerosol numbers Exhauster B was removed and Exhauster C installed in late November-early December Exhauster C was operated for a total of 5559 hours between 121098 and 122398 The stack record sample was removed on 122898 No sampling was performed during this period so the data and time werenrsquot included when calculating RMCS aerosol numbers Exhauster C was operated for a total of 30218 hours between 122898 and 2899 All the RMCS segments from riser 3 were taken in this time period so only the data and time for this period were included when calculating RMCS aerosol numbers Exhauster B was used during sampling of riser 5 Exhauster B operated for a total of 11712 hours between 41299 and 42899
Tank 241-TX-l18599 to 699 RMCS was begun in TX-I 18 on 5699 Exhauster C (4) and Truck 4 were used Sampling was completed on 6298 Risers 9B and 12B were sampled A total of 9 RMCS segments were taken there were no PMCS segments Two RMCS cores were obtained The total exhauster run time was 21247 hours The stack record sample was removed and analyzed following this run period The maximum dose rate taken at the side of the exhauster housing following RMCS was 08 m M r CGM filter papers were not analyzed An NDA was performed on the exhauster housing following completion of the two cores The exhauster housing contained the same nuclides as for the first NDA (S-110 U-107 BY-105 and TX-I 13 first core) plus those from TX-I 18
The basic core sampling operational data used in this document includes the number of RMCS cores and segments the exhauster run times and flow rates the RMCS exhauster HEPA filter dose rates and tank vapor space temperatures Table F-l lists the basic operational data This information excluding tank vapor space temperature data was obtained from procedural data sheets in the sampling work packages (References W - 1 to WP-23)
Tank temperature data for the tanks ventilated with the RMCS exhausters was obtained from the TWINS database Plots for each tank were prepared for the time RMCS was conducted and the average value of the highest thermocouple located in the tank (the lowest temperature reading) was estimated and used as the average tank head space temperature during the RMCS period
The SX exhauster flow rates listed in Table F-l are estimates only The combined flow rate for SX-IO1 through SX-106 plus SX-109 (7 tanks) averaged 440 cfm during CY 1996 (Kaiser 1997) for an average of 63 cfm per
F-5
RPP-4826 Rev I
tank Based upon inlet flow measurements at the tank inlet HEPA filters (Fanis 1998) the flow through each individual tank (SX-IO1 through SX-106 plus SX-109) was lt55 cfm at the breather filter Assuming an exhaust flow of 100 cfm for each SX farm tank sampled is therefore conservative
Calculated Data
Calculated data include the tank head space volumes conversion of the RMCS exhauster flow rate from scfm to acfm and the number of tank head space changeouts made by an exhauster during RMCS
Tank head space volume includes the dome space volume above the top of the sidewall plus the void space between the waste surface and the top of the sidewall The formula used to calculate tank head space volumes WN
Head Space Volume in A = (DS + [(H) (12) + HI + Hb - H] (V)) - 748
Where DS = dome space volume gal H = height of tank body sidewall above knuckle A HI = height of tank knuckle area in Hb = height oftank bottom below knuckle in H = height of waste in tank in V =27555 galin of waste in SX tanks 2754 gallin in all others
The tank dome space volumes height of tank sidewall above the knuckle height of tank knuckle area and height of tank bottom below the knuckle were obtained from Reynolds 1999 The height of waste in each tank at the time of core sampling was obtained from the TWINS database Tank dimensional and waste level data are given in Table F-2 along with the calculated tank head space volumes
Aerosol calculations for Appendices A-C require exhauster flow rates in actual cubic feet per minute The RMCS exhauster flow rate is controlled and recorded in standard cubic feet per minute The mass flow rate of the exhauster air is measured and internal logic in the exhauster controller calculates what the volumetric flow rate would be if the temperature and pressure in the exhauster inlet were at standard conditions The standard conditions used in the logic controller are 29921 in Hg (760 mm Hg) and 69F (ZIT)
A correction factor is built into the exhauster control logic that assumes an atmospheric pressure of 2927 in Hg the average atmospheric pressure at Hanford The RMCS exhauster will operate at about 1-2 in H20 negative pressure resulting in about a 2916 in Hg pressure in a waste tank when the RMCS exhauster is operating To revise the indicated scfm RMCS exhauster reading to an acfm value the RMCS exhauster scfm flaw rate was multiplied by (29922916)(T+459)528 where Tis the tank head space temperature in OF The tank head space temperatures in Table F-1 were input to the spreadsheet file used for aerosol calculations and converted to acfm The flow rates in acfm are included in Table F-I
The tank head space changeouts when using the RMCS exhauster were calculated by multiplying the exhauster acfm flow rate by the time of exhauster operation and dividing the result by the tank head space volume Tank head space changeouts are listed in Table F-2
F-6
c
gt 2
RPP-4826 Rev 1
APPENDIX G
REFERENCES
G-0
RPP-4826 Rev 1
APPENDIX G - References
Diedeker 1999 NDA of RMCS HEPA Filters L P Diedeker WMH E-Mail to JS Schofield CHG November 29 I999
ERDA 1976 Nuclear Air Cleaning Handbook ERDA 76-21 Buchsted C A Fuller A B and Kahn 1 E Oak Ridge National Laboratory 1976
Farris 1998 Internal Note T R Farris LMHC to J S Schofield LMHC Breather Filter Flow Rates for SX-Farm 31698
Foust 1999 Internal Memo RMCST Exhauster HEPA Filter Dose Rate Calculations D J Foust LMHC to J S Schofield LMHC October 25 1999
Greager 1999 Correspondence No WMH-9954450 Non-Destructive Analysis of the Rotay Mode Core Sample High-Efjiciency Particulate Air Filters E M Greager WMH to P C Miller LMHC June 28 1999 [Transmittal of HNF-4199 Resultsfram NDA Measurement of the 296-P-34 RMCS HEPA Filters]
HNF 1999 HNF-SD-WM-SAR-067 Tank Waste Remediation System Final Safety Analysis Report Rev 1 The revision incorporating RMCS accident analyses was submitted as Addendum 5 to DOE as a change to the FSAR predecessor the Basis for Interim Operation (BIO) LMHC-9857075 80232764-9-KOOl Submittal of Authorization Basis Amendment Package for Rotay and Push Mode Core Sampling in Satisfaction of Perfarmance Agreement TWR 122 Expectations I and 3 D 1 Allen LMHC to A M Umek FDH August 30 1998 Addendum 5 as of mid-January 2000 is waiting for approval by DOE
Kaiser 1997 T D Kaiser LMHC E-Mail to J S Schofield LMHC SX Tank Flow Data 42197
NUREG 1995 Potential Radionuclide Emissionsfrom Stacks on the HanfordSite Part I Dose Assessment Davis W E and Barnett J M Westinghouse Hanford Company from Proceedings of the 23 DOEMRC Nuclear Air Cleaning Conference held July 25-28 1994 February 1995
Schofield 2000a Letter 74910-00-002 Use of Microshield Calculations for RMCS Exhauster Housing for Estimating Radionuclide Quantities on the Filters Using NDA and Dose Rate Measurements I S Schofield CHG to File January 62000
Schofield 2000b Letter 74910-00-003 Rev I RMCS Exhauster Stack RecordSample Data J S Schofield CHG to File January 202000
Reynolds 1999 D R Reynolds LMHC E-Mail to I S Schofield LMHC transmitting Tank Volume Calculations draft of calculations done by Mike Plesha and Reed Hendershot data to be used for RESOLVE computer program for Hanford waste tanks August 3 1999
TWINS Tank Waste Information Network System database available at httptwinspnlgovSOO lhtbinTCDgetTableListexe
Waldo 1999 letter 74910-99-009 RMCS Exhauster Aerosol Test Data E I Waldo to J S Schofield June 22 1999
WHC 1993 WHC-SD-WM-ES-225 Rev I AerosolStudy for the Rotary Mode Exhauster P M Francis Westinghouse Hanford Company April 20 1993
WHC 1997 WHC-SD-WM-SAD-035 Rev Ob A Safety Assessment of Rotary Mode Core Sampling in Flammable Gas Single Shell Tanks Hanford Site Richland Washington August 8 1997
G- I
RPP-4826 Rev I
CGM Data CGM-I Letter PARTICULATE SAMPLING OF 241-SX-IO1 DURING ROTARY MODE CORE SAMPLING D C
Langlois E2 Consulting Engineers to J S Schofield Lockheed Martin Hanford Company March 16 1998
CGM-2 Letter PARTICULATE SAMPLING OF 241-SX-I05 DURING ROTARY MODE CORE SAMPLING D C Langlois E2 Consulting Engineers to J S Schofield Lockheed Martin Hanford Company June 9 1998
CGM-3 Letter PARTICULATE SAMPLING OF 241-SX-103 DURING ROTARY MODE CORE SAMPLING D C Langlois E2 Consulting Engineers to J S Schofield Lockheed Martin Hanford Company June 12 1998
CGM-4 Letter PARTICULATE SAMPLING OF 241-S-110 DURING ROTARYMODE CORESAMPLING D C Langlois E2 Consulting Engineers to J S Schofield Lockheed Martin Hanford Company July 20 1998
CGM-5 Letter PARTICULATE SAMPLING OF 241-SX-102 DURING ROTARY MODE CORE SAMPLING D C Langlois E2 Consulting Engineers to J S Schofield Lockheed Martin Hanford Company July 22 1998
CGM-6 Letter PARTICULATE SAMPLING OF241-U-107 DURING ROTARY MODE CORE SAMPLING D C Langlois E2 Consulting Engineers to J S Schofield Lockheed Martin Hanford Company August 3 1998
CGM-7 Letter PARTICULATE SAMPLING OF 241-BY-105 DURING ROTARY MODE CORESAMPLING D C Langlois E2 Consulting Engineers to 1 S Schofield Lockheed Martin Hanford Company September 17 1998
CGM-8 Letter PARTICULATE SAMPLING OF 241-TX-I13 DURING ROTARY MODE CORESAMPLING D C Langlois E2 Consulting Engineers to J S Schofield Lockheed Martin Hanford Company March 15 1999
CGM-9 Letter PARTICULATE SAMPLING OF 241-TX-113 DURING ROTARY MODE CORE SAMPLING D C Langlois E2 Consulting Engineers to I S Schofield Lockheed Martin Hanford Company May 31 1999
Notices of Construction NOC-I DOEIRL-93-40 Radioactive Air Emissions Program Notice of Construction Rotary Mode Core-Sampling
Truck and Exhauster Approved by Letter AIR 93-707 A W Conklin WDOH to J E Rasmussen DOEIRL 7893
NOC-2 DOEIRL-94-118 Rev 0 Radioactive Air Emissions Program Notice of Construction for the Rotary Mode Core-Sampling Systems Three and Four Approved by Letter AIR 95-603 A W Conklin WDOH to J E Rasmussen DOERL 63095
NOC-3 DOERL-94-118 Rev 1 Radioactive Air Emissions Program Notice of Construction for the Rotary Mode Core-Sampling Systems Three and Four Approved by Letter AIR 98-301 W W Conklin WDOH to I E Rasmussen DOEIRL 3698
NOC-4 DOEIRL-97-70 Radioactive Air Emissions Program Notice of Construction for Rotary Mode Core- Sampling in SX Tank Farm Approved by Letter AIR 97-1 101 A W Conklin WDOH to J E Rasmussen DOEIRL 113097
NOC-5 USEPA Letter OAQ-107 (no title approving DOE submittal 97-EAP-590 dated 72997) A J Frankel USEPA to J E Rasrnussen DOEIRL 8497
NOC-5 USEPA Letter OAQ-107rsquo (nb title approving DOE submittal 97-EAP-723 dated 101797) A J Frankel USEPA to J E Rasmussen DOERL 11498
Note that both letters have ldquoOAQ-107rdquo following ldquoReply to Attn ofrdquo
G-2
RPP-4826 Rev I
Work Packages WP-I ES-94-00808 WP-2 ES-95-00258 WP-3 ES-95-00045 - WP-4 ES-95-00434 - WP-5 ws-97-00173 - WP-6 WS-97-00174 - WP-7 ws-97-00143 - WP-8 WS-97-00144 - WP-9 WS-97-00207 - WP-I 1 WS-97-00208 - WP-12 WS-98-00049 - WP-13 WS-97-00050 - WP-14 WS-97-00224 - WP- I5 WS-97-00225 - WP-16 WS-97-00230 - WP- I7 ws-97-0023 1 - WP-18 ES-97-00452 - WP-19 ES-97-00453 - WP-20 WS-98-00072 - WP-21 WS-98-00073 - WP-22 WS-98-00067 - WP-23 WS-98-00068 -
241-BY-IO6 Perform Rotary Core Sample [Riser IOB] 241-BY-I IO Rotary Core Sample [Risers 12B 7 IZB 41 241-BY-IO8 Obtain Rotary Core Sample [Risers 12A amp 71 241-BY-IO5 Rotary Mode Core Sample [Riser 12A] 241-SX-101 Rotary Mode Core Sample Riser 19 241-SX-101 Rotary Mode Core Sample Riser4 241-SX-103 Rotary Mode Core Sample Riser 7 241-SX-103 Rotary Mode Core Sample Riser I I 241-SX-105 RMCST Obtain Core Sample Riser 6 241-SX-105 RMCST Core Sample Riser 14 241-SX-102 Rotary Mode Core Sample Riser 8 241-SX-102 Rotary Mode Core Sample Riser 4 241-S-1 IO RMCST Obtain Core Sample Riser 6 241-S-1 IO RMCST Obtain Core Sample Riser 14 2414-107 RMCSTCore Sample Riser 7 241-U-107 RMCST Core Sample Riser 2 241-BY-IO5 RMCST Core Sample Riser 7 241-BY-IO5 RMCST Core Sample Riser 1 IB 241-TX-113 Rotary Core Sample Riser 3 241-TX-113 RMCST Core Sample Riser 5 241-TX-I 18 RMCST Core Sample Riser 9B 241-TX-I 18 RMCST Core Sample Riser 128
G-3
RPP-4826 Rev I
The gas flow rates and average tank head space mass concentrations during RMCS for Periods 5 and 6 were calculated in a similar manner
The average mass of waste in a tank head space during RMCS was calculated by multiplying the tank head space mass concentration by the tank head space volume from Table F-2 as shown below for S-1 I O
[275 g + 146 E+7 Arsquo] x [89100 ftrsquo] = 167E-2 g waste in S-1 IO head space
The particulate quantities in the other tank head spaces were calculated in a similar manner The weighted average mass in a tank head space during Period 4 was based upon the number of segments taken in each tank
The mass sent to the exhauster per RMCS core or per RMCS segment was obtained by dividing the mass of waste sent to the exhaust stream during each period by the numbers of RMCS cores or RMCS segments obtained during the exhauster operating time The average mass of waste sent to the exhauster during Period 4 is thus
275 g waste + 7 rotary cores = 39E-1 g wastelrotary core
and
275 g waste + 50 rotary segments = 55E-2 g wasteirotary segment
The mass of waste to the exhauster per RMCS core and RMCS segment for Periods 5 and 6 were calculated in a similar manner
All data were input to a spreadsheet to perform the calculations Results are provided in Table A-3
Summary of Calculations
Non Destructive Assay was performed on the RMCS exhauster filter housings used during three separate exhauster operating periods during which IO RMCS cores and 65 RMCS segments were obtained from five tanks Weighted averages of the average tank head space mass concentration average mass of suspended solids in a tank head space and average mass sent to the exhauster per RMCS core or segment for the three periods combined were calculated based upon the number of RMCS segments taken during each period Based upon RMCS exhauster housing NDA data the results indicate that
The average tank head space mass concentration during RMCS was 77E-6 g wastelmrsquo The average mass of suspended solids in the tank head space during RMCS was 18E-2 g waste The average mass sent to the exhauster during RMCS was 52E-1 g wastelcore The average mass sent to the exhauster during RMCS was 63E-2 g wasteisegment
A-4
RPP-4826 Rev 1
APPENDIX B
ESTIMATION OF AEROSOLS GENERATED DURING RMCS BASED UPON Rh4CS EXHAUSTER HEPA FILTER DOSE RATES
B-0
RPP-4826 Rev I
APPENDIX B - Estimation Of Aerosols Generated During RMCS Based Upon RMCS Exhauster HEPA Filter Dose Rates
Summary of Method
This method of estimating RMCS aerosol quantities divides the dose rate increase (mRhr) at the side of the RMCS HEPA filter housing by a calculated dose conversion factor (mRhrmCi C S rdquo ~ ) to obtain an approximation of the radionuclide quantity in the housing This radionuclide quantity is divided by the waste specific activity (mCig) to determine the mass of waste on the HEPA filter Dividing the HEPA filter waste mass by the volume of air passing through the filter provides an estimate of the average tank head space particulate concentration during RMCS Multiplying the average tank head space particulate concentration by the tank head space volume gives an estimate of the average mass of suspended particulates in the tank head space during RMCS Dividing the HEPA filter waste mass by the number of RMCS cores or RMCS segments provides the mass per RMCS core or per RMCS segment sent to the exhauster
Description
Particulates in the exhaust stream are removed by the HEPA filter(s) upstream of the exhaust fan The captured particulates contain radionuclides with CSrsquo~rsquo being the predominant gamma emitter As the particulate quantity on the HEPA filter increases the dose rate at the side of the filter housing will increase proportionately By monitoring the HEPA dose rate at the side of the filter housing the quantity of Csrsquordquo on the HEPA can be estimated This C S rdquo ~ value is then used to back-calculate to a waste mass quantity on the filter using the Csrsquordquo concentration in the tank waste This filter waste mass quantity is used to calculate the concentration of particulates in the tank exhaust stream the total suspended solids in the tank head space and the mass of waste sent to the exhauster for each RMCS core or segment taken Although radionuclides will be trapped on both the prefilter and the primary HEPA filter with a very small amount on the secondary HEPA calculations in this section were based upon the simplifying assumption that all the activity was on the primary HEPA filter
During RMCS exhauster operation the dose rate in m M r at the side of the HEPA filter housing is periodically measured with an Eberline RO-3B per procedure to indicate when radioactive particulates are building up on the filter The limit of detection of the RO-3B is 05 mRhr
Exhauster operations were divided into six operating periods for evaluation in this document These periods are discussed in Appendix F and shown in Table F-I Housing dose rate data were obtained for Exhauster Operating Periods I 24 5 and 6 Relevant information for these periods is also listed in Table B-I Dose rate data are available and were used for all tanks on which an RMCS exhauster was present and RMCS samples were taken This includes BY-106 BY-IO5 (1995) BY-I IO S-l I O U-107 BY-IO5 (1998) TX-113 and TX- 1 18 The dose rate at the end of a period was used as the basis for calculating radionuclides on the filters The only operating period for which dose rate data were not used for estimating filter radionuclide content was Period 3 Period 3 was for RMCS in SX farm using the SX exhauster
The dose rate at the side of the SX exhauster HEPA filter housing was measured during RMCS of SX farm tanks (for sampling of tanks SX-lot SX-102 SX-103 and SX-105) but the data are not useful for estimation of aerosol quantities because the SX exhauster draws on 13 tanks in parallel or in series with the tank being core sampled Many of the tanks have a much higher off gas flow rate than the sampled tank In addition there is background radiation in the area of the SX exhauster filter housing making any increase in the housing dose rate during RMCS difficult to detect
Dose Rate Data
The dose rate data for each period is listed in Table 8-2 No dose rates above minimum detectable limits were evident at the sides of any RMCS exhauster in Periods I 2 and 5
Dose rate measurements were less than detectable for Period 4 during sampling of S-l IO and U-107 When sampling on BY-IO5 there were a few readings of 07 m M r but most were ltOS mRhr This variation in
B- 1
RPP-4826 Rev 1
readings is to be expected as the specific instrument person using the instrument and location at which the dose rate is checked can vary with time The final recorded dose rate when sampling was complete on BY-IO5 was lt05 mRhr At the end of Period 4 following completion of the first core in TX-I 13 Exhauster C was listed as having a 07 m M r dose rate
Period 6 used Exhauster C again with the same housing and filters as at the end of Period 4 The final dose rate for this period was 08 m M r
Periods 124 and 5 all began with a new housing and new filters For Periods 12 and 5 it was conservatively assumed that the final dose rate was equal to 05 m M r giving an increase of 05 mRhr for each of these periods For Period 4 the dose rate increase was 07 m M r for this period Since Period 6 used the same housing and filters as Period 4 the increase for Period 6 was 08 - 07 = 01 m M r
The dose rate increase was converted into a CsIh content on the primary filter for each period Foust 1999 provides various dose rates for an RMCS exhauster housing assuming even dispersal of 1 mCi C S rdquo ~ on the first HEPA filter Using these calculations Schofield 2000a estimated a dose rate conversion factor of 16 mRhrmCi C S rdquo ~ at the detector location for an RO-3B The assumption that radionuclides are evenly distributed on the HEPA is a reasonable assumption based upon the exhauster design and the method used to measure the radiation dose rate
Gamma emitting contribute to the dose rate due to bremsstrahlung radiation and other nuclides may provide some small additional dose but the major penetrating dose rate contributor in aged SST waste is CSrdquo~ Ignoring the presence of all radionuclides (including Srm) except C S rdquo ~ in calculating a HEPA filter waste mass will provide a conservative result This is because assuming all radiation present is due to C S rdquo ~ will result in overestimating the C ~ I ~ ~ c o n t e n t of the filter housing which in turn will result in overestimating the waste mass on the HEPA filter
Dividing the HEPA dose rate for each exhauster installation by the dose conversion factor of I 6 mRhrmCi results in an increase of 031 mCi Csrdquorsquo on the RMCS exhauster filters for Periods I 2 and 5044 mCi for period 4 and 0063 mCi for Period 6
Calculation of Mass Quantity on Filters
Dividing the Csrdquorsquo content of the filters by the specific activity of C S rsquo ~ ~ in the waste gives the estimated mass of waste sent to the exhauster The specific activity value used for the waste in each tank sampled is given in Table E-I Since RMCS was performed on more than one tank in Periods 1 and 4 a weighted average specific activity was used for these periods The weighted average specific activity was calculated based upon the number of RMCS segments taken from each tank sampled during that period The number of RhKS segments obtained during each period are listed in Table B-I These data were obtained from the individual tank data in Table F- I Calculations to estimate the specific activity of waste mixtures were performed in the same manner as shown in Appendix A For Periods 2 5 and 6 RMCS samples were taken in only one tank The waste specific activity used for these periods was the specific activity of the tank sampled The specific activities used for each exhauster operating period are given in Table B-I
For all exhauster installations except BY-IO6 in 1994 and 1995 the RMCS exhausters were hooked directly to the waste tank When sampling BY-106 a prefilter was installed in the tank riser between the tank and the exhauster The prefilter was not used for BY-I IO in Period 1 or for any other tank in any other period Thus for Periods 2 4 5 and 6 the mass of waste on the HEPA was assumed equal to the mass of waste leaving the tank risers For Period 1 the mass of waste on the HEPA had to be adjusted for the BY-106 prefilter DF when estimating the combined mass of waste leaving the BY-IO6 and BY-I IO tank risers The mass of waste on the HEPA for Period 1 was
[031 mCi] [IO00 pCimCi] = 310 pCi
[310 pCi Csrdquorsquoon HEPA] + [I77 pCi C S rdquo ~ ~ waste] = 177 gwaste on HEPA
is the predominant radionuclide contributor to filter dose rates Beta emitting Srw can
on HEPA
B-2
RPP-4826 Rev 1
A decontamination factor (DF) of 5 was used to account for radionuclide removal by the BY-IO6 prefilter (see Appendix D for basis ofprefilter DF) There were 1 1 RMCS segments taken from BY-IO6 and 13 from BY- 1 IO The total mass ofwaste assumed to exit the tank risers was therefore
[ I 77 g waste] [ 1 1 + 131 [[I 151 + 131 = 28 g waste from tank risers
The DF of 5 to account for the prefilter is only applicable to the RMCS of BY-IO6 in 1994 and 1995 for all other exhauster periods the mass of waste on the HEPA was equal to the mass of waste sent to the exhauster riser
The mass of waste sent to the exhauster for Period 2 was
[031 mCi] [IO00 pCimCi] = 310 pCi Csrdquorsquo on HEPA
[3 IO pCi C S rdquo ~ on HEPA] + [225 pCi CsiI7g waste] = I 39 g waste from tank
Using the same formula the mass of waste to the exhauster from Periods 4 and 5 was 241 and 240 g respectively and the increase in waste on the filters for Period 6 was 048 g
Aerosol Calculations
The mass sent to the exhauster per RMCS core or per RMCS segment was obtained by dividing the mass of waste leaving the risers by the number of RMCS cores or RMCS segments obtained during the exhauster operating period
The tank head space particulate concentration was obtained by dividing the mass of waste leaving the riser by the volume of gas sent to the exhauster This volume of gas sent to the exhauster was obtained by multiplying the exhauster flow rate by the exhauster run time from Table F-I The calculations for aerosols generated based upon HEPA dose rates use acfm while the exhauster flow is recorded in scfm so the actin flow rates in Table F- 1 were used
The average mass of aerosols in the tank head space was obtained by multiplying the average tank head space particulate concentration by the tank head space volume from Table F-2
Following is an example of how the mass per RMCS core mass per RMCS segment average tank head space mass concentration and average mass of aerosols in the tank head space were calculated for Period 1 Data used are from Tables E-I F-I and F-2
[200 scfm] [2992+2916] [84 + 4591 + 528 = 21 1 acfm to exhauster from BY-IO6 in 11-1294
using same formula results in 210 acfm for BY-IO6 in 195 and 209 acfm for BY-I IO
28 g waste + [((21 1 acfm)(4878 hr)+(21O)(l867)+(209)(1125))(60 minhr)]= 12E-6 g wastelf to risers
[12E-6 amp] [35315 fmrsquo] =43E-5 g wastemrsquoto risers
[12E-6 gftrsquo] [53700 Arsquo in BY-106 head space] =66E-I g waste in BY-IO6 head space during RMCS
[12E-6 piftrsquo] [92000 ftrsquo in BY-110 headspace] = IIE-l g waste in BY-I10 head spaceduring RMCS
[28 g waste] [5 RMCS cores] = 56E-1 g waste per core to riser
[28 g waste] + [24 RMCS segments] = 12E-1 g waste per segment to risei
8-3
RPP-4826 Rev 1
All data were input to a spreadsheet and the mass to exhauster per RMCS core mass to exhauster per RMCS segment average tank head space mass concentration and average mass of aerosols in the tank head space were calculated for each of the RMCS exhauster operating periods in the same manner as shown above Results are given in Table 8-3
Summary of Calculations
RMCS exhauster operations were segregated into five operating periods during which RMCS was performed The Exhauster B data for BY-IO8 and TX-I 13 riser 3 was not used in these calculations as no RMCS was performed when the exhauster was operating Exhausters were operated in seven tanks during which 16 RMCS cores and 92 RMCS segments were obtained Based on RMCS filter housing dose rate data the results indicate that
These values are conservative as the assumed dose rate at the end of RMCS for Periods I 2 and 5 was assumed to be 05 mRhr In addition using a DF of 5 for the BY-IO6 prefilter skews the results high The in-tank prefilters used in both BY-IO6 sampling events showed no detectable contamination
Operatin Periods 4 and 6 were the only periods with exhauster housing dose rates above detectable The 044 mCi Csrsquordquo and 0063 mCi CsIh increase on the filters for these two periods based upon dose rate data correspond to the 050 mCi CsI3rsquo and 014 mCi Csrdquorsquo increase on the filters for these two periods based u on NDA data (see Appendix A) The 031 mCi C S rdquo ~ for Period 5 is significantly above the 0032 mCi Cslrsquolsquofor the same period determined by the NDA but this is due to assuming the housing dose rate was equal to the minimum detectable 05 mRhr
The average tank head space mass concentration during RMCS was 22E-5 g wastem3 The average mass of suspended solids in the tank head space during RMCS was 47E-2 g waste The average mass sent to the exhauster during RMCS was 59E-1 g wastelRMCS core The average mass sent to the exhauster during RMCS was 1OE-1 g wastelRMCS segment
B-4
v m
__ ~~
RPP-4826 Rev 1
APPENDIX C
ESTIMATION OF AEROSOLS GENERATED DURING RMCS BASED UPON CGM IN-LINE FILTER PAPER ANALYSES
c-0
RPP-4826 Rev I
APPENDIX C - Estimation Of Aerosols Generated During RMCS Based Upon CGM In- Line Filter Paper Analyses
Summary of Method
This method of estimating RMCS aerosol quantities uses radionuclide assay data from in-line filter papers located upstream of continuous gas monitors (CGM) sampling the tank air for flammable gases during RMCS The radionuclide content of the filter paper is divided by the waste radionuclide specific activity and the air flow through the CGM to obtain an estimate of the average mass concentration in the tank head space during the time period the CGM is on Multiplying the estimated average tank head space mass concentration by the tank head space volume gives an estimate of the average mass of particulates in the tank head space during RMCS To obtain the mass per RMCS core or per RMCS segment sent to the exhauster the tank head space average mass concentration is multiplied by the volume of gas sent to the exhauster then multiplied by a correction factor to account for particulates in the head space removed by the exhauster when the CGM is not operating and divided by the number of RMCS cores or RMCS segments
Description
During most tank waste intrusive activities performed since 1996 an intrinsically safe CGM located above ground has been used to continually monitor the tank air for flammable gases during in-tank activities The CGM sampling method draws air directly from the tank head space During RMCS the CGM sampling line is placed in the tank dome space The sampling line is located between the sampling riser and the exhaust riser if practical A pump in the CGM draws tank air up through the line at 05 litmin for measurement of the lower flammability limit (LFL) by the CGM A filter paper is installed in the sampling line upstream of the CGM to protect the unit from internal contamination
Following CGM use the CGM filter papers are normally discarded after monitoring them in the field for contamination To help estimate the tank head space particulate levels during RMCS these filter papers were retained and analyzed in the 222-S laboratory following removal from all tanks in which RMCS was performed from the fall of 1997 through April 1999 Data were collected for the four tanks in SX farm in which RMCS was performed and the next four tanks on which the RMCS exhauster was deployed These tanks are listed in Table c-I Reported CGM Data
The CGM operational data used to estimate aerosol levels during RMCS includes CGM operating times CGM flow rates and filter paper analytical data A summary report containing all the field operating data sheets for CGM usage and lab data was prepared following completion of sampling on each tank for all tanks except TX- 113 For TX-I 13 a separate report was prepared following each core These reports are References CGM-I to CGM-9 The CGM data from these reports are provided in Table C-2
There were 14 CGM installations during RMCS when CGM filter papers were collected and analyzed Each of these installations had Csrdquorsquo total alpha and total beta quantities measured on the filter papers resulting in 42 data points Eight of the measurement results were very low and had errors of gt+-loo These values were not used resulting in a net of 34 data points for calculating average head space mass concentrations based upon CGM data
Calculated Tank Head Space Radionuclide Concentrations
To calculate the average tank head space radionuclide concentrations during RMCS the filter paper radionuclide quantities were first divided by an efficiency factor to account for radionuclides which may not have been captured on the paper This adjusted radionuclide value was divided by the volume of tank air passing through the paper to give the average tank head space radionuclide concentration
The efficiency used for most stack samplers onsite is 73 (see Appendix D) Estimates attached to References CGM-I to CGM-9 indicate the CGM filter paper sampling method used should have a sampling efficiency
c- 1
RPP-4826 Rev 1
exceeding 73 For conservatism a sampling efficiency of 50 was assumed in this document for the CGM filter paper method
The estimated Csrdquorsquo total alpha and total beta concentrations in the tank vapor space were calculated by dividing the radionuclide quantity on the filter paper from Table C-2 by the assumed CGM sampling efficiency of 05 and the volume of gas going to the CGM The volume of gas going to the CGM was calculated by multiplying the time of CGM operation from Table C-2 by the CGM flow rate of 500 mlmin For example the calculated SX- 101 head space C~rsquorsquo~concentration based upon analysis of the CGM filter papers used during RMCS of riser 19 is
[[26E-4 pCi + 051 + [[I755 min][500 mlmin]] = 59E-I0pCiml
All radionuclide concentrations were calculated in a similar fashion Results are given in Table C-3 Table C-3 lists the radionuclide concentrations for all 42 data points The eight radionuclide concentrations not used for estimating mass concentrations are noted
Table C-3 also contains the calculated number of tank head space changeouts by the tank exhauster during CGM operation Tank head space changeouts were calculated by multiplying the exhauster flow rates (in actin) from Table F-1 by the CGM run times from Table C-2 and dividing by the tank head space volumes from Table F-2 The number of tank head space changeouts during CGM operation was used when estimating the waste mass sent to the exhauster See Aerosol Calculations section below for explanation
Aerosol Calculations
Average tank head space mass concentrations based upon CGM filter paper data were calculated by dividing the head space radionuclide concentrations from Table C-3 by the waste specific activities for each tank sampled The waste specific activities used came from Table E-I and are listed again in Table C-I The average of the mass concentrations based upon radionuclide data for each tank was used as the average head space mass concentration for that tank For example the calculated SX-IO1 head space mass concentration analysis from the CGM filter papers used during RMCS of riser 19 is
[59E-10 pCi Csrdquorsquoml+ 112 pCi C S rdquo ~ ~ waste] [ 28317 mlftrsquo] = 1 SE-7 g wasteA3 based upon C S rdquo ~
[ I 7E-I I pCi T A M + 504E-1 pCi TAg waste] [ 283 17 mlftrsquo] = 94E-7 g wasteamprsquo based upon Total Alpha
[43E-9 pCi TBml+ 357 pCi TBg waste] [ 28317 mlArsquo] = 34E-7 g wastel based upon Total Beta
[ [ I 5E-7 + 94E-7 + 34E-7 g wasteArsquo] f 31 = 48E-7 g wasteamp
[48E-7 g wastelt ] [3531467 Arsquom3] = 17E-5 g wastemrsquo
All tank head space mass concentrations were calculated in the same manner The results are presented in Table C-4 The weighted average tank head space mass concentration during RMCS was based upon the number of RMCS segments taken for each data point
The average aerosol mass in the head space during RMCS was calculated by multiplying the average tank head space mass concentration by the tank head space volume from Table F-2 For the same data point as above
[48E-7 g waste Arsquo] [115E+5 Arsquo] = 55E-2 g waste in SX-IO1 head space during RMCS
All average mass quantities present in the tank head space during RMCS were calculated in the same manner using a spreadsheet The results are provided in Table C-4 The weighted average mass of waste in a tank head space in Table C-4 was calculated based upon the number of segments obtained for each data point
Estimation of the mass of waste sent to the exhauster per RMCS core or segment requires calculation of the total mass of waste sent to the exhauster Multiplying the average head space concentration during RMCS by the exhauster flow rate (in acfm) and the time of CGM operation will give the mass of waste sent to the exhauster during the CGM time frame only While the large majority of mass of waste aerosols will have exited the tank or
c -2
RPP-4826 Rev I
resettled by the time the CGM is shut off there could be some residual suspended particles remaining These would eventually pass to the exhauster but would not be picked up by the CGM filter since it was not in service An adjustment factor was used as described in the following paragraphs to account for particles that may exit to the exhauster following shut down of the CGM
Particulates are generated by RMCS when purge gas is blowing out the drill string and the bit is rotating under the waste surface This time averages about six minutes per segment Multiplying the number of RMCS segments per core by six minutes per segment and dividing by the number of minutes of CGM operation shows the creation of particulates will only occur during a nominal 3-4 of the time the CGM is operating During RMCS the normal practice is to install the CGM turn it on when personnel enter a tank farm and keep the unit in constant operation for the remainder of the shift When the portable RMCS exhauster is used the exhauster is normally started at least an hour before RMCS is initiated and kept in operation until it is time to halt operations for the week The SX exhauster is kept in constant operation Comparing exhauster operating times from Tables F-l with CGM operating times from Table C-I it can be seen the CGMs are in operation about 3-15 of the time the RMCS exhauster is operating on a tank This time comparison wasnrsquot estimated for the SX exhauster since the SX exhauster is in constant operation
With CGM operation much longer than the time period when particulates could be generated the majority of particulates generated by RMCS should have settled or been exhausted during the CGM operating period Table C-3 shows the tank head space changeouts made by the exhauster during CGM operating periods ranged from 084 to 63 The average was 24 With the CGMs operating 25-33 times longer than the aerosol generation periods and an average of over two tank head space changeouts during CGM operation the large majority of aerosols generated during RMCS will have settled out or been removed by the exhauster by the time the CGM is shut off To account for particulates remaining in the tank head space after the CGM was turned off that are subsequently removed by an exhauster it was conservatively assumed that 20 of the total mass of particles generated during RMCS were not removed from the tank head space during the CGM operating period Therefore the product of the tank head space concentration and the volume of air sent to the exhauster during the time of CGM operation was multiplied by a factor of 125 (lOOl80) to estimate the total mass of waste sent to the exhauster as a result of RMCS This is shown below for the same SX-IO1 riser 19 data point in the above calculations
[48E-7gA3] [IOOmin] [I755 min] [125]= 11E-l gwastetoexhauster
This value was divided by the number of RMCS cores and RMCS segments from Table C-1 to provide the grams per core and grams per segment in Table C-4 as follows
[ I I E- 1 g waste to exhauster] i 1 core = 11 E-I g wastelRMCS core to exhauster
and
[ 1 I E- 1 g waste to exhauster] + 5 segments = 2 I E-2 g wastelRMCS segment to exhauster
All mass per core and mass per segment values were calculated in the same manner using a spreadsheet The results are provided in Table C-4 The weighted average mass per core and mass per segment in Table C-4 were calculated based upon the number of cores or segments obtained for each data point
Summary of Calculations
There were 34 valid CGM filter paper data points from 14 RMCS CGM sampling periods in eight tanks during which I5 RMCS cores and 79 RMCS segments were obtained Based upon CGM filter paper data the results indicate that
The average tank head space mass concentration during RMCS was 4OE-5 g wastem3 The average mass of suspended solids in the tank head space during RMCS was 97E-2 g waste The average mass sent to the exhauster during RMCS was 18E-1 g wastelRMCS core The average mass sent to the exhauster during RMCS was 34E-2 g wastelRMCS segment
c - 3
RPP-4826 Rev 1
Ignoring all CGM filter paper analytical data points with a variance gtloo will result in conservative results These data points indicate negligible radioactivity was present If a value of zero was assigned to each data point with an analytical error of gtloo instead of ignoring the data point the weighted average particulate quantities in Table C-4 would be reduced by about 12
The average tank head space mass concentrations based upon CGM data will be higher than the average tank head space mass concentrations based upon filter housing NDA or dose rate The RMCS exhauster received tank air from the shifts when sampling was performed and during some of the off-shifts when no sampling was done The CGMs were only operated during the shifts when sampling was performed The air concentration drawn into the CGM and the RMCS exhauster should be roughly the came during the operating shifts but somewhat less during the off-shifts Therefore the tank head space concentration will be higher when based upon CGM data This does not impact the mass of waste sent to the exhauster per core or per segment
c -4
I
- ~
RFP-4826 Rev 1
APPENDIX D
ESTIMATION OF Rh4CS EXHAUSTER HOUSING DECONTAMINATION FACTOR
D-0
RFrsquoP-4826 Rev 1
APPENDIX D - Estimation of RMCS Exhauster Housing Decontamination Factor
Summary of Method
This Appendix estimates a Decontamination Factor (DF) for the RMCS exhausters using housing NDA data and applicable stack record sample data The Csrdquorsquo in the exhauster effluent is divided by the C S rdquo ~ in the exhauster inlet to provide a penetration efficiency The reciprocal ofthe penetration efficiency is the DF
Description
Each RMCS exhauster has an isokinetic sampler located on the stack downstream of the blower and HEPA filters A small pomp pulls air from the exhaust stack into a filter paper at a rate proportional to the exhaust flow Radionuclides in the exhaust stream passing through the sample line are caught on the filter paper The stack operating time and flow rate are recorded When the record sample filter paper is removed the filter paper is analyzed in a laboratory for radionuclides The radionuclide concentration in the stack effluent stream is calculated by dividing the quantity of material on the filter paper by the volume of air through the sampler and then dividing again by a factor to compensate for stack sampler and filter paper efficiency
Multiplying the total beta stack effluent concentration by the total off gas flow gives the total beta emissions from the exhauster The total beta emissions are multiplied by the Csrdquorsquo to total beta ratio for the waste in the tank) being exhausted to give an estimate of the C S rdquo ~ emission The C S rdquo ~ on the filters determined by NDA of the housing (see Appendix A) is added to the C S rdquo ~ emissions to give the total C S rdquo ~ input to the filter housing Dividing the emissions by the input gives the filter housing penetration efficiency Subtracting the penetration efficiency from 1 O gives the filter housing efficiency Dividing 1 O by the penetration efficiency gives the DF
RMCS Stack Record Sample Data
RMCS exhauster stack record samples are taken after completion of each sampling event on a tank Normally this is after all cores on that tank have been obtained but for BY-IO5 in 1998 record samples were taken following each core Record samples are also taken at the end of each year All samples are analyzed for total alpha and total beta At the end of each year all the filter papers for that year are composited and analyzed for individual radionuclides Sample results are entered into the Automated Bar Coding of Air Samples at Hanford (ABCASH) and Environmental Release Summary (ERS) databases Several ofthe filter papers from 1998 were reanalyzed using a longer count time to bring the error rate down
Schofield 2000b compiled and evaluated all available RMCS exhauster stack record sample data filtered out the unusable data provided derivation for the stack sampling efficiency factor and summarized the results Most of the data points were so low as to be unusable since the results were either negative or had error variances gtloo
Column 5 of Table D-1 provides the stack effluent concentrations used for calculation of the filter housing DF The stack effluent data in Table D-l come from Schofield 2000b These values include a 073 sampling efficiency factor
Calculation of RMCS Filter Housing Decontamination Factor Based upon Housing Inlet and Outlet Data
The RMCS exhauster housing NDA and stack record sample data available for exhauster Operating Periods 4 5 and 6 were used to estimate an actual DF for the RMCS exhauster housings The housing NDA data is for CSrdquo~ but there are no usable Csrdquorsquo concentrations for the RMCS exhauster outlet The RMCS exhauster stack Csrsquordquo concentrations are either negative have a variance gtloo or are not available Total beta analyses are available however so the stack eftluent C S rdquo ~ concentrations were estimated by multiplying the total beta concentration by the ratio of Csrdquorsquo to total beta in the tank waste
Column 2 of Table D-l lists the increase in CSrsquo~ on the filters for each operating period as determined by NDA This data was obtained from Table A-2
D- 1
RPP-4826 Rev 1
Column 4 of Table D-l lists the stack exhaust volume for each stack record sample period The stack exhaust volume for the exhauster installation on S-l IO was calculated by
[ZOO std ft3min][15978 hrs] [60 minhr] = 199E+6 std ftrsquo
All other stack volumes in Table D-l were calculated the same way Unlike in Appendices A B and C no adjustment was made to change the 200 scfm to actual cfm This is because the RMCS stack record sample concentrations from Table D-3 are based upon a 200 scfm flow rate rather than the actual flow rate Since the concentrations are on the same basis as the flow rate there is no need to correct to acfm
The total beta emissions for the RMCS exhauster stack were calculated by multiplying the volume by the concentration For the same S-l IO data point
[199E+6 ft3] [18E-15 pCiml] [28317mlft3] [mCi1000 pCi] = 1OE-7 mCi total beta
All other total beta emissions in Table D-l were calculated the same way
The Csrdquorsquo to total beta ratio was calculated from data in Table E-I For the same S- l I O data point
326E+5 Ci CsI3rsquo f I 14E+6 Ci total beta = 029 Ci CslhCi total beta = 029 rnCi CsrdquorsquomCi total beta
The Csrsquordquo emission for the same S-l IO data point was thus
[I OE-7 mCi total beta] [029 mCi CsrdquorsquomCi total beta] = 29E-8 mCi Csrdquorsquo
All Csrsquordquo emissions in Table D-l were calculated in the same manner
The penetration efficiency for each operating period was calculated by dividing the exhauster outlet by the filter inlet Csrdquorsquo quantities For operating period 4 this was
[81E-6 mCi] f [5OE-I + 8IE-6 mCi] = 16E-5 = 16E-3
The DF for operating period 4 is
1 + 16E-5 = 62E+4
The overall DF for periods 4 5 and 6 was calculated by dividing the efluent from all three periods by the total filter input
[95E-6 mCi] f [67E-I t 95E-6 mCi] = 14E-5 = 14E-3 penetration efficiency
I - I 4E-5 = 0999986 = 999986 filter efficiency
1 f 14E-5 = 73E+4 decontamination factor based upon housing inlet and eftluent data
Estimation of Housing Decontamination Factor Based upon General Performance Data
HEPA filters are tested at the manufacturer to a minimum 9997 efficiency using a 03 pm monodisperse aerosol After installation HEPA filters are tested in-place per ASME N5 I O to a minimum 9995 efficiency using a polydisperse aerosol with an approximate droplet size distribution of 99 less than 30 pm 50 less than 07 pm and 10 less than 04 pm The RMCS exhauster housing is tested per ASME N510 and is thus required to have a minimum removal eficiency of 9995 for an aerosol with this approximate size distribution The particle size distribution of the waste aerosols generated by RMCS is unknown but it is assumed that the removal efficiency for RMCS generated aerosols was the same as the removal efficiency for the ASME generated test aerosol
D-2
RPP-4826 Rev I
A 9995 efficiency is equivalent to a DF of 2E+3 while a 9997 efficiency is equivalent to a DF of 33E+3 The actual DF for the RMCS exhauster housing is higher than either of these It has two HEPA filters in series even though the minimum efficiency specified in the NOCs for the RMCS exhausters is only equivalent to one HEPA ERDA 1976 recommends using a DF of 3000rdquo for a filter bank where n is the number of HEPA filters in series This would result in a DF of 9E+6 for the RMCS exhauster housing This is unrealistic Using a DF of 9E+6 will calculate to Csrdquorsquo quantities on the HEPA filtersthat are orders of magnitude above what have been shown to be there based upon the measured dose rates and NDA A DF of 9E+6 would mean the dose rate would have to be almost 100 mRhr at the side of the exhauster housing instead of the 05-08 mRhr dose rates encountered The waste particles will not have the same particle size distribution entering the second HEPA filter as when entering the first The majority of the waste particles will be captured on the I rdquo HEPA filter and although the DF for each HEPA if tested individually using the ASME N5 IO aerosol test method may be 3E+3 (or higher) the overall DF of the two filters in series will not be 3000lsquo This is because the particle size distribution entering the Znd HEPA could have a greater percentage of smaller particles than that entering the 1rdquo
NUREG 1995 included an evaluation of a number of different facility stacks at the Hanford site where the HEPA filter upstream air concentrations were estimated using several different methods This report concluded that back-calculation using a value of 3000rdquo overestimated the upstream radionuclide concentration by three to four orders of magnitude when compared to filter NDA data for the nine stacks for which NDA data were obtained and by three orders of magnitude for the two stacks for which upstream air sample data were available Back- calculation using a value of 3000rdquo was shown to be high by four orders of magnitude for the single stack for which a powder release estimate was available Based upon this information the RMCS exhauster dual filter-in-series housings would have a DF of at least three and maybe four orders of magnitude less than 9E+6 or in the 1E+3 to 1 E+4 range A DF of IE+3 would he less than the minimum permissible under the NOC Comparing the older stack data and design with the newer RMCS exhauster design the minimum DF would be expected to be at least 1E+4
Table D-2 provides the available RMCS exhauster aerosol test data This information was obtained from Waldo 1999 Prior to 1998 the RMCS exhauster primary HEPA filter efficiency and either the secondaly HEPA filter or the overall efficiency for both filters were tested Starting in 1998 only the primary and secondary HEPA filter efficiency were measured The overall efficiency of the two filters in series was only measured three times in 11 setups Twice the overall penetration efficiency was lt0002 and the remaining time the only information that could be found was a value of lt005 Most individual filters had a penetration efficiency of 0002 This appears to be about the limit of the detection equipment Based upon Table D-2 data a penetration efficiency of 0002 (99998 efficiency) is normal for a single HEPA and thus a minimum for an RMCS exhauster housing Assuming a 0002 penetration efficiency for the two filters combined calculates to a DF of 5E+4 (equal to 1 +
000002) for the RMCS exhauster housing
In summary the measured DF for the RMCS exhauster housings over the period from May 1998 through June 1999 was about 73E+4 RMCS aerosol testing prior to use indicates a DF of about 5OE+4 for each of the filters separately but their overall efficiency is not measured Referenced data based on older stacks at Hanford indicate the two HEPA RMCS exhauster housing would likely have a DF of at least IE+4
Estimated Aerosol Levels During RMCS Based Upon RMCS Stack Record Sample Data
Revision 0 of this document used the positive record sample results with variance less than 100 to estimate aerosol concentrations in the exhauster inlet using an assumed exhauster housing DF of 5OE+4 This method of estimating aerosols was eliminated from Revision 1 because the stack concentrations were either too low too scattered or too questionable to provide reliable results There were 112 RMCS stack record sample data points evaluated in Schofield 2000b Excluding the total beta sample results used for estimation of the housing DF there were only ten data points remaining with positive values and variances ltloo the remaining data points were either negative had a variance gtloo or the results were not available
For comparison purposes only Schofield 2000b applied the DF of 73E+4 calculated in this document to the data points not used to calculate the exhauster housing DF to estimate aerosol concentrations upstream of the filters The results showed aerosol levels approximately the same as those estimated using NDA dose rate or CGM filter paper data when a value of zero was used for negative sample results or those with a variance gtloo When only
D-3
RPP-4826 Rev 1
the ten positive results with a variance ltloo were used the aerosol levels calculated to be two to five times higher than those estimated using NDA dose rate or CGM filter paper data Because of the variability of data resulting from the extremely low record sample concentrations and the few useable data points estimation of aerosol levels using record sample data was not included in Revision I See Schofield 2000b for further discussion of the use of record sample data to estimate aerosol levels
Summary of Calculations
A total of nine RMCS exhauster stack record sample data points were used to estimate the RMCS exhauster filter housing decontamination factor These data points were obtained when sampling on five tanks during which 10 RMCS cores and 65 RMCS segments were obtained The overall decontamination factor was 73E+4
Estimation of aerosol generation quantities based upon RMCS stack record sample data is possible However results will likely be skewed high if data points that show non-detectable levels of radionuclides present are ignored instead of using a value of zero for the data point
D-4
RPP-4826 Rev 1
APPENDIX E
TANK WASTE RADIONUCLIDE CONCENTRATIONS USED FOR AEROSOL CALCULATIONS
E-0
RPP-4826 Rev 1
APPENDIX E - Tank Waste Radionuclide Concentrations Used for Aerosol Calculations
The RMCS exhauster NDA data HEPA filter dose rate data CGM filter paper data and stack record sample data provide information on the quantity of radionuclides on the exhauster filters in the tank head space or the exhauster stack during RMCS These radioactivity quantities need to be divided by the waste radionuclide concentration specific activity to determine the mass of waste in the tank head space and in the tank gases sent to the exhauster
The mass quantities in this document were calculated using dry basis radionuclide concentrations Waste particles carried into the tank head space by the purge gas could be wet or dry If wet some of the non-chemically bound water will start to evaporate immediately providing the tank relative humidity is 400 The water present in a waste particle may be chemically bound as a hydrate or free The chemically bound water will not readily evaporate therefore even a ldquodryrdquo particle may have some water associated with it It is impractical to measure the actual water content of the waste particulates caught on the CGM filter paper the exhauster HEPA filters or the stack record sample paper Since the quantity of water in the waste particulates is unknown particulate levels were calculated using dry basis radionuclide concentrations Thus all particulate values given in this document are stated on a dry basis
The waste radionuclide concentrations on a dry basis were calculated from data available in the Tank Waste Information Network System (TWINS) The Best Basis InventorylBest Basis Summary numbers were used These values are the most complete and up to date readily available estimates for Hanford waste tank contents but do not include water The information was downloaded from TWINS into a spreadsheet The total chemical total beta and total alpha quantities were summed in the spreadsheet for all the tanks which were sampled and concentrations for Csrdquorsquo Sr9rsquo total beta and total alpha automatically calculated in pCig These concentrations are provided in Table E-I Because lab techniques for measuring gross beta levels only detect beta particles with a minimum decay energy above 150-200 kev only radionuclides with a decay energy of gt-200 kev were included in the total beta numbers
The TWINS radionuclide concentrations were obtained in December 1999 No corrections were made for decay for this document
The CGM filter paper and stack record sample data indicate the measured radionuclide values are not always in the same ratio to each other as given by TWINS nor are all radionuclides detected that TWINS indicates are present Radionuclides can be distributed unevenly in a tank Soluble fission products (primarily Csrsquordquo) are found in the liquid saltcake and in sludges Insoluble fission products and actinides are found largely in sludges as these are primarily chemical precipitates Sludge could be mixed with saltcake be present in a distinct layer at the bottom of a tank or in several layers in the tank depending upon how waste was transferred into a tank Waste particles may thus not have the same specific activity on a microscopic scale as they would have on a macro scale were the tank contents homogenized During RMCS a top to bottom core sample is attempted resulting in the drill bit and purge gas (which causes aerosols to form) passing through most ofthe waste matrix Assuming the aerosol generation rate is approximately constant during drilling the specific activity of a radionuclide in the suspended solids should be roughly the same as the average specific activity of the same radionuclide in the tank waste While the waste specific activity is probably not homogeneous from top to bottom in a tank and the aerosol generation rate will likely also vary it is beyond the scope of this document to provide an in-depth analysis of all the factors affecting aerosol radionuclide concentration Although sample radionuclide data were not always in the same ratio as provided by TWINS for the purpose of this document the simplifying assumption was made that the average tank specific activity is adequate to provide an approximation of the suspended solids specific activity for all radionuclides Average tank individual radionuclide specific activities were used in the preparation of the exhauster NOCs
The aerosol calculations presented in this document are only as accurate as the TWINS data The combined radionuclide content of all Hanford waste tanks is known fairly well since the overall content is based upon reactor production records CsrdquorsquoSrW recovery data and processing plant discharges Thus TWINS data for all tanks combined should be reasonable There are undoubtedly differences between TWINS data and the actual contents of a specific tank While the specific tank radionuclide data from TWINS used in this document may not be exact deviations from the actual concentrations are assumed to balance out over the number of tanks sampled
E- 1
RPP-4826 Rev 1
APPENDIX F
ROTARY MODE CORE SAMPLING EXHAUSTER AND CORE SAMPLE DATA
F-0
RPP-4826 Rev 1
APPENDIX F - Rotary Mode Core Sampling Exhauster and Core Sample Data
This appendix provides the basic data obtained during RMCS operations which was used in preparation of this document
Basic Operational Data
There have been three RMCS exhausters and three RMCS sampling trucks deployed since starmp of nitrogen- purged RMCS in November 1994 The exhausters are formally designated 296-P-32296-P-33 and 296-P-34 These were originally referred to as parts of RMCS Systems 2 3 and 4 respectively in the Notices of Construction (NOC) for these units The exhauster designations were changed for routine field use in 1996 to exhausters A B and C to avoid confusion with core sampling trucks 23 and 4 since any exhauster could be used with any RMCS truck Exhauster A (2) and RMCS Truck2 have not been used for RMCS since 1995 and are no longer in service for core sampling
Rotary mode core sampling has been conducted in four general time frames since 1994 These time frames were separated by down times for equipment modifications or resolution of environmental permitting and safety concerns For ease of analysis in this document exhauster operations were organized into six distinct operating periods Periods I to 6 were grouped based upon times when the same exhauster and same set of HEPA filters were being used These periods thus overlap with the general operating time frames The four operating time frames were
The first time frame lasted from November 1994 to January 1995 RMCS Truck 2 and Exhauster 2 (A) were used on Tank BY-106 along with an in-tank prefilter This tank provided the initial deployment and testing of the nitrogen-purged equipment in a waste tank During this period radiation dose rates were taken at the side of the exhauster housing Stack record samples were taken in December 1994 and January 1995
The second time frame lasted from July 1995 through October 1995 RMCS Trucks 2 and 4 were used with Exhausters 2 and 3 (A and B) on BY-105 BY-IO8 and BY-I IO During this period radiation dose rates were taken at the sides of the exhauster housings Stack record samples were taken after completion of sampling on each tank No RMCS samples were taken from BY-108 all samples were taken in push mode for this tank
The third time frame began when RMCS was restarted in December 1997 Trucks 3 and 4 were used for sampling of SX-101 SX-103 SX-105 and SX-102 with the SX tank farm exhauster providing ventilation The RMCS exhausters were not used During this period radiation dose rates were taken at the sides of the SX exhauster housing as part of HPT routine surveys SX farm exhauster stack record samples were taken when required by normal operating procedures SX record sampler and filter housing dose rate data were not evaluated for this document It would not be practical using filter dose rate or stack record sample data to estimate the RMCS aerosol addition if any to the SX ventilation system The background radiation around the SX filter housing makes measurement of any small increase in dose rate very difficult to detect The number of tanks being ventilated and the involved off-gas header routings (the exhauster is pulling on thirteen tanks in series or in parallel with the tank being sampled) and any in-tank activities in the SX tanks not being sampled would make it impractical to assess what aerosols resulted from RMCS Beginning with RMCS in SX farm radionuclide analyses were performed on the filter papers protecting the CGMs which draw air out of the tank vapor space for flammable gas detection
The fourth time frame began in May 1998 Between 1095 and 598 Exhausters B and C were extensively modified with new filter housings and other equipment to meet new NOC requirements Trucks 3 and 4 were used with Exhausters B and C (3 and 4) on S-l IO U-107 BY-105 TX-113 and TX-I 18 This period marked the first use ofthe RMCS trucks and RMCS exhausters together following resolution of flammable gas concerns and modifications to the exhausters New filters were installed Radiation dose rates were taken at the sides of the exhauster housings Stack record samples
F- 1
RPP-4826 Rev I
were taken after completion of sampling for each exhauster installation Radionuclide analyses were performed on the CGM filter papers for all tanks except TX-118 An NDA was performed on the Exhauster C housing following completion ofthe first core on TX-I 13 The housing filters when assayed contained aerosols captured by the exhauster following RMCS in S-l IO U-107 BY-105 (1998) and the first core of TX-I 13 Another NDA was performed on Exhauster C following both cores in TX-I 18 An NDA was performed following sampling of the second core in TX-I 13 using Exhauster B The time frame ran through early June 1999 No RMCS samples have been taken after June 1999 nor are any planned for the next few years
For the purposes of evaluating aerosol formation based upon RMCS exhauster housing NDA and dose rate data the exhauster operations were grouped into 6 operating periods These periods are shown in Table F-1 and restated in Tables A-I and B-I All tanks sampled in Periods 1 2 4 5 and 6 were exhausted by the same exhauster with the same housing and filters present during that period Period 3 covered the time the SX exhauster was used during RMCS in SX farm
A brief description of each RMCS tank sampling operation is provided below
Tank 241-BY-1061194 to 1294 RMCS using the nitrogen purge gas system with an exhauster was formally begun on 111794 on tank BY-106 riser IOB Exhauster 2 (A)and Truck 2 were used A sintered metal prefilter was inserted in the riser between the tank and the exhauster A total of eight segments were taken in rotary mode and five segments in push mode until sampling was halted on 122194 One RMCS core was obtained The total exhauster run time was 4878 hours The stack record sample was removed and analyzed following this run period Dose rates taken at the side of the exhauster housing during RMCS were all lt05 mRhr The in-tank prefilter was smeared for contamination when removed from the tank with the smears showing less than detectable levels of radionuclides present (Waldo 1999) The prefilter had been washed with an installed spray system prior to removal from the tank but subsequent testing showed the water flow and pressure were too low to have been effective at removing contamination
Tank 241-BY-106195 Following some process modifications RMCS in BY-IO6 riser IOB began again on 11895 Exhauster 2 (A) and Truck 2 were used The sintered metal prefilter was inserted in the riser between the tank and the exhauster RMCS was halted on 12495 over authorization basis and equipment operability issues for RMCS A total of three segments were taken in rotary mode and eleven segments in push mode One RMCS core was obtained The total exhauster run time was 1867 hours The stack record sample was removed and analyzed following this run period Dose rates taken at the side of the exhauster housing during RMCS were all lt O S mRhr The in-tank prefilter was smeared for contamination when removed from the tank with the smears showing less than detectable levels of radionuclides present (Waldo 1999) The prefilter was not washed this time
Tank 241-BY-110795 to 1095 Following resolution of RMCS authorization basis and equipment issues and completion of the fabrication and testing of Trucks 3 and 4 RMCS was begun in BY-I IO on 71195 Exhauster 2 (A) and Truck 2 were used Samples were taken from risers 128 7 128 again and 4 There was no in- tank prefilter used in this or any subsequent RMCS periods Sampling was performed until 102595 when RMCS was halted over flammable gas issues A total of 13 RMCS segments and 56 PMCS segments were taken Three RMCS cores were obtained The total exhauster run time was 1125 hours The stack record sample was removed and analyzed following this run period Dose rates taken at the side of the exhauster housing during RMCS were all lt O S mRhr
Tank 241-BY-108795 to 895 Core sampling was begun in BY-IO8 on 72595 Exhauster 3 (B) and Truck 4 were used Sampling was done in risers 12A and 7 The tank material proved soft enough so that no RMCS segments were required all segments were obtained in push mode although the exhauster was operated during part of the time sampling was performed Sampling was completed 81895 A total of 16 PMCS segments were taken The total exhauster run time was 6617 hours The stack record sample was removed and
F-2
RPP-4826 Rev 1
analyzed following this run period Dose rates taken at the side of the exhauster housing during RMCS were all lt05 mRhr
Tank 241-BY-105895 to 1095 RMCS was begun in BY-I05 riser 12A on 83095 Exhauster 3 (B) and Truck 4 were used This tank has a concrete layer on top about 12-18 inches thick which had to be drilled through Part way through sampling questions arose as to the flammable gas status of the tank and RMCS was halted on 10695 A total of 3 RMCS and 7 PMCS segments were taken One RMCS core was obtained The total exhauster run time was 4413 hours The stack record sample was removed and analyzed following this run period Dose rates taken at the side of the exhauster housing during RMCS were all lt05 mRhr
Tank 241-SX-1011297 to 298 Following resolution of extensive regulatory and authorization basis issues and installation of equipment modifications RMCS started in SX-101 with Truck 4 on 12497 An RMCS exhauster was not used since all SX farm tanks excluding SX-113 and SX-I 15 are ventilated with the SX exhauster Sampling was performed in risers 19 and 4 and was completed on 21098 A total of 9 RMCS and 6 PMCS segments were taken Two RMCS cores were obtained SX exhauster stack record samples and filter housing dose rates were obtained as part of routine operations for the SX exhauster not as part of the RMCS process Filter papers used in the suction line for the CGM were saved and analyzed in the laboratory to estimate the airborne radionuclide concentration in the tank head space Two CGM filter papers were needed for each core as moisture in the tank vapors condensed on the papers in the cold weather and began to restrict tank gas flow to the CGM
Tank 241-SX-103498 to 598 RMCS started in SX-103 with Truck 4 on 42798 The SX exhauster was used for ventilation (see SX- 101 above) Sampling was performed in risers 7 and 1 1 and was completed on 51198 A total of 6 RMCS and 18 PMCS segments were taken Two RMCS cores were obtained During sampling filter papers used in the suction line for the CGM were saved and analyzed in the laboratory to estimate the airborne radionuclide concentration in the tank head space One CGM filter paper was used during each core SX exhauster stack record samples and filter housing dose rates were obtained as part of routine operations for the SX exhauster not as part of the RMCS process
Tank 241-SX-105298 to 598 RMCS started in SX-105 with Truck 3 on 22598 The SX exhauster was used for ventilation (see SX- 101 above) Sampling was performed in risers 6 and 14 and was completed on 51598 A total of 6 RMCS and 20 PMCS segments were taken Two RMCS cores were obtained During sampling filter papers used in the suction line for the CGM were saved and analyzed in the laboratory to estimate the airborne radionuclide concentration in the tank head space Two filter papers were needed for the first core as moisture in the tank vapors condensed on the papers in the cold weather and began to restrict tank gas flow to the CGM One filter paper was used for the second core SX exhauster stack record samples and filter housing dose rates were obtained as part of routine operations for the SX exhauster not as part of the RMCS process
Tank 241-SX-102698 to 798 RMCS started in SX-102 with Truck 4 on 61798 The SX exhauster was used for ventilation (see SX- 101 above) Sampling was performed in risers 8 and 4 and was completed on 7798 A total of 2 RMCS and I8 PMCS segments were taken Two RMCS cores were obtained During sampling filter papers used in the suction line for the CGM were saved and analyzed in the laboratory to estimate the airborne radionuclide concentration in the tank head space One filter paper was used for each core SX exhauster stack record samples and filter housing dose rates were obtained as part of routine operations for the SX exhauster not as part of the RMCS process
Tank 241-S-110598 to 698 RMCS was begun in S-I10 on 51898 Exhauster C (4) and Truck 3 were used This tank marked the first use of an RMCS exhauster since 1995 Sampling was completed on 6498 Risers 6 and 14 were sampled A total of IO RMCS and 8 PMCS segments were taken Two RMCS cores were obtained The
F-3
RPP-4826 Rev I
total exhauster run time was 15978 hours The stack record sample was removed and analyzed following this run period Dose rates taken at the side of the exhauster housing during RMCS were all lt05 mRhr During sampling filter papers used in the suction line for the CGM were saved and analyzed in the laboratory to estimate the airborne radionuclide concentration in the tank head space One filter paper was used for each core Waste particles retained on the exhauster housing filters were part of the inventory subsequently measured by NDA following completion of the first core in TX-I 13
Tank 241-U-107698 to 798 RMCS was begun in U-107 on 61098 Exhauster C and Trucks 3 and 4 were used Sampling was completed on 71598 Risers 7 and 2 were sampled A total of IO RMCS and 19 PMCS segments were taken Two RMCS cores were obtained The total exhauster run time was 27385 hours The stack record sample was removed and analyzed following this run period Dose rates taken at the side of the exhauster housing during RMCS were all 105 mRihr During sampling filter papers used in the suction line for the CGM were saved and analyzed in the laboratory to estimate the airborne radionuclide concentration in the tank head space One filter paper was used for each core Waste particles retained on the exhauster housing filters were part of the inventory subsequently measured by NDA following completion of the first core in TX-I 13
Tank 24l-BY-105798 to 898 RMCS was begun in BY-105 again on 72298 Exhauster C and Trucks 3 and 4 were used Sampling was completed on 82598 Risers 7 and 1 1 B were sampled A total of 18 RMCS and 18 PMCS segments were taken The material was hard enough to require rotary mode sampling all the way to the bottom of the waste but negligible recovery was obtained After RMCS was performed to the waste bottom a PMCS core was taken in the same hole to recover material Two RMCS cores were obtained The exhauster run time was 13577 hours for the first RMCS core and 30792 hours for the second RMCS core Stack record sample information in ABCASH shows 30558 hours operation for the second core but the sampler data sheet shows the time counter was mistakenly reset 234 hours into the run No correction was made to the BY-IO5 2nd core record sample concentration for this document since the error is conservative and results in only slightly higher (ltI) record sample radionuclide concentrations for this core A stack record sample was removed and analyzed following each core giving two record samples for BY-IO5 in 1998 Dose rates taken at the side of the exhauster housing during RMCS were almost all lt05 m R h but a few readings indicated 07 mRihr This variation was assumed due to personnel reading the instrument differently or the fact that the exhauster had been used on enough tanks that by now there was sufficient activity on the filters to cause readings approximately at the background detection level The final reading when both cores were completed was lt05 m R h During sampling filter papers used in the suction line for the CGM were saved and analyzed in the laboratory to estimate the airborne radionuclide concentration in the tank head space One filter paper was used for each core Waste particles retained on the exhauster housing filters were part of the inventory subsequently measured by NDA following completion of the first core in TX-113
Tank 241-TX-113998 to 599 Core sampling was begun in TX-I 13 riser 3 on 92298 Exhauster B (3) and Truck 4 were used at the start This was the first use of Exhauster B since it was modified Exhauster B ran for a total of 8738 hours until being disconnected on 102398 During this time two PMCS segments were taken and no RMCS segments Exhauster C was then installed and operated for 5598 hours from 121098 to 122898 No RMCS or PMCS sampling was performed during this time frame RMCS segments werent taken until 299 Exhauster C ran for a 30230 hours between 122898 and 21299 Sampling was completed on the core from riser 3 on 21299 A total of 12 RMCS segments were obtained during the time Exhauster C was operating Exhauster flow rate for both exhausters was a nominal 200 scfm Stack record samples were taken following Exhauster B removal at the end of 1998 for Exhauster C and following completion ofthe first core with Exhauster C Aerosol calculations were based on only the 30230 hours run time for Exhauster C in 1999 since this was the time period during which RMCS segments were obtained Dose rates taken at the side of the exhauster housing during the short PMCS only sampling period with Exhauster B were all ltOS m R h Dose rates with Exhauster C varied between lt O S mRhr and 07 mRhr The final reading on Exhauster C following completion of the first core was 07 mFUhr During sampling filter papers used in the suction line for the CGM were saved and
F-4
RPP-4826 Rev I
analyzed in the laboratory to estimate the airborne radionuclide concentration in the tank head space One filter paper was used for the core Waste particles retained on the exhauster housing filters were part of the inventory subsequently measured by NDA following completion of this core
Sampling in riser 5 was begun on 41299 using Exhauster B and Truck 3 A total of 6 RMCS and 1 PMCS segments were taken for this core before sampling was halted on 42899 The total exhauster run time for this core was 11712 hours Problems with high vacuum in the tank required the exhauster flow rate to be reduced to 190 scfm to keep the system within pressure limits The stack record sample for the second core was removed and analyzed following the run period Dose rates taken at the side of the exhauster housing during the second core were all lt05 m M r During sampling filter papers used in the suction line for the CGM were saved and analyzed in the laboratory to estimate the airborne radionuclide concentration in the tank head space One filter paper was used An NDA was performed on the exhauster housing following this core The only radionuclides present in the housing were those from this core or what was removed from the tank head space during the non-RMCS activities in this tank from 92298 and 102398
Some clarification may be needed to explain use of the exhauster operating times and NDA dose rate and record sample data obtained during core sampling on TX-I 13 Core sampling was set up for sampling riser 3 on TX-113 in September 1998 with Exhauster B Exhauster B operated for a total of 8738 hours between 92298 and 102298 The stack record sample was removed at the end of this period The ERS database incorrectly shows the exhauster operated between 111698 and 111998 The ABCASH database shows the stack record sample was removed on 111998 The stack record sample showed positive emuent concentrations during this time period with variances 400 No RMCS samples were taken during this period so the data and time werenrsquot included when calculating RMCS aerosol numbers Exhauster B was removed and Exhauster C installed in late November-early December Exhauster C was operated for a total of 5559 hours between 121098 and 122398 The stack record sample was removed on 122898 No sampling was performed during this period so the data and time werenrsquot included when calculating RMCS aerosol numbers Exhauster C was operated for a total of 30218 hours between 122898 and 2899 All the RMCS segments from riser 3 were taken in this time period so only the data and time for this period were included when calculating RMCS aerosol numbers Exhauster B was used during sampling of riser 5 Exhauster B operated for a total of 11712 hours between 41299 and 42899
Tank 241-TX-l18599 to 699 RMCS was begun in TX-I 18 on 5699 Exhauster C (4) and Truck 4 were used Sampling was completed on 6298 Risers 9B and 12B were sampled A total of 9 RMCS segments were taken there were no PMCS segments Two RMCS cores were obtained The total exhauster run time was 21247 hours The stack record sample was removed and analyzed following this run period The maximum dose rate taken at the side of the exhauster housing following RMCS was 08 m M r CGM filter papers were not analyzed An NDA was performed on the exhauster housing following completion of the two cores The exhauster housing contained the same nuclides as for the first NDA (S-110 U-107 BY-105 and TX-I 13 first core) plus those from TX-I 18
The basic core sampling operational data used in this document includes the number of RMCS cores and segments the exhauster run times and flow rates the RMCS exhauster HEPA filter dose rates and tank vapor space temperatures Table F-l lists the basic operational data This information excluding tank vapor space temperature data was obtained from procedural data sheets in the sampling work packages (References W - 1 to WP-23)
Tank temperature data for the tanks ventilated with the RMCS exhausters was obtained from the TWINS database Plots for each tank were prepared for the time RMCS was conducted and the average value of the highest thermocouple located in the tank (the lowest temperature reading) was estimated and used as the average tank head space temperature during the RMCS period
The SX exhauster flow rates listed in Table F-l are estimates only The combined flow rate for SX-IO1 through SX-106 plus SX-109 (7 tanks) averaged 440 cfm during CY 1996 (Kaiser 1997) for an average of 63 cfm per
F-5
RPP-4826 Rev I
tank Based upon inlet flow measurements at the tank inlet HEPA filters (Fanis 1998) the flow through each individual tank (SX-IO1 through SX-106 plus SX-109) was lt55 cfm at the breather filter Assuming an exhaust flow of 100 cfm for each SX farm tank sampled is therefore conservative
Calculated Data
Calculated data include the tank head space volumes conversion of the RMCS exhauster flow rate from scfm to acfm and the number of tank head space changeouts made by an exhauster during RMCS
Tank head space volume includes the dome space volume above the top of the sidewall plus the void space between the waste surface and the top of the sidewall The formula used to calculate tank head space volumes WN
Head Space Volume in A = (DS + [(H) (12) + HI + Hb - H] (V)) - 748
Where DS = dome space volume gal H = height of tank body sidewall above knuckle A HI = height of tank knuckle area in Hb = height oftank bottom below knuckle in H = height of waste in tank in V =27555 galin of waste in SX tanks 2754 gallin in all others
The tank dome space volumes height of tank sidewall above the knuckle height of tank knuckle area and height of tank bottom below the knuckle were obtained from Reynolds 1999 The height of waste in each tank at the time of core sampling was obtained from the TWINS database Tank dimensional and waste level data are given in Table F-2 along with the calculated tank head space volumes
Aerosol calculations for Appendices A-C require exhauster flow rates in actual cubic feet per minute The RMCS exhauster flow rate is controlled and recorded in standard cubic feet per minute The mass flow rate of the exhauster air is measured and internal logic in the exhauster controller calculates what the volumetric flow rate would be if the temperature and pressure in the exhauster inlet were at standard conditions The standard conditions used in the logic controller are 29921 in Hg (760 mm Hg) and 69F (ZIT)
A correction factor is built into the exhauster control logic that assumes an atmospheric pressure of 2927 in Hg the average atmospheric pressure at Hanford The RMCS exhauster will operate at about 1-2 in H20 negative pressure resulting in about a 2916 in Hg pressure in a waste tank when the RMCS exhauster is operating To revise the indicated scfm RMCS exhauster reading to an acfm value the RMCS exhauster scfm flaw rate was multiplied by (29922916)(T+459)528 where Tis the tank head space temperature in OF The tank head space temperatures in Table F-1 were input to the spreadsheet file used for aerosol calculations and converted to acfm The flow rates in acfm are included in Table F-I
The tank head space changeouts when using the RMCS exhauster were calculated by multiplying the exhauster acfm flow rate by the time of exhauster operation and dividing the result by the tank head space volume Tank head space changeouts are listed in Table F-2
F-6
c
gt 2
RPP-4826 Rev 1
APPENDIX G
REFERENCES
G-0
RPP-4826 Rev 1
APPENDIX G - References
Diedeker 1999 NDA of RMCS HEPA Filters L P Diedeker WMH E-Mail to JS Schofield CHG November 29 I999
ERDA 1976 Nuclear Air Cleaning Handbook ERDA 76-21 Buchsted C A Fuller A B and Kahn 1 E Oak Ridge National Laboratory 1976
Farris 1998 Internal Note T R Farris LMHC to J S Schofield LMHC Breather Filter Flow Rates for SX-Farm 31698
Foust 1999 Internal Memo RMCST Exhauster HEPA Filter Dose Rate Calculations D J Foust LMHC to J S Schofield LMHC October 25 1999
Greager 1999 Correspondence No WMH-9954450 Non-Destructive Analysis of the Rotay Mode Core Sample High-Efjiciency Particulate Air Filters E M Greager WMH to P C Miller LMHC June 28 1999 [Transmittal of HNF-4199 Resultsfram NDA Measurement of the 296-P-34 RMCS HEPA Filters]
HNF 1999 HNF-SD-WM-SAR-067 Tank Waste Remediation System Final Safety Analysis Report Rev 1 The revision incorporating RMCS accident analyses was submitted as Addendum 5 to DOE as a change to the FSAR predecessor the Basis for Interim Operation (BIO) LMHC-9857075 80232764-9-KOOl Submittal of Authorization Basis Amendment Package for Rotay and Push Mode Core Sampling in Satisfaction of Perfarmance Agreement TWR 122 Expectations I and 3 D 1 Allen LMHC to A M Umek FDH August 30 1998 Addendum 5 as of mid-January 2000 is waiting for approval by DOE
Kaiser 1997 T D Kaiser LMHC E-Mail to J S Schofield LMHC SX Tank Flow Data 42197
NUREG 1995 Potential Radionuclide Emissionsfrom Stacks on the HanfordSite Part I Dose Assessment Davis W E and Barnett J M Westinghouse Hanford Company from Proceedings of the 23 DOEMRC Nuclear Air Cleaning Conference held July 25-28 1994 February 1995
Schofield 2000a Letter 74910-00-002 Use of Microshield Calculations for RMCS Exhauster Housing for Estimating Radionuclide Quantities on the Filters Using NDA and Dose Rate Measurements I S Schofield CHG to File January 62000
Schofield 2000b Letter 74910-00-003 Rev I RMCS Exhauster Stack RecordSample Data J S Schofield CHG to File January 202000
Reynolds 1999 D R Reynolds LMHC E-Mail to I S Schofield LMHC transmitting Tank Volume Calculations draft of calculations done by Mike Plesha and Reed Hendershot data to be used for RESOLVE computer program for Hanford waste tanks August 3 1999
TWINS Tank Waste Information Network System database available at httptwinspnlgovSOO lhtbinTCDgetTableListexe
Waldo 1999 letter 74910-99-009 RMCS Exhauster Aerosol Test Data E I Waldo to J S Schofield June 22 1999
WHC 1993 WHC-SD-WM-ES-225 Rev I AerosolStudy for the Rotary Mode Exhauster P M Francis Westinghouse Hanford Company April 20 1993
WHC 1997 WHC-SD-WM-SAD-035 Rev Ob A Safety Assessment of Rotary Mode Core Sampling in Flammable Gas Single Shell Tanks Hanford Site Richland Washington August 8 1997
G- I
RPP-4826 Rev I
CGM Data CGM-I Letter PARTICULATE SAMPLING OF 241-SX-IO1 DURING ROTARY MODE CORE SAMPLING D C
Langlois E2 Consulting Engineers to J S Schofield Lockheed Martin Hanford Company March 16 1998
CGM-2 Letter PARTICULATE SAMPLING OF 241-SX-I05 DURING ROTARY MODE CORE SAMPLING D C Langlois E2 Consulting Engineers to J S Schofield Lockheed Martin Hanford Company June 9 1998
CGM-3 Letter PARTICULATE SAMPLING OF 241-SX-103 DURING ROTARY MODE CORE SAMPLING D C Langlois E2 Consulting Engineers to J S Schofield Lockheed Martin Hanford Company June 12 1998
CGM-4 Letter PARTICULATE SAMPLING OF 241-S-110 DURING ROTARYMODE CORESAMPLING D C Langlois E2 Consulting Engineers to J S Schofield Lockheed Martin Hanford Company July 20 1998
CGM-5 Letter PARTICULATE SAMPLING OF 241-SX-102 DURING ROTARY MODE CORE SAMPLING D C Langlois E2 Consulting Engineers to J S Schofield Lockheed Martin Hanford Company July 22 1998
CGM-6 Letter PARTICULATE SAMPLING OF241-U-107 DURING ROTARY MODE CORE SAMPLING D C Langlois E2 Consulting Engineers to J S Schofield Lockheed Martin Hanford Company August 3 1998
CGM-7 Letter PARTICULATE SAMPLING OF 241-BY-105 DURING ROTARY MODE CORESAMPLING D C Langlois E2 Consulting Engineers to 1 S Schofield Lockheed Martin Hanford Company September 17 1998
CGM-8 Letter PARTICULATE SAMPLING OF 241-TX-I13 DURING ROTARY MODE CORESAMPLING D C Langlois E2 Consulting Engineers to J S Schofield Lockheed Martin Hanford Company March 15 1999
CGM-9 Letter PARTICULATE SAMPLING OF 241-TX-113 DURING ROTARY MODE CORE SAMPLING D C Langlois E2 Consulting Engineers to I S Schofield Lockheed Martin Hanford Company May 31 1999
Notices of Construction NOC-I DOEIRL-93-40 Radioactive Air Emissions Program Notice of Construction Rotary Mode Core-Sampling
Truck and Exhauster Approved by Letter AIR 93-707 A W Conklin WDOH to J E Rasmussen DOEIRL 7893
NOC-2 DOEIRL-94-118 Rev 0 Radioactive Air Emissions Program Notice of Construction for the Rotary Mode Core-Sampling Systems Three and Four Approved by Letter AIR 95-603 A W Conklin WDOH to J E Rasmussen DOERL 63095
NOC-3 DOERL-94-118 Rev 1 Radioactive Air Emissions Program Notice of Construction for the Rotary Mode Core-Sampling Systems Three and Four Approved by Letter AIR 98-301 W W Conklin WDOH to I E Rasmussen DOEIRL 3698
NOC-4 DOEIRL-97-70 Radioactive Air Emissions Program Notice of Construction for Rotary Mode Core- Sampling in SX Tank Farm Approved by Letter AIR 97-1 101 A W Conklin WDOH to J E Rasmussen DOEIRL 113097
NOC-5 USEPA Letter OAQ-107 (no title approving DOE submittal 97-EAP-590 dated 72997) A J Frankel USEPA to J E Rasrnussen DOEIRL 8497
NOC-5 USEPA Letter OAQ-107rsquo (nb title approving DOE submittal 97-EAP-723 dated 101797) A J Frankel USEPA to J E Rasmussen DOERL 11498
Note that both letters have ldquoOAQ-107rdquo following ldquoReply to Attn ofrdquo
G-2
RPP-4826 Rev I
Work Packages WP-I ES-94-00808 WP-2 ES-95-00258 WP-3 ES-95-00045 - WP-4 ES-95-00434 - WP-5 ws-97-00173 - WP-6 WS-97-00174 - WP-7 ws-97-00143 - WP-8 WS-97-00144 - WP-9 WS-97-00207 - WP-I 1 WS-97-00208 - WP-12 WS-98-00049 - WP-13 WS-97-00050 - WP-14 WS-97-00224 - WP- I5 WS-97-00225 - WP-16 WS-97-00230 - WP- I7 ws-97-0023 1 - WP-18 ES-97-00452 - WP-19 ES-97-00453 - WP-20 WS-98-00072 - WP-21 WS-98-00073 - WP-22 WS-98-00067 - WP-23 WS-98-00068 -
241-BY-IO6 Perform Rotary Core Sample [Riser IOB] 241-BY-I IO Rotary Core Sample [Risers 12B 7 IZB 41 241-BY-IO8 Obtain Rotary Core Sample [Risers 12A amp 71 241-BY-IO5 Rotary Mode Core Sample [Riser 12A] 241-SX-101 Rotary Mode Core Sample Riser 19 241-SX-101 Rotary Mode Core Sample Riser4 241-SX-103 Rotary Mode Core Sample Riser 7 241-SX-103 Rotary Mode Core Sample Riser I I 241-SX-105 RMCST Obtain Core Sample Riser 6 241-SX-105 RMCST Core Sample Riser 14 241-SX-102 Rotary Mode Core Sample Riser 8 241-SX-102 Rotary Mode Core Sample Riser 4 241-S-1 IO RMCST Obtain Core Sample Riser 6 241-S-1 IO RMCST Obtain Core Sample Riser 14 2414-107 RMCSTCore Sample Riser 7 241-U-107 RMCST Core Sample Riser 2 241-BY-IO5 RMCST Core Sample Riser 7 241-BY-IO5 RMCST Core Sample Riser 1 IB 241-TX-113 Rotary Core Sample Riser 3 241-TX-113 RMCST Core Sample Riser 5 241-TX-I 18 RMCST Core Sample Riser 9B 241-TX-I 18 RMCST Core Sample Riser 128
G-3
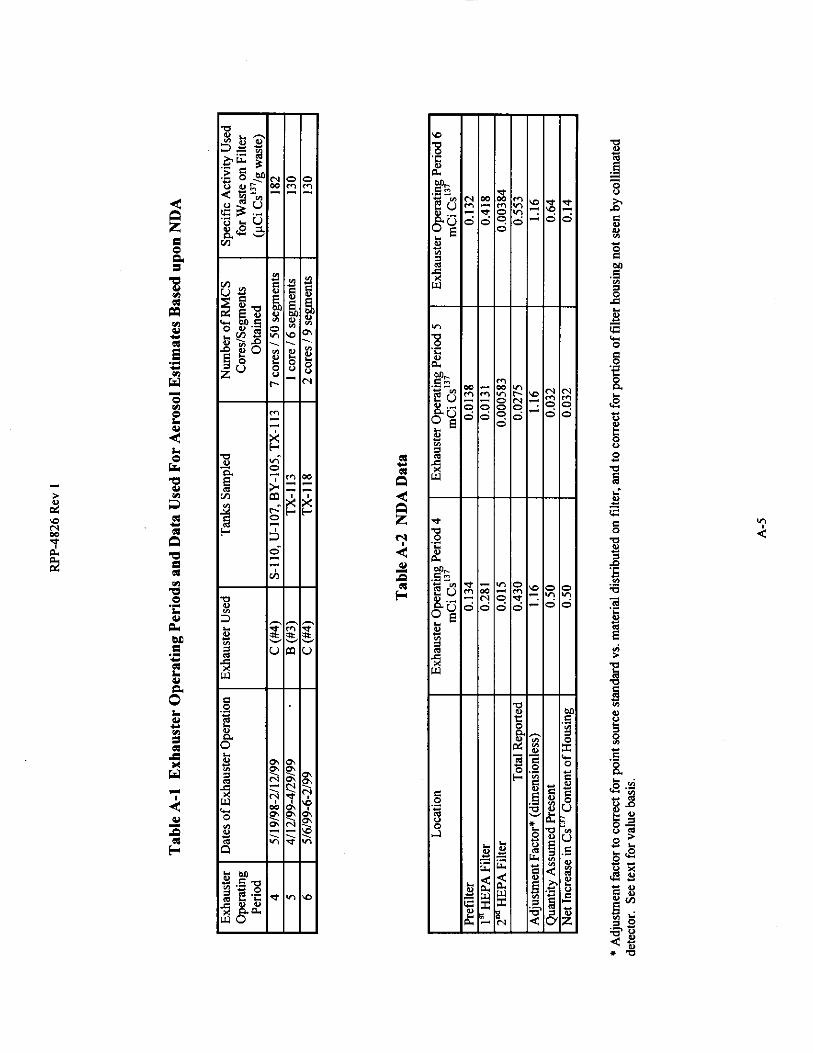
RPP-4826 Rev 1
APPENDIX B
ESTIMATION OF AEROSOLS GENERATED DURING RMCS BASED UPON Rh4CS EXHAUSTER HEPA FILTER DOSE RATES
B-0
RPP-4826 Rev I
APPENDIX B - Estimation Of Aerosols Generated During RMCS Based Upon RMCS Exhauster HEPA Filter Dose Rates
Summary of Method
This method of estimating RMCS aerosol quantities divides the dose rate increase (mRhr) at the side of the RMCS HEPA filter housing by a calculated dose conversion factor (mRhrmCi C S rdquo ~ ) to obtain an approximation of the radionuclide quantity in the housing This radionuclide quantity is divided by the waste specific activity (mCig) to determine the mass of waste on the HEPA filter Dividing the HEPA filter waste mass by the volume of air passing through the filter provides an estimate of the average tank head space particulate concentration during RMCS Multiplying the average tank head space particulate concentration by the tank head space volume gives an estimate of the average mass of suspended particulates in the tank head space during RMCS Dividing the HEPA filter waste mass by the number of RMCS cores or RMCS segments provides the mass per RMCS core or per RMCS segment sent to the exhauster
Description
Particulates in the exhaust stream are removed by the HEPA filter(s) upstream of the exhaust fan The captured particulates contain radionuclides with CSrsquo~rsquo being the predominant gamma emitter As the particulate quantity on the HEPA filter increases the dose rate at the side of the filter housing will increase proportionately By monitoring the HEPA dose rate at the side of the filter housing the quantity of Csrsquordquo on the HEPA can be estimated This C S rdquo ~ value is then used to back-calculate to a waste mass quantity on the filter using the Csrsquordquo concentration in the tank waste This filter waste mass quantity is used to calculate the concentration of particulates in the tank exhaust stream the total suspended solids in the tank head space and the mass of waste sent to the exhauster for each RMCS core or segment taken Although radionuclides will be trapped on both the prefilter and the primary HEPA filter with a very small amount on the secondary HEPA calculations in this section were based upon the simplifying assumption that all the activity was on the primary HEPA filter
During RMCS exhauster operation the dose rate in m M r at the side of the HEPA filter housing is periodically measured with an Eberline RO-3B per procedure to indicate when radioactive particulates are building up on the filter The limit of detection of the RO-3B is 05 mRhr
Exhauster operations were divided into six operating periods for evaluation in this document These periods are discussed in Appendix F and shown in Table F-I Housing dose rate data were obtained for Exhauster Operating Periods I 24 5 and 6 Relevant information for these periods is also listed in Table B-I Dose rate data are available and were used for all tanks on which an RMCS exhauster was present and RMCS samples were taken This includes BY-106 BY-IO5 (1995) BY-I IO S-l I O U-107 BY-IO5 (1998) TX-113 and TX- 1 18 The dose rate at the end of a period was used as the basis for calculating radionuclides on the filters The only operating period for which dose rate data were not used for estimating filter radionuclide content was Period 3 Period 3 was for RMCS in SX farm using the SX exhauster
The dose rate at the side of the SX exhauster HEPA filter housing was measured during RMCS of SX farm tanks (for sampling of tanks SX-lot SX-102 SX-103 and SX-105) but the data are not useful for estimation of aerosol quantities because the SX exhauster draws on 13 tanks in parallel or in series with the tank being core sampled Many of the tanks have a much higher off gas flow rate than the sampled tank In addition there is background radiation in the area of the SX exhauster filter housing making any increase in the housing dose rate during RMCS difficult to detect
Dose Rate Data
The dose rate data for each period is listed in Table 8-2 No dose rates above minimum detectable limits were evident at the sides of any RMCS exhauster in Periods I 2 and 5
Dose rate measurements were less than detectable for Period 4 during sampling of S-l IO and U-107 When sampling on BY-IO5 there were a few readings of 07 m M r but most were ltOS mRhr This variation in
B- 1
RPP-4826 Rev 1
readings is to be expected as the specific instrument person using the instrument and location at which the dose rate is checked can vary with time The final recorded dose rate when sampling was complete on BY-IO5 was lt05 mRhr At the end of Period 4 following completion of the first core in TX-I 13 Exhauster C was listed as having a 07 m M r dose rate
Period 6 used Exhauster C again with the same housing and filters as at the end of Period 4 The final dose rate for this period was 08 m M r
Periods 124 and 5 all began with a new housing and new filters For Periods 12 and 5 it was conservatively assumed that the final dose rate was equal to 05 m M r giving an increase of 05 mRhr for each of these periods For Period 4 the dose rate increase was 07 m M r for this period Since Period 6 used the same housing and filters as Period 4 the increase for Period 6 was 08 - 07 = 01 m M r
The dose rate increase was converted into a CsIh content on the primary filter for each period Foust 1999 provides various dose rates for an RMCS exhauster housing assuming even dispersal of 1 mCi C S rdquo ~ on the first HEPA filter Using these calculations Schofield 2000a estimated a dose rate conversion factor of 16 mRhrmCi C S rdquo ~ at the detector location for an RO-3B The assumption that radionuclides are evenly distributed on the HEPA is a reasonable assumption based upon the exhauster design and the method used to measure the radiation dose rate
Gamma emitting contribute to the dose rate due to bremsstrahlung radiation and other nuclides may provide some small additional dose but the major penetrating dose rate contributor in aged SST waste is CSrdquo~ Ignoring the presence of all radionuclides (including Srm) except C S rdquo ~ in calculating a HEPA filter waste mass will provide a conservative result This is because assuming all radiation present is due to C S rdquo ~ will result in overestimating the C ~ I ~ ~ c o n t e n t of the filter housing which in turn will result in overestimating the waste mass on the HEPA filter
Dividing the HEPA dose rate for each exhauster installation by the dose conversion factor of I 6 mRhrmCi results in an increase of 031 mCi Csrdquorsquo on the RMCS exhauster filters for Periods I 2 and 5044 mCi for period 4 and 0063 mCi for Period 6
Calculation of Mass Quantity on Filters
Dividing the Csrdquorsquo content of the filters by the specific activity of C S rsquo ~ ~ in the waste gives the estimated mass of waste sent to the exhauster The specific activity value used for the waste in each tank sampled is given in Table E-I Since RMCS was performed on more than one tank in Periods 1 and 4 a weighted average specific activity was used for these periods The weighted average specific activity was calculated based upon the number of RMCS segments taken from each tank sampled during that period The number of RhKS segments obtained during each period are listed in Table B-I These data were obtained from the individual tank data in Table F- I Calculations to estimate the specific activity of waste mixtures were performed in the same manner as shown in Appendix A For Periods 2 5 and 6 RMCS samples were taken in only one tank The waste specific activity used for these periods was the specific activity of the tank sampled The specific activities used for each exhauster operating period are given in Table B-I
For all exhauster installations except BY-IO6 in 1994 and 1995 the RMCS exhausters were hooked directly to the waste tank When sampling BY-106 a prefilter was installed in the tank riser between the tank and the exhauster The prefilter was not used for BY-I IO in Period 1 or for any other tank in any other period Thus for Periods 2 4 5 and 6 the mass of waste on the HEPA was assumed equal to the mass of waste leaving the tank risers For Period 1 the mass of waste on the HEPA had to be adjusted for the BY-106 prefilter DF when estimating the combined mass of waste leaving the BY-IO6 and BY-I IO tank risers The mass of waste on the HEPA for Period 1 was
[031 mCi] [IO00 pCimCi] = 310 pCi
[310 pCi Csrdquorsquoon HEPA] + [I77 pCi C S rdquo ~ ~ waste] = 177 gwaste on HEPA
is the predominant radionuclide contributor to filter dose rates Beta emitting Srw can
on HEPA
B-2
RPP-4826 Rev 1
A decontamination factor (DF) of 5 was used to account for radionuclide removal by the BY-IO6 prefilter (see Appendix D for basis ofprefilter DF) There were 1 1 RMCS segments taken from BY-IO6 and 13 from BY- 1 IO The total mass ofwaste assumed to exit the tank risers was therefore
[ I 77 g waste] [ 1 1 + 131 [[I 151 + 131 = 28 g waste from tank risers
The DF of 5 to account for the prefilter is only applicable to the RMCS of BY-IO6 in 1994 and 1995 for all other exhauster periods the mass of waste on the HEPA was equal to the mass of waste sent to the exhauster riser
The mass of waste sent to the exhauster for Period 2 was
[031 mCi] [IO00 pCimCi] = 310 pCi Csrdquorsquo on HEPA
[3 IO pCi C S rdquo ~ on HEPA] + [225 pCi CsiI7g waste] = I 39 g waste from tank
Using the same formula the mass of waste to the exhauster from Periods 4 and 5 was 241 and 240 g respectively and the increase in waste on the filters for Period 6 was 048 g
Aerosol Calculations
The mass sent to the exhauster per RMCS core or per RMCS segment was obtained by dividing the mass of waste leaving the risers by the number of RMCS cores or RMCS segments obtained during the exhauster operating period
The tank head space particulate concentration was obtained by dividing the mass of waste leaving the riser by the volume of gas sent to the exhauster This volume of gas sent to the exhauster was obtained by multiplying the exhauster flow rate by the exhauster run time from Table F-I The calculations for aerosols generated based upon HEPA dose rates use acfm while the exhauster flow is recorded in scfm so the actin flow rates in Table F- 1 were used
The average mass of aerosols in the tank head space was obtained by multiplying the average tank head space particulate concentration by the tank head space volume from Table F-2
Following is an example of how the mass per RMCS core mass per RMCS segment average tank head space mass concentration and average mass of aerosols in the tank head space were calculated for Period 1 Data used are from Tables E-I F-I and F-2
[200 scfm] [2992+2916] [84 + 4591 + 528 = 21 1 acfm to exhauster from BY-IO6 in 11-1294
using same formula results in 210 acfm for BY-IO6 in 195 and 209 acfm for BY-I IO
28 g waste + [((21 1 acfm)(4878 hr)+(21O)(l867)+(209)(1125))(60 minhr)]= 12E-6 g wastelf to risers
[12E-6 amp] [35315 fmrsquo] =43E-5 g wastemrsquoto risers
[12E-6 gftrsquo] [53700 Arsquo in BY-106 head space] =66E-I g waste in BY-IO6 head space during RMCS
[12E-6 piftrsquo] [92000 ftrsquo in BY-110 headspace] = IIE-l g waste in BY-I10 head spaceduring RMCS
[28 g waste] [5 RMCS cores] = 56E-1 g waste per core to riser
[28 g waste] + [24 RMCS segments] = 12E-1 g waste per segment to risei
8-3
RPP-4826 Rev 1
All data were input to a spreadsheet and the mass to exhauster per RMCS core mass to exhauster per RMCS segment average tank head space mass concentration and average mass of aerosols in the tank head space were calculated for each of the RMCS exhauster operating periods in the same manner as shown above Results are given in Table 8-3
Summary of Calculations
RMCS exhauster operations were segregated into five operating periods during which RMCS was performed The Exhauster B data for BY-IO8 and TX-I 13 riser 3 was not used in these calculations as no RMCS was performed when the exhauster was operating Exhausters were operated in seven tanks during which 16 RMCS cores and 92 RMCS segments were obtained Based on RMCS filter housing dose rate data the results indicate that
These values are conservative as the assumed dose rate at the end of RMCS for Periods I 2 and 5 was assumed to be 05 mRhr In addition using a DF of 5 for the BY-IO6 prefilter skews the results high The in-tank prefilters used in both BY-IO6 sampling events showed no detectable contamination
Operatin Periods 4 and 6 were the only periods with exhauster housing dose rates above detectable The 044 mCi Csrsquordquo and 0063 mCi CsIh increase on the filters for these two periods based upon dose rate data correspond to the 050 mCi CsI3rsquo and 014 mCi Csrdquorsquo increase on the filters for these two periods based u on NDA data (see Appendix A) The 031 mCi C S rdquo ~ for Period 5 is significantly above the 0032 mCi Cslrsquolsquofor the same period determined by the NDA but this is due to assuming the housing dose rate was equal to the minimum detectable 05 mRhr
The average tank head space mass concentration during RMCS was 22E-5 g wastem3 The average mass of suspended solids in the tank head space during RMCS was 47E-2 g waste The average mass sent to the exhauster during RMCS was 59E-1 g wastelRMCS core The average mass sent to the exhauster during RMCS was 1OE-1 g wastelRMCS segment
B-4
v m
__ ~~
RPP-4826 Rev 1
APPENDIX C
ESTIMATION OF AEROSOLS GENERATED DURING RMCS BASED UPON CGM IN-LINE FILTER PAPER ANALYSES
c-0
RPP-4826 Rev I
APPENDIX C - Estimation Of Aerosols Generated During RMCS Based Upon CGM In- Line Filter Paper Analyses
Summary of Method
This method of estimating RMCS aerosol quantities uses radionuclide assay data from in-line filter papers located upstream of continuous gas monitors (CGM) sampling the tank air for flammable gases during RMCS The radionuclide content of the filter paper is divided by the waste radionuclide specific activity and the air flow through the CGM to obtain an estimate of the average mass concentration in the tank head space during the time period the CGM is on Multiplying the estimated average tank head space mass concentration by the tank head space volume gives an estimate of the average mass of particulates in the tank head space during RMCS To obtain the mass per RMCS core or per RMCS segment sent to the exhauster the tank head space average mass concentration is multiplied by the volume of gas sent to the exhauster then multiplied by a correction factor to account for particulates in the head space removed by the exhauster when the CGM is not operating and divided by the number of RMCS cores or RMCS segments
Description
During most tank waste intrusive activities performed since 1996 an intrinsically safe CGM located above ground has been used to continually monitor the tank air for flammable gases during in-tank activities The CGM sampling method draws air directly from the tank head space During RMCS the CGM sampling line is placed in the tank dome space The sampling line is located between the sampling riser and the exhaust riser if practical A pump in the CGM draws tank air up through the line at 05 litmin for measurement of the lower flammability limit (LFL) by the CGM A filter paper is installed in the sampling line upstream of the CGM to protect the unit from internal contamination
Following CGM use the CGM filter papers are normally discarded after monitoring them in the field for contamination To help estimate the tank head space particulate levels during RMCS these filter papers were retained and analyzed in the 222-S laboratory following removal from all tanks in which RMCS was performed from the fall of 1997 through April 1999 Data were collected for the four tanks in SX farm in which RMCS was performed and the next four tanks on which the RMCS exhauster was deployed These tanks are listed in Table c-I Reported CGM Data
The CGM operational data used to estimate aerosol levels during RMCS includes CGM operating times CGM flow rates and filter paper analytical data A summary report containing all the field operating data sheets for CGM usage and lab data was prepared following completion of sampling on each tank for all tanks except TX- 113 For TX-I 13 a separate report was prepared following each core These reports are References CGM-I to CGM-9 The CGM data from these reports are provided in Table C-2
There were 14 CGM installations during RMCS when CGM filter papers were collected and analyzed Each of these installations had Csrdquorsquo total alpha and total beta quantities measured on the filter papers resulting in 42 data points Eight of the measurement results were very low and had errors of gt+-loo These values were not used resulting in a net of 34 data points for calculating average head space mass concentrations based upon CGM data
Calculated Tank Head Space Radionuclide Concentrations
To calculate the average tank head space radionuclide concentrations during RMCS the filter paper radionuclide quantities were first divided by an efficiency factor to account for radionuclides which may not have been captured on the paper This adjusted radionuclide value was divided by the volume of tank air passing through the paper to give the average tank head space radionuclide concentration
The efficiency used for most stack samplers onsite is 73 (see Appendix D) Estimates attached to References CGM-I to CGM-9 indicate the CGM filter paper sampling method used should have a sampling efficiency
c- 1
RPP-4826 Rev 1
exceeding 73 For conservatism a sampling efficiency of 50 was assumed in this document for the CGM filter paper method
The estimated Csrdquorsquo total alpha and total beta concentrations in the tank vapor space were calculated by dividing the radionuclide quantity on the filter paper from Table C-2 by the assumed CGM sampling efficiency of 05 and the volume of gas going to the CGM The volume of gas going to the CGM was calculated by multiplying the time of CGM operation from Table C-2 by the CGM flow rate of 500 mlmin For example the calculated SX- 101 head space C~rsquorsquo~concentration based upon analysis of the CGM filter papers used during RMCS of riser 19 is
[[26E-4 pCi + 051 + [[I755 min][500 mlmin]] = 59E-I0pCiml
All radionuclide concentrations were calculated in a similar fashion Results are given in Table C-3 Table C-3 lists the radionuclide concentrations for all 42 data points The eight radionuclide concentrations not used for estimating mass concentrations are noted
Table C-3 also contains the calculated number of tank head space changeouts by the tank exhauster during CGM operation Tank head space changeouts were calculated by multiplying the exhauster flow rates (in actin) from Table F-1 by the CGM run times from Table C-2 and dividing by the tank head space volumes from Table F-2 The number of tank head space changeouts during CGM operation was used when estimating the waste mass sent to the exhauster See Aerosol Calculations section below for explanation
Aerosol Calculations
Average tank head space mass concentrations based upon CGM filter paper data were calculated by dividing the head space radionuclide concentrations from Table C-3 by the waste specific activities for each tank sampled The waste specific activities used came from Table E-I and are listed again in Table C-I The average of the mass concentrations based upon radionuclide data for each tank was used as the average head space mass concentration for that tank For example the calculated SX-IO1 head space mass concentration analysis from the CGM filter papers used during RMCS of riser 19 is
[59E-10 pCi Csrdquorsquoml+ 112 pCi C S rdquo ~ ~ waste] [ 28317 mlftrsquo] = 1 SE-7 g wasteA3 based upon C S rdquo ~
[ I 7E-I I pCi T A M + 504E-1 pCi TAg waste] [ 283 17 mlftrsquo] = 94E-7 g wasteamprsquo based upon Total Alpha
[43E-9 pCi TBml+ 357 pCi TBg waste] [ 28317 mlArsquo] = 34E-7 g wastel based upon Total Beta
[ [ I 5E-7 + 94E-7 + 34E-7 g wasteArsquo] f 31 = 48E-7 g wasteamp
[48E-7 g wastelt ] [3531467 Arsquom3] = 17E-5 g wastemrsquo
All tank head space mass concentrations were calculated in the same manner The results are presented in Table C-4 The weighted average tank head space mass concentration during RMCS was based upon the number of RMCS segments taken for each data point
The average aerosol mass in the head space during RMCS was calculated by multiplying the average tank head space mass concentration by the tank head space volume from Table F-2 For the same data point as above
[48E-7 g waste Arsquo] [115E+5 Arsquo] = 55E-2 g waste in SX-IO1 head space during RMCS
All average mass quantities present in the tank head space during RMCS were calculated in the same manner using a spreadsheet The results are provided in Table C-4 The weighted average mass of waste in a tank head space in Table C-4 was calculated based upon the number of segments obtained for each data point
Estimation of the mass of waste sent to the exhauster per RMCS core or segment requires calculation of the total mass of waste sent to the exhauster Multiplying the average head space concentration during RMCS by the exhauster flow rate (in acfm) and the time of CGM operation will give the mass of waste sent to the exhauster during the CGM time frame only While the large majority of mass of waste aerosols will have exited the tank or
c -2
RPP-4826 Rev I
resettled by the time the CGM is shut off there could be some residual suspended particles remaining These would eventually pass to the exhauster but would not be picked up by the CGM filter since it was not in service An adjustment factor was used as described in the following paragraphs to account for particles that may exit to the exhauster following shut down of the CGM
Particulates are generated by RMCS when purge gas is blowing out the drill string and the bit is rotating under the waste surface This time averages about six minutes per segment Multiplying the number of RMCS segments per core by six minutes per segment and dividing by the number of minutes of CGM operation shows the creation of particulates will only occur during a nominal 3-4 of the time the CGM is operating During RMCS the normal practice is to install the CGM turn it on when personnel enter a tank farm and keep the unit in constant operation for the remainder of the shift When the portable RMCS exhauster is used the exhauster is normally started at least an hour before RMCS is initiated and kept in operation until it is time to halt operations for the week The SX exhauster is kept in constant operation Comparing exhauster operating times from Tables F-l with CGM operating times from Table C-I it can be seen the CGMs are in operation about 3-15 of the time the RMCS exhauster is operating on a tank This time comparison wasnrsquot estimated for the SX exhauster since the SX exhauster is in constant operation
With CGM operation much longer than the time period when particulates could be generated the majority of particulates generated by RMCS should have settled or been exhausted during the CGM operating period Table C-3 shows the tank head space changeouts made by the exhauster during CGM operating periods ranged from 084 to 63 The average was 24 With the CGMs operating 25-33 times longer than the aerosol generation periods and an average of over two tank head space changeouts during CGM operation the large majority of aerosols generated during RMCS will have settled out or been removed by the exhauster by the time the CGM is shut off To account for particulates remaining in the tank head space after the CGM was turned off that are subsequently removed by an exhauster it was conservatively assumed that 20 of the total mass of particles generated during RMCS were not removed from the tank head space during the CGM operating period Therefore the product of the tank head space concentration and the volume of air sent to the exhauster during the time of CGM operation was multiplied by a factor of 125 (lOOl80) to estimate the total mass of waste sent to the exhauster as a result of RMCS This is shown below for the same SX-IO1 riser 19 data point in the above calculations
[48E-7gA3] [IOOmin] [I755 min] [125]= 11E-l gwastetoexhauster
This value was divided by the number of RMCS cores and RMCS segments from Table C-1 to provide the grams per core and grams per segment in Table C-4 as follows
[ I I E- 1 g waste to exhauster] i 1 core = 11 E-I g wastelRMCS core to exhauster
and
[ 1 I E- 1 g waste to exhauster] + 5 segments = 2 I E-2 g wastelRMCS segment to exhauster
All mass per core and mass per segment values were calculated in the same manner using a spreadsheet The results are provided in Table C-4 The weighted average mass per core and mass per segment in Table C-4 were calculated based upon the number of cores or segments obtained for each data point
Summary of Calculations
There were 34 valid CGM filter paper data points from 14 RMCS CGM sampling periods in eight tanks during which I5 RMCS cores and 79 RMCS segments were obtained Based upon CGM filter paper data the results indicate that
The average tank head space mass concentration during RMCS was 4OE-5 g wastem3 The average mass of suspended solids in the tank head space during RMCS was 97E-2 g waste The average mass sent to the exhauster during RMCS was 18E-1 g wastelRMCS core The average mass sent to the exhauster during RMCS was 34E-2 g wastelRMCS segment
c - 3
RPP-4826 Rev 1
Ignoring all CGM filter paper analytical data points with a variance gtloo will result in conservative results These data points indicate negligible radioactivity was present If a value of zero was assigned to each data point with an analytical error of gtloo instead of ignoring the data point the weighted average particulate quantities in Table C-4 would be reduced by about 12
The average tank head space mass concentrations based upon CGM data will be higher than the average tank head space mass concentrations based upon filter housing NDA or dose rate The RMCS exhauster received tank air from the shifts when sampling was performed and during some of the off-shifts when no sampling was done The CGMs were only operated during the shifts when sampling was performed The air concentration drawn into the CGM and the RMCS exhauster should be roughly the came during the operating shifts but somewhat less during the off-shifts Therefore the tank head space concentration will be higher when based upon CGM data This does not impact the mass of waste sent to the exhauster per core or per segment
c -4
I
- ~
RFP-4826 Rev 1
APPENDIX D
ESTIMATION OF Rh4CS EXHAUSTER HOUSING DECONTAMINATION FACTOR
D-0
RFrsquoP-4826 Rev 1
APPENDIX D - Estimation of RMCS Exhauster Housing Decontamination Factor
Summary of Method
This Appendix estimates a Decontamination Factor (DF) for the RMCS exhausters using housing NDA data and applicable stack record sample data The Csrdquorsquo in the exhauster effluent is divided by the C S rdquo ~ in the exhauster inlet to provide a penetration efficiency The reciprocal ofthe penetration efficiency is the DF
Description
Each RMCS exhauster has an isokinetic sampler located on the stack downstream of the blower and HEPA filters A small pomp pulls air from the exhaust stack into a filter paper at a rate proportional to the exhaust flow Radionuclides in the exhaust stream passing through the sample line are caught on the filter paper The stack operating time and flow rate are recorded When the record sample filter paper is removed the filter paper is analyzed in a laboratory for radionuclides The radionuclide concentration in the stack effluent stream is calculated by dividing the quantity of material on the filter paper by the volume of air through the sampler and then dividing again by a factor to compensate for stack sampler and filter paper efficiency
Multiplying the total beta stack effluent concentration by the total off gas flow gives the total beta emissions from the exhauster The total beta emissions are multiplied by the Csrdquorsquo to total beta ratio for the waste in the tank) being exhausted to give an estimate of the C S rdquo ~ emission The C S rdquo ~ on the filters determined by NDA of the housing (see Appendix A) is added to the C S rdquo ~ emissions to give the total C S rdquo ~ input to the filter housing Dividing the emissions by the input gives the filter housing penetration efficiency Subtracting the penetration efficiency from 1 O gives the filter housing efficiency Dividing 1 O by the penetration efficiency gives the DF
RMCS Stack Record Sample Data
RMCS exhauster stack record samples are taken after completion of each sampling event on a tank Normally this is after all cores on that tank have been obtained but for BY-IO5 in 1998 record samples were taken following each core Record samples are also taken at the end of each year All samples are analyzed for total alpha and total beta At the end of each year all the filter papers for that year are composited and analyzed for individual radionuclides Sample results are entered into the Automated Bar Coding of Air Samples at Hanford (ABCASH) and Environmental Release Summary (ERS) databases Several ofthe filter papers from 1998 were reanalyzed using a longer count time to bring the error rate down
Schofield 2000b compiled and evaluated all available RMCS exhauster stack record sample data filtered out the unusable data provided derivation for the stack sampling efficiency factor and summarized the results Most of the data points were so low as to be unusable since the results were either negative or had error variances gtloo
Column 5 of Table D-1 provides the stack effluent concentrations used for calculation of the filter housing DF The stack effluent data in Table D-l come from Schofield 2000b These values include a 073 sampling efficiency factor
Calculation of RMCS Filter Housing Decontamination Factor Based upon Housing Inlet and Outlet Data
The RMCS exhauster housing NDA and stack record sample data available for exhauster Operating Periods 4 5 and 6 were used to estimate an actual DF for the RMCS exhauster housings The housing NDA data is for CSrdquo~ but there are no usable Csrdquorsquo concentrations for the RMCS exhauster outlet The RMCS exhauster stack Csrsquordquo concentrations are either negative have a variance gtloo or are not available Total beta analyses are available however so the stack eftluent C S rdquo ~ concentrations were estimated by multiplying the total beta concentration by the ratio of Csrdquorsquo to total beta in the tank waste
Column 2 of Table D-l lists the increase in CSrsquo~ on the filters for each operating period as determined by NDA This data was obtained from Table A-2
D- 1
RPP-4826 Rev 1
Column 4 of Table D-l lists the stack exhaust volume for each stack record sample period The stack exhaust volume for the exhauster installation on S-l IO was calculated by
[ZOO std ft3min][15978 hrs] [60 minhr] = 199E+6 std ftrsquo
All other stack volumes in Table D-l were calculated the same way Unlike in Appendices A B and C no adjustment was made to change the 200 scfm to actual cfm This is because the RMCS stack record sample concentrations from Table D-3 are based upon a 200 scfm flow rate rather than the actual flow rate Since the concentrations are on the same basis as the flow rate there is no need to correct to acfm
The total beta emissions for the RMCS exhauster stack were calculated by multiplying the volume by the concentration For the same S-l IO data point
[199E+6 ft3] [18E-15 pCiml] [28317mlft3] [mCi1000 pCi] = 1OE-7 mCi total beta
All other total beta emissions in Table D-l were calculated the same way
The Csrdquorsquo to total beta ratio was calculated from data in Table E-I For the same S- l I O data point
326E+5 Ci CsI3rsquo f I 14E+6 Ci total beta = 029 Ci CslhCi total beta = 029 rnCi CsrdquorsquomCi total beta
The Csrsquordquo emission for the same S-l IO data point was thus
[I OE-7 mCi total beta] [029 mCi CsrdquorsquomCi total beta] = 29E-8 mCi Csrdquorsquo
All Csrsquordquo emissions in Table D-l were calculated in the same manner
The penetration efficiency for each operating period was calculated by dividing the exhauster outlet by the filter inlet Csrdquorsquo quantities For operating period 4 this was
[81E-6 mCi] f [5OE-I + 8IE-6 mCi] = 16E-5 = 16E-3
The DF for operating period 4 is
1 + 16E-5 = 62E+4
The overall DF for periods 4 5 and 6 was calculated by dividing the efluent from all three periods by the total filter input
[95E-6 mCi] f [67E-I t 95E-6 mCi] = 14E-5 = 14E-3 penetration efficiency
I - I 4E-5 = 0999986 = 999986 filter efficiency
1 f 14E-5 = 73E+4 decontamination factor based upon housing inlet and eftluent data
Estimation of Housing Decontamination Factor Based upon General Performance Data
HEPA filters are tested at the manufacturer to a minimum 9997 efficiency using a 03 pm monodisperse aerosol After installation HEPA filters are tested in-place per ASME N5 I O to a minimum 9995 efficiency using a polydisperse aerosol with an approximate droplet size distribution of 99 less than 30 pm 50 less than 07 pm and 10 less than 04 pm The RMCS exhauster housing is tested per ASME N510 and is thus required to have a minimum removal eficiency of 9995 for an aerosol with this approximate size distribution The particle size distribution of the waste aerosols generated by RMCS is unknown but it is assumed that the removal efficiency for RMCS generated aerosols was the same as the removal efficiency for the ASME generated test aerosol
D-2
RPP-4826 Rev I
A 9995 efficiency is equivalent to a DF of 2E+3 while a 9997 efficiency is equivalent to a DF of 33E+3 The actual DF for the RMCS exhauster housing is higher than either of these It has two HEPA filters in series even though the minimum efficiency specified in the NOCs for the RMCS exhausters is only equivalent to one HEPA ERDA 1976 recommends using a DF of 3000rdquo for a filter bank where n is the number of HEPA filters in series This would result in a DF of 9E+6 for the RMCS exhauster housing This is unrealistic Using a DF of 9E+6 will calculate to Csrdquorsquo quantities on the HEPA filtersthat are orders of magnitude above what have been shown to be there based upon the measured dose rates and NDA A DF of 9E+6 would mean the dose rate would have to be almost 100 mRhr at the side of the exhauster housing instead of the 05-08 mRhr dose rates encountered The waste particles will not have the same particle size distribution entering the second HEPA filter as when entering the first The majority of the waste particles will be captured on the I rdquo HEPA filter and although the DF for each HEPA if tested individually using the ASME N5 IO aerosol test method may be 3E+3 (or higher) the overall DF of the two filters in series will not be 3000lsquo This is because the particle size distribution entering the Znd HEPA could have a greater percentage of smaller particles than that entering the 1rdquo
NUREG 1995 included an evaluation of a number of different facility stacks at the Hanford site where the HEPA filter upstream air concentrations were estimated using several different methods This report concluded that back-calculation using a value of 3000rdquo overestimated the upstream radionuclide concentration by three to four orders of magnitude when compared to filter NDA data for the nine stacks for which NDA data were obtained and by three orders of magnitude for the two stacks for which upstream air sample data were available Back- calculation using a value of 3000rdquo was shown to be high by four orders of magnitude for the single stack for which a powder release estimate was available Based upon this information the RMCS exhauster dual filter-in-series housings would have a DF of at least three and maybe four orders of magnitude less than 9E+6 or in the 1E+3 to 1 E+4 range A DF of IE+3 would he less than the minimum permissible under the NOC Comparing the older stack data and design with the newer RMCS exhauster design the minimum DF would be expected to be at least 1E+4
Table D-2 provides the available RMCS exhauster aerosol test data This information was obtained from Waldo 1999 Prior to 1998 the RMCS exhauster primary HEPA filter efficiency and either the secondaly HEPA filter or the overall efficiency for both filters were tested Starting in 1998 only the primary and secondary HEPA filter efficiency were measured The overall efficiency of the two filters in series was only measured three times in 11 setups Twice the overall penetration efficiency was lt0002 and the remaining time the only information that could be found was a value of lt005 Most individual filters had a penetration efficiency of 0002 This appears to be about the limit of the detection equipment Based upon Table D-2 data a penetration efficiency of 0002 (99998 efficiency) is normal for a single HEPA and thus a minimum for an RMCS exhauster housing Assuming a 0002 penetration efficiency for the two filters combined calculates to a DF of 5E+4 (equal to 1 +
000002) for the RMCS exhauster housing
In summary the measured DF for the RMCS exhauster housings over the period from May 1998 through June 1999 was about 73E+4 RMCS aerosol testing prior to use indicates a DF of about 5OE+4 for each of the filters separately but their overall efficiency is not measured Referenced data based on older stacks at Hanford indicate the two HEPA RMCS exhauster housing would likely have a DF of at least IE+4
Estimated Aerosol Levels During RMCS Based Upon RMCS Stack Record Sample Data
Revision 0 of this document used the positive record sample results with variance less than 100 to estimate aerosol concentrations in the exhauster inlet using an assumed exhauster housing DF of 5OE+4 This method of estimating aerosols was eliminated from Revision 1 because the stack concentrations were either too low too scattered or too questionable to provide reliable results There were 112 RMCS stack record sample data points evaluated in Schofield 2000b Excluding the total beta sample results used for estimation of the housing DF there were only ten data points remaining with positive values and variances ltloo the remaining data points were either negative had a variance gtloo or the results were not available
For comparison purposes only Schofield 2000b applied the DF of 73E+4 calculated in this document to the data points not used to calculate the exhauster housing DF to estimate aerosol concentrations upstream of the filters The results showed aerosol levels approximately the same as those estimated using NDA dose rate or CGM filter paper data when a value of zero was used for negative sample results or those with a variance gtloo When only
D-3
RPP-4826 Rev 1
the ten positive results with a variance ltloo were used the aerosol levels calculated to be two to five times higher than those estimated using NDA dose rate or CGM filter paper data Because of the variability of data resulting from the extremely low record sample concentrations and the few useable data points estimation of aerosol levels using record sample data was not included in Revision I See Schofield 2000b for further discussion of the use of record sample data to estimate aerosol levels
Summary of Calculations
A total of nine RMCS exhauster stack record sample data points were used to estimate the RMCS exhauster filter housing decontamination factor These data points were obtained when sampling on five tanks during which 10 RMCS cores and 65 RMCS segments were obtained The overall decontamination factor was 73E+4
Estimation of aerosol generation quantities based upon RMCS stack record sample data is possible However results will likely be skewed high if data points that show non-detectable levels of radionuclides present are ignored instead of using a value of zero for the data point
D-4
RPP-4826 Rev 1
APPENDIX E
TANK WASTE RADIONUCLIDE CONCENTRATIONS USED FOR AEROSOL CALCULATIONS
E-0
RPP-4826 Rev 1
APPENDIX E - Tank Waste Radionuclide Concentrations Used for Aerosol Calculations
The RMCS exhauster NDA data HEPA filter dose rate data CGM filter paper data and stack record sample data provide information on the quantity of radionuclides on the exhauster filters in the tank head space or the exhauster stack during RMCS These radioactivity quantities need to be divided by the waste radionuclide concentration specific activity to determine the mass of waste in the tank head space and in the tank gases sent to the exhauster
The mass quantities in this document were calculated using dry basis radionuclide concentrations Waste particles carried into the tank head space by the purge gas could be wet or dry If wet some of the non-chemically bound water will start to evaporate immediately providing the tank relative humidity is 400 The water present in a waste particle may be chemically bound as a hydrate or free The chemically bound water will not readily evaporate therefore even a ldquodryrdquo particle may have some water associated with it It is impractical to measure the actual water content of the waste particulates caught on the CGM filter paper the exhauster HEPA filters or the stack record sample paper Since the quantity of water in the waste particulates is unknown particulate levels were calculated using dry basis radionuclide concentrations Thus all particulate values given in this document are stated on a dry basis
The waste radionuclide concentrations on a dry basis were calculated from data available in the Tank Waste Information Network System (TWINS) The Best Basis InventorylBest Basis Summary numbers were used These values are the most complete and up to date readily available estimates for Hanford waste tank contents but do not include water The information was downloaded from TWINS into a spreadsheet The total chemical total beta and total alpha quantities were summed in the spreadsheet for all the tanks which were sampled and concentrations for Csrdquorsquo Sr9rsquo total beta and total alpha automatically calculated in pCig These concentrations are provided in Table E-I Because lab techniques for measuring gross beta levels only detect beta particles with a minimum decay energy above 150-200 kev only radionuclides with a decay energy of gt-200 kev were included in the total beta numbers
The TWINS radionuclide concentrations were obtained in December 1999 No corrections were made for decay for this document
The CGM filter paper and stack record sample data indicate the measured radionuclide values are not always in the same ratio to each other as given by TWINS nor are all radionuclides detected that TWINS indicates are present Radionuclides can be distributed unevenly in a tank Soluble fission products (primarily Csrsquordquo) are found in the liquid saltcake and in sludges Insoluble fission products and actinides are found largely in sludges as these are primarily chemical precipitates Sludge could be mixed with saltcake be present in a distinct layer at the bottom of a tank or in several layers in the tank depending upon how waste was transferred into a tank Waste particles may thus not have the same specific activity on a microscopic scale as they would have on a macro scale were the tank contents homogenized During RMCS a top to bottom core sample is attempted resulting in the drill bit and purge gas (which causes aerosols to form) passing through most ofthe waste matrix Assuming the aerosol generation rate is approximately constant during drilling the specific activity of a radionuclide in the suspended solids should be roughly the same as the average specific activity of the same radionuclide in the tank waste While the waste specific activity is probably not homogeneous from top to bottom in a tank and the aerosol generation rate will likely also vary it is beyond the scope of this document to provide an in-depth analysis of all the factors affecting aerosol radionuclide concentration Although sample radionuclide data were not always in the same ratio as provided by TWINS for the purpose of this document the simplifying assumption was made that the average tank specific activity is adequate to provide an approximation of the suspended solids specific activity for all radionuclides Average tank individual radionuclide specific activities were used in the preparation of the exhauster NOCs
The aerosol calculations presented in this document are only as accurate as the TWINS data The combined radionuclide content of all Hanford waste tanks is known fairly well since the overall content is based upon reactor production records CsrdquorsquoSrW recovery data and processing plant discharges Thus TWINS data for all tanks combined should be reasonable There are undoubtedly differences between TWINS data and the actual contents of a specific tank While the specific tank radionuclide data from TWINS used in this document may not be exact deviations from the actual concentrations are assumed to balance out over the number of tanks sampled
E- 1
RPP-4826 Rev 1
APPENDIX F
ROTARY MODE CORE SAMPLING EXHAUSTER AND CORE SAMPLE DATA
F-0
RPP-4826 Rev 1
APPENDIX F - Rotary Mode Core Sampling Exhauster and Core Sample Data
This appendix provides the basic data obtained during RMCS operations which was used in preparation of this document
Basic Operational Data
There have been three RMCS exhausters and three RMCS sampling trucks deployed since starmp of nitrogen- purged RMCS in November 1994 The exhausters are formally designated 296-P-32296-P-33 and 296-P-34 These were originally referred to as parts of RMCS Systems 2 3 and 4 respectively in the Notices of Construction (NOC) for these units The exhauster designations were changed for routine field use in 1996 to exhausters A B and C to avoid confusion with core sampling trucks 23 and 4 since any exhauster could be used with any RMCS truck Exhauster A (2) and RMCS Truck2 have not been used for RMCS since 1995 and are no longer in service for core sampling
Rotary mode core sampling has been conducted in four general time frames since 1994 These time frames were separated by down times for equipment modifications or resolution of environmental permitting and safety concerns For ease of analysis in this document exhauster operations were organized into six distinct operating periods Periods I to 6 were grouped based upon times when the same exhauster and same set of HEPA filters were being used These periods thus overlap with the general operating time frames The four operating time frames were
The first time frame lasted from November 1994 to January 1995 RMCS Truck 2 and Exhauster 2 (A) were used on Tank BY-106 along with an in-tank prefilter This tank provided the initial deployment and testing of the nitrogen-purged equipment in a waste tank During this period radiation dose rates were taken at the side of the exhauster housing Stack record samples were taken in December 1994 and January 1995
The second time frame lasted from July 1995 through October 1995 RMCS Trucks 2 and 4 were used with Exhausters 2 and 3 (A and B) on BY-105 BY-IO8 and BY-I IO During this period radiation dose rates were taken at the sides of the exhauster housings Stack record samples were taken after completion of sampling on each tank No RMCS samples were taken from BY-108 all samples were taken in push mode for this tank
The third time frame began when RMCS was restarted in December 1997 Trucks 3 and 4 were used for sampling of SX-101 SX-103 SX-105 and SX-102 with the SX tank farm exhauster providing ventilation The RMCS exhausters were not used During this period radiation dose rates were taken at the sides of the SX exhauster housing as part of HPT routine surveys SX farm exhauster stack record samples were taken when required by normal operating procedures SX record sampler and filter housing dose rate data were not evaluated for this document It would not be practical using filter dose rate or stack record sample data to estimate the RMCS aerosol addition if any to the SX ventilation system The background radiation around the SX filter housing makes measurement of any small increase in dose rate very difficult to detect The number of tanks being ventilated and the involved off-gas header routings (the exhauster is pulling on thirteen tanks in series or in parallel with the tank being sampled) and any in-tank activities in the SX tanks not being sampled would make it impractical to assess what aerosols resulted from RMCS Beginning with RMCS in SX farm radionuclide analyses were performed on the filter papers protecting the CGMs which draw air out of the tank vapor space for flammable gas detection
The fourth time frame began in May 1998 Between 1095 and 598 Exhausters B and C were extensively modified with new filter housings and other equipment to meet new NOC requirements Trucks 3 and 4 were used with Exhausters B and C (3 and 4) on S-l IO U-107 BY-105 TX-113 and TX-I 18 This period marked the first use ofthe RMCS trucks and RMCS exhausters together following resolution of flammable gas concerns and modifications to the exhausters New filters were installed Radiation dose rates were taken at the sides of the exhauster housings Stack record samples
F- 1
RPP-4826 Rev I
were taken after completion of sampling for each exhauster installation Radionuclide analyses were performed on the CGM filter papers for all tanks except TX-118 An NDA was performed on the Exhauster C housing following completion ofthe first core on TX-I 13 The housing filters when assayed contained aerosols captured by the exhauster following RMCS in S-l IO U-107 BY-105 (1998) and the first core of TX-I 13 Another NDA was performed on Exhauster C following both cores in TX-I 18 An NDA was performed following sampling of the second core in TX-I 13 using Exhauster B The time frame ran through early June 1999 No RMCS samples have been taken after June 1999 nor are any planned for the next few years
For the purposes of evaluating aerosol formation based upon RMCS exhauster housing NDA and dose rate data the exhauster operations were grouped into 6 operating periods These periods are shown in Table F-1 and restated in Tables A-I and B-I All tanks sampled in Periods 1 2 4 5 and 6 were exhausted by the same exhauster with the same housing and filters present during that period Period 3 covered the time the SX exhauster was used during RMCS in SX farm
A brief description of each RMCS tank sampling operation is provided below
Tank 241-BY-1061194 to 1294 RMCS using the nitrogen purge gas system with an exhauster was formally begun on 111794 on tank BY-106 riser IOB Exhauster 2 (A)and Truck 2 were used A sintered metal prefilter was inserted in the riser between the tank and the exhauster A total of eight segments were taken in rotary mode and five segments in push mode until sampling was halted on 122194 One RMCS core was obtained The total exhauster run time was 4878 hours The stack record sample was removed and analyzed following this run period Dose rates taken at the side of the exhauster housing during RMCS were all lt05 mRhr The in-tank prefilter was smeared for contamination when removed from the tank with the smears showing less than detectable levels of radionuclides present (Waldo 1999) The prefilter had been washed with an installed spray system prior to removal from the tank but subsequent testing showed the water flow and pressure were too low to have been effective at removing contamination
Tank 241-BY-106195 Following some process modifications RMCS in BY-IO6 riser IOB began again on 11895 Exhauster 2 (A) and Truck 2 were used The sintered metal prefilter was inserted in the riser between the tank and the exhauster RMCS was halted on 12495 over authorization basis and equipment operability issues for RMCS A total of three segments were taken in rotary mode and eleven segments in push mode One RMCS core was obtained The total exhauster run time was 1867 hours The stack record sample was removed and analyzed following this run period Dose rates taken at the side of the exhauster housing during RMCS were all lt O S mRhr The in-tank prefilter was smeared for contamination when removed from the tank with the smears showing less than detectable levels of radionuclides present (Waldo 1999) The prefilter was not washed this time
Tank 241-BY-110795 to 1095 Following resolution of RMCS authorization basis and equipment issues and completion of the fabrication and testing of Trucks 3 and 4 RMCS was begun in BY-I IO on 71195 Exhauster 2 (A) and Truck 2 were used Samples were taken from risers 128 7 128 again and 4 There was no in- tank prefilter used in this or any subsequent RMCS periods Sampling was performed until 102595 when RMCS was halted over flammable gas issues A total of 13 RMCS segments and 56 PMCS segments were taken Three RMCS cores were obtained The total exhauster run time was 1125 hours The stack record sample was removed and analyzed following this run period Dose rates taken at the side of the exhauster housing during RMCS were all lt O S mRhr
Tank 241-BY-108795 to 895 Core sampling was begun in BY-IO8 on 72595 Exhauster 3 (B) and Truck 4 were used Sampling was done in risers 12A and 7 The tank material proved soft enough so that no RMCS segments were required all segments were obtained in push mode although the exhauster was operated during part of the time sampling was performed Sampling was completed 81895 A total of 16 PMCS segments were taken The total exhauster run time was 6617 hours The stack record sample was removed and
F-2
RPP-4826 Rev 1
analyzed following this run period Dose rates taken at the side of the exhauster housing during RMCS were all lt05 mRhr
Tank 241-BY-105895 to 1095 RMCS was begun in BY-I05 riser 12A on 83095 Exhauster 3 (B) and Truck 4 were used This tank has a concrete layer on top about 12-18 inches thick which had to be drilled through Part way through sampling questions arose as to the flammable gas status of the tank and RMCS was halted on 10695 A total of 3 RMCS and 7 PMCS segments were taken One RMCS core was obtained The total exhauster run time was 4413 hours The stack record sample was removed and analyzed following this run period Dose rates taken at the side of the exhauster housing during RMCS were all lt05 mRhr
Tank 241-SX-1011297 to 298 Following resolution of extensive regulatory and authorization basis issues and installation of equipment modifications RMCS started in SX-101 with Truck 4 on 12497 An RMCS exhauster was not used since all SX farm tanks excluding SX-113 and SX-I 15 are ventilated with the SX exhauster Sampling was performed in risers 19 and 4 and was completed on 21098 A total of 9 RMCS and 6 PMCS segments were taken Two RMCS cores were obtained SX exhauster stack record samples and filter housing dose rates were obtained as part of routine operations for the SX exhauster not as part of the RMCS process Filter papers used in the suction line for the CGM were saved and analyzed in the laboratory to estimate the airborne radionuclide concentration in the tank head space Two CGM filter papers were needed for each core as moisture in the tank vapors condensed on the papers in the cold weather and began to restrict tank gas flow to the CGM
Tank 241-SX-103498 to 598 RMCS started in SX-103 with Truck 4 on 42798 The SX exhauster was used for ventilation (see SX- 101 above) Sampling was performed in risers 7 and 1 1 and was completed on 51198 A total of 6 RMCS and 18 PMCS segments were taken Two RMCS cores were obtained During sampling filter papers used in the suction line for the CGM were saved and analyzed in the laboratory to estimate the airborne radionuclide concentration in the tank head space One CGM filter paper was used during each core SX exhauster stack record samples and filter housing dose rates were obtained as part of routine operations for the SX exhauster not as part of the RMCS process
Tank 241-SX-105298 to 598 RMCS started in SX-105 with Truck 3 on 22598 The SX exhauster was used for ventilation (see SX- 101 above) Sampling was performed in risers 6 and 14 and was completed on 51598 A total of 6 RMCS and 20 PMCS segments were taken Two RMCS cores were obtained During sampling filter papers used in the suction line for the CGM were saved and analyzed in the laboratory to estimate the airborne radionuclide concentration in the tank head space Two filter papers were needed for the first core as moisture in the tank vapors condensed on the papers in the cold weather and began to restrict tank gas flow to the CGM One filter paper was used for the second core SX exhauster stack record samples and filter housing dose rates were obtained as part of routine operations for the SX exhauster not as part of the RMCS process
Tank 241-SX-102698 to 798 RMCS started in SX-102 with Truck 4 on 61798 The SX exhauster was used for ventilation (see SX- 101 above) Sampling was performed in risers 8 and 4 and was completed on 7798 A total of 2 RMCS and I8 PMCS segments were taken Two RMCS cores were obtained During sampling filter papers used in the suction line for the CGM were saved and analyzed in the laboratory to estimate the airborne radionuclide concentration in the tank head space One filter paper was used for each core SX exhauster stack record samples and filter housing dose rates were obtained as part of routine operations for the SX exhauster not as part of the RMCS process
Tank 241-S-110598 to 698 RMCS was begun in S-I10 on 51898 Exhauster C (4) and Truck 3 were used This tank marked the first use of an RMCS exhauster since 1995 Sampling was completed on 6498 Risers 6 and 14 were sampled A total of IO RMCS and 8 PMCS segments were taken Two RMCS cores were obtained The
F-3
RPP-4826 Rev I
total exhauster run time was 15978 hours The stack record sample was removed and analyzed following this run period Dose rates taken at the side of the exhauster housing during RMCS were all lt05 mRhr During sampling filter papers used in the suction line for the CGM were saved and analyzed in the laboratory to estimate the airborne radionuclide concentration in the tank head space One filter paper was used for each core Waste particles retained on the exhauster housing filters were part of the inventory subsequently measured by NDA following completion of the first core in TX-I 13
Tank 241-U-107698 to 798 RMCS was begun in U-107 on 61098 Exhauster C and Trucks 3 and 4 were used Sampling was completed on 71598 Risers 7 and 2 were sampled A total of IO RMCS and 19 PMCS segments were taken Two RMCS cores were obtained The total exhauster run time was 27385 hours The stack record sample was removed and analyzed following this run period Dose rates taken at the side of the exhauster housing during RMCS were all 105 mRihr During sampling filter papers used in the suction line for the CGM were saved and analyzed in the laboratory to estimate the airborne radionuclide concentration in the tank head space One filter paper was used for each core Waste particles retained on the exhauster housing filters were part of the inventory subsequently measured by NDA following completion of the first core in TX-I 13
Tank 24l-BY-105798 to 898 RMCS was begun in BY-105 again on 72298 Exhauster C and Trucks 3 and 4 were used Sampling was completed on 82598 Risers 7 and 1 1 B were sampled A total of 18 RMCS and 18 PMCS segments were taken The material was hard enough to require rotary mode sampling all the way to the bottom of the waste but negligible recovery was obtained After RMCS was performed to the waste bottom a PMCS core was taken in the same hole to recover material Two RMCS cores were obtained The exhauster run time was 13577 hours for the first RMCS core and 30792 hours for the second RMCS core Stack record sample information in ABCASH shows 30558 hours operation for the second core but the sampler data sheet shows the time counter was mistakenly reset 234 hours into the run No correction was made to the BY-IO5 2nd core record sample concentration for this document since the error is conservative and results in only slightly higher (ltI) record sample radionuclide concentrations for this core A stack record sample was removed and analyzed following each core giving two record samples for BY-IO5 in 1998 Dose rates taken at the side of the exhauster housing during RMCS were almost all lt05 m R h but a few readings indicated 07 mRihr This variation was assumed due to personnel reading the instrument differently or the fact that the exhauster had been used on enough tanks that by now there was sufficient activity on the filters to cause readings approximately at the background detection level The final reading when both cores were completed was lt05 m R h During sampling filter papers used in the suction line for the CGM were saved and analyzed in the laboratory to estimate the airborne radionuclide concentration in the tank head space One filter paper was used for each core Waste particles retained on the exhauster housing filters were part of the inventory subsequently measured by NDA following completion of the first core in TX-113
Tank 241-TX-113998 to 599 Core sampling was begun in TX-I 13 riser 3 on 92298 Exhauster B (3) and Truck 4 were used at the start This was the first use of Exhauster B since it was modified Exhauster B ran for a total of 8738 hours until being disconnected on 102398 During this time two PMCS segments were taken and no RMCS segments Exhauster C was then installed and operated for 5598 hours from 121098 to 122898 No RMCS or PMCS sampling was performed during this time frame RMCS segments werent taken until 299 Exhauster C ran for a 30230 hours between 122898 and 21299 Sampling was completed on the core from riser 3 on 21299 A total of 12 RMCS segments were obtained during the time Exhauster C was operating Exhauster flow rate for both exhausters was a nominal 200 scfm Stack record samples were taken following Exhauster B removal at the end of 1998 for Exhauster C and following completion ofthe first core with Exhauster C Aerosol calculations were based on only the 30230 hours run time for Exhauster C in 1999 since this was the time period during which RMCS segments were obtained Dose rates taken at the side of the exhauster housing during the short PMCS only sampling period with Exhauster B were all ltOS m R h Dose rates with Exhauster C varied between lt O S mRhr and 07 mRhr The final reading on Exhauster C following completion of the first core was 07 mFUhr During sampling filter papers used in the suction line for the CGM were saved and
F-4
RPP-4826 Rev I
analyzed in the laboratory to estimate the airborne radionuclide concentration in the tank head space One filter paper was used for the core Waste particles retained on the exhauster housing filters were part of the inventory subsequently measured by NDA following completion of this core
Sampling in riser 5 was begun on 41299 using Exhauster B and Truck 3 A total of 6 RMCS and 1 PMCS segments were taken for this core before sampling was halted on 42899 The total exhauster run time for this core was 11712 hours Problems with high vacuum in the tank required the exhauster flow rate to be reduced to 190 scfm to keep the system within pressure limits The stack record sample for the second core was removed and analyzed following the run period Dose rates taken at the side of the exhauster housing during the second core were all lt05 m M r During sampling filter papers used in the suction line for the CGM were saved and analyzed in the laboratory to estimate the airborne radionuclide concentration in the tank head space One filter paper was used An NDA was performed on the exhauster housing following this core The only radionuclides present in the housing were those from this core or what was removed from the tank head space during the non-RMCS activities in this tank from 92298 and 102398
Some clarification may be needed to explain use of the exhauster operating times and NDA dose rate and record sample data obtained during core sampling on TX-I 13 Core sampling was set up for sampling riser 3 on TX-113 in September 1998 with Exhauster B Exhauster B operated for a total of 8738 hours between 92298 and 102298 The stack record sample was removed at the end of this period The ERS database incorrectly shows the exhauster operated between 111698 and 111998 The ABCASH database shows the stack record sample was removed on 111998 The stack record sample showed positive emuent concentrations during this time period with variances 400 No RMCS samples were taken during this period so the data and time werenrsquot included when calculating RMCS aerosol numbers Exhauster B was removed and Exhauster C installed in late November-early December Exhauster C was operated for a total of 5559 hours between 121098 and 122398 The stack record sample was removed on 122898 No sampling was performed during this period so the data and time werenrsquot included when calculating RMCS aerosol numbers Exhauster C was operated for a total of 30218 hours between 122898 and 2899 All the RMCS segments from riser 3 were taken in this time period so only the data and time for this period were included when calculating RMCS aerosol numbers Exhauster B was used during sampling of riser 5 Exhauster B operated for a total of 11712 hours between 41299 and 42899
Tank 241-TX-l18599 to 699 RMCS was begun in TX-I 18 on 5699 Exhauster C (4) and Truck 4 were used Sampling was completed on 6298 Risers 9B and 12B were sampled A total of 9 RMCS segments were taken there were no PMCS segments Two RMCS cores were obtained The total exhauster run time was 21247 hours The stack record sample was removed and analyzed following this run period The maximum dose rate taken at the side of the exhauster housing following RMCS was 08 m M r CGM filter papers were not analyzed An NDA was performed on the exhauster housing following completion of the two cores The exhauster housing contained the same nuclides as for the first NDA (S-110 U-107 BY-105 and TX-I 13 first core) plus those from TX-I 18
The basic core sampling operational data used in this document includes the number of RMCS cores and segments the exhauster run times and flow rates the RMCS exhauster HEPA filter dose rates and tank vapor space temperatures Table F-l lists the basic operational data This information excluding tank vapor space temperature data was obtained from procedural data sheets in the sampling work packages (References W - 1 to WP-23)
Tank temperature data for the tanks ventilated with the RMCS exhausters was obtained from the TWINS database Plots for each tank were prepared for the time RMCS was conducted and the average value of the highest thermocouple located in the tank (the lowest temperature reading) was estimated and used as the average tank head space temperature during the RMCS period
The SX exhauster flow rates listed in Table F-l are estimates only The combined flow rate for SX-IO1 through SX-106 plus SX-109 (7 tanks) averaged 440 cfm during CY 1996 (Kaiser 1997) for an average of 63 cfm per
F-5
RPP-4826 Rev I
tank Based upon inlet flow measurements at the tank inlet HEPA filters (Fanis 1998) the flow through each individual tank (SX-IO1 through SX-106 plus SX-109) was lt55 cfm at the breather filter Assuming an exhaust flow of 100 cfm for each SX farm tank sampled is therefore conservative
Calculated Data
Calculated data include the tank head space volumes conversion of the RMCS exhauster flow rate from scfm to acfm and the number of tank head space changeouts made by an exhauster during RMCS
Tank head space volume includes the dome space volume above the top of the sidewall plus the void space between the waste surface and the top of the sidewall The formula used to calculate tank head space volumes WN
Head Space Volume in A = (DS + [(H) (12) + HI + Hb - H] (V)) - 748
Where DS = dome space volume gal H = height of tank body sidewall above knuckle A HI = height of tank knuckle area in Hb = height oftank bottom below knuckle in H = height of waste in tank in V =27555 galin of waste in SX tanks 2754 gallin in all others
The tank dome space volumes height of tank sidewall above the knuckle height of tank knuckle area and height of tank bottom below the knuckle were obtained from Reynolds 1999 The height of waste in each tank at the time of core sampling was obtained from the TWINS database Tank dimensional and waste level data are given in Table F-2 along with the calculated tank head space volumes
Aerosol calculations for Appendices A-C require exhauster flow rates in actual cubic feet per minute The RMCS exhauster flow rate is controlled and recorded in standard cubic feet per minute The mass flow rate of the exhauster air is measured and internal logic in the exhauster controller calculates what the volumetric flow rate would be if the temperature and pressure in the exhauster inlet were at standard conditions The standard conditions used in the logic controller are 29921 in Hg (760 mm Hg) and 69F (ZIT)
A correction factor is built into the exhauster control logic that assumes an atmospheric pressure of 2927 in Hg the average atmospheric pressure at Hanford The RMCS exhauster will operate at about 1-2 in H20 negative pressure resulting in about a 2916 in Hg pressure in a waste tank when the RMCS exhauster is operating To revise the indicated scfm RMCS exhauster reading to an acfm value the RMCS exhauster scfm flaw rate was multiplied by (29922916)(T+459)528 where Tis the tank head space temperature in OF The tank head space temperatures in Table F-1 were input to the spreadsheet file used for aerosol calculations and converted to acfm The flow rates in acfm are included in Table F-I
The tank head space changeouts when using the RMCS exhauster were calculated by multiplying the exhauster acfm flow rate by the time of exhauster operation and dividing the result by the tank head space volume Tank head space changeouts are listed in Table F-2
F-6
c
gt 2
RPP-4826 Rev 1
APPENDIX G
REFERENCES
G-0
RPP-4826 Rev 1
APPENDIX G - References
Diedeker 1999 NDA of RMCS HEPA Filters L P Diedeker WMH E-Mail to JS Schofield CHG November 29 I999
ERDA 1976 Nuclear Air Cleaning Handbook ERDA 76-21 Buchsted C A Fuller A B and Kahn 1 E Oak Ridge National Laboratory 1976
Farris 1998 Internal Note T R Farris LMHC to J S Schofield LMHC Breather Filter Flow Rates for SX-Farm 31698
Foust 1999 Internal Memo RMCST Exhauster HEPA Filter Dose Rate Calculations D J Foust LMHC to J S Schofield LMHC October 25 1999
Greager 1999 Correspondence No WMH-9954450 Non-Destructive Analysis of the Rotay Mode Core Sample High-Efjiciency Particulate Air Filters E M Greager WMH to P C Miller LMHC June 28 1999 [Transmittal of HNF-4199 Resultsfram NDA Measurement of the 296-P-34 RMCS HEPA Filters]
HNF 1999 HNF-SD-WM-SAR-067 Tank Waste Remediation System Final Safety Analysis Report Rev 1 The revision incorporating RMCS accident analyses was submitted as Addendum 5 to DOE as a change to the FSAR predecessor the Basis for Interim Operation (BIO) LMHC-9857075 80232764-9-KOOl Submittal of Authorization Basis Amendment Package for Rotay and Push Mode Core Sampling in Satisfaction of Perfarmance Agreement TWR 122 Expectations I and 3 D 1 Allen LMHC to A M Umek FDH August 30 1998 Addendum 5 as of mid-January 2000 is waiting for approval by DOE
Kaiser 1997 T D Kaiser LMHC E-Mail to J S Schofield LMHC SX Tank Flow Data 42197
NUREG 1995 Potential Radionuclide Emissionsfrom Stacks on the HanfordSite Part I Dose Assessment Davis W E and Barnett J M Westinghouse Hanford Company from Proceedings of the 23 DOEMRC Nuclear Air Cleaning Conference held July 25-28 1994 February 1995
Schofield 2000a Letter 74910-00-002 Use of Microshield Calculations for RMCS Exhauster Housing for Estimating Radionuclide Quantities on the Filters Using NDA and Dose Rate Measurements I S Schofield CHG to File January 62000
Schofield 2000b Letter 74910-00-003 Rev I RMCS Exhauster Stack RecordSample Data J S Schofield CHG to File January 202000
Reynolds 1999 D R Reynolds LMHC E-Mail to I S Schofield LMHC transmitting Tank Volume Calculations draft of calculations done by Mike Plesha and Reed Hendershot data to be used for RESOLVE computer program for Hanford waste tanks August 3 1999
TWINS Tank Waste Information Network System database available at httptwinspnlgovSOO lhtbinTCDgetTableListexe
Waldo 1999 letter 74910-99-009 RMCS Exhauster Aerosol Test Data E I Waldo to J S Schofield June 22 1999
WHC 1993 WHC-SD-WM-ES-225 Rev I AerosolStudy for the Rotary Mode Exhauster P M Francis Westinghouse Hanford Company April 20 1993
WHC 1997 WHC-SD-WM-SAD-035 Rev Ob A Safety Assessment of Rotary Mode Core Sampling in Flammable Gas Single Shell Tanks Hanford Site Richland Washington August 8 1997
G- I
RPP-4826 Rev I
CGM Data CGM-I Letter PARTICULATE SAMPLING OF 241-SX-IO1 DURING ROTARY MODE CORE SAMPLING D C
Langlois E2 Consulting Engineers to J S Schofield Lockheed Martin Hanford Company March 16 1998
CGM-2 Letter PARTICULATE SAMPLING OF 241-SX-I05 DURING ROTARY MODE CORE SAMPLING D C Langlois E2 Consulting Engineers to J S Schofield Lockheed Martin Hanford Company June 9 1998
CGM-3 Letter PARTICULATE SAMPLING OF 241-SX-103 DURING ROTARY MODE CORE SAMPLING D C Langlois E2 Consulting Engineers to J S Schofield Lockheed Martin Hanford Company June 12 1998
CGM-4 Letter PARTICULATE SAMPLING OF 241-S-110 DURING ROTARYMODE CORESAMPLING D C Langlois E2 Consulting Engineers to J S Schofield Lockheed Martin Hanford Company July 20 1998
CGM-5 Letter PARTICULATE SAMPLING OF 241-SX-102 DURING ROTARY MODE CORE SAMPLING D C Langlois E2 Consulting Engineers to J S Schofield Lockheed Martin Hanford Company July 22 1998
CGM-6 Letter PARTICULATE SAMPLING OF241-U-107 DURING ROTARY MODE CORE SAMPLING D C Langlois E2 Consulting Engineers to J S Schofield Lockheed Martin Hanford Company August 3 1998
CGM-7 Letter PARTICULATE SAMPLING OF 241-BY-105 DURING ROTARY MODE CORESAMPLING D C Langlois E2 Consulting Engineers to 1 S Schofield Lockheed Martin Hanford Company September 17 1998
CGM-8 Letter PARTICULATE SAMPLING OF 241-TX-I13 DURING ROTARY MODE CORESAMPLING D C Langlois E2 Consulting Engineers to J S Schofield Lockheed Martin Hanford Company March 15 1999
CGM-9 Letter PARTICULATE SAMPLING OF 241-TX-113 DURING ROTARY MODE CORE SAMPLING D C Langlois E2 Consulting Engineers to I S Schofield Lockheed Martin Hanford Company May 31 1999
Notices of Construction NOC-I DOEIRL-93-40 Radioactive Air Emissions Program Notice of Construction Rotary Mode Core-Sampling
Truck and Exhauster Approved by Letter AIR 93-707 A W Conklin WDOH to J E Rasmussen DOEIRL 7893
NOC-2 DOEIRL-94-118 Rev 0 Radioactive Air Emissions Program Notice of Construction for the Rotary Mode Core-Sampling Systems Three and Four Approved by Letter AIR 95-603 A W Conklin WDOH to J E Rasmussen DOERL 63095
NOC-3 DOERL-94-118 Rev 1 Radioactive Air Emissions Program Notice of Construction for the Rotary Mode Core-Sampling Systems Three and Four Approved by Letter AIR 98-301 W W Conklin WDOH to I E Rasmussen DOEIRL 3698
NOC-4 DOEIRL-97-70 Radioactive Air Emissions Program Notice of Construction for Rotary Mode Core- Sampling in SX Tank Farm Approved by Letter AIR 97-1 101 A W Conklin WDOH to J E Rasmussen DOEIRL 113097
NOC-5 USEPA Letter OAQ-107 (no title approving DOE submittal 97-EAP-590 dated 72997) A J Frankel USEPA to J E Rasrnussen DOEIRL 8497
NOC-5 USEPA Letter OAQ-107rsquo (nb title approving DOE submittal 97-EAP-723 dated 101797) A J Frankel USEPA to J E Rasmussen DOERL 11498
Note that both letters have ldquoOAQ-107rdquo following ldquoReply to Attn ofrdquo
G-2
RPP-4826 Rev I
Work Packages WP-I ES-94-00808 WP-2 ES-95-00258 WP-3 ES-95-00045 - WP-4 ES-95-00434 - WP-5 ws-97-00173 - WP-6 WS-97-00174 - WP-7 ws-97-00143 - WP-8 WS-97-00144 - WP-9 WS-97-00207 - WP-I 1 WS-97-00208 - WP-12 WS-98-00049 - WP-13 WS-97-00050 - WP-14 WS-97-00224 - WP- I5 WS-97-00225 - WP-16 WS-97-00230 - WP- I7 ws-97-0023 1 - WP-18 ES-97-00452 - WP-19 ES-97-00453 - WP-20 WS-98-00072 - WP-21 WS-98-00073 - WP-22 WS-98-00067 - WP-23 WS-98-00068 -
241-BY-IO6 Perform Rotary Core Sample [Riser IOB] 241-BY-I IO Rotary Core Sample [Risers 12B 7 IZB 41 241-BY-IO8 Obtain Rotary Core Sample [Risers 12A amp 71 241-BY-IO5 Rotary Mode Core Sample [Riser 12A] 241-SX-101 Rotary Mode Core Sample Riser 19 241-SX-101 Rotary Mode Core Sample Riser4 241-SX-103 Rotary Mode Core Sample Riser 7 241-SX-103 Rotary Mode Core Sample Riser I I 241-SX-105 RMCST Obtain Core Sample Riser 6 241-SX-105 RMCST Core Sample Riser 14 241-SX-102 Rotary Mode Core Sample Riser 8 241-SX-102 Rotary Mode Core Sample Riser 4 241-S-1 IO RMCST Obtain Core Sample Riser 6 241-S-1 IO RMCST Obtain Core Sample Riser 14 2414-107 RMCSTCore Sample Riser 7 241-U-107 RMCST Core Sample Riser 2 241-BY-IO5 RMCST Core Sample Riser 7 241-BY-IO5 RMCST Core Sample Riser 1 IB 241-TX-113 Rotary Core Sample Riser 3 241-TX-113 RMCST Core Sample Riser 5 241-TX-I 18 RMCST Core Sample Riser 9B 241-TX-I 18 RMCST Core Sample Riser 128
G-3
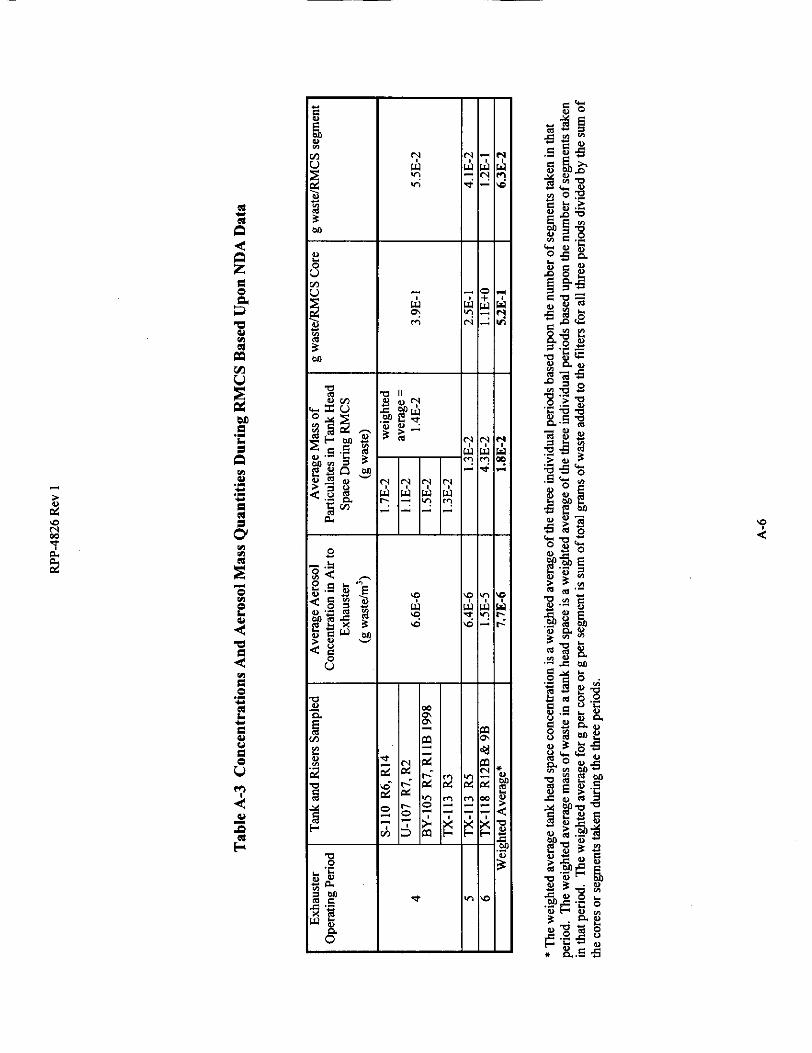
RPP-4826 Rev I
APPENDIX B - Estimation Of Aerosols Generated During RMCS Based Upon RMCS Exhauster HEPA Filter Dose Rates
Summary of Method
This method of estimating RMCS aerosol quantities divides the dose rate increase (mRhr) at the side of the RMCS HEPA filter housing by a calculated dose conversion factor (mRhrmCi C S rdquo ~ ) to obtain an approximation of the radionuclide quantity in the housing This radionuclide quantity is divided by the waste specific activity (mCig) to determine the mass of waste on the HEPA filter Dividing the HEPA filter waste mass by the volume of air passing through the filter provides an estimate of the average tank head space particulate concentration during RMCS Multiplying the average tank head space particulate concentration by the tank head space volume gives an estimate of the average mass of suspended particulates in the tank head space during RMCS Dividing the HEPA filter waste mass by the number of RMCS cores or RMCS segments provides the mass per RMCS core or per RMCS segment sent to the exhauster
Description
Particulates in the exhaust stream are removed by the HEPA filter(s) upstream of the exhaust fan The captured particulates contain radionuclides with CSrsquo~rsquo being the predominant gamma emitter As the particulate quantity on the HEPA filter increases the dose rate at the side of the filter housing will increase proportionately By monitoring the HEPA dose rate at the side of the filter housing the quantity of Csrsquordquo on the HEPA can be estimated This C S rdquo ~ value is then used to back-calculate to a waste mass quantity on the filter using the Csrsquordquo concentration in the tank waste This filter waste mass quantity is used to calculate the concentration of particulates in the tank exhaust stream the total suspended solids in the tank head space and the mass of waste sent to the exhauster for each RMCS core or segment taken Although radionuclides will be trapped on both the prefilter and the primary HEPA filter with a very small amount on the secondary HEPA calculations in this section were based upon the simplifying assumption that all the activity was on the primary HEPA filter
During RMCS exhauster operation the dose rate in m M r at the side of the HEPA filter housing is periodically measured with an Eberline RO-3B per procedure to indicate when radioactive particulates are building up on the filter The limit of detection of the RO-3B is 05 mRhr
Exhauster operations were divided into six operating periods for evaluation in this document These periods are discussed in Appendix F and shown in Table F-I Housing dose rate data were obtained for Exhauster Operating Periods I 24 5 and 6 Relevant information for these periods is also listed in Table B-I Dose rate data are available and were used for all tanks on which an RMCS exhauster was present and RMCS samples were taken This includes BY-106 BY-IO5 (1995) BY-I IO S-l I O U-107 BY-IO5 (1998) TX-113 and TX- 1 18 The dose rate at the end of a period was used as the basis for calculating radionuclides on the filters The only operating period for which dose rate data were not used for estimating filter radionuclide content was Period 3 Period 3 was for RMCS in SX farm using the SX exhauster
The dose rate at the side of the SX exhauster HEPA filter housing was measured during RMCS of SX farm tanks (for sampling of tanks SX-lot SX-102 SX-103 and SX-105) but the data are not useful for estimation of aerosol quantities because the SX exhauster draws on 13 tanks in parallel or in series with the tank being core sampled Many of the tanks have a much higher off gas flow rate than the sampled tank In addition there is background radiation in the area of the SX exhauster filter housing making any increase in the housing dose rate during RMCS difficult to detect
Dose Rate Data
The dose rate data for each period is listed in Table 8-2 No dose rates above minimum detectable limits were evident at the sides of any RMCS exhauster in Periods I 2 and 5
Dose rate measurements were less than detectable for Period 4 during sampling of S-l IO and U-107 When sampling on BY-IO5 there were a few readings of 07 m M r but most were ltOS mRhr This variation in
B- 1
RPP-4826 Rev 1
readings is to be expected as the specific instrument person using the instrument and location at which the dose rate is checked can vary with time The final recorded dose rate when sampling was complete on BY-IO5 was lt05 mRhr At the end of Period 4 following completion of the first core in TX-I 13 Exhauster C was listed as having a 07 m M r dose rate
Period 6 used Exhauster C again with the same housing and filters as at the end of Period 4 The final dose rate for this period was 08 m M r
Periods 124 and 5 all began with a new housing and new filters For Periods 12 and 5 it was conservatively assumed that the final dose rate was equal to 05 m M r giving an increase of 05 mRhr for each of these periods For Period 4 the dose rate increase was 07 m M r for this period Since Period 6 used the same housing and filters as Period 4 the increase for Period 6 was 08 - 07 = 01 m M r
The dose rate increase was converted into a CsIh content on the primary filter for each period Foust 1999 provides various dose rates for an RMCS exhauster housing assuming even dispersal of 1 mCi C S rdquo ~ on the first HEPA filter Using these calculations Schofield 2000a estimated a dose rate conversion factor of 16 mRhrmCi C S rdquo ~ at the detector location for an RO-3B The assumption that radionuclides are evenly distributed on the HEPA is a reasonable assumption based upon the exhauster design and the method used to measure the radiation dose rate
Gamma emitting contribute to the dose rate due to bremsstrahlung radiation and other nuclides may provide some small additional dose but the major penetrating dose rate contributor in aged SST waste is CSrdquo~ Ignoring the presence of all radionuclides (including Srm) except C S rdquo ~ in calculating a HEPA filter waste mass will provide a conservative result This is because assuming all radiation present is due to C S rdquo ~ will result in overestimating the C ~ I ~ ~ c o n t e n t of the filter housing which in turn will result in overestimating the waste mass on the HEPA filter
Dividing the HEPA dose rate for each exhauster installation by the dose conversion factor of I 6 mRhrmCi results in an increase of 031 mCi Csrdquorsquo on the RMCS exhauster filters for Periods I 2 and 5044 mCi for period 4 and 0063 mCi for Period 6
Calculation of Mass Quantity on Filters
Dividing the Csrdquorsquo content of the filters by the specific activity of C S rsquo ~ ~ in the waste gives the estimated mass of waste sent to the exhauster The specific activity value used for the waste in each tank sampled is given in Table E-I Since RMCS was performed on more than one tank in Periods 1 and 4 a weighted average specific activity was used for these periods The weighted average specific activity was calculated based upon the number of RMCS segments taken from each tank sampled during that period The number of RhKS segments obtained during each period are listed in Table B-I These data were obtained from the individual tank data in Table F- I Calculations to estimate the specific activity of waste mixtures were performed in the same manner as shown in Appendix A For Periods 2 5 and 6 RMCS samples were taken in only one tank The waste specific activity used for these periods was the specific activity of the tank sampled The specific activities used for each exhauster operating period are given in Table B-I
For all exhauster installations except BY-IO6 in 1994 and 1995 the RMCS exhausters were hooked directly to the waste tank When sampling BY-106 a prefilter was installed in the tank riser between the tank and the exhauster The prefilter was not used for BY-I IO in Period 1 or for any other tank in any other period Thus for Periods 2 4 5 and 6 the mass of waste on the HEPA was assumed equal to the mass of waste leaving the tank risers For Period 1 the mass of waste on the HEPA had to be adjusted for the BY-106 prefilter DF when estimating the combined mass of waste leaving the BY-IO6 and BY-I IO tank risers The mass of waste on the HEPA for Period 1 was
[031 mCi] [IO00 pCimCi] = 310 pCi
[310 pCi Csrdquorsquoon HEPA] + [I77 pCi C S rdquo ~ ~ waste] = 177 gwaste on HEPA
is the predominant radionuclide contributor to filter dose rates Beta emitting Srw can
on HEPA
B-2
RPP-4826 Rev 1
A decontamination factor (DF) of 5 was used to account for radionuclide removal by the BY-IO6 prefilter (see Appendix D for basis ofprefilter DF) There were 1 1 RMCS segments taken from BY-IO6 and 13 from BY- 1 IO The total mass ofwaste assumed to exit the tank risers was therefore
[ I 77 g waste] [ 1 1 + 131 [[I 151 + 131 = 28 g waste from tank risers
The DF of 5 to account for the prefilter is only applicable to the RMCS of BY-IO6 in 1994 and 1995 for all other exhauster periods the mass of waste on the HEPA was equal to the mass of waste sent to the exhauster riser
The mass of waste sent to the exhauster for Period 2 was
[031 mCi] [IO00 pCimCi] = 310 pCi Csrdquorsquo on HEPA
[3 IO pCi C S rdquo ~ on HEPA] + [225 pCi CsiI7g waste] = I 39 g waste from tank
Using the same formula the mass of waste to the exhauster from Periods 4 and 5 was 241 and 240 g respectively and the increase in waste on the filters for Period 6 was 048 g
Aerosol Calculations
The mass sent to the exhauster per RMCS core or per RMCS segment was obtained by dividing the mass of waste leaving the risers by the number of RMCS cores or RMCS segments obtained during the exhauster operating period
The tank head space particulate concentration was obtained by dividing the mass of waste leaving the riser by the volume of gas sent to the exhauster This volume of gas sent to the exhauster was obtained by multiplying the exhauster flow rate by the exhauster run time from Table F-I The calculations for aerosols generated based upon HEPA dose rates use acfm while the exhauster flow is recorded in scfm so the actin flow rates in Table F- 1 were used
The average mass of aerosols in the tank head space was obtained by multiplying the average tank head space particulate concentration by the tank head space volume from Table F-2
Following is an example of how the mass per RMCS core mass per RMCS segment average tank head space mass concentration and average mass of aerosols in the tank head space were calculated for Period 1 Data used are from Tables E-I F-I and F-2
[200 scfm] [2992+2916] [84 + 4591 + 528 = 21 1 acfm to exhauster from BY-IO6 in 11-1294
using same formula results in 210 acfm for BY-IO6 in 195 and 209 acfm for BY-I IO
28 g waste + [((21 1 acfm)(4878 hr)+(21O)(l867)+(209)(1125))(60 minhr)]= 12E-6 g wastelf to risers
[12E-6 amp] [35315 fmrsquo] =43E-5 g wastemrsquoto risers
[12E-6 gftrsquo] [53700 Arsquo in BY-106 head space] =66E-I g waste in BY-IO6 head space during RMCS
[12E-6 piftrsquo] [92000 ftrsquo in BY-110 headspace] = IIE-l g waste in BY-I10 head spaceduring RMCS
[28 g waste] [5 RMCS cores] = 56E-1 g waste per core to riser
[28 g waste] + [24 RMCS segments] = 12E-1 g waste per segment to risei
8-3
RPP-4826 Rev 1
All data were input to a spreadsheet and the mass to exhauster per RMCS core mass to exhauster per RMCS segment average tank head space mass concentration and average mass of aerosols in the tank head space were calculated for each of the RMCS exhauster operating periods in the same manner as shown above Results are given in Table 8-3
Summary of Calculations
RMCS exhauster operations were segregated into five operating periods during which RMCS was performed The Exhauster B data for BY-IO8 and TX-I 13 riser 3 was not used in these calculations as no RMCS was performed when the exhauster was operating Exhausters were operated in seven tanks during which 16 RMCS cores and 92 RMCS segments were obtained Based on RMCS filter housing dose rate data the results indicate that
These values are conservative as the assumed dose rate at the end of RMCS for Periods I 2 and 5 was assumed to be 05 mRhr In addition using a DF of 5 for the BY-IO6 prefilter skews the results high The in-tank prefilters used in both BY-IO6 sampling events showed no detectable contamination
Operatin Periods 4 and 6 were the only periods with exhauster housing dose rates above detectable The 044 mCi Csrsquordquo and 0063 mCi CsIh increase on the filters for these two periods based upon dose rate data correspond to the 050 mCi CsI3rsquo and 014 mCi Csrdquorsquo increase on the filters for these two periods based u on NDA data (see Appendix A) The 031 mCi C S rdquo ~ for Period 5 is significantly above the 0032 mCi Cslrsquolsquofor the same period determined by the NDA but this is due to assuming the housing dose rate was equal to the minimum detectable 05 mRhr
The average tank head space mass concentration during RMCS was 22E-5 g wastem3 The average mass of suspended solids in the tank head space during RMCS was 47E-2 g waste The average mass sent to the exhauster during RMCS was 59E-1 g wastelRMCS core The average mass sent to the exhauster during RMCS was 1OE-1 g wastelRMCS segment
B-4
v m
__ ~~
RPP-4826 Rev 1
APPENDIX C
ESTIMATION OF AEROSOLS GENERATED DURING RMCS BASED UPON CGM IN-LINE FILTER PAPER ANALYSES
c-0
RPP-4826 Rev I
APPENDIX C - Estimation Of Aerosols Generated During RMCS Based Upon CGM In- Line Filter Paper Analyses
Summary of Method
This method of estimating RMCS aerosol quantities uses radionuclide assay data from in-line filter papers located upstream of continuous gas monitors (CGM) sampling the tank air for flammable gases during RMCS The radionuclide content of the filter paper is divided by the waste radionuclide specific activity and the air flow through the CGM to obtain an estimate of the average mass concentration in the tank head space during the time period the CGM is on Multiplying the estimated average tank head space mass concentration by the tank head space volume gives an estimate of the average mass of particulates in the tank head space during RMCS To obtain the mass per RMCS core or per RMCS segment sent to the exhauster the tank head space average mass concentration is multiplied by the volume of gas sent to the exhauster then multiplied by a correction factor to account for particulates in the head space removed by the exhauster when the CGM is not operating and divided by the number of RMCS cores or RMCS segments
Description
During most tank waste intrusive activities performed since 1996 an intrinsically safe CGM located above ground has been used to continually monitor the tank air for flammable gases during in-tank activities The CGM sampling method draws air directly from the tank head space During RMCS the CGM sampling line is placed in the tank dome space The sampling line is located between the sampling riser and the exhaust riser if practical A pump in the CGM draws tank air up through the line at 05 litmin for measurement of the lower flammability limit (LFL) by the CGM A filter paper is installed in the sampling line upstream of the CGM to protect the unit from internal contamination
Following CGM use the CGM filter papers are normally discarded after monitoring them in the field for contamination To help estimate the tank head space particulate levels during RMCS these filter papers were retained and analyzed in the 222-S laboratory following removal from all tanks in which RMCS was performed from the fall of 1997 through April 1999 Data were collected for the four tanks in SX farm in which RMCS was performed and the next four tanks on which the RMCS exhauster was deployed These tanks are listed in Table c-I Reported CGM Data
The CGM operational data used to estimate aerosol levels during RMCS includes CGM operating times CGM flow rates and filter paper analytical data A summary report containing all the field operating data sheets for CGM usage and lab data was prepared following completion of sampling on each tank for all tanks except TX- 113 For TX-I 13 a separate report was prepared following each core These reports are References CGM-I to CGM-9 The CGM data from these reports are provided in Table C-2
There were 14 CGM installations during RMCS when CGM filter papers were collected and analyzed Each of these installations had Csrdquorsquo total alpha and total beta quantities measured on the filter papers resulting in 42 data points Eight of the measurement results were very low and had errors of gt+-loo These values were not used resulting in a net of 34 data points for calculating average head space mass concentrations based upon CGM data
Calculated Tank Head Space Radionuclide Concentrations
To calculate the average tank head space radionuclide concentrations during RMCS the filter paper radionuclide quantities were first divided by an efficiency factor to account for radionuclides which may not have been captured on the paper This adjusted radionuclide value was divided by the volume of tank air passing through the paper to give the average tank head space radionuclide concentration
The efficiency used for most stack samplers onsite is 73 (see Appendix D) Estimates attached to References CGM-I to CGM-9 indicate the CGM filter paper sampling method used should have a sampling efficiency
c- 1
RPP-4826 Rev 1
exceeding 73 For conservatism a sampling efficiency of 50 was assumed in this document for the CGM filter paper method
The estimated Csrdquorsquo total alpha and total beta concentrations in the tank vapor space were calculated by dividing the radionuclide quantity on the filter paper from Table C-2 by the assumed CGM sampling efficiency of 05 and the volume of gas going to the CGM The volume of gas going to the CGM was calculated by multiplying the time of CGM operation from Table C-2 by the CGM flow rate of 500 mlmin For example the calculated SX- 101 head space C~rsquorsquo~concentration based upon analysis of the CGM filter papers used during RMCS of riser 19 is
[[26E-4 pCi + 051 + [[I755 min][500 mlmin]] = 59E-I0pCiml
All radionuclide concentrations were calculated in a similar fashion Results are given in Table C-3 Table C-3 lists the radionuclide concentrations for all 42 data points The eight radionuclide concentrations not used for estimating mass concentrations are noted
Table C-3 also contains the calculated number of tank head space changeouts by the tank exhauster during CGM operation Tank head space changeouts were calculated by multiplying the exhauster flow rates (in actin) from Table F-1 by the CGM run times from Table C-2 and dividing by the tank head space volumes from Table F-2 The number of tank head space changeouts during CGM operation was used when estimating the waste mass sent to the exhauster See Aerosol Calculations section below for explanation
Aerosol Calculations
Average tank head space mass concentrations based upon CGM filter paper data were calculated by dividing the head space radionuclide concentrations from Table C-3 by the waste specific activities for each tank sampled The waste specific activities used came from Table E-I and are listed again in Table C-I The average of the mass concentrations based upon radionuclide data for each tank was used as the average head space mass concentration for that tank For example the calculated SX-IO1 head space mass concentration analysis from the CGM filter papers used during RMCS of riser 19 is
[59E-10 pCi Csrdquorsquoml+ 112 pCi C S rdquo ~ ~ waste] [ 28317 mlftrsquo] = 1 SE-7 g wasteA3 based upon C S rdquo ~
[ I 7E-I I pCi T A M + 504E-1 pCi TAg waste] [ 283 17 mlftrsquo] = 94E-7 g wasteamprsquo based upon Total Alpha
[43E-9 pCi TBml+ 357 pCi TBg waste] [ 28317 mlArsquo] = 34E-7 g wastel based upon Total Beta
[ [ I 5E-7 + 94E-7 + 34E-7 g wasteArsquo] f 31 = 48E-7 g wasteamp
[48E-7 g wastelt ] [3531467 Arsquom3] = 17E-5 g wastemrsquo
All tank head space mass concentrations were calculated in the same manner The results are presented in Table C-4 The weighted average tank head space mass concentration during RMCS was based upon the number of RMCS segments taken for each data point
The average aerosol mass in the head space during RMCS was calculated by multiplying the average tank head space mass concentration by the tank head space volume from Table F-2 For the same data point as above
[48E-7 g waste Arsquo] [115E+5 Arsquo] = 55E-2 g waste in SX-IO1 head space during RMCS
All average mass quantities present in the tank head space during RMCS were calculated in the same manner using a spreadsheet The results are provided in Table C-4 The weighted average mass of waste in a tank head space in Table C-4 was calculated based upon the number of segments obtained for each data point
Estimation of the mass of waste sent to the exhauster per RMCS core or segment requires calculation of the total mass of waste sent to the exhauster Multiplying the average head space concentration during RMCS by the exhauster flow rate (in acfm) and the time of CGM operation will give the mass of waste sent to the exhauster during the CGM time frame only While the large majority of mass of waste aerosols will have exited the tank or
c -2
RPP-4826 Rev I
resettled by the time the CGM is shut off there could be some residual suspended particles remaining These would eventually pass to the exhauster but would not be picked up by the CGM filter since it was not in service An adjustment factor was used as described in the following paragraphs to account for particles that may exit to the exhauster following shut down of the CGM
Particulates are generated by RMCS when purge gas is blowing out the drill string and the bit is rotating under the waste surface This time averages about six minutes per segment Multiplying the number of RMCS segments per core by six minutes per segment and dividing by the number of minutes of CGM operation shows the creation of particulates will only occur during a nominal 3-4 of the time the CGM is operating During RMCS the normal practice is to install the CGM turn it on when personnel enter a tank farm and keep the unit in constant operation for the remainder of the shift When the portable RMCS exhauster is used the exhauster is normally started at least an hour before RMCS is initiated and kept in operation until it is time to halt operations for the week The SX exhauster is kept in constant operation Comparing exhauster operating times from Tables F-l with CGM operating times from Table C-I it can be seen the CGMs are in operation about 3-15 of the time the RMCS exhauster is operating on a tank This time comparison wasnrsquot estimated for the SX exhauster since the SX exhauster is in constant operation
With CGM operation much longer than the time period when particulates could be generated the majority of particulates generated by RMCS should have settled or been exhausted during the CGM operating period Table C-3 shows the tank head space changeouts made by the exhauster during CGM operating periods ranged from 084 to 63 The average was 24 With the CGMs operating 25-33 times longer than the aerosol generation periods and an average of over two tank head space changeouts during CGM operation the large majority of aerosols generated during RMCS will have settled out or been removed by the exhauster by the time the CGM is shut off To account for particulates remaining in the tank head space after the CGM was turned off that are subsequently removed by an exhauster it was conservatively assumed that 20 of the total mass of particles generated during RMCS were not removed from the tank head space during the CGM operating period Therefore the product of the tank head space concentration and the volume of air sent to the exhauster during the time of CGM operation was multiplied by a factor of 125 (lOOl80) to estimate the total mass of waste sent to the exhauster as a result of RMCS This is shown below for the same SX-IO1 riser 19 data point in the above calculations
[48E-7gA3] [IOOmin] [I755 min] [125]= 11E-l gwastetoexhauster
This value was divided by the number of RMCS cores and RMCS segments from Table C-1 to provide the grams per core and grams per segment in Table C-4 as follows
[ I I E- 1 g waste to exhauster] i 1 core = 11 E-I g wastelRMCS core to exhauster
and
[ 1 I E- 1 g waste to exhauster] + 5 segments = 2 I E-2 g wastelRMCS segment to exhauster
All mass per core and mass per segment values were calculated in the same manner using a spreadsheet The results are provided in Table C-4 The weighted average mass per core and mass per segment in Table C-4 were calculated based upon the number of cores or segments obtained for each data point
Summary of Calculations
There were 34 valid CGM filter paper data points from 14 RMCS CGM sampling periods in eight tanks during which I5 RMCS cores and 79 RMCS segments were obtained Based upon CGM filter paper data the results indicate that
The average tank head space mass concentration during RMCS was 4OE-5 g wastem3 The average mass of suspended solids in the tank head space during RMCS was 97E-2 g waste The average mass sent to the exhauster during RMCS was 18E-1 g wastelRMCS core The average mass sent to the exhauster during RMCS was 34E-2 g wastelRMCS segment
c - 3
RPP-4826 Rev 1
Ignoring all CGM filter paper analytical data points with a variance gtloo will result in conservative results These data points indicate negligible radioactivity was present If a value of zero was assigned to each data point with an analytical error of gtloo instead of ignoring the data point the weighted average particulate quantities in Table C-4 would be reduced by about 12
The average tank head space mass concentrations based upon CGM data will be higher than the average tank head space mass concentrations based upon filter housing NDA or dose rate The RMCS exhauster received tank air from the shifts when sampling was performed and during some of the off-shifts when no sampling was done The CGMs were only operated during the shifts when sampling was performed The air concentration drawn into the CGM and the RMCS exhauster should be roughly the came during the operating shifts but somewhat less during the off-shifts Therefore the tank head space concentration will be higher when based upon CGM data This does not impact the mass of waste sent to the exhauster per core or per segment
c -4
I
- ~
RFP-4826 Rev 1
APPENDIX D
ESTIMATION OF Rh4CS EXHAUSTER HOUSING DECONTAMINATION FACTOR
D-0
RFrsquoP-4826 Rev 1
APPENDIX D - Estimation of RMCS Exhauster Housing Decontamination Factor
Summary of Method
This Appendix estimates a Decontamination Factor (DF) for the RMCS exhausters using housing NDA data and applicable stack record sample data The Csrdquorsquo in the exhauster effluent is divided by the C S rdquo ~ in the exhauster inlet to provide a penetration efficiency The reciprocal ofthe penetration efficiency is the DF
Description
Each RMCS exhauster has an isokinetic sampler located on the stack downstream of the blower and HEPA filters A small pomp pulls air from the exhaust stack into a filter paper at a rate proportional to the exhaust flow Radionuclides in the exhaust stream passing through the sample line are caught on the filter paper The stack operating time and flow rate are recorded When the record sample filter paper is removed the filter paper is analyzed in a laboratory for radionuclides The radionuclide concentration in the stack effluent stream is calculated by dividing the quantity of material on the filter paper by the volume of air through the sampler and then dividing again by a factor to compensate for stack sampler and filter paper efficiency
Multiplying the total beta stack effluent concentration by the total off gas flow gives the total beta emissions from the exhauster The total beta emissions are multiplied by the Csrdquorsquo to total beta ratio for the waste in the tank) being exhausted to give an estimate of the C S rdquo ~ emission The C S rdquo ~ on the filters determined by NDA of the housing (see Appendix A) is added to the C S rdquo ~ emissions to give the total C S rdquo ~ input to the filter housing Dividing the emissions by the input gives the filter housing penetration efficiency Subtracting the penetration efficiency from 1 O gives the filter housing efficiency Dividing 1 O by the penetration efficiency gives the DF
RMCS Stack Record Sample Data
RMCS exhauster stack record samples are taken after completion of each sampling event on a tank Normally this is after all cores on that tank have been obtained but for BY-IO5 in 1998 record samples were taken following each core Record samples are also taken at the end of each year All samples are analyzed for total alpha and total beta At the end of each year all the filter papers for that year are composited and analyzed for individual radionuclides Sample results are entered into the Automated Bar Coding of Air Samples at Hanford (ABCASH) and Environmental Release Summary (ERS) databases Several ofthe filter papers from 1998 were reanalyzed using a longer count time to bring the error rate down
Schofield 2000b compiled and evaluated all available RMCS exhauster stack record sample data filtered out the unusable data provided derivation for the stack sampling efficiency factor and summarized the results Most of the data points were so low as to be unusable since the results were either negative or had error variances gtloo
Column 5 of Table D-1 provides the stack effluent concentrations used for calculation of the filter housing DF The stack effluent data in Table D-l come from Schofield 2000b These values include a 073 sampling efficiency factor
Calculation of RMCS Filter Housing Decontamination Factor Based upon Housing Inlet and Outlet Data
The RMCS exhauster housing NDA and stack record sample data available for exhauster Operating Periods 4 5 and 6 were used to estimate an actual DF for the RMCS exhauster housings The housing NDA data is for CSrdquo~ but there are no usable Csrdquorsquo concentrations for the RMCS exhauster outlet The RMCS exhauster stack Csrsquordquo concentrations are either negative have a variance gtloo or are not available Total beta analyses are available however so the stack eftluent C S rdquo ~ concentrations were estimated by multiplying the total beta concentration by the ratio of Csrdquorsquo to total beta in the tank waste
Column 2 of Table D-l lists the increase in CSrsquo~ on the filters for each operating period as determined by NDA This data was obtained from Table A-2
D- 1
RPP-4826 Rev 1
Column 4 of Table D-l lists the stack exhaust volume for each stack record sample period The stack exhaust volume for the exhauster installation on S-l IO was calculated by
[ZOO std ft3min][15978 hrs] [60 minhr] = 199E+6 std ftrsquo
All other stack volumes in Table D-l were calculated the same way Unlike in Appendices A B and C no adjustment was made to change the 200 scfm to actual cfm This is because the RMCS stack record sample concentrations from Table D-3 are based upon a 200 scfm flow rate rather than the actual flow rate Since the concentrations are on the same basis as the flow rate there is no need to correct to acfm
The total beta emissions for the RMCS exhauster stack were calculated by multiplying the volume by the concentration For the same S-l IO data point
[199E+6 ft3] [18E-15 pCiml] [28317mlft3] [mCi1000 pCi] = 1OE-7 mCi total beta
All other total beta emissions in Table D-l were calculated the same way
The Csrdquorsquo to total beta ratio was calculated from data in Table E-I For the same S- l I O data point
326E+5 Ci CsI3rsquo f I 14E+6 Ci total beta = 029 Ci CslhCi total beta = 029 rnCi CsrdquorsquomCi total beta
The Csrsquordquo emission for the same S-l IO data point was thus
[I OE-7 mCi total beta] [029 mCi CsrdquorsquomCi total beta] = 29E-8 mCi Csrdquorsquo
All Csrsquordquo emissions in Table D-l were calculated in the same manner
The penetration efficiency for each operating period was calculated by dividing the exhauster outlet by the filter inlet Csrdquorsquo quantities For operating period 4 this was
[81E-6 mCi] f [5OE-I + 8IE-6 mCi] = 16E-5 = 16E-3
The DF for operating period 4 is
1 + 16E-5 = 62E+4
The overall DF for periods 4 5 and 6 was calculated by dividing the efluent from all three periods by the total filter input
[95E-6 mCi] f [67E-I t 95E-6 mCi] = 14E-5 = 14E-3 penetration efficiency
I - I 4E-5 = 0999986 = 999986 filter efficiency
1 f 14E-5 = 73E+4 decontamination factor based upon housing inlet and eftluent data
Estimation of Housing Decontamination Factor Based upon General Performance Data
HEPA filters are tested at the manufacturer to a minimum 9997 efficiency using a 03 pm monodisperse aerosol After installation HEPA filters are tested in-place per ASME N5 I O to a minimum 9995 efficiency using a polydisperse aerosol with an approximate droplet size distribution of 99 less than 30 pm 50 less than 07 pm and 10 less than 04 pm The RMCS exhauster housing is tested per ASME N510 and is thus required to have a minimum removal eficiency of 9995 for an aerosol with this approximate size distribution The particle size distribution of the waste aerosols generated by RMCS is unknown but it is assumed that the removal efficiency for RMCS generated aerosols was the same as the removal efficiency for the ASME generated test aerosol
D-2
RPP-4826 Rev I
A 9995 efficiency is equivalent to a DF of 2E+3 while a 9997 efficiency is equivalent to a DF of 33E+3 The actual DF for the RMCS exhauster housing is higher than either of these It has two HEPA filters in series even though the minimum efficiency specified in the NOCs for the RMCS exhausters is only equivalent to one HEPA ERDA 1976 recommends using a DF of 3000rdquo for a filter bank where n is the number of HEPA filters in series This would result in a DF of 9E+6 for the RMCS exhauster housing This is unrealistic Using a DF of 9E+6 will calculate to Csrdquorsquo quantities on the HEPA filtersthat are orders of magnitude above what have been shown to be there based upon the measured dose rates and NDA A DF of 9E+6 would mean the dose rate would have to be almost 100 mRhr at the side of the exhauster housing instead of the 05-08 mRhr dose rates encountered The waste particles will not have the same particle size distribution entering the second HEPA filter as when entering the first The majority of the waste particles will be captured on the I rdquo HEPA filter and although the DF for each HEPA if tested individually using the ASME N5 IO aerosol test method may be 3E+3 (or higher) the overall DF of the two filters in series will not be 3000lsquo This is because the particle size distribution entering the Znd HEPA could have a greater percentage of smaller particles than that entering the 1rdquo
NUREG 1995 included an evaluation of a number of different facility stacks at the Hanford site where the HEPA filter upstream air concentrations were estimated using several different methods This report concluded that back-calculation using a value of 3000rdquo overestimated the upstream radionuclide concentration by three to four orders of magnitude when compared to filter NDA data for the nine stacks for which NDA data were obtained and by three orders of magnitude for the two stacks for which upstream air sample data were available Back- calculation using a value of 3000rdquo was shown to be high by four orders of magnitude for the single stack for which a powder release estimate was available Based upon this information the RMCS exhauster dual filter-in-series housings would have a DF of at least three and maybe four orders of magnitude less than 9E+6 or in the 1E+3 to 1 E+4 range A DF of IE+3 would he less than the minimum permissible under the NOC Comparing the older stack data and design with the newer RMCS exhauster design the minimum DF would be expected to be at least 1E+4
Table D-2 provides the available RMCS exhauster aerosol test data This information was obtained from Waldo 1999 Prior to 1998 the RMCS exhauster primary HEPA filter efficiency and either the secondaly HEPA filter or the overall efficiency for both filters were tested Starting in 1998 only the primary and secondary HEPA filter efficiency were measured The overall efficiency of the two filters in series was only measured three times in 11 setups Twice the overall penetration efficiency was lt0002 and the remaining time the only information that could be found was a value of lt005 Most individual filters had a penetration efficiency of 0002 This appears to be about the limit of the detection equipment Based upon Table D-2 data a penetration efficiency of 0002 (99998 efficiency) is normal for a single HEPA and thus a minimum for an RMCS exhauster housing Assuming a 0002 penetration efficiency for the two filters combined calculates to a DF of 5E+4 (equal to 1 +
000002) for the RMCS exhauster housing
In summary the measured DF for the RMCS exhauster housings over the period from May 1998 through June 1999 was about 73E+4 RMCS aerosol testing prior to use indicates a DF of about 5OE+4 for each of the filters separately but their overall efficiency is not measured Referenced data based on older stacks at Hanford indicate the two HEPA RMCS exhauster housing would likely have a DF of at least IE+4
Estimated Aerosol Levels During RMCS Based Upon RMCS Stack Record Sample Data
Revision 0 of this document used the positive record sample results with variance less than 100 to estimate aerosol concentrations in the exhauster inlet using an assumed exhauster housing DF of 5OE+4 This method of estimating aerosols was eliminated from Revision 1 because the stack concentrations were either too low too scattered or too questionable to provide reliable results There were 112 RMCS stack record sample data points evaluated in Schofield 2000b Excluding the total beta sample results used for estimation of the housing DF there were only ten data points remaining with positive values and variances ltloo the remaining data points were either negative had a variance gtloo or the results were not available
For comparison purposes only Schofield 2000b applied the DF of 73E+4 calculated in this document to the data points not used to calculate the exhauster housing DF to estimate aerosol concentrations upstream of the filters The results showed aerosol levels approximately the same as those estimated using NDA dose rate or CGM filter paper data when a value of zero was used for negative sample results or those with a variance gtloo When only
D-3
RPP-4826 Rev 1
the ten positive results with a variance ltloo were used the aerosol levels calculated to be two to five times higher than those estimated using NDA dose rate or CGM filter paper data Because of the variability of data resulting from the extremely low record sample concentrations and the few useable data points estimation of aerosol levels using record sample data was not included in Revision I See Schofield 2000b for further discussion of the use of record sample data to estimate aerosol levels
Summary of Calculations
A total of nine RMCS exhauster stack record sample data points were used to estimate the RMCS exhauster filter housing decontamination factor These data points were obtained when sampling on five tanks during which 10 RMCS cores and 65 RMCS segments were obtained The overall decontamination factor was 73E+4
Estimation of aerosol generation quantities based upon RMCS stack record sample data is possible However results will likely be skewed high if data points that show non-detectable levels of radionuclides present are ignored instead of using a value of zero for the data point
D-4
RPP-4826 Rev 1
APPENDIX E
TANK WASTE RADIONUCLIDE CONCENTRATIONS USED FOR AEROSOL CALCULATIONS
E-0
RPP-4826 Rev 1
APPENDIX E - Tank Waste Radionuclide Concentrations Used for Aerosol Calculations
The RMCS exhauster NDA data HEPA filter dose rate data CGM filter paper data and stack record sample data provide information on the quantity of radionuclides on the exhauster filters in the tank head space or the exhauster stack during RMCS These radioactivity quantities need to be divided by the waste radionuclide concentration specific activity to determine the mass of waste in the tank head space and in the tank gases sent to the exhauster
The mass quantities in this document were calculated using dry basis radionuclide concentrations Waste particles carried into the tank head space by the purge gas could be wet or dry If wet some of the non-chemically bound water will start to evaporate immediately providing the tank relative humidity is 400 The water present in a waste particle may be chemically bound as a hydrate or free The chemically bound water will not readily evaporate therefore even a ldquodryrdquo particle may have some water associated with it It is impractical to measure the actual water content of the waste particulates caught on the CGM filter paper the exhauster HEPA filters or the stack record sample paper Since the quantity of water in the waste particulates is unknown particulate levels were calculated using dry basis radionuclide concentrations Thus all particulate values given in this document are stated on a dry basis
The waste radionuclide concentrations on a dry basis were calculated from data available in the Tank Waste Information Network System (TWINS) The Best Basis InventorylBest Basis Summary numbers were used These values are the most complete and up to date readily available estimates for Hanford waste tank contents but do not include water The information was downloaded from TWINS into a spreadsheet The total chemical total beta and total alpha quantities were summed in the spreadsheet for all the tanks which were sampled and concentrations for Csrdquorsquo Sr9rsquo total beta and total alpha automatically calculated in pCig These concentrations are provided in Table E-I Because lab techniques for measuring gross beta levels only detect beta particles with a minimum decay energy above 150-200 kev only radionuclides with a decay energy of gt-200 kev were included in the total beta numbers
The TWINS radionuclide concentrations were obtained in December 1999 No corrections were made for decay for this document
The CGM filter paper and stack record sample data indicate the measured radionuclide values are not always in the same ratio to each other as given by TWINS nor are all radionuclides detected that TWINS indicates are present Radionuclides can be distributed unevenly in a tank Soluble fission products (primarily Csrsquordquo) are found in the liquid saltcake and in sludges Insoluble fission products and actinides are found largely in sludges as these are primarily chemical precipitates Sludge could be mixed with saltcake be present in a distinct layer at the bottom of a tank or in several layers in the tank depending upon how waste was transferred into a tank Waste particles may thus not have the same specific activity on a microscopic scale as they would have on a macro scale were the tank contents homogenized During RMCS a top to bottom core sample is attempted resulting in the drill bit and purge gas (which causes aerosols to form) passing through most ofthe waste matrix Assuming the aerosol generation rate is approximately constant during drilling the specific activity of a radionuclide in the suspended solids should be roughly the same as the average specific activity of the same radionuclide in the tank waste While the waste specific activity is probably not homogeneous from top to bottom in a tank and the aerosol generation rate will likely also vary it is beyond the scope of this document to provide an in-depth analysis of all the factors affecting aerosol radionuclide concentration Although sample radionuclide data were not always in the same ratio as provided by TWINS for the purpose of this document the simplifying assumption was made that the average tank specific activity is adequate to provide an approximation of the suspended solids specific activity for all radionuclides Average tank individual radionuclide specific activities were used in the preparation of the exhauster NOCs
The aerosol calculations presented in this document are only as accurate as the TWINS data The combined radionuclide content of all Hanford waste tanks is known fairly well since the overall content is based upon reactor production records CsrdquorsquoSrW recovery data and processing plant discharges Thus TWINS data for all tanks combined should be reasonable There are undoubtedly differences between TWINS data and the actual contents of a specific tank While the specific tank radionuclide data from TWINS used in this document may not be exact deviations from the actual concentrations are assumed to balance out over the number of tanks sampled
E- 1
RPP-4826 Rev 1
APPENDIX F
ROTARY MODE CORE SAMPLING EXHAUSTER AND CORE SAMPLE DATA
F-0
RPP-4826 Rev 1
APPENDIX F - Rotary Mode Core Sampling Exhauster and Core Sample Data
This appendix provides the basic data obtained during RMCS operations which was used in preparation of this document
Basic Operational Data
There have been three RMCS exhausters and three RMCS sampling trucks deployed since starmp of nitrogen- purged RMCS in November 1994 The exhausters are formally designated 296-P-32296-P-33 and 296-P-34 These were originally referred to as parts of RMCS Systems 2 3 and 4 respectively in the Notices of Construction (NOC) for these units The exhauster designations were changed for routine field use in 1996 to exhausters A B and C to avoid confusion with core sampling trucks 23 and 4 since any exhauster could be used with any RMCS truck Exhauster A (2) and RMCS Truck2 have not been used for RMCS since 1995 and are no longer in service for core sampling
Rotary mode core sampling has been conducted in four general time frames since 1994 These time frames were separated by down times for equipment modifications or resolution of environmental permitting and safety concerns For ease of analysis in this document exhauster operations were organized into six distinct operating periods Periods I to 6 were grouped based upon times when the same exhauster and same set of HEPA filters were being used These periods thus overlap with the general operating time frames The four operating time frames were
The first time frame lasted from November 1994 to January 1995 RMCS Truck 2 and Exhauster 2 (A) were used on Tank BY-106 along with an in-tank prefilter This tank provided the initial deployment and testing of the nitrogen-purged equipment in a waste tank During this period radiation dose rates were taken at the side of the exhauster housing Stack record samples were taken in December 1994 and January 1995
The second time frame lasted from July 1995 through October 1995 RMCS Trucks 2 and 4 were used with Exhausters 2 and 3 (A and B) on BY-105 BY-IO8 and BY-I IO During this period radiation dose rates were taken at the sides of the exhauster housings Stack record samples were taken after completion of sampling on each tank No RMCS samples were taken from BY-108 all samples were taken in push mode for this tank
The third time frame began when RMCS was restarted in December 1997 Trucks 3 and 4 were used for sampling of SX-101 SX-103 SX-105 and SX-102 with the SX tank farm exhauster providing ventilation The RMCS exhausters were not used During this period radiation dose rates were taken at the sides of the SX exhauster housing as part of HPT routine surveys SX farm exhauster stack record samples were taken when required by normal operating procedures SX record sampler and filter housing dose rate data were not evaluated for this document It would not be practical using filter dose rate or stack record sample data to estimate the RMCS aerosol addition if any to the SX ventilation system The background radiation around the SX filter housing makes measurement of any small increase in dose rate very difficult to detect The number of tanks being ventilated and the involved off-gas header routings (the exhauster is pulling on thirteen tanks in series or in parallel with the tank being sampled) and any in-tank activities in the SX tanks not being sampled would make it impractical to assess what aerosols resulted from RMCS Beginning with RMCS in SX farm radionuclide analyses were performed on the filter papers protecting the CGMs which draw air out of the tank vapor space for flammable gas detection
The fourth time frame began in May 1998 Between 1095 and 598 Exhausters B and C were extensively modified with new filter housings and other equipment to meet new NOC requirements Trucks 3 and 4 were used with Exhausters B and C (3 and 4) on S-l IO U-107 BY-105 TX-113 and TX-I 18 This period marked the first use ofthe RMCS trucks and RMCS exhausters together following resolution of flammable gas concerns and modifications to the exhausters New filters were installed Radiation dose rates were taken at the sides of the exhauster housings Stack record samples
F- 1
RPP-4826 Rev I
were taken after completion of sampling for each exhauster installation Radionuclide analyses were performed on the CGM filter papers for all tanks except TX-118 An NDA was performed on the Exhauster C housing following completion ofthe first core on TX-I 13 The housing filters when assayed contained aerosols captured by the exhauster following RMCS in S-l IO U-107 BY-105 (1998) and the first core of TX-I 13 Another NDA was performed on Exhauster C following both cores in TX-I 18 An NDA was performed following sampling of the second core in TX-I 13 using Exhauster B The time frame ran through early June 1999 No RMCS samples have been taken after June 1999 nor are any planned for the next few years
For the purposes of evaluating aerosol formation based upon RMCS exhauster housing NDA and dose rate data the exhauster operations were grouped into 6 operating periods These periods are shown in Table F-1 and restated in Tables A-I and B-I All tanks sampled in Periods 1 2 4 5 and 6 were exhausted by the same exhauster with the same housing and filters present during that period Period 3 covered the time the SX exhauster was used during RMCS in SX farm
A brief description of each RMCS tank sampling operation is provided below
Tank 241-BY-1061194 to 1294 RMCS using the nitrogen purge gas system with an exhauster was formally begun on 111794 on tank BY-106 riser IOB Exhauster 2 (A)and Truck 2 were used A sintered metal prefilter was inserted in the riser between the tank and the exhauster A total of eight segments were taken in rotary mode and five segments in push mode until sampling was halted on 122194 One RMCS core was obtained The total exhauster run time was 4878 hours The stack record sample was removed and analyzed following this run period Dose rates taken at the side of the exhauster housing during RMCS were all lt05 mRhr The in-tank prefilter was smeared for contamination when removed from the tank with the smears showing less than detectable levels of radionuclides present (Waldo 1999) The prefilter had been washed with an installed spray system prior to removal from the tank but subsequent testing showed the water flow and pressure were too low to have been effective at removing contamination
Tank 241-BY-106195 Following some process modifications RMCS in BY-IO6 riser IOB began again on 11895 Exhauster 2 (A) and Truck 2 were used The sintered metal prefilter was inserted in the riser between the tank and the exhauster RMCS was halted on 12495 over authorization basis and equipment operability issues for RMCS A total of three segments were taken in rotary mode and eleven segments in push mode One RMCS core was obtained The total exhauster run time was 1867 hours The stack record sample was removed and analyzed following this run period Dose rates taken at the side of the exhauster housing during RMCS were all lt O S mRhr The in-tank prefilter was smeared for contamination when removed from the tank with the smears showing less than detectable levels of radionuclides present (Waldo 1999) The prefilter was not washed this time
Tank 241-BY-110795 to 1095 Following resolution of RMCS authorization basis and equipment issues and completion of the fabrication and testing of Trucks 3 and 4 RMCS was begun in BY-I IO on 71195 Exhauster 2 (A) and Truck 2 were used Samples were taken from risers 128 7 128 again and 4 There was no in- tank prefilter used in this or any subsequent RMCS periods Sampling was performed until 102595 when RMCS was halted over flammable gas issues A total of 13 RMCS segments and 56 PMCS segments were taken Three RMCS cores were obtained The total exhauster run time was 1125 hours The stack record sample was removed and analyzed following this run period Dose rates taken at the side of the exhauster housing during RMCS were all lt O S mRhr
Tank 241-BY-108795 to 895 Core sampling was begun in BY-IO8 on 72595 Exhauster 3 (B) and Truck 4 were used Sampling was done in risers 12A and 7 The tank material proved soft enough so that no RMCS segments were required all segments were obtained in push mode although the exhauster was operated during part of the time sampling was performed Sampling was completed 81895 A total of 16 PMCS segments were taken The total exhauster run time was 6617 hours The stack record sample was removed and
F-2
RPP-4826 Rev 1
analyzed following this run period Dose rates taken at the side of the exhauster housing during RMCS were all lt05 mRhr
Tank 241-BY-105895 to 1095 RMCS was begun in BY-I05 riser 12A on 83095 Exhauster 3 (B) and Truck 4 were used This tank has a concrete layer on top about 12-18 inches thick which had to be drilled through Part way through sampling questions arose as to the flammable gas status of the tank and RMCS was halted on 10695 A total of 3 RMCS and 7 PMCS segments were taken One RMCS core was obtained The total exhauster run time was 4413 hours The stack record sample was removed and analyzed following this run period Dose rates taken at the side of the exhauster housing during RMCS were all lt05 mRhr
Tank 241-SX-1011297 to 298 Following resolution of extensive regulatory and authorization basis issues and installation of equipment modifications RMCS started in SX-101 with Truck 4 on 12497 An RMCS exhauster was not used since all SX farm tanks excluding SX-113 and SX-I 15 are ventilated with the SX exhauster Sampling was performed in risers 19 and 4 and was completed on 21098 A total of 9 RMCS and 6 PMCS segments were taken Two RMCS cores were obtained SX exhauster stack record samples and filter housing dose rates were obtained as part of routine operations for the SX exhauster not as part of the RMCS process Filter papers used in the suction line for the CGM were saved and analyzed in the laboratory to estimate the airborne radionuclide concentration in the tank head space Two CGM filter papers were needed for each core as moisture in the tank vapors condensed on the papers in the cold weather and began to restrict tank gas flow to the CGM
Tank 241-SX-103498 to 598 RMCS started in SX-103 with Truck 4 on 42798 The SX exhauster was used for ventilation (see SX- 101 above) Sampling was performed in risers 7 and 1 1 and was completed on 51198 A total of 6 RMCS and 18 PMCS segments were taken Two RMCS cores were obtained During sampling filter papers used in the suction line for the CGM were saved and analyzed in the laboratory to estimate the airborne radionuclide concentration in the tank head space One CGM filter paper was used during each core SX exhauster stack record samples and filter housing dose rates were obtained as part of routine operations for the SX exhauster not as part of the RMCS process
Tank 241-SX-105298 to 598 RMCS started in SX-105 with Truck 3 on 22598 The SX exhauster was used for ventilation (see SX- 101 above) Sampling was performed in risers 6 and 14 and was completed on 51598 A total of 6 RMCS and 20 PMCS segments were taken Two RMCS cores were obtained During sampling filter papers used in the suction line for the CGM were saved and analyzed in the laboratory to estimate the airborne radionuclide concentration in the tank head space Two filter papers were needed for the first core as moisture in the tank vapors condensed on the papers in the cold weather and began to restrict tank gas flow to the CGM One filter paper was used for the second core SX exhauster stack record samples and filter housing dose rates were obtained as part of routine operations for the SX exhauster not as part of the RMCS process
Tank 241-SX-102698 to 798 RMCS started in SX-102 with Truck 4 on 61798 The SX exhauster was used for ventilation (see SX- 101 above) Sampling was performed in risers 8 and 4 and was completed on 7798 A total of 2 RMCS and I8 PMCS segments were taken Two RMCS cores were obtained During sampling filter papers used in the suction line for the CGM were saved and analyzed in the laboratory to estimate the airborne radionuclide concentration in the tank head space One filter paper was used for each core SX exhauster stack record samples and filter housing dose rates were obtained as part of routine operations for the SX exhauster not as part of the RMCS process
Tank 241-S-110598 to 698 RMCS was begun in S-I10 on 51898 Exhauster C (4) and Truck 3 were used This tank marked the first use of an RMCS exhauster since 1995 Sampling was completed on 6498 Risers 6 and 14 were sampled A total of IO RMCS and 8 PMCS segments were taken Two RMCS cores were obtained The
F-3
RPP-4826 Rev I
total exhauster run time was 15978 hours The stack record sample was removed and analyzed following this run period Dose rates taken at the side of the exhauster housing during RMCS were all lt05 mRhr During sampling filter papers used in the suction line for the CGM were saved and analyzed in the laboratory to estimate the airborne radionuclide concentration in the tank head space One filter paper was used for each core Waste particles retained on the exhauster housing filters were part of the inventory subsequently measured by NDA following completion of the first core in TX-I 13
Tank 241-U-107698 to 798 RMCS was begun in U-107 on 61098 Exhauster C and Trucks 3 and 4 were used Sampling was completed on 71598 Risers 7 and 2 were sampled A total of IO RMCS and 19 PMCS segments were taken Two RMCS cores were obtained The total exhauster run time was 27385 hours The stack record sample was removed and analyzed following this run period Dose rates taken at the side of the exhauster housing during RMCS were all 105 mRihr During sampling filter papers used in the suction line for the CGM were saved and analyzed in the laboratory to estimate the airborne radionuclide concentration in the tank head space One filter paper was used for each core Waste particles retained on the exhauster housing filters were part of the inventory subsequently measured by NDA following completion of the first core in TX-I 13
Tank 24l-BY-105798 to 898 RMCS was begun in BY-105 again on 72298 Exhauster C and Trucks 3 and 4 were used Sampling was completed on 82598 Risers 7 and 1 1 B were sampled A total of 18 RMCS and 18 PMCS segments were taken The material was hard enough to require rotary mode sampling all the way to the bottom of the waste but negligible recovery was obtained After RMCS was performed to the waste bottom a PMCS core was taken in the same hole to recover material Two RMCS cores were obtained The exhauster run time was 13577 hours for the first RMCS core and 30792 hours for the second RMCS core Stack record sample information in ABCASH shows 30558 hours operation for the second core but the sampler data sheet shows the time counter was mistakenly reset 234 hours into the run No correction was made to the BY-IO5 2nd core record sample concentration for this document since the error is conservative and results in only slightly higher (ltI) record sample radionuclide concentrations for this core A stack record sample was removed and analyzed following each core giving two record samples for BY-IO5 in 1998 Dose rates taken at the side of the exhauster housing during RMCS were almost all lt05 m R h but a few readings indicated 07 mRihr This variation was assumed due to personnel reading the instrument differently or the fact that the exhauster had been used on enough tanks that by now there was sufficient activity on the filters to cause readings approximately at the background detection level The final reading when both cores were completed was lt05 m R h During sampling filter papers used in the suction line for the CGM were saved and analyzed in the laboratory to estimate the airborne radionuclide concentration in the tank head space One filter paper was used for each core Waste particles retained on the exhauster housing filters were part of the inventory subsequently measured by NDA following completion of the first core in TX-113
Tank 241-TX-113998 to 599 Core sampling was begun in TX-I 13 riser 3 on 92298 Exhauster B (3) and Truck 4 were used at the start This was the first use of Exhauster B since it was modified Exhauster B ran for a total of 8738 hours until being disconnected on 102398 During this time two PMCS segments were taken and no RMCS segments Exhauster C was then installed and operated for 5598 hours from 121098 to 122898 No RMCS or PMCS sampling was performed during this time frame RMCS segments werent taken until 299 Exhauster C ran for a 30230 hours between 122898 and 21299 Sampling was completed on the core from riser 3 on 21299 A total of 12 RMCS segments were obtained during the time Exhauster C was operating Exhauster flow rate for both exhausters was a nominal 200 scfm Stack record samples were taken following Exhauster B removal at the end of 1998 for Exhauster C and following completion ofthe first core with Exhauster C Aerosol calculations were based on only the 30230 hours run time for Exhauster C in 1999 since this was the time period during which RMCS segments were obtained Dose rates taken at the side of the exhauster housing during the short PMCS only sampling period with Exhauster B were all ltOS m R h Dose rates with Exhauster C varied between lt O S mRhr and 07 mRhr The final reading on Exhauster C following completion of the first core was 07 mFUhr During sampling filter papers used in the suction line for the CGM were saved and
F-4
RPP-4826 Rev I
analyzed in the laboratory to estimate the airborne radionuclide concentration in the tank head space One filter paper was used for the core Waste particles retained on the exhauster housing filters were part of the inventory subsequently measured by NDA following completion of this core
Sampling in riser 5 was begun on 41299 using Exhauster B and Truck 3 A total of 6 RMCS and 1 PMCS segments were taken for this core before sampling was halted on 42899 The total exhauster run time for this core was 11712 hours Problems with high vacuum in the tank required the exhauster flow rate to be reduced to 190 scfm to keep the system within pressure limits The stack record sample for the second core was removed and analyzed following the run period Dose rates taken at the side of the exhauster housing during the second core were all lt05 m M r During sampling filter papers used in the suction line for the CGM were saved and analyzed in the laboratory to estimate the airborne radionuclide concentration in the tank head space One filter paper was used An NDA was performed on the exhauster housing following this core The only radionuclides present in the housing were those from this core or what was removed from the tank head space during the non-RMCS activities in this tank from 92298 and 102398
Some clarification may be needed to explain use of the exhauster operating times and NDA dose rate and record sample data obtained during core sampling on TX-I 13 Core sampling was set up for sampling riser 3 on TX-113 in September 1998 with Exhauster B Exhauster B operated for a total of 8738 hours between 92298 and 102298 The stack record sample was removed at the end of this period The ERS database incorrectly shows the exhauster operated between 111698 and 111998 The ABCASH database shows the stack record sample was removed on 111998 The stack record sample showed positive emuent concentrations during this time period with variances 400 No RMCS samples were taken during this period so the data and time werenrsquot included when calculating RMCS aerosol numbers Exhauster B was removed and Exhauster C installed in late November-early December Exhauster C was operated for a total of 5559 hours between 121098 and 122398 The stack record sample was removed on 122898 No sampling was performed during this period so the data and time werenrsquot included when calculating RMCS aerosol numbers Exhauster C was operated for a total of 30218 hours between 122898 and 2899 All the RMCS segments from riser 3 were taken in this time period so only the data and time for this period were included when calculating RMCS aerosol numbers Exhauster B was used during sampling of riser 5 Exhauster B operated for a total of 11712 hours between 41299 and 42899
Tank 241-TX-l18599 to 699 RMCS was begun in TX-I 18 on 5699 Exhauster C (4) and Truck 4 were used Sampling was completed on 6298 Risers 9B and 12B were sampled A total of 9 RMCS segments were taken there were no PMCS segments Two RMCS cores were obtained The total exhauster run time was 21247 hours The stack record sample was removed and analyzed following this run period The maximum dose rate taken at the side of the exhauster housing following RMCS was 08 m M r CGM filter papers were not analyzed An NDA was performed on the exhauster housing following completion of the two cores The exhauster housing contained the same nuclides as for the first NDA (S-110 U-107 BY-105 and TX-I 13 first core) plus those from TX-I 18
The basic core sampling operational data used in this document includes the number of RMCS cores and segments the exhauster run times and flow rates the RMCS exhauster HEPA filter dose rates and tank vapor space temperatures Table F-l lists the basic operational data This information excluding tank vapor space temperature data was obtained from procedural data sheets in the sampling work packages (References W - 1 to WP-23)
Tank temperature data for the tanks ventilated with the RMCS exhausters was obtained from the TWINS database Plots for each tank were prepared for the time RMCS was conducted and the average value of the highest thermocouple located in the tank (the lowest temperature reading) was estimated and used as the average tank head space temperature during the RMCS period
The SX exhauster flow rates listed in Table F-l are estimates only The combined flow rate for SX-IO1 through SX-106 plus SX-109 (7 tanks) averaged 440 cfm during CY 1996 (Kaiser 1997) for an average of 63 cfm per
F-5
RPP-4826 Rev I
tank Based upon inlet flow measurements at the tank inlet HEPA filters (Fanis 1998) the flow through each individual tank (SX-IO1 through SX-106 plus SX-109) was lt55 cfm at the breather filter Assuming an exhaust flow of 100 cfm for each SX farm tank sampled is therefore conservative
Calculated Data
Calculated data include the tank head space volumes conversion of the RMCS exhauster flow rate from scfm to acfm and the number of tank head space changeouts made by an exhauster during RMCS
Tank head space volume includes the dome space volume above the top of the sidewall plus the void space between the waste surface and the top of the sidewall The formula used to calculate tank head space volumes WN
Head Space Volume in A = (DS + [(H) (12) + HI + Hb - H] (V)) - 748
Where DS = dome space volume gal H = height of tank body sidewall above knuckle A HI = height of tank knuckle area in Hb = height oftank bottom below knuckle in H = height of waste in tank in V =27555 galin of waste in SX tanks 2754 gallin in all others
The tank dome space volumes height of tank sidewall above the knuckle height of tank knuckle area and height of tank bottom below the knuckle were obtained from Reynolds 1999 The height of waste in each tank at the time of core sampling was obtained from the TWINS database Tank dimensional and waste level data are given in Table F-2 along with the calculated tank head space volumes
Aerosol calculations for Appendices A-C require exhauster flow rates in actual cubic feet per minute The RMCS exhauster flow rate is controlled and recorded in standard cubic feet per minute The mass flow rate of the exhauster air is measured and internal logic in the exhauster controller calculates what the volumetric flow rate would be if the temperature and pressure in the exhauster inlet were at standard conditions The standard conditions used in the logic controller are 29921 in Hg (760 mm Hg) and 69F (ZIT)
A correction factor is built into the exhauster control logic that assumes an atmospheric pressure of 2927 in Hg the average atmospheric pressure at Hanford The RMCS exhauster will operate at about 1-2 in H20 negative pressure resulting in about a 2916 in Hg pressure in a waste tank when the RMCS exhauster is operating To revise the indicated scfm RMCS exhauster reading to an acfm value the RMCS exhauster scfm flaw rate was multiplied by (29922916)(T+459)528 where Tis the tank head space temperature in OF The tank head space temperatures in Table F-1 were input to the spreadsheet file used for aerosol calculations and converted to acfm The flow rates in acfm are included in Table F-I
The tank head space changeouts when using the RMCS exhauster were calculated by multiplying the exhauster acfm flow rate by the time of exhauster operation and dividing the result by the tank head space volume Tank head space changeouts are listed in Table F-2
F-6
c
gt 2
RPP-4826 Rev 1
APPENDIX G
REFERENCES
G-0
RPP-4826 Rev 1
APPENDIX G - References
Diedeker 1999 NDA of RMCS HEPA Filters L P Diedeker WMH E-Mail to JS Schofield CHG November 29 I999
ERDA 1976 Nuclear Air Cleaning Handbook ERDA 76-21 Buchsted C A Fuller A B and Kahn 1 E Oak Ridge National Laboratory 1976
Farris 1998 Internal Note T R Farris LMHC to J S Schofield LMHC Breather Filter Flow Rates for SX-Farm 31698
Foust 1999 Internal Memo RMCST Exhauster HEPA Filter Dose Rate Calculations D J Foust LMHC to J S Schofield LMHC October 25 1999
Greager 1999 Correspondence No WMH-9954450 Non-Destructive Analysis of the Rotay Mode Core Sample High-Efjiciency Particulate Air Filters E M Greager WMH to P C Miller LMHC June 28 1999 [Transmittal of HNF-4199 Resultsfram NDA Measurement of the 296-P-34 RMCS HEPA Filters]
HNF 1999 HNF-SD-WM-SAR-067 Tank Waste Remediation System Final Safety Analysis Report Rev 1 The revision incorporating RMCS accident analyses was submitted as Addendum 5 to DOE as a change to the FSAR predecessor the Basis for Interim Operation (BIO) LMHC-9857075 80232764-9-KOOl Submittal of Authorization Basis Amendment Package for Rotay and Push Mode Core Sampling in Satisfaction of Perfarmance Agreement TWR 122 Expectations I and 3 D 1 Allen LMHC to A M Umek FDH August 30 1998 Addendum 5 as of mid-January 2000 is waiting for approval by DOE
Kaiser 1997 T D Kaiser LMHC E-Mail to J S Schofield LMHC SX Tank Flow Data 42197
NUREG 1995 Potential Radionuclide Emissionsfrom Stacks on the HanfordSite Part I Dose Assessment Davis W E and Barnett J M Westinghouse Hanford Company from Proceedings of the 23 DOEMRC Nuclear Air Cleaning Conference held July 25-28 1994 February 1995
Schofield 2000a Letter 74910-00-002 Use of Microshield Calculations for RMCS Exhauster Housing for Estimating Radionuclide Quantities on the Filters Using NDA and Dose Rate Measurements I S Schofield CHG to File January 62000
Schofield 2000b Letter 74910-00-003 Rev I RMCS Exhauster Stack RecordSample Data J S Schofield CHG to File January 202000
Reynolds 1999 D R Reynolds LMHC E-Mail to I S Schofield LMHC transmitting Tank Volume Calculations draft of calculations done by Mike Plesha and Reed Hendershot data to be used for RESOLVE computer program for Hanford waste tanks August 3 1999
TWINS Tank Waste Information Network System database available at httptwinspnlgovSOO lhtbinTCDgetTableListexe
Waldo 1999 letter 74910-99-009 RMCS Exhauster Aerosol Test Data E I Waldo to J S Schofield June 22 1999
WHC 1993 WHC-SD-WM-ES-225 Rev I AerosolStudy for the Rotary Mode Exhauster P M Francis Westinghouse Hanford Company April 20 1993
WHC 1997 WHC-SD-WM-SAD-035 Rev Ob A Safety Assessment of Rotary Mode Core Sampling in Flammable Gas Single Shell Tanks Hanford Site Richland Washington August 8 1997
G- I
RPP-4826 Rev I
CGM Data CGM-I Letter PARTICULATE SAMPLING OF 241-SX-IO1 DURING ROTARY MODE CORE SAMPLING D C
Langlois E2 Consulting Engineers to J S Schofield Lockheed Martin Hanford Company March 16 1998
CGM-2 Letter PARTICULATE SAMPLING OF 241-SX-I05 DURING ROTARY MODE CORE SAMPLING D C Langlois E2 Consulting Engineers to J S Schofield Lockheed Martin Hanford Company June 9 1998
CGM-3 Letter PARTICULATE SAMPLING OF 241-SX-103 DURING ROTARY MODE CORE SAMPLING D C Langlois E2 Consulting Engineers to J S Schofield Lockheed Martin Hanford Company June 12 1998
CGM-4 Letter PARTICULATE SAMPLING OF 241-S-110 DURING ROTARYMODE CORESAMPLING D C Langlois E2 Consulting Engineers to J S Schofield Lockheed Martin Hanford Company July 20 1998
CGM-5 Letter PARTICULATE SAMPLING OF 241-SX-102 DURING ROTARY MODE CORE SAMPLING D C Langlois E2 Consulting Engineers to J S Schofield Lockheed Martin Hanford Company July 22 1998
CGM-6 Letter PARTICULATE SAMPLING OF241-U-107 DURING ROTARY MODE CORE SAMPLING D C Langlois E2 Consulting Engineers to J S Schofield Lockheed Martin Hanford Company August 3 1998
CGM-7 Letter PARTICULATE SAMPLING OF 241-BY-105 DURING ROTARY MODE CORESAMPLING D C Langlois E2 Consulting Engineers to 1 S Schofield Lockheed Martin Hanford Company September 17 1998
CGM-8 Letter PARTICULATE SAMPLING OF 241-TX-I13 DURING ROTARY MODE CORESAMPLING D C Langlois E2 Consulting Engineers to J S Schofield Lockheed Martin Hanford Company March 15 1999
CGM-9 Letter PARTICULATE SAMPLING OF 241-TX-113 DURING ROTARY MODE CORE SAMPLING D C Langlois E2 Consulting Engineers to I S Schofield Lockheed Martin Hanford Company May 31 1999
Notices of Construction NOC-I DOEIRL-93-40 Radioactive Air Emissions Program Notice of Construction Rotary Mode Core-Sampling
Truck and Exhauster Approved by Letter AIR 93-707 A W Conklin WDOH to J E Rasmussen DOEIRL 7893
NOC-2 DOEIRL-94-118 Rev 0 Radioactive Air Emissions Program Notice of Construction for the Rotary Mode Core-Sampling Systems Three and Four Approved by Letter AIR 95-603 A W Conklin WDOH to J E Rasmussen DOERL 63095
NOC-3 DOERL-94-118 Rev 1 Radioactive Air Emissions Program Notice of Construction for the Rotary Mode Core-Sampling Systems Three and Four Approved by Letter AIR 98-301 W W Conklin WDOH to I E Rasmussen DOEIRL 3698
NOC-4 DOEIRL-97-70 Radioactive Air Emissions Program Notice of Construction for Rotary Mode Core- Sampling in SX Tank Farm Approved by Letter AIR 97-1 101 A W Conklin WDOH to J E Rasmussen DOEIRL 113097
NOC-5 USEPA Letter OAQ-107 (no title approving DOE submittal 97-EAP-590 dated 72997) A J Frankel USEPA to J E Rasrnussen DOEIRL 8497
NOC-5 USEPA Letter OAQ-107rsquo (nb title approving DOE submittal 97-EAP-723 dated 101797) A J Frankel USEPA to J E Rasmussen DOERL 11498
Note that both letters have ldquoOAQ-107rdquo following ldquoReply to Attn ofrdquo
G-2
RPP-4826 Rev I
Work Packages WP-I ES-94-00808 WP-2 ES-95-00258 WP-3 ES-95-00045 - WP-4 ES-95-00434 - WP-5 ws-97-00173 - WP-6 WS-97-00174 - WP-7 ws-97-00143 - WP-8 WS-97-00144 - WP-9 WS-97-00207 - WP-I 1 WS-97-00208 - WP-12 WS-98-00049 - WP-13 WS-97-00050 - WP-14 WS-97-00224 - WP- I5 WS-97-00225 - WP-16 WS-97-00230 - WP- I7 ws-97-0023 1 - WP-18 ES-97-00452 - WP-19 ES-97-00453 - WP-20 WS-98-00072 - WP-21 WS-98-00073 - WP-22 WS-98-00067 - WP-23 WS-98-00068 -
241-BY-IO6 Perform Rotary Core Sample [Riser IOB] 241-BY-I IO Rotary Core Sample [Risers 12B 7 IZB 41 241-BY-IO8 Obtain Rotary Core Sample [Risers 12A amp 71 241-BY-IO5 Rotary Mode Core Sample [Riser 12A] 241-SX-101 Rotary Mode Core Sample Riser 19 241-SX-101 Rotary Mode Core Sample Riser4 241-SX-103 Rotary Mode Core Sample Riser 7 241-SX-103 Rotary Mode Core Sample Riser I I 241-SX-105 RMCST Obtain Core Sample Riser 6 241-SX-105 RMCST Core Sample Riser 14 241-SX-102 Rotary Mode Core Sample Riser 8 241-SX-102 Rotary Mode Core Sample Riser 4 241-S-1 IO RMCST Obtain Core Sample Riser 6 241-S-1 IO RMCST Obtain Core Sample Riser 14 2414-107 RMCSTCore Sample Riser 7 241-U-107 RMCST Core Sample Riser 2 241-BY-IO5 RMCST Core Sample Riser 7 241-BY-IO5 RMCST Core Sample Riser 1 IB 241-TX-113 Rotary Core Sample Riser 3 241-TX-113 RMCST Core Sample Riser 5 241-TX-I 18 RMCST Core Sample Riser 9B 241-TX-I 18 RMCST Core Sample Riser 128
G-3
RPP-4826 Rev 1
All data were input to a spreadsheet and the mass to exhauster per RMCS core mass to exhauster per RMCS segment average tank head space mass concentration and average mass of aerosols in the tank head space were calculated for each of the RMCS exhauster operating periods in the same manner as shown above Results are given in Table 8-3
Summary of Calculations
RMCS exhauster operations were segregated into five operating periods during which RMCS was performed The Exhauster B data for BY-IO8 and TX-I 13 riser 3 was not used in these calculations as no RMCS was performed when the exhauster was operating Exhausters were operated in seven tanks during which 16 RMCS cores and 92 RMCS segments were obtained Based on RMCS filter housing dose rate data the results indicate that
These values are conservative as the assumed dose rate at the end of RMCS for Periods I 2 and 5 was assumed to be 05 mRhr In addition using a DF of 5 for the BY-IO6 prefilter skews the results high The in-tank prefilters used in both BY-IO6 sampling events showed no detectable contamination
Operatin Periods 4 and 6 were the only periods with exhauster housing dose rates above detectable The 044 mCi Csrsquordquo and 0063 mCi CsIh increase on the filters for these two periods based upon dose rate data correspond to the 050 mCi CsI3rsquo and 014 mCi Csrdquorsquo increase on the filters for these two periods based u on NDA data (see Appendix A) The 031 mCi C S rdquo ~ for Period 5 is significantly above the 0032 mCi Cslrsquolsquofor the same period determined by the NDA but this is due to assuming the housing dose rate was equal to the minimum detectable 05 mRhr
The average tank head space mass concentration during RMCS was 22E-5 g wastem3 The average mass of suspended solids in the tank head space during RMCS was 47E-2 g waste The average mass sent to the exhauster during RMCS was 59E-1 g wastelRMCS core The average mass sent to the exhauster during RMCS was 1OE-1 g wastelRMCS segment
B-4
v m
__ ~~
RPP-4826 Rev 1
APPENDIX C
ESTIMATION OF AEROSOLS GENERATED DURING RMCS BASED UPON CGM IN-LINE FILTER PAPER ANALYSES
c-0
RPP-4826 Rev I
APPENDIX C - Estimation Of Aerosols Generated During RMCS Based Upon CGM In- Line Filter Paper Analyses
Summary of Method
This method of estimating RMCS aerosol quantities uses radionuclide assay data from in-line filter papers located upstream of continuous gas monitors (CGM) sampling the tank air for flammable gases during RMCS The radionuclide content of the filter paper is divided by the waste radionuclide specific activity and the air flow through the CGM to obtain an estimate of the average mass concentration in the tank head space during the time period the CGM is on Multiplying the estimated average tank head space mass concentration by the tank head space volume gives an estimate of the average mass of particulates in the tank head space during RMCS To obtain the mass per RMCS core or per RMCS segment sent to the exhauster the tank head space average mass concentration is multiplied by the volume of gas sent to the exhauster then multiplied by a correction factor to account for particulates in the head space removed by the exhauster when the CGM is not operating and divided by the number of RMCS cores or RMCS segments
Description
During most tank waste intrusive activities performed since 1996 an intrinsically safe CGM located above ground has been used to continually monitor the tank air for flammable gases during in-tank activities The CGM sampling method draws air directly from the tank head space During RMCS the CGM sampling line is placed in the tank dome space The sampling line is located between the sampling riser and the exhaust riser if practical A pump in the CGM draws tank air up through the line at 05 litmin for measurement of the lower flammability limit (LFL) by the CGM A filter paper is installed in the sampling line upstream of the CGM to protect the unit from internal contamination
Following CGM use the CGM filter papers are normally discarded after monitoring them in the field for contamination To help estimate the tank head space particulate levels during RMCS these filter papers were retained and analyzed in the 222-S laboratory following removal from all tanks in which RMCS was performed from the fall of 1997 through April 1999 Data were collected for the four tanks in SX farm in which RMCS was performed and the next four tanks on which the RMCS exhauster was deployed These tanks are listed in Table c-I Reported CGM Data
The CGM operational data used to estimate aerosol levels during RMCS includes CGM operating times CGM flow rates and filter paper analytical data A summary report containing all the field operating data sheets for CGM usage and lab data was prepared following completion of sampling on each tank for all tanks except TX- 113 For TX-I 13 a separate report was prepared following each core These reports are References CGM-I to CGM-9 The CGM data from these reports are provided in Table C-2
There were 14 CGM installations during RMCS when CGM filter papers were collected and analyzed Each of these installations had Csrdquorsquo total alpha and total beta quantities measured on the filter papers resulting in 42 data points Eight of the measurement results were very low and had errors of gt+-loo These values were not used resulting in a net of 34 data points for calculating average head space mass concentrations based upon CGM data
Calculated Tank Head Space Radionuclide Concentrations
To calculate the average tank head space radionuclide concentrations during RMCS the filter paper radionuclide quantities were first divided by an efficiency factor to account for radionuclides which may not have been captured on the paper This adjusted radionuclide value was divided by the volume of tank air passing through the paper to give the average tank head space radionuclide concentration
The efficiency used for most stack samplers onsite is 73 (see Appendix D) Estimates attached to References CGM-I to CGM-9 indicate the CGM filter paper sampling method used should have a sampling efficiency
c- 1
RPP-4826 Rev 1
exceeding 73 For conservatism a sampling efficiency of 50 was assumed in this document for the CGM filter paper method
The estimated Csrdquorsquo total alpha and total beta concentrations in the tank vapor space were calculated by dividing the radionuclide quantity on the filter paper from Table C-2 by the assumed CGM sampling efficiency of 05 and the volume of gas going to the CGM The volume of gas going to the CGM was calculated by multiplying the time of CGM operation from Table C-2 by the CGM flow rate of 500 mlmin For example the calculated SX- 101 head space C~rsquorsquo~concentration based upon analysis of the CGM filter papers used during RMCS of riser 19 is
[[26E-4 pCi + 051 + [[I755 min][500 mlmin]] = 59E-I0pCiml
All radionuclide concentrations were calculated in a similar fashion Results are given in Table C-3 Table C-3 lists the radionuclide concentrations for all 42 data points The eight radionuclide concentrations not used for estimating mass concentrations are noted
Table C-3 also contains the calculated number of tank head space changeouts by the tank exhauster during CGM operation Tank head space changeouts were calculated by multiplying the exhauster flow rates (in actin) from Table F-1 by the CGM run times from Table C-2 and dividing by the tank head space volumes from Table F-2 The number of tank head space changeouts during CGM operation was used when estimating the waste mass sent to the exhauster See Aerosol Calculations section below for explanation
Aerosol Calculations
Average tank head space mass concentrations based upon CGM filter paper data were calculated by dividing the head space radionuclide concentrations from Table C-3 by the waste specific activities for each tank sampled The waste specific activities used came from Table E-I and are listed again in Table C-I The average of the mass concentrations based upon radionuclide data for each tank was used as the average head space mass concentration for that tank For example the calculated SX-IO1 head space mass concentration analysis from the CGM filter papers used during RMCS of riser 19 is
[59E-10 pCi Csrdquorsquoml+ 112 pCi C S rdquo ~ ~ waste] [ 28317 mlftrsquo] = 1 SE-7 g wasteA3 based upon C S rdquo ~
[ I 7E-I I pCi T A M + 504E-1 pCi TAg waste] [ 283 17 mlftrsquo] = 94E-7 g wasteamprsquo based upon Total Alpha
[43E-9 pCi TBml+ 357 pCi TBg waste] [ 28317 mlArsquo] = 34E-7 g wastel based upon Total Beta
[ [ I 5E-7 + 94E-7 + 34E-7 g wasteArsquo] f 31 = 48E-7 g wasteamp
[48E-7 g wastelt ] [3531467 Arsquom3] = 17E-5 g wastemrsquo
All tank head space mass concentrations were calculated in the same manner The results are presented in Table C-4 The weighted average tank head space mass concentration during RMCS was based upon the number of RMCS segments taken for each data point
The average aerosol mass in the head space during RMCS was calculated by multiplying the average tank head space mass concentration by the tank head space volume from Table F-2 For the same data point as above
[48E-7 g waste Arsquo] [115E+5 Arsquo] = 55E-2 g waste in SX-IO1 head space during RMCS
All average mass quantities present in the tank head space during RMCS were calculated in the same manner using a spreadsheet The results are provided in Table C-4 The weighted average mass of waste in a tank head space in Table C-4 was calculated based upon the number of segments obtained for each data point
Estimation of the mass of waste sent to the exhauster per RMCS core or segment requires calculation of the total mass of waste sent to the exhauster Multiplying the average head space concentration during RMCS by the exhauster flow rate (in acfm) and the time of CGM operation will give the mass of waste sent to the exhauster during the CGM time frame only While the large majority of mass of waste aerosols will have exited the tank or
c -2
RPP-4826 Rev I
resettled by the time the CGM is shut off there could be some residual suspended particles remaining These would eventually pass to the exhauster but would not be picked up by the CGM filter since it was not in service An adjustment factor was used as described in the following paragraphs to account for particles that may exit to the exhauster following shut down of the CGM
Particulates are generated by RMCS when purge gas is blowing out the drill string and the bit is rotating under the waste surface This time averages about six minutes per segment Multiplying the number of RMCS segments per core by six minutes per segment and dividing by the number of minutes of CGM operation shows the creation of particulates will only occur during a nominal 3-4 of the time the CGM is operating During RMCS the normal practice is to install the CGM turn it on when personnel enter a tank farm and keep the unit in constant operation for the remainder of the shift When the portable RMCS exhauster is used the exhauster is normally started at least an hour before RMCS is initiated and kept in operation until it is time to halt operations for the week The SX exhauster is kept in constant operation Comparing exhauster operating times from Tables F-l with CGM operating times from Table C-I it can be seen the CGMs are in operation about 3-15 of the time the RMCS exhauster is operating on a tank This time comparison wasnrsquot estimated for the SX exhauster since the SX exhauster is in constant operation
With CGM operation much longer than the time period when particulates could be generated the majority of particulates generated by RMCS should have settled or been exhausted during the CGM operating period Table C-3 shows the tank head space changeouts made by the exhauster during CGM operating periods ranged from 084 to 63 The average was 24 With the CGMs operating 25-33 times longer than the aerosol generation periods and an average of over two tank head space changeouts during CGM operation the large majority of aerosols generated during RMCS will have settled out or been removed by the exhauster by the time the CGM is shut off To account for particulates remaining in the tank head space after the CGM was turned off that are subsequently removed by an exhauster it was conservatively assumed that 20 of the total mass of particles generated during RMCS were not removed from the tank head space during the CGM operating period Therefore the product of the tank head space concentration and the volume of air sent to the exhauster during the time of CGM operation was multiplied by a factor of 125 (lOOl80) to estimate the total mass of waste sent to the exhauster as a result of RMCS This is shown below for the same SX-IO1 riser 19 data point in the above calculations
[48E-7gA3] [IOOmin] [I755 min] [125]= 11E-l gwastetoexhauster
This value was divided by the number of RMCS cores and RMCS segments from Table C-1 to provide the grams per core and grams per segment in Table C-4 as follows
[ I I E- 1 g waste to exhauster] i 1 core = 11 E-I g wastelRMCS core to exhauster
and
[ 1 I E- 1 g waste to exhauster] + 5 segments = 2 I E-2 g wastelRMCS segment to exhauster
All mass per core and mass per segment values were calculated in the same manner using a spreadsheet The results are provided in Table C-4 The weighted average mass per core and mass per segment in Table C-4 were calculated based upon the number of cores or segments obtained for each data point
Summary of Calculations
There were 34 valid CGM filter paper data points from 14 RMCS CGM sampling periods in eight tanks during which I5 RMCS cores and 79 RMCS segments were obtained Based upon CGM filter paper data the results indicate that
The average tank head space mass concentration during RMCS was 4OE-5 g wastem3 The average mass of suspended solids in the tank head space during RMCS was 97E-2 g waste The average mass sent to the exhauster during RMCS was 18E-1 g wastelRMCS core The average mass sent to the exhauster during RMCS was 34E-2 g wastelRMCS segment
c - 3
RPP-4826 Rev 1
Ignoring all CGM filter paper analytical data points with a variance gtloo will result in conservative results These data points indicate negligible radioactivity was present If a value of zero was assigned to each data point with an analytical error of gtloo instead of ignoring the data point the weighted average particulate quantities in Table C-4 would be reduced by about 12
The average tank head space mass concentrations based upon CGM data will be higher than the average tank head space mass concentrations based upon filter housing NDA or dose rate The RMCS exhauster received tank air from the shifts when sampling was performed and during some of the off-shifts when no sampling was done The CGMs were only operated during the shifts when sampling was performed The air concentration drawn into the CGM and the RMCS exhauster should be roughly the came during the operating shifts but somewhat less during the off-shifts Therefore the tank head space concentration will be higher when based upon CGM data This does not impact the mass of waste sent to the exhauster per core or per segment
c -4
I
- ~
RFP-4826 Rev 1
APPENDIX D
ESTIMATION OF Rh4CS EXHAUSTER HOUSING DECONTAMINATION FACTOR
D-0
RFrsquoP-4826 Rev 1
APPENDIX D - Estimation of RMCS Exhauster Housing Decontamination Factor
Summary of Method
This Appendix estimates a Decontamination Factor (DF) for the RMCS exhausters using housing NDA data and applicable stack record sample data The Csrdquorsquo in the exhauster effluent is divided by the C S rdquo ~ in the exhauster inlet to provide a penetration efficiency The reciprocal ofthe penetration efficiency is the DF
Description
Each RMCS exhauster has an isokinetic sampler located on the stack downstream of the blower and HEPA filters A small pomp pulls air from the exhaust stack into a filter paper at a rate proportional to the exhaust flow Radionuclides in the exhaust stream passing through the sample line are caught on the filter paper The stack operating time and flow rate are recorded When the record sample filter paper is removed the filter paper is analyzed in a laboratory for radionuclides The radionuclide concentration in the stack effluent stream is calculated by dividing the quantity of material on the filter paper by the volume of air through the sampler and then dividing again by a factor to compensate for stack sampler and filter paper efficiency
Multiplying the total beta stack effluent concentration by the total off gas flow gives the total beta emissions from the exhauster The total beta emissions are multiplied by the Csrdquorsquo to total beta ratio for the waste in the tank) being exhausted to give an estimate of the C S rdquo ~ emission The C S rdquo ~ on the filters determined by NDA of the housing (see Appendix A) is added to the C S rdquo ~ emissions to give the total C S rdquo ~ input to the filter housing Dividing the emissions by the input gives the filter housing penetration efficiency Subtracting the penetration efficiency from 1 O gives the filter housing efficiency Dividing 1 O by the penetration efficiency gives the DF
RMCS Stack Record Sample Data
RMCS exhauster stack record samples are taken after completion of each sampling event on a tank Normally this is after all cores on that tank have been obtained but for BY-IO5 in 1998 record samples were taken following each core Record samples are also taken at the end of each year All samples are analyzed for total alpha and total beta At the end of each year all the filter papers for that year are composited and analyzed for individual radionuclides Sample results are entered into the Automated Bar Coding of Air Samples at Hanford (ABCASH) and Environmental Release Summary (ERS) databases Several ofthe filter papers from 1998 were reanalyzed using a longer count time to bring the error rate down
Schofield 2000b compiled and evaluated all available RMCS exhauster stack record sample data filtered out the unusable data provided derivation for the stack sampling efficiency factor and summarized the results Most of the data points were so low as to be unusable since the results were either negative or had error variances gtloo
Column 5 of Table D-1 provides the stack effluent concentrations used for calculation of the filter housing DF The stack effluent data in Table D-l come from Schofield 2000b These values include a 073 sampling efficiency factor
Calculation of RMCS Filter Housing Decontamination Factor Based upon Housing Inlet and Outlet Data
The RMCS exhauster housing NDA and stack record sample data available for exhauster Operating Periods 4 5 and 6 were used to estimate an actual DF for the RMCS exhauster housings The housing NDA data is for CSrdquo~ but there are no usable Csrdquorsquo concentrations for the RMCS exhauster outlet The RMCS exhauster stack Csrsquordquo concentrations are either negative have a variance gtloo or are not available Total beta analyses are available however so the stack eftluent C S rdquo ~ concentrations were estimated by multiplying the total beta concentration by the ratio of Csrdquorsquo to total beta in the tank waste
Column 2 of Table D-l lists the increase in CSrsquo~ on the filters for each operating period as determined by NDA This data was obtained from Table A-2
D- 1
RPP-4826 Rev 1
Column 4 of Table D-l lists the stack exhaust volume for each stack record sample period The stack exhaust volume for the exhauster installation on S-l IO was calculated by
[ZOO std ft3min][15978 hrs] [60 minhr] = 199E+6 std ftrsquo
All other stack volumes in Table D-l were calculated the same way Unlike in Appendices A B and C no adjustment was made to change the 200 scfm to actual cfm This is because the RMCS stack record sample concentrations from Table D-3 are based upon a 200 scfm flow rate rather than the actual flow rate Since the concentrations are on the same basis as the flow rate there is no need to correct to acfm
The total beta emissions for the RMCS exhauster stack were calculated by multiplying the volume by the concentration For the same S-l IO data point
[199E+6 ft3] [18E-15 pCiml] [28317mlft3] [mCi1000 pCi] = 1OE-7 mCi total beta
All other total beta emissions in Table D-l were calculated the same way
The Csrdquorsquo to total beta ratio was calculated from data in Table E-I For the same S- l I O data point
326E+5 Ci CsI3rsquo f I 14E+6 Ci total beta = 029 Ci CslhCi total beta = 029 rnCi CsrdquorsquomCi total beta
The Csrsquordquo emission for the same S-l IO data point was thus
[I OE-7 mCi total beta] [029 mCi CsrdquorsquomCi total beta] = 29E-8 mCi Csrdquorsquo
All Csrsquordquo emissions in Table D-l were calculated in the same manner
The penetration efficiency for each operating period was calculated by dividing the exhauster outlet by the filter inlet Csrdquorsquo quantities For operating period 4 this was
[81E-6 mCi] f [5OE-I + 8IE-6 mCi] = 16E-5 = 16E-3
The DF for operating period 4 is
1 + 16E-5 = 62E+4
The overall DF for periods 4 5 and 6 was calculated by dividing the efluent from all three periods by the total filter input
[95E-6 mCi] f [67E-I t 95E-6 mCi] = 14E-5 = 14E-3 penetration efficiency
I - I 4E-5 = 0999986 = 999986 filter efficiency
1 f 14E-5 = 73E+4 decontamination factor based upon housing inlet and eftluent data
Estimation of Housing Decontamination Factor Based upon General Performance Data
HEPA filters are tested at the manufacturer to a minimum 9997 efficiency using a 03 pm monodisperse aerosol After installation HEPA filters are tested in-place per ASME N5 I O to a minimum 9995 efficiency using a polydisperse aerosol with an approximate droplet size distribution of 99 less than 30 pm 50 less than 07 pm and 10 less than 04 pm The RMCS exhauster housing is tested per ASME N510 and is thus required to have a minimum removal eficiency of 9995 for an aerosol with this approximate size distribution The particle size distribution of the waste aerosols generated by RMCS is unknown but it is assumed that the removal efficiency for RMCS generated aerosols was the same as the removal efficiency for the ASME generated test aerosol
D-2
RPP-4826 Rev I
A 9995 efficiency is equivalent to a DF of 2E+3 while a 9997 efficiency is equivalent to a DF of 33E+3 The actual DF for the RMCS exhauster housing is higher than either of these It has two HEPA filters in series even though the minimum efficiency specified in the NOCs for the RMCS exhausters is only equivalent to one HEPA ERDA 1976 recommends using a DF of 3000rdquo for a filter bank where n is the number of HEPA filters in series This would result in a DF of 9E+6 for the RMCS exhauster housing This is unrealistic Using a DF of 9E+6 will calculate to Csrdquorsquo quantities on the HEPA filtersthat are orders of magnitude above what have been shown to be there based upon the measured dose rates and NDA A DF of 9E+6 would mean the dose rate would have to be almost 100 mRhr at the side of the exhauster housing instead of the 05-08 mRhr dose rates encountered The waste particles will not have the same particle size distribution entering the second HEPA filter as when entering the first The majority of the waste particles will be captured on the I rdquo HEPA filter and although the DF for each HEPA if tested individually using the ASME N5 IO aerosol test method may be 3E+3 (or higher) the overall DF of the two filters in series will not be 3000lsquo This is because the particle size distribution entering the Znd HEPA could have a greater percentage of smaller particles than that entering the 1rdquo
NUREG 1995 included an evaluation of a number of different facility stacks at the Hanford site where the HEPA filter upstream air concentrations were estimated using several different methods This report concluded that back-calculation using a value of 3000rdquo overestimated the upstream radionuclide concentration by three to four orders of magnitude when compared to filter NDA data for the nine stacks for which NDA data were obtained and by three orders of magnitude for the two stacks for which upstream air sample data were available Back- calculation using a value of 3000rdquo was shown to be high by four orders of magnitude for the single stack for which a powder release estimate was available Based upon this information the RMCS exhauster dual filter-in-series housings would have a DF of at least three and maybe four orders of magnitude less than 9E+6 or in the 1E+3 to 1 E+4 range A DF of IE+3 would he less than the minimum permissible under the NOC Comparing the older stack data and design with the newer RMCS exhauster design the minimum DF would be expected to be at least 1E+4
Table D-2 provides the available RMCS exhauster aerosol test data This information was obtained from Waldo 1999 Prior to 1998 the RMCS exhauster primary HEPA filter efficiency and either the secondaly HEPA filter or the overall efficiency for both filters were tested Starting in 1998 only the primary and secondary HEPA filter efficiency were measured The overall efficiency of the two filters in series was only measured three times in 11 setups Twice the overall penetration efficiency was lt0002 and the remaining time the only information that could be found was a value of lt005 Most individual filters had a penetration efficiency of 0002 This appears to be about the limit of the detection equipment Based upon Table D-2 data a penetration efficiency of 0002 (99998 efficiency) is normal for a single HEPA and thus a minimum for an RMCS exhauster housing Assuming a 0002 penetration efficiency for the two filters combined calculates to a DF of 5E+4 (equal to 1 +
000002) for the RMCS exhauster housing
In summary the measured DF for the RMCS exhauster housings over the period from May 1998 through June 1999 was about 73E+4 RMCS aerosol testing prior to use indicates a DF of about 5OE+4 for each of the filters separately but their overall efficiency is not measured Referenced data based on older stacks at Hanford indicate the two HEPA RMCS exhauster housing would likely have a DF of at least IE+4
Estimated Aerosol Levels During RMCS Based Upon RMCS Stack Record Sample Data
Revision 0 of this document used the positive record sample results with variance less than 100 to estimate aerosol concentrations in the exhauster inlet using an assumed exhauster housing DF of 5OE+4 This method of estimating aerosols was eliminated from Revision 1 because the stack concentrations were either too low too scattered or too questionable to provide reliable results There were 112 RMCS stack record sample data points evaluated in Schofield 2000b Excluding the total beta sample results used for estimation of the housing DF there were only ten data points remaining with positive values and variances ltloo the remaining data points were either negative had a variance gtloo or the results were not available
For comparison purposes only Schofield 2000b applied the DF of 73E+4 calculated in this document to the data points not used to calculate the exhauster housing DF to estimate aerosol concentrations upstream of the filters The results showed aerosol levels approximately the same as those estimated using NDA dose rate or CGM filter paper data when a value of zero was used for negative sample results or those with a variance gtloo When only
D-3
RPP-4826 Rev 1
the ten positive results with a variance ltloo were used the aerosol levels calculated to be two to five times higher than those estimated using NDA dose rate or CGM filter paper data Because of the variability of data resulting from the extremely low record sample concentrations and the few useable data points estimation of aerosol levels using record sample data was not included in Revision I See Schofield 2000b for further discussion of the use of record sample data to estimate aerosol levels
Summary of Calculations
A total of nine RMCS exhauster stack record sample data points were used to estimate the RMCS exhauster filter housing decontamination factor These data points were obtained when sampling on five tanks during which 10 RMCS cores and 65 RMCS segments were obtained The overall decontamination factor was 73E+4
Estimation of aerosol generation quantities based upon RMCS stack record sample data is possible However results will likely be skewed high if data points that show non-detectable levels of radionuclides present are ignored instead of using a value of zero for the data point
D-4
RPP-4826 Rev 1
APPENDIX E
TANK WASTE RADIONUCLIDE CONCENTRATIONS USED FOR AEROSOL CALCULATIONS
E-0
RPP-4826 Rev 1
APPENDIX E - Tank Waste Radionuclide Concentrations Used for Aerosol Calculations
The RMCS exhauster NDA data HEPA filter dose rate data CGM filter paper data and stack record sample data provide information on the quantity of radionuclides on the exhauster filters in the tank head space or the exhauster stack during RMCS These radioactivity quantities need to be divided by the waste radionuclide concentration specific activity to determine the mass of waste in the tank head space and in the tank gases sent to the exhauster
The mass quantities in this document were calculated using dry basis radionuclide concentrations Waste particles carried into the tank head space by the purge gas could be wet or dry If wet some of the non-chemically bound water will start to evaporate immediately providing the tank relative humidity is 400 The water present in a waste particle may be chemically bound as a hydrate or free The chemically bound water will not readily evaporate therefore even a ldquodryrdquo particle may have some water associated with it It is impractical to measure the actual water content of the waste particulates caught on the CGM filter paper the exhauster HEPA filters or the stack record sample paper Since the quantity of water in the waste particulates is unknown particulate levels were calculated using dry basis radionuclide concentrations Thus all particulate values given in this document are stated on a dry basis
The waste radionuclide concentrations on a dry basis were calculated from data available in the Tank Waste Information Network System (TWINS) The Best Basis InventorylBest Basis Summary numbers were used These values are the most complete and up to date readily available estimates for Hanford waste tank contents but do not include water The information was downloaded from TWINS into a spreadsheet The total chemical total beta and total alpha quantities were summed in the spreadsheet for all the tanks which were sampled and concentrations for Csrdquorsquo Sr9rsquo total beta and total alpha automatically calculated in pCig These concentrations are provided in Table E-I Because lab techniques for measuring gross beta levels only detect beta particles with a minimum decay energy above 150-200 kev only radionuclides with a decay energy of gt-200 kev were included in the total beta numbers
The TWINS radionuclide concentrations were obtained in December 1999 No corrections were made for decay for this document
The CGM filter paper and stack record sample data indicate the measured radionuclide values are not always in the same ratio to each other as given by TWINS nor are all radionuclides detected that TWINS indicates are present Radionuclides can be distributed unevenly in a tank Soluble fission products (primarily Csrsquordquo) are found in the liquid saltcake and in sludges Insoluble fission products and actinides are found largely in sludges as these are primarily chemical precipitates Sludge could be mixed with saltcake be present in a distinct layer at the bottom of a tank or in several layers in the tank depending upon how waste was transferred into a tank Waste particles may thus not have the same specific activity on a microscopic scale as they would have on a macro scale were the tank contents homogenized During RMCS a top to bottom core sample is attempted resulting in the drill bit and purge gas (which causes aerosols to form) passing through most ofthe waste matrix Assuming the aerosol generation rate is approximately constant during drilling the specific activity of a radionuclide in the suspended solids should be roughly the same as the average specific activity of the same radionuclide in the tank waste While the waste specific activity is probably not homogeneous from top to bottom in a tank and the aerosol generation rate will likely also vary it is beyond the scope of this document to provide an in-depth analysis of all the factors affecting aerosol radionuclide concentration Although sample radionuclide data were not always in the same ratio as provided by TWINS for the purpose of this document the simplifying assumption was made that the average tank specific activity is adequate to provide an approximation of the suspended solids specific activity for all radionuclides Average tank individual radionuclide specific activities were used in the preparation of the exhauster NOCs
The aerosol calculations presented in this document are only as accurate as the TWINS data The combined radionuclide content of all Hanford waste tanks is known fairly well since the overall content is based upon reactor production records CsrdquorsquoSrW recovery data and processing plant discharges Thus TWINS data for all tanks combined should be reasonable There are undoubtedly differences between TWINS data and the actual contents of a specific tank While the specific tank radionuclide data from TWINS used in this document may not be exact deviations from the actual concentrations are assumed to balance out over the number of tanks sampled
E- 1
RPP-4826 Rev 1
APPENDIX F
ROTARY MODE CORE SAMPLING EXHAUSTER AND CORE SAMPLE DATA
F-0
RPP-4826 Rev 1
APPENDIX F - Rotary Mode Core Sampling Exhauster and Core Sample Data
This appendix provides the basic data obtained during RMCS operations which was used in preparation of this document
Basic Operational Data
There have been three RMCS exhausters and three RMCS sampling trucks deployed since starmp of nitrogen- purged RMCS in November 1994 The exhausters are formally designated 296-P-32296-P-33 and 296-P-34 These were originally referred to as parts of RMCS Systems 2 3 and 4 respectively in the Notices of Construction (NOC) for these units The exhauster designations were changed for routine field use in 1996 to exhausters A B and C to avoid confusion with core sampling trucks 23 and 4 since any exhauster could be used with any RMCS truck Exhauster A (2) and RMCS Truck2 have not been used for RMCS since 1995 and are no longer in service for core sampling
Rotary mode core sampling has been conducted in four general time frames since 1994 These time frames were separated by down times for equipment modifications or resolution of environmental permitting and safety concerns For ease of analysis in this document exhauster operations were organized into six distinct operating periods Periods I to 6 were grouped based upon times when the same exhauster and same set of HEPA filters were being used These periods thus overlap with the general operating time frames The four operating time frames were
The first time frame lasted from November 1994 to January 1995 RMCS Truck 2 and Exhauster 2 (A) were used on Tank BY-106 along with an in-tank prefilter This tank provided the initial deployment and testing of the nitrogen-purged equipment in a waste tank During this period radiation dose rates were taken at the side of the exhauster housing Stack record samples were taken in December 1994 and January 1995
The second time frame lasted from July 1995 through October 1995 RMCS Trucks 2 and 4 were used with Exhausters 2 and 3 (A and B) on BY-105 BY-IO8 and BY-I IO During this period radiation dose rates were taken at the sides of the exhauster housings Stack record samples were taken after completion of sampling on each tank No RMCS samples were taken from BY-108 all samples were taken in push mode for this tank
The third time frame began when RMCS was restarted in December 1997 Trucks 3 and 4 were used for sampling of SX-101 SX-103 SX-105 and SX-102 with the SX tank farm exhauster providing ventilation The RMCS exhausters were not used During this period radiation dose rates were taken at the sides of the SX exhauster housing as part of HPT routine surveys SX farm exhauster stack record samples were taken when required by normal operating procedures SX record sampler and filter housing dose rate data were not evaluated for this document It would not be practical using filter dose rate or stack record sample data to estimate the RMCS aerosol addition if any to the SX ventilation system The background radiation around the SX filter housing makes measurement of any small increase in dose rate very difficult to detect The number of tanks being ventilated and the involved off-gas header routings (the exhauster is pulling on thirteen tanks in series or in parallel with the tank being sampled) and any in-tank activities in the SX tanks not being sampled would make it impractical to assess what aerosols resulted from RMCS Beginning with RMCS in SX farm radionuclide analyses were performed on the filter papers protecting the CGMs which draw air out of the tank vapor space for flammable gas detection
The fourth time frame began in May 1998 Between 1095 and 598 Exhausters B and C were extensively modified with new filter housings and other equipment to meet new NOC requirements Trucks 3 and 4 were used with Exhausters B and C (3 and 4) on S-l IO U-107 BY-105 TX-113 and TX-I 18 This period marked the first use ofthe RMCS trucks and RMCS exhausters together following resolution of flammable gas concerns and modifications to the exhausters New filters were installed Radiation dose rates were taken at the sides of the exhauster housings Stack record samples
F- 1
RPP-4826 Rev I
were taken after completion of sampling for each exhauster installation Radionuclide analyses were performed on the CGM filter papers for all tanks except TX-118 An NDA was performed on the Exhauster C housing following completion ofthe first core on TX-I 13 The housing filters when assayed contained aerosols captured by the exhauster following RMCS in S-l IO U-107 BY-105 (1998) and the first core of TX-I 13 Another NDA was performed on Exhauster C following both cores in TX-I 18 An NDA was performed following sampling of the second core in TX-I 13 using Exhauster B The time frame ran through early June 1999 No RMCS samples have been taken after June 1999 nor are any planned for the next few years
For the purposes of evaluating aerosol formation based upon RMCS exhauster housing NDA and dose rate data the exhauster operations were grouped into 6 operating periods These periods are shown in Table F-1 and restated in Tables A-I and B-I All tanks sampled in Periods 1 2 4 5 and 6 were exhausted by the same exhauster with the same housing and filters present during that period Period 3 covered the time the SX exhauster was used during RMCS in SX farm
A brief description of each RMCS tank sampling operation is provided below
Tank 241-BY-1061194 to 1294 RMCS using the nitrogen purge gas system with an exhauster was formally begun on 111794 on tank BY-106 riser IOB Exhauster 2 (A)and Truck 2 were used A sintered metal prefilter was inserted in the riser between the tank and the exhauster A total of eight segments were taken in rotary mode and five segments in push mode until sampling was halted on 122194 One RMCS core was obtained The total exhauster run time was 4878 hours The stack record sample was removed and analyzed following this run period Dose rates taken at the side of the exhauster housing during RMCS were all lt05 mRhr The in-tank prefilter was smeared for contamination when removed from the tank with the smears showing less than detectable levels of radionuclides present (Waldo 1999) The prefilter had been washed with an installed spray system prior to removal from the tank but subsequent testing showed the water flow and pressure were too low to have been effective at removing contamination
Tank 241-BY-106195 Following some process modifications RMCS in BY-IO6 riser IOB began again on 11895 Exhauster 2 (A) and Truck 2 were used The sintered metal prefilter was inserted in the riser between the tank and the exhauster RMCS was halted on 12495 over authorization basis and equipment operability issues for RMCS A total of three segments were taken in rotary mode and eleven segments in push mode One RMCS core was obtained The total exhauster run time was 1867 hours The stack record sample was removed and analyzed following this run period Dose rates taken at the side of the exhauster housing during RMCS were all lt O S mRhr The in-tank prefilter was smeared for contamination when removed from the tank with the smears showing less than detectable levels of radionuclides present (Waldo 1999) The prefilter was not washed this time
Tank 241-BY-110795 to 1095 Following resolution of RMCS authorization basis and equipment issues and completion of the fabrication and testing of Trucks 3 and 4 RMCS was begun in BY-I IO on 71195 Exhauster 2 (A) and Truck 2 were used Samples were taken from risers 128 7 128 again and 4 There was no in- tank prefilter used in this or any subsequent RMCS periods Sampling was performed until 102595 when RMCS was halted over flammable gas issues A total of 13 RMCS segments and 56 PMCS segments were taken Three RMCS cores were obtained The total exhauster run time was 1125 hours The stack record sample was removed and analyzed following this run period Dose rates taken at the side of the exhauster housing during RMCS were all lt O S mRhr
Tank 241-BY-108795 to 895 Core sampling was begun in BY-IO8 on 72595 Exhauster 3 (B) and Truck 4 were used Sampling was done in risers 12A and 7 The tank material proved soft enough so that no RMCS segments were required all segments were obtained in push mode although the exhauster was operated during part of the time sampling was performed Sampling was completed 81895 A total of 16 PMCS segments were taken The total exhauster run time was 6617 hours The stack record sample was removed and
F-2
RPP-4826 Rev 1
analyzed following this run period Dose rates taken at the side of the exhauster housing during RMCS were all lt05 mRhr
Tank 241-BY-105895 to 1095 RMCS was begun in BY-I05 riser 12A on 83095 Exhauster 3 (B) and Truck 4 were used This tank has a concrete layer on top about 12-18 inches thick which had to be drilled through Part way through sampling questions arose as to the flammable gas status of the tank and RMCS was halted on 10695 A total of 3 RMCS and 7 PMCS segments were taken One RMCS core was obtained The total exhauster run time was 4413 hours The stack record sample was removed and analyzed following this run period Dose rates taken at the side of the exhauster housing during RMCS were all lt05 mRhr
Tank 241-SX-1011297 to 298 Following resolution of extensive regulatory and authorization basis issues and installation of equipment modifications RMCS started in SX-101 with Truck 4 on 12497 An RMCS exhauster was not used since all SX farm tanks excluding SX-113 and SX-I 15 are ventilated with the SX exhauster Sampling was performed in risers 19 and 4 and was completed on 21098 A total of 9 RMCS and 6 PMCS segments were taken Two RMCS cores were obtained SX exhauster stack record samples and filter housing dose rates were obtained as part of routine operations for the SX exhauster not as part of the RMCS process Filter papers used in the suction line for the CGM were saved and analyzed in the laboratory to estimate the airborne radionuclide concentration in the tank head space Two CGM filter papers were needed for each core as moisture in the tank vapors condensed on the papers in the cold weather and began to restrict tank gas flow to the CGM
Tank 241-SX-103498 to 598 RMCS started in SX-103 with Truck 4 on 42798 The SX exhauster was used for ventilation (see SX- 101 above) Sampling was performed in risers 7 and 1 1 and was completed on 51198 A total of 6 RMCS and 18 PMCS segments were taken Two RMCS cores were obtained During sampling filter papers used in the suction line for the CGM were saved and analyzed in the laboratory to estimate the airborne radionuclide concentration in the tank head space One CGM filter paper was used during each core SX exhauster stack record samples and filter housing dose rates were obtained as part of routine operations for the SX exhauster not as part of the RMCS process
Tank 241-SX-105298 to 598 RMCS started in SX-105 with Truck 3 on 22598 The SX exhauster was used for ventilation (see SX- 101 above) Sampling was performed in risers 6 and 14 and was completed on 51598 A total of 6 RMCS and 20 PMCS segments were taken Two RMCS cores were obtained During sampling filter papers used in the suction line for the CGM were saved and analyzed in the laboratory to estimate the airborne radionuclide concentration in the tank head space Two filter papers were needed for the first core as moisture in the tank vapors condensed on the papers in the cold weather and began to restrict tank gas flow to the CGM One filter paper was used for the second core SX exhauster stack record samples and filter housing dose rates were obtained as part of routine operations for the SX exhauster not as part of the RMCS process
Tank 241-SX-102698 to 798 RMCS started in SX-102 with Truck 4 on 61798 The SX exhauster was used for ventilation (see SX- 101 above) Sampling was performed in risers 8 and 4 and was completed on 7798 A total of 2 RMCS and I8 PMCS segments were taken Two RMCS cores were obtained During sampling filter papers used in the suction line for the CGM were saved and analyzed in the laboratory to estimate the airborne radionuclide concentration in the tank head space One filter paper was used for each core SX exhauster stack record samples and filter housing dose rates were obtained as part of routine operations for the SX exhauster not as part of the RMCS process
Tank 241-S-110598 to 698 RMCS was begun in S-I10 on 51898 Exhauster C (4) and Truck 3 were used This tank marked the first use of an RMCS exhauster since 1995 Sampling was completed on 6498 Risers 6 and 14 were sampled A total of IO RMCS and 8 PMCS segments were taken Two RMCS cores were obtained The
F-3
RPP-4826 Rev I
total exhauster run time was 15978 hours The stack record sample was removed and analyzed following this run period Dose rates taken at the side of the exhauster housing during RMCS were all lt05 mRhr During sampling filter papers used in the suction line for the CGM were saved and analyzed in the laboratory to estimate the airborne radionuclide concentration in the tank head space One filter paper was used for each core Waste particles retained on the exhauster housing filters were part of the inventory subsequently measured by NDA following completion of the first core in TX-I 13
Tank 241-U-107698 to 798 RMCS was begun in U-107 on 61098 Exhauster C and Trucks 3 and 4 were used Sampling was completed on 71598 Risers 7 and 2 were sampled A total of IO RMCS and 19 PMCS segments were taken Two RMCS cores were obtained The total exhauster run time was 27385 hours The stack record sample was removed and analyzed following this run period Dose rates taken at the side of the exhauster housing during RMCS were all 105 mRihr During sampling filter papers used in the suction line for the CGM were saved and analyzed in the laboratory to estimate the airborne radionuclide concentration in the tank head space One filter paper was used for each core Waste particles retained on the exhauster housing filters were part of the inventory subsequently measured by NDA following completion of the first core in TX-I 13
Tank 24l-BY-105798 to 898 RMCS was begun in BY-105 again on 72298 Exhauster C and Trucks 3 and 4 were used Sampling was completed on 82598 Risers 7 and 1 1 B were sampled A total of 18 RMCS and 18 PMCS segments were taken The material was hard enough to require rotary mode sampling all the way to the bottom of the waste but negligible recovery was obtained After RMCS was performed to the waste bottom a PMCS core was taken in the same hole to recover material Two RMCS cores were obtained The exhauster run time was 13577 hours for the first RMCS core and 30792 hours for the second RMCS core Stack record sample information in ABCASH shows 30558 hours operation for the second core but the sampler data sheet shows the time counter was mistakenly reset 234 hours into the run No correction was made to the BY-IO5 2nd core record sample concentration for this document since the error is conservative and results in only slightly higher (ltI) record sample radionuclide concentrations for this core A stack record sample was removed and analyzed following each core giving two record samples for BY-IO5 in 1998 Dose rates taken at the side of the exhauster housing during RMCS were almost all lt05 m R h but a few readings indicated 07 mRihr This variation was assumed due to personnel reading the instrument differently or the fact that the exhauster had been used on enough tanks that by now there was sufficient activity on the filters to cause readings approximately at the background detection level The final reading when both cores were completed was lt05 m R h During sampling filter papers used in the suction line for the CGM were saved and analyzed in the laboratory to estimate the airborne radionuclide concentration in the tank head space One filter paper was used for each core Waste particles retained on the exhauster housing filters were part of the inventory subsequently measured by NDA following completion of the first core in TX-113
Tank 241-TX-113998 to 599 Core sampling was begun in TX-I 13 riser 3 on 92298 Exhauster B (3) and Truck 4 were used at the start This was the first use of Exhauster B since it was modified Exhauster B ran for a total of 8738 hours until being disconnected on 102398 During this time two PMCS segments were taken and no RMCS segments Exhauster C was then installed and operated for 5598 hours from 121098 to 122898 No RMCS or PMCS sampling was performed during this time frame RMCS segments werent taken until 299 Exhauster C ran for a 30230 hours between 122898 and 21299 Sampling was completed on the core from riser 3 on 21299 A total of 12 RMCS segments were obtained during the time Exhauster C was operating Exhauster flow rate for both exhausters was a nominal 200 scfm Stack record samples were taken following Exhauster B removal at the end of 1998 for Exhauster C and following completion ofthe first core with Exhauster C Aerosol calculations were based on only the 30230 hours run time for Exhauster C in 1999 since this was the time period during which RMCS segments were obtained Dose rates taken at the side of the exhauster housing during the short PMCS only sampling period with Exhauster B were all ltOS m R h Dose rates with Exhauster C varied between lt O S mRhr and 07 mRhr The final reading on Exhauster C following completion of the first core was 07 mFUhr During sampling filter papers used in the suction line for the CGM were saved and
F-4
RPP-4826 Rev I
analyzed in the laboratory to estimate the airborne radionuclide concentration in the tank head space One filter paper was used for the core Waste particles retained on the exhauster housing filters were part of the inventory subsequently measured by NDA following completion of this core
Sampling in riser 5 was begun on 41299 using Exhauster B and Truck 3 A total of 6 RMCS and 1 PMCS segments were taken for this core before sampling was halted on 42899 The total exhauster run time for this core was 11712 hours Problems with high vacuum in the tank required the exhauster flow rate to be reduced to 190 scfm to keep the system within pressure limits The stack record sample for the second core was removed and analyzed following the run period Dose rates taken at the side of the exhauster housing during the second core were all lt05 m M r During sampling filter papers used in the suction line for the CGM were saved and analyzed in the laboratory to estimate the airborne radionuclide concentration in the tank head space One filter paper was used An NDA was performed on the exhauster housing following this core The only radionuclides present in the housing were those from this core or what was removed from the tank head space during the non-RMCS activities in this tank from 92298 and 102398
Some clarification may be needed to explain use of the exhauster operating times and NDA dose rate and record sample data obtained during core sampling on TX-I 13 Core sampling was set up for sampling riser 3 on TX-113 in September 1998 with Exhauster B Exhauster B operated for a total of 8738 hours between 92298 and 102298 The stack record sample was removed at the end of this period The ERS database incorrectly shows the exhauster operated between 111698 and 111998 The ABCASH database shows the stack record sample was removed on 111998 The stack record sample showed positive emuent concentrations during this time period with variances 400 No RMCS samples were taken during this period so the data and time werenrsquot included when calculating RMCS aerosol numbers Exhauster B was removed and Exhauster C installed in late November-early December Exhauster C was operated for a total of 5559 hours between 121098 and 122398 The stack record sample was removed on 122898 No sampling was performed during this period so the data and time werenrsquot included when calculating RMCS aerosol numbers Exhauster C was operated for a total of 30218 hours between 122898 and 2899 All the RMCS segments from riser 3 were taken in this time period so only the data and time for this period were included when calculating RMCS aerosol numbers Exhauster B was used during sampling of riser 5 Exhauster B operated for a total of 11712 hours between 41299 and 42899
Tank 241-TX-l18599 to 699 RMCS was begun in TX-I 18 on 5699 Exhauster C (4) and Truck 4 were used Sampling was completed on 6298 Risers 9B and 12B were sampled A total of 9 RMCS segments were taken there were no PMCS segments Two RMCS cores were obtained The total exhauster run time was 21247 hours The stack record sample was removed and analyzed following this run period The maximum dose rate taken at the side of the exhauster housing following RMCS was 08 m M r CGM filter papers were not analyzed An NDA was performed on the exhauster housing following completion of the two cores The exhauster housing contained the same nuclides as for the first NDA (S-110 U-107 BY-105 and TX-I 13 first core) plus those from TX-I 18
The basic core sampling operational data used in this document includes the number of RMCS cores and segments the exhauster run times and flow rates the RMCS exhauster HEPA filter dose rates and tank vapor space temperatures Table F-l lists the basic operational data This information excluding tank vapor space temperature data was obtained from procedural data sheets in the sampling work packages (References W - 1 to WP-23)
Tank temperature data for the tanks ventilated with the RMCS exhausters was obtained from the TWINS database Plots for each tank were prepared for the time RMCS was conducted and the average value of the highest thermocouple located in the tank (the lowest temperature reading) was estimated and used as the average tank head space temperature during the RMCS period
The SX exhauster flow rates listed in Table F-l are estimates only The combined flow rate for SX-IO1 through SX-106 plus SX-109 (7 tanks) averaged 440 cfm during CY 1996 (Kaiser 1997) for an average of 63 cfm per
F-5
RPP-4826 Rev I
tank Based upon inlet flow measurements at the tank inlet HEPA filters (Fanis 1998) the flow through each individual tank (SX-IO1 through SX-106 plus SX-109) was lt55 cfm at the breather filter Assuming an exhaust flow of 100 cfm for each SX farm tank sampled is therefore conservative
Calculated Data
Calculated data include the tank head space volumes conversion of the RMCS exhauster flow rate from scfm to acfm and the number of tank head space changeouts made by an exhauster during RMCS
Tank head space volume includes the dome space volume above the top of the sidewall plus the void space between the waste surface and the top of the sidewall The formula used to calculate tank head space volumes WN
Head Space Volume in A = (DS + [(H) (12) + HI + Hb - H] (V)) - 748
Where DS = dome space volume gal H = height of tank body sidewall above knuckle A HI = height of tank knuckle area in Hb = height oftank bottom below knuckle in H = height of waste in tank in V =27555 galin of waste in SX tanks 2754 gallin in all others
The tank dome space volumes height of tank sidewall above the knuckle height of tank knuckle area and height of tank bottom below the knuckle were obtained from Reynolds 1999 The height of waste in each tank at the time of core sampling was obtained from the TWINS database Tank dimensional and waste level data are given in Table F-2 along with the calculated tank head space volumes
Aerosol calculations for Appendices A-C require exhauster flow rates in actual cubic feet per minute The RMCS exhauster flow rate is controlled and recorded in standard cubic feet per minute The mass flow rate of the exhauster air is measured and internal logic in the exhauster controller calculates what the volumetric flow rate would be if the temperature and pressure in the exhauster inlet were at standard conditions The standard conditions used in the logic controller are 29921 in Hg (760 mm Hg) and 69F (ZIT)
A correction factor is built into the exhauster control logic that assumes an atmospheric pressure of 2927 in Hg the average atmospheric pressure at Hanford The RMCS exhauster will operate at about 1-2 in H20 negative pressure resulting in about a 2916 in Hg pressure in a waste tank when the RMCS exhauster is operating To revise the indicated scfm RMCS exhauster reading to an acfm value the RMCS exhauster scfm flaw rate was multiplied by (29922916)(T+459)528 where Tis the tank head space temperature in OF The tank head space temperatures in Table F-1 were input to the spreadsheet file used for aerosol calculations and converted to acfm The flow rates in acfm are included in Table F-I
The tank head space changeouts when using the RMCS exhauster were calculated by multiplying the exhauster acfm flow rate by the time of exhauster operation and dividing the result by the tank head space volume Tank head space changeouts are listed in Table F-2
F-6
c
gt 2
RPP-4826 Rev 1
APPENDIX G
REFERENCES
G-0
RPP-4826 Rev 1
APPENDIX G - References
Diedeker 1999 NDA of RMCS HEPA Filters L P Diedeker WMH E-Mail to JS Schofield CHG November 29 I999
ERDA 1976 Nuclear Air Cleaning Handbook ERDA 76-21 Buchsted C A Fuller A B and Kahn 1 E Oak Ridge National Laboratory 1976
Farris 1998 Internal Note T R Farris LMHC to J S Schofield LMHC Breather Filter Flow Rates for SX-Farm 31698
Foust 1999 Internal Memo RMCST Exhauster HEPA Filter Dose Rate Calculations D J Foust LMHC to J S Schofield LMHC October 25 1999
Greager 1999 Correspondence No WMH-9954450 Non-Destructive Analysis of the Rotay Mode Core Sample High-Efjiciency Particulate Air Filters E M Greager WMH to P C Miller LMHC June 28 1999 [Transmittal of HNF-4199 Resultsfram NDA Measurement of the 296-P-34 RMCS HEPA Filters]
HNF 1999 HNF-SD-WM-SAR-067 Tank Waste Remediation System Final Safety Analysis Report Rev 1 The revision incorporating RMCS accident analyses was submitted as Addendum 5 to DOE as a change to the FSAR predecessor the Basis for Interim Operation (BIO) LMHC-9857075 80232764-9-KOOl Submittal of Authorization Basis Amendment Package for Rotay and Push Mode Core Sampling in Satisfaction of Perfarmance Agreement TWR 122 Expectations I and 3 D 1 Allen LMHC to A M Umek FDH August 30 1998 Addendum 5 as of mid-January 2000 is waiting for approval by DOE
Kaiser 1997 T D Kaiser LMHC E-Mail to J S Schofield LMHC SX Tank Flow Data 42197
NUREG 1995 Potential Radionuclide Emissionsfrom Stacks on the HanfordSite Part I Dose Assessment Davis W E and Barnett J M Westinghouse Hanford Company from Proceedings of the 23 DOEMRC Nuclear Air Cleaning Conference held July 25-28 1994 February 1995
Schofield 2000a Letter 74910-00-002 Use of Microshield Calculations for RMCS Exhauster Housing for Estimating Radionuclide Quantities on the Filters Using NDA and Dose Rate Measurements I S Schofield CHG to File January 62000
Schofield 2000b Letter 74910-00-003 Rev I RMCS Exhauster Stack RecordSample Data J S Schofield CHG to File January 202000
Reynolds 1999 D R Reynolds LMHC E-Mail to I S Schofield LMHC transmitting Tank Volume Calculations draft of calculations done by Mike Plesha and Reed Hendershot data to be used for RESOLVE computer program for Hanford waste tanks August 3 1999
TWINS Tank Waste Information Network System database available at httptwinspnlgovSOO lhtbinTCDgetTableListexe
Waldo 1999 letter 74910-99-009 RMCS Exhauster Aerosol Test Data E I Waldo to J S Schofield June 22 1999
WHC 1993 WHC-SD-WM-ES-225 Rev I AerosolStudy for the Rotary Mode Exhauster P M Francis Westinghouse Hanford Company April 20 1993
WHC 1997 WHC-SD-WM-SAD-035 Rev Ob A Safety Assessment of Rotary Mode Core Sampling in Flammable Gas Single Shell Tanks Hanford Site Richland Washington August 8 1997
G- I
RPP-4826 Rev I
CGM Data CGM-I Letter PARTICULATE SAMPLING OF 241-SX-IO1 DURING ROTARY MODE CORE SAMPLING D C
Langlois E2 Consulting Engineers to J S Schofield Lockheed Martin Hanford Company March 16 1998
CGM-2 Letter PARTICULATE SAMPLING OF 241-SX-I05 DURING ROTARY MODE CORE SAMPLING D C Langlois E2 Consulting Engineers to J S Schofield Lockheed Martin Hanford Company June 9 1998
CGM-3 Letter PARTICULATE SAMPLING OF 241-SX-103 DURING ROTARY MODE CORE SAMPLING D C Langlois E2 Consulting Engineers to J S Schofield Lockheed Martin Hanford Company June 12 1998
CGM-4 Letter PARTICULATE SAMPLING OF 241-S-110 DURING ROTARYMODE CORESAMPLING D C Langlois E2 Consulting Engineers to J S Schofield Lockheed Martin Hanford Company July 20 1998
CGM-5 Letter PARTICULATE SAMPLING OF 241-SX-102 DURING ROTARY MODE CORE SAMPLING D C Langlois E2 Consulting Engineers to J S Schofield Lockheed Martin Hanford Company July 22 1998
CGM-6 Letter PARTICULATE SAMPLING OF241-U-107 DURING ROTARY MODE CORE SAMPLING D C Langlois E2 Consulting Engineers to J S Schofield Lockheed Martin Hanford Company August 3 1998
CGM-7 Letter PARTICULATE SAMPLING OF 241-BY-105 DURING ROTARY MODE CORESAMPLING D C Langlois E2 Consulting Engineers to 1 S Schofield Lockheed Martin Hanford Company September 17 1998
CGM-8 Letter PARTICULATE SAMPLING OF 241-TX-I13 DURING ROTARY MODE CORESAMPLING D C Langlois E2 Consulting Engineers to J S Schofield Lockheed Martin Hanford Company March 15 1999
CGM-9 Letter PARTICULATE SAMPLING OF 241-TX-113 DURING ROTARY MODE CORE SAMPLING D C Langlois E2 Consulting Engineers to I S Schofield Lockheed Martin Hanford Company May 31 1999
Notices of Construction NOC-I DOEIRL-93-40 Radioactive Air Emissions Program Notice of Construction Rotary Mode Core-Sampling
Truck and Exhauster Approved by Letter AIR 93-707 A W Conklin WDOH to J E Rasmussen DOEIRL 7893
NOC-2 DOEIRL-94-118 Rev 0 Radioactive Air Emissions Program Notice of Construction for the Rotary Mode Core-Sampling Systems Three and Four Approved by Letter AIR 95-603 A W Conklin WDOH to J E Rasmussen DOERL 63095
NOC-3 DOERL-94-118 Rev 1 Radioactive Air Emissions Program Notice of Construction for the Rotary Mode Core-Sampling Systems Three and Four Approved by Letter AIR 98-301 W W Conklin WDOH to I E Rasmussen DOEIRL 3698
NOC-4 DOEIRL-97-70 Radioactive Air Emissions Program Notice of Construction for Rotary Mode Core- Sampling in SX Tank Farm Approved by Letter AIR 97-1 101 A W Conklin WDOH to J E Rasmussen DOEIRL 113097
NOC-5 USEPA Letter OAQ-107 (no title approving DOE submittal 97-EAP-590 dated 72997) A J Frankel USEPA to J E Rasrnussen DOEIRL 8497
NOC-5 USEPA Letter OAQ-107rsquo (nb title approving DOE submittal 97-EAP-723 dated 101797) A J Frankel USEPA to J E Rasmussen DOERL 11498
Note that both letters have ldquoOAQ-107rdquo following ldquoReply to Attn ofrdquo
G-2
RPP-4826 Rev I
Work Packages WP-I ES-94-00808 WP-2 ES-95-00258 WP-3 ES-95-00045 - WP-4 ES-95-00434 - WP-5 ws-97-00173 - WP-6 WS-97-00174 - WP-7 ws-97-00143 - WP-8 WS-97-00144 - WP-9 WS-97-00207 - WP-I 1 WS-97-00208 - WP-12 WS-98-00049 - WP-13 WS-97-00050 - WP-14 WS-97-00224 - WP- I5 WS-97-00225 - WP-16 WS-97-00230 - WP- I7 ws-97-0023 1 - WP-18 ES-97-00452 - WP-19 ES-97-00453 - WP-20 WS-98-00072 - WP-21 WS-98-00073 - WP-22 WS-98-00067 - WP-23 WS-98-00068 -
241-BY-IO6 Perform Rotary Core Sample [Riser IOB] 241-BY-I IO Rotary Core Sample [Risers 12B 7 IZB 41 241-BY-IO8 Obtain Rotary Core Sample [Risers 12A amp 71 241-BY-IO5 Rotary Mode Core Sample [Riser 12A] 241-SX-101 Rotary Mode Core Sample Riser 19 241-SX-101 Rotary Mode Core Sample Riser4 241-SX-103 Rotary Mode Core Sample Riser 7 241-SX-103 Rotary Mode Core Sample Riser I I 241-SX-105 RMCST Obtain Core Sample Riser 6 241-SX-105 RMCST Core Sample Riser 14 241-SX-102 Rotary Mode Core Sample Riser 8 241-SX-102 Rotary Mode Core Sample Riser 4 241-S-1 IO RMCST Obtain Core Sample Riser 6 241-S-1 IO RMCST Obtain Core Sample Riser 14 2414-107 RMCSTCore Sample Riser 7 241-U-107 RMCST Core Sample Riser 2 241-BY-IO5 RMCST Core Sample Riser 7 241-BY-IO5 RMCST Core Sample Riser 1 IB 241-TX-113 Rotary Core Sample Riser 3 241-TX-113 RMCST Core Sample Riser 5 241-TX-I 18 RMCST Core Sample Riser 9B 241-TX-I 18 RMCST Core Sample Riser 128
G-3
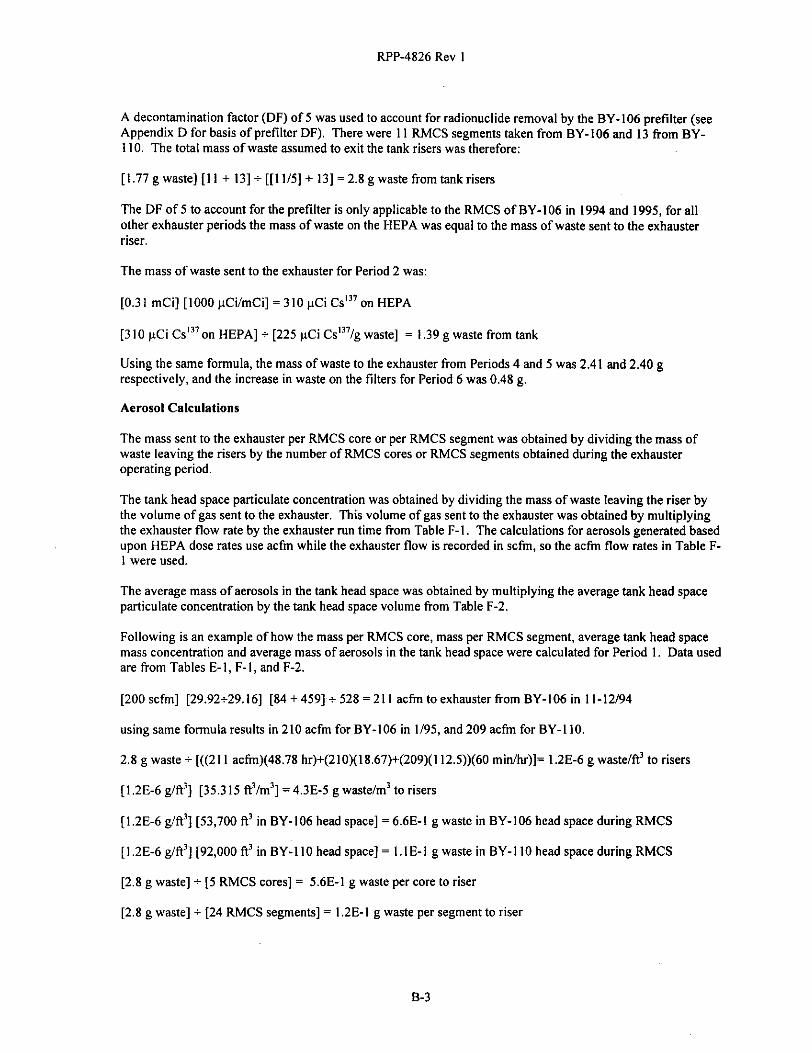
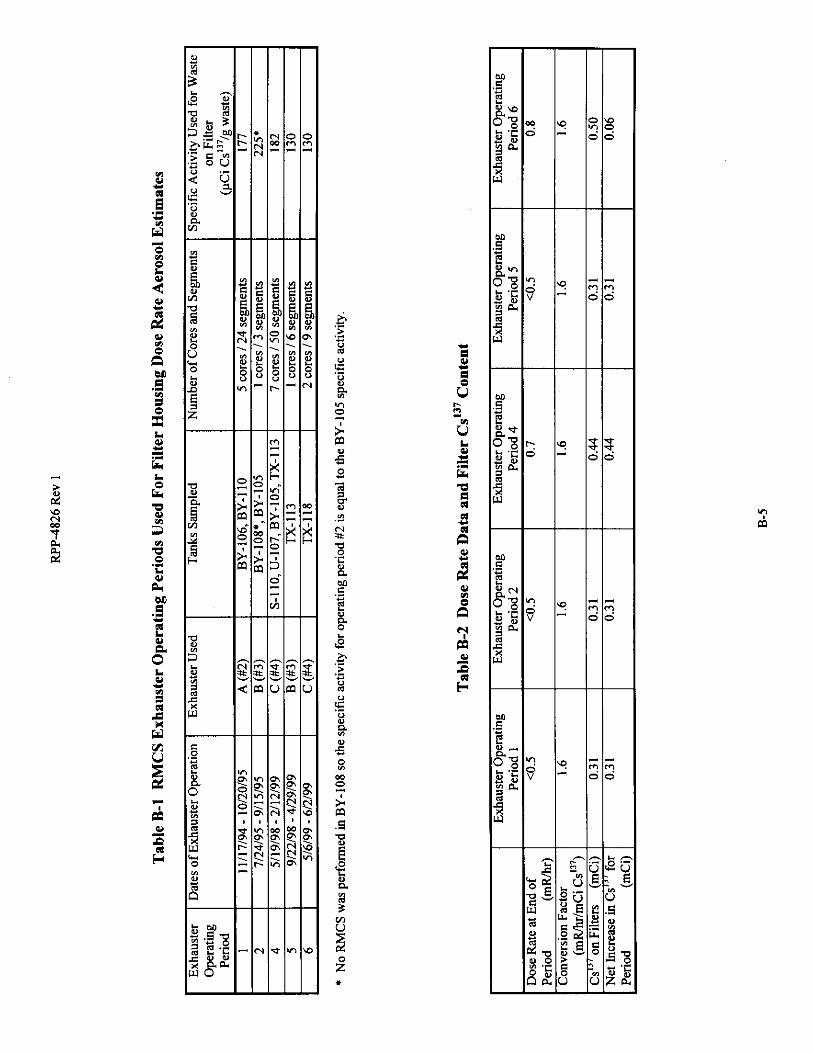
RPP-4826 Rev I
APPENDIX C - Estimation Of Aerosols Generated During RMCS Based Upon CGM In- Line Filter Paper Analyses
Summary of Method
This method of estimating RMCS aerosol quantities uses radionuclide assay data from in-line filter papers located upstream of continuous gas monitors (CGM) sampling the tank air for flammable gases during RMCS The radionuclide content of the filter paper is divided by the waste radionuclide specific activity and the air flow through the CGM to obtain an estimate of the average mass concentration in the tank head space during the time period the CGM is on Multiplying the estimated average tank head space mass concentration by the tank head space volume gives an estimate of the average mass of particulates in the tank head space during RMCS To obtain the mass per RMCS core or per RMCS segment sent to the exhauster the tank head space average mass concentration is multiplied by the volume of gas sent to the exhauster then multiplied by a correction factor to account for particulates in the head space removed by the exhauster when the CGM is not operating and divided by the number of RMCS cores or RMCS segments
Description
During most tank waste intrusive activities performed since 1996 an intrinsically safe CGM located above ground has been used to continually monitor the tank air for flammable gases during in-tank activities The CGM sampling method draws air directly from the tank head space During RMCS the CGM sampling line is placed in the tank dome space The sampling line is located between the sampling riser and the exhaust riser if practical A pump in the CGM draws tank air up through the line at 05 litmin for measurement of the lower flammability limit (LFL) by the CGM A filter paper is installed in the sampling line upstream of the CGM to protect the unit from internal contamination
Following CGM use the CGM filter papers are normally discarded after monitoring them in the field for contamination To help estimate the tank head space particulate levels during RMCS these filter papers were retained and analyzed in the 222-S laboratory following removal from all tanks in which RMCS was performed from the fall of 1997 through April 1999 Data were collected for the four tanks in SX farm in which RMCS was performed and the next four tanks on which the RMCS exhauster was deployed These tanks are listed in Table c-I Reported CGM Data
The CGM operational data used to estimate aerosol levels during RMCS includes CGM operating times CGM flow rates and filter paper analytical data A summary report containing all the field operating data sheets for CGM usage and lab data was prepared following completion of sampling on each tank for all tanks except TX- 113 For TX-I 13 a separate report was prepared following each core These reports are References CGM-I to CGM-9 The CGM data from these reports are provided in Table C-2
There were 14 CGM installations during RMCS when CGM filter papers were collected and analyzed Each of these installations had Csrdquorsquo total alpha and total beta quantities measured on the filter papers resulting in 42 data points Eight of the measurement results were very low and had errors of gt+-loo These values were not used resulting in a net of 34 data points for calculating average head space mass concentrations based upon CGM data
Calculated Tank Head Space Radionuclide Concentrations
To calculate the average tank head space radionuclide concentrations during RMCS the filter paper radionuclide quantities were first divided by an efficiency factor to account for radionuclides which may not have been captured on the paper This adjusted radionuclide value was divided by the volume of tank air passing through the paper to give the average tank head space radionuclide concentration
The efficiency used for most stack samplers onsite is 73 (see Appendix D) Estimates attached to References CGM-I to CGM-9 indicate the CGM filter paper sampling method used should have a sampling efficiency
c- 1
RPP-4826 Rev 1
exceeding 73 For conservatism a sampling efficiency of 50 was assumed in this document for the CGM filter paper method
The estimated Csrdquorsquo total alpha and total beta concentrations in the tank vapor space were calculated by dividing the radionuclide quantity on the filter paper from Table C-2 by the assumed CGM sampling efficiency of 05 and the volume of gas going to the CGM The volume of gas going to the CGM was calculated by multiplying the time of CGM operation from Table C-2 by the CGM flow rate of 500 mlmin For example the calculated SX- 101 head space C~rsquorsquo~concentration based upon analysis of the CGM filter papers used during RMCS of riser 19 is
[[26E-4 pCi + 051 + [[I755 min][500 mlmin]] = 59E-I0pCiml
All radionuclide concentrations were calculated in a similar fashion Results are given in Table C-3 Table C-3 lists the radionuclide concentrations for all 42 data points The eight radionuclide concentrations not used for estimating mass concentrations are noted
Table C-3 also contains the calculated number of tank head space changeouts by the tank exhauster during CGM operation Tank head space changeouts were calculated by multiplying the exhauster flow rates (in actin) from Table F-1 by the CGM run times from Table C-2 and dividing by the tank head space volumes from Table F-2 The number of tank head space changeouts during CGM operation was used when estimating the waste mass sent to the exhauster See Aerosol Calculations section below for explanation
Aerosol Calculations
Average tank head space mass concentrations based upon CGM filter paper data were calculated by dividing the head space radionuclide concentrations from Table C-3 by the waste specific activities for each tank sampled The waste specific activities used came from Table E-I and are listed again in Table C-I The average of the mass concentrations based upon radionuclide data for each tank was used as the average head space mass concentration for that tank For example the calculated SX-IO1 head space mass concentration analysis from the CGM filter papers used during RMCS of riser 19 is
[59E-10 pCi Csrdquorsquoml+ 112 pCi C S rdquo ~ ~ waste] [ 28317 mlftrsquo] = 1 SE-7 g wasteA3 based upon C S rdquo ~
[ I 7E-I I pCi T A M + 504E-1 pCi TAg waste] [ 283 17 mlftrsquo] = 94E-7 g wasteamprsquo based upon Total Alpha
[43E-9 pCi TBml+ 357 pCi TBg waste] [ 28317 mlArsquo] = 34E-7 g wastel based upon Total Beta
[ [ I 5E-7 + 94E-7 + 34E-7 g wasteArsquo] f 31 = 48E-7 g wasteamp
[48E-7 g wastelt ] [3531467 Arsquom3] = 17E-5 g wastemrsquo
All tank head space mass concentrations were calculated in the same manner The results are presented in Table C-4 The weighted average tank head space mass concentration during RMCS was based upon the number of RMCS segments taken for each data point
The average aerosol mass in the head space during RMCS was calculated by multiplying the average tank head space mass concentration by the tank head space volume from Table F-2 For the same data point as above
[48E-7 g waste Arsquo] [115E+5 Arsquo] = 55E-2 g waste in SX-IO1 head space during RMCS
All average mass quantities present in the tank head space during RMCS were calculated in the same manner using a spreadsheet The results are provided in Table C-4 The weighted average mass of waste in a tank head space in Table C-4 was calculated based upon the number of segments obtained for each data point
Estimation of the mass of waste sent to the exhauster per RMCS core or segment requires calculation of the total mass of waste sent to the exhauster Multiplying the average head space concentration during RMCS by the exhauster flow rate (in acfm) and the time of CGM operation will give the mass of waste sent to the exhauster during the CGM time frame only While the large majority of mass of waste aerosols will have exited the tank or
c -2
RPP-4826 Rev I
resettled by the time the CGM is shut off there could be some residual suspended particles remaining These would eventually pass to the exhauster but would not be picked up by the CGM filter since it was not in service An adjustment factor was used as described in the following paragraphs to account for particles that may exit to the exhauster following shut down of the CGM
Particulates are generated by RMCS when purge gas is blowing out the drill string and the bit is rotating under the waste surface This time averages about six minutes per segment Multiplying the number of RMCS segments per core by six minutes per segment and dividing by the number of minutes of CGM operation shows the creation of particulates will only occur during a nominal 3-4 of the time the CGM is operating During RMCS the normal practice is to install the CGM turn it on when personnel enter a tank farm and keep the unit in constant operation for the remainder of the shift When the portable RMCS exhauster is used the exhauster is normally started at least an hour before RMCS is initiated and kept in operation until it is time to halt operations for the week The SX exhauster is kept in constant operation Comparing exhauster operating times from Tables F-l with CGM operating times from Table C-I it can be seen the CGMs are in operation about 3-15 of the time the RMCS exhauster is operating on a tank This time comparison wasnrsquot estimated for the SX exhauster since the SX exhauster is in constant operation
With CGM operation much longer than the time period when particulates could be generated the majority of particulates generated by RMCS should have settled or been exhausted during the CGM operating period Table C-3 shows the tank head space changeouts made by the exhauster during CGM operating periods ranged from 084 to 63 The average was 24 With the CGMs operating 25-33 times longer than the aerosol generation periods and an average of over two tank head space changeouts during CGM operation the large majority of aerosols generated during RMCS will have settled out or been removed by the exhauster by the time the CGM is shut off To account for particulates remaining in the tank head space after the CGM was turned off that are subsequently removed by an exhauster it was conservatively assumed that 20 of the total mass of particles generated during RMCS were not removed from the tank head space during the CGM operating period Therefore the product of the tank head space concentration and the volume of air sent to the exhauster during the time of CGM operation was multiplied by a factor of 125 (lOOl80) to estimate the total mass of waste sent to the exhauster as a result of RMCS This is shown below for the same SX-IO1 riser 19 data point in the above calculations
[48E-7gA3] [IOOmin] [I755 min] [125]= 11E-l gwastetoexhauster
This value was divided by the number of RMCS cores and RMCS segments from Table C-1 to provide the grams per core and grams per segment in Table C-4 as follows
[ I I E- 1 g waste to exhauster] i 1 core = 11 E-I g wastelRMCS core to exhauster
and
[ 1 I E- 1 g waste to exhauster] + 5 segments = 2 I E-2 g wastelRMCS segment to exhauster
All mass per core and mass per segment values were calculated in the same manner using a spreadsheet The results are provided in Table C-4 The weighted average mass per core and mass per segment in Table C-4 were calculated based upon the number of cores or segments obtained for each data point
Summary of Calculations
There were 34 valid CGM filter paper data points from 14 RMCS CGM sampling periods in eight tanks during which I5 RMCS cores and 79 RMCS segments were obtained Based upon CGM filter paper data the results indicate that
The average tank head space mass concentration during RMCS was 4OE-5 g wastem3 The average mass of suspended solids in the tank head space during RMCS was 97E-2 g waste The average mass sent to the exhauster during RMCS was 18E-1 g wastelRMCS core The average mass sent to the exhauster during RMCS was 34E-2 g wastelRMCS segment
c - 3
RPP-4826 Rev 1
Ignoring all CGM filter paper analytical data points with a variance gtloo will result in conservative results These data points indicate negligible radioactivity was present If a value of zero was assigned to each data point with an analytical error of gtloo instead of ignoring the data point the weighted average particulate quantities in Table C-4 would be reduced by about 12
The average tank head space mass concentrations based upon CGM data will be higher than the average tank head space mass concentrations based upon filter housing NDA or dose rate The RMCS exhauster received tank air from the shifts when sampling was performed and during some of the off-shifts when no sampling was done The CGMs were only operated during the shifts when sampling was performed The air concentration drawn into the CGM and the RMCS exhauster should be roughly the came during the operating shifts but somewhat less during the off-shifts Therefore the tank head space concentration will be higher when based upon CGM data This does not impact the mass of waste sent to the exhauster per core or per segment
c -4
I
- ~
RFP-4826 Rev 1
APPENDIX D
ESTIMATION OF Rh4CS EXHAUSTER HOUSING DECONTAMINATION FACTOR
D-0
RFrsquoP-4826 Rev 1
APPENDIX D - Estimation of RMCS Exhauster Housing Decontamination Factor
Summary of Method
This Appendix estimates a Decontamination Factor (DF) for the RMCS exhausters using housing NDA data and applicable stack record sample data The Csrdquorsquo in the exhauster effluent is divided by the C S rdquo ~ in the exhauster inlet to provide a penetration efficiency The reciprocal ofthe penetration efficiency is the DF
Description
Each RMCS exhauster has an isokinetic sampler located on the stack downstream of the blower and HEPA filters A small pomp pulls air from the exhaust stack into a filter paper at a rate proportional to the exhaust flow Radionuclides in the exhaust stream passing through the sample line are caught on the filter paper The stack operating time and flow rate are recorded When the record sample filter paper is removed the filter paper is analyzed in a laboratory for radionuclides The radionuclide concentration in the stack effluent stream is calculated by dividing the quantity of material on the filter paper by the volume of air through the sampler and then dividing again by a factor to compensate for stack sampler and filter paper efficiency
Multiplying the total beta stack effluent concentration by the total off gas flow gives the total beta emissions from the exhauster The total beta emissions are multiplied by the Csrdquorsquo to total beta ratio for the waste in the tank) being exhausted to give an estimate of the C S rdquo ~ emission The C S rdquo ~ on the filters determined by NDA of the housing (see Appendix A) is added to the C S rdquo ~ emissions to give the total C S rdquo ~ input to the filter housing Dividing the emissions by the input gives the filter housing penetration efficiency Subtracting the penetration efficiency from 1 O gives the filter housing efficiency Dividing 1 O by the penetration efficiency gives the DF
RMCS Stack Record Sample Data
RMCS exhauster stack record samples are taken after completion of each sampling event on a tank Normally this is after all cores on that tank have been obtained but for BY-IO5 in 1998 record samples were taken following each core Record samples are also taken at the end of each year All samples are analyzed for total alpha and total beta At the end of each year all the filter papers for that year are composited and analyzed for individual radionuclides Sample results are entered into the Automated Bar Coding of Air Samples at Hanford (ABCASH) and Environmental Release Summary (ERS) databases Several ofthe filter papers from 1998 were reanalyzed using a longer count time to bring the error rate down
Schofield 2000b compiled and evaluated all available RMCS exhauster stack record sample data filtered out the unusable data provided derivation for the stack sampling efficiency factor and summarized the results Most of the data points were so low as to be unusable since the results were either negative or had error variances gtloo
Column 5 of Table D-1 provides the stack effluent concentrations used for calculation of the filter housing DF The stack effluent data in Table D-l come from Schofield 2000b These values include a 073 sampling efficiency factor
Calculation of RMCS Filter Housing Decontamination Factor Based upon Housing Inlet and Outlet Data
The RMCS exhauster housing NDA and stack record sample data available for exhauster Operating Periods 4 5 and 6 were used to estimate an actual DF for the RMCS exhauster housings The housing NDA data is for CSrdquo~ but there are no usable Csrdquorsquo concentrations for the RMCS exhauster outlet The RMCS exhauster stack Csrsquordquo concentrations are either negative have a variance gtloo or are not available Total beta analyses are available however so the stack eftluent C S rdquo ~ concentrations were estimated by multiplying the total beta concentration by the ratio of Csrdquorsquo to total beta in the tank waste
Column 2 of Table D-l lists the increase in CSrsquo~ on the filters for each operating period as determined by NDA This data was obtained from Table A-2
D- 1
RPP-4826 Rev 1
Column 4 of Table D-l lists the stack exhaust volume for each stack record sample period The stack exhaust volume for the exhauster installation on S-l IO was calculated by
[ZOO std ft3min][15978 hrs] [60 minhr] = 199E+6 std ftrsquo
All other stack volumes in Table D-l were calculated the same way Unlike in Appendices A B and C no adjustment was made to change the 200 scfm to actual cfm This is because the RMCS stack record sample concentrations from Table D-3 are based upon a 200 scfm flow rate rather than the actual flow rate Since the concentrations are on the same basis as the flow rate there is no need to correct to acfm
The total beta emissions for the RMCS exhauster stack were calculated by multiplying the volume by the concentration For the same S-l IO data point
[199E+6 ft3] [18E-15 pCiml] [28317mlft3] [mCi1000 pCi] = 1OE-7 mCi total beta
All other total beta emissions in Table D-l were calculated the same way
The Csrdquorsquo to total beta ratio was calculated from data in Table E-I For the same S- l I O data point
326E+5 Ci CsI3rsquo f I 14E+6 Ci total beta = 029 Ci CslhCi total beta = 029 rnCi CsrdquorsquomCi total beta
The Csrsquordquo emission for the same S-l IO data point was thus
[I OE-7 mCi total beta] [029 mCi CsrdquorsquomCi total beta] = 29E-8 mCi Csrdquorsquo
All Csrsquordquo emissions in Table D-l were calculated in the same manner
The penetration efficiency for each operating period was calculated by dividing the exhauster outlet by the filter inlet Csrdquorsquo quantities For operating period 4 this was
[81E-6 mCi] f [5OE-I + 8IE-6 mCi] = 16E-5 = 16E-3
The DF for operating period 4 is
1 + 16E-5 = 62E+4
The overall DF for periods 4 5 and 6 was calculated by dividing the efluent from all three periods by the total filter input
[95E-6 mCi] f [67E-I t 95E-6 mCi] = 14E-5 = 14E-3 penetration efficiency
I - I 4E-5 = 0999986 = 999986 filter efficiency
1 f 14E-5 = 73E+4 decontamination factor based upon housing inlet and eftluent data
Estimation of Housing Decontamination Factor Based upon General Performance Data
HEPA filters are tested at the manufacturer to a minimum 9997 efficiency using a 03 pm monodisperse aerosol After installation HEPA filters are tested in-place per ASME N5 I O to a minimum 9995 efficiency using a polydisperse aerosol with an approximate droplet size distribution of 99 less than 30 pm 50 less than 07 pm and 10 less than 04 pm The RMCS exhauster housing is tested per ASME N510 and is thus required to have a minimum removal eficiency of 9995 for an aerosol with this approximate size distribution The particle size distribution of the waste aerosols generated by RMCS is unknown but it is assumed that the removal efficiency for RMCS generated aerosols was the same as the removal efficiency for the ASME generated test aerosol
D-2
RPP-4826 Rev I
A 9995 efficiency is equivalent to a DF of 2E+3 while a 9997 efficiency is equivalent to a DF of 33E+3 The actual DF for the RMCS exhauster housing is higher than either of these It has two HEPA filters in series even though the minimum efficiency specified in the NOCs for the RMCS exhausters is only equivalent to one HEPA ERDA 1976 recommends using a DF of 3000rdquo for a filter bank where n is the number of HEPA filters in series This would result in a DF of 9E+6 for the RMCS exhauster housing This is unrealistic Using a DF of 9E+6 will calculate to Csrdquorsquo quantities on the HEPA filtersthat are orders of magnitude above what have been shown to be there based upon the measured dose rates and NDA A DF of 9E+6 would mean the dose rate would have to be almost 100 mRhr at the side of the exhauster housing instead of the 05-08 mRhr dose rates encountered The waste particles will not have the same particle size distribution entering the second HEPA filter as when entering the first The majority of the waste particles will be captured on the I rdquo HEPA filter and although the DF for each HEPA if tested individually using the ASME N5 IO aerosol test method may be 3E+3 (or higher) the overall DF of the two filters in series will not be 3000lsquo This is because the particle size distribution entering the Znd HEPA could have a greater percentage of smaller particles than that entering the 1rdquo
NUREG 1995 included an evaluation of a number of different facility stacks at the Hanford site where the HEPA filter upstream air concentrations were estimated using several different methods This report concluded that back-calculation using a value of 3000rdquo overestimated the upstream radionuclide concentration by three to four orders of magnitude when compared to filter NDA data for the nine stacks for which NDA data were obtained and by three orders of magnitude for the two stacks for which upstream air sample data were available Back- calculation using a value of 3000rdquo was shown to be high by four orders of magnitude for the single stack for which a powder release estimate was available Based upon this information the RMCS exhauster dual filter-in-series housings would have a DF of at least three and maybe four orders of magnitude less than 9E+6 or in the 1E+3 to 1 E+4 range A DF of IE+3 would he less than the minimum permissible under the NOC Comparing the older stack data and design with the newer RMCS exhauster design the minimum DF would be expected to be at least 1E+4
Table D-2 provides the available RMCS exhauster aerosol test data This information was obtained from Waldo 1999 Prior to 1998 the RMCS exhauster primary HEPA filter efficiency and either the secondaly HEPA filter or the overall efficiency for both filters were tested Starting in 1998 only the primary and secondary HEPA filter efficiency were measured The overall efficiency of the two filters in series was only measured three times in 11 setups Twice the overall penetration efficiency was lt0002 and the remaining time the only information that could be found was a value of lt005 Most individual filters had a penetration efficiency of 0002 This appears to be about the limit of the detection equipment Based upon Table D-2 data a penetration efficiency of 0002 (99998 efficiency) is normal for a single HEPA and thus a minimum for an RMCS exhauster housing Assuming a 0002 penetration efficiency for the two filters combined calculates to a DF of 5E+4 (equal to 1 +
000002) for the RMCS exhauster housing
In summary the measured DF for the RMCS exhauster housings over the period from May 1998 through June 1999 was about 73E+4 RMCS aerosol testing prior to use indicates a DF of about 5OE+4 for each of the filters separately but their overall efficiency is not measured Referenced data based on older stacks at Hanford indicate the two HEPA RMCS exhauster housing would likely have a DF of at least IE+4
Estimated Aerosol Levels During RMCS Based Upon RMCS Stack Record Sample Data
Revision 0 of this document used the positive record sample results with variance less than 100 to estimate aerosol concentrations in the exhauster inlet using an assumed exhauster housing DF of 5OE+4 This method of estimating aerosols was eliminated from Revision 1 because the stack concentrations were either too low too scattered or too questionable to provide reliable results There were 112 RMCS stack record sample data points evaluated in Schofield 2000b Excluding the total beta sample results used for estimation of the housing DF there were only ten data points remaining with positive values and variances ltloo the remaining data points were either negative had a variance gtloo or the results were not available
For comparison purposes only Schofield 2000b applied the DF of 73E+4 calculated in this document to the data points not used to calculate the exhauster housing DF to estimate aerosol concentrations upstream of the filters The results showed aerosol levels approximately the same as those estimated using NDA dose rate or CGM filter paper data when a value of zero was used for negative sample results or those with a variance gtloo When only
D-3
RPP-4826 Rev 1
the ten positive results with a variance ltloo were used the aerosol levels calculated to be two to five times higher than those estimated using NDA dose rate or CGM filter paper data Because of the variability of data resulting from the extremely low record sample concentrations and the few useable data points estimation of aerosol levels using record sample data was not included in Revision I See Schofield 2000b for further discussion of the use of record sample data to estimate aerosol levels
Summary of Calculations
A total of nine RMCS exhauster stack record sample data points were used to estimate the RMCS exhauster filter housing decontamination factor These data points were obtained when sampling on five tanks during which 10 RMCS cores and 65 RMCS segments were obtained The overall decontamination factor was 73E+4
Estimation of aerosol generation quantities based upon RMCS stack record sample data is possible However results will likely be skewed high if data points that show non-detectable levels of radionuclides present are ignored instead of using a value of zero for the data point
D-4
RPP-4826 Rev 1
APPENDIX E
TANK WASTE RADIONUCLIDE CONCENTRATIONS USED FOR AEROSOL CALCULATIONS
E-0
RPP-4826 Rev 1
APPENDIX E - Tank Waste Radionuclide Concentrations Used for Aerosol Calculations
The RMCS exhauster NDA data HEPA filter dose rate data CGM filter paper data and stack record sample data provide information on the quantity of radionuclides on the exhauster filters in the tank head space or the exhauster stack during RMCS These radioactivity quantities need to be divided by the waste radionuclide concentration specific activity to determine the mass of waste in the tank head space and in the tank gases sent to the exhauster
The mass quantities in this document were calculated using dry basis radionuclide concentrations Waste particles carried into the tank head space by the purge gas could be wet or dry If wet some of the non-chemically bound water will start to evaporate immediately providing the tank relative humidity is 400 The water present in a waste particle may be chemically bound as a hydrate or free The chemically bound water will not readily evaporate therefore even a ldquodryrdquo particle may have some water associated with it It is impractical to measure the actual water content of the waste particulates caught on the CGM filter paper the exhauster HEPA filters or the stack record sample paper Since the quantity of water in the waste particulates is unknown particulate levels were calculated using dry basis radionuclide concentrations Thus all particulate values given in this document are stated on a dry basis
The waste radionuclide concentrations on a dry basis were calculated from data available in the Tank Waste Information Network System (TWINS) The Best Basis InventorylBest Basis Summary numbers were used These values are the most complete and up to date readily available estimates for Hanford waste tank contents but do not include water The information was downloaded from TWINS into a spreadsheet The total chemical total beta and total alpha quantities were summed in the spreadsheet for all the tanks which were sampled and concentrations for Csrdquorsquo Sr9rsquo total beta and total alpha automatically calculated in pCig These concentrations are provided in Table E-I Because lab techniques for measuring gross beta levels only detect beta particles with a minimum decay energy above 150-200 kev only radionuclides with a decay energy of gt-200 kev were included in the total beta numbers
The TWINS radionuclide concentrations were obtained in December 1999 No corrections were made for decay for this document
The CGM filter paper and stack record sample data indicate the measured radionuclide values are not always in the same ratio to each other as given by TWINS nor are all radionuclides detected that TWINS indicates are present Radionuclides can be distributed unevenly in a tank Soluble fission products (primarily Csrsquordquo) are found in the liquid saltcake and in sludges Insoluble fission products and actinides are found largely in sludges as these are primarily chemical precipitates Sludge could be mixed with saltcake be present in a distinct layer at the bottom of a tank or in several layers in the tank depending upon how waste was transferred into a tank Waste particles may thus not have the same specific activity on a microscopic scale as they would have on a macro scale were the tank contents homogenized During RMCS a top to bottom core sample is attempted resulting in the drill bit and purge gas (which causes aerosols to form) passing through most ofthe waste matrix Assuming the aerosol generation rate is approximately constant during drilling the specific activity of a radionuclide in the suspended solids should be roughly the same as the average specific activity of the same radionuclide in the tank waste While the waste specific activity is probably not homogeneous from top to bottom in a tank and the aerosol generation rate will likely also vary it is beyond the scope of this document to provide an in-depth analysis of all the factors affecting aerosol radionuclide concentration Although sample radionuclide data were not always in the same ratio as provided by TWINS for the purpose of this document the simplifying assumption was made that the average tank specific activity is adequate to provide an approximation of the suspended solids specific activity for all radionuclides Average tank individual radionuclide specific activities were used in the preparation of the exhauster NOCs
The aerosol calculations presented in this document are only as accurate as the TWINS data The combined radionuclide content of all Hanford waste tanks is known fairly well since the overall content is based upon reactor production records CsrdquorsquoSrW recovery data and processing plant discharges Thus TWINS data for all tanks combined should be reasonable There are undoubtedly differences between TWINS data and the actual contents of a specific tank While the specific tank radionuclide data from TWINS used in this document may not be exact deviations from the actual concentrations are assumed to balance out over the number of tanks sampled
E- 1
RPP-4826 Rev 1
APPENDIX F
ROTARY MODE CORE SAMPLING EXHAUSTER AND CORE SAMPLE DATA
F-0
RPP-4826 Rev 1
APPENDIX F - Rotary Mode Core Sampling Exhauster and Core Sample Data
This appendix provides the basic data obtained during RMCS operations which was used in preparation of this document
Basic Operational Data
There have been three RMCS exhausters and three RMCS sampling trucks deployed since starmp of nitrogen- purged RMCS in November 1994 The exhausters are formally designated 296-P-32296-P-33 and 296-P-34 These were originally referred to as parts of RMCS Systems 2 3 and 4 respectively in the Notices of Construction (NOC) for these units The exhauster designations were changed for routine field use in 1996 to exhausters A B and C to avoid confusion with core sampling trucks 23 and 4 since any exhauster could be used with any RMCS truck Exhauster A (2) and RMCS Truck2 have not been used for RMCS since 1995 and are no longer in service for core sampling
Rotary mode core sampling has been conducted in four general time frames since 1994 These time frames were separated by down times for equipment modifications or resolution of environmental permitting and safety concerns For ease of analysis in this document exhauster operations were organized into six distinct operating periods Periods I to 6 were grouped based upon times when the same exhauster and same set of HEPA filters were being used These periods thus overlap with the general operating time frames The four operating time frames were
The first time frame lasted from November 1994 to January 1995 RMCS Truck 2 and Exhauster 2 (A) were used on Tank BY-106 along with an in-tank prefilter This tank provided the initial deployment and testing of the nitrogen-purged equipment in a waste tank During this period radiation dose rates were taken at the side of the exhauster housing Stack record samples were taken in December 1994 and January 1995
The second time frame lasted from July 1995 through October 1995 RMCS Trucks 2 and 4 were used with Exhausters 2 and 3 (A and B) on BY-105 BY-IO8 and BY-I IO During this period radiation dose rates were taken at the sides of the exhauster housings Stack record samples were taken after completion of sampling on each tank No RMCS samples were taken from BY-108 all samples were taken in push mode for this tank
The third time frame began when RMCS was restarted in December 1997 Trucks 3 and 4 were used for sampling of SX-101 SX-103 SX-105 and SX-102 with the SX tank farm exhauster providing ventilation The RMCS exhausters were not used During this period radiation dose rates were taken at the sides of the SX exhauster housing as part of HPT routine surveys SX farm exhauster stack record samples were taken when required by normal operating procedures SX record sampler and filter housing dose rate data were not evaluated for this document It would not be practical using filter dose rate or stack record sample data to estimate the RMCS aerosol addition if any to the SX ventilation system The background radiation around the SX filter housing makes measurement of any small increase in dose rate very difficult to detect The number of tanks being ventilated and the involved off-gas header routings (the exhauster is pulling on thirteen tanks in series or in parallel with the tank being sampled) and any in-tank activities in the SX tanks not being sampled would make it impractical to assess what aerosols resulted from RMCS Beginning with RMCS in SX farm radionuclide analyses were performed on the filter papers protecting the CGMs which draw air out of the tank vapor space for flammable gas detection
The fourth time frame began in May 1998 Between 1095 and 598 Exhausters B and C were extensively modified with new filter housings and other equipment to meet new NOC requirements Trucks 3 and 4 were used with Exhausters B and C (3 and 4) on S-l IO U-107 BY-105 TX-113 and TX-I 18 This period marked the first use ofthe RMCS trucks and RMCS exhausters together following resolution of flammable gas concerns and modifications to the exhausters New filters were installed Radiation dose rates were taken at the sides of the exhauster housings Stack record samples
F- 1
RPP-4826 Rev I
were taken after completion of sampling for each exhauster installation Radionuclide analyses were performed on the CGM filter papers for all tanks except TX-118 An NDA was performed on the Exhauster C housing following completion ofthe first core on TX-I 13 The housing filters when assayed contained aerosols captured by the exhauster following RMCS in S-l IO U-107 BY-105 (1998) and the first core of TX-I 13 Another NDA was performed on Exhauster C following both cores in TX-I 18 An NDA was performed following sampling of the second core in TX-I 13 using Exhauster B The time frame ran through early June 1999 No RMCS samples have been taken after June 1999 nor are any planned for the next few years
For the purposes of evaluating aerosol formation based upon RMCS exhauster housing NDA and dose rate data the exhauster operations were grouped into 6 operating periods These periods are shown in Table F-1 and restated in Tables A-I and B-I All tanks sampled in Periods 1 2 4 5 and 6 were exhausted by the same exhauster with the same housing and filters present during that period Period 3 covered the time the SX exhauster was used during RMCS in SX farm
A brief description of each RMCS tank sampling operation is provided below
Tank 241-BY-1061194 to 1294 RMCS using the nitrogen purge gas system with an exhauster was formally begun on 111794 on tank BY-106 riser IOB Exhauster 2 (A)and Truck 2 were used A sintered metal prefilter was inserted in the riser between the tank and the exhauster A total of eight segments were taken in rotary mode and five segments in push mode until sampling was halted on 122194 One RMCS core was obtained The total exhauster run time was 4878 hours The stack record sample was removed and analyzed following this run period Dose rates taken at the side of the exhauster housing during RMCS were all lt05 mRhr The in-tank prefilter was smeared for contamination when removed from the tank with the smears showing less than detectable levels of radionuclides present (Waldo 1999) The prefilter had been washed with an installed spray system prior to removal from the tank but subsequent testing showed the water flow and pressure were too low to have been effective at removing contamination
Tank 241-BY-106195 Following some process modifications RMCS in BY-IO6 riser IOB began again on 11895 Exhauster 2 (A) and Truck 2 were used The sintered metal prefilter was inserted in the riser between the tank and the exhauster RMCS was halted on 12495 over authorization basis and equipment operability issues for RMCS A total of three segments were taken in rotary mode and eleven segments in push mode One RMCS core was obtained The total exhauster run time was 1867 hours The stack record sample was removed and analyzed following this run period Dose rates taken at the side of the exhauster housing during RMCS were all lt O S mRhr The in-tank prefilter was smeared for contamination when removed from the tank with the smears showing less than detectable levels of radionuclides present (Waldo 1999) The prefilter was not washed this time
Tank 241-BY-110795 to 1095 Following resolution of RMCS authorization basis and equipment issues and completion of the fabrication and testing of Trucks 3 and 4 RMCS was begun in BY-I IO on 71195 Exhauster 2 (A) and Truck 2 were used Samples were taken from risers 128 7 128 again and 4 There was no in- tank prefilter used in this or any subsequent RMCS periods Sampling was performed until 102595 when RMCS was halted over flammable gas issues A total of 13 RMCS segments and 56 PMCS segments were taken Three RMCS cores were obtained The total exhauster run time was 1125 hours The stack record sample was removed and analyzed following this run period Dose rates taken at the side of the exhauster housing during RMCS were all lt O S mRhr
Tank 241-BY-108795 to 895 Core sampling was begun in BY-IO8 on 72595 Exhauster 3 (B) and Truck 4 were used Sampling was done in risers 12A and 7 The tank material proved soft enough so that no RMCS segments were required all segments were obtained in push mode although the exhauster was operated during part of the time sampling was performed Sampling was completed 81895 A total of 16 PMCS segments were taken The total exhauster run time was 6617 hours The stack record sample was removed and
F-2
RPP-4826 Rev 1
analyzed following this run period Dose rates taken at the side of the exhauster housing during RMCS were all lt05 mRhr
Tank 241-BY-105895 to 1095 RMCS was begun in BY-I05 riser 12A on 83095 Exhauster 3 (B) and Truck 4 were used This tank has a concrete layer on top about 12-18 inches thick which had to be drilled through Part way through sampling questions arose as to the flammable gas status of the tank and RMCS was halted on 10695 A total of 3 RMCS and 7 PMCS segments were taken One RMCS core was obtained The total exhauster run time was 4413 hours The stack record sample was removed and analyzed following this run period Dose rates taken at the side of the exhauster housing during RMCS were all lt05 mRhr
Tank 241-SX-1011297 to 298 Following resolution of extensive regulatory and authorization basis issues and installation of equipment modifications RMCS started in SX-101 with Truck 4 on 12497 An RMCS exhauster was not used since all SX farm tanks excluding SX-113 and SX-I 15 are ventilated with the SX exhauster Sampling was performed in risers 19 and 4 and was completed on 21098 A total of 9 RMCS and 6 PMCS segments were taken Two RMCS cores were obtained SX exhauster stack record samples and filter housing dose rates were obtained as part of routine operations for the SX exhauster not as part of the RMCS process Filter papers used in the suction line for the CGM were saved and analyzed in the laboratory to estimate the airborne radionuclide concentration in the tank head space Two CGM filter papers were needed for each core as moisture in the tank vapors condensed on the papers in the cold weather and began to restrict tank gas flow to the CGM
Tank 241-SX-103498 to 598 RMCS started in SX-103 with Truck 4 on 42798 The SX exhauster was used for ventilation (see SX- 101 above) Sampling was performed in risers 7 and 1 1 and was completed on 51198 A total of 6 RMCS and 18 PMCS segments were taken Two RMCS cores were obtained During sampling filter papers used in the suction line for the CGM were saved and analyzed in the laboratory to estimate the airborne radionuclide concentration in the tank head space One CGM filter paper was used during each core SX exhauster stack record samples and filter housing dose rates were obtained as part of routine operations for the SX exhauster not as part of the RMCS process
Tank 241-SX-105298 to 598 RMCS started in SX-105 with Truck 3 on 22598 The SX exhauster was used for ventilation (see SX- 101 above) Sampling was performed in risers 6 and 14 and was completed on 51598 A total of 6 RMCS and 20 PMCS segments were taken Two RMCS cores were obtained During sampling filter papers used in the suction line for the CGM were saved and analyzed in the laboratory to estimate the airborne radionuclide concentration in the tank head space Two filter papers were needed for the first core as moisture in the tank vapors condensed on the papers in the cold weather and began to restrict tank gas flow to the CGM One filter paper was used for the second core SX exhauster stack record samples and filter housing dose rates were obtained as part of routine operations for the SX exhauster not as part of the RMCS process
Tank 241-SX-102698 to 798 RMCS started in SX-102 with Truck 4 on 61798 The SX exhauster was used for ventilation (see SX- 101 above) Sampling was performed in risers 8 and 4 and was completed on 7798 A total of 2 RMCS and I8 PMCS segments were taken Two RMCS cores were obtained During sampling filter papers used in the suction line for the CGM were saved and analyzed in the laboratory to estimate the airborne radionuclide concentration in the tank head space One filter paper was used for each core SX exhauster stack record samples and filter housing dose rates were obtained as part of routine operations for the SX exhauster not as part of the RMCS process
Tank 241-S-110598 to 698 RMCS was begun in S-I10 on 51898 Exhauster C (4) and Truck 3 were used This tank marked the first use of an RMCS exhauster since 1995 Sampling was completed on 6498 Risers 6 and 14 were sampled A total of IO RMCS and 8 PMCS segments were taken Two RMCS cores were obtained The
F-3
RPP-4826 Rev I
total exhauster run time was 15978 hours The stack record sample was removed and analyzed following this run period Dose rates taken at the side of the exhauster housing during RMCS were all lt05 mRhr During sampling filter papers used in the suction line for the CGM were saved and analyzed in the laboratory to estimate the airborne radionuclide concentration in the tank head space One filter paper was used for each core Waste particles retained on the exhauster housing filters were part of the inventory subsequently measured by NDA following completion of the first core in TX-I 13
Tank 241-U-107698 to 798 RMCS was begun in U-107 on 61098 Exhauster C and Trucks 3 and 4 were used Sampling was completed on 71598 Risers 7 and 2 were sampled A total of IO RMCS and 19 PMCS segments were taken Two RMCS cores were obtained The total exhauster run time was 27385 hours The stack record sample was removed and analyzed following this run period Dose rates taken at the side of the exhauster housing during RMCS were all 105 mRihr During sampling filter papers used in the suction line for the CGM were saved and analyzed in the laboratory to estimate the airborne radionuclide concentration in the tank head space One filter paper was used for each core Waste particles retained on the exhauster housing filters were part of the inventory subsequently measured by NDA following completion of the first core in TX-I 13
Tank 24l-BY-105798 to 898 RMCS was begun in BY-105 again on 72298 Exhauster C and Trucks 3 and 4 were used Sampling was completed on 82598 Risers 7 and 1 1 B were sampled A total of 18 RMCS and 18 PMCS segments were taken The material was hard enough to require rotary mode sampling all the way to the bottom of the waste but negligible recovery was obtained After RMCS was performed to the waste bottom a PMCS core was taken in the same hole to recover material Two RMCS cores were obtained The exhauster run time was 13577 hours for the first RMCS core and 30792 hours for the second RMCS core Stack record sample information in ABCASH shows 30558 hours operation for the second core but the sampler data sheet shows the time counter was mistakenly reset 234 hours into the run No correction was made to the BY-IO5 2nd core record sample concentration for this document since the error is conservative and results in only slightly higher (ltI) record sample radionuclide concentrations for this core A stack record sample was removed and analyzed following each core giving two record samples for BY-IO5 in 1998 Dose rates taken at the side of the exhauster housing during RMCS were almost all lt05 m R h but a few readings indicated 07 mRihr This variation was assumed due to personnel reading the instrument differently or the fact that the exhauster had been used on enough tanks that by now there was sufficient activity on the filters to cause readings approximately at the background detection level The final reading when both cores were completed was lt05 m R h During sampling filter papers used in the suction line for the CGM were saved and analyzed in the laboratory to estimate the airborne radionuclide concentration in the tank head space One filter paper was used for each core Waste particles retained on the exhauster housing filters were part of the inventory subsequently measured by NDA following completion of the first core in TX-113
Tank 241-TX-113998 to 599 Core sampling was begun in TX-I 13 riser 3 on 92298 Exhauster B (3) and Truck 4 were used at the start This was the first use of Exhauster B since it was modified Exhauster B ran for a total of 8738 hours until being disconnected on 102398 During this time two PMCS segments were taken and no RMCS segments Exhauster C was then installed and operated for 5598 hours from 121098 to 122898 No RMCS or PMCS sampling was performed during this time frame RMCS segments werent taken until 299 Exhauster C ran for a 30230 hours between 122898 and 21299 Sampling was completed on the core from riser 3 on 21299 A total of 12 RMCS segments were obtained during the time Exhauster C was operating Exhauster flow rate for both exhausters was a nominal 200 scfm Stack record samples were taken following Exhauster B removal at the end of 1998 for Exhauster C and following completion ofthe first core with Exhauster C Aerosol calculations were based on only the 30230 hours run time for Exhauster C in 1999 since this was the time period during which RMCS segments were obtained Dose rates taken at the side of the exhauster housing during the short PMCS only sampling period with Exhauster B were all ltOS m R h Dose rates with Exhauster C varied between lt O S mRhr and 07 mRhr The final reading on Exhauster C following completion of the first core was 07 mFUhr During sampling filter papers used in the suction line for the CGM were saved and
F-4
RPP-4826 Rev I
analyzed in the laboratory to estimate the airborne radionuclide concentration in the tank head space One filter paper was used for the core Waste particles retained on the exhauster housing filters were part of the inventory subsequently measured by NDA following completion of this core
Sampling in riser 5 was begun on 41299 using Exhauster B and Truck 3 A total of 6 RMCS and 1 PMCS segments were taken for this core before sampling was halted on 42899 The total exhauster run time for this core was 11712 hours Problems with high vacuum in the tank required the exhauster flow rate to be reduced to 190 scfm to keep the system within pressure limits The stack record sample for the second core was removed and analyzed following the run period Dose rates taken at the side of the exhauster housing during the second core were all lt05 m M r During sampling filter papers used in the suction line for the CGM were saved and analyzed in the laboratory to estimate the airborne radionuclide concentration in the tank head space One filter paper was used An NDA was performed on the exhauster housing following this core The only radionuclides present in the housing were those from this core or what was removed from the tank head space during the non-RMCS activities in this tank from 92298 and 102398
Some clarification may be needed to explain use of the exhauster operating times and NDA dose rate and record sample data obtained during core sampling on TX-I 13 Core sampling was set up for sampling riser 3 on TX-113 in September 1998 with Exhauster B Exhauster B operated for a total of 8738 hours between 92298 and 102298 The stack record sample was removed at the end of this period The ERS database incorrectly shows the exhauster operated between 111698 and 111998 The ABCASH database shows the stack record sample was removed on 111998 The stack record sample showed positive emuent concentrations during this time period with variances 400 No RMCS samples were taken during this period so the data and time werenrsquot included when calculating RMCS aerosol numbers Exhauster B was removed and Exhauster C installed in late November-early December Exhauster C was operated for a total of 5559 hours between 121098 and 122398 The stack record sample was removed on 122898 No sampling was performed during this period so the data and time werenrsquot included when calculating RMCS aerosol numbers Exhauster C was operated for a total of 30218 hours between 122898 and 2899 All the RMCS segments from riser 3 were taken in this time period so only the data and time for this period were included when calculating RMCS aerosol numbers Exhauster B was used during sampling of riser 5 Exhauster B operated for a total of 11712 hours between 41299 and 42899
Tank 241-TX-l18599 to 699 RMCS was begun in TX-I 18 on 5699 Exhauster C (4) and Truck 4 were used Sampling was completed on 6298 Risers 9B and 12B were sampled A total of 9 RMCS segments were taken there were no PMCS segments Two RMCS cores were obtained The total exhauster run time was 21247 hours The stack record sample was removed and analyzed following this run period The maximum dose rate taken at the side of the exhauster housing following RMCS was 08 m M r CGM filter papers were not analyzed An NDA was performed on the exhauster housing following completion of the two cores The exhauster housing contained the same nuclides as for the first NDA (S-110 U-107 BY-105 and TX-I 13 first core) plus those from TX-I 18
The basic core sampling operational data used in this document includes the number of RMCS cores and segments the exhauster run times and flow rates the RMCS exhauster HEPA filter dose rates and tank vapor space temperatures Table F-l lists the basic operational data This information excluding tank vapor space temperature data was obtained from procedural data sheets in the sampling work packages (References W - 1 to WP-23)
Tank temperature data for the tanks ventilated with the RMCS exhausters was obtained from the TWINS database Plots for each tank were prepared for the time RMCS was conducted and the average value of the highest thermocouple located in the tank (the lowest temperature reading) was estimated and used as the average tank head space temperature during the RMCS period
The SX exhauster flow rates listed in Table F-l are estimates only The combined flow rate for SX-IO1 through SX-106 plus SX-109 (7 tanks) averaged 440 cfm during CY 1996 (Kaiser 1997) for an average of 63 cfm per
F-5
RPP-4826 Rev I
tank Based upon inlet flow measurements at the tank inlet HEPA filters (Fanis 1998) the flow through each individual tank (SX-IO1 through SX-106 plus SX-109) was lt55 cfm at the breather filter Assuming an exhaust flow of 100 cfm for each SX farm tank sampled is therefore conservative
Calculated Data
Calculated data include the tank head space volumes conversion of the RMCS exhauster flow rate from scfm to acfm and the number of tank head space changeouts made by an exhauster during RMCS
Tank head space volume includes the dome space volume above the top of the sidewall plus the void space between the waste surface and the top of the sidewall The formula used to calculate tank head space volumes WN
Head Space Volume in A = (DS + [(H) (12) + HI + Hb - H] (V)) - 748
Where DS = dome space volume gal H = height of tank body sidewall above knuckle A HI = height of tank knuckle area in Hb = height oftank bottom below knuckle in H = height of waste in tank in V =27555 galin of waste in SX tanks 2754 gallin in all others
The tank dome space volumes height of tank sidewall above the knuckle height of tank knuckle area and height of tank bottom below the knuckle were obtained from Reynolds 1999 The height of waste in each tank at the time of core sampling was obtained from the TWINS database Tank dimensional and waste level data are given in Table F-2 along with the calculated tank head space volumes
Aerosol calculations for Appendices A-C require exhauster flow rates in actual cubic feet per minute The RMCS exhauster flow rate is controlled and recorded in standard cubic feet per minute The mass flow rate of the exhauster air is measured and internal logic in the exhauster controller calculates what the volumetric flow rate would be if the temperature and pressure in the exhauster inlet were at standard conditions The standard conditions used in the logic controller are 29921 in Hg (760 mm Hg) and 69F (ZIT)
A correction factor is built into the exhauster control logic that assumes an atmospheric pressure of 2927 in Hg the average atmospheric pressure at Hanford The RMCS exhauster will operate at about 1-2 in H20 negative pressure resulting in about a 2916 in Hg pressure in a waste tank when the RMCS exhauster is operating To revise the indicated scfm RMCS exhauster reading to an acfm value the RMCS exhauster scfm flaw rate was multiplied by (29922916)(T+459)528 where Tis the tank head space temperature in OF The tank head space temperatures in Table F-1 were input to the spreadsheet file used for aerosol calculations and converted to acfm The flow rates in acfm are included in Table F-I
The tank head space changeouts when using the RMCS exhauster were calculated by multiplying the exhauster acfm flow rate by the time of exhauster operation and dividing the result by the tank head space volume Tank head space changeouts are listed in Table F-2
F-6
c
gt 2
RPP-4826 Rev 1
APPENDIX G
REFERENCES
G-0
RPP-4826 Rev 1
APPENDIX G - References
Diedeker 1999 NDA of RMCS HEPA Filters L P Diedeker WMH E-Mail to JS Schofield CHG November 29 I999
ERDA 1976 Nuclear Air Cleaning Handbook ERDA 76-21 Buchsted C A Fuller A B and Kahn 1 E Oak Ridge National Laboratory 1976
Farris 1998 Internal Note T R Farris LMHC to J S Schofield LMHC Breather Filter Flow Rates for SX-Farm 31698
Foust 1999 Internal Memo RMCST Exhauster HEPA Filter Dose Rate Calculations D J Foust LMHC to J S Schofield LMHC October 25 1999
Greager 1999 Correspondence No WMH-9954450 Non-Destructive Analysis of the Rotay Mode Core Sample High-Efjiciency Particulate Air Filters E M Greager WMH to P C Miller LMHC June 28 1999 [Transmittal of HNF-4199 Resultsfram NDA Measurement of the 296-P-34 RMCS HEPA Filters]
HNF 1999 HNF-SD-WM-SAR-067 Tank Waste Remediation System Final Safety Analysis Report Rev 1 The revision incorporating RMCS accident analyses was submitted as Addendum 5 to DOE as a change to the FSAR predecessor the Basis for Interim Operation (BIO) LMHC-9857075 80232764-9-KOOl Submittal of Authorization Basis Amendment Package for Rotay and Push Mode Core Sampling in Satisfaction of Perfarmance Agreement TWR 122 Expectations I and 3 D 1 Allen LMHC to A M Umek FDH August 30 1998 Addendum 5 as of mid-January 2000 is waiting for approval by DOE
Kaiser 1997 T D Kaiser LMHC E-Mail to J S Schofield LMHC SX Tank Flow Data 42197
NUREG 1995 Potential Radionuclide Emissionsfrom Stacks on the HanfordSite Part I Dose Assessment Davis W E and Barnett J M Westinghouse Hanford Company from Proceedings of the 23 DOEMRC Nuclear Air Cleaning Conference held July 25-28 1994 February 1995
Schofield 2000a Letter 74910-00-002 Use of Microshield Calculations for RMCS Exhauster Housing for Estimating Radionuclide Quantities on the Filters Using NDA and Dose Rate Measurements I S Schofield CHG to File January 62000
Schofield 2000b Letter 74910-00-003 Rev I RMCS Exhauster Stack RecordSample Data J S Schofield CHG to File January 202000
Reynolds 1999 D R Reynolds LMHC E-Mail to I S Schofield LMHC transmitting Tank Volume Calculations draft of calculations done by Mike Plesha and Reed Hendershot data to be used for RESOLVE computer program for Hanford waste tanks August 3 1999
TWINS Tank Waste Information Network System database available at httptwinspnlgovSOO lhtbinTCDgetTableListexe
Waldo 1999 letter 74910-99-009 RMCS Exhauster Aerosol Test Data E I Waldo to J S Schofield June 22 1999
WHC 1993 WHC-SD-WM-ES-225 Rev I AerosolStudy for the Rotary Mode Exhauster P M Francis Westinghouse Hanford Company April 20 1993
WHC 1997 WHC-SD-WM-SAD-035 Rev Ob A Safety Assessment of Rotary Mode Core Sampling in Flammable Gas Single Shell Tanks Hanford Site Richland Washington August 8 1997
G- I
RPP-4826 Rev I
CGM Data CGM-I Letter PARTICULATE SAMPLING OF 241-SX-IO1 DURING ROTARY MODE CORE SAMPLING D C
Langlois E2 Consulting Engineers to J S Schofield Lockheed Martin Hanford Company March 16 1998
CGM-2 Letter PARTICULATE SAMPLING OF 241-SX-I05 DURING ROTARY MODE CORE SAMPLING D C Langlois E2 Consulting Engineers to J S Schofield Lockheed Martin Hanford Company June 9 1998
CGM-3 Letter PARTICULATE SAMPLING OF 241-SX-103 DURING ROTARY MODE CORE SAMPLING D C Langlois E2 Consulting Engineers to J S Schofield Lockheed Martin Hanford Company June 12 1998
CGM-4 Letter PARTICULATE SAMPLING OF 241-S-110 DURING ROTARYMODE CORESAMPLING D C Langlois E2 Consulting Engineers to J S Schofield Lockheed Martin Hanford Company July 20 1998
CGM-5 Letter PARTICULATE SAMPLING OF 241-SX-102 DURING ROTARY MODE CORE SAMPLING D C Langlois E2 Consulting Engineers to J S Schofield Lockheed Martin Hanford Company July 22 1998
CGM-6 Letter PARTICULATE SAMPLING OF241-U-107 DURING ROTARY MODE CORE SAMPLING D C Langlois E2 Consulting Engineers to J S Schofield Lockheed Martin Hanford Company August 3 1998
CGM-7 Letter PARTICULATE SAMPLING OF 241-BY-105 DURING ROTARY MODE CORESAMPLING D C Langlois E2 Consulting Engineers to 1 S Schofield Lockheed Martin Hanford Company September 17 1998
CGM-8 Letter PARTICULATE SAMPLING OF 241-TX-I13 DURING ROTARY MODE CORESAMPLING D C Langlois E2 Consulting Engineers to J S Schofield Lockheed Martin Hanford Company March 15 1999
CGM-9 Letter PARTICULATE SAMPLING OF 241-TX-113 DURING ROTARY MODE CORE SAMPLING D C Langlois E2 Consulting Engineers to I S Schofield Lockheed Martin Hanford Company May 31 1999
Notices of Construction NOC-I DOEIRL-93-40 Radioactive Air Emissions Program Notice of Construction Rotary Mode Core-Sampling
Truck and Exhauster Approved by Letter AIR 93-707 A W Conklin WDOH to J E Rasmussen DOEIRL 7893
NOC-2 DOEIRL-94-118 Rev 0 Radioactive Air Emissions Program Notice of Construction for the Rotary Mode Core-Sampling Systems Three and Four Approved by Letter AIR 95-603 A W Conklin WDOH to J E Rasmussen DOERL 63095
NOC-3 DOERL-94-118 Rev 1 Radioactive Air Emissions Program Notice of Construction for the Rotary Mode Core-Sampling Systems Three and Four Approved by Letter AIR 98-301 W W Conklin WDOH to I E Rasmussen DOEIRL 3698
NOC-4 DOEIRL-97-70 Radioactive Air Emissions Program Notice of Construction for Rotary Mode Core- Sampling in SX Tank Farm Approved by Letter AIR 97-1 101 A W Conklin WDOH to J E Rasmussen DOEIRL 113097
NOC-5 USEPA Letter OAQ-107 (no title approving DOE submittal 97-EAP-590 dated 72997) A J Frankel USEPA to J E Rasrnussen DOEIRL 8497
NOC-5 USEPA Letter OAQ-107rsquo (nb title approving DOE submittal 97-EAP-723 dated 101797) A J Frankel USEPA to J E Rasmussen DOERL 11498
Note that both letters have ldquoOAQ-107rdquo following ldquoReply to Attn ofrdquo
G-2
RPP-4826 Rev I
Work Packages WP-I ES-94-00808 WP-2 ES-95-00258 WP-3 ES-95-00045 - WP-4 ES-95-00434 - WP-5 ws-97-00173 - WP-6 WS-97-00174 - WP-7 ws-97-00143 - WP-8 WS-97-00144 - WP-9 WS-97-00207 - WP-I 1 WS-97-00208 - WP-12 WS-98-00049 - WP-13 WS-97-00050 - WP-14 WS-97-00224 - WP- I5 WS-97-00225 - WP-16 WS-97-00230 - WP- I7 ws-97-0023 1 - WP-18 ES-97-00452 - WP-19 ES-97-00453 - WP-20 WS-98-00072 - WP-21 WS-98-00073 - WP-22 WS-98-00067 - WP-23 WS-98-00068 -
241-BY-IO6 Perform Rotary Core Sample [Riser IOB] 241-BY-I IO Rotary Core Sample [Risers 12B 7 IZB 41 241-BY-IO8 Obtain Rotary Core Sample [Risers 12A amp 71 241-BY-IO5 Rotary Mode Core Sample [Riser 12A] 241-SX-101 Rotary Mode Core Sample Riser 19 241-SX-101 Rotary Mode Core Sample Riser4 241-SX-103 Rotary Mode Core Sample Riser 7 241-SX-103 Rotary Mode Core Sample Riser I I 241-SX-105 RMCST Obtain Core Sample Riser 6 241-SX-105 RMCST Core Sample Riser 14 241-SX-102 Rotary Mode Core Sample Riser 8 241-SX-102 Rotary Mode Core Sample Riser 4 241-S-1 IO RMCST Obtain Core Sample Riser 6 241-S-1 IO RMCST Obtain Core Sample Riser 14 2414-107 RMCSTCore Sample Riser 7 241-U-107 RMCST Core Sample Riser 2 241-BY-IO5 RMCST Core Sample Riser 7 241-BY-IO5 RMCST Core Sample Riser 1 IB 241-TX-113 Rotary Core Sample Riser 3 241-TX-113 RMCST Core Sample Riser 5 241-TX-I 18 RMCST Core Sample Riser 9B 241-TX-I 18 RMCST Core Sample Riser 128
G-3
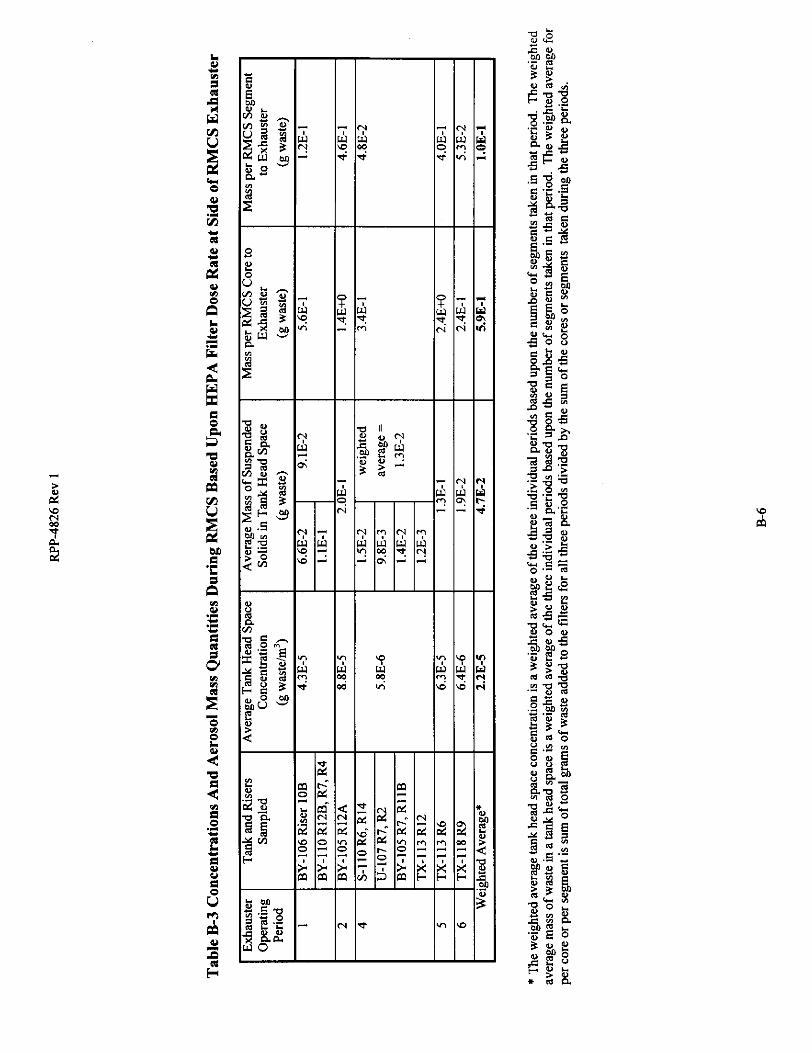
RPP-4826 Rev 1
exceeding 73 For conservatism a sampling efficiency of 50 was assumed in this document for the CGM filter paper method
The estimated Csrdquorsquo total alpha and total beta concentrations in the tank vapor space were calculated by dividing the radionuclide quantity on the filter paper from Table C-2 by the assumed CGM sampling efficiency of 05 and the volume of gas going to the CGM The volume of gas going to the CGM was calculated by multiplying the time of CGM operation from Table C-2 by the CGM flow rate of 500 mlmin For example the calculated SX- 101 head space C~rsquorsquo~concentration based upon analysis of the CGM filter papers used during RMCS of riser 19 is
[[26E-4 pCi + 051 + [[I755 min][500 mlmin]] = 59E-I0pCiml
All radionuclide concentrations were calculated in a similar fashion Results are given in Table C-3 Table C-3 lists the radionuclide concentrations for all 42 data points The eight radionuclide concentrations not used for estimating mass concentrations are noted
Table C-3 also contains the calculated number of tank head space changeouts by the tank exhauster during CGM operation Tank head space changeouts were calculated by multiplying the exhauster flow rates (in actin) from Table F-1 by the CGM run times from Table C-2 and dividing by the tank head space volumes from Table F-2 The number of tank head space changeouts during CGM operation was used when estimating the waste mass sent to the exhauster See Aerosol Calculations section below for explanation
Aerosol Calculations
Average tank head space mass concentrations based upon CGM filter paper data were calculated by dividing the head space radionuclide concentrations from Table C-3 by the waste specific activities for each tank sampled The waste specific activities used came from Table E-I and are listed again in Table C-I The average of the mass concentrations based upon radionuclide data for each tank was used as the average head space mass concentration for that tank For example the calculated SX-IO1 head space mass concentration analysis from the CGM filter papers used during RMCS of riser 19 is
[59E-10 pCi Csrdquorsquoml+ 112 pCi C S rdquo ~ ~ waste] [ 28317 mlftrsquo] = 1 SE-7 g wasteA3 based upon C S rdquo ~
[ I 7E-I I pCi T A M + 504E-1 pCi TAg waste] [ 283 17 mlftrsquo] = 94E-7 g wasteamprsquo based upon Total Alpha
[43E-9 pCi TBml+ 357 pCi TBg waste] [ 28317 mlArsquo] = 34E-7 g wastel based upon Total Beta
[ [ I 5E-7 + 94E-7 + 34E-7 g wasteArsquo] f 31 = 48E-7 g wasteamp
[48E-7 g wastelt ] [3531467 Arsquom3] = 17E-5 g wastemrsquo
All tank head space mass concentrations were calculated in the same manner The results are presented in Table C-4 The weighted average tank head space mass concentration during RMCS was based upon the number of RMCS segments taken for each data point
The average aerosol mass in the head space during RMCS was calculated by multiplying the average tank head space mass concentration by the tank head space volume from Table F-2 For the same data point as above
[48E-7 g waste Arsquo] [115E+5 Arsquo] = 55E-2 g waste in SX-IO1 head space during RMCS
All average mass quantities present in the tank head space during RMCS were calculated in the same manner using a spreadsheet The results are provided in Table C-4 The weighted average mass of waste in a tank head space in Table C-4 was calculated based upon the number of segments obtained for each data point
Estimation of the mass of waste sent to the exhauster per RMCS core or segment requires calculation of the total mass of waste sent to the exhauster Multiplying the average head space concentration during RMCS by the exhauster flow rate (in acfm) and the time of CGM operation will give the mass of waste sent to the exhauster during the CGM time frame only While the large majority of mass of waste aerosols will have exited the tank or
c -2
RPP-4826 Rev I
resettled by the time the CGM is shut off there could be some residual suspended particles remaining These would eventually pass to the exhauster but would not be picked up by the CGM filter since it was not in service An adjustment factor was used as described in the following paragraphs to account for particles that may exit to the exhauster following shut down of the CGM
Particulates are generated by RMCS when purge gas is blowing out the drill string and the bit is rotating under the waste surface This time averages about six minutes per segment Multiplying the number of RMCS segments per core by six minutes per segment and dividing by the number of minutes of CGM operation shows the creation of particulates will only occur during a nominal 3-4 of the time the CGM is operating During RMCS the normal practice is to install the CGM turn it on when personnel enter a tank farm and keep the unit in constant operation for the remainder of the shift When the portable RMCS exhauster is used the exhauster is normally started at least an hour before RMCS is initiated and kept in operation until it is time to halt operations for the week The SX exhauster is kept in constant operation Comparing exhauster operating times from Tables F-l with CGM operating times from Table C-I it can be seen the CGMs are in operation about 3-15 of the time the RMCS exhauster is operating on a tank This time comparison wasnrsquot estimated for the SX exhauster since the SX exhauster is in constant operation
With CGM operation much longer than the time period when particulates could be generated the majority of particulates generated by RMCS should have settled or been exhausted during the CGM operating period Table C-3 shows the tank head space changeouts made by the exhauster during CGM operating periods ranged from 084 to 63 The average was 24 With the CGMs operating 25-33 times longer than the aerosol generation periods and an average of over two tank head space changeouts during CGM operation the large majority of aerosols generated during RMCS will have settled out or been removed by the exhauster by the time the CGM is shut off To account for particulates remaining in the tank head space after the CGM was turned off that are subsequently removed by an exhauster it was conservatively assumed that 20 of the total mass of particles generated during RMCS were not removed from the tank head space during the CGM operating period Therefore the product of the tank head space concentration and the volume of air sent to the exhauster during the time of CGM operation was multiplied by a factor of 125 (lOOl80) to estimate the total mass of waste sent to the exhauster as a result of RMCS This is shown below for the same SX-IO1 riser 19 data point in the above calculations
[48E-7gA3] [IOOmin] [I755 min] [125]= 11E-l gwastetoexhauster
This value was divided by the number of RMCS cores and RMCS segments from Table C-1 to provide the grams per core and grams per segment in Table C-4 as follows
[ I I E- 1 g waste to exhauster] i 1 core = 11 E-I g wastelRMCS core to exhauster
and
[ 1 I E- 1 g waste to exhauster] + 5 segments = 2 I E-2 g wastelRMCS segment to exhauster
All mass per core and mass per segment values were calculated in the same manner using a spreadsheet The results are provided in Table C-4 The weighted average mass per core and mass per segment in Table C-4 were calculated based upon the number of cores or segments obtained for each data point
Summary of Calculations
There were 34 valid CGM filter paper data points from 14 RMCS CGM sampling periods in eight tanks during which I5 RMCS cores and 79 RMCS segments were obtained Based upon CGM filter paper data the results indicate that
The average tank head space mass concentration during RMCS was 4OE-5 g wastem3 The average mass of suspended solids in the tank head space during RMCS was 97E-2 g waste The average mass sent to the exhauster during RMCS was 18E-1 g wastelRMCS core The average mass sent to the exhauster during RMCS was 34E-2 g wastelRMCS segment
c - 3
RPP-4826 Rev 1
Ignoring all CGM filter paper analytical data points with a variance gtloo will result in conservative results These data points indicate negligible radioactivity was present If a value of zero was assigned to each data point with an analytical error of gtloo instead of ignoring the data point the weighted average particulate quantities in Table C-4 would be reduced by about 12
The average tank head space mass concentrations based upon CGM data will be higher than the average tank head space mass concentrations based upon filter housing NDA or dose rate The RMCS exhauster received tank air from the shifts when sampling was performed and during some of the off-shifts when no sampling was done The CGMs were only operated during the shifts when sampling was performed The air concentration drawn into the CGM and the RMCS exhauster should be roughly the came during the operating shifts but somewhat less during the off-shifts Therefore the tank head space concentration will be higher when based upon CGM data This does not impact the mass of waste sent to the exhauster per core or per segment
c -4
I
- ~
RFP-4826 Rev 1
APPENDIX D
ESTIMATION OF Rh4CS EXHAUSTER HOUSING DECONTAMINATION FACTOR
D-0
RFrsquoP-4826 Rev 1
APPENDIX D - Estimation of RMCS Exhauster Housing Decontamination Factor
Summary of Method
This Appendix estimates a Decontamination Factor (DF) for the RMCS exhausters using housing NDA data and applicable stack record sample data The Csrdquorsquo in the exhauster effluent is divided by the C S rdquo ~ in the exhauster inlet to provide a penetration efficiency The reciprocal ofthe penetration efficiency is the DF
Description
Each RMCS exhauster has an isokinetic sampler located on the stack downstream of the blower and HEPA filters A small pomp pulls air from the exhaust stack into a filter paper at a rate proportional to the exhaust flow Radionuclides in the exhaust stream passing through the sample line are caught on the filter paper The stack operating time and flow rate are recorded When the record sample filter paper is removed the filter paper is analyzed in a laboratory for radionuclides The radionuclide concentration in the stack effluent stream is calculated by dividing the quantity of material on the filter paper by the volume of air through the sampler and then dividing again by a factor to compensate for stack sampler and filter paper efficiency
Multiplying the total beta stack effluent concentration by the total off gas flow gives the total beta emissions from the exhauster The total beta emissions are multiplied by the Csrdquorsquo to total beta ratio for the waste in the tank) being exhausted to give an estimate of the C S rdquo ~ emission The C S rdquo ~ on the filters determined by NDA of the housing (see Appendix A) is added to the C S rdquo ~ emissions to give the total C S rdquo ~ input to the filter housing Dividing the emissions by the input gives the filter housing penetration efficiency Subtracting the penetration efficiency from 1 O gives the filter housing efficiency Dividing 1 O by the penetration efficiency gives the DF
RMCS Stack Record Sample Data
RMCS exhauster stack record samples are taken after completion of each sampling event on a tank Normally this is after all cores on that tank have been obtained but for BY-IO5 in 1998 record samples were taken following each core Record samples are also taken at the end of each year All samples are analyzed for total alpha and total beta At the end of each year all the filter papers for that year are composited and analyzed for individual radionuclides Sample results are entered into the Automated Bar Coding of Air Samples at Hanford (ABCASH) and Environmental Release Summary (ERS) databases Several ofthe filter papers from 1998 were reanalyzed using a longer count time to bring the error rate down
Schofield 2000b compiled and evaluated all available RMCS exhauster stack record sample data filtered out the unusable data provided derivation for the stack sampling efficiency factor and summarized the results Most of the data points were so low as to be unusable since the results were either negative or had error variances gtloo
Column 5 of Table D-1 provides the stack effluent concentrations used for calculation of the filter housing DF The stack effluent data in Table D-l come from Schofield 2000b These values include a 073 sampling efficiency factor
Calculation of RMCS Filter Housing Decontamination Factor Based upon Housing Inlet and Outlet Data
The RMCS exhauster housing NDA and stack record sample data available for exhauster Operating Periods 4 5 and 6 were used to estimate an actual DF for the RMCS exhauster housings The housing NDA data is for CSrdquo~ but there are no usable Csrdquorsquo concentrations for the RMCS exhauster outlet The RMCS exhauster stack Csrsquordquo concentrations are either negative have a variance gtloo or are not available Total beta analyses are available however so the stack eftluent C S rdquo ~ concentrations were estimated by multiplying the total beta concentration by the ratio of Csrdquorsquo to total beta in the tank waste
Column 2 of Table D-l lists the increase in CSrsquo~ on the filters for each operating period as determined by NDA This data was obtained from Table A-2
D- 1
RPP-4826 Rev 1
Column 4 of Table D-l lists the stack exhaust volume for each stack record sample period The stack exhaust volume for the exhauster installation on S-l IO was calculated by
[ZOO std ft3min][15978 hrs] [60 minhr] = 199E+6 std ftrsquo
All other stack volumes in Table D-l were calculated the same way Unlike in Appendices A B and C no adjustment was made to change the 200 scfm to actual cfm This is because the RMCS stack record sample concentrations from Table D-3 are based upon a 200 scfm flow rate rather than the actual flow rate Since the concentrations are on the same basis as the flow rate there is no need to correct to acfm
The total beta emissions for the RMCS exhauster stack were calculated by multiplying the volume by the concentration For the same S-l IO data point
[199E+6 ft3] [18E-15 pCiml] [28317mlft3] [mCi1000 pCi] = 1OE-7 mCi total beta
All other total beta emissions in Table D-l were calculated the same way
The Csrdquorsquo to total beta ratio was calculated from data in Table E-I For the same S- l I O data point
326E+5 Ci CsI3rsquo f I 14E+6 Ci total beta = 029 Ci CslhCi total beta = 029 rnCi CsrdquorsquomCi total beta
The Csrsquordquo emission for the same S-l IO data point was thus
[I OE-7 mCi total beta] [029 mCi CsrdquorsquomCi total beta] = 29E-8 mCi Csrdquorsquo
All Csrsquordquo emissions in Table D-l were calculated in the same manner
The penetration efficiency for each operating period was calculated by dividing the exhauster outlet by the filter inlet Csrdquorsquo quantities For operating period 4 this was
[81E-6 mCi] f [5OE-I + 8IE-6 mCi] = 16E-5 = 16E-3
The DF for operating period 4 is
1 + 16E-5 = 62E+4
The overall DF for periods 4 5 and 6 was calculated by dividing the efluent from all three periods by the total filter input
[95E-6 mCi] f [67E-I t 95E-6 mCi] = 14E-5 = 14E-3 penetration efficiency
I - I 4E-5 = 0999986 = 999986 filter efficiency
1 f 14E-5 = 73E+4 decontamination factor based upon housing inlet and eftluent data
Estimation of Housing Decontamination Factor Based upon General Performance Data
HEPA filters are tested at the manufacturer to a minimum 9997 efficiency using a 03 pm monodisperse aerosol After installation HEPA filters are tested in-place per ASME N5 I O to a minimum 9995 efficiency using a polydisperse aerosol with an approximate droplet size distribution of 99 less than 30 pm 50 less than 07 pm and 10 less than 04 pm The RMCS exhauster housing is tested per ASME N510 and is thus required to have a minimum removal eficiency of 9995 for an aerosol with this approximate size distribution The particle size distribution of the waste aerosols generated by RMCS is unknown but it is assumed that the removal efficiency for RMCS generated aerosols was the same as the removal efficiency for the ASME generated test aerosol
D-2
RPP-4826 Rev I
A 9995 efficiency is equivalent to a DF of 2E+3 while a 9997 efficiency is equivalent to a DF of 33E+3 The actual DF for the RMCS exhauster housing is higher than either of these It has two HEPA filters in series even though the minimum efficiency specified in the NOCs for the RMCS exhausters is only equivalent to one HEPA ERDA 1976 recommends using a DF of 3000rdquo for a filter bank where n is the number of HEPA filters in series This would result in a DF of 9E+6 for the RMCS exhauster housing This is unrealistic Using a DF of 9E+6 will calculate to Csrdquorsquo quantities on the HEPA filtersthat are orders of magnitude above what have been shown to be there based upon the measured dose rates and NDA A DF of 9E+6 would mean the dose rate would have to be almost 100 mRhr at the side of the exhauster housing instead of the 05-08 mRhr dose rates encountered The waste particles will not have the same particle size distribution entering the second HEPA filter as when entering the first The majority of the waste particles will be captured on the I rdquo HEPA filter and although the DF for each HEPA if tested individually using the ASME N5 IO aerosol test method may be 3E+3 (or higher) the overall DF of the two filters in series will not be 3000lsquo This is because the particle size distribution entering the Znd HEPA could have a greater percentage of smaller particles than that entering the 1rdquo
NUREG 1995 included an evaluation of a number of different facility stacks at the Hanford site where the HEPA filter upstream air concentrations were estimated using several different methods This report concluded that back-calculation using a value of 3000rdquo overestimated the upstream radionuclide concentration by three to four orders of magnitude when compared to filter NDA data for the nine stacks for which NDA data were obtained and by three orders of magnitude for the two stacks for which upstream air sample data were available Back- calculation using a value of 3000rdquo was shown to be high by four orders of magnitude for the single stack for which a powder release estimate was available Based upon this information the RMCS exhauster dual filter-in-series housings would have a DF of at least three and maybe four orders of magnitude less than 9E+6 or in the 1E+3 to 1 E+4 range A DF of IE+3 would he less than the minimum permissible under the NOC Comparing the older stack data and design with the newer RMCS exhauster design the minimum DF would be expected to be at least 1E+4
Table D-2 provides the available RMCS exhauster aerosol test data This information was obtained from Waldo 1999 Prior to 1998 the RMCS exhauster primary HEPA filter efficiency and either the secondaly HEPA filter or the overall efficiency for both filters were tested Starting in 1998 only the primary and secondary HEPA filter efficiency were measured The overall efficiency of the two filters in series was only measured three times in 11 setups Twice the overall penetration efficiency was lt0002 and the remaining time the only information that could be found was a value of lt005 Most individual filters had a penetration efficiency of 0002 This appears to be about the limit of the detection equipment Based upon Table D-2 data a penetration efficiency of 0002 (99998 efficiency) is normal for a single HEPA and thus a minimum for an RMCS exhauster housing Assuming a 0002 penetration efficiency for the two filters combined calculates to a DF of 5E+4 (equal to 1 +
000002) for the RMCS exhauster housing
In summary the measured DF for the RMCS exhauster housings over the period from May 1998 through June 1999 was about 73E+4 RMCS aerosol testing prior to use indicates a DF of about 5OE+4 for each of the filters separately but their overall efficiency is not measured Referenced data based on older stacks at Hanford indicate the two HEPA RMCS exhauster housing would likely have a DF of at least IE+4
Estimated Aerosol Levels During RMCS Based Upon RMCS Stack Record Sample Data
Revision 0 of this document used the positive record sample results with variance less than 100 to estimate aerosol concentrations in the exhauster inlet using an assumed exhauster housing DF of 5OE+4 This method of estimating aerosols was eliminated from Revision 1 because the stack concentrations were either too low too scattered or too questionable to provide reliable results There were 112 RMCS stack record sample data points evaluated in Schofield 2000b Excluding the total beta sample results used for estimation of the housing DF there were only ten data points remaining with positive values and variances ltloo the remaining data points were either negative had a variance gtloo or the results were not available
For comparison purposes only Schofield 2000b applied the DF of 73E+4 calculated in this document to the data points not used to calculate the exhauster housing DF to estimate aerosol concentrations upstream of the filters The results showed aerosol levels approximately the same as those estimated using NDA dose rate or CGM filter paper data when a value of zero was used for negative sample results or those with a variance gtloo When only
D-3
RPP-4826 Rev 1
the ten positive results with a variance ltloo were used the aerosol levels calculated to be two to five times higher than those estimated using NDA dose rate or CGM filter paper data Because of the variability of data resulting from the extremely low record sample concentrations and the few useable data points estimation of aerosol levels using record sample data was not included in Revision I See Schofield 2000b for further discussion of the use of record sample data to estimate aerosol levels
Summary of Calculations
A total of nine RMCS exhauster stack record sample data points were used to estimate the RMCS exhauster filter housing decontamination factor These data points were obtained when sampling on five tanks during which 10 RMCS cores and 65 RMCS segments were obtained The overall decontamination factor was 73E+4
Estimation of aerosol generation quantities based upon RMCS stack record sample data is possible However results will likely be skewed high if data points that show non-detectable levels of radionuclides present are ignored instead of using a value of zero for the data point
D-4
RPP-4826 Rev 1
APPENDIX E
TANK WASTE RADIONUCLIDE CONCENTRATIONS USED FOR AEROSOL CALCULATIONS
E-0
RPP-4826 Rev 1
APPENDIX E - Tank Waste Radionuclide Concentrations Used for Aerosol Calculations
The RMCS exhauster NDA data HEPA filter dose rate data CGM filter paper data and stack record sample data provide information on the quantity of radionuclides on the exhauster filters in the tank head space or the exhauster stack during RMCS These radioactivity quantities need to be divided by the waste radionuclide concentration specific activity to determine the mass of waste in the tank head space and in the tank gases sent to the exhauster
The mass quantities in this document were calculated using dry basis radionuclide concentrations Waste particles carried into the tank head space by the purge gas could be wet or dry If wet some of the non-chemically bound water will start to evaporate immediately providing the tank relative humidity is 400 The water present in a waste particle may be chemically bound as a hydrate or free The chemically bound water will not readily evaporate therefore even a ldquodryrdquo particle may have some water associated with it It is impractical to measure the actual water content of the waste particulates caught on the CGM filter paper the exhauster HEPA filters or the stack record sample paper Since the quantity of water in the waste particulates is unknown particulate levels were calculated using dry basis radionuclide concentrations Thus all particulate values given in this document are stated on a dry basis
The waste radionuclide concentrations on a dry basis were calculated from data available in the Tank Waste Information Network System (TWINS) The Best Basis InventorylBest Basis Summary numbers were used These values are the most complete and up to date readily available estimates for Hanford waste tank contents but do not include water The information was downloaded from TWINS into a spreadsheet The total chemical total beta and total alpha quantities were summed in the spreadsheet for all the tanks which were sampled and concentrations for Csrdquorsquo Sr9rsquo total beta and total alpha automatically calculated in pCig These concentrations are provided in Table E-I Because lab techniques for measuring gross beta levels only detect beta particles with a minimum decay energy above 150-200 kev only radionuclides with a decay energy of gt-200 kev were included in the total beta numbers
The TWINS radionuclide concentrations were obtained in December 1999 No corrections were made for decay for this document
The CGM filter paper and stack record sample data indicate the measured radionuclide values are not always in the same ratio to each other as given by TWINS nor are all radionuclides detected that TWINS indicates are present Radionuclides can be distributed unevenly in a tank Soluble fission products (primarily Csrsquordquo) are found in the liquid saltcake and in sludges Insoluble fission products and actinides are found largely in sludges as these are primarily chemical precipitates Sludge could be mixed with saltcake be present in a distinct layer at the bottom of a tank or in several layers in the tank depending upon how waste was transferred into a tank Waste particles may thus not have the same specific activity on a microscopic scale as they would have on a macro scale were the tank contents homogenized During RMCS a top to bottom core sample is attempted resulting in the drill bit and purge gas (which causes aerosols to form) passing through most ofthe waste matrix Assuming the aerosol generation rate is approximately constant during drilling the specific activity of a radionuclide in the suspended solids should be roughly the same as the average specific activity of the same radionuclide in the tank waste While the waste specific activity is probably not homogeneous from top to bottom in a tank and the aerosol generation rate will likely also vary it is beyond the scope of this document to provide an in-depth analysis of all the factors affecting aerosol radionuclide concentration Although sample radionuclide data were not always in the same ratio as provided by TWINS for the purpose of this document the simplifying assumption was made that the average tank specific activity is adequate to provide an approximation of the suspended solids specific activity for all radionuclides Average tank individual radionuclide specific activities were used in the preparation of the exhauster NOCs
The aerosol calculations presented in this document are only as accurate as the TWINS data The combined radionuclide content of all Hanford waste tanks is known fairly well since the overall content is based upon reactor production records CsrdquorsquoSrW recovery data and processing plant discharges Thus TWINS data for all tanks combined should be reasonable There are undoubtedly differences between TWINS data and the actual contents of a specific tank While the specific tank radionuclide data from TWINS used in this document may not be exact deviations from the actual concentrations are assumed to balance out over the number of tanks sampled
E- 1
RPP-4826 Rev 1
APPENDIX F
ROTARY MODE CORE SAMPLING EXHAUSTER AND CORE SAMPLE DATA
F-0
RPP-4826 Rev 1
APPENDIX F - Rotary Mode Core Sampling Exhauster and Core Sample Data
This appendix provides the basic data obtained during RMCS operations which was used in preparation of this document
Basic Operational Data
There have been three RMCS exhausters and three RMCS sampling trucks deployed since starmp of nitrogen- purged RMCS in November 1994 The exhausters are formally designated 296-P-32296-P-33 and 296-P-34 These were originally referred to as parts of RMCS Systems 2 3 and 4 respectively in the Notices of Construction (NOC) for these units The exhauster designations were changed for routine field use in 1996 to exhausters A B and C to avoid confusion with core sampling trucks 23 and 4 since any exhauster could be used with any RMCS truck Exhauster A (2) and RMCS Truck2 have not been used for RMCS since 1995 and are no longer in service for core sampling
Rotary mode core sampling has been conducted in four general time frames since 1994 These time frames were separated by down times for equipment modifications or resolution of environmental permitting and safety concerns For ease of analysis in this document exhauster operations were organized into six distinct operating periods Periods I to 6 were grouped based upon times when the same exhauster and same set of HEPA filters were being used These periods thus overlap with the general operating time frames The four operating time frames were
The first time frame lasted from November 1994 to January 1995 RMCS Truck 2 and Exhauster 2 (A) were used on Tank BY-106 along with an in-tank prefilter This tank provided the initial deployment and testing of the nitrogen-purged equipment in a waste tank During this period radiation dose rates were taken at the side of the exhauster housing Stack record samples were taken in December 1994 and January 1995
The second time frame lasted from July 1995 through October 1995 RMCS Trucks 2 and 4 were used with Exhausters 2 and 3 (A and B) on BY-105 BY-IO8 and BY-I IO During this period radiation dose rates were taken at the sides of the exhauster housings Stack record samples were taken after completion of sampling on each tank No RMCS samples were taken from BY-108 all samples were taken in push mode for this tank
The third time frame began when RMCS was restarted in December 1997 Trucks 3 and 4 were used for sampling of SX-101 SX-103 SX-105 and SX-102 with the SX tank farm exhauster providing ventilation The RMCS exhausters were not used During this period radiation dose rates were taken at the sides of the SX exhauster housing as part of HPT routine surveys SX farm exhauster stack record samples were taken when required by normal operating procedures SX record sampler and filter housing dose rate data were not evaluated for this document It would not be practical using filter dose rate or stack record sample data to estimate the RMCS aerosol addition if any to the SX ventilation system The background radiation around the SX filter housing makes measurement of any small increase in dose rate very difficult to detect The number of tanks being ventilated and the involved off-gas header routings (the exhauster is pulling on thirteen tanks in series or in parallel with the tank being sampled) and any in-tank activities in the SX tanks not being sampled would make it impractical to assess what aerosols resulted from RMCS Beginning with RMCS in SX farm radionuclide analyses were performed on the filter papers protecting the CGMs which draw air out of the tank vapor space for flammable gas detection
The fourth time frame began in May 1998 Between 1095 and 598 Exhausters B and C were extensively modified with new filter housings and other equipment to meet new NOC requirements Trucks 3 and 4 were used with Exhausters B and C (3 and 4) on S-l IO U-107 BY-105 TX-113 and TX-I 18 This period marked the first use ofthe RMCS trucks and RMCS exhausters together following resolution of flammable gas concerns and modifications to the exhausters New filters were installed Radiation dose rates were taken at the sides of the exhauster housings Stack record samples
F- 1
RPP-4826 Rev I
were taken after completion of sampling for each exhauster installation Radionuclide analyses were performed on the CGM filter papers for all tanks except TX-118 An NDA was performed on the Exhauster C housing following completion ofthe first core on TX-I 13 The housing filters when assayed contained aerosols captured by the exhauster following RMCS in S-l IO U-107 BY-105 (1998) and the first core of TX-I 13 Another NDA was performed on Exhauster C following both cores in TX-I 18 An NDA was performed following sampling of the second core in TX-I 13 using Exhauster B The time frame ran through early June 1999 No RMCS samples have been taken after June 1999 nor are any planned for the next few years
For the purposes of evaluating aerosol formation based upon RMCS exhauster housing NDA and dose rate data the exhauster operations were grouped into 6 operating periods These periods are shown in Table F-1 and restated in Tables A-I and B-I All tanks sampled in Periods 1 2 4 5 and 6 were exhausted by the same exhauster with the same housing and filters present during that period Period 3 covered the time the SX exhauster was used during RMCS in SX farm
A brief description of each RMCS tank sampling operation is provided below
Tank 241-BY-1061194 to 1294 RMCS using the nitrogen purge gas system with an exhauster was formally begun on 111794 on tank BY-106 riser IOB Exhauster 2 (A)and Truck 2 were used A sintered metal prefilter was inserted in the riser between the tank and the exhauster A total of eight segments were taken in rotary mode and five segments in push mode until sampling was halted on 122194 One RMCS core was obtained The total exhauster run time was 4878 hours The stack record sample was removed and analyzed following this run period Dose rates taken at the side of the exhauster housing during RMCS were all lt05 mRhr The in-tank prefilter was smeared for contamination when removed from the tank with the smears showing less than detectable levels of radionuclides present (Waldo 1999) The prefilter had been washed with an installed spray system prior to removal from the tank but subsequent testing showed the water flow and pressure were too low to have been effective at removing contamination
Tank 241-BY-106195 Following some process modifications RMCS in BY-IO6 riser IOB began again on 11895 Exhauster 2 (A) and Truck 2 were used The sintered metal prefilter was inserted in the riser between the tank and the exhauster RMCS was halted on 12495 over authorization basis and equipment operability issues for RMCS A total of three segments were taken in rotary mode and eleven segments in push mode One RMCS core was obtained The total exhauster run time was 1867 hours The stack record sample was removed and analyzed following this run period Dose rates taken at the side of the exhauster housing during RMCS were all lt O S mRhr The in-tank prefilter was smeared for contamination when removed from the tank with the smears showing less than detectable levels of radionuclides present (Waldo 1999) The prefilter was not washed this time
Tank 241-BY-110795 to 1095 Following resolution of RMCS authorization basis and equipment issues and completion of the fabrication and testing of Trucks 3 and 4 RMCS was begun in BY-I IO on 71195 Exhauster 2 (A) and Truck 2 were used Samples were taken from risers 128 7 128 again and 4 There was no in- tank prefilter used in this or any subsequent RMCS periods Sampling was performed until 102595 when RMCS was halted over flammable gas issues A total of 13 RMCS segments and 56 PMCS segments were taken Three RMCS cores were obtained The total exhauster run time was 1125 hours The stack record sample was removed and analyzed following this run period Dose rates taken at the side of the exhauster housing during RMCS were all lt O S mRhr
Tank 241-BY-108795 to 895 Core sampling was begun in BY-IO8 on 72595 Exhauster 3 (B) and Truck 4 were used Sampling was done in risers 12A and 7 The tank material proved soft enough so that no RMCS segments were required all segments were obtained in push mode although the exhauster was operated during part of the time sampling was performed Sampling was completed 81895 A total of 16 PMCS segments were taken The total exhauster run time was 6617 hours The stack record sample was removed and
F-2
RPP-4826 Rev 1
analyzed following this run period Dose rates taken at the side of the exhauster housing during RMCS were all lt05 mRhr
Tank 241-BY-105895 to 1095 RMCS was begun in BY-I05 riser 12A on 83095 Exhauster 3 (B) and Truck 4 were used This tank has a concrete layer on top about 12-18 inches thick which had to be drilled through Part way through sampling questions arose as to the flammable gas status of the tank and RMCS was halted on 10695 A total of 3 RMCS and 7 PMCS segments were taken One RMCS core was obtained The total exhauster run time was 4413 hours The stack record sample was removed and analyzed following this run period Dose rates taken at the side of the exhauster housing during RMCS were all lt05 mRhr
Tank 241-SX-1011297 to 298 Following resolution of extensive regulatory and authorization basis issues and installation of equipment modifications RMCS started in SX-101 with Truck 4 on 12497 An RMCS exhauster was not used since all SX farm tanks excluding SX-113 and SX-I 15 are ventilated with the SX exhauster Sampling was performed in risers 19 and 4 and was completed on 21098 A total of 9 RMCS and 6 PMCS segments were taken Two RMCS cores were obtained SX exhauster stack record samples and filter housing dose rates were obtained as part of routine operations for the SX exhauster not as part of the RMCS process Filter papers used in the suction line for the CGM were saved and analyzed in the laboratory to estimate the airborne radionuclide concentration in the tank head space Two CGM filter papers were needed for each core as moisture in the tank vapors condensed on the papers in the cold weather and began to restrict tank gas flow to the CGM
Tank 241-SX-103498 to 598 RMCS started in SX-103 with Truck 4 on 42798 The SX exhauster was used for ventilation (see SX- 101 above) Sampling was performed in risers 7 and 1 1 and was completed on 51198 A total of 6 RMCS and 18 PMCS segments were taken Two RMCS cores were obtained During sampling filter papers used in the suction line for the CGM were saved and analyzed in the laboratory to estimate the airborne radionuclide concentration in the tank head space One CGM filter paper was used during each core SX exhauster stack record samples and filter housing dose rates were obtained as part of routine operations for the SX exhauster not as part of the RMCS process
Tank 241-SX-105298 to 598 RMCS started in SX-105 with Truck 3 on 22598 The SX exhauster was used for ventilation (see SX- 101 above) Sampling was performed in risers 6 and 14 and was completed on 51598 A total of 6 RMCS and 20 PMCS segments were taken Two RMCS cores were obtained During sampling filter papers used in the suction line for the CGM were saved and analyzed in the laboratory to estimate the airborne radionuclide concentration in the tank head space Two filter papers were needed for the first core as moisture in the tank vapors condensed on the papers in the cold weather and began to restrict tank gas flow to the CGM One filter paper was used for the second core SX exhauster stack record samples and filter housing dose rates were obtained as part of routine operations for the SX exhauster not as part of the RMCS process
Tank 241-SX-102698 to 798 RMCS started in SX-102 with Truck 4 on 61798 The SX exhauster was used for ventilation (see SX- 101 above) Sampling was performed in risers 8 and 4 and was completed on 7798 A total of 2 RMCS and I8 PMCS segments were taken Two RMCS cores were obtained During sampling filter papers used in the suction line for the CGM were saved and analyzed in the laboratory to estimate the airborne radionuclide concentration in the tank head space One filter paper was used for each core SX exhauster stack record samples and filter housing dose rates were obtained as part of routine operations for the SX exhauster not as part of the RMCS process
Tank 241-S-110598 to 698 RMCS was begun in S-I10 on 51898 Exhauster C (4) and Truck 3 were used This tank marked the first use of an RMCS exhauster since 1995 Sampling was completed on 6498 Risers 6 and 14 were sampled A total of IO RMCS and 8 PMCS segments were taken Two RMCS cores were obtained The
F-3
RPP-4826 Rev I
total exhauster run time was 15978 hours The stack record sample was removed and analyzed following this run period Dose rates taken at the side of the exhauster housing during RMCS were all lt05 mRhr During sampling filter papers used in the suction line for the CGM were saved and analyzed in the laboratory to estimate the airborne radionuclide concentration in the tank head space One filter paper was used for each core Waste particles retained on the exhauster housing filters were part of the inventory subsequently measured by NDA following completion of the first core in TX-I 13
Tank 241-U-107698 to 798 RMCS was begun in U-107 on 61098 Exhauster C and Trucks 3 and 4 were used Sampling was completed on 71598 Risers 7 and 2 were sampled A total of IO RMCS and 19 PMCS segments were taken Two RMCS cores were obtained The total exhauster run time was 27385 hours The stack record sample was removed and analyzed following this run period Dose rates taken at the side of the exhauster housing during RMCS were all 105 mRihr During sampling filter papers used in the suction line for the CGM were saved and analyzed in the laboratory to estimate the airborne radionuclide concentration in the tank head space One filter paper was used for each core Waste particles retained on the exhauster housing filters were part of the inventory subsequently measured by NDA following completion of the first core in TX-I 13
Tank 24l-BY-105798 to 898 RMCS was begun in BY-105 again on 72298 Exhauster C and Trucks 3 and 4 were used Sampling was completed on 82598 Risers 7 and 1 1 B were sampled A total of 18 RMCS and 18 PMCS segments were taken The material was hard enough to require rotary mode sampling all the way to the bottom of the waste but negligible recovery was obtained After RMCS was performed to the waste bottom a PMCS core was taken in the same hole to recover material Two RMCS cores were obtained The exhauster run time was 13577 hours for the first RMCS core and 30792 hours for the second RMCS core Stack record sample information in ABCASH shows 30558 hours operation for the second core but the sampler data sheet shows the time counter was mistakenly reset 234 hours into the run No correction was made to the BY-IO5 2nd core record sample concentration for this document since the error is conservative and results in only slightly higher (ltI) record sample radionuclide concentrations for this core A stack record sample was removed and analyzed following each core giving two record samples for BY-IO5 in 1998 Dose rates taken at the side of the exhauster housing during RMCS were almost all lt05 m R h but a few readings indicated 07 mRihr This variation was assumed due to personnel reading the instrument differently or the fact that the exhauster had been used on enough tanks that by now there was sufficient activity on the filters to cause readings approximately at the background detection level The final reading when both cores were completed was lt05 m R h During sampling filter papers used in the suction line for the CGM were saved and analyzed in the laboratory to estimate the airborne radionuclide concentration in the tank head space One filter paper was used for each core Waste particles retained on the exhauster housing filters were part of the inventory subsequently measured by NDA following completion of the first core in TX-113
Tank 241-TX-113998 to 599 Core sampling was begun in TX-I 13 riser 3 on 92298 Exhauster B (3) and Truck 4 were used at the start This was the first use of Exhauster B since it was modified Exhauster B ran for a total of 8738 hours until being disconnected on 102398 During this time two PMCS segments were taken and no RMCS segments Exhauster C was then installed and operated for 5598 hours from 121098 to 122898 No RMCS or PMCS sampling was performed during this time frame RMCS segments werent taken until 299 Exhauster C ran for a 30230 hours between 122898 and 21299 Sampling was completed on the core from riser 3 on 21299 A total of 12 RMCS segments were obtained during the time Exhauster C was operating Exhauster flow rate for both exhausters was a nominal 200 scfm Stack record samples were taken following Exhauster B removal at the end of 1998 for Exhauster C and following completion ofthe first core with Exhauster C Aerosol calculations were based on only the 30230 hours run time for Exhauster C in 1999 since this was the time period during which RMCS segments were obtained Dose rates taken at the side of the exhauster housing during the short PMCS only sampling period with Exhauster B were all ltOS m R h Dose rates with Exhauster C varied between lt O S mRhr and 07 mRhr The final reading on Exhauster C following completion of the first core was 07 mFUhr During sampling filter papers used in the suction line for the CGM were saved and
F-4
RPP-4826 Rev I
analyzed in the laboratory to estimate the airborne radionuclide concentration in the tank head space One filter paper was used for the core Waste particles retained on the exhauster housing filters were part of the inventory subsequently measured by NDA following completion of this core
Sampling in riser 5 was begun on 41299 using Exhauster B and Truck 3 A total of 6 RMCS and 1 PMCS segments were taken for this core before sampling was halted on 42899 The total exhauster run time for this core was 11712 hours Problems with high vacuum in the tank required the exhauster flow rate to be reduced to 190 scfm to keep the system within pressure limits The stack record sample for the second core was removed and analyzed following the run period Dose rates taken at the side of the exhauster housing during the second core were all lt05 m M r During sampling filter papers used in the suction line for the CGM were saved and analyzed in the laboratory to estimate the airborne radionuclide concentration in the tank head space One filter paper was used An NDA was performed on the exhauster housing following this core The only radionuclides present in the housing were those from this core or what was removed from the tank head space during the non-RMCS activities in this tank from 92298 and 102398
Some clarification may be needed to explain use of the exhauster operating times and NDA dose rate and record sample data obtained during core sampling on TX-I 13 Core sampling was set up for sampling riser 3 on TX-113 in September 1998 with Exhauster B Exhauster B operated for a total of 8738 hours between 92298 and 102298 The stack record sample was removed at the end of this period The ERS database incorrectly shows the exhauster operated between 111698 and 111998 The ABCASH database shows the stack record sample was removed on 111998 The stack record sample showed positive emuent concentrations during this time period with variances 400 No RMCS samples were taken during this period so the data and time werenrsquot included when calculating RMCS aerosol numbers Exhauster B was removed and Exhauster C installed in late November-early December Exhauster C was operated for a total of 5559 hours between 121098 and 122398 The stack record sample was removed on 122898 No sampling was performed during this period so the data and time werenrsquot included when calculating RMCS aerosol numbers Exhauster C was operated for a total of 30218 hours between 122898 and 2899 All the RMCS segments from riser 3 were taken in this time period so only the data and time for this period were included when calculating RMCS aerosol numbers Exhauster B was used during sampling of riser 5 Exhauster B operated for a total of 11712 hours between 41299 and 42899
Tank 241-TX-l18599 to 699 RMCS was begun in TX-I 18 on 5699 Exhauster C (4) and Truck 4 were used Sampling was completed on 6298 Risers 9B and 12B were sampled A total of 9 RMCS segments were taken there were no PMCS segments Two RMCS cores were obtained The total exhauster run time was 21247 hours The stack record sample was removed and analyzed following this run period The maximum dose rate taken at the side of the exhauster housing following RMCS was 08 m M r CGM filter papers were not analyzed An NDA was performed on the exhauster housing following completion of the two cores The exhauster housing contained the same nuclides as for the first NDA (S-110 U-107 BY-105 and TX-I 13 first core) plus those from TX-I 18
The basic core sampling operational data used in this document includes the number of RMCS cores and segments the exhauster run times and flow rates the RMCS exhauster HEPA filter dose rates and tank vapor space temperatures Table F-l lists the basic operational data This information excluding tank vapor space temperature data was obtained from procedural data sheets in the sampling work packages (References W - 1 to WP-23)
Tank temperature data for the tanks ventilated with the RMCS exhausters was obtained from the TWINS database Plots for each tank were prepared for the time RMCS was conducted and the average value of the highest thermocouple located in the tank (the lowest temperature reading) was estimated and used as the average tank head space temperature during the RMCS period
The SX exhauster flow rates listed in Table F-l are estimates only The combined flow rate for SX-IO1 through SX-106 plus SX-109 (7 tanks) averaged 440 cfm during CY 1996 (Kaiser 1997) for an average of 63 cfm per
F-5
RPP-4826 Rev I
tank Based upon inlet flow measurements at the tank inlet HEPA filters (Fanis 1998) the flow through each individual tank (SX-IO1 through SX-106 plus SX-109) was lt55 cfm at the breather filter Assuming an exhaust flow of 100 cfm for each SX farm tank sampled is therefore conservative
Calculated Data
Calculated data include the tank head space volumes conversion of the RMCS exhauster flow rate from scfm to acfm and the number of tank head space changeouts made by an exhauster during RMCS
Tank head space volume includes the dome space volume above the top of the sidewall plus the void space between the waste surface and the top of the sidewall The formula used to calculate tank head space volumes WN
Head Space Volume in A = (DS + [(H) (12) + HI + Hb - H] (V)) - 748
Where DS = dome space volume gal H = height of tank body sidewall above knuckle A HI = height of tank knuckle area in Hb = height oftank bottom below knuckle in H = height of waste in tank in V =27555 galin of waste in SX tanks 2754 gallin in all others
The tank dome space volumes height of tank sidewall above the knuckle height of tank knuckle area and height of tank bottom below the knuckle were obtained from Reynolds 1999 The height of waste in each tank at the time of core sampling was obtained from the TWINS database Tank dimensional and waste level data are given in Table F-2 along with the calculated tank head space volumes
Aerosol calculations for Appendices A-C require exhauster flow rates in actual cubic feet per minute The RMCS exhauster flow rate is controlled and recorded in standard cubic feet per minute The mass flow rate of the exhauster air is measured and internal logic in the exhauster controller calculates what the volumetric flow rate would be if the temperature and pressure in the exhauster inlet were at standard conditions The standard conditions used in the logic controller are 29921 in Hg (760 mm Hg) and 69F (ZIT)
A correction factor is built into the exhauster control logic that assumes an atmospheric pressure of 2927 in Hg the average atmospheric pressure at Hanford The RMCS exhauster will operate at about 1-2 in H20 negative pressure resulting in about a 2916 in Hg pressure in a waste tank when the RMCS exhauster is operating To revise the indicated scfm RMCS exhauster reading to an acfm value the RMCS exhauster scfm flaw rate was multiplied by (29922916)(T+459)528 where Tis the tank head space temperature in OF The tank head space temperatures in Table F-1 were input to the spreadsheet file used for aerosol calculations and converted to acfm The flow rates in acfm are included in Table F-I
The tank head space changeouts when using the RMCS exhauster were calculated by multiplying the exhauster acfm flow rate by the time of exhauster operation and dividing the result by the tank head space volume Tank head space changeouts are listed in Table F-2
F-6
c
gt 2
RPP-4826 Rev 1
APPENDIX G
REFERENCES
G-0
RPP-4826 Rev 1
APPENDIX G - References
Diedeker 1999 NDA of RMCS HEPA Filters L P Diedeker WMH E-Mail to JS Schofield CHG November 29 I999
ERDA 1976 Nuclear Air Cleaning Handbook ERDA 76-21 Buchsted C A Fuller A B and Kahn 1 E Oak Ridge National Laboratory 1976
Farris 1998 Internal Note T R Farris LMHC to J S Schofield LMHC Breather Filter Flow Rates for SX-Farm 31698
Foust 1999 Internal Memo RMCST Exhauster HEPA Filter Dose Rate Calculations D J Foust LMHC to J S Schofield LMHC October 25 1999
Greager 1999 Correspondence No WMH-9954450 Non-Destructive Analysis of the Rotay Mode Core Sample High-Efjiciency Particulate Air Filters E M Greager WMH to P C Miller LMHC June 28 1999 [Transmittal of HNF-4199 Resultsfram NDA Measurement of the 296-P-34 RMCS HEPA Filters]
HNF 1999 HNF-SD-WM-SAR-067 Tank Waste Remediation System Final Safety Analysis Report Rev 1 The revision incorporating RMCS accident analyses was submitted as Addendum 5 to DOE as a change to the FSAR predecessor the Basis for Interim Operation (BIO) LMHC-9857075 80232764-9-KOOl Submittal of Authorization Basis Amendment Package for Rotay and Push Mode Core Sampling in Satisfaction of Perfarmance Agreement TWR 122 Expectations I and 3 D 1 Allen LMHC to A M Umek FDH August 30 1998 Addendum 5 as of mid-January 2000 is waiting for approval by DOE
Kaiser 1997 T D Kaiser LMHC E-Mail to J S Schofield LMHC SX Tank Flow Data 42197
NUREG 1995 Potential Radionuclide Emissionsfrom Stacks on the HanfordSite Part I Dose Assessment Davis W E and Barnett J M Westinghouse Hanford Company from Proceedings of the 23 DOEMRC Nuclear Air Cleaning Conference held July 25-28 1994 February 1995
Schofield 2000a Letter 74910-00-002 Use of Microshield Calculations for RMCS Exhauster Housing for Estimating Radionuclide Quantities on the Filters Using NDA and Dose Rate Measurements I S Schofield CHG to File January 62000
Schofield 2000b Letter 74910-00-003 Rev I RMCS Exhauster Stack RecordSample Data J S Schofield CHG to File January 202000
Reynolds 1999 D R Reynolds LMHC E-Mail to I S Schofield LMHC transmitting Tank Volume Calculations draft of calculations done by Mike Plesha and Reed Hendershot data to be used for RESOLVE computer program for Hanford waste tanks August 3 1999
TWINS Tank Waste Information Network System database available at httptwinspnlgovSOO lhtbinTCDgetTableListexe
Waldo 1999 letter 74910-99-009 RMCS Exhauster Aerosol Test Data E I Waldo to J S Schofield June 22 1999
WHC 1993 WHC-SD-WM-ES-225 Rev I AerosolStudy for the Rotary Mode Exhauster P M Francis Westinghouse Hanford Company April 20 1993
WHC 1997 WHC-SD-WM-SAD-035 Rev Ob A Safety Assessment of Rotary Mode Core Sampling in Flammable Gas Single Shell Tanks Hanford Site Richland Washington August 8 1997
G- I
RPP-4826 Rev I
CGM Data CGM-I Letter PARTICULATE SAMPLING OF 241-SX-IO1 DURING ROTARY MODE CORE SAMPLING D C
Langlois E2 Consulting Engineers to J S Schofield Lockheed Martin Hanford Company March 16 1998
CGM-2 Letter PARTICULATE SAMPLING OF 241-SX-I05 DURING ROTARY MODE CORE SAMPLING D C Langlois E2 Consulting Engineers to J S Schofield Lockheed Martin Hanford Company June 9 1998
CGM-3 Letter PARTICULATE SAMPLING OF 241-SX-103 DURING ROTARY MODE CORE SAMPLING D C Langlois E2 Consulting Engineers to J S Schofield Lockheed Martin Hanford Company June 12 1998
CGM-4 Letter PARTICULATE SAMPLING OF 241-S-110 DURING ROTARYMODE CORESAMPLING D C Langlois E2 Consulting Engineers to J S Schofield Lockheed Martin Hanford Company July 20 1998
CGM-5 Letter PARTICULATE SAMPLING OF 241-SX-102 DURING ROTARY MODE CORE SAMPLING D C Langlois E2 Consulting Engineers to J S Schofield Lockheed Martin Hanford Company July 22 1998
CGM-6 Letter PARTICULATE SAMPLING OF241-U-107 DURING ROTARY MODE CORE SAMPLING D C Langlois E2 Consulting Engineers to J S Schofield Lockheed Martin Hanford Company August 3 1998
CGM-7 Letter PARTICULATE SAMPLING OF 241-BY-105 DURING ROTARY MODE CORESAMPLING D C Langlois E2 Consulting Engineers to 1 S Schofield Lockheed Martin Hanford Company September 17 1998
CGM-8 Letter PARTICULATE SAMPLING OF 241-TX-I13 DURING ROTARY MODE CORESAMPLING D C Langlois E2 Consulting Engineers to J S Schofield Lockheed Martin Hanford Company March 15 1999
CGM-9 Letter PARTICULATE SAMPLING OF 241-TX-113 DURING ROTARY MODE CORE SAMPLING D C Langlois E2 Consulting Engineers to I S Schofield Lockheed Martin Hanford Company May 31 1999
Notices of Construction NOC-I DOEIRL-93-40 Radioactive Air Emissions Program Notice of Construction Rotary Mode Core-Sampling
Truck and Exhauster Approved by Letter AIR 93-707 A W Conklin WDOH to J E Rasmussen DOEIRL 7893
NOC-2 DOEIRL-94-118 Rev 0 Radioactive Air Emissions Program Notice of Construction for the Rotary Mode Core-Sampling Systems Three and Four Approved by Letter AIR 95-603 A W Conklin WDOH to J E Rasmussen DOERL 63095
NOC-3 DOERL-94-118 Rev 1 Radioactive Air Emissions Program Notice of Construction for the Rotary Mode Core-Sampling Systems Three and Four Approved by Letter AIR 98-301 W W Conklin WDOH to I E Rasmussen DOEIRL 3698
NOC-4 DOEIRL-97-70 Radioactive Air Emissions Program Notice of Construction for Rotary Mode Core- Sampling in SX Tank Farm Approved by Letter AIR 97-1 101 A W Conklin WDOH to J E Rasmussen DOEIRL 113097
NOC-5 USEPA Letter OAQ-107 (no title approving DOE submittal 97-EAP-590 dated 72997) A J Frankel USEPA to J E Rasrnussen DOEIRL 8497
NOC-5 USEPA Letter OAQ-107rsquo (nb title approving DOE submittal 97-EAP-723 dated 101797) A J Frankel USEPA to J E Rasmussen DOERL 11498
Note that both letters have ldquoOAQ-107rdquo following ldquoReply to Attn ofrdquo
G-2
RPP-4826 Rev I
Work Packages WP-I ES-94-00808 WP-2 ES-95-00258 WP-3 ES-95-00045 - WP-4 ES-95-00434 - WP-5 ws-97-00173 - WP-6 WS-97-00174 - WP-7 ws-97-00143 - WP-8 WS-97-00144 - WP-9 WS-97-00207 - WP-I 1 WS-97-00208 - WP-12 WS-98-00049 - WP-13 WS-97-00050 - WP-14 WS-97-00224 - WP- I5 WS-97-00225 - WP-16 WS-97-00230 - WP- I7 ws-97-0023 1 - WP-18 ES-97-00452 - WP-19 ES-97-00453 - WP-20 WS-98-00072 - WP-21 WS-98-00073 - WP-22 WS-98-00067 - WP-23 WS-98-00068 -
241-BY-IO6 Perform Rotary Core Sample [Riser IOB] 241-BY-I IO Rotary Core Sample [Risers 12B 7 IZB 41 241-BY-IO8 Obtain Rotary Core Sample [Risers 12A amp 71 241-BY-IO5 Rotary Mode Core Sample [Riser 12A] 241-SX-101 Rotary Mode Core Sample Riser 19 241-SX-101 Rotary Mode Core Sample Riser4 241-SX-103 Rotary Mode Core Sample Riser 7 241-SX-103 Rotary Mode Core Sample Riser I I 241-SX-105 RMCST Obtain Core Sample Riser 6 241-SX-105 RMCST Core Sample Riser 14 241-SX-102 Rotary Mode Core Sample Riser 8 241-SX-102 Rotary Mode Core Sample Riser 4 241-S-1 IO RMCST Obtain Core Sample Riser 6 241-S-1 IO RMCST Obtain Core Sample Riser 14 2414-107 RMCSTCore Sample Riser 7 241-U-107 RMCST Core Sample Riser 2 241-BY-IO5 RMCST Core Sample Riser 7 241-BY-IO5 RMCST Core Sample Riser 1 IB 241-TX-113 Rotary Core Sample Riser 3 241-TX-113 RMCST Core Sample Riser 5 241-TX-I 18 RMCST Core Sample Riser 9B 241-TX-I 18 RMCST Core Sample Riser 128
G-3
RPP-4826 Rev I
resettled by the time the CGM is shut off there could be some residual suspended particles remaining These would eventually pass to the exhauster but would not be picked up by the CGM filter since it was not in service An adjustment factor was used as described in the following paragraphs to account for particles that may exit to the exhauster following shut down of the CGM
Particulates are generated by RMCS when purge gas is blowing out the drill string and the bit is rotating under the waste surface This time averages about six minutes per segment Multiplying the number of RMCS segments per core by six minutes per segment and dividing by the number of minutes of CGM operation shows the creation of particulates will only occur during a nominal 3-4 of the time the CGM is operating During RMCS the normal practice is to install the CGM turn it on when personnel enter a tank farm and keep the unit in constant operation for the remainder of the shift When the portable RMCS exhauster is used the exhauster is normally started at least an hour before RMCS is initiated and kept in operation until it is time to halt operations for the week The SX exhauster is kept in constant operation Comparing exhauster operating times from Tables F-l with CGM operating times from Table C-I it can be seen the CGMs are in operation about 3-15 of the time the RMCS exhauster is operating on a tank This time comparison wasnrsquot estimated for the SX exhauster since the SX exhauster is in constant operation
With CGM operation much longer than the time period when particulates could be generated the majority of particulates generated by RMCS should have settled or been exhausted during the CGM operating period Table C-3 shows the tank head space changeouts made by the exhauster during CGM operating periods ranged from 084 to 63 The average was 24 With the CGMs operating 25-33 times longer than the aerosol generation periods and an average of over two tank head space changeouts during CGM operation the large majority of aerosols generated during RMCS will have settled out or been removed by the exhauster by the time the CGM is shut off To account for particulates remaining in the tank head space after the CGM was turned off that are subsequently removed by an exhauster it was conservatively assumed that 20 of the total mass of particles generated during RMCS were not removed from the tank head space during the CGM operating period Therefore the product of the tank head space concentration and the volume of air sent to the exhauster during the time of CGM operation was multiplied by a factor of 125 (lOOl80) to estimate the total mass of waste sent to the exhauster as a result of RMCS This is shown below for the same SX-IO1 riser 19 data point in the above calculations
[48E-7gA3] [IOOmin] [I755 min] [125]= 11E-l gwastetoexhauster
This value was divided by the number of RMCS cores and RMCS segments from Table C-1 to provide the grams per core and grams per segment in Table C-4 as follows
[ I I E- 1 g waste to exhauster] i 1 core = 11 E-I g wastelRMCS core to exhauster
and
[ 1 I E- 1 g waste to exhauster] + 5 segments = 2 I E-2 g wastelRMCS segment to exhauster
All mass per core and mass per segment values were calculated in the same manner using a spreadsheet The results are provided in Table C-4 The weighted average mass per core and mass per segment in Table C-4 were calculated based upon the number of cores or segments obtained for each data point
Summary of Calculations
There were 34 valid CGM filter paper data points from 14 RMCS CGM sampling periods in eight tanks during which I5 RMCS cores and 79 RMCS segments were obtained Based upon CGM filter paper data the results indicate that
The average tank head space mass concentration during RMCS was 4OE-5 g wastem3 The average mass of suspended solids in the tank head space during RMCS was 97E-2 g waste The average mass sent to the exhauster during RMCS was 18E-1 g wastelRMCS core The average mass sent to the exhauster during RMCS was 34E-2 g wastelRMCS segment
c - 3
RPP-4826 Rev 1
Ignoring all CGM filter paper analytical data points with a variance gtloo will result in conservative results These data points indicate negligible radioactivity was present If a value of zero was assigned to each data point with an analytical error of gtloo instead of ignoring the data point the weighted average particulate quantities in Table C-4 would be reduced by about 12
The average tank head space mass concentrations based upon CGM data will be higher than the average tank head space mass concentrations based upon filter housing NDA or dose rate The RMCS exhauster received tank air from the shifts when sampling was performed and during some of the off-shifts when no sampling was done The CGMs were only operated during the shifts when sampling was performed The air concentration drawn into the CGM and the RMCS exhauster should be roughly the came during the operating shifts but somewhat less during the off-shifts Therefore the tank head space concentration will be higher when based upon CGM data This does not impact the mass of waste sent to the exhauster per core or per segment
c -4
I
- ~
RFP-4826 Rev 1
APPENDIX D
ESTIMATION OF Rh4CS EXHAUSTER HOUSING DECONTAMINATION FACTOR
D-0
RFrsquoP-4826 Rev 1
APPENDIX D - Estimation of RMCS Exhauster Housing Decontamination Factor
Summary of Method
This Appendix estimates a Decontamination Factor (DF) for the RMCS exhausters using housing NDA data and applicable stack record sample data The Csrdquorsquo in the exhauster effluent is divided by the C S rdquo ~ in the exhauster inlet to provide a penetration efficiency The reciprocal ofthe penetration efficiency is the DF
Description
Each RMCS exhauster has an isokinetic sampler located on the stack downstream of the blower and HEPA filters A small pomp pulls air from the exhaust stack into a filter paper at a rate proportional to the exhaust flow Radionuclides in the exhaust stream passing through the sample line are caught on the filter paper The stack operating time and flow rate are recorded When the record sample filter paper is removed the filter paper is analyzed in a laboratory for radionuclides The radionuclide concentration in the stack effluent stream is calculated by dividing the quantity of material on the filter paper by the volume of air through the sampler and then dividing again by a factor to compensate for stack sampler and filter paper efficiency
Multiplying the total beta stack effluent concentration by the total off gas flow gives the total beta emissions from the exhauster The total beta emissions are multiplied by the Csrdquorsquo to total beta ratio for the waste in the tank) being exhausted to give an estimate of the C S rdquo ~ emission The C S rdquo ~ on the filters determined by NDA of the housing (see Appendix A) is added to the C S rdquo ~ emissions to give the total C S rdquo ~ input to the filter housing Dividing the emissions by the input gives the filter housing penetration efficiency Subtracting the penetration efficiency from 1 O gives the filter housing efficiency Dividing 1 O by the penetration efficiency gives the DF
RMCS Stack Record Sample Data
RMCS exhauster stack record samples are taken after completion of each sampling event on a tank Normally this is after all cores on that tank have been obtained but for BY-IO5 in 1998 record samples were taken following each core Record samples are also taken at the end of each year All samples are analyzed for total alpha and total beta At the end of each year all the filter papers for that year are composited and analyzed for individual radionuclides Sample results are entered into the Automated Bar Coding of Air Samples at Hanford (ABCASH) and Environmental Release Summary (ERS) databases Several ofthe filter papers from 1998 were reanalyzed using a longer count time to bring the error rate down
Schofield 2000b compiled and evaluated all available RMCS exhauster stack record sample data filtered out the unusable data provided derivation for the stack sampling efficiency factor and summarized the results Most of the data points were so low as to be unusable since the results were either negative or had error variances gtloo
Column 5 of Table D-1 provides the stack effluent concentrations used for calculation of the filter housing DF The stack effluent data in Table D-l come from Schofield 2000b These values include a 073 sampling efficiency factor
Calculation of RMCS Filter Housing Decontamination Factor Based upon Housing Inlet and Outlet Data
The RMCS exhauster housing NDA and stack record sample data available for exhauster Operating Periods 4 5 and 6 were used to estimate an actual DF for the RMCS exhauster housings The housing NDA data is for CSrdquo~ but there are no usable Csrdquorsquo concentrations for the RMCS exhauster outlet The RMCS exhauster stack Csrsquordquo concentrations are either negative have a variance gtloo or are not available Total beta analyses are available however so the stack eftluent C S rdquo ~ concentrations were estimated by multiplying the total beta concentration by the ratio of Csrdquorsquo to total beta in the tank waste
Column 2 of Table D-l lists the increase in CSrsquo~ on the filters for each operating period as determined by NDA This data was obtained from Table A-2
D- 1
RPP-4826 Rev 1
Column 4 of Table D-l lists the stack exhaust volume for each stack record sample period The stack exhaust volume for the exhauster installation on S-l IO was calculated by
[ZOO std ft3min][15978 hrs] [60 minhr] = 199E+6 std ftrsquo
All other stack volumes in Table D-l were calculated the same way Unlike in Appendices A B and C no adjustment was made to change the 200 scfm to actual cfm This is because the RMCS stack record sample concentrations from Table D-3 are based upon a 200 scfm flow rate rather than the actual flow rate Since the concentrations are on the same basis as the flow rate there is no need to correct to acfm
The total beta emissions for the RMCS exhauster stack were calculated by multiplying the volume by the concentration For the same S-l IO data point
[199E+6 ft3] [18E-15 pCiml] [28317mlft3] [mCi1000 pCi] = 1OE-7 mCi total beta
All other total beta emissions in Table D-l were calculated the same way
The Csrdquorsquo to total beta ratio was calculated from data in Table E-I For the same S- l I O data point
326E+5 Ci CsI3rsquo f I 14E+6 Ci total beta = 029 Ci CslhCi total beta = 029 rnCi CsrdquorsquomCi total beta
The Csrsquordquo emission for the same S-l IO data point was thus
[I OE-7 mCi total beta] [029 mCi CsrdquorsquomCi total beta] = 29E-8 mCi Csrdquorsquo
All Csrsquordquo emissions in Table D-l were calculated in the same manner
The penetration efficiency for each operating period was calculated by dividing the exhauster outlet by the filter inlet Csrdquorsquo quantities For operating period 4 this was
[81E-6 mCi] f [5OE-I + 8IE-6 mCi] = 16E-5 = 16E-3
The DF for operating period 4 is
1 + 16E-5 = 62E+4
The overall DF for periods 4 5 and 6 was calculated by dividing the efluent from all three periods by the total filter input
[95E-6 mCi] f [67E-I t 95E-6 mCi] = 14E-5 = 14E-3 penetration efficiency
I - I 4E-5 = 0999986 = 999986 filter efficiency
1 f 14E-5 = 73E+4 decontamination factor based upon housing inlet and eftluent data
Estimation of Housing Decontamination Factor Based upon General Performance Data
HEPA filters are tested at the manufacturer to a minimum 9997 efficiency using a 03 pm monodisperse aerosol After installation HEPA filters are tested in-place per ASME N5 I O to a minimum 9995 efficiency using a polydisperse aerosol with an approximate droplet size distribution of 99 less than 30 pm 50 less than 07 pm and 10 less than 04 pm The RMCS exhauster housing is tested per ASME N510 and is thus required to have a minimum removal eficiency of 9995 for an aerosol with this approximate size distribution The particle size distribution of the waste aerosols generated by RMCS is unknown but it is assumed that the removal efficiency for RMCS generated aerosols was the same as the removal efficiency for the ASME generated test aerosol
D-2
RPP-4826 Rev I
A 9995 efficiency is equivalent to a DF of 2E+3 while a 9997 efficiency is equivalent to a DF of 33E+3 The actual DF for the RMCS exhauster housing is higher than either of these It has two HEPA filters in series even though the minimum efficiency specified in the NOCs for the RMCS exhausters is only equivalent to one HEPA ERDA 1976 recommends using a DF of 3000rdquo for a filter bank where n is the number of HEPA filters in series This would result in a DF of 9E+6 for the RMCS exhauster housing This is unrealistic Using a DF of 9E+6 will calculate to Csrdquorsquo quantities on the HEPA filtersthat are orders of magnitude above what have been shown to be there based upon the measured dose rates and NDA A DF of 9E+6 would mean the dose rate would have to be almost 100 mRhr at the side of the exhauster housing instead of the 05-08 mRhr dose rates encountered The waste particles will not have the same particle size distribution entering the second HEPA filter as when entering the first The majority of the waste particles will be captured on the I rdquo HEPA filter and although the DF for each HEPA if tested individually using the ASME N5 IO aerosol test method may be 3E+3 (or higher) the overall DF of the two filters in series will not be 3000lsquo This is because the particle size distribution entering the Znd HEPA could have a greater percentage of smaller particles than that entering the 1rdquo
NUREG 1995 included an evaluation of a number of different facility stacks at the Hanford site where the HEPA filter upstream air concentrations were estimated using several different methods This report concluded that back-calculation using a value of 3000rdquo overestimated the upstream radionuclide concentration by three to four orders of magnitude when compared to filter NDA data for the nine stacks for which NDA data were obtained and by three orders of magnitude for the two stacks for which upstream air sample data were available Back- calculation using a value of 3000rdquo was shown to be high by four orders of magnitude for the single stack for which a powder release estimate was available Based upon this information the RMCS exhauster dual filter-in-series housings would have a DF of at least three and maybe four orders of magnitude less than 9E+6 or in the 1E+3 to 1 E+4 range A DF of IE+3 would he less than the minimum permissible under the NOC Comparing the older stack data and design with the newer RMCS exhauster design the minimum DF would be expected to be at least 1E+4
Table D-2 provides the available RMCS exhauster aerosol test data This information was obtained from Waldo 1999 Prior to 1998 the RMCS exhauster primary HEPA filter efficiency and either the secondaly HEPA filter or the overall efficiency for both filters were tested Starting in 1998 only the primary and secondary HEPA filter efficiency were measured The overall efficiency of the two filters in series was only measured three times in 11 setups Twice the overall penetration efficiency was lt0002 and the remaining time the only information that could be found was a value of lt005 Most individual filters had a penetration efficiency of 0002 This appears to be about the limit of the detection equipment Based upon Table D-2 data a penetration efficiency of 0002 (99998 efficiency) is normal for a single HEPA and thus a minimum for an RMCS exhauster housing Assuming a 0002 penetration efficiency for the two filters combined calculates to a DF of 5E+4 (equal to 1 +
000002) for the RMCS exhauster housing
In summary the measured DF for the RMCS exhauster housings over the period from May 1998 through June 1999 was about 73E+4 RMCS aerosol testing prior to use indicates a DF of about 5OE+4 for each of the filters separately but their overall efficiency is not measured Referenced data based on older stacks at Hanford indicate the two HEPA RMCS exhauster housing would likely have a DF of at least IE+4
Estimated Aerosol Levels During RMCS Based Upon RMCS Stack Record Sample Data
Revision 0 of this document used the positive record sample results with variance less than 100 to estimate aerosol concentrations in the exhauster inlet using an assumed exhauster housing DF of 5OE+4 This method of estimating aerosols was eliminated from Revision 1 because the stack concentrations were either too low too scattered or too questionable to provide reliable results There were 112 RMCS stack record sample data points evaluated in Schofield 2000b Excluding the total beta sample results used for estimation of the housing DF there were only ten data points remaining with positive values and variances ltloo the remaining data points were either negative had a variance gtloo or the results were not available
For comparison purposes only Schofield 2000b applied the DF of 73E+4 calculated in this document to the data points not used to calculate the exhauster housing DF to estimate aerosol concentrations upstream of the filters The results showed aerosol levels approximately the same as those estimated using NDA dose rate or CGM filter paper data when a value of zero was used for negative sample results or those with a variance gtloo When only
D-3
RPP-4826 Rev 1
the ten positive results with a variance ltloo were used the aerosol levels calculated to be two to five times higher than those estimated using NDA dose rate or CGM filter paper data Because of the variability of data resulting from the extremely low record sample concentrations and the few useable data points estimation of aerosol levels using record sample data was not included in Revision I See Schofield 2000b for further discussion of the use of record sample data to estimate aerosol levels
Summary of Calculations
A total of nine RMCS exhauster stack record sample data points were used to estimate the RMCS exhauster filter housing decontamination factor These data points were obtained when sampling on five tanks during which 10 RMCS cores and 65 RMCS segments were obtained The overall decontamination factor was 73E+4
Estimation of aerosol generation quantities based upon RMCS stack record sample data is possible However results will likely be skewed high if data points that show non-detectable levels of radionuclides present are ignored instead of using a value of zero for the data point
D-4
RPP-4826 Rev 1
APPENDIX E
TANK WASTE RADIONUCLIDE CONCENTRATIONS USED FOR AEROSOL CALCULATIONS
E-0
RPP-4826 Rev 1
APPENDIX E - Tank Waste Radionuclide Concentrations Used for Aerosol Calculations
The RMCS exhauster NDA data HEPA filter dose rate data CGM filter paper data and stack record sample data provide information on the quantity of radionuclides on the exhauster filters in the tank head space or the exhauster stack during RMCS These radioactivity quantities need to be divided by the waste radionuclide concentration specific activity to determine the mass of waste in the tank head space and in the tank gases sent to the exhauster
The mass quantities in this document were calculated using dry basis radionuclide concentrations Waste particles carried into the tank head space by the purge gas could be wet or dry If wet some of the non-chemically bound water will start to evaporate immediately providing the tank relative humidity is 400 The water present in a waste particle may be chemically bound as a hydrate or free The chemically bound water will not readily evaporate therefore even a ldquodryrdquo particle may have some water associated with it It is impractical to measure the actual water content of the waste particulates caught on the CGM filter paper the exhauster HEPA filters or the stack record sample paper Since the quantity of water in the waste particulates is unknown particulate levels were calculated using dry basis radionuclide concentrations Thus all particulate values given in this document are stated on a dry basis
The waste radionuclide concentrations on a dry basis were calculated from data available in the Tank Waste Information Network System (TWINS) The Best Basis InventorylBest Basis Summary numbers were used These values are the most complete and up to date readily available estimates for Hanford waste tank contents but do not include water The information was downloaded from TWINS into a spreadsheet The total chemical total beta and total alpha quantities were summed in the spreadsheet for all the tanks which were sampled and concentrations for Csrdquorsquo Sr9rsquo total beta and total alpha automatically calculated in pCig These concentrations are provided in Table E-I Because lab techniques for measuring gross beta levels only detect beta particles with a minimum decay energy above 150-200 kev only radionuclides with a decay energy of gt-200 kev were included in the total beta numbers
The TWINS radionuclide concentrations were obtained in December 1999 No corrections were made for decay for this document
The CGM filter paper and stack record sample data indicate the measured radionuclide values are not always in the same ratio to each other as given by TWINS nor are all radionuclides detected that TWINS indicates are present Radionuclides can be distributed unevenly in a tank Soluble fission products (primarily Csrsquordquo) are found in the liquid saltcake and in sludges Insoluble fission products and actinides are found largely in sludges as these are primarily chemical precipitates Sludge could be mixed with saltcake be present in a distinct layer at the bottom of a tank or in several layers in the tank depending upon how waste was transferred into a tank Waste particles may thus not have the same specific activity on a microscopic scale as they would have on a macro scale were the tank contents homogenized During RMCS a top to bottom core sample is attempted resulting in the drill bit and purge gas (which causes aerosols to form) passing through most ofthe waste matrix Assuming the aerosol generation rate is approximately constant during drilling the specific activity of a radionuclide in the suspended solids should be roughly the same as the average specific activity of the same radionuclide in the tank waste While the waste specific activity is probably not homogeneous from top to bottom in a tank and the aerosol generation rate will likely also vary it is beyond the scope of this document to provide an in-depth analysis of all the factors affecting aerosol radionuclide concentration Although sample radionuclide data were not always in the same ratio as provided by TWINS for the purpose of this document the simplifying assumption was made that the average tank specific activity is adequate to provide an approximation of the suspended solids specific activity for all radionuclides Average tank individual radionuclide specific activities were used in the preparation of the exhauster NOCs
The aerosol calculations presented in this document are only as accurate as the TWINS data The combined radionuclide content of all Hanford waste tanks is known fairly well since the overall content is based upon reactor production records CsrdquorsquoSrW recovery data and processing plant discharges Thus TWINS data for all tanks combined should be reasonable There are undoubtedly differences between TWINS data and the actual contents of a specific tank While the specific tank radionuclide data from TWINS used in this document may not be exact deviations from the actual concentrations are assumed to balance out over the number of tanks sampled
E- 1
RPP-4826 Rev 1
APPENDIX F
ROTARY MODE CORE SAMPLING EXHAUSTER AND CORE SAMPLE DATA
F-0
RPP-4826 Rev 1
APPENDIX F - Rotary Mode Core Sampling Exhauster and Core Sample Data
This appendix provides the basic data obtained during RMCS operations which was used in preparation of this document
Basic Operational Data
There have been three RMCS exhausters and three RMCS sampling trucks deployed since starmp of nitrogen- purged RMCS in November 1994 The exhausters are formally designated 296-P-32296-P-33 and 296-P-34 These were originally referred to as parts of RMCS Systems 2 3 and 4 respectively in the Notices of Construction (NOC) for these units The exhauster designations were changed for routine field use in 1996 to exhausters A B and C to avoid confusion with core sampling trucks 23 and 4 since any exhauster could be used with any RMCS truck Exhauster A (2) and RMCS Truck2 have not been used for RMCS since 1995 and are no longer in service for core sampling
Rotary mode core sampling has been conducted in four general time frames since 1994 These time frames were separated by down times for equipment modifications or resolution of environmental permitting and safety concerns For ease of analysis in this document exhauster operations were organized into six distinct operating periods Periods I to 6 were grouped based upon times when the same exhauster and same set of HEPA filters were being used These periods thus overlap with the general operating time frames The four operating time frames were
The first time frame lasted from November 1994 to January 1995 RMCS Truck 2 and Exhauster 2 (A) were used on Tank BY-106 along with an in-tank prefilter This tank provided the initial deployment and testing of the nitrogen-purged equipment in a waste tank During this period radiation dose rates were taken at the side of the exhauster housing Stack record samples were taken in December 1994 and January 1995
The second time frame lasted from July 1995 through October 1995 RMCS Trucks 2 and 4 were used with Exhausters 2 and 3 (A and B) on BY-105 BY-IO8 and BY-I IO During this period radiation dose rates were taken at the sides of the exhauster housings Stack record samples were taken after completion of sampling on each tank No RMCS samples were taken from BY-108 all samples were taken in push mode for this tank
The third time frame began when RMCS was restarted in December 1997 Trucks 3 and 4 were used for sampling of SX-101 SX-103 SX-105 and SX-102 with the SX tank farm exhauster providing ventilation The RMCS exhausters were not used During this period radiation dose rates were taken at the sides of the SX exhauster housing as part of HPT routine surveys SX farm exhauster stack record samples were taken when required by normal operating procedures SX record sampler and filter housing dose rate data were not evaluated for this document It would not be practical using filter dose rate or stack record sample data to estimate the RMCS aerosol addition if any to the SX ventilation system The background radiation around the SX filter housing makes measurement of any small increase in dose rate very difficult to detect The number of tanks being ventilated and the involved off-gas header routings (the exhauster is pulling on thirteen tanks in series or in parallel with the tank being sampled) and any in-tank activities in the SX tanks not being sampled would make it impractical to assess what aerosols resulted from RMCS Beginning with RMCS in SX farm radionuclide analyses were performed on the filter papers protecting the CGMs which draw air out of the tank vapor space for flammable gas detection
The fourth time frame began in May 1998 Between 1095 and 598 Exhausters B and C were extensively modified with new filter housings and other equipment to meet new NOC requirements Trucks 3 and 4 were used with Exhausters B and C (3 and 4) on S-l IO U-107 BY-105 TX-113 and TX-I 18 This period marked the first use ofthe RMCS trucks and RMCS exhausters together following resolution of flammable gas concerns and modifications to the exhausters New filters were installed Radiation dose rates were taken at the sides of the exhauster housings Stack record samples
F- 1
RPP-4826 Rev I
were taken after completion of sampling for each exhauster installation Radionuclide analyses were performed on the CGM filter papers for all tanks except TX-118 An NDA was performed on the Exhauster C housing following completion ofthe first core on TX-I 13 The housing filters when assayed contained aerosols captured by the exhauster following RMCS in S-l IO U-107 BY-105 (1998) and the first core of TX-I 13 Another NDA was performed on Exhauster C following both cores in TX-I 18 An NDA was performed following sampling of the second core in TX-I 13 using Exhauster B The time frame ran through early June 1999 No RMCS samples have been taken after June 1999 nor are any planned for the next few years
For the purposes of evaluating aerosol formation based upon RMCS exhauster housing NDA and dose rate data the exhauster operations were grouped into 6 operating periods These periods are shown in Table F-1 and restated in Tables A-I and B-I All tanks sampled in Periods 1 2 4 5 and 6 were exhausted by the same exhauster with the same housing and filters present during that period Period 3 covered the time the SX exhauster was used during RMCS in SX farm
A brief description of each RMCS tank sampling operation is provided below
Tank 241-BY-1061194 to 1294 RMCS using the nitrogen purge gas system with an exhauster was formally begun on 111794 on tank BY-106 riser IOB Exhauster 2 (A)and Truck 2 were used A sintered metal prefilter was inserted in the riser between the tank and the exhauster A total of eight segments were taken in rotary mode and five segments in push mode until sampling was halted on 122194 One RMCS core was obtained The total exhauster run time was 4878 hours The stack record sample was removed and analyzed following this run period Dose rates taken at the side of the exhauster housing during RMCS were all lt05 mRhr The in-tank prefilter was smeared for contamination when removed from the tank with the smears showing less than detectable levels of radionuclides present (Waldo 1999) The prefilter had been washed with an installed spray system prior to removal from the tank but subsequent testing showed the water flow and pressure were too low to have been effective at removing contamination
Tank 241-BY-106195 Following some process modifications RMCS in BY-IO6 riser IOB began again on 11895 Exhauster 2 (A) and Truck 2 were used The sintered metal prefilter was inserted in the riser between the tank and the exhauster RMCS was halted on 12495 over authorization basis and equipment operability issues for RMCS A total of three segments were taken in rotary mode and eleven segments in push mode One RMCS core was obtained The total exhauster run time was 1867 hours The stack record sample was removed and analyzed following this run period Dose rates taken at the side of the exhauster housing during RMCS were all lt O S mRhr The in-tank prefilter was smeared for contamination when removed from the tank with the smears showing less than detectable levels of radionuclides present (Waldo 1999) The prefilter was not washed this time
Tank 241-BY-110795 to 1095 Following resolution of RMCS authorization basis and equipment issues and completion of the fabrication and testing of Trucks 3 and 4 RMCS was begun in BY-I IO on 71195 Exhauster 2 (A) and Truck 2 were used Samples were taken from risers 128 7 128 again and 4 There was no in- tank prefilter used in this or any subsequent RMCS periods Sampling was performed until 102595 when RMCS was halted over flammable gas issues A total of 13 RMCS segments and 56 PMCS segments were taken Three RMCS cores were obtained The total exhauster run time was 1125 hours The stack record sample was removed and analyzed following this run period Dose rates taken at the side of the exhauster housing during RMCS were all lt O S mRhr
Tank 241-BY-108795 to 895 Core sampling was begun in BY-IO8 on 72595 Exhauster 3 (B) and Truck 4 were used Sampling was done in risers 12A and 7 The tank material proved soft enough so that no RMCS segments were required all segments were obtained in push mode although the exhauster was operated during part of the time sampling was performed Sampling was completed 81895 A total of 16 PMCS segments were taken The total exhauster run time was 6617 hours The stack record sample was removed and
F-2
RPP-4826 Rev 1
analyzed following this run period Dose rates taken at the side of the exhauster housing during RMCS were all lt05 mRhr
Tank 241-BY-105895 to 1095 RMCS was begun in BY-I05 riser 12A on 83095 Exhauster 3 (B) and Truck 4 were used This tank has a concrete layer on top about 12-18 inches thick which had to be drilled through Part way through sampling questions arose as to the flammable gas status of the tank and RMCS was halted on 10695 A total of 3 RMCS and 7 PMCS segments were taken One RMCS core was obtained The total exhauster run time was 4413 hours The stack record sample was removed and analyzed following this run period Dose rates taken at the side of the exhauster housing during RMCS were all lt05 mRhr
Tank 241-SX-1011297 to 298 Following resolution of extensive regulatory and authorization basis issues and installation of equipment modifications RMCS started in SX-101 with Truck 4 on 12497 An RMCS exhauster was not used since all SX farm tanks excluding SX-113 and SX-I 15 are ventilated with the SX exhauster Sampling was performed in risers 19 and 4 and was completed on 21098 A total of 9 RMCS and 6 PMCS segments were taken Two RMCS cores were obtained SX exhauster stack record samples and filter housing dose rates were obtained as part of routine operations for the SX exhauster not as part of the RMCS process Filter papers used in the suction line for the CGM were saved and analyzed in the laboratory to estimate the airborne radionuclide concentration in the tank head space Two CGM filter papers were needed for each core as moisture in the tank vapors condensed on the papers in the cold weather and began to restrict tank gas flow to the CGM
Tank 241-SX-103498 to 598 RMCS started in SX-103 with Truck 4 on 42798 The SX exhauster was used for ventilation (see SX- 101 above) Sampling was performed in risers 7 and 1 1 and was completed on 51198 A total of 6 RMCS and 18 PMCS segments were taken Two RMCS cores were obtained During sampling filter papers used in the suction line for the CGM were saved and analyzed in the laboratory to estimate the airborne radionuclide concentration in the tank head space One CGM filter paper was used during each core SX exhauster stack record samples and filter housing dose rates were obtained as part of routine operations for the SX exhauster not as part of the RMCS process
Tank 241-SX-105298 to 598 RMCS started in SX-105 with Truck 3 on 22598 The SX exhauster was used for ventilation (see SX- 101 above) Sampling was performed in risers 6 and 14 and was completed on 51598 A total of 6 RMCS and 20 PMCS segments were taken Two RMCS cores were obtained During sampling filter papers used in the suction line for the CGM were saved and analyzed in the laboratory to estimate the airborne radionuclide concentration in the tank head space Two filter papers were needed for the first core as moisture in the tank vapors condensed on the papers in the cold weather and began to restrict tank gas flow to the CGM One filter paper was used for the second core SX exhauster stack record samples and filter housing dose rates were obtained as part of routine operations for the SX exhauster not as part of the RMCS process
Tank 241-SX-102698 to 798 RMCS started in SX-102 with Truck 4 on 61798 The SX exhauster was used for ventilation (see SX- 101 above) Sampling was performed in risers 8 and 4 and was completed on 7798 A total of 2 RMCS and I8 PMCS segments were taken Two RMCS cores were obtained During sampling filter papers used in the suction line for the CGM were saved and analyzed in the laboratory to estimate the airborne radionuclide concentration in the tank head space One filter paper was used for each core SX exhauster stack record samples and filter housing dose rates were obtained as part of routine operations for the SX exhauster not as part of the RMCS process
Tank 241-S-110598 to 698 RMCS was begun in S-I10 on 51898 Exhauster C (4) and Truck 3 were used This tank marked the first use of an RMCS exhauster since 1995 Sampling was completed on 6498 Risers 6 and 14 were sampled A total of IO RMCS and 8 PMCS segments were taken Two RMCS cores were obtained The
F-3
RPP-4826 Rev I
total exhauster run time was 15978 hours The stack record sample was removed and analyzed following this run period Dose rates taken at the side of the exhauster housing during RMCS were all lt05 mRhr During sampling filter papers used in the suction line for the CGM were saved and analyzed in the laboratory to estimate the airborne radionuclide concentration in the tank head space One filter paper was used for each core Waste particles retained on the exhauster housing filters were part of the inventory subsequently measured by NDA following completion of the first core in TX-I 13
Tank 241-U-107698 to 798 RMCS was begun in U-107 on 61098 Exhauster C and Trucks 3 and 4 were used Sampling was completed on 71598 Risers 7 and 2 were sampled A total of IO RMCS and 19 PMCS segments were taken Two RMCS cores were obtained The total exhauster run time was 27385 hours The stack record sample was removed and analyzed following this run period Dose rates taken at the side of the exhauster housing during RMCS were all 105 mRihr During sampling filter papers used in the suction line for the CGM were saved and analyzed in the laboratory to estimate the airborne radionuclide concentration in the tank head space One filter paper was used for each core Waste particles retained on the exhauster housing filters were part of the inventory subsequently measured by NDA following completion of the first core in TX-I 13
Tank 24l-BY-105798 to 898 RMCS was begun in BY-105 again on 72298 Exhauster C and Trucks 3 and 4 were used Sampling was completed on 82598 Risers 7 and 1 1 B were sampled A total of 18 RMCS and 18 PMCS segments were taken The material was hard enough to require rotary mode sampling all the way to the bottom of the waste but negligible recovery was obtained After RMCS was performed to the waste bottom a PMCS core was taken in the same hole to recover material Two RMCS cores were obtained The exhauster run time was 13577 hours for the first RMCS core and 30792 hours for the second RMCS core Stack record sample information in ABCASH shows 30558 hours operation for the second core but the sampler data sheet shows the time counter was mistakenly reset 234 hours into the run No correction was made to the BY-IO5 2nd core record sample concentration for this document since the error is conservative and results in only slightly higher (ltI) record sample radionuclide concentrations for this core A stack record sample was removed and analyzed following each core giving two record samples for BY-IO5 in 1998 Dose rates taken at the side of the exhauster housing during RMCS were almost all lt05 m R h but a few readings indicated 07 mRihr This variation was assumed due to personnel reading the instrument differently or the fact that the exhauster had been used on enough tanks that by now there was sufficient activity on the filters to cause readings approximately at the background detection level The final reading when both cores were completed was lt05 m R h During sampling filter papers used in the suction line for the CGM were saved and analyzed in the laboratory to estimate the airborne radionuclide concentration in the tank head space One filter paper was used for each core Waste particles retained on the exhauster housing filters were part of the inventory subsequently measured by NDA following completion of the first core in TX-113
Tank 241-TX-113998 to 599 Core sampling was begun in TX-I 13 riser 3 on 92298 Exhauster B (3) and Truck 4 were used at the start This was the first use of Exhauster B since it was modified Exhauster B ran for a total of 8738 hours until being disconnected on 102398 During this time two PMCS segments were taken and no RMCS segments Exhauster C was then installed and operated for 5598 hours from 121098 to 122898 No RMCS or PMCS sampling was performed during this time frame RMCS segments werent taken until 299 Exhauster C ran for a 30230 hours between 122898 and 21299 Sampling was completed on the core from riser 3 on 21299 A total of 12 RMCS segments were obtained during the time Exhauster C was operating Exhauster flow rate for both exhausters was a nominal 200 scfm Stack record samples were taken following Exhauster B removal at the end of 1998 for Exhauster C and following completion ofthe first core with Exhauster C Aerosol calculations were based on only the 30230 hours run time for Exhauster C in 1999 since this was the time period during which RMCS segments were obtained Dose rates taken at the side of the exhauster housing during the short PMCS only sampling period with Exhauster B were all ltOS m R h Dose rates with Exhauster C varied between lt O S mRhr and 07 mRhr The final reading on Exhauster C following completion of the first core was 07 mFUhr During sampling filter papers used in the suction line for the CGM were saved and
F-4
RPP-4826 Rev I
analyzed in the laboratory to estimate the airborne radionuclide concentration in the tank head space One filter paper was used for the core Waste particles retained on the exhauster housing filters were part of the inventory subsequently measured by NDA following completion of this core
Sampling in riser 5 was begun on 41299 using Exhauster B and Truck 3 A total of 6 RMCS and 1 PMCS segments were taken for this core before sampling was halted on 42899 The total exhauster run time for this core was 11712 hours Problems with high vacuum in the tank required the exhauster flow rate to be reduced to 190 scfm to keep the system within pressure limits The stack record sample for the second core was removed and analyzed following the run period Dose rates taken at the side of the exhauster housing during the second core were all lt05 m M r During sampling filter papers used in the suction line for the CGM were saved and analyzed in the laboratory to estimate the airborne radionuclide concentration in the tank head space One filter paper was used An NDA was performed on the exhauster housing following this core The only radionuclides present in the housing were those from this core or what was removed from the tank head space during the non-RMCS activities in this tank from 92298 and 102398
Some clarification may be needed to explain use of the exhauster operating times and NDA dose rate and record sample data obtained during core sampling on TX-I 13 Core sampling was set up for sampling riser 3 on TX-113 in September 1998 with Exhauster B Exhauster B operated for a total of 8738 hours between 92298 and 102298 The stack record sample was removed at the end of this period The ERS database incorrectly shows the exhauster operated between 111698 and 111998 The ABCASH database shows the stack record sample was removed on 111998 The stack record sample showed positive emuent concentrations during this time period with variances 400 No RMCS samples were taken during this period so the data and time werenrsquot included when calculating RMCS aerosol numbers Exhauster B was removed and Exhauster C installed in late November-early December Exhauster C was operated for a total of 5559 hours between 121098 and 122398 The stack record sample was removed on 122898 No sampling was performed during this period so the data and time werenrsquot included when calculating RMCS aerosol numbers Exhauster C was operated for a total of 30218 hours between 122898 and 2899 All the RMCS segments from riser 3 were taken in this time period so only the data and time for this period were included when calculating RMCS aerosol numbers Exhauster B was used during sampling of riser 5 Exhauster B operated for a total of 11712 hours between 41299 and 42899
Tank 241-TX-l18599 to 699 RMCS was begun in TX-I 18 on 5699 Exhauster C (4) and Truck 4 were used Sampling was completed on 6298 Risers 9B and 12B were sampled A total of 9 RMCS segments were taken there were no PMCS segments Two RMCS cores were obtained The total exhauster run time was 21247 hours The stack record sample was removed and analyzed following this run period The maximum dose rate taken at the side of the exhauster housing following RMCS was 08 m M r CGM filter papers were not analyzed An NDA was performed on the exhauster housing following completion of the two cores The exhauster housing contained the same nuclides as for the first NDA (S-110 U-107 BY-105 and TX-I 13 first core) plus those from TX-I 18
The basic core sampling operational data used in this document includes the number of RMCS cores and segments the exhauster run times and flow rates the RMCS exhauster HEPA filter dose rates and tank vapor space temperatures Table F-l lists the basic operational data This information excluding tank vapor space temperature data was obtained from procedural data sheets in the sampling work packages (References W - 1 to WP-23)
Tank temperature data for the tanks ventilated with the RMCS exhausters was obtained from the TWINS database Plots for each tank were prepared for the time RMCS was conducted and the average value of the highest thermocouple located in the tank (the lowest temperature reading) was estimated and used as the average tank head space temperature during the RMCS period
The SX exhauster flow rates listed in Table F-l are estimates only The combined flow rate for SX-IO1 through SX-106 plus SX-109 (7 tanks) averaged 440 cfm during CY 1996 (Kaiser 1997) for an average of 63 cfm per
F-5
RPP-4826 Rev I
tank Based upon inlet flow measurements at the tank inlet HEPA filters (Fanis 1998) the flow through each individual tank (SX-IO1 through SX-106 plus SX-109) was lt55 cfm at the breather filter Assuming an exhaust flow of 100 cfm for each SX farm tank sampled is therefore conservative
Calculated Data
Calculated data include the tank head space volumes conversion of the RMCS exhauster flow rate from scfm to acfm and the number of tank head space changeouts made by an exhauster during RMCS
Tank head space volume includes the dome space volume above the top of the sidewall plus the void space between the waste surface and the top of the sidewall The formula used to calculate tank head space volumes WN
Head Space Volume in A = (DS + [(H) (12) + HI + Hb - H] (V)) - 748
Where DS = dome space volume gal H = height of tank body sidewall above knuckle A HI = height of tank knuckle area in Hb = height oftank bottom below knuckle in H = height of waste in tank in V =27555 galin of waste in SX tanks 2754 gallin in all others
The tank dome space volumes height of tank sidewall above the knuckle height of tank knuckle area and height of tank bottom below the knuckle were obtained from Reynolds 1999 The height of waste in each tank at the time of core sampling was obtained from the TWINS database Tank dimensional and waste level data are given in Table F-2 along with the calculated tank head space volumes
Aerosol calculations for Appendices A-C require exhauster flow rates in actual cubic feet per minute The RMCS exhauster flow rate is controlled and recorded in standard cubic feet per minute The mass flow rate of the exhauster air is measured and internal logic in the exhauster controller calculates what the volumetric flow rate would be if the temperature and pressure in the exhauster inlet were at standard conditions The standard conditions used in the logic controller are 29921 in Hg (760 mm Hg) and 69F (ZIT)
A correction factor is built into the exhauster control logic that assumes an atmospheric pressure of 2927 in Hg the average atmospheric pressure at Hanford The RMCS exhauster will operate at about 1-2 in H20 negative pressure resulting in about a 2916 in Hg pressure in a waste tank when the RMCS exhauster is operating To revise the indicated scfm RMCS exhauster reading to an acfm value the RMCS exhauster scfm flaw rate was multiplied by (29922916)(T+459)528 where Tis the tank head space temperature in OF The tank head space temperatures in Table F-1 were input to the spreadsheet file used for aerosol calculations and converted to acfm The flow rates in acfm are included in Table F-I
The tank head space changeouts when using the RMCS exhauster were calculated by multiplying the exhauster acfm flow rate by the time of exhauster operation and dividing the result by the tank head space volume Tank head space changeouts are listed in Table F-2
F-6
c
gt 2
RPP-4826 Rev 1
APPENDIX G
REFERENCES
G-0
RPP-4826 Rev 1
APPENDIX G - References
Diedeker 1999 NDA of RMCS HEPA Filters L P Diedeker WMH E-Mail to JS Schofield CHG November 29 I999
ERDA 1976 Nuclear Air Cleaning Handbook ERDA 76-21 Buchsted C A Fuller A B and Kahn 1 E Oak Ridge National Laboratory 1976
Farris 1998 Internal Note T R Farris LMHC to J S Schofield LMHC Breather Filter Flow Rates for SX-Farm 31698
Foust 1999 Internal Memo RMCST Exhauster HEPA Filter Dose Rate Calculations D J Foust LMHC to J S Schofield LMHC October 25 1999
Greager 1999 Correspondence No WMH-9954450 Non-Destructive Analysis of the Rotay Mode Core Sample High-Efjiciency Particulate Air Filters E M Greager WMH to P C Miller LMHC June 28 1999 [Transmittal of HNF-4199 Resultsfram NDA Measurement of the 296-P-34 RMCS HEPA Filters]
HNF 1999 HNF-SD-WM-SAR-067 Tank Waste Remediation System Final Safety Analysis Report Rev 1 The revision incorporating RMCS accident analyses was submitted as Addendum 5 to DOE as a change to the FSAR predecessor the Basis for Interim Operation (BIO) LMHC-9857075 80232764-9-KOOl Submittal of Authorization Basis Amendment Package for Rotay and Push Mode Core Sampling in Satisfaction of Perfarmance Agreement TWR 122 Expectations I and 3 D 1 Allen LMHC to A M Umek FDH August 30 1998 Addendum 5 as of mid-January 2000 is waiting for approval by DOE
Kaiser 1997 T D Kaiser LMHC E-Mail to J S Schofield LMHC SX Tank Flow Data 42197
NUREG 1995 Potential Radionuclide Emissionsfrom Stacks on the HanfordSite Part I Dose Assessment Davis W E and Barnett J M Westinghouse Hanford Company from Proceedings of the 23 DOEMRC Nuclear Air Cleaning Conference held July 25-28 1994 February 1995
Schofield 2000a Letter 74910-00-002 Use of Microshield Calculations for RMCS Exhauster Housing for Estimating Radionuclide Quantities on the Filters Using NDA and Dose Rate Measurements I S Schofield CHG to File January 62000
Schofield 2000b Letter 74910-00-003 Rev I RMCS Exhauster Stack RecordSample Data J S Schofield CHG to File January 202000
Reynolds 1999 D R Reynolds LMHC E-Mail to I S Schofield LMHC transmitting Tank Volume Calculations draft of calculations done by Mike Plesha and Reed Hendershot data to be used for RESOLVE computer program for Hanford waste tanks August 3 1999
TWINS Tank Waste Information Network System database available at httptwinspnlgovSOO lhtbinTCDgetTableListexe
Waldo 1999 letter 74910-99-009 RMCS Exhauster Aerosol Test Data E I Waldo to J S Schofield June 22 1999
WHC 1993 WHC-SD-WM-ES-225 Rev I AerosolStudy for the Rotary Mode Exhauster P M Francis Westinghouse Hanford Company April 20 1993
WHC 1997 WHC-SD-WM-SAD-035 Rev Ob A Safety Assessment of Rotary Mode Core Sampling in Flammable Gas Single Shell Tanks Hanford Site Richland Washington August 8 1997
G- I
RPP-4826 Rev I
CGM Data CGM-I Letter PARTICULATE SAMPLING OF 241-SX-IO1 DURING ROTARY MODE CORE SAMPLING D C
Langlois E2 Consulting Engineers to J S Schofield Lockheed Martin Hanford Company March 16 1998
CGM-2 Letter PARTICULATE SAMPLING OF 241-SX-I05 DURING ROTARY MODE CORE SAMPLING D C Langlois E2 Consulting Engineers to J S Schofield Lockheed Martin Hanford Company June 9 1998
CGM-3 Letter PARTICULATE SAMPLING OF 241-SX-103 DURING ROTARY MODE CORE SAMPLING D C Langlois E2 Consulting Engineers to J S Schofield Lockheed Martin Hanford Company June 12 1998
CGM-4 Letter PARTICULATE SAMPLING OF 241-S-110 DURING ROTARYMODE CORESAMPLING D C Langlois E2 Consulting Engineers to J S Schofield Lockheed Martin Hanford Company July 20 1998
CGM-5 Letter PARTICULATE SAMPLING OF 241-SX-102 DURING ROTARY MODE CORE SAMPLING D C Langlois E2 Consulting Engineers to J S Schofield Lockheed Martin Hanford Company July 22 1998
CGM-6 Letter PARTICULATE SAMPLING OF241-U-107 DURING ROTARY MODE CORE SAMPLING D C Langlois E2 Consulting Engineers to J S Schofield Lockheed Martin Hanford Company August 3 1998
CGM-7 Letter PARTICULATE SAMPLING OF 241-BY-105 DURING ROTARY MODE CORESAMPLING D C Langlois E2 Consulting Engineers to 1 S Schofield Lockheed Martin Hanford Company September 17 1998
CGM-8 Letter PARTICULATE SAMPLING OF 241-TX-I13 DURING ROTARY MODE CORESAMPLING D C Langlois E2 Consulting Engineers to J S Schofield Lockheed Martin Hanford Company March 15 1999
CGM-9 Letter PARTICULATE SAMPLING OF 241-TX-113 DURING ROTARY MODE CORE SAMPLING D C Langlois E2 Consulting Engineers to I S Schofield Lockheed Martin Hanford Company May 31 1999
Notices of Construction NOC-I DOEIRL-93-40 Radioactive Air Emissions Program Notice of Construction Rotary Mode Core-Sampling
Truck and Exhauster Approved by Letter AIR 93-707 A W Conklin WDOH to J E Rasmussen DOEIRL 7893
NOC-2 DOEIRL-94-118 Rev 0 Radioactive Air Emissions Program Notice of Construction for the Rotary Mode Core-Sampling Systems Three and Four Approved by Letter AIR 95-603 A W Conklin WDOH to J E Rasmussen DOERL 63095
NOC-3 DOERL-94-118 Rev 1 Radioactive Air Emissions Program Notice of Construction for the Rotary Mode Core-Sampling Systems Three and Four Approved by Letter AIR 98-301 W W Conklin WDOH to I E Rasmussen DOEIRL 3698
NOC-4 DOEIRL-97-70 Radioactive Air Emissions Program Notice of Construction for Rotary Mode Core- Sampling in SX Tank Farm Approved by Letter AIR 97-1 101 A W Conklin WDOH to J E Rasmussen DOEIRL 113097
NOC-5 USEPA Letter OAQ-107 (no title approving DOE submittal 97-EAP-590 dated 72997) A J Frankel USEPA to J E Rasrnussen DOEIRL 8497
NOC-5 USEPA Letter OAQ-107rsquo (nb title approving DOE submittal 97-EAP-723 dated 101797) A J Frankel USEPA to J E Rasmussen DOERL 11498
Note that both letters have ldquoOAQ-107rdquo following ldquoReply to Attn ofrdquo
G-2
RPP-4826 Rev I
Work Packages WP-I ES-94-00808 WP-2 ES-95-00258 WP-3 ES-95-00045 - WP-4 ES-95-00434 - WP-5 ws-97-00173 - WP-6 WS-97-00174 - WP-7 ws-97-00143 - WP-8 WS-97-00144 - WP-9 WS-97-00207 - WP-I 1 WS-97-00208 - WP-12 WS-98-00049 - WP-13 WS-97-00050 - WP-14 WS-97-00224 - WP- I5 WS-97-00225 - WP-16 WS-97-00230 - WP- I7 ws-97-0023 1 - WP-18 ES-97-00452 - WP-19 ES-97-00453 - WP-20 WS-98-00072 - WP-21 WS-98-00073 - WP-22 WS-98-00067 - WP-23 WS-98-00068 -
241-BY-IO6 Perform Rotary Core Sample [Riser IOB] 241-BY-I IO Rotary Core Sample [Risers 12B 7 IZB 41 241-BY-IO8 Obtain Rotary Core Sample [Risers 12A amp 71 241-BY-IO5 Rotary Mode Core Sample [Riser 12A] 241-SX-101 Rotary Mode Core Sample Riser 19 241-SX-101 Rotary Mode Core Sample Riser4 241-SX-103 Rotary Mode Core Sample Riser 7 241-SX-103 Rotary Mode Core Sample Riser I I 241-SX-105 RMCST Obtain Core Sample Riser 6 241-SX-105 RMCST Core Sample Riser 14 241-SX-102 Rotary Mode Core Sample Riser 8 241-SX-102 Rotary Mode Core Sample Riser 4 241-S-1 IO RMCST Obtain Core Sample Riser 6 241-S-1 IO RMCST Obtain Core Sample Riser 14 2414-107 RMCSTCore Sample Riser 7 241-U-107 RMCST Core Sample Riser 2 241-BY-IO5 RMCST Core Sample Riser 7 241-BY-IO5 RMCST Core Sample Riser 1 IB 241-TX-113 Rotary Core Sample Riser 3 241-TX-113 RMCST Core Sample Riser 5 241-TX-I 18 RMCST Core Sample Riser 9B 241-TX-I 18 RMCST Core Sample Riser 128
G-3
RPP-4826 Rev 1
Ignoring all CGM filter paper analytical data points with a variance gtloo will result in conservative results These data points indicate negligible radioactivity was present If a value of zero was assigned to each data point with an analytical error of gtloo instead of ignoring the data point the weighted average particulate quantities in Table C-4 would be reduced by about 12
The average tank head space mass concentrations based upon CGM data will be higher than the average tank head space mass concentrations based upon filter housing NDA or dose rate The RMCS exhauster received tank air from the shifts when sampling was performed and during some of the off-shifts when no sampling was done The CGMs were only operated during the shifts when sampling was performed The air concentration drawn into the CGM and the RMCS exhauster should be roughly the came during the operating shifts but somewhat less during the off-shifts Therefore the tank head space concentration will be higher when based upon CGM data This does not impact the mass of waste sent to the exhauster per core or per segment
c -4
I
- ~
RFP-4826 Rev 1
APPENDIX D
ESTIMATION OF Rh4CS EXHAUSTER HOUSING DECONTAMINATION FACTOR
D-0
RFrsquoP-4826 Rev 1
APPENDIX D - Estimation of RMCS Exhauster Housing Decontamination Factor
Summary of Method
This Appendix estimates a Decontamination Factor (DF) for the RMCS exhausters using housing NDA data and applicable stack record sample data The Csrdquorsquo in the exhauster effluent is divided by the C S rdquo ~ in the exhauster inlet to provide a penetration efficiency The reciprocal ofthe penetration efficiency is the DF
Description
Each RMCS exhauster has an isokinetic sampler located on the stack downstream of the blower and HEPA filters A small pomp pulls air from the exhaust stack into a filter paper at a rate proportional to the exhaust flow Radionuclides in the exhaust stream passing through the sample line are caught on the filter paper The stack operating time and flow rate are recorded When the record sample filter paper is removed the filter paper is analyzed in a laboratory for radionuclides The radionuclide concentration in the stack effluent stream is calculated by dividing the quantity of material on the filter paper by the volume of air through the sampler and then dividing again by a factor to compensate for stack sampler and filter paper efficiency
Multiplying the total beta stack effluent concentration by the total off gas flow gives the total beta emissions from the exhauster The total beta emissions are multiplied by the Csrdquorsquo to total beta ratio for the waste in the tank) being exhausted to give an estimate of the C S rdquo ~ emission The C S rdquo ~ on the filters determined by NDA of the housing (see Appendix A) is added to the C S rdquo ~ emissions to give the total C S rdquo ~ input to the filter housing Dividing the emissions by the input gives the filter housing penetration efficiency Subtracting the penetration efficiency from 1 O gives the filter housing efficiency Dividing 1 O by the penetration efficiency gives the DF
RMCS Stack Record Sample Data
RMCS exhauster stack record samples are taken after completion of each sampling event on a tank Normally this is after all cores on that tank have been obtained but for BY-IO5 in 1998 record samples were taken following each core Record samples are also taken at the end of each year All samples are analyzed for total alpha and total beta At the end of each year all the filter papers for that year are composited and analyzed for individual radionuclides Sample results are entered into the Automated Bar Coding of Air Samples at Hanford (ABCASH) and Environmental Release Summary (ERS) databases Several ofthe filter papers from 1998 were reanalyzed using a longer count time to bring the error rate down
Schofield 2000b compiled and evaluated all available RMCS exhauster stack record sample data filtered out the unusable data provided derivation for the stack sampling efficiency factor and summarized the results Most of the data points were so low as to be unusable since the results were either negative or had error variances gtloo
Column 5 of Table D-1 provides the stack effluent concentrations used for calculation of the filter housing DF The stack effluent data in Table D-l come from Schofield 2000b These values include a 073 sampling efficiency factor
Calculation of RMCS Filter Housing Decontamination Factor Based upon Housing Inlet and Outlet Data
The RMCS exhauster housing NDA and stack record sample data available for exhauster Operating Periods 4 5 and 6 were used to estimate an actual DF for the RMCS exhauster housings The housing NDA data is for CSrdquo~ but there are no usable Csrdquorsquo concentrations for the RMCS exhauster outlet The RMCS exhauster stack Csrsquordquo concentrations are either negative have a variance gtloo or are not available Total beta analyses are available however so the stack eftluent C S rdquo ~ concentrations were estimated by multiplying the total beta concentration by the ratio of Csrdquorsquo to total beta in the tank waste
Column 2 of Table D-l lists the increase in CSrsquo~ on the filters for each operating period as determined by NDA This data was obtained from Table A-2
D- 1
RPP-4826 Rev 1
Column 4 of Table D-l lists the stack exhaust volume for each stack record sample period The stack exhaust volume for the exhauster installation on S-l IO was calculated by
[ZOO std ft3min][15978 hrs] [60 minhr] = 199E+6 std ftrsquo
All other stack volumes in Table D-l were calculated the same way Unlike in Appendices A B and C no adjustment was made to change the 200 scfm to actual cfm This is because the RMCS stack record sample concentrations from Table D-3 are based upon a 200 scfm flow rate rather than the actual flow rate Since the concentrations are on the same basis as the flow rate there is no need to correct to acfm
The total beta emissions for the RMCS exhauster stack were calculated by multiplying the volume by the concentration For the same S-l IO data point
[199E+6 ft3] [18E-15 pCiml] [28317mlft3] [mCi1000 pCi] = 1OE-7 mCi total beta
All other total beta emissions in Table D-l were calculated the same way
The Csrdquorsquo to total beta ratio was calculated from data in Table E-I For the same S- l I O data point
326E+5 Ci CsI3rsquo f I 14E+6 Ci total beta = 029 Ci CslhCi total beta = 029 rnCi CsrdquorsquomCi total beta
The Csrsquordquo emission for the same S-l IO data point was thus
[I OE-7 mCi total beta] [029 mCi CsrdquorsquomCi total beta] = 29E-8 mCi Csrdquorsquo
All Csrsquordquo emissions in Table D-l were calculated in the same manner
The penetration efficiency for each operating period was calculated by dividing the exhauster outlet by the filter inlet Csrdquorsquo quantities For operating period 4 this was
[81E-6 mCi] f [5OE-I + 8IE-6 mCi] = 16E-5 = 16E-3
The DF for operating period 4 is
1 + 16E-5 = 62E+4
The overall DF for periods 4 5 and 6 was calculated by dividing the efluent from all three periods by the total filter input
[95E-6 mCi] f [67E-I t 95E-6 mCi] = 14E-5 = 14E-3 penetration efficiency
I - I 4E-5 = 0999986 = 999986 filter efficiency
1 f 14E-5 = 73E+4 decontamination factor based upon housing inlet and eftluent data
Estimation of Housing Decontamination Factor Based upon General Performance Data
HEPA filters are tested at the manufacturer to a minimum 9997 efficiency using a 03 pm monodisperse aerosol After installation HEPA filters are tested in-place per ASME N5 I O to a minimum 9995 efficiency using a polydisperse aerosol with an approximate droplet size distribution of 99 less than 30 pm 50 less than 07 pm and 10 less than 04 pm The RMCS exhauster housing is tested per ASME N510 and is thus required to have a minimum removal eficiency of 9995 for an aerosol with this approximate size distribution The particle size distribution of the waste aerosols generated by RMCS is unknown but it is assumed that the removal efficiency for RMCS generated aerosols was the same as the removal efficiency for the ASME generated test aerosol
D-2
RPP-4826 Rev I
A 9995 efficiency is equivalent to a DF of 2E+3 while a 9997 efficiency is equivalent to a DF of 33E+3 The actual DF for the RMCS exhauster housing is higher than either of these It has two HEPA filters in series even though the minimum efficiency specified in the NOCs for the RMCS exhausters is only equivalent to one HEPA ERDA 1976 recommends using a DF of 3000rdquo for a filter bank where n is the number of HEPA filters in series This would result in a DF of 9E+6 for the RMCS exhauster housing This is unrealistic Using a DF of 9E+6 will calculate to Csrdquorsquo quantities on the HEPA filtersthat are orders of magnitude above what have been shown to be there based upon the measured dose rates and NDA A DF of 9E+6 would mean the dose rate would have to be almost 100 mRhr at the side of the exhauster housing instead of the 05-08 mRhr dose rates encountered The waste particles will not have the same particle size distribution entering the second HEPA filter as when entering the first The majority of the waste particles will be captured on the I rdquo HEPA filter and although the DF for each HEPA if tested individually using the ASME N5 IO aerosol test method may be 3E+3 (or higher) the overall DF of the two filters in series will not be 3000lsquo This is because the particle size distribution entering the Znd HEPA could have a greater percentage of smaller particles than that entering the 1rdquo
NUREG 1995 included an evaluation of a number of different facility stacks at the Hanford site where the HEPA filter upstream air concentrations were estimated using several different methods This report concluded that back-calculation using a value of 3000rdquo overestimated the upstream radionuclide concentration by three to four orders of magnitude when compared to filter NDA data for the nine stacks for which NDA data were obtained and by three orders of magnitude for the two stacks for which upstream air sample data were available Back- calculation using a value of 3000rdquo was shown to be high by four orders of magnitude for the single stack for which a powder release estimate was available Based upon this information the RMCS exhauster dual filter-in-series housings would have a DF of at least three and maybe four orders of magnitude less than 9E+6 or in the 1E+3 to 1 E+4 range A DF of IE+3 would he less than the minimum permissible under the NOC Comparing the older stack data and design with the newer RMCS exhauster design the minimum DF would be expected to be at least 1E+4
Table D-2 provides the available RMCS exhauster aerosol test data This information was obtained from Waldo 1999 Prior to 1998 the RMCS exhauster primary HEPA filter efficiency and either the secondaly HEPA filter or the overall efficiency for both filters were tested Starting in 1998 only the primary and secondary HEPA filter efficiency were measured The overall efficiency of the two filters in series was only measured three times in 11 setups Twice the overall penetration efficiency was lt0002 and the remaining time the only information that could be found was a value of lt005 Most individual filters had a penetration efficiency of 0002 This appears to be about the limit of the detection equipment Based upon Table D-2 data a penetration efficiency of 0002 (99998 efficiency) is normal for a single HEPA and thus a minimum for an RMCS exhauster housing Assuming a 0002 penetration efficiency for the two filters combined calculates to a DF of 5E+4 (equal to 1 +
000002) for the RMCS exhauster housing
In summary the measured DF for the RMCS exhauster housings over the period from May 1998 through June 1999 was about 73E+4 RMCS aerosol testing prior to use indicates a DF of about 5OE+4 for each of the filters separately but their overall efficiency is not measured Referenced data based on older stacks at Hanford indicate the two HEPA RMCS exhauster housing would likely have a DF of at least IE+4
Estimated Aerosol Levels During RMCS Based Upon RMCS Stack Record Sample Data
Revision 0 of this document used the positive record sample results with variance less than 100 to estimate aerosol concentrations in the exhauster inlet using an assumed exhauster housing DF of 5OE+4 This method of estimating aerosols was eliminated from Revision 1 because the stack concentrations were either too low too scattered or too questionable to provide reliable results There were 112 RMCS stack record sample data points evaluated in Schofield 2000b Excluding the total beta sample results used for estimation of the housing DF there were only ten data points remaining with positive values and variances ltloo the remaining data points were either negative had a variance gtloo or the results were not available
For comparison purposes only Schofield 2000b applied the DF of 73E+4 calculated in this document to the data points not used to calculate the exhauster housing DF to estimate aerosol concentrations upstream of the filters The results showed aerosol levels approximately the same as those estimated using NDA dose rate or CGM filter paper data when a value of zero was used for negative sample results or those with a variance gtloo When only
D-3
RPP-4826 Rev 1
the ten positive results with a variance ltloo were used the aerosol levels calculated to be two to five times higher than those estimated using NDA dose rate or CGM filter paper data Because of the variability of data resulting from the extremely low record sample concentrations and the few useable data points estimation of aerosol levels using record sample data was not included in Revision I See Schofield 2000b for further discussion of the use of record sample data to estimate aerosol levels
Summary of Calculations
A total of nine RMCS exhauster stack record sample data points were used to estimate the RMCS exhauster filter housing decontamination factor These data points were obtained when sampling on five tanks during which 10 RMCS cores and 65 RMCS segments were obtained The overall decontamination factor was 73E+4
Estimation of aerosol generation quantities based upon RMCS stack record sample data is possible However results will likely be skewed high if data points that show non-detectable levels of radionuclides present are ignored instead of using a value of zero for the data point
D-4
RPP-4826 Rev 1
APPENDIX E
TANK WASTE RADIONUCLIDE CONCENTRATIONS USED FOR AEROSOL CALCULATIONS
E-0
RPP-4826 Rev 1
APPENDIX E - Tank Waste Radionuclide Concentrations Used for Aerosol Calculations
The RMCS exhauster NDA data HEPA filter dose rate data CGM filter paper data and stack record sample data provide information on the quantity of radionuclides on the exhauster filters in the tank head space or the exhauster stack during RMCS These radioactivity quantities need to be divided by the waste radionuclide concentration specific activity to determine the mass of waste in the tank head space and in the tank gases sent to the exhauster
The mass quantities in this document were calculated using dry basis radionuclide concentrations Waste particles carried into the tank head space by the purge gas could be wet or dry If wet some of the non-chemically bound water will start to evaporate immediately providing the tank relative humidity is 400 The water present in a waste particle may be chemically bound as a hydrate or free The chemically bound water will not readily evaporate therefore even a ldquodryrdquo particle may have some water associated with it It is impractical to measure the actual water content of the waste particulates caught on the CGM filter paper the exhauster HEPA filters or the stack record sample paper Since the quantity of water in the waste particulates is unknown particulate levels were calculated using dry basis radionuclide concentrations Thus all particulate values given in this document are stated on a dry basis
The waste radionuclide concentrations on a dry basis were calculated from data available in the Tank Waste Information Network System (TWINS) The Best Basis InventorylBest Basis Summary numbers were used These values are the most complete and up to date readily available estimates for Hanford waste tank contents but do not include water The information was downloaded from TWINS into a spreadsheet The total chemical total beta and total alpha quantities were summed in the spreadsheet for all the tanks which were sampled and concentrations for Csrdquorsquo Sr9rsquo total beta and total alpha automatically calculated in pCig These concentrations are provided in Table E-I Because lab techniques for measuring gross beta levels only detect beta particles with a minimum decay energy above 150-200 kev only radionuclides with a decay energy of gt-200 kev were included in the total beta numbers
The TWINS radionuclide concentrations were obtained in December 1999 No corrections were made for decay for this document
The CGM filter paper and stack record sample data indicate the measured radionuclide values are not always in the same ratio to each other as given by TWINS nor are all radionuclides detected that TWINS indicates are present Radionuclides can be distributed unevenly in a tank Soluble fission products (primarily Csrsquordquo) are found in the liquid saltcake and in sludges Insoluble fission products and actinides are found largely in sludges as these are primarily chemical precipitates Sludge could be mixed with saltcake be present in a distinct layer at the bottom of a tank or in several layers in the tank depending upon how waste was transferred into a tank Waste particles may thus not have the same specific activity on a microscopic scale as they would have on a macro scale were the tank contents homogenized During RMCS a top to bottom core sample is attempted resulting in the drill bit and purge gas (which causes aerosols to form) passing through most ofthe waste matrix Assuming the aerosol generation rate is approximately constant during drilling the specific activity of a radionuclide in the suspended solids should be roughly the same as the average specific activity of the same radionuclide in the tank waste While the waste specific activity is probably not homogeneous from top to bottom in a tank and the aerosol generation rate will likely also vary it is beyond the scope of this document to provide an in-depth analysis of all the factors affecting aerosol radionuclide concentration Although sample radionuclide data were not always in the same ratio as provided by TWINS for the purpose of this document the simplifying assumption was made that the average tank specific activity is adequate to provide an approximation of the suspended solids specific activity for all radionuclides Average tank individual radionuclide specific activities were used in the preparation of the exhauster NOCs
The aerosol calculations presented in this document are only as accurate as the TWINS data The combined radionuclide content of all Hanford waste tanks is known fairly well since the overall content is based upon reactor production records CsrdquorsquoSrW recovery data and processing plant discharges Thus TWINS data for all tanks combined should be reasonable There are undoubtedly differences between TWINS data and the actual contents of a specific tank While the specific tank radionuclide data from TWINS used in this document may not be exact deviations from the actual concentrations are assumed to balance out over the number of tanks sampled
E- 1
RPP-4826 Rev 1
APPENDIX F
ROTARY MODE CORE SAMPLING EXHAUSTER AND CORE SAMPLE DATA
F-0
RPP-4826 Rev 1
APPENDIX F - Rotary Mode Core Sampling Exhauster and Core Sample Data
This appendix provides the basic data obtained during RMCS operations which was used in preparation of this document
Basic Operational Data
There have been three RMCS exhausters and three RMCS sampling trucks deployed since starmp of nitrogen- purged RMCS in November 1994 The exhausters are formally designated 296-P-32296-P-33 and 296-P-34 These were originally referred to as parts of RMCS Systems 2 3 and 4 respectively in the Notices of Construction (NOC) for these units The exhauster designations were changed for routine field use in 1996 to exhausters A B and C to avoid confusion with core sampling trucks 23 and 4 since any exhauster could be used with any RMCS truck Exhauster A (2) and RMCS Truck2 have not been used for RMCS since 1995 and are no longer in service for core sampling
Rotary mode core sampling has been conducted in four general time frames since 1994 These time frames were separated by down times for equipment modifications or resolution of environmental permitting and safety concerns For ease of analysis in this document exhauster operations were organized into six distinct operating periods Periods I to 6 were grouped based upon times when the same exhauster and same set of HEPA filters were being used These periods thus overlap with the general operating time frames The four operating time frames were
The first time frame lasted from November 1994 to January 1995 RMCS Truck 2 and Exhauster 2 (A) were used on Tank BY-106 along with an in-tank prefilter This tank provided the initial deployment and testing of the nitrogen-purged equipment in a waste tank During this period radiation dose rates were taken at the side of the exhauster housing Stack record samples were taken in December 1994 and January 1995
The second time frame lasted from July 1995 through October 1995 RMCS Trucks 2 and 4 were used with Exhausters 2 and 3 (A and B) on BY-105 BY-IO8 and BY-I IO During this period radiation dose rates were taken at the sides of the exhauster housings Stack record samples were taken after completion of sampling on each tank No RMCS samples were taken from BY-108 all samples were taken in push mode for this tank
The third time frame began when RMCS was restarted in December 1997 Trucks 3 and 4 were used for sampling of SX-101 SX-103 SX-105 and SX-102 with the SX tank farm exhauster providing ventilation The RMCS exhausters were not used During this period radiation dose rates were taken at the sides of the SX exhauster housing as part of HPT routine surveys SX farm exhauster stack record samples were taken when required by normal operating procedures SX record sampler and filter housing dose rate data were not evaluated for this document It would not be practical using filter dose rate or stack record sample data to estimate the RMCS aerosol addition if any to the SX ventilation system The background radiation around the SX filter housing makes measurement of any small increase in dose rate very difficult to detect The number of tanks being ventilated and the involved off-gas header routings (the exhauster is pulling on thirteen tanks in series or in parallel with the tank being sampled) and any in-tank activities in the SX tanks not being sampled would make it impractical to assess what aerosols resulted from RMCS Beginning with RMCS in SX farm radionuclide analyses were performed on the filter papers protecting the CGMs which draw air out of the tank vapor space for flammable gas detection
The fourth time frame began in May 1998 Between 1095 and 598 Exhausters B and C were extensively modified with new filter housings and other equipment to meet new NOC requirements Trucks 3 and 4 were used with Exhausters B and C (3 and 4) on S-l IO U-107 BY-105 TX-113 and TX-I 18 This period marked the first use ofthe RMCS trucks and RMCS exhausters together following resolution of flammable gas concerns and modifications to the exhausters New filters were installed Radiation dose rates were taken at the sides of the exhauster housings Stack record samples
F- 1
RPP-4826 Rev I
were taken after completion of sampling for each exhauster installation Radionuclide analyses were performed on the CGM filter papers for all tanks except TX-118 An NDA was performed on the Exhauster C housing following completion ofthe first core on TX-I 13 The housing filters when assayed contained aerosols captured by the exhauster following RMCS in S-l IO U-107 BY-105 (1998) and the first core of TX-I 13 Another NDA was performed on Exhauster C following both cores in TX-I 18 An NDA was performed following sampling of the second core in TX-I 13 using Exhauster B The time frame ran through early June 1999 No RMCS samples have been taken after June 1999 nor are any planned for the next few years
For the purposes of evaluating aerosol formation based upon RMCS exhauster housing NDA and dose rate data the exhauster operations were grouped into 6 operating periods These periods are shown in Table F-1 and restated in Tables A-I and B-I All tanks sampled in Periods 1 2 4 5 and 6 were exhausted by the same exhauster with the same housing and filters present during that period Period 3 covered the time the SX exhauster was used during RMCS in SX farm
A brief description of each RMCS tank sampling operation is provided below
Tank 241-BY-1061194 to 1294 RMCS using the nitrogen purge gas system with an exhauster was formally begun on 111794 on tank BY-106 riser IOB Exhauster 2 (A)and Truck 2 were used A sintered metal prefilter was inserted in the riser between the tank and the exhauster A total of eight segments were taken in rotary mode and five segments in push mode until sampling was halted on 122194 One RMCS core was obtained The total exhauster run time was 4878 hours The stack record sample was removed and analyzed following this run period Dose rates taken at the side of the exhauster housing during RMCS were all lt05 mRhr The in-tank prefilter was smeared for contamination when removed from the tank with the smears showing less than detectable levels of radionuclides present (Waldo 1999) The prefilter had been washed with an installed spray system prior to removal from the tank but subsequent testing showed the water flow and pressure were too low to have been effective at removing contamination
Tank 241-BY-106195 Following some process modifications RMCS in BY-IO6 riser IOB began again on 11895 Exhauster 2 (A) and Truck 2 were used The sintered metal prefilter was inserted in the riser between the tank and the exhauster RMCS was halted on 12495 over authorization basis and equipment operability issues for RMCS A total of three segments were taken in rotary mode and eleven segments in push mode One RMCS core was obtained The total exhauster run time was 1867 hours The stack record sample was removed and analyzed following this run period Dose rates taken at the side of the exhauster housing during RMCS were all lt O S mRhr The in-tank prefilter was smeared for contamination when removed from the tank with the smears showing less than detectable levels of radionuclides present (Waldo 1999) The prefilter was not washed this time
Tank 241-BY-110795 to 1095 Following resolution of RMCS authorization basis and equipment issues and completion of the fabrication and testing of Trucks 3 and 4 RMCS was begun in BY-I IO on 71195 Exhauster 2 (A) and Truck 2 were used Samples were taken from risers 128 7 128 again and 4 There was no in- tank prefilter used in this or any subsequent RMCS periods Sampling was performed until 102595 when RMCS was halted over flammable gas issues A total of 13 RMCS segments and 56 PMCS segments were taken Three RMCS cores were obtained The total exhauster run time was 1125 hours The stack record sample was removed and analyzed following this run period Dose rates taken at the side of the exhauster housing during RMCS were all lt O S mRhr
Tank 241-BY-108795 to 895 Core sampling was begun in BY-IO8 on 72595 Exhauster 3 (B) and Truck 4 were used Sampling was done in risers 12A and 7 The tank material proved soft enough so that no RMCS segments were required all segments were obtained in push mode although the exhauster was operated during part of the time sampling was performed Sampling was completed 81895 A total of 16 PMCS segments were taken The total exhauster run time was 6617 hours The stack record sample was removed and
F-2
RPP-4826 Rev 1
analyzed following this run period Dose rates taken at the side of the exhauster housing during RMCS were all lt05 mRhr
Tank 241-BY-105895 to 1095 RMCS was begun in BY-I05 riser 12A on 83095 Exhauster 3 (B) and Truck 4 were used This tank has a concrete layer on top about 12-18 inches thick which had to be drilled through Part way through sampling questions arose as to the flammable gas status of the tank and RMCS was halted on 10695 A total of 3 RMCS and 7 PMCS segments were taken One RMCS core was obtained The total exhauster run time was 4413 hours The stack record sample was removed and analyzed following this run period Dose rates taken at the side of the exhauster housing during RMCS were all lt05 mRhr
Tank 241-SX-1011297 to 298 Following resolution of extensive regulatory and authorization basis issues and installation of equipment modifications RMCS started in SX-101 with Truck 4 on 12497 An RMCS exhauster was not used since all SX farm tanks excluding SX-113 and SX-I 15 are ventilated with the SX exhauster Sampling was performed in risers 19 and 4 and was completed on 21098 A total of 9 RMCS and 6 PMCS segments were taken Two RMCS cores were obtained SX exhauster stack record samples and filter housing dose rates were obtained as part of routine operations for the SX exhauster not as part of the RMCS process Filter papers used in the suction line for the CGM were saved and analyzed in the laboratory to estimate the airborne radionuclide concentration in the tank head space Two CGM filter papers were needed for each core as moisture in the tank vapors condensed on the papers in the cold weather and began to restrict tank gas flow to the CGM
Tank 241-SX-103498 to 598 RMCS started in SX-103 with Truck 4 on 42798 The SX exhauster was used for ventilation (see SX- 101 above) Sampling was performed in risers 7 and 1 1 and was completed on 51198 A total of 6 RMCS and 18 PMCS segments were taken Two RMCS cores were obtained During sampling filter papers used in the suction line for the CGM were saved and analyzed in the laboratory to estimate the airborne radionuclide concentration in the tank head space One CGM filter paper was used during each core SX exhauster stack record samples and filter housing dose rates were obtained as part of routine operations for the SX exhauster not as part of the RMCS process
Tank 241-SX-105298 to 598 RMCS started in SX-105 with Truck 3 on 22598 The SX exhauster was used for ventilation (see SX- 101 above) Sampling was performed in risers 6 and 14 and was completed on 51598 A total of 6 RMCS and 20 PMCS segments were taken Two RMCS cores were obtained During sampling filter papers used in the suction line for the CGM were saved and analyzed in the laboratory to estimate the airborne radionuclide concentration in the tank head space Two filter papers were needed for the first core as moisture in the tank vapors condensed on the papers in the cold weather and began to restrict tank gas flow to the CGM One filter paper was used for the second core SX exhauster stack record samples and filter housing dose rates were obtained as part of routine operations for the SX exhauster not as part of the RMCS process
Tank 241-SX-102698 to 798 RMCS started in SX-102 with Truck 4 on 61798 The SX exhauster was used for ventilation (see SX- 101 above) Sampling was performed in risers 8 and 4 and was completed on 7798 A total of 2 RMCS and I8 PMCS segments were taken Two RMCS cores were obtained During sampling filter papers used in the suction line for the CGM were saved and analyzed in the laboratory to estimate the airborne radionuclide concentration in the tank head space One filter paper was used for each core SX exhauster stack record samples and filter housing dose rates were obtained as part of routine operations for the SX exhauster not as part of the RMCS process
Tank 241-S-110598 to 698 RMCS was begun in S-I10 on 51898 Exhauster C (4) and Truck 3 were used This tank marked the first use of an RMCS exhauster since 1995 Sampling was completed on 6498 Risers 6 and 14 were sampled A total of IO RMCS and 8 PMCS segments were taken Two RMCS cores were obtained The
F-3
RPP-4826 Rev I
total exhauster run time was 15978 hours The stack record sample was removed and analyzed following this run period Dose rates taken at the side of the exhauster housing during RMCS were all lt05 mRhr During sampling filter papers used in the suction line for the CGM were saved and analyzed in the laboratory to estimate the airborne radionuclide concentration in the tank head space One filter paper was used for each core Waste particles retained on the exhauster housing filters were part of the inventory subsequently measured by NDA following completion of the first core in TX-I 13
Tank 241-U-107698 to 798 RMCS was begun in U-107 on 61098 Exhauster C and Trucks 3 and 4 were used Sampling was completed on 71598 Risers 7 and 2 were sampled A total of IO RMCS and 19 PMCS segments were taken Two RMCS cores were obtained The total exhauster run time was 27385 hours The stack record sample was removed and analyzed following this run period Dose rates taken at the side of the exhauster housing during RMCS were all 105 mRihr During sampling filter papers used in the suction line for the CGM were saved and analyzed in the laboratory to estimate the airborne radionuclide concentration in the tank head space One filter paper was used for each core Waste particles retained on the exhauster housing filters were part of the inventory subsequently measured by NDA following completion of the first core in TX-I 13
Tank 24l-BY-105798 to 898 RMCS was begun in BY-105 again on 72298 Exhauster C and Trucks 3 and 4 were used Sampling was completed on 82598 Risers 7 and 1 1 B were sampled A total of 18 RMCS and 18 PMCS segments were taken The material was hard enough to require rotary mode sampling all the way to the bottom of the waste but negligible recovery was obtained After RMCS was performed to the waste bottom a PMCS core was taken in the same hole to recover material Two RMCS cores were obtained The exhauster run time was 13577 hours for the first RMCS core and 30792 hours for the second RMCS core Stack record sample information in ABCASH shows 30558 hours operation for the second core but the sampler data sheet shows the time counter was mistakenly reset 234 hours into the run No correction was made to the BY-IO5 2nd core record sample concentration for this document since the error is conservative and results in only slightly higher (ltI) record sample radionuclide concentrations for this core A stack record sample was removed and analyzed following each core giving two record samples for BY-IO5 in 1998 Dose rates taken at the side of the exhauster housing during RMCS were almost all lt05 m R h but a few readings indicated 07 mRihr This variation was assumed due to personnel reading the instrument differently or the fact that the exhauster had been used on enough tanks that by now there was sufficient activity on the filters to cause readings approximately at the background detection level The final reading when both cores were completed was lt05 m R h During sampling filter papers used in the suction line for the CGM were saved and analyzed in the laboratory to estimate the airborne radionuclide concentration in the tank head space One filter paper was used for each core Waste particles retained on the exhauster housing filters were part of the inventory subsequently measured by NDA following completion of the first core in TX-113
Tank 241-TX-113998 to 599 Core sampling was begun in TX-I 13 riser 3 on 92298 Exhauster B (3) and Truck 4 were used at the start This was the first use of Exhauster B since it was modified Exhauster B ran for a total of 8738 hours until being disconnected on 102398 During this time two PMCS segments were taken and no RMCS segments Exhauster C was then installed and operated for 5598 hours from 121098 to 122898 No RMCS or PMCS sampling was performed during this time frame RMCS segments werent taken until 299 Exhauster C ran for a 30230 hours between 122898 and 21299 Sampling was completed on the core from riser 3 on 21299 A total of 12 RMCS segments were obtained during the time Exhauster C was operating Exhauster flow rate for both exhausters was a nominal 200 scfm Stack record samples were taken following Exhauster B removal at the end of 1998 for Exhauster C and following completion ofthe first core with Exhauster C Aerosol calculations were based on only the 30230 hours run time for Exhauster C in 1999 since this was the time period during which RMCS segments were obtained Dose rates taken at the side of the exhauster housing during the short PMCS only sampling period with Exhauster B were all ltOS m R h Dose rates with Exhauster C varied between lt O S mRhr and 07 mRhr The final reading on Exhauster C following completion of the first core was 07 mFUhr During sampling filter papers used in the suction line for the CGM were saved and
F-4
RPP-4826 Rev I
analyzed in the laboratory to estimate the airborne radionuclide concentration in the tank head space One filter paper was used for the core Waste particles retained on the exhauster housing filters were part of the inventory subsequently measured by NDA following completion of this core
Sampling in riser 5 was begun on 41299 using Exhauster B and Truck 3 A total of 6 RMCS and 1 PMCS segments were taken for this core before sampling was halted on 42899 The total exhauster run time for this core was 11712 hours Problems with high vacuum in the tank required the exhauster flow rate to be reduced to 190 scfm to keep the system within pressure limits The stack record sample for the second core was removed and analyzed following the run period Dose rates taken at the side of the exhauster housing during the second core were all lt05 m M r During sampling filter papers used in the suction line for the CGM were saved and analyzed in the laboratory to estimate the airborne radionuclide concentration in the tank head space One filter paper was used An NDA was performed on the exhauster housing following this core The only radionuclides present in the housing were those from this core or what was removed from the tank head space during the non-RMCS activities in this tank from 92298 and 102398
Some clarification may be needed to explain use of the exhauster operating times and NDA dose rate and record sample data obtained during core sampling on TX-I 13 Core sampling was set up for sampling riser 3 on TX-113 in September 1998 with Exhauster B Exhauster B operated for a total of 8738 hours between 92298 and 102298 The stack record sample was removed at the end of this period The ERS database incorrectly shows the exhauster operated between 111698 and 111998 The ABCASH database shows the stack record sample was removed on 111998 The stack record sample showed positive emuent concentrations during this time period with variances 400 No RMCS samples were taken during this period so the data and time werenrsquot included when calculating RMCS aerosol numbers Exhauster B was removed and Exhauster C installed in late November-early December Exhauster C was operated for a total of 5559 hours between 121098 and 122398 The stack record sample was removed on 122898 No sampling was performed during this period so the data and time werenrsquot included when calculating RMCS aerosol numbers Exhauster C was operated for a total of 30218 hours between 122898 and 2899 All the RMCS segments from riser 3 were taken in this time period so only the data and time for this period were included when calculating RMCS aerosol numbers Exhauster B was used during sampling of riser 5 Exhauster B operated for a total of 11712 hours between 41299 and 42899
Tank 241-TX-l18599 to 699 RMCS was begun in TX-I 18 on 5699 Exhauster C (4) and Truck 4 were used Sampling was completed on 6298 Risers 9B and 12B were sampled A total of 9 RMCS segments were taken there were no PMCS segments Two RMCS cores were obtained The total exhauster run time was 21247 hours The stack record sample was removed and analyzed following this run period The maximum dose rate taken at the side of the exhauster housing following RMCS was 08 m M r CGM filter papers were not analyzed An NDA was performed on the exhauster housing following completion of the two cores The exhauster housing contained the same nuclides as for the first NDA (S-110 U-107 BY-105 and TX-I 13 first core) plus those from TX-I 18
The basic core sampling operational data used in this document includes the number of RMCS cores and segments the exhauster run times and flow rates the RMCS exhauster HEPA filter dose rates and tank vapor space temperatures Table F-l lists the basic operational data This information excluding tank vapor space temperature data was obtained from procedural data sheets in the sampling work packages (References W - 1 to WP-23)
Tank temperature data for the tanks ventilated with the RMCS exhausters was obtained from the TWINS database Plots for each tank were prepared for the time RMCS was conducted and the average value of the highest thermocouple located in the tank (the lowest temperature reading) was estimated and used as the average tank head space temperature during the RMCS period
The SX exhauster flow rates listed in Table F-l are estimates only The combined flow rate for SX-IO1 through SX-106 plus SX-109 (7 tanks) averaged 440 cfm during CY 1996 (Kaiser 1997) for an average of 63 cfm per
F-5
RPP-4826 Rev I
tank Based upon inlet flow measurements at the tank inlet HEPA filters (Fanis 1998) the flow through each individual tank (SX-IO1 through SX-106 plus SX-109) was lt55 cfm at the breather filter Assuming an exhaust flow of 100 cfm for each SX farm tank sampled is therefore conservative
Calculated Data
Calculated data include the tank head space volumes conversion of the RMCS exhauster flow rate from scfm to acfm and the number of tank head space changeouts made by an exhauster during RMCS
Tank head space volume includes the dome space volume above the top of the sidewall plus the void space between the waste surface and the top of the sidewall The formula used to calculate tank head space volumes WN
Head Space Volume in A = (DS + [(H) (12) + HI + Hb - H] (V)) - 748
Where DS = dome space volume gal H = height of tank body sidewall above knuckle A HI = height of tank knuckle area in Hb = height oftank bottom below knuckle in H = height of waste in tank in V =27555 galin of waste in SX tanks 2754 gallin in all others
The tank dome space volumes height of tank sidewall above the knuckle height of tank knuckle area and height of tank bottom below the knuckle were obtained from Reynolds 1999 The height of waste in each tank at the time of core sampling was obtained from the TWINS database Tank dimensional and waste level data are given in Table F-2 along with the calculated tank head space volumes
Aerosol calculations for Appendices A-C require exhauster flow rates in actual cubic feet per minute The RMCS exhauster flow rate is controlled and recorded in standard cubic feet per minute The mass flow rate of the exhauster air is measured and internal logic in the exhauster controller calculates what the volumetric flow rate would be if the temperature and pressure in the exhauster inlet were at standard conditions The standard conditions used in the logic controller are 29921 in Hg (760 mm Hg) and 69F (ZIT)
A correction factor is built into the exhauster control logic that assumes an atmospheric pressure of 2927 in Hg the average atmospheric pressure at Hanford The RMCS exhauster will operate at about 1-2 in H20 negative pressure resulting in about a 2916 in Hg pressure in a waste tank when the RMCS exhauster is operating To revise the indicated scfm RMCS exhauster reading to an acfm value the RMCS exhauster scfm flaw rate was multiplied by (29922916)(T+459)528 where Tis the tank head space temperature in OF The tank head space temperatures in Table F-1 were input to the spreadsheet file used for aerosol calculations and converted to acfm The flow rates in acfm are included in Table F-I
The tank head space changeouts when using the RMCS exhauster were calculated by multiplying the exhauster acfm flow rate by the time of exhauster operation and dividing the result by the tank head space volume Tank head space changeouts are listed in Table F-2
F-6
c
gt 2
RPP-4826 Rev 1
APPENDIX G
REFERENCES
G-0
RPP-4826 Rev 1
APPENDIX G - References
Diedeker 1999 NDA of RMCS HEPA Filters L P Diedeker WMH E-Mail to JS Schofield CHG November 29 I999
ERDA 1976 Nuclear Air Cleaning Handbook ERDA 76-21 Buchsted C A Fuller A B and Kahn 1 E Oak Ridge National Laboratory 1976
Farris 1998 Internal Note T R Farris LMHC to J S Schofield LMHC Breather Filter Flow Rates for SX-Farm 31698
Foust 1999 Internal Memo RMCST Exhauster HEPA Filter Dose Rate Calculations D J Foust LMHC to J S Schofield LMHC October 25 1999
Greager 1999 Correspondence No WMH-9954450 Non-Destructive Analysis of the Rotay Mode Core Sample High-Efjiciency Particulate Air Filters E M Greager WMH to P C Miller LMHC June 28 1999 [Transmittal of HNF-4199 Resultsfram NDA Measurement of the 296-P-34 RMCS HEPA Filters]
HNF 1999 HNF-SD-WM-SAR-067 Tank Waste Remediation System Final Safety Analysis Report Rev 1 The revision incorporating RMCS accident analyses was submitted as Addendum 5 to DOE as a change to the FSAR predecessor the Basis for Interim Operation (BIO) LMHC-9857075 80232764-9-KOOl Submittal of Authorization Basis Amendment Package for Rotay and Push Mode Core Sampling in Satisfaction of Perfarmance Agreement TWR 122 Expectations I and 3 D 1 Allen LMHC to A M Umek FDH August 30 1998 Addendum 5 as of mid-January 2000 is waiting for approval by DOE
Kaiser 1997 T D Kaiser LMHC E-Mail to J S Schofield LMHC SX Tank Flow Data 42197
NUREG 1995 Potential Radionuclide Emissionsfrom Stacks on the HanfordSite Part I Dose Assessment Davis W E and Barnett J M Westinghouse Hanford Company from Proceedings of the 23 DOEMRC Nuclear Air Cleaning Conference held July 25-28 1994 February 1995
Schofield 2000a Letter 74910-00-002 Use of Microshield Calculations for RMCS Exhauster Housing for Estimating Radionuclide Quantities on the Filters Using NDA and Dose Rate Measurements I S Schofield CHG to File January 62000
Schofield 2000b Letter 74910-00-003 Rev I RMCS Exhauster Stack RecordSample Data J S Schofield CHG to File January 202000
Reynolds 1999 D R Reynolds LMHC E-Mail to I S Schofield LMHC transmitting Tank Volume Calculations draft of calculations done by Mike Plesha and Reed Hendershot data to be used for RESOLVE computer program for Hanford waste tanks August 3 1999
TWINS Tank Waste Information Network System database available at httptwinspnlgovSOO lhtbinTCDgetTableListexe
Waldo 1999 letter 74910-99-009 RMCS Exhauster Aerosol Test Data E I Waldo to J S Schofield June 22 1999
WHC 1993 WHC-SD-WM-ES-225 Rev I AerosolStudy for the Rotary Mode Exhauster P M Francis Westinghouse Hanford Company April 20 1993
WHC 1997 WHC-SD-WM-SAD-035 Rev Ob A Safety Assessment of Rotary Mode Core Sampling in Flammable Gas Single Shell Tanks Hanford Site Richland Washington August 8 1997
G- I
RPP-4826 Rev I
CGM Data CGM-I Letter PARTICULATE SAMPLING OF 241-SX-IO1 DURING ROTARY MODE CORE SAMPLING D C
Langlois E2 Consulting Engineers to J S Schofield Lockheed Martin Hanford Company March 16 1998
CGM-2 Letter PARTICULATE SAMPLING OF 241-SX-I05 DURING ROTARY MODE CORE SAMPLING D C Langlois E2 Consulting Engineers to J S Schofield Lockheed Martin Hanford Company June 9 1998
CGM-3 Letter PARTICULATE SAMPLING OF 241-SX-103 DURING ROTARY MODE CORE SAMPLING D C Langlois E2 Consulting Engineers to J S Schofield Lockheed Martin Hanford Company June 12 1998
CGM-4 Letter PARTICULATE SAMPLING OF 241-S-110 DURING ROTARYMODE CORESAMPLING D C Langlois E2 Consulting Engineers to J S Schofield Lockheed Martin Hanford Company July 20 1998
CGM-5 Letter PARTICULATE SAMPLING OF 241-SX-102 DURING ROTARY MODE CORE SAMPLING D C Langlois E2 Consulting Engineers to J S Schofield Lockheed Martin Hanford Company July 22 1998
CGM-6 Letter PARTICULATE SAMPLING OF241-U-107 DURING ROTARY MODE CORE SAMPLING D C Langlois E2 Consulting Engineers to J S Schofield Lockheed Martin Hanford Company August 3 1998
CGM-7 Letter PARTICULATE SAMPLING OF 241-BY-105 DURING ROTARY MODE CORESAMPLING D C Langlois E2 Consulting Engineers to 1 S Schofield Lockheed Martin Hanford Company September 17 1998
CGM-8 Letter PARTICULATE SAMPLING OF 241-TX-I13 DURING ROTARY MODE CORESAMPLING D C Langlois E2 Consulting Engineers to J S Schofield Lockheed Martin Hanford Company March 15 1999
CGM-9 Letter PARTICULATE SAMPLING OF 241-TX-113 DURING ROTARY MODE CORE SAMPLING D C Langlois E2 Consulting Engineers to I S Schofield Lockheed Martin Hanford Company May 31 1999
Notices of Construction NOC-I DOEIRL-93-40 Radioactive Air Emissions Program Notice of Construction Rotary Mode Core-Sampling
Truck and Exhauster Approved by Letter AIR 93-707 A W Conklin WDOH to J E Rasmussen DOEIRL 7893
NOC-2 DOEIRL-94-118 Rev 0 Radioactive Air Emissions Program Notice of Construction for the Rotary Mode Core-Sampling Systems Three and Four Approved by Letter AIR 95-603 A W Conklin WDOH to J E Rasmussen DOERL 63095
NOC-3 DOERL-94-118 Rev 1 Radioactive Air Emissions Program Notice of Construction for the Rotary Mode Core-Sampling Systems Three and Four Approved by Letter AIR 98-301 W W Conklin WDOH to I E Rasmussen DOEIRL 3698
NOC-4 DOEIRL-97-70 Radioactive Air Emissions Program Notice of Construction for Rotary Mode Core- Sampling in SX Tank Farm Approved by Letter AIR 97-1 101 A W Conklin WDOH to J E Rasmussen DOEIRL 113097
NOC-5 USEPA Letter OAQ-107 (no title approving DOE submittal 97-EAP-590 dated 72997) A J Frankel USEPA to J E Rasrnussen DOEIRL 8497
NOC-5 USEPA Letter OAQ-107rsquo (nb title approving DOE submittal 97-EAP-723 dated 101797) A J Frankel USEPA to J E Rasmussen DOERL 11498
Note that both letters have ldquoOAQ-107rdquo following ldquoReply to Attn ofrdquo
G-2
RPP-4826 Rev I
Work Packages WP-I ES-94-00808 WP-2 ES-95-00258 WP-3 ES-95-00045 - WP-4 ES-95-00434 - WP-5 ws-97-00173 - WP-6 WS-97-00174 - WP-7 ws-97-00143 - WP-8 WS-97-00144 - WP-9 WS-97-00207 - WP-I 1 WS-97-00208 - WP-12 WS-98-00049 - WP-13 WS-97-00050 - WP-14 WS-97-00224 - WP- I5 WS-97-00225 - WP-16 WS-97-00230 - WP- I7 ws-97-0023 1 - WP-18 ES-97-00452 - WP-19 ES-97-00453 - WP-20 WS-98-00072 - WP-21 WS-98-00073 - WP-22 WS-98-00067 - WP-23 WS-98-00068 -
241-BY-IO6 Perform Rotary Core Sample [Riser IOB] 241-BY-I IO Rotary Core Sample [Risers 12B 7 IZB 41 241-BY-IO8 Obtain Rotary Core Sample [Risers 12A amp 71 241-BY-IO5 Rotary Mode Core Sample [Riser 12A] 241-SX-101 Rotary Mode Core Sample Riser 19 241-SX-101 Rotary Mode Core Sample Riser4 241-SX-103 Rotary Mode Core Sample Riser 7 241-SX-103 Rotary Mode Core Sample Riser I I 241-SX-105 RMCST Obtain Core Sample Riser 6 241-SX-105 RMCST Core Sample Riser 14 241-SX-102 Rotary Mode Core Sample Riser 8 241-SX-102 Rotary Mode Core Sample Riser 4 241-S-1 IO RMCST Obtain Core Sample Riser 6 241-S-1 IO RMCST Obtain Core Sample Riser 14 2414-107 RMCSTCore Sample Riser 7 241-U-107 RMCST Core Sample Riser 2 241-BY-IO5 RMCST Core Sample Riser 7 241-BY-IO5 RMCST Core Sample Riser 1 IB 241-TX-113 Rotary Core Sample Riser 3 241-TX-113 RMCST Core Sample Riser 5 241-TX-I 18 RMCST Core Sample Riser 9B 241-TX-I 18 RMCST Core Sample Riser 128
G-3
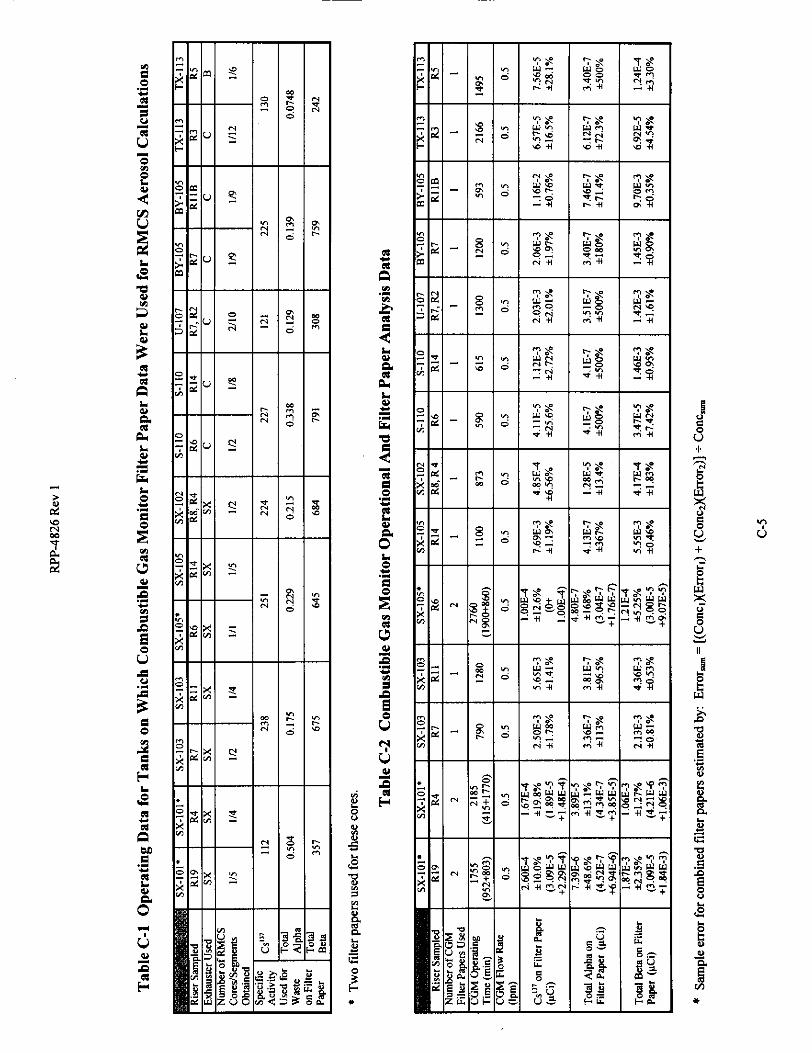
RPP-4826 Rev 1
Column 4 of Table D-l lists the stack exhaust volume for each stack record sample period The stack exhaust volume for the exhauster installation on S-l IO was calculated by
[ZOO std ft3min][15978 hrs] [60 minhr] = 199E+6 std ftrsquo
All other stack volumes in Table D-l were calculated the same way Unlike in Appendices A B and C no adjustment was made to change the 200 scfm to actual cfm This is because the RMCS stack record sample concentrations from Table D-3 are based upon a 200 scfm flow rate rather than the actual flow rate Since the concentrations are on the same basis as the flow rate there is no need to correct to acfm
The total beta emissions for the RMCS exhauster stack were calculated by multiplying the volume by the concentration For the same S-l IO data point
[199E+6 ft3] [18E-15 pCiml] [28317mlft3] [mCi1000 pCi] = 1OE-7 mCi total beta
All other total beta emissions in Table D-l were calculated the same way
The Csrdquorsquo to total beta ratio was calculated from data in Table E-I For the same S- l I O data point
326E+5 Ci CsI3rsquo f I 14E+6 Ci total beta = 029 Ci CslhCi total beta = 029 rnCi CsrdquorsquomCi total beta
The Csrsquordquo emission for the same S-l IO data point was thus
[I OE-7 mCi total beta] [029 mCi CsrdquorsquomCi total beta] = 29E-8 mCi Csrdquorsquo
All Csrsquordquo emissions in Table D-l were calculated in the same manner
The penetration efficiency for each operating period was calculated by dividing the exhauster outlet by the filter inlet Csrdquorsquo quantities For operating period 4 this was
[81E-6 mCi] f [5OE-I + 8IE-6 mCi] = 16E-5 = 16E-3
The DF for operating period 4 is
1 + 16E-5 = 62E+4
The overall DF for periods 4 5 and 6 was calculated by dividing the efluent from all three periods by the total filter input
[95E-6 mCi] f [67E-I t 95E-6 mCi] = 14E-5 = 14E-3 penetration efficiency
I - I 4E-5 = 0999986 = 999986 filter efficiency
1 f 14E-5 = 73E+4 decontamination factor based upon housing inlet and eftluent data
Estimation of Housing Decontamination Factor Based upon General Performance Data
HEPA filters are tested at the manufacturer to a minimum 9997 efficiency using a 03 pm monodisperse aerosol After installation HEPA filters are tested in-place per ASME N5 I O to a minimum 9995 efficiency using a polydisperse aerosol with an approximate droplet size distribution of 99 less than 30 pm 50 less than 07 pm and 10 less than 04 pm The RMCS exhauster housing is tested per ASME N510 and is thus required to have a minimum removal eficiency of 9995 for an aerosol with this approximate size distribution The particle size distribution of the waste aerosols generated by RMCS is unknown but it is assumed that the removal efficiency for RMCS generated aerosols was the same as the removal efficiency for the ASME generated test aerosol
D-2
RPP-4826 Rev I
A 9995 efficiency is equivalent to a DF of 2E+3 while a 9997 efficiency is equivalent to a DF of 33E+3 The actual DF for the RMCS exhauster housing is higher than either of these It has two HEPA filters in series even though the minimum efficiency specified in the NOCs for the RMCS exhausters is only equivalent to one HEPA ERDA 1976 recommends using a DF of 3000rdquo for a filter bank where n is the number of HEPA filters in series This would result in a DF of 9E+6 for the RMCS exhauster housing This is unrealistic Using a DF of 9E+6 will calculate to Csrdquorsquo quantities on the HEPA filtersthat are orders of magnitude above what have been shown to be there based upon the measured dose rates and NDA A DF of 9E+6 would mean the dose rate would have to be almost 100 mRhr at the side of the exhauster housing instead of the 05-08 mRhr dose rates encountered The waste particles will not have the same particle size distribution entering the second HEPA filter as when entering the first The majority of the waste particles will be captured on the I rdquo HEPA filter and although the DF for each HEPA if tested individually using the ASME N5 IO aerosol test method may be 3E+3 (or higher) the overall DF of the two filters in series will not be 3000lsquo This is because the particle size distribution entering the Znd HEPA could have a greater percentage of smaller particles than that entering the 1rdquo
NUREG 1995 included an evaluation of a number of different facility stacks at the Hanford site where the HEPA filter upstream air concentrations were estimated using several different methods This report concluded that back-calculation using a value of 3000rdquo overestimated the upstream radionuclide concentration by three to four orders of magnitude when compared to filter NDA data for the nine stacks for which NDA data were obtained and by three orders of magnitude for the two stacks for which upstream air sample data were available Back- calculation using a value of 3000rdquo was shown to be high by four orders of magnitude for the single stack for which a powder release estimate was available Based upon this information the RMCS exhauster dual filter-in-series housings would have a DF of at least three and maybe four orders of magnitude less than 9E+6 or in the 1E+3 to 1 E+4 range A DF of IE+3 would he less than the minimum permissible under the NOC Comparing the older stack data and design with the newer RMCS exhauster design the minimum DF would be expected to be at least 1E+4
Table D-2 provides the available RMCS exhauster aerosol test data This information was obtained from Waldo 1999 Prior to 1998 the RMCS exhauster primary HEPA filter efficiency and either the secondaly HEPA filter or the overall efficiency for both filters were tested Starting in 1998 only the primary and secondary HEPA filter efficiency were measured The overall efficiency of the two filters in series was only measured three times in 11 setups Twice the overall penetration efficiency was lt0002 and the remaining time the only information that could be found was a value of lt005 Most individual filters had a penetration efficiency of 0002 This appears to be about the limit of the detection equipment Based upon Table D-2 data a penetration efficiency of 0002 (99998 efficiency) is normal for a single HEPA and thus a minimum for an RMCS exhauster housing Assuming a 0002 penetration efficiency for the two filters combined calculates to a DF of 5E+4 (equal to 1 +
000002) for the RMCS exhauster housing
In summary the measured DF for the RMCS exhauster housings over the period from May 1998 through June 1999 was about 73E+4 RMCS aerosol testing prior to use indicates a DF of about 5OE+4 for each of the filters separately but their overall efficiency is not measured Referenced data based on older stacks at Hanford indicate the two HEPA RMCS exhauster housing would likely have a DF of at least IE+4
Estimated Aerosol Levels During RMCS Based Upon RMCS Stack Record Sample Data
Revision 0 of this document used the positive record sample results with variance less than 100 to estimate aerosol concentrations in the exhauster inlet using an assumed exhauster housing DF of 5OE+4 This method of estimating aerosols was eliminated from Revision 1 because the stack concentrations were either too low too scattered or too questionable to provide reliable results There were 112 RMCS stack record sample data points evaluated in Schofield 2000b Excluding the total beta sample results used for estimation of the housing DF there were only ten data points remaining with positive values and variances ltloo the remaining data points were either negative had a variance gtloo or the results were not available
For comparison purposes only Schofield 2000b applied the DF of 73E+4 calculated in this document to the data points not used to calculate the exhauster housing DF to estimate aerosol concentrations upstream of the filters The results showed aerosol levels approximately the same as those estimated using NDA dose rate or CGM filter paper data when a value of zero was used for negative sample results or those with a variance gtloo When only
D-3
RPP-4826 Rev 1
the ten positive results with a variance ltloo were used the aerosol levels calculated to be two to five times higher than those estimated using NDA dose rate or CGM filter paper data Because of the variability of data resulting from the extremely low record sample concentrations and the few useable data points estimation of aerosol levels using record sample data was not included in Revision I See Schofield 2000b for further discussion of the use of record sample data to estimate aerosol levels
Summary of Calculations
A total of nine RMCS exhauster stack record sample data points were used to estimate the RMCS exhauster filter housing decontamination factor These data points were obtained when sampling on five tanks during which 10 RMCS cores and 65 RMCS segments were obtained The overall decontamination factor was 73E+4
Estimation of aerosol generation quantities based upon RMCS stack record sample data is possible However results will likely be skewed high if data points that show non-detectable levels of radionuclides present are ignored instead of using a value of zero for the data point
D-4
RPP-4826 Rev 1
APPENDIX E
TANK WASTE RADIONUCLIDE CONCENTRATIONS USED FOR AEROSOL CALCULATIONS
E-0
RPP-4826 Rev 1
APPENDIX E - Tank Waste Radionuclide Concentrations Used for Aerosol Calculations
The RMCS exhauster NDA data HEPA filter dose rate data CGM filter paper data and stack record sample data provide information on the quantity of radionuclides on the exhauster filters in the tank head space or the exhauster stack during RMCS These radioactivity quantities need to be divided by the waste radionuclide concentration specific activity to determine the mass of waste in the tank head space and in the tank gases sent to the exhauster
The mass quantities in this document were calculated using dry basis radionuclide concentrations Waste particles carried into the tank head space by the purge gas could be wet or dry If wet some of the non-chemically bound water will start to evaporate immediately providing the tank relative humidity is 400 The water present in a waste particle may be chemically bound as a hydrate or free The chemically bound water will not readily evaporate therefore even a ldquodryrdquo particle may have some water associated with it It is impractical to measure the actual water content of the waste particulates caught on the CGM filter paper the exhauster HEPA filters or the stack record sample paper Since the quantity of water in the waste particulates is unknown particulate levels were calculated using dry basis radionuclide concentrations Thus all particulate values given in this document are stated on a dry basis
The waste radionuclide concentrations on a dry basis were calculated from data available in the Tank Waste Information Network System (TWINS) The Best Basis InventorylBest Basis Summary numbers were used These values are the most complete and up to date readily available estimates for Hanford waste tank contents but do not include water The information was downloaded from TWINS into a spreadsheet The total chemical total beta and total alpha quantities were summed in the spreadsheet for all the tanks which were sampled and concentrations for Csrdquorsquo Sr9rsquo total beta and total alpha automatically calculated in pCig These concentrations are provided in Table E-I Because lab techniques for measuring gross beta levels only detect beta particles with a minimum decay energy above 150-200 kev only radionuclides with a decay energy of gt-200 kev were included in the total beta numbers
The TWINS radionuclide concentrations were obtained in December 1999 No corrections were made for decay for this document
The CGM filter paper and stack record sample data indicate the measured radionuclide values are not always in the same ratio to each other as given by TWINS nor are all radionuclides detected that TWINS indicates are present Radionuclides can be distributed unevenly in a tank Soluble fission products (primarily Csrsquordquo) are found in the liquid saltcake and in sludges Insoluble fission products and actinides are found largely in sludges as these are primarily chemical precipitates Sludge could be mixed with saltcake be present in a distinct layer at the bottom of a tank or in several layers in the tank depending upon how waste was transferred into a tank Waste particles may thus not have the same specific activity on a microscopic scale as they would have on a macro scale were the tank contents homogenized During RMCS a top to bottom core sample is attempted resulting in the drill bit and purge gas (which causes aerosols to form) passing through most ofthe waste matrix Assuming the aerosol generation rate is approximately constant during drilling the specific activity of a radionuclide in the suspended solids should be roughly the same as the average specific activity of the same radionuclide in the tank waste While the waste specific activity is probably not homogeneous from top to bottom in a tank and the aerosol generation rate will likely also vary it is beyond the scope of this document to provide an in-depth analysis of all the factors affecting aerosol radionuclide concentration Although sample radionuclide data were not always in the same ratio as provided by TWINS for the purpose of this document the simplifying assumption was made that the average tank specific activity is adequate to provide an approximation of the suspended solids specific activity for all radionuclides Average tank individual radionuclide specific activities were used in the preparation of the exhauster NOCs
The aerosol calculations presented in this document are only as accurate as the TWINS data The combined radionuclide content of all Hanford waste tanks is known fairly well since the overall content is based upon reactor production records CsrdquorsquoSrW recovery data and processing plant discharges Thus TWINS data for all tanks combined should be reasonable There are undoubtedly differences between TWINS data and the actual contents of a specific tank While the specific tank radionuclide data from TWINS used in this document may not be exact deviations from the actual concentrations are assumed to balance out over the number of tanks sampled
E- 1
RPP-4826 Rev 1
APPENDIX F
ROTARY MODE CORE SAMPLING EXHAUSTER AND CORE SAMPLE DATA
F-0
RPP-4826 Rev 1
APPENDIX F - Rotary Mode Core Sampling Exhauster and Core Sample Data
This appendix provides the basic data obtained during RMCS operations which was used in preparation of this document
Basic Operational Data
There have been three RMCS exhausters and three RMCS sampling trucks deployed since starmp of nitrogen- purged RMCS in November 1994 The exhausters are formally designated 296-P-32296-P-33 and 296-P-34 These were originally referred to as parts of RMCS Systems 2 3 and 4 respectively in the Notices of Construction (NOC) for these units The exhauster designations were changed for routine field use in 1996 to exhausters A B and C to avoid confusion with core sampling trucks 23 and 4 since any exhauster could be used with any RMCS truck Exhauster A (2) and RMCS Truck2 have not been used for RMCS since 1995 and are no longer in service for core sampling
Rotary mode core sampling has been conducted in four general time frames since 1994 These time frames were separated by down times for equipment modifications or resolution of environmental permitting and safety concerns For ease of analysis in this document exhauster operations were organized into six distinct operating periods Periods I to 6 were grouped based upon times when the same exhauster and same set of HEPA filters were being used These periods thus overlap with the general operating time frames The four operating time frames were
The first time frame lasted from November 1994 to January 1995 RMCS Truck 2 and Exhauster 2 (A) were used on Tank BY-106 along with an in-tank prefilter This tank provided the initial deployment and testing of the nitrogen-purged equipment in a waste tank During this period radiation dose rates were taken at the side of the exhauster housing Stack record samples were taken in December 1994 and January 1995
The second time frame lasted from July 1995 through October 1995 RMCS Trucks 2 and 4 were used with Exhausters 2 and 3 (A and B) on BY-105 BY-IO8 and BY-I IO During this period radiation dose rates were taken at the sides of the exhauster housings Stack record samples were taken after completion of sampling on each tank No RMCS samples were taken from BY-108 all samples were taken in push mode for this tank
The third time frame began when RMCS was restarted in December 1997 Trucks 3 and 4 were used for sampling of SX-101 SX-103 SX-105 and SX-102 with the SX tank farm exhauster providing ventilation The RMCS exhausters were not used During this period radiation dose rates were taken at the sides of the SX exhauster housing as part of HPT routine surveys SX farm exhauster stack record samples were taken when required by normal operating procedures SX record sampler and filter housing dose rate data were not evaluated for this document It would not be practical using filter dose rate or stack record sample data to estimate the RMCS aerosol addition if any to the SX ventilation system The background radiation around the SX filter housing makes measurement of any small increase in dose rate very difficult to detect The number of tanks being ventilated and the involved off-gas header routings (the exhauster is pulling on thirteen tanks in series or in parallel with the tank being sampled) and any in-tank activities in the SX tanks not being sampled would make it impractical to assess what aerosols resulted from RMCS Beginning with RMCS in SX farm radionuclide analyses were performed on the filter papers protecting the CGMs which draw air out of the tank vapor space for flammable gas detection
The fourth time frame began in May 1998 Between 1095 and 598 Exhausters B and C were extensively modified with new filter housings and other equipment to meet new NOC requirements Trucks 3 and 4 were used with Exhausters B and C (3 and 4) on S-l IO U-107 BY-105 TX-113 and TX-I 18 This period marked the first use ofthe RMCS trucks and RMCS exhausters together following resolution of flammable gas concerns and modifications to the exhausters New filters were installed Radiation dose rates were taken at the sides of the exhauster housings Stack record samples
F- 1
RPP-4826 Rev I
were taken after completion of sampling for each exhauster installation Radionuclide analyses were performed on the CGM filter papers for all tanks except TX-118 An NDA was performed on the Exhauster C housing following completion ofthe first core on TX-I 13 The housing filters when assayed contained aerosols captured by the exhauster following RMCS in S-l IO U-107 BY-105 (1998) and the first core of TX-I 13 Another NDA was performed on Exhauster C following both cores in TX-I 18 An NDA was performed following sampling of the second core in TX-I 13 using Exhauster B The time frame ran through early June 1999 No RMCS samples have been taken after June 1999 nor are any planned for the next few years
For the purposes of evaluating aerosol formation based upon RMCS exhauster housing NDA and dose rate data the exhauster operations were grouped into 6 operating periods These periods are shown in Table F-1 and restated in Tables A-I and B-I All tanks sampled in Periods 1 2 4 5 and 6 were exhausted by the same exhauster with the same housing and filters present during that period Period 3 covered the time the SX exhauster was used during RMCS in SX farm
A brief description of each RMCS tank sampling operation is provided below
Tank 241-BY-1061194 to 1294 RMCS using the nitrogen purge gas system with an exhauster was formally begun on 111794 on tank BY-106 riser IOB Exhauster 2 (A)and Truck 2 were used A sintered metal prefilter was inserted in the riser between the tank and the exhauster A total of eight segments were taken in rotary mode and five segments in push mode until sampling was halted on 122194 One RMCS core was obtained The total exhauster run time was 4878 hours The stack record sample was removed and analyzed following this run period Dose rates taken at the side of the exhauster housing during RMCS were all lt05 mRhr The in-tank prefilter was smeared for contamination when removed from the tank with the smears showing less than detectable levels of radionuclides present (Waldo 1999) The prefilter had been washed with an installed spray system prior to removal from the tank but subsequent testing showed the water flow and pressure were too low to have been effective at removing contamination
Tank 241-BY-106195 Following some process modifications RMCS in BY-IO6 riser IOB began again on 11895 Exhauster 2 (A) and Truck 2 were used The sintered metal prefilter was inserted in the riser between the tank and the exhauster RMCS was halted on 12495 over authorization basis and equipment operability issues for RMCS A total of three segments were taken in rotary mode and eleven segments in push mode One RMCS core was obtained The total exhauster run time was 1867 hours The stack record sample was removed and analyzed following this run period Dose rates taken at the side of the exhauster housing during RMCS were all lt O S mRhr The in-tank prefilter was smeared for contamination when removed from the tank with the smears showing less than detectable levels of radionuclides present (Waldo 1999) The prefilter was not washed this time
Tank 241-BY-110795 to 1095 Following resolution of RMCS authorization basis and equipment issues and completion of the fabrication and testing of Trucks 3 and 4 RMCS was begun in BY-I IO on 71195 Exhauster 2 (A) and Truck 2 were used Samples were taken from risers 128 7 128 again and 4 There was no in- tank prefilter used in this or any subsequent RMCS periods Sampling was performed until 102595 when RMCS was halted over flammable gas issues A total of 13 RMCS segments and 56 PMCS segments were taken Three RMCS cores were obtained The total exhauster run time was 1125 hours The stack record sample was removed and analyzed following this run period Dose rates taken at the side of the exhauster housing during RMCS were all lt O S mRhr
Tank 241-BY-108795 to 895 Core sampling was begun in BY-IO8 on 72595 Exhauster 3 (B) and Truck 4 were used Sampling was done in risers 12A and 7 The tank material proved soft enough so that no RMCS segments were required all segments were obtained in push mode although the exhauster was operated during part of the time sampling was performed Sampling was completed 81895 A total of 16 PMCS segments were taken The total exhauster run time was 6617 hours The stack record sample was removed and
F-2
RPP-4826 Rev 1
analyzed following this run period Dose rates taken at the side of the exhauster housing during RMCS were all lt05 mRhr
Tank 241-BY-105895 to 1095 RMCS was begun in BY-I05 riser 12A on 83095 Exhauster 3 (B) and Truck 4 were used This tank has a concrete layer on top about 12-18 inches thick which had to be drilled through Part way through sampling questions arose as to the flammable gas status of the tank and RMCS was halted on 10695 A total of 3 RMCS and 7 PMCS segments were taken One RMCS core was obtained The total exhauster run time was 4413 hours The stack record sample was removed and analyzed following this run period Dose rates taken at the side of the exhauster housing during RMCS were all lt05 mRhr
Tank 241-SX-1011297 to 298 Following resolution of extensive regulatory and authorization basis issues and installation of equipment modifications RMCS started in SX-101 with Truck 4 on 12497 An RMCS exhauster was not used since all SX farm tanks excluding SX-113 and SX-I 15 are ventilated with the SX exhauster Sampling was performed in risers 19 and 4 and was completed on 21098 A total of 9 RMCS and 6 PMCS segments were taken Two RMCS cores were obtained SX exhauster stack record samples and filter housing dose rates were obtained as part of routine operations for the SX exhauster not as part of the RMCS process Filter papers used in the suction line for the CGM were saved and analyzed in the laboratory to estimate the airborne radionuclide concentration in the tank head space Two CGM filter papers were needed for each core as moisture in the tank vapors condensed on the papers in the cold weather and began to restrict tank gas flow to the CGM
Tank 241-SX-103498 to 598 RMCS started in SX-103 with Truck 4 on 42798 The SX exhauster was used for ventilation (see SX- 101 above) Sampling was performed in risers 7 and 1 1 and was completed on 51198 A total of 6 RMCS and 18 PMCS segments were taken Two RMCS cores were obtained During sampling filter papers used in the suction line for the CGM were saved and analyzed in the laboratory to estimate the airborne radionuclide concentration in the tank head space One CGM filter paper was used during each core SX exhauster stack record samples and filter housing dose rates were obtained as part of routine operations for the SX exhauster not as part of the RMCS process
Tank 241-SX-105298 to 598 RMCS started in SX-105 with Truck 3 on 22598 The SX exhauster was used for ventilation (see SX- 101 above) Sampling was performed in risers 6 and 14 and was completed on 51598 A total of 6 RMCS and 20 PMCS segments were taken Two RMCS cores were obtained During sampling filter papers used in the suction line for the CGM were saved and analyzed in the laboratory to estimate the airborne radionuclide concentration in the tank head space Two filter papers were needed for the first core as moisture in the tank vapors condensed on the papers in the cold weather and began to restrict tank gas flow to the CGM One filter paper was used for the second core SX exhauster stack record samples and filter housing dose rates were obtained as part of routine operations for the SX exhauster not as part of the RMCS process
Tank 241-SX-102698 to 798 RMCS started in SX-102 with Truck 4 on 61798 The SX exhauster was used for ventilation (see SX- 101 above) Sampling was performed in risers 8 and 4 and was completed on 7798 A total of 2 RMCS and I8 PMCS segments were taken Two RMCS cores were obtained During sampling filter papers used in the suction line for the CGM were saved and analyzed in the laboratory to estimate the airborne radionuclide concentration in the tank head space One filter paper was used for each core SX exhauster stack record samples and filter housing dose rates were obtained as part of routine operations for the SX exhauster not as part of the RMCS process
Tank 241-S-110598 to 698 RMCS was begun in S-I10 on 51898 Exhauster C (4) and Truck 3 were used This tank marked the first use of an RMCS exhauster since 1995 Sampling was completed on 6498 Risers 6 and 14 were sampled A total of IO RMCS and 8 PMCS segments were taken Two RMCS cores were obtained The
F-3
RPP-4826 Rev I
total exhauster run time was 15978 hours The stack record sample was removed and analyzed following this run period Dose rates taken at the side of the exhauster housing during RMCS were all lt05 mRhr During sampling filter papers used in the suction line for the CGM were saved and analyzed in the laboratory to estimate the airborne radionuclide concentration in the tank head space One filter paper was used for each core Waste particles retained on the exhauster housing filters were part of the inventory subsequently measured by NDA following completion of the first core in TX-I 13
Tank 241-U-107698 to 798 RMCS was begun in U-107 on 61098 Exhauster C and Trucks 3 and 4 were used Sampling was completed on 71598 Risers 7 and 2 were sampled A total of IO RMCS and 19 PMCS segments were taken Two RMCS cores were obtained The total exhauster run time was 27385 hours The stack record sample was removed and analyzed following this run period Dose rates taken at the side of the exhauster housing during RMCS were all 105 mRihr During sampling filter papers used in the suction line for the CGM were saved and analyzed in the laboratory to estimate the airborne radionuclide concentration in the tank head space One filter paper was used for each core Waste particles retained on the exhauster housing filters were part of the inventory subsequently measured by NDA following completion of the first core in TX-I 13
Tank 24l-BY-105798 to 898 RMCS was begun in BY-105 again on 72298 Exhauster C and Trucks 3 and 4 were used Sampling was completed on 82598 Risers 7 and 1 1 B were sampled A total of 18 RMCS and 18 PMCS segments were taken The material was hard enough to require rotary mode sampling all the way to the bottom of the waste but negligible recovery was obtained After RMCS was performed to the waste bottom a PMCS core was taken in the same hole to recover material Two RMCS cores were obtained The exhauster run time was 13577 hours for the first RMCS core and 30792 hours for the second RMCS core Stack record sample information in ABCASH shows 30558 hours operation for the second core but the sampler data sheet shows the time counter was mistakenly reset 234 hours into the run No correction was made to the BY-IO5 2nd core record sample concentration for this document since the error is conservative and results in only slightly higher (ltI) record sample radionuclide concentrations for this core A stack record sample was removed and analyzed following each core giving two record samples for BY-IO5 in 1998 Dose rates taken at the side of the exhauster housing during RMCS were almost all lt05 m R h but a few readings indicated 07 mRihr This variation was assumed due to personnel reading the instrument differently or the fact that the exhauster had been used on enough tanks that by now there was sufficient activity on the filters to cause readings approximately at the background detection level The final reading when both cores were completed was lt05 m R h During sampling filter papers used in the suction line for the CGM were saved and analyzed in the laboratory to estimate the airborne radionuclide concentration in the tank head space One filter paper was used for each core Waste particles retained on the exhauster housing filters were part of the inventory subsequently measured by NDA following completion of the first core in TX-113
Tank 241-TX-113998 to 599 Core sampling was begun in TX-I 13 riser 3 on 92298 Exhauster B (3) and Truck 4 were used at the start This was the first use of Exhauster B since it was modified Exhauster B ran for a total of 8738 hours until being disconnected on 102398 During this time two PMCS segments were taken and no RMCS segments Exhauster C was then installed and operated for 5598 hours from 121098 to 122898 No RMCS or PMCS sampling was performed during this time frame RMCS segments werent taken until 299 Exhauster C ran for a 30230 hours between 122898 and 21299 Sampling was completed on the core from riser 3 on 21299 A total of 12 RMCS segments were obtained during the time Exhauster C was operating Exhauster flow rate for both exhausters was a nominal 200 scfm Stack record samples were taken following Exhauster B removal at the end of 1998 for Exhauster C and following completion ofthe first core with Exhauster C Aerosol calculations were based on only the 30230 hours run time for Exhauster C in 1999 since this was the time period during which RMCS segments were obtained Dose rates taken at the side of the exhauster housing during the short PMCS only sampling period with Exhauster B were all ltOS m R h Dose rates with Exhauster C varied between lt O S mRhr and 07 mRhr The final reading on Exhauster C following completion of the first core was 07 mFUhr During sampling filter papers used in the suction line for the CGM were saved and
F-4
RPP-4826 Rev I
analyzed in the laboratory to estimate the airborne radionuclide concentration in the tank head space One filter paper was used for the core Waste particles retained on the exhauster housing filters were part of the inventory subsequently measured by NDA following completion of this core
Sampling in riser 5 was begun on 41299 using Exhauster B and Truck 3 A total of 6 RMCS and 1 PMCS segments were taken for this core before sampling was halted on 42899 The total exhauster run time for this core was 11712 hours Problems with high vacuum in the tank required the exhauster flow rate to be reduced to 190 scfm to keep the system within pressure limits The stack record sample for the second core was removed and analyzed following the run period Dose rates taken at the side of the exhauster housing during the second core were all lt05 m M r During sampling filter papers used in the suction line for the CGM were saved and analyzed in the laboratory to estimate the airborne radionuclide concentration in the tank head space One filter paper was used An NDA was performed on the exhauster housing following this core The only radionuclides present in the housing were those from this core or what was removed from the tank head space during the non-RMCS activities in this tank from 92298 and 102398
Some clarification may be needed to explain use of the exhauster operating times and NDA dose rate and record sample data obtained during core sampling on TX-I 13 Core sampling was set up for sampling riser 3 on TX-113 in September 1998 with Exhauster B Exhauster B operated for a total of 8738 hours between 92298 and 102298 The stack record sample was removed at the end of this period The ERS database incorrectly shows the exhauster operated between 111698 and 111998 The ABCASH database shows the stack record sample was removed on 111998 The stack record sample showed positive emuent concentrations during this time period with variances 400 No RMCS samples were taken during this period so the data and time werenrsquot included when calculating RMCS aerosol numbers Exhauster B was removed and Exhauster C installed in late November-early December Exhauster C was operated for a total of 5559 hours between 121098 and 122398 The stack record sample was removed on 122898 No sampling was performed during this period so the data and time werenrsquot included when calculating RMCS aerosol numbers Exhauster C was operated for a total of 30218 hours between 122898 and 2899 All the RMCS segments from riser 3 were taken in this time period so only the data and time for this period were included when calculating RMCS aerosol numbers Exhauster B was used during sampling of riser 5 Exhauster B operated for a total of 11712 hours between 41299 and 42899
Tank 241-TX-l18599 to 699 RMCS was begun in TX-I 18 on 5699 Exhauster C (4) and Truck 4 were used Sampling was completed on 6298 Risers 9B and 12B were sampled A total of 9 RMCS segments were taken there were no PMCS segments Two RMCS cores were obtained The total exhauster run time was 21247 hours The stack record sample was removed and analyzed following this run period The maximum dose rate taken at the side of the exhauster housing following RMCS was 08 m M r CGM filter papers were not analyzed An NDA was performed on the exhauster housing following completion of the two cores The exhauster housing contained the same nuclides as for the first NDA (S-110 U-107 BY-105 and TX-I 13 first core) plus those from TX-I 18
The basic core sampling operational data used in this document includes the number of RMCS cores and segments the exhauster run times and flow rates the RMCS exhauster HEPA filter dose rates and tank vapor space temperatures Table F-l lists the basic operational data This information excluding tank vapor space temperature data was obtained from procedural data sheets in the sampling work packages (References W - 1 to WP-23)
Tank temperature data for the tanks ventilated with the RMCS exhausters was obtained from the TWINS database Plots for each tank were prepared for the time RMCS was conducted and the average value of the highest thermocouple located in the tank (the lowest temperature reading) was estimated and used as the average tank head space temperature during the RMCS period
The SX exhauster flow rates listed in Table F-l are estimates only The combined flow rate for SX-IO1 through SX-106 plus SX-109 (7 tanks) averaged 440 cfm during CY 1996 (Kaiser 1997) for an average of 63 cfm per
F-5
RPP-4826 Rev I
tank Based upon inlet flow measurements at the tank inlet HEPA filters (Fanis 1998) the flow through each individual tank (SX-IO1 through SX-106 plus SX-109) was lt55 cfm at the breather filter Assuming an exhaust flow of 100 cfm for each SX farm tank sampled is therefore conservative
Calculated Data
Calculated data include the tank head space volumes conversion of the RMCS exhauster flow rate from scfm to acfm and the number of tank head space changeouts made by an exhauster during RMCS
Tank head space volume includes the dome space volume above the top of the sidewall plus the void space between the waste surface and the top of the sidewall The formula used to calculate tank head space volumes WN
Head Space Volume in A = (DS + [(H) (12) + HI + Hb - H] (V)) - 748
Where DS = dome space volume gal H = height of tank body sidewall above knuckle A HI = height of tank knuckle area in Hb = height oftank bottom below knuckle in H = height of waste in tank in V =27555 galin of waste in SX tanks 2754 gallin in all others
The tank dome space volumes height of tank sidewall above the knuckle height of tank knuckle area and height of tank bottom below the knuckle were obtained from Reynolds 1999 The height of waste in each tank at the time of core sampling was obtained from the TWINS database Tank dimensional and waste level data are given in Table F-2 along with the calculated tank head space volumes
Aerosol calculations for Appendices A-C require exhauster flow rates in actual cubic feet per minute The RMCS exhauster flow rate is controlled and recorded in standard cubic feet per minute The mass flow rate of the exhauster air is measured and internal logic in the exhauster controller calculates what the volumetric flow rate would be if the temperature and pressure in the exhauster inlet were at standard conditions The standard conditions used in the logic controller are 29921 in Hg (760 mm Hg) and 69F (ZIT)
A correction factor is built into the exhauster control logic that assumes an atmospheric pressure of 2927 in Hg the average atmospheric pressure at Hanford The RMCS exhauster will operate at about 1-2 in H20 negative pressure resulting in about a 2916 in Hg pressure in a waste tank when the RMCS exhauster is operating To revise the indicated scfm RMCS exhauster reading to an acfm value the RMCS exhauster scfm flaw rate was multiplied by (29922916)(T+459)528 where Tis the tank head space temperature in OF The tank head space temperatures in Table F-1 were input to the spreadsheet file used for aerosol calculations and converted to acfm The flow rates in acfm are included in Table F-I
The tank head space changeouts when using the RMCS exhauster were calculated by multiplying the exhauster acfm flow rate by the time of exhauster operation and dividing the result by the tank head space volume Tank head space changeouts are listed in Table F-2
F-6
c
gt 2
RPP-4826 Rev 1
APPENDIX G
REFERENCES
G-0
RPP-4826 Rev 1
APPENDIX G - References
Diedeker 1999 NDA of RMCS HEPA Filters L P Diedeker WMH E-Mail to JS Schofield CHG November 29 I999
ERDA 1976 Nuclear Air Cleaning Handbook ERDA 76-21 Buchsted C A Fuller A B and Kahn 1 E Oak Ridge National Laboratory 1976
Farris 1998 Internal Note T R Farris LMHC to J S Schofield LMHC Breather Filter Flow Rates for SX-Farm 31698
Foust 1999 Internal Memo RMCST Exhauster HEPA Filter Dose Rate Calculations D J Foust LMHC to J S Schofield LMHC October 25 1999
Greager 1999 Correspondence No WMH-9954450 Non-Destructive Analysis of the Rotay Mode Core Sample High-Efjiciency Particulate Air Filters E M Greager WMH to P C Miller LMHC June 28 1999 [Transmittal of HNF-4199 Resultsfram NDA Measurement of the 296-P-34 RMCS HEPA Filters]
HNF 1999 HNF-SD-WM-SAR-067 Tank Waste Remediation System Final Safety Analysis Report Rev 1 The revision incorporating RMCS accident analyses was submitted as Addendum 5 to DOE as a change to the FSAR predecessor the Basis for Interim Operation (BIO) LMHC-9857075 80232764-9-KOOl Submittal of Authorization Basis Amendment Package for Rotay and Push Mode Core Sampling in Satisfaction of Perfarmance Agreement TWR 122 Expectations I and 3 D 1 Allen LMHC to A M Umek FDH August 30 1998 Addendum 5 as of mid-January 2000 is waiting for approval by DOE
Kaiser 1997 T D Kaiser LMHC E-Mail to J S Schofield LMHC SX Tank Flow Data 42197
NUREG 1995 Potential Radionuclide Emissionsfrom Stacks on the HanfordSite Part I Dose Assessment Davis W E and Barnett J M Westinghouse Hanford Company from Proceedings of the 23 DOEMRC Nuclear Air Cleaning Conference held July 25-28 1994 February 1995
Schofield 2000a Letter 74910-00-002 Use of Microshield Calculations for RMCS Exhauster Housing for Estimating Radionuclide Quantities on the Filters Using NDA and Dose Rate Measurements I S Schofield CHG to File January 62000
Schofield 2000b Letter 74910-00-003 Rev I RMCS Exhauster Stack RecordSample Data J S Schofield CHG to File January 202000
Reynolds 1999 D R Reynolds LMHC E-Mail to I S Schofield LMHC transmitting Tank Volume Calculations draft of calculations done by Mike Plesha and Reed Hendershot data to be used for RESOLVE computer program for Hanford waste tanks August 3 1999
TWINS Tank Waste Information Network System database available at httptwinspnlgovSOO lhtbinTCDgetTableListexe
Waldo 1999 letter 74910-99-009 RMCS Exhauster Aerosol Test Data E I Waldo to J S Schofield June 22 1999
WHC 1993 WHC-SD-WM-ES-225 Rev I AerosolStudy for the Rotary Mode Exhauster P M Francis Westinghouse Hanford Company April 20 1993
WHC 1997 WHC-SD-WM-SAD-035 Rev Ob A Safety Assessment of Rotary Mode Core Sampling in Flammable Gas Single Shell Tanks Hanford Site Richland Washington August 8 1997
G- I
RPP-4826 Rev I
CGM Data CGM-I Letter PARTICULATE SAMPLING OF 241-SX-IO1 DURING ROTARY MODE CORE SAMPLING D C
Langlois E2 Consulting Engineers to J S Schofield Lockheed Martin Hanford Company March 16 1998
CGM-2 Letter PARTICULATE SAMPLING OF 241-SX-I05 DURING ROTARY MODE CORE SAMPLING D C Langlois E2 Consulting Engineers to J S Schofield Lockheed Martin Hanford Company June 9 1998
CGM-3 Letter PARTICULATE SAMPLING OF 241-SX-103 DURING ROTARY MODE CORE SAMPLING D C Langlois E2 Consulting Engineers to J S Schofield Lockheed Martin Hanford Company June 12 1998
CGM-4 Letter PARTICULATE SAMPLING OF 241-S-110 DURING ROTARYMODE CORESAMPLING D C Langlois E2 Consulting Engineers to J S Schofield Lockheed Martin Hanford Company July 20 1998
CGM-5 Letter PARTICULATE SAMPLING OF 241-SX-102 DURING ROTARY MODE CORE SAMPLING D C Langlois E2 Consulting Engineers to J S Schofield Lockheed Martin Hanford Company July 22 1998
CGM-6 Letter PARTICULATE SAMPLING OF241-U-107 DURING ROTARY MODE CORE SAMPLING D C Langlois E2 Consulting Engineers to J S Schofield Lockheed Martin Hanford Company August 3 1998
CGM-7 Letter PARTICULATE SAMPLING OF 241-BY-105 DURING ROTARY MODE CORESAMPLING D C Langlois E2 Consulting Engineers to 1 S Schofield Lockheed Martin Hanford Company September 17 1998
CGM-8 Letter PARTICULATE SAMPLING OF 241-TX-I13 DURING ROTARY MODE CORESAMPLING D C Langlois E2 Consulting Engineers to J S Schofield Lockheed Martin Hanford Company March 15 1999
CGM-9 Letter PARTICULATE SAMPLING OF 241-TX-113 DURING ROTARY MODE CORE SAMPLING D C Langlois E2 Consulting Engineers to I S Schofield Lockheed Martin Hanford Company May 31 1999
Notices of Construction NOC-I DOEIRL-93-40 Radioactive Air Emissions Program Notice of Construction Rotary Mode Core-Sampling
Truck and Exhauster Approved by Letter AIR 93-707 A W Conklin WDOH to J E Rasmussen DOEIRL 7893
NOC-2 DOEIRL-94-118 Rev 0 Radioactive Air Emissions Program Notice of Construction for the Rotary Mode Core-Sampling Systems Three and Four Approved by Letter AIR 95-603 A W Conklin WDOH to J E Rasmussen DOERL 63095
NOC-3 DOERL-94-118 Rev 1 Radioactive Air Emissions Program Notice of Construction for the Rotary Mode Core-Sampling Systems Three and Four Approved by Letter AIR 98-301 W W Conklin WDOH to I E Rasmussen DOEIRL 3698
NOC-4 DOEIRL-97-70 Radioactive Air Emissions Program Notice of Construction for Rotary Mode Core- Sampling in SX Tank Farm Approved by Letter AIR 97-1 101 A W Conklin WDOH to J E Rasmussen DOEIRL 113097
NOC-5 USEPA Letter OAQ-107 (no title approving DOE submittal 97-EAP-590 dated 72997) A J Frankel USEPA to J E Rasrnussen DOEIRL 8497
NOC-5 USEPA Letter OAQ-107rsquo (nb title approving DOE submittal 97-EAP-723 dated 101797) A J Frankel USEPA to J E Rasmussen DOERL 11498
Note that both letters have ldquoOAQ-107rdquo following ldquoReply to Attn ofrdquo
G-2
RPP-4826 Rev I
Work Packages WP-I ES-94-00808 WP-2 ES-95-00258 WP-3 ES-95-00045 - WP-4 ES-95-00434 - WP-5 ws-97-00173 - WP-6 WS-97-00174 - WP-7 ws-97-00143 - WP-8 WS-97-00144 - WP-9 WS-97-00207 - WP-I 1 WS-97-00208 - WP-12 WS-98-00049 - WP-13 WS-97-00050 - WP-14 WS-97-00224 - WP- I5 WS-97-00225 - WP-16 WS-97-00230 - WP- I7 ws-97-0023 1 - WP-18 ES-97-00452 - WP-19 ES-97-00453 - WP-20 WS-98-00072 - WP-21 WS-98-00073 - WP-22 WS-98-00067 - WP-23 WS-98-00068 -
241-BY-IO6 Perform Rotary Core Sample [Riser IOB] 241-BY-I IO Rotary Core Sample [Risers 12B 7 IZB 41 241-BY-IO8 Obtain Rotary Core Sample [Risers 12A amp 71 241-BY-IO5 Rotary Mode Core Sample [Riser 12A] 241-SX-101 Rotary Mode Core Sample Riser 19 241-SX-101 Rotary Mode Core Sample Riser4 241-SX-103 Rotary Mode Core Sample Riser 7 241-SX-103 Rotary Mode Core Sample Riser I I 241-SX-105 RMCST Obtain Core Sample Riser 6 241-SX-105 RMCST Core Sample Riser 14 241-SX-102 Rotary Mode Core Sample Riser 8 241-SX-102 Rotary Mode Core Sample Riser 4 241-S-1 IO RMCST Obtain Core Sample Riser 6 241-S-1 IO RMCST Obtain Core Sample Riser 14 2414-107 RMCSTCore Sample Riser 7 241-U-107 RMCST Core Sample Riser 2 241-BY-IO5 RMCST Core Sample Riser 7 241-BY-IO5 RMCST Core Sample Riser 1 IB 241-TX-113 Rotary Core Sample Riser 3 241-TX-113 RMCST Core Sample Riser 5 241-TX-I 18 RMCST Core Sample Riser 9B 241-TX-I 18 RMCST Core Sample Riser 128
G-3
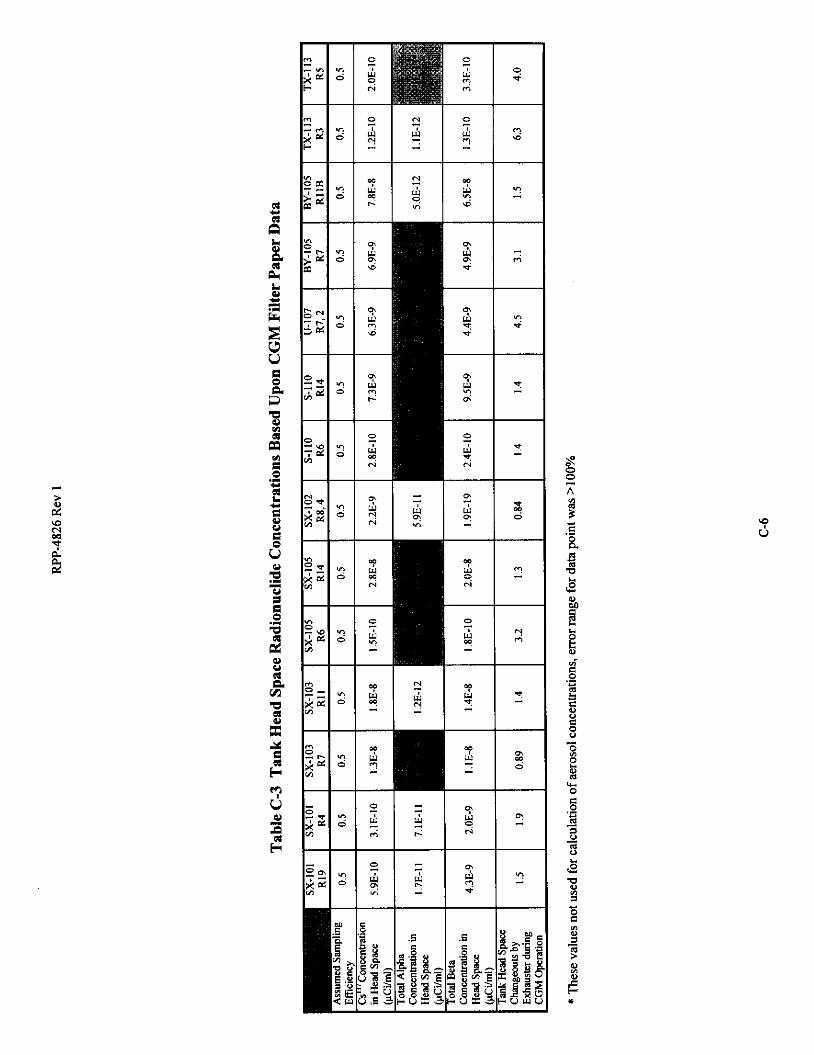
RPP-4826 Rev I
A 9995 efficiency is equivalent to a DF of 2E+3 while a 9997 efficiency is equivalent to a DF of 33E+3 The actual DF for the RMCS exhauster housing is higher than either of these It has two HEPA filters in series even though the minimum efficiency specified in the NOCs for the RMCS exhausters is only equivalent to one HEPA ERDA 1976 recommends using a DF of 3000rdquo for a filter bank where n is the number of HEPA filters in series This would result in a DF of 9E+6 for the RMCS exhauster housing This is unrealistic Using a DF of 9E+6 will calculate to Csrdquorsquo quantities on the HEPA filtersthat are orders of magnitude above what have been shown to be there based upon the measured dose rates and NDA A DF of 9E+6 would mean the dose rate would have to be almost 100 mRhr at the side of the exhauster housing instead of the 05-08 mRhr dose rates encountered The waste particles will not have the same particle size distribution entering the second HEPA filter as when entering the first The majority of the waste particles will be captured on the I rdquo HEPA filter and although the DF for each HEPA if tested individually using the ASME N5 IO aerosol test method may be 3E+3 (or higher) the overall DF of the two filters in series will not be 3000lsquo This is because the particle size distribution entering the Znd HEPA could have a greater percentage of smaller particles than that entering the 1rdquo
NUREG 1995 included an evaluation of a number of different facility stacks at the Hanford site where the HEPA filter upstream air concentrations were estimated using several different methods This report concluded that back-calculation using a value of 3000rdquo overestimated the upstream radionuclide concentration by three to four orders of magnitude when compared to filter NDA data for the nine stacks for which NDA data were obtained and by three orders of magnitude for the two stacks for which upstream air sample data were available Back- calculation using a value of 3000rdquo was shown to be high by four orders of magnitude for the single stack for which a powder release estimate was available Based upon this information the RMCS exhauster dual filter-in-series housings would have a DF of at least three and maybe four orders of magnitude less than 9E+6 or in the 1E+3 to 1 E+4 range A DF of IE+3 would he less than the minimum permissible under the NOC Comparing the older stack data and design with the newer RMCS exhauster design the minimum DF would be expected to be at least 1E+4
Table D-2 provides the available RMCS exhauster aerosol test data This information was obtained from Waldo 1999 Prior to 1998 the RMCS exhauster primary HEPA filter efficiency and either the secondaly HEPA filter or the overall efficiency for both filters were tested Starting in 1998 only the primary and secondary HEPA filter efficiency were measured The overall efficiency of the two filters in series was only measured three times in 11 setups Twice the overall penetration efficiency was lt0002 and the remaining time the only information that could be found was a value of lt005 Most individual filters had a penetration efficiency of 0002 This appears to be about the limit of the detection equipment Based upon Table D-2 data a penetration efficiency of 0002 (99998 efficiency) is normal for a single HEPA and thus a minimum for an RMCS exhauster housing Assuming a 0002 penetration efficiency for the two filters combined calculates to a DF of 5E+4 (equal to 1 +
000002) for the RMCS exhauster housing
In summary the measured DF for the RMCS exhauster housings over the period from May 1998 through June 1999 was about 73E+4 RMCS aerosol testing prior to use indicates a DF of about 5OE+4 for each of the filters separately but their overall efficiency is not measured Referenced data based on older stacks at Hanford indicate the two HEPA RMCS exhauster housing would likely have a DF of at least IE+4
Estimated Aerosol Levels During RMCS Based Upon RMCS Stack Record Sample Data
Revision 0 of this document used the positive record sample results with variance less than 100 to estimate aerosol concentrations in the exhauster inlet using an assumed exhauster housing DF of 5OE+4 This method of estimating aerosols was eliminated from Revision 1 because the stack concentrations were either too low too scattered or too questionable to provide reliable results There were 112 RMCS stack record sample data points evaluated in Schofield 2000b Excluding the total beta sample results used for estimation of the housing DF there were only ten data points remaining with positive values and variances ltloo the remaining data points were either negative had a variance gtloo or the results were not available
For comparison purposes only Schofield 2000b applied the DF of 73E+4 calculated in this document to the data points not used to calculate the exhauster housing DF to estimate aerosol concentrations upstream of the filters The results showed aerosol levels approximately the same as those estimated using NDA dose rate or CGM filter paper data when a value of zero was used for negative sample results or those with a variance gtloo When only
D-3
RPP-4826 Rev 1
the ten positive results with a variance ltloo were used the aerosol levels calculated to be two to five times higher than those estimated using NDA dose rate or CGM filter paper data Because of the variability of data resulting from the extremely low record sample concentrations and the few useable data points estimation of aerosol levels using record sample data was not included in Revision I See Schofield 2000b for further discussion of the use of record sample data to estimate aerosol levels
Summary of Calculations
A total of nine RMCS exhauster stack record sample data points were used to estimate the RMCS exhauster filter housing decontamination factor These data points were obtained when sampling on five tanks during which 10 RMCS cores and 65 RMCS segments were obtained The overall decontamination factor was 73E+4
Estimation of aerosol generation quantities based upon RMCS stack record sample data is possible However results will likely be skewed high if data points that show non-detectable levels of radionuclides present are ignored instead of using a value of zero for the data point
D-4
RPP-4826 Rev 1
APPENDIX E
TANK WASTE RADIONUCLIDE CONCENTRATIONS USED FOR AEROSOL CALCULATIONS
E-0
RPP-4826 Rev 1
APPENDIX E - Tank Waste Radionuclide Concentrations Used for Aerosol Calculations
The RMCS exhauster NDA data HEPA filter dose rate data CGM filter paper data and stack record sample data provide information on the quantity of radionuclides on the exhauster filters in the tank head space or the exhauster stack during RMCS These radioactivity quantities need to be divided by the waste radionuclide concentration specific activity to determine the mass of waste in the tank head space and in the tank gases sent to the exhauster
The mass quantities in this document were calculated using dry basis radionuclide concentrations Waste particles carried into the tank head space by the purge gas could be wet or dry If wet some of the non-chemically bound water will start to evaporate immediately providing the tank relative humidity is 400 The water present in a waste particle may be chemically bound as a hydrate or free The chemically bound water will not readily evaporate therefore even a ldquodryrdquo particle may have some water associated with it It is impractical to measure the actual water content of the waste particulates caught on the CGM filter paper the exhauster HEPA filters or the stack record sample paper Since the quantity of water in the waste particulates is unknown particulate levels were calculated using dry basis radionuclide concentrations Thus all particulate values given in this document are stated on a dry basis
The waste radionuclide concentrations on a dry basis were calculated from data available in the Tank Waste Information Network System (TWINS) The Best Basis InventorylBest Basis Summary numbers were used These values are the most complete and up to date readily available estimates for Hanford waste tank contents but do not include water The information was downloaded from TWINS into a spreadsheet The total chemical total beta and total alpha quantities were summed in the spreadsheet for all the tanks which were sampled and concentrations for Csrdquorsquo Sr9rsquo total beta and total alpha automatically calculated in pCig These concentrations are provided in Table E-I Because lab techniques for measuring gross beta levels only detect beta particles with a minimum decay energy above 150-200 kev only radionuclides with a decay energy of gt-200 kev were included in the total beta numbers
The TWINS radionuclide concentrations were obtained in December 1999 No corrections were made for decay for this document
The CGM filter paper and stack record sample data indicate the measured radionuclide values are not always in the same ratio to each other as given by TWINS nor are all radionuclides detected that TWINS indicates are present Radionuclides can be distributed unevenly in a tank Soluble fission products (primarily Csrsquordquo) are found in the liquid saltcake and in sludges Insoluble fission products and actinides are found largely in sludges as these are primarily chemical precipitates Sludge could be mixed with saltcake be present in a distinct layer at the bottom of a tank or in several layers in the tank depending upon how waste was transferred into a tank Waste particles may thus not have the same specific activity on a microscopic scale as they would have on a macro scale were the tank contents homogenized During RMCS a top to bottom core sample is attempted resulting in the drill bit and purge gas (which causes aerosols to form) passing through most ofthe waste matrix Assuming the aerosol generation rate is approximately constant during drilling the specific activity of a radionuclide in the suspended solids should be roughly the same as the average specific activity of the same radionuclide in the tank waste While the waste specific activity is probably not homogeneous from top to bottom in a tank and the aerosol generation rate will likely also vary it is beyond the scope of this document to provide an in-depth analysis of all the factors affecting aerosol radionuclide concentration Although sample radionuclide data were not always in the same ratio as provided by TWINS for the purpose of this document the simplifying assumption was made that the average tank specific activity is adequate to provide an approximation of the suspended solids specific activity for all radionuclides Average tank individual radionuclide specific activities were used in the preparation of the exhauster NOCs
The aerosol calculations presented in this document are only as accurate as the TWINS data The combined radionuclide content of all Hanford waste tanks is known fairly well since the overall content is based upon reactor production records CsrdquorsquoSrW recovery data and processing plant discharges Thus TWINS data for all tanks combined should be reasonable There are undoubtedly differences between TWINS data and the actual contents of a specific tank While the specific tank radionuclide data from TWINS used in this document may not be exact deviations from the actual concentrations are assumed to balance out over the number of tanks sampled
E- 1
RPP-4826 Rev 1
APPENDIX F
ROTARY MODE CORE SAMPLING EXHAUSTER AND CORE SAMPLE DATA
F-0
RPP-4826 Rev 1
APPENDIX F - Rotary Mode Core Sampling Exhauster and Core Sample Data
This appendix provides the basic data obtained during RMCS operations which was used in preparation of this document
Basic Operational Data
There have been three RMCS exhausters and three RMCS sampling trucks deployed since starmp of nitrogen- purged RMCS in November 1994 The exhausters are formally designated 296-P-32296-P-33 and 296-P-34 These were originally referred to as parts of RMCS Systems 2 3 and 4 respectively in the Notices of Construction (NOC) for these units The exhauster designations were changed for routine field use in 1996 to exhausters A B and C to avoid confusion with core sampling trucks 23 and 4 since any exhauster could be used with any RMCS truck Exhauster A (2) and RMCS Truck2 have not been used for RMCS since 1995 and are no longer in service for core sampling
Rotary mode core sampling has been conducted in four general time frames since 1994 These time frames were separated by down times for equipment modifications or resolution of environmental permitting and safety concerns For ease of analysis in this document exhauster operations were organized into six distinct operating periods Periods I to 6 were grouped based upon times when the same exhauster and same set of HEPA filters were being used These periods thus overlap with the general operating time frames The four operating time frames were
The first time frame lasted from November 1994 to January 1995 RMCS Truck 2 and Exhauster 2 (A) were used on Tank BY-106 along with an in-tank prefilter This tank provided the initial deployment and testing of the nitrogen-purged equipment in a waste tank During this period radiation dose rates were taken at the side of the exhauster housing Stack record samples were taken in December 1994 and January 1995
The second time frame lasted from July 1995 through October 1995 RMCS Trucks 2 and 4 were used with Exhausters 2 and 3 (A and B) on BY-105 BY-IO8 and BY-I IO During this period radiation dose rates were taken at the sides of the exhauster housings Stack record samples were taken after completion of sampling on each tank No RMCS samples were taken from BY-108 all samples were taken in push mode for this tank
The third time frame began when RMCS was restarted in December 1997 Trucks 3 and 4 were used for sampling of SX-101 SX-103 SX-105 and SX-102 with the SX tank farm exhauster providing ventilation The RMCS exhausters were not used During this period radiation dose rates were taken at the sides of the SX exhauster housing as part of HPT routine surveys SX farm exhauster stack record samples were taken when required by normal operating procedures SX record sampler and filter housing dose rate data were not evaluated for this document It would not be practical using filter dose rate or stack record sample data to estimate the RMCS aerosol addition if any to the SX ventilation system The background radiation around the SX filter housing makes measurement of any small increase in dose rate very difficult to detect The number of tanks being ventilated and the involved off-gas header routings (the exhauster is pulling on thirteen tanks in series or in parallel with the tank being sampled) and any in-tank activities in the SX tanks not being sampled would make it impractical to assess what aerosols resulted from RMCS Beginning with RMCS in SX farm radionuclide analyses were performed on the filter papers protecting the CGMs which draw air out of the tank vapor space for flammable gas detection
The fourth time frame began in May 1998 Between 1095 and 598 Exhausters B and C were extensively modified with new filter housings and other equipment to meet new NOC requirements Trucks 3 and 4 were used with Exhausters B and C (3 and 4) on S-l IO U-107 BY-105 TX-113 and TX-I 18 This period marked the first use ofthe RMCS trucks and RMCS exhausters together following resolution of flammable gas concerns and modifications to the exhausters New filters were installed Radiation dose rates were taken at the sides of the exhauster housings Stack record samples
F- 1
RPP-4826 Rev I
were taken after completion of sampling for each exhauster installation Radionuclide analyses were performed on the CGM filter papers for all tanks except TX-118 An NDA was performed on the Exhauster C housing following completion ofthe first core on TX-I 13 The housing filters when assayed contained aerosols captured by the exhauster following RMCS in S-l IO U-107 BY-105 (1998) and the first core of TX-I 13 Another NDA was performed on Exhauster C following both cores in TX-I 18 An NDA was performed following sampling of the second core in TX-I 13 using Exhauster B The time frame ran through early June 1999 No RMCS samples have been taken after June 1999 nor are any planned for the next few years
For the purposes of evaluating aerosol formation based upon RMCS exhauster housing NDA and dose rate data the exhauster operations were grouped into 6 operating periods These periods are shown in Table F-1 and restated in Tables A-I and B-I All tanks sampled in Periods 1 2 4 5 and 6 were exhausted by the same exhauster with the same housing and filters present during that period Period 3 covered the time the SX exhauster was used during RMCS in SX farm
A brief description of each RMCS tank sampling operation is provided below
Tank 241-BY-1061194 to 1294 RMCS using the nitrogen purge gas system with an exhauster was formally begun on 111794 on tank BY-106 riser IOB Exhauster 2 (A)and Truck 2 were used A sintered metal prefilter was inserted in the riser between the tank and the exhauster A total of eight segments were taken in rotary mode and five segments in push mode until sampling was halted on 122194 One RMCS core was obtained The total exhauster run time was 4878 hours The stack record sample was removed and analyzed following this run period Dose rates taken at the side of the exhauster housing during RMCS were all lt05 mRhr The in-tank prefilter was smeared for contamination when removed from the tank with the smears showing less than detectable levels of radionuclides present (Waldo 1999) The prefilter had been washed with an installed spray system prior to removal from the tank but subsequent testing showed the water flow and pressure were too low to have been effective at removing contamination
Tank 241-BY-106195 Following some process modifications RMCS in BY-IO6 riser IOB began again on 11895 Exhauster 2 (A) and Truck 2 were used The sintered metal prefilter was inserted in the riser between the tank and the exhauster RMCS was halted on 12495 over authorization basis and equipment operability issues for RMCS A total of three segments were taken in rotary mode and eleven segments in push mode One RMCS core was obtained The total exhauster run time was 1867 hours The stack record sample was removed and analyzed following this run period Dose rates taken at the side of the exhauster housing during RMCS were all lt O S mRhr The in-tank prefilter was smeared for contamination when removed from the tank with the smears showing less than detectable levels of radionuclides present (Waldo 1999) The prefilter was not washed this time
Tank 241-BY-110795 to 1095 Following resolution of RMCS authorization basis and equipment issues and completion of the fabrication and testing of Trucks 3 and 4 RMCS was begun in BY-I IO on 71195 Exhauster 2 (A) and Truck 2 were used Samples were taken from risers 128 7 128 again and 4 There was no in- tank prefilter used in this or any subsequent RMCS periods Sampling was performed until 102595 when RMCS was halted over flammable gas issues A total of 13 RMCS segments and 56 PMCS segments were taken Three RMCS cores were obtained The total exhauster run time was 1125 hours The stack record sample was removed and analyzed following this run period Dose rates taken at the side of the exhauster housing during RMCS were all lt O S mRhr
Tank 241-BY-108795 to 895 Core sampling was begun in BY-IO8 on 72595 Exhauster 3 (B) and Truck 4 were used Sampling was done in risers 12A and 7 The tank material proved soft enough so that no RMCS segments were required all segments were obtained in push mode although the exhauster was operated during part of the time sampling was performed Sampling was completed 81895 A total of 16 PMCS segments were taken The total exhauster run time was 6617 hours The stack record sample was removed and
F-2
RPP-4826 Rev 1
analyzed following this run period Dose rates taken at the side of the exhauster housing during RMCS were all lt05 mRhr
Tank 241-BY-105895 to 1095 RMCS was begun in BY-I05 riser 12A on 83095 Exhauster 3 (B) and Truck 4 were used This tank has a concrete layer on top about 12-18 inches thick which had to be drilled through Part way through sampling questions arose as to the flammable gas status of the tank and RMCS was halted on 10695 A total of 3 RMCS and 7 PMCS segments were taken One RMCS core was obtained The total exhauster run time was 4413 hours The stack record sample was removed and analyzed following this run period Dose rates taken at the side of the exhauster housing during RMCS were all lt05 mRhr
Tank 241-SX-1011297 to 298 Following resolution of extensive regulatory and authorization basis issues and installation of equipment modifications RMCS started in SX-101 with Truck 4 on 12497 An RMCS exhauster was not used since all SX farm tanks excluding SX-113 and SX-I 15 are ventilated with the SX exhauster Sampling was performed in risers 19 and 4 and was completed on 21098 A total of 9 RMCS and 6 PMCS segments were taken Two RMCS cores were obtained SX exhauster stack record samples and filter housing dose rates were obtained as part of routine operations for the SX exhauster not as part of the RMCS process Filter papers used in the suction line for the CGM were saved and analyzed in the laboratory to estimate the airborne radionuclide concentration in the tank head space Two CGM filter papers were needed for each core as moisture in the tank vapors condensed on the papers in the cold weather and began to restrict tank gas flow to the CGM
Tank 241-SX-103498 to 598 RMCS started in SX-103 with Truck 4 on 42798 The SX exhauster was used for ventilation (see SX- 101 above) Sampling was performed in risers 7 and 1 1 and was completed on 51198 A total of 6 RMCS and 18 PMCS segments were taken Two RMCS cores were obtained During sampling filter papers used in the suction line for the CGM were saved and analyzed in the laboratory to estimate the airborne radionuclide concentration in the tank head space One CGM filter paper was used during each core SX exhauster stack record samples and filter housing dose rates were obtained as part of routine operations for the SX exhauster not as part of the RMCS process
Tank 241-SX-105298 to 598 RMCS started in SX-105 with Truck 3 on 22598 The SX exhauster was used for ventilation (see SX- 101 above) Sampling was performed in risers 6 and 14 and was completed on 51598 A total of 6 RMCS and 20 PMCS segments were taken Two RMCS cores were obtained During sampling filter papers used in the suction line for the CGM were saved and analyzed in the laboratory to estimate the airborne radionuclide concentration in the tank head space Two filter papers were needed for the first core as moisture in the tank vapors condensed on the papers in the cold weather and began to restrict tank gas flow to the CGM One filter paper was used for the second core SX exhauster stack record samples and filter housing dose rates were obtained as part of routine operations for the SX exhauster not as part of the RMCS process
Tank 241-SX-102698 to 798 RMCS started in SX-102 with Truck 4 on 61798 The SX exhauster was used for ventilation (see SX- 101 above) Sampling was performed in risers 8 and 4 and was completed on 7798 A total of 2 RMCS and I8 PMCS segments were taken Two RMCS cores were obtained During sampling filter papers used in the suction line for the CGM were saved and analyzed in the laboratory to estimate the airborne radionuclide concentration in the tank head space One filter paper was used for each core SX exhauster stack record samples and filter housing dose rates were obtained as part of routine operations for the SX exhauster not as part of the RMCS process
Tank 241-S-110598 to 698 RMCS was begun in S-I10 on 51898 Exhauster C (4) and Truck 3 were used This tank marked the first use of an RMCS exhauster since 1995 Sampling was completed on 6498 Risers 6 and 14 were sampled A total of IO RMCS and 8 PMCS segments were taken Two RMCS cores were obtained The
F-3
RPP-4826 Rev I
total exhauster run time was 15978 hours The stack record sample was removed and analyzed following this run period Dose rates taken at the side of the exhauster housing during RMCS were all lt05 mRhr During sampling filter papers used in the suction line for the CGM were saved and analyzed in the laboratory to estimate the airborne radionuclide concentration in the tank head space One filter paper was used for each core Waste particles retained on the exhauster housing filters were part of the inventory subsequently measured by NDA following completion of the first core in TX-I 13
Tank 241-U-107698 to 798 RMCS was begun in U-107 on 61098 Exhauster C and Trucks 3 and 4 were used Sampling was completed on 71598 Risers 7 and 2 were sampled A total of IO RMCS and 19 PMCS segments were taken Two RMCS cores were obtained The total exhauster run time was 27385 hours The stack record sample was removed and analyzed following this run period Dose rates taken at the side of the exhauster housing during RMCS were all 105 mRihr During sampling filter papers used in the suction line for the CGM were saved and analyzed in the laboratory to estimate the airborne radionuclide concentration in the tank head space One filter paper was used for each core Waste particles retained on the exhauster housing filters were part of the inventory subsequently measured by NDA following completion of the first core in TX-I 13
Tank 24l-BY-105798 to 898 RMCS was begun in BY-105 again on 72298 Exhauster C and Trucks 3 and 4 were used Sampling was completed on 82598 Risers 7 and 1 1 B were sampled A total of 18 RMCS and 18 PMCS segments were taken The material was hard enough to require rotary mode sampling all the way to the bottom of the waste but negligible recovery was obtained After RMCS was performed to the waste bottom a PMCS core was taken in the same hole to recover material Two RMCS cores were obtained The exhauster run time was 13577 hours for the first RMCS core and 30792 hours for the second RMCS core Stack record sample information in ABCASH shows 30558 hours operation for the second core but the sampler data sheet shows the time counter was mistakenly reset 234 hours into the run No correction was made to the BY-IO5 2nd core record sample concentration for this document since the error is conservative and results in only slightly higher (ltI) record sample radionuclide concentrations for this core A stack record sample was removed and analyzed following each core giving two record samples for BY-IO5 in 1998 Dose rates taken at the side of the exhauster housing during RMCS were almost all lt05 m R h but a few readings indicated 07 mRihr This variation was assumed due to personnel reading the instrument differently or the fact that the exhauster had been used on enough tanks that by now there was sufficient activity on the filters to cause readings approximately at the background detection level The final reading when both cores were completed was lt05 m R h During sampling filter papers used in the suction line for the CGM were saved and analyzed in the laboratory to estimate the airborne radionuclide concentration in the tank head space One filter paper was used for each core Waste particles retained on the exhauster housing filters were part of the inventory subsequently measured by NDA following completion of the first core in TX-113
Tank 241-TX-113998 to 599 Core sampling was begun in TX-I 13 riser 3 on 92298 Exhauster B (3) and Truck 4 were used at the start This was the first use of Exhauster B since it was modified Exhauster B ran for a total of 8738 hours until being disconnected on 102398 During this time two PMCS segments were taken and no RMCS segments Exhauster C was then installed and operated for 5598 hours from 121098 to 122898 No RMCS or PMCS sampling was performed during this time frame RMCS segments werent taken until 299 Exhauster C ran for a 30230 hours between 122898 and 21299 Sampling was completed on the core from riser 3 on 21299 A total of 12 RMCS segments were obtained during the time Exhauster C was operating Exhauster flow rate for both exhausters was a nominal 200 scfm Stack record samples were taken following Exhauster B removal at the end of 1998 for Exhauster C and following completion ofthe first core with Exhauster C Aerosol calculations were based on only the 30230 hours run time for Exhauster C in 1999 since this was the time period during which RMCS segments were obtained Dose rates taken at the side of the exhauster housing during the short PMCS only sampling period with Exhauster B were all ltOS m R h Dose rates with Exhauster C varied between lt O S mRhr and 07 mRhr The final reading on Exhauster C following completion of the first core was 07 mFUhr During sampling filter papers used in the suction line for the CGM were saved and
F-4
RPP-4826 Rev I
analyzed in the laboratory to estimate the airborne radionuclide concentration in the tank head space One filter paper was used for the core Waste particles retained on the exhauster housing filters were part of the inventory subsequently measured by NDA following completion of this core
Sampling in riser 5 was begun on 41299 using Exhauster B and Truck 3 A total of 6 RMCS and 1 PMCS segments were taken for this core before sampling was halted on 42899 The total exhauster run time for this core was 11712 hours Problems with high vacuum in the tank required the exhauster flow rate to be reduced to 190 scfm to keep the system within pressure limits The stack record sample for the second core was removed and analyzed following the run period Dose rates taken at the side of the exhauster housing during the second core were all lt05 m M r During sampling filter papers used in the suction line for the CGM were saved and analyzed in the laboratory to estimate the airborne radionuclide concentration in the tank head space One filter paper was used An NDA was performed on the exhauster housing following this core The only radionuclides present in the housing were those from this core or what was removed from the tank head space during the non-RMCS activities in this tank from 92298 and 102398
Some clarification may be needed to explain use of the exhauster operating times and NDA dose rate and record sample data obtained during core sampling on TX-I 13 Core sampling was set up for sampling riser 3 on TX-113 in September 1998 with Exhauster B Exhauster B operated for a total of 8738 hours between 92298 and 102298 The stack record sample was removed at the end of this period The ERS database incorrectly shows the exhauster operated between 111698 and 111998 The ABCASH database shows the stack record sample was removed on 111998 The stack record sample showed positive emuent concentrations during this time period with variances 400 No RMCS samples were taken during this period so the data and time werenrsquot included when calculating RMCS aerosol numbers Exhauster B was removed and Exhauster C installed in late November-early December Exhauster C was operated for a total of 5559 hours between 121098 and 122398 The stack record sample was removed on 122898 No sampling was performed during this period so the data and time werenrsquot included when calculating RMCS aerosol numbers Exhauster C was operated for a total of 30218 hours between 122898 and 2899 All the RMCS segments from riser 3 were taken in this time period so only the data and time for this period were included when calculating RMCS aerosol numbers Exhauster B was used during sampling of riser 5 Exhauster B operated for a total of 11712 hours between 41299 and 42899
Tank 241-TX-l18599 to 699 RMCS was begun in TX-I 18 on 5699 Exhauster C (4) and Truck 4 were used Sampling was completed on 6298 Risers 9B and 12B were sampled A total of 9 RMCS segments were taken there were no PMCS segments Two RMCS cores were obtained The total exhauster run time was 21247 hours The stack record sample was removed and analyzed following this run period The maximum dose rate taken at the side of the exhauster housing following RMCS was 08 m M r CGM filter papers were not analyzed An NDA was performed on the exhauster housing following completion of the two cores The exhauster housing contained the same nuclides as for the first NDA (S-110 U-107 BY-105 and TX-I 13 first core) plus those from TX-I 18
The basic core sampling operational data used in this document includes the number of RMCS cores and segments the exhauster run times and flow rates the RMCS exhauster HEPA filter dose rates and tank vapor space temperatures Table F-l lists the basic operational data This information excluding tank vapor space temperature data was obtained from procedural data sheets in the sampling work packages (References W - 1 to WP-23)
Tank temperature data for the tanks ventilated with the RMCS exhausters was obtained from the TWINS database Plots for each tank were prepared for the time RMCS was conducted and the average value of the highest thermocouple located in the tank (the lowest temperature reading) was estimated and used as the average tank head space temperature during the RMCS period
The SX exhauster flow rates listed in Table F-l are estimates only The combined flow rate for SX-IO1 through SX-106 plus SX-109 (7 tanks) averaged 440 cfm during CY 1996 (Kaiser 1997) for an average of 63 cfm per
F-5
RPP-4826 Rev I
tank Based upon inlet flow measurements at the tank inlet HEPA filters (Fanis 1998) the flow through each individual tank (SX-IO1 through SX-106 plus SX-109) was lt55 cfm at the breather filter Assuming an exhaust flow of 100 cfm for each SX farm tank sampled is therefore conservative
Calculated Data
Calculated data include the tank head space volumes conversion of the RMCS exhauster flow rate from scfm to acfm and the number of tank head space changeouts made by an exhauster during RMCS
Tank head space volume includes the dome space volume above the top of the sidewall plus the void space between the waste surface and the top of the sidewall The formula used to calculate tank head space volumes WN
Head Space Volume in A = (DS + [(H) (12) + HI + Hb - H] (V)) - 748
Where DS = dome space volume gal H = height of tank body sidewall above knuckle A HI = height of tank knuckle area in Hb = height oftank bottom below knuckle in H = height of waste in tank in V =27555 galin of waste in SX tanks 2754 gallin in all others
The tank dome space volumes height of tank sidewall above the knuckle height of tank knuckle area and height of tank bottom below the knuckle were obtained from Reynolds 1999 The height of waste in each tank at the time of core sampling was obtained from the TWINS database Tank dimensional and waste level data are given in Table F-2 along with the calculated tank head space volumes
Aerosol calculations for Appendices A-C require exhauster flow rates in actual cubic feet per minute The RMCS exhauster flow rate is controlled and recorded in standard cubic feet per minute The mass flow rate of the exhauster air is measured and internal logic in the exhauster controller calculates what the volumetric flow rate would be if the temperature and pressure in the exhauster inlet were at standard conditions The standard conditions used in the logic controller are 29921 in Hg (760 mm Hg) and 69F (ZIT)
A correction factor is built into the exhauster control logic that assumes an atmospheric pressure of 2927 in Hg the average atmospheric pressure at Hanford The RMCS exhauster will operate at about 1-2 in H20 negative pressure resulting in about a 2916 in Hg pressure in a waste tank when the RMCS exhauster is operating To revise the indicated scfm RMCS exhauster reading to an acfm value the RMCS exhauster scfm flaw rate was multiplied by (29922916)(T+459)528 where Tis the tank head space temperature in OF The tank head space temperatures in Table F-1 were input to the spreadsheet file used for aerosol calculations and converted to acfm The flow rates in acfm are included in Table F-I
The tank head space changeouts when using the RMCS exhauster were calculated by multiplying the exhauster acfm flow rate by the time of exhauster operation and dividing the result by the tank head space volume Tank head space changeouts are listed in Table F-2
F-6
c
gt 2
RPP-4826 Rev 1
APPENDIX G
REFERENCES
G-0
RPP-4826 Rev 1
APPENDIX G - References
Diedeker 1999 NDA of RMCS HEPA Filters L P Diedeker WMH E-Mail to JS Schofield CHG November 29 I999
ERDA 1976 Nuclear Air Cleaning Handbook ERDA 76-21 Buchsted C A Fuller A B and Kahn 1 E Oak Ridge National Laboratory 1976
Farris 1998 Internal Note T R Farris LMHC to J S Schofield LMHC Breather Filter Flow Rates for SX-Farm 31698
Foust 1999 Internal Memo RMCST Exhauster HEPA Filter Dose Rate Calculations D J Foust LMHC to J S Schofield LMHC October 25 1999
Greager 1999 Correspondence No WMH-9954450 Non-Destructive Analysis of the Rotay Mode Core Sample High-Efjiciency Particulate Air Filters E M Greager WMH to P C Miller LMHC June 28 1999 [Transmittal of HNF-4199 Resultsfram NDA Measurement of the 296-P-34 RMCS HEPA Filters]
HNF 1999 HNF-SD-WM-SAR-067 Tank Waste Remediation System Final Safety Analysis Report Rev 1 The revision incorporating RMCS accident analyses was submitted as Addendum 5 to DOE as a change to the FSAR predecessor the Basis for Interim Operation (BIO) LMHC-9857075 80232764-9-KOOl Submittal of Authorization Basis Amendment Package for Rotay and Push Mode Core Sampling in Satisfaction of Perfarmance Agreement TWR 122 Expectations I and 3 D 1 Allen LMHC to A M Umek FDH August 30 1998 Addendum 5 as of mid-January 2000 is waiting for approval by DOE
Kaiser 1997 T D Kaiser LMHC E-Mail to J S Schofield LMHC SX Tank Flow Data 42197
NUREG 1995 Potential Radionuclide Emissionsfrom Stacks on the HanfordSite Part I Dose Assessment Davis W E and Barnett J M Westinghouse Hanford Company from Proceedings of the 23 DOEMRC Nuclear Air Cleaning Conference held July 25-28 1994 February 1995
Schofield 2000a Letter 74910-00-002 Use of Microshield Calculations for RMCS Exhauster Housing for Estimating Radionuclide Quantities on the Filters Using NDA and Dose Rate Measurements I S Schofield CHG to File January 62000
Schofield 2000b Letter 74910-00-003 Rev I RMCS Exhauster Stack RecordSample Data J S Schofield CHG to File January 202000
Reynolds 1999 D R Reynolds LMHC E-Mail to I S Schofield LMHC transmitting Tank Volume Calculations draft of calculations done by Mike Plesha and Reed Hendershot data to be used for RESOLVE computer program for Hanford waste tanks August 3 1999
TWINS Tank Waste Information Network System database available at httptwinspnlgovSOO lhtbinTCDgetTableListexe
Waldo 1999 letter 74910-99-009 RMCS Exhauster Aerosol Test Data E I Waldo to J S Schofield June 22 1999
WHC 1993 WHC-SD-WM-ES-225 Rev I AerosolStudy for the Rotary Mode Exhauster P M Francis Westinghouse Hanford Company April 20 1993
WHC 1997 WHC-SD-WM-SAD-035 Rev Ob A Safety Assessment of Rotary Mode Core Sampling in Flammable Gas Single Shell Tanks Hanford Site Richland Washington August 8 1997
G- I
RPP-4826 Rev I
CGM Data CGM-I Letter PARTICULATE SAMPLING OF 241-SX-IO1 DURING ROTARY MODE CORE SAMPLING D C
Langlois E2 Consulting Engineers to J S Schofield Lockheed Martin Hanford Company March 16 1998
CGM-2 Letter PARTICULATE SAMPLING OF 241-SX-I05 DURING ROTARY MODE CORE SAMPLING D C Langlois E2 Consulting Engineers to J S Schofield Lockheed Martin Hanford Company June 9 1998
CGM-3 Letter PARTICULATE SAMPLING OF 241-SX-103 DURING ROTARY MODE CORE SAMPLING D C Langlois E2 Consulting Engineers to J S Schofield Lockheed Martin Hanford Company June 12 1998
CGM-4 Letter PARTICULATE SAMPLING OF 241-S-110 DURING ROTARYMODE CORESAMPLING D C Langlois E2 Consulting Engineers to J S Schofield Lockheed Martin Hanford Company July 20 1998
CGM-5 Letter PARTICULATE SAMPLING OF 241-SX-102 DURING ROTARY MODE CORE SAMPLING D C Langlois E2 Consulting Engineers to J S Schofield Lockheed Martin Hanford Company July 22 1998
CGM-6 Letter PARTICULATE SAMPLING OF241-U-107 DURING ROTARY MODE CORE SAMPLING D C Langlois E2 Consulting Engineers to J S Schofield Lockheed Martin Hanford Company August 3 1998
CGM-7 Letter PARTICULATE SAMPLING OF 241-BY-105 DURING ROTARY MODE CORESAMPLING D C Langlois E2 Consulting Engineers to 1 S Schofield Lockheed Martin Hanford Company September 17 1998
CGM-8 Letter PARTICULATE SAMPLING OF 241-TX-I13 DURING ROTARY MODE CORESAMPLING D C Langlois E2 Consulting Engineers to J S Schofield Lockheed Martin Hanford Company March 15 1999
CGM-9 Letter PARTICULATE SAMPLING OF 241-TX-113 DURING ROTARY MODE CORE SAMPLING D C Langlois E2 Consulting Engineers to I S Schofield Lockheed Martin Hanford Company May 31 1999
Notices of Construction NOC-I DOEIRL-93-40 Radioactive Air Emissions Program Notice of Construction Rotary Mode Core-Sampling
Truck and Exhauster Approved by Letter AIR 93-707 A W Conklin WDOH to J E Rasmussen DOEIRL 7893
NOC-2 DOEIRL-94-118 Rev 0 Radioactive Air Emissions Program Notice of Construction for the Rotary Mode Core-Sampling Systems Three and Four Approved by Letter AIR 95-603 A W Conklin WDOH to J E Rasmussen DOERL 63095
NOC-3 DOERL-94-118 Rev 1 Radioactive Air Emissions Program Notice of Construction for the Rotary Mode Core-Sampling Systems Three and Four Approved by Letter AIR 98-301 W W Conklin WDOH to I E Rasmussen DOEIRL 3698
NOC-4 DOEIRL-97-70 Radioactive Air Emissions Program Notice of Construction for Rotary Mode Core- Sampling in SX Tank Farm Approved by Letter AIR 97-1 101 A W Conklin WDOH to J E Rasmussen DOEIRL 113097
NOC-5 USEPA Letter OAQ-107 (no title approving DOE submittal 97-EAP-590 dated 72997) A J Frankel USEPA to J E Rasrnussen DOEIRL 8497
NOC-5 USEPA Letter OAQ-107rsquo (nb title approving DOE submittal 97-EAP-723 dated 101797) A J Frankel USEPA to J E Rasmussen DOERL 11498
Note that both letters have ldquoOAQ-107rdquo following ldquoReply to Attn ofrdquo
G-2
RPP-4826 Rev I
Work Packages WP-I ES-94-00808 WP-2 ES-95-00258 WP-3 ES-95-00045 - WP-4 ES-95-00434 - WP-5 ws-97-00173 - WP-6 WS-97-00174 - WP-7 ws-97-00143 - WP-8 WS-97-00144 - WP-9 WS-97-00207 - WP-I 1 WS-97-00208 - WP-12 WS-98-00049 - WP-13 WS-97-00050 - WP-14 WS-97-00224 - WP- I5 WS-97-00225 - WP-16 WS-97-00230 - WP- I7 ws-97-0023 1 - WP-18 ES-97-00452 - WP-19 ES-97-00453 - WP-20 WS-98-00072 - WP-21 WS-98-00073 - WP-22 WS-98-00067 - WP-23 WS-98-00068 -
241-BY-IO6 Perform Rotary Core Sample [Riser IOB] 241-BY-I IO Rotary Core Sample [Risers 12B 7 IZB 41 241-BY-IO8 Obtain Rotary Core Sample [Risers 12A amp 71 241-BY-IO5 Rotary Mode Core Sample [Riser 12A] 241-SX-101 Rotary Mode Core Sample Riser 19 241-SX-101 Rotary Mode Core Sample Riser4 241-SX-103 Rotary Mode Core Sample Riser 7 241-SX-103 Rotary Mode Core Sample Riser I I 241-SX-105 RMCST Obtain Core Sample Riser 6 241-SX-105 RMCST Core Sample Riser 14 241-SX-102 Rotary Mode Core Sample Riser 8 241-SX-102 Rotary Mode Core Sample Riser 4 241-S-1 IO RMCST Obtain Core Sample Riser 6 241-S-1 IO RMCST Obtain Core Sample Riser 14 2414-107 RMCSTCore Sample Riser 7 241-U-107 RMCST Core Sample Riser 2 241-BY-IO5 RMCST Core Sample Riser 7 241-BY-IO5 RMCST Core Sample Riser 1 IB 241-TX-113 Rotary Core Sample Riser 3 241-TX-113 RMCST Core Sample Riser 5 241-TX-I 18 RMCST Core Sample Riser 9B 241-TX-I 18 RMCST Core Sample Riser 128
G-3
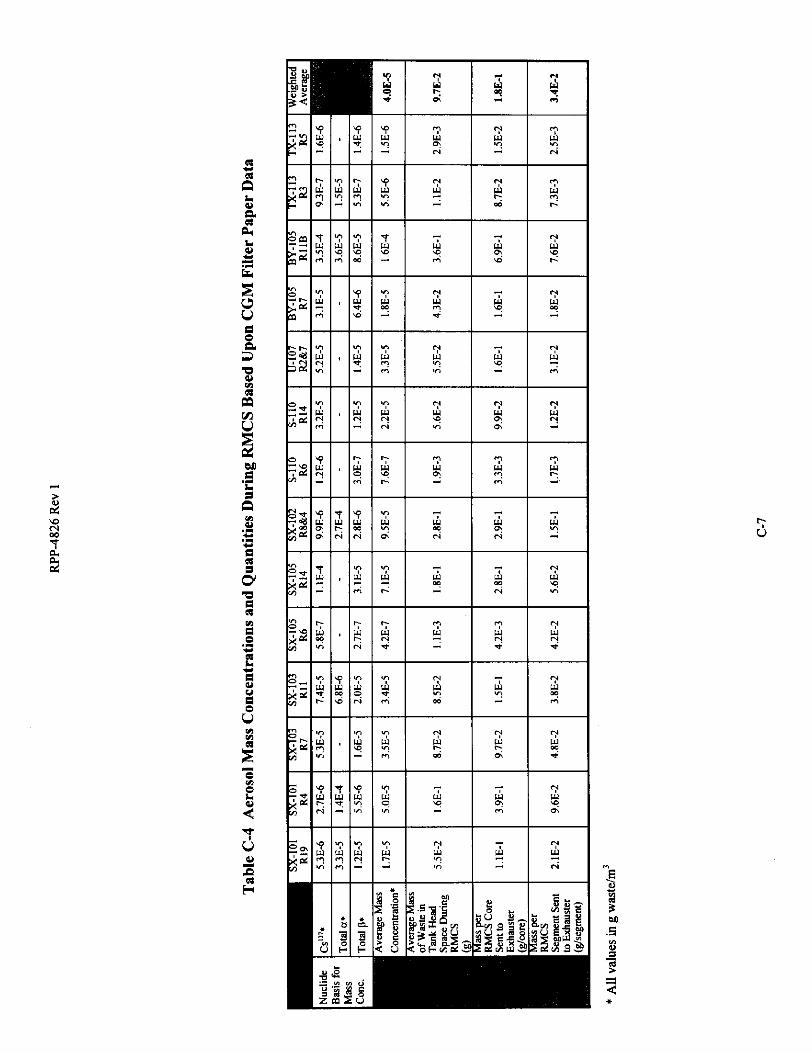
RPP-4826 Rev 1
the ten positive results with a variance ltloo were used the aerosol levels calculated to be two to five times higher than those estimated using NDA dose rate or CGM filter paper data Because of the variability of data resulting from the extremely low record sample concentrations and the few useable data points estimation of aerosol levels using record sample data was not included in Revision I See Schofield 2000b for further discussion of the use of record sample data to estimate aerosol levels
Summary of Calculations
A total of nine RMCS exhauster stack record sample data points were used to estimate the RMCS exhauster filter housing decontamination factor These data points were obtained when sampling on five tanks during which 10 RMCS cores and 65 RMCS segments were obtained The overall decontamination factor was 73E+4
Estimation of aerosol generation quantities based upon RMCS stack record sample data is possible However results will likely be skewed high if data points that show non-detectable levels of radionuclides present are ignored instead of using a value of zero for the data point
D-4
RPP-4826 Rev 1
APPENDIX E
TANK WASTE RADIONUCLIDE CONCENTRATIONS USED FOR AEROSOL CALCULATIONS
E-0
RPP-4826 Rev 1
APPENDIX E - Tank Waste Radionuclide Concentrations Used for Aerosol Calculations
The RMCS exhauster NDA data HEPA filter dose rate data CGM filter paper data and stack record sample data provide information on the quantity of radionuclides on the exhauster filters in the tank head space or the exhauster stack during RMCS These radioactivity quantities need to be divided by the waste radionuclide concentration specific activity to determine the mass of waste in the tank head space and in the tank gases sent to the exhauster
The mass quantities in this document were calculated using dry basis radionuclide concentrations Waste particles carried into the tank head space by the purge gas could be wet or dry If wet some of the non-chemically bound water will start to evaporate immediately providing the tank relative humidity is 400 The water present in a waste particle may be chemically bound as a hydrate or free The chemically bound water will not readily evaporate therefore even a ldquodryrdquo particle may have some water associated with it It is impractical to measure the actual water content of the waste particulates caught on the CGM filter paper the exhauster HEPA filters or the stack record sample paper Since the quantity of water in the waste particulates is unknown particulate levels were calculated using dry basis radionuclide concentrations Thus all particulate values given in this document are stated on a dry basis
The waste radionuclide concentrations on a dry basis were calculated from data available in the Tank Waste Information Network System (TWINS) The Best Basis InventorylBest Basis Summary numbers were used These values are the most complete and up to date readily available estimates for Hanford waste tank contents but do not include water The information was downloaded from TWINS into a spreadsheet The total chemical total beta and total alpha quantities were summed in the spreadsheet for all the tanks which were sampled and concentrations for Csrdquorsquo Sr9rsquo total beta and total alpha automatically calculated in pCig These concentrations are provided in Table E-I Because lab techniques for measuring gross beta levels only detect beta particles with a minimum decay energy above 150-200 kev only radionuclides with a decay energy of gt-200 kev were included in the total beta numbers
The TWINS radionuclide concentrations were obtained in December 1999 No corrections were made for decay for this document
The CGM filter paper and stack record sample data indicate the measured radionuclide values are not always in the same ratio to each other as given by TWINS nor are all radionuclides detected that TWINS indicates are present Radionuclides can be distributed unevenly in a tank Soluble fission products (primarily Csrsquordquo) are found in the liquid saltcake and in sludges Insoluble fission products and actinides are found largely in sludges as these are primarily chemical precipitates Sludge could be mixed with saltcake be present in a distinct layer at the bottom of a tank or in several layers in the tank depending upon how waste was transferred into a tank Waste particles may thus not have the same specific activity on a microscopic scale as they would have on a macro scale were the tank contents homogenized During RMCS a top to bottom core sample is attempted resulting in the drill bit and purge gas (which causes aerosols to form) passing through most ofthe waste matrix Assuming the aerosol generation rate is approximately constant during drilling the specific activity of a radionuclide in the suspended solids should be roughly the same as the average specific activity of the same radionuclide in the tank waste While the waste specific activity is probably not homogeneous from top to bottom in a tank and the aerosol generation rate will likely also vary it is beyond the scope of this document to provide an in-depth analysis of all the factors affecting aerosol radionuclide concentration Although sample radionuclide data were not always in the same ratio as provided by TWINS for the purpose of this document the simplifying assumption was made that the average tank specific activity is adequate to provide an approximation of the suspended solids specific activity for all radionuclides Average tank individual radionuclide specific activities were used in the preparation of the exhauster NOCs
The aerosol calculations presented in this document are only as accurate as the TWINS data The combined radionuclide content of all Hanford waste tanks is known fairly well since the overall content is based upon reactor production records CsrdquorsquoSrW recovery data and processing plant discharges Thus TWINS data for all tanks combined should be reasonable There are undoubtedly differences between TWINS data and the actual contents of a specific tank While the specific tank radionuclide data from TWINS used in this document may not be exact deviations from the actual concentrations are assumed to balance out over the number of tanks sampled
E- 1
RPP-4826 Rev 1
APPENDIX F
ROTARY MODE CORE SAMPLING EXHAUSTER AND CORE SAMPLE DATA
F-0
RPP-4826 Rev 1
APPENDIX F - Rotary Mode Core Sampling Exhauster and Core Sample Data
This appendix provides the basic data obtained during RMCS operations which was used in preparation of this document
Basic Operational Data
There have been three RMCS exhausters and three RMCS sampling trucks deployed since starmp of nitrogen- purged RMCS in November 1994 The exhausters are formally designated 296-P-32296-P-33 and 296-P-34 These were originally referred to as parts of RMCS Systems 2 3 and 4 respectively in the Notices of Construction (NOC) for these units The exhauster designations were changed for routine field use in 1996 to exhausters A B and C to avoid confusion with core sampling trucks 23 and 4 since any exhauster could be used with any RMCS truck Exhauster A (2) and RMCS Truck2 have not been used for RMCS since 1995 and are no longer in service for core sampling
Rotary mode core sampling has been conducted in four general time frames since 1994 These time frames were separated by down times for equipment modifications or resolution of environmental permitting and safety concerns For ease of analysis in this document exhauster operations were organized into six distinct operating periods Periods I to 6 were grouped based upon times when the same exhauster and same set of HEPA filters were being used These periods thus overlap with the general operating time frames The four operating time frames were
The first time frame lasted from November 1994 to January 1995 RMCS Truck 2 and Exhauster 2 (A) were used on Tank BY-106 along with an in-tank prefilter This tank provided the initial deployment and testing of the nitrogen-purged equipment in a waste tank During this period radiation dose rates were taken at the side of the exhauster housing Stack record samples were taken in December 1994 and January 1995
The second time frame lasted from July 1995 through October 1995 RMCS Trucks 2 and 4 were used with Exhausters 2 and 3 (A and B) on BY-105 BY-IO8 and BY-I IO During this period radiation dose rates were taken at the sides of the exhauster housings Stack record samples were taken after completion of sampling on each tank No RMCS samples were taken from BY-108 all samples were taken in push mode for this tank
The third time frame began when RMCS was restarted in December 1997 Trucks 3 and 4 were used for sampling of SX-101 SX-103 SX-105 and SX-102 with the SX tank farm exhauster providing ventilation The RMCS exhausters were not used During this period radiation dose rates were taken at the sides of the SX exhauster housing as part of HPT routine surveys SX farm exhauster stack record samples were taken when required by normal operating procedures SX record sampler and filter housing dose rate data were not evaluated for this document It would not be practical using filter dose rate or stack record sample data to estimate the RMCS aerosol addition if any to the SX ventilation system The background radiation around the SX filter housing makes measurement of any small increase in dose rate very difficult to detect The number of tanks being ventilated and the involved off-gas header routings (the exhauster is pulling on thirteen tanks in series or in parallel with the tank being sampled) and any in-tank activities in the SX tanks not being sampled would make it impractical to assess what aerosols resulted from RMCS Beginning with RMCS in SX farm radionuclide analyses were performed on the filter papers protecting the CGMs which draw air out of the tank vapor space for flammable gas detection
The fourth time frame began in May 1998 Between 1095 and 598 Exhausters B and C were extensively modified with new filter housings and other equipment to meet new NOC requirements Trucks 3 and 4 were used with Exhausters B and C (3 and 4) on S-l IO U-107 BY-105 TX-113 and TX-I 18 This period marked the first use ofthe RMCS trucks and RMCS exhausters together following resolution of flammable gas concerns and modifications to the exhausters New filters were installed Radiation dose rates were taken at the sides of the exhauster housings Stack record samples
F- 1
RPP-4826 Rev I
were taken after completion of sampling for each exhauster installation Radionuclide analyses were performed on the CGM filter papers for all tanks except TX-118 An NDA was performed on the Exhauster C housing following completion ofthe first core on TX-I 13 The housing filters when assayed contained aerosols captured by the exhauster following RMCS in S-l IO U-107 BY-105 (1998) and the first core of TX-I 13 Another NDA was performed on Exhauster C following both cores in TX-I 18 An NDA was performed following sampling of the second core in TX-I 13 using Exhauster B The time frame ran through early June 1999 No RMCS samples have been taken after June 1999 nor are any planned for the next few years
For the purposes of evaluating aerosol formation based upon RMCS exhauster housing NDA and dose rate data the exhauster operations were grouped into 6 operating periods These periods are shown in Table F-1 and restated in Tables A-I and B-I All tanks sampled in Periods 1 2 4 5 and 6 were exhausted by the same exhauster with the same housing and filters present during that period Period 3 covered the time the SX exhauster was used during RMCS in SX farm
A brief description of each RMCS tank sampling operation is provided below
Tank 241-BY-1061194 to 1294 RMCS using the nitrogen purge gas system with an exhauster was formally begun on 111794 on tank BY-106 riser IOB Exhauster 2 (A)and Truck 2 were used A sintered metal prefilter was inserted in the riser between the tank and the exhauster A total of eight segments were taken in rotary mode and five segments in push mode until sampling was halted on 122194 One RMCS core was obtained The total exhauster run time was 4878 hours The stack record sample was removed and analyzed following this run period Dose rates taken at the side of the exhauster housing during RMCS were all lt05 mRhr The in-tank prefilter was smeared for contamination when removed from the tank with the smears showing less than detectable levels of radionuclides present (Waldo 1999) The prefilter had been washed with an installed spray system prior to removal from the tank but subsequent testing showed the water flow and pressure were too low to have been effective at removing contamination
Tank 241-BY-106195 Following some process modifications RMCS in BY-IO6 riser IOB began again on 11895 Exhauster 2 (A) and Truck 2 were used The sintered metal prefilter was inserted in the riser between the tank and the exhauster RMCS was halted on 12495 over authorization basis and equipment operability issues for RMCS A total of three segments were taken in rotary mode and eleven segments in push mode One RMCS core was obtained The total exhauster run time was 1867 hours The stack record sample was removed and analyzed following this run period Dose rates taken at the side of the exhauster housing during RMCS were all lt O S mRhr The in-tank prefilter was smeared for contamination when removed from the tank with the smears showing less than detectable levels of radionuclides present (Waldo 1999) The prefilter was not washed this time
Tank 241-BY-110795 to 1095 Following resolution of RMCS authorization basis and equipment issues and completion of the fabrication and testing of Trucks 3 and 4 RMCS was begun in BY-I IO on 71195 Exhauster 2 (A) and Truck 2 were used Samples were taken from risers 128 7 128 again and 4 There was no in- tank prefilter used in this or any subsequent RMCS periods Sampling was performed until 102595 when RMCS was halted over flammable gas issues A total of 13 RMCS segments and 56 PMCS segments were taken Three RMCS cores were obtained The total exhauster run time was 1125 hours The stack record sample was removed and analyzed following this run period Dose rates taken at the side of the exhauster housing during RMCS were all lt O S mRhr
Tank 241-BY-108795 to 895 Core sampling was begun in BY-IO8 on 72595 Exhauster 3 (B) and Truck 4 were used Sampling was done in risers 12A and 7 The tank material proved soft enough so that no RMCS segments were required all segments were obtained in push mode although the exhauster was operated during part of the time sampling was performed Sampling was completed 81895 A total of 16 PMCS segments were taken The total exhauster run time was 6617 hours The stack record sample was removed and
F-2
RPP-4826 Rev 1
analyzed following this run period Dose rates taken at the side of the exhauster housing during RMCS were all lt05 mRhr
Tank 241-BY-105895 to 1095 RMCS was begun in BY-I05 riser 12A on 83095 Exhauster 3 (B) and Truck 4 were used This tank has a concrete layer on top about 12-18 inches thick which had to be drilled through Part way through sampling questions arose as to the flammable gas status of the tank and RMCS was halted on 10695 A total of 3 RMCS and 7 PMCS segments were taken One RMCS core was obtained The total exhauster run time was 4413 hours The stack record sample was removed and analyzed following this run period Dose rates taken at the side of the exhauster housing during RMCS were all lt05 mRhr
Tank 241-SX-1011297 to 298 Following resolution of extensive regulatory and authorization basis issues and installation of equipment modifications RMCS started in SX-101 with Truck 4 on 12497 An RMCS exhauster was not used since all SX farm tanks excluding SX-113 and SX-I 15 are ventilated with the SX exhauster Sampling was performed in risers 19 and 4 and was completed on 21098 A total of 9 RMCS and 6 PMCS segments were taken Two RMCS cores were obtained SX exhauster stack record samples and filter housing dose rates were obtained as part of routine operations for the SX exhauster not as part of the RMCS process Filter papers used in the suction line for the CGM were saved and analyzed in the laboratory to estimate the airborne radionuclide concentration in the tank head space Two CGM filter papers were needed for each core as moisture in the tank vapors condensed on the papers in the cold weather and began to restrict tank gas flow to the CGM
Tank 241-SX-103498 to 598 RMCS started in SX-103 with Truck 4 on 42798 The SX exhauster was used for ventilation (see SX- 101 above) Sampling was performed in risers 7 and 1 1 and was completed on 51198 A total of 6 RMCS and 18 PMCS segments were taken Two RMCS cores were obtained During sampling filter papers used in the suction line for the CGM were saved and analyzed in the laboratory to estimate the airborne radionuclide concentration in the tank head space One CGM filter paper was used during each core SX exhauster stack record samples and filter housing dose rates were obtained as part of routine operations for the SX exhauster not as part of the RMCS process
Tank 241-SX-105298 to 598 RMCS started in SX-105 with Truck 3 on 22598 The SX exhauster was used for ventilation (see SX- 101 above) Sampling was performed in risers 6 and 14 and was completed on 51598 A total of 6 RMCS and 20 PMCS segments were taken Two RMCS cores were obtained During sampling filter papers used in the suction line for the CGM were saved and analyzed in the laboratory to estimate the airborne radionuclide concentration in the tank head space Two filter papers were needed for the first core as moisture in the tank vapors condensed on the papers in the cold weather and began to restrict tank gas flow to the CGM One filter paper was used for the second core SX exhauster stack record samples and filter housing dose rates were obtained as part of routine operations for the SX exhauster not as part of the RMCS process
Tank 241-SX-102698 to 798 RMCS started in SX-102 with Truck 4 on 61798 The SX exhauster was used for ventilation (see SX- 101 above) Sampling was performed in risers 8 and 4 and was completed on 7798 A total of 2 RMCS and I8 PMCS segments were taken Two RMCS cores were obtained During sampling filter papers used in the suction line for the CGM were saved and analyzed in the laboratory to estimate the airborne radionuclide concentration in the tank head space One filter paper was used for each core SX exhauster stack record samples and filter housing dose rates were obtained as part of routine operations for the SX exhauster not as part of the RMCS process
Tank 241-S-110598 to 698 RMCS was begun in S-I10 on 51898 Exhauster C (4) and Truck 3 were used This tank marked the first use of an RMCS exhauster since 1995 Sampling was completed on 6498 Risers 6 and 14 were sampled A total of IO RMCS and 8 PMCS segments were taken Two RMCS cores were obtained The
F-3
RPP-4826 Rev I
total exhauster run time was 15978 hours The stack record sample was removed and analyzed following this run period Dose rates taken at the side of the exhauster housing during RMCS were all lt05 mRhr During sampling filter papers used in the suction line for the CGM were saved and analyzed in the laboratory to estimate the airborne radionuclide concentration in the tank head space One filter paper was used for each core Waste particles retained on the exhauster housing filters were part of the inventory subsequently measured by NDA following completion of the first core in TX-I 13
Tank 241-U-107698 to 798 RMCS was begun in U-107 on 61098 Exhauster C and Trucks 3 and 4 were used Sampling was completed on 71598 Risers 7 and 2 were sampled A total of IO RMCS and 19 PMCS segments were taken Two RMCS cores were obtained The total exhauster run time was 27385 hours The stack record sample was removed and analyzed following this run period Dose rates taken at the side of the exhauster housing during RMCS were all 105 mRihr During sampling filter papers used in the suction line for the CGM were saved and analyzed in the laboratory to estimate the airborne radionuclide concentration in the tank head space One filter paper was used for each core Waste particles retained on the exhauster housing filters were part of the inventory subsequently measured by NDA following completion of the first core in TX-I 13
Tank 24l-BY-105798 to 898 RMCS was begun in BY-105 again on 72298 Exhauster C and Trucks 3 and 4 were used Sampling was completed on 82598 Risers 7 and 1 1 B were sampled A total of 18 RMCS and 18 PMCS segments were taken The material was hard enough to require rotary mode sampling all the way to the bottom of the waste but negligible recovery was obtained After RMCS was performed to the waste bottom a PMCS core was taken in the same hole to recover material Two RMCS cores were obtained The exhauster run time was 13577 hours for the first RMCS core and 30792 hours for the second RMCS core Stack record sample information in ABCASH shows 30558 hours operation for the second core but the sampler data sheet shows the time counter was mistakenly reset 234 hours into the run No correction was made to the BY-IO5 2nd core record sample concentration for this document since the error is conservative and results in only slightly higher (ltI) record sample radionuclide concentrations for this core A stack record sample was removed and analyzed following each core giving two record samples for BY-IO5 in 1998 Dose rates taken at the side of the exhauster housing during RMCS were almost all lt05 m R h but a few readings indicated 07 mRihr This variation was assumed due to personnel reading the instrument differently or the fact that the exhauster had been used on enough tanks that by now there was sufficient activity on the filters to cause readings approximately at the background detection level The final reading when both cores were completed was lt05 m R h During sampling filter papers used in the suction line for the CGM were saved and analyzed in the laboratory to estimate the airborne radionuclide concentration in the tank head space One filter paper was used for each core Waste particles retained on the exhauster housing filters were part of the inventory subsequently measured by NDA following completion of the first core in TX-113
Tank 241-TX-113998 to 599 Core sampling was begun in TX-I 13 riser 3 on 92298 Exhauster B (3) and Truck 4 were used at the start This was the first use of Exhauster B since it was modified Exhauster B ran for a total of 8738 hours until being disconnected on 102398 During this time two PMCS segments were taken and no RMCS segments Exhauster C was then installed and operated for 5598 hours from 121098 to 122898 No RMCS or PMCS sampling was performed during this time frame RMCS segments werent taken until 299 Exhauster C ran for a 30230 hours between 122898 and 21299 Sampling was completed on the core from riser 3 on 21299 A total of 12 RMCS segments were obtained during the time Exhauster C was operating Exhauster flow rate for both exhausters was a nominal 200 scfm Stack record samples were taken following Exhauster B removal at the end of 1998 for Exhauster C and following completion ofthe first core with Exhauster C Aerosol calculations were based on only the 30230 hours run time for Exhauster C in 1999 since this was the time period during which RMCS segments were obtained Dose rates taken at the side of the exhauster housing during the short PMCS only sampling period with Exhauster B were all ltOS m R h Dose rates with Exhauster C varied between lt O S mRhr and 07 mRhr The final reading on Exhauster C following completion of the first core was 07 mFUhr During sampling filter papers used in the suction line for the CGM were saved and
F-4
RPP-4826 Rev I
analyzed in the laboratory to estimate the airborne radionuclide concentration in the tank head space One filter paper was used for the core Waste particles retained on the exhauster housing filters were part of the inventory subsequently measured by NDA following completion of this core
Sampling in riser 5 was begun on 41299 using Exhauster B and Truck 3 A total of 6 RMCS and 1 PMCS segments were taken for this core before sampling was halted on 42899 The total exhauster run time for this core was 11712 hours Problems with high vacuum in the tank required the exhauster flow rate to be reduced to 190 scfm to keep the system within pressure limits The stack record sample for the second core was removed and analyzed following the run period Dose rates taken at the side of the exhauster housing during the second core were all lt05 m M r During sampling filter papers used in the suction line for the CGM were saved and analyzed in the laboratory to estimate the airborne radionuclide concentration in the tank head space One filter paper was used An NDA was performed on the exhauster housing following this core The only radionuclides present in the housing were those from this core or what was removed from the tank head space during the non-RMCS activities in this tank from 92298 and 102398
Some clarification may be needed to explain use of the exhauster operating times and NDA dose rate and record sample data obtained during core sampling on TX-I 13 Core sampling was set up for sampling riser 3 on TX-113 in September 1998 with Exhauster B Exhauster B operated for a total of 8738 hours between 92298 and 102298 The stack record sample was removed at the end of this period The ERS database incorrectly shows the exhauster operated between 111698 and 111998 The ABCASH database shows the stack record sample was removed on 111998 The stack record sample showed positive emuent concentrations during this time period with variances 400 No RMCS samples were taken during this period so the data and time werenrsquot included when calculating RMCS aerosol numbers Exhauster B was removed and Exhauster C installed in late November-early December Exhauster C was operated for a total of 5559 hours between 121098 and 122398 The stack record sample was removed on 122898 No sampling was performed during this period so the data and time werenrsquot included when calculating RMCS aerosol numbers Exhauster C was operated for a total of 30218 hours between 122898 and 2899 All the RMCS segments from riser 3 were taken in this time period so only the data and time for this period were included when calculating RMCS aerosol numbers Exhauster B was used during sampling of riser 5 Exhauster B operated for a total of 11712 hours between 41299 and 42899
Tank 241-TX-l18599 to 699 RMCS was begun in TX-I 18 on 5699 Exhauster C (4) and Truck 4 were used Sampling was completed on 6298 Risers 9B and 12B were sampled A total of 9 RMCS segments were taken there were no PMCS segments Two RMCS cores were obtained The total exhauster run time was 21247 hours The stack record sample was removed and analyzed following this run period The maximum dose rate taken at the side of the exhauster housing following RMCS was 08 m M r CGM filter papers were not analyzed An NDA was performed on the exhauster housing following completion of the two cores The exhauster housing contained the same nuclides as for the first NDA (S-110 U-107 BY-105 and TX-I 13 first core) plus those from TX-I 18
The basic core sampling operational data used in this document includes the number of RMCS cores and segments the exhauster run times and flow rates the RMCS exhauster HEPA filter dose rates and tank vapor space temperatures Table F-l lists the basic operational data This information excluding tank vapor space temperature data was obtained from procedural data sheets in the sampling work packages (References W - 1 to WP-23)
Tank temperature data for the tanks ventilated with the RMCS exhausters was obtained from the TWINS database Plots for each tank were prepared for the time RMCS was conducted and the average value of the highest thermocouple located in the tank (the lowest temperature reading) was estimated and used as the average tank head space temperature during the RMCS period
The SX exhauster flow rates listed in Table F-l are estimates only The combined flow rate for SX-IO1 through SX-106 plus SX-109 (7 tanks) averaged 440 cfm during CY 1996 (Kaiser 1997) for an average of 63 cfm per
F-5
RPP-4826 Rev I
tank Based upon inlet flow measurements at the tank inlet HEPA filters (Fanis 1998) the flow through each individual tank (SX-IO1 through SX-106 plus SX-109) was lt55 cfm at the breather filter Assuming an exhaust flow of 100 cfm for each SX farm tank sampled is therefore conservative
Calculated Data
Calculated data include the tank head space volumes conversion of the RMCS exhauster flow rate from scfm to acfm and the number of tank head space changeouts made by an exhauster during RMCS
Tank head space volume includes the dome space volume above the top of the sidewall plus the void space between the waste surface and the top of the sidewall The formula used to calculate tank head space volumes WN
Head Space Volume in A = (DS + [(H) (12) + HI + Hb - H] (V)) - 748
Where DS = dome space volume gal H = height of tank body sidewall above knuckle A HI = height of tank knuckle area in Hb = height oftank bottom below knuckle in H = height of waste in tank in V =27555 galin of waste in SX tanks 2754 gallin in all others
The tank dome space volumes height of tank sidewall above the knuckle height of tank knuckle area and height of tank bottom below the knuckle were obtained from Reynolds 1999 The height of waste in each tank at the time of core sampling was obtained from the TWINS database Tank dimensional and waste level data are given in Table F-2 along with the calculated tank head space volumes
Aerosol calculations for Appendices A-C require exhauster flow rates in actual cubic feet per minute The RMCS exhauster flow rate is controlled and recorded in standard cubic feet per minute The mass flow rate of the exhauster air is measured and internal logic in the exhauster controller calculates what the volumetric flow rate would be if the temperature and pressure in the exhauster inlet were at standard conditions The standard conditions used in the logic controller are 29921 in Hg (760 mm Hg) and 69F (ZIT)
A correction factor is built into the exhauster control logic that assumes an atmospheric pressure of 2927 in Hg the average atmospheric pressure at Hanford The RMCS exhauster will operate at about 1-2 in H20 negative pressure resulting in about a 2916 in Hg pressure in a waste tank when the RMCS exhauster is operating To revise the indicated scfm RMCS exhauster reading to an acfm value the RMCS exhauster scfm flaw rate was multiplied by (29922916)(T+459)528 where Tis the tank head space temperature in OF The tank head space temperatures in Table F-1 were input to the spreadsheet file used for aerosol calculations and converted to acfm The flow rates in acfm are included in Table F-I
The tank head space changeouts when using the RMCS exhauster were calculated by multiplying the exhauster acfm flow rate by the time of exhauster operation and dividing the result by the tank head space volume Tank head space changeouts are listed in Table F-2
F-6
c
gt 2
RPP-4826 Rev 1
APPENDIX G
REFERENCES
G-0
RPP-4826 Rev 1
APPENDIX G - References
Diedeker 1999 NDA of RMCS HEPA Filters L P Diedeker WMH E-Mail to JS Schofield CHG November 29 I999
ERDA 1976 Nuclear Air Cleaning Handbook ERDA 76-21 Buchsted C A Fuller A B and Kahn 1 E Oak Ridge National Laboratory 1976
Farris 1998 Internal Note T R Farris LMHC to J S Schofield LMHC Breather Filter Flow Rates for SX-Farm 31698
Foust 1999 Internal Memo RMCST Exhauster HEPA Filter Dose Rate Calculations D J Foust LMHC to J S Schofield LMHC October 25 1999
Greager 1999 Correspondence No WMH-9954450 Non-Destructive Analysis of the Rotay Mode Core Sample High-Efjiciency Particulate Air Filters E M Greager WMH to P C Miller LMHC June 28 1999 [Transmittal of HNF-4199 Resultsfram NDA Measurement of the 296-P-34 RMCS HEPA Filters]
HNF 1999 HNF-SD-WM-SAR-067 Tank Waste Remediation System Final Safety Analysis Report Rev 1 The revision incorporating RMCS accident analyses was submitted as Addendum 5 to DOE as a change to the FSAR predecessor the Basis for Interim Operation (BIO) LMHC-9857075 80232764-9-KOOl Submittal of Authorization Basis Amendment Package for Rotay and Push Mode Core Sampling in Satisfaction of Perfarmance Agreement TWR 122 Expectations I and 3 D 1 Allen LMHC to A M Umek FDH August 30 1998 Addendum 5 as of mid-January 2000 is waiting for approval by DOE
Kaiser 1997 T D Kaiser LMHC E-Mail to J S Schofield LMHC SX Tank Flow Data 42197
NUREG 1995 Potential Radionuclide Emissionsfrom Stacks on the HanfordSite Part I Dose Assessment Davis W E and Barnett J M Westinghouse Hanford Company from Proceedings of the 23 DOEMRC Nuclear Air Cleaning Conference held July 25-28 1994 February 1995
Schofield 2000a Letter 74910-00-002 Use of Microshield Calculations for RMCS Exhauster Housing for Estimating Radionuclide Quantities on the Filters Using NDA and Dose Rate Measurements I S Schofield CHG to File January 62000
Schofield 2000b Letter 74910-00-003 Rev I RMCS Exhauster Stack RecordSample Data J S Schofield CHG to File January 202000
Reynolds 1999 D R Reynolds LMHC E-Mail to I S Schofield LMHC transmitting Tank Volume Calculations draft of calculations done by Mike Plesha and Reed Hendershot data to be used for RESOLVE computer program for Hanford waste tanks August 3 1999
TWINS Tank Waste Information Network System database available at httptwinspnlgovSOO lhtbinTCDgetTableListexe
Waldo 1999 letter 74910-99-009 RMCS Exhauster Aerosol Test Data E I Waldo to J S Schofield June 22 1999
WHC 1993 WHC-SD-WM-ES-225 Rev I AerosolStudy for the Rotary Mode Exhauster P M Francis Westinghouse Hanford Company April 20 1993
WHC 1997 WHC-SD-WM-SAD-035 Rev Ob A Safety Assessment of Rotary Mode Core Sampling in Flammable Gas Single Shell Tanks Hanford Site Richland Washington August 8 1997
G- I
RPP-4826 Rev I
CGM Data CGM-I Letter PARTICULATE SAMPLING OF 241-SX-IO1 DURING ROTARY MODE CORE SAMPLING D C
Langlois E2 Consulting Engineers to J S Schofield Lockheed Martin Hanford Company March 16 1998
CGM-2 Letter PARTICULATE SAMPLING OF 241-SX-I05 DURING ROTARY MODE CORE SAMPLING D C Langlois E2 Consulting Engineers to J S Schofield Lockheed Martin Hanford Company June 9 1998
CGM-3 Letter PARTICULATE SAMPLING OF 241-SX-103 DURING ROTARY MODE CORE SAMPLING D C Langlois E2 Consulting Engineers to J S Schofield Lockheed Martin Hanford Company June 12 1998
CGM-4 Letter PARTICULATE SAMPLING OF 241-S-110 DURING ROTARYMODE CORESAMPLING D C Langlois E2 Consulting Engineers to J S Schofield Lockheed Martin Hanford Company July 20 1998
CGM-5 Letter PARTICULATE SAMPLING OF 241-SX-102 DURING ROTARY MODE CORE SAMPLING D C Langlois E2 Consulting Engineers to J S Schofield Lockheed Martin Hanford Company July 22 1998
CGM-6 Letter PARTICULATE SAMPLING OF241-U-107 DURING ROTARY MODE CORE SAMPLING D C Langlois E2 Consulting Engineers to J S Schofield Lockheed Martin Hanford Company August 3 1998
CGM-7 Letter PARTICULATE SAMPLING OF 241-BY-105 DURING ROTARY MODE CORESAMPLING D C Langlois E2 Consulting Engineers to 1 S Schofield Lockheed Martin Hanford Company September 17 1998
CGM-8 Letter PARTICULATE SAMPLING OF 241-TX-I13 DURING ROTARY MODE CORESAMPLING D C Langlois E2 Consulting Engineers to J S Schofield Lockheed Martin Hanford Company March 15 1999
CGM-9 Letter PARTICULATE SAMPLING OF 241-TX-113 DURING ROTARY MODE CORE SAMPLING D C Langlois E2 Consulting Engineers to I S Schofield Lockheed Martin Hanford Company May 31 1999
Notices of Construction NOC-I DOEIRL-93-40 Radioactive Air Emissions Program Notice of Construction Rotary Mode Core-Sampling
Truck and Exhauster Approved by Letter AIR 93-707 A W Conklin WDOH to J E Rasmussen DOEIRL 7893
NOC-2 DOEIRL-94-118 Rev 0 Radioactive Air Emissions Program Notice of Construction for the Rotary Mode Core-Sampling Systems Three and Four Approved by Letter AIR 95-603 A W Conklin WDOH to J E Rasmussen DOERL 63095
NOC-3 DOERL-94-118 Rev 1 Radioactive Air Emissions Program Notice of Construction for the Rotary Mode Core-Sampling Systems Three and Four Approved by Letter AIR 98-301 W W Conklin WDOH to I E Rasmussen DOEIRL 3698
NOC-4 DOEIRL-97-70 Radioactive Air Emissions Program Notice of Construction for Rotary Mode Core- Sampling in SX Tank Farm Approved by Letter AIR 97-1 101 A W Conklin WDOH to J E Rasmussen DOEIRL 113097
NOC-5 USEPA Letter OAQ-107 (no title approving DOE submittal 97-EAP-590 dated 72997) A J Frankel USEPA to J E Rasrnussen DOEIRL 8497
NOC-5 USEPA Letter OAQ-107rsquo (nb title approving DOE submittal 97-EAP-723 dated 101797) A J Frankel USEPA to J E Rasmussen DOERL 11498
Note that both letters have ldquoOAQ-107rdquo following ldquoReply to Attn ofrdquo
G-2
RPP-4826 Rev I
Work Packages WP-I ES-94-00808 WP-2 ES-95-00258 WP-3 ES-95-00045 - WP-4 ES-95-00434 - WP-5 ws-97-00173 - WP-6 WS-97-00174 - WP-7 ws-97-00143 - WP-8 WS-97-00144 - WP-9 WS-97-00207 - WP-I 1 WS-97-00208 - WP-12 WS-98-00049 - WP-13 WS-97-00050 - WP-14 WS-97-00224 - WP- I5 WS-97-00225 - WP-16 WS-97-00230 - WP- I7 ws-97-0023 1 - WP-18 ES-97-00452 - WP-19 ES-97-00453 - WP-20 WS-98-00072 - WP-21 WS-98-00073 - WP-22 WS-98-00067 - WP-23 WS-98-00068 -
241-BY-IO6 Perform Rotary Core Sample [Riser IOB] 241-BY-I IO Rotary Core Sample [Risers 12B 7 IZB 41 241-BY-IO8 Obtain Rotary Core Sample [Risers 12A amp 71 241-BY-IO5 Rotary Mode Core Sample [Riser 12A] 241-SX-101 Rotary Mode Core Sample Riser 19 241-SX-101 Rotary Mode Core Sample Riser4 241-SX-103 Rotary Mode Core Sample Riser 7 241-SX-103 Rotary Mode Core Sample Riser I I 241-SX-105 RMCST Obtain Core Sample Riser 6 241-SX-105 RMCST Core Sample Riser 14 241-SX-102 Rotary Mode Core Sample Riser 8 241-SX-102 Rotary Mode Core Sample Riser 4 241-S-1 IO RMCST Obtain Core Sample Riser 6 241-S-1 IO RMCST Obtain Core Sample Riser 14 2414-107 RMCSTCore Sample Riser 7 241-U-107 RMCST Core Sample Riser 2 241-BY-IO5 RMCST Core Sample Riser 7 241-BY-IO5 RMCST Core Sample Riser 1 IB 241-TX-113 Rotary Core Sample Riser 3 241-TX-113 RMCST Core Sample Riser 5 241-TX-I 18 RMCST Core Sample Riser 9B 241-TX-I 18 RMCST Core Sample Riser 128
G-3
RPP-4826 Rev 1
APPENDIX F - Rotary Mode Core Sampling Exhauster and Core Sample Data
This appendix provides the basic data obtained during RMCS operations which was used in preparation of this document
Basic Operational Data
There have been three RMCS exhausters and three RMCS sampling trucks deployed since starmp of nitrogen- purged RMCS in November 1994 The exhausters are formally designated 296-P-32296-P-33 and 296-P-34 These were originally referred to as parts of RMCS Systems 2 3 and 4 respectively in the Notices of Construction (NOC) for these units The exhauster designations were changed for routine field use in 1996 to exhausters A B and C to avoid confusion with core sampling trucks 23 and 4 since any exhauster could be used with any RMCS truck Exhauster A (2) and RMCS Truck2 have not been used for RMCS since 1995 and are no longer in service for core sampling
Rotary mode core sampling has been conducted in four general time frames since 1994 These time frames were separated by down times for equipment modifications or resolution of environmental permitting and safety concerns For ease of analysis in this document exhauster operations were organized into six distinct operating periods Periods I to 6 were grouped based upon times when the same exhauster and same set of HEPA filters were being used These periods thus overlap with the general operating time frames The four operating time frames were
The first time frame lasted from November 1994 to January 1995 RMCS Truck 2 and Exhauster 2 (A) were used on Tank BY-106 along with an in-tank prefilter This tank provided the initial deployment and testing of the nitrogen-purged equipment in a waste tank During this period radiation dose rates were taken at the side of the exhauster housing Stack record samples were taken in December 1994 and January 1995
The second time frame lasted from July 1995 through October 1995 RMCS Trucks 2 and 4 were used with Exhausters 2 and 3 (A and B) on BY-105 BY-IO8 and BY-I IO During this period radiation dose rates were taken at the sides of the exhauster housings Stack record samples were taken after completion of sampling on each tank No RMCS samples were taken from BY-108 all samples were taken in push mode for this tank
The third time frame began when RMCS was restarted in December 1997 Trucks 3 and 4 were used for sampling of SX-101 SX-103 SX-105 and SX-102 with the SX tank farm exhauster providing ventilation The RMCS exhausters were not used During this period radiation dose rates were taken at the sides of the SX exhauster housing as part of HPT routine surveys SX farm exhauster stack record samples were taken when required by normal operating procedures SX record sampler and filter housing dose rate data were not evaluated for this document It would not be practical using filter dose rate or stack record sample data to estimate the RMCS aerosol addition if any to the SX ventilation system The background radiation around the SX filter housing makes measurement of any small increase in dose rate very difficult to detect The number of tanks being ventilated and the involved off-gas header routings (the exhauster is pulling on thirteen tanks in series or in parallel with the tank being sampled) and any in-tank activities in the SX tanks not being sampled would make it impractical to assess what aerosols resulted from RMCS Beginning with RMCS in SX farm radionuclide analyses were performed on the filter papers protecting the CGMs which draw air out of the tank vapor space for flammable gas detection
The fourth time frame began in May 1998 Between 1095 and 598 Exhausters B and C were extensively modified with new filter housings and other equipment to meet new NOC requirements Trucks 3 and 4 were used with Exhausters B and C (3 and 4) on S-l IO U-107 BY-105 TX-113 and TX-I 18 This period marked the first use ofthe RMCS trucks and RMCS exhausters together following resolution of flammable gas concerns and modifications to the exhausters New filters were installed Radiation dose rates were taken at the sides of the exhauster housings Stack record samples
F- 1
RPP-4826 Rev I
were taken after completion of sampling for each exhauster installation Radionuclide analyses were performed on the CGM filter papers for all tanks except TX-118 An NDA was performed on the Exhauster C housing following completion ofthe first core on TX-I 13 The housing filters when assayed contained aerosols captured by the exhauster following RMCS in S-l IO U-107 BY-105 (1998) and the first core of TX-I 13 Another NDA was performed on Exhauster C following both cores in TX-I 18 An NDA was performed following sampling of the second core in TX-I 13 using Exhauster B The time frame ran through early June 1999 No RMCS samples have been taken after June 1999 nor are any planned for the next few years
For the purposes of evaluating aerosol formation based upon RMCS exhauster housing NDA and dose rate data the exhauster operations were grouped into 6 operating periods These periods are shown in Table F-1 and restated in Tables A-I and B-I All tanks sampled in Periods 1 2 4 5 and 6 were exhausted by the same exhauster with the same housing and filters present during that period Period 3 covered the time the SX exhauster was used during RMCS in SX farm
A brief description of each RMCS tank sampling operation is provided below
Tank 241-BY-1061194 to 1294 RMCS using the nitrogen purge gas system with an exhauster was formally begun on 111794 on tank BY-106 riser IOB Exhauster 2 (A)and Truck 2 were used A sintered metal prefilter was inserted in the riser between the tank and the exhauster A total of eight segments were taken in rotary mode and five segments in push mode until sampling was halted on 122194 One RMCS core was obtained The total exhauster run time was 4878 hours The stack record sample was removed and analyzed following this run period Dose rates taken at the side of the exhauster housing during RMCS were all lt05 mRhr The in-tank prefilter was smeared for contamination when removed from the tank with the smears showing less than detectable levels of radionuclides present (Waldo 1999) The prefilter had been washed with an installed spray system prior to removal from the tank but subsequent testing showed the water flow and pressure were too low to have been effective at removing contamination
Tank 241-BY-106195 Following some process modifications RMCS in BY-IO6 riser IOB began again on 11895 Exhauster 2 (A) and Truck 2 were used The sintered metal prefilter was inserted in the riser between the tank and the exhauster RMCS was halted on 12495 over authorization basis and equipment operability issues for RMCS A total of three segments were taken in rotary mode and eleven segments in push mode One RMCS core was obtained The total exhauster run time was 1867 hours The stack record sample was removed and analyzed following this run period Dose rates taken at the side of the exhauster housing during RMCS were all lt O S mRhr The in-tank prefilter was smeared for contamination when removed from the tank with the smears showing less than detectable levels of radionuclides present (Waldo 1999) The prefilter was not washed this time
Tank 241-BY-110795 to 1095 Following resolution of RMCS authorization basis and equipment issues and completion of the fabrication and testing of Trucks 3 and 4 RMCS was begun in BY-I IO on 71195 Exhauster 2 (A) and Truck 2 were used Samples were taken from risers 128 7 128 again and 4 There was no in- tank prefilter used in this or any subsequent RMCS periods Sampling was performed until 102595 when RMCS was halted over flammable gas issues A total of 13 RMCS segments and 56 PMCS segments were taken Three RMCS cores were obtained The total exhauster run time was 1125 hours The stack record sample was removed and analyzed following this run period Dose rates taken at the side of the exhauster housing during RMCS were all lt O S mRhr
Tank 241-BY-108795 to 895 Core sampling was begun in BY-IO8 on 72595 Exhauster 3 (B) and Truck 4 were used Sampling was done in risers 12A and 7 The tank material proved soft enough so that no RMCS segments were required all segments were obtained in push mode although the exhauster was operated during part of the time sampling was performed Sampling was completed 81895 A total of 16 PMCS segments were taken The total exhauster run time was 6617 hours The stack record sample was removed and
F-2
RPP-4826 Rev 1
analyzed following this run period Dose rates taken at the side of the exhauster housing during RMCS were all lt05 mRhr
Tank 241-BY-105895 to 1095 RMCS was begun in BY-I05 riser 12A on 83095 Exhauster 3 (B) and Truck 4 were used This tank has a concrete layer on top about 12-18 inches thick which had to be drilled through Part way through sampling questions arose as to the flammable gas status of the tank and RMCS was halted on 10695 A total of 3 RMCS and 7 PMCS segments were taken One RMCS core was obtained The total exhauster run time was 4413 hours The stack record sample was removed and analyzed following this run period Dose rates taken at the side of the exhauster housing during RMCS were all lt05 mRhr
Tank 241-SX-1011297 to 298 Following resolution of extensive regulatory and authorization basis issues and installation of equipment modifications RMCS started in SX-101 with Truck 4 on 12497 An RMCS exhauster was not used since all SX farm tanks excluding SX-113 and SX-I 15 are ventilated with the SX exhauster Sampling was performed in risers 19 and 4 and was completed on 21098 A total of 9 RMCS and 6 PMCS segments were taken Two RMCS cores were obtained SX exhauster stack record samples and filter housing dose rates were obtained as part of routine operations for the SX exhauster not as part of the RMCS process Filter papers used in the suction line for the CGM were saved and analyzed in the laboratory to estimate the airborne radionuclide concentration in the tank head space Two CGM filter papers were needed for each core as moisture in the tank vapors condensed on the papers in the cold weather and began to restrict tank gas flow to the CGM
Tank 241-SX-103498 to 598 RMCS started in SX-103 with Truck 4 on 42798 The SX exhauster was used for ventilation (see SX- 101 above) Sampling was performed in risers 7 and 1 1 and was completed on 51198 A total of 6 RMCS and 18 PMCS segments were taken Two RMCS cores were obtained During sampling filter papers used in the suction line for the CGM were saved and analyzed in the laboratory to estimate the airborne radionuclide concentration in the tank head space One CGM filter paper was used during each core SX exhauster stack record samples and filter housing dose rates were obtained as part of routine operations for the SX exhauster not as part of the RMCS process
Tank 241-SX-105298 to 598 RMCS started in SX-105 with Truck 3 on 22598 The SX exhauster was used for ventilation (see SX- 101 above) Sampling was performed in risers 6 and 14 and was completed on 51598 A total of 6 RMCS and 20 PMCS segments were taken Two RMCS cores were obtained During sampling filter papers used in the suction line for the CGM were saved and analyzed in the laboratory to estimate the airborne radionuclide concentration in the tank head space Two filter papers were needed for the first core as moisture in the tank vapors condensed on the papers in the cold weather and began to restrict tank gas flow to the CGM One filter paper was used for the second core SX exhauster stack record samples and filter housing dose rates were obtained as part of routine operations for the SX exhauster not as part of the RMCS process
Tank 241-SX-102698 to 798 RMCS started in SX-102 with Truck 4 on 61798 The SX exhauster was used for ventilation (see SX- 101 above) Sampling was performed in risers 8 and 4 and was completed on 7798 A total of 2 RMCS and I8 PMCS segments were taken Two RMCS cores were obtained During sampling filter papers used in the suction line for the CGM were saved and analyzed in the laboratory to estimate the airborne radionuclide concentration in the tank head space One filter paper was used for each core SX exhauster stack record samples and filter housing dose rates were obtained as part of routine operations for the SX exhauster not as part of the RMCS process
Tank 241-S-110598 to 698 RMCS was begun in S-I10 on 51898 Exhauster C (4) and Truck 3 were used This tank marked the first use of an RMCS exhauster since 1995 Sampling was completed on 6498 Risers 6 and 14 were sampled A total of IO RMCS and 8 PMCS segments were taken Two RMCS cores were obtained The
F-3
RPP-4826 Rev I
total exhauster run time was 15978 hours The stack record sample was removed and analyzed following this run period Dose rates taken at the side of the exhauster housing during RMCS were all lt05 mRhr During sampling filter papers used in the suction line for the CGM were saved and analyzed in the laboratory to estimate the airborne radionuclide concentration in the tank head space One filter paper was used for each core Waste particles retained on the exhauster housing filters were part of the inventory subsequently measured by NDA following completion of the first core in TX-I 13
Tank 241-U-107698 to 798 RMCS was begun in U-107 on 61098 Exhauster C and Trucks 3 and 4 were used Sampling was completed on 71598 Risers 7 and 2 were sampled A total of IO RMCS and 19 PMCS segments were taken Two RMCS cores were obtained The total exhauster run time was 27385 hours The stack record sample was removed and analyzed following this run period Dose rates taken at the side of the exhauster housing during RMCS were all 105 mRihr During sampling filter papers used in the suction line for the CGM were saved and analyzed in the laboratory to estimate the airborne radionuclide concentration in the tank head space One filter paper was used for each core Waste particles retained on the exhauster housing filters were part of the inventory subsequently measured by NDA following completion of the first core in TX-I 13
Tank 24l-BY-105798 to 898 RMCS was begun in BY-105 again on 72298 Exhauster C and Trucks 3 and 4 were used Sampling was completed on 82598 Risers 7 and 1 1 B were sampled A total of 18 RMCS and 18 PMCS segments were taken The material was hard enough to require rotary mode sampling all the way to the bottom of the waste but negligible recovery was obtained After RMCS was performed to the waste bottom a PMCS core was taken in the same hole to recover material Two RMCS cores were obtained The exhauster run time was 13577 hours for the first RMCS core and 30792 hours for the second RMCS core Stack record sample information in ABCASH shows 30558 hours operation for the second core but the sampler data sheet shows the time counter was mistakenly reset 234 hours into the run No correction was made to the BY-IO5 2nd core record sample concentration for this document since the error is conservative and results in only slightly higher (ltI) record sample radionuclide concentrations for this core A stack record sample was removed and analyzed following each core giving two record samples for BY-IO5 in 1998 Dose rates taken at the side of the exhauster housing during RMCS were almost all lt05 m R h but a few readings indicated 07 mRihr This variation was assumed due to personnel reading the instrument differently or the fact that the exhauster had been used on enough tanks that by now there was sufficient activity on the filters to cause readings approximately at the background detection level The final reading when both cores were completed was lt05 m R h During sampling filter papers used in the suction line for the CGM were saved and analyzed in the laboratory to estimate the airborne radionuclide concentration in the tank head space One filter paper was used for each core Waste particles retained on the exhauster housing filters were part of the inventory subsequently measured by NDA following completion of the first core in TX-113
Tank 241-TX-113998 to 599 Core sampling was begun in TX-I 13 riser 3 on 92298 Exhauster B (3) and Truck 4 were used at the start This was the first use of Exhauster B since it was modified Exhauster B ran for a total of 8738 hours until being disconnected on 102398 During this time two PMCS segments were taken and no RMCS segments Exhauster C was then installed and operated for 5598 hours from 121098 to 122898 No RMCS or PMCS sampling was performed during this time frame RMCS segments werent taken until 299 Exhauster C ran for a 30230 hours between 122898 and 21299 Sampling was completed on the core from riser 3 on 21299 A total of 12 RMCS segments were obtained during the time Exhauster C was operating Exhauster flow rate for both exhausters was a nominal 200 scfm Stack record samples were taken following Exhauster B removal at the end of 1998 for Exhauster C and following completion ofthe first core with Exhauster C Aerosol calculations were based on only the 30230 hours run time for Exhauster C in 1999 since this was the time period during which RMCS segments were obtained Dose rates taken at the side of the exhauster housing during the short PMCS only sampling period with Exhauster B were all ltOS m R h Dose rates with Exhauster C varied between lt O S mRhr and 07 mRhr The final reading on Exhauster C following completion of the first core was 07 mFUhr During sampling filter papers used in the suction line for the CGM were saved and
F-4
RPP-4826 Rev I
analyzed in the laboratory to estimate the airborne radionuclide concentration in the tank head space One filter paper was used for the core Waste particles retained on the exhauster housing filters were part of the inventory subsequently measured by NDA following completion of this core
Sampling in riser 5 was begun on 41299 using Exhauster B and Truck 3 A total of 6 RMCS and 1 PMCS segments were taken for this core before sampling was halted on 42899 The total exhauster run time for this core was 11712 hours Problems with high vacuum in the tank required the exhauster flow rate to be reduced to 190 scfm to keep the system within pressure limits The stack record sample for the second core was removed and analyzed following the run period Dose rates taken at the side of the exhauster housing during the second core were all lt05 m M r During sampling filter papers used in the suction line for the CGM were saved and analyzed in the laboratory to estimate the airborne radionuclide concentration in the tank head space One filter paper was used An NDA was performed on the exhauster housing following this core The only radionuclides present in the housing were those from this core or what was removed from the tank head space during the non-RMCS activities in this tank from 92298 and 102398
Some clarification may be needed to explain use of the exhauster operating times and NDA dose rate and record sample data obtained during core sampling on TX-I 13 Core sampling was set up for sampling riser 3 on TX-113 in September 1998 with Exhauster B Exhauster B operated for a total of 8738 hours between 92298 and 102298 The stack record sample was removed at the end of this period The ERS database incorrectly shows the exhauster operated between 111698 and 111998 The ABCASH database shows the stack record sample was removed on 111998 The stack record sample showed positive emuent concentrations during this time period with variances 400 No RMCS samples were taken during this period so the data and time werenrsquot included when calculating RMCS aerosol numbers Exhauster B was removed and Exhauster C installed in late November-early December Exhauster C was operated for a total of 5559 hours between 121098 and 122398 The stack record sample was removed on 122898 No sampling was performed during this period so the data and time werenrsquot included when calculating RMCS aerosol numbers Exhauster C was operated for a total of 30218 hours between 122898 and 2899 All the RMCS segments from riser 3 were taken in this time period so only the data and time for this period were included when calculating RMCS aerosol numbers Exhauster B was used during sampling of riser 5 Exhauster B operated for a total of 11712 hours between 41299 and 42899
Tank 241-TX-l18599 to 699 RMCS was begun in TX-I 18 on 5699 Exhauster C (4) and Truck 4 were used Sampling was completed on 6298 Risers 9B and 12B were sampled A total of 9 RMCS segments were taken there were no PMCS segments Two RMCS cores were obtained The total exhauster run time was 21247 hours The stack record sample was removed and analyzed following this run period The maximum dose rate taken at the side of the exhauster housing following RMCS was 08 m M r CGM filter papers were not analyzed An NDA was performed on the exhauster housing following completion of the two cores The exhauster housing contained the same nuclides as for the first NDA (S-110 U-107 BY-105 and TX-I 13 first core) plus those from TX-I 18
The basic core sampling operational data used in this document includes the number of RMCS cores and segments the exhauster run times and flow rates the RMCS exhauster HEPA filter dose rates and tank vapor space temperatures Table F-l lists the basic operational data This information excluding tank vapor space temperature data was obtained from procedural data sheets in the sampling work packages (References W - 1 to WP-23)
Tank temperature data for the tanks ventilated with the RMCS exhausters was obtained from the TWINS database Plots for each tank were prepared for the time RMCS was conducted and the average value of the highest thermocouple located in the tank (the lowest temperature reading) was estimated and used as the average tank head space temperature during the RMCS period
The SX exhauster flow rates listed in Table F-l are estimates only The combined flow rate for SX-IO1 through SX-106 plus SX-109 (7 tanks) averaged 440 cfm during CY 1996 (Kaiser 1997) for an average of 63 cfm per
F-5
RPP-4826 Rev I
tank Based upon inlet flow measurements at the tank inlet HEPA filters (Fanis 1998) the flow through each individual tank (SX-IO1 through SX-106 plus SX-109) was lt55 cfm at the breather filter Assuming an exhaust flow of 100 cfm for each SX farm tank sampled is therefore conservative
Calculated Data
Calculated data include the tank head space volumes conversion of the RMCS exhauster flow rate from scfm to acfm and the number of tank head space changeouts made by an exhauster during RMCS
Tank head space volume includes the dome space volume above the top of the sidewall plus the void space between the waste surface and the top of the sidewall The formula used to calculate tank head space volumes WN
Head Space Volume in A = (DS + [(H) (12) + HI + Hb - H] (V)) - 748
Where DS = dome space volume gal H = height of tank body sidewall above knuckle A HI = height of tank knuckle area in Hb = height oftank bottom below knuckle in H = height of waste in tank in V =27555 galin of waste in SX tanks 2754 gallin in all others
The tank dome space volumes height of tank sidewall above the knuckle height of tank knuckle area and height of tank bottom below the knuckle were obtained from Reynolds 1999 The height of waste in each tank at the time of core sampling was obtained from the TWINS database Tank dimensional and waste level data are given in Table F-2 along with the calculated tank head space volumes
Aerosol calculations for Appendices A-C require exhauster flow rates in actual cubic feet per minute The RMCS exhauster flow rate is controlled and recorded in standard cubic feet per minute The mass flow rate of the exhauster air is measured and internal logic in the exhauster controller calculates what the volumetric flow rate would be if the temperature and pressure in the exhauster inlet were at standard conditions The standard conditions used in the logic controller are 29921 in Hg (760 mm Hg) and 69F (ZIT)
A correction factor is built into the exhauster control logic that assumes an atmospheric pressure of 2927 in Hg the average atmospheric pressure at Hanford The RMCS exhauster will operate at about 1-2 in H20 negative pressure resulting in about a 2916 in Hg pressure in a waste tank when the RMCS exhauster is operating To revise the indicated scfm RMCS exhauster reading to an acfm value the RMCS exhauster scfm flaw rate was multiplied by (29922916)(T+459)528 where Tis the tank head space temperature in OF The tank head space temperatures in Table F-1 were input to the spreadsheet file used for aerosol calculations and converted to acfm The flow rates in acfm are included in Table F-I
The tank head space changeouts when using the RMCS exhauster were calculated by multiplying the exhauster acfm flow rate by the time of exhauster operation and dividing the result by the tank head space volume Tank head space changeouts are listed in Table F-2
F-6
c
gt 2
RPP-4826 Rev 1
APPENDIX G
REFERENCES
G-0
RPP-4826 Rev 1
APPENDIX G - References
Diedeker 1999 NDA of RMCS HEPA Filters L P Diedeker WMH E-Mail to JS Schofield CHG November 29 I999
ERDA 1976 Nuclear Air Cleaning Handbook ERDA 76-21 Buchsted C A Fuller A B and Kahn 1 E Oak Ridge National Laboratory 1976
Farris 1998 Internal Note T R Farris LMHC to J S Schofield LMHC Breather Filter Flow Rates for SX-Farm 31698
Foust 1999 Internal Memo RMCST Exhauster HEPA Filter Dose Rate Calculations D J Foust LMHC to J S Schofield LMHC October 25 1999
Greager 1999 Correspondence No WMH-9954450 Non-Destructive Analysis of the Rotay Mode Core Sample High-Efjiciency Particulate Air Filters E M Greager WMH to P C Miller LMHC June 28 1999 [Transmittal of HNF-4199 Resultsfram NDA Measurement of the 296-P-34 RMCS HEPA Filters]
HNF 1999 HNF-SD-WM-SAR-067 Tank Waste Remediation System Final Safety Analysis Report Rev 1 The revision incorporating RMCS accident analyses was submitted as Addendum 5 to DOE as a change to the FSAR predecessor the Basis for Interim Operation (BIO) LMHC-9857075 80232764-9-KOOl Submittal of Authorization Basis Amendment Package for Rotay and Push Mode Core Sampling in Satisfaction of Perfarmance Agreement TWR 122 Expectations I and 3 D 1 Allen LMHC to A M Umek FDH August 30 1998 Addendum 5 as of mid-January 2000 is waiting for approval by DOE
Kaiser 1997 T D Kaiser LMHC E-Mail to J S Schofield LMHC SX Tank Flow Data 42197
NUREG 1995 Potential Radionuclide Emissionsfrom Stacks on the HanfordSite Part I Dose Assessment Davis W E and Barnett J M Westinghouse Hanford Company from Proceedings of the 23 DOEMRC Nuclear Air Cleaning Conference held July 25-28 1994 February 1995
Schofield 2000a Letter 74910-00-002 Use of Microshield Calculations for RMCS Exhauster Housing for Estimating Radionuclide Quantities on the Filters Using NDA and Dose Rate Measurements I S Schofield CHG to File January 62000
Schofield 2000b Letter 74910-00-003 Rev I RMCS Exhauster Stack RecordSample Data J S Schofield CHG to File January 202000
Reynolds 1999 D R Reynolds LMHC E-Mail to I S Schofield LMHC transmitting Tank Volume Calculations draft of calculations done by Mike Plesha and Reed Hendershot data to be used for RESOLVE computer program for Hanford waste tanks August 3 1999
TWINS Tank Waste Information Network System database available at httptwinspnlgovSOO lhtbinTCDgetTableListexe
Waldo 1999 letter 74910-99-009 RMCS Exhauster Aerosol Test Data E I Waldo to J S Schofield June 22 1999
WHC 1993 WHC-SD-WM-ES-225 Rev I AerosolStudy for the Rotary Mode Exhauster P M Francis Westinghouse Hanford Company April 20 1993
WHC 1997 WHC-SD-WM-SAD-035 Rev Ob A Safety Assessment of Rotary Mode Core Sampling in Flammable Gas Single Shell Tanks Hanford Site Richland Washington August 8 1997
G- I
RPP-4826 Rev I
CGM Data CGM-I Letter PARTICULATE SAMPLING OF 241-SX-IO1 DURING ROTARY MODE CORE SAMPLING D C
Langlois E2 Consulting Engineers to J S Schofield Lockheed Martin Hanford Company March 16 1998
CGM-2 Letter PARTICULATE SAMPLING OF 241-SX-I05 DURING ROTARY MODE CORE SAMPLING D C Langlois E2 Consulting Engineers to J S Schofield Lockheed Martin Hanford Company June 9 1998
CGM-3 Letter PARTICULATE SAMPLING OF 241-SX-103 DURING ROTARY MODE CORE SAMPLING D C Langlois E2 Consulting Engineers to J S Schofield Lockheed Martin Hanford Company June 12 1998
CGM-4 Letter PARTICULATE SAMPLING OF 241-S-110 DURING ROTARYMODE CORESAMPLING D C Langlois E2 Consulting Engineers to J S Schofield Lockheed Martin Hanford Company July 20 1998
CGM-5 Letter PARTICULATE SAMPLING OF 241-SX-102 DURING ROTARY MODE CORE SAMPLING D C Langlois E2 Consulting Engineers to J S Schofield Lockheed Martin Hanford Company July 22 1998
CGM-6 Letter PARTICULATE SAMPLING OF241-U-107 DURING ROTARY MODE CORE SAMPLING D C Langlois E2 Consulting Engineers to J S Schofield Lockheed Martin Hanford Company August 3 1998
CGM-7 Letter PARTICULATE SAMPLING OF 241-BY-105 DURING ROTARY MODE CORESAMPLING D C Langlois E2 Consulting Engineers to 1 S Schofield Lockheed Martin Hanford Company September 17 1998
CGM-8 Letter PARTICULATE SAMPLING OF 241-TX-I13 DURING ROTARY MODE CORESAMPLING D C Langlois E2 Consulting Engineers to J S Schofield Lockheed Martin Hanford Company March 15 1999
CGM-9 Letter PARTICULATE SAMPLING OF 241-TX-113 DURING ROTARY MODE CORE SAMPLING D C Langlois E2 Consulting Engineers to I S Schofield Lockheed Martin Hanford Company May 31 1999
Notices of Construction NOC-I DOEIRL-93-40 Radioactive Air Emissions Program Notice of Construction Rotary Mode Core-Sampling
Truck and Exhauster Approved by Letter AIR 93-707 A W Conklin WDOH to J E Rasmussen DOEIRL 7893
NOC-2 DOEIRL-94-118 Rev 0 Radioactive Air Emissions Program Notice of Construction for the Rotary Mode Core-Sampling Systems Three and Four Approved by Letter AIR 95-603 A W Conklin WDOH to J E Rasmussen DOERL 63095
NOC-3 DOERL-94-118 Rev 1 Radioactive Air Emissions Program Notice of Construction for the Rotary Mode Core-Sampling Systems Three and Four Approved by Letter AIR 98-301 W W Conklin WDOH to I E Rasmussen DOEIRL 3698
NOC-4 DOEIRL-97-70 Radioactive Air Emissions Program Notice of Construction for Rotary Mode Core- Sampling in SX Tank Farm Approved by Letter AIR 97-1 101 A W Conklin WDOH to J E Rasmussen DOEIRL 113097
NOC-5 USEPA Letter OAQ-107 (no title approving DOE submittal 97-EAP-590 dated 72997) A J Frankel USEPA to J E Rasrnussen DOEIRL 8497
NOC-5 USEPA Letter OAQ-107rsquo (nb title approving DOE submittal 97-EAP-723 dated 101797) A J Frankel USEPA to J E Rasmussen DOERL 11498
Note that both letters have ldquoOAQ-107rdquo following ldquoReply to Attn ofrdquo
G-2
RPP-4826 Rev I
Work Packages WP-I ES-94-00808 WP-2 ES-95-00258 WP-3 ES-95-00045 - WP-4 ES-95-00434 - WP-5 ws-97-00173 - WP-6 WS-97-00174 - WP-7 ws-97-00143 - WP-8 WS-97-00144 - WP-9 WS-97-00207 - WP-I 1 WS-97-00208 - WP-12 WS-98-00049 - WP-13 WS-97-00050 - WP-14 WS-97-00224 - WP- I5 WS-97-00225 - WP-16 WS-97-00230 - WP- I7 ws-97-0023 1 - WP-18 ES-97-00452 - WP-19 ES-97-00453 - WP-20 WS-98-00072 - WP-21 WS-98-00073 - WP-22 WS-98-00067 - WP-23 WS-98-00068 -
241-BY-IO6 Perform Rotary Core Sample [Riser IOB] 241-BY-I IO Rotary Core Sample [Risers 12B 7 IZB 41 241-BY-IO8 Obtain Rotary Core Sample [Risers 12A amp 71 241-BY-IO5 Rotary Mode Core Sample [Riser 12A] 241-SX-101 Rotary Mode Core Sample Riser 19 241-SX-101 Rotary Mode Core Sample Riser4 241-SX-103 Rotary Mode Core Sample Riser 7 241-SX-103 Rotary Mode Core Sample Riser I I 241-SX-105 RMCST Obtain Core Sample Riser 6 241-SX-105 RMCST Core Sample Riser 14 241-SX-102 Rotary Mode Core Sample Riser 8 241-SX-102 Rotary Mode Core Sample Riser 4 241-S-1 IO RMCST Obtain Core Sample Riser 6 241-S-1 IO RMCST Obtain Core Sample Riser 14 2414-107 RMCSTCore Sample Riser 7 241-U-107 RMCST Core Sample Riser 2 241-BY-IO5 RMCST Core Sample Riser 7 241-BY-IO5 RMCST Core Sample Riser 1 IB 241-TX-113 Rotary Core Sample Riser 3 241-TX-113 RMCST Core Sample Riser 5 241-TX-I 18 RMCST Core Sample Riser 9B 241-TX-I 18 RMCST Core Sample Riser 128
G-3
RPP-4826 Rev I
were taken after completion of sampling for each exhauster installation Radionuclide analyses were performed on the CGM filter papers for all tanks except TX-118 An NDA was performed on the Exhauster C housing following completion ofthe first core on TX-I 13 The housing filters when assayed contained aerosols captured by the exhauster following RMCS in S-l IO U-107 BY-105 (1998) and the first core of TX-I 13 Another NDA was performed on Exhauster C following both cores in TX-I 18 An NDA was performed following sampling of the second core in TX-I 13 using Exhauster B The time frame ran through early June 1999 No RMCS samples have been taken after June 1999 nor are any planned for the next few years
For the purposes of evaluating aerosol formation based upon RMCS exhauster housing NDA and dose rate data the exhauster operations were grouped into 6 operating periods These periods are shown in Table F-1 and restated in Tables A-I and B-I All tanks sampled in Periods 1 2 4 5 and 6 were exhausted by the same exhauster with the same housing and filters present during that period Period 3 covered the time the SX exhauster was used during RMCS in SX farm
A brief description of each RMCS tank sampling operation is provided below
Tank 241-BY-1061194 to 1294 RMCS using the nitrogen purge gas system with an exhauster was formally begun on 111794 on tank BY-106 riser IOB Exhauster 2 (A)and Truck 2 were used A sintered metal prefilter was inserted in the riser between the tank and the exhauster A total of eight segments were taken in rotary mode and five segments in push mode until sampling was halted on 122194 One RMCS core was obtained The total exhauster run time was 4878 hours The stack record sample was removed and analyzed following this run period Dose rates taken at the side of the exhauster housing during RMCS were all lt05 mRhr The in-tank prefilter was smeared for contamination when removed from the tank with the smears showing less than detectable levels of radionuclides present (Waldo 1999) The prefilter had been washed with an installed spray system prior to removal from the tank but subsequent testing showed the water flow and pressure were too low to have been effective at removing contamination
Tank 241-BY-106195 Following some process modifications RMCS in BY-IO6 riser IOB began again on 11895 Exhauster 2 (A) and Truck 2 were used The sintered metal prefilter was inserted in the riser between the tank and the exhauster RMCS was halted on 12495 over authorization basis and equipment operability issues for RMCS A total of three segments were taken in rotary mode and eleven segments in push mode One RMCS core was obtained The total exhauster run time was 1867 hours The stack record sample was removed and analyzed following this run period Dose rates taken at the side of the exhauster housing during RMCS were all lt O S mRhr The in-tank prefilter was smeared for contamination when removed from the tank with the smears showing less than detectable levels of radionuclides present (Waldo 1999) The prefilter was not washed this time
Tank 241-BY-110795 to 1095 Following resolution of RMCS authorization basis and equipment issues and completion of the fabrication and testing of Trucks 3 and 4 RMCS was begun in BY-I IO on 71195 Exhauster 2 (A) and Truck 2 were used Samples were taken from risers 128 7 128 again and 4 There was no in- tank prefilter used in this or any subsequent RMCS periods Sampling was performed until 102595 when RMCS was halted over flammable gas issues A total of 13 RMCS segments and 56 PMCS segments were taken Three RMCS cores were obtained The total exhauster run time was 1125 hours The stack record sample was removed and analyzed following this run period Dose rates taken at the side of the exhauster housing during RMCS were all lt O S mRhr
Tank 241-BY-108795 to 895 Core sampling was begun in BY-IO8 on 72595 Exhauster 3 (B) and Truck 4 were used Sampling was done in risers 12A and 7 The tank material proved soft enough so that no RMCS segments were required all segments were obtained in push mode although the exhauster was operated during part of the time sampling was performed Sampling was completed 81895 A total of 16 PMCS segments were taken The total exhauster run time was 6617 hours The stack record sample was removed and
F-2
RPP-4826 Rev 1
analyzed following this run period Dose rates taken at the side of the exhauster housing during RMCS were all lt05 mRhr
Tank 241-BY-105895 to 1095 RMCS was begun in BY-I05 riser 12A on 83095 Exhauster 3 (B) and Truck 4 were used This tank has a concrete layer on top about 12-18 inches thick which had to be drilled through Part way through sampling questions arose as to the flammable gas status of the tank and RMCS was halted on 10695 A total of 3 RMCS and 7 PMCS segments were taken One RMCS core was obtained The total exhauster run time was 4413 hours The stack record sample was removed and analyzed following this run period Dose rates taken at the side of the exhauster housing during RMCS were all lt05 mRhr
Tank 241-SX-1011297 to 298 Following resolution of extensive regulatory and authorization basis issues and installation of equipment modifications RMCS started in SX-101 with Truck 4 on 12497 An RMCS exhauster was not used since all SX farm tanks excluding SX-113 and SX-I 15 are ventilated with the SX exhauster Sampling was performed in risers 19 and 4 and was completed on 21098 A total of 9 RMCS and 6 PMCS segments were taken Two RMCS cores were obtained SX exhauster stack record samples and filter housing dose rates were obtained as part of routine operations for the SX exhauster not as part of the RMCS process Filter papers used in the suction line for the CGM were saved and analyzed in the laboratory to estimate the airborne radionuclide concentration in the tank head space Two CGM filter papers were needed for each core as moisture in the tank vapors condensed on the papers in the cold weather and began to restrict tank gas flow to the CGM
Tank 241-SX-103498 to 598 RMCS started in SX-103 with Truck 4 on 42798 The SX exhauster was used for ventilation (see SX- 101 above) Sampling was performed in risers 7 and 1 1 and was completed on 51198 A total of 6 RMCS and 18 PMCS segments were taken Two RMCS cores were obtained During sampling filter papers used in the suction line for the CGM were saved and analyzed in the laboratory to estimate the airborne radionuclide concentration in the tank head space One CGM filter paper was used during each core SX exhauster stack record samples and filter housing dose rates were obtained as part of routine operations for the SX exhauster not as part of the RMCS process
Tank 241-SX-105298 to 598 RMCS started in SX-105 with Truck 3 on 22598 The SX exhauster was used for ventilation (see SX- 101 above) Sampling was performed in risers 6 and 14 and was completed on 51598 A total of 6 RMCS and 20 PMCS segments were taken Two RMCS cores were obtained During sampling filter papers used in the suction line for the CGM were saved and analyzed in the laboratory to estimate the airborne radionuclide concentration in the tank head space Two filter papers were needed for the first core as moisture in the tank vapors condensed on the papers in the cold weather and began to restrict tank gas flow to the CGM One filter paper was used for the second core SX exhauster stack record samples and filter housing dose rates were obtained as part of routine operations for the SX exhauster not as part of the RMCS process
Tank 241-SX-102698 to 798 RMCS started in SX-102 with Truck 4 on 61798 The SX exhauster was used for ventilation (see SX- 101 above) Sampling was performed in risers 8 and 4 and was completed on 7798 A total of 2 RMCS and I8 PMCS segments were taken Two RMCS cores were obtained During sampling filter papers used in the suction line for the CGM were saved and analyzed in the laboratory to estimate the airborne radionuclide concentration in the tank head space One filter paper was used for each core SX exhauster stack record samples and filter housing dose rates were obtained as part of routine operations for the SX exhauster not as part of the RMCS process
Tank 241-S-110598 to 698 RMCS was begun in S-I10 on 51898 Exhauster C (4) and Truck 3 were used This tank marked the first use of an RMCS exhauster since 1995 Sampling was completed on 6498 Risers 6 and 14 were sampled A total of IO RMCS and 8 PMCS segments were taken Two RMCS cores were obtained The
F-3
RPP-4826 Rev I
total exhauster run time was 15978 hours The stack record sample was removed and analyzed following this run period Dose rates taken at the side of the exhauster housing during RMCS were all lt05 mRhr During sampling filter papers used in the suction line for the CGM were saved and analyzed in the laboratory to estimate the airborne radionuclide concentration in the tank head space One filter paper was used for each core Waste particles retained on the exhauster housing filters were part of the inventory subsequently measured by NDA following completion of the first core in TX-I 13
Tank 241-U-107698 to 798 RMCS was begun in U-107 on 61098 Exhauster C and Trucks 3 and 4 were used Sampling was completed on 71598 Risers 7 and 2 were sampled A total of IO RMCS and 19 PMCS segments were taken Two RMCS cores were obtained The total exhauster run time was 27385 hours The stack record sample was removed and analyzed following this run period Dose rates taken at the side of the exhauster housing during RMCS were all 105 mRihr During sampling filter papers used in the suction line for the CGM were saved and analyzed in the laboratory to estimate the airborne radionuclide concentration in the tank head space One filter paper was used for each core Waste particles retained on the exhauster housing filters were part of the inventory subsequently measured by NDA following completion of the first core in TX-I 13
Tank 24l-BY-105798 to 898 RMCS was begun in BY-105 again on 72298 Exhauster C and Trucks 3 and 4 were used Sampling was completed on 82598 Risers 7 and 1 1 B were sampled A total of 18 RMCS and 18 PMCS segments were taken The material was hard enough to require rotary mode sampling all the way to the bottom of the waste but negligible recovery was obtained After RMCS was performed to the waste bottom a PMCS core was taken in the same hole to recover material Two RMCS cores were obtained The exhauster run time was 13577 hours for the first RMCS core and 30792 hours for the second RMCS core Stack record sample information in ABCASH shows 30558 hours operation for the second core but the sampler data sheet shows the time counter was mistakenly reset 234 hours into the run No correction was made to the BY-IO5 2nd core record sample concentration for this document since the error is conservative and results in only slightly higher (ltI) record sample radionuclide concentrations for this core A stack record sample was removed and analyzed following each core giving two record samples for BY-IO5 in 1998 Dose rates taken at the side of the exhauster housing during RMCS were almost all lt05 m R h but a few readings indicated 07 mRihr This variation was assumed due to personnel reading the instrument differently or the fact that the exhauster had been used on enough tanks that by now there was sufficient activity on the filters to cause readings approximately at the background detection level The final reading when both cores were completed was lt05 m R h During sampling filter papers used in the suction line for the CGM were saved and analyzed in the laboratory to estimate the airborne radionuclide concentration in the tank head space One filter paper was used for each core Waste particles retained on the exhauster housing filters were part of the inventory subsequently measured by NDA following completion of the first core in TX-113
Tank 241-TX-113998 to 599 Core sampling was begun in TX-I 13 riser 3 on 92298 Exhauster B (3) and Truck 4 were used at the start This was the first use of Exhauster B since it was modified Exhauster B ran for a total of 8738 hours until being disconnected on 102398 During this time two PMCS segments were taken and no RMCS segments Exhauster C was then installed and operated for 5598 hours from 121098 to 122898 No RMCS or PMCS sampling was performed during this time frame RMCS segments werent taken until 299 Exhauster C ran for a 30230 hours between 122898 and 21299 Sampling was completed on the core from riser 3 on 21299 A total of 12 RMCS segments were obtained during the time Exhauster C was operating Exhauster flow rate for both exhausters was a nominal 200 scfm Stack record samples were taken following Exhauster B removal at the end of 1998 for Exhauster C and following completion ofthe first core with Exhauster C Aerosol calculations were based on only the 30230 hours run time for Exhauster C in 1999 since this was the time period during which RMCS segments were obtained Dose rates taken at the side of the exhauster housing during the short PMCS only sampling period with Exhauster B were all ltOS m R h Dose rates with Exhauster C varied between lt O S mRhr and 07 mRhr The final reading on Exhauster C following completion of the first core was 07 mFUhr During sampling filter papers used in the suction line for the CGM were saved and
F-4
RPP-4826 Rev I
analyzed in the laboratory to estimate the airborne radionuclide concentration in the tank head space One filter paper was used for the core Waste particles retained on the exhauster housing filters were part of the inventory subsequently measured by NDA following completion of this core
Sampling in riser 5 was begun on 41299 using Exhauster B and Truck 3 A total of 6 RMCS and 1 PMCS segments were taken for this core before sampling was halted on 42899 The total exhauster run time for this core was 11712 hours Problems with high vacuum in the tank required the exhauster flow rate to be reduced to 190 scfm to keep the system within pressure limits The stack record sample for the second core was removed and analyzed following the run period Dose rates taken at the side of the exhauster housing during the second core were all lt05 m M r During sampling filter papers used in the suction line for the CGM were saved and analyzed in the laboratory to estimate the airborne radionuclide concentration in the tank head space One filter paper was used An NDA was performed on the exhauster housing following this core The only radionuclides present in the housing were those from this core or what was removed from the tank head space during the non-RMCS activities in this tank from 92298 and 102398
Some clarification may be needed to explain use of the exhauster operating times and NDA dose rate and record sample data obtained during core sampling on TX-I 13 Core sampling was set up for sampling riser 3 on TX-113 in September 1998 with Exhauster B Exhauster B operated for a total of 8738 hours between 92298 and 102298 The stack record sample was removed at the end of this period The ERS database incorrectly shows the exhauster operated between 111698 and 111998 The ABCASH database shows the stack record sample was removed on 111998 The stack record sample showed positive emuent concentrations during this time period with variances 400 No RMCS samples were taken during this period so the data and time werenrsquot included when calculating RMCS aerosol numbers Exhauster B was removed and Exhauster C installed in late November-early December Exhauster C was operated for a total of 5559 hours between 121098 and 122398 The stack record sample was removed on 122898 No sampling was performed during this period so the data and time werenrsquot included when calculating RMCS aerosol numbers Exhauster C was operated for a total of 30218 hours between 122898 and 2899 All the RMCS segments from riser 3 were taken in this time period so only the data and time for this period were included when calculating RMCS aerosol numbers Exhauster B was used during sampling of riser 5 Exhauster B operated for a total of 11712 hours between 41299 and 42899
Tank 241-TX-l18599 to 699 RMCS was begun in TX-I 18 on 5699 Exhauster C (4) and Truck 4 were used Sampling was completed on 6298 Risers 9B and 12B were sampled A total of 9 RMCS segments were taken there were no PMCS segments Two RMCS cores were obtained The total exhauster run time was 21247 hours The stack record sample was removed and analyzed following this run period The maximum dose rate taken at the side of the exhauster housing following RMCS was 08 m M r CGM filter papers were not analyzed An NDA was performed on the exhauster housing following completion of the two cores The exhauster housing contained the same nuclides as for the first NDA (S-110 U-107 BY-105 and TX-I 13 first core) plus those from TX-I 18
The basic core sampling operational data used in this document includes the number of RMCS cores and segments the exhauster run times and flow rates the RMCS exhauster HEPA filter dose rates and tank vapor space temperatures Table F-l lists the basic operational data This information excluding tank vapor space temperature data was obtained from procedural data sheets in the sampling work packages (References W - 1 to WP-23)
Tank temperature data for the tanks ventilated with the RMCS exhausters was obtained from the TWINS database Plots for each tank were prepared for the time RMCS was conducted and the average value of the highest thermocouple located in the tank (the lowest temperature reading) was estimated and used as the average tank head space temperature during the RMCS period
The SX exhauster flow rates listed in Table F-l are estimates only The combined flow rate for SX-IO1 through SX-106 plus SX-109 (7 tanks) averaged 440 cfm during CY 1996 (Kaiser 1997) for an average of 63 cfm per
F-5
RPP-4826 Rev I
tank Based upon inlet flow measurements at the tank inlet HEPA filters (Fanis 1998) the flow through each individual tank (SX-IO1 through SX-106 plus SX-109) was lt55 cfm at the breather filter Assuming an exhaust flow of 100 cfm for each SX farm tank sampled is therefore conservative
Calculated Data
Calculated data include the tank head space volumes conversion of the RMCS exhauster flow rate from scfm to acfm and the number of tank head space changeouts made by an exhauster during RMCS
Tank head space volume includes the dome space volume above the top of the sidewall plus the void space between the waste surface and the top of the sidewall The formula used to calculate tank head space volumes WN
Head Space Volume in A = (DS + [(H) (12) + HI + Hb - H] (V)) - 748
Where DS = dome space volume gal H = height of tank body sidewall above knuckle A HI = height of tank knuckle area in Hb = height oftank bottom below knuckle in H = height of waste in tank in V =27555 galin of waste in SX tanks 2754 gallin in all others
The tank dome space volumes height of tank sidewall above the knuckle height of tank knuckle area and height of tank bottom below the knuckle were obtained from Reynolds 1999 The height of waste in each tank at the time of core sampling was obtained from the TWINS database Tank dimensional and waste level data are given in Table F-2 along with the calculated tank head space volumes
Aerosol calculations for Appendices A-C require exhauster flow rates in actual cubic feet per minute The RMCS exhauster flow rate is controlled and recorded in standard cubic feet per minute The mass flow rate of the exhauster air is measured and internal logic in the exhauster controller calculates what the volumetric flow rate would be if the temperature and pressure in the exhauster inlet were at standard conditions The standard conditions used in the logic controller are 29921 in Hg (760 mm Hg) and 69F (ZIT)
A correction factor is built into the exhauster control logic that assumes an atmospheric pressure of 2927 in Hg the average atmospheric pressure at Hanford The RMCS exhauster will operate at about 1-2 in H20 negative pressure resulting in about a 2916 in Hg pressure in a waste tank when the RMCS exhauster is operating To revise the indicated scfm RMCS exhauster reading to an acfm value the RMCS exhauster scfm flaw rate was multiplied by (29922916)(T+459)528 where Tis the tank head space temperature in OF The tank head space temperatures in Table F-1 were input to the spreadsheet file used for aerosol calculations and converted to acfm The flow rates in acfm are included in Table F-I
The tank head space changeouts when using the RMCS exhauster were calculated by multiplying the exhauster acfm flow rate by the time of exhauster operation and dividing the result by the tank head space volume Tank head space changeouts are listed in Table F-2
F-6
c
gt 2
RPP-4826 Rev 1
APPENDIX G
REFERENCES
G-0
RPP-4826 Rev 1
APPENDIX G - References
Diedeker 1999 NDA of RMCS HEPA Filters L P Diedeker WMH E-Mail to JS Schofield CHG November 29 I999
ERDA 1976 Nuclear Air Cleaning Handbook ERDA 76-21 Buchsted C A Fuller A B and Kahn 1 E Oak Ridge National Laboratory 1976
Farris 1998 Internal Note T R Farris LMHC to J S Schofield LMHC Breather Filter Flow Rates for SX-Farm 31698
Foust 1999 Internal Memo RMCST Exhauster HEPA Filter Dose Rate Calculations D J Foust LMHC to J S Schofield LMHC October 25 1999
Greager 1999 Correspondence No WMH-9954450 Non-Destructive Analysis of the Rotay Mode Core Sample High-Efjiciency Particulate Air Filters E M Greager WMH to P C Miller LMHC June 28 1999 [Transmittal of HNF-4199 Resultsfram NDA Measurement of the 296-P-34 RMCS HEPA Filters]
HNF 1999 HNF-SD-WM-SAR-067 Tank Waste Remediation System Final Safety Analysis Report Rev 1 The revision incorporating RMCS accident analyses was submitted as Addendum 5 to DOE as a change to the FSAR predecessor the Basis for Interim Operation (BIO) LMHC-9857075 80232764-9-KOOl Submittal of Authorization Basis Amendment Package for Rotay and Push Mode Core Sampling in Satisfaction of Perfarmance Agreement TWR 122 Expectations I and 3 D 1 Allen LMHC to A M Umek FDH August 30 1998 Addendum 5 as of mid-January 2000 is waiting for approval by DOE
Kaiser 1997 T D Kaiser LMHC E-Mail to J S Schofield LMHC SX Tank Flow Data 42197
NUREG 1995 Potential Radionuclide Emissionsfrom Stacks on the HanfordSite Part I Dose Assessment Davis W E and Barnett J M Westinghouse Hanford Company from Proceedings of the 23 DOEMRC Nuclear Air Cleaning Conference held July 25-28 1994 February 1995
Schofield 2000a Letter 74910-00-002 Use of Microshield Calculations for RMCS Exhauster Housing for Estimating Radionuclide Quantities on the Filters Using NDA and Dose Rate Measurements I S Schofield CHG to File January 62000
Schofield 2000b Letter 74910-00-003 Rev I RMCS Exhauster Stack RecordSample Data J S Schofield CHG to File January 202000
Reynolds 1999 D R Reynolds LMHC E-Mail to I S Schofield LMHC transmitting Tank Volume Calculations draft of calculations done by Mike Plesha and Reed Hendershot data to be used for RESOLVE computer program for Hanford waste tanks August 3 1999
TWINS Tank Waste Information Network System database available at httptwinspnlgovSOO lhtbinTCDgetTableListexe
Waldo 1999 letter 74910-99-009 RMCS Exhauster Aerosol Test Data E I Waldo to J S Schofield June 22 1999
WHC 1993 WHC-SD-WM-ES-225 Rev I AerosolStudy for the Rotary Mode Exhauster P M Francis Westinghouse Hanford Company April 20 1993
WHC 1997 WHC-SD-WM-SAD-035 Rev Ob A Safety Assessment of Rotary Mode Core Sampling in Flammable Gas Single Shell Tanks Hanford Site Richland Washington August 8 1997
G- I
RPP-4826 Rev I
CGM Data CGM-I Letter PARTICULATE SAMPLING OF 241-SX-IO1 DURING ROTARY MODE CORE SAMPLING D C
Langlois E2 Consulting Engineers to J S Schofield Lockheed Martin Hanford Company March 16 1998
CGM-2 Letter PARTICULATE SAMPLING OF 241-SX-I05 DURING ROTARY MODE CORE SAMPLING D C Langlois E2 Consulting Engineers to J S Schofield Lockheed Martin Hanford Company June 9 1998
CGM-3 Letter PARTICULATE SAMPLING OF 241-SX-103 DURING ROTARY MODE CORE SAMPLING D C Langlois E2 Consulting Engineers to J S Schofield Lockheed Martin Hanford Company June 12 1998
CGM-4 Letter PARTICULATE SAMPLING OF 241-S-110 DURING ROTARYMODE CORESAMPLING D C Langlois E2 Consulting Engineers to J S Schofield Lockheed Martin Hanford Company July 20 1998
CGM-5 Letter PARTICULATE SAMPLING OF 241-SX-102 DURING ROTARY MODE CORE SAMPLING D C Langlois E2 Consulting Engineers to J S Schofield Lockheed Martin Hanford Company July 22 1998
CGM-6 Letter PARTICULATE SAMPLING OF241-U-107 DURING ROTARY MODE CORE SAMPLING D C Langlois E2 Consulting Engineers to J S Schofield Lockheed Martin Hanford Company August 3 1998
CGM-7 Letter PARTICULATE SAMPLING OF 241-BY-105 DURING ROTARY MODE CORESAMPLING D C Langlois E2 Consulting Engineers to 1 S Schofield Lockheed Martin Hanford Company September 17 1998
CGM-8 Letter PARTICULATE SAMPLING OF 241-TX-I13 DURING ROTARY MODE CORESAMPLING D C Langlois E2 Consulting Engineers to J S Schofield Lockheed Martin Hanford Company March 15 1999
CGM-9 Letter PARTICULATE SAMPLING OF 241-TX-113 DURING ROTARY MODE CORE SAMPLING D C Langlois E2 Consulting Engineers to I S Schofield Lockheed Martin Hanford Company May 31 1999
Notices of Construction NOC-I DOEIRL-93-40 Radioactive Air Emissions Program Notice of Construction Rotary Mode Core-Sampling
Truck and Exhauster Approved by Letter AIR 93-707 A W Conklin WDOH to J E Rasmussen DOEIRL 7893
NOC-2 DOEIRL-94-118 Rev 0 Radioactive Air Emissions Program Notice of Construction for the Rotary Mode Core-Sampling Systems Three and Four Approved by Letter AIR 95-603 A W Conklin WDOH to J E Rasmussen DOERL 63095
NOC-3 DOERL-94-118 Rev 1 Radioactive Air Emissions Program Notice of Construction for the Rotary Mode Core-Sampling Systems Three and Four Approved by Letter AIR 98-301 W W Conklin WDOH to I E Rasmussen DOEIRL 3698
NOC-4 DOEIRL-97-70 Radioactive Air Emissions Program Notice of Construction for Rotary Mode Core- Sampling in SX Tank Farm Approved by Letter AIR 97-1 101 A W Conklin WDOH to J E Rasmussen DOEIRL 113097
NOC-5 USEPA Letter OAQ-107 (no title approving DOE submittal 97-EAP-590 dated 72997) A J Frankel USEPA to J E Rasrnussen DOEIRL 8497
NOC-5 USEPA Letter OAQ-107rsquo (nb title approving DOE submittal 97-EAP-723 dated 101797) A J Frankel USEPA to J E Rasmussen DOERL 11498
Note that both letters have ldquoOAQ-107rdquo following ldquoReply to Attn ofrdquo
G-2
RPP-4826 Rev I
Work Packages WP-I ES-94-00808 WP-2 ES-95-00258 WP-3 ES-95-00045 - WP-4 ES-95-00434 - WP-5 ws-97-00173 - WP-6 WS-97-00174 - WP-7 ws-97-00143 - WP-8 WS-97-00144 - WP-9 WS-97-00207 - WP-I 1 WS-97-00208 - WP-12 WS-98-00049 - WP-13 WS-97-00050 - WP-14 WS-97-00224 - WP- I5 WS-97-00225 - WP-16 WS-97-00230 - WP- I7 ws-97-0023 1 - WP-18 ES-97-00452 - WP-19 ES-97-00453 - WP-20 WS-98-00072 - WP-21 WS-98-00073 - WP-22 WS-98-00067 - WP-23 WS-98-00068 -
241-BY-IO6 Perform Rotary Core Sample [Riser IOB] 241-BY-I IO Rotary Core Sample [Risers 12B 7 IZB 41 241-BY-IO8 Obtain Rotary Core Sample [Risers 12A amp 71 241-BY-IO5 Rotary Mode Core Sample [Riser 12A] 241-SX-101 Rotary Mode Core Sample Riser 19 241-SX-101 Rotary Mode Core Sample Riser4 241-SX-103 Rotary Mode Core Sample Riser 7 241-SX-103 Rotary Mode Core Sample Riser I I 241-SX-105 RMCST Obtain Core Sample Riser 6 241-SX-105 RMCST Core Sample Riser 14 241-SX-102 Rotary Mode Core Sample Riser 8 241-SX-102 Rotary Mode Core Sample Riser 4 241-S-1 IO RMCST Obtain Core Sample Riser 6 241-S-1 IO RMCST Obtain Core Sample Riser 14 2414-107 RMCSTCore Sample Riser 7 241-U-107 RMCST Core Sample Riser 2 241-BY-IO5 RMCST Core Sample Riser 7 241-BY-IO5 RMCST Core Sample Riser 1 IB 241-TX-113 Rotary Core Sample Riser 3 241-TX-113 RMCST Core Sample Riser 5 241-TX-I 18 RMCST Core Sample Riser 9B 241-TX-I 18 RMCST Core Sample Riser 128
G-3
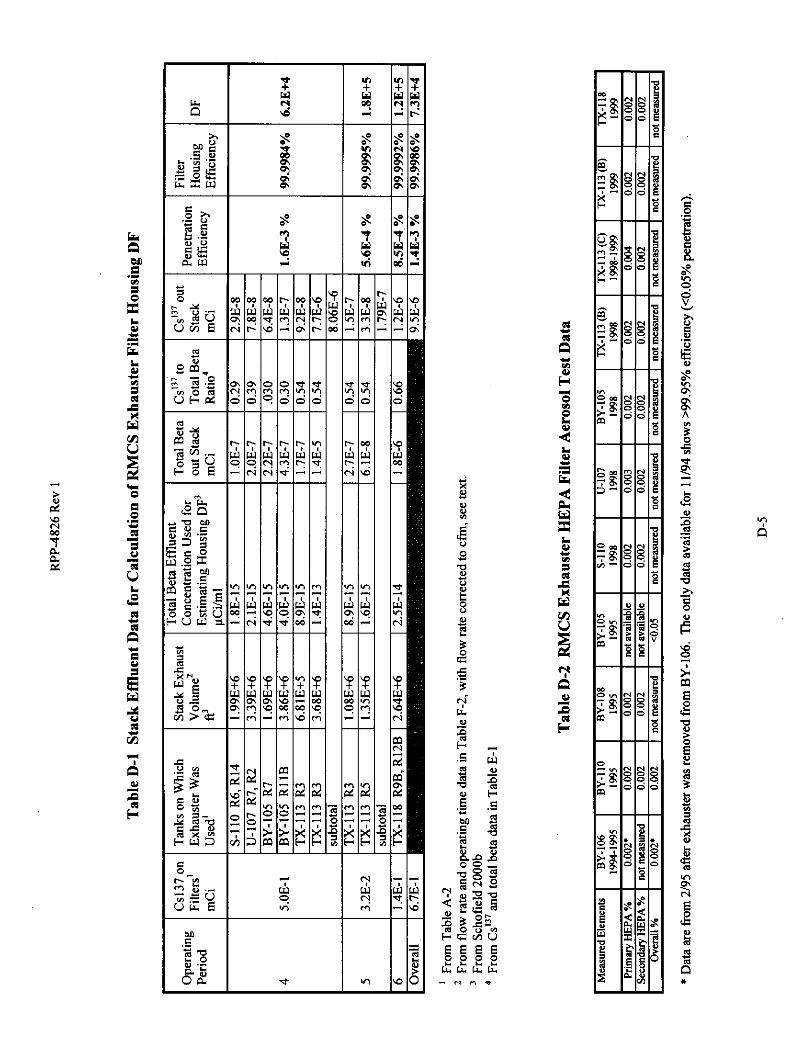
RPP-4826 Rev 1
analyzed following this run period Dose rates taken at the side of the exhauster housing during RMCS were all lt05 mRhr
Tank 241-BY-105895 to 1095 RMCS was begun in BY-I05 riser 12A on 83095 Exhauster 3 (B) and Truck 4 were used This tank has a concrete layer on top about 12-18 inches thick which had to be drilled through Part way through sampling questions arose as to the flammable gas status of the tank and RMCS was halted on 10695 A total of 3 RMCS and 7 PMCS segments were taken One RMCS core was obtained The total exhauster run time was 4413 hours The stack record sample was removed and analyzed following this run period Dose rates taken at the side of the exhauster housing during RMCS were all lt05 mRhr
Tank 241-SX-1011297 to 298 Following resolution of extensive regulatory and authorization basis issues and installation of equipment modifications RMCS started in SX-101 with Truck 4 on 12497 An RMCS exhauster was not used since all SX farm tanks excluding SX-113 and SX-I 15 are ventilated with the SX exhauster Sampling was performed in risers 19 and 4 and was completed on 21098 A total of 9 RMCS and 6 PMCS segments were taken Two RMCS cores were obtained SX exhauster stack record samples and filter housing dose rates were obtained as part of routine operations for the SX exhauster not as part of the RMCS process Filter papers used in the suction line for the CGM were saved and analyzed in the laboratory to estimate the airborne radionuclide concentration in the tank head space Two CGM filter papers were needed for each core as moisture in the tank vapors condensed on the papers in the cold weather and began to restrict tank gas flow to the CGM
Tank 241-SX-103498 to 598 RMCS started in SX-103 with Truck 4 on 42798 The SX exhauster was used for ventilation (see SX- 101 above) Sampling was performed in risers 7 and 1 1 and was completed on 51198 A total of 6 RMCS and 18 PMCS segments were taken Two RMCS cores were obtained During sampling filter papers used in the suction line for the CGM were saved and analyzed in the laboratory to estimate the airborne radionuclide concentration in the tank head space One CGM filter paper was used during each core SX exhauster stack record samples and filter housing dose rates were obtained as part of routine operations for the SX exhauster not as part of the RMCS process
Tank 241-SX-105298 to 598 RMCS started in SX-105 with Truck 3 on 22598 The SX exhauster was used for ventilation (see SX- 101 above) Sampling was performed in risers 6 and 14 and was completed on 51598 A total of 6 RMCS and 20 PMCS segments were taken Two RMCS cores were obtained During sampling filter papers used in the suction line for the CGM were saved and analyzed in the laboratory to estimate the airborne radionuclide concentration in the tank head space Two filter papers were needed for the first core as moisture in the tank vapors condensed on the papers in the cold weather and began to restrict tank gas flow to the CGM One filter paper was used for the second core SX exhauster stack record samples and filter housing dose rates were obtained as part of routine operations for the SX exhauster not as part of the RMCS process
Tank 241-SX-102698 to 798 RMCS started in SX-102 with Truck 4 on 61798 The SX exhauster was used for ventilation (see SX- 101 above) Sampling was performed in risers 8 and 4 and was completed on 7798 A total of 2 RMCS and I8 PMCS segments were taken Two RMCS cores were obtained During sampling filter papers used in the suction line for the CGM were saved and analyzed in the laboratory to estimate the airborne radionuclide concentration in the tank head space One filter paper was used for each core SX exhauster stack record samples and filter housing dose rates were obtained as part of routine operations for the SX exhauster not as part of the RMCS process
Tank 241-S-110598 to 698 RMCS was begun in S-I10 on 51898 Exhauster C (4) and Truck 3 were used This tank marked the first use of an RMCS exhauster since 1995 Sampling was completed on 6498 Risers 6 and 14 were sampled A total of IO RMCS and 8 PMCS segments were taken Two RMCS cores were obtained The
F-3
RPP-4826 Rev I
total exhauster run time was 15978 hours The stack record sample was removed and analyzed following this run period Dose rates taken at the side of the exhauster housing during RMCS were all lt05 mRhr During sampling filter papers used in the suction line for the CGM were saved and analyzed in the laboratory to estimate the airborne radionuclide concentration in the tank head space One filter paper was used for each core Waste particles retained on the exhauster housing filters were part of the inventory subsequently measured by NDA following completion of the first core in TX-I 13
Tank 241-U-107698 to 798 RMCS was begun in U-107 on 61098 Exhauster C and Trucks 3 and 4 were used Sampling was completed on 71598 Risers 7 and 2 were sampled A total of IO RMCS and 19 PMCS segments were taken Two RMCS cores were obtained The total exhauster run time was 27385 hours The stack record sample was removed and analyzed following this run period Dose rates taken at the side of the exhauster housing during RMCS were all 105 mRihr During sampling filter papers used in the suction line for the CGM were saved and analyzed in the laboratory to estimate the airborne radionuclide concentration in the tank head space One filter paper was used for each core Waste particles retained on the exhauster housing filters were part of the inventory subsequently measured by NDA following completion of the first core in TX-I 13
Tank 24l-BY-105798 to 898 RMCS was begun in BY-105 again on 72298 Exhauster C and Trucks 3 and 4 were used Sampling was completed on 82598 Risers 7 and 1 1 B were sampled A total of 18 RMCS and 18 PMCS segments were taken The material was hard enough to require rotary mode sampling all the way to the bottom of the waste but negligible recovery was obtained After RMCS was performed to the waste bottom a PMCS core was taken in the same hole to recover material Two RMCS cores were obtained The exhauster run time was 13577 hours for the first RMCS core and 30792 hours for the second RMCS core Stack record sample information in ABCASH shows 30558 hours operation for the second core but the sampler data sheet shows the time counter was mistakenly reset 234 hours into the run No correction was made to the BY-IO5 2nd core record sample concentration for this document since the error is conservative and results in only slightly higher (ltI) record sample radionuclide concentrations for this core A stack record sample was removed and analyzed following each core giving two record samples for BY-IO5 in 1998 Dose rates taken at the side of the exhauster housing during RMCS were almost all lt05 m R h but a few readings indicated 07 mRihr This variation was assumed due to personnel reading the instrument differently or the fact that the exhauster had been used on enough tanks that by now there was sufficient activity on the filters to cause readings approximately at the background detection level The final reading when both cores were completed was lt05 m R h During sampling filter papers used in the suction line for the CGM were saved and analyzed in the laboratory to estimate the airborne radionuclide concentration in the tank head space One filter paper was used for each core Waste particles retained on the exhauster housing filters were part of the inventory subsequently measured by NDA following completion of the first core in TX-113
Tank 241-TX-113998 to 599 Core sampling was begun in TX-I 13 riser 3 on 92298 Exhauster B (3) and Truck 4 were used at the start This was the first use of Exhauster B since it was modified Exhauster B ran for a total of 8738 hours until being disconnected on 102398 During this time two PMCS segments were taken and no RMCS segments Exhauster C was then installed and operated for 5598 hours from 121098 to 122898 No RMCS or PMCS sampling was performed during this time frame RMCS segments werent taken until 299 Exhauster C ran for a 30230 hours between 122898 and 21299 Sampling was completed on the core from riser 3 on 21299 A total of 12 RMCS segments were obtained during the time Exhauster C was operating Exhauster flow rate for both exhausters was a nominal 200 scfm Stack record samples were taken following Exhauster B removal at the end of 1998 for Exhauster C and following completion ofthe first core with Exhauster C Aerosol calculations were based on only the 30230 hours run time for Exhauster C in 1999 since this was the time period during which RMCS segments were obtained Dose rates taken at the side of the exhauster housing during the short PMCS only sampling period with Exhauster B were all ltOS m R h Dose rates with Exhauster C varied between lt O S mRhr and 07 mRhr The final reading on Exhauster C following completion of the first core was 07 mFUhr During sampling filter papers used in the suction line for the CGM were saved and
F-4
RPP-4826 Rev I
analyzed in the laboratory to estimate the airborne radionuclide concentration in the tank head space One filter paper was used for the core Waste particles retained on the exhauster housing filters were part of the inventory subsequently measured by NDA following completion of this core
Sampling in riser 5 was begun on 41299 using Exhauster B and Truck 3 A total of 6 RMCS and 1 PMCS segments were taken for this core before sampling was halted on 42899 The total exhauster run time for this core was 11712 hours Problems with high vacuum in the tank required the exhauster flow rate to be reduced to 190 scfm to keep the system within pressure limits The stack record sample for the second core was removed and analyzed following the run period Dose rates taken at the side of the exhauster housing during the second core were all lt05 m M r During sampling filter papers used in the suction line for the CGM were saved and analyzed in the laboratory to estimate the airborne radionuclide concentration in the tank head space One filter paper was used An NDA was performed on the exhauster housing following this core The only radionuclides present in the housing were those from this core or what was removed from the tank head space during the non-RMCS activities in this tank from 92298 and 102398
Some clarification may be needed to explain use of the exhauster operating times and NDA dose rate and record sample data obtained during core sampling on TX-I 13 Core sampling was set up for sampling riser 3 on TX-113 in September 1998 with Exhauster B Exhauster B operated for a total of 8738 hours between 92298 and 102298 The stack record sample was removed at the end of this period The ERS database incorrectly shows the exhauster operated between 111698 and 111998 The ABCASH database shows the stack record sample was removed on 111998 The stack record sample showed positive emuent concentrations during this time period with variances 400 No RMCS samples were taken during this period so the data and time werenrsquot included when calculating RMCS aerosol numbers Exhauster B was removed and Exhauster C installed in late November-early December Exhauster C was operated for a total of 5559 hours between 121098 and 122398 The stack record sample was removed on 122898 No sampling was performed during this period so the data and time werenrsquot included when calculating RMCS aerosol numbers Exhauster C was operated for a total of 30218 hours between 122898 and 2899 All the RMCS segments from riser 3 were taken in this time period so only the data and time for this period were included when calculating RMCS aerosol numbers Exhauster B was used during sampling of riser 5 Exhauster B operated for a total of 11712 hours between 41299 and 42899
Tank 241-TX-l18599 to 699 RMCS was begun in TX-I 18 on 5699 Exhauster C (4) and Truck 4 were used Sampling was completed on 6298 Risers 9B and 12B were sampled A total of 9 RMCS segments were taken there were no PMCS segments Two RMCS cores were obtained The total exhauster run time was 21247 hours The stack record sample was removed and analyzed following this run period The maximum dose rate taken at the side of the exhauster housing following RMCS was 08 m M r CGM filter papers were not analyzed An NDA was performed on the exhauster housing following completion of the two cores The exhauster housing contained the same nuclides as for the first NDA (S-110 U-107 BY-105 and TX-I 13 first core) plus those from TX-I 18
The basic core sampling operational data used in this document includes the number of RMCS cores and segments the exhauster run times and flow rates the RMCS exhauster HEPA filter dose rates and tank vapor space temperatures Table F-l lists the basic operational data This information excluding tank vapor space temperature data was obtained from procedural data sheets in the sampling work packages (References W - 1 to WP-23)
Tank temperature data for the tanks ventilated with the RMCS exhausters was obtained from the TWINS database Plots for each tank were prepared for the time RMCS was conducted and the average value of the highest thermocouple located in the tank (the lowest temperature reading) was estimated and used as the average tank head space temperature during the RMCS period
The SX exhauster flow rates listed in Table F-l are estimates only The combined flow rate for SX-IO1 through SX-106 plus SX-109 (7 tanks) averaged 440 cfm during CY 1996 (Kaiser 1997) for an average of 63 cfm per
F-5
RPP-4826 Rev I
tank Based upon inlet flow measurements at the tank inlet HEPA filters (Fanis 1998) the flow through each individual tank (SX-IO1 through SX-106 plus SX-109) was lt55 cfm at the breather filter Assuming an exhaust flow of 100 cfm for each SX farm tank sampled is therefore conservative
Calculated Data
Calculated data include the tank head space volumes conversion of the RMCS exhauster flow rate from scfm to acfm and the number of tank head space changeouts made by an exhauster during RMCS
Tank head space volume includes the dome space volume above the top of the sidewall plus the void space between the waste surface and the top of the sidewall The formula used to calculate tank head space volumes WN
Head Space Volume in A = (DS + [(H) (12) + HI + Hb - H] (V)) - 748
Where DS = dome space volume gal H = height of tank body sidewall above knuckle A HI = height of tank knuckle area in Hb = height oftank bottom below knuckle in H = height of waste in tank in V =27555 galin of waste in SX tanks 2754 gallin in all others
The tank dome space volumes height of tank sidewall above the knuckle height of tank knuckle area and height of tank bottom below the knuckle were obtained from Reynolds 1999 The height of waste in each tank at the time of core sampling was obtained from the TWINS database Tank dimensional and waste level data are given in Table F-2 along with the calculated tank head space volumes
Aerosol calculations for Appendices A-C require exhauster flow rates in actual cubic feet per minute The RMCS exhauster flow rate is controlled and recorded in standard cubic feet per minute The mass flow rate of the exhauster air is measured and internal logic in the exhauster controller calculates what the volumetric flow rate would be if the temperature and pressure in the exhauster inlet were at standard conditions The standard conditions used in the logic controller are 29921 in Hg (760 mm Hg) and 69F (ZIT)
A correction factor is built into the exhauster control logic that assumes an atmospheric pressure of 2927 in Hg the average atmospheric pressure at Hanford The RMCS exhauster will operate at about 1-2 in H20 negative pressure resulting in about a 2916 in Hg pressure in a waste tank when the RMCS exhauster is operating To revise the indicated scfm RMCS exhauster reading to an acfm value the RMCS exhauster scfm flaw rate was multiplied by (29922916)(T+459)528 where Tis the tank head space temperature in OF The tank head space temperatures in Table F-1 were input to the spreadsheet file used for aerosol calculations and converted to acfm The flow rates in acfm are included in Table F-I
The tank head space changeouts when using the RMCS exhauster were calculated by multiplying the exhauster acfm flow rate by the time of exhauster operation and dividing the result by the tank head space volume Tank head space changeouts are listed in Table F-2
F-6
c
gt 2
RPP-4826 Rev 1
APPENDIX G
REFERENCES
G-0
RPP-4826 Rev 1
APPENDIX G - References
Diedeker 1999 NDA of RMCS HEPA Filters L P Diedeker WMH E-Mail to JS Schofield CHG November 29 I999
ERDA 1976 Nuclear Air Cleaning Handbook ERDA 76-21 Buchsted C A Fuller A B and Kahn 1 E Oak Ridge National Laboratory 1976
Farris 1998 Internal Note T R Farris LMHC to J S Schofield LMHC Breather Filter Flow Rates for SX-Farm 31698
Foust 1999 Internal Memo RMCST Exhauster HEPA Filter Dose Rate Calculations D J Foust LMHC to J S Schofield LMHC October 25 1999
Greager 1999 Correspondence No WMH-9954450 Non-Destructive Analysis of the Rotay Mode Core Sample High-Efjiciency Particulate Air Filters E M Greager WMH to P C Miller LMHC June 28 1999 [Transmittal of HNF-4199 Resultsfram NDA Measurement of the 296-P-34 RMCS HEPA Filters]
HNF 1999 HNF-SD-WM-SAR-067 Tank Waste Remediation System Final Safety Analysis Report Rev 1 The revision incorporating RMCS accident analyses was submitted as Addendum 5 to DOE as a change to the FSAR predecessor the Basis for Interim Operation (BIO) LMHC-9857075 80232764-9-KOOl Submittal of Authorization Basis Amendment Package for Rotay and Push Mode Core Sampling in Satisfaction of Perfarmance Agreement TWR 122 Expectations I and 3 D 1 Allen LMHC to A M Umek FDH August 30 1998 Addendum 5 as of mid-January 2000 is waiting for approval by DOE
Kaiser 1997 T D Kaiser LMHC E-Mail to J S Schofield LMHC SX Tank Flow Data 42197
NUREG 1995 Potential Radionuclide Emissionsfrom Stacks on the HanfordSite Part I Dose Assessment Davis W E and Barnett J M Westinghouse Hanford Company from Proceedings of the 23 DOEMRC Nuclear Air Cleaning Conference held July 25-28 1994 February 1995
Schofield 2000a Letter 74910-00-002 Use of Microshield Calculations for RMCS Exhauster Housing for Estimating Radionuclide Quantities on the Filters Using NDA and Dose Rate Measurements I S Schofield CHG to File January 62000
Schofield 2000b Letter 74910-00-003 Rev I RMCS Exhauster Stack RecordSample Data J S Schofield CHG to File January 202000
Reynolds 1999 D R Reynolds LMHC E-Mail to I S Schofield LMHC transmitting Tank Volume Calculations draft of calculations done by Mike Plesha and Reed Hendershot data to be used for RESOLVE computer program for Hanford waste tanks August 3 1999
TWINS Tank Waste Information Network System database available at httptwinspnlgovSOO lhtbinTCDgetTableListexe
Waldo 1999 letter 74910-99-009 RMCS Exhauster Aerosol Test Data E I Waldo to J S Schofield June 22 1999
WHC 1993 WHC-SD-WM-ES-225 Rev I AerosolStudy for the Rotary Mode Exhauster P M Francis Westinghouse Hanford Company April 20 1993
WHC 1997 WHC-SD-WM-SAD-035 Rev Ob A Safety Assessment of Rotary Mode Core Sampling in Flammable Gas Single Shell Tanks Hanford Site Richland Washington August 8 1997
G- I
RPP-4826 Rev I
CGM Data CGM-I Letter PARTICULATE SAMPLING OF 241-SX-IO1 DURING ROTARY MODE CORE SAMPLING D C
Langlois E2 Consulting Engineers to J S Schofield Lockheed Martin Hanford Company March 16 1998
CGM-2 Letter PARTICULATE SAMPLING OF 241-SX-I05 DURING ROTARY MODE CORE SAMPLING D C Langlois E2 Consulting Engineers to J S Schofield Lockheed Martin Hanford Company June 9 1998
CGM-3 Letter PARTICULATE SAMPLING OF 241-SX-103 DURING ROTARY MODE CORE SAMPLING D C Langlois E2 Consulting Engineers to J S Schofield Lockheed Martin Hanford Company June 12 1998
CGM-4 Letter PARTICULATE SAMPLING OF 241-S-110 DURING ROTARYMODE CORESAMPLING D C Langlois E2 Consulting Engineers to J S Schofield Lockheed Martin Hanford Company July 20 1998
CGM-5 Letter PARTICULATE SAMPLING OF 241-SX-102 DURING ROTARY MODE CORE SAMPLING D C Langlois E2 Consulting Engineers to J S Schofield Lockheed Martin Hanford Company July 22 1998
CGM-6 Letter PARTICULATE SAMPLING OF241-U-107 DURING ROTARY MODE CORE SAMPLING D C Langlois E2 Consulting Engineers to J S Schofield Lockheed Martin Hanford Company August 3 1998
CGM-7 Letter PARTICULATE SAMPLING OF 241-BY-105 DURING ROTARY MODE CORESAMPLING D C Langlois E2 Consulting Engineers to 1 S Schofield Lockheed Martin Hanford Company September 17 1998
CGM-8 Letter PARTICULATE SAMPLING OF 241-TX-I13 DURING ROTARY MODE CORESAMPLING D C Langlois E2 Consulting Engineers to J S Schofield Lockheed Martin Hanford Company March 15 1999
CGM-9 Letter PARTICULATE SAMPLING OF 241-TX-113 DURING ROTARY MODE CORE SAMPLING D C Langlois E2 Consulting Engineers to I S Schofield Lockheed Martin Hanford Company May 31 1999
Notices of Construction NOC-I DOEIRL-93-40 Radioactive Air Emissions Program Notice of Construction Rotary Mode Core-Sampling
Truck and Exhauster Approved by Letter AIR 93-707 A W Conklin WDOH to J E Rasmussen DOEIRL 7893
NOC-2 DOEIRL-94-118 Rev 0 Radioactive Air Emissions Program Notice of Construction for the Rotary Mode Core-Sampling Systems Three and Four Approved by Letter AIR 95-603 A W Conklin WDOH to J E Rasmussen DOERL 63095
NOC-3 DOERL-94-118 Rev 1 Radioactive Air Emissions Program Notice of Construction for the Rotary Mode Core-Sampling Systems Three and Four Approved by Letter AIR 98-301 W W Conklin WDOH to I E Rasmussen DOEIRL 3698
NOC-4 DOEIRL-97-70 Radioactive Air Emissions Program Notice of Construction for Rotary Mode Core- Sampling in SX Tank Farm Approved by Letter AIR 97-1 101 A W Conklin WDOH to J E Rasmussen DOEIRL 113097
NOC-5 USEPA Letter OAQ-107 (no title approving DOE submittal 97-EAP-590 dated 72997) A J Frankel USEPA to J E Rasrnussen DOEIRL 8497
NOC-5 USEPA Letter OAQ-107rsquo (nb title approving DOE submittal 97-EAP-723 dated 101797) A J Frankel USEPA to J E Rasmussen DOERL 11498
Note that both letters have ldquoOAQ-107rdquo following ldquoReply to Attn ofrdquo
G-2
RPP-4826 Rev I
Work Packages WP-I ES-94-00808 WP-2 ES-95-00258 WP-3 ES-95-00045 - WP-4 ES-95-00434 - WP-5 ws-97-00173 - WP-6 WS-97-00174 - WP-7 ws-97-00143 - WP-8 WS-97-00144 - WP-9 WS-97-00207 - WP-I 1 WS-97-00208 - WP-12 WS-98-00049 - WP-13 WS-97-00050 - WP-14 WS-97-00224 - WP- I5 WS-97-00225 - WP-16 WS-97-00230 - WP- I7 ws-97-0023 1 - WP-18 ES-97-00452 - WP-19 ES-97-00453 - WP-20 WS-98-00072 - WP-21 WS-98-00073 - WP-22 WS-98-00067 - WP-23 WS-98-00068 -
241-BY-IO6 Perform Rotary Core Sample [Riser IOB] 241-BY-I IO Rotary Core Sample [Risers 12B 7 IZB 41 241-BY-IO8 Obtain Rotary Core Sample [Risers 12A amp 71 241-BY-IO5 Rotary Mode Core Sample [Riser 12A] 241-SX-101 Rotary Mode Core Sample Riser 19 241-SX-101 Rotary Mode Core Sample Riser4 241-SX-103 Rotary Mode Core Sample Riser 7 241-SX-103 Rotary Mode Core Sample Riser I I 241-SX-105 RMCST Obtain Core Sample Riser 6 241-SX-105 RMCST Core Sample Riser 14 241-SX-102 Rotary Mode Core Sample Riser 8 241-SX-102 Rotary Mode Core Sample Riser 4 241-S-1 IO RMCST Obtain Core Sample Riser 6 241-S-1 IO RMCST Obtain Core Sample Riser 14 2414-107 RMCSTCore Sample Riser 7 241-U-107 RMCST Core Sample Riser 2 241-BY-IO5 RMCST Core Sample Riser 7 241-BY-IO5 RMCST Core Sample Riser 1 IB 241-TX-113 Rotary Core Sample Riser 3 241-TX-113 RMCST Core Sample Riser 5 241-TX-I 18 RMCST Core Sample Riser 9B 241-TX-I 18 RMCST Core Sample Riser 128
G-3
RPP-4826 Rev I
analyzed in the laboratory to estimate the airborne radionuclide concentration in the tank head space One filter paper was used for the core Waste particles retained on the exhauster housing filters were part of the inventory subsequently measured by NDA following completion of this core
Sampling in riser 5 was begun on 41299 using Exhauster B and Truck 3 A total of 6 RMCS and 1 PMCS segments were taken for this core before sampling was halted on 42899 The total exhauster run time for this core was 11712 hours Problems with high vacuum in the tank required the exhauster flow rate to be reduced to 190 scfm to keep the system within pressure limits The stack record sample for the second core was removed and analyzed following the run period Dose rates taken at the side of the exhauster housing during the second core were all lt05 m M r During sampling filter papers used in the suction line for the CGM were saved and analyzed in the laboratory to estimate the airborne radionuclide concentration in the tank head space One filter paper was used An NDA was performed on the exhauster housing following this core The only radionuclides present in the housing were those from this core or what was removed from the tank head space during the non-RMCS activities in this tank from 92298 and 102398
Some clarification may be needed to explain use of the exhauster operating times and NDA dose rate and record sample data obtained during core sampling on TX-I 13 Core sampling was set up for sampling riser 3 on TX-113 in September 1998 with Exhauster B Exhauster B operated for a total of 8738 hours between 92298 and 102298 The stack record sample was removed at the end of this period The ERS database incorrectly shows the exhauster operated between 111698 and 111998 The ABCASH database shows the stack record sample was removed on 111998 The stack record sample showed positive emuent concentrations during this time period with variances 400 No RMCS samples were taken during this period so the data and time werenrsquot included when calculating RMCS aerosol numbers Exhauster B was removed and Exhauster C installed in late November-early December Exhauster C was operated for a total of 5559 hours between 121098 and 122398 The stack record sample was removed on 122898 No sampling was performed during this period so the data and time werenrsquot included when calculating RMCS aerosol numbers Exhauster C was operated for a total of 30218 hours between 122898 and 2899 All the RMCS segments from riser 3 were taken in this time period so only the data and time for this period were included when calculating RMCS aerosol numbers Exhauster B was used during sampling of riser 5 Exhauster B operated for a total of 11712 hours between 41299 and 42899
Tank 241-TX-l18599 to 699 RMCS was begun in TX-I 18 on 5699 Exhauster C (4) and Truck 4 were used Sampling was completed on 6298 Risers 9B and 12B were sampled A total of 9 RMCS segments were taken there were no PMCS segments Two RMCS cores were obtained The total exhauster run time was 21247 hours The stack record sample was removed and analyzed following this run period The maximum dose rate taken at the side of the exhauster housing following RMCS was 08 m M r CGM filter papers were not analyzed An NDA was performed on the exhauster housing following completion of the two cores The exhauster housing contained the same nuclides as for the first NDA (S-110 U-107 BY-105 and TX-I 13 first core) plus those from TX-I 18
The basic core sampling operational data used in this document includes the number of RMCS cores and segments the exhauster run times and flow rates the RMCS exhauster HEPA filter dose rates and tank vapor space temperatures Table F-l lists the basic operational data This information excluding tank vapor space temperature data was obtained from procedural data sheets in the sampling work packages (References W - 1 to WP-23)
Tank temperature data for the tanks ventilated with the RMCS exhausters was obtained from the TWINS database Plots for each tank were prepared for the time RMCS was conducted and the average value of the highest thermocouple located in the tank (the lowest temperature reading) was estimated and used as the average tank head space temperature during the RMCS period
The SX exhauster flow rates listed in Table F-l are estimates only The combined flow rate for SX-IO1 through SX-106 plus SX-109 (7 tanks) averaged 440 cfm during CY 1996 (Kaiser 1997) for an average of 63 cfm per
F-5
RPP-4826 Rev I
tank Based upon inlet flow measurements at the tank inlet HEPA filters (Fanis 1998) the flow through each individual tank (SX-IO1 through SX-106 plus SX-109) was lt55 cfm at the breather filter Assuming an exhaust flow of 100 cfm for each SX farm tank sampled is therefore conservative
Calculated Data
Calculated data include the tank head space volumes conversion of the RMCS exhauster flow rate from scfm to acfm and the number of tank head space changeouts made by an exhauster during RMCS
Tank head space volume includes the dome space volume above the top of the sidewall plus the void space between the waste surface and the top of the sidewall The formula used to calculate tank head space volumes WN
Head Space Volume in A = (DS + [(H) (12) + HI + Hb - H] (V)) - 748
Where DS = dome space volume gal H = height of tank body sidewall above knuckle A HI = height of tank knuckle area in Hb = height oftank bottom below knuckle in H = height of waste in tank in V =27555 galin of waste in SX tanks 2754 gallin in all others
The tank dome space volumes height of tank sidewall above the knuckle height of tank knuckle area and height of tank bottom below the knuckle were obtained from Reynolds 1999 The height of waste in each tank at the time of core sampling was obtained from the TWINS database Tank dimensional and waste level data are given in Table F-2 along with the calculated tank head space volumes
Aerosol calculations for Appendices A-C require exhauster flow rates in actual cubic feet per minute The RMCS exhauster flow rate is controlled and recorded in standard cubic feet per minute The mass flow rate of the exhauster air is measured and internal logic in the exhauster controller calculates what the volumetric flow rate would be if the temperature and pressure in the exhauster inlet were at standard conditions The standard conditions used in the logic controller are 29921 in Hg (760 mm Hg) and 69F (ZIT)
A correction factor is built into the exhauster control logic that assumes an atmospheric pressure of 2927 in Hg the average atmospheric pressure at Hanford The RMCS exhauster will operate at about 1-2 in H20 negative pressure resulting in about a 2916 in Hg pressure in a waste tank when the RMCS exhauster is operating To revise the indicated scfm RMCS exhauster reading to an acfm value the RMCS exhauster scfm flaw rate was multiplied by (29922916)(T+459)528 where Tis the tank head space temperature in OF The tank head space temperatures in Table F-1 were input to the spreadsheet file used for aerosol calculations and converted to acfm The flow rates in acfm are included in Table F-I
The tank head space changeouts when using the RMCS exhauster were calculated by multiplying the exhauster acfm flow rate by the time of exhauster operation and dividing the result by the tank head space volume Tank head space changeouts are listed in Table F-2
F-6
c
gt 2
RPP-4826 Rev 1
APPENDIX G
REFERENCES
G-0
RPP-4826 Rev 1
APPENDIX G - References
Diedeker 1999 NDA of RMCS HEPA Filters L P Diedeker WMH E-Mail to JS Schofield CHG November 29 I999
ERDA 1976 Nuclear Air Cleaning Handbook ERDA 76-21 Buchsted C A Fuller A B and Kahn 1 E Oak Ridge National Laboratory 1976
Farris 1998 Internal Note T R Farris LMHC to J S Schofield LMHC Breather Filter Flow Rates for SX-Farm 31698
Foust 1999 Internal Memo RMCST Exhauster HEPA Filter Dose Rate Calculations D J Foust LMHC to J S Schofield LMHC October 25 1999
Greager 1999 Correspondence No WMH-9954450 Non-Destructive Analysis of the Rotay Mode Core Sample High-Efjiciency Particulate Air Filters E M Greager WMH to P C Miller LMHC June 28 1999 [Transmittal of HNF-4199 Resultsfram NDA Measurement of the 296-P-34 RMCS HEPA Filters]
HNF 1999 HNF-SD-WM-SAR-067 Tank Waste Remediation System Final Safety Analysis Report Rev 1 The revision incorporating RMCS accident analyses was submitted as Addendum 5 to DOE as a change to the FSAR predecessor the Basis for Interim Operation (BIO) LMHC-9857075 80232764-9-KOOl Submittal of Authorization Basis Amendment Package for Rotay and Push Mode Core Sampling in Satisfaction of Perfarmance Agreement TWR 122 Expectations I and 3 D 1 Allen LMHC to A M Umek FDH August 30 1998 Addendum 5 as of mid-January 2000 is waiting for approval by DOE
Kaiser 1997 T D Kaiser LMHC E-Mail to J S Schofield LMHC SX Tank Flow Data 42197
NUREG 1995 Potential Radionuclide Emissionsfrom Stacks on the HanfordSite Part I Dose Assessment Davis W E and Barnett J M Westinghouse Hanford Company from Proceedings of the 23 DOEMRC Nuclear Air Cleaning Conference held July 25-28 1994 February 1995
Schofield 2000a Letter 74910-00-002 Use of Microshield Calculations for RMCS Exhauster Housing for Estimating Radionuclide Quantities on the Filters Using NDA and Dose Rate Measurements I S Schofield CHG to File January 62000
Schofield 2000b Letter 74910-00-003 Rev I RMCS Exhauster Stack RecordSample Data J S Schofield CHG to File January 202000
Reynolds 1999 D R Reynolds LMHC E-Mail to I S Schofield LMHC transmitting Tank Volume Calculations draft of calculations done by Mike Plesha and Reed Hendershot data to be used for RESOLVE computer program for Hanford waste tanks August 3 1999
TWINS Tank Waste Information Network System database available at httptwinspnlgovSOO lhtbinTCDgetTableListexe
Waldo 1999 letter 74910-99-009 RMCS Exhauster Aerosol Test Data E I Waldo to J S Schofield June 22 1999
WHC 1993 WHC-SD-WM-ES-225 Rev I AerosolStudy for the Rotary Mode Exhauster P M Francis Westinghouse Hanford Company April 20 1993
WHC 1997 WHC-SD-WM-SAD-035 Rev Ob A Safety Assessment of Rotary Mode Core Sampling in Flammable Gas Single Shell Tanks Hanford Site Richland Washington August 8 1997
G- I
RPP-4826 Rev I
CGM Data CGM-I Letter PARTICULATE SAMPLING OF 241-SX-IO1 DURING ROTARY MODE CORE SAMPLING D C
Langlois E2 Consulting Engineers to J S Schofield Lockheed Martin Hanford Company March 16 1998
CGM-2 Letter PARTICULATE SAMPLING OF 241-SX-I05 DURING ROTARY MODE CORE SAMPLING D C Langlois E2 Consulting Engineers to J S Schofield Lockheed Martin Hanford Company June 9 1998
CGM-3 Letter PARTICULATE SAMPLING OF 241-SX-103 DURING ROTARY MODE CORE SAMPLING D C Langlois E2 Consulting Engineers to J S Schofield Lockheed Martin Hanford Company June 12 1998
CGM-4 Letter PARTICULATE SAMPLING OF 241-S-110 DURING ROTARYMODE CORESAMPLING D C Langlois E2 Consulting Engineers to J S Schofield Lockheed Martin Hanford Company July 20 1998
CGM-5 Letter PARTICULATE SAMPLING OF 241-SX-102 DURING ROTARY MODE CORE SAMPLING D C Langlois E2 Consulting Engineers to J S Schofield Lockheed Martin Hanford Company July 22 1998
CGM-6 Letter PARTICULATE SAMPLING OF241-U-107 DURING ROTARY MODE CORE SAMPLING D C Langlois E2 Consulting Engineers to J S Schofield Lockheed Martin Hanford Company August 3 1998
CGM-7 Letter PARTICULATE SAMPLING OF 241-BY-105 DURING ROTARY MODE CORESAMPLING D C Langlois E2 Consulting Engineers to 1 S Schofield Lockheed Martin Hanford Company September 17 1998
CGM-8 Letter PARTICULATE SAMPLING OF 241-TX-I13 DURING ROTARY MODE CORESAMPLING D C Langlois E2 Consulting Engineers to J S Schofield Lockheed Martin Hanford Company March 15 1999
CGM-9 Letter PARTICULATE SAMPLING OF 241-TX-113 DURING ROTARY MODE CORE SAMPLING D C Langlois E2 Consulting Engineers to I S Schofield Lockheed Martin Hanford Company May 31 1999
Notices of Construction NOC-I DOEIRL-93-40 Radioactive Air Emissions Program Notice of Construction Rotary Mode Core-Sampling
Truck and Exhauster Approved by Letter AIR 93-707 A W Conklin WDOH to J E Rasmussen DOEIRL 7893
NOC-2 DOEIRL-94-118 Rev 0 Radioactive Air Emissions Program Notice of Construction for the Rotary Mode Core-Sampling Systems Three and Four Approved by Letter AIR 95-603 A W Conklin WDOH to J E Rasmussen DOERL 63095
NOC-3 DOERL-94-118 Rev 1 Radioactive Air Emissions Program Notice of Construction for the Rotary Mode Core-Sampling Systems Three and Four Approved by Letter AIR 98-301 W W Conklin WDOH to I E Rasmussen DOEIRL 3698
NOC-4 DOEIRL-97-70 Radioactive Air Emissions Program Notice of Construction for Rotary Mode Core- Sampling in SX Tank Farm Approved by Letter AIR 97-1 101 A W Conklin WDOH to J E Rasmussen DOEIRL 113097
NOC-5 USEPA Letter OAQ-107 (no title approving DOE submittal 97-EAP-590 dated 72997) A J Frankel USEPA to J E Rasrnussen DOEIRL 8497
NOC-5 USEPA Letter OAQ-107rsquo (nb title approving DOE submittal 97-EAP-723 dated 101797) A J Frankel USEPA to J E Rasmussen DOERL 11498
Note that both letters have ldquoOAQ-107rdquo following ldquoReply to Attn ofrdquo
G-2
RPP-4826 Rev I
Work Packages WP-I ES-94-00808 WP-2 ES-95-00258 WP-3 ES-95-00045 - WP-4 ES-95-00434 - WP-5 ws-97-00173 - WP-6 WS-97-00174 - WP-7 ws-97-00143 - WP-8 WS-97-00144 - WP-9 WS-97-00207 - WP-I 1 WS-97-00208 - WP-12 WS-98-00049 - WP-13 WS-97-00050 - WP-14 WS-97-00224 - WP- I5 WS-97-00225 - WP-16 WS-97-00230 - WP- I7 ws-97-0023 1 - WP-18 ES-97-00452 - WP-19 ES-97-00453 - WP-20 WS-98-00072 - WP-21 WS-98-00073 - WP-22 WS-98-00067 - WP-23 WS-98-00068 -
241-BY-IO6 Perform Rotary Core Sample [Riser IOB] 241-BY-I IO Rotary Core Sample [Risers 12B 7 IZB 41 241-BY-IO8 Obtain Rotary Core Sample [Risers 12A amp 71 241-BY-IO5 Rotary Mode Core Sample [Riser 12A] 241-SX-101 Rotary Mode Core Sample Riser 19 241-SX-101 Rotary Mode Core Sample Riser4 241-SX-103 Rotary Mode Core Sample Riser 7 241-SX-103 Rotary Mode Core Sample Riser I I 241-SX-105 RMCST Obtain Core Sample Riser 6 241-SX-105 RMCST Core Sample Riser 14 241-SX-102 Rotary Mode Core Sample Riser 8 241-SX-102 Rotary Mode Core Sample Riser 4 241-S-1 IO RMCST Obtain Core Sample Riser 6 241-S-1 IO RMCST Obtain Core Sample Riser 14 2414-107 RMCSTCore Sample Riser 7 241-U-107 RMCST Core Sample Riser 2 241-BY-IO5 RMCST Core Sample Riser 7 241-BY-IO5 RMCST Core Sample Riser 1 IB 241-TX-113 Rotary Core Sample Riser 3 241-TX-113 RMCST Core Sample Riser 5 241-TX-I 18 RMCST Core Sample Riser 9B 241-TX-I 18 RMCST Core Sample Riser 128
G-3
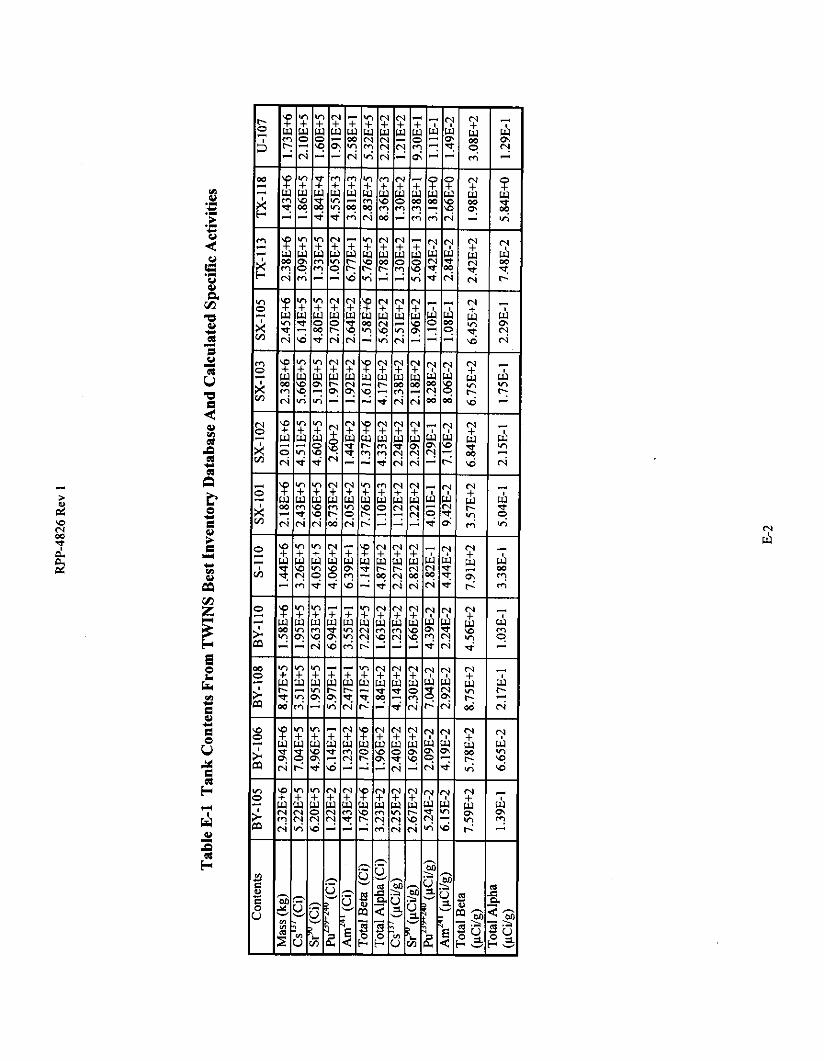
RPP-4826 Rev I
tank Based upon inlet flow measurements at the tank inlet HEPA filters (Fanis 1998) the flow through each individual tank (SX-IO1 through SX-106 plus SX-109) was lt55 cfm at the breather filter Assuming an exhaust flow of 100 cfm for each SX farm tank sampled is therefore conservative
Calculated Data
Calculated data include the tank head space volumes conversion of the RMCS exhauster flow rate from scfm to acfm and the number of tank head space changeouts made by an exhauster during RMCS
Tank head space volume includes the dome space volume above the top of the sidewall plus the void space between the waste surface and the top of the sidewall The formula used to calculate tank head space volumes WN
Head Space Volume in A = (DS + [(H) (12) + HI + Hb - H] (V)) - 748
Where DS = dome space volume gal H = height of tank body sidewall above knuckle A HI = height of tank knuckle area in Hb = height oftank bottom below knuckle in H = height of waste in tank in V =27555 galin of waste in SX tanks 2754 gallin in all others
The tank dome space volumes height of tank sidewall above the knuckle height of tank knuckle area and height of tank bottom below the knuckle were obtained from Reynolds 1999 The height of waste in each tank at the time of core sampling was obtained from the TWINS database Tank dimensional and waste level data are given in Table F-2 along with the calculated tank head space volumes
Aerosol calculations for Appendices A-C require exhauster flow rates in actual cubic feet per minute The RMCS exhauster flow rate is controlled and recorded in standard cubic feet per minute The mass flow rate of the exhauster air is measured and internal logic in the exhauster controller calculates what the volumetric flow rate would be if the temperature and pressure in the exhauster inlet were at standard conditions The standard conditions used in the logic controller are 29921 in Hg (760 mm Hg) and 69F (ZIT)
A correction factor is built into the exhauster control logic that assumes an atmospheric pressure of 2927 in Hg the average atmospheric pressure at Hanford The RMCS exhauster will operate at about 1-2 in H20 negative pressure resulting in about a 2916 in Hg pressure in a waste tank when the RMCS exhauster is operating To revise the indicated scfm RMCS exhauster reading to an acfm value the RMCS exhauster scfm flaw rate was multiplied by (29922916)(T+459)528 where Tis the tank head space temperature in OF The tank head space temperatures in Table F-1 were input to the spreadsheet file used for aerosol calculations and converted to acfm The flow rates in acfm are included in Table F-I
The tank head space changeouts when using the RMCS exhauster were calculated by multiplying the exhauster acfm flow rate by the time of exhauster operation and dividing the result by the tank head space volume Tank head space changeouts are listed in Table F-2
F-6
c
gt 2
RPP-4826 Rev 1
APPENDIX G
REFERENCES
G-0
RPP-4826 Rev 1
APPENDIX G - References
Diedeker 1999 NDA of RMCS HEPA Filters L P Diedeker WMH E-Mail to JS Schofield CHG November 29 I999
ERDA 1976 Nuclear Air Cleaning Handbook ERDA 76-21 Buchsted C A Fuller A B and Kahn 1 E Oak Ridge National Laboratory 1976
Farris 1998 Internal Note T R Farris LMHC to J S Schofield LMHC Breather Filter Flow Rates for SX-Farm 31698
Foust 1999 Internal Memo RMCST Exhauster HEPA Filter Dose Rate Calculations D J Foust LMHC to J S Schofield LMHC October 25 1999
Greager 1999 Correspondence No WMH-9954450 Non-Destructive Analysis of the Rotay Mode Core Sample High-Efjiciency Particulate Air Filters E M Greager WMH to P C Miller LMHC June 28 1999 [Transmittal of HNF-4199 Resultsfram NDA Measurement of the 296-P-34 RMCS HEPA Filters]
HNF 1999 HNF-SD-WM-SAR-067 Tank Waste Remediation System Final Safety Analysis Report Rev 1 The revision incorporating RMCS accident analyses was submitted as Addendum 5 to DOE as a change to the FSAR predecessor the Basis for Interim Operation (BIO) LMHC-9857075 80232764-9-KOOl Submittal of Authorization Basis Amendment Package for Rotay and Push Mode Core Sampling in Satisfaction of Perfarmance Agreement TWR 122 Expectations I and 3 D 1 Allen LMHC to A M Umek FDH August 30 1998 Addendum 5 as of mid-January 2000 is waiting for approval by DOE
Kaiser 1997 T D Kaiser LMHC E-Mail to J S Schofield LMHC SX Tank Flow Data 42197
NUREG 1995 Potential Radionuclide Emissionsfrom Stacks on the HanfordSite Part I Dose Assessment Davis W E and Barnett J M Westinghouse Hanford Company from Proceedings of the 23 DOEMRC Nuclear Air Cleaning Conference held July 25-28 1994 February 1995
Schofield 2000a Letter 74910-00-002 Use of Microshield Calculations for RMCS Exhauster Housing for Estimating Radionuclide Quantities on the Filters Using NDA and Dose Rate Measurements I S Schofield CHG to File January 62000
Schofield 2000b Letter 74910-00-003 Rev I RMCS Exhauster Stack RecordSample Data J S Schofield CHG to File January 202000
Reynolds 1999 D R Reynolds LMHC E-Mail to I S Schofield LMHC transmitting Tank Volume Calculations draft of calculations done by Mike Plesha and Reed Hendershot data to be used for RESOLVE computer program for Hanford waste tanks August 3 1999
TWINS Tank Waste Information Network System database available at httptwinspnlgovSOO lhtbinTCDgetTableListexe
Waldo 1999 letter 74910-99-009 RMCS Exhauster Aerosol Test Data E I Waldo to J S Schofield June 22 1999
WHC 1993 WHC-SD-WM-ES-225 Rev I AerosolStudy for the Rotary Mode Exhauster P M Francis Westinghouse Hanford Company April 20 1993
WHC 1997 WHC-SD-WM-SAD-035 Rev Ob A Safety Assessment of Rotary Mode Core Sampling in Flammable Gas Single Shell Tanks Hanford Site Richland Washington August 8 1997
G- I
RPP-4826 Rev I
CGM Data CGM-I Letter PARTICULATE SAMPLING OF 241-SX-IO1 DURING ROTARY MODE CORE SAMPLING D C
Langlois E2 Consulting Engineers to J S Schofield Lockheed Martin Hanford Company March 16 1998
CGM-2 Letter PARTICULATE SAMPLING OF 241-SX-I05 DURING ROTARY MODE CORE SAMPLING D C Langlois E2 Consulting Engineers to J S Schofield Lockheed Martin Hanford Company June 9 1998
CGM-3 Letter PARTICULATE SAMPLING OF 241-SX-103 DURING ROTARY MODE CORE SAMPLING D C Langlois E2 Consulting Engineers to J S Schofield Lockheed Martin Hanford Company June 12 1998
CGM-4 Letter PARTICULATE SAMPLING OF 241-S-110 DURING ROTARYMODE CORESAMPLING D C Langlois E2 Consulting Engineers to J S Schofield Lockheed Martin Hanford Company July 20 1998
CGM-5 Letter PARTICULATE SAMPLING OF 241-SX-102 DURING ROTARY MODE CORE SAMPLING D C Langlois E2 Consulting Engineers to J S Schofield Lockheed Martin Hanford Company July 22 1998
CGM-6 Letter PARTICULATE SAMPLING OF241-U-107 DURING ROTARY MODE CORE SAMPLING D C Langlois E2 Consulting Engineers to J S Schofield Lockheed Martin Hanford Company August 3 1998
CGM-7 Letter PARTICULATE SAMPLING OF 241-BY-105 DURING ROTARY MODE CORESAMPLING D C Langlois E2 Consulting Engineers to 1 S Schofield Lockheed Martin Hanford Company September 17 1998
CGM-8 Letter PARTICULATE SAMPLING OF 241-TX-I13 DURING ROTARY MODE CORESAMPLING D C Langlois E2 Consulting Engineers to J S Schofield Lockheed Martin Hanford Company March 15 1999
CGM-9 Letter PARTICULATE SAMPLING OF 241-TX-113 DURING ROTARY MODE CORE SAMPLING D C Langlois E2 Consulting Engineers to I S Schofield Lockheed Martin Hanford Company May 31 1999
Notices of Construction NOC-I DOEIRL-93-40 Radioactive Air Emissions Program Notice of Construction Rotary Mode Core-Sampling
Truck and Exhauster Approved by Letter AIR 93-707 A W Conklin WDOH to J E Rasmussen DOEIRL 7893
NOC-2 DOEIRL-94-118 Rev 0 Radioactive Air Emissions Program Notice of Construction for the Rotary Mode Core-Sampling Systems Three and Four Approved by Letter AIR 95-603 A W Conklin WDOH to J E Rasmussen DOERL 63095
NOC-3 DOERL-94-118 Rev 1 Radioactive Air Emissions Program Notice of Construction for the Rotary Mode Core-Sampling Systems Three and Four Approved by Letter AIR 98-301 W W Conklin WDOH to I E Rasmussen DOEIRL 3698
NOC-4 DOEIRL-97-70 Radioactive Air Emissions Program Notice of Construction for Rotary Mode Core- Sampling in SX Tank Farm Approved by Letter AIR 97-1 101 A W Conklin WDOH to J E Rasmussen DOEIRL 113097
NOC-5 USEPA Letter OAQ-107 (no title approving DOE submittal 97-EAP-590 dated 72997) A J Frankel USEPA to J E Rasrnussen DOEIRL 8497
NOC-5 USEPA Letter OAQ-107rsquo (nb title approving DOE submittal 97-EAP-723 dated 101797) A J Frankel USEPA to J E Rasmussen DOERL 11498
Note that both letters have ldquoOAQ-107rdquo following ldquoReply to Attn ofrdquo
G-2
RPP-4826 Rev I
Work Packages WP-I ES-94-00808 WP-2 ES-95-00258 WP-3 ES-95-00045 - WP-4 ES-95-00434 - WP-5 ws-97-00173 - WP-6 WS-97-00174 - WP-7 ws-97-00143 - WP-8 WS-97-00144 - WP-9 WS-97-00207 - WP-I 1 WS-97-00208 - WP-12 WS-98-00049 - WP-13 WS-97-00050 - WP-14 WS-97-00224 - WP- I5 WS-97-00225 - WP-16 WS-97-00230 - WP- I7 ws-97-0023 1 - WP-18 ES-97-00452 - WP-19 ES-97-00453 - WP-20 WS-98-00072 - WP-21 WS-98-00073 - WP-22 WS-98-00067 - WP-23 WS-98-00068 -
241-BY-IO6 Perform Rotary Core Sample [Riser IOB] 241-BY-I IO Rotary Core Sample [Risers 12B 7 IZB 41 241-BY-IO8 Obtain Rotary Core Sample [Risers 12A amp 71 241-BY-IO5 Rotary Mode Core Sample [Riser 12A] 241-SX-101 Rotary Mode Core Sample Riser 19 241-SX-101 Rotary Mode Core Sample Riser4 241-SX-103 Rotary Mode Core Sample Riser 7 241-SX-103 Rotary Mode Core Sample Riser I I 241-SX-105 RMCST Obtain Core Sample Riser 6 241-SX-105 RMCST Core Sample Riser 14 241-SX-102 Rotary Mode Core Sample Riser 8 241-SX-102 Rotary Mode Core Sample Riser 4 241-S-1 IO RMCST Obtain Core Sample Riser 6 241-S-1 IO RMCST Obtain Core Sample Riser 14 2414-107 RMCSTCore Sample Riser 7 241-U-107 RMCST Core Sample Riser 2 241-BY-IO5 RMCST Core Sample Riser 7 241-BY-IO5 RMCST Core Sample Riser 1 IB 241-TX-113 Rotary Core Sample Riser 3 241-TX-113 RMCST Core Sample Riser 5 241-TX-I 18 RMCST Core Sample Riser 9B 241-TX-I 18 RMCST Core Sample Riser 128
G-3
RPP-4826 Rev 1
APPENDIX G - References
Diedeker 1999 NDA of RMCS HEPA Filters L P Diedeker WMH E-Mail to JS Schofield CHG November 29 I999
ERDA 1976 Nuclear Air Cleaning Handbook ERDA 76-21 Buchsted C A Fuller A B and Kahn 1 E Oak Ridge National Laboratory 1976
Farris 1998 Internal Note T R Farris LMHC to J S Schofield LMHC Breather Filter Flow Rates for SX-Farm 31698
Foust 1999 Internal Memo RMCST Exhauster HEPA Filter Dose Rate Calculations D J Foust LMHC to J S Schofield LMHC October 25 1999
Greager 1999 Correspondence No WMH-9954450 Non-Destructive Analysis of the Rotay Mode Core Sample High-Efjiciency Particulate Air Filters E M Greager WMH to P C Miller LMHC June 28 1999 [Transmittal of HNF-4199 Resultsfram NDA Measurement of the 296-P-34 RMCS HEPA Filters]
HNF 1999 HNF-SD-WM-SAR-067 Tank Waste Remediation System Final Safety Analysis Report Rev 1 The revision incorporating RMCS accident analyses was submitted as Addendum 5 to DOE as a change to the FSAR predecessor the Basis for Interim Operation (BIO) LMHC-9857075 80232764-9-KOOl Submittal of Authorization Basis Amendment Package for Rotay and Push Mode Core Sampling in Satisfaction of Perfarmance Agreement TWR 122 Expectations I and 3 D 1 Allen LMHC to A M Umek FDH August 30 1998 Addendum 5 as of mid-January 2000 is waiting for approval by DOE
Kaiser 1997 T D Kaiser LMHC E-Mail to J S Schofield LMHC SX Tank Flow Data 42197
NUREG 1995 Potential Radionuclide Emissionsfrom Stacks on the HanfordSite Part I Dose Assessment Davis W E and Barnett J M Westinghouse Hanford Company from Proceedings of the 23 DOEMRC Nuclear Air Cleaning Conference held July 25-28 1994 February 1995
Schofield 2000a Letter 74910-00-002 Use of Microshield Calculations for RMCS Exhauster Housing for Estimating Radionuclide Quantities on the Filters Using NDA and Dose Rate Measurements I S Schofield CHG to File January 62000
Schofield 2000b Letter 74910-00-003 Rev I RMCS Exhauster Stack RecordSample Data J S Schofield CHG to File January 202000
Reynolds 1999 D R Reynolds LMHC E-Mail to I S Schofield LMHC transmitting Tank Volume Calculations draft of calculations done by Mike Plesha and Reed Hendershot data to be used for RESOLVE computer program for Hanford waste tanks August 3 1999
TWINS Tank Waste Information Network System database available at httptwinspnlgovSOO lhtbinTCDgetTableListexe
Waldo 1999 letter 74910-99-009 RMCS Exhauster Aerosol Test Data E I Waldo to J S Schofield June 22 1999
WHC 1993 WHC-SD-WM-ES-225 Rev I AerosolStudy for the Rotary Mode Exhauster P M Francis Westinghouse Hanford Company April 20 1993
WHC 1997 WHC-SD-WM-SAD-035 Rev Ob A Safety Assessment of Rotary Mode Core Sampling in Flammable Gas Single Shell Tanks Hanford Site Richland Washington August 8 1997
G- I
RPP-4826 Rev I
CGM Data CGM-I Letter PARTICULATE SAMPLING OF 241-SX-IO1 DURING ROTARY MODE CORE SAMPLING D C
Langlois E2 Consulting Engineers to J S Schofield Lockheed Martin Hanford Company March 16 1998
CGM-2 Letter PARTICULATE SAMPLING OF 241-SX-I05 DURING ROTARY MODE CORE SAMPLING D C Langlois E2 Consulting Engineers to J S Schofield Lockheed Martin Hanford Company June 9 1998
CGM-3 Letter PARTICULATE SAMPLING OF 241-SX-103 DURING ROTARY MODE CORE SAMPLING D C Langlois E2 Consulting Engineers to J S Schofield Lockheed Martin Hanford Company June 12 1998
CGM-4 Letter PARTICULATE SAMPLING OF 241-S-110 DURING ROTARYMODE CORESAMPLING D C Langlois E2 Consulting Engineers to J S Schofield Lockheed Martin Hanford Company July 20 1998
CGM-5 Letter PARTICULATE SAMPLING OF 241-SX-102 DURING ROTARY MODE CORE SAMPLING D C Langlois E2 Consulting Engineers to J S Schofield Lockheed Martin Hanford Company July 22 1998
CGM-6 Letter PARTICULATE SAMPLING OF241-U-107 DURING ROTARY MODE CORE SAMPLING D C Langlois E2 Consulting Engineers to J S Schofield Lockheed Martin Hanford Company August 3 1998
CGM-7 Letter PARTICULATE SAMPLING OF 241-BY-105 DURING ROTARY MODE CORESAMPLING D C Langlois E2 Consulting Engineers to 1 S Schofield Lockheed Martin Hanford Company September 17 1998
CGM-8 Letter PARTICULATE SAMPLING OF 241-TX-I13 DURING ROTARY MODE CORESAMPLING D C Langlois E2 Consulting Engineers to J S Schofield Lockheed Martin Hanford Company March 15 1999
CGM-9 Letter PARTICULATE SAMPLING OF 241-TX-113 DURING ROTARY MODE CORE SAMPLING D C Langlois E2 Consulting Engineers to I S Schofield Lockheed Martin Hanford Company May 31 1999
Notices of Construction NOC-I DOEIRL-93-40 Radioactive Air Emissions Program Notice of Construction Rotary Mode Core-Sampling
Truck and Exhauster Approved by Letter AIR 93-707 A W Conklin WDOH to J E Rasmussen DOEIRL 7893
NOC-2 DOEIRL-94-118 Rev 0 Radioactive Air Emissions Program Notice of Construction for the Rotary Mode Core-Sampling Systems Three and Four Approved by Letter AIR 95-603 A W Conklin WDOH to J E Rasmussen DOERL 63095
NOC-3 DOERL-94-118 Rev 1 Radioactive Air Emissions Program Notice of Construction for the Rotary Mode Core-Sampling Systems Three and Four Approved by Letter AIR 98-301 W W Conklin WDOH to I E Rasmussen DOEIRL 3698
NOC-4 DOEIRL-97-70 Radioactive Air Emissions Program Notice of Construction for Rotary Mode Core- Sampling in SX Tank Farm Approved by Letter AIR 97-1 101 A W Conklin WDOH to J E Rasmussen DOEIRL 113097
NOC-5 USEPA Letter OAQ-107 (no title approving DOE submittal 97-EAP-590 dated 72997) A J Frankel USEPA to J E Rasrnussen DOEIRL 8497
NOC-5 USEPA Letter OAQ-107rsquo (nb title approving DOE submittal 97-EAP-723 dated 101797) A J Frankel USEPA to J E Rasmussen DOERL 11498
Note that both letters have ldquoOAQ-107rdquo following ldquoReply to Attn ofrdquo
G-2
RPP-4826 Rev I
Work Packages WP-I ES-94-00808 WP-2 ES-95-00258 WP-3 ES-95-00045 - WP-4 ES-95-00434 - WP-5 ws-97-00173 - WP-6 WS-97-00174 - WP-7 ws-97-00143 - WP-8 WS-97-00144 - WP-9 WS-97-00207 - WP-I 1 WS-97-00208 - WP-12 WS-98-00049 - WP-13 WS-97-00050 - WP-14 WS-97-00224 - WP- I5 WS-97-00225 - WP-16 WS-97-00230 - WP- I7 ws-97-0023 1 - WP-18 ES-97-00452 - WP-19 ES-97-00453 - WP-20 WS-98-00072 - WP-21 WS-98-00073 - WP-22 WS-98-00067 - WP-23 WS-98-00068 -
241-BY-IO6 Perform Rotary Core Sample [Riser IOB] 241-BY-I IO Rotary Core Sample [Risers 12B 7 IZB 41 241-BY-IO8 Obtain Rotary Core Sample [Risers 12A amp 71 241-BY-IO5 Rotary Mode Core Sample [Riser 12A] 241-SX-101 Rotary Mode Core Sample Riser 19 241-SX-101 Rotary Mode Core Sample Riser4 241-SX-103 Rotary Mode Core Sample Riser 7 241-SX-103 Rotary Mode Core Sample Riser I I 241-SX-105 RMCST Obtain Core Sample Riser 6 241-SX-105 RMCST Core Sample Riser 14 241-SX-102 Rotary Mode Core Sample Riser 8 241-SX-102 Rotary Mode Core Sample Riser 4 241-S-1 IO RMCST Obtain Core Sample Riser 6 241-S-1 IO RMCST Obtain Core Sample Riser 14 2414-107 RMCSTCore Sample Riser 7 241-U-107 RMCST Core Sample Riser 2 241-BY-IO5 RMCST Core Sample Riser 7 241-BY-IO5 RMCST Core Sample Riser 1 IB 241-TX-113 Rotary Core Sample Riser 3 241-TX-113 RMCST Core Sample Riser 5 241-TX-I 18 RMCST Core Sample Riser 9B 241-TX-I 18 RMCST Core Sample Riser 128
G-3
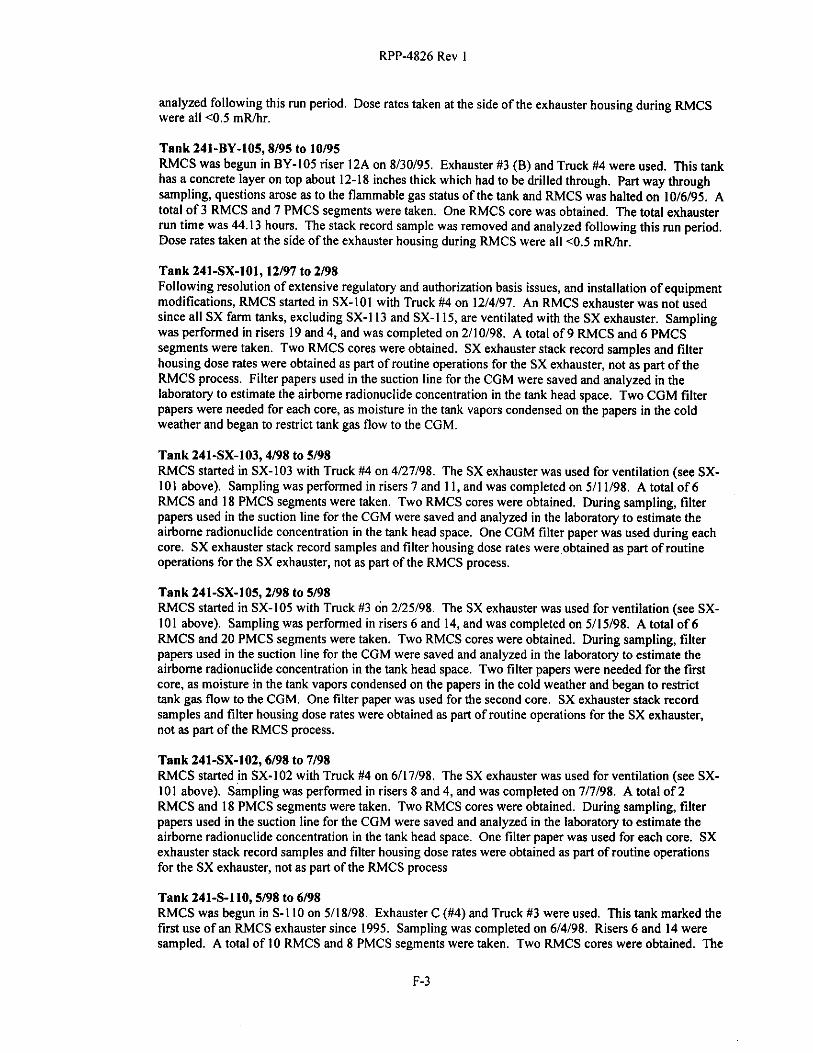
RPP-4826 Rev I
CGM Data CGM-I Letter PARTICULATE SAMPLING OF 241-SX-IO1 DURING ROTARY MODE CORE SAMPLING D C
Langlois E2 Consulting Engineers to J S Schofield Lockheed Martin Hanford Company March 16 1998
CGM-2 Letter PARTICULATE SAMPLING OF 241-SX-I05 DURING ROTARY MODE CORE SAMPLING D C Langlois E2 Consulting Engineers to J S Schofield Lockheed Martin Hanford Company June 9 1998
CGM-3 Letter PARTICULATE SAMPLING OF 241-SX-103 DURING ROTARY MODE CORE SAMPLING D C Langlois E2 Consulting Engineers to J S Schofield Lockheed Martin Hanford Company June 12 1998
CGM-4 Letter PARTICULATE SAMPLING OF 241-S-110 DURING ROTARYMODE CORESAMPLING D C Langlois E2 Consulting Engineers to J S Schofield Lockheed Martin Hanford Company July 20 1998
CGM-5 Letter PARTICULATE SAMPLING OF 241-SX-102 DURING ROTARY MODE CORE SAMPLING D C Langlois E2 Consulting Engineers to J S Schofield Lockheed Martin Hanford Company July 22 1998
CGM-6 Letter PARTICULATE SAMPLING OF241-U-107 DURING ROTARY MODE CORE SAMPLING D C Langlois E2 Consulting Engineers to J S Schofield Lockheed Martin Hanford Company August 3 1998
CGM-7 Letter PARTICULATE SAMPLING OF 241-BY-105 DURING ROTARY MODE CORESAMPLING D C Langlois E2 Consulting Engineers to 1 S Schofield Lockheed Martin Hanford Company September 17 1998
CGM-8 Letter PARTICULATE SAMPLING OF 241-TX-I13 DURING ROTARY MODE CORESAMPLING D C Langlois E2 Consulting Engineers to J S Schofield Lockheed Martin Hanford Company March 15 1999
CGM-9 Letter PARTICULATE SAMPLING OF 241-TX-113 DURING ROTARY MODE CORE SAMPLING D C Langlois E2 Consulting Engineers to I S Schofield Lockheed Martin Hanford Company May 31 1999
Notices of Construction NOC-I DOEIRL-93-40 Radioactive Air Emissions Program Notice of Construction Rotary Mode Core-Sampling
Truck and Exhauster Approved by Letter AIR 93-707 A W Conklin WDOH to J E Rasmussen DOEIRL 7893
NOC-2 DOEIRL-94-118 Rev 0 Radioactive Air Emissions Program Notice of Construction for the Rotary Mode Core-Sampling Systems Three and Four Approved by Letter AIR 95-603 A W Conklin WDOH to J E Rasmussen DOERL 63095
NOC-3 DOERL-94-118 Rev 1 Radioactive Air Emissions Program Notice of Construction for the Rotary Mode Core-Sampling Systems Three and Four Approved by Letter AIR 98-301 W W Conklin WDOH to I E Rasmussen DOEIRL 3698
NOC-4 DOEIRL-97-70 Radioactive Air Emissions Program Notice of Construction for Rotary Mode Core- Sampling in SX Tank Farm Approved by Letter AIR 97-1 101 A W Conklin WDOH to J E Rasmussen DOEIRL 113097
NOC-5 USEPA Letter OAQ-107 (no title approving DOE submittal 97-EAP-590 dated 72997) A J Frankel USEPA to J E Rasrnussen DOEIRL 8497
NOC-5 USEPA Letter OAQ-107rsquo (nb title approving DOE submittal 97-EAP-723 dated 101797) A J Frankel USEPA to J E Rasmussen DOERL 11498
Note that both letters have ldquoOAQ-107rdquo following ldquoReply to Attn ofrdquo
G-2
RPP-4826 Rev I
Work Packages WP-I ES-94-00808 WP-2 ES-95-00258 WP-3 ES-95-00045 - WP-4 ES-95-00434 - WP-5 ws-97-00173 - WP-6 WS-97-00174 - WP-7 ws-97-00143 - WP-8 WS-97-00144 - WP-9 WS-97-00207 - WP-I 1 WS-97-00208 - WP-12 WS-98-00049 - WP-13 WS-97-00050 - WP-14 WS-97-00224 - WP- I5 WS-97-00225 - WP-16 WS-97-00230 - WP- I7 ws-97-0023 1 - WP-18 ES-97-00452 - WP-19 ES-97-00453 - WP-20 WS-98-00072 - WP-21 WS-98-00073 - WP-22 WS-98-00067 - WP-23 WS-98-00068 -
241-BY-IO6 Perform Rotary Core Sample [Riser IOB] 241-BY-I IO Rotary Core Sample [Risers 12B 7 IZB 41 241-BY-IO8 Obtain Rotary Core Sample [Risers 12A amp 71 241-BY-IO5 Rotary Mode Core Sample [Riser 12A] 241-SX-101 Rotary Mode Core Sample Riser 19 241-SX-101 Rotary Mode Core Sample Riser4 241-SX-103 Rotary Mode Core Sample Riser 7 241-SX-103 Rotary Mode Core Sample Riser I I 241-SX-105 RMCST Obtain Core Sample Riser 6 241-SX-105 RMCST Core Sample Riser 14 241-SX-102 Rotary Mode Core Sample Riser 8 241-SX-102 Rotary Mode Core Sample Riser 4 241-S-1 IO RMCST Obtain Core Sample Riser 6 241-S-1 IO RMCST Obtain Core Sample Riser 14 2414-107 RMCSTCore Sample Riser 7 241-U-107 RMCST Core Sample Riser 2 241-BY-IO5 RMCST Core Sample Riser 7 241-BY-IO5 RMCST Core Sample Riser 1 IB 241-TX-113 Rotary Core Sample Riser 3 241-TX-113 RMCST Core Sample Riser 5 241-TX-I 18 RMCST Core Sample Riser 9B 241-TX-I 18 RMCST Core Sample Riser 128
G-3
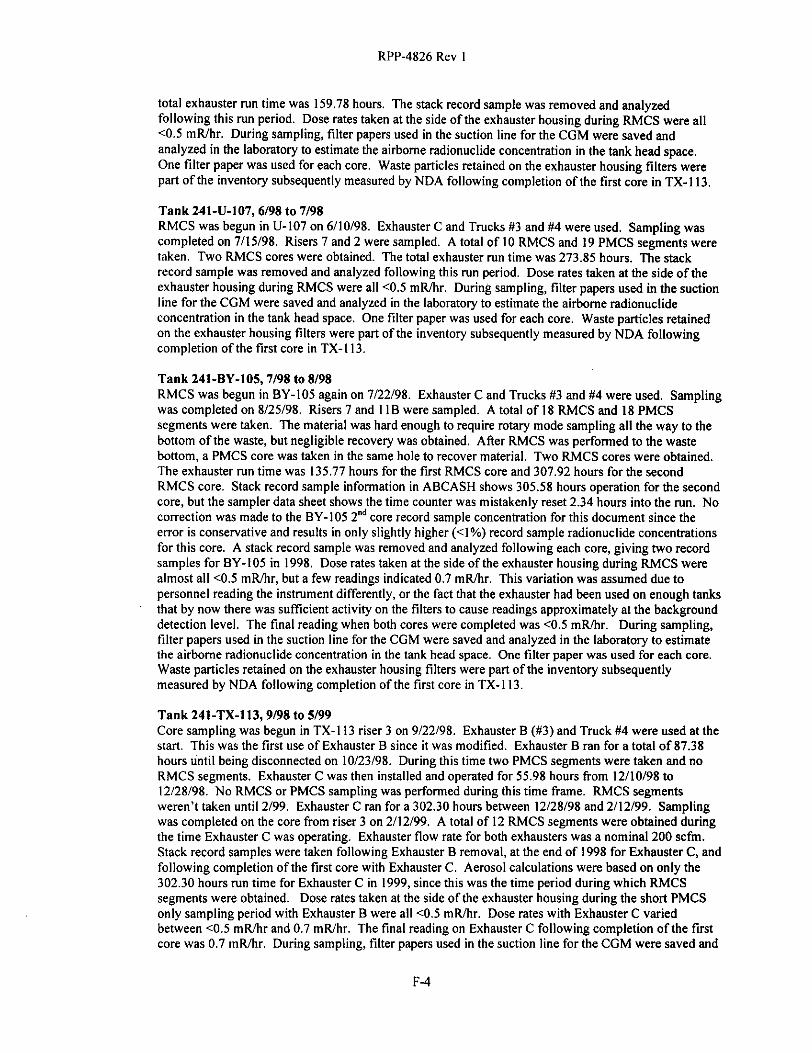
RPP-4826 Rev I
Work Packages WP-I ES-94-00808 WP-2 ES-95-00258 WP-3 ES-95-00045 - WP-4 ES-95-00434 - WP-5 ws-97-00173 - WP-6 WS-97-00174 - WP-7 ws-97-00143 - WP-8 WS-97-00144 - WP-9 WS-97-00207 - WP-I 1 WS-97-00208 - WP-12 WS-98-00049 - WP-13 WS-97-00050 - WP-14 WS-97-00224 - WP- I5 WS-97-00225 - WP-16 WS-97-00230 - WP- I7 ws-97-0023 1 - WP-18 ES-97-00452 - WP-19 ES-97-00453 - WP-20 WS-98-00072 - WP-21 WS-98-00073 - WP-22 WS-98-00067 - WP-23 WS-98-00068 -
241-BY-IO6 Perform Rotary Core Sample [Riser IOB] 241-BY-I IO Rotary Core Sample [Risers 12B 7 IZB 41 241-BY-IO8 Obtain Rotary Core Sample [Risers 12A amp 71 241-BY-IO5 Rotary Mode Core Sample [Riser 12A] 241-SX-101 Rotary Mode Core Sample Riser 19 241-SX-101 Rotary Mode Core Sample Riser4 241-SX-103 Rotary Mode Core Sample Riser 7 241-SX-103 Rotary Mode Core Sample Riser I I 241-SX-105 RMCST Obtain Core Sample Riser 6 241-SX-105 RMCST Core Sample Riser 14 241-SX-102 Rotary Mode Core Sample Riser 8 241-SX-102 Rotary Mode Core Sample Riser 4 241-S-1 IO RMCST Obtain Core Sample Riser 6 241-S-1 IO RMCST Obtain Core Sample Riser 14 2414-107 RMCSTCore Sample Riser 7 241-U-107 RMCST Core Sample Riser 2 241-BY-IO5 RMCST Core Sample Riser 7 241-BY-IO5 RMCST Core Sample Riser 1 IB 241-TX-113 Rotary Core Sample Riser 3 241-TX-113 RMCST Core Sample Riser 5 241-TX-I 18 RMCST Core Sample Riser 9B 241-TX-I 18 RMCST Core Sample Riser 128
G-3