Embed Size (px)
Citation preview

6 – 1Copyright © 2010 Pearson Education, Inc. Publishing as Prentice Hall.
Capacity PlanningCapacity Planning6
For For Operations Management, 9eOperations Management, 9e by by Krajewski/Ritzman/Malhotra Krajewski/Ritzman/Malhotra © 2010 Pearson Education© 2010 Pearson Education
Homework 5, 14,Homework 5, 14,Sup1, Sup2Sup1, Sup2

6 – 2Copyright © 2010 Pearson Education, Inc. Publishing as Prentice Hall.
Sup Homework #1Sup Homework #1
The following diagram shows a 4-step process that begins with Operation 1 and ends with Operation 4. The rates shown in each box represent the effective capacity of that operation.a.Determine the capacity of this process.b.Which action would yield the greatest increase in process capacity? 1. increase the capacity of operation 1 by 15%
2. increase the capacity of operation 2 by 10%3. increase the capacity of operation 3 by 10%
c. What is the new capacity of the process for each scenario?
11
12/hr.
22
15/hr.
33
11/hr.
44
14/hr.

6 – 3Copyright © 2010 Pearson Education, Inc. Publishing as Prentice Hall.
Sup Homework #2Sup Homework #2
A producer of pottery is considering the addition of a new plant to absorb the backlog of demand that now exists. The primary location being considered will have fixed costs of $9,200 per month and variable costs of 70 cents per unit produced. Each item is sold to retailers at a price that averages 90 cents.
a.What volume per month is required in order to break even?b.What profit would be realized on a monthly volume of 61,000 units, 87,000 units?c.What volume is needed to obtain a profit of $16,000 per month?d.What volume is needed to provide a revenue of $23,000 per month?e.Plot the total cost and total revenue lines.

6 – 4Copyright © 2010 Pearson Education, Inc. Publishing as Prentice Hall.

6 – 5Copyright © 2010 Pearson Education, Inc. Publishing as Prentice Hall.

6 – 6Copyright © 2010 Pearson Education, Inc. Publishing as Prentice Hall.
Planning CapacityPlanning Capacity
Capacity
Utilization
Overview of capacity planning Utilization Cushion Capacity Bottlenecks Estimating Capacity Requirements Decision Trees Cost-Volume Analysis
o Break Even Point Choosing Capacity (In / Out)
Learning Objectives
6 – 7Copyright © 2010 Pearson Education, Inc. Publishing as Prentice Hall.
Planning CapacityPlanning Capacity
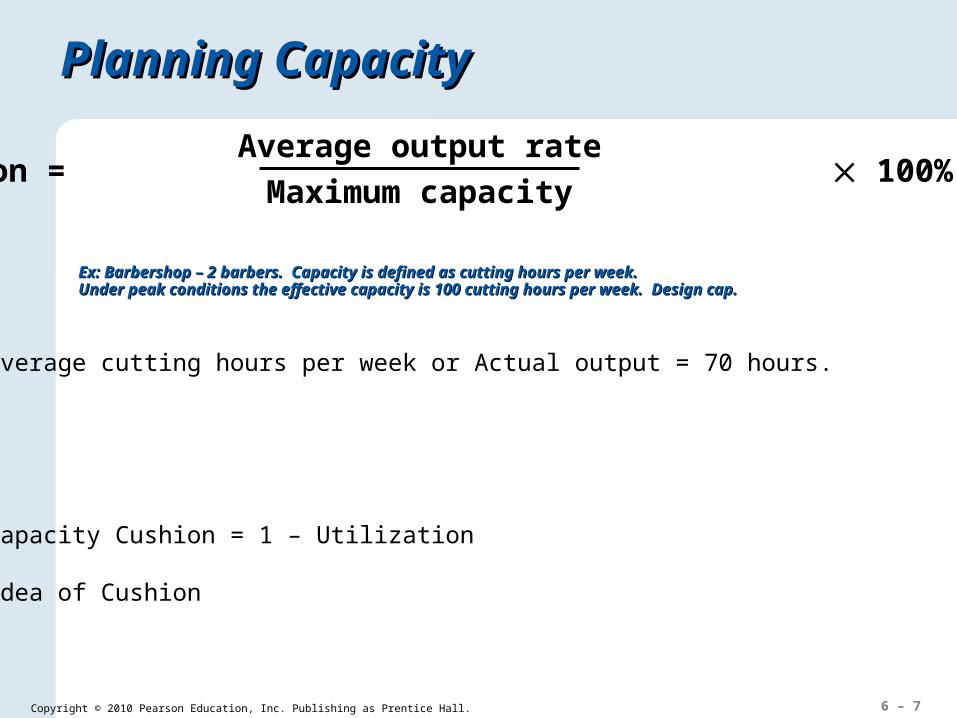
Utilization = 100%Average output rate
Maximum capacity
Ex: Barbershop – 2 barbers. Capacity is defined as cutting hours per week.Ex: Barbershop – 2 barbers. Capacity is defined as cutting hours per week.Under peak conditions the effective capacity is 100 cutting hours per week. Design cap.Under peak conditions the effective capacity is 100 cutting hours per week. Design cap.
Average cutting hours per week or Actual output = 70 hours.
Capacity Cushion = 1 – Utilization
Idea of Cushion

6 – 8Copyright © 2010 Pearson Education, Inc. Publishing as Prentice Hall.
CushionCushion
High Cushion
Low Cushion
6 – 9Copyright © 2010 Pearson Education, Inc. Publishing as Prentice Hall.
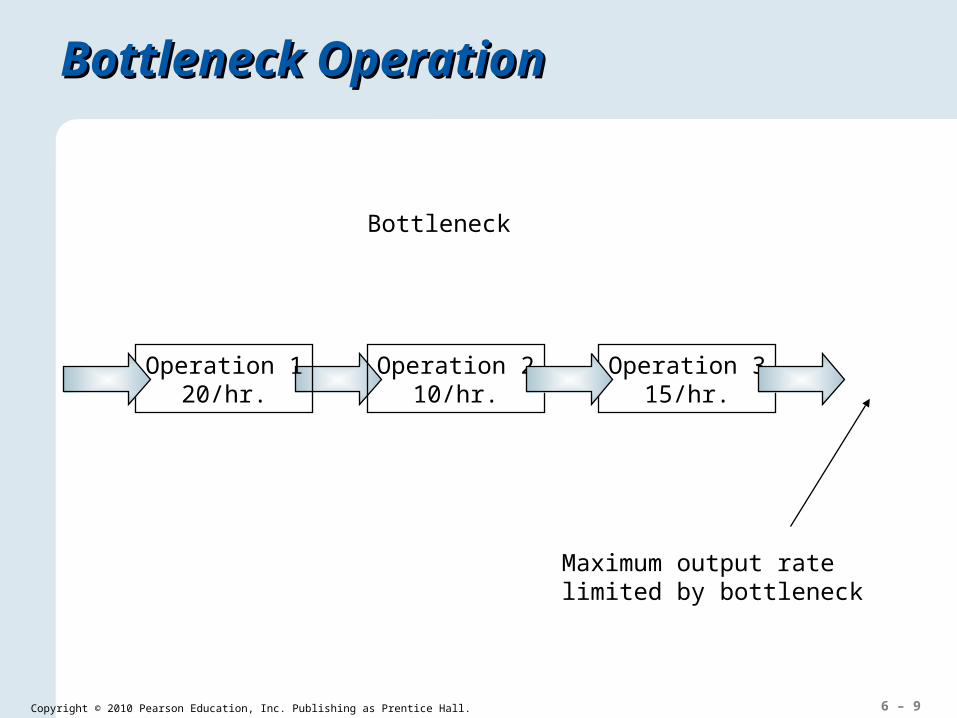
Bottleneck OperationBottleneck Operation
Operation 120/hr.
Operation 210/hr.
Operation 315/hr.
Bottleneck
Maximum output ratelimited by bottleneck

6 – 10Copyright © 2010 Pearson Education, Inc. Publishing as Prentice Hall.
The following diagram describes a process that consists of eight separate operations, with The following diagram describes a process that consists of eight separate operations, with sequential relationships and capacities (units per hour) as shown.sequential relationships and capacities (units per hour) as shown.
a. What is the current capacity of the entire process?a. What is the current capacity of the entire process?b. If you could increase the capacity of only two operations through process improvement efforts, which two b. If you could increase the capacity of only two operations through process improvement efforts, which two operations would you select, how much additional capacity would you strive for in each of those operations, operations would you select, how much additional capacity would you strive for in each of those operations, and what would the resulting capacity of the entire process be?and what would the resulting capacity of the entire process be?
11
15/hr.
22
10/hr.
33
20/hr.
44
5/hr.
55
8/hr.
66
12/hr.
77
34/hr.
88
30/hr.

6 – 11Copyright © 2010 Pearson Education, Inc. Publishing as Prentice Hall.
Tools for Capacity PlanningTools for Capacity Planning
Waiting-line models Useful in high customer-contact processes Supplement C, “Waiting Lines” is a fuller
treatment of the models
Simulation Can be used when models are too complex for
waiting-line analysis
Decision trees Useful when demand is uncertain and
sequential decisions are involved

6 – 12Copyright © 2010 Pearson Education, Inc. Publishing as Prentice Hall.
Decision TheoryDecision Theory
Helpful tool for financial comparison of alternatives under conditions of risk or uncertainty
Suited to capacity decisions See Supplement Decision Making

6 – 13Copyright © 2010 Pearson Education, Inc. Publishing as Prentice Hall.
Waiting-Line AnalysisWaiting-Line Analysis
Useful for designing or modifying service systems
Waiting-lines occur across a wide variety of service systems
Waiting-lines are caused by bottlenecks in the process
Helps managers plan capacity level that will be cost-effective by balancing the cost of having customers wait in line with the cost of additional capacity

6 – 14Copyright © 2010 Pearson Education, Inc. Publishing as Prentice Hall.
Planning Service CapacityPlanning Service Capacity
Need to be near customers Capacity and location are closely tied
Inability to store services Capacity must be matched with timing of
demand
Degree of volatility of demand Peak demand periods

6 – 15Copyright © 2010 Pearson Education, Inc. Publishing as Prentice Hall.
In-House or OutsourcingIn-House or Outsourcing
1. Available capacity
2. Expertise
3. Quality considerations
4. Nature of demand
5. Cost
6. Risk
Outsource: obtain a good or service from an external provider

6 – 16Copyright © 2010 Pearson Education, Inc. Publishing as Prentice Hall.
Determine the Break Even Quantity for purchasing 1, 2, and 3 machines.Determine the Break Even Quantity for purchasing 1, 2, and 3 machines.For all possible demand scenarios, determine profits.For all possible demand scenarios, determine profits.
Number of Machines
Total Annual Fixed Costs
Corresponding Range of Output
1 $ 9,600 0 to 300
2 15,000 301 to 600
3 20,000 601 to 900

6 – 17Copyright © 2010 Pearson Education, Inc. Publishing as Prentice Hall.

6 – 18Copyright © 2010 Pearson Education, Inc. Publishing as Prentice Hall.
Capacity and ScaleCapacity and Scale
Economies of scale Spreading fixed costs Reducing construction costs Cutting costs of purchased materials Finding process advantages
Diseconomies of scale Complexity Loss of focus Inefficiencies

6 – 19Copyright © 2010 Pearson Education, Inc. Publishing as Prentice Hall.
Capacity and ScaleCapacity and Scale
Figure 6.1 – Economies and Diseconomies of Scale
250-bed hospital
500-bed hospital
750-bed hospital
Output rate (patients per week)
Ave
rag
e u
nit
co
st
(do
llar
s p
er p
atie
nt)
Economies of scale
Diseconomies of scale

6 – 20Copyright © 2010 Pearson Education, Inc. Publishing as Prentice Hall.
Capacity Timing and SizingCapacity Timing and Sizing
Sizing capacity cushions
Capacity cushions are the amount of reserve capacity a process uses to handle sudden changes
Capacity cushion = 100% – Average Utilization rate (%)
Expansionist strategies
Wait-and-see strategies
Combination of strategies

6 – 21Copyright © 2010 Pearson Education, Inc. Publishing as Prentice Hall.
Capacity Timing and SizingCapacity Timing and Sizing
Planned unused capacity
Time
Cap
acit
y
Forecast of capacity required
Time between increments
Capacity increment
(a) Expansionist strategy
Figure 6.2 – Two Capacity Strategies

6 – 22Copyright © 2010 Pearson Education, Inc. Publishing as Prentice Hall.
Time
Cap
acit
y
(b) Wait-and-see strategy
Planned use of short-term options
Time between increments
Capacity increment
Capacity Timing and SizingCapacity Timing and Sizing
Forecast of capacity required
Figure 6.2 – Two Capacity Strategies

6 – 23Copyright © 2010 Pearson Education, Inc. Publishing as Prentice Hall.
Systematic ApproachSystematic Approach
For one service or product processed at one operation with a one year time period, the capacity requirement, M, is
Capacity requirement =
Processing hours required for year’s demand
Hours available from a single capacity unit (such as an employee or machine) per year,
after deducting desired cushion
M =Dp
N[1 – (C/100)]
whereD =demand forecast for the year (number of customers serviced or units of product)p =processing time (in hours per customer served or unit produced)N =total number of hours per year during which the process operatesC =desired capacity cushion (expressed as a percent)
6 – 24Copyright © 2010 Pearson Education, Inc. Publishing as Prentice Hall.
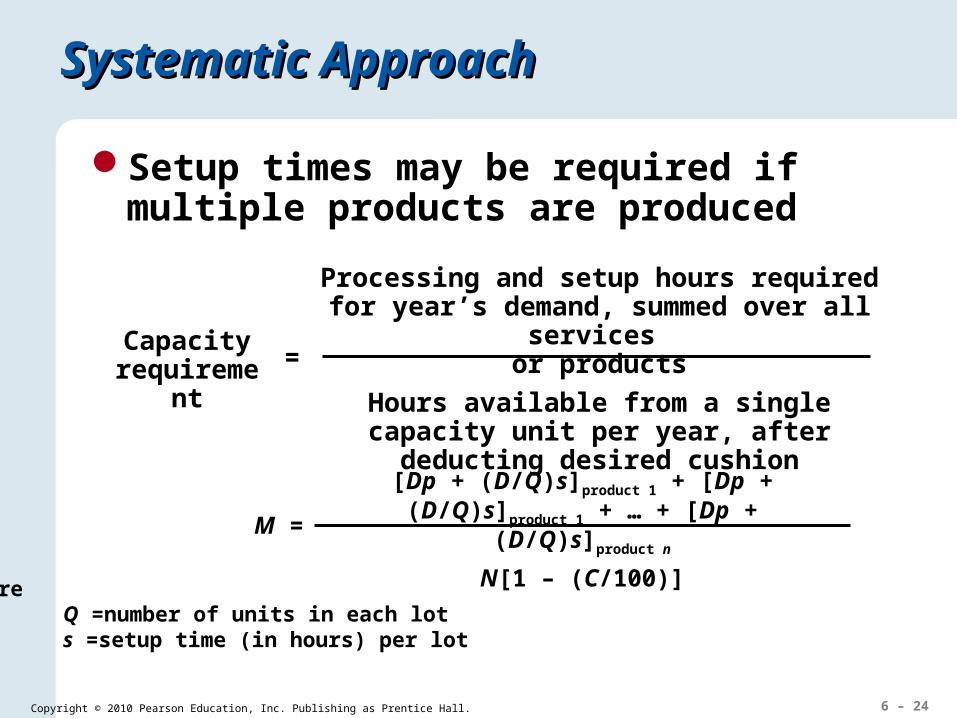
Systematic ApproachSystematic Approach
Setup times may be required if multiple products are produced
Capacity requirement =
Processing and setup hours required for year’s demand, summed over all services
or products
Hours available from a single capacity unit per year, after deducting desired cushion
M =
[Dp + (D/Q)s]product 1 + [Dp + (D/Q)s]product 1 + … + [Dp + (D/Q)s]product n
N[1 – (C/100)]
whereQ =number of units in each lots =setup time (in hours) per lot

6 – 25Copyright © 2010 Pearson Education, Inc. Publishing as Prentice Hall.
Estimating Capacity RequirementsEstimating Capacity Requirements
EXAMPLE 6.1
A copy center in an office building prepares bound reports for two clients. The center makes multiple copies (the lot size) of each report. The processing time to run, collate, and bind each copy depends on, among other factors, the number of pages. The center operates 250 days per year, with one 8-hour shift. Management believes that a capacity cushion of 15 percent (beyond the allowance built into time standards) is best. It currently has three copy machines. Based on the following table of information, determine how many machines are needed at the copy center.
Item Client X Client Y
Annual demand forecast (copies) 2,000 6,000
Standard processing time (hour/copy) 0.5 0.7
Average lot size (copies per report) 20 30
Standard setup time (hours) 0.25 0.40

6 – 26Copyright © 2010 Pearson Education, Inc. Publishing as Prentice Hall.
Estimating Capacity RequirementsEstimating Capacity Requirements
SOLUTION
M =[Dp + (D/Q)s]product 1 + [Dp + (D/Q)s]product 1 + … + [Dp + (D/Q)s]product n
N[1 – (C/100)]
Rounding up to the next integer gives a requirement of ____ machines.

6 – 27Copyright © 2010 Pearson Education, Inc. Publishing as Prentice Hall.
Solved Problem 1Solved Problem 1
You have been asked to put together a capacity plan for a critical operation at the Surefoot Sandal Company. Your capacity measure is number of machines. Three products (men’s, women’s, and children’s sandals) are manufactured. The time standards (processing and setup), lot sizes, and demand forecasts are given in the following table. The firm operates two 8-hour shifts, 5 days per week, 50 weeks per year. Experience shows that a capacity cushion of 5 percent is sufficient.
a. How many machines are needed? If no setup or production in lots?b. If the operation currently has two machines, what is the capacity gap?
Time Standards
Product Processing(hr/pair)
Setup(hr/pair)
Lot size(pairs/lot)
Demand Forecast(pairs/yr)
Men’s sandals 0.05 0.5 240 80,000
Women’s sandals 0.10 2.2 180 60,000
Children’s sandals 0.02 3.8 360 120,000

6 – 28Copyright © 2010 Pearson Education, Inc. Publishing as Prentice Hall.
Solved Problem 1Solved Problem 1
SOLUTION
a. The number of hours of operation per year, N, is N = (2 shifts/day)(8 hours/shifts) (250 days/machine-year) = 4,000 hours/machine-year
The number of machines required, M, is the sum of machine-hour requirements for all three products divided by the number of productive hours available for one machine:
M = [Dp + (D/Q)s]men + [Dp + (D/Q)s]women + [Dp + (D/Q)s]children
N[1 - (C/100)]