Embed Size (px)
Citation preview

I – 1Copyright © 2010 Pearson Education, Inc. Publishing as Prentice Hall.
Learning Curve AnalysisLearning Curve AnalysisI
For For Operations Management, 9eOperations Management, 9e by by Krajewski/Ritzman/Malhotra Krajewski/Ritzman/Malhotra © 2010 Pearson Education© 2010 Pearson Education
PowerPoint Slides PowerPoint Slides by Jeff Heylby Jeff Heyl

I – 2Copyright © 2010 Pearson Education, Inc. Publishing as Prentice Hall.
The Learning Effect The Learning Effect
Organizational learning Automation Productivity improvements
Learning effect Relationship between total direct labor per unit
and the cumulative quantity produced Sometimes called manufacturing progress
function or experience curve

I – 3Copyright © 2010 Pearson Education, Inc. Publishing as Prentice Hall.
The Learning Effect The Learning Effect
Background First developed in aircraft industry Rate may be different for different products and
different companies
Learning curves and competitive strategy Project the manufacturing cost per unit Product design changes disrupt the learning
effect Costs decrease as products move down the
learning curve

I – 4Copyright © 2010 Pearson Education, Inc. Publishing as Prentice Hall.
Learning curve
Standard time
Learning period
0.30 –
0.25 –
0.20 –
0.15 –
0.10 –
0.05 –
0 –| | | | | |
50 100 150 200 250 300
Cumulative units produced
Pro
cess
tim
e p
er u
nit
(h
r)
Learning CurveLearning Curve
Figure I.1 – Learning Curve, Showing the Learning Period and the Time When Standards Are Calculated

I – 5Copyright © 2010 Pearson Education, Inc. Publishing as Prentice Hall.
Developing Learning Curves Developing Learning Curves
In developing learning curves we make the following assumptions The direct labor required to produce the n + 1st
unit will always be less than the direct time of labor required for the nth unit
Direct labor requirements will decrease at a declining rate as cumulative production increases
The reduction in time will follow an exponential curve

I – 6Copyright © 2010 Pearson Education, Inc. Publishing as Prentice Hall.
Developing Learning Curves Developing Learning Curves
Using a logarithmic model to draw a learning curve, the direct labor required for the nth unit, kn, is
kn = k1nb
where
k1 =direct labor hours for the first unitn =cumulative numbers of units produced
r =learning rate (as decimal)
2loglog r
b
Doubling of the quantity reduces the time per unit by (1 – r)

I – 7Copyright © 2010 Pearson Education, Inc. Publishing as Prentice Hall.
Developing Learning Curves Developing Learning Curves
TABLE I.1 | CONVERSION FACTORS FOR THE CUMULATIVE AVERAGE| NUMBER OF DIRECT LABOR HOURS PER UNIT
80% Learning Rate(n = cumulative production)
n n n
1 1.00000 11 0.61613 21 0.51715
2 0.90000 12 0.60224 22 0.51045
3 0.83403 13 0.58960 23 0.50410
4 0.78553 14 0.57802 24 0.49808
5 0.74755 15 0.56737 25 0.49234
6 0.71657 16 0.55751 26 0.48688
7 0.69056 17 0.54834 27 0.48167
8 0.66824 18 0.53979 28 0.47668
9 0.64876 19 0.53178 29 0.47191
10 0.63154 20 0.52425 30 0.46733

I – 8Copyright © 2010 Pearson Education, Inc. Publishing as Prentice Hall.
Developing Learning Curves Developing Learning Curves
TABLE I.1 | CONVERSION FACTORS FOR THE CUMULATIVE AVERAGE| NUMBER OF DIRECT LABOR HOURS PER UNIT
90% Learning Rate(n = cumulative production)
n n n
1 1.00000 11 0.78991 21 0.72559
2 0.95000 12 0.78120 22 0.72102
3 0.91540 13 0.77320 23 0.71666
4 0.88905 14 0.76580 24 0.71251
5 0.86784 15 0.75891 25 0.70853
6 0.85013 16 0.75249 26 0.70472
7 0.83496 17 0.74646 27 0.70106
8 0.82172 18 0.74080 28 0.69754
9 0.80998 19 0.73545 29 0.69416
10 0.79945 20 0.73039 30 0.69090
I – 9Copyright © 2010 Pearson Education, Inc. Publishing as Prentice Hall.
Using Learning CurvesUsing Learning Curves
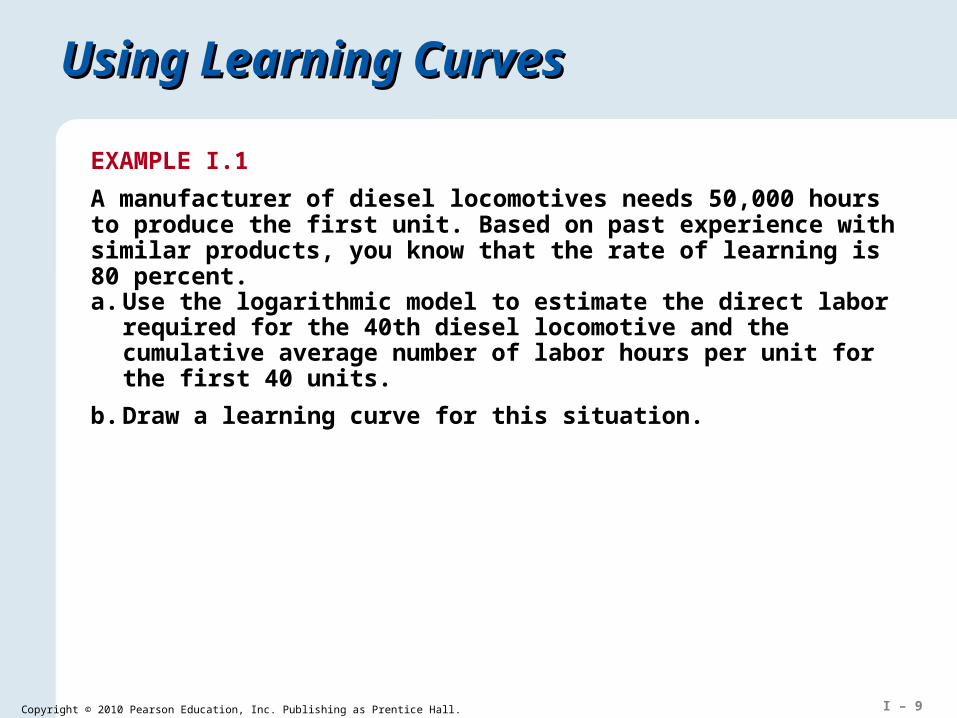
EXAMPLE I.1
A manufacturer of diesel locomotives needs 50,000 hours to produce the first unit. Based on past experience with similar products, you know that the rate of learning is 80 percent.
a. Use the logarithmic model to estimate the direct labor required for the 40th diesel locomotive and the cumulative average number of labor hours per unit for the first 40 units.
b. Draw a learning curve for this situation.

I – 10Copyright © 2010 Pearson Education, Inc. Publishing as Prentice Hall.
Using Learning CurvesUsing Learning Curves
SOLUTION
a. The estimated number of direct labor hours required to produce the 40th unit is
k40 = 50,000(40)(log 0.8)/(log 2) = 50,000(40)–0.322 = 50,000(0.30488)
= 15,248 hours
We calculate the cumulative average number of direct labor hours per unit for the first 40 units with the help of Table I.1. For a cumulative production of 40 units and an 80 percent learning rate, the factor is 0.42984. The cumulative average direct labor hours per unit is 50,000(0.42984) = 21,492 hours.

I – 11Copyright © 2010 Pearson Education, Inc. Publishing as Prentice Hall.
Using Learning CurvesUsing Learning Curves
b. Plot the first point at (1, 50,000). The second unit‘s labor time is 80 percent of the first, so multiply 50,000(0.80) = 40,000 hours. Plot the second point at (2, 40,000). The fourth is 80 percent of the second, so multiply 40,000(0.80) = 32,000 hours. Plot the point (4, 32,000). The result is shown in Figure I.2.
50 –
40 –
30 –
20 –
10 –
0 –| | | | | | |
40 80 120 160 200 240 280Cumulative units produced
Dir
ect
lab
or
ho
urs
pe
r lo
com
oti
ve (
tho
usa
nd
s)
Figure I.2 – The 80 Percent Learning Curve

I – 12Copyright © 2010 Pearson Education, Inc. Publishing as Prentice Hall.
Application I.1Application I.1
The first unit of a new product is expected to take 1000 hours to complete. If the rate of learning is 80 percent, how much time should the 50th unit take?
SOLUTION
Given
k1 = 1,000 n = 50 r = 0.80
kn = k1nb
k50 = 1000(50)(log 0.8/log 2)
= 1000(50)–0.32192
= 1000(0.283827)
k50 = 283.8 hours
I – 13Copyright © 2010 Pearson Education, Inc. Publishing as Prentice Hall.
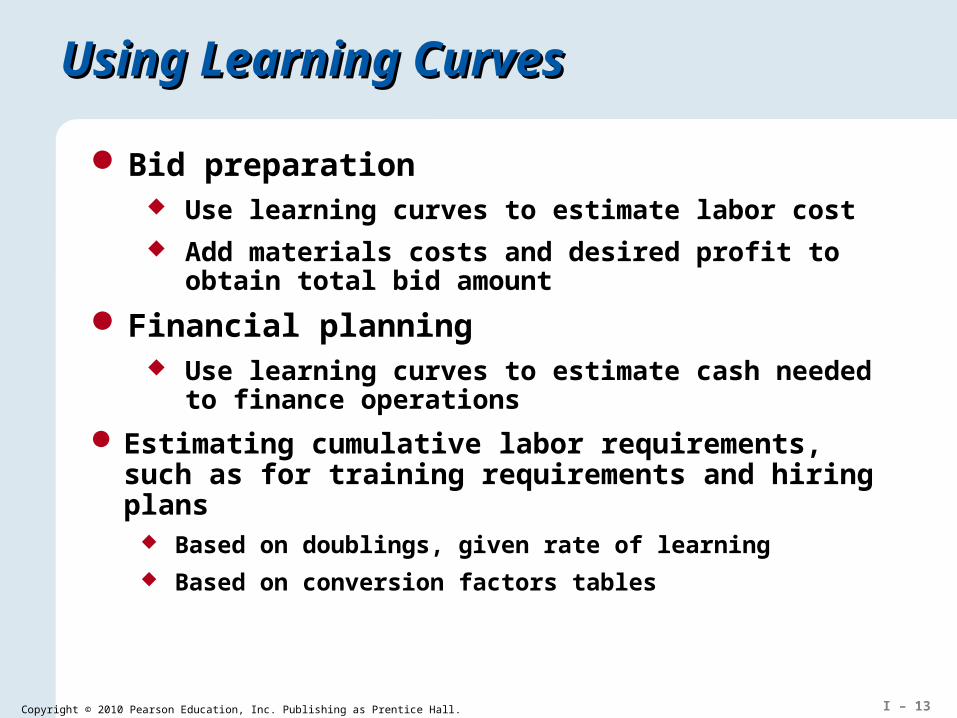
Bid preparation Use learning curves to estimate labor cost Add materials costs and desired profit to obtain total
bid amount
Using Learning CurvesUsing Learning Curves
Financial planning Use learning curves to estimate cash needed to finance
operations
Estimating cumulative labor requirements, such as for training requirements and hiring plans
Based on doublings, given rate of learning Based on conversion factors tables

I – 14Copyright © 2010 Pearson Education, Inc. Publishing as Prentice Hall.
Using Learning CurvesUsing Learning Curves
EXAMPLE I.2
The manager of a custom manufacturer has just received a production schedule for an order for 30 large turbines. Over the next 5 months, the company is to produce 2, 3, 5, 8, and 12 turbines, respectively. The first unit took 30,000 direct labor hours, and experience on past projects indicates that a 90 percent learning curve is appropriate; therefore, the second unit will require only 27,000 hours. Each employee works an average of 150 hours per month. Estimate the total number of full-time employees needed each month for the next 5 months.

I – 15Copyright © 2010 Pearson Education, Inc. Publishing as Prentice Hall.
Using Learning CurvesUsing Learning Curves
SOLUTION
The following table shows the production schedule and cumulative number of units scheduled for production through each month:
Month Units per Month Cumulative Units
1 2 2
2 3 5
3 5 10
4 8 18
5 12 30

I – 16Copyright © 2010 Pearson Education, Inc. Publishing as Prentice Hall.
Using Learning CurvesUsing Learning Curves
We first need to find the cumulative average time per unit using Table I.1 and the cumulative total hours through each month. We then can determine the number of labor hours needed each month. The calculations for months 1 – 5 follow.
Month Cumulative Average Time
per UnitCumulative Total Hours
for All Units
1 30,000(0.95000) = 28,500.0 (2)28,500.0 = 57,000
2 30,000(0.86784) = 26,035.2 (5)26,035.2 = 130,176
3 30,000(0.79945) = 23,983.5 (10)23,983.5 = 239,835
4 30,000(0.74080) = 22,224.0 (18)22,224.0 = 400,032
5 30,000(0.69090) = 20,727.0 (30)20,727.0 = 621,810

I – 17Copyright © 2010 Pearson Education, Inc. Publishing as Prentice Hall.
Using Learning CurvesUsing Learning Curves
Calculate the number of hours needed for a particular month by subtracting its cumulative total hours from that of the previous month.
Month 1:
Month 2:
Month 3:
Month 4:
Month 5:
57,000 – 0 = 57,000 hours
130,176 – 57,000 = 73,176 hours
239,835 – 130,176 = 109,659 hours
400,032 – 239,835 = 160,197 hours
621,810 – 400,032 = 221,778 hours

I – 18Copyright © 2010 Pearson Education, Inc. Publishing as Prentice Hall.
Using Learning CurvesUsing Learning Curves
The required number of employees equals the number of hours needed each month divided by 150, the number of hours each employee can work.
Month 1:
Month 2:
Month 3:
Month 4:
Month 5:
57,000/150 = 380 employees
73,176/150 = 488 employees
109,659/150 = 731 employees
160,197/150 = 1,068 employees
221,778/150 = 1,479 employees

I – 19Copyright © 2010 Pearson Education, Inc. Publishing as Prentice Hall.
Application I.2Application I.2
A company has a contract to make a product for the first time. The total budget for the 38-unit job is 15,000 hours. The first unit took 1000 hours, and the rate of learning is expected to be 80 percent.
a. Do you think the 38-unit job can be completed within the 15,000-hour budget?
b. How many additional hours would you need for a second job of 26 additional units?

I – 20Copyright © 2010 Pearson Education, Inc. Publishing as Prentice Hall.
Application I.2Application I.2
SOLUTION
a.
Average38 =
Total38 =
b.
They will have trouble meeting the 15,000 hour budget
Average64 =
Total64 =
Total64 – Total38 =
=
1000(0.43634) = 436.34
436.34(38) = 16,581 hours
1000(0.37382) = 373.82
373.82(64) = 23,924 hours
23,924 – 16,581
7,343 additional hours required
I – 21Copyright © 2010 Pearson Education, Inc. Publishing as Prentice Hall.
Managerial Considerations Managerial Considerations
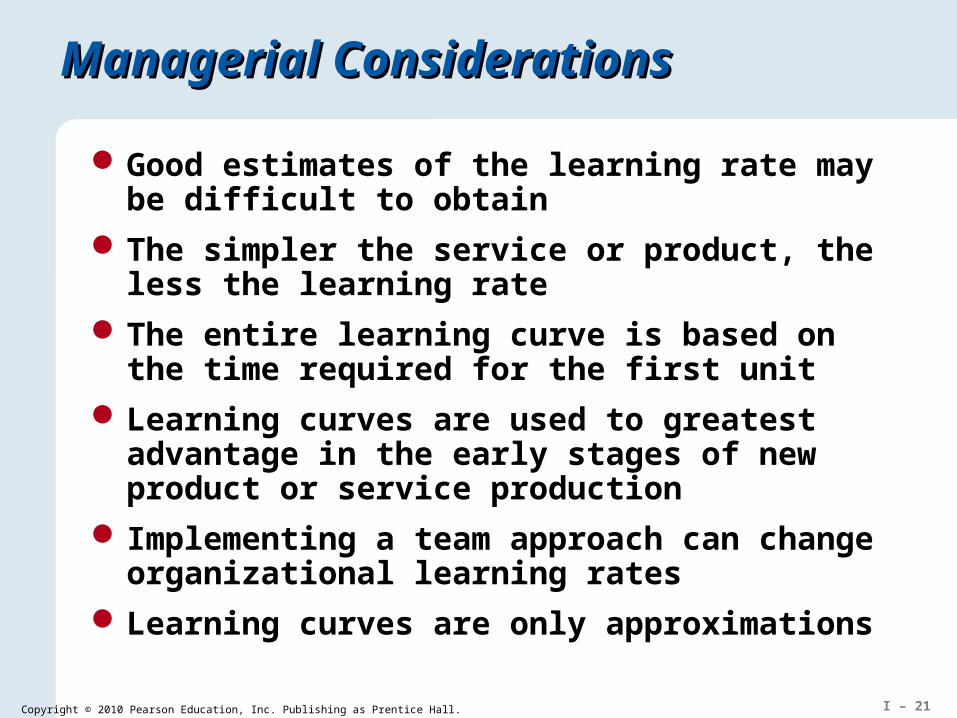
Good estimates of the learning rate may be difficult to obtain
The simpler the service or product, the less the learning rate
The entire learning curve is based on the time required for the first unit
Learning curves are used to greatest advantage in the early stages of new product or service production
Implementing a team approach can change organizational learning rates
Learning curves are only approximations

I – 22Copyright © 2010 Pearson Education, Inc. Publishing as Prentice Hall.
Solved ProblemSolved Problem
The Minnesota Coach Company has just been given the following production schedule for ski-lift gondola cars. This product is considerably different from any others the company has produced. Historically, the company‘s learning rate has been 80 percent on large projects. The first unit took 1,000 hours to produce.
Month Units Cumulative Units
1 3 3
2 7 10
3 10 20
4 12 32
5 4 36
6 2 38

I – 23Copyright © 2010 Pearson Education, Inc. Publishing as Prentice Hall.
Solved ProblemSolved Problem
a. Estimate how many hours would be required to complete the 38th unit.
b. If the budget only provides for a maximum of 30 direct labor employees in any month and a total of 15,000 direct labor hours for the entire schedule, will the budget be adequate? Assume that each direct labor employee is productive for 150 work hours each month.
SOLUTION
a. We use the learning curve formulas to calculate the time required for the 38th unit:
2log
log rb 3220
301030096910
280
...
log.log
(1,000 hours)(38)–0.322 = 310 hourskn = k1nb =

I – 24Copyright © 2010 Pearson Education, Inc. Publishing as Prentice Hall.
(834.03 hr/u)(3 u) = 2,502.1 hr1,000(0.83403) = 834.03 hr/u
1,000(0.63154) = 631.54 hr/u (631.54 hr/u)(10 u) = 6,315.4 hr
1,000(0.52425) = 524.25 hr/u (524.25 hr/u)(20 u) = 10,485.0 hr
1,000(0.45871) = 458.71 hr/u (458.71 hr/u)(32 u) = 14,678.7 hr
1,000(0.44329) = 443.29 hr/u (443.29 hr/u)(36 u) = 15,958.4 hr
1,000(0.43634) = 436.34 hr/u (436.34 hr/u)(38 u) = 16,580.9 hr
Solved ProblemSolved Problem
b. Table I.1 gives the data needed to calculate the cumulative number of hours through each month of the schedule. Table I.2 shows these calculations.
TABLE I.2 | CUMULATIVE TOTAL HOURS
MonthCumulative
UnitsCumulative Average
Time per UnitCumulative Total Hours
for All Units
1 3
2 10
3 20
4 32
5 36
6 38

I – 25Copyright © 2010 Pearson Education, Inc. Publishing as Prentice Hall.
(2,502.1 hr)/(150 hr) = 16.7, or 172,502.1 – 0 = 2,502.1 hr
6,315.4 – 2,502.1 = 3,813.3 hr (3,813.3 hr)/(150 hr) = 25.4, or 26
10,485.0 – 6,315.4 = 4,169.6 hr (4,169.6 hr)/(150 hr) = 27.8, or 28
14,678.7 – 10,485.0 = 4,193.7 hr (4,193.7 hr)/(150 hr) = 27.9, or 28
15,958.4 – 14,678.7 = 1,279.7 hr (1,279.7 hr)/(150 hr) = 8.5, or 9
16,580.9 – 15,958.4 = 622.5 hr (622.5 hr)/(150 hr) = 4.2, or 5
Solved ProblemSolved Problem
The cumulative amount of time needed to produce the entire schedule of 38 units is 16,580.9 hours, which exceeds the 15,000 hours budgeted. By finding how much the cumulative total hours increased each month, we can break the total hours into monthly requirements. Finally, the number of employees required is simply the monthly hours divided by 150 hours per employee per month. The calculations are shown in Table I.3.
TABLE I.3 | DIRECT LABOR EMPLOYEES
Month Cumulative Total Hours for Month Direct Labor Workers by Month
1
2
3
4
5
6

I – 26Copyright © 2010 Pearson Education, Inc. Publishing as Prentice Hall.
Solved ProblemSolved Problem
The schedule is feasible in terms of the maximum direct labor required in any month because it never exceeds 28 employees. However, the total cumulative hours are 16,581, which exceeds the budgeted amount by 1,581 hours. Therefore, the budget will not be adequate.

I – 27Copyright © 2010 Pearson Education, Inc. Publishing as Prentice Hall.