Embed Size (px)
Citation preview
To Accompany Krajewski & Ritzman Operations Management: Strategy and Analysis, Sixth Edition © 2002 Prentice Hall, Inc. All rights reserved.
Chapter 8 -Chapter 8 -
CapacityCapacity
To Accompany Krajewski & Ritzman Operations Management: Strategy and Analysis, Sixth Edition © 2002 Prentice Hall, Inc. All rights reserved.
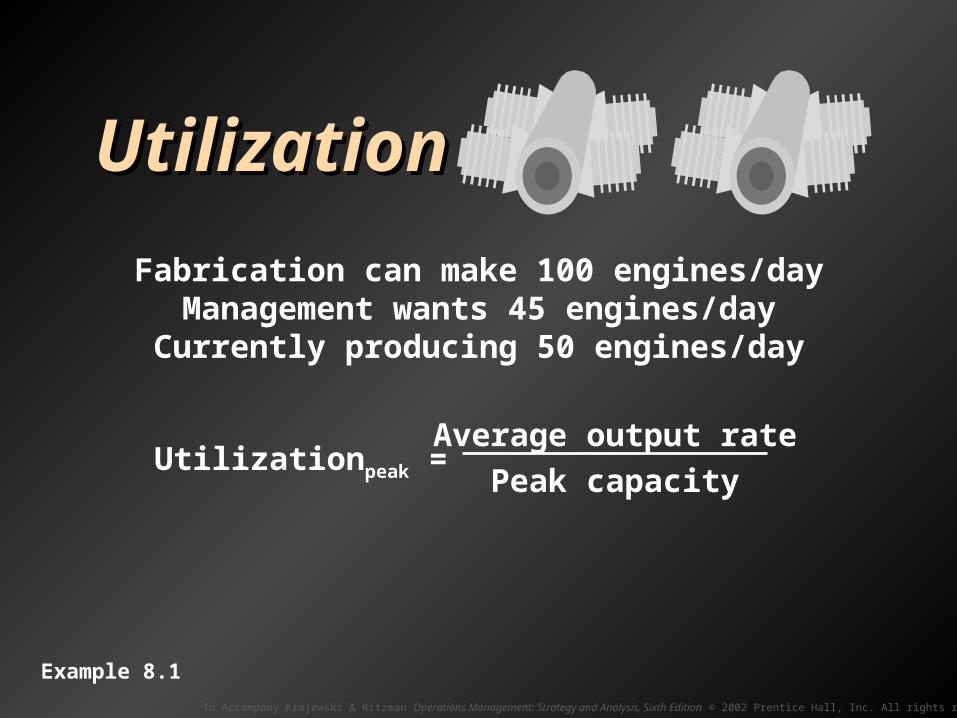
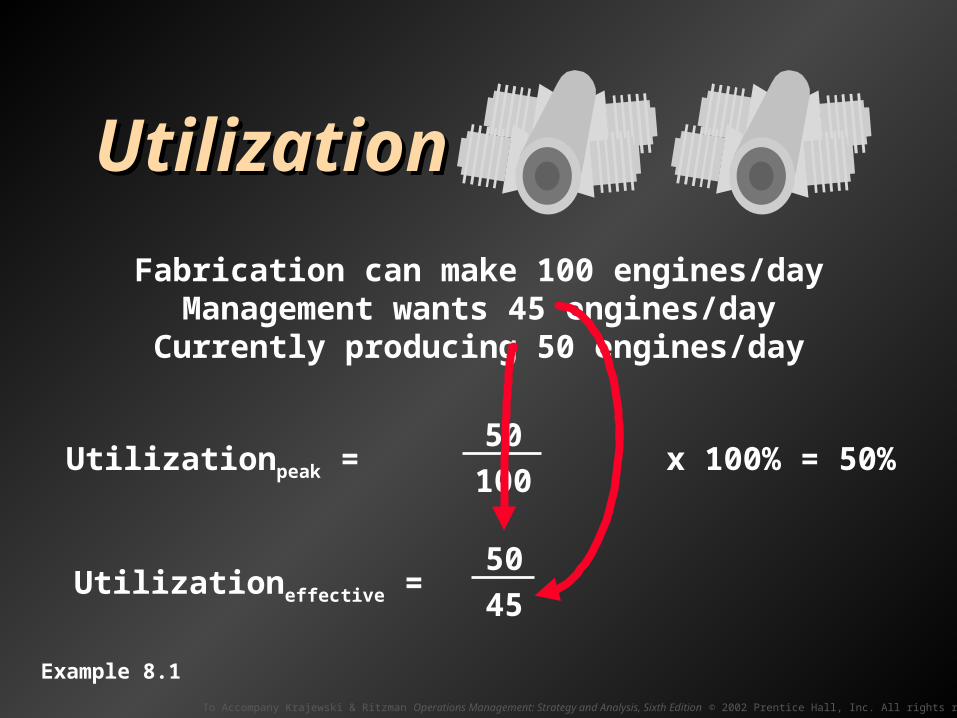
UtilizationUtilization
To Accompany Krajewski & Ritzman Operations Management: Strategy and Analysis, Sixth Edition © 2002 Prentice Hall, Inc. All rights reserved.
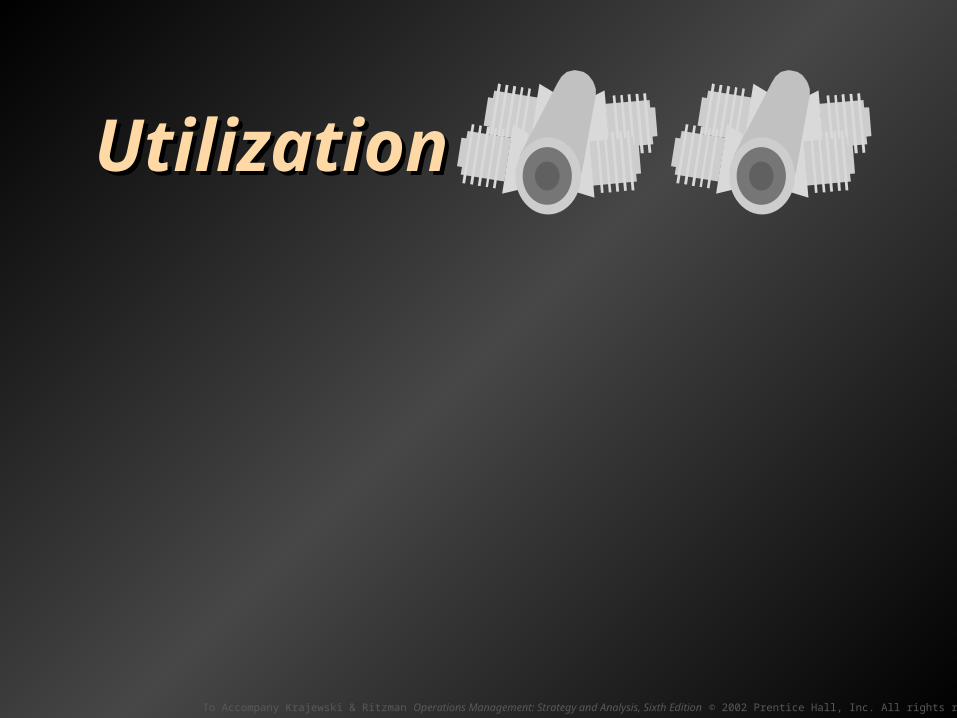
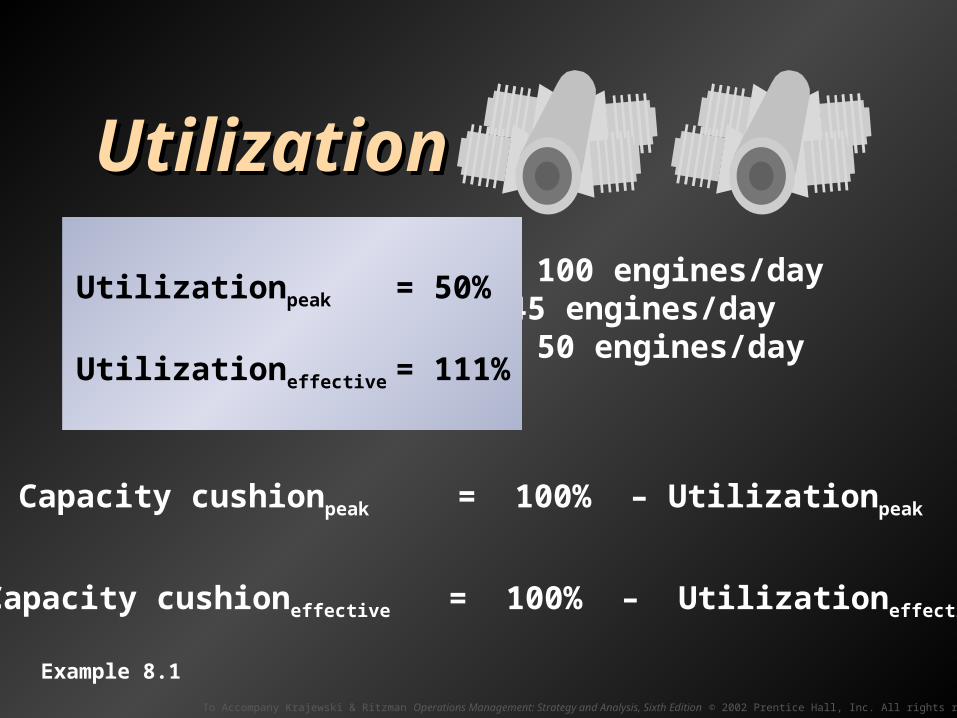
UtilizationUtilization
Fabrication can make 100 engines/dayManagement wants 45 engines/dayCurrently producing 50 engines/day
Example 8.1
To Accompany Krajewski & Ritzman Operations Management: Strategy and Analysis, Sixth Edition © 2002 Prentice Hall, Inc. All rights reserved.
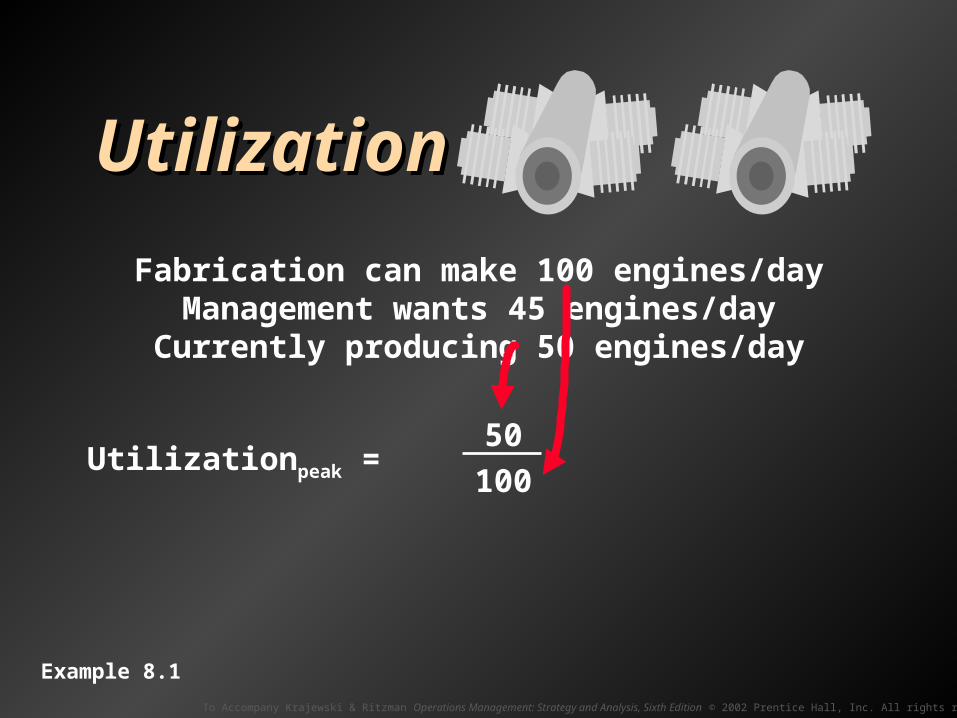
UtilizationUtilization
Fabrication can make 100 engines/dayManagement wants 45 engines/dayCurrently producing 50 engines/day
Utilizationpeak = Average output rate
Peak capacity
Example 8.1
To Accompany Krajewski & Ritzman Operations Management: Strategy and Analysis, Sixth Edition © 2002 Prentice Hall, Inc. All rights reserved.
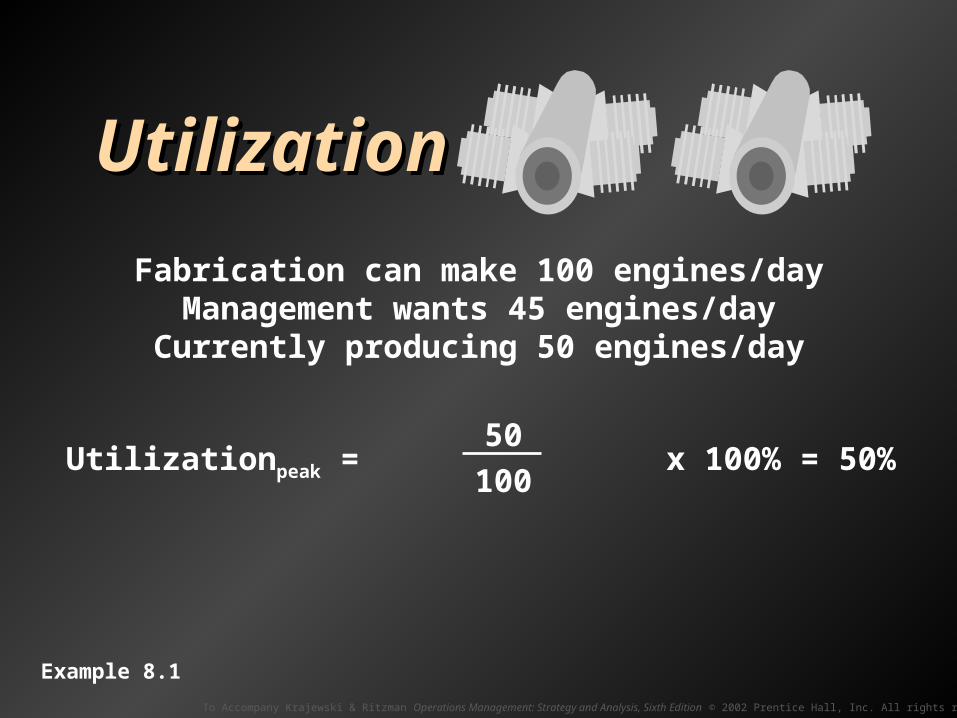
UtilizationUtilization
Fabrication can make 100 engines/dayManagement wants 45 engines/dayCurrently producing 50 engines/day
Utilizationpeak = 50
100
Example 8.1
To Accompany Krajewski & Ritzman Operations Management: Strategy and Analysis, Sixth Edition © 2002 Prentice Hall, Inc. All rights reserved.
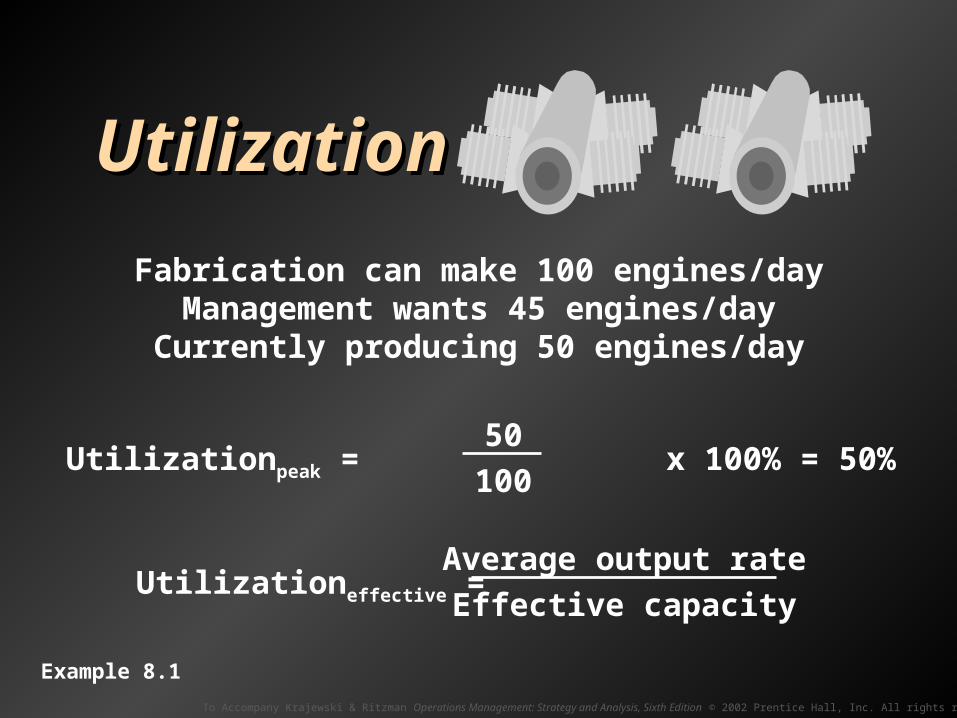
UtilizationUtilization
Fabrication can make 100 engines/dayManagement wants 45 engines/dayCurrently producing 50 engines/day
Utilizationpeak = x 100% = 50%50
100
Example 8.1
To Accompany Krajewski & Ritzman Operations Management: Strategy and Analysis, Sixth Edition © 2002 Prentice Hall, Inc. All rights reserved.
UtilizationUtilization
Fabrication can make 100 engines/dayManagement wants 45 engines/dayCurrently producing 50 engines/day
Utilizationpeak = x 100% = 50%50
100
Utilizationeffective = Average output rate
Effective capacity
Example 8.1
To Accompany Krajewski & Ritzman Operations Management: Strategy and Analysis, Sixth Edition © 2002 Prentice Hall, Inc. All rights reserved.
UtilizationUtilization
Fabrication can make 100 engines/dayManagement wants 45 engines/dayCurrently producing 50 engines/day
Utilizationpeak = x 100% = 50%50
100
Utilizationeffective = 50
45
Example 8.1
To Accompany Krajewski & Ritzman Operations Management: Strategy and Analysis, Sixth Edition © 2002 Prentice Hall, Inc. All rights reserved.
UtilizationUtilization
Fabrication can make 100 engines/dayManagement wants 45 engines/dayCurrently producing 50 engines/day
Utilizationpeak = x 100% = 50%50
100
Utilizationeffective = x 100% = 111%50
45
Example 8.1
To Accompany Krajewski & Ritzman Operations Management: Strategy and Analysis, Sixth Edition © 2002 Prentice Hall, Inc. All rights reserved.
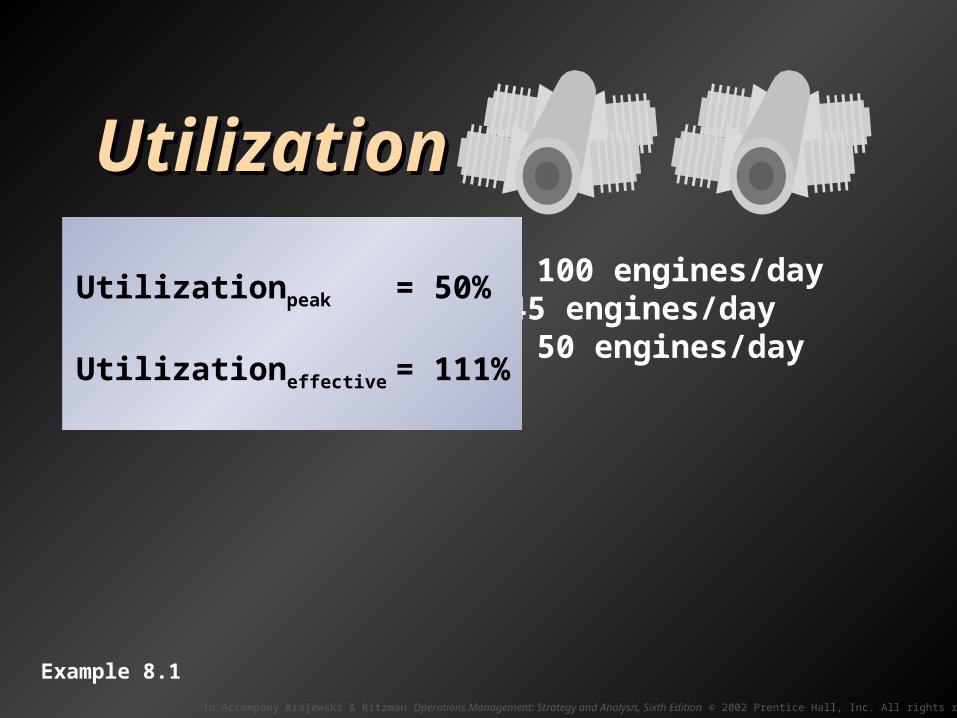
UtilizationUtilization
Fabrication can make 100 engines/dayManagement wants 45 engines/dayCurrently producing 50 engines/day
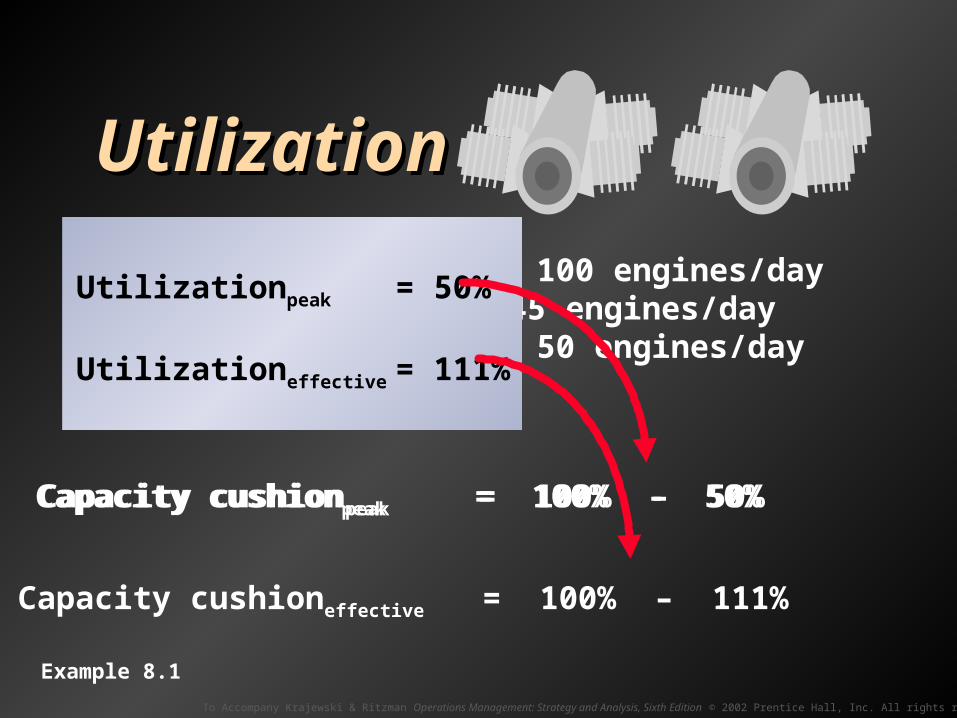
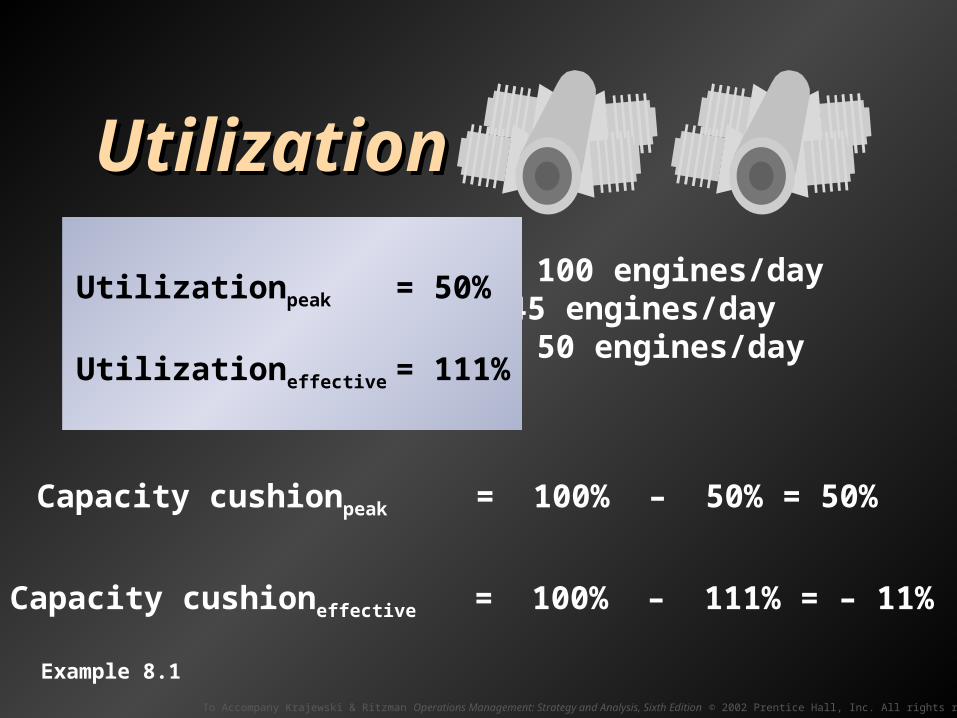
Utilizationpeak = 50%
Utilizationeffective = 111%
Example 8.1
To Accompany Krajewski & Ritzman Operations Management: Strategy and Analysis, Sixth Edition © 2002 Prentice Hall, Inc. All rights reserved.
UtilizationUtilization
Fabrication can make 100 engines/dayManagement wants 45 engines/dayCurrently producing 50 engines/day
Capacity cushionpeak = 100% – 50% = 50%
Capacity cushioneffective = 100% – 111% = – 11%
Utilizationpeak = 50%
Utilizationeffective = 111%
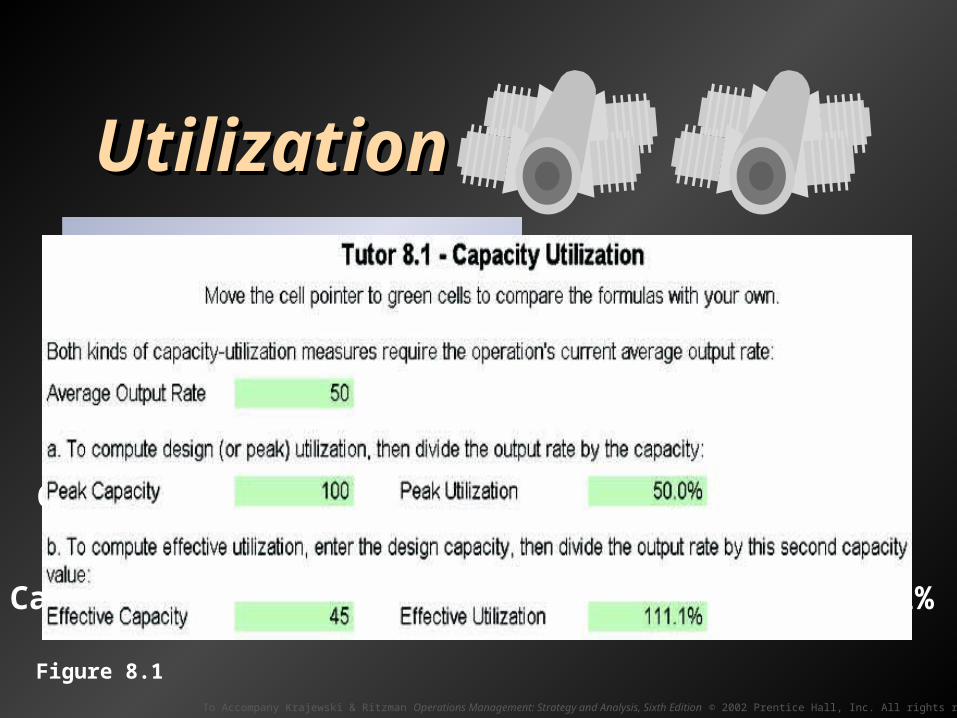
Figure 8.1
To Accompany Krajewski & Ritzman Operations Management: Strategy and Analysis, Sixth Edition © 2002 Prentice Hall, Inc. All rights reserved.
UtilizationUtilization
Fabrication can make 100 engines/dayManagement wants 45 engines/dayCurrently producing 50 engines/day
Capacity cushioneffective = 100% – Utilizationeffective
Utilizationpeak = 50%
Utilizationeffective = 111%
Capacity cushionpeak = 100% – Utilizationpeak
Example 8.1
To Accompany Krajewski & Ritzman Operations Management: Strategy and Analysis, Sixth Edition © 2002 Prentice Hall, Inc. All rights reserved.
UtilizationUtilization
Fabrication can make 100 engines/dayManagement wants 45 engines/dayCurrently producing 50 engines/day
Capacity cushionpeak = 100% - 50%
Capacity cushioneffective = 100% – 111%
Utilizationpeak = 50%
Utilizationeffective = 111%
Capacity cushionpeak = 100% – 50%
Example 8.1
To Accompany Krajewski & Ritzman Operations Management: Strategy and Analysis, Sixth Edition © 2002 Prentice Hall, Inc. All rights reserved.
UtilizationUtilization
Fabrication can make 100 engines/dayManagement wants 45 engines/dayCurrently producing 50 engines/day
Capacity cushionpeak = 100% – 50% = 50%
Capacity cushioneffective = 100% – 111% = – 11%
Utilizationpeak = 50%
Utilizationeffective = 111%
Example 8.1

To Accompany Krajewski & Ritzman Operations Management: Strategy and Analysis, Sixth Edition © 2002 Prentice Hall, Inc. All rights reserved.
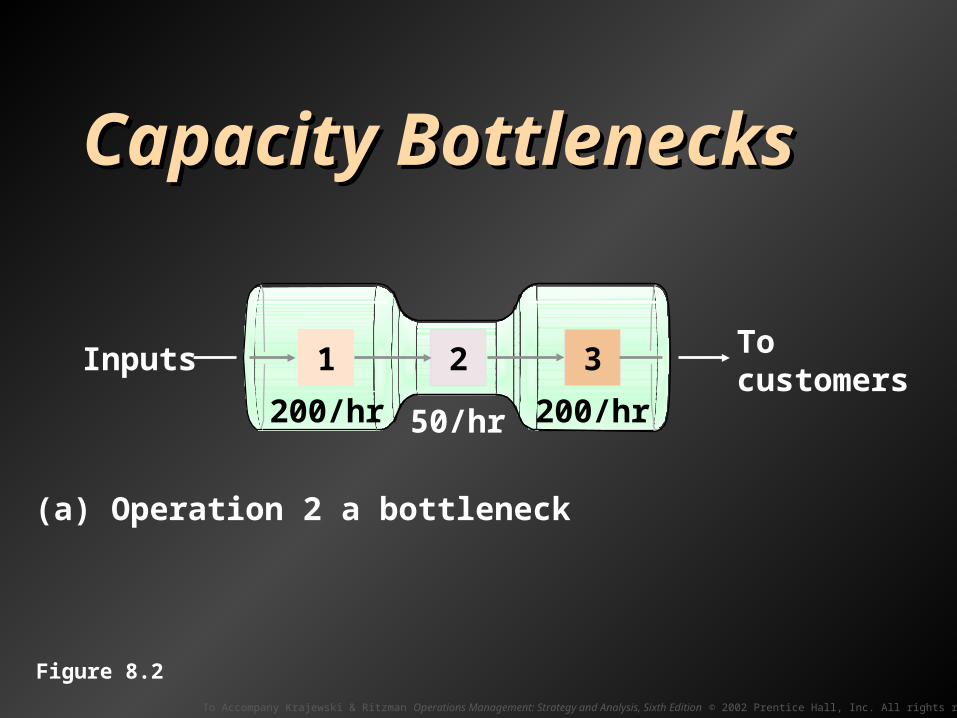
Capacity BottlenecksCapacity Bottlenecks
To Accompany Krajewski & Ritzman Operations Management: Strategy and Analysis, Sixth Edition © 2002 Prentice Hall, Inc. All rights reserved.
Capacity BottlenecksCapacity Bottlenecks
Inputs To customers
(a) Operation 2 a bottleneck
50/hr
1 2 3
200/hr 200/hr
Figure 8.2
To Accompany Krajewski & Ritzman Operations Management: Strategy and Analysis, Sixth Edition © 2002 Prentice Hall, Inc. All rights reserved.
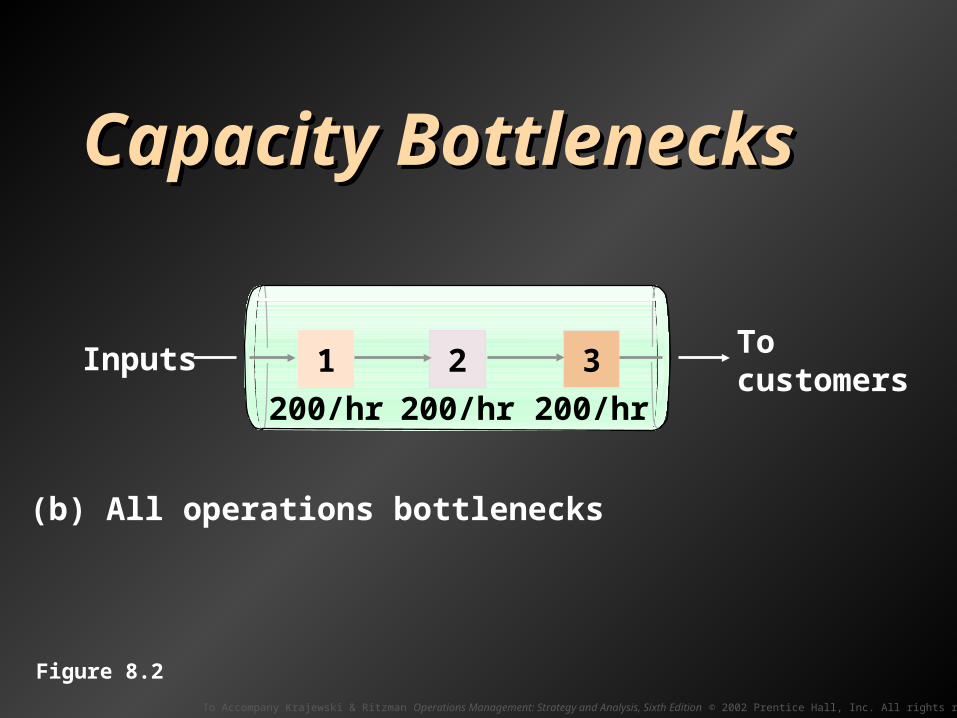
(b) All operations bottlenecks
2 31Inputs To customers
200/hr 200/hr 200/hr
Capacity BottlenecksCapacity Bottlenecks
Figure 8.2
To Accompany Krajewski & Ritzman Operations Management: Strategy and Analysis, Sixth Edition © 2002 Prentice Hall, Inc. All rights reserved.
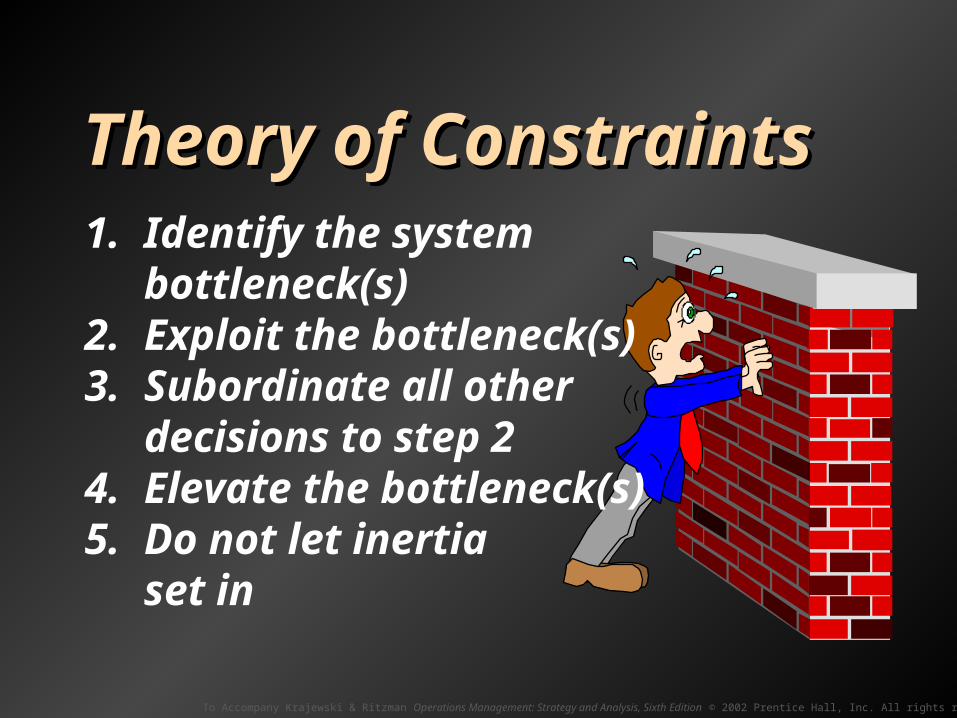
Theory of ConstraintsTheory of Constraints1. Identify the system
bottleneck(s)2. Exploit the bottleneck(s)3. Subordinate all other
decisions to step 24. Elevate the bottleneck(s)5. Do not let inertia
set in
To Accompany Krajewski & Ritzman Operations Management: Strategy and Analysis, Sixth Edition © 2002 Prentice Hall, Inc. All rights reserved.
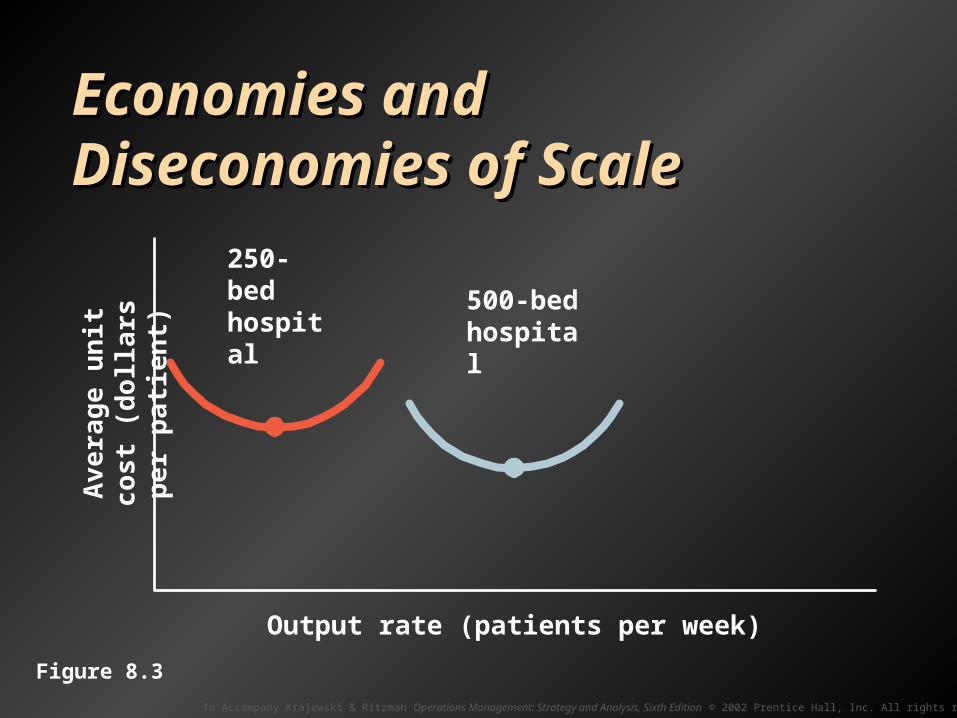
Output rate (patients per week)
Economies and Economies and Diseconomies of ScaleDiseconomies of Scale
Figure 8.3
Av
era
ge
un
it c
os
t (d
olla
rs p
er
pat
ien
t)
To Accompany Krajewski & Ritzman Operations Management: Strategy and Analysis, Sixth Edition © 2002 Prentice Hall, Inc. All rights reserved.
250-bed hospital
Output rate (patients per week)
Economies and Economies and Diseconomies of ScaleDiseconomies of Scale
Figure 8.3
Av
era
ge
un
it c
os
t (d
olla
rs p
er
pat
ien
t)
To Accompany Krajewski & Ritzman Operations Management: Strategy and Analysis, Sixth Edition © 2002 Prentice Hall, Inc. All rights reserved.
Economies and Economies and Diseconomies of ScaleDiseconomies of Scale
250-bed hospital 500-bed
hospital
Output rate (patients per week)
Economies of scale
Figure 8.3
Av
era
ge
un
it c
os
t (d
olla
rs p
er
pat
ien
t)
To Accompany Krajewski & Ritzman Operations Management: Strategy and Analysis, Sixth Edition © 2002 Prentice Hall, Inc. All rights reserved.
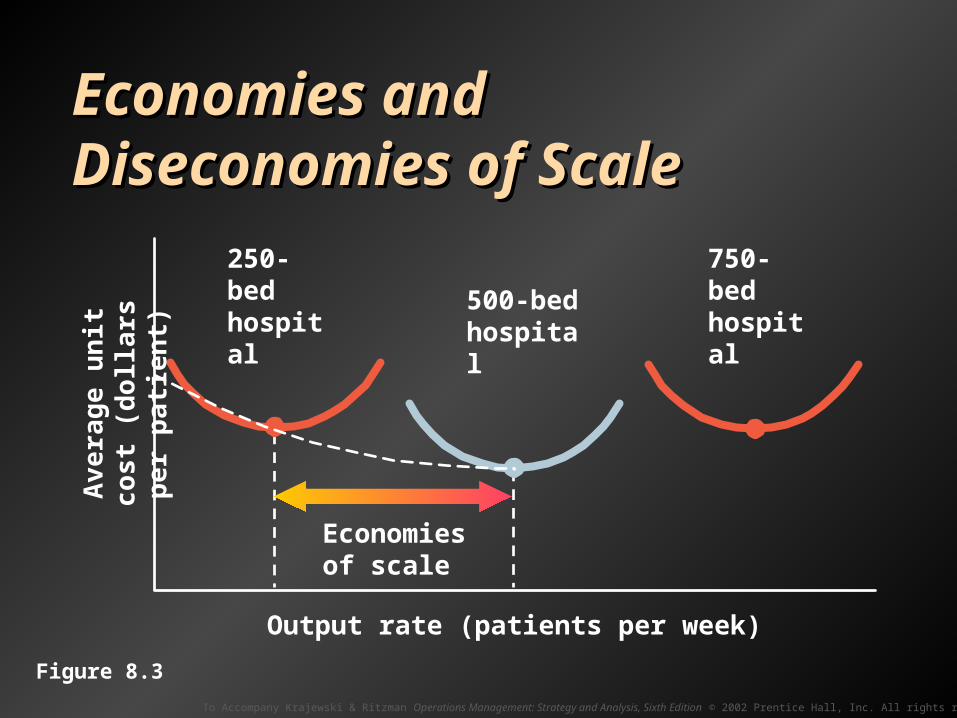
Economies and Economies and Diseconomies of ScaleDiseconomies of Scale
250-bed hospital
750-bed hospital 500-bed
hospital
Output rate (patients per week)
Economies of scale
Figure 8.3
Av
era
ge
un
it c
os
t (d
olla
rs p
er
pat
ien
t)
To Accompany Krajewski & Ritzman Operations Management: Strategy and Analysis, Sixth Edition © 2002 Prentice Hall, Inc. All rights reserved.
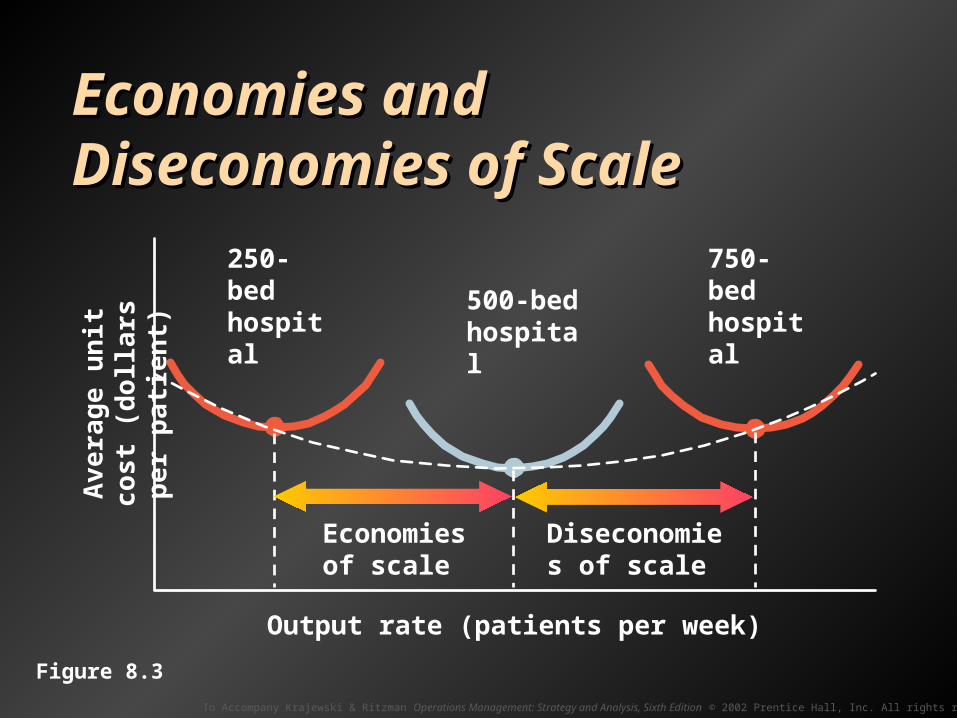
Economies and Economies and Diseconomies of ScaleDiseconomies of Scale
Av
era
ge
un
it c
os
t (d
olla
rs p
er
pat
ien
t)
Output rate (patients per week)
250-bed hospital
750-bed hospital 500-bed
hospital
Diseconomies of scale
Economies of scale
Figure 8.3

To Accompany Krajewski & Ritzman Operations Management: Strategy and Analysis, Sixth Edition © 2002 Prentice Hall, Inc. All rights reserved.
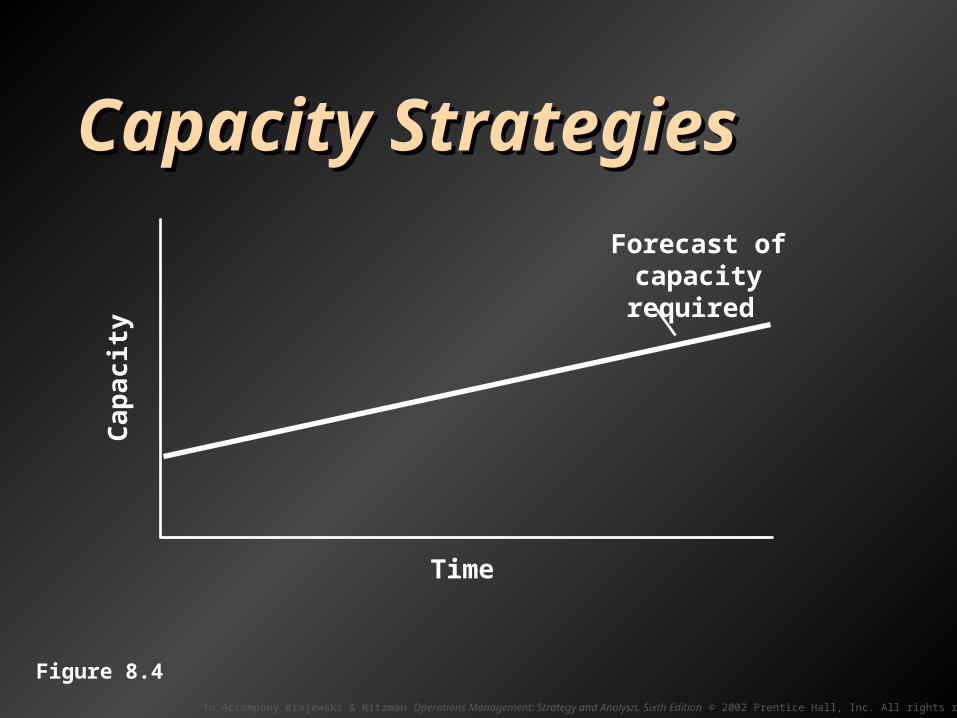
Capacity StrategiesCapacity Strategies
To Accompany Krajewski & Ritzman Operations Management: Strategy and Analysis, Sixth Edition © 2002 Prentice Hall, Inc. All rights reserved.
Capacity StrategiesCapacity Strategies
Time
Forecast of capacity required
Ca
pac
ity
Figure 8.4
To Accompany Krajewski & Ritzman Operations Management: Strategy and Analysis, Sixth Edition © 2002 Prentice Hall, Inc. All rights reserved.
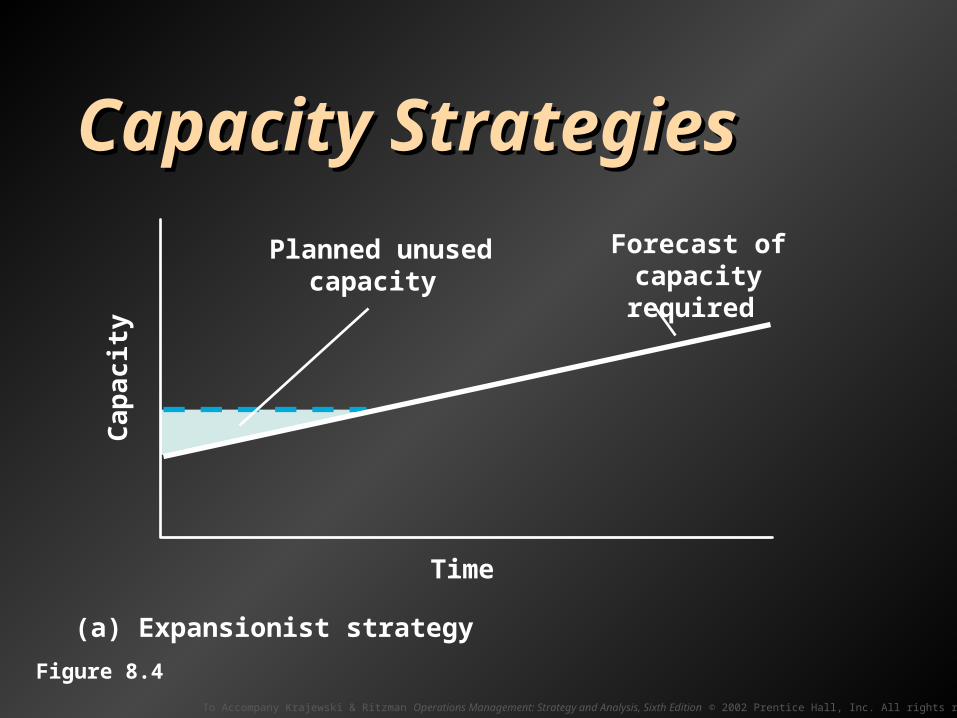
Capacity StrategiesCapacity Strategies
Planned unused capacity
Time
(a) Expansionist strategy
Forecast of capacity required
Ca
pac
ity
Figure 8.4
To Accompany Krajewski & Ritzman Operations Management: Strategy and Analysis, Sixth Edition © 2002 Prentice Hall, Inc. All rights reserved.
Capacity StrategiesCapacity Strategies
Planned unused capacity
Time
(a) Expansionist strategy
Forecast of capacity required
Ca
pac
ity
Figure 8.4
To Accompany Krajewski & Ritzman Operations Management: Strategy and Analysis, Sixth Edition © 2002 Prentice Hall, Inc. All rights reserved.
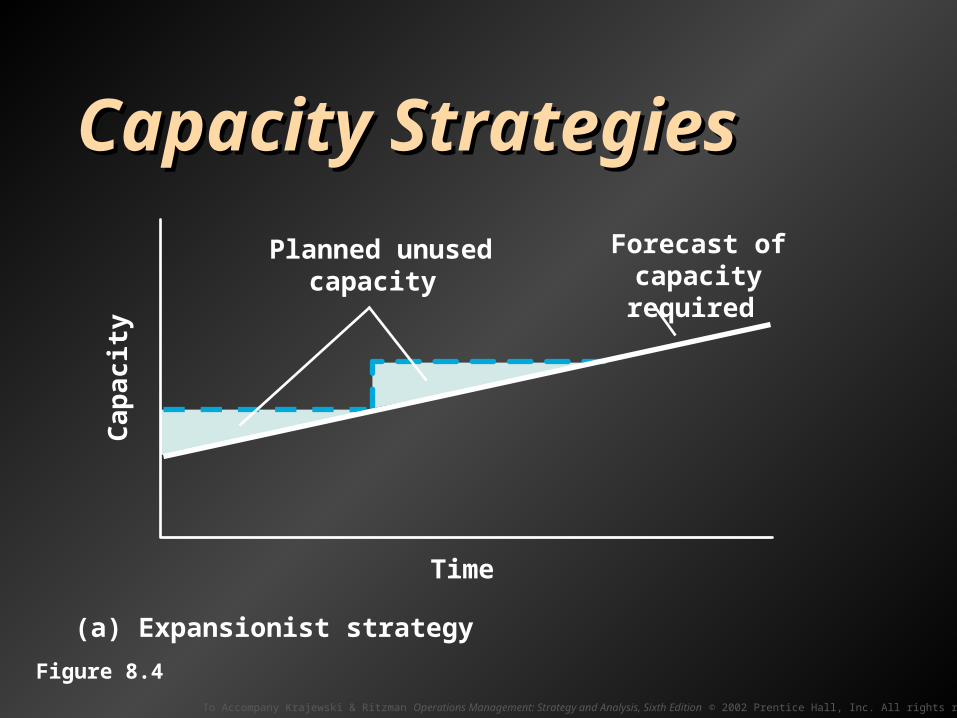
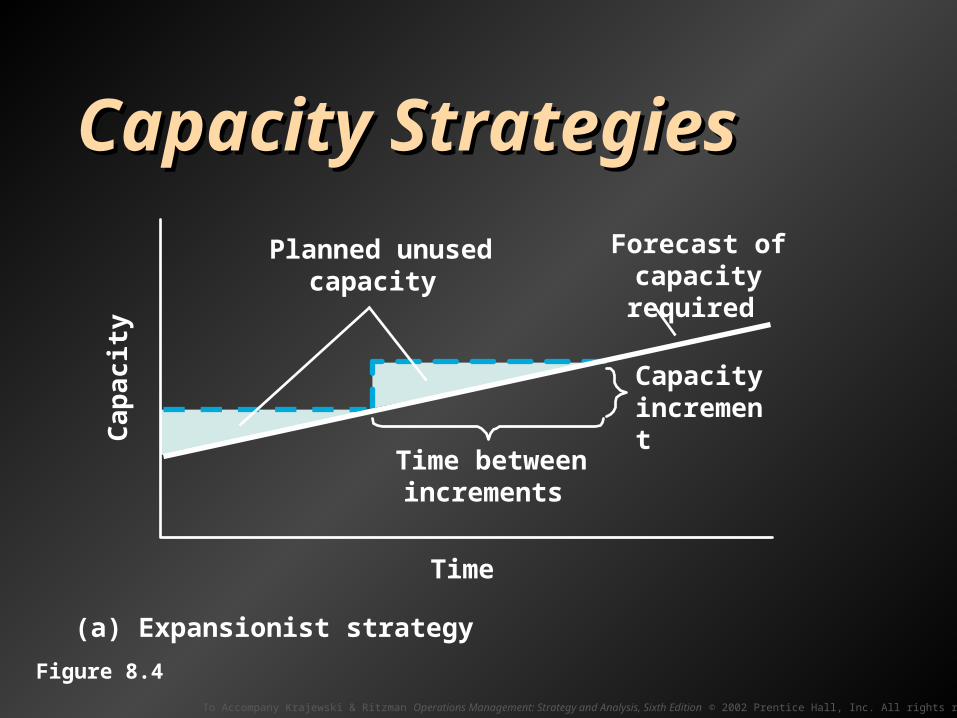
Capacity StrategiesCapacity Strategies
Time between increments
Capacity increment
Planned unused capacity
Time
(a) Expansionist strategy
Forecast of capacity required
Ca
pac
ity
Figure 8.4
To Accompany Krajewski & Ritzman Operations Management: Strategy and Analysis, Sixth Edition © 2002 Prentice Hall, Inc. All rights reserved.
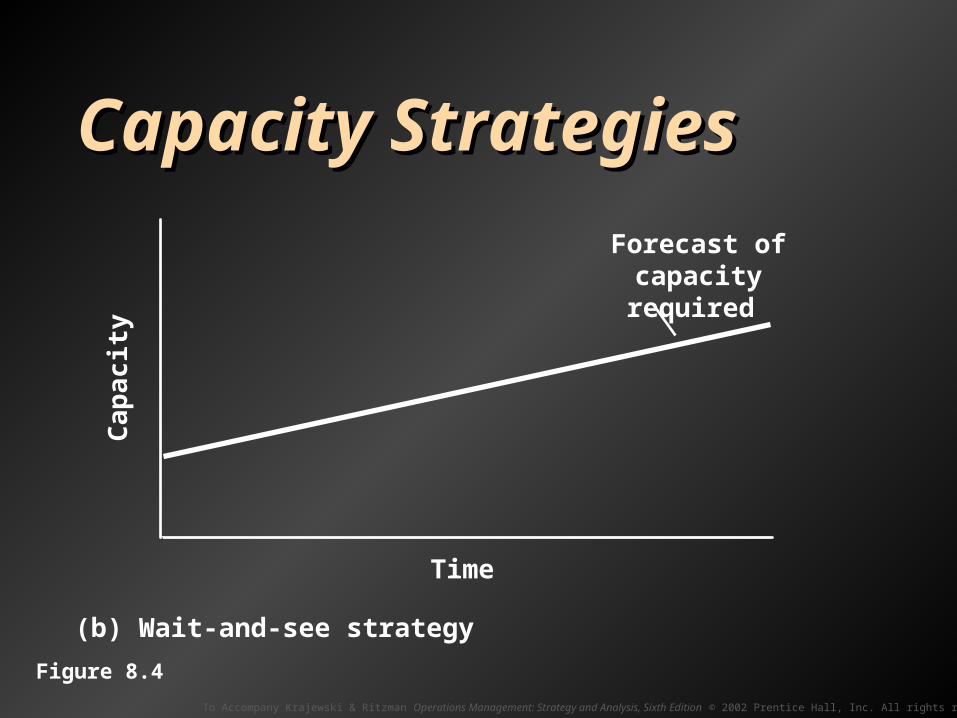
Capacity StrategiesCapacity Strategies
Time
Forecast of capacity required
Ca
pac
ity
(b) Wait-and-see strategy
Figure 8.4
To Accompany Krajewski & Ritzman Operations Management: Strategy and Analysis, Sixth Edition © 2002 Prentice Hall, Inc. All rights reserved.
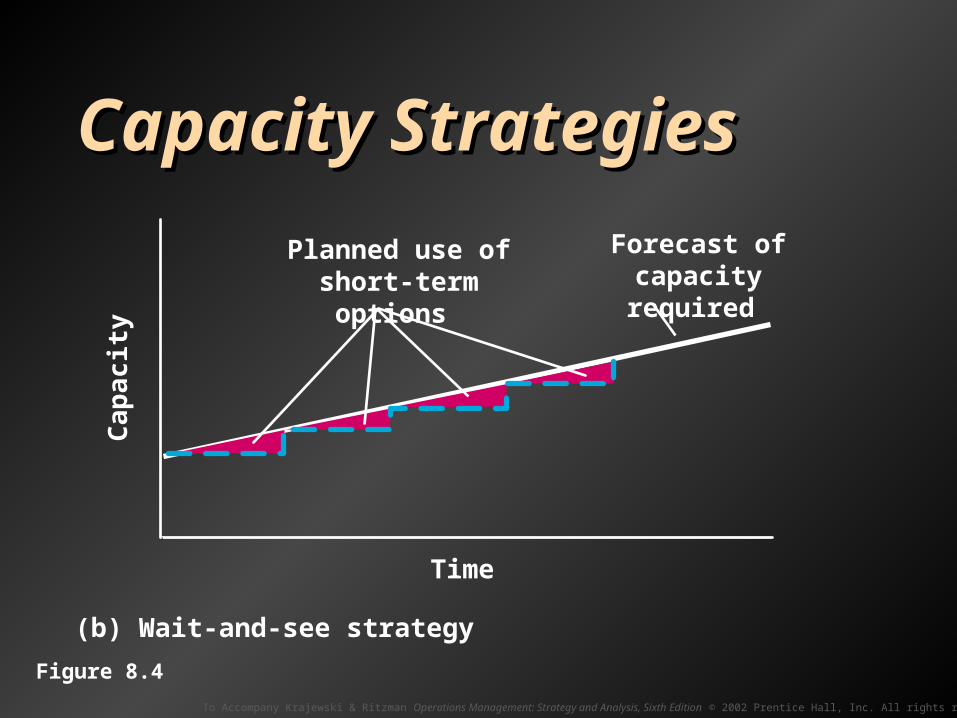
Capacity StrategiesCapacity Strategies
Time
Forecast of capacity required
Ca
pac
ity
(b) Wait-and-see strategy
Planned use of short-term options
Figure 8.4
To Accompany Krajewski & Ritzman Operations Management: Strategy and Analysis, Sixth Edition © 2002 Prentice Hall, Inc. All rights reserved.
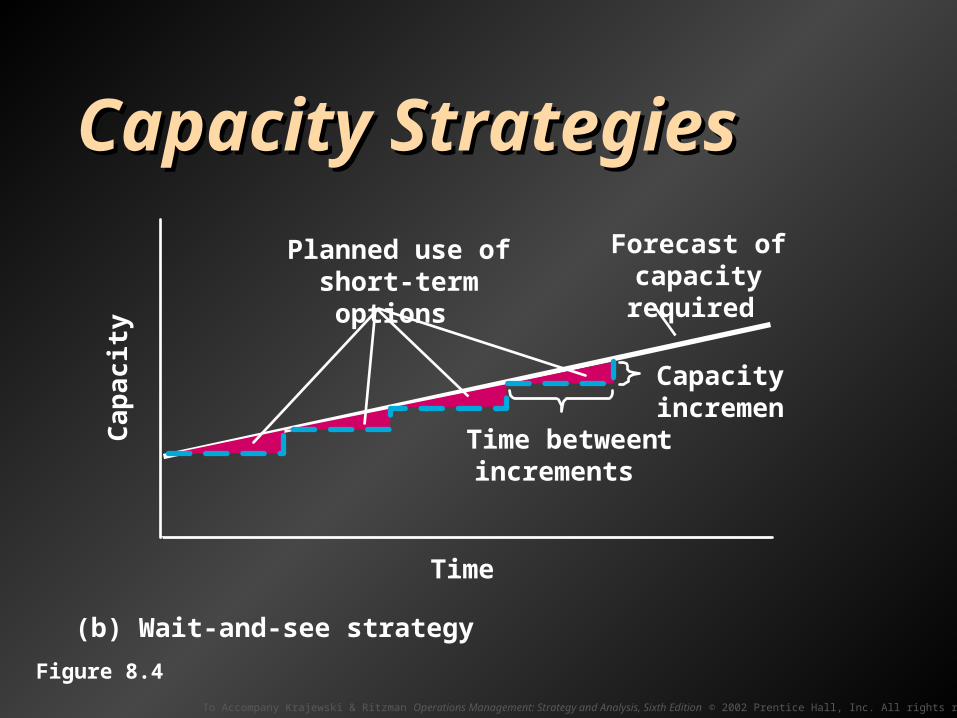
Capacity StrategiesCapacity Strategies
Time between increments
Capacity increment
Time
Forecast of capacity required
Ca
pac
ity
Planned use of short-term options
(b) Wait-and-see strategy
Figure 8.4
To Accompany Krajewski & Ritzman Operations Management: Strategy and Analysis, Sixth Edition © 2002 Prentice Hall, Inc. All rights reserved.
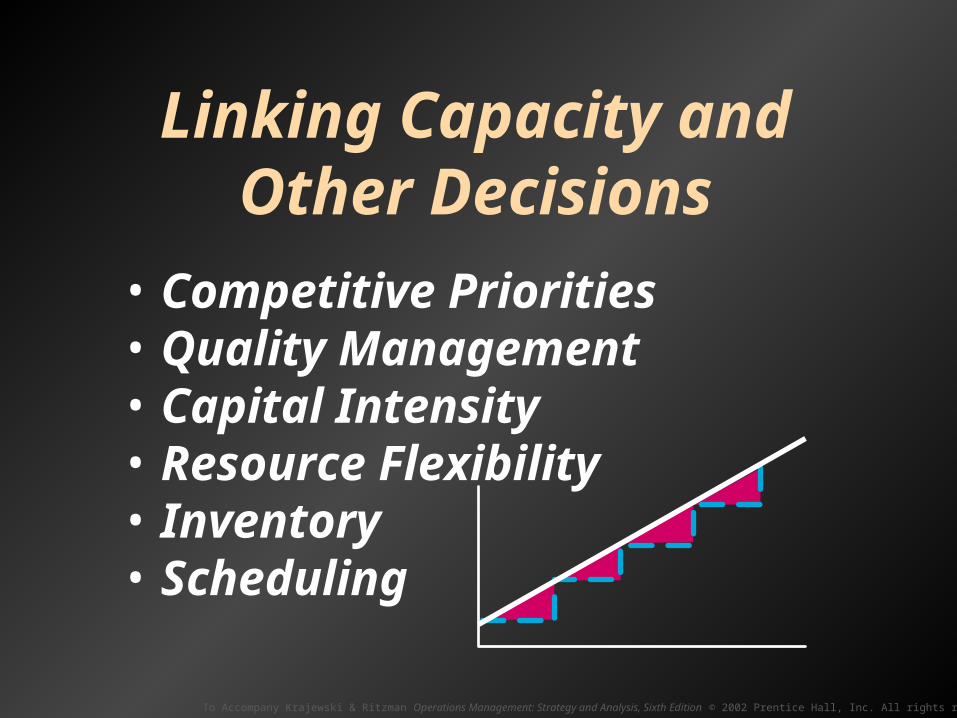
Linking Capacity and Other Decisions
• Competitive Priorities• Quality Management• Capital Intensity• Resource Flexibility• Inventory• Scheduling

To Accompany Krajewski & Ritzman Operations Management: Strategy and Analysis, Sixth Edition © 2002 Prentice Hall, Inc. All rights reserved.
Capacity DecisionsCapacity Decisions

To Accompany Krajewski & Ritzman Operations Management: Strategy and Analysis, Sixth Edition © 2002 Prentice Hall, Inc. All rights reserved.
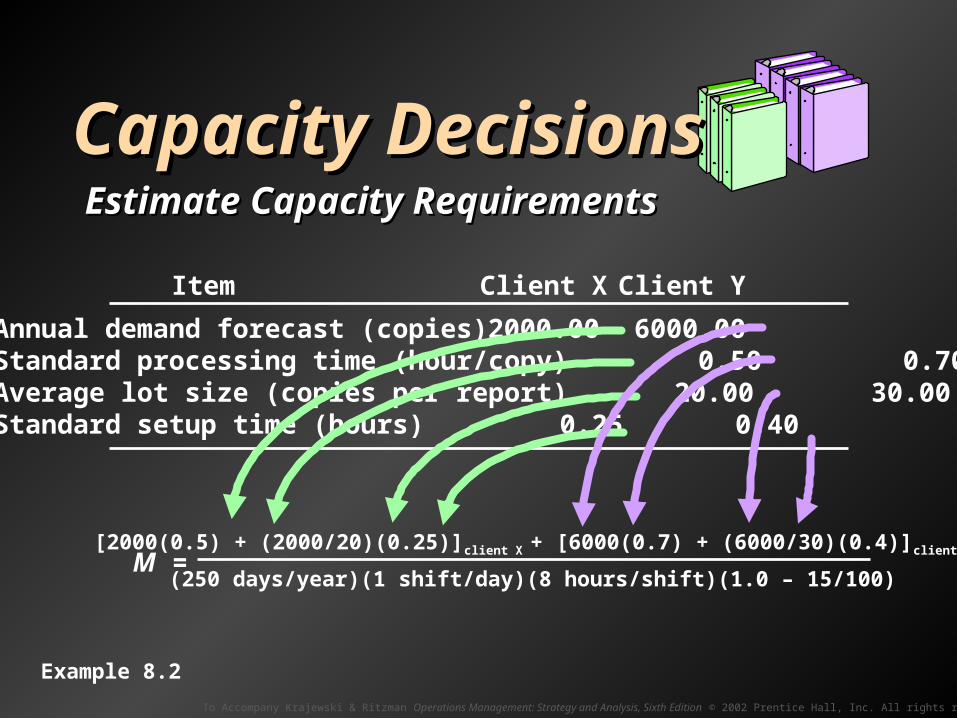
Capacity DecisionsCapacity DecisionsEstimate Capacity RequirementsEstimate Capacity Requirements
Item Client X Client Y
Annual demand forecast (copies) 2000.00 6000.00Standard processing time (hour/copy) 0.50 0.70Average lot size (copies per report) 20.00 30.00Standard setup time (hours) 0.25 0.40
Example 8.2

To Accompany Krajewski & Ritzman Operations Management: Strategy and Analysis, Sixth Edition © 2002 Prentice Hall, Inc. All rights reserved.
Capacity DecisionsCapacity DecisionsEstimate Capacity RequirementsEstimate Capacity Requirements
Item Client X Client Y
Annual demand forecast (copies) 2000.00 6000.00Standard processing time (hour/copy) 0.50 0.70Average lot size (copies per report) 20.00 30.00Standard setup time (hours) 0.25 0.40
[Dp + (D/Q)s]product 1 + ... + [Dp + (D/Q)s]product n
N[1 – (C/100)]M =
Example 8.2
To Accompany Krajewski & Ritzman Operations Management: Strategy and Analysis, Sixth Edition © 2002 Prentice Hall, Inc. All rights reserved.
Capacity DecisionsCapacity DecisionsEstimate Capacity RequirementsEstimate Capacity Requirements
Item Client X Client Y
Annual demand forecast (copies) 2000.00 6000.00Standard processing time (hour/copy) 0.50 0.70Average lot size (copies per report) 20.00 30.00Standard setup time (hours) 0.25 0.40
[2000(0.5) + (2000/20)(0.25)]client X + [6000(0.7) + (6000/30)(0.4)]client Y
(250 days/year)(1 shift/day)(8 hours/shift)(1.0 – 15/100)M =
Example 8.2
To Accompany Krajewski & Ritzman Operations Management: Strategy and Analysis, Sixth Edition © 2002 Prentice Hall, Inc. All rights reserved.
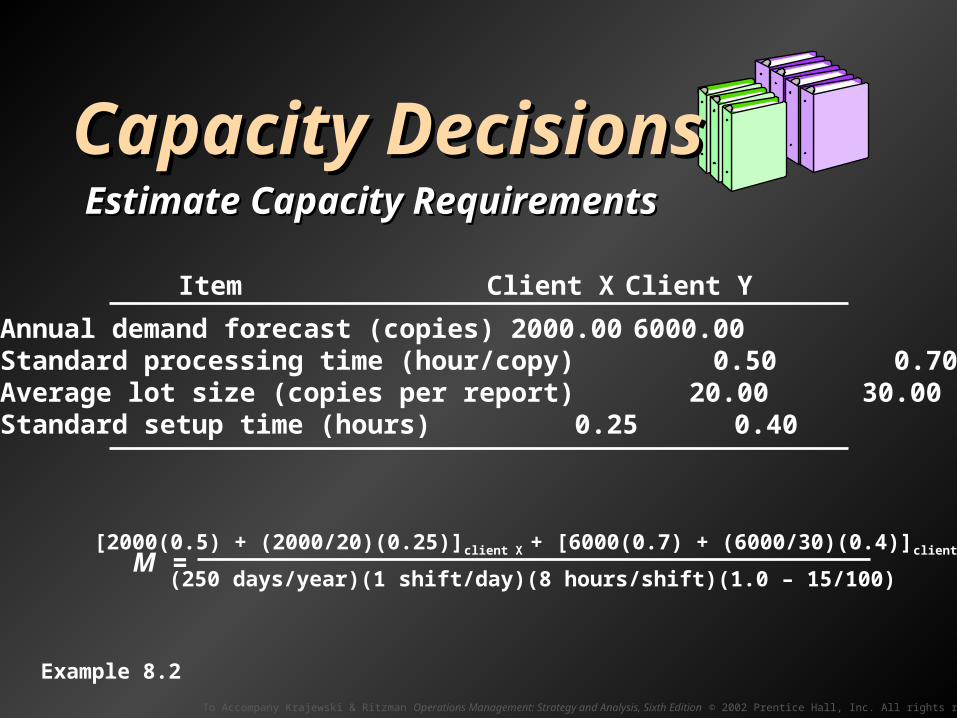
Capacity DecisionsCapacity DecisionsEstimate Capacity RequirementsEstimate Capacity Requirements
Item Client X Client Y
Annual demand forecast (copies) 2000.00 6000.00Standard processing time (hour/copy) 0.50 0.70Average lot size (copies per report) 20.00 30.00Standard setup time (hours) 0.25 0.40
M = [2000(0.5) + (2000/20)(0.25)]client X + [6000(0.7) + (6000/30)(0.4)]client Y
(250 days/year)(1 shift/day)(8 hours/shift)(1.0 – 15/100)
Example 8.2
To Accompany Krajewski & Ritzman Operations Management: Strategy and Analysis, Sixth Edition © 2002 Prentice Hall, Inc. All rights reserved.
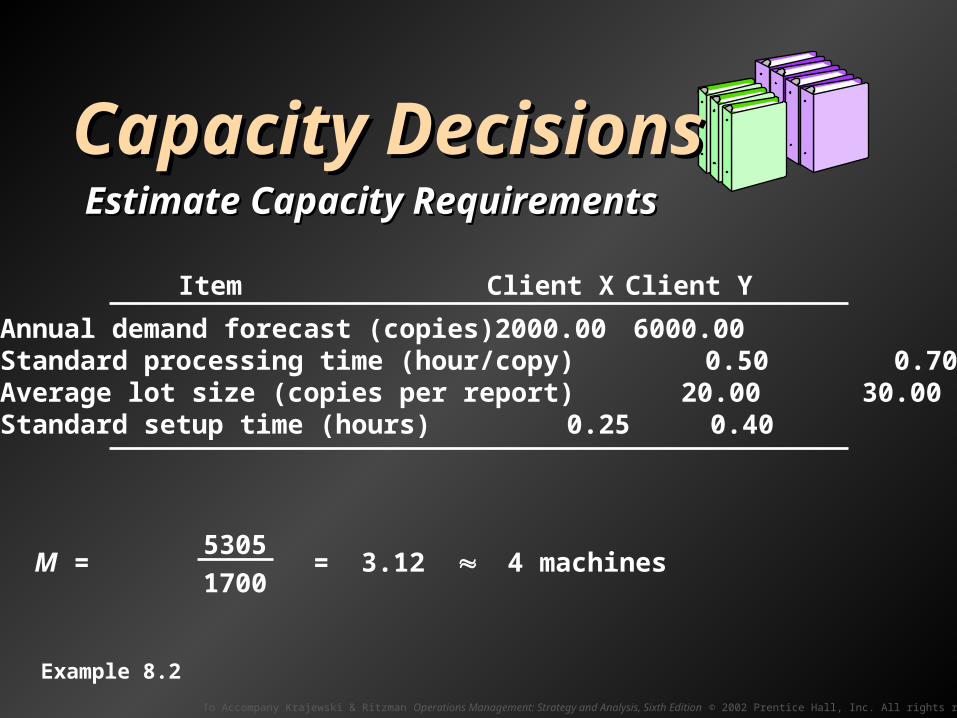
Capacity DecisionsCapacity DecisionsEstimate Capacity RequirementsEstimate Capacity Requirements
Item Client X Client Y
Annual demand forecast (copies) 2000.00 6000.00Standard processing time (hour/copy) 0.50 0.70Average lot size (copies per report) 20.00 30.00Standard setup time (hours) 0.25 0.40
M = = 3.12 4 machines5305
1700
Example 8.2

To Accompany Krajewski & Ritzman Operations Management: Strategy and Analysis, Sixth Edition © 2002 Prentice Hall, Inc. All rights reserved.
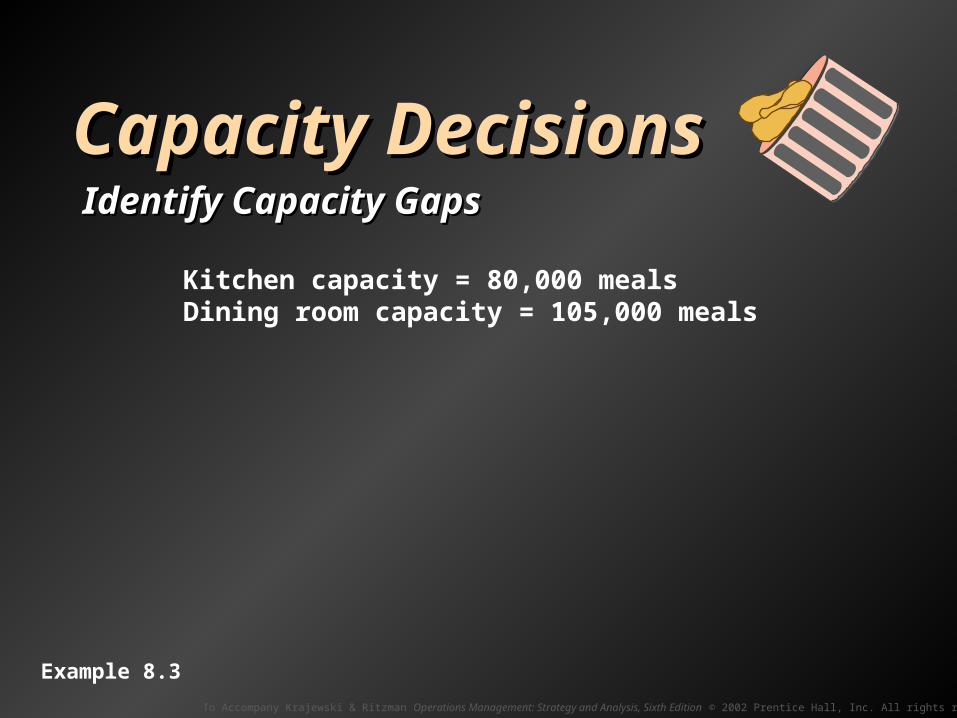
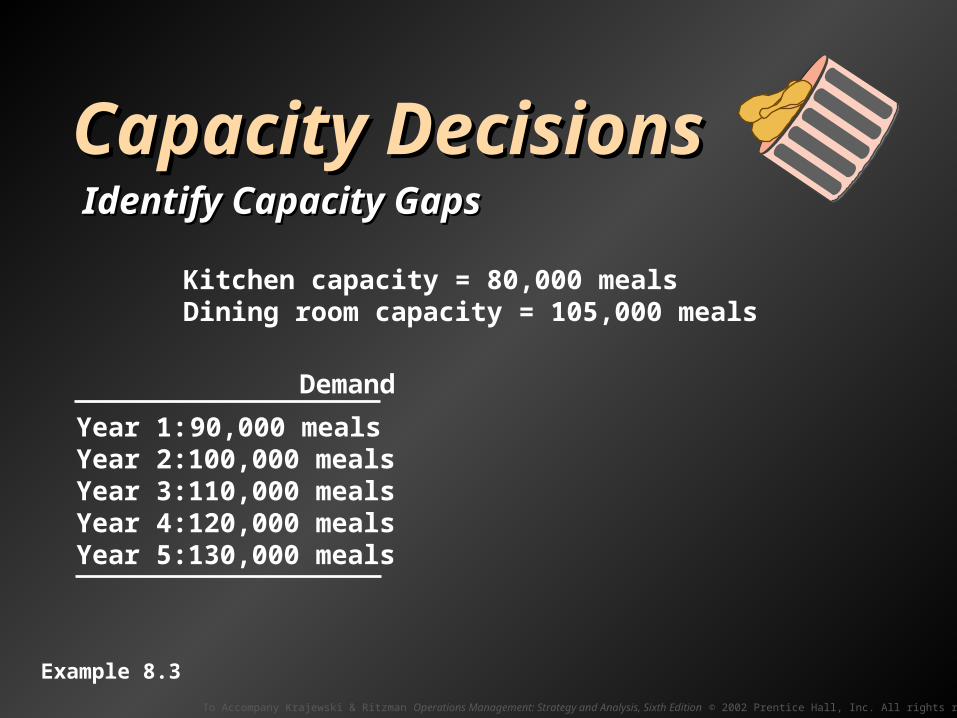
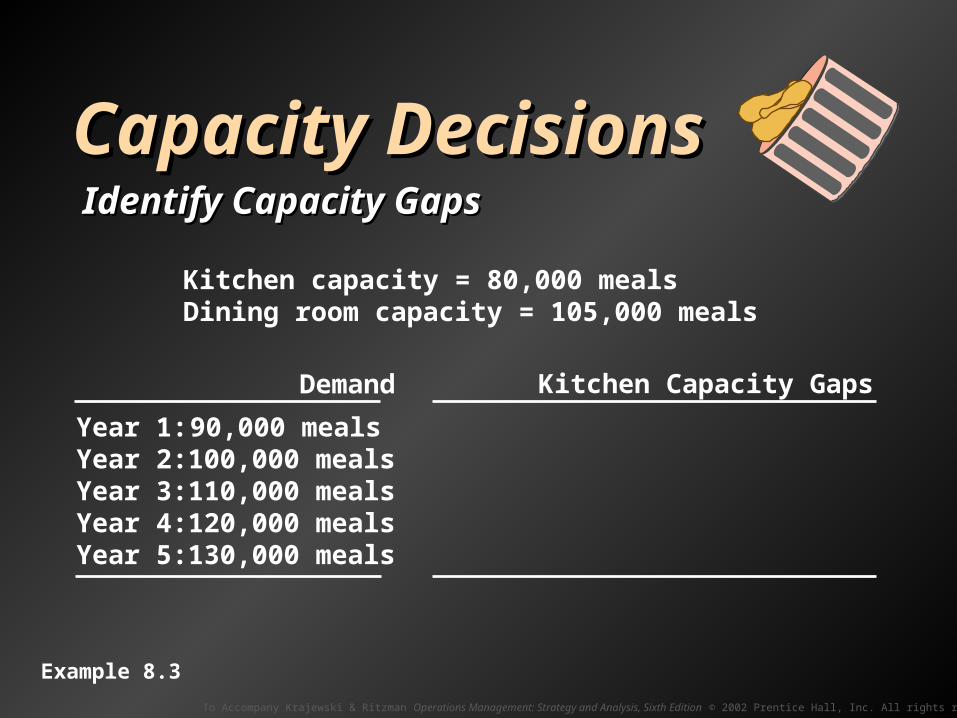
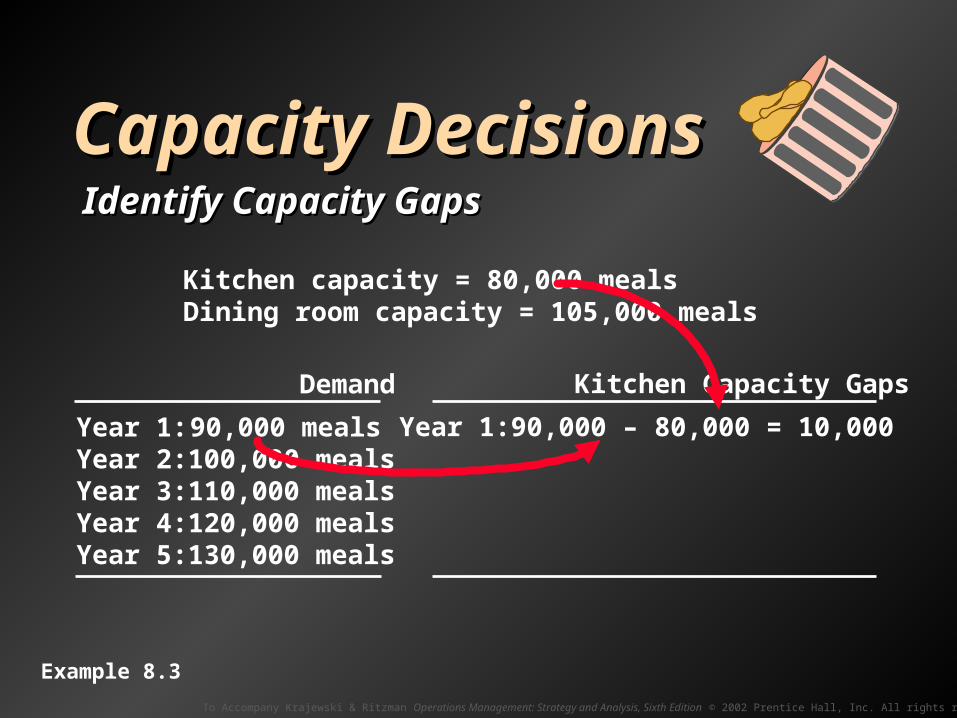
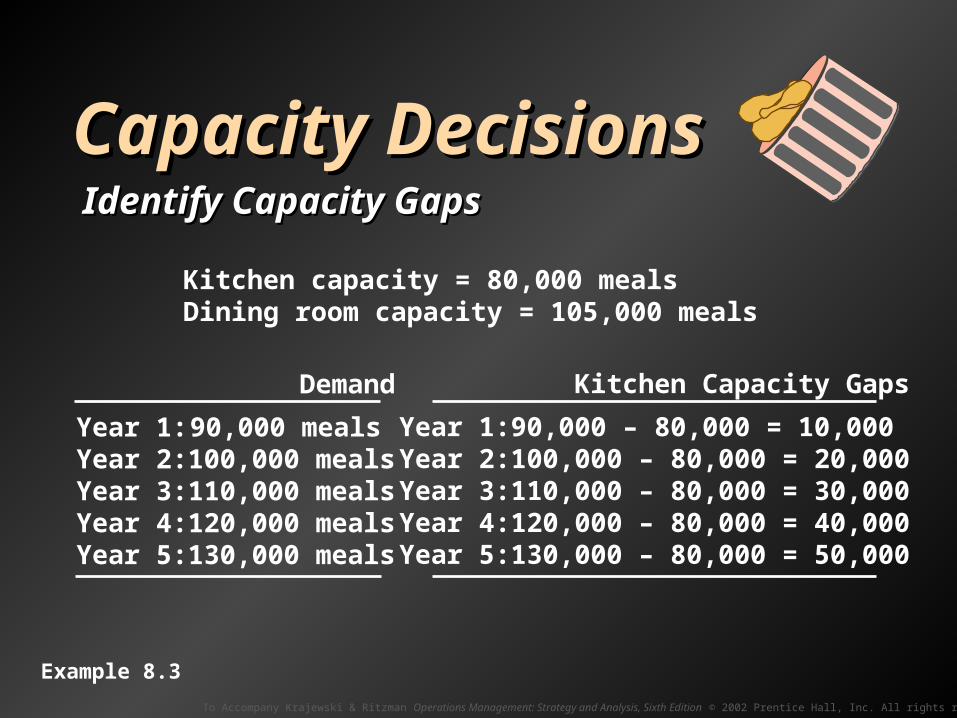
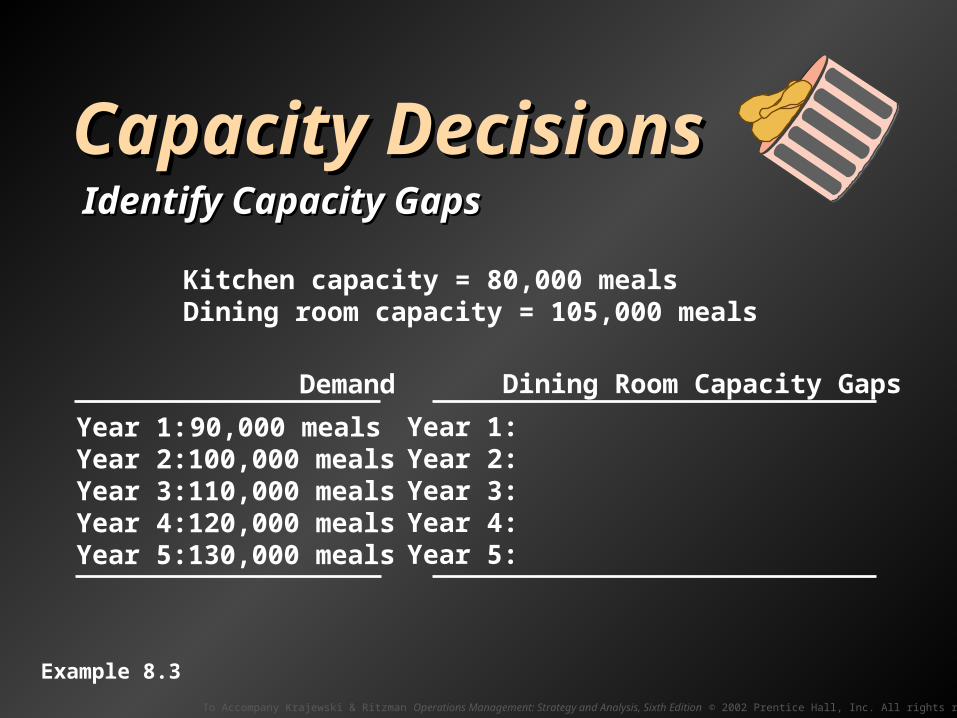
Capacity DecisionsCapacity DecisionsIdentify Capacity GapsIdentify Capacity Gaps
To Accompany Krajewski & Ritzman Operations Management: Strategy and Analysis, Sixth Edition © 2002 Prentice Hall, Inc. All rights reserved.
Capacity DecisionsCapacity Decisions
Kitchen capacity = 80,000 mealsDining room capacity = 105,000 meals
Identify Capacity GapsIdentify Capacity Gaps
Example 8.3
To Accompany Krajewski & Ritzman Operations Management: Strategy and Analysis, Sixth Edition © 2002 Prentice Hall, Inc. All rights reserved.
Capacity DecisionsCapacity Decisions
Kitchen capacity = 80,000 mealsDining room capacity = 105,000 meals
Demand
Year 1: 90,000 mealsYear 2: 100,000 mealsYear 3: 110,000 mealsYear 4: 120,000 mealsYear 5: 130,000 meals
Kitchen Capacity Gaps
Year 1: 90,000 – 80,000 = 10,000
Identify Capacity GapsIdentify Capacity Gaps
Example 8.3
To Accompany Krajewski & Ritzman Operations Management: Strategy and Analysis, Sixth Edition © 2002 Prentice Hall, Inc. All rights reserved.
Capacity DecisionsCapacity Decisions
Kitchen capacity = 80,000 mealsDining room capacity = 105,000 meals
Demand
Year 1: 90,000 mealsYear 2: 100,000 mealsYear 3: 110,000 mealsYear 4: 120,000 mealsYear 5: 130,000 meals
Kitchen Capacity Gaps
Year 1: 90,000 – 80,000 = 10,000Year 2: 100,000 – 80,000 = 20,000Year 3: 110,000 – 80,000 = 30,000Year 4: 120,000 – 80,000 = 40,000Year 5: 130,000 – 80,000 = 50,000
Identify Capacity GapsIdentify Capacity Gaps
Example 8.3
To Accompany Krajewski & Ritzman Operations Management: Strategy and Analysis, Sixth Edition © 2002 Prentice Hall, Inc. All rights reserved.
Capacity DecisionsCapacity Decisions
Kitchen capacity = 80,000 mealsDining room capacity = 105,000 meals
Demand
Year 1: 90,000 mealsYear 2: 100,000 mealsYear 3: 110,000 mealsYear 4: 120,000 mealsYear 5: 130,000 meals
Dining Room Capacity Gaps
Year 1:Year 2:Year 3:Year 4:Year 5:
Identify Capacity GapsIdentify Capacity Gaps
Example 8.3
To Accompany Krajewski & Ritzman Operations Management: Strategy and Analysis, Sixth Edition © 2002 Prentice Hall, Inc. All rights reserved.
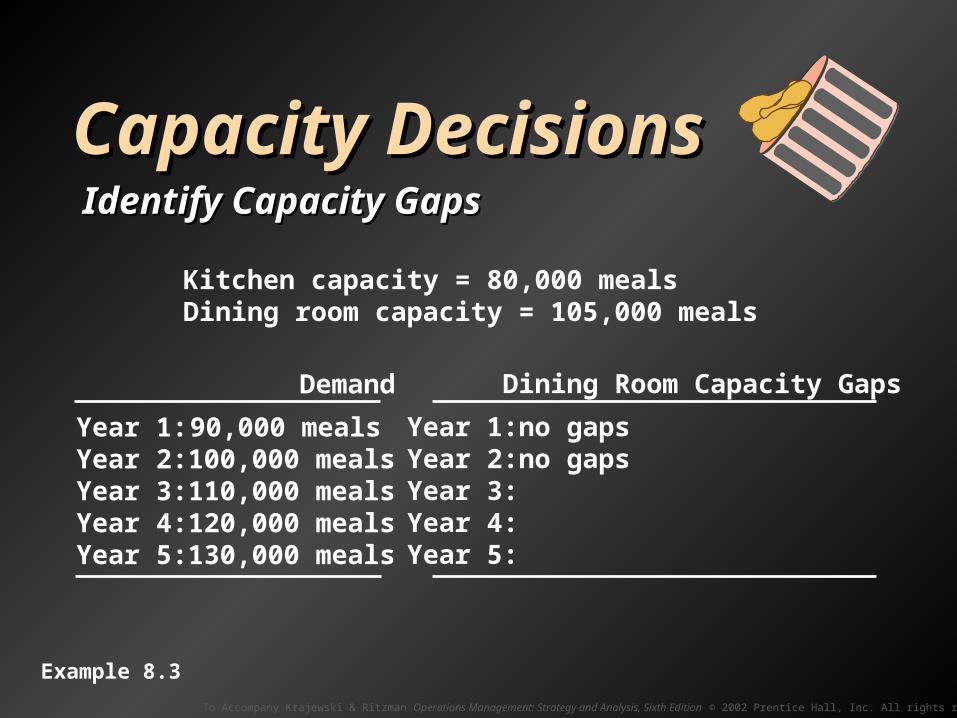
Capacity DecisionsCapacity Decisions
Kitchen capacity = 80,000 mealsDining room capacity = 105,000 meals
Demand
Year 1: 90,000 mealsYear 2: 100,000 mealsYear 3: 110,000 mealsYear 4: 120,000 mealsYear 5: 130,000 meals
Dining Room Capacity Gaps
Year 1: no gaps Year 2: no gaps Year 3:Year 4:Year 5:
Identify Capacity GapsIdentify Capacity Gaps
Example 8.3
To Accompany Krajewski & Ritzman Operations Management: Strategy and Analysis, Sixth Edition © 2002 Prentice Hall, Inc. All rights reserved.
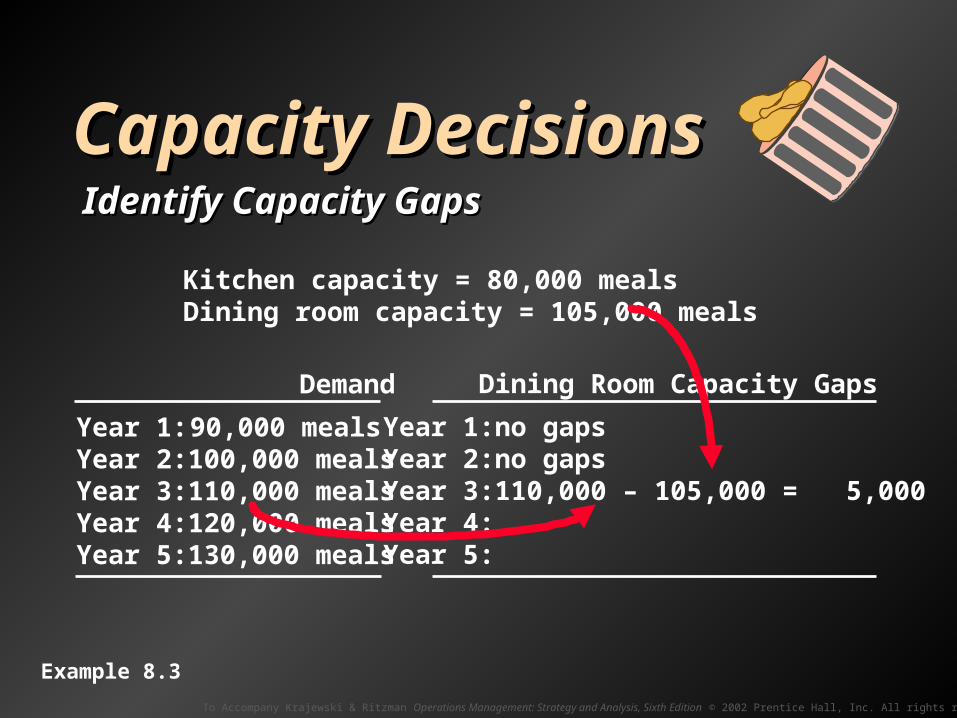
Capacity DecisionsCapacity Decisions
Kitchen capacity = 80,000 mealsDining room capacity = 105,000 meals
Demand
Year 1: 90,000 mealsYear 2: 100,000 mealsYear 3: 110,000 mealsYear 4: 120,000 mealsYear 5: 130,000 meals
Dining Room Capacity Gaps
Year 1: no gaps Year 2: no gaps Year 3: 110,000 – 105,000 = 5,000Year 4:Year 5:
Identify Capacity GapsIdentify Capacity Gaps
Example 8.3
To Accompany Krajewski & Ritzman Operations Management: Strategy and Analysis, Sixth Edition © 2002 Prentice Hall, Inc. All rights reserved.
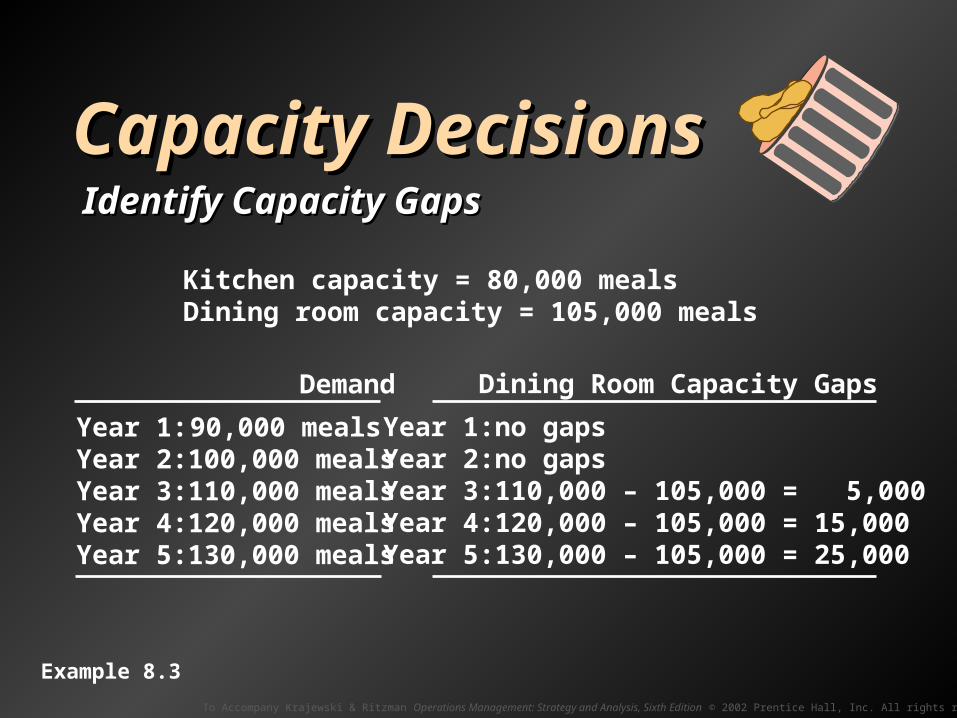
Capacity DecisionsCapacity Decisions
Kitchen capacity = 80,000 mealsDining room capacity = 105,000 meals
Demand
Year 1: 90,000 mealsYear 2: 100,000 mealsYear 3: 110,000 mealsYear 4: 120,000 mealsYear 5: 130,000 meals
Dining Room Capacity Gaps
Year 1: no gaps Year 2: no gaps Year 3: 110,000 – 105,000 = 5,000Year 4: 120,000 – 105,000 = 15,000Year 5: 130,000 – 105,000 = 25,000
Identify Capacity GapsIdentify Capacity Gaps
Example 8.3

To Accompany Krajewski & Ritzman Operations Management: Strategy and Analysis, Sixth Edition © 2002 Prentice Hall, Inc. All rights reserved.
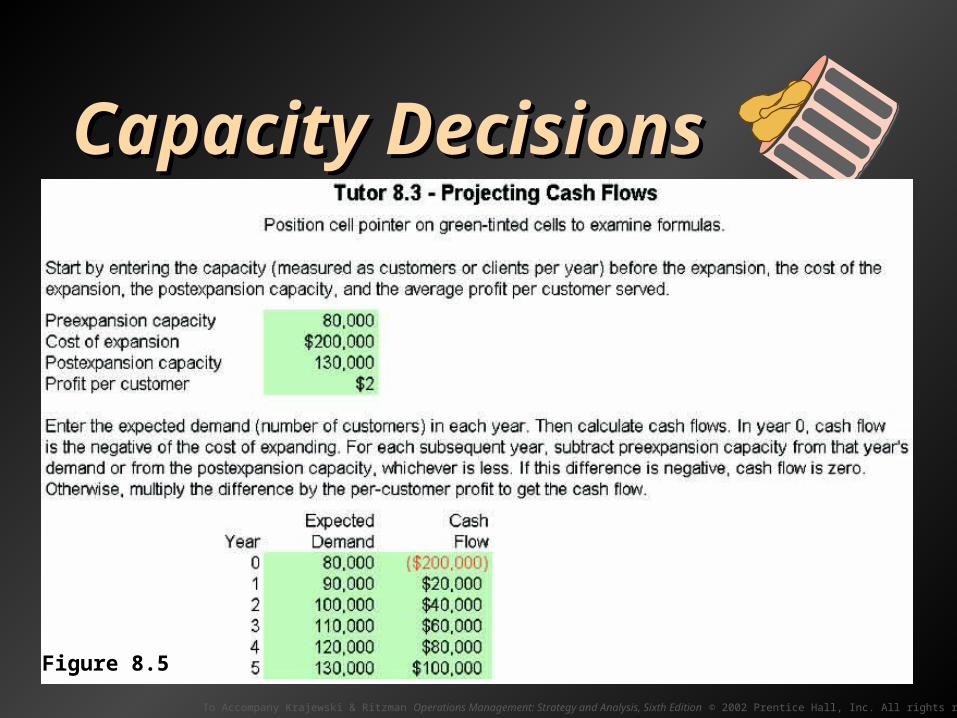
Capacity DecisionsCapacity DecisionsEvaluate AlternativesEvaluate Alternatives
To Accompany Krajewski & Ritzman Operations Management: Strategy and Analysis, Sixth Edition © 2002 Prentice Hall, Inc. All rights reserved.
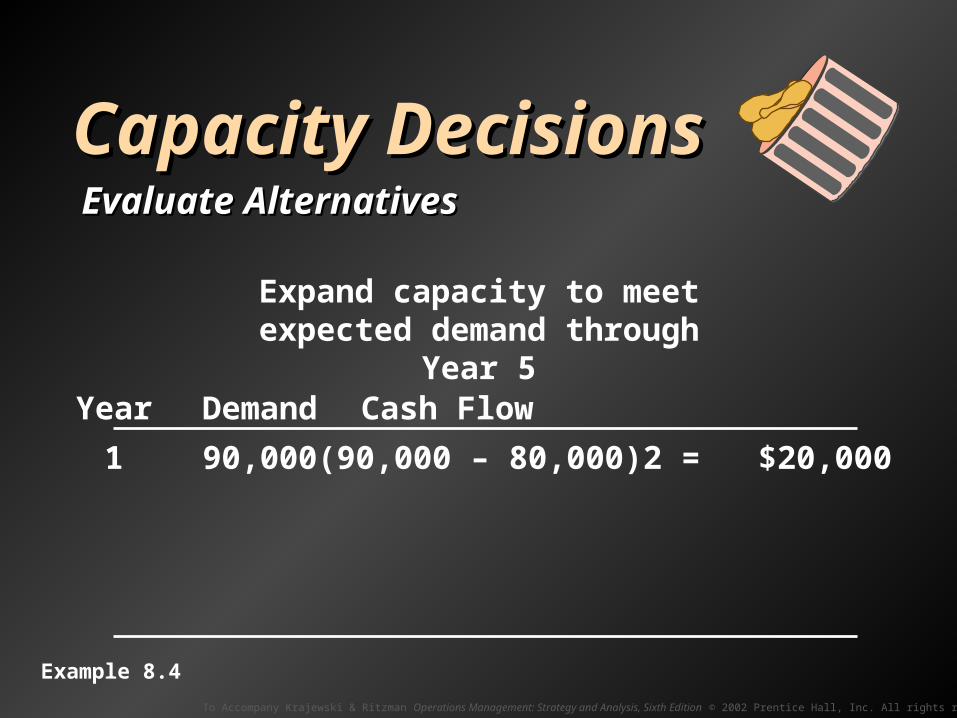
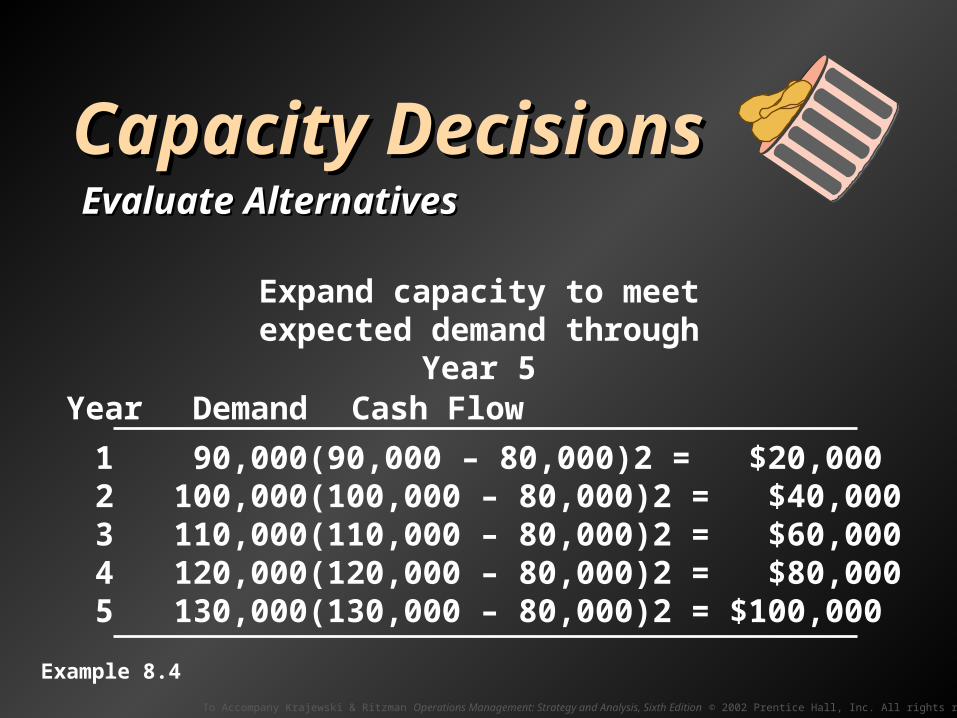
Capacity DecisionsCapacity DecisionsEvaluate AlternativesEvaluate Alternatives
Expand capacity to meet expected demand through Year 5
Example 8.4

To Accompany Krajewski & Ritzman Operations Management: Strategy and Analysis, Sixth Edition © 2002 Prentice Hall, Inc. All rights reserved.
Capacity DecisionsCapacity DecisionsEvaluate AlternativesEvaluate Alternatives
Expand capacity to meet expected demand through Year 5
Year Demand Cash Flow
Example 8.4
To Accompany Krajewski & Ritzman Operations Management: Strategy and Analysis, Sixth Edition © 2002 Prentice Hall, Inc. All rights reserved.
Capacity DecisionsCapacity DecisionsEvaluate AlternativesEvaluate Alternatives
Expand capacity to meet expected demand through Year 5
Year Demand Cash Flow
1 90,000 (90,000 – 80,000)2 = $20,000
Example 8.4
To Accompany Krajewski & Ritzman Operations Management: Strategy and Analysis, Sixth Edition © 2002 Prentice Hall, Inc. All rights reserved.
Capacity DecisionsCapacity DecisionsEvaluate AlternativesEvaluate Alternatives
Expand capacity to meet expected demand through Year 5
Year Demand Cash Flow
1 90,000 (90,000 – 80,000)2 = $20,0002 100,000 (100,000 – 80,000)2 = $40,0003 110,000 (110,000 – 80,000)2 = $60,0004 120,000 (120,000 – 80,000)2 = $80,0005 130,000 (130,000 – 80,000)2 = $100,000
Example 8.4
To Accompany Krajewski & Ritzman Operations Management: Strategy and Analysis, Sixth Edition © 2002 Prentice Hall, Inc. All rights reserved.
Capacity DecisionsCapacity DecisionsEvaluate AlternativesEvaluate Alternatives
Figure 8.5

To Accompany Krajewski & Ritzman Operations Management: Strategy and Analysis, Sixth Edition © 2002 Prentice Hall, Inc. All rights reserved.
Capacity DecisionsCapacity DecisionsSimulationSimulation
To Accompany Krajewski & Ritzman Operations Management: Strategy and Analysis, Sixth Edition © 2002 Prentice Hall, Inc. All rights reserved.
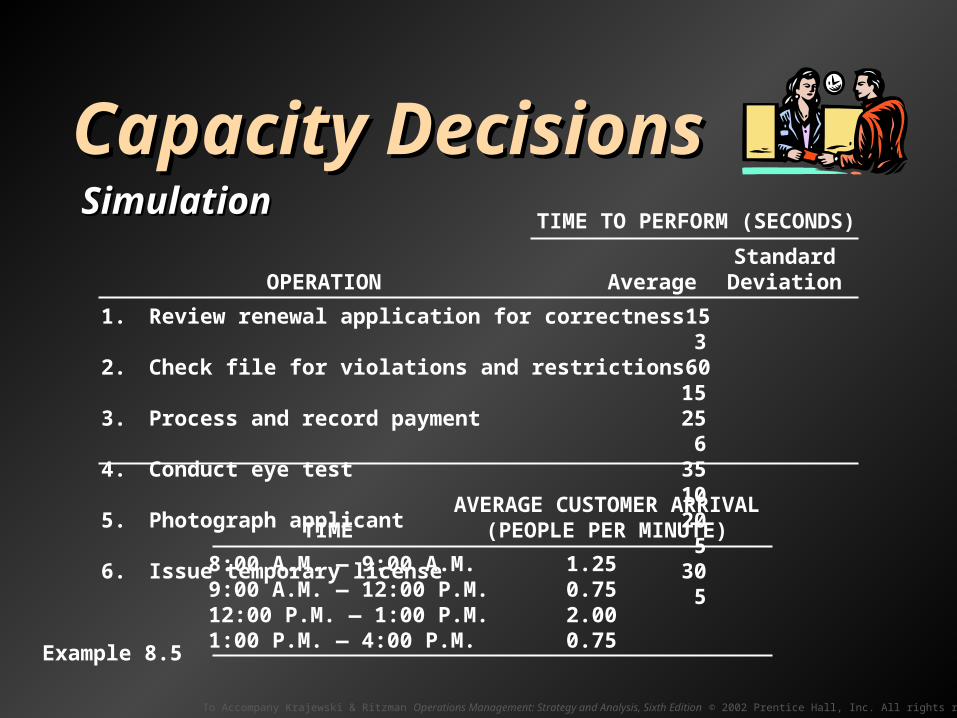
Capacity DecisionsCapacity DecisionsSimulationSimulation
TIME TO PERFORM (SECONDS)
StandardOPERATION Average Deviation
1. Review renewal application for correctness 153
2. Check file for violations and restrictions 6015
3. Process and record payment 256
4. Conduct eye test 3510
5. Photograph applicant 205
6. Issue temporary license 305
AVERAGE CUSTOMER ARRIVALTIME (PEOPLE PER MINUTE)
8:00 A.M. — 9:00 A.M. 1.259:00 A.M. — 12:00 P.M. 0.7512:00 P.M. — 1:00 P.M. 2.001:00 P.M. — 4:00 P.M. 0.75
Example 8.5
To Accompany Krajewski & Ritzman Operations Management: Strategy and Analysis, Sixth Edition © 2002 Prentice Hall, Inc. All rights reserved.
Capacity DecisionsCapacity DecisionsSimulationSimulation
To Accompany Krajewski & Ritzman Operations Management: Strategy and Analysis, Sixth Edition © 2002 Prentice Hall, Inc. All rights reserved.
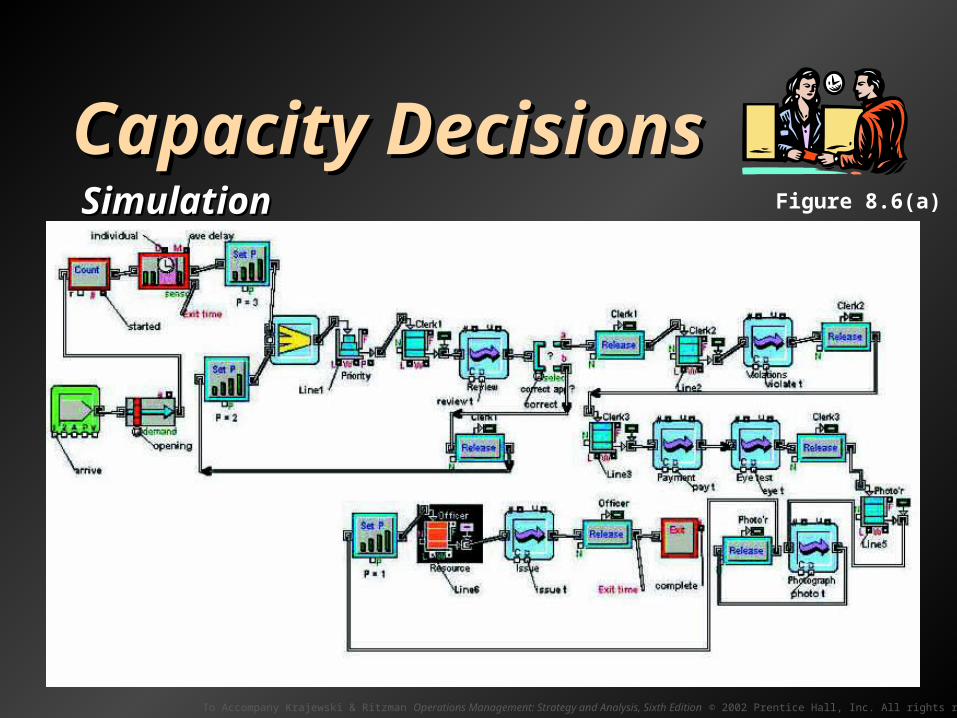
Capacity DecisionsCapacity DecisionsSimulationSimulation Figure 8.6(a)

To Accompany Krajewski & Ritzman Operations Management: Strategy and Analysis, Sixth Edition © 2002 Prentice Hall, Inc. All rights reserved.
Capacity DecisionsCapacity DecisionsSimulationSimulation
To Accompany Krajewski & Ritzman Operations Management: Strategy and Analysis, Sixth Edition © 2002 Prentice Hall, Inc. All rights reserved.
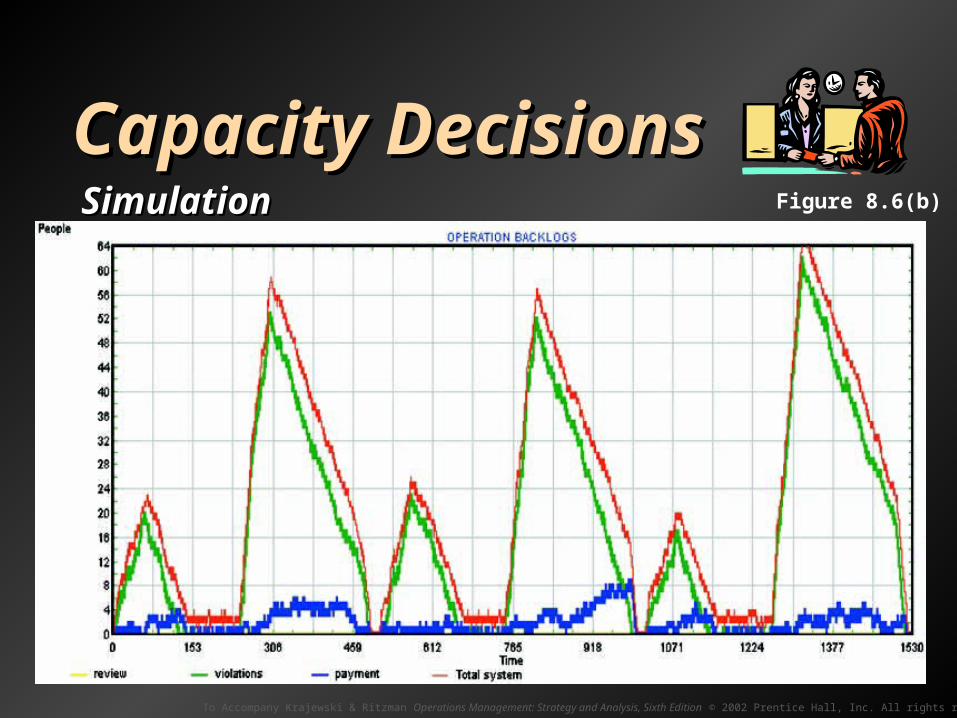
Capacity DecisionsCapacity DecisionsSimulationSimulation Figure 8.6(b)

To Accompany Krajewski & Ritzman Operations Management: Strategy and Analysis, Sixth Edition © 2002 Prentice Hall, Inc. All rights reserved.
Capacity DecisionsCapacity DecisionsSimulationSimulation
To Accompany Krajewski & Ritzman Operations Management: Strategy and Analysis, Sixth Edition © 2002 Prentice Hall, Inc. All rights reserved.
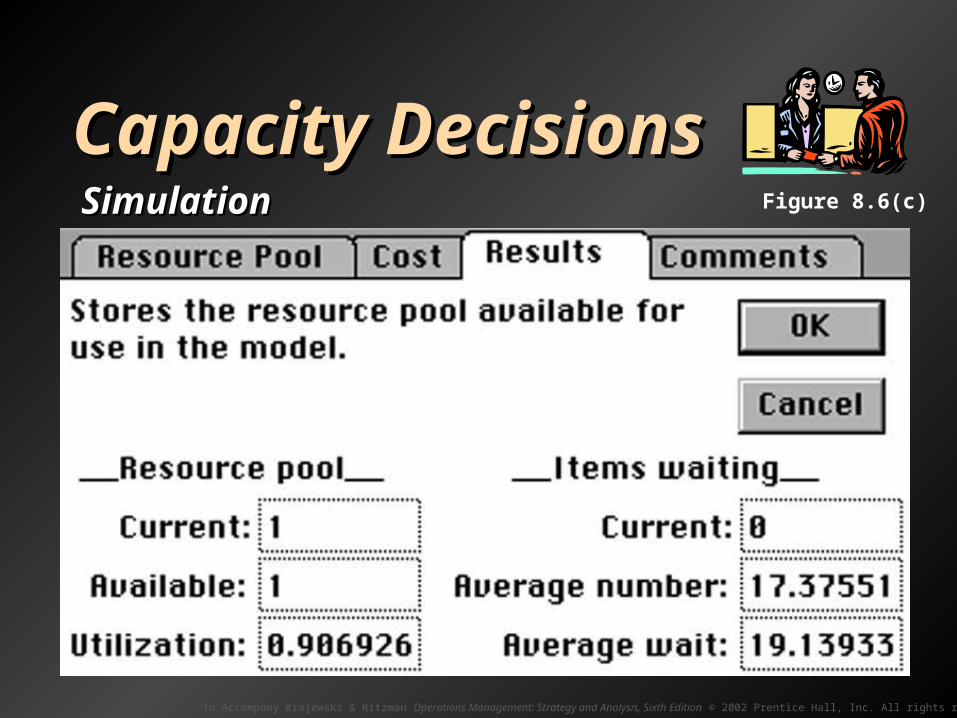
Capacity DecisionsCapacity DecisionsSimulationSimulation Figure 8.6(c)

To Accompany Krajewski & Ritzman Operations Management: Strategy and Analysis, Sixth Edition © 2002 Prentice Hall, Inc. All rights reserved.
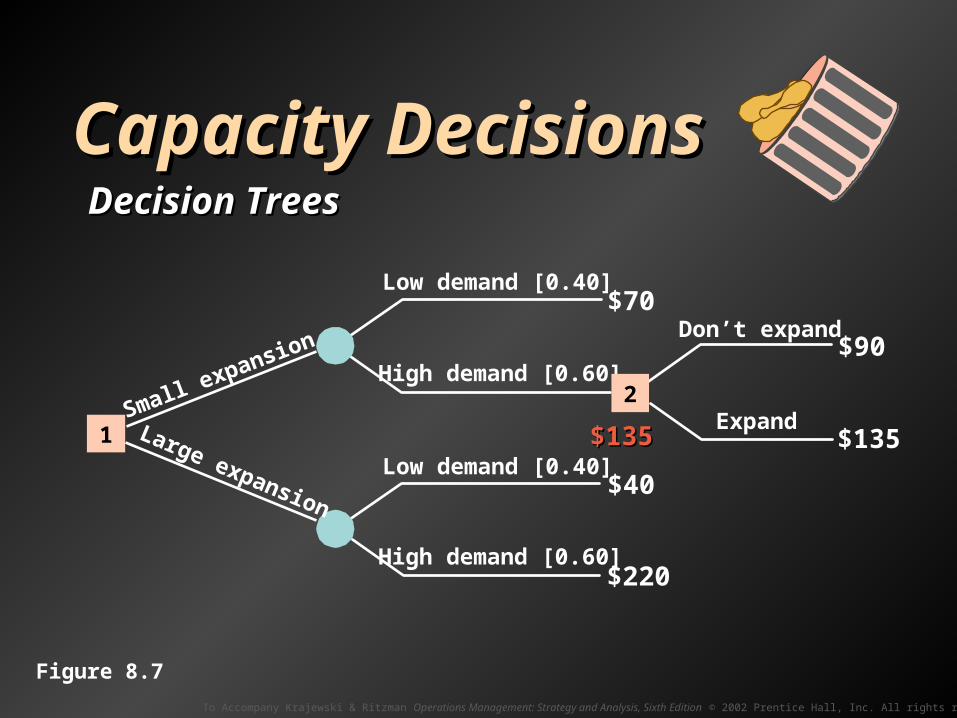
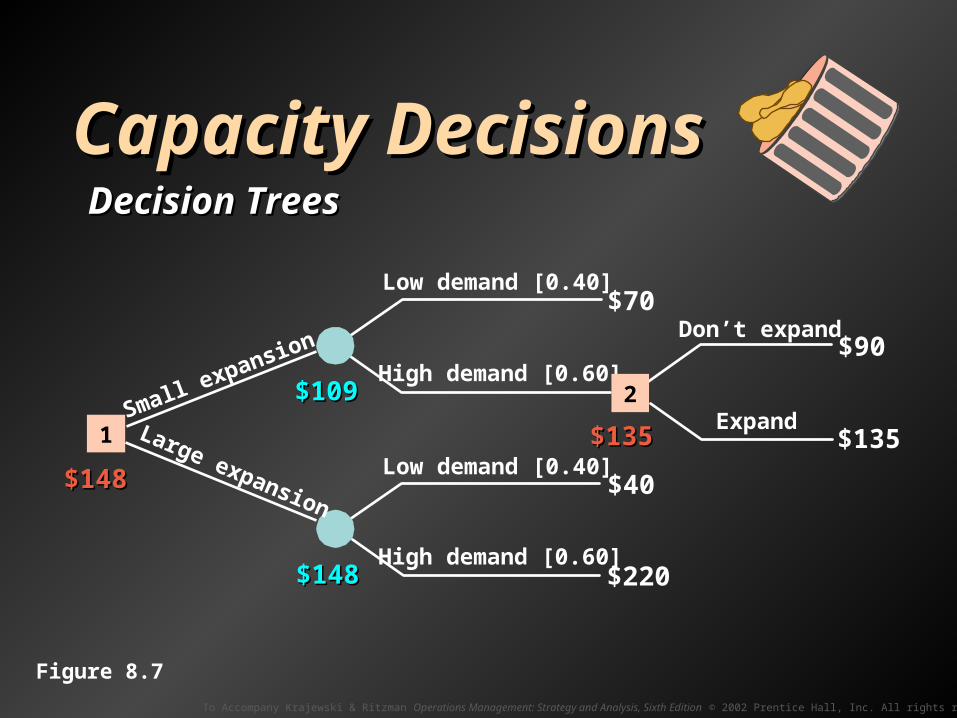
Capacity DecisionsCapacity DecisionsDecision TreesDecision Trees
To Accompany Krajewski & Ritzman Operations Management: Strategy and Analysis, Sixth Edition © 2002 Prentice Hall, Inc. All rights reserved.
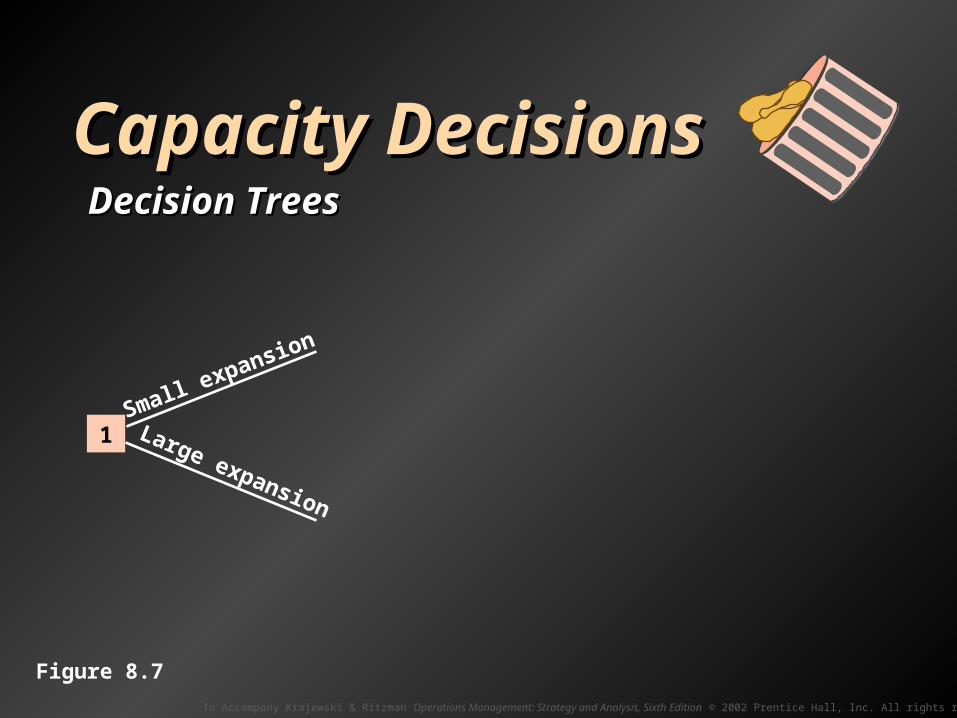
Capacity DecisionsCapacity DecisionsDecision TreesDecision Trees
1Small expansion
Large expansion
Figure 8.7
To Accompany Krajewski & Ritzman Operations Management: Strategy and Analysis, Sixth Edition © 2002 Prentice Hall, Inc. All rights reserved.
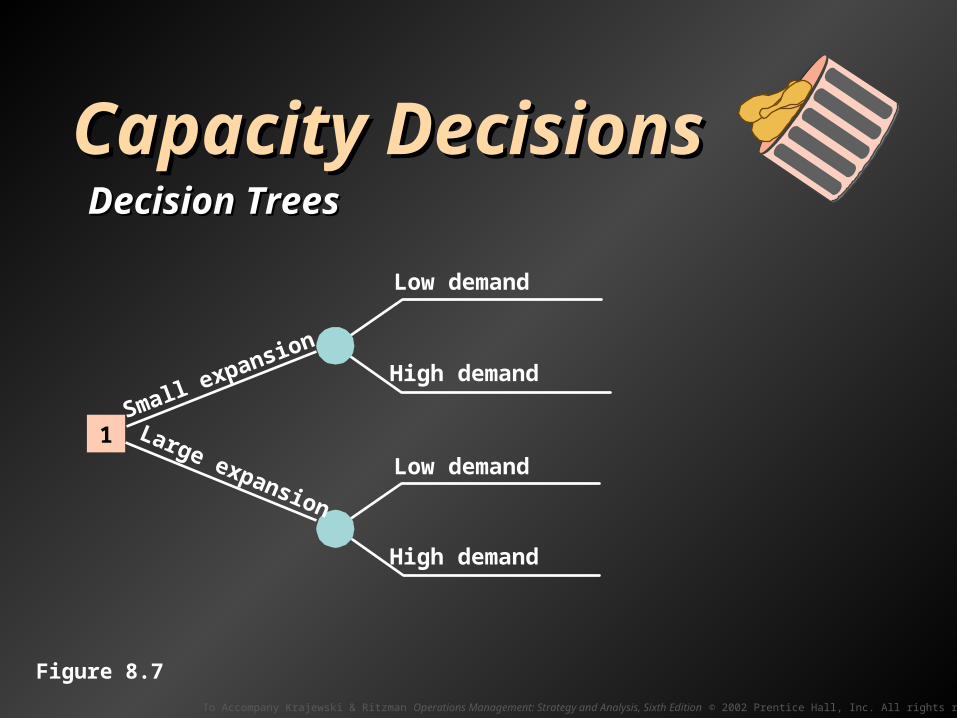
Capacity DecisionsCapacity DecisionsDecision TreesDecision Trees
Low demand
Low demand
High demand
High demand
1Small expansion
Large expansion
Figure 8.7
To Accompany Krajewski & Ritzman Operations Management: Strategy and Analysis, Sixth Edition © 2002 Prentice Hall, Inc. All rights reserved.
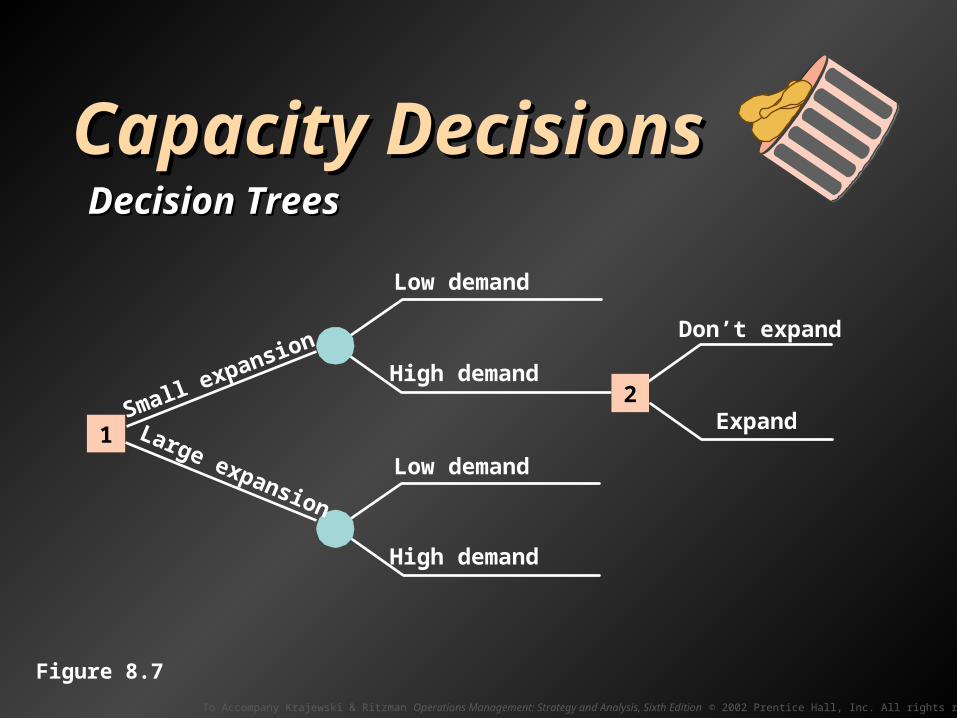
Capacity DecisionsCapacity DecisionsDecision TreesDecision Trees
Low demand
Low demand
High demand
High demand
Don’t expand
Expand1
2Small expansion
Large expansion
Figure 8.7
To Accompany Krajewski & Ritzman Operations Management: Strategy and Analysis, Sixth Edition © 2002 Prentice Hall, Inc. All rights reserved.
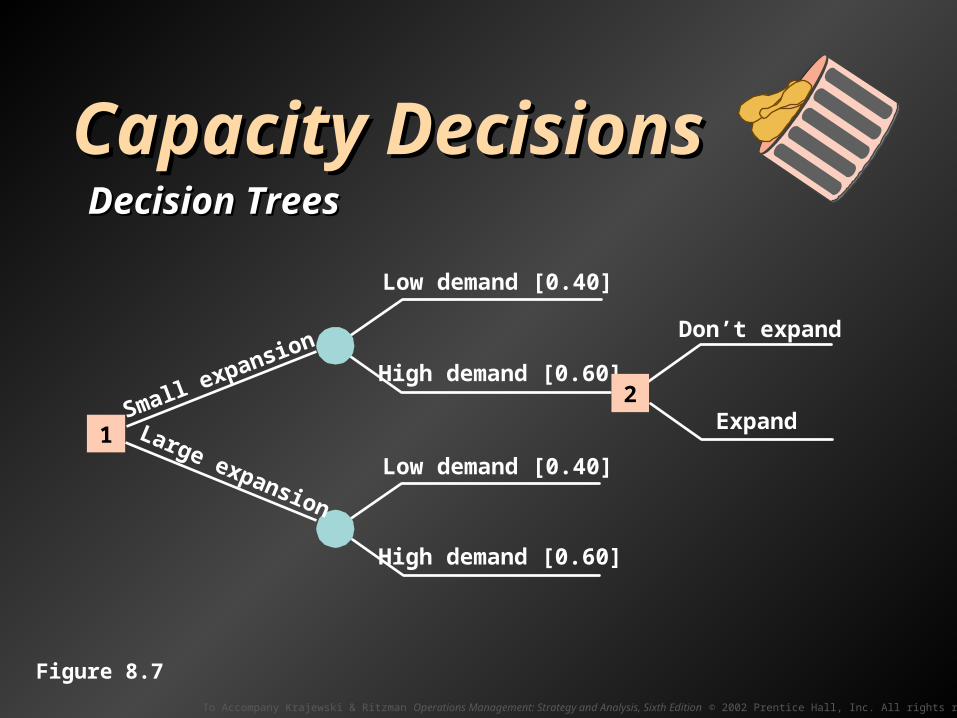
Capacity DecisionsCapacity DecisionsDecision TreesDecision Trees
Low demand [0.40]
Low demand [0.40]
High demand [0.60]
High demand [0.60]
Don’t expand
Expand1
2Small expansion
Large expansion
Figure 8.7
To Accompany Krajewski & Ritzman Operations Management: Strategy and Analysis, Sixth Edition © 2002 Prentice Hall, Inc. All rights reserved.
Capacity DecisionsCapacity DecisionsDecision TreesDecision Trees
Low demand [0.40]
Low demand [0.40]
$70
$220
$40
High demand [0.60]
High demand [0.60]
Don’t expand
Expand$135
$90
1
2Small expansion
Large expansion
Figure 8.7
To Accompany Krajewski & Ritzman Operations Management: Strategy and Analysis, Sixth Edition © 2002 Prentice Hall, Inc. All rights reserved.
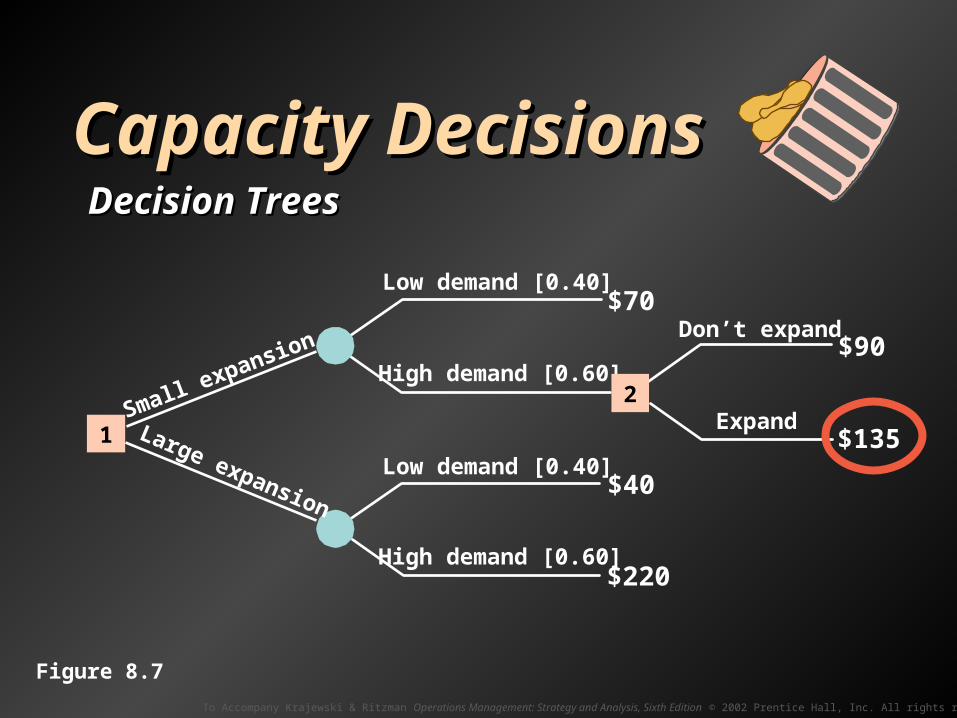
Capacity DecisionsCapacity DecisionsDecision TreesDecision Trees
Low demand [0.40]
Low demand [0.40]
$70
$220
$40
High demand [0.60]
High demand [0.60]
$135$135
Don’t expand
Expand$135
$90
1
2Small expansion
Large expansion
Figure 8.7
To Accompany Krajewski & Ritzman Operations Management: Strategy and Analysis, Sixth Edition © 2002 Prentice Hall, Inc. All rights reserved.
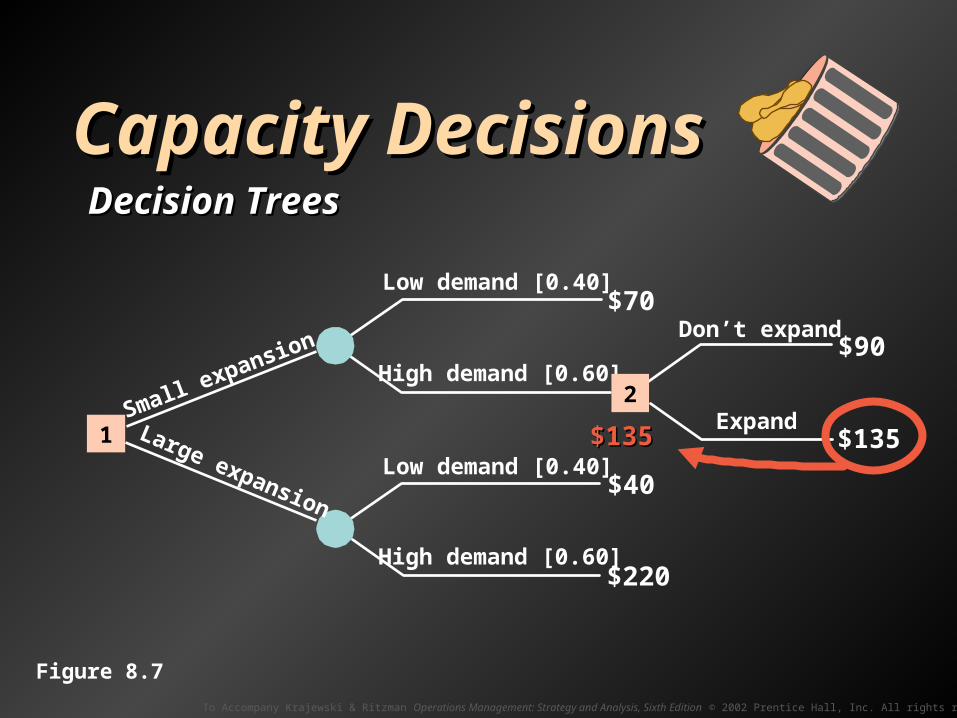
Capacity DecisionsCapacity DecisionsDecision TreesDecision Trees
Low demand [0.40]
Low demand [0.40]
$70
$220
$40
High demand [0.60]
High demand [0.60]
$135$135
Don’t expand
Expand$135
$90
1
2Small expansion
Large expansion
Figure 8.7
To Accompany Krajewski & Ritzman Operations Management: Strategy and Analysis, Sixth Edition © 2002 Prentice Hall, Inc. All rights reserved.
Capacity DecisionsCapacity DecisionsDecision TreesDecision Trees
Low demand [0.40]
Low demand [0.40]
$70
$220
$40
High demand [0.60]
High demand [0.60]
$135$135
Don’t expand
Expand$135
$90
1
2Small expansion
Large expansion
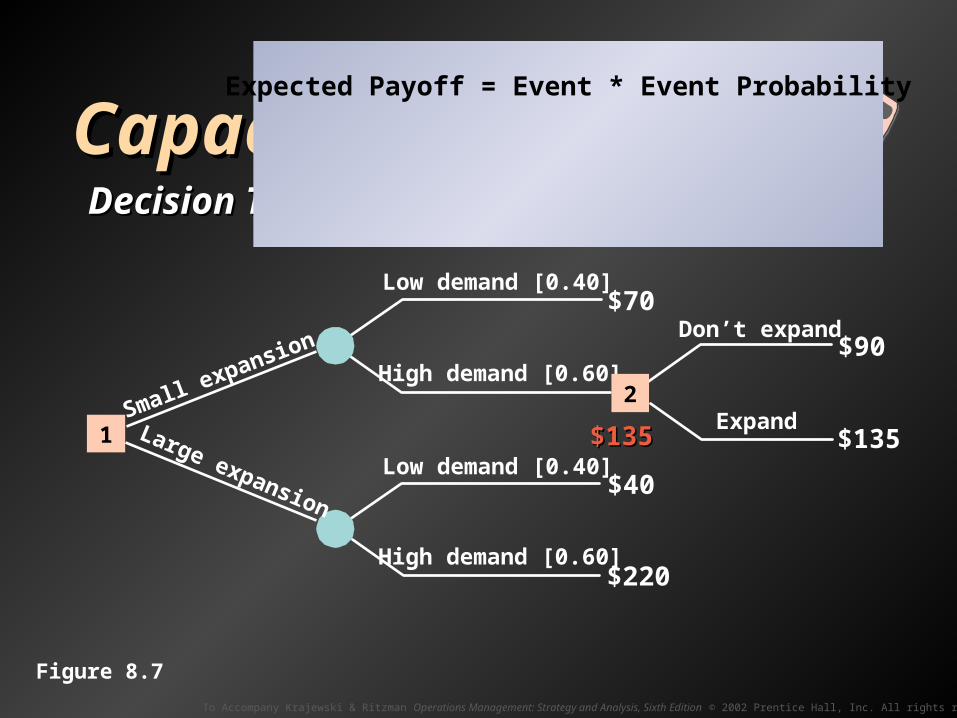
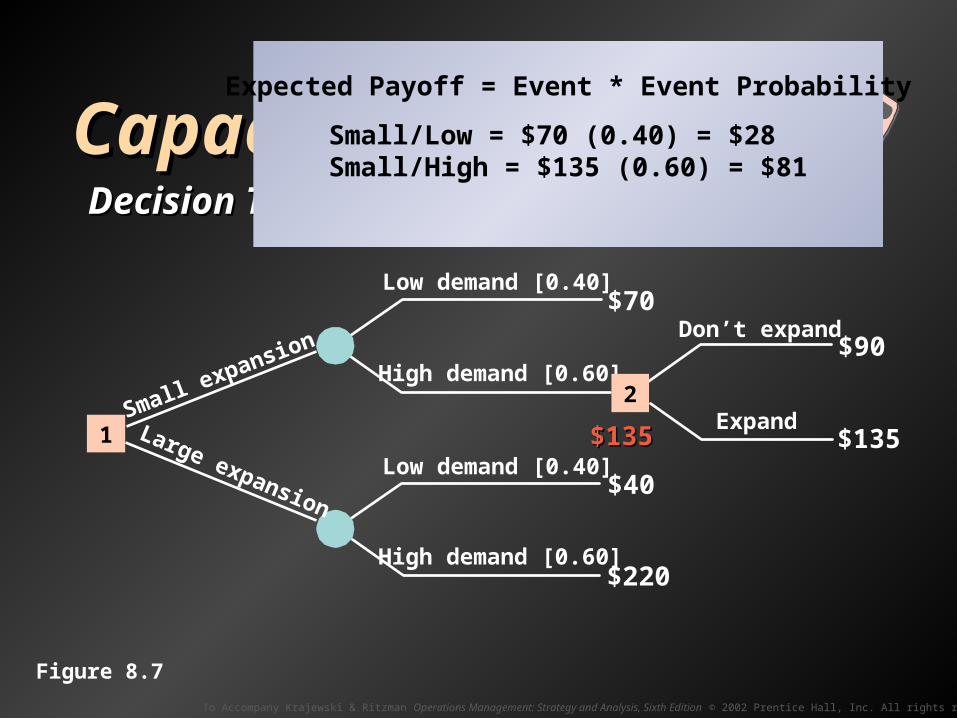
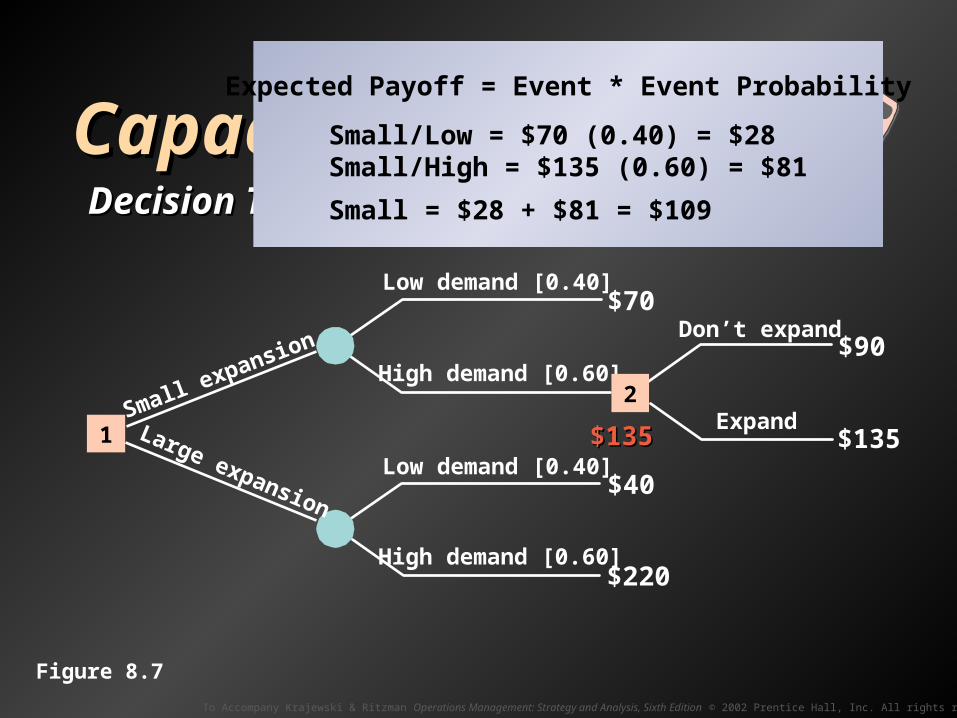
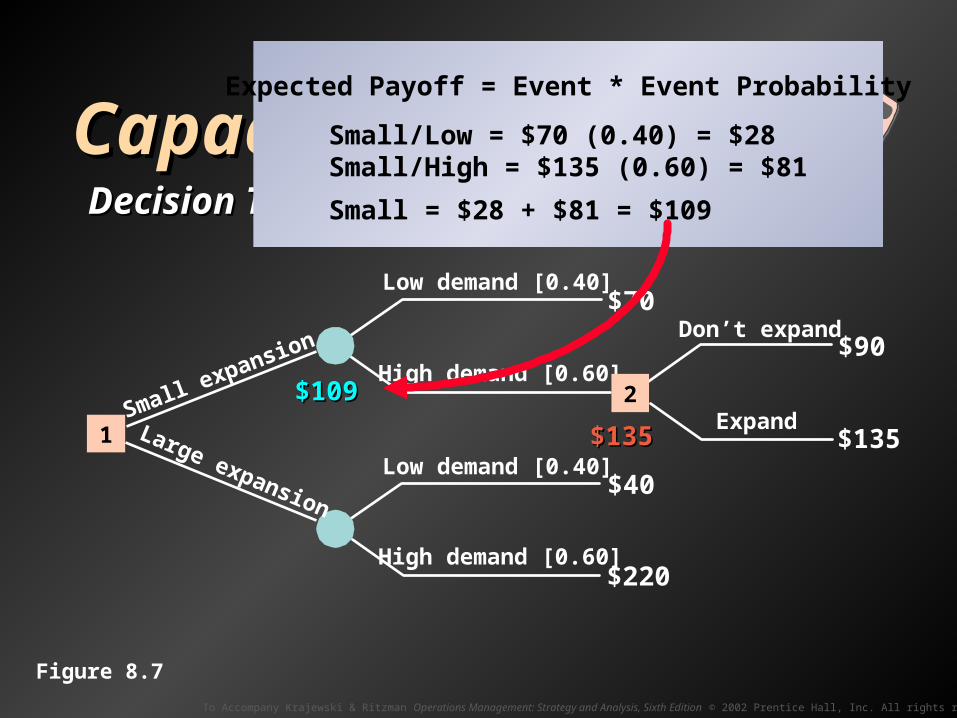
Expected Payoff = Event * Event Probability
Figure 8.7

To Accompany Krajewski & Ritzman Operations Management: Strategy and Analysis, Sixth Edition © 2002 Prentice Hall, Inc. All rights reserved.
Capacity DecisionsCapacity DecisionsDecision TreesDecision Trees
Low demand [0.40]
Low demand [0.40]
$70
$220
$40
High demand [0.60]
High demand [0.60]
$135$135
Don’t expand
Expand$135
$90
1
2Small expansion
Large expansion
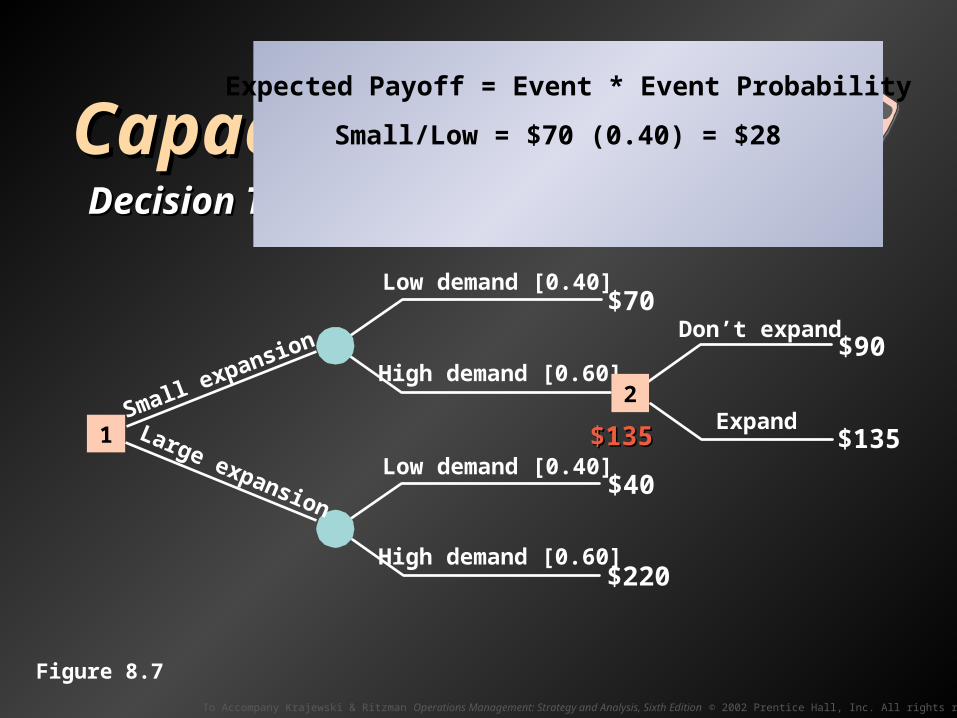
Expected Payoff = Event * Event Probability
Small/Low = $70 (0.40)
Figure 8.7
To Accompany Krajewski & Ritzman Operations Management: Strategy and Analysis, Sixth Edition © 2002 Prentice Hall, Inc. All rights reserved.
Capacity DecisionsCapacity DecisionsDecision TreesDecision Trees
Low demand [0.40]
Low demand [0.40]
$70
$220
$40
High demand [0.60]
High demand [0.60]
$135$135
Don’t expand
Expand$135
$90
1
2Small expansion
Large expansion
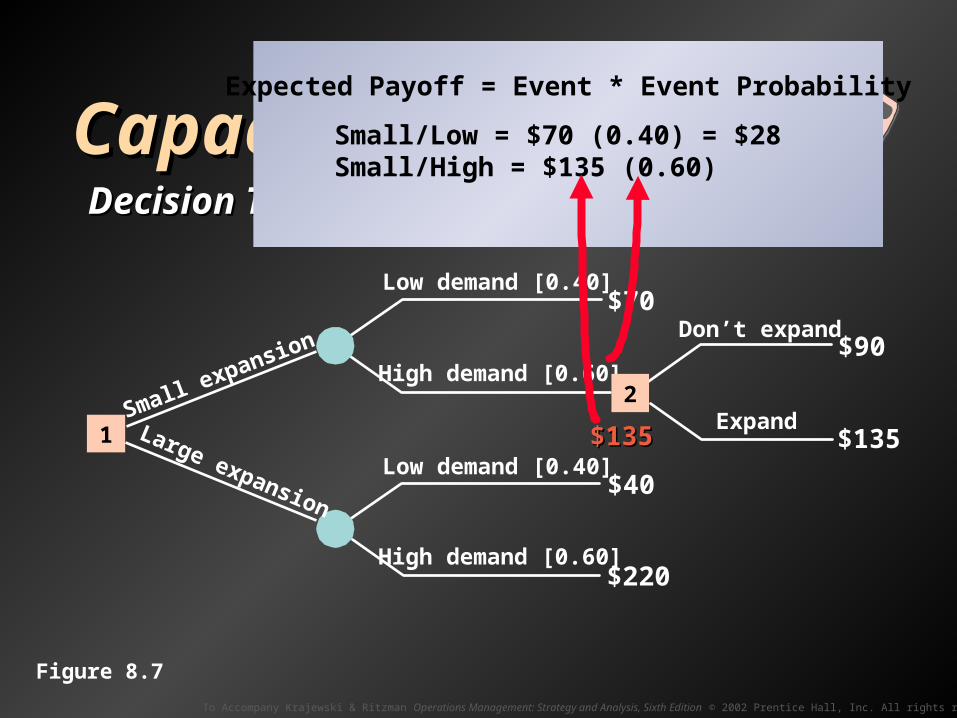
Expected Payoff = Event * Event Probability
Small/Low = $70 (0.40) = $28
Figure 8.7
To Accompany Krajewski & Ritzman Operations Management: Strategy and Analysis, Sixth Edition © 2002 Prentice Hall, Inc. All rights reserved.
Capacity DecisionsCapacity DecisionsDecision TreesDecision Trees
Low demand [0.40]
Low demand [0.40]
$70
$220
$40
High demand [0.60]
High demand [0.60]
$135$135
Don’t expand
Expand$135
$90
1
2Small expansion
Large expansion
Expected Payoff = Event * Event Probability
Small/Low = $70 (0.40) = $28Small/High = $135 (0.60)
Figure 8.7
To Accompany Krajewski & Ritzman Operations Management: Strategy and Analysis, Sixth Edition © 2002 Prentice Hall, Inc. All rights reserved.
Capacity DecisionsCapacity DecisionsDecision TreesDecision Trees
Low demand [0.40]
Low demand [0.40]
$70
$220
$40
High demand [0.60]
High demand [0.60]
$135$135
Don’t expand
Expand$135
$90
1
2Small expansion
Large expansion
Expected Payoff = Event * Event Probability
Small/Low = $70 (0.40) = $28Small/High = $135 (0.60) = $81
Small = $28 + $81 = $109
$109$109
Figure 8.7
To Accompany Krajewski & Ritzman Operations Management: Strategy and Analysis, Sixth Edition © 2002 Prentice Hall, Inc. All rights reserved.
Capacity DecisionsCapacity DecisionsDecision TreesDecision Trees
Low demand [0.40]
Low demand [0.40]
$70
$220
$40
High demand [0.60]
High demand [0.60]
$135$135
Don’t expand
Expand$135
$90
1
2Small expansion
Large expansion
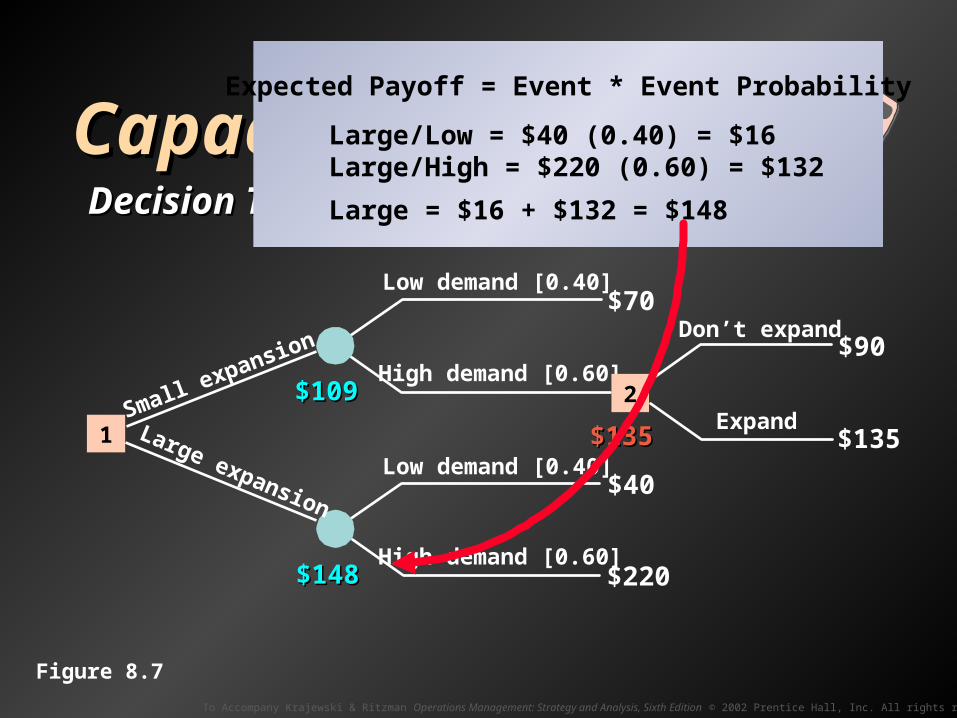
Expected Payoff = Event * Event Probability
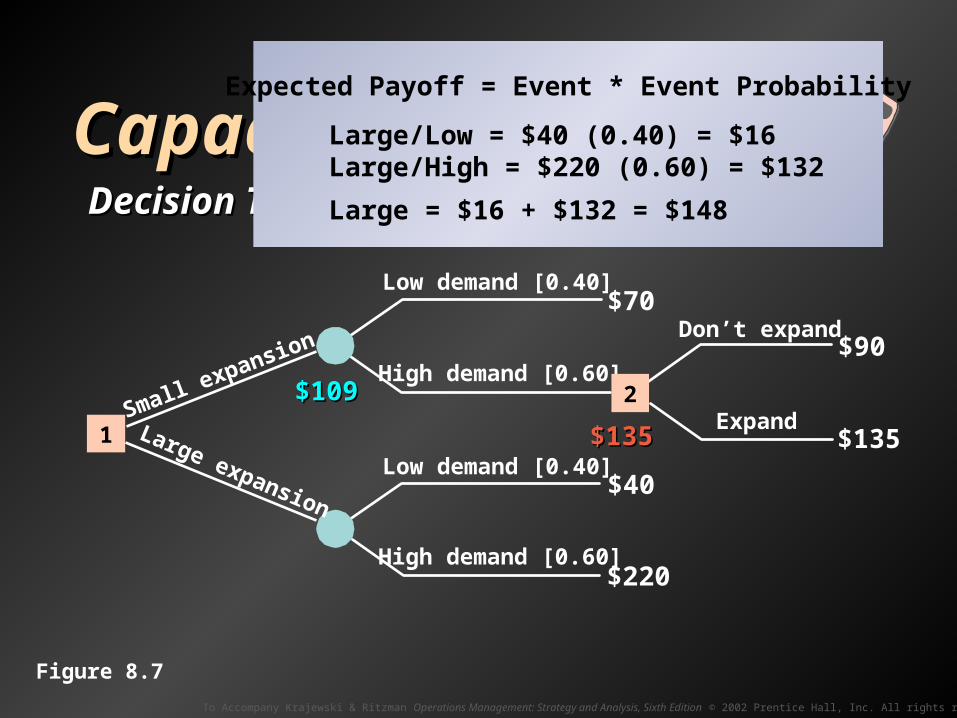
Large/Low = $40 (0.40) = $16Large/High = $220 (0.60) = $132
Large = $16 + $132 = $148
$109$109
Figure 8.7
To Accompany Krajewski & Ritzman Operations Management: Strategy and Analysis, Sixth Edition © 2002 Prentice Hall, Inc. All rights reserved.
Capacity DecisionsCapacity DecisionsDecision TreesDecision Trees
Low demand [0.40]
Low demand [0.40]
$70
$220
$40
High demand [0.60]
High demand [0.60]
$135$135
Don’t expand
Expand$135
$90
1
2Small expansion
Large expansion
Expected Payoff = Event * Event Probability
Large/Low = $40 (0.40) = $16Large/High = $220 (0.60) = $132
Large = $16 + $132 = $148
$109$109
$148$148
Figure 8.7
To Accompany Krajewski & Ritzman Operations Management: Strategy and Analysis, Sixth Edition © 2002 Prentice Hall, Inc. All rights reserved.
Capacity DecisionsCapacity DecisionsDecision TreesDecision Trees
Low demand [0.40]
Low demand [0.40]
$70
$220
$40
$148$148
$109$109
High demand [0.60]
High demand [0.60]
$135$135
Don’t expand
Expand$135
$90
1
2Small expansion
Large expansion
Figure 8.7
To Accompany Krajewski & Ritzman Operations Management: Strategy and Analysis, Sixth Edition © 2002 Prentice Hall, Inc. All rights reserved.
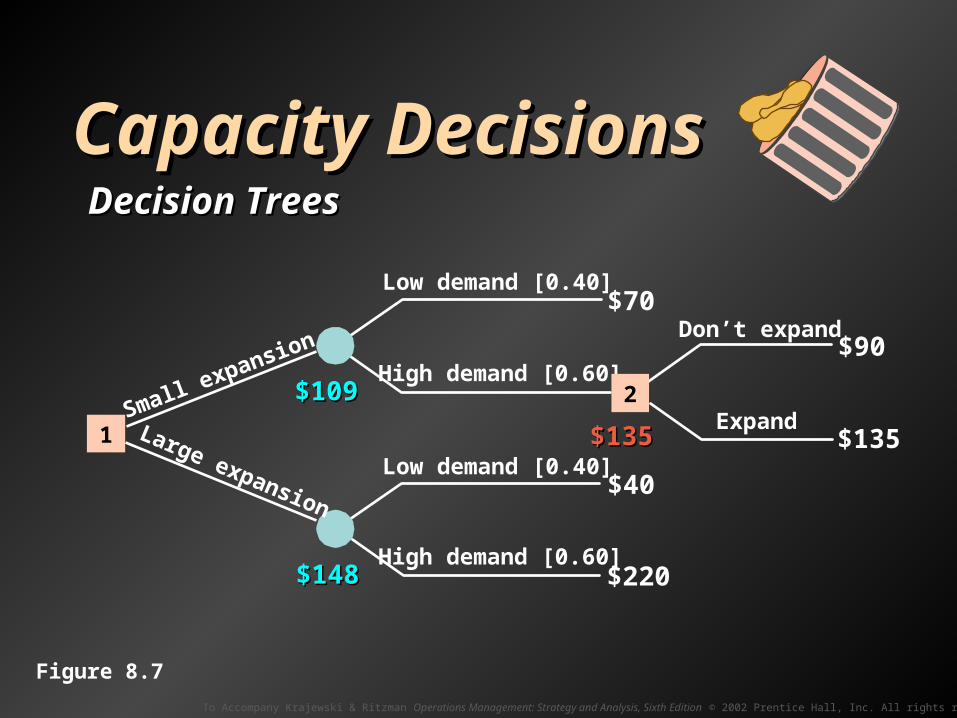
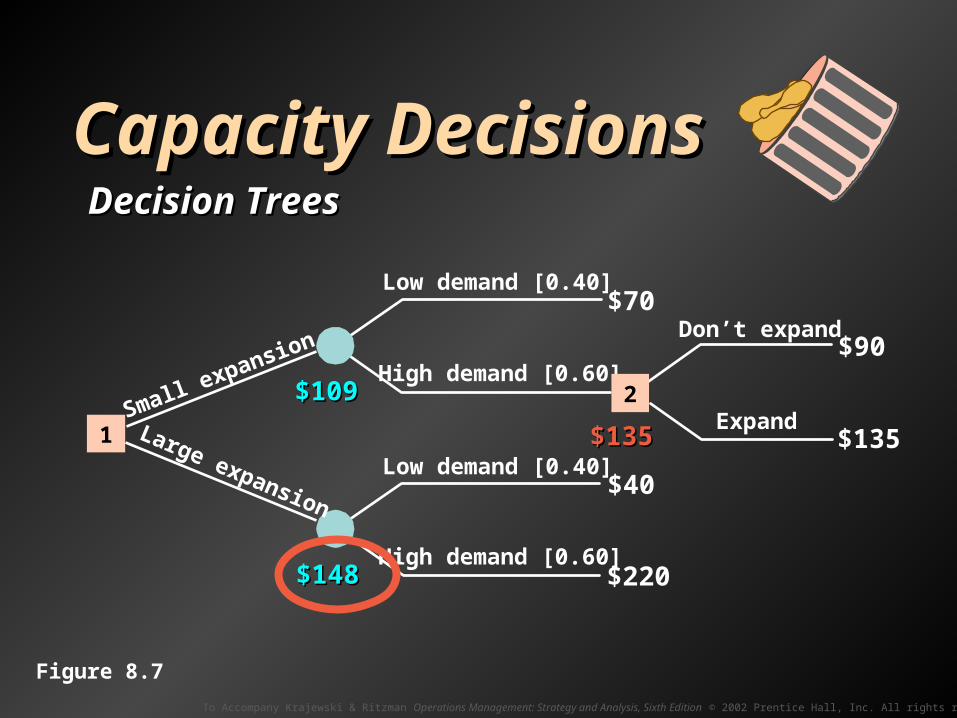
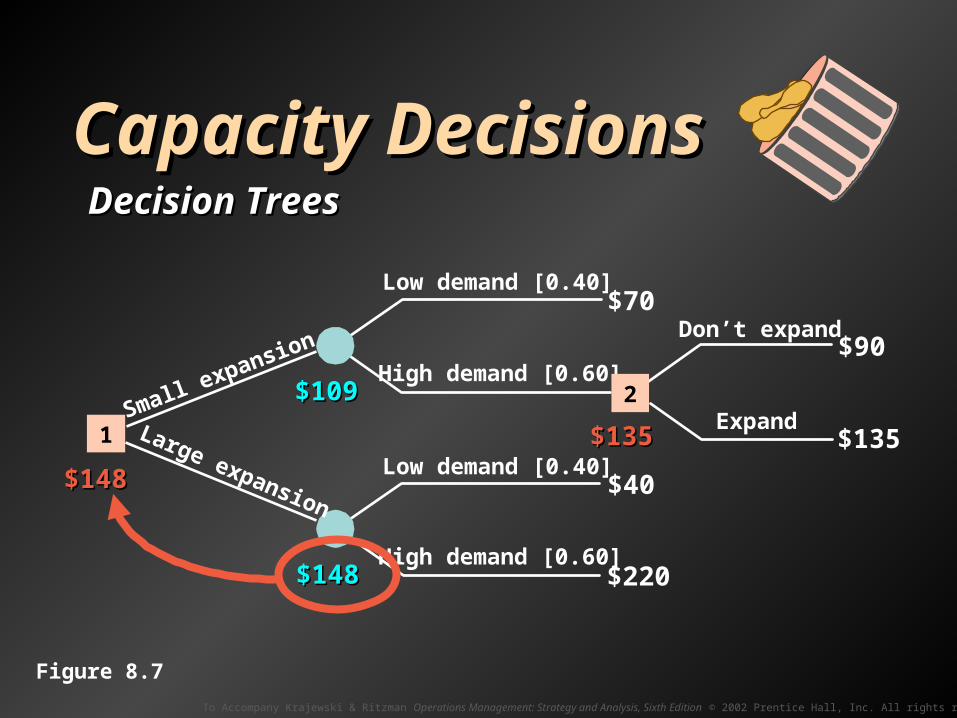
Capacity DecisionsCapacity DecisionsDecision TreesDecision Trees
Low demand [0.40]
Low demand [0.40]
$70
$220
$40
$148$148
$109$109
$148$148
High demand [0.60]
High demand [0.60]
$135$135
Don’t expand
Expand$135
$90
1
2Small expansion
Large expansion
Figure 8.7
To Accompany Krajewski & Ritzman Operations Management: Strategy and Analysis, Sixth Edition © 2002 Prentice Hall, Inc. All rights reserved.
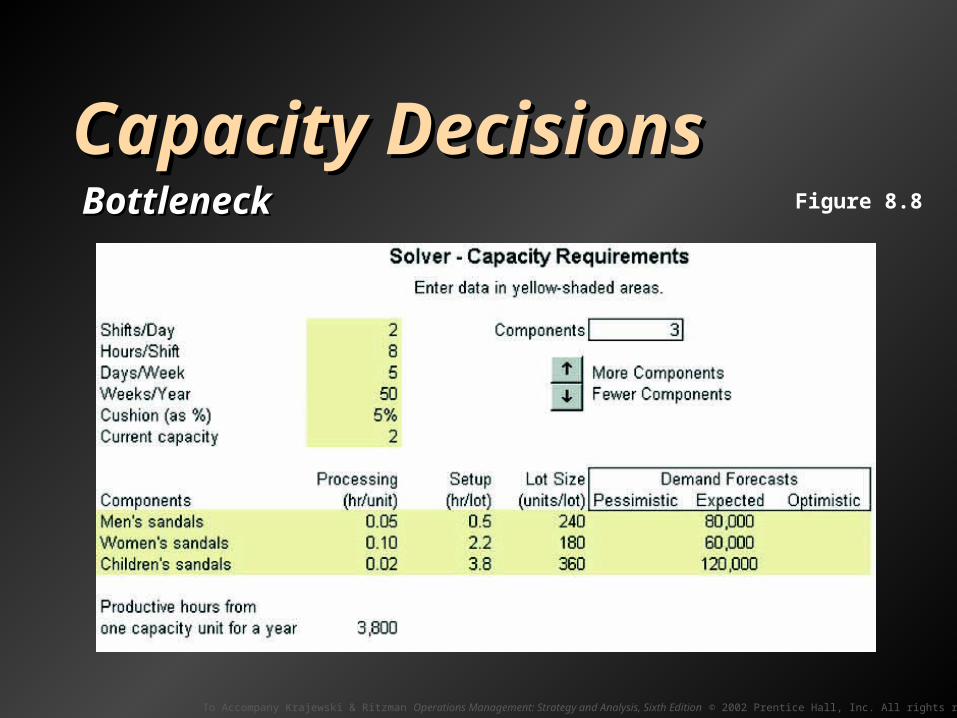
Capacity DecisionsCapacity DecisionsBottleneckBottleneck Figure 8.8
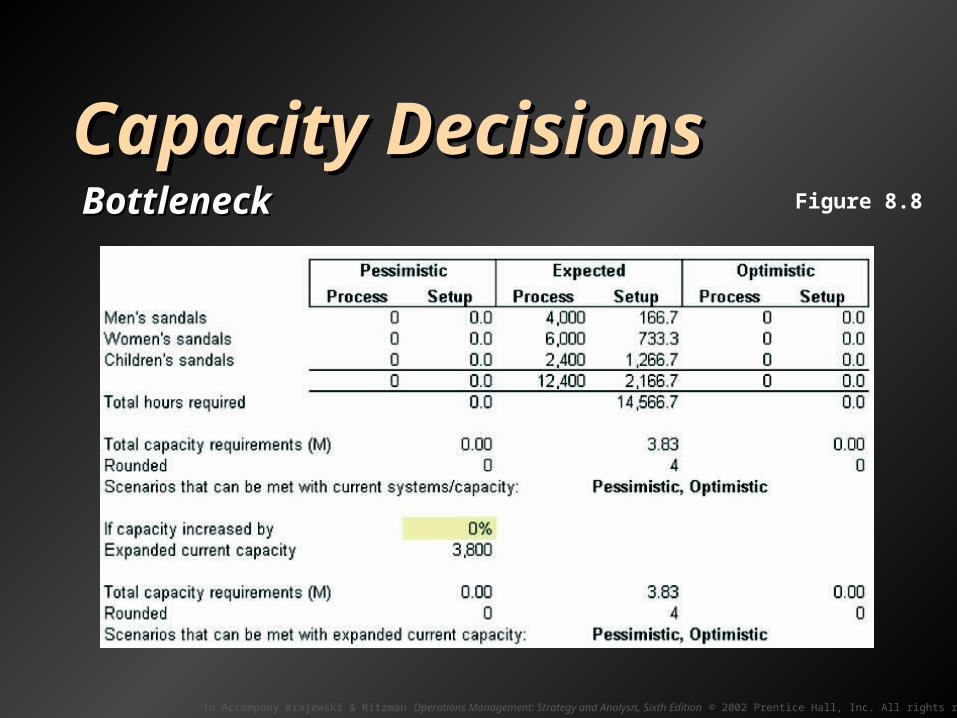
To Accompany Krajewski & Ritzman Operations Management: Strategy and Analysis, Sixth Edition © 2002 Prentice Hall, Inc. All rights reserved.
Capacity DecisionsCapacity DecisionsBottleneckBottleneck Figure 8.8