Embed Size (px)
Citation preview
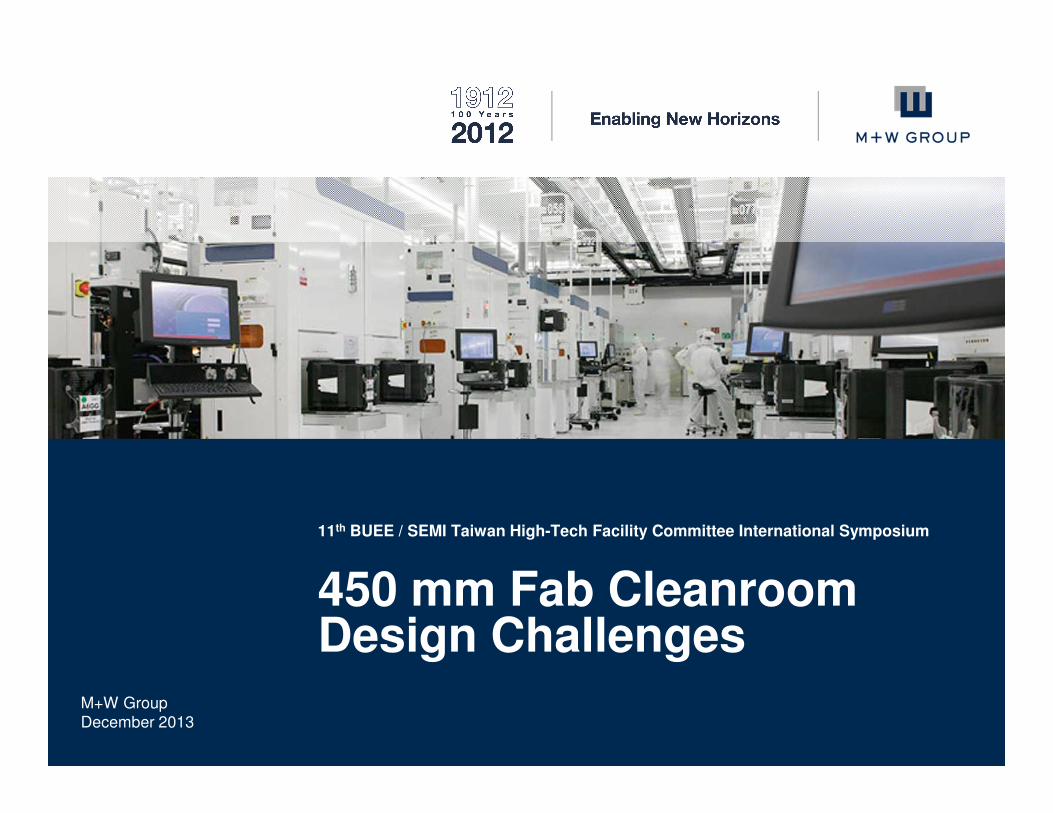
11th BUEE / SEMI Taiwan High-Tech Facility Committee International Symposium
450 mm Fab Cleanroom Design Challenges
M+W GroupDecember 2013
© M+W Group2
Contents
� Introduction
� The Transition - Investment Drivers
� Tool Dimensions / Weight
� Floor Load and Cleanroom Height
� Manufacturing Area Sizing
� Utility Consumption
� Sustainability - Operational Cost Considerations
� Energy Conservation
� Related M+W R&D Activities
� Facilities Optimization
� Summary
© M+W Group3
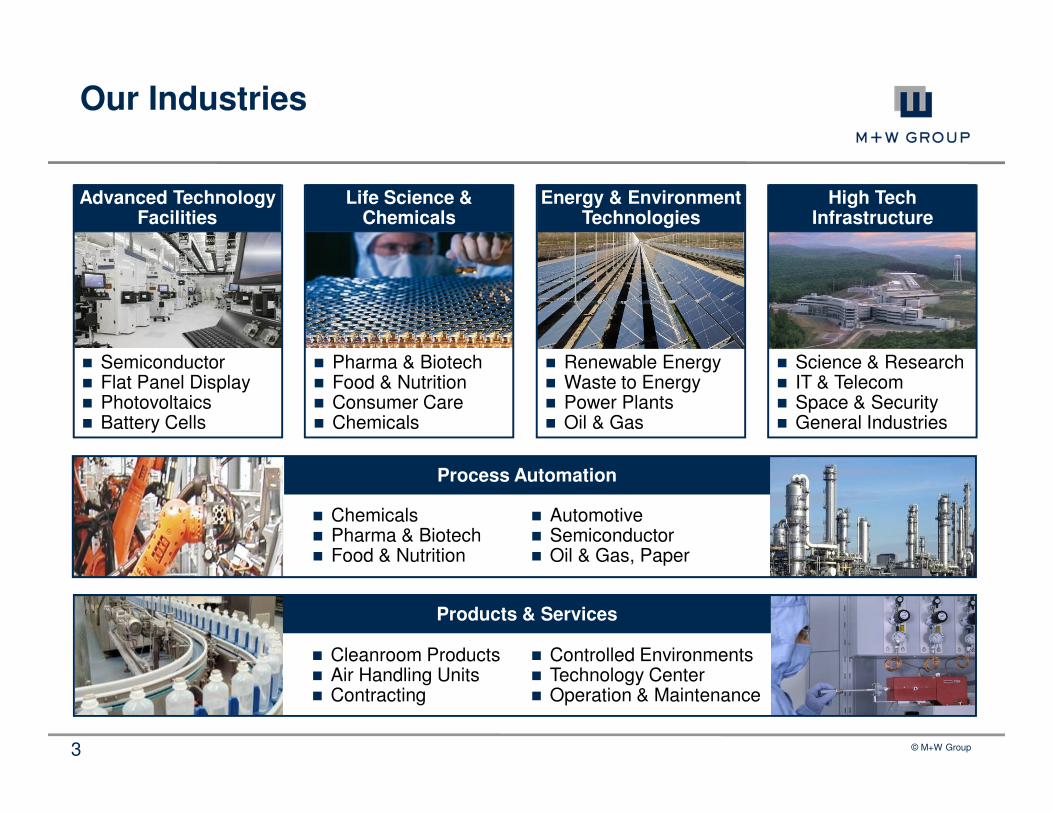
Our Industries
Process Automation
Products & Services
Energy & Environment Technologies
� Semiconductor� Flat Panel Display� Photovoltaics� Battery Cells
� Pharma & Biotech� Food & Nutrition� Consumer Care� Chemicals
� Renewable Energy� Waste to Energy� Power Plants� Oil & Gas
� Science & Research� IT & Telecom� Space & Security� General Industries
Advanced TechnologyFacilities
Life Science & Chemicals
High Tech Infrastructure
� Cleanroom Products� Air Handling Units� Contracting
� Controlled Environments� Technology Center� Operation & Maintenance
� Chemicals� Pharma & Biotech� Food & Nutrition
� Automotive� Semiconductor� Oil & Gas, Paper
© M+W Group4
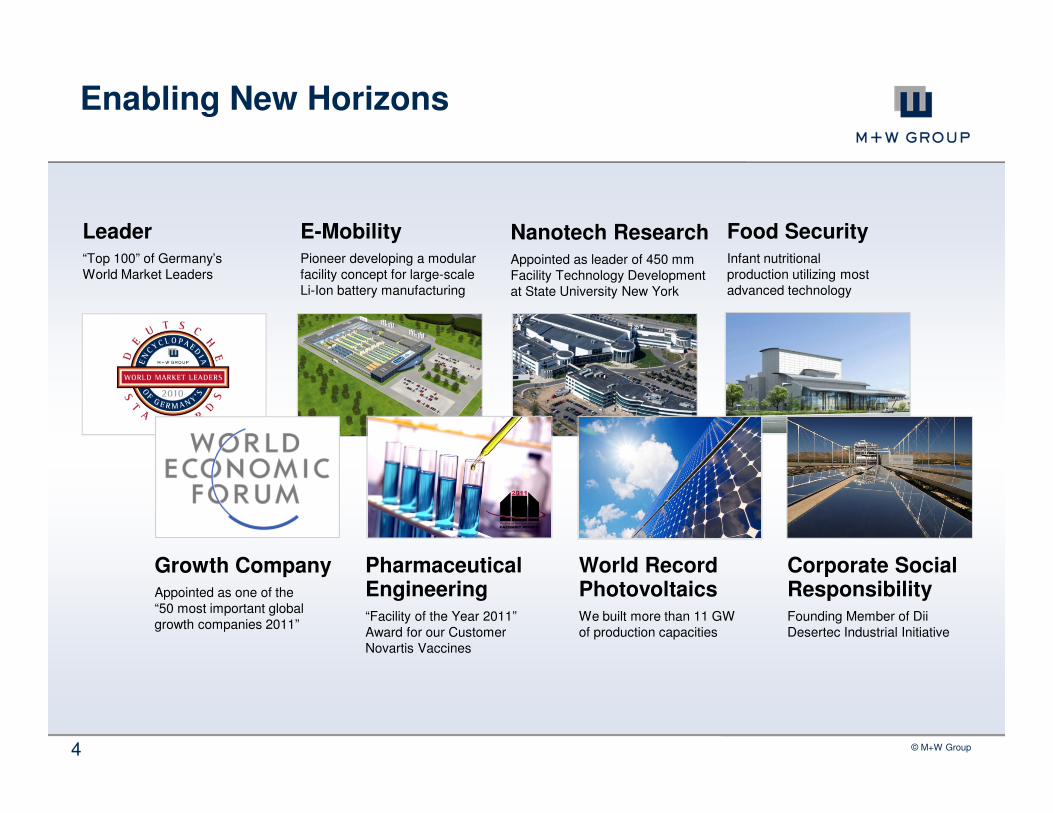
Enabling New Horizons
Leader“Top 100” of Germany’s World Market Leaders
E-MobilityPioneer developing a modular facility concept for large-scale Li-Ion battery manufacturing
Nanotech ResearchAppointed as leader of 450 mm Facility Technology Development at State University New York
Food SecurityInfant nutritional production utilizing most advanced technology
Growth CompanyAppointed as one of the “50 most important global growth companies 2011”
Pharmaceutical Engineering“Facility of the Year 2011” Award for our Customer Novartis Vaccines
World Record PhotovoltaicsWe built more than 11 GW of production capacities
Corporate Social ResponsibilityFounding Member of DiiDesertec Industrial Initiative
© M+W Group5
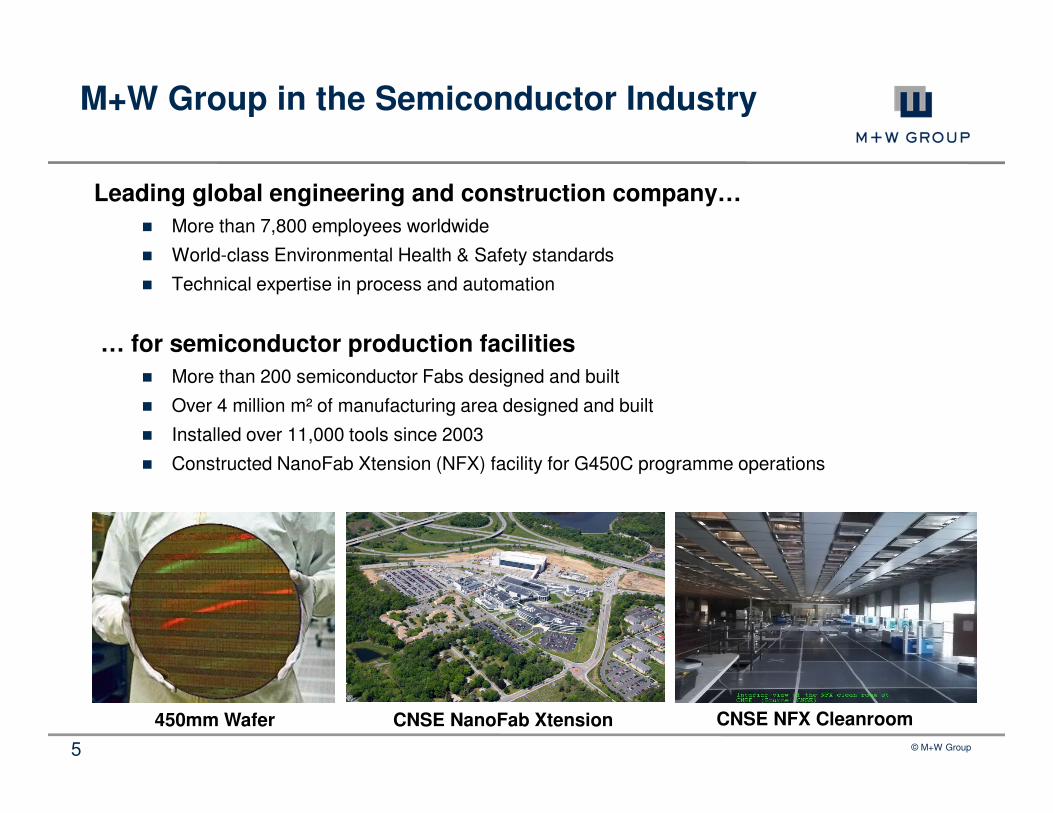
M+W Group in the Semiconductor Industry
Leading global engineering and construction company…
� More than 7,800 employees worldwide
� World-class Environmental Health & Safety standards
� Technical expertise in process and automation
… for semiconductor production facilities
� More than 200 semiconductor Fabs designed and built
� Over 4 million m² of manufacturing area designed and built
� Installed over 11,000 tools since 2003
� Constructed NanoFab Xtension (NFX) facility for G450C programme operations
CNSE NFX Cleanroom450mm Wafer CNSE NanoFab Xtension
© M+W Group6
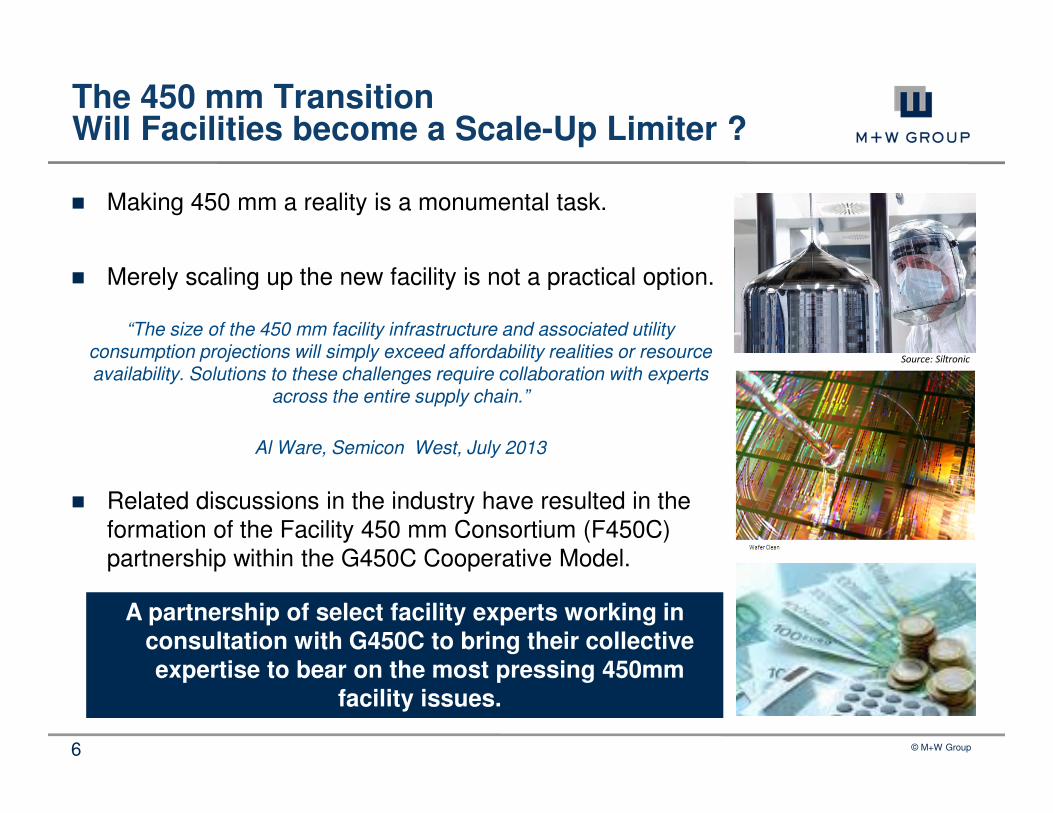
The 450 mm Transition Will Facilities become a Scale-Up Limiter ?
� Making 450 mm a reality is a monumental task.
� Merely scaling up the new facility is not a practical option.
� Related discussions in the industry have resulted in the formation of the Facility 450 mm Consortium (F450C) partnership within the G450C Cooperative Model.
“The size of the 450 mm facility infrastructure and associated utility consumption projections will simply exceed affordability realities or resource availability. Solutions to these challenges require collaboration with experts
across the entire supply chain.”
Al Ware, Semicon West, July 2013
A partnership of select facility experts working in consultation with G450C to bring their collective expertise to bear on the most pressing 450mm
facility issues.
Source: Siltronic
© M+W Group7
Contents
� Introduction
� The Transition - Investment Drivers
� Tool Dimensions / Weight
� Floor Load and Cleanroom Height
� Manufacturing Area Sizing
� Utility Consumption
� Sustainability - Operational Cost Considerations
� Energy Conservation
� Related M+W R&D Activities
� Facilities Optimization
� Summary
© M+W Group8
450 mm Process Equipment Data
� If…
� the first 450 mm Fab should come on line within the next 2 to 3 years there is already today a need to extrapolate 450 mm tool requirements to enable the design and construction of 450 mm capable HVM factories.
� But…
� only a few 450 mm process tools are already available at SUNY or other R&D sites for evaluation of requirements (footprint, load impact, utility consumption, move-in etc.).
� Therefore,…
� M+W Group developed a tool scaling methodology in order to extrapolate future 450 mm tool requirements. The modeling results are continuously updated with real data collected from international R&D projects as well as within the framework of cooperation with tool vendors.
© M+W Group9
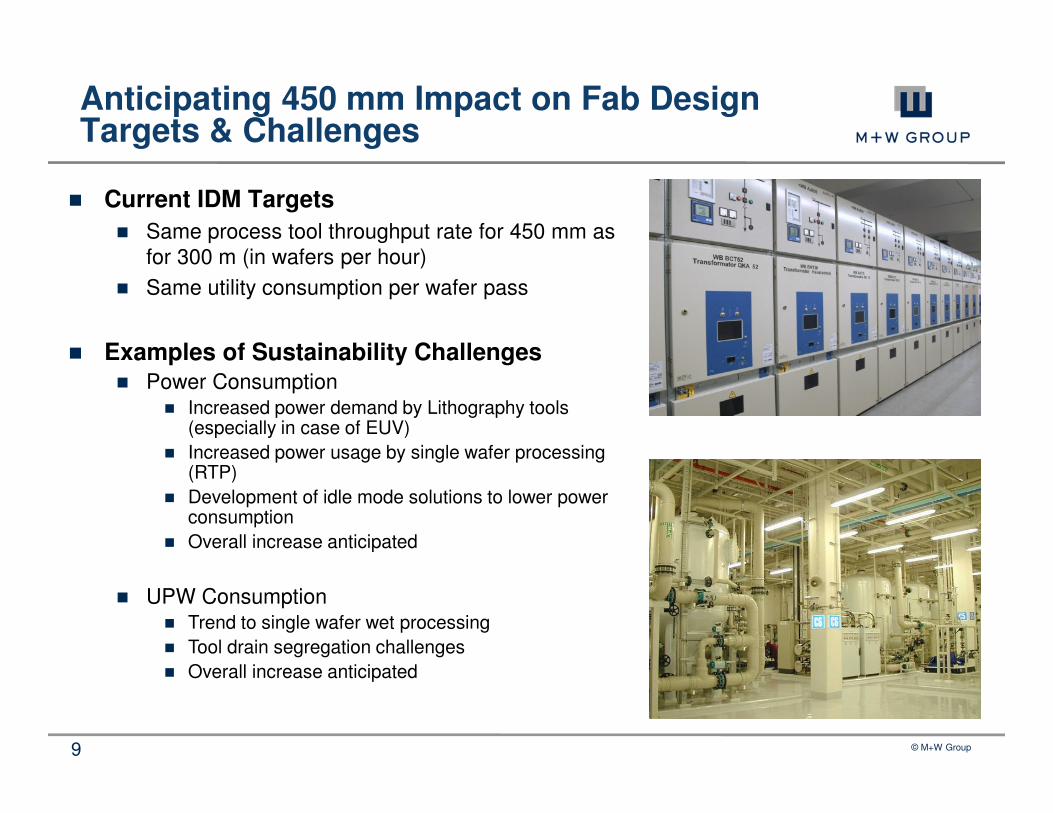
Anticipating 450 mm Impact on Fab DesignTargets & Challenges
� Current IDM Targets
� Same process tool throughput rate for 450 mm as for 300 m (in wafers per hour)
� Same utility consumption per wafer pass
� Examples of Sustainability Challenges� Power Consumption
� Increased power demand by Lithography tools (especially in case of EUV)
� Increased power usage by single wafer processing (RTP)
� Development of idle mode solutions to lower power consumption
� Overall increase anticipated
� UPW Consumption� Trend to single wafer wet processing
� Tool drain segregation challenges
� Overall increase anticipated
© M+W Group10
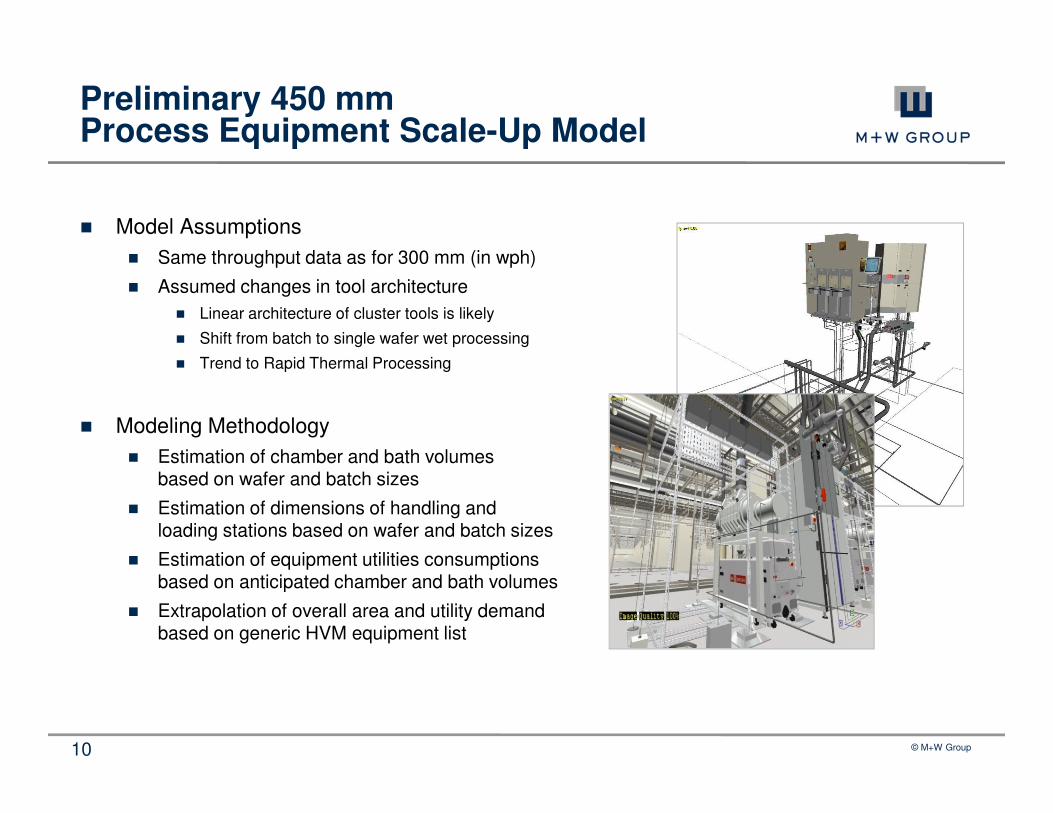
Preliminary 450 mm Process Equipment Scale-Up Model
� Model Assumptions
� Same throughput data as for 300 mm (in wph)
� Assumed changes in tool architecture
� Linear architecture of cluster tools is likely
� Shift from batch to single wafer wet processing
� Trend to Rapid Thermal Processing
� Modeling Methodology
� Estimation of chamber and bath volumesbased on wafer and batch sizes
� Estimation of dimensions of handling andloading stations based on wafer and batch sizes
� Estimation of equipment utilities consumptions based on anticipated chamber and bath volumes
� Extrapolation of overall area and utility demand based on generic HVM equipment list
© M+W Group11
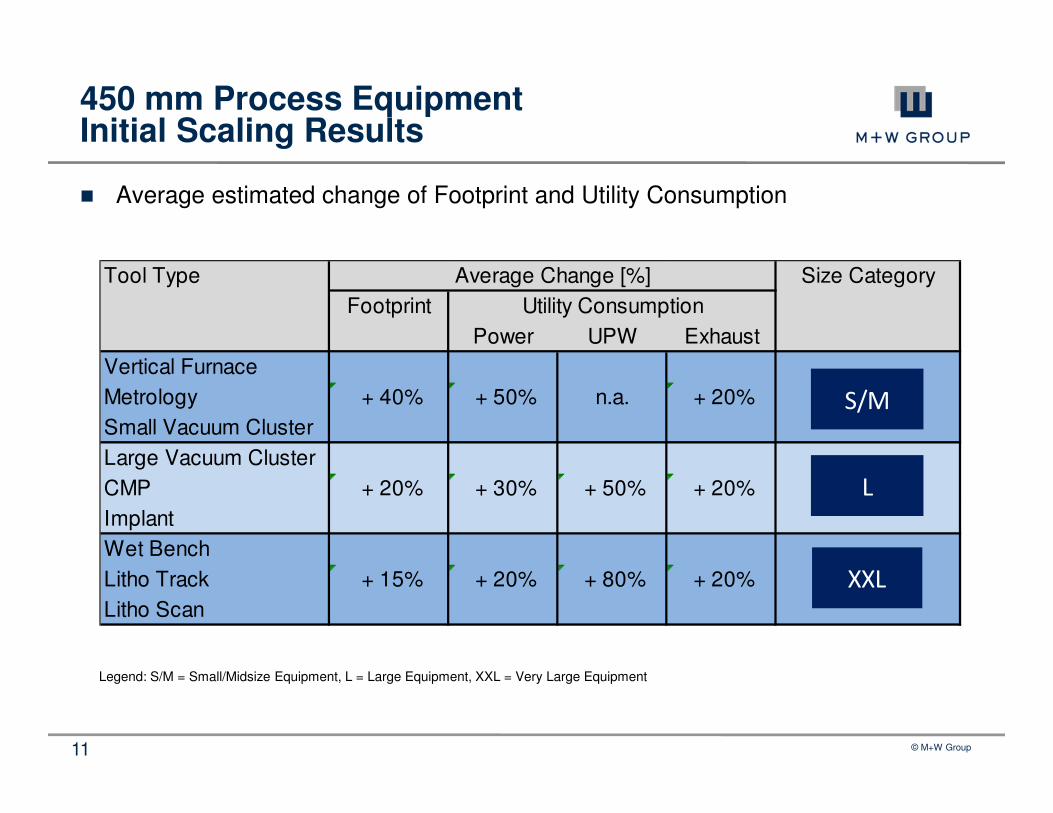
450 mm Process EquipmentInitial Scaling Results
� Average estimated change of Footprint and Utility Consumption
Legend: S/M = Small/Midsize Equipment, L = Large Equipment, XXL = Very Large Equipment
Tool Type Size Category
Footprint
Power UPW Exhaust
Vertical Furnace
Metrology + 40% + 50% n.a. + 20%
Small Vacuum Cluster
Large Vacuum Cluster
CMP + 20% + 30% + 50% + 20%
Implant
Wet Bench
Litho Track + 15% + 20% + 80% + 20%
Litho Scan
Utility Consumption
Average Change [%]
S/M
L
XXL
© M+W Group12
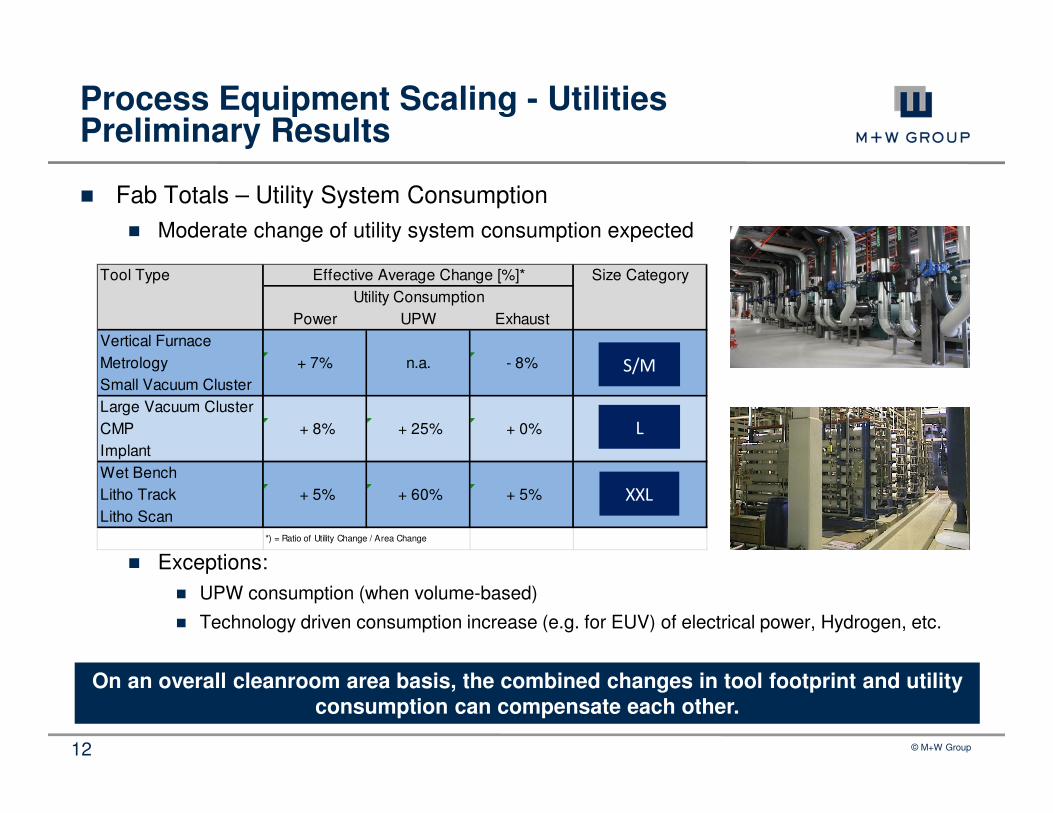
Process Equipment Scaling - UtilitiesPreliminary Results
� Fab Totals – Utility System Consumption
� Moderate change of utility system consumption expected
� Exceptions:
� UPW consumption (when volume-based)
� Technology driven consumption increase (e.g. for EUV) of electrical power, Hydrogen, etc.
On an overall cleanroom area basis, the combined changes in tool footprint and utility consumption can compensate each other.
Tool Type Size Category
Power UPW Exhaust
Vertical Furnace
Metrology + 7% n.a. - 8%
Small Vacuum Cluster
Large Vacuum Cluster
CMP + 8% + 25% + 0%
Implant
Wet Bench
Litho Track + 5% + 60% + 5%
Litho Scan
*) = Ratio of Utility Change / Area Change
Effective Average Change [%]*
Utility Consumption
S/M
L
XXL
© M+W Group13
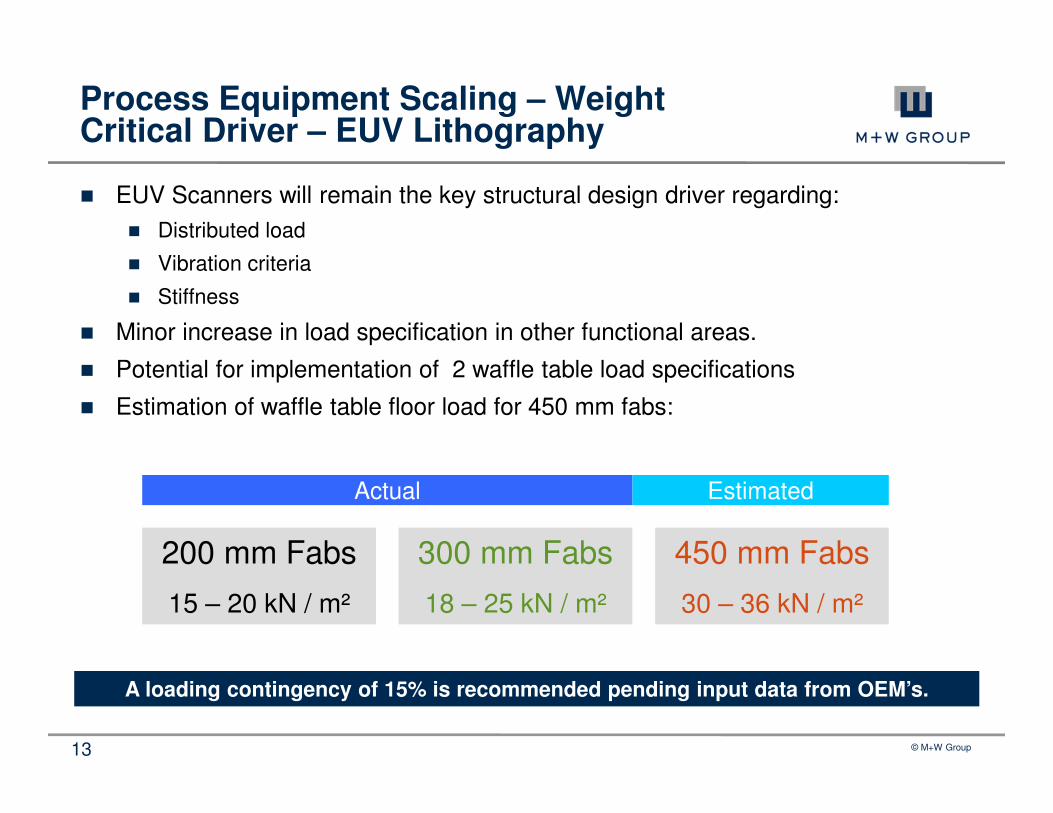
� EUV Scanners will remain the key structural design driver regarding:
� Distributed load
� Vibration criteria
� Stiffness
� Minor increase in load specification in other functional areas.
� Potential for implementation of 2 waffle table load specifications
� Estimation of waffle table floor load for 450 mm fabs:
Process Equipment Scaling – WeightCritical Driver – EUV Lithography
A loading contingency of 15% is recommended pending input data from OEM’s.
Actual Estimated
200 mm Fabs
15 – 20 kN / m²
300 mm Fabs
18 – 25 kN / m²
450 mm Fabs
30 – 36 kN / m²
© M+W Group14
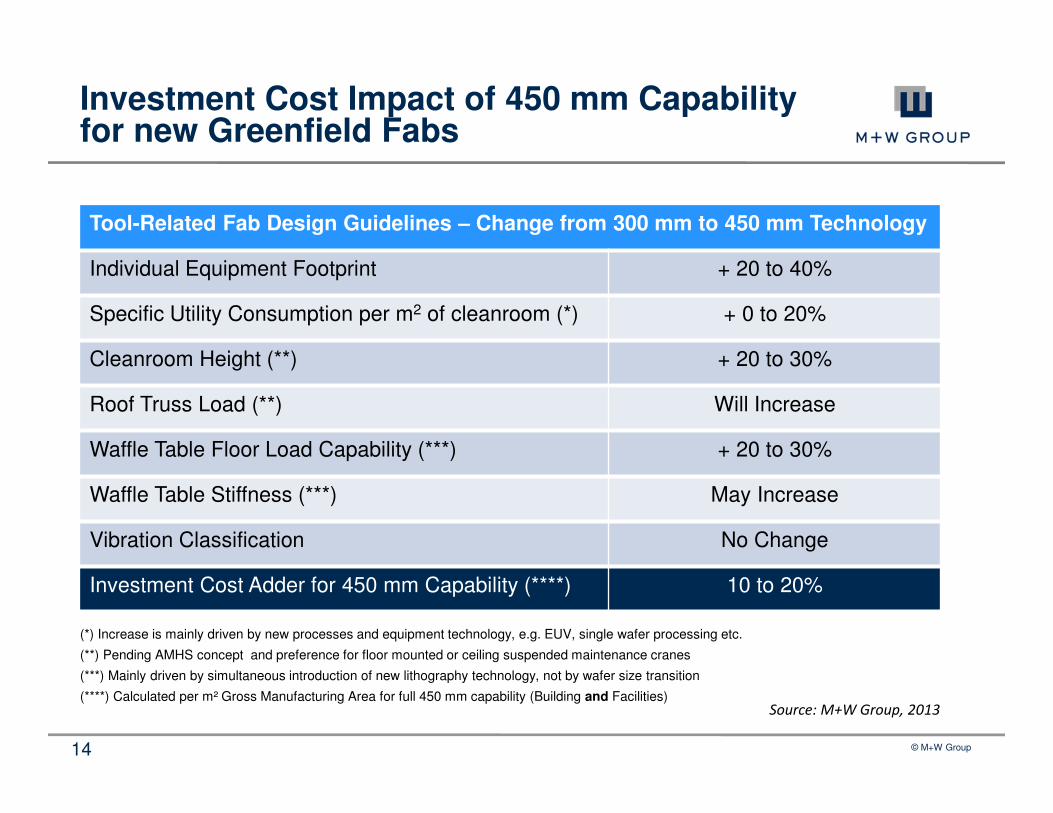
Investment Cost Impact of 450 mm Capabilityfor new Greenfield Fabs
New!
(*) Increase is mainly driven by new processes and equipment technology, e.g. EUV, single wafer processing etc.
(**) Pending AMHS concept and preference for floor mounted or ceiling suspended maintenance cranes
(***) Mainly driven by simultaneous introduction of new lithography technology, not by wafer size transition
(****) Calculated per m² Gross Manufacturing Area for full 450 mm capability (Building and Facilities)
Tool-Related Fab Design Guidelines – Change from 300 mm to 450 mm Technology
Individual Equipment Footprint + 20 to 40%
Specific Utility Consumption per m2 of cleanroom (*) + 0 to 20%
Cleanroom Height (**) + 20 to 30%
Roof Truss Load (**) Will Increase
Waffle Table Floor Load Capability (***) + 20 to 30%
Waffle Table Stiffness (***) May Increase
Vibration Classification No Change
Investment Cost Adder for 450 mm Capability (****) 10 to 20%
Source: M+W Group, 2013
© M+W Group15
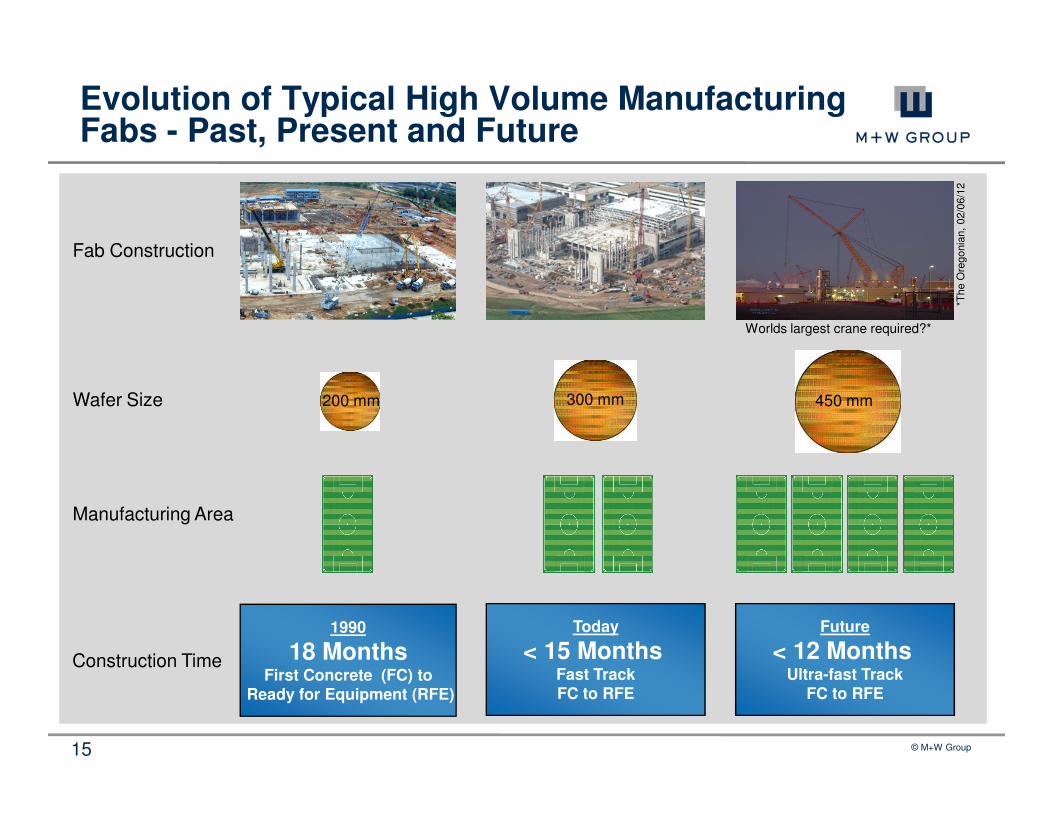
Evolution of Typical High Volume Manufacturing Fabs - Past, Present and Future
1990
18 MonthsFirst Concrete (FC) to
Ready for Equipment (RFE)
Today
< 15 MonthsFast TrackFC to RFE
Future
< 12 MonthsUltra-fast Track
FC to RFE
200 mm 300 mm 450 mm
Worlds largest crane required?*
Wafer Size
Manufacturing Area
Fab Construction
Construction Time
*The O
regonia
n,
02/0
6/1
2
© M+W Group16
Contents
� Introduction
� The Transition - Investment Drivers
� Tool Dimensions / Weight
� Floor Load and Cleanroom Height
� Manufacturing Area Sizing
� Utility Consumption
� Sustainability - Operational Cost Considerations
� Energy Conservation
� Related M+W R&D Activities
� Facilities Optimization
� Summary
© M+W Group17
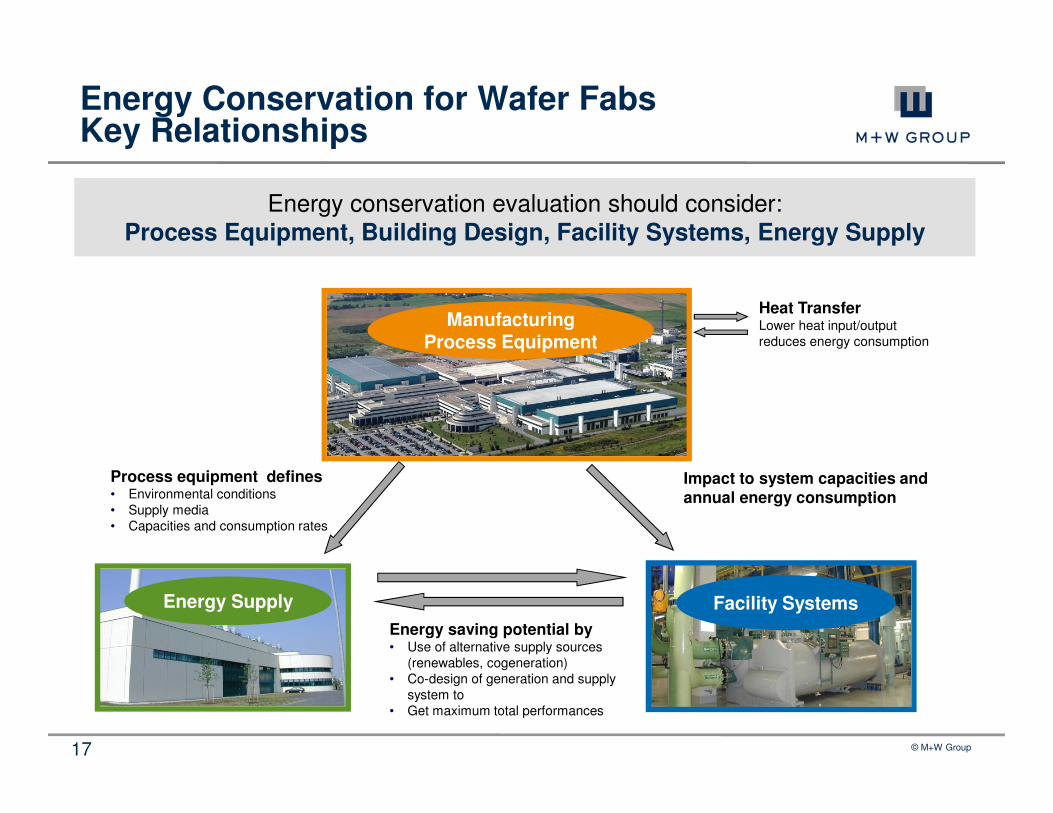
Energy Conservation for Wafer FabsKey Relationships
Impact to system capacities and annual energy consumption
Process equipment defines• Environmental conditions• Supply media• Capacities and consumption rates
Energy saving potential by• Use of alternative supply sources
(renewables, cogeneration)• Co-design of generation and supply
system to• Get maximum total performances
Facility SystemsEnergy Supply
Heat TransferLower heat input/output reduces energy consumption
ManufacturingProcess Equipment
Energy conservation evaluation should consider: Process Equipment, Building Design, Facility Systems, Energy Supply
© M+W Group18
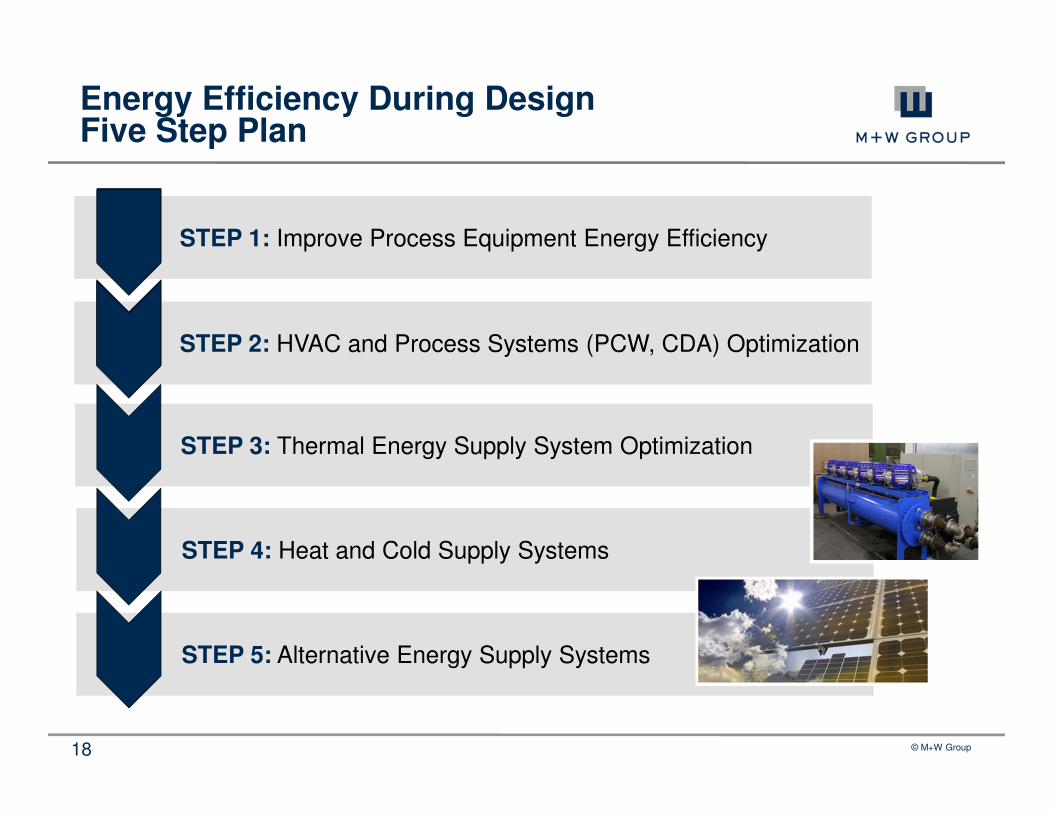
Energy Efficiency During DesignFive Step Plan
STEP 1: Improve Process Equipment Energy Efficiency
STEP 2: HVAC and Process Systems (PCW, CDA) Optimization
STEP 3: Thermal Energy Supply System Optimization
STEP 4: Heat and Cold Supply Systems
STEP 5: Alternative Energy Supply Systems
© M+W Group19
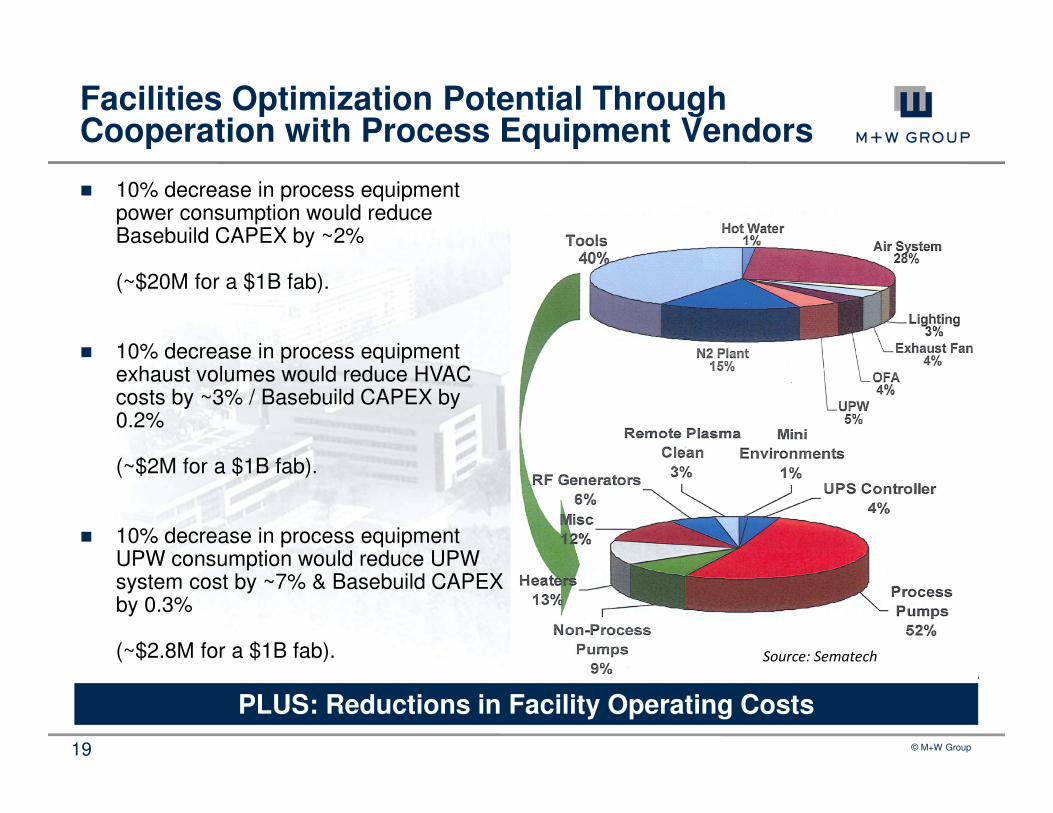
Facilities Optimization Potential Through Cooperation with Process Equipment Vendors
� 10% decrease in process equipment power consumption would reduce Basebuild CAPEX by ~2%
(~$20M for a $1B fab).
� 10% decrease in process equipment exhaust volumes would reduce HVAC costs by ~3% / Basebuild CAPEX by 0.2%
(~$2M for a $1B fab).
� 10% decrease in process equipment UPW consumption would reduce UPW system cost by ~7% & Basebuild CAPEX by 0.3%
(~$2.8M for a $1B fab).
PLUS: Reductions in Facility Operating Costs
Source: Sematech
© M+W Group20
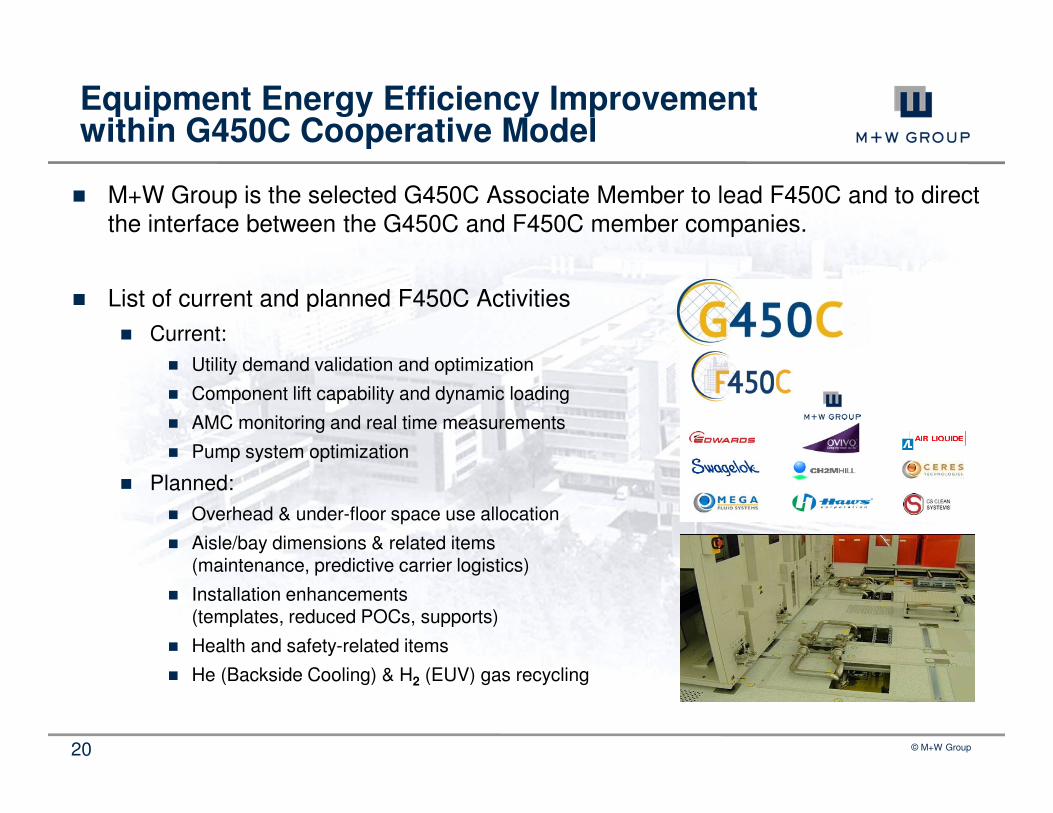
Equipment Energy Efficiency Improvement within G450C Cooperative Model
� M+W Group is the selected G450C Associate Member to lead F450C and to direct the interface between the G450C and F450C member companies.
� List of current and planned F450C Activities
� Current:
� Utility demand validation and optimization
� Component lift capability and dynamic loading
� AMC monitoring and real time measurements
� Pump system optimization
� Planned:
� Overhead & under-floor space use allocation
� Aisle/bay dimensions & related items (maintenance, predictive carrier logistics)
� Installation enhancements (templates, reduced POCs, supports)
� Health and safety-related items
� He (Backside Cooling) & H2 (EUV) gas recycling
© M+W Group21
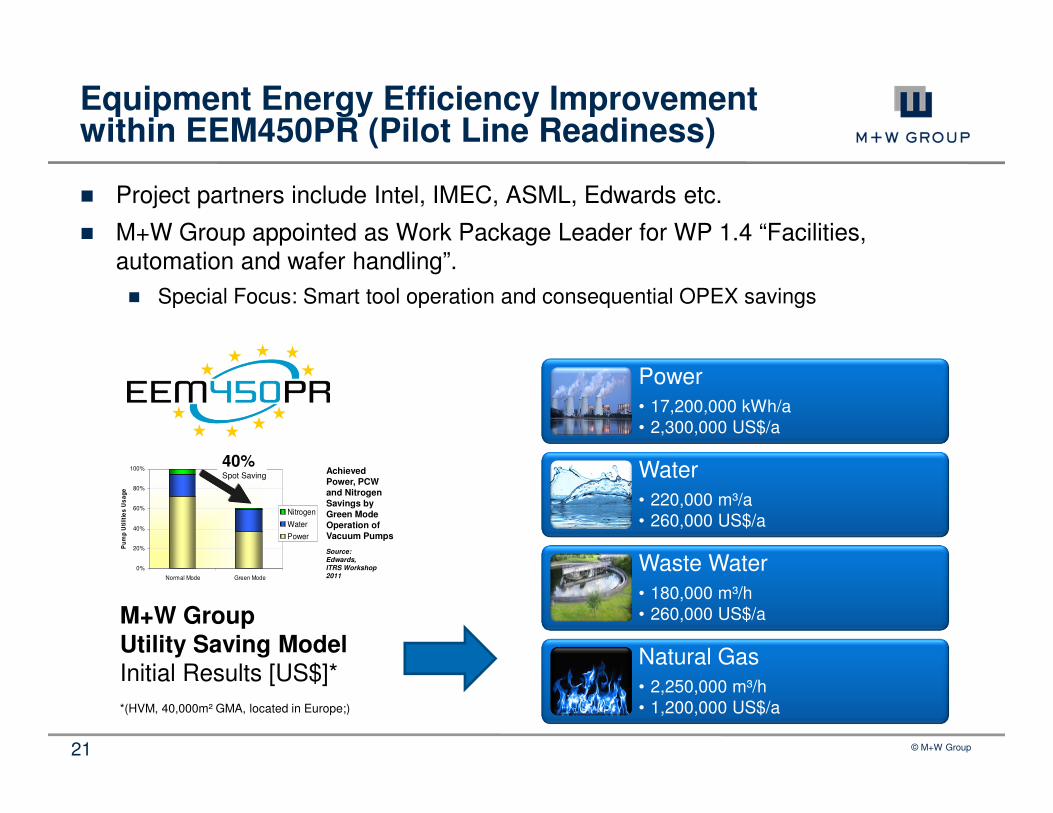
Equipment Energy Efficiency Improvementwithin EEM450PR (Pilot Line Readiness)
� Project partners include Intel, IMEC, ASML, Edwards etc.
� M+W Group appointed as Work Package Leader for WP 1.4 “Facilities, automation and wafer handling”.
� Special Focus: Smart tool operation and consequential OPEX savings
Power
• 17,200,000 kWh/a• 2,300,000 US$/a
Water
• 220,000 m³/a• 260,000 US$/a
Waste Water
• 180,000 m³/h• 260,000 US$/a
Natural Gas
• 2,250,000 m³/h• 1,200,000 US$/a
Achieved Power, PCW and Nitrogen Savings by Green Mode Operation of Vacuum Pumps
0%
20%
40%
60%
80%
100%
Normal Mode Green Mode
Pu
mp
Uti
liti
es
Us
ag
e
Nitrogen
Water
Power
40%Spot Saving
Source:
Edwards,
ITRS Workshop 2011
M+W GroupUtility Saving ModelInitial Results [US$]*
*(HVM, 40,000m² GMA, located in Europe;)
© M+W Group22
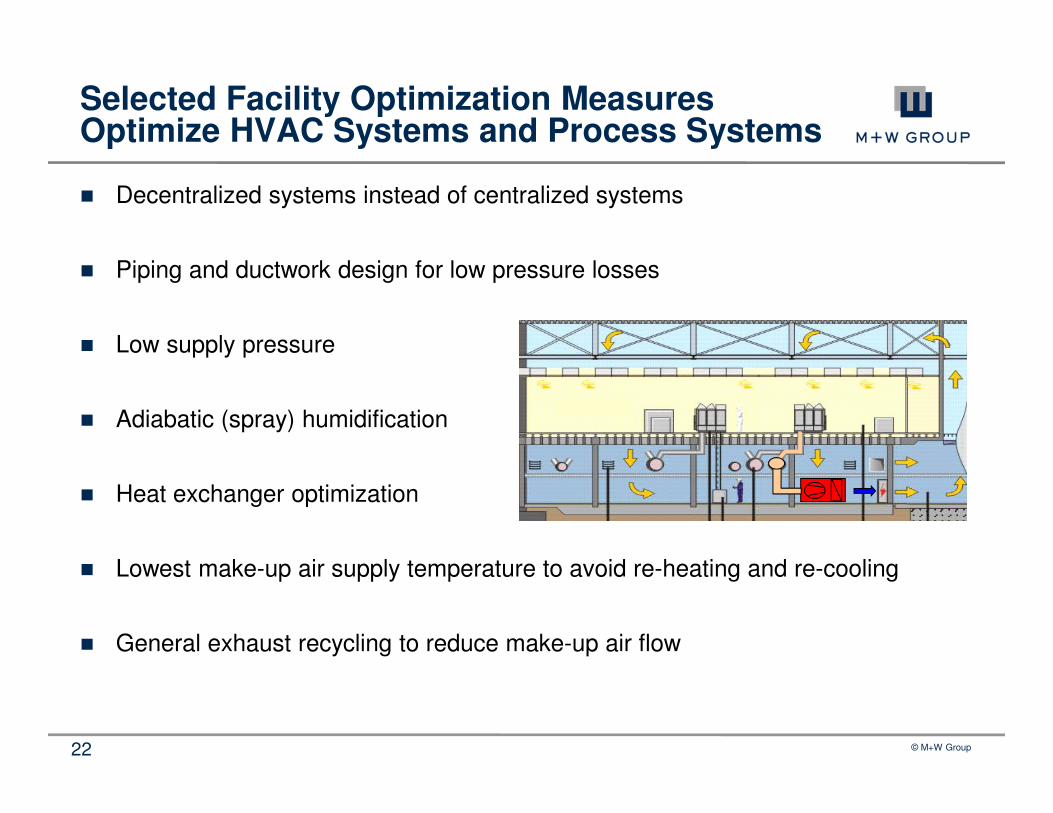
Selected Facility Optimization MeasuresOptimize HVAC Systems and Process Systems
� Decentralized systems instead of centralized systems
� Piping and ductwork design for low pressure losses
� Low supply pressure
� Adiabatic (spray) humidification
� Heat exchanger optimization
� Lowest make-up air supply temperature to avoid re-heating and re-cooling
� General exhaust recycling to reduce make-up air flow
© M+W Group23
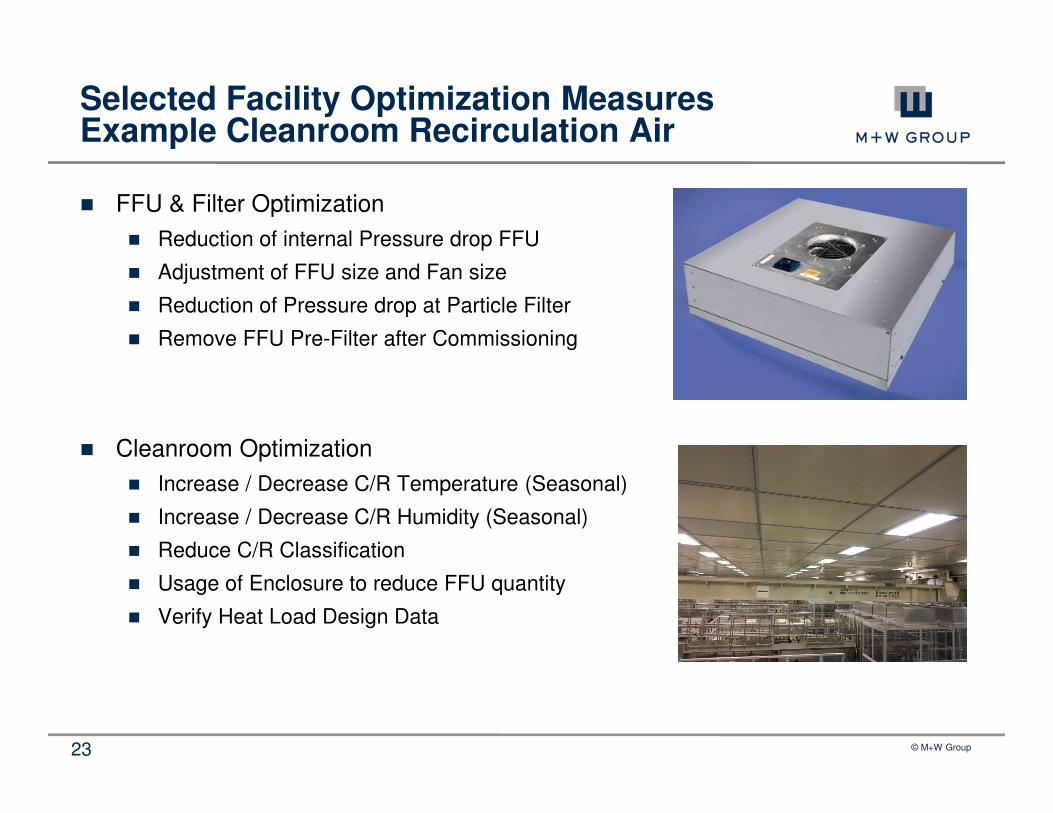
Selected Facility Optimization Measures Example Cleanroom Recirculation Air
� FFU & Filter Optimization
� Reduction of internal Pressure drop FFU
� Adjustment of FFU size and Fan size
� Reduction of Pressure drop at Particle Filter
� Remove FFU Pre-Filter after Commissioning
� Cleanroom Optimization
� Increase / Decrease C/R Temperature (Seasonal)
� Increase / Decrease C/R Humidity (Seasonal)
� Reduce C/R Classification
� Usage of Enclosure to reduce FFU quantity
� Verify Heat Load Design Data
© M+W Group24
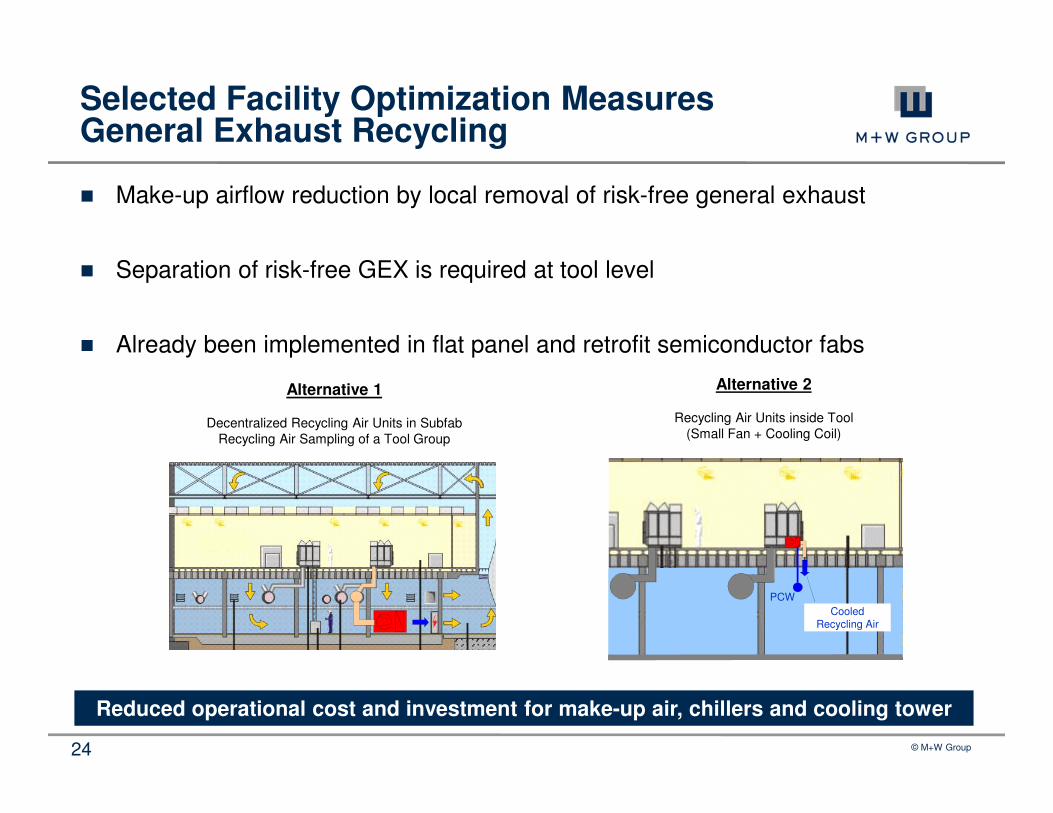
Selected Facility Optimization Measures General Exhaust Recycling
� Make-up airflow reduction by local removal of risk-free general exhaust
� Separation of risk-free GEX is required at tool level
� Already been implemented in flat panel and retrofit semiconductor fabs
Reduced operational cost and investment for make-up air, chillers and cooling tower
CooledRecycling Air
PCW
Alternative 1
Decentralized Recycling Air Units in SubfabRecycling Air Sampling of a Tool Group
Alternative 2
Recycling Air Units inside Tool(Small Fan + Cooling Coil)
© M+W Group25
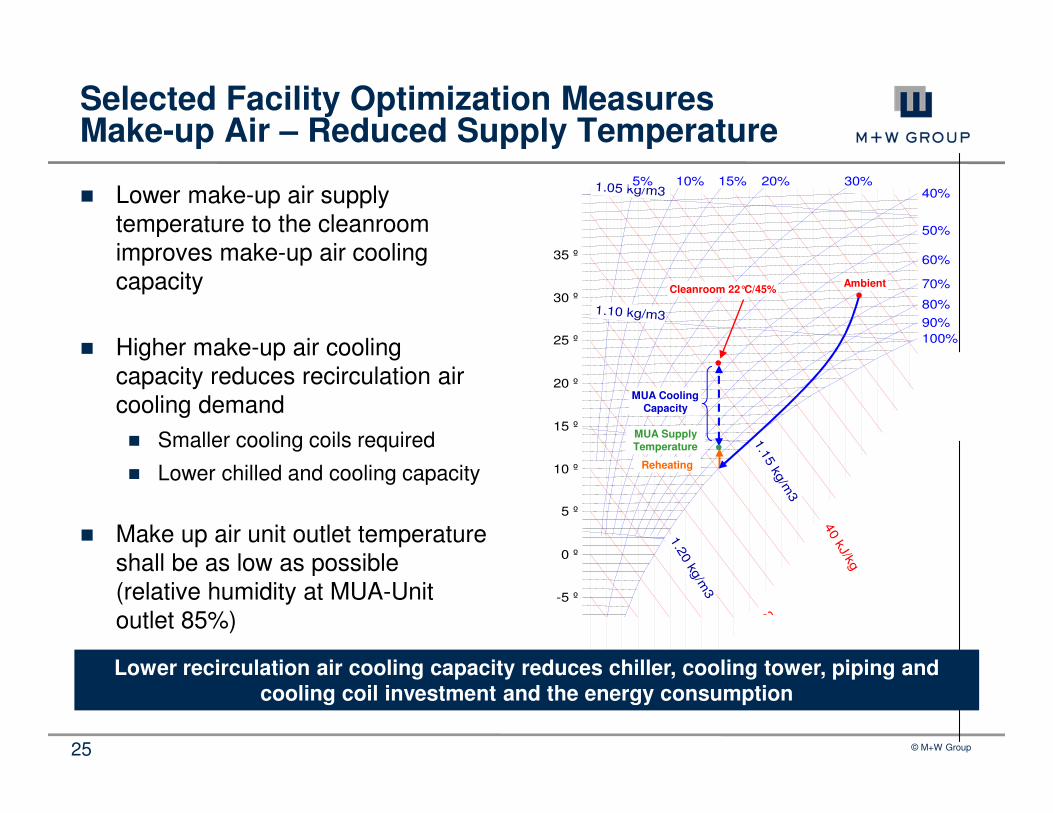
Selected Facility Optimization Measures Make-up Air – Reduced Supply Temperature
� Lower make-up air supply temperature to the cleanroom improves make-up air cooling capacity
� Higher make-up air cooling capacity reduces recirculation air cooling demand
� Smaller cooling coils required
� Lower chilled and cooling capacity
� Make up air unit outlet temperature shall be as low as possible(relative humidity at MUA-Unit outlet 85%)
1.2
0 kg
/m3
1.1
5 kg
/m3
1.10 kg/m3
1.05 kg/m3
20 kJ/kg
40 kJ/kg
Enth
alp
ie
100%
50%
90%
80%
70%
60%
40% 30% 20% 15% 10% 5%
Re
l. F
eu
ch
te
-5 º
0 º
5 º
10 º
15 º
20 º
25 º
30 º
35 º
40 º
Te
mp
era
tur
Cleanroom 22°C/45%
MUA Supply Temperature
Reheating
MUA Cooling Capacity
Ambient
Lower recirculation air cooling capacity reduces chiller, cooling tower, piping and cooling coil investment and the energy consumption
© M+W Group26
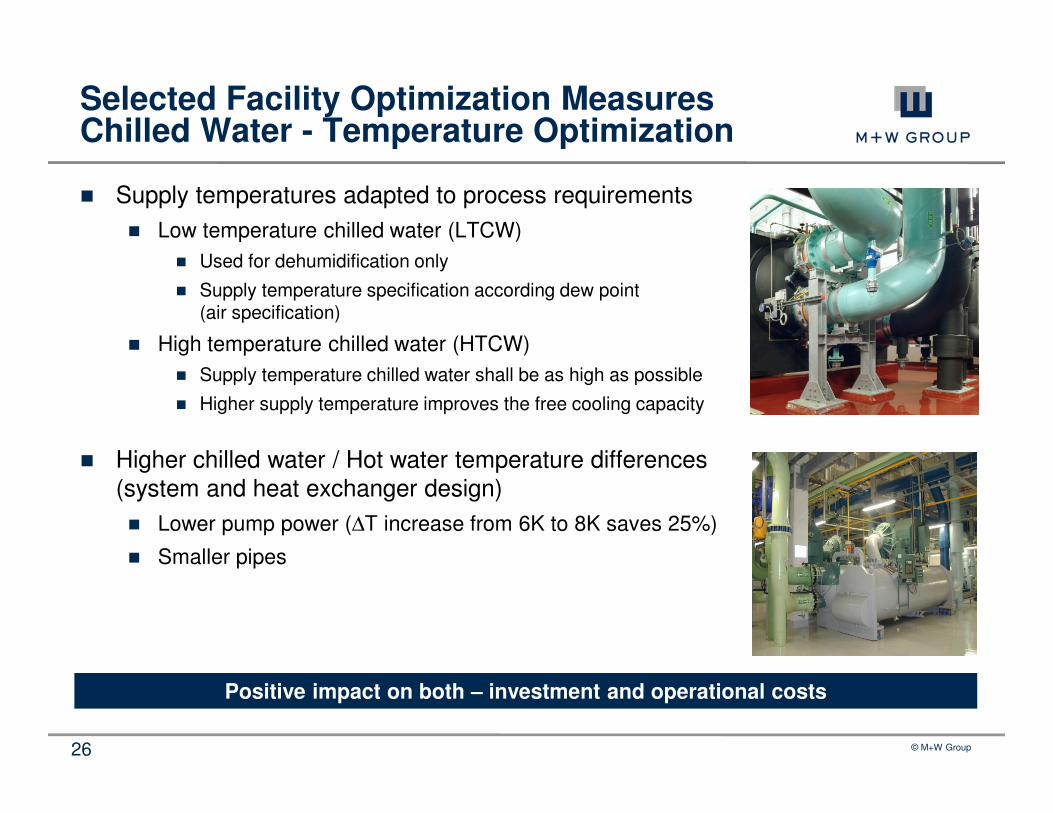
Selected Facility Optimization MeasuresChilled Water - Temperature Optimization
� Supply temperatures adapted to process requirements
� Low temperature chilled water (LTCW)
� Used for dehumidification only
� Supply temperature specification according dew point(air specification)
� High temperature chilled water (HTCW)
� Supply temperature chilled water shall be as high as possible
� Higher supply temperature improves the free cooling capacity
� Higher chilled water / Hot water temperature differences(system and heat exchanger design)
� Lower pump power (∆T increase from 6K to 8K saves 25%)
� Smaller pipes
Positive impact on both – investment and operational costs
© M+W Group27
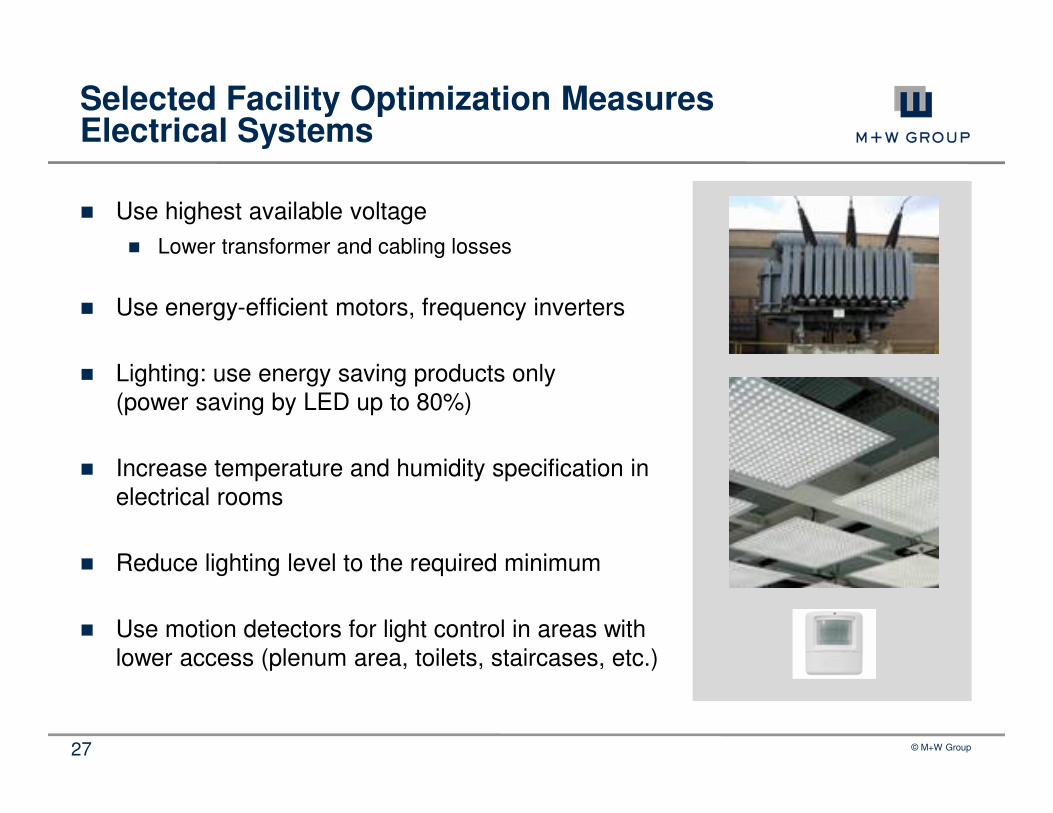
Selected Facility Optimization Measures Electrical Systems
� Use highest available voltage
� Lower transformer and cabling losses
� Use energy-efficient motors, frequency inverters
� Lighting: use energy saving products only(power saving by LED up to 80%)
� Increase temperature and humidity specification in electrical rooms
� Reduce lighting level to the required minimum
� Use motion detectors for light control in areas with lower access (plenum area, toilets, staircases, etc.)
© M+W Group28
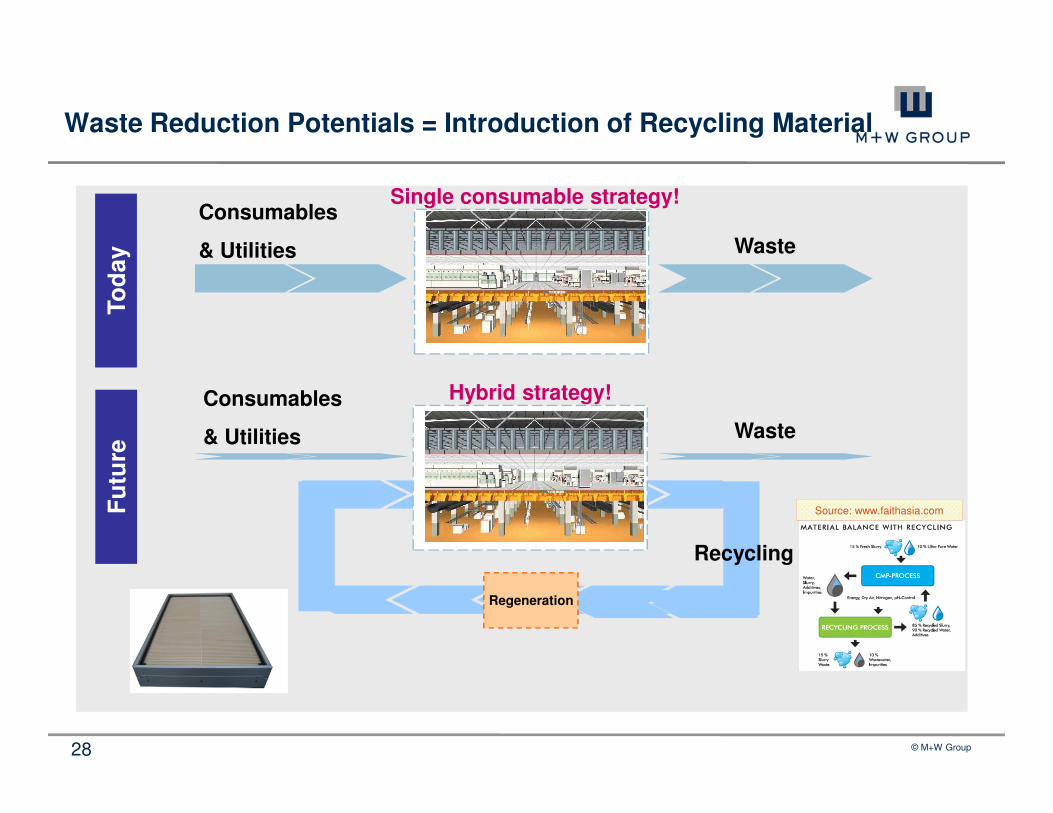
Waste Reduction Potentials = Introduction of Recycling Material
Consumables
& Utilities
To
day Waste
Single consumable strategy!
Hybrid strategy!Consumables
& Utilities
Fu
ture
Waste
Recycling
Regeneration
Source: www.faithasia.com
© M+W Group29
Summary
� From a building and facilities perspective, the 450 mm transition is evolutionary not a revolutionary.
� The technology roadmap (EUV, single wafer clean, rapid thermal processing) may dominate the impact versus the wafer size migration.
� The transition provides the opportunity to re-think and optimize actual operational procedures, facility design criteria and system specifications.
� M+W Group is involved in major 450 mm R&D projects and initiatives across the globe in order to identify potential facility optimization measures and support their incorporation into 450 mm HVM.
© M+W Group30
Thank You!
Contact:
Peter CsatáryHead of GroupGlobal Technology ServicesE-Mail: [email protected]: +49 711 8804 1441Mobile: +49 172 712 1133
Allen WareVice President M+W USM+W Program Executive for G450C E-Mail: [email protected]: +1 602 567 9670Mobile: +1 480 307 1009