Embed Size (px)
Citation preview

Jointly published by Elsevier Science S. A., Lausanne and Akad~miai Kiad6, Budapest
Journal of Radioanalytical and Nuclear Chemistry, Articles, Vol. 193, No. 2 (1995) 309-318
222RN A T B E R M U D A A N D M A U N A LOA: L O C A L A N D D I S T A N T
S O U R C E S
A. R. HU ITP.;R', R. J. LARSEN*, H. MAILING", J. T. MERRILL"*
*Environmental Measurements Laboratory, U.S. Department of Energy, New York, NY 10014-362L USA **Rosenstiel School of Marine and A tmospheric Science, Division of Marine and Atmospheric Chemistry,
University of Miami, Miami FL 33149-1098, USA "**Center for Atmospheric Chemistry Studies, Graduate School of Oceanography,
University of Rhode Island, Narragansett, R102882-1197, USA
Continuous measurements of atmospheric 222Rn were made for the past three years by the Environmental Measurements Laboratory (EML) at the Atmosphere/Ocean Chemistry Experiment site located at Tudor Hill, Bermuda and at the National Oceanic and Atmospheric Administration/Climate Monitoring and Diagnostics Laboratory Mauna Loa Observatory. The 222Rn analyzer is based on the two-filter tube method. At the Bermuda site, monthly median 222Rn concentrations range from ~ 50 to 700 mBq m "3, and the concentrations vary seasonally, with a maximum in the winter and a minimum in the summer. The concentrations are significantly elevated when local winds traverse the island. At MLO, monthly median 222Rn concentrations range from ~ 100 mBq m "3 during the fall months to ~ 400 mBq m "3 during the spring months. The springtime maximum values correspond to periods of rapid transport in the free troposphere from the Asian continent, corroborated by backward air mass trajectories. The 222Rn data are also used to help decipher local dai!)' upslope/downslope conditions
22~v present at MLO. This study illustrates the value of atmospheric Rn monitoring, when screened through the filter of local meteorology, in studying the transport of continental air to the oceans, as well as the dynamics of local meteorological effects.
We describe in this report 222Rn measurements obtained at the Atmosphere/Ocean Chemistry Experiment (AEROCE) site located at Tudor Hill, Bermuda, beginning in June 1991, and at the U.S. Department of Commerce's National Oceanic and Atmospheric Administration (NOAA.)/Climate Monitoring and Diagnostics Laboratory (CMDL) Mauna Loa Observatory (MLO), Hawaii, beginning in December 1990. 222Rn is a radioactive noble gas (Tlrz = 3.825 days, e-folding lifetime = 5.5 days) produced during the decay of 226Ra in the 23Su series. 222Rn is emitted ubiquitously by soils and diffuses from the soil/atmosphere boundary. Since 222Rn diffusing from the sediment/ocean boundary decays in the water column, and the flux of 222Rn emanating from sea water is very low compared to that from land, there is a strong gradient between 222Rn concentrations in the air over the oceans and the continents. Therefore, 222Rn can be used as a tracer of air masses that have been in contact with land, either continental masses or local island masses. Unlike other chemical tracers, such as 03, nitrate and 21~ 222Rn is conservative in the atmosphere and its only sink is decay, with negligible solution into precipitation and seawater.
The AEROCE Bermuda site, where the EML 222Rn analyzer is deployed, is located on the western coast of Bermuda at Tudor Hill. "An ultimate goal of AEROCE is to develop the predictive capability for quantifying the transport of continentally-derived species to the marine atmosphere and the effects of that transport on the chemical and physical properties of the atmosphere, and for estimating the deposition of these species to this region and the effects of that deposition on ocean processes. ''l To achieve these goals, a diverse group of scientific
0236-5731/951US $ 9.50 Copyright �9 1995 Akad#miai Kiad6, Budapest All rights reserved

A. R. HOI-I/~7~ et al.: 222Rn AT BERMUDA AND MAUNA LOA
investigators are conducting extensive experiments and measurements at Bermuda and other AEROCE sites (Izania, Canary Islands; Mace Head, Ireland; Barbados). Measurements of tracers (e.g., 222Rn, 7Be, 2wpb, trace elements, carbon black) are used to characterize the aerosol origin (continental or marine) and to identify meteorological transport processes.
The MLO is part of a network of stations "designed to establish and maintain a program of observation and analysis of data representative of the global background of selected gases and aerosols. "2 The Observatory is located on the north-northeast slope of the Manna Loa volcano at an elevation of 3400 m, which is above the variable height of the trade wind inversion layer (2000 m average) ~ 75% of the time. 2 At times when free tropospheric air is present at MLO, regional baseline concentrations of numerous gases and aerosols can be obtained. Conversely, when air from within the marine boundary layer (previously in contact with the island) is present at MLO, the data obtained is not useful for monitoring regional baseline conditions. In this manner, 222Rn is used as a complementary indicator for detecting the different air flow patterns and air mass types present at the MLO at different times.
Experimental
The atmospheric 222Rn analyzer is designed on the two-filter tube method, a A sketch of the EML 222Rn analyzer is presented in Fig. 1. At the Bermuda site, the analyzer is configured with a 500-L decay chamber, and is used for 1-h sampling and counting periods. At MLO, the analyzer is configured with a 1000-L decay chamber, and is set up for 30-min sampling and counting periods.
Sample air is pumped through a cylindrical aluminum decay chamber at flow rates typically ranging from 350 to 400 L rain 1. The 222Rn progeny in the sample air are removed from the airstream by filtration through an array of seven 20-cm diameter extra thick glass fiber air filters located at the entrance to the decay chamber. During the airstream residence in the decay chamber, ~ 4 rain for a 500-L chamber, a portion of the 222Rn atoms undergo radioactive decay, producing solid progeny, which are continually collected on a second filter located at the exit of the decay chamber. After collecting the 222Rn progeny on the second filter for the sampling period, this filter is automatically transported to a counting location. To do this, the second filter is configured as a ribbon, capable of forward and backwards motion: While one section of the second filter is being counted, another section is used in sampling. The alpha particles resulting from the further decay of the progeny collected on the second filter are counted by using a photomultiplier tube (PMT) scintillation-phosphor assembly and its attendant circuitry. The 222Rn concentration during the sampling period can be calculated from the count, the sampling and counting intervals, and the time required to transport the second filter to the PMT.
The second filter automatically rewinds after ~ 30 samples, allowing for 22~ and 222Rn progenies to decay. This causes an unexposed filter section to be counted (approximately every 30 h at the Bermuda site, and approximately every 20 h for the MLO site due to the combination of a longer filter tape and 1/2 hour sampling and counting periods) as a background estimate. The flow through the analyzer, as well as humidity and temperature sensors located i.n the electronics box, are continually measured for diagnostic purposes. The operation of the analyzer and the recording of data are performed by a Tattletale data logger (TT) located in the analyzers electronics assembly. An external computer is required to interface with the "IT, including downloading data.
310

A. R. HUTTER et al.: 222Rn AT BERMUDA AND MAUNA LOA
Front filters (7) 20 cm glass fiber
() in
(400 L min-1) from top of tower
Decay Chamber (500 or 1000 L)
_ _
Terminal (data collection)
Fig. 1. Schematic of EML 22~Rn analyzer
Out
Second filter cartridge,
PMT, Electronics, TT computer
The factor which incorporates the sampling, counting, and transport times in the system calibration is designated as Z. 3 At Bermuda, Z = 35 while at MLO Z = 13. Using these Z factors, in addition to the atmospheric conditions at the sites, one can determine the requisite decay chamber size to achieve a given sensitivity. Prior to deployment, the analyzer is calibrated over a dynamic range of concentrations in the EML Radon, Thoron, and Progeny Exposure Facility. s The calibration factor for the Bermuda analyzer is 2.85 mBq m a per counts h 1 and 6.85 mBq m 3 per counts per 30 min at the MLO. The overall uncertainty due to calibration is estimated to be < 10%. Due to plate-out of progeny on the decay chamber walls during transport, the progeny recovery is ~ 75% of the ideal, determined from the volume of the decay chamber, sampling time, delay time and counting time. 6
The welding material used to constr0ct the decay chambers in this study was found after deployment to contain trace quantities of thorium. This impurity resulted in a constant flux of ~2~ into the decay chamber and the resulting progeny, 212pb, significantly increased system background. The 2Z~ contamination of the 22ZRn analyzers was drastically reduced by sealing all the welds in the instrument with a resin epoxy in December 1992 at MLO and October 1993 at Bermuda. As a result, the background count rates were reduced from 75 to 23 counts h a for the Bermuda analyzer, and from 23 to 7 counts per half-hour for the MLO analyzer, thereby decreasing each lower limit of detection (LLD) to ~ 55 mBq m "3 and 90 mBq m 3, respectively, as well as resulting in greater sensitivity. These LLD's 5 were obtained from:
LLD = 4.66 (N)V2; (1) where N is the background count.
The analyzer has relatively few moving parts and is therefore highly dependable. It is maintenance free, simple to operate and can operate unattended, with the exception of data downloading ~ every 2 months. The entire analyzer is self-contained and is located outdoors. The analyzer was designed to easily adapt to specific site requirements, as the sampling interval can be varied to obtain a detailed temporal resolution. The LLD can be reduced and sensitivity increased by increasing the size of the decay chamber.
311

A. R. HLrYrER et al.: 222Rn AT BERMUDA AND MAUNA LOA
R e s u l t s a n d D i s c u s s i o n
222Rn data collected at the Bermuda site from July 1, 1991 through June 25, 1992, and at the MLO site from January 1, 1991 through the end of 1993 are used in the present analysis. Occasionally, different sampling periods than the normal 1-h at Bermuda and 30-min at MLO were used, often due to power outages or for calibrations and diagnostics. During these times, the 222Rn data were split into the normal time period to facilitate matching with meteorological measurements and compatibility with the remainder of the 222Rn measurements.
700
600
4 " 500
400
300 =
200
100
Jan Feb Mar Apt May Jun Jul Aug Sep
Month
Oct Nov Dec
Fig. 2. Monthly median 222Rn concentration for in-sector measurements at the Bermuda site for the period July 1, 1991 - June 25, 1992.
The established sampling sector at the Bermuda site is from 180 ~ to 330 ~ , the line-of-sight to the open ocean, and is referred to as the in-sector. Figure 2 presents monthly median 222Rn
concentrations at the Bermuda site for in-sector periods. 222Rn concentrations are highest during the late fall and winter, and lowest during the late spring and summer, with transition periods occurring in the early spring and the late summer. This seasonal pattern is a conse- quence of the annual north-south shifting of the intertropical convergence zone (ITCZ), the meteorological equator. During the winter, the ITCZ shifts more southward, and meteoro- logically, Bermuda is then located in the Northern Hemisphere westerlies. At this time, flow off the North American continent, with relatively higher 222Rn concentrations, is more likely. During the summer, the ITCZ shifts more north and Bermuda is then located in the Northern Hemisphere easterlies. Flow from oceanic regions, with relatively lower 222Rn concentrations, is more likely during this time.
At the MLO, spring 222Rn highs can be attributed to frequent storms transporting Asian air across the Pacific to Hawaii. Figure 3 shows the monthly 222Rn medians for the MLO site.
Islands asLocal L~Rn Source: Since in-sector oceanic air masses arriving at the Bermuda site do not cross the island, we would expect minimal local influence and relatively low 2Z2Rn concentrations. On the other hand, air transported to the site from the out-sector traverses the island and local impact is expected, resulting in relatively higher 222Rn concentrations. Figure 4 shows a period when back air trajectories indicate that the long-range transport is from oceanic
312
A. R. HUITF_,R et al.: 222Rn AT BERMUDA AND MAUNA LOA
400
350
300 4-" t~ 250
m 200
150
~:~ 100
5O
0 Jan Feb Mar Apr May Jun Jul Aug Sep Oct Nov Dec
Month
Fig. 3. Mean of monthly median 222Rn concentration from MLO for 1991, 1992 and 1993.
[ 2 2 2 R n " = 'O3 _e ws _a w_d_ ]
~ T " ~ T 35~
t~ 3 5 t ~-.250t300 ~
~- 20 4- ta~t a-- u-,-,-,. [] ~ IT 200 .,.-.,
r- 15 t~ ' . -" ",. ,- ... �9 ,. " ~ ,,r-l- 150 '~ ~,~ I | ' . , * / / .o.
~, 10 i- | , " . / L I l k - * e e ~ oeoe ~ . . ~ l q 100
SoC . . . . �9
~ •
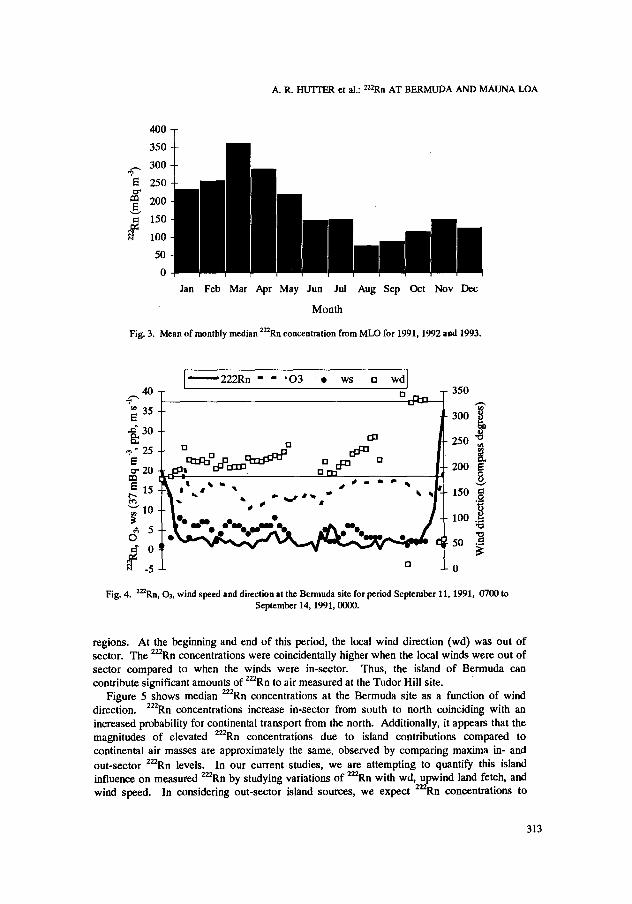
Fig. 4. 222Rn, 03, wind speed and direction at the Bermuda site for period September 11, 1991, 0700 to September 14, 1991, 0000.
regions. At the beginning and end of this period, the local wind direction (wd) was out of sector. The 222Rn concentrations were coincidentally higher when the local winds were out of sector compared to when the winds were in-sector. Thus, the island of Bermuda can contribute significant amounts of 222Rn to air measured at the Tudor Hill site.
Figure 5 shows median 222Rn concentrations at the Bermuda site as a function of wind direction, a22Rn concentrations increase in-sector from south to north coinciding with an increased probability for continental transport from the north. Additionally, it appears that the magnitudes of elevated 222Rn concentrations due to island contributions compared to continental air masses are approximately the same, observed by comparing maxima in- and out-sector 222Rn levels. In our current studies, we are attempting to quantify this island influence on measured 222Rn by studying variations of 222Rn with wd, upwind land fetch, and wind speed. In considering out-sector island sources, we expect 222Rn concentrations to
313

A. R. HUII~R et al.: 222Rn AT BERMUDA AND MAUNA LOA
6 "
m g t -
1200
1000
800
600
400
200
0
15 45 75 105 135 165 195 225 255 285 315 345
Middle of interval, wind direction (compass degreeS)
Fig. 5. Median 222Rn as a function ofwd at Bermuda for period July 1, 1991 to June 25, 1992.
700
600
-- 500
~ 400
300
~ 2oo
100
0
1 2 3 4 5
Day, January 1991
Fig 6. 222Rn at the MLO showing uplsope (elevated concentrations) and downslope (low concentrations) events for period January 1, 1991, 0000 to January 6, 1991, 0000.
increase as the air traverses a longer fetch of the island, and to decrease with increasing wind speed.
At the MLO, upslope conditions are the result of heated marine boundary layer air breaking through the trade wind inversion layer and flowing up the mountain slope. Conversely, downslope conditions occur during many nighttime periods when the trade wind inversion layer is at a lower elevation than the Observatory and free tropospheric air is present. Additionally, synoptic trade winds can also be present, which largely disrupt the local air fl0w patterns, resulting in entrainment of marine boundary layer air in free tropospheric air. 7 222Rn data is used at the MLO in conjunction with Gthec tracers to discern the p~esence and timing of these air mass types. The 222Rn concentration of free tropospheric air is expected to be relatively low compared to island-influenced marine boundary layer air. s9 Figure 6 shows a 5-
314

A. R. HU'ITF_,R et al.: 222Rn AT BERMUDA AND MAUNA LOA
l , -222Rn ~ ~ O 3 �9 ws n ' wd"
6~ . . I '504 / ' " - - . _ . - . .
150
OOQ~OQ O 0 oOOO0 O000000 0 Oqp 0
Fig 7. Arrival of continental air at the Bermuda site for period November I 1, 1991, 0000 to November 13, 1991, 0000. Note increasing O3 and 2Z2Rn with simultaneous shift ofwd.
day period of 222Rn data where the afternoon upslope and evening downslope conditions, relatively high and low 2~'Rn concentrations, respectively, are clearly evident.
Long-Distance Transport Events for Elevated ZZ'Rn: Figure 7 shows the arrival of continental air at the Bermuda site. The wd at the beginning of the period indicates out-sector sampling, and changes to in-sector sampling with a concurrent drastic increase in 03 and 2~Rn. Further evidence of the arrival of continental air at Bermuda is indicated by relative humidity (RH) data. At the time of 222Rn and O3 increases, the RH decreases from 98% to 74%, indicating a change in the long-range transport from oceanic to continental air. Back trajectories corroborate this event, as shown in Figs. 8a and 8b. In these figures, the upper portion shows the height vs. longitude profile corresponding to the map in the lower portion; the pressure scale is approximately linear in height. Points every 12 h are connected by lines, with a dot at 0000 UTC each day. Arrival time at the site is indicated (UTC). Figure 8a indicates anticylonic flow from oceanic regions prior to a transition to cyclonic flow from North America, shown in Fig. 8b.
The climat01ogical airflow probability shown in Fig. 9 is a superposition of ensembles of trajectories to map the areal distribution of the probability of hypothetical air parcels reaching the Bermuda site. The areas of highest occurrence of trajectory passage may be important source areas, as the air reaching the site has spent considerable time over them. 1~ Selected trajectories are used based upon the lowest potential temperature level when two or more of the four trajectories ending near the site ate above ground. The number of hours these selected trajectories spend in each geographical area is shown as a cumulative probability field. In Fig. 9 it is evident that flow around the anticyclone is important, but that flow from North America is also significant. In Fig. 10 we show a weighted probability analysis, based on the measured in-sector Z22Rn concentration. The weight used Ls the cumulative frequency of the concentration, which increases from zero for low concentrations to unity for the highest concentrations measured, so areas from which 222Rn arrives are emphasized. The figure clearly indicates that trajectories from the continental area are associated with high concentrations, and that flow from around the anticyclone is not important in transporting 2Z2Rn to the site.
315

A. R. HLrI-I/SR et al.: 222Rn AT BERMUDA AND MAUNA LOA
] ' ' I ' ' I ' ' I ' ' I
500 . . . . . . . . . . . . . . . . . . . . . . . . . . . . . . . . . . . . . . . . . . . . . . . . . . . . . . . . . . . . . . . . . . . . .
n.
iiiiiiiiiiiiiiiiiiiiiiiiiiiii iiiiiiiiiiiiiiiii ~ 900
I I i I I I I L , I L L 1
1300W 100~ 70~ 400W 10*W
50*N
30*N
10*N
o
N o v e m b e r 12, 1991 B e r m u d a 300K 00 UTC
Fig. ga. Isentmpie trajectories back in time from the Bermuda area showing anticyclonic flow from oceanic 222 regions coinciding with the relatively low Rn and 03 concentrations shown in Fig. 7.
At the MLO, 222Rn data have been used in conjunction with back air trajectories to distinguish events of continental air from Asia transported in the free troposphere across the Pacific towards Hawaii. 11
Conclusions: The EML 2~Rn analyzer, based on the two-filter tube method, has produced near real-time data capable of detecting rapid changes in air mass provenance at both the Tudor Hill, Bermuda AEROCE site and at the NOAA/CMDL MLO site. The 222Rn analyzer can be used for sampling periods as short as 30 min, with a lower level of detection of < 100 Bq m "3. When used in conjunction with local meteorological data, e.g., O3, wd and speed, and analyses such as back air trajectories, the continuous 222Rn data shows the capability to help determine the recent history of air masses, specifically, to discriminate whether the air mass has been in contact with a continent, local island, or the ocean.
316

A. R. HUII'F_~ et al.: 222Rtt AT BERMUDA AND MAUNA LOA
"p
,.c:
m
5 0 0
700
900
�9 I ' ' I ' ' I ' ' J ' ' r
iiiiiiii iiiiiiiiiiiiiiiiiiiiiiiiiiiiiiii I , , r , , r , , I , , I
130~ IO0~ 70~ 40~ IO~
5 0 ~
3 0 ~
10~
November 12, i991 Bermuda 295K 12 UTC
Fig. 8b. Isentropic trajectories back in time from the Bermuda area showing cyclonic flow from North America coinciding with the relatively high 222Rn and 03 concentrations shown in Fig. 7.
90~ 60~ 30~ 0 o
50ON
30~
10~
O c e a n L a n d > 759 > 1365
F i g . 9. lsentropic flow dimatology for Bermuda, July 1991 to June 1992.
317

A. R. HUTI'I~R ct al.: 222Rn AT BERMUDA AND MAUNA LOA
90ow 60~ 30~ 0 ~
50~
30~
10~
Ocean Land > 203 > 365
Fig. 10. Isentmpic flow climatology for Bermuda weighted for 222Rn, July 1991 to June 1992.
Acknowledgments: We depend on many individuals for support in this program. We are especially indebted to site operators A. Glasspool, Bermuda, and S. Ryan, MLO. N. Chieco, EML editor, is thanked for her timely improvements to the manuscript. We also thank S. Oltmans, NOAA/CMDL, for the Bermuda 03 data.
References
1. AEROCE, Overview and Synopses, unpublished (1990). 2. J.M. MILLER (Ed), Geophysical Monitoring for Climatic Change, Boulder, CO, Summary Report No. 1 -- 1972, 1974. 3. J. THOMAS, P. LE CLARE, Health Physics, 18 (1970) 113. 4. S.F. GUGGENHEIM, V.C. NEGRO, Proceedings of the ASME Winter Annual Meeting, Dallas, TX, 90- WA/DE-2, 1990. 5. N. CHIECO, D. BOGEN, E. KNU'ISON (Eds), USDOE, Environmental Measurements Laboratory, New York, NY, Report HASL-300, EML Procedures Manual, 27th Edition, Section 4.5, 1992. 6. V.C. NEGRO, USDOE, Environmental Measurements Laboratory, New York, NY, Report EML-367, 1979. 7. B.G. MENDONCA, J. Appl. Met. 8 (1969) 533. 8. M.H. WILKENING, Science 183 (1974) 413. 9. A.R. HU'ITI~R, A.C. GEORGE, M.L. MAIELLO, I.M. FISENNE, R.J. LARSEN, H.L. BECK, F.C. WILSON, USDOE, Environmental Measurements Laboratory, New York, NY, Report EML-522, 1990. 10. R.L. POIROT, P. R. WISHINSKI, Atmos. Env. 20 (1986) 1457. 11. S.E. WHITrLESTONE, E. ROBINSON, S. RYAN, Atmos. Env. 26A (1992) 251.
318

![[PPT]Mauna Loa - mrs. BOHAYCHUK's information stationmrsbohaychuk.weebly.com/.../mauna_loa_ashlea_olga.ppt · Web viewThe largest volcano on the island of hawaii! Mauna loa’s summit](https://img.pdfslide.us/doc/110x75/5b032cd17f8b9a89208bc914/pptmauna-loa-mrs-bohaychuks-information-viewthe-largest-volcano-on-the-island.jpg)