Embed Size (px)
Citation preview
State of Ohio Enhanced Hazard Mitigation Plan Rev. May 2014
Section 2: HIRA 78
2.2 FLOOD Floods are natural and beneficial functions of stream and lacustrine systems. Floods occur when streams or lakes overflow their banks and spill onto the adjoining land area, which is called a floodplain. Loss of life and property can result when people build structures and develop in flood hazard areas. Numerous factors can cause or exacerbate flooding in Ohio including: heavy and/or prolonged periods of rainfall, snowmelt, soil saturation, ground freeze, severe wind events, and inadequate drainage systems. Floods damage private and public property and infrastructure in Ohio every year. Flooding is the most frequently occurring natural disaster in Ohio and the United States.
RISK ASSESSMENT The two major drainage basins in Ohio are the Lake Erie and Ohio River basins. Streams in the northern third of the state flow into Lake Erie and eventually into the Atlantic Ocean. Streams in the southern two-thirds of the state flow into the Ohio River and eventually into the Gulf of Mexico. There are many types of flooding that occur in Ohio including: riverine, flash flooding, coastal flooding, and shallow flooding. Riverine flooding is generally characterized by slower rising water, which allows for increased warning time but has the potential to last for longer periods of time. Ohio communities experience riverine flooding on both large basins and smaller tributary streams throughout the state. Major sources of riverine flooding in Ohio include the Ohio River, Scioto River, Great Miami River, Muskingum River, Hocking River, Maumee River, Blanchard River, Sandusky River, Cuyahoga River, Grand River, Little Miami River, the Mahoning River and their larger tributaries. Flash flooding can occur when a severe storm produces large amounts of rainfall in a short time. Flash flooding is generally characterized by high velocity water that rises and recedes quickly allowing little or no warning time to evacuate. Ohio’s Appalachian Region is particularly vulnerable to flash flooding because of the steep terrain and narrow stream valleys. Ohio’s urban areas also experience flash flooding that may be attributed to inadequate or poorly maintained storm water infrastructure, increased impervious area, and lost wetland areas. The U.S. Geological Survey (USGS) has concluded that urbanization generally increases the size and frequency of floods and may increase a community’s flood risk. Coastal flooding generally occurs in the counties that border Lake Erie. Flooding in coastal areas can be caused by stream overflow, wave run-up caused by strong winds, and higher than normal lake levels. Annual fluctuations in Lake Erie water levels are the result of seasonal changes and the amount of water flowing into and out of the lake. In-flow for Lake Erie includes drainage from the upper portion of the Great Lakes basin through the Detroit River, water from streams flowing directly into the lake, ground water, and precipitation falling directly into the lake. Out-flow includes discharge into Lake Ontario through the Niagara River, evaporation, and any diversion or other withdrawals. Lake Erie
State of Ohio Enhanced Hazard Mitigation Plan Rev. May 2014
Section 2: HIRA 79
levels also exhibit a wide range of long-term fluctuations that are the result of prolonged and persistent deviation from average climatic conditions. Shallow flooding occurs in flat areas with inadequate channels that prevent water from draining easily. There are four types of shallow flooding: sheet flow, ponding, urban drainage and rural drainage. Sheet flow flooding occurs in areas where channels are not defined. Sheet flow flooding moves downhill and covers a large area under a relatively uniform depth. Ponding occurs in flat areas where runoff collects in depressions and cannot drain. Ponding can occur where glaciers carved out depressions in the landscape, and where man-made features such as roads have blocked drainage outlets. Urban drainage systems can include combinations of ditches, storm sewers, detention ponds, house gutters, and yard swales. When a rainfall event exceeds the design capacity of the drainage system, it can result in the system’s back-up and overflowing ditches. Basements are highly susceptible to flood damage caused by overloaded sewer and drainage systems. Urban drainage flooding can also occur behind levees when rainfall amounts exceed the capacity of pumps or other man-made systems designed to drain the landward side of the levees. Rural drainage flooding in northwest Ohio is similar to urban drainage flooding in Ohio’s cities and villages. Most of northwest Ohio was covered by a large swamp prior to European settlement that was subsequently drained for agriculture. The flat topography of this area is drained by an extensive system of ditches, swales, and small meandering streams. Rural drainage flooding occurs when rainfall exceeds the design capacity of the drainage system. Ohio’s river systems offer many benefits that have contributed to the development of the state such as: transportation, waste disposal, energy, commerce, recreation, and water supply. As a result, most major communities include development in flood hazard areas. Wetland areas have been developed, streamside forests have been removed, and streams have been straightened and channelized resulting in faster and increased runoff. After two centuries, these development patterns have drastically changed Ohio’s riparian ecosystems, and resulted in escalating flood damages. Historically, efforts to manage flooding can be divided into three major era’s according to the Federal Interagency Floodplain Management Task Force. The Frontier Era (Pre-1917) is characterized by limited federal involvement in flood control or relief. During this time, many federal policies and programs encouraged land development with the common goal being “to conquer the wild landscape and to promote productive use of the land.” Flood hazards were the problem of the individual property owner, or dealt with cooperatively at the local level. The Structural Era (1917-1959) is characterized by attempts to modify and control floodwater and move water off the land as quickly as possible. The
State of Ohio Enhanced Hazard Mitigation Plan Rev. May 2014
Section 2: HIRA 80
federal government began assuming the costs to construct dams, levees, reservoirs, and other large structural flood control projects. As this era came to an end, resource managers began to realize that flood control projects were not eliminating flood damage and may be harming the environment. During the Stewardship Era (1960-present), people began to recognize the important benefits and natural functions provided by floodplain areas such as natural flood and erosion control, water quality maintenance, groundwater recharge, recreation, wildlife habitat, agricultural production and many others. The responsibility of floodplain management began to shift from the federal government to the local level again. The federal government began to focus on providing financial assistance to reduce and recover from the impacts of flooding. Congress created the National Flood Insurance Program (NFIP) in 1968 as a response to mounting flood losses and increasing disaster relief costs. The intent of the program is to reduce future flood damage through community floodplain management regulations, and provide a federally-subsidized insurance alternative to federal disaster relief. The political jurisdictions in Ohio that are eligible to participate in the NFIP include cities, villages, and unincorporated areas (through the county government). There are 251 cities, 688 villages, and 88 counties in Ohio. There are 745 Ohio communities that participate in the NFIP. FEMA has identified flood hazard areas in every county in the state. As of December 2011, there were 45,068 flood insurance policies in effect for $7,284,384,100 in coverage statewide. Since 1978, the NFIP has paid 25,342 claims totaling $281,618,973.
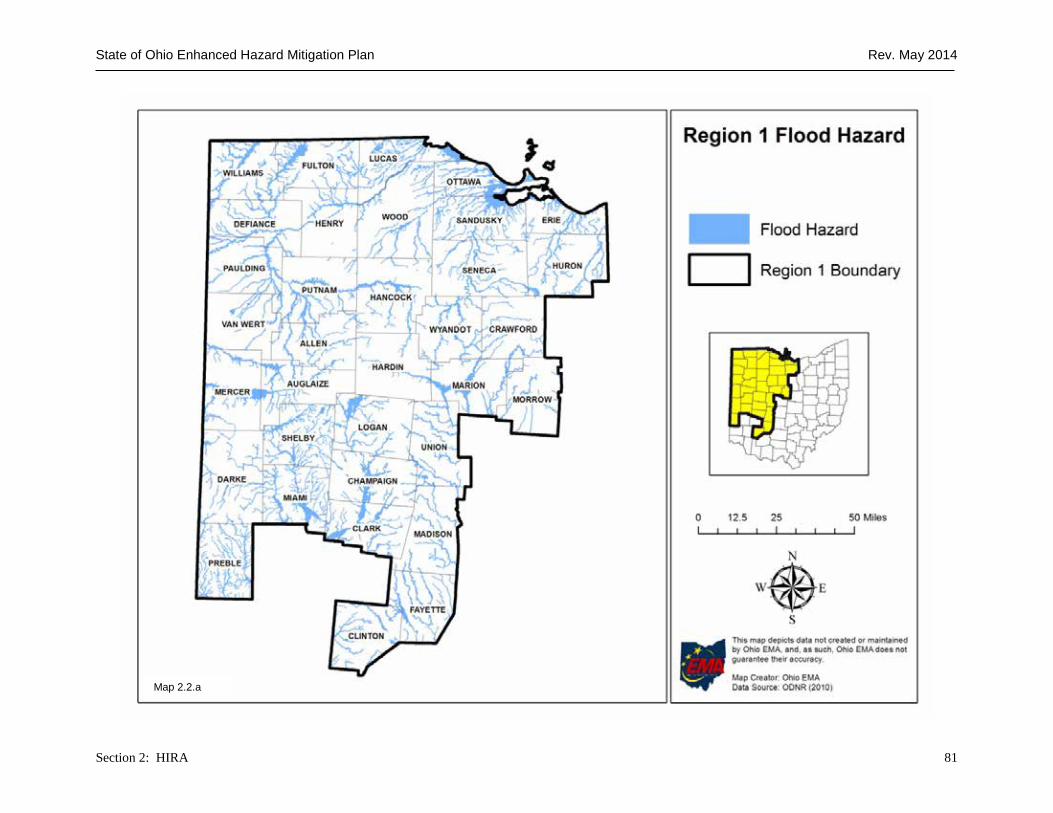
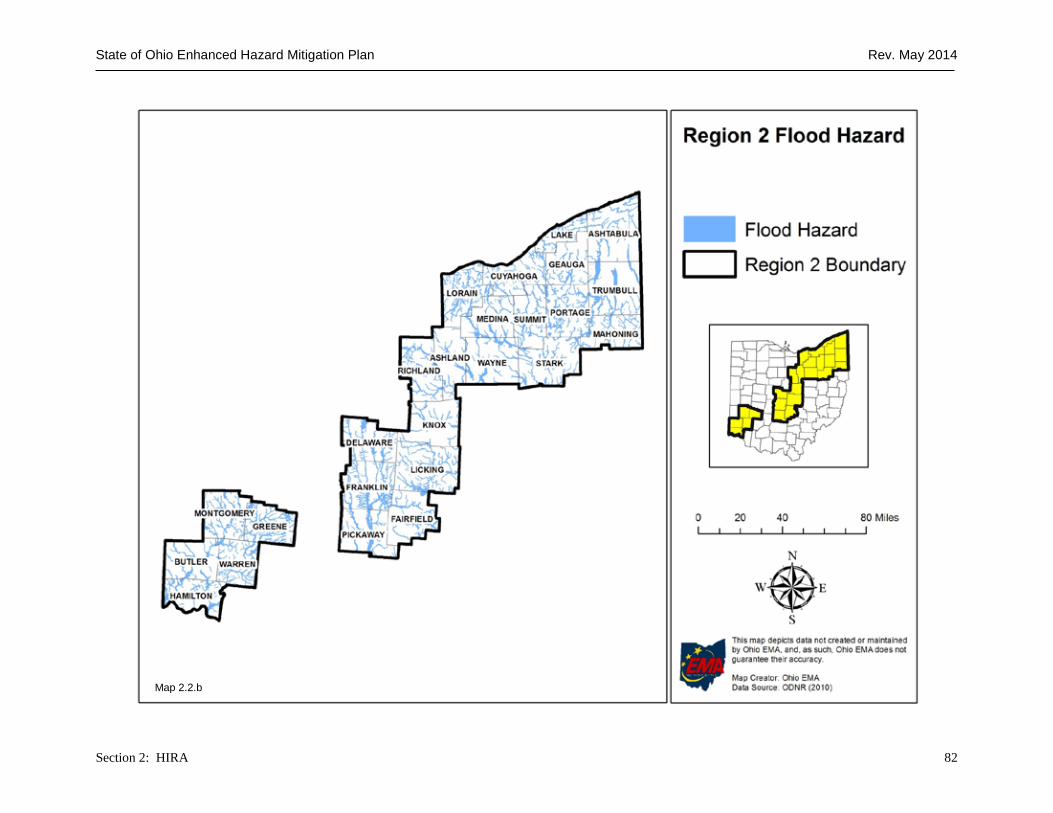
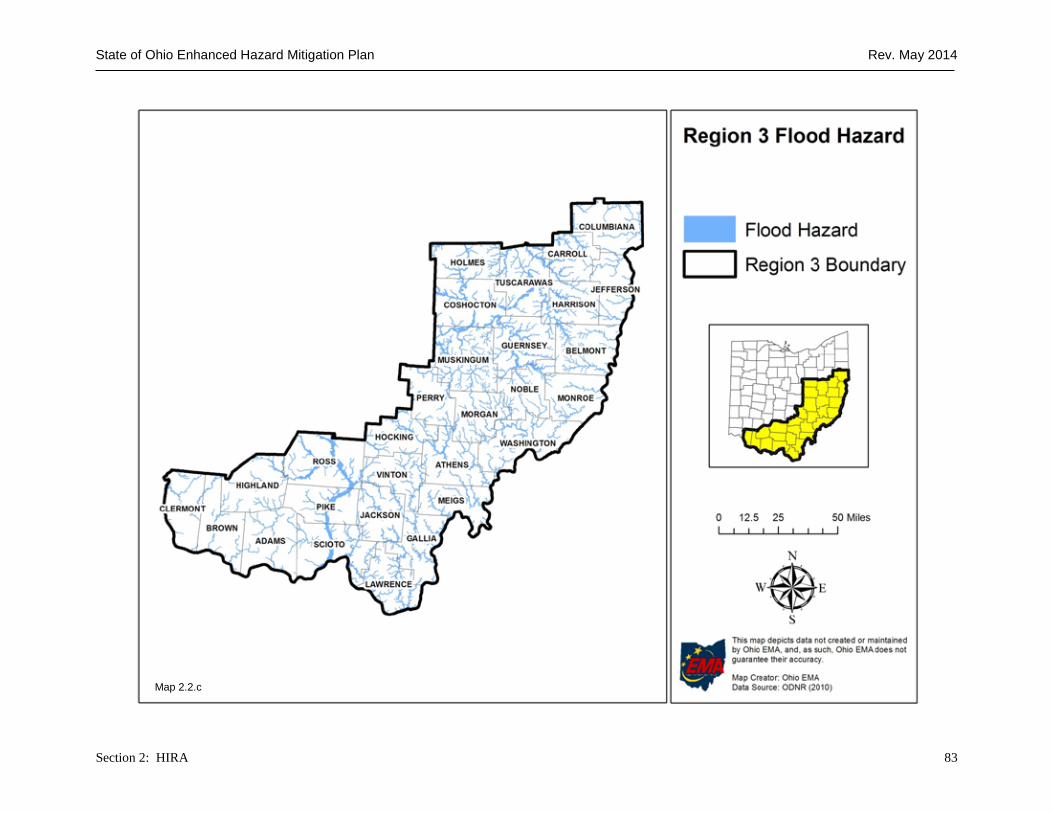
Location The four sources of information used to determine the location of flooding in Ohio are: FEMA flood maps and studies, NOAA data, information provided by the Ohio Department of Natural Resources - Division of Soil and Water Resources, and HAZUS analyses. Flood maps generated by FEMA to support the NFIP are the primary source of information on the location of special flood hazard areas (SFHAs) in the state. There are two main types of flood maps: the Flood Hazard Boundary Map (FHBM) and the Flood Insurance Rate Map (FIRM). The FHBM identifies approximate SFHAs based on the best available data at the time the map was created. Generally, Flood Insurance Studies (FISs) and FIRMs are issued by FEMA following a detailed engineering analysis of flood hazard areas in participating communities. The FIS and FIRM identify 1%-annual-chance flood elevations and boundaries for selected stream reaches in the community. The FIRM will contain flood elevation information for various flood frequencies and may also delineate floodway boundaries. Flooding occurs in every county in Ohio. There are over 60,000 miles of named, unnamed and intermittent streams in Ohio. FEMA has mapped approximately 2,777 square miles of flood hazard area in the state. Maps 2.2.a -2.2.c display FEMA identified SFHAs in the State of Ohio for the designated Regions.
State of Ohio Enhanced Hazard Mitigation Plan Rev. May 2014
Section 2: HIRA 81
Map 2.2.a
State of Ohio Enhanced Hazard Mitigation Plan Rev. May 2014
Section 2: HIRA 82
Map 2.2.b
State of Ohio Enhanced Hazard Mitigation Plan Rev. May 2014
Section 2: HIRA 83
Map 2.2.c
State of Ohio Enhanced Hazard Mitigation Plan Rev. May 2014
Section 2: HIRA 84
The NOAA’s National Climate Data Center (NCDC) Storm Events Database contains information on the location of flood events in Ohio. The database can be searched by county and includes a written description of the location of flood events reported in the state. The database also contains latitude and longitude values for some events and contains information on reported deaths, injuries, and estimated property and crop damage. The database can be found on the NCDC website. The Ohio Department of Natural Resources, Division of Soil and Water Resources is mandated to be a state repository for flood hazard information (Ohio Revised Code Section 1521.13(C)(2)). The Floodplain Management Program maintains copies of flood hazard data generated by various federal, state, local, and private entities.
Past Occurrences Profiling past occurrences of flooding at the state level involves gathering and compiling data from many different sources. The data sources used to profile the past occurrences of flooding include FEMA, the ODNR, the Ohio EMA, the NOAA, and the book Thunder in the Heartland by Thomas W. and Jeanne Applehans-Schmidlin, 1996. Table 2.2.a displays a summary of historic flooding information from 1860 to 1990 based on the chronicle Thunder in the Heartland: A Chronicle of Outstanding Weather Events in Ohio. More specific information on these events as well as events post 1990 can be found in the narrative of this section.
State of Ohio Enhanced Hazard Mitigation Plan Rev. May 2014
Section 2: HIRA 85
Table 2.2.a
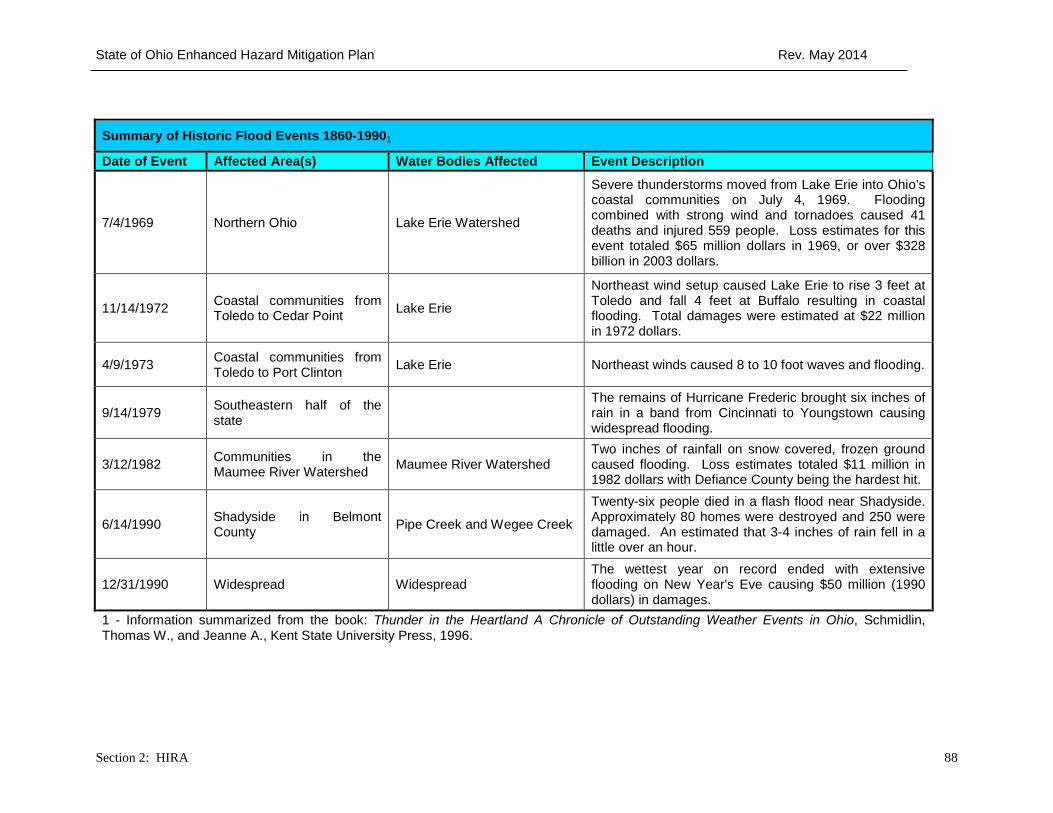
Summary of Historic Flood Events 1860-19901
Date of Event Affected Area(s) Water Bodies Affected Event Description
8/12/1861 Columbiana County, Elkton, Lisbon Beaver Creek, Elk Run Every home in Elkton was damaged and four persons
drowned when one home was washed off its foundation.
2/17/1867 Toledo, Maumee Maumee River Ice jams destroyed one bridge and damaged several others. Flooding in downtown Toledo.
2/11/1881 Toledo, Grand Rapids, Columbus, Findlay
Maumee River, Scioto River, Blanchard River
Four bridges were damaged by ice jams and debris in Toledo. Flooding in downtown Toledo.
2/1883 Statewide Auglaize, Blanchard, Maumee, Portage, and Sandusky Rivers
A combination of snowmelt, ice jams, frozen ground and heavy rains caused flooding statewide.
2/14/1884 Statewide Ohio, Hocking, Maumee, and Muskingum Rivers
Second highest stage on the Ohio River in Cincinnati. Thousands were evacuated and 3000 buildings were submerged.
5/12/1886 Xenia Shawnee Creek Flash flooding washed away several homes killing 21 people and destroying one bridge.
1/23/1904 Lorain, Toledo, Waverly Black, Scioto, Mahoning and Maumee Rivers
Ships, bridges, and structures were damaged by ice jams and flooding.
3/14-18/1907 Ohio River Watershed Southern 2/3 of Ohio Large scale flooding in the Ohio River Watershed resulted in 32 casualties, hundreds of flooded structures, utility and infrastructure damage.
3/23-27/1913 Statewide Statewide
Described as "Ohio's Greatest Weather Disaster". Four days of heavy rain on saturated soils resulted in 467 casualties, over 2,200 homes destroyed, over 40,000 damaged, and over $2.5 Billion damage in 2003 dollars.
7/16/1914 Cambridge Wills Creek Watershed Over 7.09 inches of rain in 1.5 hours causing flash flooding.
8/16/1920 Toledo Maumee River Flash flooding in downtown Toledo damaged homes, businesses and infrastructure.
State of Ohio Enhanced Hazard Mitigation Plan Rev. May 2014
Section 2: HIRA 86
Summary of Historic Flood Events 1860-19901
Date of Event Affected Area(s) Water Bodies Affected Event Description
2/26/1929 Cleveland, Dayton, Mt. Vernon, Bridgeport, Springfield
Little Miami, Maumee, Miami, Rocky, Mad, and Kokosing Rivers, Wheeling and Buck Creeks
Two to three inches of rain, melting snow, and ice jams caused widespread flooding.
3/21/1933 Cincinnati and Southern Ohio Ohio River Two periods of heavy rain cause widespread minor
flooding.
8/7/1935 Coshocton and surrounding counties Tuscarawas Watershed Heavy rain on saturated soils saturated soils caused
flash flooding.
3/19/1936 Ohio River Communities from Pittsburgh to Steubenville
Upper Ohio River Snowmelt and heavy rains in Penn. and W. Virginia caused the Ohio River to rise 20 feet in two days.
1/26/1937 All Ohio River Communities Ohio River Described as the "Greatest Flood on the Ohio River". Record levels on the Ohio River from Gallipolis to the confluence with the Mississippi.
7/7/1943 Akron and Steubenville Cuyahoga River, Cross and Wills Creeks
Six to seven inches of rain in several hours caused flash flooding and landslides.
6/16/1946 Wayne and Holmes Counties Killbuck and Salt Creeks
Heavy rain caused flash flooding resulting in one death, a train wreck destroying 5 bridges and seriously damaging 55 others.
6/8/1947 Adams, Lawrence and Scioto Counties
South Fork of Scioto Brush Creek and other small tributaries to the south emptying into the Ohio River
Flash flooding damaged many homes, bridges, roads, and crops.
3/21/1948 Counties in the Lake Erie Watershed Lake Erie Watershed
The most severe damage was reported in along the Chagrin River in Cleveland. Twenty buildings were destroyed and 153 were damaged.
6/16/1950 Crooksville, Roseville Moxahala Creek Watershed One of the most intense rainfalls ever known in Ohio caused severe flood damages to homes and businesses.
State of Ohio Enhanced Hazard Mitigation Plan Rev. May 2014
Section 2: HIRA 87
Summary of Historic Flood Events 1860-19901
Date of Event Affected Area(s) Water Bodies Affected Event Description
1/21/1959 Statewide Statewide
Rainfall in January 1959 ranging from 3-6 inches on snow-covered, frozen ground caused the most severe statewide flooding since 1913. Streams reached flood stage from January 21-24 killing 16 people, forcing 49,000 people from their homes, and causing extensive damage to homes, businesses and infrastructure.
6/5/1963 Guernsey County Wills Creek Watershed
Official records indicate 7.95 inches of rainfall in 16-hours in Cambridge. One railroad bridge was destroyed, all major highways were inundated, and water supplies were polluted.
3/10/1964 Southern and Central Ohio All Streams in Southern and Central Ohio
Two periods of heavy rain cause widespread flooding resulting in eight deaths, thousands evacuated, 84 homes destroyed, and 8,200 damaged.
7/21/1964 Akron Ohio Canal and Little Cuyahoga River
Official records indicate 3.05 inches of rain in 75 minutes, but rain distribution was variable. The resulting flooding caused a sewer line to collapse a large section of road killing 3 people.
4/27/1966 Communities Along Lake Erie's Western Basin Lake Erie's Western Basin
Several hours of winds up to 55 mph from the northeast pushed the western end of Lake Erie to flood stage. Fifteen hundred were evacuated, hundreds of homes were damaged, and utility services were interrupted.
7/12/1966 Erie, Ottawa, and Huron Counties
Sandusky and Huron River Watersheds
Rainfall totals ranging from 9-12 inches of rainfall over and approximately one-day period. Total damages exceed $27 million in 2003 dollars, including damages to 12,000 homes and businesses in Sandusky.
5/23-27/1968 Central and Southern Ohio Hocking, Scioto, Little Miami Two periods of heavy rain within 5 days on already saturated soils caused flooding on many streams. Four deaths have been attributed to this event.
State of Ohio Enhanced Hazard Mitigation Plan Rev. May 2014
Section 2: HIRA 88
Summary of Historic Flood Events 1860-19901
Date of Event Affected Area(s) Water Bodies Affected Event Description
7/4/1969 Northern Ohio Lake Erie Watershed
Severe thunderstorms moved from Lake Erie into Ohio’s coastal communities on July 4, 1969. Flooding combined with strong wind and tornadoes caused 41 deaths and injured 559 people. Loss estimates for this event totaled $65 million dollars in 1969, or over $328 billion in 2003 dollars.
11/14/1972 Coastal communities from Toledo to Cedar Point Lake Erie
Northeast wind setup caused Lake Erie to rise 3 feet at Toledo and fall 4 feet at Buffalo resulting in coastal flooding. Total damages were estimated at $22 million in 1972 dollars.
4/9/1973 Coastal communities from Toledo to Port Clinton Lake Erie Northeast winds caused 8 to 10 foot waves and flooding.
9/14/1979 Southeastern half of the state
The remains of Hurricane Frederic brought six inches of rain in a band from Cincinnati to Youngstown causing widespread flooding.
3/12/1982 Communities in the Maumee River Watershed Maumee River Watershed
Two inches of rainfall on snow covered, frozen ground caused flooding. Loss estimates totaled $11 million in 1982 dollars with Defiance County being the hardest hit.
6/14/1990 Shadyside in Belmont County Pipe Creek and Wegee Creek
Twenty-six people died in a flash flood near Shadyside. Approximately 80 homes were destroyed and 250 were damaged. An estimated that 3-4 inches of rain fell in a little over an hour.
12/31/1990 Widespread Widespread The wettest year on record ended with extensive flooding on New Year's Eve causing $50 million (1990 dollars) in damages.
1 - Information summarized from the book: Thunder in the Heartland A Chronicle of Outstanding Weather Events in Ohio, Schmidlin, Thomas W., and Jeanne A., Kent State University Press, 1996.
State of Ohio Enhanced Hazard Mitigation Plan Rev. May 2014
Section 2: HIRA 89
Historically, significant floods in Ohio occurred in 1913, 1937, 1959 and 1969. Heavy rain on saturated soils caused flooding throughout Ohio during March 23-27, 1913 killing 467 people, destroying 2,200 homes, and flooding 40,637 residences. Losses totaled $113 million in 1913 dollars ($2.5 billion in 2010 dollars), including: $78 million to buildings and personal property, $12 million to roads and bridges, $12 million to railroad property, which includes lost profit, $6 million to the agricultural industry, and $4 million dollars to machinery. This flood set record water levels on many Ohio streams. The Miami River Watershed experienced the highest casualties and damages during this event. The flood of record for the Ohio River occurred the last two weeks in January 1937. Normal January precipitation in Ohio is 2-3 inches. The statewide average rainfall in January 1937 was 9.57 inches, with some stations recording over 14 inches. Ohio River levels on January 26-27 were the highest ever recorded from Gallipolis, Ohio to the confluence with the Mississippi River. Every Ohio community along the river was flooded resulting in 10 casualties, 16 injuries, thousands of damaged structures, and over 54,000 evacuations statewide. Rainfall in January 1959 ranging from 3-6 inches on snow-covered, frozen ground caused the most severe statewide flooding since 1913. Streams reached flood stage from January 21-24 killing 16 people, forcing 49,000 people from their homes, and causing extensive damage to homes, businesses and infrastructure. Loss estimates for this event totaled $100 million in 1959, or over $752 million in 2010 dollars. Some of the factors that reduced casualties and damages from the 1913 flood include: less intense rainfall amounts, the construction of flood-control reservoirs built after 1913, and improved emergency management procedures and capabilities. Severe thunderstorms moved from Lake Erie into Ohio’s coastal communities on July 4, 1969. This line of storms became nearly stationary for more than eight hours aligned from Toledo southeast to Wooster. Official records indicate over 10 inches of precipitation lasting over a 2-day period. Flooding combined with strong winds and tornadoes caused 41 deaths and injured 559 people. Loss estimates for this event totaled $65 million dollars in 1969, or over $388 million in 2010 dollars. This flood caused extensive damage to homes, businesses, infrastructure, utilities, boats and automobiles. Twenty-six people died in a flash flood near Shadyside, Ohio on June 14, 1990. The National Weather Service estimated that 3-4 inches of rain fell in a little over an hour near Pipe Creek and Wegee Creek. Total rainfall is estimated at 5.5 inches in three hours. The saturated soils and narrow, steep-sided valleys caused the water to drain quickly into the creeks. Flash flooding began at 9:30PM and was over in 30 minutes. During that time a wall of water six feet high (reported to be 20 feet in some areas) rushed through the valley at seven to ten miles-per-hour. Approximately 80 homes were destroyed and 250 were damaged.
State of Ohio Enhanced Hazard Mitigation Plan Rev. May 2014
Section 2: HIRA 90
Storms that produced heavy rains during March 1-2, 1997, resulted in severe flooding in southern Ohio. The largest accumulations of rainfall were recorded in southern Adams and Brown Counties and ranged from 10-12 inches over the two-day period. Generally, rainfall amounts of four or more inches fell on most of the counties along or near the southern border of Ohio. Widespread damages to private and public property occurred throughout the area. Preliminary loss estimates totaled nearly $180 million in 1997, or over $245 million in 2010 dollars. Approximately 20,000 people were evacuated and 6,500 residences and 833 businesses were affected. Five deaths were attributed to flooding; all of the fatalities were the result of attempts to drive through flooded roads. Storms during June 26-30, 1998, resulted in flooding and widespread damage throughout much of central, east-central and southeastern Ohio. More than 10 inches of rain fell during a four-day period in parts of southeast Ohio. Twelve storm or flood-related fatalities were reported and infrastructure and utilities were heavily impacted. Loss estimates totaled nearly $178 million in 1998, or over $239 million in 2010 dollars. Between the 2005 and 2014 plan updates, five flood events resulted in Presidential disaster declarations. These five events are described below. DR-1651-OH declared July 2, 2006 Severe thunderstorms and tornado touchdowns caused two deaths and widespread damage in northern Ohio from June 21-23, 2006. The primary causes of damage in this event were flash flooding, which overwhelmed urban stormwater infrastructure, and riverine flooding. Huron County and the City of Brecksville were especially impacted. The communities of Toledo, Norwalk, Valley View and Independence also experienced significant flooding. The USGS estimated flood recurrence intervals for gaged streams based on flood stage for this event. The flooding on the Vermilion River was estimated to be a 50-year event. The flooding on the Cuyahoga River and Tinkers Creek were estimated to be 25 to 50-year events. DR-1656-OH declared August 1, 2006 Two separate weather systems produced storms resulting in more than 11 inches of rain in parts of Lake County, Ohio on July 27-28, 2006. As a result of the storms and ensuing flooding, the counties of Lake, Geauga and Ashtabula were declared Federal disaster areas. The flooding caused one fatality and 600 evacuations in Lake County. Over all of Lake County, 100 homes and businesses were destroyed and an additional 731 homes and businesses were damaged. Flooding destroyed five bridges in Lake County and closed 13 roads. The City of Painesville experienced heavy damages. The USGS stream flow-gaging station at the Grand River near Painesville, Ohio had record peak stream flow and peak stage. The recurrence interval for this event was estimated to be 500 years (Ebner, A.D.; Sherwood, J.M.; Astifan, Brian; and Lombardy, Kirk, 2007, Flood of July 27-31, 2006, on the Grand River near Painesville, Ohio: U.S. Geological Survey Open-File Report 2007-1164).
State of Ohio Enhanced Hazard Mitigation Plan Rev. May 2014
Section 2: HIRA 91
DR-1720-OH declared August 26, 2007 Heavy rainfall inundated multiple communities across northern Ohio during a two-day period. The rain developed along a nearly stationary frontal boundary that was oriented from west to east across north central Ohio. Moisture from the Gulf of Mexico, as well as the remnants of Tropical Depression Erin, was drawn northward resulting in tropical downpours. The heaviest rains redeveloped each night, starting Sunday night August 19, 2007 into Monday morning and then again on Monday night into the early morning hours of Tuesday, August 21, 2007. Stream gage reports from four locations in the affected area indicated that 24-hour rainfall totals ending at 8AM on August 21, 2007 exceeded the 1,000 year/24-hour rainfall frequency. Peak flood stage of the Blanchard River in the City of Findlay was 0.04 less than the flood of record in 1913 (National Weather Service Forecast Office in Cleveland, Ohio). Communities in the Blanchard, Sandusky and Mohican River watersheds were heavily impacted. There were approximately 2,500 flooded structures in the City of Findlay. The communities of Ottawa, Bucyrus, Shelby, Lima, Carey, and Bluffton also had many flooded structures. Recovery efforts are still progressing in these areas. DR-4002-OH declared July 13, 2011 Heavy rains and thunderstorms moved through the state on February 27, 2011 as 3-4 inches of rain accumulated over a 24-hour period in already saturated areas across northern Ohio. This system exited the state and a second wave of precipitation moved through Southern Ohio. Warm temperatures, heavy snow pack and snow melt resulted in moderate to major flooding in many areas of the state. The State monitored river crests and falling temperatures over a 48-hour period for impacts, including potential issues with debris, waste water, sewage, and shelters. Major to moderate flood river levels were recorded in Northern Ohio. The Cuyahoga River reached near-record flood levels. In March and April, much of Ohio continued to experience heavy rain, severe storms, flooding, and flash flooding across the southern portion of the state. The cumulative effect of these conditions, coupled with flooding in neighboring states along the Ohio and Mississippi Rivers, resulted in dangerous conditions and damages which affected the health, safety and welfare in 21 southern Ohio counties. More severe storms moved across the south central part of the state in May, producing heavy rain and high winds. These conditions further intensified the previously affected citizens in Gallia, Jackson, Lawrence, Pike, Ross, Scioto and Vinton Counties. During this time, the Governor had issued two proclamations and requested a Presidentially-declared disaster for 13 counties along the Ohio River and 8 adjacent counties.
State of Ohio Enhanced Hazard Mitigation Plan Rev. May 2014
Section 2: HIRA 92
DR-4098-OH declared January 3, 2013 Hurricane Sandy brought heavy rainfall and significant flooding to northern portions of Ohio on October 29-30, 2012. The flooding was the result of three consecutive weather events; a cold front, hurricane Sandy remnants, and lake enhanced showers. Rain started on October 26th as a slow moving cold front moved into the Ohio Valley. This front brought widespread 0.75 to 2.0 inches of rainfall to northern Ohio, highest near the lake. By Monday the remnants of Hurricane Sandy moved into Pennsylvania, and the pressure gradient between it and high pressure over Missouri produced storm force winds over Lake Erie. Moisture from Sandy moved into the region producing an additional rainfall of 2 to 3 inches by Tuesday the 30th. Rain continued at a rate averaging 0.10 inches per hour for the day, but increased to 0.75 inches per hour overnight and early Wednesday morning. This band of heavier rain caused the rivers which were receding to once again rise. Areal flooding was limited to more northern counties; however some small streams and creeks came out of their banks as far south as Ashland County. Numerous roads were closed due to flooding in Cuyahoga, Lake, and Medina Counties. In Ashtabula County, docks were damaged at the Port of Ashtabula due to severe wind and violent wave actions on Lake Erie, and marinas had to be dredged at the Port Authority of Conneaut. A flood watch was in effect for the lake front counties and flood advisories were issued during the event. A few dozen homes and businesses were impacted as water inundated basements or first floors. A number of homes affected were located in the flood plain of the rivers or along the shoreline where the raised lake level combined with the increased stream flows to produce flooding in areas not typically affected. Two rivers along the lakeshore reached major flood stage (based on NWS stage categories), the Cuyahoga and the Huron Rivers. The rest of the Lake Erie tributaries saw minor or moderate flooding. Many basements flooded further inland as sump pumps failed due to power outages. As the result of Hurricane Sandy, and estimated $13,406,088 in public assistance funds has been awarded to this point. NOAA Data Summary Table 2.2.b lists the number of reported floods in Ohio since the year 2000, and associated loss totals according to the NOAA’s NCDC Storm Events Database. The information in this database comes from NWS, who receives their data from a variety of sources including: county, state, and federal emergency management officials, local law enforcement officials, weather spotters, NWS damage surveys, newspaper clipping service, the insurance industry and the public. An effort is made to use the best available information, but because of time and resource constraints, information from these sources may be unverified by the NWS.
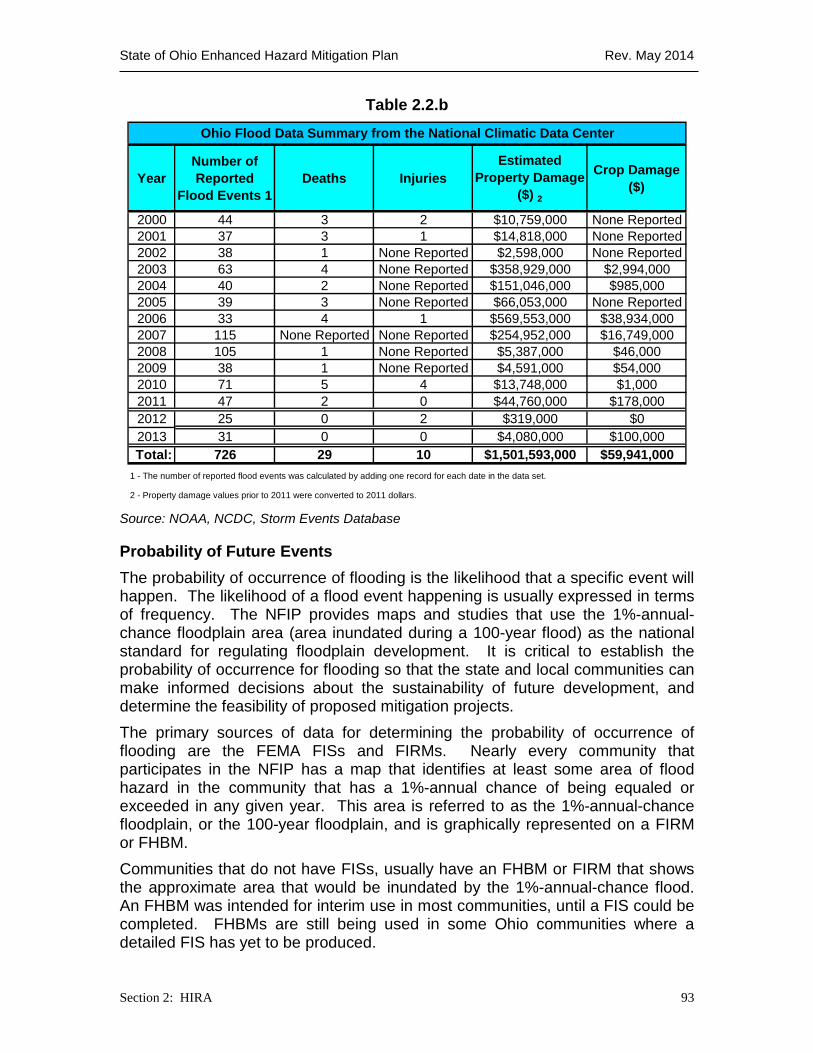
State of Ohio Enhanced Hazard Mitigation Plan Rev. May 2014
Section 2: HIRA 93
Table 2.2.b
YearNumber of Reported
Flood Events 1Deaths Injuries
Estimated Property Damage
($) 2
Crop Damage ($)
2000 44 3 2 $10,759,000 None Reported2001 37 3 1 $14,818,000 None Reported2002 38 1 None Reported $2,598,000 None Reported2003 63 4 None Reported $358,929,000 $2,994,0002004 40 2 None Reported $151,046,000 $985,0002005 39 3 None Reported $66,053,000 None Reported2006 33 4 1 $569,553,000 $38,934,0002007 115 None Reported None Reported $254,952,000 $16,749,0002008 105 1 None Reported $5,387,000 $46,0002009 38 1 None Reported $4,591,000 $54,0002010 71 5 4 $13,748,000 $1,0002011 47 2 0 $44,760,000 $178,0002012 25 0 2 $319,000 $02013 31 0 0 $4,080,000 $100,000Total: 726 29 10 $1,501,593,000 $59,941,000
Ohio Flood Data Summary from the National Climatic Data Center
1 - The number of reported flood events was calculated by adding one record for each date in the data set.
2 - Property damage values prior to 2011 were converted to 2011 dollars. Source: NOAA, NCDC, Storm Events Database
Probability of Future Events The probability of occurrence of flooding is the likelihood that a specific event will happen. The likelihood of a flood event happening is usually expressed in terms of frequency. The NFIP provides maps and studies that use the 1%-annual-chance floodplain area (area inundated during a 100-year flood) as the national standard for regulating floodplain development. It is critical to establish the probability of occurrence for flooding so that the state and local communities can make informed decisions about the sustainability of future development, and determine the feasibility of proposed mitigation projects. The primary sources of data for determining the probability of occurrence of flooding are the FEMA FISs and FIRMs. Nearly every community that participates in the NFIP has a map that identifies at least some area of flood hazard in the community that has a 1%-annual chance of being equaled or exceeded in any given year. This area is referred to as the 1%-annual-chance floodplain, or the 100-year floodplain, and is graphically represented on a FIRM or FHBM. Communities that do not have FISs, usually have an FHBM or FIRM that shows the approximate area that would be inundated by the 1%-annual-chance flood. An FHBM was intended for interim use in most communities, until a FIS could be completed. FHBMs are still being used in some Ohio communities where a detailed FIS has yet to be produced.
State of Ohio Enhanced Hazard Mitigation Plan Rev. May 2014
Section 2: HIRA 94
Approximately 81 percent of Ohio communities that participate in the NFIP have a portion of their flood hazard areas identified in an FIS. The purpose of a FIS is to investigate the existence and severity of flood hazards in a certain geographic area. The information in an FIS is used to establish actuarial flood insurance rates and assist the community in its efforts to regulate flood hazard areas. An FIS contains data on: historical flood events, the area and flood sources studied, and the engineering methods employed to generate the flood hazard data. An FIS will have flood elevation profiles for the 100-year recurrence probability flood, and usually the 10-, 50-, and/or 500-year floods. It may also contain tables summarizing floodway data and other flood hazard information; however it does not usually contain data for every flood hazard area in a community. The remaining areas may have approximate flood hazard data, or none at all. There are several other possible data sources for determining the area affected by a particular probability flood event. The Ohio Department of Natural Resources, Division of Soil and Water Resources, is the state repository for flood hazard information and has copies of flood hazard information generated by various federal, state, local and private entities. The Floodplain Management Program maintains current copies of all FEMA FISs and flood maps in the state.
LHMP Data As stated at the beginning of Section 2, integration of LHMP data into the state HIRA is an ongoing effort. As local plans continue to expire and jurisdictions update their plans, vulnerability information and loss estimation are collected and assembled. Highlighted below is some of the more notable jurisdictional plan information that has been assembled and integrated into the state HIRA. Hamilton County. The 2013 updated Multi-Hazard Mitigation Plan examined flash flooding, river flooding and urban flooding (categorized in their plan as Non-Flood Zone flooding). Since the previously approved plan in October 2006, Hamilton County has experienced 31 events with a total of $82,000 in property damage. Additionally, river flooding assessment is conducted for each of the major watersheds that affect the county: the Great Miami River, the Little Miami River, the Ohio River and the Mill Creek watershed plus its tributaries. Each of the watersheds are mapped and analyzed to include properties, repetitive loss areas and critical facilities. These analyses projected 2,377 residential structures at risk at a value of $72,428,000, an estimated 750 non-residential structures valued at $319,464,000 and 173 critical facilities valued at $30,404,000. Belmont County. The 2013-2018 Belmont County Multi-Jurisdictional Hazard Mitigation Plan provides an analysis of riverine and flash flooding. Although it is considered to be a small, rural county, projections show potential losses approaching $2 billion. A Level-1 HAZUS-MH 100-year flood scenario estimated 10,469 residential structures at risk at a value of $1,388,080,000, an estimated 3,552 non-residential structures valued at $471,071,000 and 839 critical facilities valued at $113,140,000. Flooding continues to be a frequent and damaging hazard as a result of the Ohio River, several streams and creeks. There have been eight Presidential declarations due to flooding since 1980, three of which
State of Ohio Enhanced Hazard Mitigation Plan Rev. May 2014
Section 2: HIRA 95
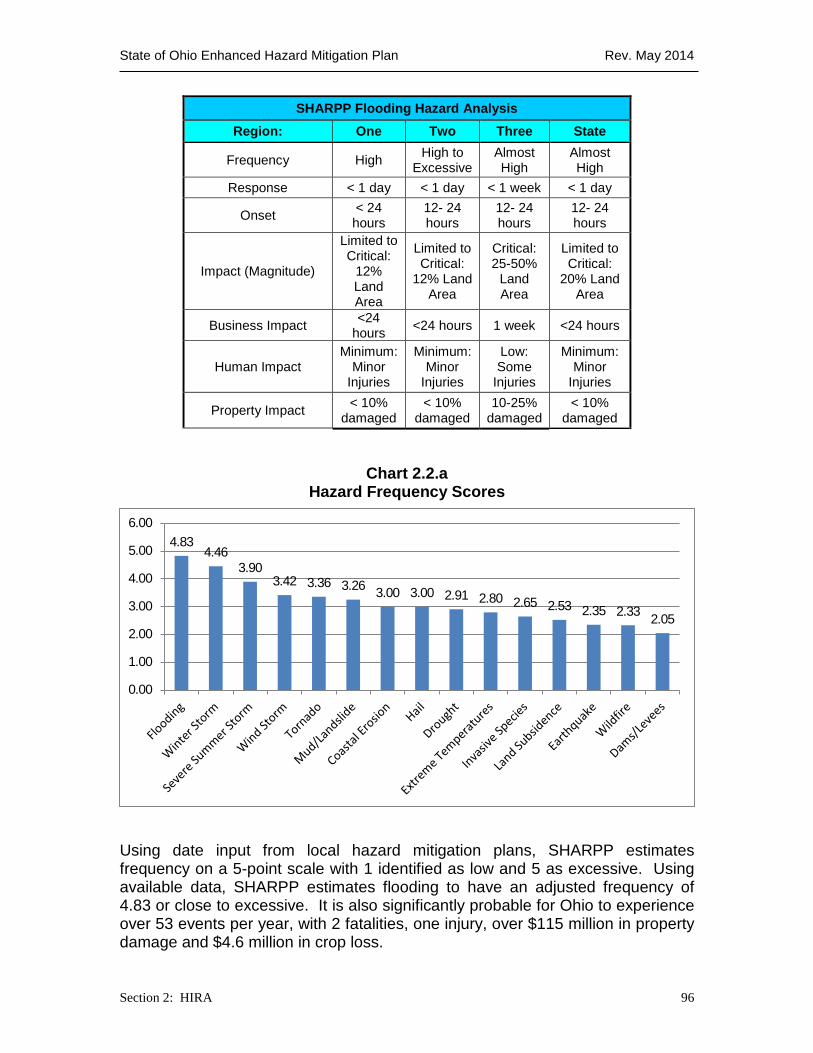
occurred in the month of June. However riverine flooding occurs in the winter as well. In January 1996, floodwaters from the conveyance of two rivers in Pittsburgh caused the Ohio River to crest over 4 feet above flood stage. This caused 61 residences to be destroyed, 136 with major damage, 107 with minor damage and 14 residences to be affected. Belmont County also has 52 repetitive loss properties: 37 are residential with 36 losses while 15 are classified as non-residential with 87 losses. One of the residential properties is a Severe Repetitive Loss property with four losses. Flash flooding occurs more often than riverine flooding with 65 events recorded between 1996 to 2013 and damaging $7,159,000 in property and $5 million in crop losses. The most significant event was in June 1990, recorded as the most devastating flash flood to strike Ohio in recent years, resulting in 26 fatalities. Jackson County. The Jackson County Natural Hazards Mitigation Plan of February 2011 used HAZUS-MH to project damage in its most flood prone areas. These are identified as the Cities of Jackson and Wellston, and the Villages of Coalton and Oak Hill and various unincorporated jurisdictions. These areas experienced flooding in 1997 when the Little Salt Creek, Meadow Run, Little Raccoon Creek and other watersheds exceeded their banks. A Level-1 HAZUS-MH 100-year flood scenario performed in 2011, estimated 2,474 residential structures at risk at a value of $297,782,000, an estimated 958 non-residential structures valued at $115,769,000 and 175 critical facilities valued at $21,137,000. SHARPP. Hazard identification data were queried from SHARPP to evaluate each hazard and its frequency. Considering all hazards identified in the local plans, flooding ranked the highest in terms of frequency among the counties in the state (Chart 2.2.a). While ranking high for frequency, flooding ranked relatively low in terms of local magnitude (sixth), as the flood hazard areas in most counties represent less than 10 percent of their land area. However, this hazard ranked second for local economic effects, including both impact on businesses and impact on property. On the average, counties indicated that a flood results in business shutdown of approximately one week. Concerning property in flood hazard areas, counties suggested flooding affects approximately 10 – 25 percent of individual assets given a moderate flood magnitude. These and additional HIRA data queried from SHARPP can be found in Appendix J. As local mitigation plans are updated, county HIRA, vulnerability assessment , and mitigation action item data will continue to be added by local officials. The collection and analysis of this data will strengthen mitigation planning efforts statewide. The following information is reported with available information and data input:
State of Ohio Enhanced Hazard Mitigation Plan Rev. May 2014
Section 2: HIRA 96
SHARPP Flooding Hazard Analysis Region: One Two Three State
Frequency High High to Excessive
Almost High
Almost High
Response < 1 day < 1 day < 1 week < 1 day
Onset < 24 hours
12- 24 hours
12- 24 hours
12- 24 hours
Impact (Magnitude)
Limited to Critical:
12% Land Area
Limited to Critical:
12% Land Area
Critical: 25-50%
Land Area
Limited to Critical:
20% Land Area
Business Impact <24 hours <24 hours 1 week <24 hours
Human Impact Minimum:
Minor Injuries
Minimum: Minor
Injuries
Low: Some
Injuries
Minimum: Minor
Injuries
Property Impact < 10% damaged
< 10% damaged
10-25% damaged
< 10% damaged
Chart 2.2.a
Hazard Frequency Scores
Using date input from local hazard mitigation plans, SHARPP estimates frequency on a 5-point scale with 1 identified as low and 5 as excessive. Using available data, SHARPP estimates flooding to have an adjusted frequency of 4.83 or close to excessive. It is also significantly probable for Ohio to experience over 53 events per year, with 2 fatalities, one injury, over $115 million in property damage and $4.6 million in crop loss.
4.83 4.46
3.90 3.42 3.36 3.26 3.00 3.00 2.91 2.80 2.65 2.53 2.35 2.33 2.05
0.00
1.00
2.00
3.00
4.00
5.00
6.00
State of Ohio Enhanced Hazard Mitigation Plan Rev. May 2014
Section 2: HIRA 97
VULNERABILITY ANALYSIS Flooding vulnerability is the likelihood of something to be damaged in a flood. A vulnerability analysis is a measurement of a community’s flood risk. Vulnerability can be measured using many different methods. The method selected is highly dependent on the type and format of available data. If site-specific information on flood elevation, lowest floor elevation, structure type, and replacement value exist, a detailed vulnerability analysis can be performed using flood damage curves. The State of Ohio, and most communities in the state lack all or a component of the data required for a detailed analysis and must use more simplified methods. Several different data sources are utilized in this discussion to help develop a clearer picture of Ohio’s flood vulnerability including: local natural hazard mitigation plans, presidential disaster declaration data, the statewide Structure Inventory, NFIP repetitive loss data, HAZUS-MH analyses, and local data uploaded into SHARPP.
ODNR Structure Inventory The ODNR, Division of Soil and Water Resources, Floodplain Management Program developed a statewide coverage of the federally identified 1%-annual-chance floodplains. This coverage was combined with Digital Ortho Quarter Quadrangles to identify structures located within that flood hazard area. Every structure in or near the 100-year floodplain was georeferenced and was assigned a unique structure ID number. The number assigned to each structure was entered into a database that contains attribute fields for each structure, including: structure use (residential, commercial etc.), lowest floor elevation, and Base Flood Elevation. The initial baseline of flood-prone structures and the accompanying database provide a tool that communities can use to develop comprehensive flood vulnerability analyses. These data were disseminated to all counties for use in their daily floodplain management duties and planning initiatives. According to the Structure Inventory, there are 139,644 structures in FEMA-identified SFHA in the State of Ohio. Once a county’s structure inventory database is populated, it can be used to complete a risk assessment by: classifying flood-prone structures by address, use category, repetitive loss status, construction date, foundation type, construction type and several other categories. A populated structure inventory database can also distinguish between structures that have reduced risk because they are built in compliance with local flood damage prevention regulations, and those that are not. This will allow communities to track how and where they are reducing future flood risks. This tool can also be used to identify structures that may be good candidates for future mitigation projects. Likewise, the structure inventory can be used by counties to conduct a vulnerability analysis. This analysis should include an accurate estimate of the value of flood-prone assets. The most accurate assessment of structure values in the State of Ohio is maintained at the individual county auditor’s offices. Each county auditor’s office maintains the current tax assessed value of structures in
State of Ohio Enhanced Hazard Mitigation Plan Rev. May 2014
Section 2: HIRA 98
their county, many of which are available in a GIS format. If a county auditor can provide the value of structures in the SFHA, it can be used with the structure inventory to provide improved vulnerability analyses. Communities that are beginning the mitigation planning process, or updating their plan, are encouraged to use the Structure Inventory to collect data about flood-prone structures in their community. Copies of the Structure Inventory were delivered to all county emergency management agency directors and every local floodplain administrator in the state prior to November 2004. It should be noted that most communities throughout the state did not incorporate these data into their mitigation actions as most communities did not possess GIS resources and capability at the time. In addition, there has been much developmental change in flood hazard areas throughout the state, and these changes would not be present in the data. As more communities develop GIS capabilities and more flood hazard data are developed, updated structure inventories can be collected and maintained for future vulnerability analyses. For the purposes of this Enhanced State Plan Update, the structure inventory provides the most accurate quantification of potential structures at risk from flooding, especially when coupled with the HAZUS-MH results. When these results are paired with data housed in SHARPP, the state can make informed decisions regarding mitigation strategies and priorities.
Presidential Disaster Declaration Data Flood vulnerability can also be expressed as historic expenditures on disaster recovery for flood events. Total expenditures for programs triggered by a Presidential Disaster Declarations are tracked and summarized by Ohio EMA (Appendix A).
NFIP Repetitive Loss Properties The NFIP has identified a subset of structures covered by flood insurance policies that are referred to as “repetitive loss” and “severe repetitive loss.”(see Appendix B). For this analysis, a repetitive loss structure is any property covered under an NFIP flood insurance policy with two or more losses in any 10-year rolling period, and at least two losses that are more than 10 days apart. As of September 25, 2013, the NFIP identified 2,317 structures in Ohio that meet this definition, with a combined building and content loss of $125,021,664.80. Severe repetitive loss (SRL) structures are defined as residential structures that are covered under an NFIP flood insurance policy and a) that have at least four NFIP claim payments (including building and contents) over $5,000 each, and the cumulative amounts of such claims payments exceed $20,000; or b) for which at least two separate claims payments (building payments only) have been made with the cumulative amount of the building portion of such claims exceeding the market value of the building. For both (a) and (b) above, at least two of the referenced claims must have occurred within any ten-year period, and must be greater than 10 days apart. Currently, there are 68 structures on the SRL list with a combined building and content loss of $6,455,283.79.
State of Ohio Enhanced Hazard Mitigation Plan Rev. May 2014
Section 2: HIRA 99
NFIP repetitive loss data can be used to identify some of the structures vulnerable to flooding throughout the state. In Ohio, it is estimated that approximately 75% of the structures in the SFHA are not covered by flood insurance for any number of reasons. Some reasons include: misinformation about flood insurance as a mitigation option; the structure is not required to be covered by flood insurance because there is no current mortgage; lack of resources to purchase coverage; and lack of enforcement by mortgage holder. Recent legislation is focused on reducing the number of repetitive loss structures by offering mitigation options to the owners. FEMA mitigation grant programs have also prioritized the mitigation of repetitive loss structures including Severe Repetitive Loss, Repetitive Flood Claims, HMGP, FMA, and the PDM-C. The repetitive loss data should be used to identify areas that are repetitively flooded in a community. Given the current prioritization of repetitive loss structures, these structures should be considered when developing mitigation projects that utilize FEMA funding.
HAZARDS U.S.-MULTI-HAZARD (HAZUS-MH) Ohio EMA and ODNR cooperated with the US Army Corps of Engineers (USACE) to undertake a HAZUS analysis project under the USACE’s Planning Assistance to States program (50/50 cost share program). In this project, the ODNR-FPM and USACE combined to complete Level 1 flood analysis for 49 counties. The Corps analyzed Adams, Ashland, Athens, Coshocton, Delaware, Fairfield, Fayette, Franklin, Gallia, Guernsey, Harrison, Highland, Hocking, Holmes, Jackson, Knox, Lawrence, Licking, Madison, Marion, Medina, Meigs, Monroe, Morgan, Morrow, Muskingum, Noble, Perry, Pickaway, Pike, Richland, Ross, Scioto, Stark, Tuscarawas, Union, Vinton, Washington and Wayne Counties. The ODNR analyzed Belmont, Carroll, Columbiana, Jefferson, Mahoning, Portage, Summit and Trumbull. The remainder of the state was analyzed by Ohio EMA from 2009 to 2010. The analyses completed for all counties in the state included the 100-year and 25-year flood intervals using a drainage area of four square miles. Results of these and other HAZUS-MH runs are shared with counties and jurisdictions when possible to assist in updating local mitigation plans.
LOSS ESTIMATION
ODNR Structure Inventory Each county (and communities within) is now able to identify the baseline number of structures at risk in identified flood hazard areas of their community. The attribute database will support the measurement of structures with reduced risk through NFIP compliance or mitigation actions (e.g. acquisitions, retrofits, and elevations). Given increased development throughout the state, some communities may find it advantageous to update their structure inventory by using updated aerial photography, such as the data produced by the Ohio Statewide Imagery Program (OSIP). Since local GIS capabilities have grown
State of Ohio Enhanced Hazard Mitigation Plan Rev. May 2014
Section 2: HIRA 100
exponentially over the past five years, many local mitigation plans should be able to assess their vulnerability to flooding in a more accurate manner.
Presidential Disaster Declaration Data Since 1964 there has been $504,489,149 in Public Assistance funds, $276,396,684 in Individual Assistance funds, $61,100,951 in Hazard Mitigation Grant Program funds, $9,348,252 in State Controlling Board funds, $5,274,171 in State Disaster Relief Program funds, $10,410,817 in Natural Resources Conservation funds, $350,000 in Community Development Block Grant funds, and $25,457,115 in State funds used as to match federal funds spent as a result of disaster declarations related to floods within Ohio. The dollar totals listed above are not in current dollars and exclude insured and unreported losses.
NFIP Repetitive Loss Data Appendix B lists the repetitive loss properties by county and region, indicates the status of flood insurance, estimates the structure and content value, and demonstrates the number of flood losses per structure. Region 1 has the highest number of repetitive loss structures in the state as identified by the NFIP (877 structures). The amount paid out for repair of their structures through September 25, 2013 is $41,090,795.42 for structure repairs and contents replacements. Within Region 1 the most significant concentration of repetitive loss structures is located in the City of Findlay (Hancock County), which is along the Blanchard River. In total, Findlay has 222 repetitive loss structures identified with 678 losses, which have paid a total of $16,615,468.60 for structure repairs and contents replacements. Region 2 is identified as having the second highest number of repetitive loss structures in the State. All of the counties within the region have identified repetitive loss structures. As a whole Region 2 has 749 repetitive loss structures identified, with the highest value of contents replacements and total payments equaling $51,180,618.48 in paid claims. There are two areas of significant loss identified with in the region. The City of Cincinnati (Hamilton County) is located in the southwestern portion of the state on the Ohio River. It has 59 repetitive loss structures with 192 claims for $5,406,440.69, in repairs paid and contents replaced. The second area includes the City of Eastlake (Lake County), situated in the northeastern portion of the state on Lake Erie. Eastlake has 37 identified repetitive loss structures with 105 claims for a total of $892,093.94. Region 3 is third in the state for all statistics regarding repetitive loss structures. In total, there are 714 repetitive loss structures with 1,784 losses totaling $33,724,863.35 in repairs and contents paid. The City of Marietta (Washington County) has 118 repetitive loss structures with 289 reported claims representing $7,789,481.17 in repairs and contents replacements. The second highest RFC count in this region resides in the unincorporated area of Washington County; 52 structures with 127 losses totaling $2,322,373.30 in repairs and contents replacements. Collectively the counties, which border the Ohio River, represent the largest exposure in this region.
State of Ohio Enhanced Hazard Mitigation Plan Rev. May 2014
Section 2: HIRA 101
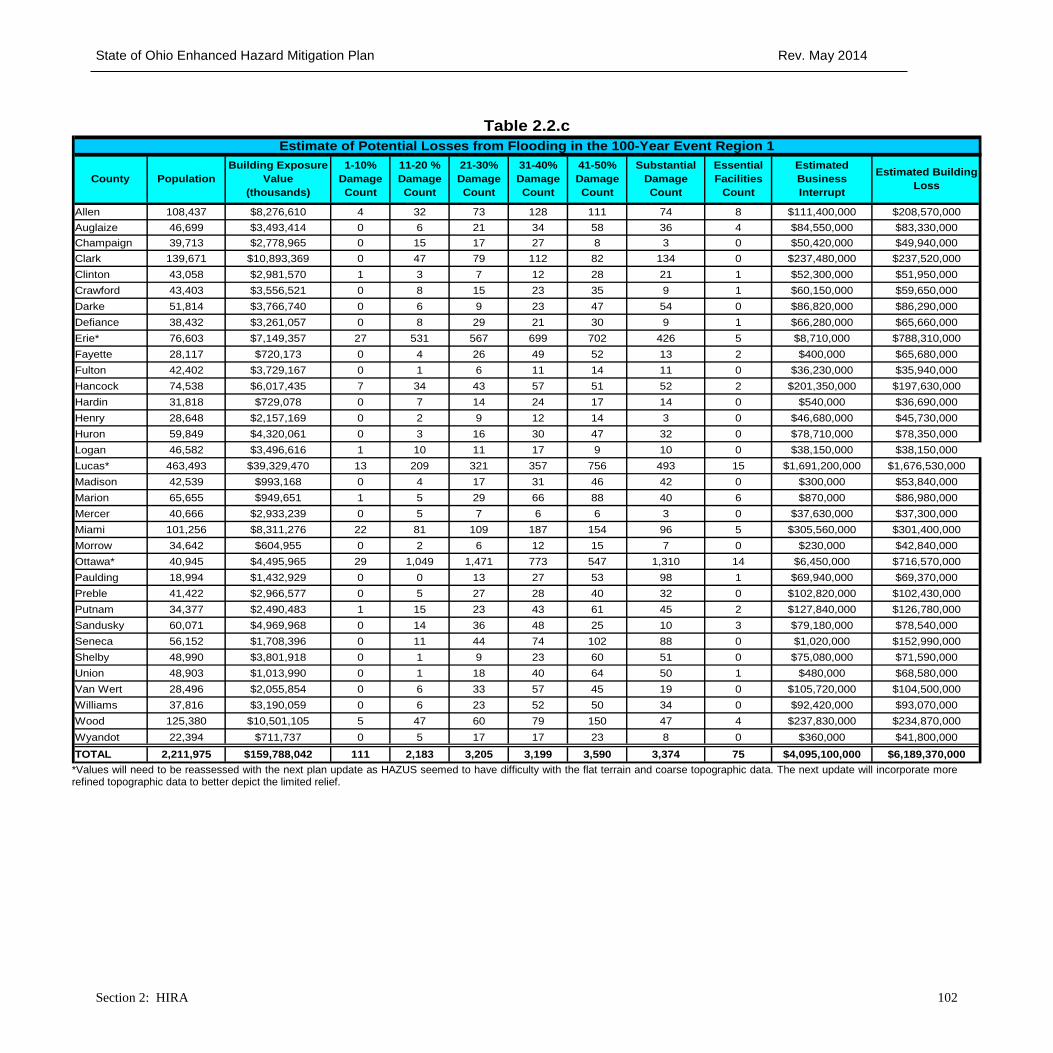
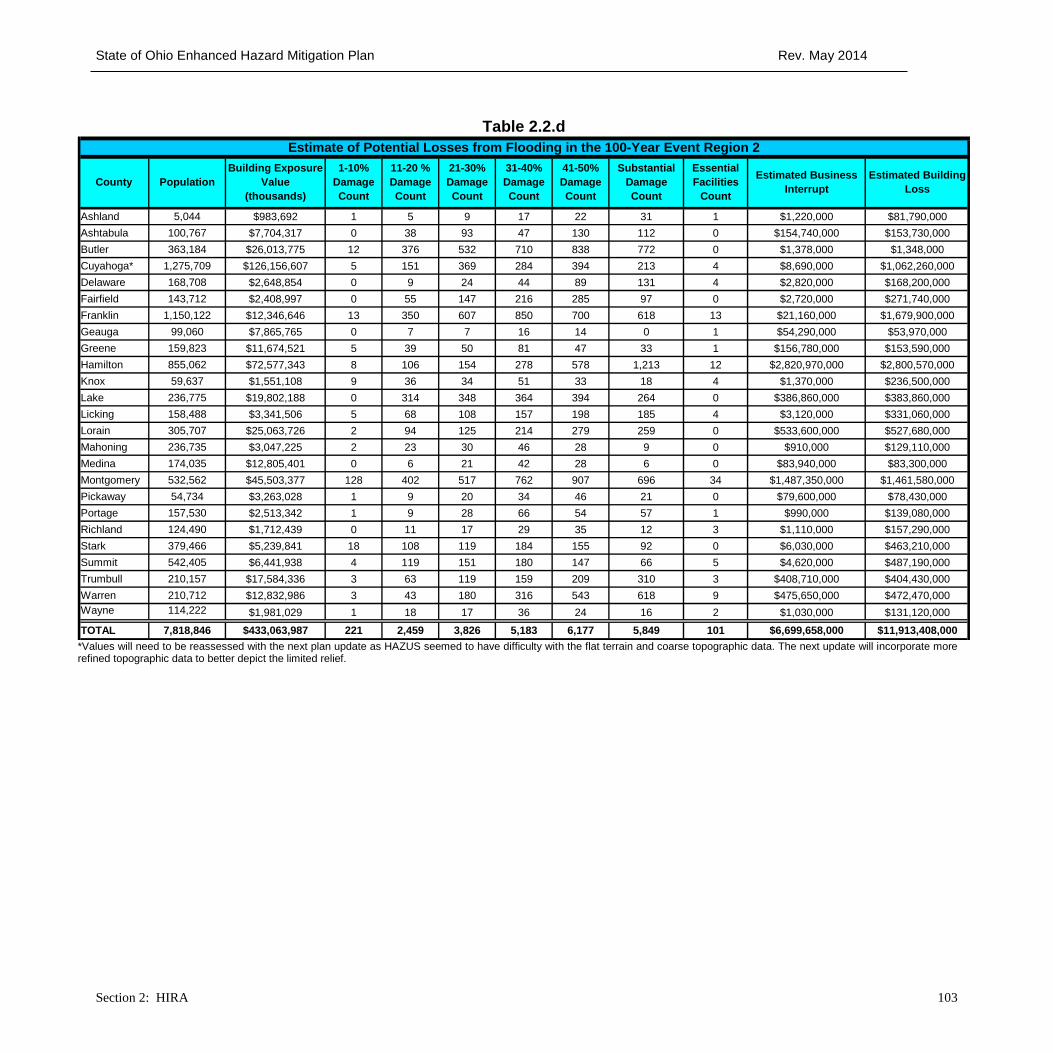
HAZUS-MH The results of the HAZUS-MH runs have been broken down by region and are reported by county for total building exposure, number of structures impacted by percentage damaged, number of critical facilities impacted, total business interruption losses, and the total building loss (See Tables 2.2.c, 2.2.d, 2.2.e, 2.2.f, 2.2.g and 2.2.h). Tables ending in c, d and e contain the results based on a 100-year event while f, g and h contain the 25-year results. It is important to remember all the information reported via the state’s HAZUS-MH analyses is an estimate and cannot be interpreted as precise losses. Future HAZUS analyses will include more refined property, flood, and topographic data to reduce this uncertainty.
State of Ohio Enhanced Hazard Mitigation Plan Rev. May 2014
Section 2: HIRA 102
Allen 108,437 $8,276,610 4 32 73 128 111 74 8 $111,400,000 $208,570,000Auglaize 46,699 $3,493,414 0 6 21 34 58 36 4 $84,550,000 $83,330,000Champaign 39,713 $2,778,965 0 15 17 27 8 3 0 $50,420,000 $49,940,000Clark 139,671 $10,893,369 0 47 79 112 82 134 0 $237,480,000 $237,520,000Clinton 43,058 $2,981,570 1 3 7 12 28 21 1 $52,300,000 $51,950,000Crawford 43,403 $3,556,521 0 8 15 23 35 9 1 $60,150,000 $59,650,000Darke 51,814 $3,766,740 0 6 9 23 47 54 0 $86,820,000 $86,290,000Defiance 38,432 $3,261,057 0 8 29 21 30 9 1 $66,280,000 $65,660,000Erie* 76,603 $7,149,357 27 531 567 699 702 426 5 $8,710,000 $788,310,000Fayette 28,117 $720,173 0 4 26 49 52 13 2 $400,000 $65,680,000Fulton 42,402 $3,729,167 0 1 6 11 14 11 0 $36,230,000 $35,940,000Hancock 74,538 $6,017,435 7 34 43 57 51 52 2 $201,350,000 $197,630,000Hardin 31,818 $729,078 0 7 14 24 17 14 0 $540,000 $36,690,000Henry 28,648 $2,157,169 0 2 9 12 14 3 0 $46,680,000 $45,730,000Huron 59,849 $4,320,061 0 3 16 30 47 32 0 $78,710,000 $78,350,000Logan 46,582 $3,496,616 1 10 11 17 9 10 0 $38,150,000 $38,150,000Lucas* 463,493 $39,329,470 13 209 321 357 756 493 15 $1,691,200,000 $1,676,530,000Madison 42,539 $993,168 0 4 17 31 46 42 0 $300,000 $53,840,000Marion 65,655 $949,651 1 5 29 66 88 40 6 $870,000 $86,980,000Mercer 40,666 $2,933,239 0 5 7 6 6 3 0 $37,630,000 $37,300,000Miami 101,256 $8,311,276 22 81 109 187 154 96 5 $305,560,000 $301,400,000Morrow 34,642 $604,955 0 2 6 12 15 7 0 $230,000 $42,840,000Ottawa* 40,945 $4,495,965 29 1,049 1,471 773 547 1,310 14 $6,450,000 $716,570,000Paulding 18,994 $1,432,929 0 0 13 27 53 98 1 $69,940,000 $69,370,000Preble 41,422 $2,966,577 0 5 27 28 40 32 0 $102,820,000 $102,430,000Putnam 34,377 $2,490,483 1 15 23 43 61 45 2 $127,840,000 $126,780,000Sandusky 60,071 $4,969,968 0 14 36 48 25 10 3 $79,180,000 $78,540,000Seneca 56,152 $1,708,396 0 11 44 74 102 88 0 $1,020,000 $152,990,000Shelby 48,990 $3,801,918 0 1 9 23 60 51 0 $75,080,000 $71,590,000Union 48,903 $1,013,990 0 1 18 40 64 50 1 $480,000 $68,580,000Van Wert 28,496 $2,055,854 0 6 33 57 45 19 0 $105,720,000 $104,500,000Williams 37,816 $3,190,059 0 6 23 52 50 34 0 $92,420,000 $93,070,000Wood 125,380 $10,501,105 5 47 60 79 150 47 4 $237,830,000 $234,870,000Wyandot 22,394 $711,737 0 5 17 17 23 8 0 $360,000 $41,800,000TOTAL 2,211,975 $159,788,042 111 2,183 3,205 3,199 3,590 3,374 75 $4,095,100,000 $6,189,370,000
County PopulationBuilding Exposure
Value(thousands)
1-10% Damage Count
Table 2.2.cEstimate of Potential Losses from Flooding in the 100-Year Event Region 1
Substantial Damage Count
Essential Facilities
Count
Estimated Business Interrupt
Estimated Building Loss
11-20 % Damage Count
21-30% Damage Count
31-40% Damage Count
41-50% Damage Count
*Values will need to be reassessed with the next plan update as HAZUS seemed to have difficulty with the flat terrain and coarse topographic data. The next update will incorporate more refined topographic data to better depict the limited relief.
State of Ohio Enhanced Hazard Mitigation Plan Rev. May 2014
Section 2: HIRA 103
Ashland 5,044 $983,692 1 5 9 17 22 31 1 $1,220,000 $81,790,000Ashtabula 100,767 $7,704,317 0 38 93 47 130 112 0 $154,740,000 $153,730,000Butler 363,184 $26,013,775 12 376 532 710 838 772 0 $1,378,000 $1,348,000Cuyahoga* 1,275,709 $126,156,607 5 151 369 284 394 213 4 $8,690,000 $1,062,260,000Delaware 168,708 $2,648,854 0 9 24 44 89 131 4 $2,820,000 $168,200,000Fairfield 143,712 $2,408,997 0 55 147 216 285 97 0 $2,720,000 $271,740,000Franklin 1,150,122 $12,346,646 13 350 607 850 700 618 13 $21,160,000 $1,679,900,000Geauga 99,060 $7,865,765 0 7 7 16 14 0 1 $54,290,000 $53,970,000Greene 159,823 $11,674,521 5 39 50 81 47 33 1 $156,780,000 $153,590,000Hamilton 855,062 $72,577,343 8 106 154 278 578 1,213 12 $2,820,970,000 $2,800,570,000Knox 59,637 $1,551,108 9 36 34 51 33 18 4 $1,370,000 $236,500,000Lake 236,775 $19,802,188 0 314 348 364 394 264 0 $386,860,000 $383,860,000Licking 158,488 $3,341,506 5 68 108 157 198 185 4 $3,120,000 $331,060,000Lorain 305,707 $25,063,726 2 94 125 214 279 259 0 $533,600,000 $527,680,000Mahoning 236,735 $3,047,225 2 23 30 46 28 9 0 $910,000 $129,110,000Medina 174,035 $12,805,401 0 6 21 42 28 6 0 $83,940,000 $83,300,000Montgomery 532,562 $45,503,377 128 402 517 762 907 696 34 $1,487,350,000 $1,461,580,000Pickaway 54,734 $3,263,028 1 9 20 34 46 21 0 $79,600,000 $78,430,000Portage 157,530 $2,513,342 1 9 28 66 54 57 1 $990,000 $139,080,000Richland 124,490 $1,712,439 0 11 17 29 35 12 3 $1,110,000 $157,290,000Stark 379,466 $5,239,841 18 108 119 184 155 92 0 $6,030,000 $463,210,000Summit 542,405 $6,441,938 4 119 151 180 147 66 5 $4,620,000 $487,190,000Trumbull 210,157 $17,584,336 3 63 119 159 209 310 3 $408,710,000 $404,430,000Warren 210,712 $12,832,986 3 43 180 316 543 618 9 $475,650,000 $472,470,000Wayne 114,222 $1,981,029 1 18 17 36 24 16 2 $1,030,000 $131,120,000
TOTAL 7,818,846 $433,063,987 221 2,459 3,826 5,183 6,177 5,849 101 $6,699,658,000 $11,913,408,000
Table 2.2.dEstimate of Potential Losses from Flooding in the 100-Year Event Region 2
Substantial Damage Count
Essential Facilities
Count
Estimated Business Interrupt
Estimated Building Loss
11-20 % Damage Count
21-30% Damage Count
31-40% Damage Count
41-50% Damage Count
County PopulationBuilding Exposure
Value(thousands)
1-10% Damage Count
*Values will need to be reassessed with the next plan update as HAZUS seemed to have difficulty with the flat terrain and coarse topographic data. The next update will incorporate more refined topographic data to better depict the limited relief.
State of Ohio Enhanced Hazard Mitigation Plan Rev. May 2014
Section 2: HIRA 104
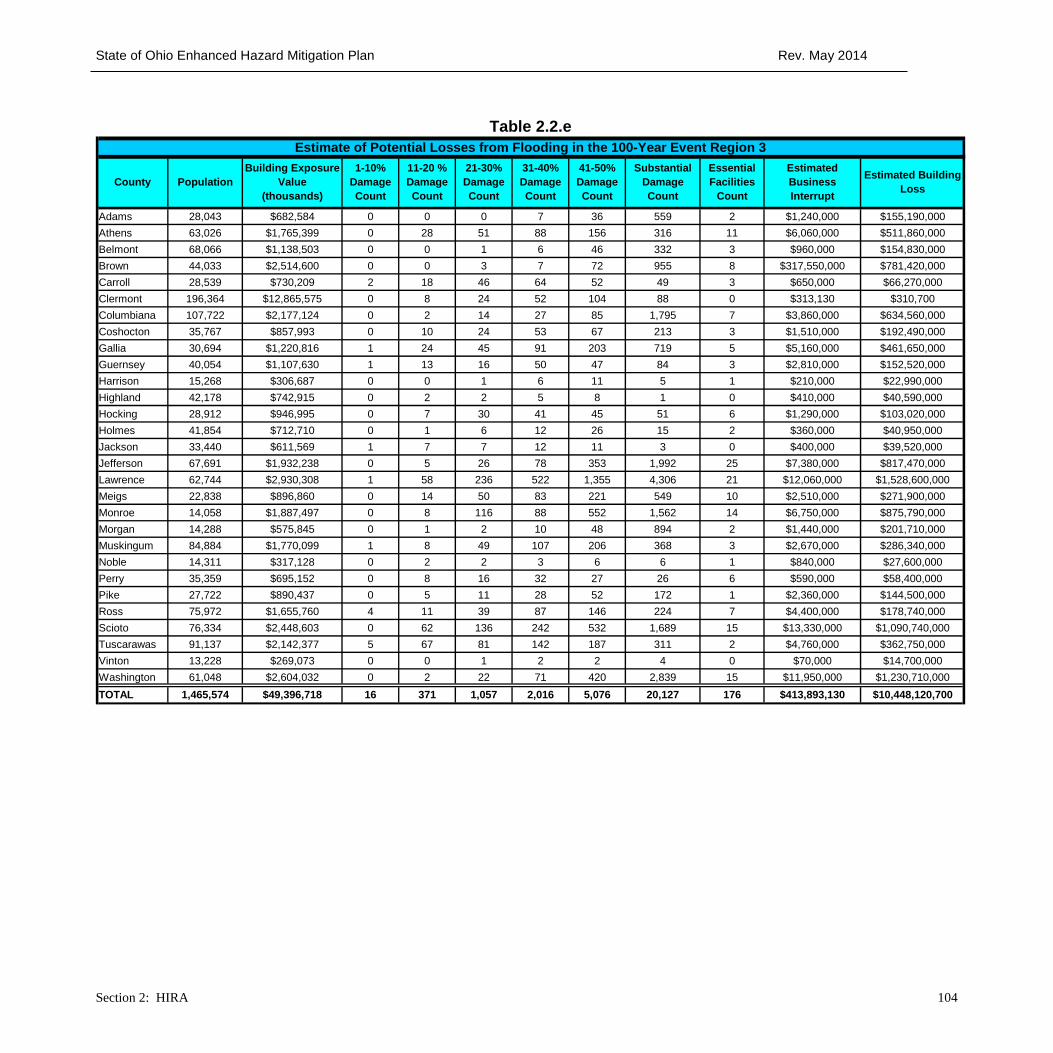
Adams 28,043 $682,584 0 0 0 7 36 559 2 $1,240,000 $155,190,000Athens 63,026 $1,765,399 0 28 51 88 156 316 11 $6,060,000 $511,860,000Belmont 68,066 $1,138,503 0 0 1 6 46 332 3 $960,000 $154,830,000Brown 44,033 $2,514,600 0 0 3 7 72 955 8 $317,550,000 $781,420,000Carroll 28,539 $730,209 2 18 46 64 52 49 3 $650,000 $66,270,000Clermont 196,364 $12,865,575 0 8 24 52 104 88 0 $313,130 $310,700Columbiana 107,722 $2,177,124 0 2 14 27 85 1,795 7 $3,860,000 $634,560,000Coshocton 35,767 $857,993 0 10 24 53 67 213 3 $1,510,000 $192,490,000Gallia 30,694 $1,220,816 1 24 45 91 203 719 5 $5,160,000 $461,650,000Guernsey 40,054 $1,107,630 1 13 16 50 47 84 3 $2,810,000 $152,520,000Harrison 15,268 $306,687 0 0 1 6 11 5 1 $210,000 $22,990,000Highland 42,178 $742,915 0 2 2 5 8 1 0 $410,000 $40,590,000Hocking 28,912 $946,995 0 7 30 41 45 51 6 $1,290,000 $103,020,000Holmes 41,854 $712,710 0 1 6 12 26 15 2 $360,000 $40,950,000Jackson 33,440 $611,569 1 7 7 12 11 3 0 $400,000 $39,520,000Jefferson 67,691 $1,932,238 0 5 26 78 353 1,992 25 $7,380,000 $817,470,000Lawrence 62,744 $2,930,308 1 58 236 522 1,355 4,306 21 $12,060,000 $1,528,600,000Meigs 22,838 $896,860 0 14 50 83 221 549 10 $2,510,000 $271,900,000Monroe 14,058 $1,887,497 0 8 116 88 552 1,562 14 $6,750,000 $875,790,000Morgan 14,288 $575,845 0 1 2 10 48 894 2 $1,440,000 $201,710,000Muskingum 84,884 $1,770,099 1 8 49 107 206 368 3 $2,670,000 $286,340,000Noble 14,311 $317,128 0 2 2 3 6 6 1 $840,000 $27,600,000Perry 35,359 $695,152 0 8 16 32 27 26 6 $590,000 $58,400,000Pike 27,722 $890,437 0 5 11 28 52 172 1 $2,360,000 $144,500,000Ross 75,972 $1,655,760 4 11 39 87 146 224 7 $4,400,000 $178,740,000Scioto 76,334 $2,448,603 0 62 136 242 532 1,689 15 $13,330,000 $1,090,740,000Tuscarawas 91,137 $2,142,377 5 67 81 142 187 311 2 $4,760,000 $362,750,000Vinton 13,228 $269,073 0 0 1 2 2 4 0 $70,000 $14,700,000Washington 61,048 $2,604,032 0 2 22 71 420 2,839 15 $11,950,000 $1,230,710,000TOTAL 1,465,574 $49,396,718 16 371 1,057 2,016 5,076 20,127 176 $413,893,130 $10,448,120,700
County PopulationBuilding Exposure
Value(thousands)
1-10% Damage Count
Table 2.2.eEstimate of Potential Losses from Flooding in the 100-Year Event Region 3
Substantial Damage Count
Essential Facilities
Count
Estimated Business Interrupt
Estimated Building Loss
11-20 % Damage Count
21-30% Damage Count
31-40% Damage Count
41-50% Damage Count
State of Ohio Enhanced Hazard Mitigation Plan Rev. May 2014
Section 2: HIRA 105
Allen 108,437 $8,276,610 6 30 66 96 94 61 8 $182,460,000 $180,140,000Auglaize 46,699 $3,493,414 0 4 15 24 36 17 2 $52,160,000 $51,410,000Champaign 39,713 $2,778,965 0 10 11 16 3 1 0 $40,050,000 $12,160,000Clark 139,671 $10,893,369 0 35 56 89 49 115 0 $159,630,000 $158,040,000Clinton 43,058 $2,981,570 2 2 5 9 22 17 1 $43,340,000 $43,040,000Crawford 43,403 $3,556,521 0 7 12 15 37 46 0 $61,450,000 $60,960,000Darke 51,814 $3,766,740 0 3 8 23 45 39 0 $73,000,000 $2,540,000Defiance 38,432 $3,261,057 0 11 30 16 15 6 1 $54,630,000 $54,090,000Erie* 76,603 $7,149,397 14 349 986 161 649 400 3 $7,080,000 $671,720,000Fayette 28,117 $720,173 0 6 24 44 33 6 2 $350,000 $55,560,000Fulton 42,402 $3,729,167 0 1 6 12 9 7 0 $31,400,000 $31,140,000Hancock 74,538 $6,017,435 7 26 40 48 45 36 2 $171,970,000 $168,530,000Hardin 31,818 $729,078 0 5 8 15 11 6 0 $454,000 $29,719,000Henry 28,648 $2,157,169 0 1 11 8 11 2 0 $39,890,000 $39,090,000Huron 59,849 $4,320,061 0 3 14 26 45 29 0 $68,980,000 $68,650,000Logan 46,582 $3,496,616 1 10 9 6 9 5 0 $30,760,000 $30,280,000Lucas* 463,493 $39,329,470 15 152 319 384 682 372 7 $1,217,510,000 $1,209,200,000Madison 42,539 $993,168 0 4 17 29 35 25 0 $250,000 $44,830,000Marion 65,655 $949,651 0 8 24 69 49 35 6 $770,000 $73,150,000Mercer 40,666 $2,933,239 0 2 4 4 4 1 0 $32,760,000 $32,480,000Miami 101,256 $8,311,276 6 45 57 92 87 71 2 $225,490,000 $222,240,000Morrow 34,642 $604,955 0 2 4 9 11 2 0 $210,000 $35,210,000Ottawa* 40,945 $4,495,969 17 838 931 526 435 899 1 $5,002,000 $520,390,000Paulding 18,994 $1,432,929 0 0 12 226 42 80 1 $58,270,000 $57,860,000Preble 41,422 $2,966,577 0 9 17 25 28 22 0 $88,540,000 $88,230,000Putnam 34,377 $2,490,483 1 8 14 33 44 43 2 $102,650,000 $101,770,000Sandusky 60,071 $4,969,968 1 16 24 24 21 12 0 $80,410,000 $79,780,000Seneca 56,152 $1,708,396 0 7 26 47 67 40 0 $857,000 $123,924,000Shelby 48,990 $3,801,918 0 0 9 27 52 38 0 $65,690,000 $65,250,000Union 48,903 $1,013,990 0 2 19 40 50 32 1 $390,000 $56,720,000Van Wert 28,496 $2,055,854 0 3 27 39 33 10 0 $89,270,000 $88,200,000Williams 37,816 $3,190,059 0 6 18 32 42 15 0 $70,530,000 $69,580,000Wood 125,380 $10,501,105 2 31 39 57 105 27 2 $200,950,000 $193,080,000Wyandot 22,394 $711,737 0 3 10 11 15 4 0 $303,000 $33,858,000
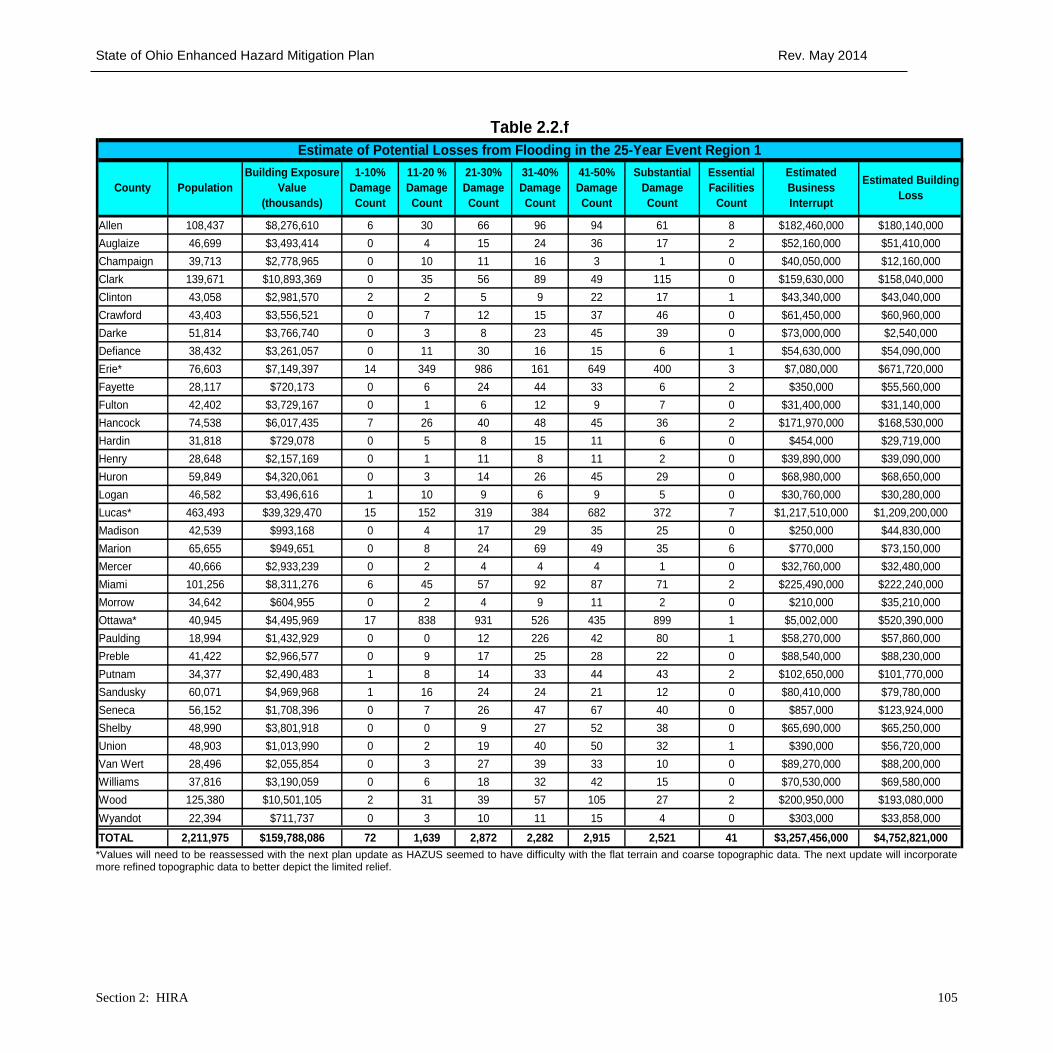
TOTAL 2,211,975 $159,788,086 72 1,639 2,872 2,282 2,915 2,521 41 $3,257,456,000 $4,752,821,000
11-20 % Damage Count
21-30% Damage Count
31-40% Damage Count
41-50% Damage Count
County PopulationBuilding Exposure
Value(thousands)
1-10% Damage Count
Table 2.2.fEstimate of Potential Losses from Flooding in the 25-Year Event Region 1
Substantial Damage Count
Essential Facilities
Count
Estimated Business Interrupt
Estimated Building Loss
*Values will need to be reassessed with the next plan update as HAZUS seemed to have difficulty with the flat terrain and coarse topographic data. The next update will incorporate more refined topographic data to better depict the limited relief.

State of Ohio Enhanced Hazard Mitigation Plan Rev. May 2014
Section 2: HIRA 106
Ashland 5,044 $983,692 0 4 8 14 22 23 1 $1,060,000 $68,630,000Ashtabula 100,767 $7,704,317 0 36 89 38 112 85 0 $130,370,000 $128,560,000Butler 363,184 $26,013,775 8 181 448 710 796 523 0 $916,250,000 $825,620,000Cuyahoga 1,275,709 $126,156,607 7 127 307 229 362 167 5 $2,550,000 $933,100,000Delaware 168,708 $2,648,854 1 9 22 35 88 108 2 $2,500,000 $142,790,000Fairfield 143,712 $2,408,997 0 70 120 188 129 39 0 $2,410,000 $212,350,000Franklin 1,150,122 $12,346,646 17 309 515 714 574 483 11 $18,180,000 $1,398,090,000Geauga 99,060 $7,865,765 0 5 4 8 3 0 1 $43,530,000 $43,240,000Greene 159,823 $11,674,521 4 33 41 56 33 25 1 $134,400,000 $131,530,000Hamilton 855,062 $72,577,343 11 101 117 231 365 603 7 $1,801,500,000 $1,788,860,000Knox 59,637 $1,551,108 9 43 32 53 22 10 4 $1,270,000 $210,650,000Lake 236,775 $19,802,188 0 238 480 118 344 219 0 $327,480,000 $325,000,000Licking 158,488 $3,341,506 6 53 91 122 155 126 4 $2,670,000 $270,130,000Lorain 305,707 $25,063,726 1 82 188 116 226 211 1 $483,740,000 $478,080,000Mahoning 236,735 $3,047,225 2 23 24 29 24 9 1 $1,290,000 $146,360,000Medina 174,035 $12,805,401 0 1 10 23 11 1 0 $59,190,000 $58,760,000Montgomery 532,562 $45,503,377 102 340 418 615 643 449 27 $1,220,730,000 $1,200,690,000Pickaway 54,734 $3,263,028 3 6 18 32 28 18 0 $69,670,000 $68,600,000Portage 157,530 $2,513,342 1 12 37 65 48 59 1 $940,000 $130,740,000Richland 124,490 $1,712,439 0 10 15 33 18 6 3 $930,000 $128,920,000Stark 379,466 $5,239,841 20 83 111 156 120 63 11 $5,310,000 $385,790,000Summit 542,405 $6,441,938 6 94 103 112 74 33 5 $4,140,000 $404,480,000Trumbull 210,157 $17,584,336 2 46 79 95 150 183 2 $82,120,000 $279,300,000Warren 210,712 $12,832,986 2 49 164 294 407 484 9 $416,910,000 $413,980,000Wayne 114,222 $1,981,029 1 12 10 23 16 7 1 $866,000 $106,208,000
TOTAL 7,818,846 $433,063,987 203 1,967 3,451 4,109 4,770 3,934 97 $5,730,006,000 $10,280,458,000
11-20 % Damage Count
21-30% Damage Count
31-40% Damage Count
41-50% Damage Count
County PopulationBuilding Exposure
Value(thousands)
1-10% Damage Count
Table 2.2.gEstimate of Potential Losses from Flooding in the 25-Year Event Region 2
Substantial Damage Count
Essential Facilities
Count
Estimated Business Interrupt
Estimated Building Loss

State of Ohio Enhanced Hazard Mitigation Plan Rev. May 2014
Section 2: HIRA 107
Adams 28,043 $682,584 0 0 3 6 43 501 2 $1,220,000 $147,910,000Athens 63,026 $1,765,399 1 22 42 86 138 272 6 $5,000,000 $446,570,000Belmont 68,066 $1,138,503 0 0 1 4 42 288 4 $950,000 $142,180,000Brown 44,033 $2,514,600 0 0 7 20 82 840 6 $289,840,000 $287,700,000Carroll 28,539 $730,209 0 19 36 53 32 40 1 $640,000 $58,150,000Clermont 196,364 $12,865,575 0 8 15 41 104 69 0 $231,030 $229,670Columbiana 107,722 $2,177,124 0 1 14 32 96 1,606 6 $3,730,000 $590,960,000Coshocton 35,767 $857,993 0 8 23 40 60 179 3 $1,290,000 $164,210,000Gallia 30,694 $1,220,816 1 12 38 56 161 618 5 $4,190,000 $388,090,000Guernsey 40,054 $1,107,630 0 18 15 30 35 53 4 $2,130,000 $142,590,000Harrison 15,268 $306,687 0 0 1 4 7 3 1 $190,000 $19,910,000Highland 42,178 $742,915 0 2 2 3 8 1 0 $370,000 $34,810,000Hocking 28,912 $946,995 0 5 18 33 33 34 6 $1,140,000 $84,380,000Holmes 41,854 $712,710 0 1 6 10 18 13 3 $330,000 $34,030,000Jackson 33,440 $611,569 3 7 4 11 2 2 0 $400,000 $32,890,000Jefferson 67,691 $1,932,238 0 4 28 104 368 1,699 19 $5,850,000 $694,310,000Lawrence 62,744 $2,930,308 1 71 263 585 1,211 3,640 20 $10,850,000 $1,349,080,000Meigs 22,838 $896,860 1 28 58 94 131 390 10 $2,200,000 $219,130,000Monroe 14,058 $1,887,497 0 12 100 64 415 1,029 12 $4,560,000 $630,250,000Morgan 14,288 $575,845 0 0 2 10 63 763 2 $1,130,000 $169,800,000Muskingum 84,884 $1,770,099 1 11 49 104 161 276 2 $2,260,000 $237,860,000Noble 14,311 $317,128 0 2 2 2 5 3 1 $760,000 $23,430,000Perry 35,359 $695,152 0 9 15 23 20 17 4 $520,000 $49,610,000Pike 27,722 $890,437 0 5 11 24 41 128 0 $2,070,000 $117,090,000Ross 75,972 $1,655,760 2 7 37 62 139 144 7 $3,520,000 $134,270,000Scioto 76,334 $2,448,603 0 18 52 114 386 1,327 10 $7,260,000 $635,040,000Tuscarawas 91,137 $2,142,377 5 55 67 132 140 266 1 $4,460,000 $317,550,000Vinton 13,228 $269,073 0 0 0 1 1 2 0 $60,000 $12,430,000Washington 61,048 $2,604,032 0 11 49 141 516 2,266 15 $10,700,000 $1,064,680,000TOTAL 1,465,574 $49,396,718 15 336 958 1,889 4,458 16,469 150 $367,851,030 $8,229,139,670
11-20 % Damage Count
21-30% Damage Count
31-40% Damage Count
41-50% Damage Count
County PopulationBuilding Exposure
Value(thousands)
1-10% Damage Count
Table 2.2.h.Estimate of Potential Losses from Flooding in the 25-Year Event Region 3
Substantial Damage Count
Essential Facilities
Count
Estimated Business Interrupt
Estimated Building Loss
State of Ohio Enhanced Hazard Mitigation Plan Rev. May 2014
Section 2: HIRA 108
Region 1 collectively has approximately $159,788,042,000 in total building exposure to flooding for the 1%-annual-chance event. A total of 3,374 structures are estimated to be substantially damaged, meaning damages that total 50 percent or more of the structures’ pre-flood market values. There are an estimated 75 critical facilities impacted, which include police, fire, hospitals and schools. The overall estimated building loss is expected to approach $6,189,370,000 with an additional $4,095,100,000 in business interruption. Changing to a 4%-annual-chance event (25-year flood), a total of 2,521 structures are estimated to be substantially damaged. There are an estimated 41 critical facilities impacted. Finally, the overall estimated building loss is projected to approach $4,752,821,000, with an additional $3,257,456,000 in business interruption. Region 2 collectively has $433,063,987,000 in total building exposure to flooding for the 100-year event. A total of 5,849 structures are estimated to be substantially damaged, meaning damages that total 50 percent or more of the structures’ pre-flood market values. There are an estimated 101 critical facilities impacted, which include police, fire, hospitals and schools. The overall estimated building loss should approach $11,913,408,000, with an additional $6,699,658,000 in business interruption. Changing to a 25-year event, a total of 3,934 structures are estimated to be substantially damaged. There are an estimated 97 critical facilities impacted. Finally, the overall estimated building loss is $10,280,458,000 with an additional $5,730,006,000 in business interruption. According to the HAZUS-MH runs, there appear to be more critical facilities impacted during a 25-year event than a 100-year event. We have no explanation for this occurrence. Region 3 collectively has $49,396,718,000 in total building exposure to flooding for the100-year event. A total of 20,127 structures are estimated to be substantially damaged, meaning damages that total 50 percent or more of the structures’ pre-flood market values. There are an estimated 176 critical facilities impacted, which include police, fire, hospitals and schools. The overall estimated building loss is expected to approach $10,448,120,700 with an additional $413,893,130 in business interruption. Changing to a 25-year event, a total of 16,469 structures are estimated to be substantially damaged. There are an estimated 150 critical facilities impacted. Finally, the overall estimated building loss should approach $8,229,139,670 with an additional $367,851,030 in business interruption.
STATE-OWNED AND STATE-LEASED CRITICAL FACILITIES VULNERABILITY ANALYSIS & LOSS ESTIMATION The estimates for losses to state-owned and state-leased critical facilities were developed using the DAS-maintained databases discussed in Section 2.1. An updated 1-percent-annual-chance floodplain shapefile was obtained from the ODNR so the most recent DFIRM data could be used for this analysis. Tables 2.2.i – k list regional exposure for state-owned critical and non-critical facilities, and Tables 2.2.l – n list regional exposure for state-leased critical and non-critical
State of Ohio Enhanced Hazard Mitigation Plan Rev. May 2014
Section 2: HIRA 109
facilities. Because first-floor elevations have not been collected for these structures, estimated damages cannot be calculated via depth/damage curves. Therefore, loss estimations are based on a 25-percent loss for each state-owned structure located in the special flood hazard area. For those state-owned structures located in a special flood hazard area AND FEMA-identified floodway, it is assumed that 50 percent damage will be incurred. It should be noted that floodways are not identified for every flood hazard area in the state. The assumptions used for loss estimation of state-owned structures were different than those used for state-leased facilities because replacement values are not known for leases. Considering annual rental costs are known for leased structures, loss estimation is based on loss of function for a damaged facility. For a 25-percent loss, the loss of function is assumed to be six months, and for a 50-percent loss, the loss of function is assumed to be one year. These loss-of-function quantities are based on values used by HAZUS-MH and FEMA’s Benefit-Cost Analysis software when evaluating loss of function for businesses. Region 1 has a total of 91 state-owned facilities in the flood hazard areas, and eight of those are located within the floodway. This represents over $33 million exposed to flooding, and approximately $725,777 in the destructive area of the floodway. Based on the loss estimation assumptions described herein, during a 1-percent-annual-chance flood, Region 1 would experience over $8.4 million in damages. Critical facilities in Region 1 represent 45 percent of the state-owned facilities exposed to flood hazard areas in this region, and four of those are located in the floodway. Over one-third of this exposure is in Mercer County, but none of these structures are in the floodway. Overall, this Region ranks second in estimated losses to state-owned critical facilities given a 1-percent-annual-chance flood when compared with Regions 2 and 3. This makes sense since Region 1 is characterized with a smaller percent of land area designated as flood-prone on FEMA FIRMs and/or DFIRMs. Concerning state-leased facilities in Region 1, there is a total of five structures exposed to flood hazards with one located in the floodway (Huron County). While all five of these structures are non-critical to recovery, during a 1-percent-annual-chance flood Ohio could expect over $95,000 in lost rent. This is lowest estimate of losses for state-leased facilities among the three regions discussed in this plan. Region 2 has a total of 94 state-owned facilities in the flood hazard areas, and eight of those are located within the floodway. This represents over $40 million exposed to flooding, with approximately $915,535 in the highest velocity of that flood-prone area—the floodway. Overall, this Region shows the highest estimated loss given a 1-percent-annual-chance flood when compared with the other two regions. The estimated losses for state-owned facilities in the flood fringe and floodway are over $10 million, which correlates with the high development and high population characteristics of Region 2.
State of Ohio Enhanced Hazard Mitigation Plan Rev. May 2014
Section 2: HIRA 110
Critical facilities in Region 2 represent 24 percent of the state-owned facilities exposed to flood hazard areas in this region, and eight of those are located in the floodway. Three-fourths of these structures are in Licking County and are mainly associated with the Department of Transportation. All of the state-owned critical facilities in Licking County are located within the floodway, which increases the risk of high losses during a major flood event. Overall, this Region ranks third in estimated losses to state-owned critical facilities given a 1-percent-annual-chance flood when compared with Regions 2 and 3. However, a large percentage (27 percent) of those losses is expected to occur in the floodway. Concerning state-leased facilities in Region 2, there is a total of five structures exposed to flood hazards with four located in the floodway (administrative facilities in Franklin County). Two of the aforementioned structures are critical in nature and represent an expected loss of $310,776 in rent. Taken as a whole, more losses are expected with state-leased facilities in Region 2 than Regions 1 and 3 combined. Region 3 has a total of 120 state-owned facilities in the flood hazard areas, and nine of those are located within the floodway. This represents an estimated $39.4 million exposed to flooding, with approximately $677,645 in the floodway. Overall, this Region shows the highest number of structures and the second highest dollars at risk among the three regions. While this region is sparsely populated compared to Region 2, Ohio could expect losses to exceed $10 million given a one-percent-annual-chance flood. There are 537 state-owned critical facilities in Region 3 (Appendix C), and 63 of those are located in identified flood hazard areas, which represents over $19 million in exposure. Nine structures are located within the floodway, and given a major flood, Ohio could expect losses to approach $340,000 in that high-hazard area alone. Collectively, state-owned critical facility loss estimates would climb above $5 million in Region 3, which is 75 percent higher than Regions 1 and 2 combined. Again, the majority of these critical facilities are associated with the Department of Transportation. Ten state-leased facilities are located in the flood hazard areas in Region 3, with one non-critical structure located in the floodway (Hocking County). Expected losses in this Region would approach $500,000, which ranks second among the three regions in the state. Additional building stock data for state-owned and state-leased facilities for counties in each Region can be found in Appendix C.
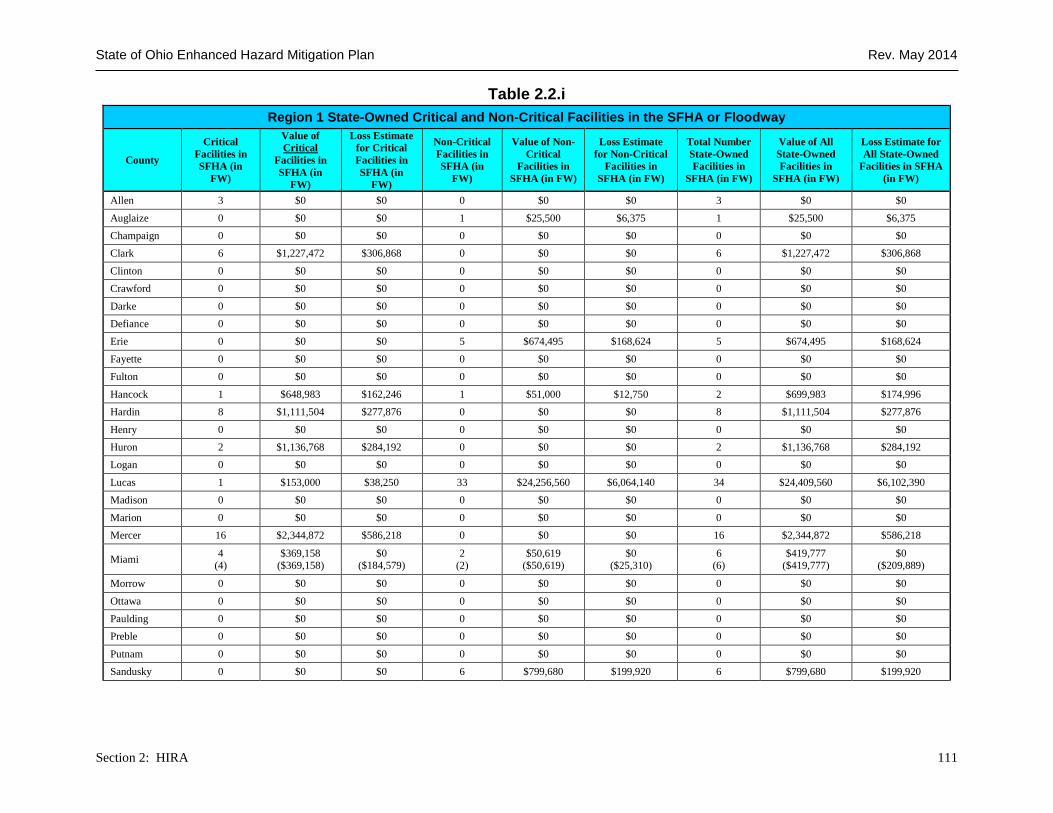
State of Ohio Enhanced Hazard Mitigation Plan Rev. May 2014
Section 2: HIRA 111
Table 2.2.i Region 1 State-Owned Critical and Non-Critical Facilities in the SFHA or Floodway
County
Critical Facilities in SFHA (in
FW)
Value of Critical
Facilities in SFHA (in
FW)
Loss Estimate for Critical Facilities in SFHA (in
FW)
Non-Critical Facilities in SFHA (in
FW)
Value of Non-Critical
Facilities in SFHA (in FW)
Loss Estimate for Non-Critical
Facilities in SFHA (in FW)
Total Number State-Owned Facilities in
SFHA (in FW)
Value of All State-Owned Facilities in
SFHA (in FW)
Loss Estimate for All State-Owned
Facilities in SFHA (in FW)
Allen 3 $0 $0 0 $0 $0 3 $0 $0
Auglaize 0 $0 $0 1 $25,500 $6,375 1 $25,500 $6,375 Champaign 0 $0 $0 0 $0 $0 0 $0 $0 Clark 6 $1,227,472 $306,868 0 $0 $0 6 $1,227,472 $306,868
Clinton 0 $0 $0 0 $0 $0 0 $0 $0 Crawford 0 $0 $0 0 $0 $0 0 $0 $0
Darke 0 $0 $0 0 $0 $0 0 $0 $0 Defiance 0 $0 $0 0 $0 $0 0 $0 $0 Erie 0 $0 $0 5 $674,495 $168,624 5 $674,495 $168,624
Fayette 0 $0 $0 0 $0 $0 0 $0 $0 Fulton 0 $0 $0 0 $0 $0 0 $0 $0
Hancock 1 $648,983 $162,246 1 $51,000 $12,750 2 $699,983 $174,996 Hardin 8 $1,111,504 $277,876 0 $0 $0 8 $1,111,504 $277,876
Henry 0 $0 $0 0 $0 $0 0 $0 $0 Huron 2 $1,136,768 $284,192 0 $0 $0 2 $1,136,768 $284,192 Logan 0 $0 $0 0 $0 $0 0 $0 $0
Lucas 1 $153,000 $38,250 33 $24,256,560 $6,064,140 34 $24,409,560 $6,102,390 Madison 0 $0 $0 0 $0 $0 0 $0 $0
Marion 0 $0 $0 0 $0 $0 0 $0 $0 Mercer 16 $2,344,872 $586,218 0 $0 $0 16 $2,344,872 $586,218
Miami 4 (4)
$369,158 ($369,158)
$0 ($184,579)
2 (2)
$50,619 ($50,619)
$0 ($25,310)
6 (6)
$419,777 ($419,777)
$0 ($209,889)
Morrow 0 $0 $0 0 $0 $0 0 $0 $0
Ottawa 0 $0 $0 0 $0 $0 0 $0 $0 Paulding 0 $0 $0 0 $0 $0 0 $0 $0 Preble 0 $0 $0 0 $0 $0 0 $0 $0
Putnam 0 $0 $0 0 $0 $0 0 $0 $0 Sandusky 0 $0 $0 6 $799,680 $199,920 6 $799,680 $199,920

State of Ohio Enhanced Hazard Mitigation Plan Rev. May 2014
Section 2: HIRA 112
Seneca 0 $0 $0 0 $0 $0 0 $0 $0
Shelby 0 $0 $0 2 (2)
$306,000 ($306,000)
$0 ($153,000)
2 (2)
$306,000 ($306,000)
$0 ($153,000)
Union 0 $0 $0 0 $0 $0 0 $0 $0 Van Wert 0 $0 $0 0 $0 $0 0 $0 $0
Williams 0 $0 $0 0 $0 $0 0 $0 $0 Wood 0 $0 $0 0 $0 $0 0 $0 $0
Wyandot 0 $0 $0 0 $0 $0 0 $0 $0
REGIONAL TOTALS
41 (4)
$6,991,757 ($369,158)
$1,655,650 ($184,579)
50 (4)
$26,163,854 ($356,619)
$6,451,809 ($178,310)
91 (8)
$33,155,611 ($725,777)
$8,107,458 ($362,889)
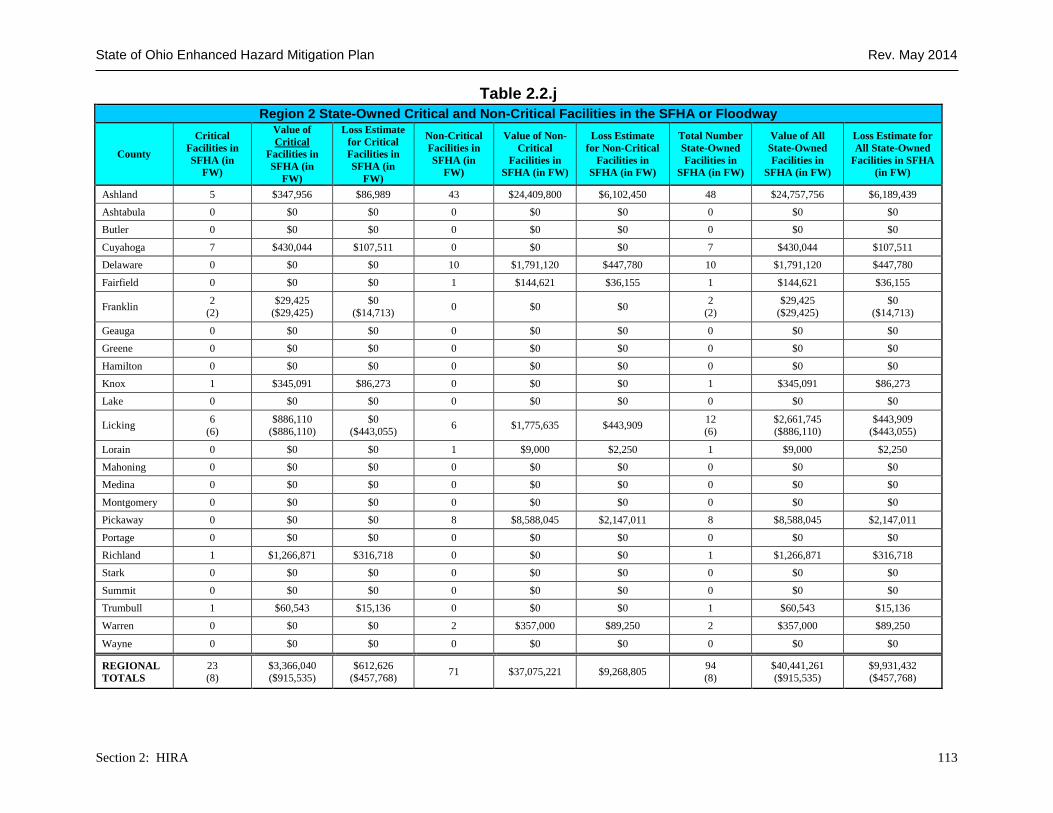
State of Ohio Enhanced Hazard Mitigation Plan Rev. May 2014
Section 2: HIRA 113
Table 2.2.j Region 2 State-Owned Critical and Non-Critical Facilities in the SFHA or Floodway
County
Critical Facilities in SFHA (in
FW)
Value of Critical
Facilities in SFHA (in
FW)
Loss Estimate for Critical Facilities in SFHA (in
FW)
Non-Critical Facilities in SFHA (in
FW)
Value of Non-Critical
Facilities in SFHA (in FW)
Loss Estimate for Non-Critical
Facilities in SFHA (in FW)
Total Number State-Owned Facilities in
SFHA (in FW)
Value of All State-Owned Facilities in
SFHA (in FW)
Loss Estimate for All State-Owned
Facilities in SFHA (in FW)
Ashland 5 $347,956 $86,989 43 $24,409,800 $6,102,450 48 $24,757,756 $6,189,439 Ashtabula 0 $0 $0 0 $0 $0 0 $0 $0 Butler 0 $0 $0 0 $0 $0 0 $0 $0
Cuyahoga 7 $430,044 $107,511 0 $0 $0 7 $430,044 $107,511 Delaware 0 $0 $0 10 $1,791,120 $447,780 10 $1,791,120 $447,780
Fairfield 0 $0 $0 1 $144,621 $36,155 1 $144,621 $36,155
Franklin 2 (2)
$29,425 ($29,425)
$0 ($14,713) 0 $0 $0 2
(2) $29,425
($29,425) $0
($14,713)
Geauga 0 $0 $0 0 $0 $0 0 $0 $0 Greene 0 $0 $0 0 $0 $0 0 $0 $0
Hamilton 0 $0 $0 0 $0 $0 0 $0 $0 Knox 1 $345,091 $86,273 0 $0 $0 1 $345,091 $86,273 Lake 0 $0 $0 0 $0 $0 0 $0 $0
Licking 6 (6)
$886,110 ($886,110)
$0 ($443,055) 6 $1,775,635 $443,909 12
(6) $2,661,745 ($886,110)
$443,909 ($443,055)
Lorain 0 $0 $0 1 $9,000 $2,250 1 $9,000 $2,250 Mahoning 0 $0 $0 0 $0 $0 0 $0 $0 Medina 0 $0 $0 0 $0 $0 0 $0 $0
Montgomery 0 $0 $0 0 $0 $0 0 $0 $0 Pickaway 0 $0 $0 8 $8,588,045 $2,147,011 8 $8,588,045 $2,147,011
Portage 0 $0 $0 0 $0 $0 0 $0 $0 Richland 1 $1,266,871 $316,718 0 $0 $0 1 $1,266,871 $316,718 Stark 0 $0 $0 0 $0 $0 0 $0 $0
Summit 0 $0 $0 0 $0 $0 0 $0 $0 Trumbull 1 $60,543 $15,136 0 $0 $0 1 $60,543 $15,136
Warren 0 $0 $0 2 $357,000 $89,250 2 $357,000 $89,250
Wayne 0 $0 $0 0 $0 $0 0 $0 $0
REGIONAL TOTALS
23 (8)
$3,366,040 ($915,535)
$612,626 ($457,768) 71 $37,075,221 $9,268,805 94
(8) $40,441,261 ($915,535)
$9,931,432 ($457,768)
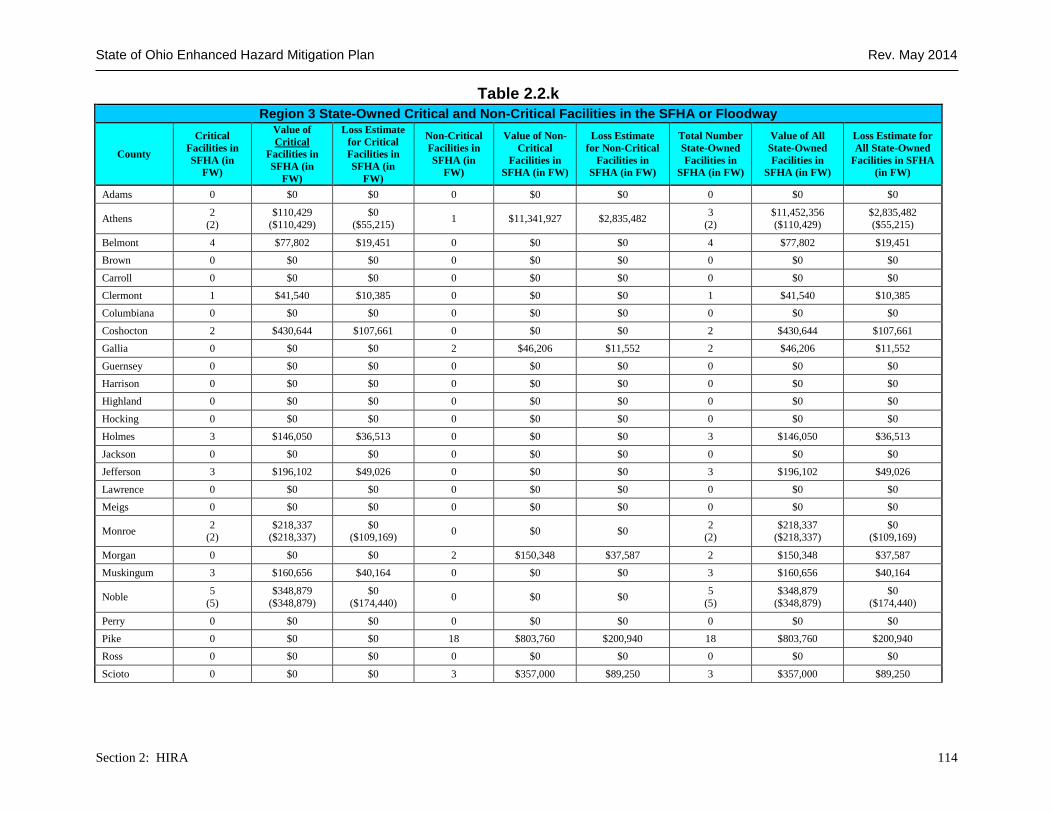
State of Ohio Enhanced Hazard Mitigation Plan Rev. May 2014
Section 2: HIRA 114
Table 2.2.k Region 3 State-Owned Critical and Non-Critical Facilities in the SFHA or Floodway
County
Critical Facilities in SFHA (in
FW)
Value of Critical
Facilities in SFHA (in
FW)
Loss Estimate for Critical Facilities in SFHA (in
FW)
Non-Critical Facilities in SFHA (in
FW)
Value of Non-Critical
Facilities in SFHA (in FW)
Loss Estimate for Non-Critical
Facilities in SFHA (in FW)
Total Number State-Owned Facilities in
SFHA (in FW)
Value of All State-Owned Facilities in
SFHA (in FW)
Loss Estimate for All State-Owned
Facilities in SFHA (in FW)
Adams 0 $0 $0 0 $0 $0 0 $0 $0
Athens 2 (2)
$110,429 ($110,429)
$0 ($55,215) 1 $11,341,927 $2,835,482 3
(2) $11,452,356 ($110,429)
$2,835,482 ($55,215)
Belmont 4 $77,802 $19,451 0 $0 $0 4 $77,802 $19,451 Brown 0 $0 $0 0 $0 $0 0 $0 $0
Carroll 0 $0 $0 0 $0 $0 0 $0 $0 Clermont 1 $41,540 $10,385 0 $0 $0 1 $41,540 $10,385 Columbiana 0 $0 $0 0 $0 $0 0 $0 $0
Coshocton 2 $430,644 $107,661 0 $0 $0 2 $430,644 $107,661 Gallia 0 $0 $0 2 $46,206 $11,552 2 $46,206 $11,552
Guernsey 0 $0 $0 0 $0 $0 0 $0 $0 Harrison 0 $0 $0 0 $0 $0 0 $0 $0 Highland 0 $0 $0 0 $0 $0 0 $0 $0
Hocking 0 $0 $0 0 $0 $0 0 $0 $0 Holmes 3 $146,050 $36,513 0 $0 $0 3 $146,050 $36,513
Jackson 0 $0 $0 0 $0 $0 0 $0 $0 Jefferson 3 $196,102 $49,026 0 $0 $0 3 $196,102 $49,026
Lawrence 0 $0 $0 0 $0 $0 0 $0 $0 Meigs 0 $0 $0 0 $0 $0 0 $0 $0
Monroe 2 (2)
$218,337 ($218,337)
$0 ($109,169) 0 $0 $0 2
(2) $218,337
($218,337) $0
($109,169)
Morgan 0 $0 $0 2 $150,348 $37,587 2 $150,348 $37,587 Muskingum 3 $160,656 $40,164 0 $0 $0 3 $160,656 $40,164
Noble 5 (5)
$348,879 ($348,879)
$0 ($174,440) 0 $0 $0 5
(5) $348,879
($348,879) $0
($174,440)
Perry 0 $0 $0 0 $0 $0 0 $0 $0 Pike 0 $0 $0 18 $803,760 $200,940 18 $803,760 $200,940 Ross 0 $0 $0 0 $0 $0 0 $0 $0
Scioto 0 $0 $0 3 $357,000 $89,250 3 $357,000 $89,250
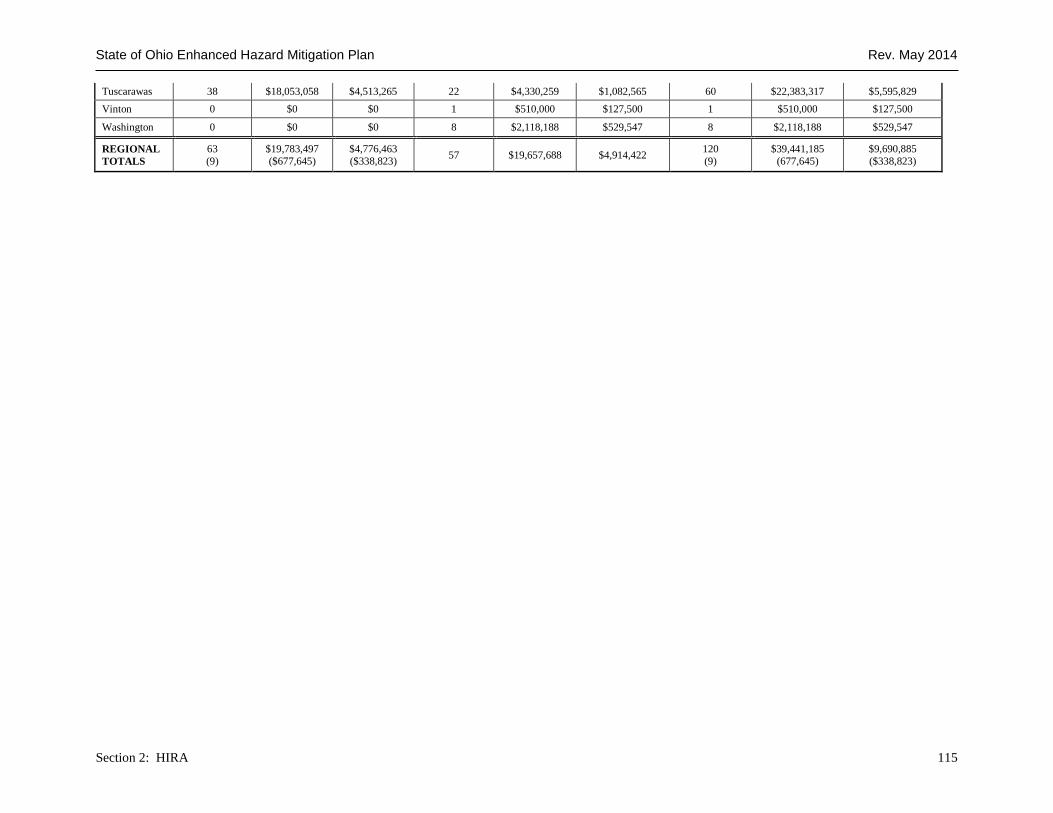
State of Ohio Enhanced Hazard Mitigation Plan Rev. May 2014
Section 2: HIRA 115
Tuscarawas 38 $18,053,058 $4,513,265 22 $4,330,259 $1,082,565 60 $22,383,317 $5,595,829 Vinton 0 $0 $0 1 $510,000 $127,500 1 $510,000 $127,500
Washington 0 $0 $0 8 $2,118,188 $529,547 8 $2,118,188 $529,547
REGIONAL TOTALS
63 (9)
$19,783,497 ($677,645)
$4,776,463 ($338,823) 57 $19,657,688 $4,914,422 120
(9) $39,441,185
(677,645) $9,690,885 ($338,823)
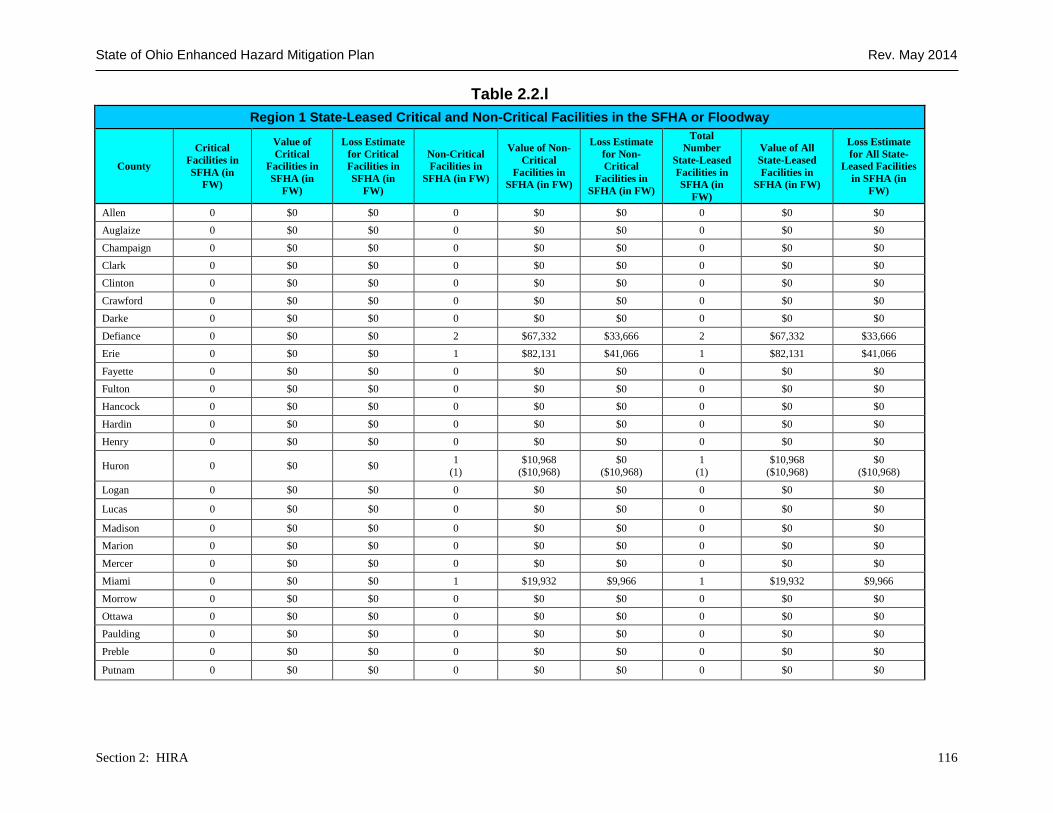
State of Ohio Enhanced Hazard Mitigation Plan Rev. May 2014
Section 2: HIRA 116
Table 2.2.l Region 1 State-Leased Critical and Non-Critical Facilities in the SFHA or Floodway
County
Critical Facilities in SFHA (in
FW)
Value of Critical
Facilities in SFHA (in
FW)
Loss Estimate for Critical Facilities in SFHA (in
FW)
Non-Critical Facilities in
SFHA (in FW)
Value of Non-Critical
Facilities in SFHA (in FW)
Loss Estimate for Non-Critical
Facilities in SFHA (in FW)
Total Number
State-Leased Facilities in SFHA (in
FW)
Value of All State-Leased Facilities in
SFHA (in FW)
Loss Estimate for All State-
Leased Facilities in SFHA (in
FW)
Allen 0 $0 $0 0 $0 $0 0 $0 $0 Auglaize 0 $0 $0 0 $0 $0 0 $0 $0
Champaign 0 $0 $0 0 $0 $0 0 $0 $0 Clark 0 $0 $0 0 $0 $0 0 $0 $0 Clinton 0 $0 $0 0 $0 $0 0 $0 $0
Crawford 0 $0 $0 0 $0 $0 0 $0 $0 Darke 0 $0 $0 0 $0 $0 0 $0 $0
Defiance 0 $0 $0 2 $67,332 $33,666 2 $67,332 $33,666 Erie 0 $0 $0 1 $82,131 $41,066 1 $82,131 $41,066
Fayette 0 $0 $0 0 $0 $0 0 $0 $0 Fulton 0 $0 $0 0 $0 $0 0 $0 $0 Hancock 0 $0 $0 0 $0 $0 0 $0 $0
Hardin 0 $0 $0 0 $0 $0 0 $0 $0 Henry 0 $0 $0 0 $0 $0 0 $0 $0
Huron 0 $0 $0 1 (1)
$10,968 ($10,968)
$0 ($10,968)
1 (1)
$10,968 ($10,968)
$0 ($10,968)
Logan 0 $0 $0 0 $0 $0 0 $0 $0
Lucas 0 $0 $0 0 $0 $0 0 $0 $0
Madison 0 $0 $0 0 $0 $0 0 $0 $0 Marion 0 $0 $0 0 $0 $0 0 $0 $0
Mercer 0 $0 $0 0 $0 $0 0 $0 $0 Miami 0 $0 $0 1 $19,932 $9,966 1 $19,932 $9,966
Morrow 0 $0 $0 0 $0 $0 0 $0 $0 Ottawa 0 $0 $0 0 $0 $0 0 $0 $0 Paulding 0 $0 $0 0 $0 $0 0 $0 $0
Preble 0 $0 $0 0 $0 $0 0 $0 $0
Putnam 0 $0 $0 0 $0 $0 0 $0 $0
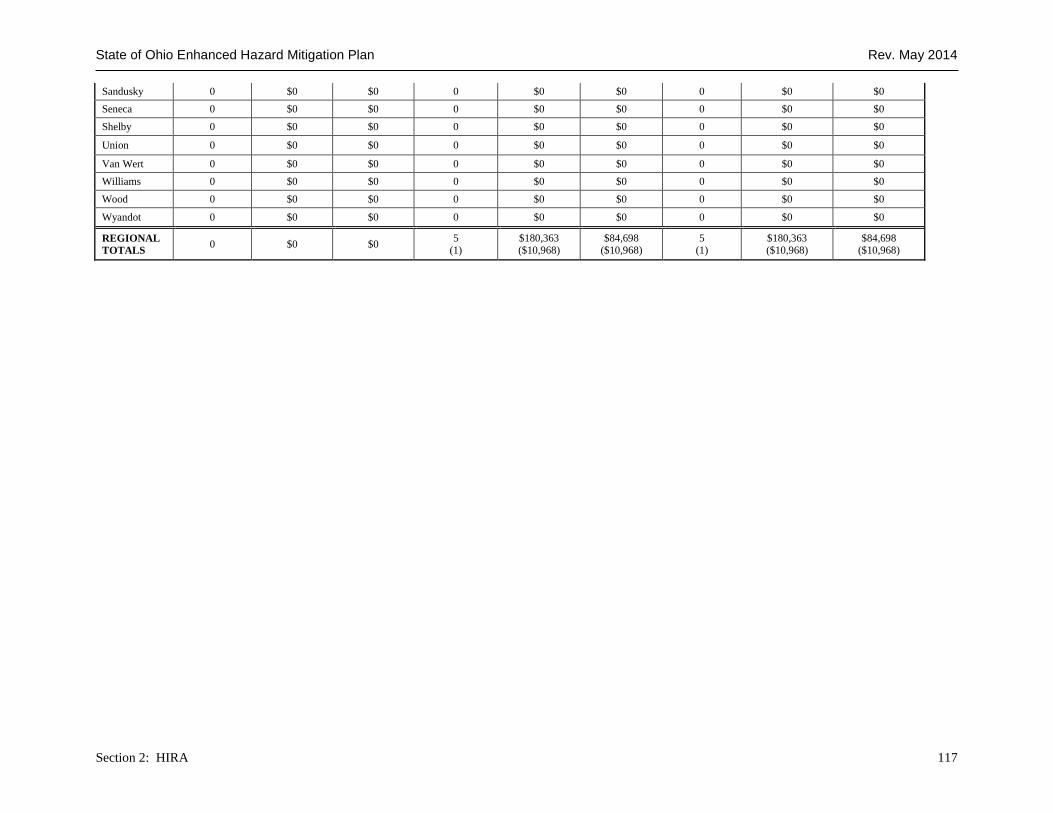
State of Ohio Enhanced Hazard Mitigation Plan Rev. May 2014
Section 2: HIRA 117
Sandusky 0 $0 $0 0 $0 $0 0 $0 $0 Seneca 0 $0 $0 0 $0 $0 0 $0 $0
Shelby 0 $0 $0 0 $0 $0 0 $0 $0
Union 0 $0 $0 0 $0 $0 0 $0 $0
Van Wert 0 $0 $0 0 $0 $0 0 $0 $0 Williams 0 $0 $0 0 $0 $0 0 $0 $0
Wood 0 $0 $0 0 $0 $0 0 $0 $0
Wyandot 0 $0 $0 0 $0 $0 0 $0 $0
REGIONAL TOTALS 0 $0 $0 5
(1) $180,363 ($10,968)
$84,698 ($10,968)
5 (1)
$180,363 ($10,968)
$84,698 ($10,968)
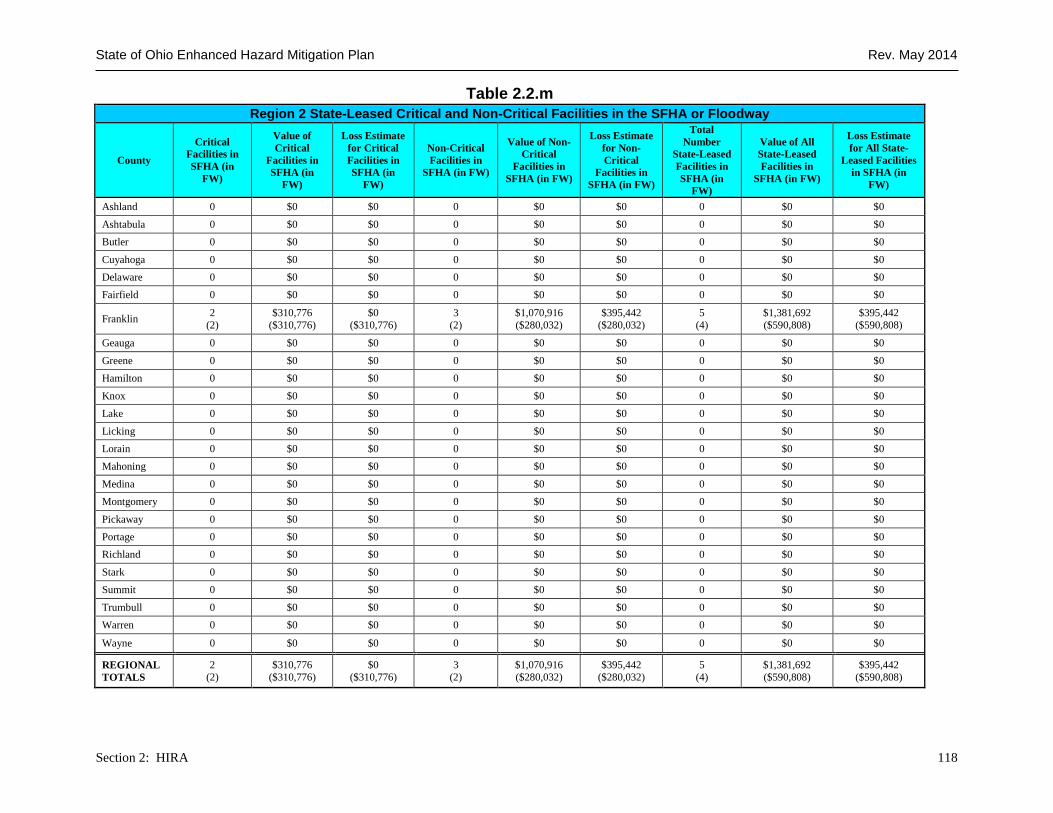
State of Ohio Enhanced Hazard Mitigation Plan Rev. May 2014
Section 2: HIRA 118
Table 2.2.m Region 2 State-Leased Critical and Non-Critical Facilities in the SFHA or Floodway
County
Critical Facilities in SFHA (in
FW)
Value of Critical
Facilities in SFHA (in
FW)
Loss Estimate for Critical Facilities in SFHA (in
FW)
Non-Critical Facilities in
SFHA (in FW)
Value of Non-Critical
Facilities in SFHA (in FW)
Loss Estimate for Non-Critical
Facilities in SFHA (in FW)
Total Number
State-Leased Facilities in SFHA (in
FW)
Value of All State-Leased Facilities in
SFHA (in FW)
Loss Estimate for All State-
Leased Facilities in SFHA (in
FW)
Ashland 0 $0 $0 0 $0 $0 0 $0 $0
Ashtabula 0 $0 $0 0 $0 $0 0 $0 $0 Butler 0 $0 $0 0 $0 $0 0 $0 $0
Cuyahoga 0 $0 $0 0 $0 $0 0 $0 $0 Delaware 0 $0 $0 0 $0 $0 0 $0 $0 Fairfield 0 $0 $0 0 $0 $0 0 $0 $0
Franklin 2 (2)
$310,776 ($310,776)
$0 ($310,776)
3 (2)
$1,070,916 ($280,032)
$395,442 ($280,032)
5 (4)
$1,381,692 ($590,808)
$395,442 ($590,808)
Geauga 0 $0 $0 0 $0 $0 0 $0 $0
Greene 0 $0 $0 0 $0 $0 0 $0 $0 Hamilton 0 $0 $0 0 $0 $0 0 $0 $0
Knox 0 $0 $0 0 $0 $0 0 $0 $0 Lake 0 $0 $0 0 $0 $0 0 $0 $0
Licking 0 $0 $0 0 $0 $0 0 $0 $0 Lorain 0 $0 $0 0 $0 $0 0 $0 $0 Mahoning 0 $0 $0 0 $0 $0 0 $0 $0
Medina 0 $0 $0 0 $0 $0 0 $0 $0 Montgomery 0 $0 $0 0 $0 $0 0 $0 $0
Pickaway 0 $0 $0 0 $0 $0 0 $0 $0 Portage 0 $0 $0 0 $0 $0 0 $0 $0 Richland 0 $0 $0 0 $0 $0 0 $0 $0
Stark 0 $0 $0 0 $0 $0 0 $0 $0 Summit 0 $0 $0 0 $0 $0 0 $0 $0
Trumbull 0 $0 $0 0 $0 $0 0 $0 $0 Warren 0 $0 $0 0 $0 $0 0 $0 $0
Wayne 0 $0 $0 0 $0 $0 0 $0 $0
REGIONAL TOTALS
2 (2)
$310,776 ($310,776)
$0 ($310,776)
3 (2)
$1,070,916 ($280,032)
$395,442 ($280,032)
5 (4)
$1,381,692 ($590,808)
$395,442 ($590,808)
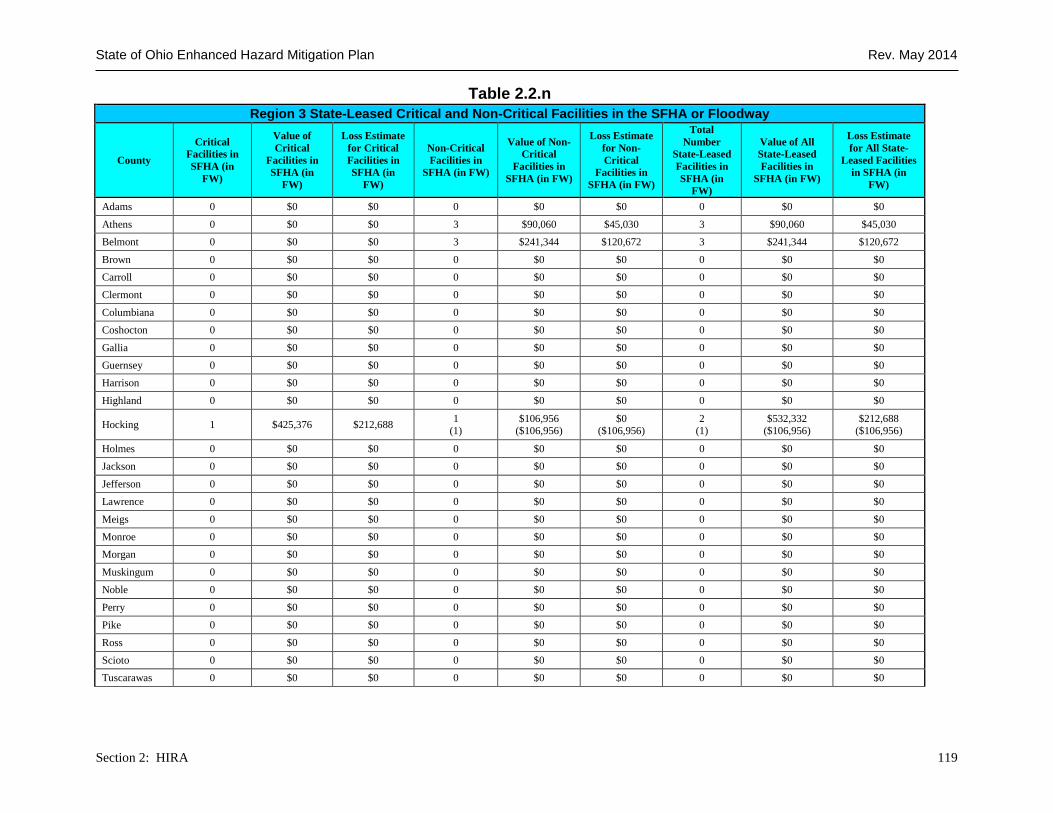
State of Ohio Enhanced Hazard Mitigation Plan Rev. May 2014
Section 2: HIRA 119
Table 2.2.n Region 3 State-Leased Critical and Non-Critical Facilities in the SFHA or Floodway
County
Critical Facilities in SFHA (in
FW)
Value of Critical
Facilities in SFHA (in
FW)
Loss Estimate for Critical Facilities in SFHA (in
FW)
Non-Critical Facilities in
SFHA (in FW)
Value of Non-Critical
Facilities in SFHA (in FW)
Loss Estimate for Non-Critical
Facilities in SFHA (in FW)
Total Number
State-Leased Facilities in SFHA (in
FW)
Value of All State-Leased Facilities in
SFHA (in FW)
Loss Estimate for All State-
Leased Facilities in SFHA (in
FW)
Adams 0 $0 $0 0 $0 $0 0 $0 $0
Athens 0 $0 $0 3 $90,060 $45,030 3 $90,060 $45,030 Belmont 0 $0 $0 3 $241,344 $120,672 3 $241,344 $120,672
Brown 0 $0 $0 0 $0 $0 0 $0 $0 Carroll 0 $0 $0 0 $0 $0 0 $0 $0 Clermont 0 $0 $0 0 $0 $0 0 $0 $0
Columbiana 0 $0 $0 0 $0 $0 0 $0 $0 Coshocton 0 $0 $0 0 $0 $0 0 $0 $0
Gallia 0 $0 $0 0 $0 $0 0 $0 $0 Guernsey 0 $0 $0 0 $0 $0 0 $0 $0 Harrison 0 $0 $0 0 $0 $0 0 $0 $0
Highland 0 $0 $0 0 $0 $0 0 $0 $0
Hocking 1 $425,376 $212,688 1 (1)
$106,956 ($106,956)
$0 ($106,956)
2 (1)
$532,332 ($106,956)
$212,688 ($106,956)
Holmes 0 $0 $0 0 $0 $0 0 $0 $0 Jackson 0 $0 $0 0 $0 $0 0 $0 $0
Jefferson 0 $0 $0 0 $0 $0 0 $0 $0 Lawrence 0 $0 $0 0 $0 $0 0 $0 $0
Meigs 0 $0 $0 0 $0 $0 0 $0 $0 Monroe 0 $0 $0 0 $0 $0 0 $0 $0 Morgan 0 $0 $0 0 $0 $0 0 $0 $0
Muskingum 0 $0 $0 0 $0 $0 0 $0 $0 Noble 0 $0 $0 0 $0 $0 0 $0 $0
Perry 0 $0 $0 0 $0 $0 0 $0 $0 Pike 0 $0 $0 0 $0 $0 0 $0 $0
Ross 0 $0 $0 0 $0 $0 0 $0 $0 Scioto 0 $0 $0 0 $0 $0 0 $0 $0 Tuscarawas 0 $0 $0 0 $0 $0 0 $0 $0
State of Ohio Enhanced Hazard Mitigation Plan Rev. May 2014
Section 2: HIRA 120
Vinton 0 $0 $0 0 $0 $0 0 $0 $0
Washington 0 $0 $0 2 $32,004 $16,002 2 $32,004 $16,002
REGIONAL TOTALS 1 $425,376 $212,688 9
(1) $470,363
($106,956) $181,704
($106,956) 10 (1)
$895,739 ($106,956)
$394,392 ($106,956)