Embed Size (px)
Citation preview

2015-2016 Performance Report South Plains College – 1
SOUT
H PLAINS COLLEGE
DREAMS PRECEDE R
EA
LITIES
EST. 1957
South Plains College improves each student’s life.
JULY 2017
2015-2016

2 – South Plains College 2015-2016 Performance Report

2015-2016 Performance Report South Plains College – 3
IntroductionSouth Plains College has made a significant commitment to accountability and quality with the adop-tion of a comprehensive institutional effectiveness program. This planning and assessment process is based on successful accomplishments of the College’s vision and mission within the context of an insti-tutional plan and as measured by student and institutional outcomes.
To ensure effectiveness, South Plains College has embraced a process of continuous organizational im-provement designed to improve the way the work of the institution is done and to accomplish the goals and objectives of the institution. The College has established a five-year strategic planning cycle that sets institutional goals based on a review of the College’s vision, mission, role and scope, and commit-ment statements. Each goal is reached through a set of priority objectives and outcomes. These goals, objectives and outcomes formulate the College’s Institutional Plan and provide the framework for the development of operational objectives on departmental and program levels.
A companion assessment process measures the extent to which the College accomplishes its mission through its Institutional Plan. The College has identified these indicators as Critical Success Factors (CSF) and Indicators of Institutional Effectiveness which map the College’s performance against high standards. The College uses this process to monitor its effectiveness and make necessary adjustments in programs and services.
A yearly update of the institutional effectiveness program is presented to the South Plains College Board of Regents. The document used to convey these annual results is the Institutional Effectiveness Per-formance Report. The 2015-2016 Performance Report presents the most recent available assessment results recorded for Year 1 of the 2015-2020 Institutional Plan.
For additional information about the institutional effectiveness program at South Plains College or to address questions, contact the Office of Institutional Advancement, South Plains College, 1401 S. Col-lege Ave., Levelland, Texas 79336. Telephone: (806) 716-2217 or (806) 716-2218.
4 – South Plains College 2015-2016 Performance Report
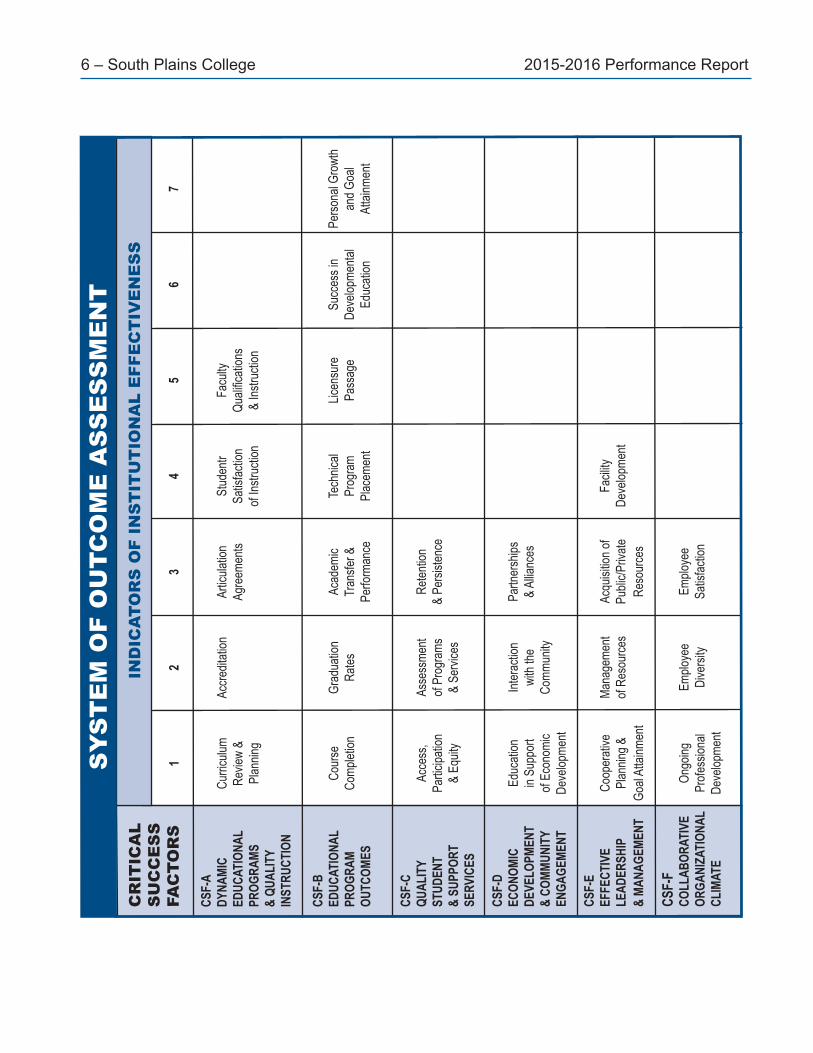
Critical Success Factorsand Indicators of Institutional EffectivenessInstitutional effectiveness is at the heart of what an institution does. South Plains College believes that its institu-tional effectiveness process will improve teaching and learning and contribute to the attainment of the College’s vision and validation of its mission.South Plains College measures its performance through an outcome-based assessment process. The College has identified six factors that are critical to its success as an institution of higher learning. Through these Critical Suc-cess Factors, SPC maintains a comprehensive evaluation system that measures the extent to which institutional goals and objectives are accomplished. These Critical Success Factors include the following.
Dynamic Educational Programs and Quality InstructionEducational Program OutcomesQuality Student and Support ServicesEconomic Development and Community InvolvementEffective Leadership and ManagementCollaborative Organizational Climate
To monitor progress and achievement in each of these areas, the College has identified 25 key performance indica-tors. Benchmarks (standards) have been developed for each of these measures. The results of performance are compared against these benchmarks and indicate how well the College has achieved its stated goals and objec-tives. The achievement of the identified Critical Success Factors is positive proof of the College’s effectiveness. This system of outcome assessment against critical success factors is illustrated in the table found on page 6.The indicators and benchmarks and their supporting measurement criteria are the observed, quantified or quali-fied results of performance. The collected data provide valuable information for those making decisions about the future direction of the College. The following section contains the identified benchmarks for evaluation and the review of data which describes the College’s performance in each critical success area. Interpretation of the find-ings is provided for each benchmark and if the standard was not met, an action plan for the next year (2014-15) has been developed.
Definition of Critical Success FactorsCSF A: DYNAMIC EDUCATIONAL PROGRAMS AND QUALITY INSTRUCTIONThe primary mission of South Plains College is to provide quality educational programs that prepare students for transfer to a university or to enter the workplace. Faculty design curricula to develop students’ competencies, skills and general knowledge in order to be successful in a rapidly changing world. The quality of instruction received by the student in these programs is an essential contributor to student success. At the same time, these curricula address the needs and expectations of transfer institutions, employers in business and industry, and ac-crediting bodies.
CSF B: EDUCATIONAL PROGRAM OUTCOMESThe success the educational program of South Plains College is measured by the success of students as they attain their goals and master learning outcomes. These goals may include remaining in college and graduating in a field of study, attaining specific job skills, successfully transferring to a university, obtaining employment in the work-place, obtaining licensure in certain professions, and performing well in their chosen careers.
2015-2016 Performance Report South Plains College – 5
CSF C: QUALITY STUDENT AND SUPPORT SERVICESSouth Plains College provides opportunities for widely diverse populations to access its educational programs and services. To successfully respond to these constituencies, the College continually assesses the needs and sat-isfaction levels of its students, alumni and employers. This information is used to provide appropriate programs, services, facilities, technology and resources to assist students in achieving their goals.
CSF D: ECONOMIC DEVELOPMENT & COMMUNITY ENGAGEMENTThe College supports economic and workforce development by providing educational programs that facilitate the training of entry-level workers and the retraining of current workers, based on local business and industry demands. South Plains College faculty, staff and students are actively involved in the community and its develop-ment. At the same time, the community is actively engaged in the events, activities and programs of the College.
CSF E: EFFECTIVE LEADERSHIP & MANAGEMENTTo be effective, the College must be accountable to the citizens and students who provide resources. This account-ability includes demonstrating effective leadership, cooperative planning, resource management, acquisition of resources and the development of facilities and technology in order to accomplish college goals.
CSF F: COLLABORATIVE ORGANIZATIONAL CLIMATEThe culture of an organization powerfully influences the performance of its members, the use of resources, and the quality of its programs and services. South Plains College seeks to promote a collaborative institutional climate through a shared institutional vision and common organizational values. Decision-making and resource allocation reflect these values and are influenced by broad input from college employees.
Comparative StandardsThe Texas Higher Education Coordinating Board has developed, in consultation with the state’s com-munity colleges, the Community College Accountability System which reports the performance of the state’s 50 community college districts in the areas of participation, success, and excellence. Key mea-sures and contextual measures for each of these areas are defined and data are collected and reported on an annual basis. South Plains College has incorporated a number of these measures and standards, as reported in this Institutional Effectiveness Performance Report, into its overall system of outcome as-sessment. As a result, SPC’s performance is compared against the performance of all Texas community colleges, as well as a Large College Peer Group that is based on enrollment. The following institutions form the Large College Peer Group.
Amarillo College, Amarillo, Dumas and Hereford, Texas Blinn College, Brenham and Bryan/College Station, Texas Central Texas College, Killeen, Texas Del Mar College, Corpus Christi, Texas Laredo Community College, Laredo, Texas Navarro College, Corsicana, Texas North Central Texas College, Gainesville, Texas South Plains College, Levelland, Lubbock and Plainview, Texas Tyler Junior College, Tyler, Texas
6 – South Plains College 2015-2016 Performance Report
SY
ST
EM
OF
OU
TCO
ME
AS
SE
SS
ME
NT
CR
ITIC
AL
IND
ICA
TOR
S O
F IN
ST
ITU
TIO
NA
L E
FFE
CT
IVE
NE
SS
SU
CC
ES
S
FAC
TOR
S
1 2
3 4
5 6
7
CSF-
ADY
NAMI
C Cu
rricu
lum
Accr
edita
tion
Artic
ulatio
n St
uden
tr Fa
culty
EDUC
ATIO
NAL
Revie
w&
Ag
reem
ents
Satisfaction
Qualification
sPR
OGRA
MS
Plan
ning
of In
struc
tion
& In
struc
tion
& QU
ALIT
YIN
STRU
CTIO
N
CSF-
BED
UCAT
IONA
L Co
urse
Gr
adua
tion
Acad
emic
Tech
nical
Licen
sure
Su
cces
s in
Pers
onal
Grow
thPR
OGRA
M Co
mple
tion
Rate
s Tr
ansfe
r &
Prog
ram
Pa
ssag
e De
velop
men
tal
and
Goal
OUTC
OMES
Pe
rform
ance
Pl
acem
ent
Ed
ucat
ion
Atta
inmen
t
CSF-
CQU
ALIT
Y Ac
cess
, As
sess
men
t Re
tent
ionST
UDEN
T Pa
rticip
ation
of
Pro
gram
s &
Pers
isten
ce&
SUPP
ORT
& Eq
uity
& Se
rvice
sSE
RVIC
ES
CSF-
DEC
ONOM
IC
Educ
ation
In
tera
ction
Pa
rtner
ships
DEVE
LOPM
ENT
in Su
ppor
t wi
th th
e &
Allia
nces
& CO
MMUN
ITY
of E
cono
mic
Com
mun
ityEN
GAGE
MENT
De
velop
men
t
CSF-
EEF
FECT
IVE
Coop
erat
ive
Man
agem
ent
Acqu
isitio
n of
Fa
cility
LEAD
ERSH
IP
Plan
ning
& of
Res
ourc
es
Publi
c/Priv
ate
Deve
lopm
ent
& MA
NAGE
MENT
Go
al At
tainm
ent
Re
sour
ces
CSF-
FCO
LLAB
ORAT
IVE
Ongo
ing
Emplo
yee
Emplo
yee
ORGA
NIZA
TION
AL
Prof
essio
nal
Dive
rsity
Sa
tisfa
ction
CLIM
ATE
Deve
lopm
ent

2015-2016 Performance Report South Plains College – 7
Index of Effectiveness IndicatorsCSF A: Dynamic Educational Programs and Quality Instruction A-1: Curriculum Review and Planning ........................................................................ 8 A-2: Accreditation ........................................................................................................... 8 A-3: Articulation Agreements ........................................................................................ 9 A-4: Student Satisfaction with Instruction ................................................................. 10 A-5: Faculty Qualifications and Instruction ...............................................................11CSF B: Educational Program Outcomes B-1: Course Completion ............................................................................................... 13 B-2: Graduation and Persistence Rates ...................................................................... 14 B-3: Academic Transfer and Performance .................................................................. 18 B-4: Technical Program Placement Rates ................................................................... 21 B-5: Licensure Passage and Skills Attainment .......................................................... 23 B-6: Success in Developmental Education ................................................................. 24 B-7: Personal Growth and Goal Attainment .............................................................. 25CSF C: Quality Student and Support Services C-1: Access, Participation and Equity ........................................................................ 26 C-2: Assessment of Programs and Services ............................................................... 31 C-3: Retention and Persistence .................................................................................... 33CSF D: Economic Development and Community Engagement D-1: Education in Support of Economic Development ........................................... 35 D-2: Interaction with the Community ........................................................................ 36 D-3: Partnerships and Alliances .................................................................................. 39CSF E: Effective Leadership and Management E-1: Cooperative Planning and Goal Attainment ..................................................... 40 E-2: Management of Resources ................................................................................... 40 E-3: Acquisition of Public/Private Resources ........................................................... 44 E-4: Facility Development ............................................................................................ 46CSF F: Collaborative Organizational Climate F-1: Ongoing Professional Development ................................................................... 47 F-2: Employee Diversity ............................................................................................... 48 F-3: Employee Satisfaction ........................................................................................... 50

8 – South Plains College 2015-2016 Performance Report
CSF A: Dynamic Educational Programs and Quality Instruction
Measurement A-1: Curriculum Review and PlanningBENCHMARK AND RESULTSA-1.1 The number of curriculum changes each year will be within the normal limits of variation
from year to year or the reasons for the extra variation will be known.NUMBER OF CURRICULUM CHANGES
ANNUAL REPORT TO THE BOARD
2010-11 2011-12 2012-13 2013-14 2014-15 2015-16
Curriculum Changes 212 119 153 222 283 256
Control Limit 297 297 297 297 297 297
SOURCE:OfficeofAcademicAffairs
Data Analysis: South Plains College provides an up-to-date curriculum to meet the needs of students, transfer institutions and service area constituents. The curriculum is reviewed annually by faculty and revisions are made accordingly. For 2015-16, curriculum revisions included 143 course revisions to align courses with the Academic Course Guide Manual and the Workforce Education Course Manual that is prescribed by the Texas Higher Education Coordinating Board. Additionally, revisions included 50 course additions and 63 course deletions. For the most recent period, the annual number of changes is below the upper control limit which is calculated as two standard deviations above the mean for a 23-year population trend.
The standard is met.
Measurement A-2: AccreditationBENCHMARK AND RESULTSA-2.1 Individual educational programs subject to accreditation by external review bodies shall
achieve re-accreditation status with a minimum of recommendations.
Status Report: All programs requiring accreditation and certification maintained good standing with external review bodies during the 2015-16 academic year. The following programs underwent a review during this period.
• Associate Degree Nursing Program received continuing program approval from the Texas Board of Nursing. Last date of review: April 2016.
• The Vocational Nursing Programs on Levelland Campus, Reese Center and Plainview Center each received continuing program approval by the Texas Board of Nursing. Date of last re-view: April 2016.
• The Fire Technology Program received continuing program approval from the Texas Commis-sion on Fire Protection for the Fire Academy and online course delivery: Date of last review: February 2016.
2015-2016 Performance Report South Plains College – 9
Measurement A-3: Articulation AgreementsBENCHMARK AND RESULTSA-3.1 South Plains College will maintain articulation agreements with 100% of all accredited uni-
versities in the College’s service area.
Status Report: South Plains College maintains active articulation agreements with the following accredited universities that are located within the College’s service area: Texas Tech University, Lubbock Christian University and Wayland Baptist University. Additionally, articulation agreements are maintained with the following universities located outside the College’s service area: West Texas A&M University, Eastern New Mexico University, Midwestern University, Sul Ross State University and Angelo State University.
The standard is met.
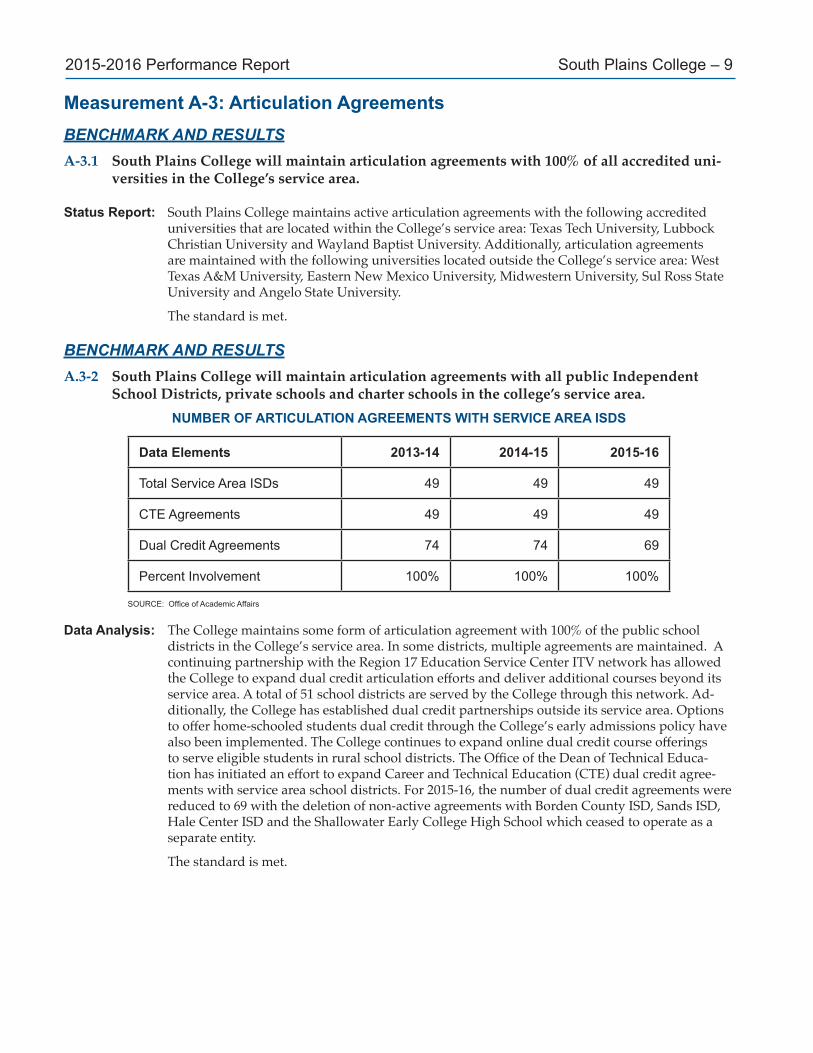
BENCHMARK AND RESULTSA.3-2 South Plains College will maintain articulation agreements with all public Independent
School Districts, private schools and charter schools in the college’s service area.NUMBER OF ARTICULATION AGREEMENTS WITH SERVICE AREA ISDS
Data Elements 2013-14 2014-15 2015-16
Total Service Area ISDs 49 49 49
CTE Agreements 49 49 49
Dual Credit Agreements 74 74 69
Percent Involvement 100% 100% 100%
SOURCE:OfficeofAcademicAffairs
Data Analysis: The College maintains some form of articulation agreement with 100% of the public school districts in the College’s service area. In some districts, multiple agreements are maintained. A continuing partnership with the Region 17 Education Service Center ITV network has allowed the College to expand dual credit articulation efforts and deliver additional courses beyond its service area. A total of 51 school districts are served by the College through this network. Ad-ditionally, the College has established dual credit partnerships outside its service area. Options to offer home-schooled students dual credit through the College’s early admissions policy have also been implemented. The College continues to expand online dual credit course offerings to serve eligible students in rural school districts. The Office of the Dean of Technical Educa-tion has initiated an effort to expand Career and Technical Education (CTE) dual credit agree-ments with service area school districts. For 2015-16, the number of dual credit agreements were reduced to 69 with the deletion of non-active agreements with Borden County ISD, Sands ISD, Hale Center ISD and the Shallowater Early College High School which ceased to operate as a separate entity.
The standard is met.

10 – South Plains College 2015-2016 Performance Report
Measurement A-4: Student Satisfaction with InstructionBENCHMARK AND RESULTSA-4.1 Students participating in the annual faculty evaluation survey will rate their level of satisfac-
tion with courses and instruction above average (3.5 or greater on 5.0 scale) in all categories.STUDENT EVALUATION OF INSTRUCTION
ANNUAL REPORT TO THE BOARD
Data Elements 2011-12 2012-13 2013-14 2014-15 2015-16
Rating of Face to Face Instruction 4.66 4.58 4.69 4.70 4.71
Rating of ITV Instruction 4.60 4.34 4.38 4.35 4.28
Rate of Online Instruction 4.20 4.44 4.15 4.28 4.17
Rating of Dual Credit Instruction 4.36 4.42 4.61 4.70 4.90
SOURCE:OfficeofAcademicAffairs
Data Analysis: Instruction is rated annually by students through the faculty evaluation process. SPC students continue to rate their overall level of satisfaction with instruction very high. Evaluation results are disaggregated by method of instructional delivery. For all methods of delivery, the mean rating for student satisfaction exceeds the 3.5 benchmark. Student evaluation of instruction is monitored by the Academic Affairs Office and the Faculty Evaluation Committee.
The standard is met.
BENCHMARK AND RESULTSA-4.2 Respondents to the Student Satisfaction Inventory (Noel-Levitz) will rate their satisfaction
with Instructional Effectiveness above average (5.0 or greater on a 7.0 scale) in all survey cat-egories.
STUDENT SATISFACTION WITH INSTRUCTIONAL EFFECTIVENESS
Survey Elements Fall 2011 Fall 2013 Fall 2015
Quality of instruction in classes 6.04 6.17 5.79
Faculty are fair and unbiased 5.88 6.20 5.66
Faculty provide timely feedback on academic progress 5.69 5.90 5.43
Technology and media use in classroom 5.94 6.24 5.71
Faculty are available to students outside of class 6.04 6.46 6.00
Classes deal with practical experiences and applications 5.94 6.21 5.63
Sufficientcourseswithinprogramofstudy 5.91 6.13 5.83
Composite Score 5.92 6.19 5.72
SOURCE:OfficeofInstitutionalEffectivenessandAssessment

2015-2016 Performance Report South Plains College – 11
Data Analysis: Student satisfaction with instructional effectiveness is measured by the Noel-Levitz Student Satisfaction Inventory which is administered to a sample of students in odd-numbered fall se-mesters. Respondents to the survey rate the level of perceived importance of the survey item as well as their level of satisfaction. Comparison of these two means provides a gap analysis that is used to identify strengths and challenges. For the instructional effectiveness sector, one item was identified as a strength for the Fall 2015 survey: Faculty are available to students outside of class. One item was identified as a challenge: Faculty provide timely feedback about my aca-demic progress. All mean ratings exceed the 5.0 benchmark.
The standard is met.
Measurement A-6: Faculty Qualifications and InstructionBENCHMARK AND RESULTSA-6.1 The College will employ full-time and part-time faculty members whose degrees are present-
ed by regionally accredited institutions, whose educational credentials meet or exceed the SACSCOC standards, or whose qualifications meet the standards for exceptions described in the SACSCOC Criteria.
PERCENTAGE OF FACULTY MEETING SACS QUALIFICATIONS CRITERIA
Data Elements 2014-15 2015-16 2016-17
Total Arts and Sciences Faculty 290 276 277
No. Meeting SACS Criteria 290 276 277
Percent Compliance 100% 100% 100%
Total Health Occupations Faculty 80 80 82
No. Meeting SACS Criteria 80 80 82
Percent Compliance 100% 100% 100%
Total Technical Education Faculty 93 94 93
No. Meeting SACS Criteria 88 89 89
Percent Compliance 94.6% 94.7% 95.7%
SOURCE:OfficeofAcademicAffairs
Data Analysis: South Plains College seeks to employ full-time and part-time faculty members who meet the educational and professional credentials expected by the College in compliance with SACSCOC requirements. Faculty who do not meet the criteria are required to demonstrate progress toward meeting the requirements as a condition of employment. Faculty credentials are reviewed by Instructional Deans and the Vice President for Academic Affairs on an annual basis. For the years reported, 100% of faculty members in the Arts and Sciences Division and the Health Oc-cupations Division met the credential requirements or had sufficient justifications on file to meet the SACSCOC criteria. The four technical faculty members who did not meet credential require-ments are seeking additional education to meet the standards. Instructional Division Deans will continue to monitor the educational credentials of faculty members and progress made on faculty educational plans to meet the SACSCOC criteria.
The standard is met.
12 – South Plains College 2015-2016 Performance Report
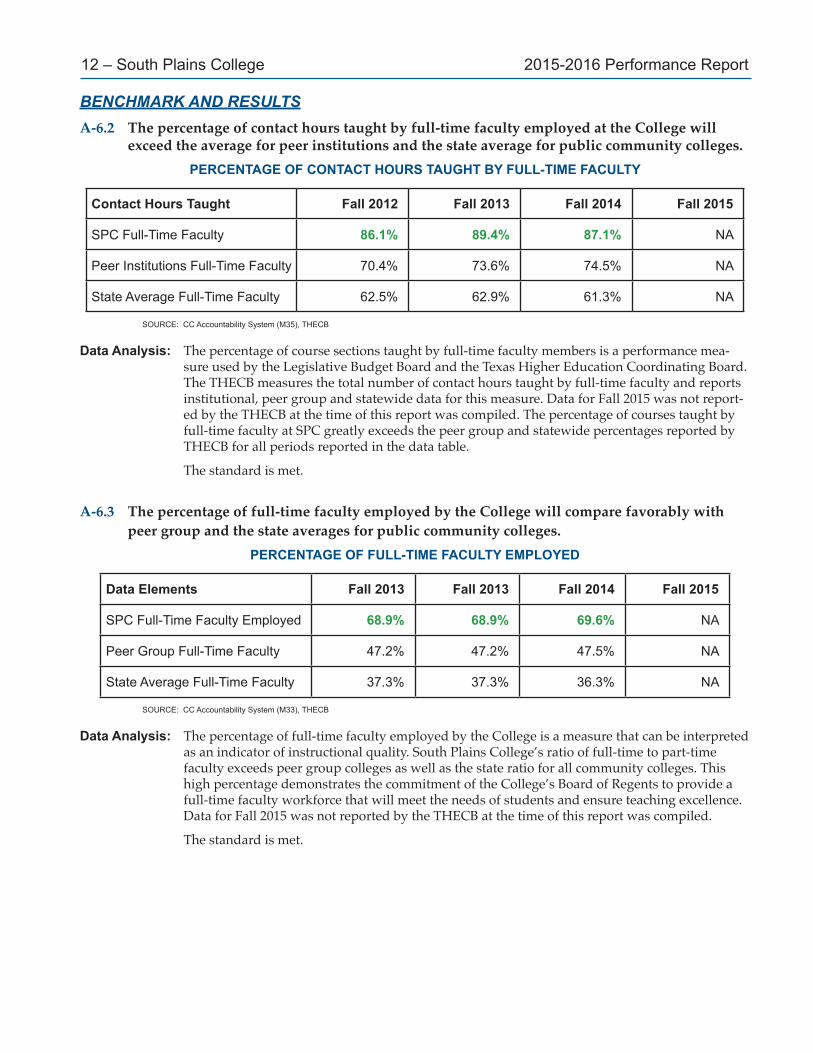
BENCHMARK AND RESULTSA-6.2 The percentage of contact hours taught by full-time faculty employed at the College will
exceed the average for peer institutions and the state average for public community colleges.PERCENTAGE OF CONTACT HOURS TAUGHT BY FULL-TIME FACULTY
Contact Hours Taught Fall 2012 Fall 2013 Fall 2014 Fall 2015
SPC Full-Time Faculty 86.1% 89.4% 87.1% NA
Peer Institutions Full-Time Faculty 70.4% 73.6% 74.5% NA
State Average Full-Time Faculty 62.5% 62.9% 61.3% NA
SOURCE: CC Accountability System (M35), THECB
Data Analysis: The percentage of course sections taught by full-time faculty members is a performance mea-sure used by the Legislative Budget Board and the Texas Higher Education Coordinating Board. The THECB measures the total number of contact hours taught by full-time faculty and reports institutional, peer group and statewide data for this measure. Data for Fall 2015 was not report-ed by the THECB at the time of this report was compiled. The percentage of courses taught by full-time faculty at SPC greatly exceeds the peer group and statewide percentages reported by THECB for all periods reported in the data table.
The standard is met.
A-6.3 The percentage of full-time faculty employed by the College will compare favorably with peer group and the state averages for public community colleges.
PERCENTAGE OF FULL-TIME FACULTY EMPLOYED
Data Elements Fall 2013 Fall 2013 Fall 2014 Fall 2015
SPC Full-Time Faculty Employed 68.9% 68.9% 69.6% NA
Peer Group Full-Time Faculty 47.2% 47.2% 47.5% NA
State Average Full-Time Faculty 37.3% 37.3% 36.3% NA
SOURCE: CC Accountability System (M33), THECB
Data Analysis: The percentage of full-time faculty employed by the College is a measure that can be interpreted as an indicator of instructional quality. South Plains College’s ratio of full-time to part-time faculty exceeds peer group colleges as well as the state ratio for all community colleges. This high percentage demonstrates the commitment of the College’s Board of Regents to provide a full-time faculty workforce that will meet the needs of students and ensure teaching excellence. Data for Fall 2015 was not reported by the THECB at the time of this report was compiled.
The standard is met.

2015-2016 Performance Report South Plains College – 13
A-6.4 The College’s FTE student to FTE faculty ratio will compare favorably with peer group and state averages for public community colleges.
FTE STUDENT TO FTE FACULTY RATIO
Data Elements Fall 2012 Fall 2013 Fall 2014 Fall 2015
SPC Student/Faculty Ratio 21:1 20:1 21:1 20:1
Peer Group Student/Faculty Ratio 21:1 21:1 21:1 20:1
State Student/Faculty Ratio 20:1 20:1 20:1 20:1
SOURCE: CC Accountability System (M34), THECB
Data Analysis: South Plains College’s full-time-equivalent student to full-time equivalent faculty ratio is equal to the peer college group and state community college averages for Fall 2015.
The standard is met.
CSF B: Educational Program Outcomes
Measurement B-1: Course CompletionBENCHMARK AND RESULTSB-1.1 South Plains College will maintain a course completion rate of not more than 5 percentage
points below peer group or state averages for community colleges.PERCENTAGE OF COURSE COMPLETERS
Data Elements Fall 2012 Fall 2013 Fall 2014 Fall 2015
SPC Course Completers 92.3% 91.7% 92.1% 91.6%
Peer Group Course Completers 88.9% 88.1% 88.3% 90.2%
State Average Course Completers 88.8% 88.9% 89.0% 90.6%
SOURCE: LBB Performance Measures, CC Accountability System (M25), THECB
Data Analysis: The state performance measures for two-year institutions includes the percentage of state fund-ed contact hours that are completed during the fall semester. Contact hours for students receiv-ing grades of A, B, C, D and F are counted as course completion. South Plains College’s course completion rate has been on par with the Large College Peer Group and the state averages. For Fall 2015, the College’s course completion rate declined slightly by 0.5 percentage points. For this term, the College’s rate exceeded the peer group and statewide rates.
The standard is met.

14 – South Plains College 2015-2016 Performance Report
Measurement B-2: Graduation and Persistence RatesBENCHMARK AND RESULTSB-2.1 The 6-year graduation / persistence rate of first-time, full-time, credential seeking undergrad-
uates will not be more than 5 percentage points below the peer group and statewide rates for public community colleges.
6-YEAR GRADUATION / PERSISTENCE RATE FOR FIRST-TIME, FULL-TIME STUDENTS
Data Elements FY 2013Fall 2007 Cohort
FY 2014Fall 2008 Cohort
FY 2015Fall 2009 Cohort
FY 2016Fall 2010 Cohort
SPC Graduation/Persistence Rate 42.3% 44.4% 44.0% 40.7%
Peer Group Rate 43.3% 43.8% 42.5% 40.8%
Statewide CC Rate 43.1% 43.6% 42.2% 41.1%
SOURCE: CC Accountability System (M10), THECB
Data Analysis: The percent of first-time, full-time credential seeking students who have graduated or who are still enrolled in a Texas public or private institution of higher education is tracked as a perfor-mance measure by the THECB. Students who transferred to out-of-state institutions are not tracked. SPC’s graduation/persistence rate has declined by 3.7 percentage points for the past two reporting periods. For all Cohorts reported, the graduation/persistence rate for SPC has been within a range of acceptable variance or has exceeded the peer group and state rates.
The standard is met.
Action Plan: Improving graduation rates and student goal attainment are priority objectives in the College’s Institutional Plan and its Quality Enhancement Plan. Improvements to the advisement sys-tem and development of individual educational plans for students are being made to address performance in this area. A significant number of students eligible for graduation transfer from SPC without applying for graduation. Strategies to encourage eligible students to apply for a degree or certificate will continue to be developed and implemented. The Admissions and Re-cords Office has a system in place to contact students who are nearing completion of certificate and associate degrees to encourage them to apply for graduation. Degree Audit is targeted for improvement to support an automatic graduation policy.

2015-2016 Performance Report South Plains College – 15
BENCHMARK AND RESULTSB-2.2 The 3, 4 and 6-year graduation rates of first-time, full-time credential seeking undergradu-
ates will not be more than 5 percentage points below the peer group and statewide rates for public community colleges.
3, 4, AND 6-YEAR GRADUATION RATES FOR FIRST-TIME, FULL-TIME STUDENTS
Student Cohorts SPC Rates Peer Rates State Rate
FY 2016
3-Year Graduation Rate (Fall 2013) 17.7% 16.0% 18.1%
4-Year Graduation Rate (Fall 2012) 24.4% 24.1% 24.3%
6-Year Graduation Rate (Fall 2010) 32.9% 32.4% 32.3%
FY 2015
3-Year Graduation Rate (Fall 2012) 17.8% 14.8% 16.2%
4-Year Graduation Rate (Fall 2011) 25.1% 21.2% 22.1%
6-Year Graduation Rate (Fall 2009) 33.7% 33.4% 32.6%
FY 2014
3-Year Graduation Rate (Fall 2011) 18.9% 14.0% 15.0%
4-Year Graduation Rate (Fall 2010) 23.8% 21.0% 20.7%
6-Year Graduation Rate (Fall 2008) 35.9% 34.2% 32.9%
FY 2013
3-Year Graduation Rate (Fall 2010) 18.3% 14.0% 14.2%
4-Year Graduation Rate (Fall 2011) 22.6% 20.7% 20.7%
6-Year Graduation Rate (Fall 2007) 32.9% 32.8% 32.0%
SOURCE: CC Accountability System (M11), THECB
Data Analysis: First-time, full-time credential seeking student cohorts are tracked to degree/certificate comple-tion at 3, 4 and 6-year intervals. For all period reported, SPC’s graduation rates at these points exceed the Large College Peer Group and statewide averages for all public community colleges for all three student cohorts.
The standard is met for the reported periods.
Action Plan: Improving graduation rates and student goal attainment are priority objectives in the College’s Institutional Plan and its Quality Enhancement Plan. Improvements to the advisement sys-tem and development of individual educational plans for students are being made to address performance in this area. A significant number of students eligible for graduation transfer from SPC without applying for graduation. Strategies to encourage eligible students to apply for a degree or certificate will continue to be developed and implemented. The Admissions and Re-cords Office has a system in place to contact students who are nearing completion of certificate and associate degrees to encourage them to apply for graduation. Degree Audit is targeted for improvement to support an automatic graduation policy.
16 – South Plains College 2015-2016 Performance Report
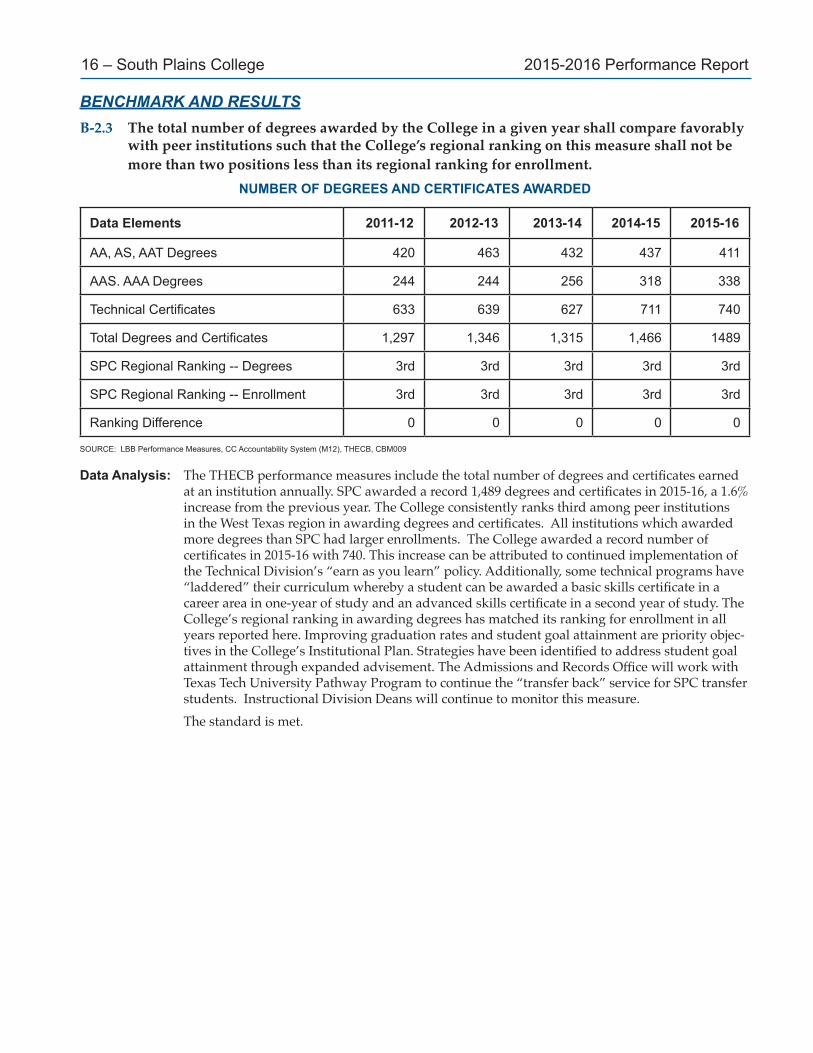
BENCHMARK AND RESULTSB-2.3 The total number of degrees awarded by the College in a given year shall compare favorably
with peer institutions such that the College’s regional ranking on this measure shall not be more than two positions less than its regional ranking for enrollment.
NUMBER OF DEGREES AND CERTIFICATES AWARDED
Data Elements 2011-12 2012-13 2013-14 2014-15 2015-16
AA, AS, AAT Degrees 420 463 432 437 411
AAS. AAA Degrees 244 244 256 318 338
TechnicalCertificates 633 639 627 711 740
TotalDegreesandCertificates 1,297 1,346 1,315 1,466 1489
SPC Regional Ranking -- Degrees 3rd 3rd 3rd 3rd 3rd
SPC Regional Ranking -- Enrollment 3rd 3rd 3rd 3rd 3rd
Ranking Difference 0 0 0 0 0
SOURCE: LBB Performance Measures, CC Accountability System (M12), THECB, CBM009
Data Analysis: The THECB performance measures include the total number of degrees and certificates earned at an institution annually. SPC awarded a record 1,489 degrees and certificates in 2015-16, a 1.6% increase from the previous year. The College consistently ranks third among peer institutions in the West Texas region in awarding degrees and certificates. All institutions which awarded more degrees than SPC had larger enrollments. The College awarded a record number of certificates in 2015-16 with 740. This increase can be attributed to continued implementation of the Technical Division’s “earn as you learn” policy. Additionally, some technical programs have “laddered” their curriculum whereby a student can be awarded a basic skills certificate in a career area in one-year of study and an advanced skills certificate in a second year of study. The College’s regional ranking in awarding degrees has matched its ranking for enrollment in all years reported here. Improving graduation rates and student goal attainment are priority objec-tives in the College’s Institutional Plan. Strategies have been identified to address student goal attainment through expanded advisement. The Admissions and Records Office will work with Texas Tech University Pathway Program to continue the “transfer back” service for SPC transfer students. Instructional Division Deans will continue to monitor this measure.
The standard is met.

2015-2016 Performance Report South Plains College – 17
BENCHMARK AND RESULTSB-2.4 The percentage ethnicity of graduates at the College will be within three percentage points
parity of the percentage of ethnicity of degree-seeking student enrollment.PERCENTAGE OF GRADUATES BY ETHNICITY
Annual Data Elements FY 2012 FY 2013 FY 2014 FY 2015 FY 2016
Percent White Graduates 54.9% 51.8% 48.9% 47.6% 45.1%
Percent White Enrollment (Credit) 53.6% 51.6% 49.5% 48.3% 48.2%
Variance +1.3 +0.2 -0.7 -0.7 -3.1
Percent African-American Graduates 4.8% 4.2% 4.9% 5.4% 5.4%
Percent African-American Enrollment (Credit) 6.1% 6.8% 7.0% 7.4% 6.7%
Variance -1.3 -2.6 -2.1 -2.0 -1.3
Percent Hispanic Graduates 36.2% 39.5% 40.6% 43.7% 44.9%
Percent Hispanic Enrollment (Credit) 35.4% 37.9% 39.7% 39.7% 40.3%
Variance +0.8 +1.6% +0.9 +4.0% +4.6
Percent Other Ethnic Graduates 4.1% 4.5% 5.5% 3.3% 4.6%
Percent Other Ethnic Enrollment (Credit) 4.9% 3.8% 3.7% 3.3% 4.9%
Variance -0.8 +0.7 +1.8 0.0 -0.3
SOURCE: CC Accountability System (M12, M4), THECB
Data Analysis: With the exception of white graduates in FY 2016, the percentage of graduates by ethnicity is within three percentage points parity of the percentage of ethnicity of degree-seeking student enrollment. For Hispanic students, the percentage of graduates consistently exceeds the percent-age of students enrolled.
The standard is not met for white graduates.
Action Plan: Improving graduation rates and student goal attainment are priority objectives in the College’s Institutional Plan and its Quality Enhancement Plan. Improvements to the advisement system and development of individual educational plans for students are being made to address per-formance in this area. A significant number of students eligible for graduation transfer from SPC without applying for graduation. This group of students tends to be characterized by a higher proportion of white students. Strategies to encourage eligible students to apply for a degree or certificate will continue to be developed and implemented. The Admissions and Records Office has a system in place to contact students who are nearing completion of certificate and associate degrees to encourage them to apply for graduation. Degree Audit is targeted for improvement to support an automatic graduation policy.

18 – South Plains College 2015-2016 Performance Report
Measurement B-3: Academic Transfer and PerformanceBENCHMARK AND RESULTSB-3.1 The transfer rate of first-time students to a university will not be more than 5 percentage
points below peer group and statewide averages for public community colleges.UNIVERSITY TRANSFER RATE FOR FTIC STUDENTS
Data Elements FY 2013Fall 2007 Cohort
FY 2014Fall 2008 Cohort
FY 2015Fall 2009 Cohort
FY 2016Fall 2010 Cohort
SPC Transfer Rate 28.7% 26.4% 24.7% 24.9%
Peer Group Transfer Rate 28.8% 26.5% 23.9% 22.4%
Statewide Transfer Rate 26.0% 25.0% 22.5% 22.5%
SOURCE: CC Accountability System (M13), THECB
Data Analysis: The THECB tracks students entering college for the first time at a two-year institution, who are not concurrently enrolled at a four-year institution, until they transfer to a four-year institution for the first time, or until they complete an award at the two-year college. Cohorts of first-time students who started are followed for six years. For the data presented in the above table, South Plains College’s transfer rate is within a range of acceptable variance with the peer group and the statewide average. For FY2016, the SPC transfer rate exceeds the two comparative groups. Appropriate personnel will continue to monitor transfer rates and will work to strengthen trans-fer pathways to the region’s universities.
The standard is met. BENCHMARK AND RESULTSB-3.2 The number of student transfers to other public institutions of higher education within the
state will compare favorably with peer institutions such that the College’s ranking for this measure will not be more than two positions less than its ranking for enrollment.
NUMBER OF FTIC STUDENTS WHO TRANSFER
Data Elements FY 2013Fall 2007 Cohort
FY 2014Fall 2008 Cohort
FY 2015Fall 2009 Cohort
FY 2016Fall 2010 Cohort
Number of SPC Students who Transfer 549 476 463 500
SPC Regional Ranking - Transfers 2nd 2nd 2nd 2nd
SPC Regional Ranking - Enrollment 3rd 3rd 3rd 3rd
Ranking Difference +1 +1 +1 +1
SOURCE: CC Accountability System (M13), THECB; LBB Performance Measures, THECB
Data Analysis: The THECB tracks students entering college for the first time at a two-year institution, who are not concurrently enrolled at a four-year institution, until they transfer to a four-year institution for the fist time, or until they complete an award at the two-year college. Cohorts of first-time students are followed for six years. For the Cohorts reported in the table above, South Plains College ranks second among the West Texas Region’s community colleges in the number of students transferring to university, while ranking third in total enrollment. Only El Paso Com-munity College transfers a higher number of students than SPC for the years reported above.
The standard is met.
2015-2016 Performance Report South Plains College – 19
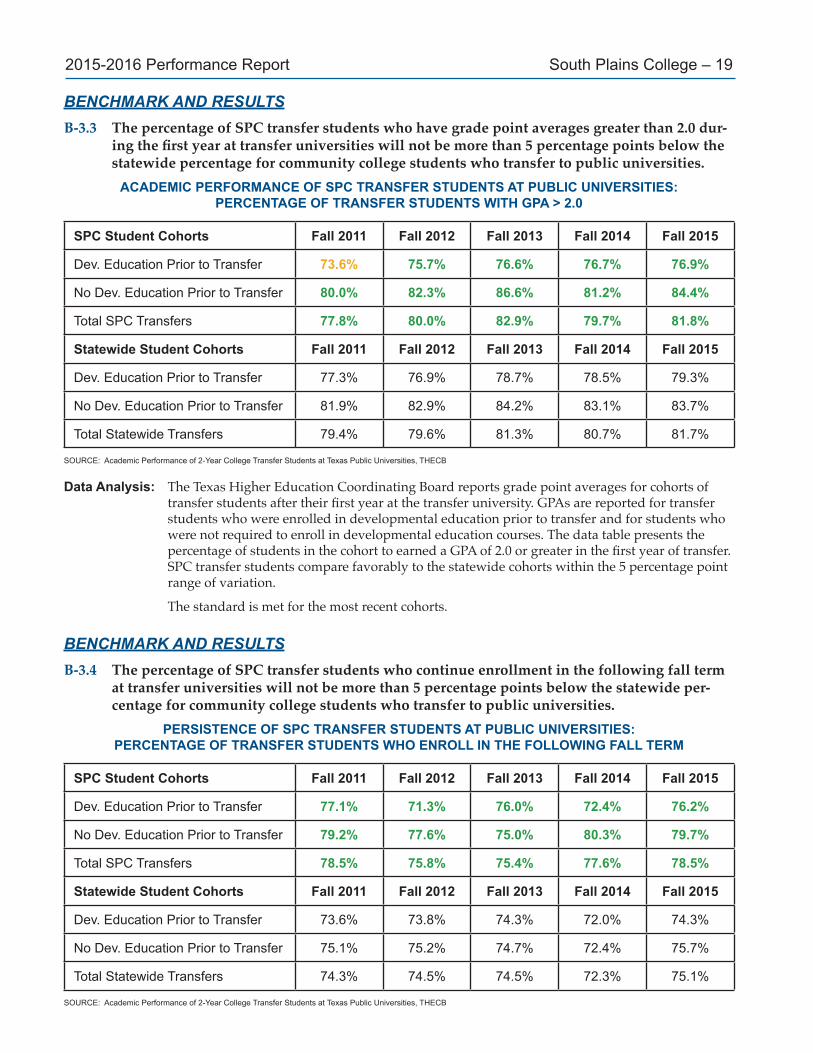
BENCHMARK AND RESULTSB-3.3 The percentage of SPC transfer students who have grade point averages greater than 2.0 dur-
ing the first year at transfer universities will not be more than 5 percentage points below the statewide percentage for community college students who transfer to public universities.
ACADEMIC PERFORMANCE OF SPC TRANSFER STUDENTS AT PUBLIC UNIVERSITIES:PERCENTAGE OF TRANSFER STUDENTS WITH GPA > 2.0
SPC Student Cohorts Fall 2011 Fall 2012 Fall 2013 Fall 2014 Fall 2015
Dev. Education Prior to Transfer 73.6% 75.7% 76.6% 76.7% 76.9%
No Dev. Education Prior to Transfer 80.0% 82.3% 86.6% 81.2% 84.4%
Total SPC Transfers 77.8% 80.0% 82.9% 79.7% 81.8%
Statewide Student Cohorts Fall 2011 Fall 2012 Fall 2013 Fall 2014 Fall 2015
Dev. Education Prior to Transfer 77.3% 76.9% 78.7% 78.5% 79.3%
No Dev. Education Prior to Transfer 81.9% 82.9% 84.2% 83.1% 83.7%
Total Statewide Transfers 79.4% 79.6% 81.3% 80.7% 81.7%
SOURCE: Academic Performance of 2-Year College Transfer Students at Texas Public Universities, THECB
Data Analysis: The Texas Higher Education Coordinating Board reports grade point averages for cohorts of transfer students after their first year at the transfer university. GPAs are reported for transfer students who were enrolled in developmental education prior to transfer and for students who were not required to enroll in developmental education courses. The data table presents the percentage of students in the cohort to earned a GPA of 2.0 or greater in the first year of transfer. SPC transfer students compare favorably to the statewide cohorts within the 5 percentage point range of variation.
The standard is met for the most recent cohorts. BENCHMARK AND RESULTSB-3.4 The percentage of SPC transfer students who continue enrollment in the following fall term
at transfer universities will not be more than 5 percentage points below the statewide per-centage for community college students who transfer to public universities.
PERSISTENCE OF SPC TRANSFER STUDENTS AT PUBLIC UNIVERSITIES:PERCENTAGE OF TRANSFER STUDENTS WHO ENROLL IN THE FOLLOWING FALL TERM
SPC Student Cohorts Fall 2011 Fall 2012 Fall 2013 Fall 2014 Fall 2015
Dev. Education Prior to Transfer 77.1% 71.3% 76.0% 72.4% 76.2%
No Dev. Education Prior to Transfer 79.2% 77.6% 75.0% 80.3% 79.7%
Total SPC Transfers 78.5% 75.8% 75.4% 77.6% 78.5%
Statewide Student Cohorts Fall 2011 Fall 2012 Fall 2013 Fall 2014 Fall 2015
Dev. Education Prior to Transfer 73.6% 73.8% 74.3% 72.0% 74.3%
No Dev. Education Prior to Transfer 75.1% 75.2% 74.7% 72.4% 75.7%
Total Statewide Transfers 74.3% 74.5% 74.5% 72.3% 75.1%
SOURCE: Academic Performance of 2-Year College Transfer Students at Texas Public Universities, THECB
20 – South Plains College 2015-2016 Performance Report
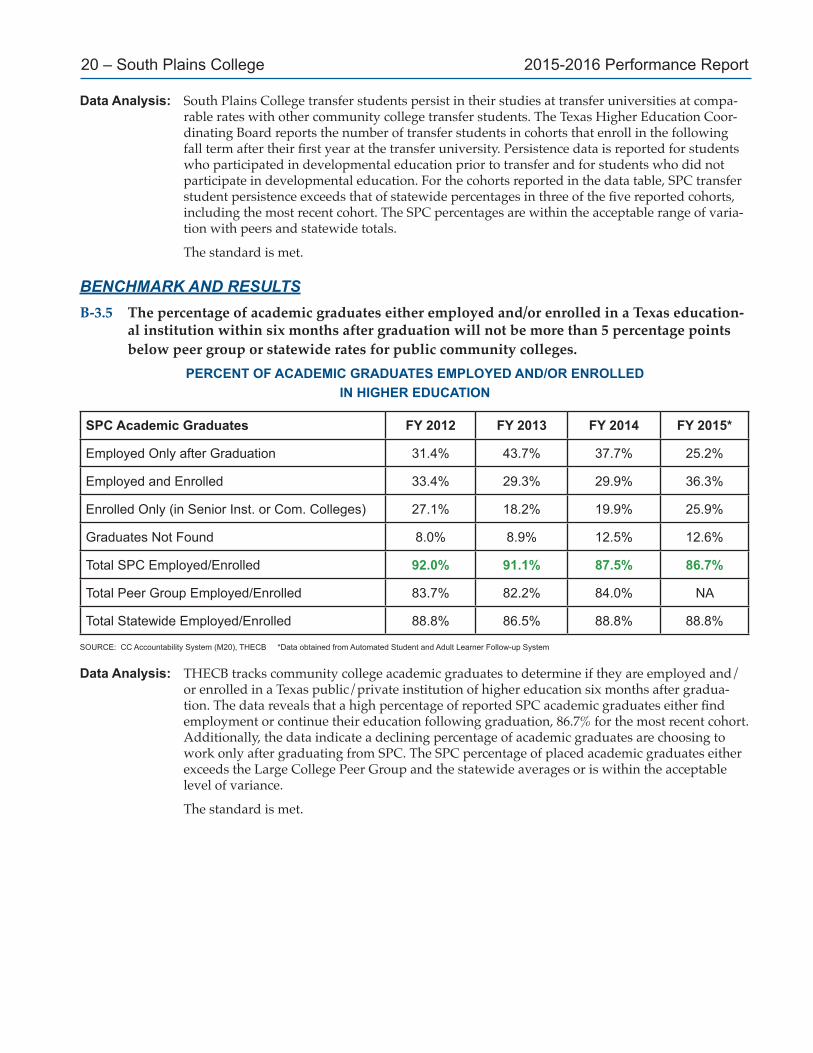
Data Analysis: South Plains College transfer students persist in their studies at transfer universities at compa-rable rates with other community college transfer students. The Texas Higher Education Coor-dinating Board reports the number of transfer students in cohorts that enroll in the following fall term after their first year at the transfer university. Persistence data is reported for students who participated in developmental education prior to transfer and for students who did not participate in developmental education. For the cohorts reported in the data table, SPC transfer student persistence exceeds that of statewide percentages in three of the five reported cohorts, including the most recent cohort. The SPC percentages are within the acceptable range of varia-tion with peers and statewide totals.
The standard is met. BENCHMARK AND RESULTSB-3.5 The percentage of academic graduates either employed and/or enrolled in a Texas education-
al institution within six months after graduation will not be more than 5 percentage points below peer group or statewide rates for public community colleges.
PERCENT OF ACADEMIC GRADUATES EMPLOYED AND/OR ENROLLED IN HIGHER EDUCATION
SPC Academic Graduates FY 2012 FY 2013 FY 2014 FY 2015*
Employed Only after Graduation 31.4% 43.7% 37.7% 25.2%
Employed and Enrolled 33.4% 29.3% 29.9% 36.3%
Enrolled Only (in Senior Inst. or Com. Colleges) 27.1% 18.2% 19.9% 25.9%
Graduates Not Found 8.0% 8.9% 12.5% 12.6%
Total SPC Employed/Enrolled 92.0% 91.1% 87.5% 86.7%
Total Peer Group Employed/Enrolled 83.7% 82.2% 84.0% NA
Total Statewide Employed/Enrolled 88.8% 86.5% 88.8% 88.8%
SOURCE: CC Accountability System (M20), THECB *Data obtained from Automated Student and Adult Learner Follow-up System
Data Analysis: THECB tracks community college academic graduates to determine if they are employed and/or enrolled in a Texas public/private institution of higher education six months after gradua-tion. The data reveals that a high percentage of reported SPC academic graduates either find employment or continue their education following graduation, 86.7% for the most recent cohort. Additionally, the data indicate a declining percentage of academic graduates are choosing to work only after graduating from SPC. The SPC percentage of placed academic graduates either exceeds the Large College Peer Group and the statewide averages or is within the acceptable level of variance.
The standard is met.
2015-2016 Performance Report South Plains College – 21
Measurement B-4: Technical Program Placement RatesBENCHMARK AND RESULTSB-4.1 85% of graduates of active technical programs will be placed in the workforce within six
months of graduation and/or be enrolled in another Texas public/private institution of higher education.
PERCENT OF TECHNICAL GRADUATES EMPLOYED AND/OR ENROLLED IN HIGHER EDUCATION
SPC Technical Graduates FY 2012 FY 2013 FY 2014 FY 2015*
Employed Only after Graduation 75.7% 78.4% 80.7% 57.2%
Employed and Enrolled 5.7% 0.9% 3.5% 19.2%
Enrolled Only (in Senior Inst. or Com. Colleges) 13.9% 10.2% 10.3% 10.6%
Graduates Not Found 4.7% 10.4% 5.5% 13.0%
Total SPC Employed/Enrolled 95.3% 89.6% 94.5% 87.0%
Total Peer Group Employed/Enrolled 91.5% 89.3% 90.5% NA
Total Statewide Employed/Enrolled 89.5% 87.3% 89.7% 86.0%
SOURCE: CC Accountability System (M20), THECB *Data obtained from Automated Student and Adult Learner Follow-up System
Data Analysis: THECB tracks community college technical graduates to determine if they are employed and/or enrolled in a Texas public/private institution of higher education six months after graduation. The data reveals that a high percentage of SPC technical graduates find employment or continue their education, exceeding the 85% placement benchmark for technical graduates for all four reported periods. The SPC percentage of technical graduates employed and/or enrolled exceeds both the Large College Peer Group and the statewide averages. Performance results for FY 2015 were calculated from data reported in the Automated Student and Adult Learner Follow-up System which summarizes data differently than what is reported in the Community College Accountability System. FY2014 was the last year this data was reported in the Accountability System. The THECB has revised the Accountability System to align with the goals and initia-tives of the new 30x60TX Higher Education Strategic Plan. Graduate employment/enrollment data will no longer be disaggregated by academic and technical completers.
The standard is met.
BENCHMARK AND RESULTSB-4.2 All active technical programs will have at least 25 graduates in a five-year period.
PERCENT OF TECHNICAL PROGRAMS WITH 25 GRADUATES IN 5 YEARS
Reporting Years 2012-13 2013-14 2014-15 2015-16
Total Active Programs 30 30 30 30
No. Programs 2 Years in Operation 29 30 29 30
No. with 25 Graduates in 5 Years 29 30 29 30
% of Programs in Compliance 100% 100% 96.7% 100%
SOURCE: Perkins Performance Data

22 – South Plains College 2015-2016 Performance Report
Data Analysis: This is a Perkins performance measure that is required in order to receive Perkins funding. For the most recent period, all active technical programs that have been in operation for two years have met the 25 graduates standard.
The standard is met.
BENCHMARK AND RESULTSB-4.3 All active technical programs will have at least an 85% average placement rate for completers
over a three-year average.PERCENT OF TECHNICAL PROGRAMS
WITH 85% SUCCESSFUL PLACEMENT OUTCOMES
Reporting Years 2012-13 2013-14 2014-15 2015-16
Total Program Areas Reporting 29 29 29 30
No. Programs 85% Success Rate 27 27 27 27
No. Less than 85% Success Rate 2 2 2 3
% of Programs in Compliance 93.1% 93.1% 93.1% 90.0%
SOURCE: Perkins Desk Review Data
Data Analysis: Of the 30 active programs reporting student placement in 2015-16, 27 technical programs met the 85% benchmark for successful outcomes for 90.0%.
The standard is not met.
Action Plan: The Instructional Deans and Program Faculty have created a plan for improving the placement rate for the three non-compliant programs. Implementation of this plan will take place during the 2016-17 academic year.
BENCHMARK AND RESULTSB-4.4 The percentage of technical graduates placed into employment, military service or appren-
ticeship programs shall not be below the 90% State Perkins Performance Target.
TECHNICAL STUDENT PLACEMENT RATE: INSTITUTIONAL PERCENTAGE
Reporting Years 2012-13 2013-14 2014-15 2015-16
SPC Performance Placement Rate 80.9% 79.2% 80.4% 79.8%
State Performance Placement Rate 73.2% 73.7% 75.6% 75.2%
State Perkins Target 79.0% 79.0% 76.0% 76.0%
State Perkins 90% Target 71.1% 71.1% 68.4% 68.5%SOURCE: Perkins Desk Review Data
Data Analysis: Student placement is a core performance indicator for Perkins funding. Actual institutional placement performance is compared to state targets by program year. For the years reported, the college’s overall technical student placement rate exceeds the state performance rate or is within a normal range of variation with the State Perkins Target rate. The College’s overall technical graduate placement rate exceeds the 90% Perkins target for all years reported.
The standard is met.
2015-2016 Performance Report South Plains College – 23
Measurement B-5: Licensure Passage and Skills AttainmentBENCHMARK AND RESULTSB-5.1 The percentage of technical graduates who take state and national certification or licensure
exams and pass shall not be below 5 percentage points of the peer group rate or the state average for community colleges.
PERCENTAGE OF TECHNICAL GRADUATES PASSING LICENSURE AND CERTIFICATION IN ALL PROGRAMS
Data Elements 2012-13 2013-14 2014-15 2015-16
SPC Licensure Passage Rate 92.4% 90.7% 96.1% 93.9%
Peer Group Licensure Passage Rate 89.0% 87.7% 88.4% 87.4%
Statewide Licensure Passage Rate 90.2% 89.2% 89.4% 88.6%
SOURCE: CC Accountability System (M27), THECB
Data Analysis: The percentage of SPC graduates passing state licensure exams exceeds the rate reported for the Large College Peer Group and the statewide community college rate for all four reported periods. Licensure test performance for individual programs is continually evaluated. Faculty in programs with licensure pass rates below state averages evaluate courses and course sequenc-ing to determine if modifications are necessary to improve student success on licensure exams.
The standard is met.
BENCHMARK AND RESULTSB-5.2 All technical programs leading to certification or licensure will have at least a 90% pass rate
on state or national exams.PERCENT OF TECHNICAL PROGRAMS WITH 90% LICENSURE RATE
Report Year 2013 2014 2015 2016
Number of Programs Reporting Passage Rates 10 10 10 10
Number of Programs with 90% Pass Rate 8 9 7 7
% of Programs in Compliance 80.0% 90.0% 70.0% 70.0%
SOURCE: Annual Licensure Report, THECB
Data Analysis: SPC offers 10 technical programs that lead to recognized licensure in a profession. Perkins per-formance measures have set a minimum 90% pass rate on licensure exams for these programs. For 2016, seven programs met the 90% standard. Graduates generally have more than one op-portunity to take licensure exams.
The standard is not met for the reported periods.
Action Plan: Program faculty and departmental chairpersons in non-compliant programs will adjust pro-gram curricula and instruction as required and continue to monitor licensure passage rates.
24 – South Plains College 2015-2016 Performance Report
BENCHMARK AND RESULTS B-5.3 The percent of technical students achieving technical skills proficiency aligned with in-
dustry-recognized standards through assessments will not be below the 90% State Perkins Performance Target.
PERCENT OF STUDENTS ACHIEVING TECHNICAL SKILLS PROFICIENCY
Reporting Years 2012-13 2013-14 2014-15 2015-16
SPCSkillsProficiencyRate 94.5% 91.5% 96.1% 93.7%
State Performance Rate 92.0% 90.7% 89.9% 90.9%
State Perkins Target 93.0% 93.0% 93.0% 91.0%
State Perkins 90% Target 83.7% 83.7% 83.7% 81.9%
SOURCE: Perkins Data Resources, THECB
Data Analysis: For the most recent reporting period, the College’s percentage of students achieving technical skills proficiency aligned with industry-recognized standards exceeds the State’s Perkins 90% Target by 11.8 percentage points, the 100% State Perkins Target by 2.7 points and the state aver-age by 2.8 points. College technical faculty, working with advisory committees, will continue to identify technical skill sets that can be assessed through industry-recognized methods and incorporate these skills competencies and assessments into the curriculum.
The standard is met.
Measurement B-6: Success in Developmental EducationBENCHMARK AND RESULTSB-6.1 The percentage of underprepared FTIC students who satisfy TSI obligation within two years
will not be more than 5 percentage points below peer group and statewide rates for commu-nity colleges.
PERCENTAGE OF UNDERPREPARED FTIC STUDENTS COMPLETING TSI REQUIREMENTS WITHIN TWO YEARS
Student Cohorts SPC Rates Peer Rates State Rate
Fall 2013 Cohort
Math 31.2% 29.6% 31.6%
Reading 59.8% 53.4% 55.8%
Writing 49.5% 47.7% 50.5%
Fall 2012 Cohort
Math 32.9% 27.6% 32.1%
Reading 52.2% 50.0% 54.8%
Writing 40.7% 43.8% 47.4%
Fall 2011 Cohort
Math 31.9% 25.6% 29.7%
Reading 50.0% 47.2% 53.2%
Writing 35.8% 40.9% 45.5%
SOURCE: CC Accountability System (M23), THECB

2015-2016 Performance Report South Plains College – 25
Data Analysis: THECB reports the percentage of underprepared FTIC students who satisfy TSI obligation within two years if they tested above deviation or three years if they tested under deviation by subject areas. For the most recent cohort reported, the percentage of SPC completers is greater than the Large College Peer Group and or is within acceptable level of variance with statewide summary percentages for math, reading and writing. Developmental English faculty have mod-ified instruction that has resulted in raising the percentage of underprepared students meeting TSI obligations in writing from 35.8% to 49.5%.
The standard is met.
BENCHMARK AND RESULTSB-6.2 The percentage of underprepared students who return the following fall semester will not be
more than 5 percentage points below peer group and statewide rates for public community colleges.
PERCENTAGE OF UNDERPREPARED STUDENTS RETURNINGTHE FOLLOWING FALL SEMESTER
Fall Student Cohorts Fall 2007 Fall 2008 Fall 2009 Fall 2010 Fall 2011
SPC Retention Rate 48.2% 42.3% 49.2% 48.2% 42.3%
Peer Group Retention Rate 50.6% 47.0% 48.4% 51.2% 47.0%
Statewide Retention Rate 52.2% 48.9% 49.5% 51.4% 48.9%
SOURCE: CC Accountability System (M24), THECB
Data Analysis: South Plains College’s fall-to-fall retention rate for students requiring remediation was 42.3%, the most recent data provided by the THECB. The SPC retention rate declined 5.9 percentage points from Fall 2010 to Fall 2011 Cohorts. While the latest performance result is within the nor-mal range of variation (5 points) with the peer group, it is 6.6 points below the statewide rate.
The standard is not met.
Action Plan: Retention of students is a strategic priority in the College’s current Institutional Plan. Appropri-ate college personnel will continue to monitor the retention of FTIC students requiring remedia-tion and develop strategies for improving success of developmental students.
Measurement B-7: Personal Growth and Goal AttainmentBENCHMARK AND RESULTSB-7.1 Respondents to the Student Satisfaction Inventory will rate the College’s contribution to
personal growth and goal attainment above average (greater than 5.0 on 7.0 scale).STUDENT SATISFACTION WITH PERSONAL GROWTH AND GOAL ATTAINMENT
Survey Statement Fall 2015Academicadvisorhelpeddefinemyacademicgoals. 5.22Iperceivemyacademicconfidencehasincreased. 5.72I am learning skills needed for my career. 5.84Iamabletoidentifytraining/skillsthatfitmyinterests/abilities. 5.93Iamdevelopingself-confidence. 5.99I am learning effective leadership skills 5.78Composite Score 5.74SOURCE:OfficeofInstitutionalEffectivenessandAssessment
26 – South Plains College 2015-2016 Performance Report
Data Analysis: Survey statements related to student personal growth and goal attainment have been added to the Noel-Levitz Student Satisfaction Inventory (SSI) which is administered in odd-numbered years. Respondents are asked to rate the importance of the survey statement and also rate their level of satisfaction with the survey statement. A gap analysis of the difference in the means for importance and satisfaction allows strengths and challenges to be identified. While the mean scores for each of the survey statements exceed the benchmark of 5.0 for this measure, the gap analysis between importance and satisfaction identified challenges in this area related to aca-demic confidence. However, developing self-confidence and learning skills needed for a career emerged as a strength.
The standard is met.
CSF C: Quality Student and Support Services
Measurement C-1: Access, Participation and EquityBENCHMARK AND RESULTSC-1.1 The College will annually enroll approximately 12,000 students in credit-level or develop-
mental courses within a normal range of variance of 5%.SOUTH PLAINS COLLEGE ANNUAL CREDIT ENROLLMENT
Data Elements 2011-12 2012-13 2013-14 2014-15 2015-16
Annual Credit Enrollments 13,624 13,236 12,968 12,648 12,435
Percent Change -3.3% -2.8% -2.0% -2.6% -1.7%
Lower Control Limit (-5%) 11,875 11,875 11,875 11,875 11,875
SOURCE:OfficeofInstitutionalResearchandReports
Data Analysis: Annual enrollment in 2015-16 declined 1.7% to 12,425 students. Since FY 2012, annual enroll-ment has declined by 1,189 students or 8.7 percent. For all years reported, annual enrollment has remained above the 12,000 student benchmark.
The standard is met.
BENCHMARK AND RESULTSC-1.2 Students who enroll at SPC will include a minimum of 45% of the most recent high school
graduates from the College service area.SOUTH PLAINS COLLEGE HIGH SCHOOL MARKET SHARE
SERVICE AREA SCHOOL DISTRICTS WITH MORE THAN 25 GRADUATES
Data Elements Fall 2011 Fall 2012 Fall 2013 Fall 2014 Fall 2015
Total Service H.S. Graduates 4,178 3,871 4,243 4,166 4,493
H.S. Grads Enrolled in Higher Ed. 2,063 1,978 2,051 2,095 2,110
% of Grads Enrolled in Higher Ed. 49.4% 51.1% 48.3% 50.3% 47.0%
H.S. Grads Enrolled at SPC 992 915 937 930 1,037
% of College-Bound Enrolled at SPC 48.1% 46.3% 45.7% 44.4% 49.2%
SOURCE: High School to College Linkages, THECB

2015-2016 Performance Report South Plains College – 27
Data Analysis: As part of the statewide “Closing the Gaps in Higher Education” initiative, the THECB tracks high school graduates enrolling in Texas public/private colleges and universities the fall semes-ter following May graduation. Only districts that graduate more than 25 students are tracked and reported in the High School to College Linkages Report. Of the 51 public school and charter school districts in the College’s service area, 31 districts (60.8%) graduated 25 or more students for FY 2015. Within this cohort, only 47.0% of graduates enrolled in a Texas public/private col-lege or university in Fall 2015. SPC enrolled 1,037 graduates from these schools for 49.2% of the college bound service area group. While the percentage of service area high school graduates attending college has fluctuated from 51.1% to the recent 47.0%, the region lags behind the state average of 55.9% matriculation to college. SPC has consistently enrolled 44% or more of service area graduates for the years reported. SPC will continue to actively support the P-20 Closing the Gaps Council and its initiatives to nurture a “college going culture” in the South Plains region.
The standard is met.
BENCHMARK AND RESULTSC-1.3 The College will enroll 40% of those individuals participating in higher education who re-
side in the College’s service area within a normal range of variance of 5%.SOUTH PLAINS COLLEGE SERVICE AREA MARKET SHARE
INDIVIDUALS PARTICIPATING IN HIGHER EDUCATION
Data Elements Fall 2011 Fall 2012 Fall 2013 Fall 2014
Total Service Area Residents Enrolled in Higher Ed. 17,090 15,987 15,941 16,684
Total Service Area Residents Enrolled at SPC 8,370 7,668 7,655 7,670
% of Service Area Residents Enrolling at SPC 49.0% 48.0% 48.1% 46.0%SOURCE: PREP Online Query, THECB
Data Analysis: This market share analysis attempts to determine the percentage of service area residents who participate in higher education by enrolling at SPC. The College’s “share” is computed as a percentage of the total number of service area residents who enroll in public higher educa-tion as reported by the Texas Higher Education Coordinating Board. In this analysis, the 40% benchmark has been exceeded in all years reported, averaging 47.7% for the past four years. The overall number of service area residents enrolled in higher education has declined by 2.3% from Fall 2011 to Fall 2014.
The standard is met.
BENCHMARK AND RESULTSC-1.4 The majority of students residing in the College’s service area who enroll at a community
college will enroll at South Plains College.SOUTH PLAINS COLLEGE SERVICE AREA MARKET SHARE
INDIVIDUALS ENROLLING AT COMMUNITY COLLEGES
Data Elements Fall 2013 Fall 2014 Fall 2015 Fall 2016
Total Service Area Residents Enrolled in Community Colleges 8,334 8,385 8,062 8,229
Total Service Area Residents Enrolled at SPC 7,655 7,670 7,334 7,501
% of Service Area Residents Enrolling at SPC 91.9% 91.5% 91.0% 91.2%SOURCE: PREP Online Query, THECB
28 – South Plains College 2015-2016 Performance Report
Data Analysis: This market share analysis attempts to determine the percentage of service area residents who choose to attend a public community college and who subsequently enroll at SPC. The College’s “share” is computed as a percentage of the total number of service area residents who enroll at Texas community colleges. In this analysis, greater than 91% of service area residents who enroll at a community college choose to enroll at SPC. However, enrollment of service area residents at SPC has decreased 2.1% from Fall 2013 to Fall 2016, largely due to the decline in dual credit en-rollment over the same time period. The number of service area residents attending community colleges in general declined 1.2%.
The standard is met.
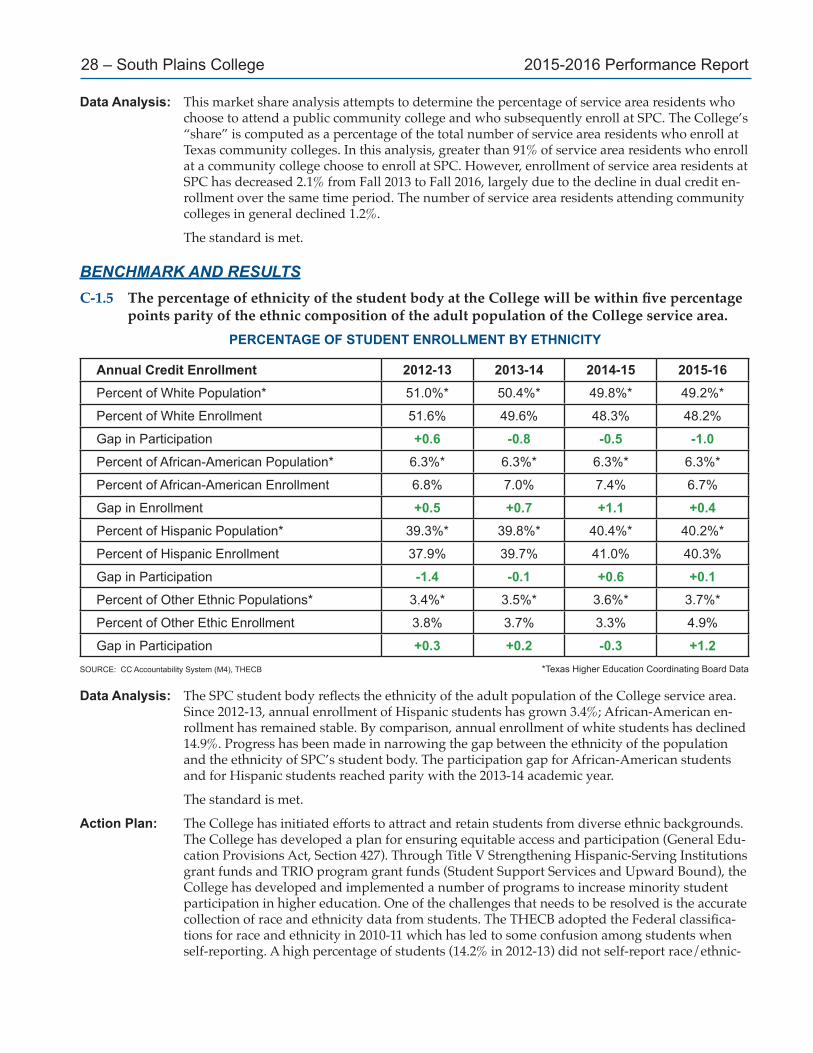
BENCHMARK AND RESULTSC-1.5 The percentage of ethnicity of the student body at the College will be within five percentage
points parity of the ethnic composition of the adult population of the College service area.PERCENTAGE OF STUDENT ENROLLMENT BY ETHNICITY
Annual Credit Enrollment 2012-13 2013-14 2014-15 2015-16Percent of White Population* 51.0%* 50.4%* 49.8%* 49.2%*
Percent of White Enrollment 51.6% 49.6% 48.3% 48.2%
Gap in Participation +0.6 -0.8 -0.5 -1.0Percent of African-American Population* 6.3%* 6.3%* 6.3%* 6.3%*
Percent of African-American Enrollment 6.8% 7.0% 7.4% 6.7%
Gap in Enrollment +0.5 +0.7 +1.1 +0.4Percent of Hispanic Population* 39.3%* 39.8%* 40.4%* 40.2%*
Percent of Hispanic Enrollment 37.9% 39.7% 41.0% 40.3%
Gap in Participation -1.4 -0.1 +0.6 +0.1Percent of Other Ethnic Populations* 3.4%* 3.5%* 3.6%* 3.7%*
Percent of Other Ethic Enrollment 3.8% 3.7% 3.3% 4.9%
Gap in Participation +0.3 +0.2 -0.3 +1.2SOURCE: CC Accountability System (M4), THECB *Texas Higher Education Coordinating Board Data
Data Analysis: The SPC student body reflects the ethnicity of the adult population of the College service area. Since 2012-13, annual enrollment of Hispanic students has grown 3.4%; African-American en-rollment has remained stable. By comparison, annual enrollment of white students has declined 14.9%. Progress has been made in narrowing the gap between the ethnicity of the population and the ethnicity of SPC’s student body. The participation gap for African-American students and for Hispanic students reached parity with the 2013-14 academic year.
The standard is met.
Action Plan: The College has initiated efforts to attract and retain students from diverse ethnic backgrounds. The College has developed a plan for ensuring equitable access and participation (General Edu-cation Provisions Act, Section 427). Through Title V Strengthening Hispanic-Serving Institutions grant funds and TRIO program grant funds (Student Support Services and Upward Bound), the College has developed and implemented a number of programs to increase minority student participation in higher education. One of the challenges that needs to be resolved is the accurate collection of race and ethnicity data from students. The THECB adopted the Federal classifica-tions for race and ethnicity in 2010-11 which has led to some confusion among students when self-reporting. A high percentage of students (14.2% in 2012-13) did not self-report race/ethnic-
2015-2016 Performance Report South Plains College – 29
ity and were identified at “Other “ by the THECB. Methods for collecting demographic infor-mation from students will be evaluated by the Office of Institutional Research and the Office of Admissions and Records. The College will continue to identify this task as a priority initiative and will monitor progress.
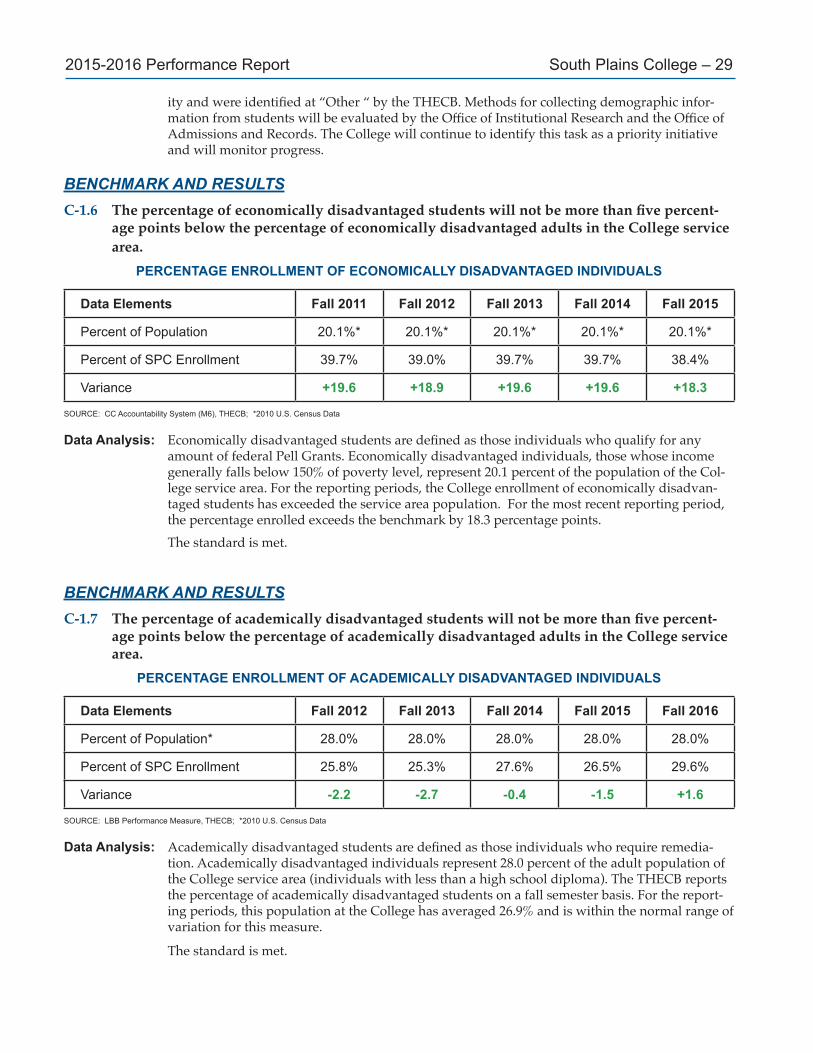
BENCHMARK AND RESULTSC-1.6 The percentage of economically disadvantaged students will not be more than five percent-
age points below the percentage of economically disadvantaged adults in the College service area.
PERCENTAGE ENROLLMENT OF ECONOMICALLY DISADVANTAGED INDIVIDUALS
Data Elements Fall 2011 Fall 2012 Fall 2013 Fall 2014 Fall 2015
Percent of Population 20.1%* 20.1%* 20.1%* 20.1%* 20.1%*
Percent of SPC Enrollment 39.7% 39.0% 39.7% 39.7% 38.4%
Variance +19.6 +18.9 +19.6 +19.6 +18.3
SOURCE: CC Accountability System (M6), THECB; *2010 U.S. Census Data
Data Analysis: Economically disadvantaged students are defined as those individuals who qualify for any amount of federal Pell Grants. Economically disadvantaged individuals, those whose income generally falls below 150% of poverty level, represent 20.1 percent of the population of the Col-lege service area. For the reporting periods, the College enrollment of economically disadvan-taged students has exceeded the service area population. For the most recent reporting period, the percentage enrolled exceeds the benchmark by 18.3 percentage points.
The standard is met.
BENCHMARK AND RESULTSC-1.7 The percentage of academically disadvantaged students will not be more than five percent-
age points below the percentage of academically disadvantaged adults in the College service area.
PERCENTAGE ENROLLMENT OF ACADEMICALLY DISADVANTAGED INDIVIDUALS
Data Elements Fall 2012 Fall 2013 Fall 2014 Fall 2015 Fall 2016
Percent of Population* 28.0% 28.0% 28.0% 28.0% 28.0%
Percent of SPC Enrollment 25.8% 25.3% 27.6% 26.5% 29.6%
Variance -2.2 -2.7 -0.4 -1.5 +1.6
SOURCE: LBB Performance Measure, THECB; *2010 U.S. Census Data
Data Analysis: Academically disadvantaged students are defined as those individuals who require remedia-tion. Academically disadvantaged individuals represent 28.0 percent of the adult population of the College service area (individuals with less than a high school diploma). The THECB reports the percentage of academically disadvantaged students on a fall semester basis. For the report-ing periods, this population at the College has averaged 26.9% and is within the normal range of variation for this measure.
The standard is met.
30 – South Plains College 2015-2016 Performance Report
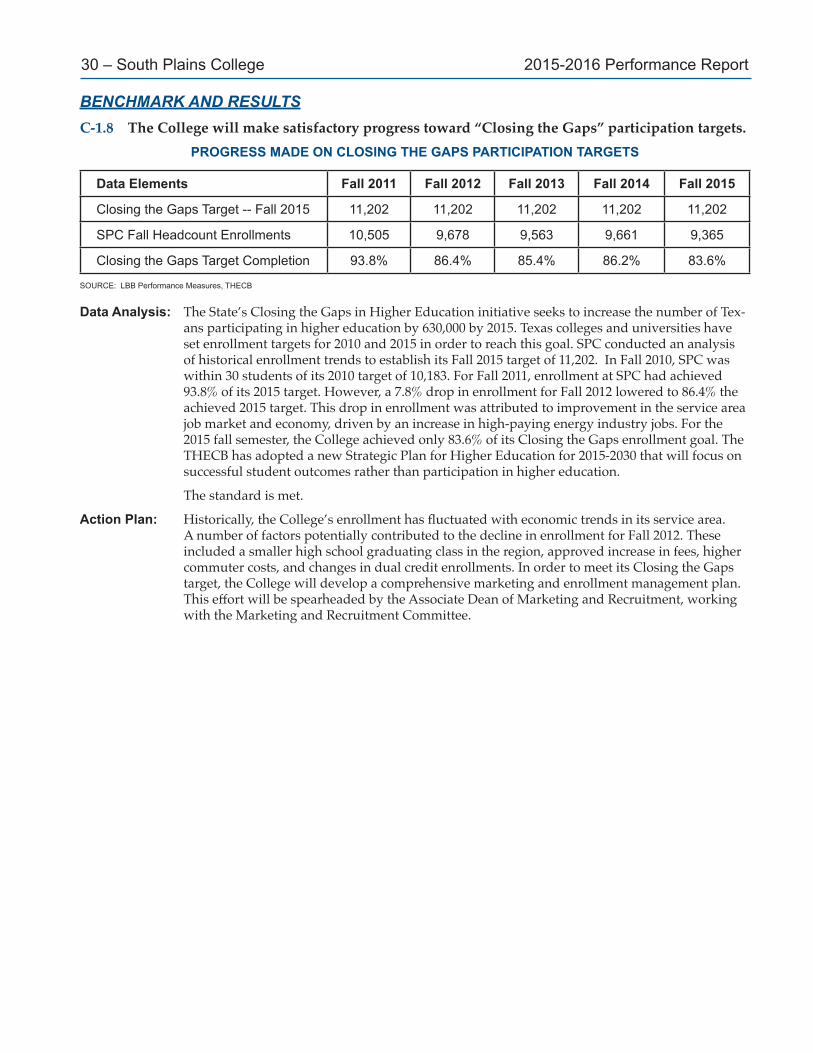
BENCHMARK AND RESULTSC-1.8 The College will make satisfactory progress toward “Closing the Gaps” participation targets.
PROGRESS MADE ON CLOSING THE GAPS PARTICIPATION TARGETS
Data Elements Fall 2011 Fall 2012 Fall 2013 Fall 2014 Fall 2015
Closing the Gaps Target -- Fall 2015 11,202 11,202 11,202 11,202 11,202
SPC Fall Headcount Enrollments 10,505 9,678 9,563 9,661 9,365
Closing the Gaps Target Completion 93.8% 86.4% 85.4% 86.2% 83.6%
SOURCE: LBB Performance Measures, THECB
Data Analysis: The State’s Closing the Gaps in Higher Education initiative seeks to increase the number of Tex-ans participating in higher education by 630,000 by 2015. Texas colleges and universities have set enrollment targets for 2010 and 2015 in order to reach this goal. SPC conducted an analysis of historical enrollment trends to establish its Fall 2015 target of 11,202. In Fall 2010, SPC was within 30 students of its 2010 target of 10,183. For Fall 2011, enrollment at SPC had achieved 93.8% of its 2015 target. However, a 7.8% drop in enrollment for Fall 2012 lowered to 86.4% the achieved 2015 target. This drop in enrollment was attributed to improvement in the service area job market and economy, driven by an increase in high-paying energy industry jobs. For the 2015 fall semester, the College achieved only 83.6% of its Closing the Gaps enrollment goal. The THECB has adopted a new Strategic Plan for Higher Education for 2015-2030 that will focus on successful student outcomes rather than participation in higher education.
The standard is met.
Action Plan: Historically, the College’s enrollment has fluctuated with economic trends in its service area. A number of factors potentially contributed to the decline in enrollment for Fall 2012. These included a smaller high school graduating class in the region, approved increase in fees, higher commuter costs, and changes in dual credit enrollments. In order to meet its Closing the Gaps target, the College will develop a comprehensive marketing and enrollment management plan. This effort will be spearheaded by the Associate Dean of Marketing and Recruitment, working with the Marketing and Recruitment Committee.
2015-2016 Performance Report South Plains College – 31
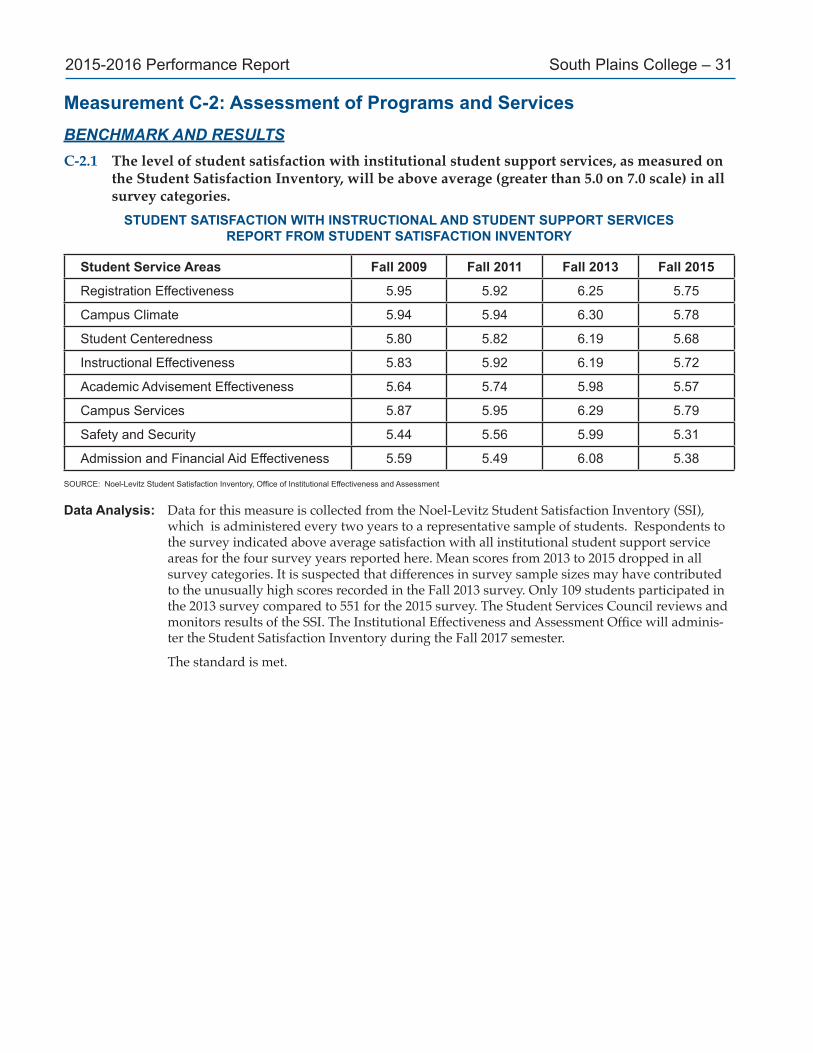
Measurement C-2: Assessment of Programs and ServicesBENCHMARK AND RESULTSC-2.1 The level of student satisfaction with institutional student support services, as measured on
the Student Satisfaction Inventory, will be above average (greater than 5.0 on 7.0 scale) in all survey categories.
STUDENT SATISFACTION WITH INSTRUCTIONAL AND STUDENT SUPPORT SERVICESREPORT FROM STUDENT SATISFACTION INVENTORY
Student Service Areas Fall 2009 Fall 2011 Fall 2013 Fall 2015
Registration Effectiveness 5.95 5.92 6.25 5.75
Campus Climate 5.94 5.94 6.30 5.78
Student Centeredness 5.80 5.82 6.19 5.68
Instructional Effectiveness 5.83 5.92 6.19 5.72
Academic Advisement Effectiveness 5.64 5.74 5.98 5.57
Campus Services 5.87 5.95 6.29 5.79
Safety and Security 5.44 5.56 5.99 5.31
Admission and Financial Aid Effectiveness 5.59 5.49 6.08 5.38
SOURCE:Noel-LevitzStudentSatisfactionInventory,OfficeofInstitutionalEffectivenessandAssessment
Data Analysis: Data for this measure is collected from the Noel-Levitz Student Satisfaction Inventory (SSI), which is administered every two years to a representative sample of students. Respondents to the survey indicated above average satisfaction with all institutional student support service areas for the four survey years reported here. Mean scores from 2013 to 2015 dropped in all survey categories. It is suspected that differences in survey sample sizes may have contributed to the unusually high scores recorded in the Fall 2013 survey. Only 109 students participated in the 2013 survey compared to 551 for the 2015 survey. The Student Services Council reviews and monitors results of the SSI. The Institutional Effectiveness and Assessment Office will adminis-ter the Student Satisfaction Inventory during the Fall 2017 semester.
The standard is met.

32 – South Plains College 2015-2016 Performance Report
BENCHMARK AND RESULTSC-2.2 The level of student satisfaction with student support services will be 70% or greater agree-
ment in all survey categories.STUDENT SATISFACTION WITH STUDENT AND SUPPORT SERVICES
REPORT FROM SURVEY OF CURRENT STUDENTS
Student Service Areas 2011-12 2012-13 2013-14 2015-16
DeanofStudentsOffice 93% 95% 87% 95%
Counseling Center 95% 93% 89% 90%
Instructional Support Services 86% 90% 81% 86%
Student Health Services 91% 86% 87% 85%
Student Activities 96% 94% 84% 91%
Campus Police / Parking 91% 100% 90% 94%
Food Service 88% 91% 84% 84%
Admissions and Records 95% 94% 93% 92%
Financial Aid 84% 90% 88% 86%
Library 99% 97% 97% 98%
BusinessOffice 97% 96% 94% 96%
Veterans Services 95% 95% 90% 92%
Advising 95% 92% 88% 88%
CampusConnect 96% 94% 96% 97%
MySPC 97% 94% 98% 98%
SOURCE:OfficeofStudentAffairs,SPC
Data Analysis: Students participating in the online student services assessment are asked to rate their level of satisfaction with customer service statements for each student service office. Respondents indicate their level of agreement with survey statements on a scale of 1 (very satisfied) to 4 (very dissatisfied). The benchmark has been set at 70% agreement (very satisfied or satisfied) with the statements for each area. The survey was not administered for 2014-15 and was revised to in-clude additional survey statements. Student satisfaction data was collected in the spring of 2016 and is presented in the data table. The percentage of student agreement with service satisfaction statements exceeds the 70% benchmark for all service areas.
The standard is met for the years reported.

2015-2016 Performance Report South Plains College – 33
Measurement C-3: Retention and PersistenceBENCHMARK AND RESULTSC-3.1 Retention/persistence of FTIC undergraduate students after one year will not be more than 5
percentage points below the peer group and statewide rate for public community colleges.RETENTION/PERSISTENCE OF UNDERGRADUATE STUDENTS AFTER ONE YEAR
Entering Fall Student Cohorts Fall 2012 Fall 2013 Fall 2014 Fall 2015
SPC Total Retained or Persisting 59.7% 60.8% 59.4% 59.5%
Peer Group Total Retained or Persisting 64.3% 65.8% 67.0% 66.4%
Statewide Total Retained or Persisting 64.2% 65.5% 66.9% 68.4%
SOURCE: CC Accountability System, THECB (M15)
Data Analysis: Cohorts of first-time, full-time students are tracked from fall to fall and reported as being retained at the same institution or persisting to another institution of higher education. Those who receive a certificate or degree within the first year are excluded from the cohort. The data presents the percentage of students who “stop out” of higher education after the first year. While this retention/persistence measure has averaged 59.9% for the four years reported in the above table, it moved outside the normal range of variation (5 points) for the peer average and state average for all two-year institutions for the past two periods. For the most recent report-ing period, the SPC retention/persistence total is 6.9 percentage points below the Large College Peer Group rate and 9.0 percentage points below the state rate.
The standard is not met.
Action Plan: While improvements have been made in the College’s retention rate for this measure, it contin-ues to be a priority opportunity for improvement. The Retention Team will continue to monitor retention of FTIC students and promote intrusive advisement and early alert strategies.
BENCHMARK AND RESULTSC-3.2 Retention/persistence of undergraduate students after two years will not be more than 5 per-
centage points below the peer group and statewide rate for public community colleges.RETENTION/PERSISTENCE OF UNDERGRADUATE STUDENTS AFTER TWO YEARS
Entering Fall Student Cohorts Fall 2011 Fall 2012 Fall 2013 Fall 2014
SPC Total Retained or Persisting 46.0% 45.3% 47.8% 47.9%
Peer Group Total Retained or Persisting 48.2% 51.7% 53.5% 55.4%
Statewide Total Retained or Persisting 48.6% 50.5% 53.0% 54.5%
SOURCE: CC Accountability System, THECB (M16)
Data Analysis: Cohorts of first-time, full-time students are tracked for two years and reported as being re-tained at the same institution or persisting to another institution of higher education. Those who receive a certificate or degree within the two years are excluded from the cohort. The data presents the percentage of students who “stop out” of higher education within two years of participation. The SPC rate remains outside the normal range of variance in relation to the peer group and state average for all two-year institutions for three of the four cohorts tracked. While incremental improvements have been made, the SPC rate continues to lag behind peer and statewide rates. For the most recent reporting period, the SPC retention/persistence total is 7.5 percentage points below the peer group rate and 6.6 percentage points below the state rate.
The standard is not met.

34 – South Plains College 2015-2016 Performance Report
Action Plan: While improvements have been made in the College’s retention rate for this measure, it contin-ues to be a priority opportunity for improvement. The Retention Team will continue to monitor retention of FTIC students and promote intrusive advisement, early alert, and individual educa-tional success plan strategies.
BENCHMARK AND RESULTSC-3.3 Retention of first-time, full-time students from fall to fall will not be more than 5 percentage
points below the peer group and statewide rate for public community colleges.FALL-TO-FALL RETENTION OF FIRST-TIME, FULL-TIME STUDENTS
Entering Fall Student Cohorts Fall 2012 Fall 2013 Fall 2014 Fall 2015
SPC Total Retained 49.3% 51.9% 48.1% 49.8%
Peer Group Total Retained 50.3% 51.9% 52.1% 53.0%
Statewide Total Retained 53.9% 55.3% 56.5% 58.5%
SOURCE: CC Accountability System, THECB
Data Analysis: Unlike Measure C-3.1, this THECB measure does not count students who persist after one year at other institutions. South Plains College’s fall-to-fall retention rate for first-time, full-time credential seeking students is within the range of variation with peer group community col-lege and but is below the statewide retention rates for all community colleges, for the two most recent reporting period.
The standard is not met.
Action Plan: Fall to fall retention of students continues to be a priority opportunity for improvement. While improvements have been made in the College’s retention rate for this measure, it continues to be a priority opportunity for improvement. The Retention Team will continue to monitor retention of FTIC students and promote intrusive advisement, early alert, and individual educational suc-cess plan strategies.
BENCHMARK AND RESULTSC-3.4 The retention rate for FTIC students from fall to spring will be within the normal range of
variation (5%).FALL TO SPRING RETENTION OF FTIC STUDENTS
Entering Fall Student Cohort 2012-13 2013-14 2014-15 2015-16
SPC First-Time Students 73.8% 72.0% 73.9% 73.2%
Lower Control Limit 72.0% 72.0% 72.0% 72.0%
SOURCE:OfficeofInstitutionalResearch
Data Analysis: The percentage of first-time-in-college students retained from the fall semester to the spring semester is a measure of retention. The retention rate for all students at SPC has averaged 72.6% for the past 10 years and the lower control limit (one standard deviation below the mean) has been calculated at 72.0%. For 2015-15, the rate was 73.2%, which is above the lower control limit. Student retention continues to be a priority initiative for the College. The Advising and Testing Center will continue to monitor retention of FTIC students and promote intrusive advisement and early alert strategies.
The standard is met.
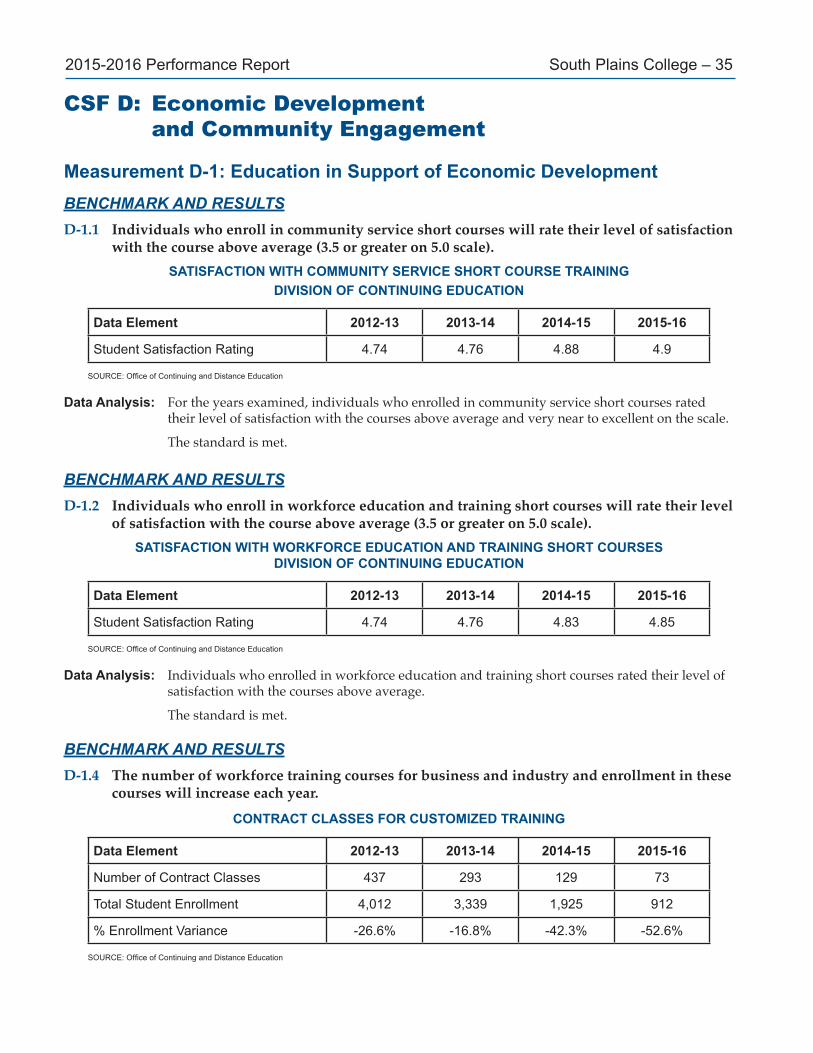
2015-2016 Performance Report South Plains College – 35
CSF D: Economic Development and Community Engagement
Measurement D-1: Education in Support of Economic DevelopmentBENCHMARK AND RESULTSD-1.1 Individuals who enroll in community service short courses will rate their level of satisfaction
with the course above average (3.5 or greater on 5.0 scale).SATISFACTION WITH COMMUNITY SERVICE SHORT COURSE TRAINING
DIVISION OF CONTINUING EDUCATION
Data Element 2012-13 2013-14 2014-15 2015-16
Student Satisfaction Rating 4.74 4.76 4.88 4.9
SOURCE:OfficeofContinuingandDistanceEducation
Data Analysis: For the years examined, individuals who enrolled in community service short courses rated their level of satisfaction with the courses above average and very near to excellent on the scale.
The standard is met.
BENCHMARK AND RESULTSD-1.2 Individuals who enroll in workforce education and training short courses will rate their level
of satisfaction with the course above average (3.5 or greater on 5.0 scale).SATISFACTION WITH WORKFORCE EDUCATION AND TRAINING SHORT COURSES
DIVISION OF CONTINUING EDUCATION
Data Element 2012-13 2013-14 2014-15 2015-16
Student Satisfaction Rating 4.74 4.76 4.83 4.85
SOURCE:OfficeofContinuingandDistanceEducation
Data Analysis: Individuals who enrolled in workforce education and training short courses rated their level of satisfaction with the courses above average.
The standard is met.
BENCHMARK AND RESULTSD-1.4 The number of workforce training courses for business and industry and enrollment in these
courses will increase each year.
CONTRACT CLASSES FOR CUSTOMIZED TRAINING
Data Element 2012-13 2013-14 2014-15 2015-16
Number of Contract Classes 437 293 129 73
Total Student Enrollment 4,012 3,339 1,925 912
% Enrollment Variance -26.6% -16.8% -42.3% -52.6%
SOURCE:OfficeofContinuingandDistanceEducation
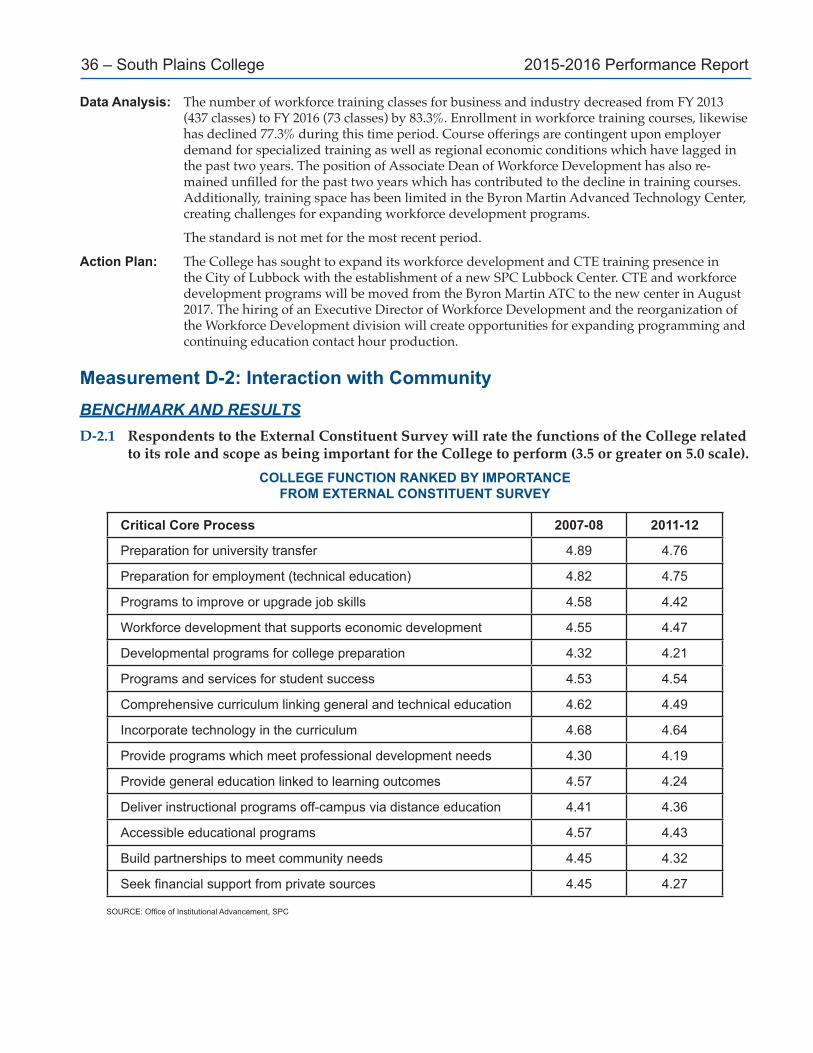
36 – South Plains College 2015-2016 Performance Report
Data Analysis: The number of workforce training classes for business and industry decreased from FY 2013 (437 classes) to FY 2016 (73 classes) by 83.3%. Enrollment in workforce training courses, likewise has declined 77.3% during this time period. Course offerings are contingent upon employer demand for specialized training as well as regional economic conditions which have lagged in the past two years. The position of Associate Dean of Workforce Development has also re-mained unfilled for the past two years which has contributed to the decline in training courses. Additionally, training space has been limited in the Byron Martin Advanced Technology Center, creating challenges for expanding workforce development programs.
The standard is not met for the most recent period.
Action Plan: The College has sought to expand its workforce development and CTE training presence in the City of Lubbock with the establishment of a new SPC Lubbock Center. CTE and workforce development programs will be moved from the Byron Martin ATC to the new center in August 2017. The hiring of an Executive Director of Workforce Development and the reorganization of the Workforce Development division will create opportunities for expanding programming and continuing education contact hour production.
Measurement D-2: Interaction with CommunityBENCHMARK AND RESULTSD-2.1 Respondents to the External Constituent Survey will rate the functions of the College related
to its role and scope as being important for the College to perform (3.5 or greater on 5.0 scale).COLLEGE FUNCTION RANKED BY IMPORTANCE
FROM EXTERNAL CONSTITUENT SURVEY
Critical Core Process 2007-08 2011-12
Preparation for university transfer 4.89 4.76
Preparation for employment (technical education) 4.82 4.75
Programs to improve or upgrade job skills 4.58 4.42
Workforce development that supports economic development 4.55 4.47
Developmental programs for college preparation 4.32 4.21
Programs and services for student success 4.53 4.54
Comprehensive curriculum linking general and technical education 4.62 4.49
Incorporate technology in the curriculum 4.68 4.64
Provide programs which meet professional development needs 4.30 4.19
Provide general education linked to learning outcomes 4.57 4.24
Deliver instructional programs off-campus via distance education 4.41 4.36
Accessible educational programs 4.57 4.43
Build partnerships to meet community needs 4.45 4.32
Seekfinancialsupportfromprivatesources 4.45 4.27
SOURCE:OfficeofInstitutionalAdvancement,SPC
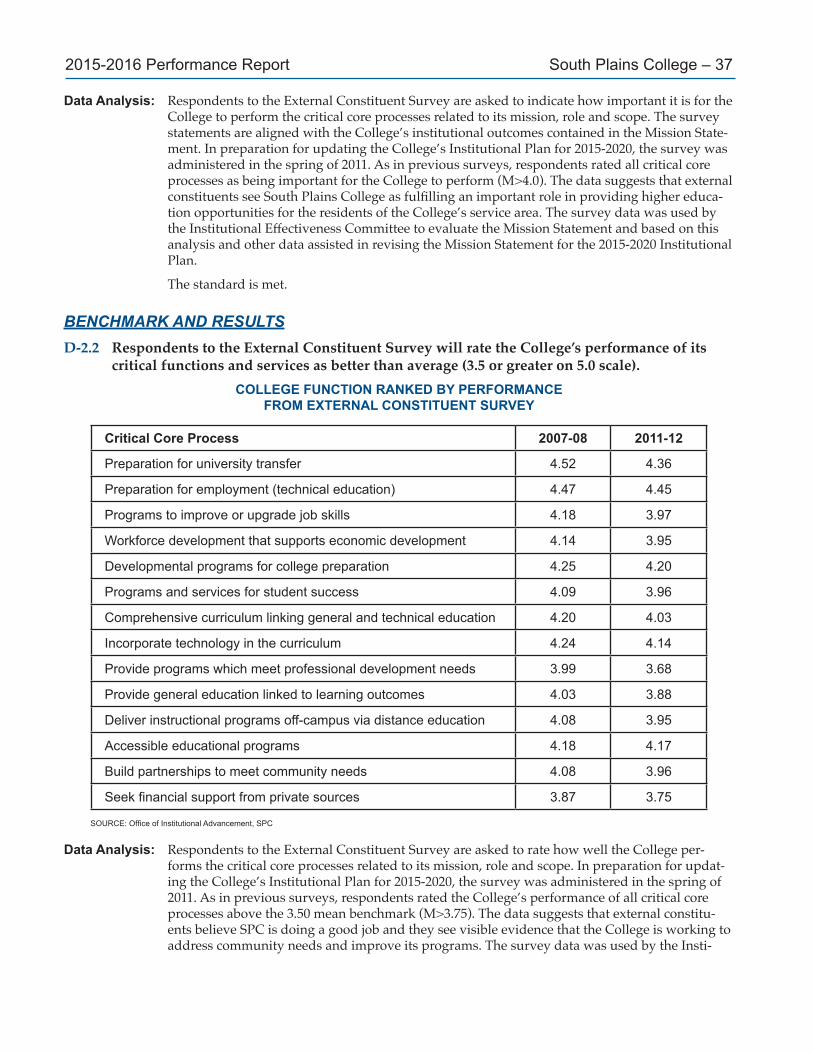
2015-2016 Performance Report South Plains College – 37
Data Analysis: Respondents to the External Constituent Survey are asked to indicate how important it is for the College to perform the critical core processes related to its mission, role and scope. The survey statements are aligned with the College’s institutional outcomes contained in the Mission State-ment. In preparation for updating the College’s Institutional Plan for 2015-2020, the survey was administered in the spring of 2011. As in previous surveys, respondents rated all critical core processes as being important for the College to perform (M>4.0). The data suggests that external constituents see South Plains College as fulfilling an important role in providing higher educa-tion opportunities for the residents of the College’s service area. The survey data was used by the Institutional Effectiveness Committee to evaluate the Mission Statement and based on this analysis and other data assisted in revising the Mission Statement for the 2015-2020 Institutional Plan.
The standard is met.
BENCHMARK AND RESULTSD-2.2 Respondents to the External Constituent Survey will rate the College’s performance of its
critical functions and services as better than average (3.5 or greater on 5.0 scale).COLLEGE FUNCTION RANKED BY PERFORMANCE
FROM EXTERNAL CONSTITUENT SURVEY
Critical Core Process 2007-08 2011-12
Preparation for university transfer 4.52 4.36
Preparation for employment (technical education) 4.47 4.45
Programs to improve or upgrade job skills 4.18 3.97
Workforce development that supports economic development 4.14 3.95
Developmental programs for college preparation 4.25 4.20
Programs and services for student success 4.09 3.96
Comprehensive curriculum linking general and technical education 4.20 4.03
Incorporate technology in the curriculum 4.24 4.14
Provide programs which meet professional development needs 3.99 3.68
Provide general education linked to learning outcomes 4.03 3.88
Deliver instructional programs off-campus via distance education 4.08 3.95
Accessible educational programs 4.18 4.17
Build partnerships to meet community needs 4.08 3.96
Seekfinancialsupportfromprivatesources 3.87 3.75
SOURCE:OfficeofInstitutionalAdvancement,SPC
Data Analysis: Respondents to the External Constituent Survey are asked to rate how well the College per-forms the critical core processes related to its mission, role and scope. In preparation for updat-ing the College’s Institutional Plan for 2015-2020, the survey was administered in the spring of 2011. As in previous surveys, respondents rated the College’s performance of all critical core processes above the 3.50 mean benchmark (M>3.75). The data suggests that external constitu-ents believe SPC is doing a good job and they see visible evidence that the College is working to address community needs and improve its programs. The survey data was used by the Insti-

38 – South Plains College 2015-2016 Performance Report
tutional Effectiveness Committee to evaluate the Mission Statement and based on this analysis and other data assisted in revising the Mission Statement for the 2015-2020 Institutional Plan.
The standard is met.
BENCHMARK AND RESULTSD-2.3 The College will annually serve at least 7 percent of the civilian workforce population resid-
ing in the college service area.COMPARISON OF WORKFORCE POPULATION SERVED
Year Standard Service AreaCivilian Workforce*
Annual Enrollment
Percent of Population
2012-13 7% 210,095 15,639 7.4%
2013-14 7% 209,251 15,121 7.2%
2014-15 7% 205,390 15,205 7.4%
2015-16 7% 208,542 14,753 7.1%
SOURCE:OfficeofInstitutionalAdvancement *TexasWorkforceCommissionEmploymentData
Data Analysis: Annual enrollment figures reported here include unduplicated headcounts in college-credit and developmental courses, and enrollments in non-credit workforce development short courses. The service area civilian workforce is determined from Texas Workforce Commission employ-ment data reported in June of each year. Some duplication of individuals may be present in the numbers of students who enroll in non-credit courses and later enroll in credit courses in a given year.
The standard is met in all years examined.
BENCHMARK AND RESULTSD-2.4 All active technical programs will have an advisory committee of business and professional
representatives that will meet with program faculty at least one time each academic year.INTERACTION WITH TECHNICAL PROGRAM ADVISORY COMMITTEES
Data Elements 2012-13 2013-14 2014-15 2015-16
Number of Active Technical Programs 30 30 30 30
Number of Programs in Compliance 30 30 30 30
Percent of Programs in Compliance 100% 100% 100% 100%
SOURCE:VicePresidentforAcademicAffairsOffice,SPC
Data Analysis: In order to keep technical programs up-to-date with industry standards and expectations, faculty consult with advisory committee personnel who review the curriculum and program training that is provided.
The standard is met in all years examined.

2015-2016 Performance Report South Plains College – 39
Measurement D-3: Partnerships and AlliancesBENCHMARK AND RESULTSD-3.1 The College will maintain partnerships and alliances with other entities which enhance the
College’s ability to serve students and the community.
Status Report: The following alliances and partnerships were in existence during the time studied. Articulated dual credit partnerships are being maintained with 63 area high schools, four pri-
vate schools and two charter schools. South Plains College continues to develop an academic alliance with Texas Tech University for
the purpose of providing undergraduate instruction for Texas Tech students. The partnership between SPC and Lubbock ISD continues to provide and expand the educa-
tional and instructional opportunities at the Byron Martin Advanced Technology Center. SPC partnered with the Region 17 Education Service Center to deliver dual credit instructions
over its distance education network. SPC delivered 67 dual credit courses via the ITV network to 197 students at 17 high school remote sites.
The College works closely with the Lubbock Economic Development Alliance to plan workforce training and assessment to assist small business employers with training needs. Through this effort, a new customer service representative certificate program was developed and approved for delivery.
The College maintained active membership in the Levelland Chamber of Commerce, the Lub-bock Chamber of Commerce, and the Plainview Chamber of Commerce.
The College is a active partner in the South Plains Closing the Gaps P-20 Council, a partnership between community and educational organizations designed to increase student participation and success in Pre-K to postsecondary education. College representatives participated in GenTX College Signing Day in May 2016 among other projects.
SPC, in cooperation with Texas Tech University, implemented the Tech Transfer Acceleration Program program (TTAP) in which SPC provides courses and instruction to students on the TTU campus. This program is a hybrid of the Gateway program and the TTU Provisional Ad-mittance program. 209 students participated in TTAP in 2015-16.
SPC secured $9.9 million in financial support from the Helen Jones Foundation, The CH Foun-dation, and the Lubbock Economic Development Alliance for the purpose of transforming a 73,000 square foot facility located at 3907 Ave. Q into a new South Plains College Lubbock Center. The new facility will allow SPC to expand its educational program within the City of Lubbock in support of workforce development.

40 – South Plains College 2015-2016 Performance Report
CSF E: Effective Leadership and Management
Measurement E-1: Cooperative Planning and Goal AttainmentBENCHMARK AND RESULTSE-1.1 The level of employee satisfaction with planning and effectiveness processes will be above
average (3.5 or greater on 5.0 scale) as measured by the Employee Survey.EMPLOYEE SATISFACTION WITH PLANNING PROCESS
REPORT FROM BIENNIAL EMPLOYEE SURVEY
Data Elements 2010 2012 2014 2016
Informed about Planning Effort 3.9 3.9 4.0 3.9
Opportunity for Input into Planning 3.5 3.7 3.6 3.4
Involved in Planning Effort 3.4 3.5 3.5 3.7
Knowledge of Planning Documents 3.8 3.6 3.8 3.7
Composite Rating for Planning Process 3.6 3.7 3.7 3.6
SOURCE:OfficeofInstitutionalAdvancement,SPC
Data Analysis: The composite rating for the planning process meets or exceeds the benchmark standard for all four reported periods. Respondents to the Employee Survey expressed above average satis-faction with planning efforts in all categories. Executive leadership will continue to educate those involved in strategic and operational planning as to the importance and use of planning data and documents which result from planning efforts. TaskStream, the College’s assessment management system, has provided for consistent and uniform documentation of planning and assessment activities. The Office of Institutional Advancement will oversee the administration of the Employee Survey during the 2018 spring semester.
The standard is met. Measurement E-2: Management of ResourcesBENCHMARK AND RESULTSE-2.1 The level of employee satisfaction with the budgetary process as measured by the Employee
Survey will be above average (3.5 or greater on 5.0 scale).EMPLOYEE SATISFACTION WITH BUDGETARY PROCESS
REPORT FROM BIENNIAL EMPLOYEE SURVEY
Data Elements 2010 2012 2014 2016
Involvement in Budget Process 3.6 3.5 3.5 3.5
Satisfaction with Budget Process 3.6 3.6 3.6 3.6
BudgetReflectsInstitutionalObjectives 3.8 3.7 3.7 3.6
SufficientResourcestoDoJob 4.1 4.1 4.1 4.0
Composite Rating for Budgetary Process 3.8 3.7 3.7 3.7
SOURCE:OfficeofInstitutionalAdvancement,SPC

2015-2016 Performance Report South Plains College – 41
Data Analysis: Employee satisfaction with the budgetary process remains above average. Executive leadership will continue to provide more information about the budgetary process and to encourage em-ployee input into planning and budgeting. The Office of Institutional Advancement will oversee the administration of the Employee Survey during the 2018 spring semester.
The standard is met.
BENCHMARK AND RESULTSE-2.2 The level of employee satisfaction with administrative support services will be above aver-
age (3.5 or greater on 5.0 scale).EMPLOYEE SATISFACTION WITH ADMINISTRATIVE SUPPORT SERVICES
FROM SUPPORT SERVICES SURVEY
Administrative Processes 2009 2012 2015
PurchasingOfficeandOperations(DPS) 3.79 3.90 3.87
Campus Copy Center and Copy Services 4.46 4.43 4.27
Telephone Communication System and Services 4.26 4.11 3.91
CampusPostOfficeandMailServices 4.28 4.18 4.22
MarketingandRecruitmentOfficeandServices 3.82 3.61 3.48
Physical Plant, Maintenance and Custodial Services 4.10 4.03 4.02
HumanResourcesOfficeandServices 4.26 4.30 4.33
Wellness and Fitness Program 3.59 3.57 3.68
BusinessOfficeandServices 4.16 4.15 4.08
DevelopmentandAlumniRelationsOfficeandServices 3.92 4.02 3.87
InformationTechnologyOfficeandServices 4.11 3.85 3.91
Campus Food Service 4.02 4.06 4.01
Campus Bookstore Services 3.86 3.78 3.23
InstitutionalResearchOfficeServices NA NA 3.66
InstitutionalEffectivenessOfficeandServices NA NA 3.71
SOURCE:OfficeofInstitutionalAdvancement,SPC
Data Analysis: The Administrative Support Services Survey was developed by the Institutional Effectiveness Committee and first administered in 2005. The survey statements were revised in Fall 2008 to align better with the services provided in administrative areas, and the survey was administered in Spring 2009. Service area directors and supervisors recommended minor revisions to the survey that were made for the 2012 administration. Respondents were asked to rate their level of agreement with 42 satisfaction statements on a scale of 1 (strongly disagree) to 5 (strongly agree). Arithmetic means were calculated for each scaled statement, and a composite mean was calculated for each service area. Employee satisfaction with administrative services is generally above average in that 13 of 15 service area satisfaction means exceeded the 3.5 benchmark. The Administrative Support Services Survey will be administered in 2018.
The standard is met.

42 – South Plains College 2015-2016 Performance Report
BENCHMARK AND RESULTSE-2.3 The annual audit of financial statements and accounting procedures by independent, state
and federal auditors will produce no qualified opinions or material internal control weak-nesses.
RESULTS OF ANNUAL AUDIT OPINIONS
Data Elements FY 2013-14 FY 2014-15 FY 2015-16
Independent Audit Exceptionsor Management Letters None None None
State Audit Exceptionsor Management Letters None None None
Federal Audit Exceptionsor Management Letters None None None
SOURCE: Annual Audit Reports
Data Analysis: Financial audits for the years examined produced no qualified opinions or identified material internal control weaknesses.
The standard is met.
BENCHMARK AND RESULTSE-2.4 The distribution of college resources by major college function will demonstrate stability
over time.DISTRIBUTION OF COLLEGE RESOURCES BY MAJOR COLLEGE FUNCTION
College Function FY 2012 FY 2013 FY 2014 FY 2015 FY 2016
Instruction 54.8% 52.1% 51.4% 49.7% 51.3%
Academic Support 5.2% 5.0% 4.9% 5.8% 5.6%
Student Services 12.9% 12.6% 12.6% 11.7% 11.5%
Institutional Support 9.8% 9.8% 9.9% 12.1% 12.4%
Operation and Plant Maintenance 11.2% 12.1% 12.0% 11.6% 11.2%
Auxiliary Enterprises 5.0% 5.4% 6.1% 5.9% 5.5%
Public Service 2.3% 2.4% 2.3% 2.2% 1.6%
Debt Service 0.6% 0.6% 0.9% 1.1% 1.0%
Total 100.0% 100.0% 100.0% 100.0% 100.0%SOURCE: Annual Audit Reports, SPC
Data Analysis: The expenditure of funds demonstrates stability. The major expenditure is for instruction, fol-lowed by students services, operation and plant maintenance and institutional support. The per-centage of resources distributed to instruction has decreased 3.5 percentage points in the past five years, while the percentage of resources for student services has declined by 1.4 percentage points. Resources to all other college functional areas have remained stable.
The standard is met.
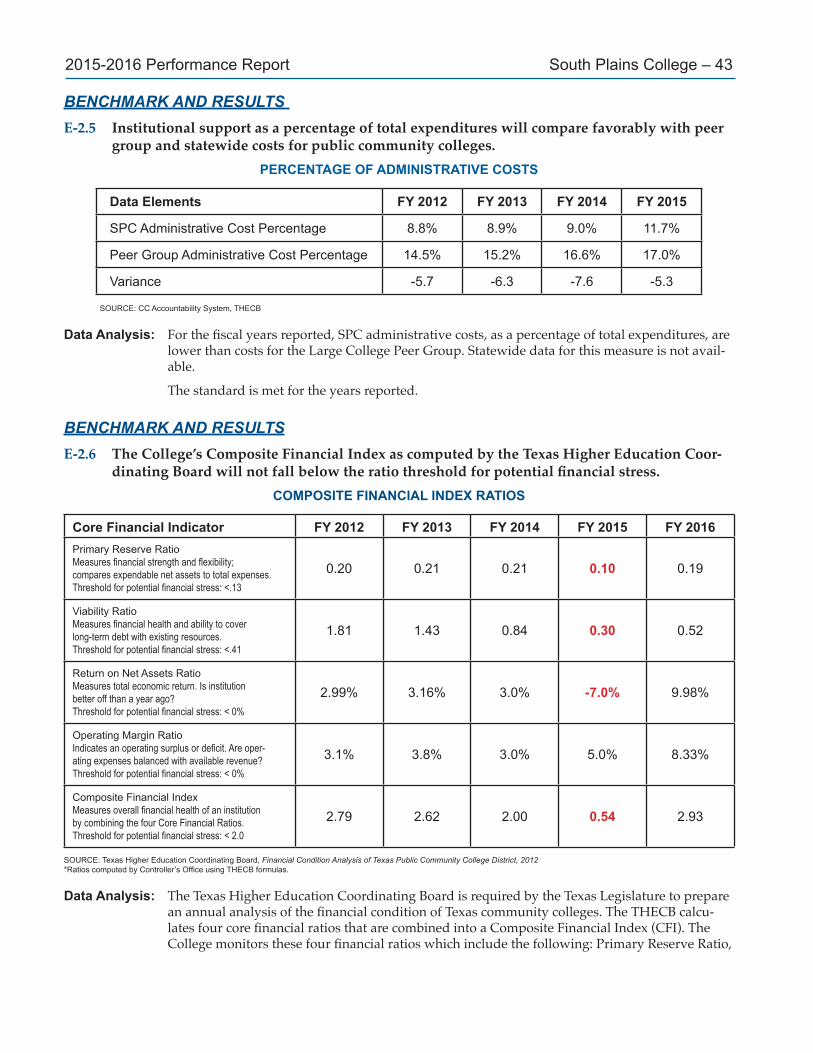
2015-2016 Performance Report South Plains College – 43
BENCHMARK AND RESULTS E-2.5 Institutional support as a percentage of total expenditures will compare favorably with peer
group and statewide costs for public community colleges.PERCENTAGE OF ADMINISTRATIVE COSTS
Data Elements FY 2012 FY 2013 FY 2014 FY 2015
SPC Administrative Cost Percentage 8.8% 8.9% 9.0% 11.7%
Peer Group Administrative Cost Percentage 14.5% 15.2% 16.6% 17.0%
Variance -5.7 -6.3 -7.6 -5.3
SOURCE: CC Accountability System, THECB
Data Analysis: For the fiscal years reported, SPC administrative costs, as a percentage of total expenditures, are lower than costs for the Large College Peer Group. Statewide data for this measure is not avail-able.
The standard is met for the years reported.
BENCHMARK AND RESULTSE-2.6 The College’s Composite Financial Index as computed by the Texas Higher Education Coor-
dinating Board will not fall below the ratio threshold for potential financial stress.COMPOSITE FINANCIAL INDEX RATIOS
Core Financial Indicator FY 2012 FY 2013 FY 2014 FY 2015 FY 2016Primary Reserve RatioMeasures financial strength and flexibility;compares expendable net assets to total expenses. Threshold for potential financial stress: <.13
0.20 0.21 0.21 0.10 0.19
Viability RatioMeasures financial health and ability to coverlong-term debt with existing resources.Threshold for potential financial stress: <.41
1.81 1.43 0.84 0.30 0.52
Return on Net Assets RatioMeasures total economic return. Is institutionbetter off than a year ago?Threshold for potential financial stress: < 0%
2.99% 3.16% 3.0% -7.0% 9.98%
Operating Margin Ratio Indicates an operating surplus or deficit. Are oper-ating expenses balanced with available revenue?Threshold for potential financial stress: < 0%
3.1% 3.8% 3.0% 5.0% 8.33%
Composite Financial IndexMeasures overall financial health of an institutionby combining the four Core Financial Ratios.Threshold for potential financial stress: < 2.0
2.79 2.62 2.00 0.54 2.93
SOURCE: Texas Higher Education Coordinating Board, Financial Condition Analysis of Texas Public Community College District, 2012*RatioscomputedbyController’sOfficeusingTHECBformulas.
Data Analysis: The Texas Higher Education Coordinating Board is required by the Texas Legislature to prepare an annual analysis of the financial condition of Texas community colleges. The THECB calcu-lates four core financial ratios that are combined into a Composite Financial Index (CFI). The College monitors these four financial ratios which include the following: Primary Reserve Ratio,

44 – South Plains College 2015-2016 Performance Report
Viability Ratio, Return on Net Assets Ratio, and Net Operating Revenues Ratio. Thresholds have been established for the four CFI ratios to indicate potential financial stress on the institution. These thresholds are indicated in the above data table. With the exception of FY2015, the College exceeded the minimum thresholds for all four financial ratios and the overall CFI target. These financial ratios are indicators of the financial well-being of the College and provide evidence that the College has benefitted from sustained financial stability.
The standard is met.
Measurement E-3: Acquisition of Public/Private ResourcesBENCHMARK AND RESULTSE-3.1 The distribution of income by major source will demonstrate stability over time.
DISTRIBUTION OF INCOME BY MAJOR SOURCE OF REVENUE
Income Sources FY 2012 FY 2013 FY 2014 FY 2015 FY 2016
Student Tuition and Fees 43.7% 42.0% 41.4% 44.4% 43.1%
State Appropriations 30.5% 29.1% 29.6% 29.0% 29.6%
Ad Valorem Tax Collections 18.9% 21.0% 20.5% 19.4% 18.6%
Govt. Grants and Contracts 3.0% 3.1% 3.7% 2.1% 2.6%
Private Gifts and Grants 0.2% 0.3% 0.2% 0.1% 0.1%
Auxiliary Sources 3.3% 3.6% 3.6% 4.3% 4.0%
Other Sources 0.6% 0.7% 1.0% 0.7% 2.0%
Total 100.0% 100.0% 100.0% 100.0% 100.0%SOURCE: Annual Audit Reports, SPC
Data Analysis: The income from various sources demonstrates stability, even though the burden of funding college operations has shifted to student tuition and fees since FY 2003. During FY 2016, student tuition and fees funded 43.1% of the College’s operations. State appropriations have continued to fund a smaller percentage of the overall operations of South Plains College, dropping from 30.5% in FY 2012 to 29.6% in FY 2016. Local sources of revenue have decreased, reflecting fluc-tuating mineral values within the College’s Tax District. The return of federal tax dollars in the form of grants and student federal financial aid ($31,144,170 in FY 2016) from Washington and the return of state grants and appropriations ($16,234,668) from Austin are major contributors to the local economy. The sum of those two sources ($47.4 million) turns over 3.5 times (a very conservative number) in the local economy and has an economic impact of approximately $166 million annually. The $166 million would represent a return of $13.16 for each local tax dollar ($12,595,785) invested in the College enterprise.
The standard is met.

2015-2016 Performance Report South Plains College – 45
BENCHMARK AND RESULTSE-3.2 The acquisition of federal, state and local grants will exhibit steady growth over time.
ACQUISITION OF FEDERAL, STATE AND LOCAL GRANTS
Funding Category FY 2013 FY 2014 FY 2015 FY 2016
Federal Grant Funds $1,585,939 $2,035,284 $1,155,749 $1,554,757
State Grant Funds $426,159 $231,424 $353,260 $787,626
Local Grant Funds $764,707 $740,607 $769,613 $870,387
Total External Funds $2,776,805 $3,007,315 $2,278,622 $3,212,770
Annual Variance 3.5% 8.3% -24.2% 41.0%
SOURCE:OfficeofInstitutionalAdvancement,SPC
Data Analysis: South Plains College has made a concerted effort to acquire external funding in the form of federal, state and local grants to support the educational program of the College. After declin-ing -24.2% in FY 2015 external funds increased 41% in FY 2016. Acquisition of a new Title V Strengthening Hispanic-Serving Institutions program grant, increases in Federal Perkins funding for CTE programs, the awarding of a state Nursing Shortage Reduction Grant and an increase in scholarships provided by the SPC Foundation contributed to this increase.
The standard is met.
Action Plan: The Vice President for Institutional Advancement will study the feasibility of establishing a Grants Office with appropriate staffing and resources to identify and seek external funding sources for college projects and operations.
BENCHMARK AND RESULTSE-3.3 Contributions to the annual fund of the Foundation will exhibit steady growth over time and
will result in an increase in net assets.ANNUAL CONTRIBUTIONS TO THE SPC FOUNDATION
Fiscal Year Annual Contributions
Percent Change
Total Year-End Assets
Net Change in Assets
Percent Change
2012-13 $3,391,425 178.9% $15,052,760 $3,832,075 34.2%
2013-14 $1,085,396 -68.0% $17,917,683 $2,864,923 19.0%
2014-15 $878,320 -19.1% $17,695,120 $-222,563 -1.2%
2015-16 $858,578 -2.2% $18,681,931 $986,811 5.6%
SOURCE:OfficeofInstitutionalAdvancement,SPC
Data Analysis: The annual contributions to the South Plains College Foundation serve as a measure of con-stituent support for the College. The amounts reported here reflect actual contributions made directly to the Foundation by donors. For the years examined, contributions to the annual fund of the Foundation have reflected local economic trends. Record giving was recorded for 2012-13, due primarily to the receipt of a $2 million gift from the J.T. and Margaret Talkington Chari-table Foundation to establish a scholarship endowment. Net assets to the Foundation increased 34.2% for FY 2013 and 19.0% for FY 2014 due to sound investment strategies for endowment assets as well as increased giving. In FY 2015, the value of the Foundation’s net assets declined in response to volatile investment markets. As markets recovered in 2015-16, the Foundation’s

46 – South Plains College 2015-2016 Performance Report
asset value also improved by 5.6%. Since FY 2013, the Foundations assets have increased 24.1% overall.
The standard is met.
BENCHMARK AND RESULTSE-3.4 The number of donors to the annual fund will exhibit steady growth over time.
ANNUAL NUMBER OF DONORS TO THE SPC FOUNDATION
Fiscal Year Individual Donors % Change Total Number
of Gifts % Change
2012-13 650 -4.4% 2,478 -6.4%
2013-14 601 -7.5% 2,428 -2.0%
2014-15 576 -4.1% 2,060 -15.2%
2015-16 645 12.0% 2,058 -0.1%
SOURCE:OfficeofInstitutionalAdvancement,SPC
Data Analysis: The number of donors to the annual fund measures the base of support for charitable giving to the Foundation. For the most recent fiscal year, the number of donors and number of gifts increased 12.0%. Since FY 2013, the number of donors providing gifts has averaged about 618 individuals each year.
The standard is met.
Action Plan: The Vice President for Institutional Advancement and Director of Development and Alumni Relations, working with the Foundation Board of Directors, will develop strategies for building greater alumni and donor engagement and support.
Measurement E-4: Facility DevelopmentBENCHMARK AND RESULTSE-4.1 The level of employee satisfaction with facilities, safety and security as measured by the Em-
ployee Survey will be above average (3.5 or greater on 5.0 scale).EMPLOYEE SATISFACTION WITH PHYSICAL FACILITIES
REPORT FROM BIENNIAL EMPLOYEE SURVEY
Data Elements 2010 2012 2014 2016
Adequacy of Physical Facilities 4.0 4.0 4.0 4.0
Facilities are Conducive to Learning 4.2 4.1 4.2 4.1
Safe and Secure Environment 4.5 4.5 4.5 4.5
Composite Rating for Physical Facilities 4.2 4.2 4.2 4.2
SOURCE:OfficeofInstitutionalAdvancement,SPC
Data Analysis: The Employee Survey was administered in Spring 2016. The mean scores for each category and composite rating exceed the benchmark for all reported periods. The Office of Institutional Advancement will oversee the administration of the Employee Survey during the 2018 spring semester.
The standard is met.
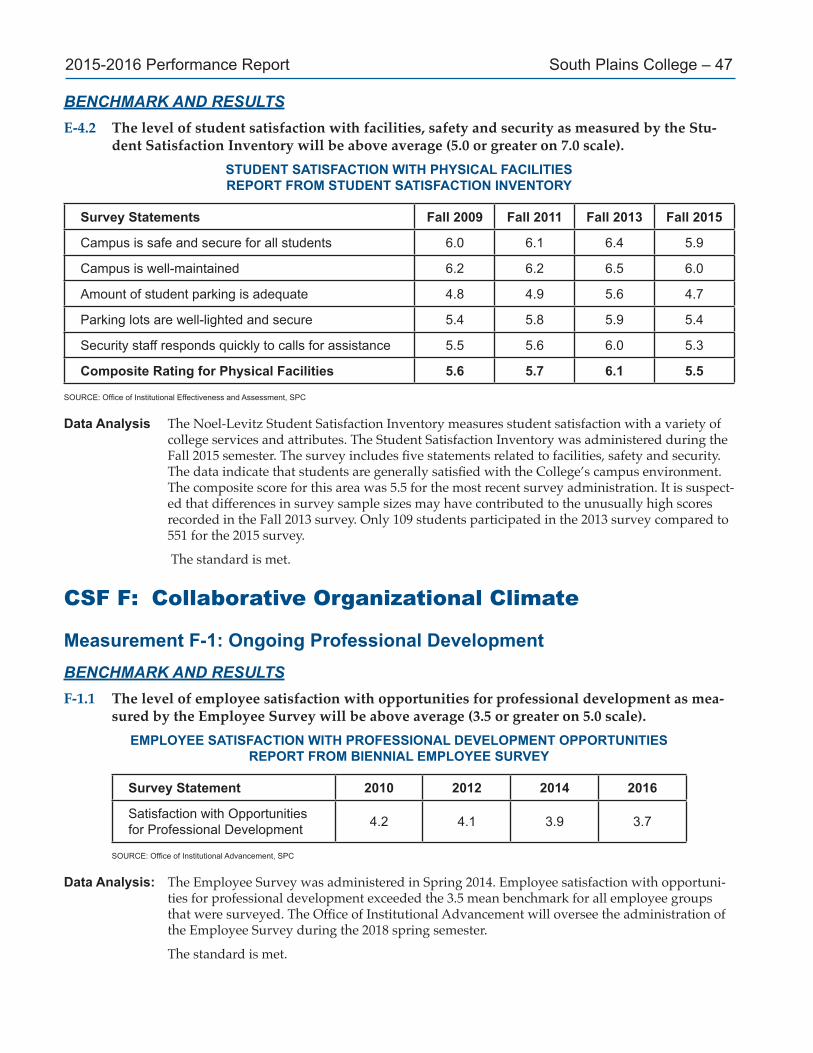
2015-2016 Performance Report South Plains College – 47
BENCHMARK AND RESULTSE-4.2 The level of student satisfaction with facilities, safety and security as measured by the Stu-
dent Satisfaction Inventory will be above average (5.0 or greater on 7.0 scale).STUDENT SATISFACTION WITH PHYSICAL FACILITIESREPORT FROM STUDENT SATISFACTION INVENTORY
Survey Statements Fall 2009 Fall 2011 Fall 2013 Fall 2015
Campus is safe and secure for all students 6.0 6.1 6.4 5.9
Campus is well-maintained 6.2 6.2 6.5 6.0
Amount of student parking is adequate 4.8 4.9 5.6 4.7
Parking lots are well-lighted and secure 5.4 5.8 5.9 5.4
Security staff responds quickly to calls for assistance 5.5 5.6 6.0 5.3
Composite Rating for Physical Facilities 5.6 5.7 6.1 5.5
SOURCE:OfficeofInstitutionalEffectivenessandAssessment,SPC
Data Analysis The Noel-Levitz Student Satisfaction Inventory measures student satisfaction with a variety of college services and attributes. The Student Satisfaction Inventory was administered during the Fall 2015 semester. The survey includes five statements related to facilities, safety and security. The data indicate that students are generally satisfied with the College’s campus environment. The composite score for this area was 5.5 for the most recent survey administration. It is suspect-ed that differences in survey sample sizes may have contributed to the unusually high scores recorded in the Fall 2013 survey. Only 109 students participated in the 2013 survey compared to 551 for the 2015 survey.
The standard is met.
CSF F: Collaborative Organizational Climate
Measurement F-1: Ongoing Professional DevelopmentBENCHMARK AND RESULTSF-1.1 The level of employee satisfaction with opportunities for professional development as mea-
sured by the Employee Survey will be above average (3.5 or greater on 5.0 scale).EMPLOYEE SATISFACTION WITH PROFESSIONAL DEVELOPMENT OPPORTUNITIES
REPORT FROM BIENNIAL EMPLOYEE SURVEY
Survey Statement 2010 2012 2014 2016
Satisfaction with Opportunities for Professional Development 4.2 4.1 3.9 3.7
SOURCE:OfficeofInstitutionalAdvancement,SPC
Data Analysis: The Employee Survey was administered in Spring 2014. Employee satisfaction with opportuni-ties for professional development exceeded the 3.5 mean benchmark for all employee groups that were surveyed. The Office of Institutional Advancement will oversee the administration of the Employee Survey during the 2018 spring semester.
The standard is met.

48 – South Plains College 2015-2016 Performance Report
Measurement F-2: Employee DiversityBENCHMARK AND RESULTSF-2.1 The College will demonstrate progress toward increasing the number and percentage of
minority faculty, administration and professional staff to reflect the ethnicity of the student population within five percentage points parity.
ETHNICITY OF FACULTY AND PROFESSIONAL STAFF
Race/EthnicityFall 2014 Fall 2015 Fall 2016
Number Percent Number Percent Number Percent
Anglo 362 89.8% 365 89.2% 355 87.0%
African-American 8 2.0% 8 2.0% 9 2.2%
Hispanic 27 6.7% 31 7.6% 36 8.8%
Asian 6 1.5% 5 1.2% 8 2.0%
Total 403 100% 409 100% 408 100%
Percent of Student Population (Fall Enrollment)
Anglo 49.4% 46.8% 45.6%
African-American 6.4% 6.4% 6.5%
Hispanic 40.2% 42.7% 43.8%
Asian 1.5% 1.5% 1.4%
Other Ethnic Origin 2.5% 2.6% 2.8%
SOURCE:OfficeofHumanResources,SPC
Data Analysis: The data which reflects the diversity of faculty and professional staff are reported by the Human Resources Office. Employee data for this table is reported as of Oct. 1 of each year. In the profes-sional area, the College has increased the number of Hispanic professionals by nine individuals over the past three reporting periods. The number of African-American professional staff has in-creased by one individual. The number of Asian professionals have increased by two individu-als. However, significant gaps exist primarily among Hispanic professionals when compared to the diversity of the SPC student body (-35.0 percentage points for Hispanic students). While the gap for African-American professionals is -4.3 percentage points and within the range of varia-tion, the College recognizes that this gap needs to improve toward parity over time, as well.
The standard is not met for the Hispanic employee group.
Action Plan: The Human Relations Office will continue to actively seek to increase the diversity of its pool of qualified applicants for professional positions at the College.

2015-2016 Performance Report South Plains College – 49
BENCHMARK AND RESULTSF-2.2 Other full-time employees of the College will reflect the ethnicity of the student population
of the College within five percentage points parity.ETHNICITY OF CLASSIFIED SUPPORT STAFF
Race/EthnicityFall 2014 Fall 2015 Fall 2016
Number Percent Number Percent Number Percent
Anglo 74 42.8% 72 43.1% 71 43.8%
African-American 6 3.5% 3 1.8% 4 2.5%
Hispanic 93 53.7% 92 55.1% 87 53.7%
Asian 0 0.0% 0 0.0% 0 0.0%
Total 173 100% 167 100% 162 100%
Percent of Student Population (Fall Enrollment)
Anglo 49.4% 46.8% 45.6%
African-American 6.4% 6.4% 6.5%
Hispanic 40.2% 42.7% 43.8%
Asian 1.5% 1.5% 1.4%
Other Ethnic Origin 2.5% 2.6% 2.8%
SOURCE:OfficeofHumanResources,SPC
Data Analysis: The data which reflects the diversity of classified support staff is reported by the Human Re-sources Office. Employee data for this table is reported as of Oct. 1 of each year. For this group, the percentage of Hispanic employees currently exceeds the percentage of Hispanic students who enroll at SPC by +9.9 percentage points. The percentage of African-American employ-ees was 2.5% for Fall 2016, -4.0 percentage points less than the SPC student body. This gap is reaching the outer limits of the range of variation. The College recognizes that this gap needs to improve toward parity over time. The Human Resources Office will continue to actively seek to increase the diversity of its pool of qualified applicants for classified positions at the College.
The standard is met.

50 – South Plains College 2015-2016 Performance Report
Measurement F-3: Employee SatisfactionBENCHMARK AND RESULTSF-3.1 Composite scores on all subscales of the Employee Survey will be at least 3.5 on 5.0 scale.
EMPLOYEE SURVEY RESULTSREPORT FROM BIENNIAL EMPLOYEE SURVEY
Survey Subscales 2010 2012 2014 2016
Student Focus 4.4 4.3 4.4 4.3
Learning Focus 4.3 4.3 4.3 4.3
Access and Diversity 4.3 4.3 4.3 4.2
Employee Focus 4.1 4.0 4.0 3.9
Employee Empowerment 4.1 4.1 4.0 3.9
Supervisory Management 4.2 4.1 4.1 4.0
Cooperation and Teamwork 4.0 3.9 3.8 3.8
Rewards and Recognition 3.7 3.6 3.6 3.5
Quality Work Environment 4.1 4.0 4.0 3.9
Organizational Communications 3.7 3.7 3.6 3.6
Internal Customer Focus 4.2 4.1 4.1 4.1
Physical Environment 4.2 4.2 4.3 4.2
Community Focus 4.1 4.0 4.1 3.9
Leadership Focus 3.9 3.8 3.8 3.8
Planning and Effectiveness 3.6 3.7 3.7 3.6
Leadership 4.0 4.0 4.0 3.9
Budgeting and Resources 3.8 3.7 3.7 3.7
SOURCE:OfficeofInstitutionalAdvancement,SPC
Data Analysis: The biennial Employee Survey measures employee satisfaction and the organizational climate of the College. Survey statement are correlated with the College’s seven areas of commitment which form the organizational values of the institution. For the data presented here, employees continue to rate student focus, learning focus and access and diversity as important strengths for the College. These subscales and those for employee focus, quality work environment, and community focus scored a 4.0 composite mean. All subscale categories meet or exceed the 3.5 benchmark for the most recent survey results. The Office of Institutional Advancement will oversee the administration of the Employee Survey during the 2018 spring semester.
The standard is met.