Embed Size (px)
Citation preview
KWAHU AFRAM PLAINS SOUTH

ii
Copyright © 2014 Ghana Statistical Service
iii
PREFACE AND ACKNOWLEDGEMENT
No meaningful developmental activity can be undertaken without taking into account the
characteristics of the population for whom the activity is targeted. The size of the population
and its spatial distribution, growth and change over time, in addition to its socio-economic
characteristics are all important in development planning.
A population census is the most important source of data on the size, composition, growth
and distribution of a country’s population at the national and sub-national levels. Data from
the 2010 Population and Housing Census (PHC) will serve as reference for equitable
distribution of national resources and government services, including the allocation of
government funds among various regions, districts and other sub-national populations to
education, health and other social services.
The Ghana Statistical Service (GSS) is delighted to provide data users, especially the
Metropolitan, Municipal and District Assemblies, with district-level analytical reports based
on the 2010 PHC data to facilitate their planning and decision-making.
The District Analytical Report for the Kwahu Afram Plains South is one of the 216 district
census reports aimed at making data available to planners and decision makers at the district
level. In addition to presenting the district profile, the report discusses the social and
economic dimensions of demographic variables and their implications for policy formulation,
planning and interventions. The conclusions and recommendations drawn from the district
report are expected to serve as a basis for improving the quality of life of Ghanaians through
evidence-based decision-making, monitoring and evaluation of developmental goals and
intervention programmes.
For ease of accessibility to the census data, the district report and other census reports
produced by the GSS will be disseminated widely in both print and electronic formats. The
report will also be posted on the GSS website: www.statsghana.gov.gh.
The GSS wishes to express its profound gratitude to the Government of Ghana for providing
the required resources for the conduct of the 2010 PHC. While appreciating the contribution
of our Development Partners (DPs) towards the successful implementation of the Census, we
wish to specifically acknowledge the Department for Foreign Affairs, Trade and
Development (DFATD) formerly the Canadian International Development Agency (CIDA)
and the Danish International Development Agency (DANIDA) for providing resources for
the preparation of all the 216 district reports. Our gratitude also goes to the Metropolitan,
Municipal and District Assemblies, the Ministry of Local Government, Consultant Guides,
Consultant Editors, Project Steering Committee members and their respective institutions for
their invaluable support during the report writing exercise. Finally, we wish to thank all the
report writers, including the GSS staff who contributed to the preparation of the reports, for
their dedication and diligence in ensuring the timely and successful completion of the district
census reports.
Dr. Philomena Nyarko
Government Statistician
iv
TABLE OF CONTENTS
PREFACE AND ACKNOWLEDGEMENT ............................................................................. iii
LIST OF TABLES ....................................................................................................................... vi
LIST OF FIGURES .................................................................................................................... vii
ACRONYMS AND ABBREVIATIONS .................................................................................. viii
EXECUTIVE SUMMARY ......................................................................................................... ix
CHAPTER ONE: INTRODUCTION ........................................................................................ 1 1.1 Introduction ...................................................................................................................... 1
1.2 Physical Features ............................................................................................................. 1 1.3 Political Administration .................................................................................................. 2
1.4 Cultural and Social Structure ........................................................................................... 2 1.5 The Economy ................................................................................................................... 4 1.6 Census Methodology, Concepts and Definitions ............................................................. 4 1.7 Organization of the report .............................................................................................. 14
CHAPTER TWO: DEMOGRAHPIC CHARACTERISTICS .............................................. 16 2.1 Introduction .................................................................................................................... 16
2.2 Population Size and Distribution ................................................................................... 16 2.3 Age-sex, structure........................................................................................................... 16 2.4 Fertility, Mortality and Migration .................................................................................. 18
CHAPTER THREE : SOCIAL CHARACTERISTICS ....................................................... 23 3.1 Introduction .................................................................................................................... 23
3.2 Household Size, Composition and Headship ................................................................. 23
3.3 Marital status .................................................................................................................. 24
3.4 Nationality ...................................................................................................................... 28 3.5 Religious Affiliation ....................................................................................................... 28
3.6 Literacy and Education................................................................................................... 29
CHAPTER FOUR: ECONOMIC CHARACTERISTICS .................................................... 33 4.1 Introduction .................................................................................................................... 33
4.2 Economic Activity Status ............................................................................................... 33 4.3 Occupation ..................................................................................................................... 35 4.4 Industry........................................................................................................................... 36
4.5 Employment Status ........................................................................................................ 37 4.6 Employment Sector ........................................................................................................ 38
CHAPTER FIVE: INFORMATION COMMUNICATION TECHNOLOGY ................... 39 5.1 Introduction .................................................................................................................... 39
5.2 Ownership of Mobile Phones ......................................................................................... 39 5.3 Use of Internet ................................................................................................................ 39 5.4 Household ownership of Desktop or Laptop computer ................................................. 40
v
CHAPTER SIX: DISABILITY ................................................................................................ 41 6.1 Introduction .................................................................................................................... 41 6.2 Population with Disability .............................................................................................. 41 6.3 Type of Disability........................................................................................................... 41
6.4 Disability by Type of Locality ....................................................................................... 41 6.5 Disability and Economic Activity .................................................................................. 43 6.6 Disability, Education and Literacy ................................................................................. 44
CHAPTER SEVEN: AGRICULTURAL ACTIVITIES ........................................................ 46 7.1 Introduction .................................................................................................................... 46
7.2 Households in Agriculture ............................................................................................. 46 7.3 Types of Farming ........................................................................................................... 46 7.4 Types of livestock and other animals reared .................................................................. 47
CHAPTER EIGHT: HOUSING CONDITIONTS ................................................................. 49 8.1 Introduction .................................................................................................................... 49 8.2 Housing stock ................................................................................................................. 49 8.3 Type of Dwelling, Holding and Tenancy arrangements ................................................ 50 8.4 Construction materials.................................................................................................... 51
8.5 Room occupancy ............................................................................................................ 53
8.6 Access to Utilities and Household facilities ................................................................... 54 8.7 Main Source of Water for drinking and for other domestic use..................................... 55
8.8 Bathing and Toilet Facilities .......................................................................................... 56 8.9 Method of Waste disposal ............................................................................................. 57
CHAPTER NINE: SUMMARY OF FINDINGS AND RECOMENDATIONS .................. 59 9.1 Introduction .................................................................................................................... 59 9.2 Summary of Main Findings ........................................................................................... 59
9.3 Recommendations .......................................................................................................... 62
REFERENCES ............................................................................................................................ 63
APPENDICES ............................................................................................................................. 64
LIST OF CONTRIBUTORS ..................................................................................................... 66
vi
LIST OF TABLES
Table 2.1: Population by Age, Sex and type of locality .......................................................... 18 Table 2.2: Female population 12 years and older by age children ever born, children surviving and sex of child ......................................................................... 19 Table 2.3: Reported total fertility rate, general fertility rate and crude birth rate .................... 20 by district, Eastern Region ...................................................................................... 20
Table 2.4: Total population, deaths in households and crude death rate, by District ............... 21 Table 2.5: Birthplace by duration of residence of migrants ...................................................... 22 Table 3.1a:Household size by type of locality .......................................................................... 23 Table 3.1b:Household population by composition and sex ...................................................... 24 Table 3.2: Household population by structure and sex ............................................................ 24
Table 3.3: Persons 12 years and older by sex, age-group and marital status ........................... 25 Table 3.4: Persons 12 years and older by sex, level of education and marital status .............. 26
Table 3.5: Persons 12 years and older by sex, marital status and economic activity status .... 27
Table 3.6: Population by nationality and sex ........................................................................... 28 Table 3.7: Population by religion and sex ............................................................................... 28 Table 3.8: Population 11 years and older by sex, age and literacy status ................................ 29
Table 3.9: Population 3 years and older by level of education, school attendance and sex .... 32 Table 4.1: Population 15 years and older by activity status and sex ....................................... 34 Table 4.2: Persons 15 years and older by age economic activity status and sex ..................... 35
Table 4.3: Employed population 15 years and older by occupation and sex ........................... 36 Table 4.4: Employed population 15 years and older by Industry and Sex .............................. 37
Table 4.5: Employed population 15 years and older by employment status and sex .............. 38 Table 4.6: Employed population 15 years & older by employment sector and sex ................ 38 Table 5.1: Population 12 years and older by mobile phone ownership,
internet facility usage, and Sex ............................................................................... 40
Table 5.2: Households having desktop/laptop computers by sex ............................................ 40 Table 6.1: Population by type of locality, disability type and sex ........................................... 42 Table 6.2: Persons 15 years & older with disability by economic activity status & sex ......... 44
Table 6.5. Population 3 years and older by sex, disability type and level of education .......... 45
Table 7.1: Households by agricultural activities and locality .................................................. 46 Table 7.2: Distribution of livestock, other animals and keepers.............................................. 48 Table 8.1: Stock of houses and households by type of locality ................................................ 49 Table 8.2: Ownership status of dwelling by sex of household head and type of locality ........ 50 Table 8.3: Type of occupied dwelling unit by sex of household head and type of locality ..... 51
Table 8.4: Main construction material for outer wall of dwelling unit by type of locality ..... 52 Table 8.5: Main construction materials for the floor of dwelling unit by type of locality ...... 52 Table 8.6: Main construction material for roofing of dwelling unit by type of locality .......... 53 Table 8.7: Household size and number of sleeping rooms occupied in dwelling unit ............ 53
Table 8.8: Main source of lighting of dwelling unit by type of locality ................................... 54 Table 8.9: Main source of water of dwelling unit for drinking and other domestic purposes .. 55 Table 8.10:Bathing facility and toilet facilities used by household .......................................... 57
Table 8.11:Method of rubbish and liquid waste disposal by households ................................. 58 Table A1: Population by sex number of households and houses in the 20 largest communities .......................................................................................................... 64 Table A2: Population by age group in the 20 largest communities ......................................... 65
vii
LIST OF FIGURES
Figure 1.1: Map of Kwahu Afram Plains South District .......................................................... 3
Figure 2.1: Population pyramid ............................................................................................... 17
Figure 6.1: Types of disability, 2010 ....................................................................................... 43
Figure 7.1: Households in agriculture by locality .................................................................... 47
viii
ACRONYMS AND ABBREVIATIONS
CEB: Children Ever Born
CIDA: Canadian International Development Agency
CS: Children Surviving
DANIDA: Danish International Development Agency
DFID: Department for International Development
DMTDP: District Medium Term Development Plan
ECOWAS: Economic Community of West African States
EA: Enumeration Area
EU: European Union
GSS: Ghana Statistical Service
GES: Ghana Education Service
ICT: Information Communication Technology
JSS: Junior Secondary School
JHS: Junior High School
SSS: Senior Secondary School
SHS: Senior High School
LEAP: Livelihood Empowerment Against Poverty
MMDAs: Metropolitan, Municipal and District Assemblies
MDGs: Millennium Development Goals
NHIS: National Health Insurance Scheme
NGOs: Non-governmental Organisations
PHC: Population and Housing Census
PES: Post Enumeration Survey
PWDs: Persons with Disabilities
UN: United Nations
UNDP: United Nations Development Programme
UNFPA: United Nations Population Fund
WHO: World Health Organization
WC: Water Closet
ix
EXECUTIVE SUMMARY
Introduction
The district census report is the first of its kind since the first post-independence census was
conducted in 1960. The report provides basic information about the district. It gives a brief
background of the district, describing its physical features, political and administrative
structure, socio-cultural structure and economy. Using data from the 2010 Population and
Housing Census (2010 PHC), the report discusses the population characteristics of the district,
fertility, mortality, migration, marital status, literacy and education, economic activity status,
occupation, employment; Information Communication Technology (ICT), disability,
agricultural activities and housing conditions of the district. The key findings of the analysis are
as follows (references are to the relevant sections of the report):
Population size, structure and composition
The population of Kwahu Afram Plains South District, according to the 2010 Population and
Housing Census, is 115,812 representing 4.3 percent of the region’s total population. Males
constitute 53.9 percent and females represent 46.1 percent. More than seventy percent (75.4%)
of the population is rural. The district has a sex ratio of 117.0. The population of the district is
youthful (42.2%) depicting a broad base population pyramid which tapers off with a small
number of elderly persons (3.3%). The total age dependency ratio for the District is 84.7, the
age dependency ratio for males is lower (83.1) than that of females (86.6).
Fertility, mortality and migration
The Total Fertility Rate for the district 4.7. The General Fertility Rate is 140.6 births per 1000
women aged 15-49 years which is among the districts with the highest for the region. The
Crude Birth Rate (CBR) is 30.9 per 1000 population. The crude death rate for the district is 4.7
per 1000. Majority of migrants (29.8 percent) living in the district were born elsewhere in the
region whiles 67.8 percent of the migrants are born elsewhere in another region.
Household Size, composition and structure
The district has a household population of 113,324 with a total number of 25,007 households.
The average household size in the district is 4.6 persons per household. Children constitute the
largest proportion of the household structure accounting for 46.8 percent. Spouses form about
12.4 percent. Nuclear households (head, spouse(s) and children) constitute 38.1 percent of the
total number of households in the district.
Marital status
About five in ten (51.3%) of the population aged 12 years and older are married, 36.5 percent
have never married, 4.2 percent are in consensual unions, 2.8 percent are widowed, 3.0
percent are divorced and 2.2 percent are separated. By age 25-29 years, more than seventy of
females (73.9%) are married compared to a little above one-fourth of males (46.8%). At age
65 and above, widowed females account for as high as 42.9 percent while widowed males
account for only 8.9 percent. . Among the married, 40.1 percent have no education while
about 26.4 percent of the unmarried have never been to school. More than ninety percent of
the married population (98.0%) are employed, 2.0 percent are unemployed and 19.5 percent
are economically not active. A greater proportion of those who have never married (40.2%)
are economically not active with 2.9 percent unemployed.
x
Nationality
The proportion of Ghanaians by birth in the district is 93.2 percent. Those who have
naturalised constitute 1.1 percent and the non-Ghanaian population in the district is 2.0
percent.
Literacy and education
Of the population 11 years and above, 57.1 percent are literate and 42.9 percent are non-
literate. The proportion of literate males is higher (33.2 %) than that of females (23.8%). Five
out of ten people (59.3%) indicated they could speak and write both English and Ghanaian
languages. Of the population aged 3 years and in the district, 19.0 percent has never attended
school, more than fifty percent are currently attending and 82.1 percent have attended in the
past.
Economic Activity Status
About 85.3 percent of the population aged 15 years and older are economically active while
14.1 per cent are economically not active. Of the economically active population, 97.9
percent are employed while 2.1 percent are unemployed. For those who are economically not
active, a larger percentage of them are students (48.7%), 28.5% perform household duties and
6.5 percent are disabled or too sick to work. Five out of ten (50.4%) unemployed are seeking
work for the first time.
Occupation
Of the employed population, about 77.2 percent are engaged as skilled agricultural, forestry
and fishery workers, 7.3 percent in service and sales, 10.0 percent in craft and related trade,
and 2.7 percent are engaged as managers, professionals, and technicians.
Employment status and sector
Of the population 15 years and older 68.6 percent are self-employed without employees, 18.6
percent are contributing family workers, 1.1 percent are casual workers and 0.5 percent are
domestic employees (house helps). Overall, females constitute the highest proportion in each
employment category except employees. The private informal sector is the largest employer
in the district, employing 95.9 percent of the population followed by the public sector with
2.0 percent.
Information Communication Technology
Of the population 12 years and above, 27.1 percent have mobile phones. Males who own
mobile phones constitute 31.8 percent as compared to 21.4 percent of females. About 1.0
percent of the population 12 years and older use internet facilities in the district. Only 252
households representing 0.9 percent of the total households in the district have desktop/laptop
computers.
Disability
About 1.9 percent of the district’s total population has one form of disability or the other. The
proportion of the male population with disability is slightly higher (2.0%) than females
(1.8%). The types of disability in the district include sight, hearing, speech, physical,
intellect, and emotion. Persons with sight disability recorded the highest of 41.8 percent
followed by physical disability (22.3%). About 1.4 percent of the population with disability
are in the urban localities. There are more females with sight, physical and emotional
xi
disabilities than males in both the urban and rural localities. Of the population disabled, 54.5
percent have never been to school.
Agriculture
As high as 77.4 percent of households in the district are engage in agriculture. In the rural
localities, eight out of ten households (83.4%) are agricultural households while in the urban
localities, 60.1 percent of households are into agriculture. Most households in the district
(93.3%) are involved in crop farming. Poultry (chicken) is the dominant animal reared in the
district
Housing
The housing stock of Kwahu Afram Plains South District is 23,430 representing 5.4 percent
of the total number of houses in the Eastern Region. The average number of persons per
house is 4.9.
Type, tenancy arrangement and ownership of dwelling units
Less than half (34.6%) of all dwelling units in the district are compound houses; 43.2 percent
are separate houses and 7.0 percent are semi-detached houses. More than half (73.4%) of the
dwelling units in the district are owned by members of the household; 16.7 percent are owned
by private individuals; 6.8 percent are owned by a relative who is not a member of the
household.
Material for construction of outer wall, floor and roof
The main construction material for outer walls of dwelling units in the district is mud bricks
or earth accounting for 81.8 percent with cement blocks constituting 13.9 percent of outer
walls of dwelling units in the district. Cement (47.1%) and mud/earth (50.4%) are the two
main materials used in the construction of floors of dwelling units in the district. Thatch/palm
leaf or raffia are the main roofing material (56.7 %) for dwelling units in the district.
Room occupancy
One room constitutes the highest percentage (45.4%) of sleeping rooms occupied by
households in housing units in the district. About 4.7 percent of households with 10 or more
members occupy single rooms.
Utilities and household facilities
The three main sources of lighting in dwelling units in the district are flash light/torch 46.2
percent, kerosene lamp (26.8%) and electricity mains (24.2%) The main source of fuel for
cooking for most households in the district is wood (70.5%). The proportion for rural (88.4%)
is higher than that of urban (11.6%). The three main sources of water in the district are
borehole/pump/tube well (42.5%), river/stream (38.2%) and Public tap/standpipe 7.1 percent.
The most important toilet facility used in the district is bush/beach/field or no facility with
44.2 percent and this is followed by Public toilet (WC/KVIP/Pit/Pan etc.) constituting 23.7
percent and Pit latrine with 22.5 percent. About a third of households (29.4%) in the district
share separate bathrooms in the same house while 32.3 percent own bathrooms for their
exclusive use.
xii
Waste disposal
The most widely method of solid waste disposal is by public dump in the open space
accounting for 30.0 percent. About two in ten households (25.1%) dump their solid waste
indiscriminately. House to house waste collection accounts for 8.8 percent. For liquid waste
disposal, throwing waste onto the compound (80.2%) and onto the street (11.8%) are the two
most common methods used by households in the district.
1
CHAPTER ONE
INTRODUCTION
1.1 Introduction
The Kwahu Afram Plains South District was carved out from the Kwahu North District and
forms part of the newly created districts in the country which were inaugurated on 19th
June,
2012. The Legislative Instrument (LI) that established the District is 2045 and was passed in
2012. In general, this chapter captures details of the District under the following headings;
physical features, political administrative structure, cultural and social structure and the
economy.
1.2 Physical Features
1.2.1 Location and Size
The District is located between Latitudes 6o
40I N and 7
0 10
’1 N; longitudes 0
O 40
I E and 0
o
10I E; at the North-Western corner of Eastern Region with a total land area of approximately
3,095 sq km. The District is bounded to the north by the Kwahu Afram Plains North, to the
south by Kwahu South, to the east by the Volta River and to the west by two districts in the
Ashanti region precisely Sekyere East and Ashanti-Akim Districts.
There are two main entrances into the District by road; namely Nkawkaw-Mpraeso-Bepong-
Kwahu Tafo and Adawso from where the three kilometer wide Afram River is crossed to
Ekye-Amanfrom by ferry operated by the Volta Lake Transport Company (VLTC). The
second entrance is through Agogo in the Sekyere Afram Plains in the Ashanti region where
one can travel by road through Dome to Maame Krobo then to Tease, the District capital. The
Volta Lake Transport Company (VLTC) provides ferry services on the Lake and currently
operates one ferry in the Kwahu Afram Plains South between Adawso and Ekye-Amanfrom
to the District. It has a capacity of 360 tones. When using a single engine it takes about 30
minutes to cross.
1.2.2 Relief and Drainage
The land is generally undulating and rises about 60 metres to 120 metres above sea level. The
only high ground is in Bonkurom. The District is drained to the south by the Afram River and
the Volta River to the east which flow continually throughout the year and can be used for
both domestic and agricultural purposes. Several other seasonal streams are found in the
District. The pattern is largely dendritic flowing in the north-south direction.
1.2.3 Climate
The district falls within the savannah vegetation zone comprising the savannah transitional
zone and savannah woodland which is characterized by short deciduous fire resistant trees
often widely spaced and a ground flora composed of grass of varying heights which is
associated by two main rainfall seasons occurring in June and October; the first rainy season
starts from May to June and the second from September to October. The mean annual rainfall
is between1150mm and1650mm. The dry seasons are distinct starting between November
and late February. Temperatures are found to be hot ranging between February and March
(36.80C and 36.60C on the average respectively), while the coldest ones are December and
2
January (19.90C and 20.10C on the average respectively). Relative humidity is generally high
throughout the year, ranging between 68.2% to 71.6% in the dry season and 81.6% and
71.6%.in the wet season.
1.2.4 Vegetation and Soil
The district lies within savannah vegetation zone comprising the savannah transitional zone
and savannah woodland. There are few forest reserves covering about 120.8sq km. The forest
reserves constitute about 15% of the entire surface area of the district. Some commercial tree
species contained in the forest are Milicia excelsa (Odum), Sterculia rhinopetala (Wawa),
Terminalia superba (Ofram), Khaya ivoriensis (African mahogany), Antiaris toxicaria
(Kyenkyen) etc. The major soils in the district are the Swedru-Nsaba-Offin Compound.
Dominating this soil group is the Swedru series which are mainly red silty, well drained, deep
gravel-free silty loams and silty-clay loams. The Nsaba series are yellowish red silty clay
loam, moderately well drained, very shallow and rocky. The soils are suitable for the
cultivation of both food crops (cassava, plantain, yam, cocoyam, maize) and cash crops
(cocoa, coffee, oil palm, citrus, cola) which are grown in the municipality. The land in this
area is susceptible to wind erosion if laid bare of vegetation.
1.3 Political Administration
The district is headed by a District Chief Executive being the representative of the President
with Tease as the Administrative capital. Under the Local Government System, the district
operates a three tier political administrative structure, with the General Assembly being the
highest decision making body followed by the area councils down to the unit committees.
The composition of the General Assembly is made up of thirty-eight (38) Assembly Members
with twenty-seven (27) elected and eleven appointees. There are eleven (11) decentralized
departments who report to the Co-ordinating Director at the central directorate of the District.
1.4 Cultural and Social Structure
The district is typically a settler district with majority being migrants. Ewesn constitute the
highest, followed by the Ashantis, the Kwahus, as well as tribes from the Northern extraction
of the Country. However, the widely spoken language in the district is Twi.
Most of the people in the district are Christians. There are also Muslims and traditionalists in
the district.
The Kwahu traditional council is the highest traditional authority in the district. The council
is headed by the Omanhene. However, several divisional chiefs operate within various
traditional areas in the district. These chiefs adjudicate cases within areas under their
jurisdiction.
3
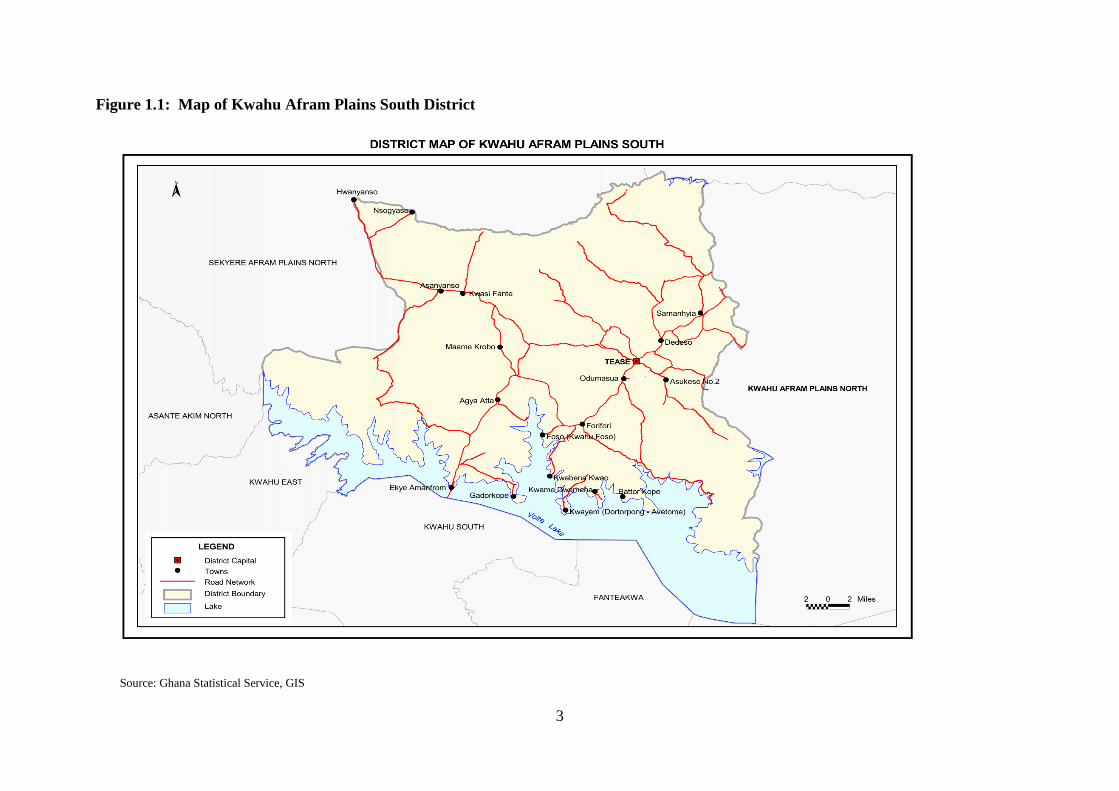
Figure 1.1: Map of Kwahu Afram Plains South District
Source: Ghana Statistical Service, GIS
4
1.5 The Economy
The economy of the district is driven by agriculture due to the vast tracts of arable land
coupled with good weather conditions. According to the 2010 PHC data, the economic sector
employs about 80 percent of the active labour force in the District.
Agriculture in the district is made up of crop farming, animal husbandry and fishing.
According to the 2010 PHC data, crop production employs about 90 percent of active labour
force in the agricultural sector whilst animal husbandry takes about five percent, fishing four
percent and one percent takes account of others like migrant Fulani herdsmen who roam the
district with their cattle.
The key food crops grown in the district include yam, maize, cocoyam, plantain, beans and
groundnuts. Cabbage is a new addition to these traditional food crops. Tree crops like
cashew, oranges and oil palm are also grown mainly for commercial purposes.
Farm acreage ranges from 2 to 30 acres for subsistence farming whilst commercial farms
range from 50 to 200 acres
1.5.1 Manufacturing Activities
The type of industrial activities in the District can be categorized based on their primary input
or raw material and the kind of skill in the production process. The wood industry is visible
even though not very vibrant. This includes sawmilling, carpentry and joinery, and
woodcarving. These are medium and small scale production units.
Also of some significance are metal-based manufacturing enterprises that include welding
and fabrication, steel bending, etc.
The industrial sector is very much dominated by informal micro agro-processing enterprise in
the District’s economy. Gari processing, oil palm extraction, fish processing are some of the
main areas of employment and income generation, especially among women, within the
industrial sector of the district. Small boat and canoe building as well as wood carving
enterprises also exist.
1.6 Census Methodology, Concepts and Definitions
1.6.1 Introduction
Ghana Statistical Service (GSS) was guided by the principle of international comparability
and the need to obtain accurate information in the 2010 Population and Housing Census
(2010 PHC). The Census was, therefore, conducted using all the essential features of a
modern census as contained in the United Nations Principles and Recommendations for
countries taking part in the 2010 Round of Population and Housing Censuses.
Experience from previous post independence censuses of Ghana (1960, 1970, 1984 and 2000)
was taken into consideration in developing the methodologies for conducting the 2010 PHC.
The primary objective of the 2010 PHC was to provide information on the number,
distribution and social, economic and demographic characteristics of the population of Ghana
necessary to facilitate the socio-economic development of the country.
5
1.6.2 Pre-enumeration activities
Development of census project document and work plans
A large scale statistical operation, such as the 2010 Population and Housing Census required
meticulous planning for its successful implementation. A working group of the Ghana
Statistical Service prepared the census project document with the assistance of two
consultants. The document contains the rationale and objectives of the census, census
organization, a work plan as well as a budget. The project document was launched in
November 2008 as part of the Ghana Statistics Development Plan (GSDP) and reviewed in
November 2009.
Census secretariat and committees
A well-structured management and supervisory framework that outlines the responsibilities
of the various stakeholders is essential for the effective implementation of a population and
housing census. To implement the 2010 PHC, a National Census Secretariat was set up in
January 2008 and comprised professional and technical staff of GSS as well as staff of other
Ministries, Departments and Agencies (MDAs) seconded to GSS. The Census Secretariat was
primarily responsible for the day-to-day planning and implementation of the census activities.
The Secretariat had seven units, namely; census administration, cartography, recruitment and
training, publicity and education, field operations and logistics management, data processing,
and data analysis and dissemination.
An acting Census Coordinator engaged by the United Nations Population Fund (UNFPA) in
2008 to support GSS in the planning of the Census initially headed the Census Secretariat. In
2009, the Census Secretariat was re-organised with the Government Statistician as the
National Chief Census Officer and overall Coordinator, assisted by a Census Management
Team and a Census Coordinating Team. The Census Management Team had oversight
responsibility for the implementation of the Census. It also had the responsibility of taking
critical decisions on the census in consultation with other national committees. The Census
Coordinating Team, on the other hand, was responsible for the day-to-day implementation of
the Census programme.
A number of census committees are also set up at both national and sub-national levels to
provide guidance and assistance with respect to resource mobilization and technical advice.
At the national level, the committees are the National Census Steering Committee (NCSC),
the National Census Technical Advisory Committee (NCTAC) and the National Census
Publicity and Education Committee (NCPEC). At the regional and district levels, the
committees are the Regional Census Implementation Committee and the District Census
Implementation Committee, respectively.
The Regional and District Census Implementation Committees are inter-sectoral in their
composition. Members of the Committees are mainly from decentralized departments with
the Regional and District Coordinating Directors chairing the Regional Census
Implementation Committee and District Census Implementation Committee, respectively.
The Committees contributed to the planning of district, community and locality level
activities in areas of publicity and field operations. They supported the Regional and District
Census Officers in the recruitment and training of field personnel (enumerators and
supervisors), as well as mobilizing logistical support for the census.
6
Selection of Census topics
The topics selected for the 2010 Population and Housing Census are based on
recommendations contained in the UN Principles and Recommendations for 2010 Round of
Population and Housing Censuses and the African Addendum to that document as well as the
needs of data users. All the core topics recommended at the global level, i.e., geographical
and internal migration characteristics, international migration, household characteristics,
demographic and social characteristics such as age, date of birth, sex, and marital status,
fertility and mortality, educational and economic characteristics, issues relating to disability
and housing conditions and amenities are included in the census.
Some topics that are not considered core by the UN recommendations but which are found to
be of great interest and importance to Ghana and are, therefore, included in the 2010 PHC are
religion, ethnicity, employment sector and place of work, agricultural activity, as well as
housing topics, such as, type of dwelling, materials for outer wall, floor and roof,
tenure/holding arrangement, number of sleeping rooms, cooking fuel, cooking space and
Information Communication Technology (ICT).
Census mapping
A timely and well-implemented census mapping is pivotal to the success of any population
and housing census. Mapping delineates the country into enumeration areas to facilitate
smooth enumeration of the population. The updating of the 2000 Census Enumeration Area
(EA) maps started in the last quarter of 2007 with the acquisition of topographic sheets of all
indices from the Survey and Mapping Division of the Lands Commission. In addition, digital
sheets are also procured for the Geographical Information System Unit.
The Cartography Unit of the Census Secretariat collaborated with the Survey and Mapping
Division of the Lands Commission and the Centre for Remote Sensing and Geographic
Information Services (CERSGIS) of the Department of Geography and Resource
Development, University of Ghana, to determine the viability of migrating from analog to
digital mapping for the 2010 PHC, as recommended in the 2000 PHC Administrative Report.
Field cartographic work started in March 2008 and was completed in February 2010.
Development of questionnaire and manuals
For effective data collection, there is the need to design appropriate documents to solicit the
required information from respondents. GSS consulted widely with main data users in the
process of the questionnaire development. Data users including MDAs, research institutions,
civil society organizations and development partners are given the opportunity to indicate the
type of questions they wanted to be included in the census questionnaire.
Documents developed for the census included the questionnaire and manuals, and field
operation documents. The field operation documents included Enumerator’s Visitation
Record Book, Supervisor’s Record Book, and other operational control forms. These record
books served as operational and quality control tools to assist enumerators and supervisors to
control and monitor their field duties respectively.
Pre-tests and trial census
The census questionnaire was pre-tested twice in the course of its development. The first pre-
test was carried out in March 2009 to find out the suitability of the questions and the
instructions provided. It also tested the adequacy and completeness of the responses and how
respondents understood the questions. It is internationally recognized that an essential
7
element in census planning is the pre-testing of the questionnaire and related instructions. The
objective of the pre-test is to test the questionnaire, the definition of its concepts and the
instructions for filling out the questionnaire.
The second pre-test was done in 10 selected enumeration areas in August, 2009. The
objective of the second pre-test was to examine the sequence of the questions, test the new
questions, such as, date of birth and migration, and assess how the introduction of ‘date of
birth’ could help to reduce ‘age heaping’. With regard to questions on fertility, the pre-tests
sought to find out the difference, if any, between proxy responses and responses by the
respondents themselves. Both pre-tests are carried in the Greater Accra Region. Experience
from the pre-tests was used to improve the final census questionnaire.
A trial census which is a dress rehearsal of all the activities and procedures that are planned
for the main census was carried out in October/November 2009. These included recruitment
and training, distribution of census materials, administration of the questionnaire and other
census forms, enumeration of the various categories of the population (household,
institutional and floating population), and data processing. The trial census was held in six
selected districts across the country namely; Saboba (Northern Region), Chereponi (Northern
Region), Sene (Brong Ahafo Region), Bia (Western Region), Awutu Senya (Central
Region), and Osu Klottey Sub-Metro (Greater Accra Region). A number of factors are
considered in selecting the trial census districts. These included: administrative boundary
issues, ecological zone, and accessibility, enumeration of floating population/outdoor-
sleepers, fast growing areas, institutional population, and enumeration areas with scattered
settlements.
The trial census provided GSS with an opportunity to assess its plans and procedures as well
as the state of preparedness for the conduct of the 2010 PHC. The common errors found
during editing of the completed questionnaires resulted in modifications to the census
questionnaire, enumerator manuals and other documents. The results of the trial census
assisted GSS to arrive at technically sound decisions on the ideal number of persons per
questionnaire, number of persons in the household roster, migration questions, placement of
the mortality question, serial numbering of houses/housing structures and method of
collection of information on community facilities. Lessons learnt from the trial census also
guided the planning of the recruitment process, the procedures for training of census field
staff and the publicity and education interventions.
1.6.3 Census Enumeration
Method of enumeration and fieldwork
All post- independence censuses (1960, 1970, 1984, and 2000) conducted in Ghana used the
de facto method of enumeration where people are enumerated at where they are on census
night and not where they usually reside. The same method was adopted for the 2010 PHC.
The de facto count is preferred because it provides a simple and straight forward way of
counting the population since it is based on a physical fact of presence and can hardly be
misinterpreted. It is thought that the method also minimizes the risks of under-enumeration
and over enumeration. The canvasser method, which involves trained field personnel visiting
houses and households identified in their respective enumeration areas, was adopted for the
2010 PHC.
The main census enumeration involved the canvassing of all categories of the population by
trained enumerators, using questionnaires prepared and tested during the pre-enumeration
phase. Specific arrangements are made for the coverage of special population groups, such as
8
the homeless and the floating population. The fieldwork began on 21st September 2010 with
the identification of EA boundaries, listing of structures, enumeration of institutional
population and floating population.
The week preceding the Census Night was used by field personnel to list houses and other
structures in their enumeration areas. Enumerators are also mobilized to enumerate
residents/inmates of institutions, such as, schools and prisons. They returned to the
institutions during the enumeration period to reconcile the information they obtained from
individuals and also to cross out names of those who are absent from the institutions on
Census Night. Out-door sleepers (floating population) are also enumerated on the Census
Night.
Enumeration of the household population started on Monday, 27th
September, 2010.
Enumerators visited houses, compounds and structures in their enumeration areas and started
enumerating all households including visitors who spent the Census Night in the households.
Enumeration was carried out in the order in which houses/structures are listed and where the
members of the household are absent, the enumerator left a call-back-card indicating when
he/she would come back to enumerate the household. The enumeration process took off
smoothly with enumerators poised on completing their assignments on schedule since many
of them are teachers and had to return to school. However, many enumerators ran short of
questionnaires after a few days’ work.
Enumeration resumed in all districts when the questionnaire shortage was resolved and by
17th
October, 2010, enumeration was completed in most districts. Enumerators who had
finished their work are mobilized to assist in the enumeration of localities that are yet to be
enumerated in some regional capitals and other fast growing areas. Flooded areas and other
inaccessible localities are also enumerated after the end of the official enumeration period.
Because some enumeration areas in fast growing cities and towns, such as, Accra
Metropolitan Area, Kumasi, Kasoa and Techiman are not properly demarcated and some are
characterized by large EAs, some enumerators are unable to complete their assigned tasks
within the stipulated time.
1.6.4 Post Enumeration Survey
In line with United Nations recommendations, GSS conducted a Post Enumeration Survey
(PES) in April, 2011 to check content and coverage error. The PES was also to serve as an
important tool in providing feedback regarding operational matters such as concepts and
procedures in order to help improve future census operations. The PES field work was
carried out for 21 days in April 2011 and was closely monitored and supervised to ensure
quality output. The main findings of the PES are that:
97.0 percent of all household residents who are in the country on Census Night (26th
September, 2010) are enumerated.
1.3 percent of the population was erroneously included in the census.
Regional differentials are observed. Upper East region recorded the highest coverage
rate of 98.2 percent while the Volta region had the lowest coverage rate of 95.7
percent.
9
Males (3.3%) are more likely than females (2.8%) to be omitted in the census. The
coverage rate for males was 96.7 percent and the coverage rate for females was 97.2
percent. Also, the coverage rates (94.1%) for those within the 20-29 and 30-39 age
groups are relatively lower compared to the coverage rates of the other age groups.
There was a high rate of agreement between the 2010 PHC data and the PES data for
sex (98.8%), marital status (94.6%), relationship to head of household (90.5%) and
age (83.0%).
1.6.5 Release and dissemination of results
The provisional results of the census are released in February 2011 and the final results in
May 2012. A National Analytical report, six thematic reports, a Census Atlas, 10 Regional
Reports and a report on Demographic, Social, Economic and Housing are prepared and
disseminated in 2013.
1.6.6 Concepts and Definitions
Introduction
The 2010 Population and Housing Census of Ghana followed the essential concepts and
definitions of a modern Population and Housing Census as recommended by the United
Nations (UN). It is important that the concepts, definitions and recommendations are adhered
to since they form the basis upon which Ghana could compare her data with that of other
countries.
The concepts and definitions in this report cover all sections of the 2010 Population and
Housing Census questionnaires (PHC1A and PHC1B). The sections are: geographical
location of the population, Household and Non-household population, Literacy and
Education, Emigration, Demographic and Economic Characteristics, Disability, Information
and Communication Technology (ICT), Fertility, Mortality, Agricultural Activity and
Housing Conditions.
The concepts and definitions are provided to facilitate understanding and use of the data
presented in this report. Users are therefore advised to use the results of the census within the
context of these concepts and definitions.
Region
There are ten (10) administrative regions in Ghana during the 2010 Population and Housing
Census as they are in 1984 and 2000.
District
In 1988, Ghana changed from the local authority system of administration to the District
assembly system. In that year, the then existing 140 local authorities are demarcated into 110
districts. In 2004, 28 new districts are created; this increased the number of districts in the
country to 138. In 2008, 32 additional districts are created bringing the total number of
districts to 170. The 2010 Population and Housing Census was conducted in these 170
administrative districts (these are made-up of 164 districts/municipals and 6 metropolitan
areas). In 2012, 46 new districts are created to bring the total number of districts to 216.
There was urgent need for data for the 46 newly created districts for planning and decision-
making. To meet this demand, the 2010 Census data was re-programmed into 216 districts
after carrying out additional fieldwork and consultations with stakeholders in the Districts
affected by the creation of the new districts.
10
Locality
A locality was defined as a distinct population cluster (also designated as inhabited place,
populated centre, settlement) which has a NAME or LOCALLY RECOGNISED STATUS. It
included fishing hamlets, mining camps, ranches, farms, market towns, villages, towns, cities
and many other types of population clusters, which meet the above criteria. There are two
main types of localities, rural and urban. As in previous censuses, the classification of
localities into ‘urban’ and ‘rural’ was based on population size. Localities with 5,000 or more
persons are classified as urban while localities with less than 5,000 persons are classified as
rural.
Population
The 2010 Census was a “de facto” count and each person present in Ghana, irrespective of
nationality, was enumerated at the place where he/she spent the midnight of 26th September
2010.
Household
A household was defined as a person or a group of persons, who lived together in the same
house or compound and shared the same house-keeping arrangements. In general, a
household consisted of a man, his wife, children and some other relatives or a house help who
may be living with them. However, it is important to remember that members of a household
are not necessarily related (by blood or marriage) because non-relatives (e.g. house helps)
may form part of a household.
Head of Household
The household head was defined as a male or female member of the household recognised as
such by the other household members. The head of household is generally the person who has
economic and social responsibility for the household. All relationships are defined with
reference to the head.
Household and Non-household population
Household population comprised of all persons who spent the census night in a household
setting. All persons who did not spend the census night in a household setting (except
otherwise stated) are classified as non-household population. Persons who spent census night
in any of the under listed institutions and locations are classified as non-household
population:
(a) Educational Institutions
(b) Children's and Old People’s Homes
(c) Hospitals and Healing Centres
(d) Hotels
(e) Prisons
(f) Service Barracks
(g) Soldiers on field exercise
(h) Floating Population: The following are examples of persons in this category:
11
i.All persons who slept in lorry parks, markets, in front of stores and offices, public
bathrooms, petrol filling stations, railway stations, verandas, pavements, and all
such places which are not houses or compounds.
ii.Hunting and fishing camps.
iii.Beggars and vagrants (mentally sick or otherwise).
Age
The age of every person was recorded in completed years disregarding fractions of days and
months. For those persons who did not know their birthdays, the enumerator estimated their
ages using a list of district, regional and national historical events.
Nationality
Nationality is defined as the country to which a person belongs. A distinction is made
between Ghanaians and other nationals. Ghanaian nationals are grouped into Ghanaian by
birth, Ghanaian with dual nationality and Ghanaian by naturalization. Other nationals are
grouped into ECOWAS nationals, Africans other than ECOWAS nationals, and non-
Africans.
Ethnicity
Ethnicity refers to the ethnic group that a person belonged to. This information is collected
only from Ghanaians by birth and Ghanaians with dual nationality. The classification of
ethnic groups in Ghana is that officially provided by the Bureau of Ghana Languages and
which has been in use since the 1960 census.
Birthplace
The birthplace of a person refers to the locality of usual residence of the mother at the time of
birth. If after delivery a mother stayed outside her locality of usual residence for six months
or more or had the intention of staying in the new place for six or more months, then the
actual town/village of physical birth becomes the birthplace of the child.
Duration of Residence
Duration of residence refers to the number of years a person has lived in a particular place.
This question is only asked of persons not born in the place where enumeration took place.
Breaks in duration of residence lasting less than 12 months are disregarded. The duration of
residence of persons who made multiple movements of one (1) year or more is assumed to be
the number of years lived in the locality (town or village) since the last movement.
Religion
Religion refers to the individual’s religious affiliation as reported by the respondent,
irrespective of the religion of the household head or the head’s spouse or the name of the
person. No attempt was made to find out if respondents actually practiced the faith they
professed.
Marital Status
Marital status refers to the respondent’s marital status as at Census Night. The question on
marital status was asked only of persons 12 years and older. The selection of the age limit of
12
12 years was based on the average age at menarche and also on the practice in some parts of
the country where girls as young as 12 years old could be given in marriage.
Literacy
The question on literacy referred to the respondent's ability to read and write in any language.
A person was considered literate if he/she could read and write a simple statement with
understanding. The question on literacy was asked only of persons 11 years and older.
Education
School Attendance
Data was collected on school attendance for all persons three (3) years and older. School
attendance refers to whether a person has ever attended, was currently attending or has never
attended school. In the census, school meant an educational institution where a person
received at least four hours of formal education.
Although the lower age limit of formal education is six years for primary one, eligibility for
the school attendance question was lowered to three years because pre-school education has
become an important phenomenon in the country.
Level of Education
Level of education refers to the highest level of formal school that a person ever attended or
was attending. This information was obtained for persons 3 years and older.
Activity Status
Activity status refers to economic or non-economic activity of respondents during the 7 days
preceding census night. Information on type of activity was collected on persons 5 years and
older. A person was regarded as economically active if he/she:
a. Worked for pay or profit or family gain for at least 1 hour within the 7 days preceding
Census Night. This included persons who are in paid employment or self-
employment or contributing family workers.
b. Did not work, but had jobs to return to.
c. Are unemployed.
The economically not active are persons who did not work and are not seeking for work.
They are classified by reasons for not being economically active. Economically not active
persons included homemakers, students, retired persons, the disabled and persons who are
unable to work due to their age or ill-health.
Occupation
This referred to the type of work the person was engaged in at the establishment where he/she
worked. This was asked only of persons 5 years and older who worked 7 days before the
census night, and those who did not work but had a job to return to as well as those
unemployed who had worked before. All persons who worked during the 7 days before the
census night are classified by the kind of work they are engaged in. The emphasis was on the
work the person did during the reference period and not what he/she was trained to do. For
those who did not work but had a job to return to, their occupation was the job they would go
back to after the period of absence. Also, for persons who had worked before and are seeking
13
for work and available for work, their occupation was on the last work they did before
becoming unemployed. If a person was engaged in more than one occupation, only the main
one was considered.
Industry
Industry referred to the type of product produced or service rendered at the respondent’s work
place. Information was collected only on the main product produced or service rendered in
the establishment during the reference period.
Employment Status
Employment status refers to the status of a person in the establishment where he/she currently
works or previously worked. Eight employment status categories are provided: employee,
self-employed without employees, self-employed with employees, casual worker,
contributing family worker, apprentice, domestic employee (house help). Persons who could
not be classified under any of the above categories are classified as “other”.
Employment Sector
This refers to the sector in which a person worked. The employment sectors covered in the
census are public, private formal, private informal, semi-public/parastatal, NGOs and
international organizations.
Disability
Persons with disability are defined as those who are unable to or are restricted in the
performance of specific tasks/activities due to loss of function of some part of the body as a
result of impairment or malformation. Information was collected on persons with visual/sight
impairment, hearing impairment, mental retardation, emotional or behavioural disorders and
other physical challenges.
Information Communication Technology (ICT)
ICT questions are asked for both individuals and households. Persons having mobile phones
refer to respondents 12 years and older who owned mobile phones (irrespective of the
number of mobile phones owned by each person). Persons using internet facility refers to
those who had access to internet facility at home, internet cafe, on mobile phone or other
mobile device. Internet access is assumed to be not only via computer, but also by mobile
phones, PDA, game machine and digital television.
Households having Personal Computers/Laptops refer to households who own
desktops/laptop computers. The fixed telephone line refers to a telephone line connecting a
customer’s terminal equipment (e.g. telephone set, facsimile machine) to the public switch
telephone network.
Fertility
Two types of fertility data are collected: lifetime fertility and current fertility. Lifetime
fertility refers to the total number of live births that females 12 years and older had ever had
during their life time. Current fertility refers to the number of live births that females 12-54
years old had in the 12 months preceding the Census Night.
14
Mortality
Mortality refers to all deaths that occurred in the household during the 12 months preceding
the Census Night. The report presents information on deaths due to accidents, violence,
homicide and suicide. In addition, data are collected on pregnancy-related deaths of females
12-54 years.
Agriculture
The census sought information on household members who are engaged in agricultural
activities, including the cultivation of crops or tree planting, rearing of livestock or breeding
of fish for sale or family consumption. Information was also collected on their farms, types of
crops and number and type of livestock.
Housing Conditions and Facilities
The UN recommended definition of a house as “a structurally separate and independent place
of abode such that a person or group of persons can isolate themselves from the hazards of
climate such as storms and the sun’’ was adopted. The definition, therefore, covered any type
of shelter used as living quarters, such as separate houses, semi-detached houses,
flats/apartments, compound houses, huts, tents, kiosks and containers.
Living quarters or dwelling units refer to a specific area or space occupied by a particular
household and therefore need not necessarily be the same as the house of which the dwelling
unit may be a part.
Information collected on housing conditions included the type of dwelling unit, main
construction materials for walls, floor and roof, holding/tenure arrangement, ownership type,
type of lighting, source of water supply and toilet facilities. Data was also collected on
method of disposal of solid and liquid waste.
1.7 Organization of the report
The report consists of nine chapters. Chapter one provides basic information about the
district. It gives a brief background of the district, describing its physical features, political
and administrative structure, social and cultural structure, economy and the methodology and
concepts used in the report. Chapter two discusses the population size, composition and age
structure. It further discusses the migratory pattern in the district as well as fertility and
mortality.
In chapter three, the focus is on household size, composition and headship as well as the
marital characteristics and nationality of the inhabitants of the district. The chapter also
discusses the religious affiliations and the educational statuses of the members of the district.
Chapter four focuses on economic characteristics such as economic activity status,
occupation, industries and the employment status and sectors that the people are employed.
Information Communication Technology (ICT) is discussed in chapter five. It analyses
mobile phone ownership, internet use and ownership of desktop/laptop computers while
chapter six is devoted to Persons living with disabilities (PWDs) and their socio-demographic
characteristics. Chapter seven concentrates on the agricultural activities of the households,
describing the types of farming activities, livestock rearing and numbers of livestock reared.
In chapter eight, housing conditions such as housing stock, type of dwelling and construction
materials, room occupancy, holding and tenancy, lighting and cooking facilities, bathing and
15
toilet facilities, waste disposal and source of water for drinking or for other domestic use in
the district are discussed and analysed in detail. The final chapter, Chapter nine presents the
summary of findings and conclusions. It also discusses the policy implications of the findings
for the district.
16
CHAPTER TWO
DEMOGRAHPIC CHARACTERISTICS
2.1 Introduction
Population size, composition and age-sex structure play an important role in the socio-
economic development in all human endeavours. The 2010 population and Housing Census
provides accurate information from which the demographic characteristics of the district can
be analyzed. Generally, age and sex are the two main population indicators that inform policy
formulation and planning. The rate of population growth of an area is largely influenced by
fertility, mortality and migration. This chapter examines population size, age distribution,
age-sex structure, fertility, mortality and migration of the district.
2.2 Population Size and Distribution
2.2.1 Population distribution by age, sex and type of locality
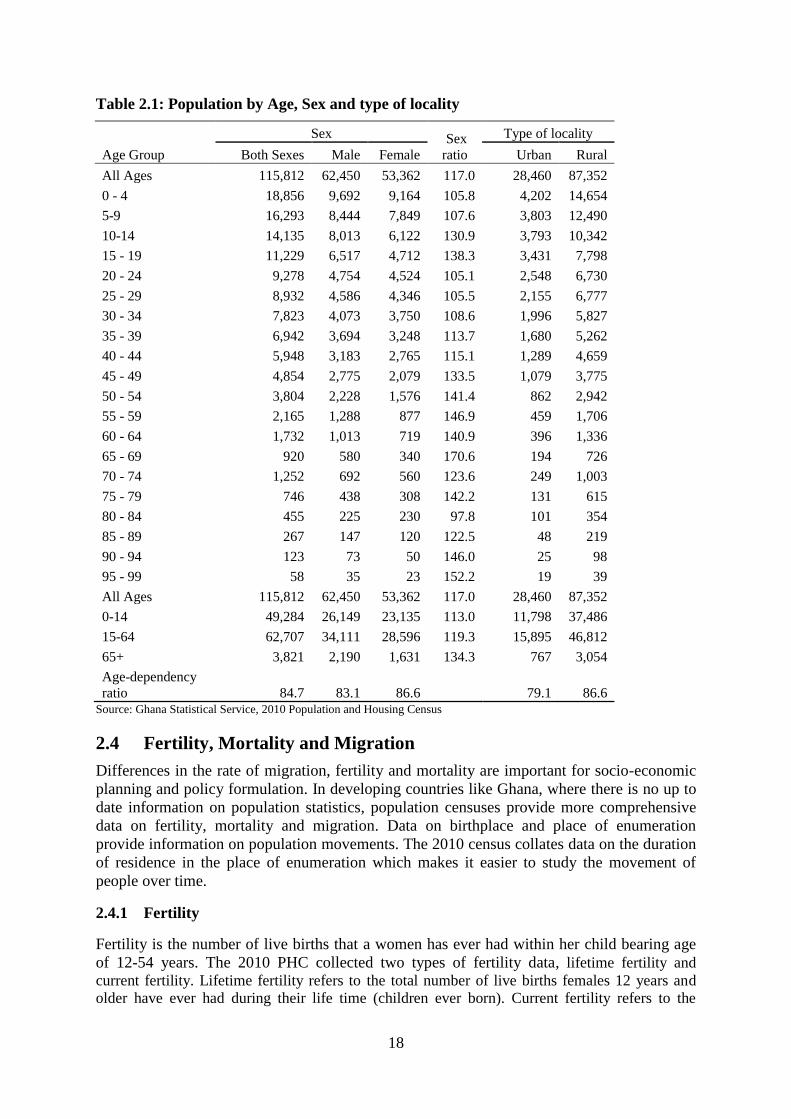
Table 2.1 presents the population distribution by age, sex and type of locality. The 2010 PHC
data reveals that the district has a total population of 115,812. As can be observed from the
table, there are more males 62,450 representing 53.9 percent than females 53,362
representing 46.1percent of the total population in the District. It can also be seen from table
2.1 that the 0-4 age group constituents the highest compared to all other age groups. The table
2.1 also shows that the district is typically a rural community given that 87,352 representing
(75.4%) of the population live in rural communities compared to 28,460 representing (24.6%)
who live in urban centres.
2.3 Age-sex, structure
One important tool for analyzing the age and sex composition of the population is the
population pyramid. According to the 2010 population and Housing Census, the district has a
total Population of 115,812.
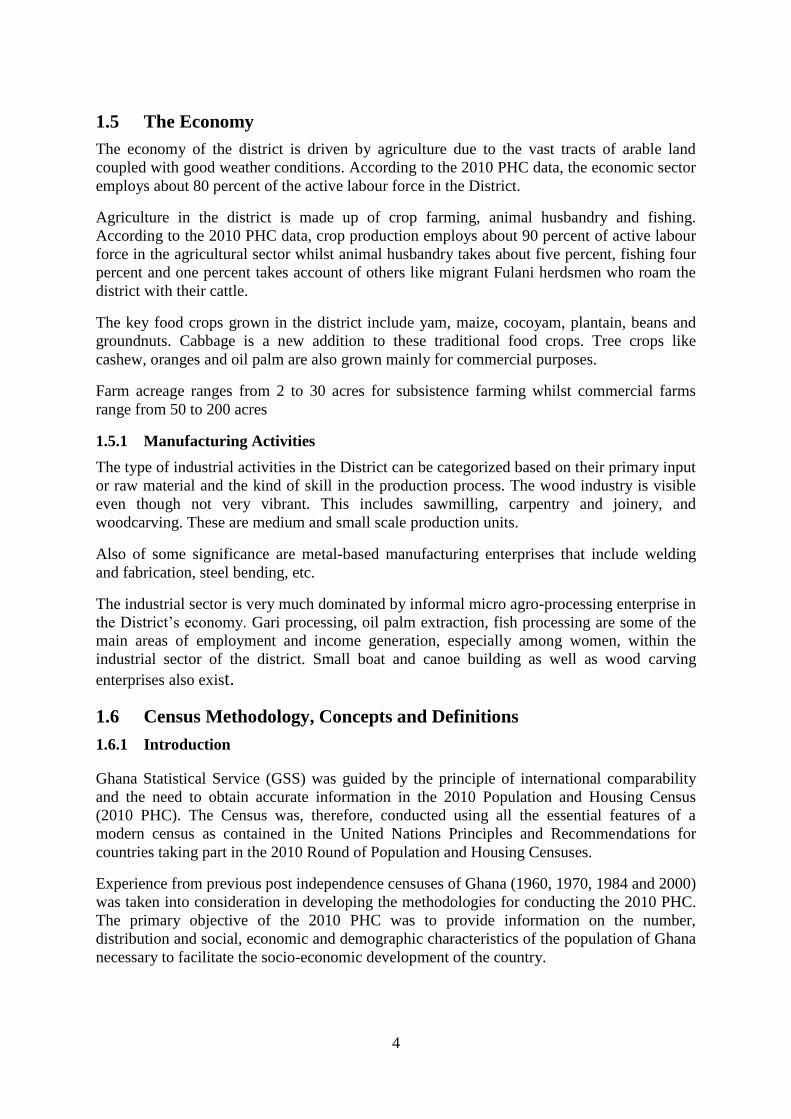
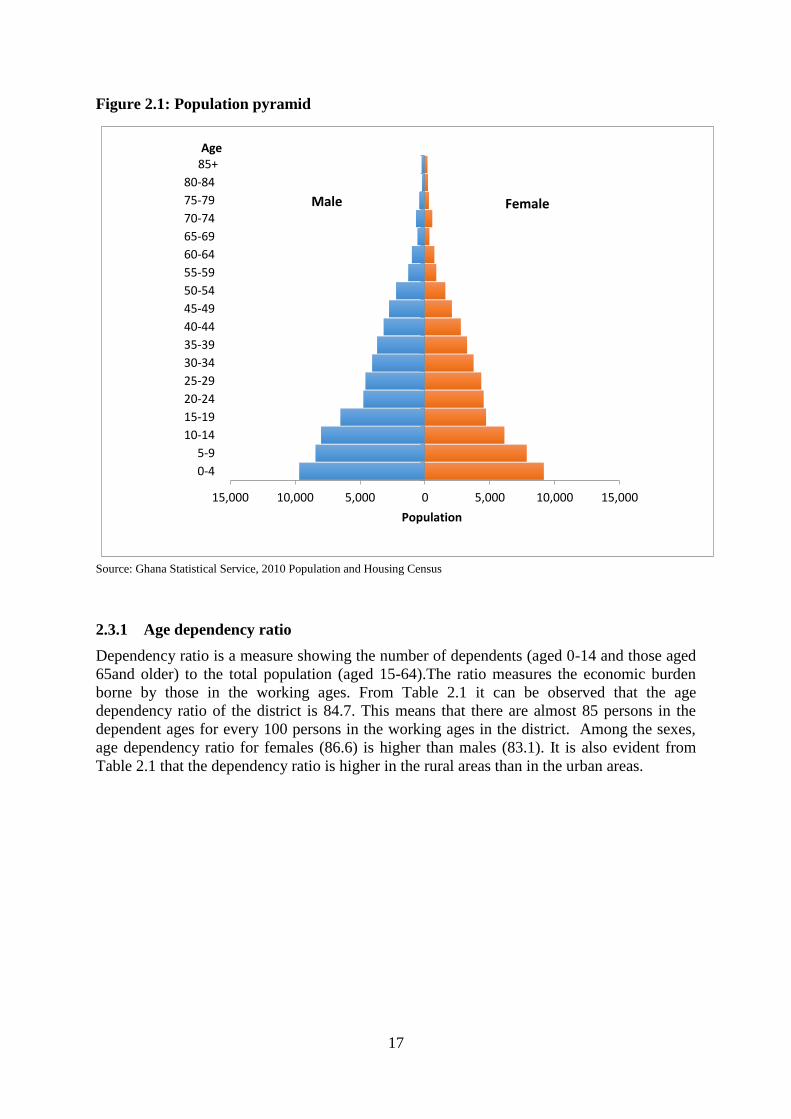
Figure 2.1 shows the population pyramid for Kwahu Afram Plains South. The shape of the
pyramid provides important information about population composition. There are more males
(51.6%) within the age groups 0-4 and 5-9 than females (48.4%) in the district. The female
population however is higher from age 10-14 through to 95 years and above compared to
males but decreases with age for both sexes. The population of the District is predominantly
youthful (Figure 2.1), the pyramid has a broad base consisting of large numbers of children
(42.2%) and a conical top of a small number of elderly persons (3.3%) with more females
than males.
17
Figure 2.1: Population pyramid
15,000 10,000 5,000 0 5,000 10,000 15,000
0-4
5-9
10-14
15-19
20-24
25-29
30-34
35-39
40-44
45-49
50-54
55-59
60-64
65-69
70-74
75-79
80-84
85+
Population
Age
FemaleMale
Source: Ghana Statistical Service, 2010 Population and Housing Census
2.3.1 Age dependency ratio
Dependency ratio is a measure showing the number of dependents (aged 0-14 and those aged
65and older) to the total population (aged 15-64).The ratio measures the economic burden
borne by those in the working ages. From Table 2.1 it can be observed that the age
dependency ratio of the district is 84.7. This means that there are almost 85 persons in the
dependent ages for every 100 persons in the working ages in the district. Among the sexes,
age dependency ratio for females (86.6) is higher than males (83.1). It is also evident from
Table 2.1 that the dependency ratio is higher in the rural areas than in the urban areas.
18
Table 2.1: Population by Age, Sex and type of locality
Age Group
Sex Sex
ratio
Type of locality
Both Sexes Male Female Urban Rural
All Ages 115,812 62,450 53,362 117.0 28,460 87,352
0 - 4 18,856 9,692 9,164 105.8 4,202 14,654
5-9 16,293 8,444 7,849 107.6 3,803 12,490
10-14 14,135 8,013 6,122 130.9 3,793 10,342
15 - 19 11,229 6,517 4,712 138.3 3,431 7,798
20 - 24 9,278 4,754 4,524 105.1 2,548 6,730
25 - 29 8,932 4,586 4,346 105.5 2,155 6,777
30 - 34 7,823 4,073 3,750 108.6 1,996 5,827
35 - 39 6,942 3,694 3,248 113.7 1,680 5,262
40 - 44 5,948 3,183 2,765 115.1 1,289 4,659
45 - 49 4,854 2,775 2,079 133.5 1,079 3,775
50 - 54 3,804 2,228 1,576 141.4 862 2,942
55 - 59 2,165 1,288 877 146.9 459 1,706
60 - 64 1,732 1,013 719 140.9 396 1,336
65 - 69 920 580 340 170.6 194 726
70 - 74 1,252 692 560 123.6 249 1,003
75 - 79 746 438 308 142.2 131 615
80 - 84 455 225 230 97.8 101 354
85 - 89 267 147 120 122.5 48 219
90 - 94 123 73 50 146.0 25 98
95 - 99 58 35 23 152.2 19 39
All Ages 115,812 62,450 53,362 117.0 28,460 87,352
0-14 49,284 26,149 23,135 113.0 11,798 37,486
15-64 62,707 34,111 28,596 119.3 15,895 46,812
65+ 3,821 2,190 1,631 134.3 767 3,054
Age-dependency
ratio 84.7 83.1 86.6 79.1 86.6 Source: Ghana Statistical Service, 2010 Population and Housing Census
2.4 Fertility, Mortality and Migration
Differences in the rate of migration, fertility and mortality are important for socio-economic
planning and policy formulation. In developing countries like Ghana, where there is no up to
date information on population statistics, population censuses provide more comprehensive
data on fertility, mortality and migration. Data on birthplace and place of enumeration
provide information on population movements. The 2010 census collates data on the duration
of residence in the place of enumeration which makes it easier to study the movement of
people over time.
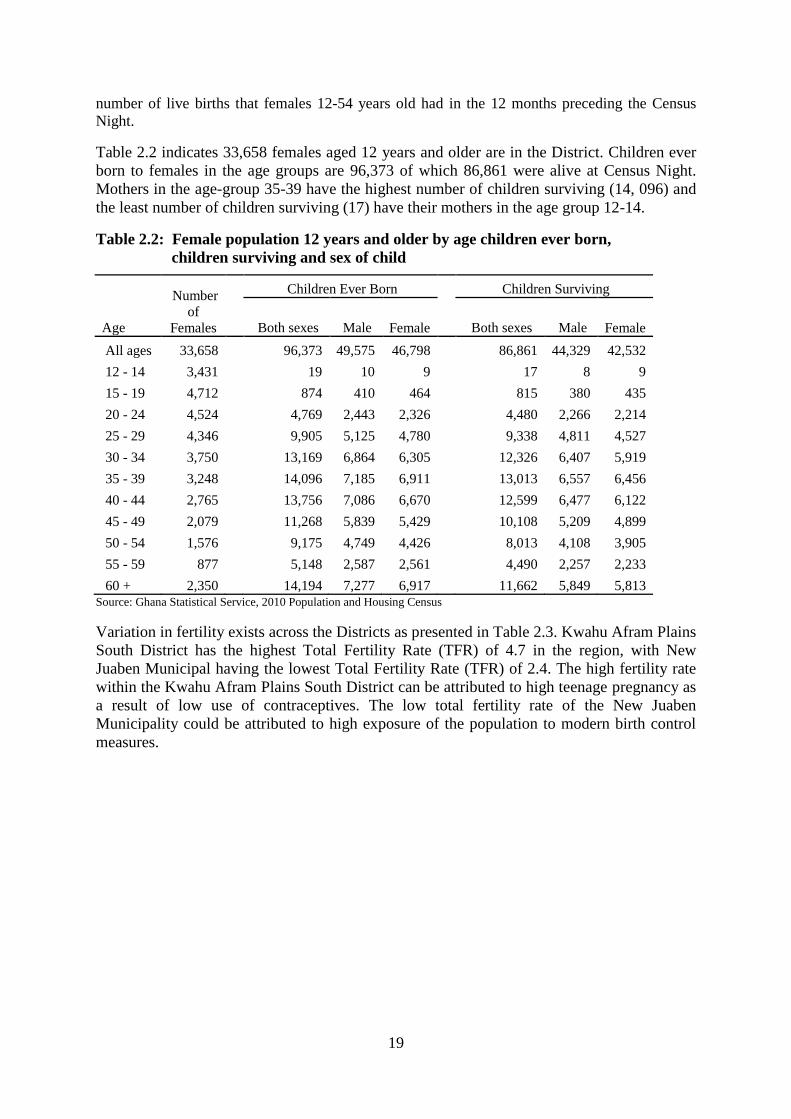
2.4.1 Fertility
Fertility is the number of live births that a women has ever had within her child bearing age
of 12-54 years. The 2010 PHC collected two types of fertility data, lifetime fertility and
current fertility. Lifetime fertility refers to the total number of live births females 12 years and
older have ever had during their life time (children ever born). Current fertility refers to the
19
number of live births that females 12-54 years old had in the 12 months preceding the Census
Night.
Table 2.2 indicates 33,658 females aged 12 years and older are in the District. Children ever
born to females in the age groups are 96,373 of which 86,861 were alive at Census Night.
Mothers in the age-group 35-39 have the highest number of children surviving (14, 096) and
the least number of children surviving (17) have their mothers in the age group 12-14.
Table 2.2: Female population 12 years and older by age children ever born,
children surviving and sex of child
Age
Number
of
Females
Children Ever Born Children Surviving
Both sexes Male
Female Both sexes Male
Female
All ages 33,658
96,373 49,575 46,798
86,861 44,329 42,532
12 - 14 3,431
19 10 9
17 8 9
15 - 19 4,712
874 410 464
815 380 435
20 - 24 4,524
4,769 2,443 2,326
4,480 2,266 2,214
25 - 29 4,346
9,905 5,125 4,780
9,338 4,811 4,527
30 - 34 3,750
13,169 6,864 6,305
12,326 6,407 5,919
35 - 39 3,248
14,096 7,185 6,911
13,013 6,557 6,456
40 - 44 2,765
13,756 7,086 6,670
12,599 6,477 6,122
45 - 49 2,079
11,268 5,839 5,429
10,108 5,209 4,899
50 - 54 1,576
9,175 4,749 4,426
8,013 4,108 3,905
55 - 59 877
5,148 2,587 2,561
4,490 2,257 2,233
60 + 2,350 14,194 7,277 6,917 11,662 5,849 5,813 Source: Ghana Statistical Service, 2010 Population and Housing Census
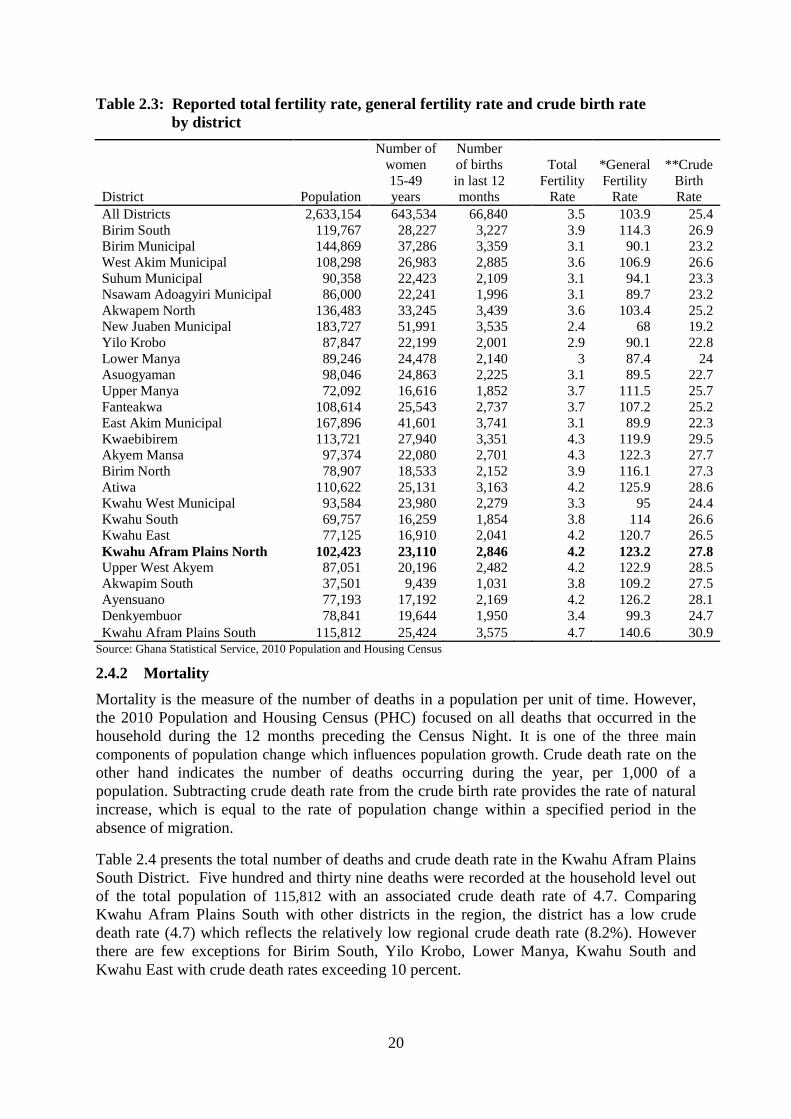
Variation in fertility exists across the Districts as presented in Table 2.3. Kwahu Afram Plains
South District has the highest Total Fertility Rate (TFR) of 4.7 in the region, with New
Juaben Municipal having the lowest Total Fertility Rate (TFR) of 2.4. The high fertility rate
within the Kwahu Afram Plains South District can be attributed to high teenage pregnancy as
a result of low use of contraceptives. The low total fertility rate of the New Juaben
Municipality could be attributed to high exposure of the population to modern birth control
measures.
20
Table 2.3: Reported total fertility rate, general fertility rate and crude birth rate
by district
District Population
Number of
women
15-49
years
Number
of births
in last 12
months
Total
Fertility
Rate
*General
Fertility
Rate
**Crude
Birth
Rate
All Districts 2,633,154 643,534 66,840
3.5 103.9 25.4
Birim South 119,767 28,227 3,227
3.9 114.3 26.9
Birim Municipal 144,869 37,286 3,359
3.1 90.1 23.2
West Akim Municipal 108,298 26,983 2,885
3.6 106.9 26.6
Suhum Municipal 90,358 22,423 2,109
3.1 94.1 23.3
Nsawam Adoagyiri Municipal 86,000 22,241 1,996
3.1 89.7 23.2
Akwapem North 136,483 33,245 3,439
3.6 103.4 25.2
New Juaben Municipal 183,727 51,991 3,535
2.4 68 19.2
Yilo Krobo 87,847 22,199 2,001
2.9 90.1 22.8
Lower Manya 89,246 24,478 2,140
3 87.4 24
Asuogyaman 98,046 24,863 2,225
3.1 89.5 22.7
Upper Manya 72,092 16,616 1,852
3.7 111.5 25.7
Fanteakwa 108,614 25,543 2,737
3.7 107.2 25.2
East Akim Municipal 167,896 41,601 3,741
3.1 89.9 22.3
Kwaebibirem 113,721 27,940 3,351
4.3 119.9 29.5
Akyem Mansa 97,374 22,080 2,701
4.3 122.3 27.7
Birim North 78,907 18,533 2,152
3.9 116.1 27.3
Atiwa 110,622 25,131 3,163
4.2 125.9 28.6
Kwahu West Municipal 93,584 23,980 2,279
3.3 95 24.4
Kwahu South 69,757 16,259 1,854
3.8 114 26.6
Kwahu East 77,125 16,910 2,041
4.2 120.7 26.5
Kwahu Afram Plains North 102,423 23,110 2,846
4.2 123.2 27.8
Upper West Akyem 87,051 20,196 2,482
4.2 122.9 28.5
Akwapim South 37,501 9,439 1,031
3.8 109.2 27.5
Ayensuano 77,193 17,192 2,169
4.2 126.2 28.1
Denkyembuor 78,841 19,644 1,950
3.4 99.3 24.7
Kwahu Afram Plains South 115,812 25,424 3,575 4.7 140.6 30.9 Source: Ghana Statistical Service, 2010 Population and Housing Census
2.4.2 Mortality
Mortality is the measure of the number of deaths in a population per unit of time. However,
the 2010 Population and Housing Census (PHC) focused on all deaths that occurred in the
household during the 12 months preceding the Census Night. It is one of the three main
components of population change which influences population growth. Crude death rate on the
other hand indicates the number of deaths occurring during the year, per 1,000 of a
population. Subtracting crude death rate from the crude birth rate provides the rate of natural
increase, which is equal to the rate of population change within a specified period in the
absence of migration.
Table 2.4 presents the total number of deaths and crude death rate in the Kwahu Afram Plains
South District. Five hundred and thirty nine deaths were recorded at the household level out
of the total population of 115,812 with an associated crude death rate of 4.7. Comparing
Kwahu Afram Plains South with other districts in the region, the district has a low crude
death rate (4.7) which reflects the relatively low regional crude death rate (8.2%). However
there are few exceptions for Birim South, Yilo Krobo, Lower Manya, Kwahu South and
Kwahu East with crude death rates exceeding 10 percent.
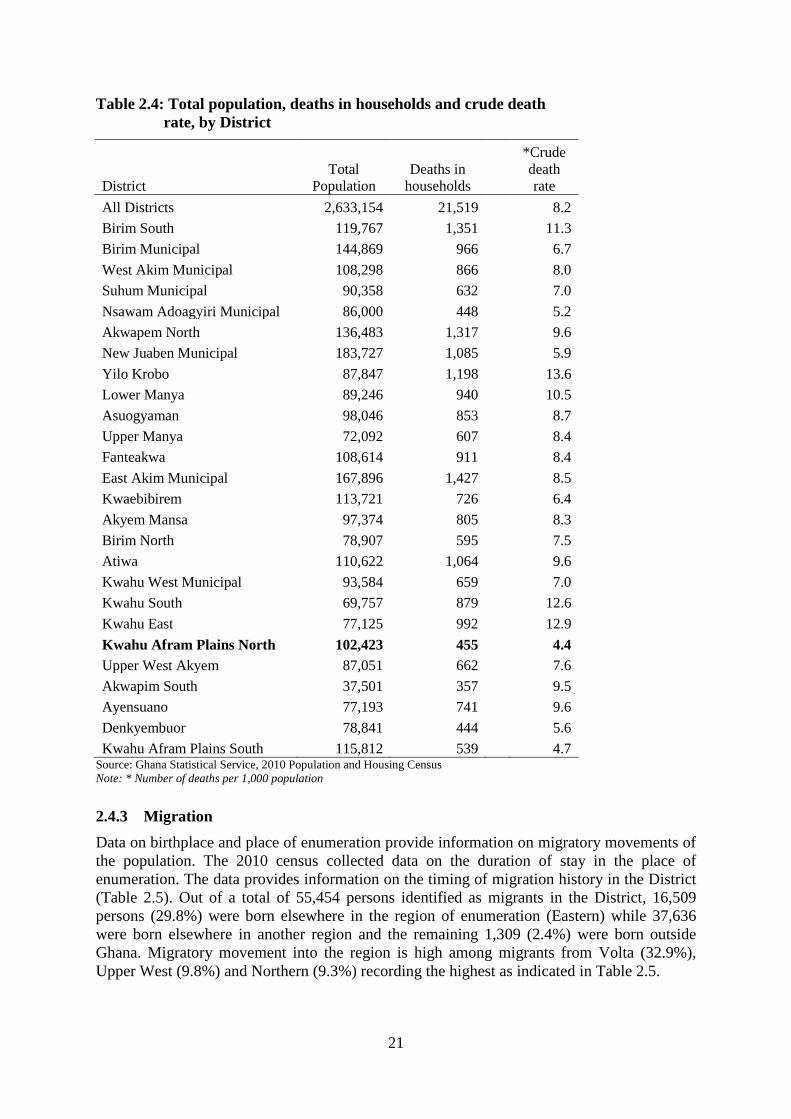
21
Table 2.4: Total population, deaths in households and crude death
rate, by District
District Total
Population Deaths in
households
*Crude
death
rate
All Districts 2,633,154 21,519 8.2
Birim South 119,767 1,351
11.3
Birim Municipal 144,869 966
6.7
West Akim Municipal 108,298 866
8.0
Suhum Municipal 90,358 632
7.0
Nsawam Adoagyiri Municipal 86,000 448
5.2
Akwapem North 136,483 1,317
9.6
New Juaben Municipal 183,727 1,085
5.9
Yilo Krobo 87,847 1,198
13.6
Lower Manya 89,246 940
10.5
Asuogyaman 98,046 853
8.7
Upper Manya 72,092 607
8.4
Fanteakwa 108,614 911
8.4
East Akim Municipal 167,896 1,427
8.5
Kwaebibirem 113,721 726
6.4
Akyem Mansa 97,374 805
8.3
Birim North 78,907 595
7.5
Atiwa 110,622 1,064
9.6
Kwahu West Municipal 93,584 659
7.0
Kwahu South 69,757 879
12.6
Kwahu East 77,125 992
12.9
Kwahu Afram Plains North 102,423 455
4.4
Upper West Akyem 87,051 662
7.6
Akwapim South 37,501 357
9.5
Ayensuano 77,193 741
9.6
Denkyembuor 78,841 444
5.6
Kwahu Afram Plains South 115,812 539 4.7 Source: Ghana Statistical Service, 2010 Population and Housing Census
Note: * Number of deaths per 1,000 population
2.4.3 Migration
Data on birthplace and place of enumeration provide information on migratory movements of
the population. The 2010 census collected data on the duration of stay in the place of
enumeration. The data provides information on the timing of migration history in the District
(Table 2.5). Out of a total of 55,454 persons identified as migrants in the District, 16,509
persons (29.8%) were born elsewhere in the region of enumeration (Eastern) while 37,636
were born elsewhere in another region and the remaining 1,309 (2.4%) were born outside
Ghana. Migratory movement into the region is high among migrants from Volta (32.9%),
Upper West (9.8%) and Northern (9.3%) recording the highest as indicated in Table 2.5.
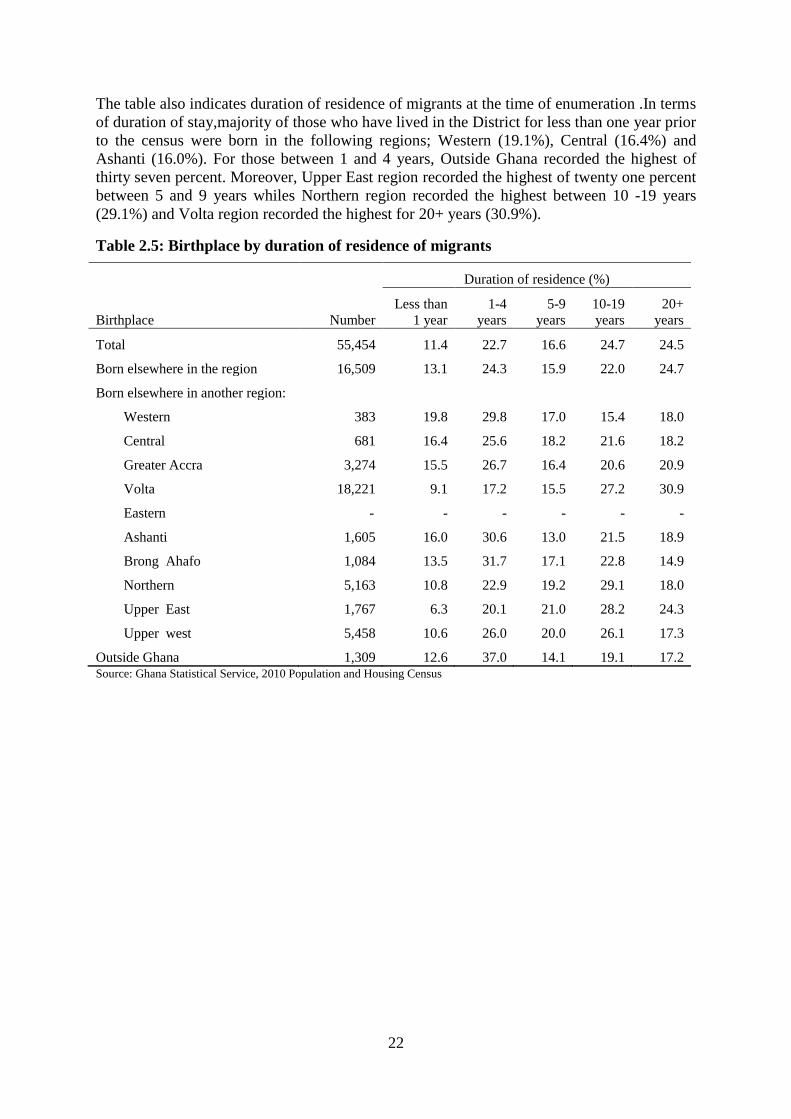
22
The table also indicates duration of residence of migrants at the time of enumeration .In terms
of duration of stay,majority of those who have lived in the District for less than one year prior
to the census were born in the following regions; Western (19.1%), Central (16.4%) and
Ashanti (16.0%). For those between 1 and 4 years, Outside Ghana recorded the highest of
thirty seven percent. Moreover, Upper East region recorded the highest of twenty one percent
between 5 and 9 years whiles Northern region recorded the highest between 10 -19 years
(29.1%) and Volta region recorded the highest for 20+ years (30.9%).
Table 2.5: Birthplace by duration of residence of migrants
Duration of residence (%)
Birthplace Number
Less than
1 year
1-4
years
5-9
years
10-19
years
20+
years
Total 55,454 11.4 22.7 16.6 24.7 24.5
Born elsewhere in the region 16,509 13.1 24.3 15.9 22.0 24.7
Born elsewhere in another region:
Western 383 19.8 29.8 17.0 15.4 18.0
Central 681 16.4 25.6 18.2 21.6 18.2
Greater Accra 3,274 15.5 26.7 16.4 20.6 20.9
Volta 18,221 9.1 17.2 15.5 27.2 30.9
Eastern - - - - - -
Ashanti 1,605 16.0 30.6 13.0 21.5 18.9
Brong Ahafo 1,084 13.5 31.7 17.1 22.8 14.9
Northern 5,163 10.8 22.9 19.2 29.1 18.0
Upper East 1,767 6.3 20.1 21.0 28.2 24.3
Upper west 5,458 10.6 26.0 20.0 26.1 17.3
Outside Ghana 1,309 12.6 37.0 14.1 19.1 17.2 Source: Ghana Statistical Service, 2010 Population and Housing Census
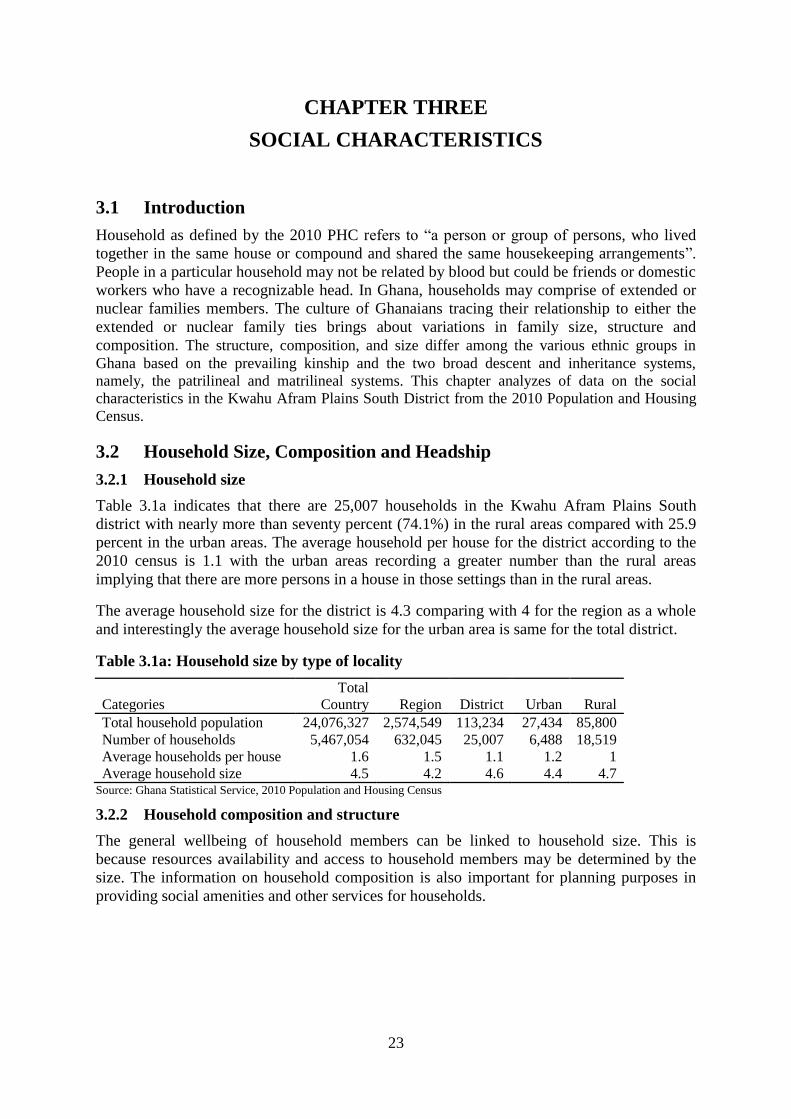
23
CHAPTER THREE
SOCIAL CHARACTERISTICS
3.1 Introduction
Household as defined by the 2010 PHC refers to “a person or group of persons, who lived
together in the same house or compound and shared the same housekeeping arrangements”.
People in a particular household may not be related by blood but could be friends or domestic
workers who have a recognizable head. In Ghana, households may comprise of extended or
nuclear families members. The culture of Ghanaians tracing their relationship to either the
extended or nuclear family ties brings about variations in family size, structure and
composition. The structure, composition, and size differ among the various ethnic groups in
Ghana based on the prevailing kinship and the two broad descent and inheritance systems,
namely, the patrilineal and matrilineal systems. This chapter analyzes of data on the social
characteristics in the Kwahu Afram Plains South District from the 2010 Population and Housing
Census.
3.2 Household Size, Composition and Headship
3.2.1 Household size
Table 3.1a indicates that there are 25,007 households in the Kwahu Afram Plains South
district with nearly more than seventy percent (74.1%) in the rural areas compared with 25.9
percent in the urban areas. The average household per house for the district according to the
2010 census is 1.1 with the urban areas recording a greater number than the rural areas
implying that there are more persons in a house in those settings than in the rural areas.
The average household size for the district is 4.3 comparing with 4 for the region as a whole
and interestingly the average household size for the urban area is same for the total district.
Table 3.1a: Household size by type of locality
Categories
Total
Country Region District Urban Rural
Total household population 24,076,327 2,574,549 113,234 27,434 85,800
Number of households 5,467,054 632,045 25,007 6,488 18,519
Average households per house 1.6 1.5 1.1 1.2 1
Average household size 4.5 4.2 4.6 4.4 4.7 Source: Ghana Statistical Service, 2010 Population and Housing Census
3.2.2 Household composition and structure
The general wellbeing of household members can be linked to household size. This is
because resources availability and access to household members may be determined by the
size. The information on household composition is also important for planning purposes in
providing social amenities and other services for households.
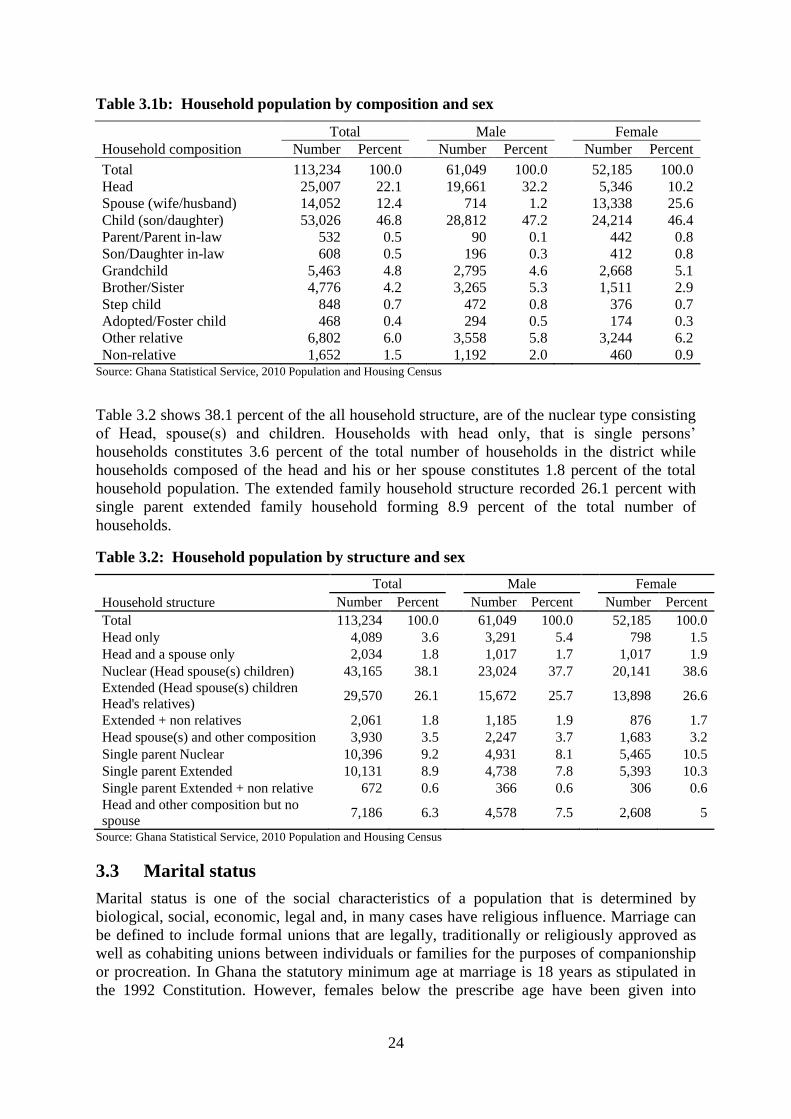
24
Table 3.1b: Household population by composition and sex
Household composition Total Male Female
Number Percent Number Percent Number Percent
Total 113,234 100.0
61,049 100.0
52,185 100.0 Head 25,007 22.1
19,661 32.2
5,346 10.2
Spouse (wife/husband) 14,052 12.4
714 1.2
13,338 25.6 Child (son/daughter) 53,026 46.8
28,812 47.2
24,214 46.4
Parent/Parent in-law 532 0.5
90 0.1
442 0.8 Son/Daughter in-law 608 0.5
196 0.3
412 0.8
Grandchild 5,463 4.8
2,795 4.6
2,668 5.1 Brother/Sister 4,776 4.2
3,265 5.3
1,511 2.9
Step child 848 0.7
472 0.8
376 0.7 Adopted/Foster child 468 0.4
294 0.5
174 0.3
Other relative 6,802 6.0
3,558 5.8
3,244 6.2 Non-relative 1,652 1.5 1,192 2.0 460 0.9
Source: Ghana Statistical Service, 2010 Population and Housing Census
Table 3.2 shows 38.1 percent of the all household structure, are of the nuclear type consisting
of Head, spouse(s) and children. Households with head only, that is single persons’
households constitutes 3.6 percent of the total number of households in the district while
households composed of the head and his or her spouse constitutes 1.8 percent of the total
household population. The extended family household structure recorded 26.1 percent with
single parent extended family household forming 8.9 percent of the total number of
households.
Table 3.2: Household population by structure and sex
Household structure
Total Male Female
Number Percent Number Percent Number Percent
Total 113,234 100.0
61,049 100.0
52,185 100.0
Head only 4,089 3.6
3,291 5.4
798 1.5
Head and a spouse only 2,034 1.8
1,017 1.7
1,017 1.9
Nuclear (Head spouse(s) children) 43,165 38.1
23,024 37.7
20,141 38.6
Extended (Head spouse(s) children
Head's relatives) 29,570 26.1
15,672 25.7
13,898 26.6
Extended + non relatives 2,061 1.8
1,185 1.9
876 1.7
Head spouse(s) and other composition 3,930 3.5
2,247 3.7
1,683 3.2
Single parent Nuclear 10,396 9.2
4,931 8.1
5,465 10.5
Single parent Extended 10,131 8.9
4,738 7.8
5,393 10.3
Single parent Extended + non relative 672 0.6
366 0.6
306 0.6
Head and other composition but no
spouse 7,186 6.3 4,578 7.5 2,608 5
Source: Ghana Statistical Service, 2010 Population and Housing Census
3.3 Marital status
Marital status is one of the social characteristics of a population that is determined by
biological, social, economic, legal and, in many cases have religious influence. Marriage can
be defined to include formal unions that are legally, traditionally or religiously approved as
well as cohabiting unions between individuals or families for the purposes of companionship
or procreation. In Ghana the statutory minimum age at marriage is 18 years as stipulated in
the 1992 Constitution. However, females below the prescribe age have been given into
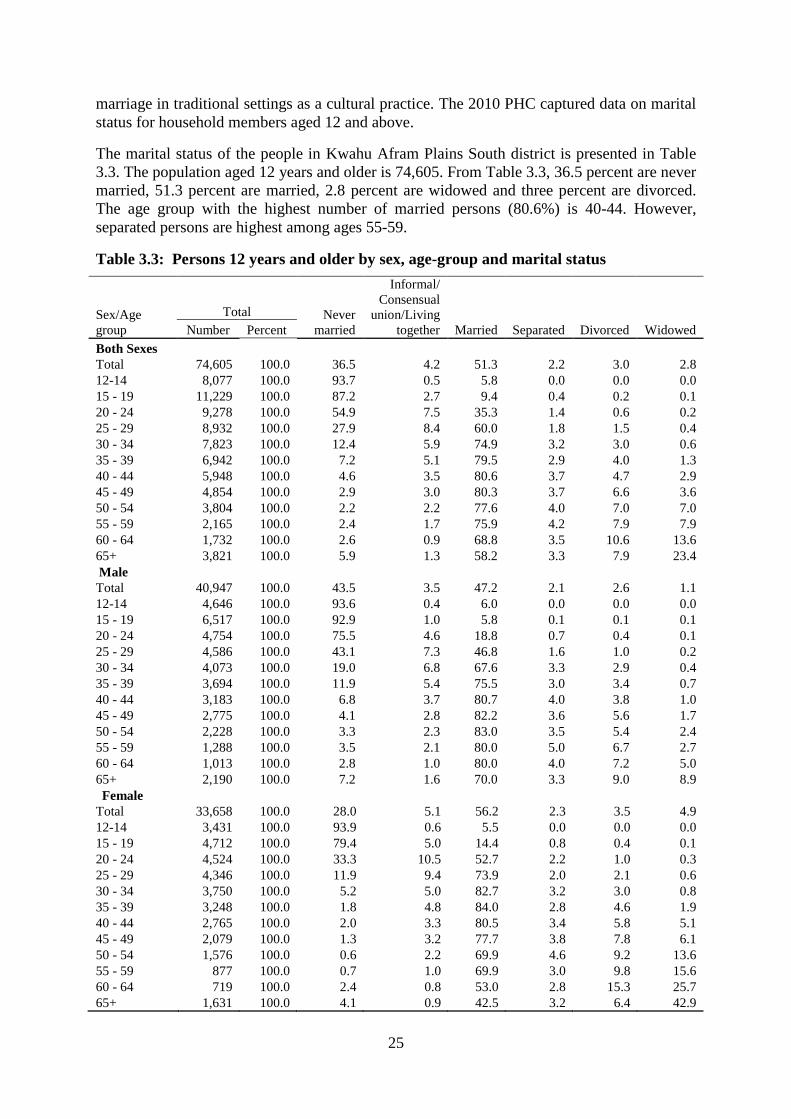
25
marriage in traditional settings as a cultural practice. The 2010 PHC captured data on marital
status for household members aged 12 and above.
The marital status of the people in Kwahu Afram Plains South district is presented in Table
3.3. The population aged 12 years and older is 74,605. From Table 3.3, 36.5 percent are never
married, 51.3 percent are married, 2.8 percent are widowed and three percent are divorced.
The age group with the highest number of married persons (80.6%) is 40-44. However,
separated persons are highest among ages 55-59.
Table 3.3: Persons 12 years and older by sex, age-group and marital status
Sex/Age
group
Total Never
married
Informal/
Consensual
union/Living
together Married Separated Divorced Widowed Number Percent
Both Sexes
Total 74,605 100.0 36.5 4.2 51.3 2.2 3.0 2.8
12-14 8,077 100.0 93.7 0.5 5.8 0.0 0.0 0.0
15 - 19 11,229 100.0 87.2 2.7 9.4 0.4 0.2 0.1
20 - 24 9,278 100.0 54.9 7.5 35.3 1.4 0.6 0.2
25 - 29 8,932 100.0 27.9 8.4 60.0 1.8 1.5 0.4
30 - 34 7,823 100.0 12.4 5.9 74.9 3.2 3.0 0.6
35 - 39 6,942 100.0 7.2 5.1 79.5 2.9 4.0 1.3
40 - 44 5,948 100.0 4.6 3.5 80.6 3.7 4.7 2.9
45 - 49 4,854 100.0 2.9 3.0 80.3 3.7 6.6 3.6
50 - 54 3,804 100.0 2.2 2.2 77.6 4.0 7.0 7.0
55 - 59 2,165 100.0 2.4 1.7 75.9 4.2 7.9 7.9
60 - 64 1,732 100.0 2.6 0.9 68.8 3.5 10.6 13.6
65+ 3,821 100.0 5.9 1.3 58.2 3.3 7.9 23.4
Male
Total 40,947 100.0 43.5 3.5 47.2 2.1 2.6 1.1
12-14 4,646 100.0 93.6 0.4 6.0 0.0 0.0 0.0
15 - 19 6,517 100.0 92.9 1.0 5.8 0.1 0.1 0.1
20 - 24 4,754 100.0 75.5 4.6 18.8 0.7 0.4 0.1
25 - 29 4,586 100.0 43.1 7.3 46.8 1.6 1.0 0.2
30 - 34 4,073 100.0 19.0 6.8 67.6 3.3 2.9 0.4
35 - 39 3,694 100.0 11.9 5.4 75.5 3.0 3.4 0.7
40 - 44 3,183 100.0 6.8 3.7 80.7 4.0 3.8 1.0
45 - 49 2,775 100.0 4.1 2.8 82.2 3.6 5.6 1.7
50 - 54 2,228 100.0 3.3 2.3 83.0 3.5 5.4 2.4
55 - 59 1,288 100.0 3.5 2.1 80.0 5.0 6.7 2.7
60 - 64 1,013 100.0 2.8 1.0 80.0 4.0 7.2 5.0
65+ 2,190 100.0 7.2 1.6 70.0 3.3 9.0 8.9
Female
Total 33,658 100.0 28.0 5.1 56.2 2.3 3.5 4.9
12-14 3,431 100.0 93.9 0.6 5.5 0.0 0.0 0.0
15 - 19 4,712 100.0 79.4 5.0 14.4 0.8 0.4 0.1
20 - 24 4,524 100.0 33.3 10.5 52.7 2.2 1.0 0.3
25 - 29 4,346 100.0 11.9 9.4 73.9 2.0 2.1 0.6
30 - 34 3,750 100.0 5.2 5.0 82.7 3.2 3.0 0.8
35 - 39 3,248 100.0 1.8 4.8 84.0 2.8 4.6 1.9
40 - 44 2,765 100.0 2.0 3.3 80.5 3.4 5.8 5.1
45 - 49 2,079 100.0 1.3 3.2 77.7 3.8 7.8 6.1
50 - 54 1,576 100.0 0.6 2.2 69.9 4.6 9.2 13.6
55 - 59 877 100.0 0.7 1.0 69.9 3.0 9.8 15.6
60 - 64 719 100.0 2.4 0.8 53.0 2.8 15.3 25.7
65+ 1,631 100.0 4.1 0.9 42.5 3.2 6.4 42.9
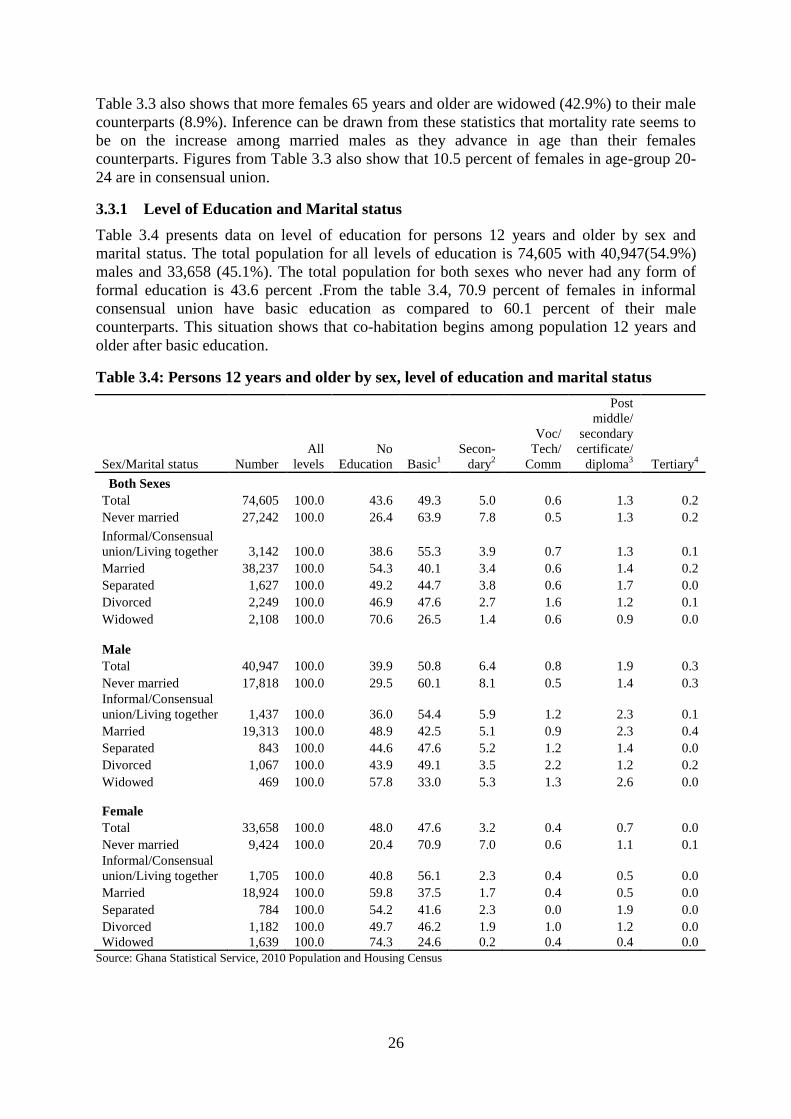
26
Table 3.3 also shows that more females 65 years and older are widowed (42.9%) to their male
counterparts (8.9%). Inference can be drawn from these statistics that mortality rate seems to
be on the increase among married males as they advance in age than their females
counterparts. Figures from Table 3.3 also show that 10.5 percent of females in age-group 20-
24 are in consensual union.
3.3.1 Level of Education and Marital status
Table 3.4 presents data on level of education for persons 12 years and older by sex and
marital status. The total population for all levels of education is 74,605 with 40,947(54.9%)
males and 33,658 (45.1%). The total population for both sexes who never had any form of
formal education is 43.6 percent .From the table 3.4, 70.9 percent of females in informal
consensual union have basic education as compared to 60.1 percent of their male
counterparts. This situation shows that co-habitation begins among population 12 years and
older after basic education.
Table 3.4: Persons 12 years and older by sex, level of education and marital status
Sex/Marital status Number
All
levels
No
Education Basic1
Secon-
dary2
Voc/
Tech/
Comm
Post
middle/
secondary
certificate/
diploma3 Tertiary
4
Both Sexes
Total 74,605 100.0 43.6 49.3 5.0 0.6 1.3 0.2
Never married 27,242 100.0 26.4 63.9 7.8 0.5 1.3 0.2
Informal/Consensual
union/Living together 3,142 100.0 38.6 55.3 3.9 0.7 1.3 0.1
Married 38,237 100.0 54.3 40.1 3.4 0.6 1.4 0.2
Separated 1,627 100.0 49.2 44.7 3.8 0.6 1.7 0.0
Divorced 2,249 100.0 46.9 47.6 2.7 1.6 1.2 0.1
Widowed 2,108 100.0 70.6 26.5 1.4 0.6 0.9 0.0
Male
Total 40,947 100.0 39.9 50.8 6.4 0.8 1.9 0.3
Never married 17,818 100.0 29.5 60.1 8.1 0.5 1.4 0.3
Informal/Consensual
union/Living together 1,437 100.0 36.0 54.4 5.9 1.2 2.3 0.1
Married 19,313 100.0 48.9 42.5 5.1 0.9 2.3 0.4
Separated 843 100.0 44.6 47.6 5.2 1.2 1.4 0.0
Divorced 1,067 100.0 43.9 49.1 3.5 2.2 1.2 0.2
Widowed 469 100.0 57.8 33.0 5.3 1.3 2.6 0.0
Female
Total 33,658 100.0 48.0 47.6 3.2 0.4 0.7 0.0
Never married 9,424 100.0 20.4 70.9 7.0 0.6 1.1 0.1
Informal/Consensual
union/Living together 1,705 100.0 40.8 56.1 2.3 0.4 0.5 0.0
Married 18,924 100.0 59.8 37.5 1.7 0.4 0.5 0.0
Separated 784 100.0 54.2 41.6 2.3 0.0 1.9 0.0
Divorced 1,182 100.0 49.7 46.2 1.9 1.0 1.2 0.0
Widowed 1,639 100.0 74.3 24.6 0.2 0.4 0.4 0.0
Source: Ghana Statistical Service, 2010 Population and Housing Census
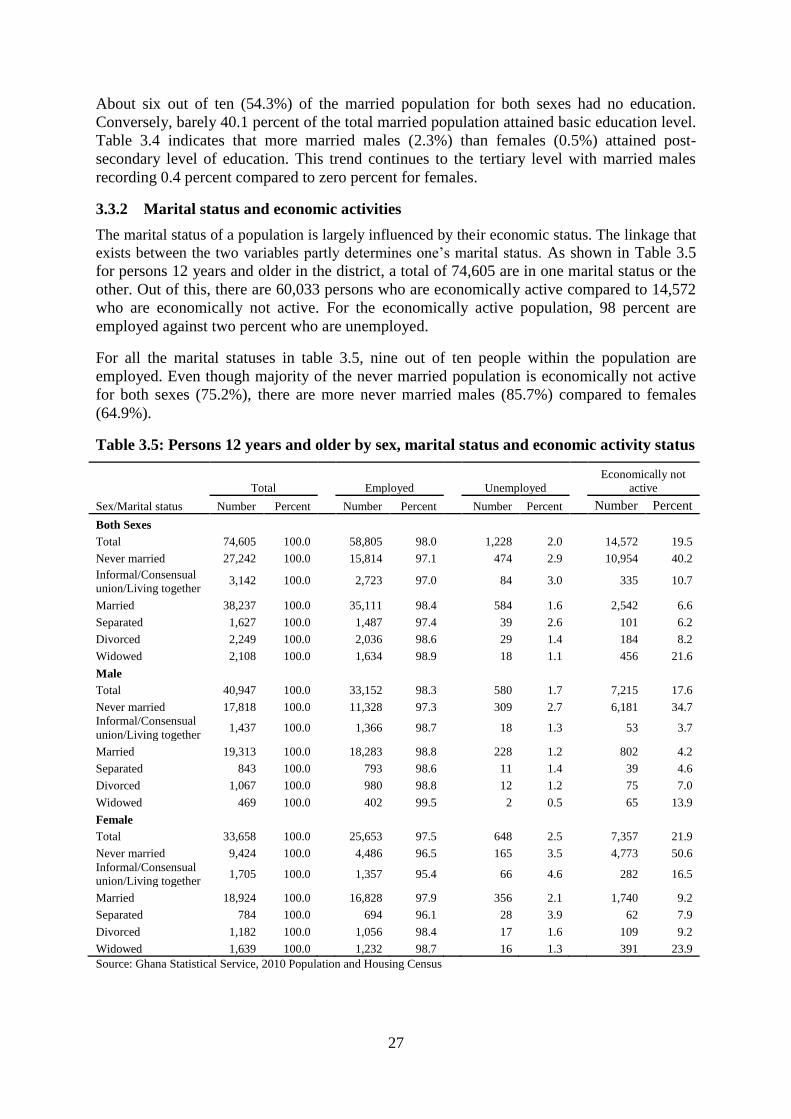
27
About six out of ten (54.3%) of the married population for both sexes had no education.
Conversely, barely 40.1 percent of the total married population attained basic education level.
Table 3.4 indicates that more married males (2.3%) than females (0.5%) attained post-
secondary level of education. This trend continues to the tertiary level with married males
recording 0.4 percent compared to zero percent for females.
3.3.2 Marital status and economic activities
The marital status of a population is largely influenced by their economic status. The linkage that
exists between the two variables partly determines one’s marital status. As shown in Table 3.5
for persons 12 years and older in the district, a total of 74,605 are in one marital status or the
other. Out of this, there are 60,033 persons who are economically active compared to 14,572
who are economically not active. For the economically active population, 98 percent are
employed against two percent who are unemployed.
For all the marital statuses in table 3.5, nine out of ten people within the population are
employed. Even though majority of the never married population is economically not active
for both sexes (75.2%), there are more never married males (85.7%) compared to females
(64.9%).
Table 3.5: Persons 12 years and older by sex, marital status and economic activity status
Sex/Marital status
Total Employed Unemployed
Economically not
active
Number Percent Number Percent Number Percent Number Percent
Both Sexes
Total 74,605 100.0
58,805 98.0
1,228 2.0
14,572 19.5
Never married 27,242 100.0
15,814 97.1
474 2.9
10,954 40.2
Informal/Consensual
union/Living together 3,142 100.0
2,723 97.0
84 3.0
335 10.7
Married 38,237 100.0
35,111 98.4
584 1.6
2,542 6.6
Separated 1,627 100.0
1,487 97.4
39 2.6
101 6.2
Divorced 2,249 100.0
2,036 98.6
29 1.4
184 8.2
Widowed 2,108 100.0
1,634 98.9
18 1.1
456 21.6
Male
Total 40,947 100.0
33,152 98.3
580 1.7
7,215 17.6
Never married 17,818 100.0
11,328 97.3
309 2.7
6,181 34.7
Informal/Consensual
union/Living together 1,437 100.0
1,366 98.7
18 1.3
53 3.7
Married 19,313 100.0
18,283 98.8
228 1.2
802 4.2
Separated 843 100.0
793 98.6
11 1.4
39 4.6
Divorced 1,067 100.0
980 98.8
12 1.2
75 7.0
Widowed 469 100.0
402 99.5
2 0.5
65 13.9
Female
Total 33,658 100.0
25,653 97.5
648 2.5
7,357 21.9
Never married 9,424 100.0
4,486 96.5
165 3.5
4,773 50.6
Informal/Consensual
union/Living together 1,705 100.0
1,357 95.4
66 4.6
282 16.5
Married 18,924 100.0
16,828 97.9
356 2.1
1,740 9.2
Separated 784 100.0
694 96.1
28 3.9
62 7.9
Divorced 1,182 100.0
1,056 98.4
17 1.6
109 9.2
Widowed 1,639 100.0 1,232 98.7 16 1.3 391 23.9
Source: Ghana Statistical Service, 2010 Population and Housing Census
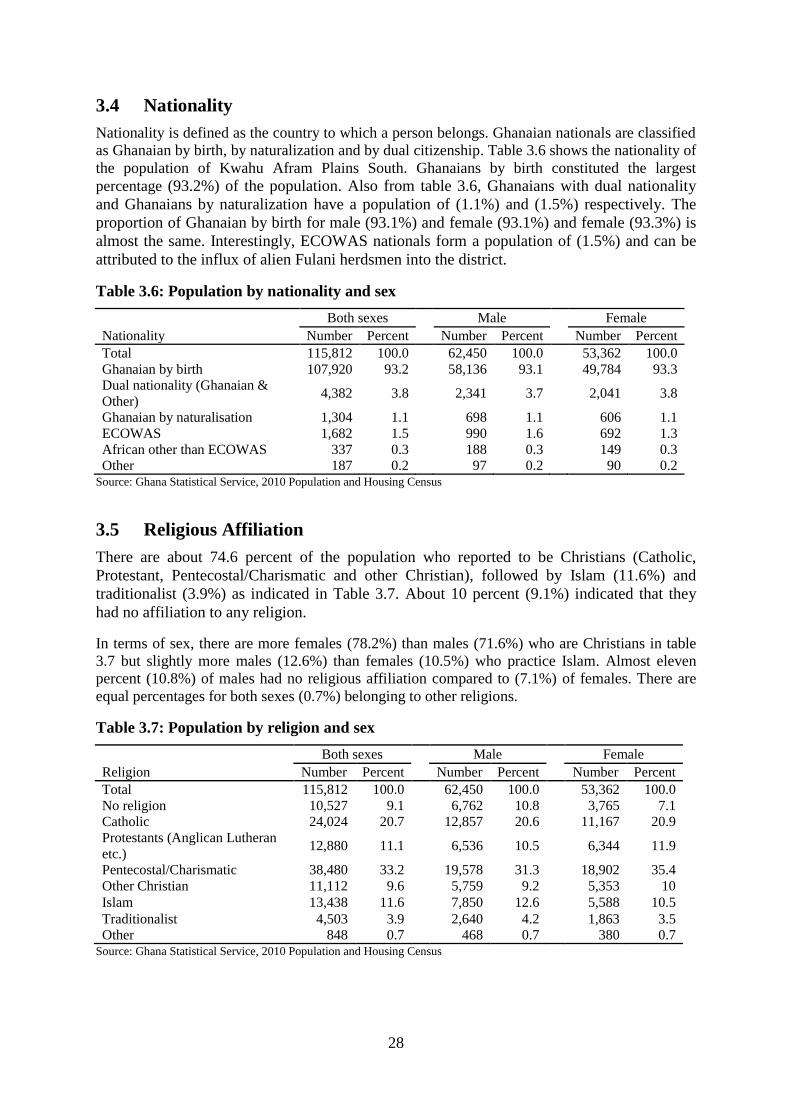
28
3.4 Nationality
Nationality is defined as the country to which a person belongs. Ghanaian nationals are classified
as Ghanaian by birth, by naturalization and by dual citizenship. Table 3.6 shows the nationality of
the population of Kwahu Afram Plains South. Ghanaians by birth constituted the largest
percentage (93.2%) of the population. Also from table 3.6, Ghanaians with dual nationality
and Ghanaians by naturalization have a population of (1.1%) and (1.5%) respectively. The
proportion of Ghanaian by birth for male (93.1%) and female (93.1%) and female (93.3%) is
almost the same. Interestingly, ECOWAS nationals form a population of (1.5%) and can be
attributed to the influx of alien Fulani herdsmen into the district.
Table 3.6: Population by nationality and sex
Nationality
Both sexes Male Female
Number Percent Number Percent Number Percent
Total 115,812 100.0
62,450 100.0
53,362 100.0
Ghanaian by birth 107,920 93.2
58,136 93.1
49,784 93.3
Dual nationality (Ghanaian &
Other) 4,382 3.8
2,341 3.7
2,041 3.8
Ghanaian by naturalisation 1,304 1.1
698 1.1
606 1.1
ECOWAS 1,682 1.5
990 1.6
692 1.3
African other than ECOWAS 337 0.3
188 0.3
149 0.3
Other 187 0.2 97 0.2 90 0.2 Source: Ghana Statistical Service, 2010 Population and Housing Census
3.5 Religious Affiliation
There are about 74.6 percent of the population who reported to be Christians (Catholic,
Protestant, Pentecostal/Charismatic and other Christian), followed by Islam (11.6%) and
traditionalist (3.9%) as indicated in Table 3.7. About 10 percent (9.1%) indicated that they
had no affiliation to any religion.
In terms of sex, there are more females (78.2%) than males (71.6%) who are Christians in table
3.7 but slightly more males (12.6%) than females (10.5%) who practice Islam. Almost eleven
percent (10.8%) of males had no religious affiliation compared to (7.1%) of females. There are
equal percentages for both sexes (0.7%) belonging to other religions.
Table 3.7: Population by religion and sex
Religion
Both sexes Male Female
Number Percent Number Percent Number Percent
Total 115,812 100.0
62,450 100.0
53,362 100.0
No religion 10,527 9.1
6,762 10.8
3,765 7.1
Catholic 24,024 20.7
12,857 20.6
11,167 20.9
Protestants (Anglican Lutheran
etc.) 12,880 11.1
6,536 10.5
6,344 11.9
Pentecostal/Charismatic 38,480 33.2
19,578 31.3
18,902 35.4
Other Christian 11,112 9.6
5,759 9.2
5,353 10
Islam 13,438 11.6
7,850 12.6
5,588 10.5
Traditionalist 4,503 3.9
2,640 4.2
1,863 3.5
Other 848 0.7 468 0.7 380 0.7 Source: Ghana Statistical Service, 2010 Population and Housing Census
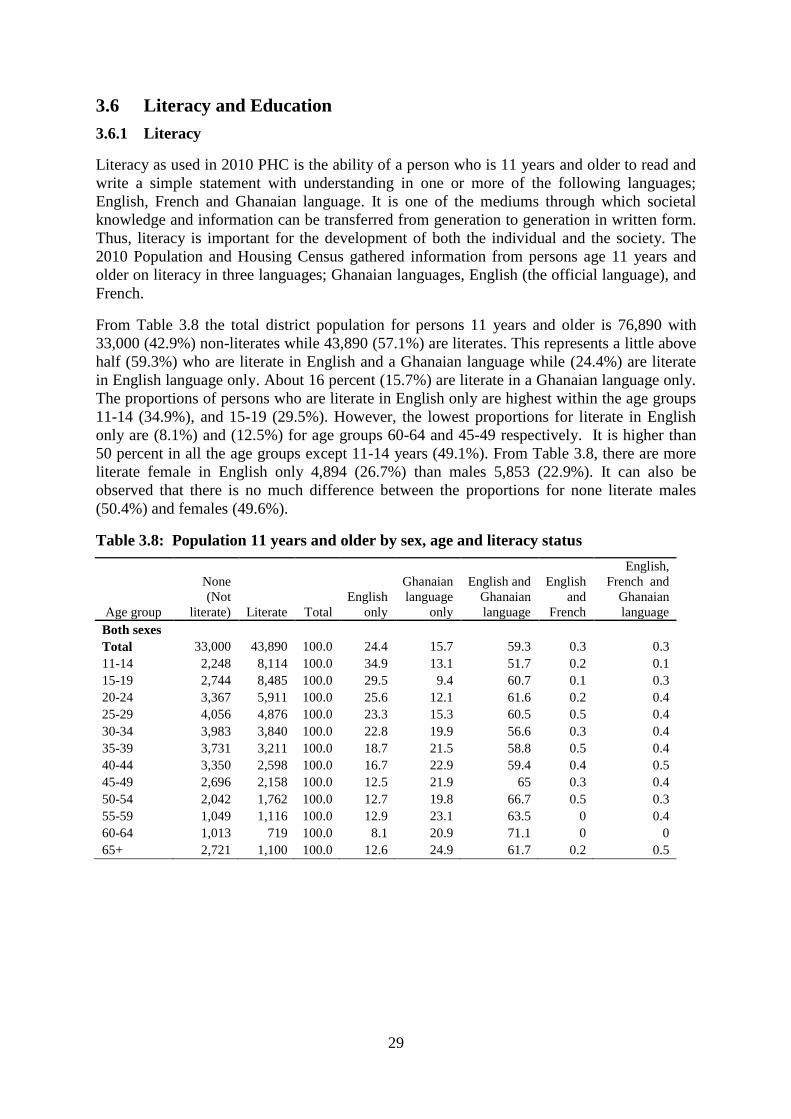
29
3.6 Literacy and Education
3.6.1 Literacy
Literacy as used in 2010 PHC is the ability of a person who is 11 years and older to read and
write a simple statement with understanding in one or more of the following languages;
English, French and Ghanaian language. It is one of the mediums through which societal
knowledge and information can be transferred from generation to generation in written form.
Thus, literacy is important for the development of both the individual and the society. The
2010 Population and Housing Census gathered information from persons age 11 years and
older on literacy in three languages; Ghanaian languages, English (the official language), and
French.
From Table 3.8 the total district population for persons 11 years and older is 76,890 with
33,000 (42.9%) non-literates while 43,890 (57.1%) are literates. This represents a little above
half (59.3%) who are literate in English and a Ghanaian language while (24.4%) are literate
in English language only. About 16 percent (15.7%) are literate in a Ghanaian language only.
The proportions of persons who are literate in English only are highest within the age groups
11-14 (34.9%), and 15-19 (29.5%). However, the lowest proportions for literate in English
only are (8.1%) and (12.5%) for age groups 60-64 and 45-49 respectively. It is higher than
50 percent in all the age groups except 11-14 years (49.1%). From Table 3.8, there are more
literate female in English only 4,894 (26.7%) than males 5,853 (22.9%). It can also be
observed that there is no much difference between the proportions for none literate males
(50.4%) and females (49.6%).
Table 3.8: Population 11 years and older by sex, age and literacy status
Age group
None
(Not
literate)
Literate
Total
English
only
Ghanaian
language
only
English and
Ghanaian
language
English
and
French
English,
French and
Ghanaian
language
Both sexes
Total 33,000 43,890 100.0 24.4 15.7 59.3 0.3 0.3
11-14 2,248 8,114 100.0 34.9 13.1 51.7 0.2 0.1
15-19 2,744 8,485 100.0 29.5 9.4 60.7 0.1 0.3
20-24 3,367 5,911 100.0 25.6 12.1 61.6 0.2 0.4
25-29 4,056 4,876 100.0 23.3 15.3 60.5 0.5 0.4
30-34 3,983 3,840 100.0 22.8 19.9 56.6 0.3 0.4
35-39 3,731 3,211 100.0 18.7 21.5 58.8 0.5 0.4
40-44 3,350 2,598 100.0 16.7 22.9 59.4 0.4 0.5
45-49 2,696 2,158 100.0 12.5 21.9 65 0.3 0.4
50-54 2,042 1,762 100.0 12.7 19.8 66.7 0.5 0.3
55-59 1,049 1,116 100.0 12.9 23.1 63.5 0 0.4
60-64 1,013 719 100.0 8.1 20.9 71.1 0 0
65+ 2,721 1,100 100.0 12.6 24.9 61.7 0.2 0.5
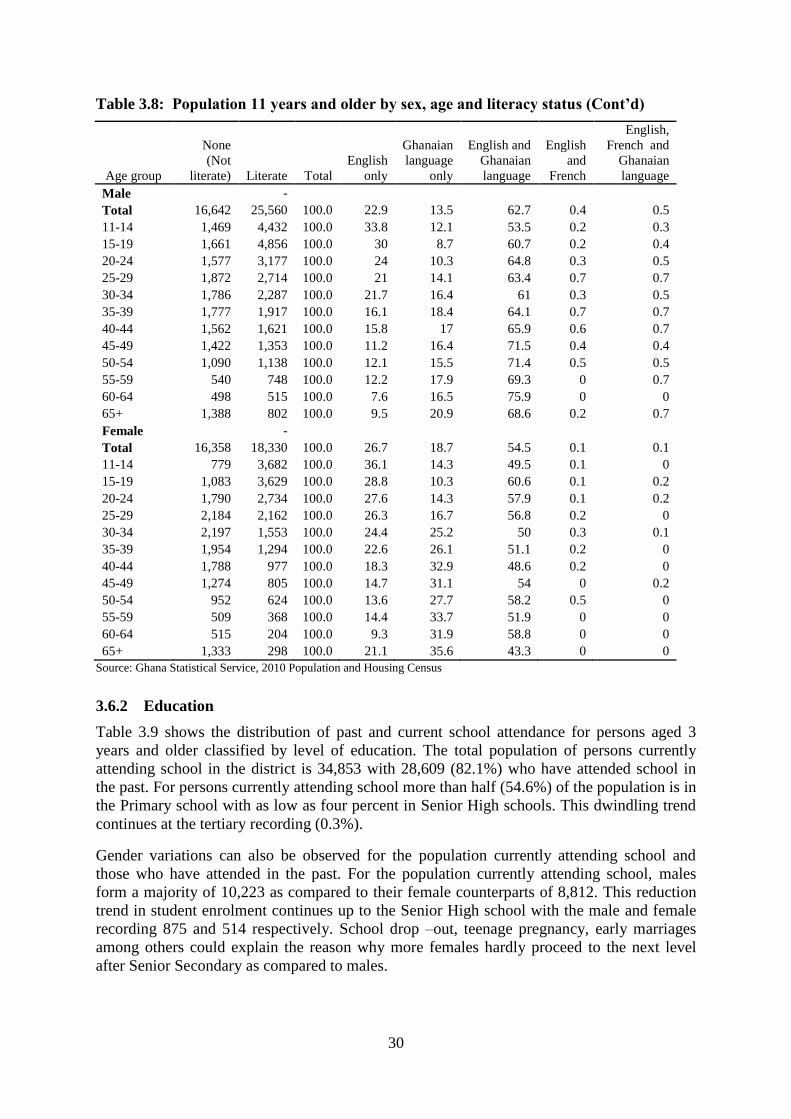
30
Table 3.8: Population 11 years and older by sex, age and literacy status (Cont’d)
Age group
None
(Not
literate)
Literate
Total
English
only
Ghanaian
language
only
English and
Ghanaian
language
English
and
French
English,
French and
Ghanaian
language
Male
-
Total 16,642 25,560 100.0 22.9 13.5 62.7 0.4 0.5
11-14 1,469 4,432 100.0 33.8 12.1 53.5 0.2 0.3
15-19 1,661 4,856 100.0 30 8.7 60.7 0.2 0.4
20-24 1,577 3,177 100.0 24 10.3 64.8 0.3 0.5
25-29 1,872 2,714 100.0 21 14.1 63.4 0.7 0.7
30-34 1,786 2,287 100.0 21.7 16.4 61 0.3 0.5
35-39 1,777 1,917 100.0 16.1 18.4 64.1 0.7 0.7
40-44 1,562 1,621 100.0 15.8 17 65.9 0.6 0.7
45-49 1,422 1,353 100.0 11.2 16.4 71.5 0.4 0.4
50-54 1,090 1,138 100.0 12.1 15.5 71.4 0.5 0.5
55-59 540 748 100.0 12.2 17.9 69.3 0 0.7
60-64 498 515 100.0 7.6 16.5 75.9 0 0
65+ 1,388 802 100.0 9.5 20.9 68.6 0.2 0.7
Female
-
Total 16,358 18,330 100.0 26.7 18.7 54.5 0.1 0.1
11-14 779 3,682 100.0 36.1 14.3 49.5 0.1 0
15-19 1,083 3,629 100.0 28.8 10.3 60.6 0.1 0.2
20-24 1,790 2,734 100.0 27.6 14.3 57.9 0.1 0.2
25-29 2,184 2,162 100.0 26.3 16.7 56.8 0.2 0
30-34 2,197 1,553 100.0 24.4 25.2 50 0.3 0.1
35-39 1,954 1,294 100.0 22.6 26.1 51.1 0.2 0
40-44 1,788 977 100.0 18.3 32.9 48.6 0.2 0
45-49 1,274 805 100.0 14.7 31.1 54 0 0.2
50-54 952 624 100.0 13.6 27.7 58.2 0.5 0
55-59 509 368 100.0 14.4 33.7 51.9 0 0
60-64 515 204 100.0 9.3 31.9 58.8 0 0
65+ 1,333 298 100.0 21.1 35.6 43.3 0 0
Source: Ghana Statistical Service, 2010 Population and Housing Census
3.6.2 Education
Table 3.9 shows the distribution of past and current school attendance for persons aged 3
years and older classified by level of education. The total population of persons currently
attending school in the district is 34,853 with 28,609 (82.1%) who have attended school in
the past. For persons currently attending school more than half (54.6%) of the population is in
the Primary school with as low as four percent in Senior High schools. This dwindling trend
continues at the tertiary recording (0.3%).
Gender variations can also be observed for the population currently attending school and
those who have attended in the past. For the population currently attending school, males
form a majority of 10,223 as compared to their female counterparts of 8,812. This reduction
trend in student enrolment continues up to the Senior High school with the male and female
recording 875 and 514 respectively. School drop –out, teenage pregnancy, early marriages
among others could explain the reason why more females hardly proceed to the next level
after Senior Secondary as compared to males.
31
The respective proportions for those currently attending and those who have attended school
in the past for middle school is a reflection of the review and transformation of the Ghanaian
educational system. The current educational reform has incorporated nursery school system
as shown in table 3.9. Owing to the current system in operation, it can be observed from table
3.9 that the number of people attending (from 388 to 69) Vocational/Technical/Commercial
schools is dwindling compared to those attended in the past.
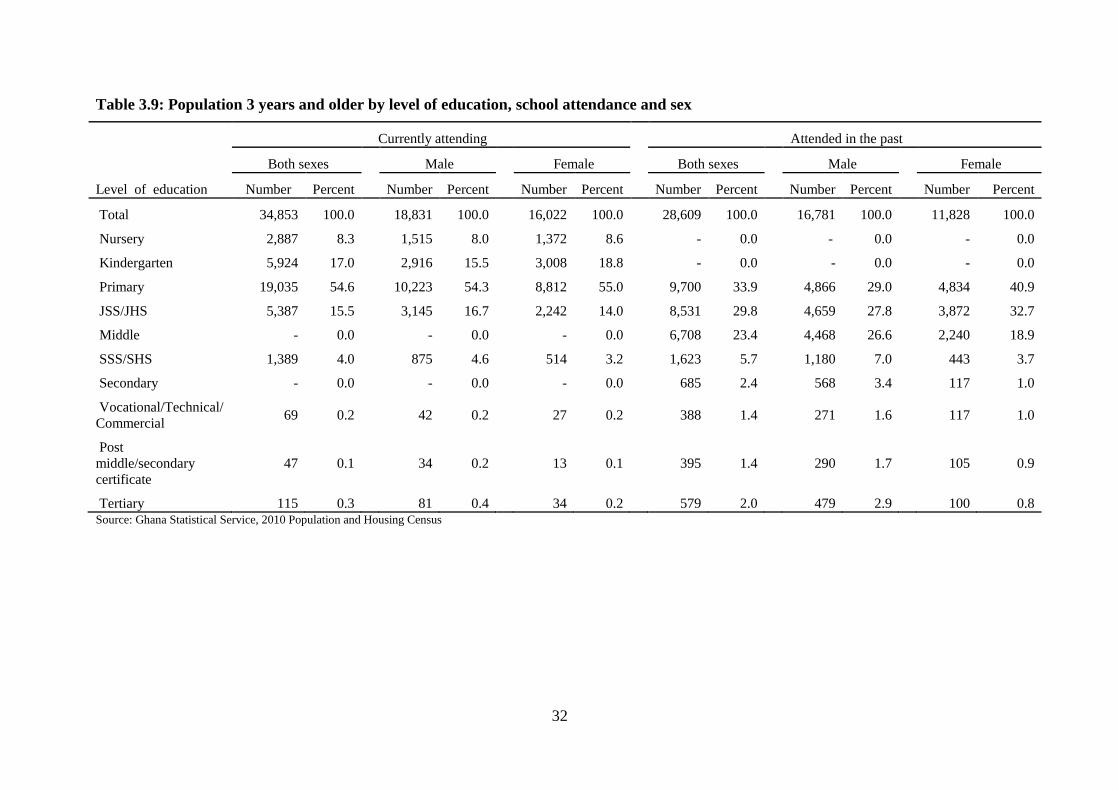
32
Table 3.9: Population 3 years and older by level of education, school attendance and sex
Currently attending Attended in the past
Both sexes
Male
Female
Both sexes
Male
Female
Level of education Number Percent Number Percent Number Percent Number Percent Number Percent Number Percent
Total 34,853 100.0
18,831 100.0
16,022 100.0
28,609 100.0
16,781 100.0
11,828 100.0
Nursery 2,887 8.3
1,515 8.0
1,372 8.6
- 0.0
- 0.0
- 0.0
Kindergarten 5,924 17.0
2,916 15.5
3,008 18.8
- 0.0
- 0.0
- 0.0
Primary 19,035 54.6
10,223 54.3
8,812 55.0
9,700 33.9
4,866 29.0
4,834 40.9
JSS/JHS 5,387 15.5
3,145 16.7
2,242 14.0
8,531 29.8
4,659 27.8
3,872 32.7
Middle - 0.0
- 0.0
- 0.0
6,708 23.4
4,468 26.6
2,240 18.9
SSS/SHS 1,389 4.0
875 4.6
514 3.2
1,623 5.7
1,180 7.0
443 3.7
Secondary - 0.0
- 0.0
- 0.0
685 2.4
568 3.4
117 1.0
Vocational/Technical/
Commercial 69 0.2
42 0.2
27 0.2
388 1.4
271 1.6
117 1.0
Post
middle/secondary
certificate
47 0.1
34 0.2
13 0.1
395 1.4
290 1.7
105 0.9
Tertiary 115 0.3 81 0.4 34 0.2 579 2.0 479 2.9 100 0.8 Source: Ghana Statistical Service, 2010 Population and Housing Census
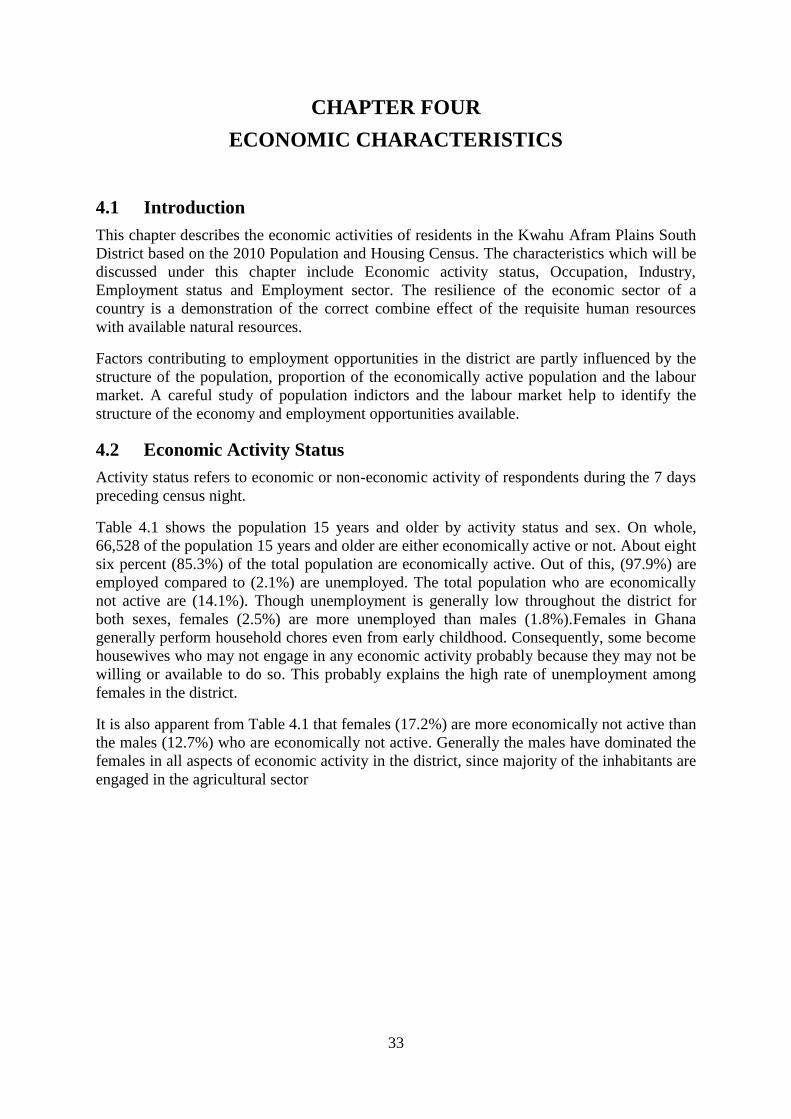
33
CHAPTER FOUR
ECONOMIC CHARACTERISTICS
4.1 Introduction
This chapter describes the economic activities of residents in the Kwahu Afram Plains South
District based on the 2010 Population and Housing Census. The characteristics which will be
discussed under this chapter include Economic activity status, Occupation, Industry,
Employment status and Employment sector. The resilience of the economic sector of a
country is a demonstration of the correct combine effect of the requisite human resources
with available natural resources.
Factors contributing to employment opportunities in the district are partly influenced by the
structure of the population, proportion of the economically active population and the labour
market. A careful study of population indictors and the labour market help to identify the
structure of the economy and employment opportunities available.
4.2 Economic Activity Status
Activity status refers to economic or non-economic activity of respondents during the 7 days
preceding census night.
Table 4.1 shows the population 15 years and older by activity status and sex. On whole,
66,528 of the population 15 years and older are either economically active or not. About eight
six percent (85.3%) of the total population are economically active. Out of this, (97.9%) are
employed compared to (2.1%) are unemployed. The total population who are economically
not active are (14.1%). Though unemployment is generally low throughout the district for
both sexes, females (2.5%) are more unemployed than males (1.8%).Females in Ghana
generally perform household chores even from early childhood. Consequently, some become
housewives who may not engage in any economic activity probably because they may not be
willing or available to do so. This probably explains the high rate of unemployment among
females in the district.
It is also apparent from Table 4.1 that females (17.2%) are more economically not active than
the males (12.7%) who are economically not active. Generally the males have dominated the
females in all aspects of economic activity in the district, since majority of the inhabitants are
engaged in the agricultural sector
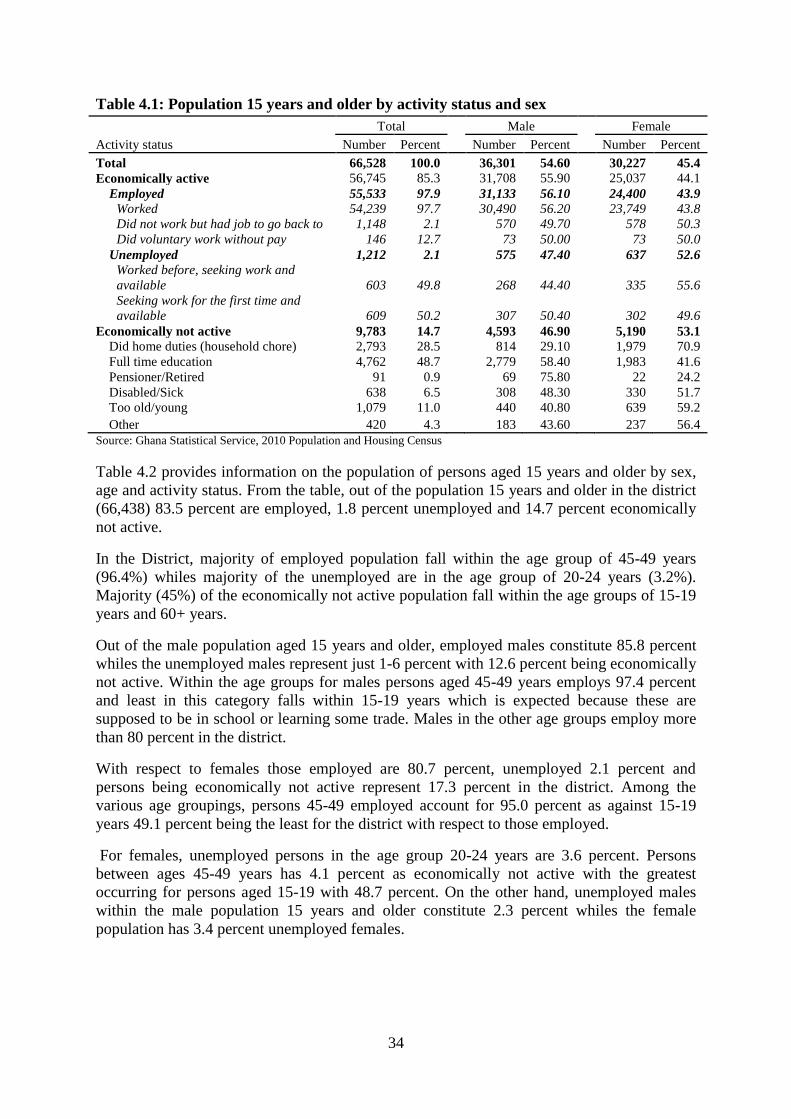
34
Table 4.1: Population 15 years and older by activity status and sex
Activity status
Total Male Female
Number Percent Number Percent Number Percent
Total 66,528 100.0
36,301 54.60
30,227 45.4
Economically active 56,745 85.3
31,708 55.90
25,037 44.1
Employed 55,533 97.9
31,133 56.10
24,400 43.9
Worked 54,239 97.7
30,490 56.20
23,749 43.8
Did not work but had job to go back to 1,148 2.1
570 49.70
578 50.3
Did voluntary work without pay 146 12.7
73 50.00
73 50.0
Unemployed 1,212 2.1
575 47.40
637 52.6
Worked before, seeking work and
available 603 49.8
268 44.40
335 55.6
Seeking work for the first time and
available 609 50.2
307 50.40
302 49.6
Economically not active 9,783 14.7
4,593 46.90
5,190 53.1
Did home duties (household chore) 2,793 28.5
814 29.10
1,979 70.9
Full time education 4,762 48.7
2,779 58.40
1,983 41.6
Pensioner/Retired 91 0.9
69 75.80
22 24.2
Disabled/Sick 638 6.5
308 48.30
330 51.7
Too old/young 1,079 11.0
440 40.80
639 59.2
Other 420 4.3 183 43.60 237 56.4
Source: Ghana Statistical Service, 2010 Population and Housing Census
Table 4.2 provides information on the population of persons aged 15 years and older by sex,
age and activity status. From the table, out of the population 15 years and older in the district
(66,438) 83.5 percent are employed, 1.8 percent unemployed and 14.7 percent economically
not active.
In the District, majority of employed population fall within the age group of 45-49 years
(96.4%) whiles majority of the unemployed are in the age group of 20-24 years (3.2%).
Majority (45%) of the economically not active population fall within the age groups of 15-19
years and 60+ years.
Out of the male population aged 15 years and older, employed males constitute 85.8 percent
whiles the unemployed males represent just 1-6 percent with 12.6 percent being economically
not active. Within the age groups for males persons aged 45-49 years employs 97.4 percent
and least in this category falls within 15-19 years which is expected because these are
supposed to be in school or learning some trade. Males in the other age groups employ more
than 80 percent in the district.
With respect to females those employed are 80.7 percent, unemployed 2.1 percent and
persons being economically not active represent 17.3 percent in the district. Among the
various age groupings, persons 45-49 employed account for 95.0 percent as against 15-19
years 49.1 percent being the least for the district with respect to those employed.
For females, unemployed persons in the age group 20-24 years are 3.6 percent. Persons
between ages 45-49 years has 4.1 percent as economically not active with the greatest
occurring for persons aged 15-19 with 48.7 percent. On the other hand, unemployed males
within the male population 15 years and older constitute 2.3 percent whiles the female
population has 3.4 percent unemployed females.
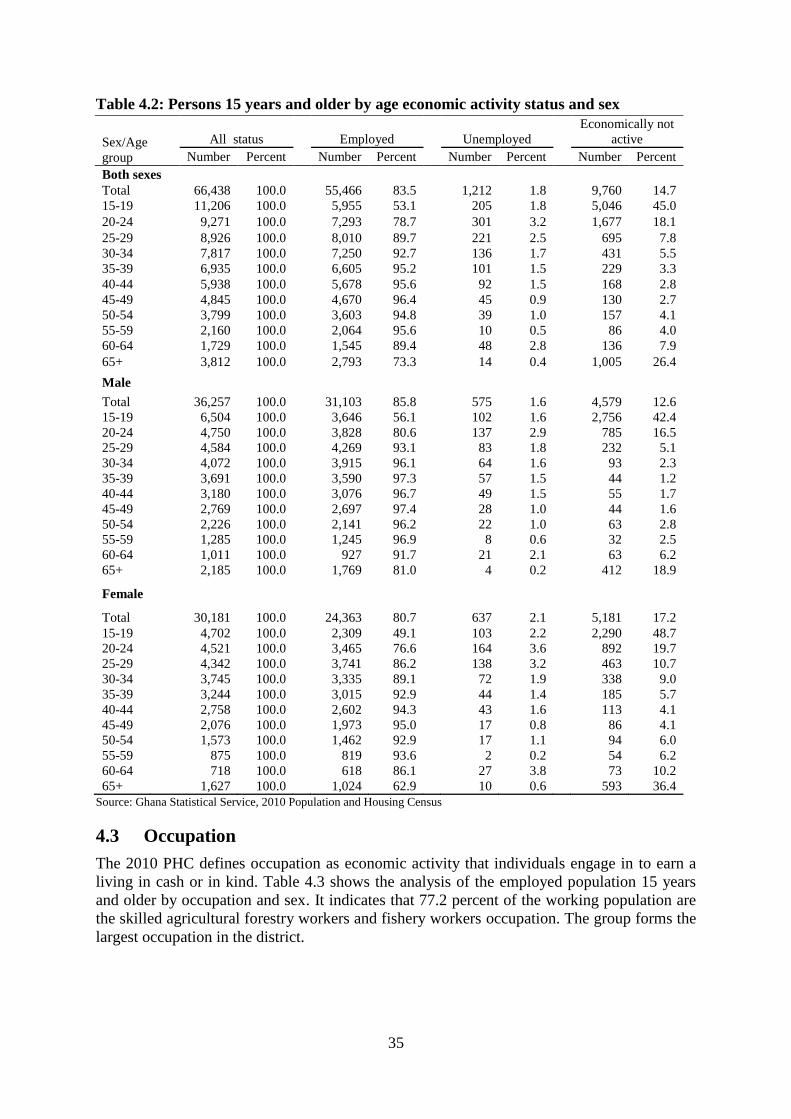
35
Table 4.2: Persons 15 years and older by age economic activity status and sex
Sex/Age
group
All status
Employed
Unemployed
Economically not
active
Number Percent Number Percent Number Percent Number Percent
Both sexes
Total 66,438 100.0
55,466 83.5
1,212 1.8
9,760 14.7
15-19 11,206 100.0
5,955 53.1
205 1.8
5,046 45.0
20-24 9,271 100.0
7,293 78.7
301 3.2
1,677 18.1
25-29 8,926 100.0
8,010 89.7
221 2.5
695 7.8
30-34 7,817 100.0
7,250 92.7
136 1.7
431 5.5
35-39 6,935 100.0
6,605 95.2
101 1.5
229 3.3
40-44 5,938 100.0
5,678 95.6
92 1.5
168 2.8
45-49 4,845 100.0
4,670 96.4
45 0.9
130 2.7
50-54 3,799 100.0
3,603 94.8
39 1.0
157 4.1
55-59 2,160 100.0
2,064 95.6
10 0.5
86 4.0
60-64 1,729 100.0
1,545 89.4
48 2.8
136 7.9
65+ 3,812 100.0
2,793 73.3
14 0.4
1,005 26.4
Male
Total 36,257 100.0
31,103 85.8
575 1.6
4,579 12.6
15-19 6,504 100.0
3,646 56.1
102 1.6
2,756 42.4
20-24 4,750 100.0
3,828 80.6
137 2.9
785 16.5
25-29 4,584 100.0
4,269 93.1
83 1.8
232 5.1
30-34 4,072 100.0
3,915 96.1
64 1.6
93 2.3
35-39 3,691 100.0
3,590 97.3
57 1.5
44 1.2
40-44 3,180 100.0
3,076 96.7
49 1.5
55 1.7
45-49 2,769 100.0
2,697 97.4
28 1.0
44 1.6
50-54 2,226 100.0
2,141 96.2
22 1.0
63 2.8
55-59 1,285 100.0
1,245 96.9
8 0.6
32 2.5
60-64 1,011 100.0
927 91.7
21 2.1
63 6.2
65+ 2,185 100.0
1,769 81.0
4 0.2
412 18.9
Female
Total 30,181 100.0
24,363 80.7
637 2.1
5,181 17.2
15-19 4,702 100.0
2,309 49.1
103 2.2
2,290 48.7
20-24 4,521 100.0
3,465 76.6
164 3.6
892 19.7
25-29 4,342 100.0
3,741 86.2
138 3.2
463 10.7
30-34 3,745 100.0
3,335 89.1
72 1.9
338 9.0
35-39 3,244 100.0
3,015 92.9
44 1.4
185 5.7
40-44 2,758 100.0
2,602 94.3
43 1.6
113 4.1
45-49 2,076 100.0
1,973 95.0
17 0.8
86 4.1
50-54 1,573 100.0
1,462 92.9
17 1.1
94 6.0
55-59 875 100.0
819 93.6
2 0.2
54 6.2
60-64 718 100.0
618 86.1
27 3.8
73 10.2
65+ 1,627 100.0 1,024 62.9 10 0.6 593 36.4
Source: Ghana Statistical Service, 2010 Population and Housing Census
4.3 Occupation
The 2010 PHC defines occupation as economic activity that individuals engage in to earn a
living in cash or in kind. Table 4.3 shows the analysis of the employed population 15 years
and older by occupation and sex. It indicates that 77.2 percent of the working population are
the skilled agricultural forestry workers and fishery workers occupation. The group forms the
largest occupation in the district.
36
However there are variations in the occupational pattern in the district with high percentage
of male population (86.3%) is engaged in agricultural forestry and fisheries as compared to
females (65.6%). On the other hand, more females (17.5%) are engaged in craft and related
trade work than their male counterparts (4.2%). Apart from the two dominant occupational
sectors mentioned from table 4.3, the remaining occupational sectors employ less than two
percent of the population.
Table 4.3: Employed population 15 years and older by occupation and sex
Occupation
Both sexes Male Female
Number Percent Number Percent Number Percent
Total 55,533 100.0
31,133 100.0
24,400 100.0
Managers 346 0.6
113 0.4
233 1.0
Professionals 983 1.8
637 2.0
346 1.4
Technicians and associate
professionals 184 0.3
122 0.4
62 0.3
Clerical support workers 148 0.3
104 0.3
44 0.2
Service and sales workers 4,034 7.3
899 2.9
3,135 12.8
Skilled agricultural forestry and
fishery workers 42,873 77.2
26,872 86.3
16,001 65.6
Craft and related trades workers 5,575 10.0
1,304 4.2
4,271 17.5
Plant and machine operators and
assemblers 791 1.4
770 2.5
21 0.1
Elementary occupations 587 1.1
302 1.0
285 1.2
Other occupations 12 0.0 10 0.0 2 0.0
Source: Ghana Statistical Service, 2010 Population and Housing Census
4.4 Industry
A total of 55,553 of the employed population 15 years and older are in the industry sector,
with the male constituting 31,133 (56.1%) compared to females 24,400 (43.9%). Agriculture
forestry and fishing constitute the largest industry employing almost eight out of ten persons
(76.3%) of the workforce aged 15 years and above in the district. The availability and access
to vast arable land could account for the high percentage of the population engaged in
agriculture sector. Another major industry is the manufacturing sector which employs (8.1%)
of the workforce. About eighty-six percent (85.2%) of the employed males are into
agriculture forestry and fishing compared to female percentage of sixty-five. There are more
females in the wholesale and retail; repair of motor vehicles and motor cycles (11.1%), than
their male counterparts of four percent.
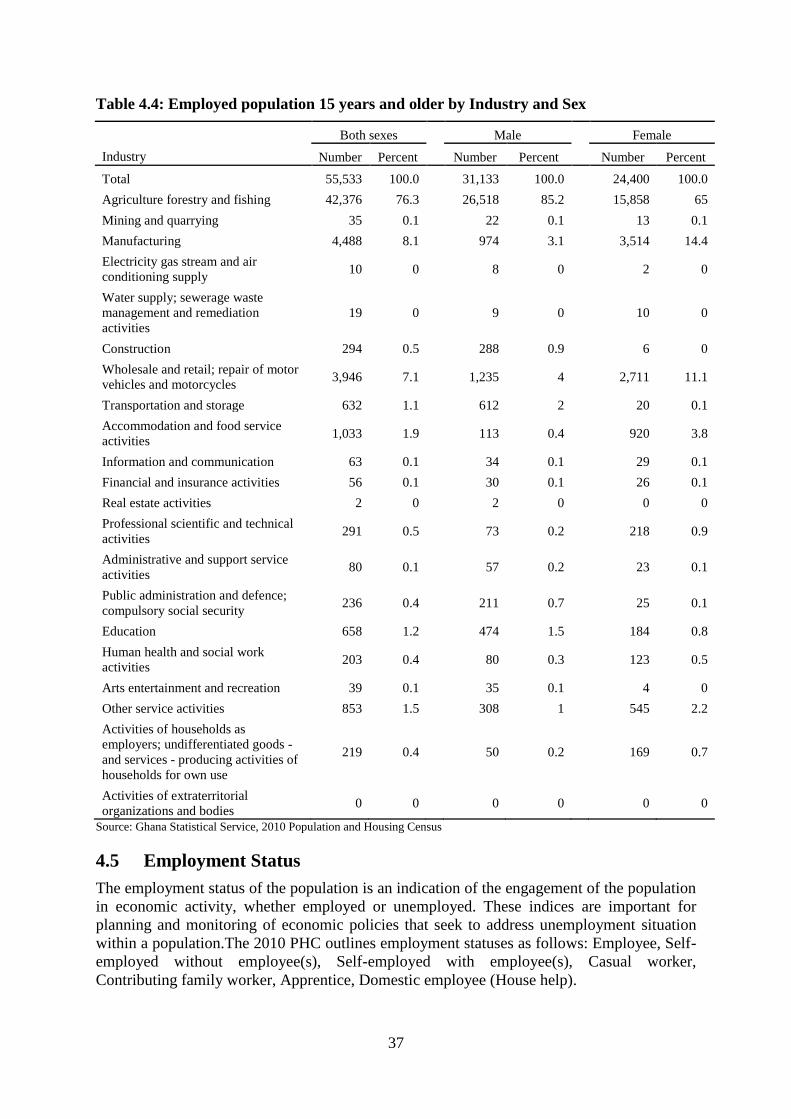
37
Table 4.4: Employed population 15 years and older by Industry and Sex
Industry
Both sexes Male Female
Number Percent Number Percent Number Percent
Total 55,533 100.0
31,133 100.0
24,400 100.0
Agriculture forestry and fishing 42,376 76.3
26,518 85.2
15,858 65
Mining and quarrying 35 0.1
22 0.1
13 0.1
Manufacturing 4,488 8.1
974 3.1
3,514 14.4
Electricity gas stream and air
conditioning supply 10 0
8 0
2 0
Water supply; sewerage waste
management and remediation
activities
19 0
9 0
10 0
Construction 294 0.5
288 0.9
6 0
Wholesale and retail; repair of motor
vehicles and motorcycles 3,946 7.1
1,235 4
2,711 11.1
Transportation and storage 632 1.1
612 2
20 0.1
Accommodation and food service
activities 1,033 1.9
113 0.4
920 3.8
Information and communication 63 0.1
34 0.1
29 0.1
Financial and insurance activities 56 0.1
30 0.1
26 0.1
Real estate activities 2 0
2 0
0 0
Professional scientific and technical
activities 291 0.5
73 0.2
218 0.9
Administrative and support service
activities 80 0.1
57 0.2
23 0.1
Public administration and defence;
compulsory social security 236 0.4
211 0.7
25 0.1
Education 658 1.2
474 1.5
184 0.8
Human health and social work
activities 203 0.4
80 0.3
123 0.5
Arts entertainment and recreation 39 0.1
35 0.1
4 0
Other service activities 853 1.5
308 1
545 2.2
Activities of households as
employers; undifferentiated goods -
and services - producing activities of
households for own use
219 0.4
50 0.2
169 0.7
Activities of extraterritorial
organizations and bodies 0 0 0 0 0 0
Source: Ghana Statistical Service, 2010 Population and Housing Census
4.5 Employment Status
The employment status of the population is an indication of the engagement of the population
in economic activity, whether employed or unemployed. These indices are important for
planning and monitoring of economic policies that seek to address unemployment situation
within a population.The 2010 PHC outlines employment statuses as follows: Employee, Self-
employed without employee(s), Self-employed with employee(s), Casual worker,
Contributing family worker, Apprentice, Domestic employee (House help).
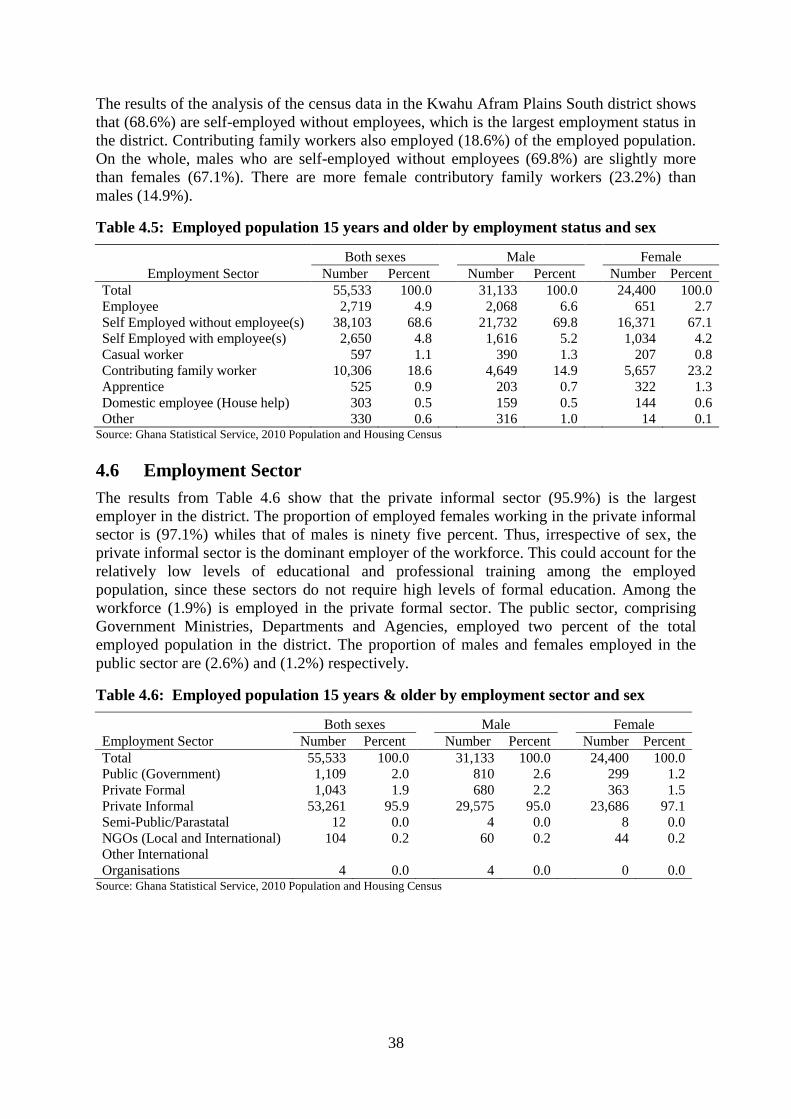
38
The results of the analysis of the census data in the Kwahu Afram Plains South district shows
that (68.6%) are self-employed without employees, which is the largest employment status in
the district. Contributing family workers also employed (18.6%) of the employed population.
On the whole, males who are self-employed without employees (69.8%) are slightly more
than females (67.1%). There are more female contributory family workers (23.2%) than
males (14.9%).
Table 4.5: Employed population 15 years and older by employment status and sex
Employment Sector
Both sexes Male Female
Number Percent Number Percent Number Percent
Total 55,533 100.0
31,133 100.0
24,400 100.0
Employee 2,719 4.9
2,068 6.6
651 2.7
Self Employed without employee(s) 38,103 68.6
21,732 69.8
16,371 67.1
Self Employed with employee(s) 2,650 4.8
1,616 5.2
1,034 4.2
Casual worker 597 1.1
390 1.3
207 0.8
Contributing family worker 10,306 18.6
4,649 14.9
5,657 23.2
Apprentice 525 0.9
203 0.7
322 1.3
Domestic employee (House help) 303 0.5
159 0.5
144 0.6
Other 330 0.6 316 1.0 14 0.1 Source: Ghana Statistical Service, 2010 Population and Housing Census
4.6 Employment Sector
The results from Table 4.6 show that the private informal sector (95.9%) is the largest
employer in the district. The proportion of employed females working in the private informal
sector is (97.1%) whiles that of males is ninety five percent. Thus, irrespective of sex, the
private informal sector is the dominant employer of the workforce. This could account for the
relatively low levels of educational and professional training among the employed
population, since these sectors do not require high levels of formal education. Among the
workforce (1.9%) is employed in the private formal sector. The public sector, comprising
Government Ministries, Departments and Agencies, employed two percent of the total
employed population in the district. The proportion of males and females employed in the
public sector are (2.6%) and (1.2%) respectively.
Table 4.6: Employed population 15 years & older by employment sector and sex
Employment Sector
Both sexes Male Female
Number Percent Number Percent Number Percent
Total 55,533 100.0
31,133 100.0
24,400 100.0
Public (Government) 1,109 2.0
810 2.6
299 1.2
Private Formal 1,043 1.9
680 2.2
363 1.5
Private Informal 53,261 95.9
29,575 95.0
23,686 97.1
Semi-Public/Parastatal 12 0.0
4 0.0
8 0.0
NGOs (Local and International) 104 0.2
60 0.2
44 0.2
Other International
Organisations 4 0.0 4 0.0 0 0.0 Source: Ghana Statistical Service, 2010 Population and Housing Census
39
CHAPTER FIVE
INFORMATION COMMUNICATION TECHNOLOGY
5.1 Introduction
The speed with which Information Communication Technology is developing and its impact
on socio-economic activities cannot be overemphasized. ICT is defined to include the full
range of electronic technologies and techniques used to manage information and knowledge.
During the 2010 PHC, ownership and usage of information communication technology
facilities and services were assessed by collecting data on both individuals/persons aged 12
years and older and households. Persons using internet facility refers to those who have
access to internet facility at home, internet café, and mobile phone or by other mobile device.
It is imperative that Kwahu Afram Plains South is not excluded from this technological
evolution and to a large extent Ghana. It is a stark fact that, the use of ICT has been
integrated into virtually every facet of Commence, Health Education, Governance, and Civic
Activities and has become critical factor in creating wealth worldwide. The e-governance
devices including computer, mobile phone and internet facilities have positively impacted
human life in the field of banking, commence and telecommunication. This chapter presents
information on access to ICT by individuals 12 years and older and households in the Kwahu
Afram Plains District.
5.2 Ownership of Mobile Phones
The usage of mobile phones has grown tremendously over the past few years in Ghana. The
rapid penetration of these mobile companies is seeing a remarkable increase in the usage of
mobile phones in the remote parts of Ghana. Table 5.1 indicates the proportion of the district
population who own mobile phone and those with access to internet facility. In totality, there
are 74,605 persons aged 12 years and older constituting 27.1 percent with males being higher
with 31.8 percent as against 21.4 percent as females in the district. This implies that the
ownership mobile phone is more predominant with males than females.
5.3 Use of Internet
The internet has become a very useful communication facility for people, businesses and
organizations. Still on Table 5.1, just exactly one percent (1.0%) of the population aged 12
years and older have access to internet in the district. With respect to gender there are more
males who have access to internet (1.3%) than females (0.6%) in the district. This general
low usage of the internet in the district is not surprising due to the remote nature of the area
with some communities not even having access to electricity.
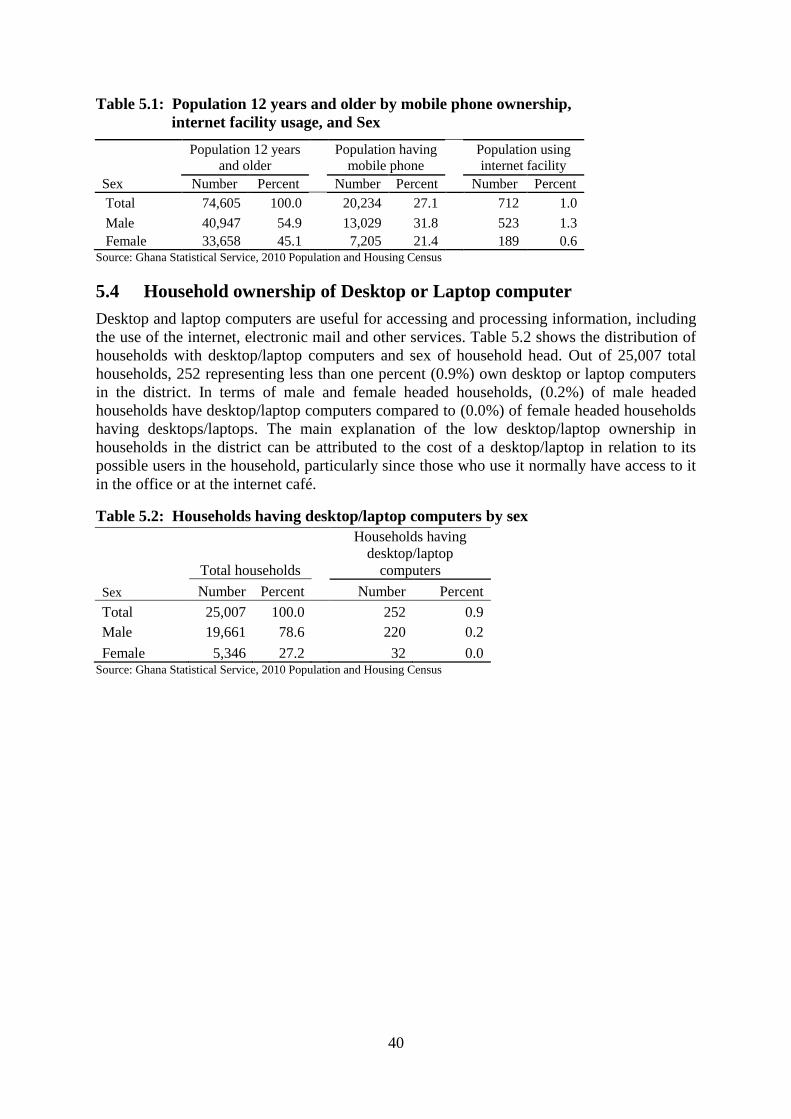
40
Table 5.1: Population 12 years and older by mobile phone ownership,
internet facility usage, and Sex
Population 12 years
and older
Population having
mobile phone
Population using
internet facility
Sex Number Percent Number Percent Number Percent
Total 74,605 100.0
20,234 27.1
712 1.0
Male 40,947 54.9
13,029 31.8
523 1.3
Female 33,658 45.1 7,205 21.4 189 0.6 Source: Ghana Statistical Service, 2010 Population and Housing Census
5.4 Household ownership of Desktop or Laptop computer
Desktop and laptop computers are useful for accessing and processing information, including
the use of the internet, electronic mail and other services. Table 5.2 shows the distribution of
households with desktop/laptop computers and sex of household head. Out of 25,007 total
households, 252 representing less than one percent (0.9%) own desktop or laptop computers
in the district. In terms of male and female headed households, (0.2%) of male headed
households have desktop/laptop computers compared to (0.0%) of female headed households
having desktops/laptops. The main explanation of the low desktop/laptop ownership in
households in the district can be attributed to the cost of a desktop/laptop in relation to its
possible users in the household, particularly since those who use it normally have access to it
in the office or at the internet café.
Table 5.2: Households having desktop/laptop computers by sex
Total households
Households having
desktop/laptop
computers
Sex Number Percent Number Percent
Total 25,007 100.0
252 0.9
Male 19,661 78.6
220 0.2
Female 5,346 27.2 32 0.0 Source: Ghana Statistical Service, 2010 Population and Housing Census
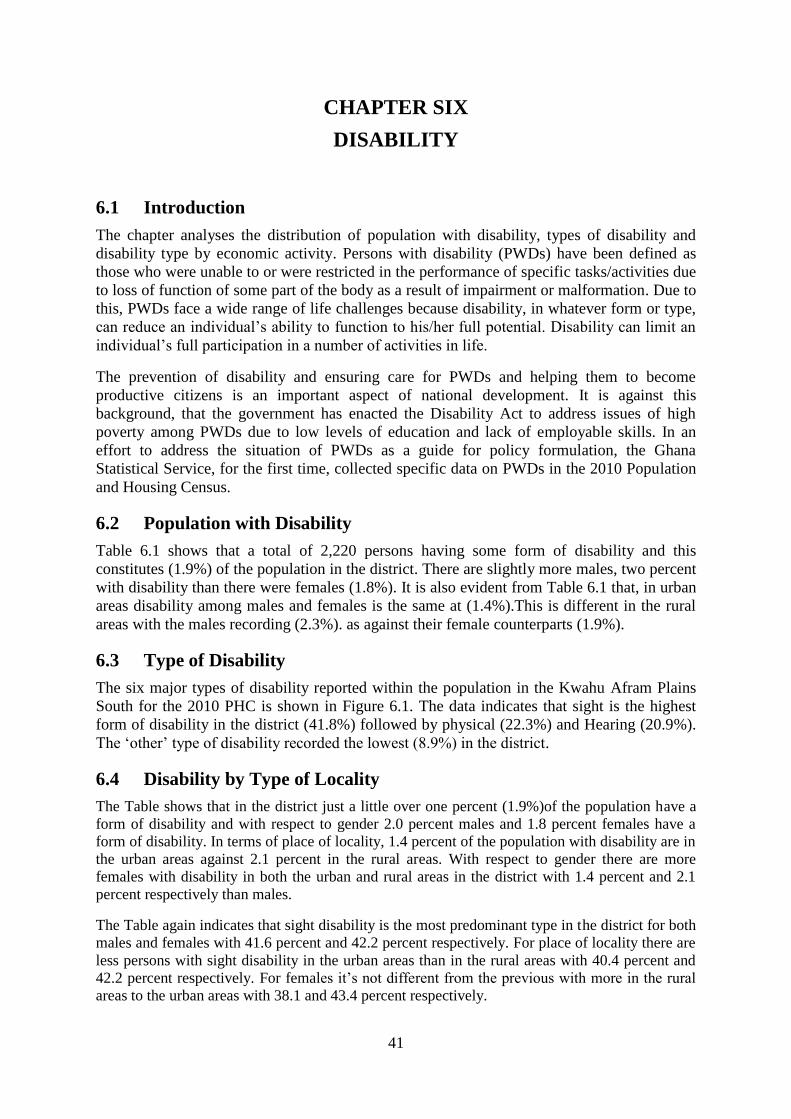
41
CHAPTER SIX
DISABILITY
6.1 Introduction
The chapter analyses the distribution of population with disability, types of disability and
disability type by economic activity. Persons with disability (PWDs) have been defined as
those who were unable to or were restricted in the performance of specific tasks/activities due
to loss of function of some part of the body as a result of impairment or malformation. Due to
this, PWDs face a wide range of life challenges because disability, in whatever form or type,
can reduce an individual’s ability to function to his/her full potential. Disability can limit an
individual’s full participation in a number of activities in life.
The prevention of disability and ensuring care for PWDs and helping them to become
productive citizens is an important aspect of national development. It is against this
background, that the government has enacted the Disability Act to address issues of high
poverty among PWDs due to low levels of education and lack of employable skills. In an
effort to address the situation of PWDs as a guide for policy formulation, the Ghana
Statistical Service, for the first time, collected specific data on PWDs in the 2010 Population
and Housing Census.
6.2 Population with Disability
Table 6.1 shows that a total of 2,220 persons having some form of disability and this
constitutes (1.9%) of the population in the district. There are slightly more males, two percent
with disability than there were females (1.8%). It is also evident from Table 6.1 that, in urban
areas disability among males and females is the same at (1.4%).This is different in the rural
areas with the males recording (2.3%). as against their female counterparts (1.9%).
6.3 Type of Disability
The six major types of disability reported within the population in the Kwahu Afram Plains
South for the 2010 PHC is shown in Figure 6.1. The data indicates that sight is the highest
form of disability in the district (41.8%) followed by physical (22.3%) and Hearing (20.9%).
The ‘other’ type of disability recorded the lowest (8.9%) in the district.
6.4 Disability by Type of Locality
The Table shows that in the district just a little over one percent (1.9%)of the population have a
form of disability and with respect to gender 2.0 percent males and 1.8 percent females have a
form of disability. In terms of place of locality, 1.4 percent of the population with disability are in
the urban areas against 2.1 percent in the rural areas. With respect to gender there are more
females with disability in both the urban and rural areas in the district with 1.4 percent and 2.1
percent respectively than males.
The Table again indicates that sight disability is the most predominant type in the district for both
males and females with 41.6 percent and 42.2 percent respectively. For place of locality there are
less persons with sight disability in the urban areas than in the rural areas with 40.4 percent and
42.2 percent respectively. For females it’s not different from the previous with more in the rural
areas to the urban areas with 38.1 and 43.4 percent respectively.
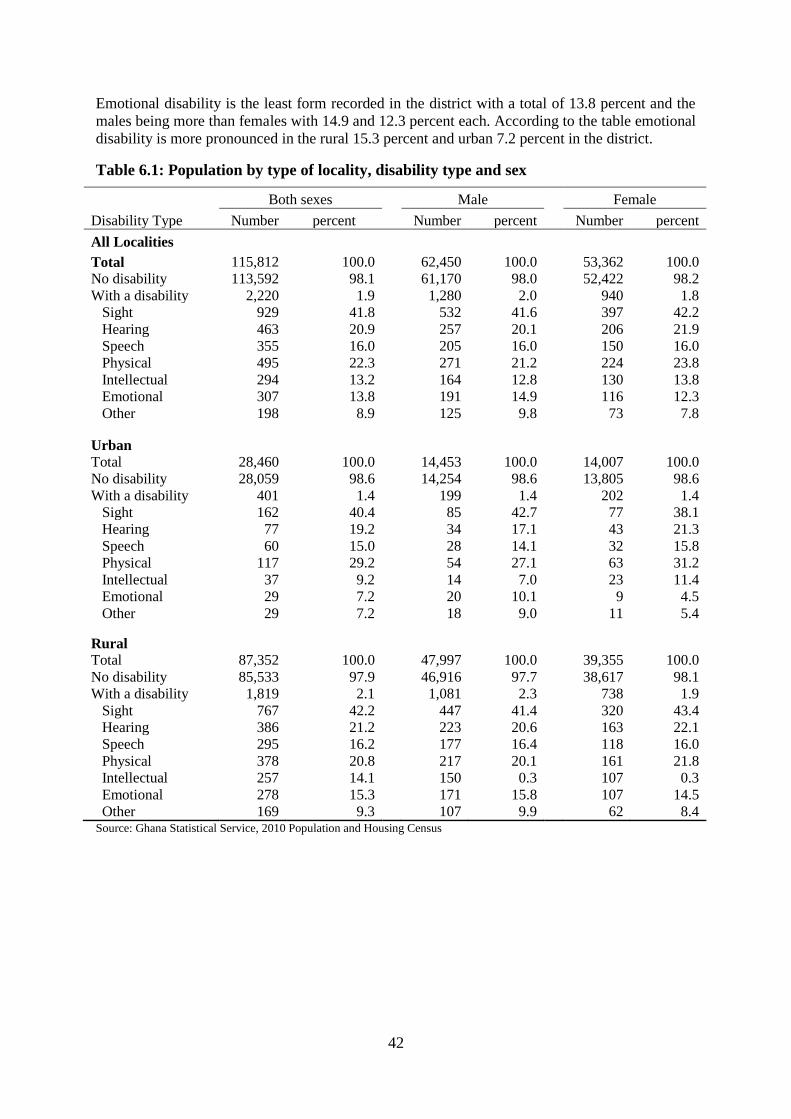
42
Emotional disability is the least form recorded in the district with a total of 13.8 percent and the
males being more than females with 14.9 and 12.3 percent each. According to the table emotional
disability is more pronounced in the rural 15.3 percent and urban 7.2 percent in the district.
Table 6.1: Population by type of locality, disability type and sex
Disability Type
Both sexes Male Female
Number percent Number percent Number percent
All Localities
Total 115,812 100.0
62,450 100.0
53,362 100.0
No disability 113,592 98.1
61,170 98.0
52,422 98.2
With a disability 2,220 1.9
1,280 2.0
940 1.8
Sight 929 41.8
532 41.6
397 42.2
Hearing 463 20.9
257 20.1
206 21.9
Speech 355 16.0
205 16.0
150 16.0
Physical 495 22.3
271 21.2
224 23.8
Intellectual 294 13.2
164 12.8
130 13.8
Emotional 307 13.8
191 14.9
116 12.3
Other 198 8.9
125 9.8
73 7.8
Urban
Total 28,460 100.0
14,453 100.0
14,007 100.0
No disability 28,059 98.6
14,254 98.6
13,805 98.6
With a disability 401 1.4
199 1.4
202 1.4
Sight 162 40.4
85 42.7
77 38.1
Hearing 77 19.2
34 17.1
43 21.3
Speech 60 15.0
28 14.1
32 15.8
Physical 117 29.2
54 27.1
63 31.2
Intellectual 37 9.2
14 7.0
23 11.4
Emotional 29 7.2
20 10.1
9 4.5
Other 29 7.2
18 9.0
11 5.4
Rural
Total 87,352 100.0
47,997 100.0
39,355 100.0
No disability 85,533 97.9
46,916 97.7
38,617 98.1
With a disability 1,819 2.1
1,081 2.3
738 1.9
Sight 767 42.2
447 41.4
320 43.4
Hearing 386 21.2
223 20.6
163 22.1
Speech 295 16.2
177 16.4
118 16.0
Physical 378 20.8
217 20.1
161 21.8
Intellectual 257 14.1
150 0.3
107 0.3
Emotional 278 15.3
171 15.8
107 14.5
Other 169 9.3 107 9.9 62 8.4 Source: Ghana Statistical Service, 2010 Population and Housing Census
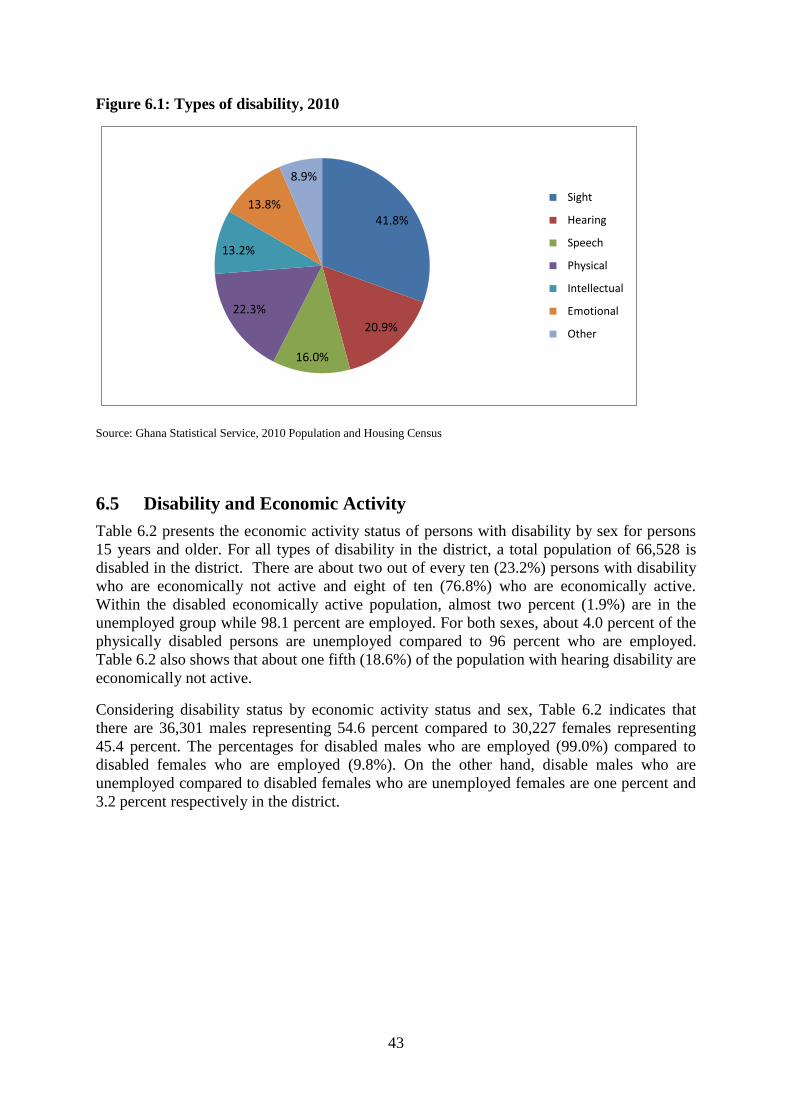
43
Figure 6.1: Types of disability, 2010
41.8%
20.9%
16.0%
22.3%
13.2%
13.8%
8.9%
Sight
Hearing
Speech
Physical
Intellectual
Emotional
Other
Source: Ghana Statistical Service, 2010 Population and Housing Census
6.5 Disability and Economic Activity
Table 6.2 presents the economic activity status of persons with disability by sex for persons
15 years and older. For all types of disability in the district, a total population of 66,528 is
disabled in the district. There are about two out of every ten (23.2%) persons with disability
who are economically not active and eight of ten (76.8%) who are economically active.
Within the disabled economically active population, almost two percent (1.9%) are in the
unemployed group while 98.1 percent are employed. For both sexes, about 4.0 percent of the
physically disabled persons are unemployed compared to 96 percent who are employed.
Table 6.2 also shows that about one fifth (18.6%) of the population with hearing disability are
economically not active.
Considering disability status by economic activity status and sex, Table 6.2 indicates that
there are 36,301 males representing 54.6 percent compared to 30,227 females representing
45.4 percent. The percentages for disabled males who are employed (99.0%) compared to
disabled females who are employed (9.8%). On the other hand, disable males who are
unemployed compared to disabled females who are unemployed females are one percent and
3.2 percent respectively in the district.
44
Table 6.2: Persons 15 years & older with disability by economic activity status & sex
Sex/Disability
type
All status
Employed
Unemployed
Economically not
active
Number Percent Number Percent Number Percent Number Percent
Both Sexes
Total 66,438 100.0
55,466 83.5
1,212 1.8
9,760 14.7
No disability 64,694 100.0
54,151 83.7
1,187 1.8
9,356 14.5
With a disability 1,744 100.0
1,315 75.4
25 1.4
404 23.2
Sight 802 100.0
652 81.3
4 0.5
146 18.2
Hearing 345 100.0
275 79.7
6 1.7
64 18.6
Speech 196 100.0
145 74.0
7 3.6
44 22.4
Physical 361 100.0
192 53.2
8 2.2
161 44.6
Intellectual 195 100.0
124 63.6
8 4.1
63 32.3
Emotional 204 100.0
144 70.6
4 2.0
56 27.5
Other 168 100.0
111 66.1
2 1.2
55 32.7
Male
Total 36,257 100.0
31,103 85.8
575 1.6
4,579 12.6
No disability 35,256 100.0
30,297 85.9
567 1.6
4,392 12.5
With a disability 1,001 100.0
806 80.5
8 0.8
187 18.7
Sight 460 100.0
388 84.3
2 0.4
70 15.2
Hearing 199 100.0
179 89.9
2 1.0
18 9.0
Speech 109 100.0
93 85.3
2 1.8
14 12.8
Physical 181 100.0
108 59.7
4 2.2
69 38.1
Intellectual 107 100.0
77 72.0
4 3.7
26 24.3
Emotional 130 100.0
102 78.5
4 3.1
24 18.5
Other 103 100.0
71 68.9
0 0.0
32 31.1
Female
Total 30,181 100.0
24,363 80.7
637 2.1
5,181 17.2
No disability 29,438 100.0
23,854 81.0
620 2.1
4,964 16.9
With a disability 743 100.0
509 68.5
17 2.3
217 29.2
Sight 342 100.0
264 77.2
2 0.6
76 22.2
Hearing 146 100.0
96 65.8
4 2.7
46 31.5
Speech 87 100.0
52 59.8
5 5.7
30 34.5
Physical 180 100.0
84 46.7
4 2.2
92 51.1
Intellectual 88 100.0
47 53.4
4 4.5
37 42.0
Emotional 74 100.0
42 56.8
0 0.0
32 43.2
Other 65 100.0 40 61.5 2 3.1 23 35.4
Source: Ghana Statistical Service, 2010 Population and Housing Census
6.6 Disability, Education and Literacy
From the Global Monitoring Report (2007), “93 Education for All” indicates that majority of
children with disabilities in Africa do not attend school. The report indicates that of the 72
million primary aged children worldwide who are out of school, one third have disabilities
(ghanaweb). The Kwahu Afram Plains South had made a tremendous stride over third of the
total disabled population had attained some level of education.
A look at the Table 6.5 indicates that males who have been to school with emotional
disability outnumber all the other forms with 62.3 percent, 41.9 percent with sight disability
have basic education and 10.1 percent with emotional disability also have sec/
The Table further reveals that females with emotional disability with no education accounts
for 71.9 percent, 32.6 percent with sight disability have basic education and finally 4.2
percent with similar disability have sec/SHS and higher education in the district. For all the
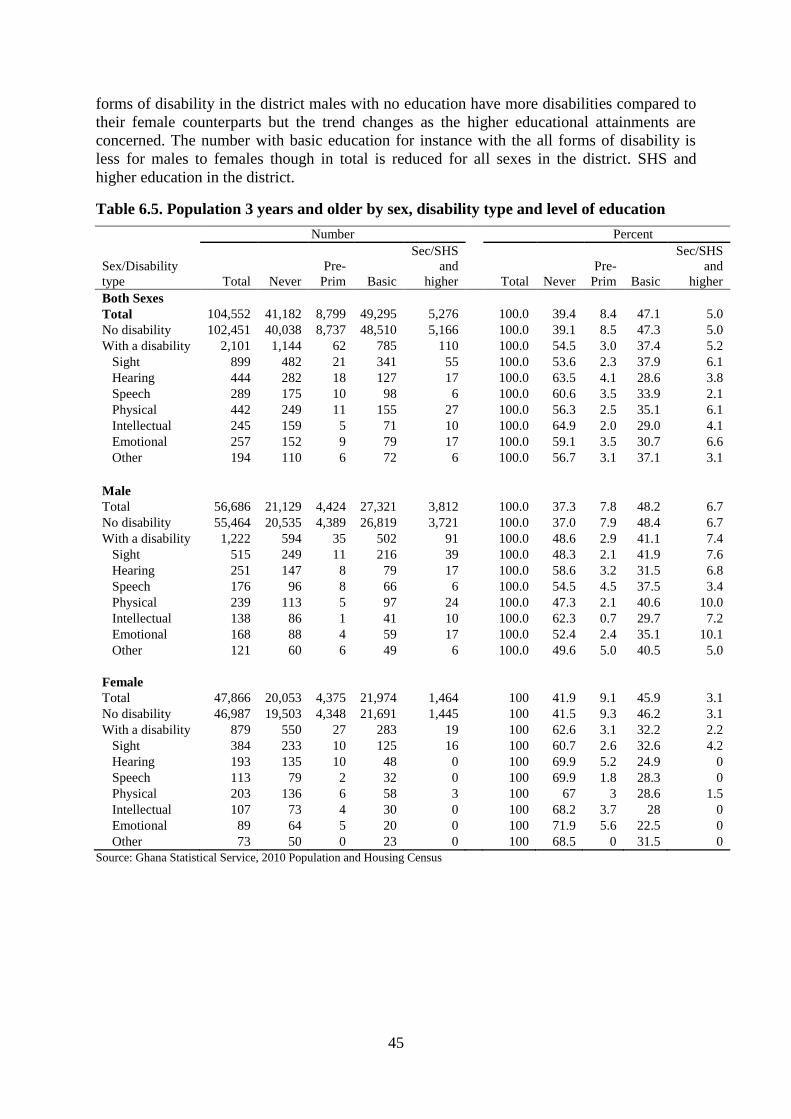
45
forms of disability in the district males with no education have more disabilities compared to
their female counterparts but the trend changes as the higher educational attainments are
concerned. The number with basic education for instance with the all forms of disability is
less for males to females though in total is reduced for all sexes in the district. SHS and
higher education in the district.
Table 6.5. Population 3 years and older by sex, disability type and level of education
Number Percent
Sex/Disability
type Total Never
Pre-
Prim Basic
Sec/SHS
and
higher Total Never
Pre-
Prim Basic
Sec/SHS
and
higher
Both Sexes
Total 104,552 41,182 8,799 49,295 5,276
100.0 39.4 8.4 47.1 5.0
No disability 102,451 40,038 8,737 48,510 5,166
100.0 39.1 8.5 47.3 5.0
With a disability 2,101 1,144 62 785 110
100.0 54.5 3.0 37.4 5.2
Sight 899 482 21 341 55
100.0 53.6 2.3 37.9 6.1
Hearing 444 282 18 127 17
100.0 63.5 4.1 28.6 3.8
Speech 289 175 10 98 6
100.0 60.6 3.5 33.9 2.1
Physical 442 249 11 155 27
100.0 56.3 2.5 35.1 6.1
Intellectual 245 159 5 71 10
100.0 64.9 2.0 29.0 4.1
Emotional 257 152 9 79 17
100.0 59.1 3.5 30.7 6.6
Other 194 110 6 72 6
100.0 56.7 3.1 37.1 3.1
Male
Total 56,686 21,129 4,424 27,321 3,812
100.0 37.3 7.8 48.2 6.7
No disability 55,464 20,535 4,389 26,819 3,721
100.0 37.0 7.9 48.4 6.7
With a disability 1,222 594 35 502 91
100.0 48.6 2.9 41.1 7.4
Sight 515 249 11 216 39
100.0 48.3 2.1 41.9 7.6
Hearing 251 147 8 79 17
100.0 58.6 3.2 31.5 6.8
Speech 176 96 8 66 6
100.0 54.5 4.5 37.5 3.4
Physical 239 113 5 97 24
100.0 47.3 2.1 40.6 10.0
Intellectual 138 86 1 41 10
100.0 62.3 0.7 29.7 7.2
Emotional 168 88 4 59 17
100.0 52.4 2.4 35.1 10.1
Other 121 60 6 49 6
100.0 49.6 5.0 40.5 5.0
Female
Total 47,866 20,053 4,375 21,974 1,464
100 41.9 9.1 45.9 3.1
No disability 46,987 19,503 4,348 21,691 1,445
100 41.5 9.3 46.2 3.1
With a disability 879 550 27 283 19
100 62.6 3.1 32.2 2.2
Sight 384 233 10 125 16
100 60.7 2.6 32.6 4.2
Hearing 193 135 10 48 0
100 69.9 5.2 24.9 0
Speech 113 79 2 32 0
100 69.9 1.8 28.3 0
Physical 203 136 6 58 3
100 67 3 28.6 1.5
Intellectual 107 73 4 30 0
100 68.2 3.7 28 0
Emotional 89 64 5 20 0
100 71.9 5.6 22.5 0
Other 73 50 0 23 0 100 68.5 0 31.5 0
Source: Ghana Statistical Service, 2010 Population and Housing Census
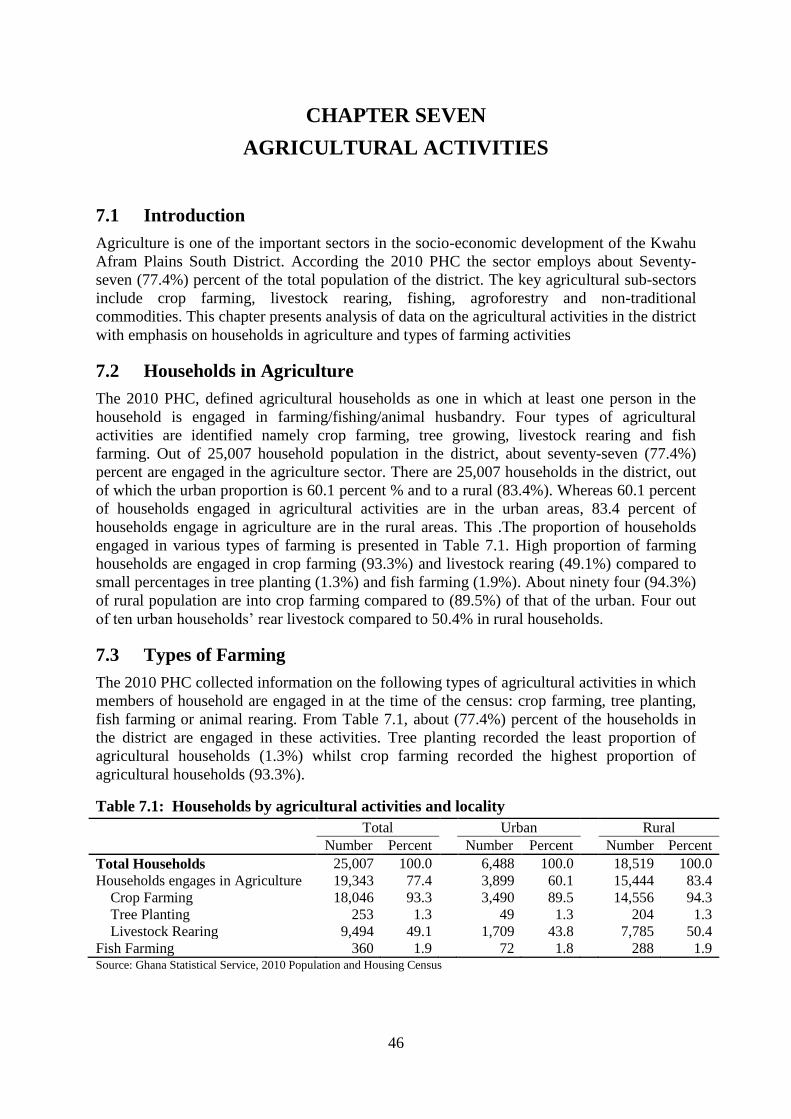
46
CHAPTER SEVEN
AGRICULTURAL ACTIVITIES
7.1 Introduction
Agriculture is one of the important sectors in the socio-economic development of the Kwahu
Afram Plains South District. According the 2010 PHC the sector employs about Seventy-
seven (77.4%) percent of the total population of the district. The key agricultural sub-sectors
include crop farming, livestock rearing, fishing, agroforestry and non-traditional
commodities. This chapter presents analysis of data on the agricultural activities in the district
with emphasis on households in agriculture and types of farming activities
7.2 Households in Agriculture
The 2010 PHC, defined agricultural households as one in which at least one person in the
household is engaged in farming/fishing/animal husbandry. Four types of agricultural
activities are identified namely crop farming, tree growing, livestock rearing and fish
farming. Out of 25,007 household population in the district, about seventy-seven (77.4%)
percent are engaged in the agriculture sector. There are 25,007 households in the district, out
of which the urban proportion is 60.1 percent % and to a rural (83.4%). Whereas 60.1 percent
of households engaged in agricultural activities are in the urban areas, 83.4 percent of
households engage in agriculture are in the rural areas. This .The proportion of households
engaged in various types of farming is presented in Table 7.1. High proportion of farming
households are engaged in crop farming (93.3%) and livestock rearing (49.1%) compared to
small percentages in tree planting (1.3%) and fish farming (1.9%). About ninety four (94.3%)
of rural population are into crop farming compared to (89.5%) of that of the urban. Four out
of ten urban households’ rear livestock compared to 50.4% in rural households.
7.3 Types of Farming
The 2010 PHC collected information on the following types of agricultural activities in which
members of household are engaged in at the time of the census: crop farming, tree planting,
fish farming or animal rearing. From Table 7.1, about (77.4%) percent of the households in
the district are engaged in these activities. Tree planting recorded the least proportion of
agricultural households (1.3%) whilst crop farming recorded the highest proportion of
agricultural households (93.3%).
Table 7.1: Households by agricultural activities and locality
Total Urban Rural
Number Percent Number Percent Number Percent
Total Households 25,007 100.0
6,488 100.0
18,519 100.0
Households engages in Agriculture 19,343 77.4
3,899 60.1
15,444 83.4
Crop Farming 18,046 93.3
3,490 89.5
14,556 94.3
Tree Planting 253 1.3
49 1.3
204 1.3
Livestock Rearing 9,494 49.1
1,709 43.8
7,785 50.4
Fish Farming 360 1.9 72 1.8 288 1.9 Source: Ghana Statistical Service, 2010 Population and Housing Census
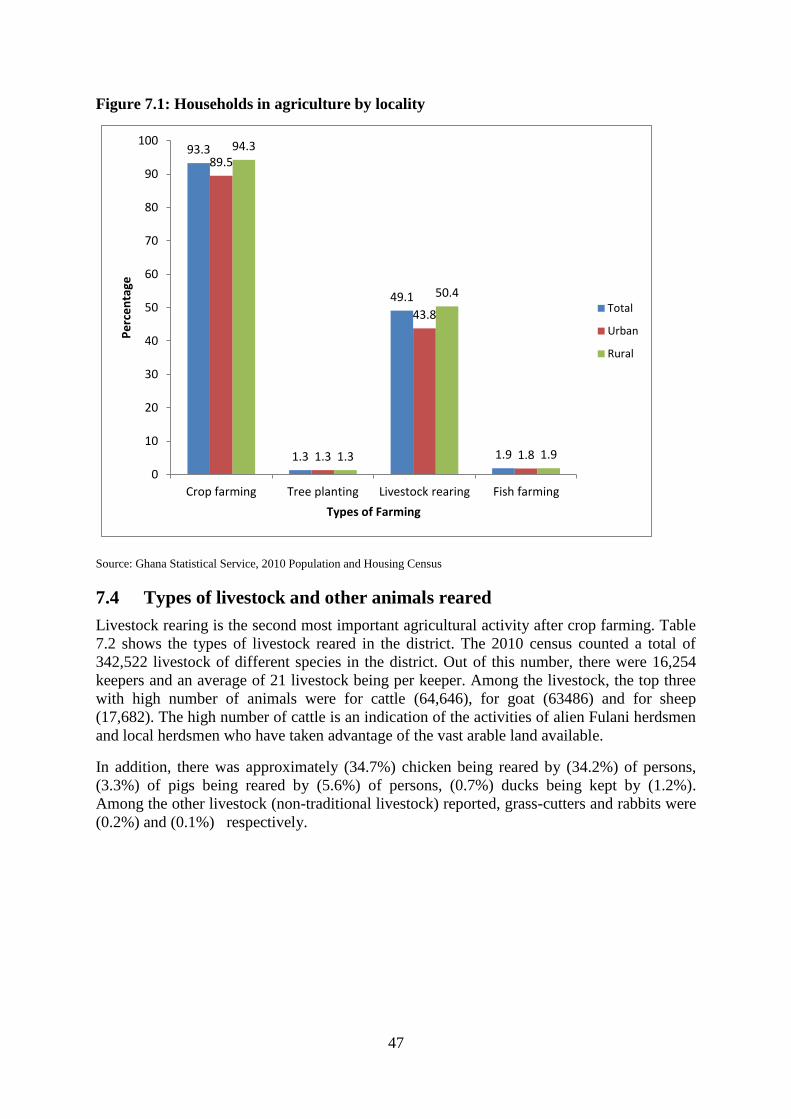
47
Figure 7.1: Households in agriculture by locality
93.3
1.3
49.1
1.9
89.5
1.3
43.8
1.8
94.3
1.3
50.4
1.9
0
10
20
30
40
50
60
70
80
90
100
Crop farming Tree planting Livestock rearing Fish farming
Pe
rce
nta
ge
Types of Farming
Total
Urban
Rural
Source: Ghana Statistical Service, 2010 Population and Housing Census
7.4 Types of livestock and other animals reared
Livestock rearing is the second most important agricultural activity after crop farming. Table
7.2 shows the types of livestock reared in the district. The 2010 census counted a total of
342,522 livestock of different species in the district. Out of this number, there were 16,254
keepers and an average of 21 livestock being per keeper. Among the livestock, the top three
with high number of animals were for cattle (64,646), for goat (63486) and for sheep
(17,682). The high number of cattle is an indication of the activities of alien Fulani herdsmen
and local herdsmen who have taken advantage of the vast arable land available.
In addition, there was approximately (34.7%) chicken being reared by (34.2%) of persons,
(3.3%) of pigs being reared by (5.6%) of persons, (0.7%) ducks being kept by (1.2%).
Among the other livestock (non-traditional livestock) reported, grass-cutters and rabbits were
(0.2%) and (0.1%) respectively.
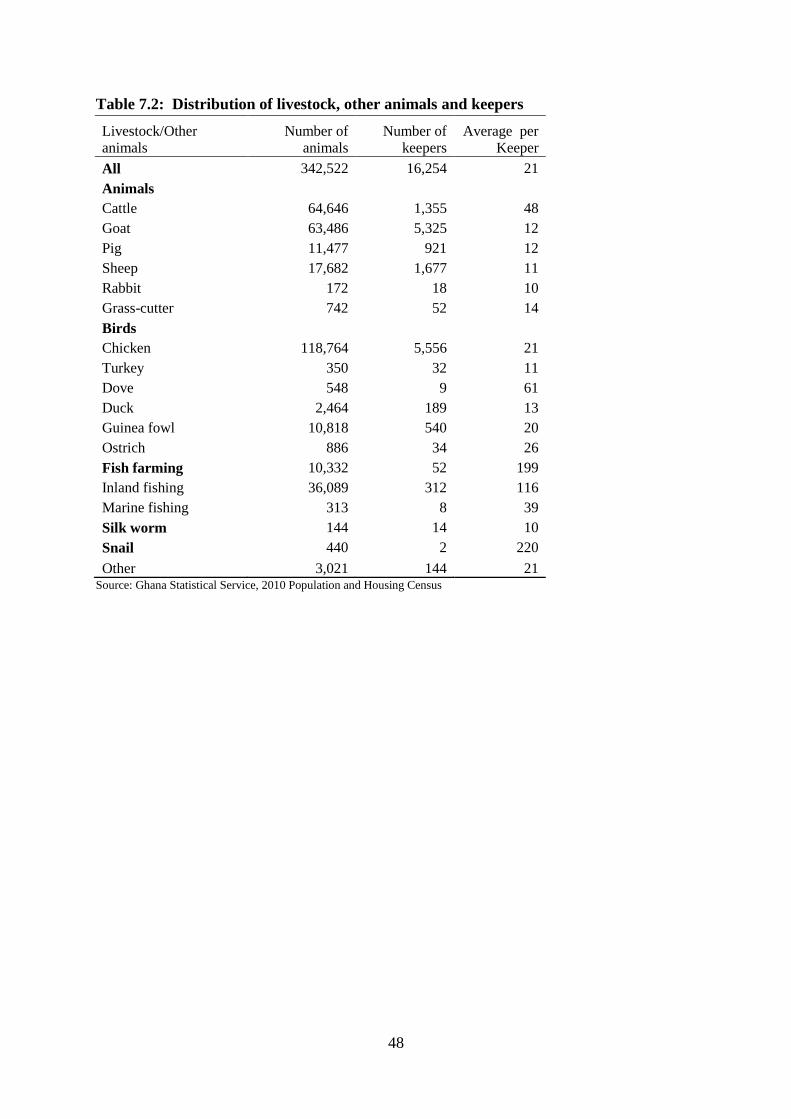
48
Table 7.2: Distribution of livestock, other animals and keepers
Livestock/Other
animals
Number of
animals
Number of
keepers
Average per
Keeper
All 342,522 16,254 21
Animals
Cattle 64,646 1,355 48
Goat 63,486 5,325 12
Pig 11,477 921 12
Sheep 17,682 1,677 11
Rabbit 172 18 10
Grass-cutter 742 52 14
Birds
Chicken 118,764 5,556 21
Turkey 350 32 11
Dove 548 9 61
Duck 2,464 189 13
Guinea fowl 10,818 540 20
Ostrich 886 34 26
Fish farming 10,332 52 199
Inland fishing 36,089 312 116
Marine fishing 313 8 39
Silk worm 144 14 10
Snail 440 2 220
Other 3,021 144 21 Source: Ghana Statistical Service, 2010 Population and Housing Census
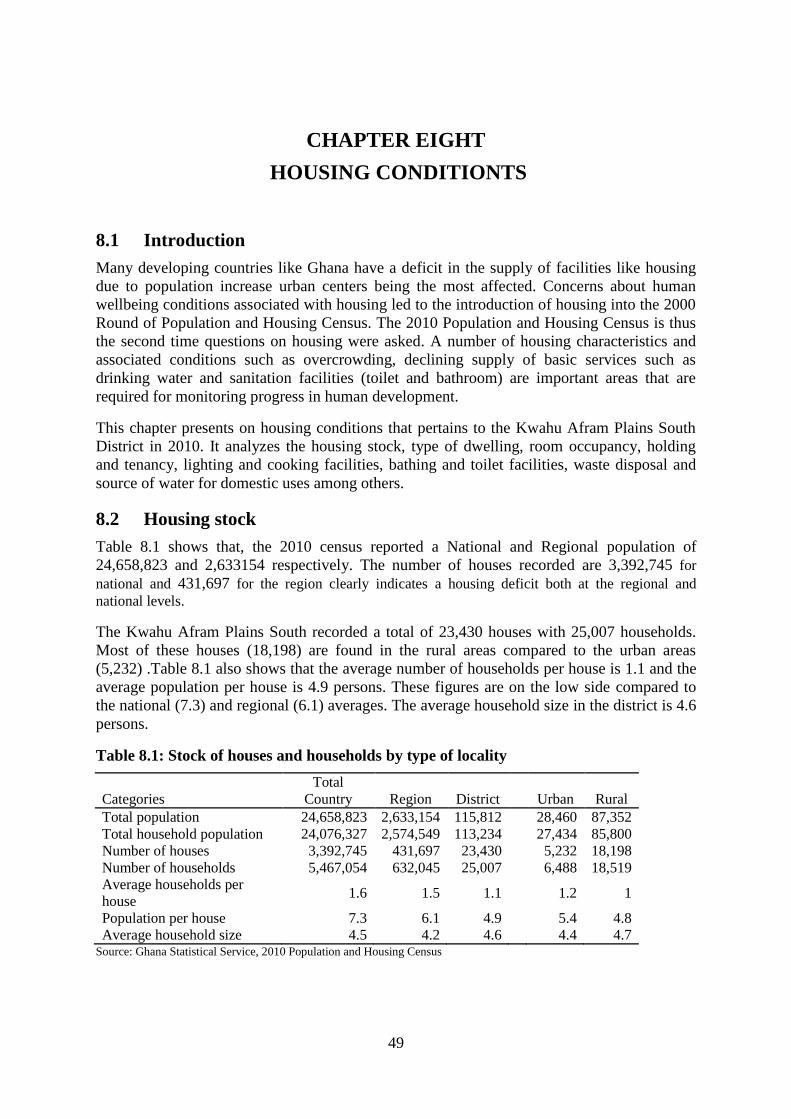
49
CHAPTER EIGHT
HOUSING CONDITIONTS
8.1 Introduction
Many developing countries like Ghana have a deficit in the supply of facilities like housing
due to population increase urban centers being the most affected. Concerns about human
wellbeing conditions associated with housing led to the introduction of housing into the 2000
Round of Population and Housing Census. The 2010 Population and Housing Census is thus
the second time questions on housing were asked. A number of housing characteristics and
associated conditions such as overcrowding, declining supply of basic services such as
drinking water and sanitation facilities (toilet and bathroom) are important areas that are
required for monitoring progress in human development.
This chapter presents on housing conditions that pertains to the Kwahu Afram Plains South
District in 2010. It analyzes the housing stock, type of dwelling, room occupancy, holding
and tenancy, lighting and cooking facilities, bathing and toilet facilities, waste disposal and
source of water for domestic uses among others.
8.2 Housing stock
Table 8.1 shows that, the 2010 census reported a National and Regional population of
24,658,823 and 2,633154 respectively. The number of houses recorded are 3,392,745 for
national and 431,697 for the region clearly indicates a housing deficit both at the regional and
national levels.
The Kwahu Afram Plains South recorded a total of 23,430 houses with 25,007 households.
Most of these houses (18,198) are found in the rural areas compared to the urban areas
(5,232) .Table 8.1 also shows that the average number of households per house is 1.1 and the
average population per house is 4.9 persons. These figures are on the low side compared to
the national (7.3) and regional (6.1) averages. The average household size in the district is 4.6
persons.
Table 8.1: Stock of houses and households by type of locality
Categories
Total
Country
Region
District
Urban
Rural
Total population 24,658,823 2,633,154 115,812
28,460 87,352
Total household population 24,076,327 2,574,549 113,234
27,434 85,800
Number of houses 3,392,745 431,697 23,430
5,232 18,198
Number of households 5,467,054 632,045 25,007
6,488 18,519
Average households per
house 1.6 1.5 1.1
1.2 1
Population per house 7.3 6.1 4.9
5.4 4.8
Average household size 4.5 4.2 4.6 4.4 4.7 Source: Ghana Statistical Service, 2010 Population and Housing Census
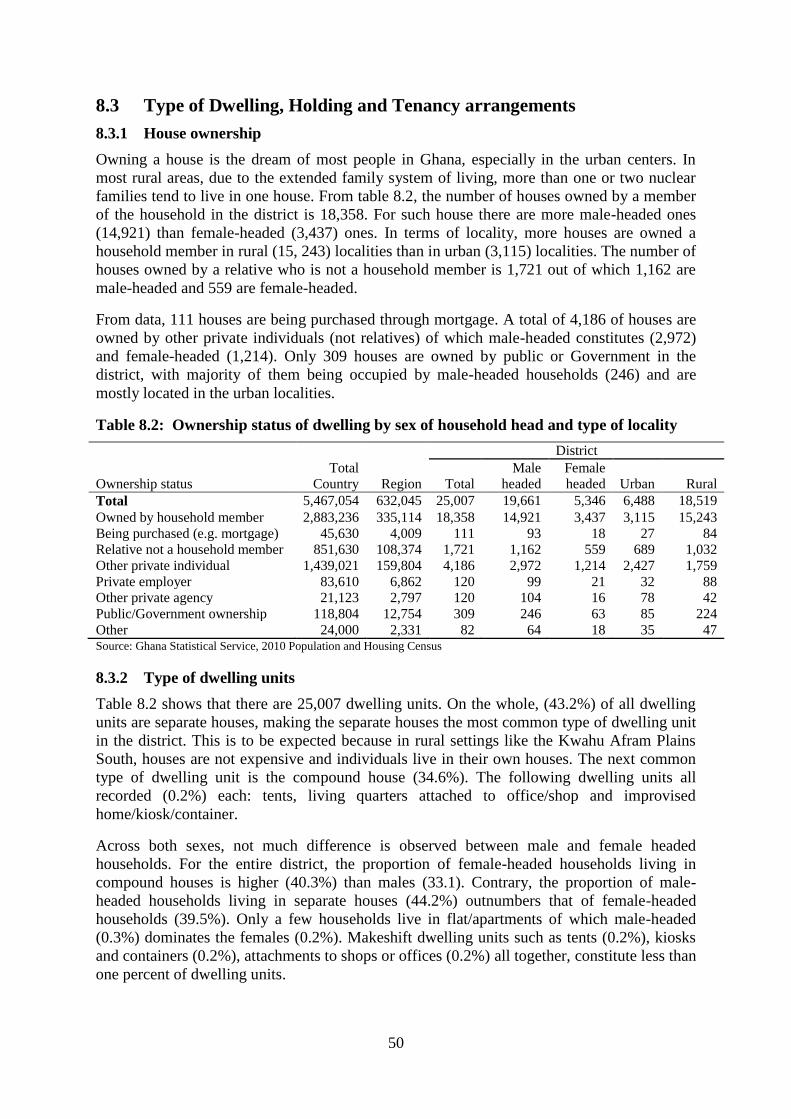
50
8.3 Type of Dwelling, Holding and Tenancy arrangements
8.3.1 House ownership
Owning a house is the dream of most people in Ghana, especially in the urban centers. In
most rural areas, due to the extended family system of living, more than one or two nuclear
families tend to live in one house. From table 8.2, the number of houses owned by a member
of the household in the district is 18,358. For such house there are more male-headed ones
(14,921) than female-headed (3,437) ones. In terms of locality, more houses are owned a
household member in rural (15, 243) localities than in urban (3,115) localities. The number of
houses owned by a relative who is not a household member is 1,721 out of which 1,162 are
male-headed and 559 are female-headed.
From data, 111 houses are being purchased through mortgage. A total of 4,186 of houses are
owned by other private individuals (not relatives) of which male-headed constitutes (2,972)
and female-headed (1,214). Only 309 houses are owned by public or Government in the
district, with majority of them being occupied by male-headed households (246) and are
mostly located in the urban localities.
Table 8.2: Ownership status of dwelling by sex of household head and type of locality
Total
Country Region
District
Ownership status Total
Male
headed
Female
headed Urban Rural
Total 5,467,054 632,045 25,007 19,661 5,346 6,488 18,519
Owned by household member 2,883,236 335,114 18,358 14,921 3,437 3,115 15,243
Being purchased (e.g. mortgage) 45,630 4,009 111 93 18 27 84
Relative not a household member 851,630 108,374 1,721 1,162 559 689 1,032
Other private individual 1,439,021 159,804 4,186 2,972 1,214 2,427 1,759
Private employer 83,610 6,862 120 99 21 32 88
Other private agency 21,123 2,797 120 104 16 78 42
Public/Government ownership 118,804 12,754 309 246 63 85 224
Other 24,000 2,331 82 64 18 35 47 Source: Ghana Statistical Service, 2010 Population and Housing Census
8.3.2 Type of dwelling units
Table 8.2 shows that there are 25,007 dwelling units. On the whole, (43.2%) of all dwelling
units are separate houses, making the separate houses the most common type of dwelling unit
in the district. This is to be expected because in rural settings like the Kwahu Afram Plains
South, houses are not expensive and individuals live in their own houses. The next common
type of dwelling unit is the compound house (34.6%). The following dwelling units all
recorded (0.2%) each: tents, living quarters attached to office/shop and improvised
home/kiosk/container.
Across both sexes, not much difference is observed between male and female headed
households. For the entire district, the proportion of female-headed households living in
compound houses is higher (40.3%) than males (33.1). Contrary, the proportion of male-
headed households living in separate houses (44.2%) outnumbers that of female-headed
households (39.5%). Only a few households live in flat/apartments of which male-headed
(0.3%) dominates the females (0.2%). Makeshift dwelling units such as tents (0.2%), kiosks
and containers (0.2%), attachments to shops or offices (0.2%) all together, constitute less than
one percent of dwelling units.
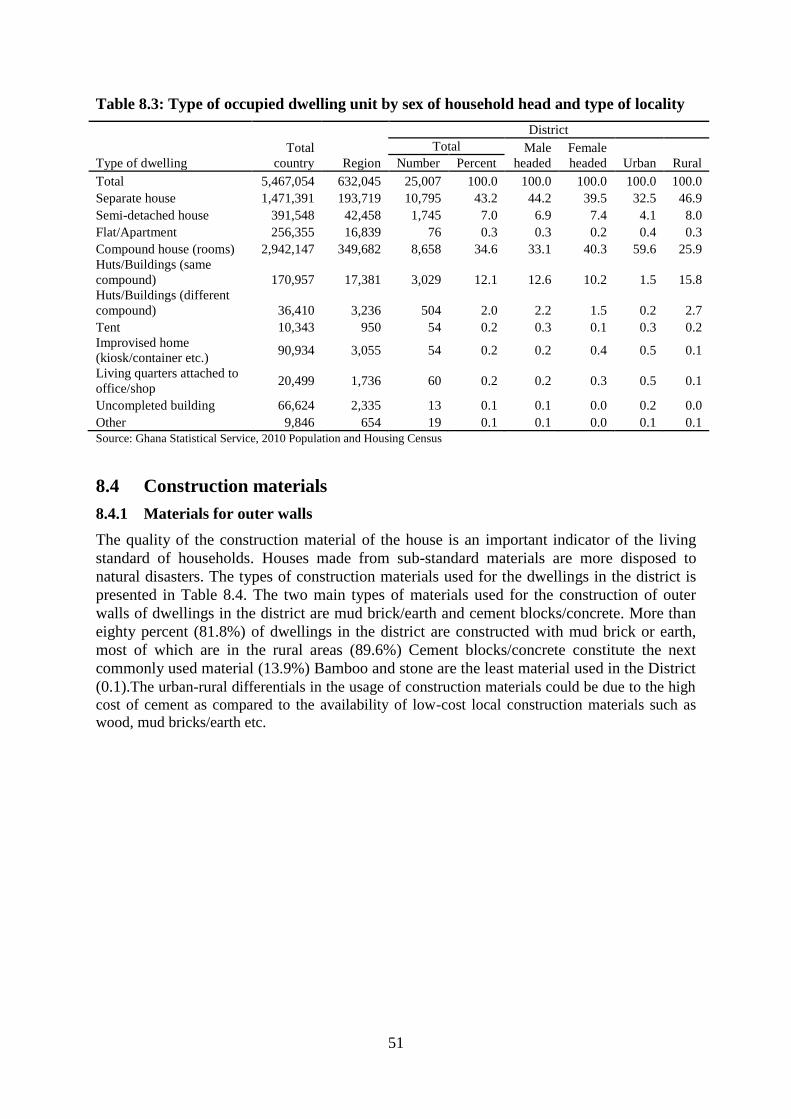
51
Table 8.3: Type of occupied dwelling unit by sex of household head and type of locality
Type of dwelling
Total
country Region
District
Total Male
headed
Female
headed Urban Rural Number Percent
Total 5,467,054 632,045 25,007 100.0 100.0 100.0 100.0 100.0
Separate house 1,471,391 193,719 10,795 43.2 44.2 39.5 32.5 46.9
Semi-detached house 391,548 42,458 1,745 7.0 6.9 7.4 4.1 8.0
Flat/Apartment 256,355 16,839 76 0.3 0.3 0.2 0.4 0.3
Compound house (rooms) 2,942,147 349,682 8,658 34.6 33.1 40.3 59.6 25.9
Huts/Buildings (same
compound) 170,957 17,381 3,029 12.1 12.6 10.2 1.5 15.8
Huts/Buildings (different
compound) 36,410 3,236 504 2.0 2.2 1.5 0.2 2.7
Tent 10,343 950 54 0.2 0.3 0.1 0.3 0.2
Improvised home
(kiosk/container etc.) 90,934 3,055 54 0.2 0.2 0.4 0.5 0.1
Living quarters attached to
office/shop 20,499 1,736 60 0.2 0.2 0.3 0.5 0.1
Uncompleted building 66,624 2,335 13 0.1 0.1 0.0 0.2 0.0
Other 9,846 654 19 0.1 0.1 0.0 0.1 0.1
Source: Ghana Statistical Service, 2010 Population and Housing Census
8.4 Construction materials
8.4.1 Materials for outer walls
The quality of the construction material of the house is an important indicator of the living
standard of households. Houses made from sub-standard materials are more disposed to
natural disasters. The types of construction materials used for the dwellings in the district is
presented in Table 8.4. The two main types of materials used for the construction of outer
walls of dwellings in the district are mud brick/earth and cement blocks/concrete. More than
eighty percent (81.8%) of dwellings in the district are constructed with mud brick or earth,
most of which are in the rural areas (89.6%) Cement blocks/concrete constitute the next
commonly used material (13.9%) Bamboo and stone are the least material used in the District
(0.1).The urban-rural differentials in the usage of construction materials could be due to the high
cost of cement as compared to the availability of low-cost local construction materials such as
wood, mud bricks/earth etc.
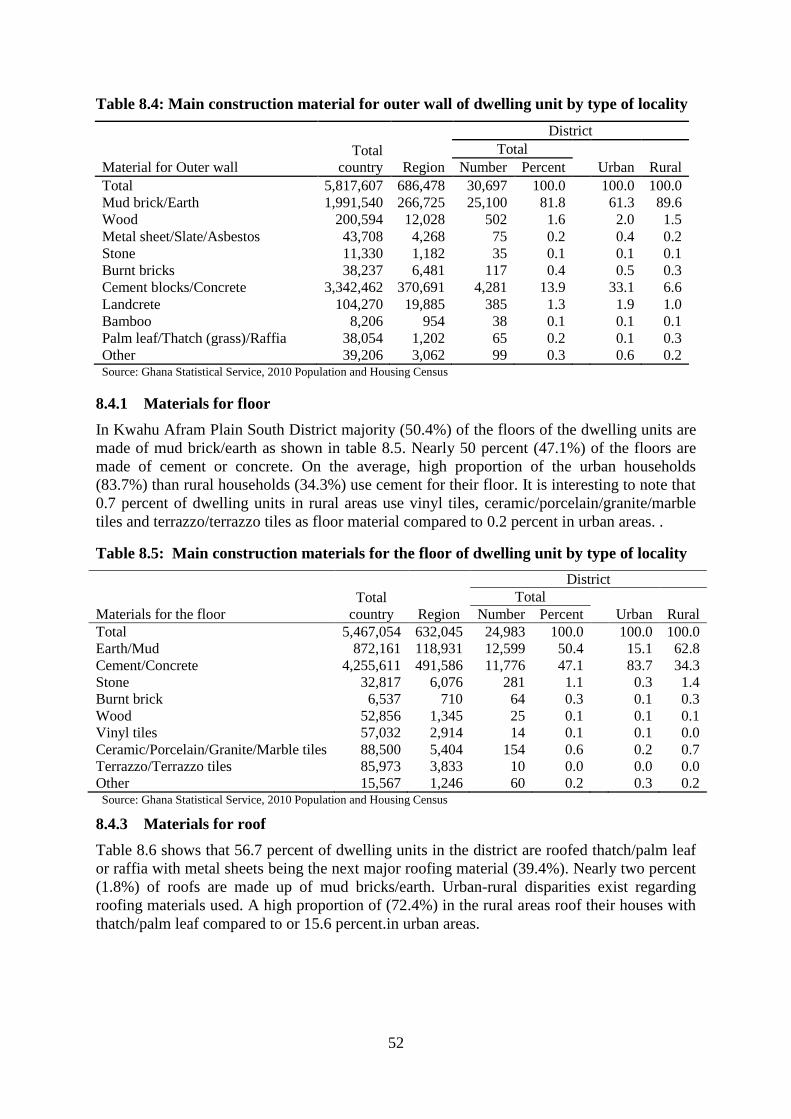
52
Table 8.4: Main construction material for outer wall of dwelling unit by type of locality
Material for Outer wall
Total
country Region
District
Total Urban Rural Number Percent
Total 5,817,607 686,478 30,697 100.0
100.0 100.0
Mud brick/Earth 1,991,540 266,725 25,100 81.8
61.3 89.6
Wood 200,594 12,028 502 1.6
2.0 1.5
Metal sheet/Slate/Asbestos 43,708 4,268 75 0.2
0.4 0.2
Stone 11,330 1,182 35 0.1
0.1 0.1
Burnt bricks 38,237 6,481 117 0.4
0.5 0.3
Cement blocks/Concrete 3,342,462 370,691 4,281 13.9
33.1 6.6
Landcrete 104,270 19,885 385 1.3
1.9 1.0
Bamboo 8,206 954 38 0.1
0.1 0.1
Palm leaf/Thatch (grass)/Raffia 38,054 1,202 65 0.2
0.1 0.3
Other 39,206 3,062 99 0.3 0.6 0.2 Source: Ghana Statistical Service, 2010 Population and Housing Census
8.4.1 Materials for floor
In Kwahu Afram Plain South District majority (50.4%) of the floors of the dwelling units are
made of mud brick/earth as shown in table 8.5. Nearly 50 percent (47.1%) of the floors are
made of cement or concrete. On the average, high proportion of the urban households
(83.7%) than rural households (34.3%) use cement for their floor. It is interesting to note that
0.7 percent of dwelling units in rural areas use vinyl tiles, ceramic/porcelain/granite/marble
tiles and terrazzo/terrazzo tiles as floor material compared to 0.2 percent in urban areas. .
Table 8.5: Main construction materials for the floor of dwelling unit by type of locality
Materials for the floor
Total
country Region
District
Total
Number Percent Urban Rural
Total 5,467,054 632,045 24,983 100.0
100.0 100.0
Earth/Mud 872,161 118,931 12,599 50.4
15.1 62.8
Cement/Concrete 4,255,611 491,586 11,776 47.1
83.7 34.3
Stone 32,817 6,076 281 1.1
0.3 1.4
Burnt brick 6,537 710 64 0.3
0.1 0.3
Wood 52,856 1,345 25 0.1
0.1 0.1
Vinyl tiles 57,032 2,914 14 0.1
0.1 0.0
Ceramic/Porcelain/Granite/Marble tiles 88,500 5,404 154 0.6
0.2 0.7
Terrazzo/Terrazzo tiles 85,973 3,833 10 0.0
0.0 0.0
Other 15,567 1,246 60 0.2 0.3 0.2 Source: Ghana Statistical Service, 2010 Population and Housing Census
8.4.3 Materials for roof
Table 8.6 shows that 56.7 percent of dwelling units in the district are roofed thatch/palm leaf
or raffia with metal sheets being the next major roofing material (39.4%). Nearly two percent
(1.8%) of roofs are made up of mud bricks/earth. Urban-rural disparities exist regarding
roofing materials used. A high proportion of (72.4%) in the rural areas roof their houses with
thatch/palm leaf compared to or 15.6 percent.in urban areas.
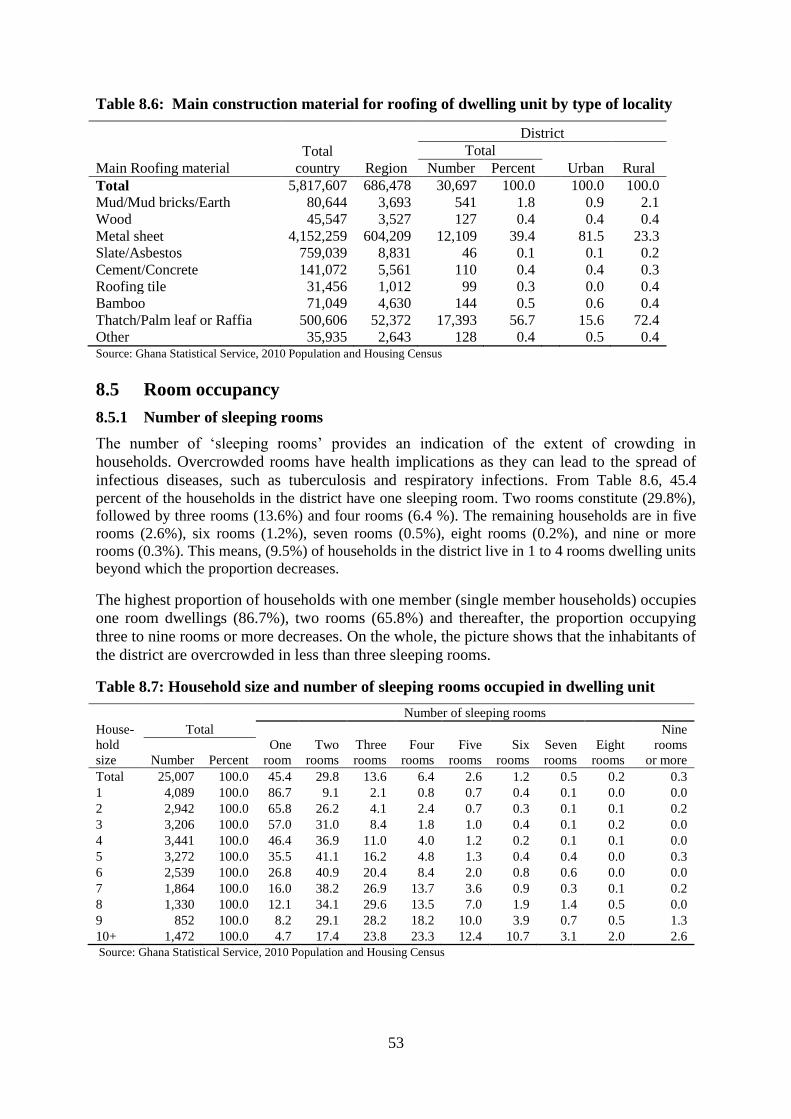
53
Table 8.6: Main construction material for roofing of dwelling unit by type of locality
Main Roofing material
Total
country Region
District
Total
Number Percent Urban Rural
Total 5,817,607 686,478 30,697 100.0
100.0 100.0
Mud/Mud bricks/Earth 80,644 3,693 541 1.8
0.9 2.1
Wood 45,547 3,527 127 0.4
0.4 0.4
Metal sheet 4,152,259 604,209 12,109 39.4
81.5 23.3
Slate/Asbestos 759,039 8,831 46 0.1
0.1 0.2
Cement/Concrete 141,072 5,561 110 0.4
0.4 0.3
Roofing tile 31,456 1,012 99 0.3
0.0 0.4
Bamboo 71,049 4,630 144 0.5
0.6 0.4
Thatch/Palm leaf or Raffia 500,606 52,372 17,393 56.7
15.6 72.4
Other 35,935 2,643 128 0.4 0.5 0.4 Source: Ghana Statistical Service, 2010 Population and Housing Census
8.5 Room occupancy
8.5.1 Number of sleeping rooms
The number of ‘sleeping rooms’ provides an indication of the extent of crowding in
households. Overcrowded rooms have health implications as they can lead to the spread of
infectious diseases, such as tuberculosis and respiratory infections. From Table 8.6, 45.4
percent of the households in the district have one sleeping room. Two rooms constitute (29.8%),
followed by three rooms (13.6%) and four rooms (6.4 %). The remaining households are in five
rooms (2.6%), six rooms (1.2%), seven rooms (0.5%), eight rooms (0.2%), and nine or more
rooms (0.3%). This means, (9.5%) of households in the district live in 1 to 4 rooms dwelling units
beyond which the proportion decreases.
The highest proportion of households with one member (single member households) occupies
one room dwellings (86.7%), two rooms (65.8%) and thereafter, the proportion occupying
three to nine rooms or more decreases. On the whole, the picture shows that the inhabitants of
the district are overcrowded in less than three sleeping rooms.
Table 8.7: Household size and number of sleeping rooms occupied in dwelling unit
Number of sleeping rooms
House-
hold
size
Total
One
room
Two
rooms
Three
rooms
Four
rooms
Five
rooms
Six
rooms
Seven
rooms
Eight
rooms
Nine
rooms
or more Number Percent
Total 25,007 100.0 45.4 29.8 13.6 6.4 2.6 1.2 0.5 0.2 0.3
1 4,089 100.0 86.7 9.1 2.1 0.8 0.7 0.4 0.1 0.0 0.0
2 2,942 100.0 65.8 26.2 4.1 2.4 0.7 0.3 0.1 0.1 0.2
3 3,206 100.0 57.0 31.0 8.4 1.8 1.0 0.4 0.1 0.2 0.0
4 3,441 100.0 46.4 36.9 11.0 4.0 1.2 0.2 0.1 0.1 0.0
5 3,272 100.0 35.5 41.1 16.2 4.8 1.3 0.4 0.4 0.0 0.3
6 2,539 100.0 26.8 40.9 20.4 8.4 2.0 0.8 0.6 0.0 0.0
7 1,864 100.0 16.0 38.2 26.9 13.7 3.6 0.9 0.3 0.1 0.2
8 1,330 100.0 12.1 34.1 29.6 13.5 7.0 1.9 1.4 0.5 0.0
9 852 100.0 8.2 29.1 28.2 18.2 10.0 3.9 0.7 0.5 1.3
10+ 1,472 100.0 4.7 17.4 23.8 23.3 12.4 10.7 3.1 2.0 2.6
Source: Ghana Statistical Service, 2010 Population and Housing Census
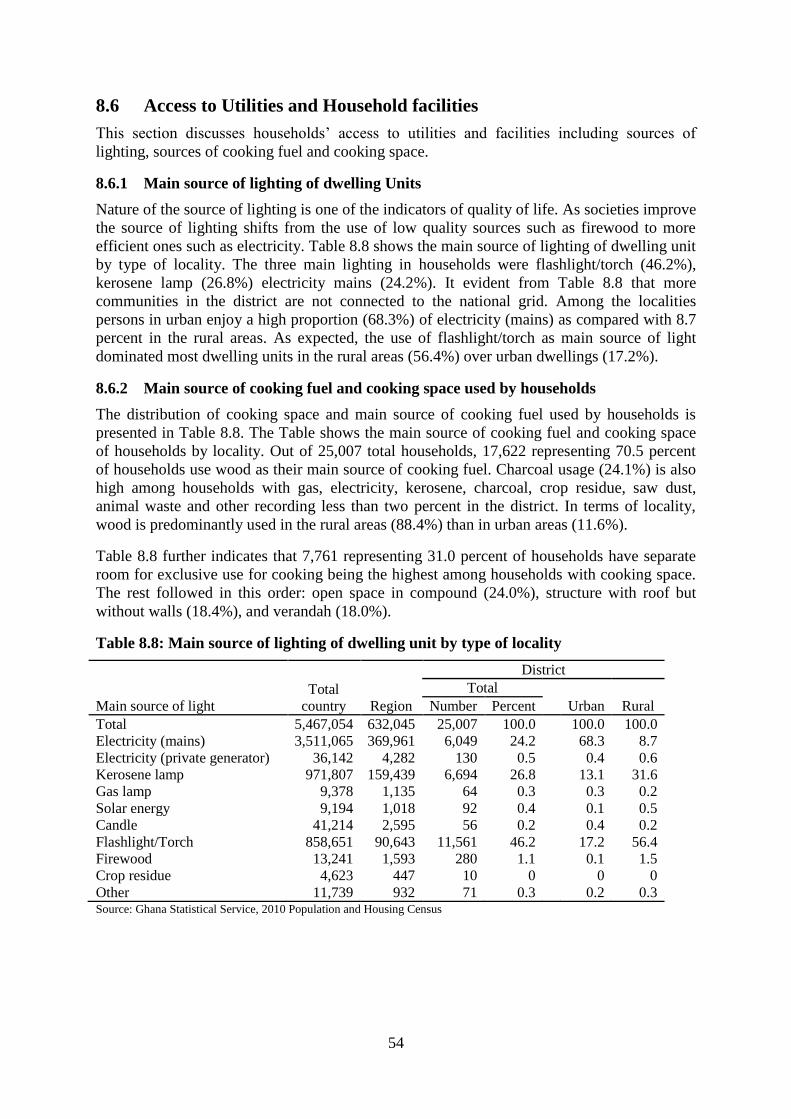
54
8.6 Access to Utilities and Household facilities
This section discusses households’ access to utilities and facilities including sources of
lighting, sources of cooking fuel and cooking space.
8.6.1 Main source of lighting of dwelling Units
Nature of the source of lighting is one of the indicators of quality of life. As societies improve
the source of lighting shifts from the use of low quality sources such as firewood to more
efficient ones such as electricity. Table 8.8 shows the main source of lighting of dwelling unit
by type of locality. The three main lighting in households were flashlight/torch (46.2%),
kerosene lamp (26.8%) electricity mains (24.2%). It evident from Table 8.8 that more
communities in the district are not connected to the national grid. Among the localities
persons in urban enjoy a high proportion (68.3%) of electricity (mains) as compared with 8.7
percent in the rural areas. As expected, the use of flashlight/torch as main source of light
dominated most dwelling units in the rural areas (56.4%) over urban dwellings (17.2%).
8.6.2 Main source of cooking fuel and cooking space used by households
The distribution of cooking space and main source of cooking fuel used by households is
presented in Table 8.8. The Table shows the main source of cooking fuel and cooking space
of households by locality. Out of 25,007 total households, 17,622 representing 70.5 percent
of households use wood as their main source of cooking fuel. Charcoal usage (24.1%) is also
high among households with gas, electricity, kerosene, charcoal, crop residue, saw dust,
animal waste and other recording less than two percent in the district. In terms of locality,
wood is predominantly used in the rural areas (88.4%) than in urban areas (11.6%).
Table 8.8 further indicates that 7,761 representing 31.0 percent of households have separate
room for exclusive use for cooking being the highest among households with cooking space.
The rest followed in this order: open space in compound (24.0%), structure with roof but
without walls (18.4%), and verandah (18.0%).
Table 8.8: Main source of lighting of dwelling unit by type of locality
Main source of light
Total
country Region
District
Total
Number Percent Urban Rural
Total 5,467,054 632,045 25,007 100.0
100.0 100.0
Electricity (mains) 3,511,065 369,961 6,049 24.2
68.3 8.7
Electricity (private generator) 36,142 4,282 130 0.5
0.4 0.6
Kerosene lamp 971,807 159,439 6,694 26.8
13.1 31.6
Gas lamp 9,378 1,135 64 0.3
0.3 0.2
Solar energy 9,194 1,018 92 0.4
0.1 0.5
Candle 41,214 2,595 56 0.2
0.4 0.2
Flashlight/Torch 858,651 90,643 11,561 46.2
17.2 56.4
Firewood 13,241 1,593 280 1.1
0.1 1.5
Crop residue 4,623 447 10 0
0 0
Other 11,739 932 71 0.3 0.2 0.3 Source: Ghana Statistical Service, 2010 Population and Housing Census
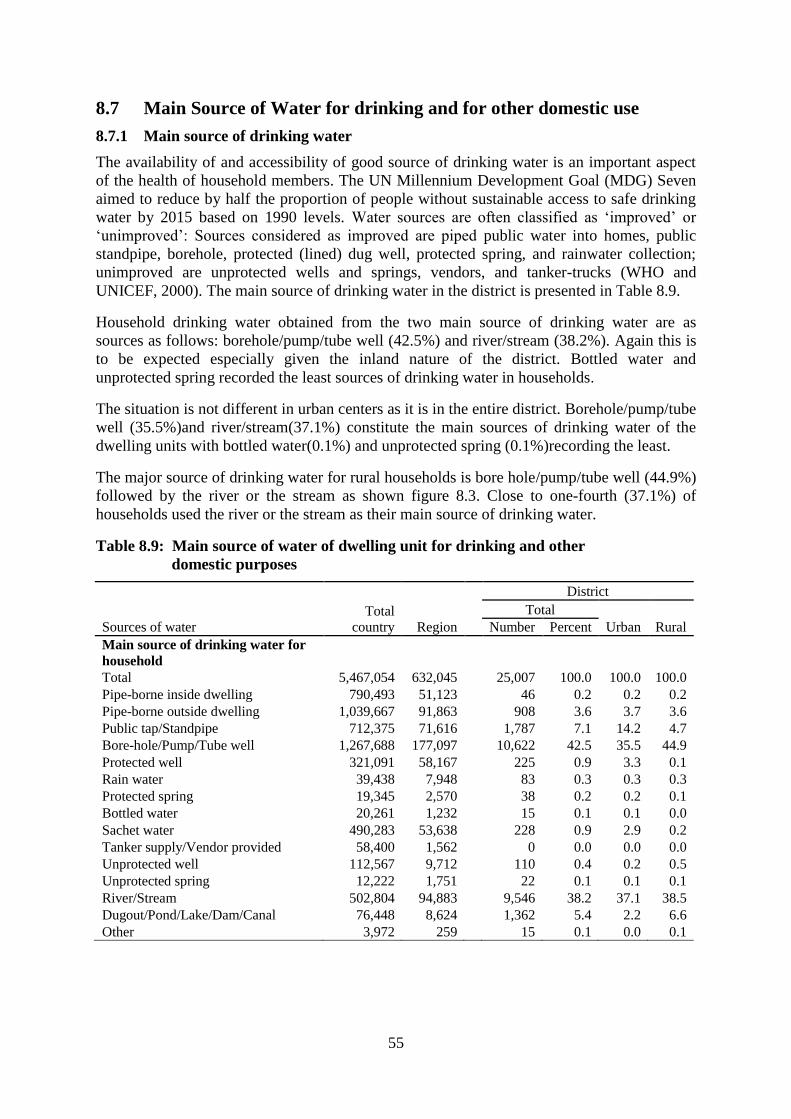
55
8.7 Main Source of Water for drinking and for other domestic use
8.7.1 Main source of drinking water
The availability of and accessibility of good source of drinking water is an important aspect
of the health of household members. The UN Millennium Development Goal (MDG) Seven
aimed to reduce by half the proportion of people without sustainable access to safe drinking
water by 2015 based on 1990 levels. Water sources are often classified as ‘improved’ or
‘unimproved’: Sources considered as improved are piped public water into homes, public
standpipe, borehole, protected (lined) dug well, protected spring, and rainwater collection;
unimproved are unprotected wells and springs, vendors, and tanker-trucks (WHO and
UNICEF, 2000). The main source of drinking water in the district is presented in Table 8.9.
Household drinking water obtained from the two main source of drinking water are as
sources as follows: borehole/pump/tube well (42.5%) and river/stream (38.2%). Again this is
to be expected especially given the inland nature of the district. Bottled water and
unprotected spring recorded the least sources of drinking water in households.
The situation is not different in urban centers as it is in the entire district. Borehole/pump/tube
well (35.5%)and river/stream(37.1%) constitute the main sources of drinking water of the
dwelling units with bottled water(0.1%) and unprotected spring (0.1%)recording the least.
The major source of drinking water for rural households is bore hole/pump/tube well (44.9%)
followed by the river or the stream as shown figure 8.3. Close to one-fourth (37.1%) of
households used the river or the stream as their main source of drinking water.
Table 8.9: Main source of water of dwelling unit for drinking and other
domestic purposes
Sources of water
Total
country Region
District
Total
Urban Rural Number Percent
Main source of drinking water for
household
Total 5,467,054 632,045
25,007 100.0 100.0 100.0
Pipe-borne inside dwelling 790,493 51,123
46 0.2 0.2 0.2
Pipe-borne outside dwelling 1,039,667 91,863
908 3.6 3.7 3.6
Public tap/Standpipe 712,375 71,616
1,787 7.1 14.2 4.7
Bore-hole/Pump/Tube well 1,267,688 177,097
10,622 42.5 35.5 44.9
Protected well 321,091 58,167
225 0.9 3.3 0.1
Rain water 39,438 7,948
83 0.3 0.3 0.3
Protected spring 19,345 2,570
38 0.2 0.2 0.1
Bottled water 20,261 1,232
15 0.1 0.1 0.0
Sachet water 490,283 53,638
228 0.9 2.9 0.2
Tanker supply/Vendor provided 58,400 1,562
0 0.0 0.0 0.0
Unprotected well 112,567 9,712
110 0.4 0.2 0.5
Unprotected spring 12,222 1,751
22 0.1 0.1 0.1
River/Stream 502,804 94,883
9,546 38.2 37.1 38.5
Dugout/Pond/Lake/Dam/Canal 76,448 8,624
1,362 5.4 2.2 6.6
Other 3,972 259
15 0.1 0.0 0.1
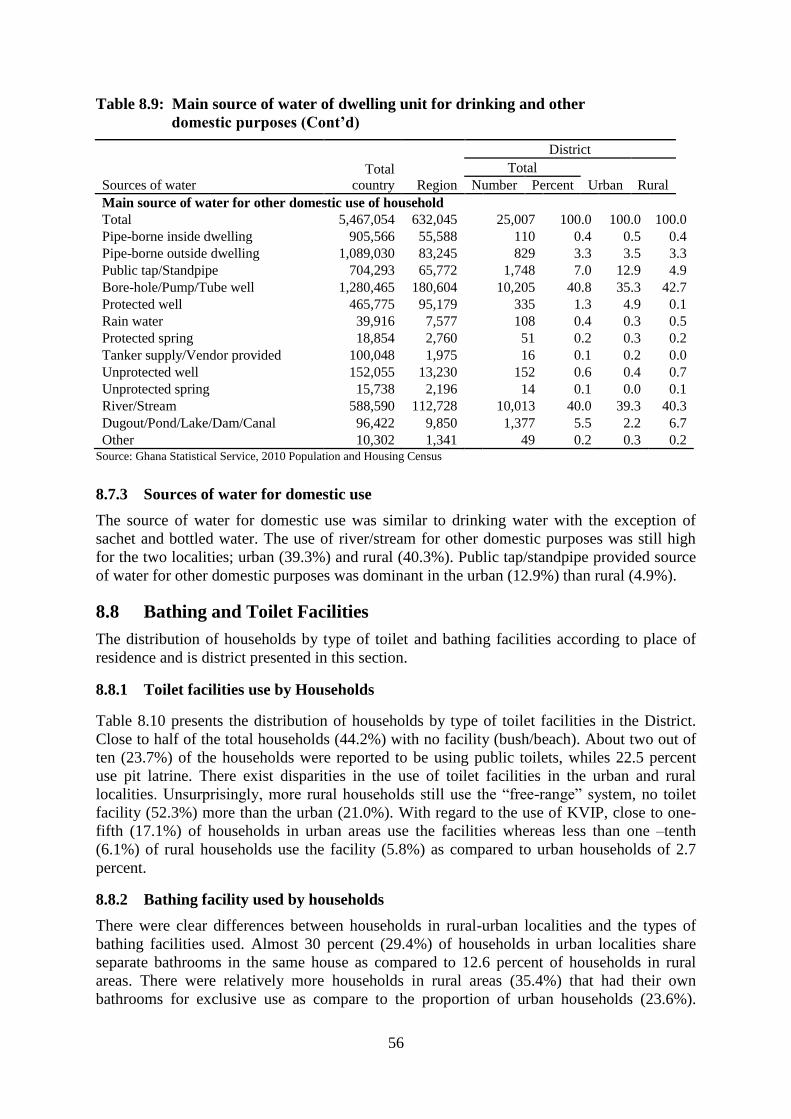
56
Table 8.9: Main source of water of dwelling unit for drinking and other
domestic purposes (Cont’d)
Sources of water
Total
country Region
District
Total
Urban Rural Number Percent
Main source of water for other domestic use of household Total 5,467,054 632,045
25,007 100.0 100.0 100.0
Pipe-borne inside dwelling 905,566 55,588
110 0.4 0.5 0.4
Pipe-borne outside dwelling 1,089,030 83,245
829 3.3 3.5 3.3
Public tap/Standpipe 704,293 65,772
1,748 7.0 12.9 4.9
Bore-hole/Pump/Tube well 1,280,465 180,604
10,205 40.8 35.3 42.7
Protected well 465,775 95,179
335 1.3 4.9 0.1
Rain water 39,916 7,577
108 0.4 0.3 0.5
Protected spring 18,854 2,760
51 0.2 0.3 0.2
Tanker supply/Vendor provided 100,048 1,975
16 0.1 0.2 0.0
Unprotected well 152,055 13,230
152 0.6 0.4 0.7
Unprotected spring 15,738 2,196
14 0.1 0.0 0.1
River/Stream 588,590 112,728
10,013 40.0 39.3 40.3
Dugout/Pond/Lake/Dam/Canal 96,422 9,850
1,377 5.5 2.2 6.7
Other 10,302 1,341 49 0.2 0.3 0.2 Source: Ghana Statistical Service, 2010 Population and Housing Census
8.7.3 Sources of water for domestic use
The source of water for domestic use was similar to drinking water with the exception of
sachet and bottled water. The use of river/stream for other domestic purposes was still high
for the two localities; urban (39.3%) and rural (40.3%). Public tap/standpipe provided source
of water for other domestic purposes was dominant in the urban (12.9%) than rural (4.9%).
8.8 Bathing and Toilet Facilities
The distribution of households by type of toilet and bathing facilities according to place of
residence and is district presented in this section.
8.8.1 Toilet facilities use by Households
Table 8.10 presents the distribution of households by type of toilet facilities in the District.
Close to half of the total households (44.2%) with no facility (bush/beach). About two out of
ten (23.7%) of the households were reported to be using public toilets, whiles 22.5 percent
use pit latrine. There exist disparities in the use of toilet facilities in the urban and rural
localities. Unsurprisingly, more rural households still use the “free-range” system, no toilet
facility (52.3%) more than the urban (21.0%). With regard to the use of KVIP, close to one-
fifth (17.1%) of households in urban areas use the facilities whereas less than one –tenth
(6.1%) of rural households use the facility (5.8%) as compared to urban households of 2.7
percent.
8.8.2 Bathing facility used by households
There were clear differences between households in rural-urban localities and the types of
bathing facilities used. Almost 30 percent (29.4%) of households in urban localities share
separate bathrooms in the same house as compared to 12.6 percent of households in rural
areas. There were relatively more households in rural areas (35.4%) that had their own
bathrooms for exclusive use as compare to the proportion of urban households (23.6%).
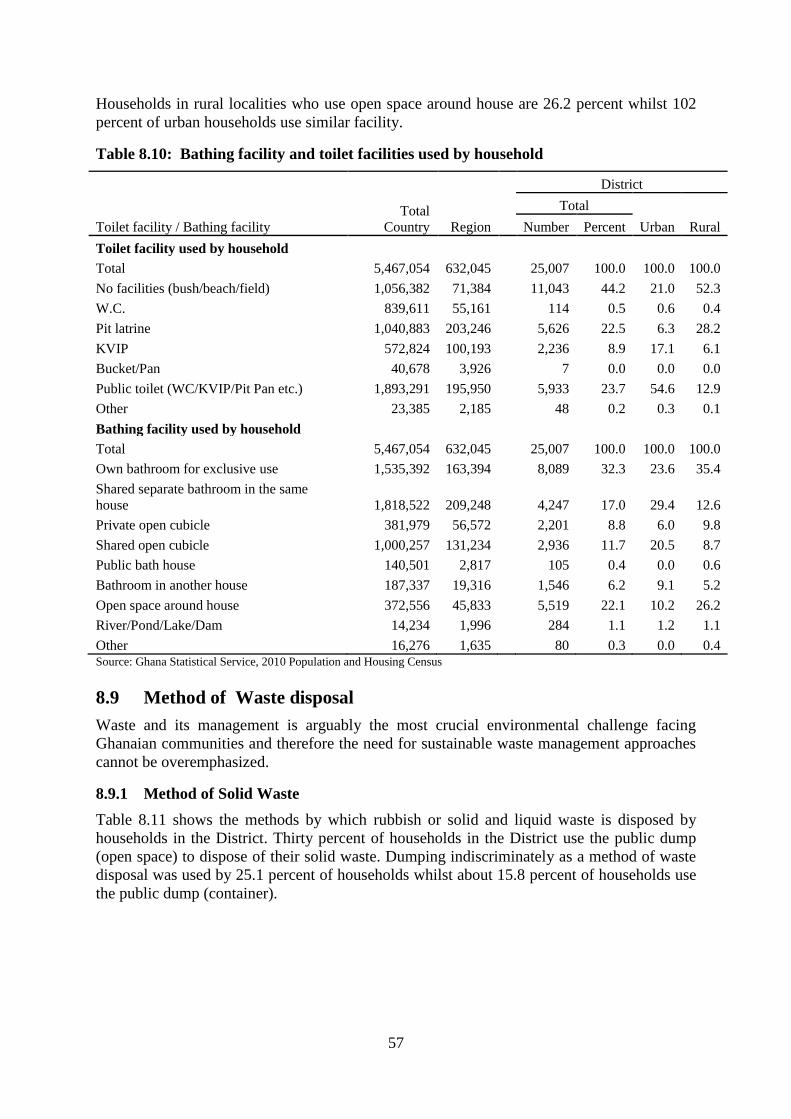
57
Households in rural localities who use open space around house are 26.2 percent whilst 102
percent of urban households use similar facility.
Table 8.10: Bathing facility and toilet facilities used by household
Total
Country Region
District
Total
Urban
Rural Toilet facility / Bathing facility Number Percent
Toilet facility used by household
Total 5,467,054 632,045
25,007 100.0 100.0 100.0
No facilities (bush/beach/field) 1,056,382 71,384
11,043 44.2 21.0 52.3
W.C. 839,611 55,161
114 0.5 0.6 0.4
Pit latrine 1,040,883 203,246
5,626 22.5 6.3 28.2
KVIP 572,824 100,193
2,236 8.9 17.1 6.1
Bucket/Pan 40,678 3,926
7 0.0 0.0 0.0
Public toilet (WC/KVIP/Pit Pan etc.) 1,893,291 195,950
5,933 23.7 54.6 12.9
Other 23,385 2,185
48 0.2 0.3 0.1
Bathing facility used by household
Total 5,467,054 632,045
25,007 100.0 100.0 100.0
Own bathroom for exclusive use 1,535,392 163,394
8,089 32.3 23.6 35.4
Shared separate bathroom in the same
house 1,818,522 209,248
4,247 17.0 29.4 12.6
Private open cubicle 381,979 56,572
2,201 8.8 6.0 9.8
Shared open cubicle 1,000,257 131,234
2,936 11.7 20.5 8.7
Public bath house 140,501 2,817
105 0.4 0.0 0.6
Bathroom in another house 187,337 19,316
1,546 6.2 9.1 5.2
Open space around house 372,556 45,833
5,519 22.1 10.2 26.2
River/Pond/Lake/Dam 14,234 1,996
284 1.1 1.2 1.1
Other 16,276 1,635 80 0.3 0.0 0.4 Source: Ghana Statistical Service, 2010 Population and Housing Census
8.9 Method of Waste disposal
Waste and its management is arguably the most crucial environmental challenge facing
Ghanaian communities and therefore the need for sustainable waste management approaches
cannot be overemphasized.
8.9.1 Method of Solid Waste
Table 8.11 shows the methods by which rubbish or solid and liquid waste is disposed by
households in the District. Thirty percent of households in the District use the public dump
(open space) to dispose of their solid waste. Dumping indiscriminately as a method of waste
disposal was used by 25.1 percent of households whilst about 15.8 percent of households use
the public dump (container).
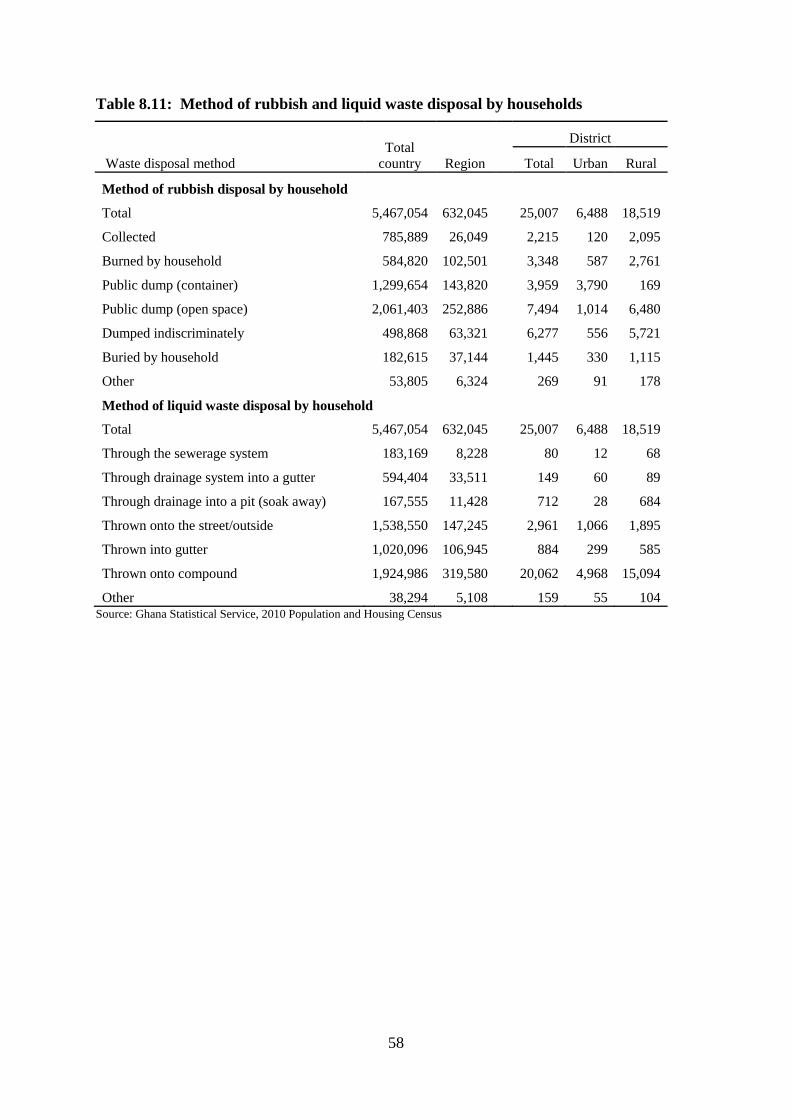
58
Table 8.11: Method of rubbish and liquid waste disposal by households
Waste disposal method
Total
country Region
District
Total Urban Rural
Method of rubbish disposal by household
Total 5,467,054 632,045
25,007 6,488 18,519
Collected 785,889 26,049
2,215 120 2,095
Burned by household 584,820 102,501
3,348 587 2,761
Public dump (container) 1,299,654 143,820
3,959 3,790 169
Public dump (open space) 2,061,403 252,886
7,494 1,014 6,480
Dumped indiscriminately 498,868 63,321
6,277 556 5,721
Buried by household 182,615 37,144
1,445 330 1,115
Other 53,805 6,324
269 91 178
Method of liquid waste disposal by household
Total 5,467,054 632,045
25,007 6,488 18,519
Through the sewerage system 183,169 8,228
80 12 68
Through drainage system into a gutter 594,404 33,511
149 60 89
Through drainage into a pit (soak away) 167,555 11,428
712 28 684
Thrown onto the street/outside 1,538,550 147,245
2,961 1,066 1,895
Thrown into gutter 1,020,096 106,945
884 299 585
Thrown onto compound 1,924,986 319,580
20,062 4,968 15,094
Other 38,294 5,108 159 55 104 Source: Ghana Statistical Service, 2010 Population and Housing Census
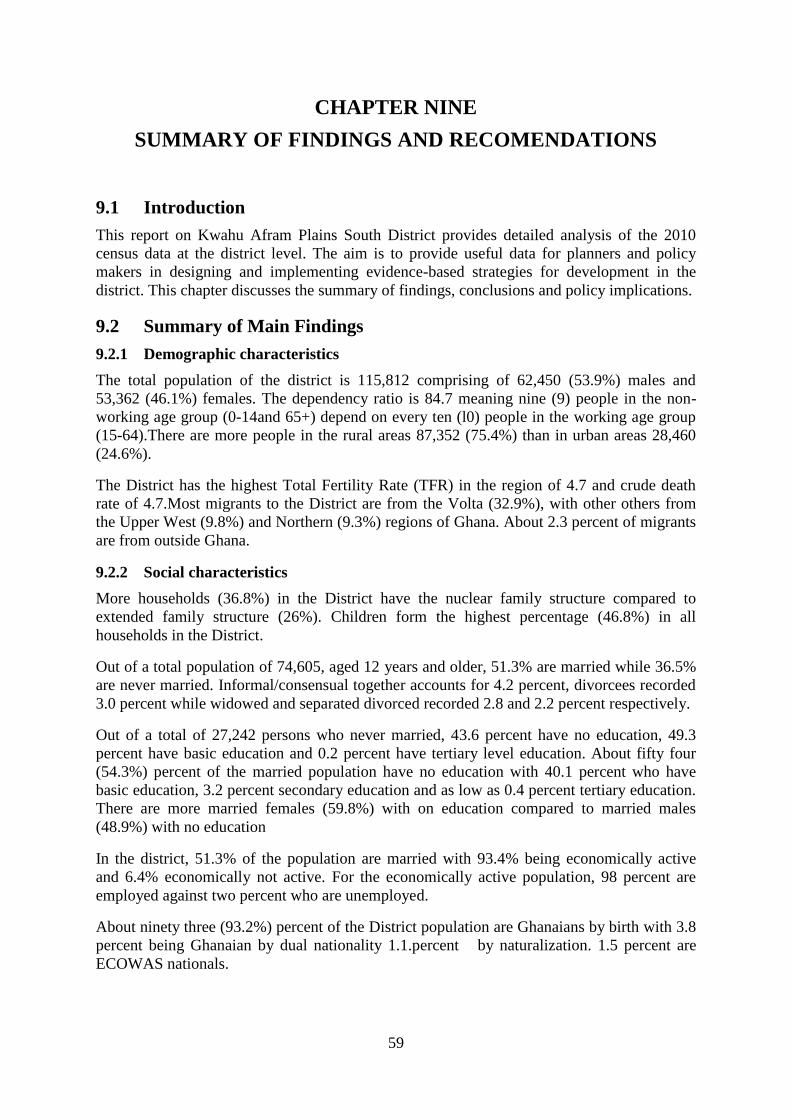
59
CHAPTER NINE
SUMMARY OF FINDINGS AND RECOMENDATIONS
9.1 Introduction
This report on Kwahu Afram Plains South District provides detailed analysis of the 2010
census data at the district level. The aim is to provide useful data for planners and policy
makers in designing and implementing evidence-based strategies for development in the
district. This chapter discusses the summary of findings, conclusions and policy implications.
9.2 Summary of Main Findings
9.2.1 Demographic characteristics
The total population of the district is 115,812 comprising of 62,450 (53.9%) males and
53,362 (46.1%) females. The dependency ratio is 84.7 meaning nine (9) people in the non-
working age group (0-14and 65+) depend on every ten (l0) people in the working age group
(15-64).There are more people in the rural areas 87,352 (75.4%) than in urban areas 28,460
(24.6%).
The District has the highest Total Fertility Rate (TFR) in the region of 4.7 and crude death
rate of 4.7.Most migrants to the District are from the Volta (32.9%), with other others from
the Upper West (9.8%) and Northern (9.3%) regions of Ghana. About 2.3 percent of migrants
are from outside Ghana.
9.2.2 Social characteristics
More households (36.8%) in the District have the nuclear family structure compared to
extended family structure (26%). Children form the highest percentage (46.8%) in all
households in the District.
Out of a total population of 74,605, aged 12 years and older, 51.3% are married while 36.5%
are never married. Informal/consensual together accounts for 4.2 percent, divorcees recorded
3.0 percent while widowed and separated divorced recorded 2.8 and 2.2 percent respectively.
Out of a total of 27,242 persons who never married, 43.6 percent have no education, 49.3
percent have basic education and 0.2 percent have tertiary level education. About fifty four
(54.3%) percent of the married population have no education with 40.1 percent who have
basic education, 3.2 percent secondary education and as low as 0.4 percent tertiary education.
There are more married females (59.8%) with on education compared to married males
(48.9%) with no education
In the district, 51.3% of the population are married with 93.4% being economically active
and 6.4% economically not active. For the economically active population, 98 percent are
employed against two percent who are unemployed.
About ninety three (93.2%) percent of the District population are Ghanaians by birth with 3.8
percent being Ghanaian by dual nationality 1.1.percent by naturalization. 1.5 percent are
ECOWAS nationals.
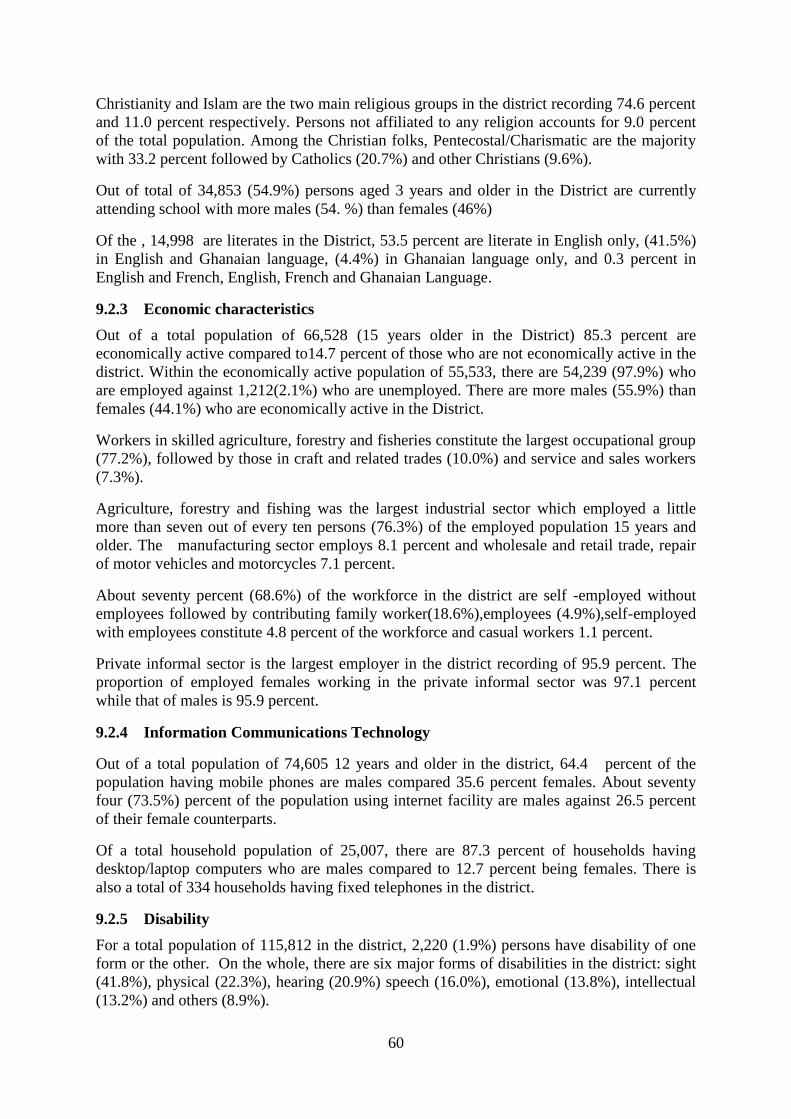
60
Christianity and Islam are the two main religious groups in the district recording 74.6 percent
and 11.0 percent respectively. Persons not affiliated to any religion accounts for 9.0 percent
of the total population. Among the Christian folks, Pentecostal/Charismatic are the majority
with 33.2 percent followed by Catholics (20.7%) and other Christians (9.6%).
Out of total of 34,853 (54.9%) persons aged 3 years and older in the District are currently
attending school with more males (54. %) than females (46%)
Of the , 14,998 are literates in the District, 53.5 percent are literate in English only, (41.5%)
in English and Ghanaian language, (4.4%) in Ghanaian language only, and 0.3 percent in
English and French, English, French and Ghanaian Language.
9.2.3 Economic characteristics
Out of a total population of 66,528 (15 years older in the District) 85.3 percent are
economically active compared to14.7 percent of those who are not economically active in the
district. Within the economically active population of 55,533, there are 54,239 (97.9%) who
are employed against 1,212(2.1%) who are unemployed. There are more males (55.9%) than
females (44.1%) who are economically active in the District.
Workers in skilled agriculture, forestry and fisheries constitute the largest occupational group
(77.2%), followed by those in craft and related trades (10.0%) and service and sales workers
(7.3%).
Agriculture, forestry and fishing was the largest industrial sector which employed a little
more than seven out of every ten persons (76.3%) of the employed population 15 years and
older. The manufacturing sector employs 8.1 percent and wholesale and retail trade, repair
of motor vehicles and motorcycles 7.1 percent.
About seventy percent (68.6%) of the workforce in the district are self -employed without
employees followed by contributing family worker(18.6%),employees (4.9%),self-employed
with employees constitute 4.8 percent of the workforce and casual workers 1.1 percent.
Private informal sector is the largest employer in the district recording of 95.9 percent. The
proportion of employed females working in the private informal sector was 97.1 percent
while that of males is 95.9 percent.
9.2.4 Information Communications Technology
Out of a total population of 74,605 12 years and older in the district, 64.4 percent of the
population having mobile phones are males compared 35.6 percent females. About seventy
four (73.5%) percent of the population using internet facility are males against 26.5 percent
of their female counterparts.
Of a total household population of 25,007, there are 87.3 percent of households having
desktop/laptop computers who are males compared to 12.7 percent being females. There is
also a total of 334 households having fixed telephones in the district.
9.2.5 Disability
For a total population of 115,812 in the district, 2,220 (1.9%) persons have disability of one
form or the other. On the whole, there are six major forms of disabilities in the district: sight
(41.8%), physical (22.3%), hearing (20.9%) speech (16.0%), emotional (13.8%), intellectual
(13.2%) and others (8.9%).
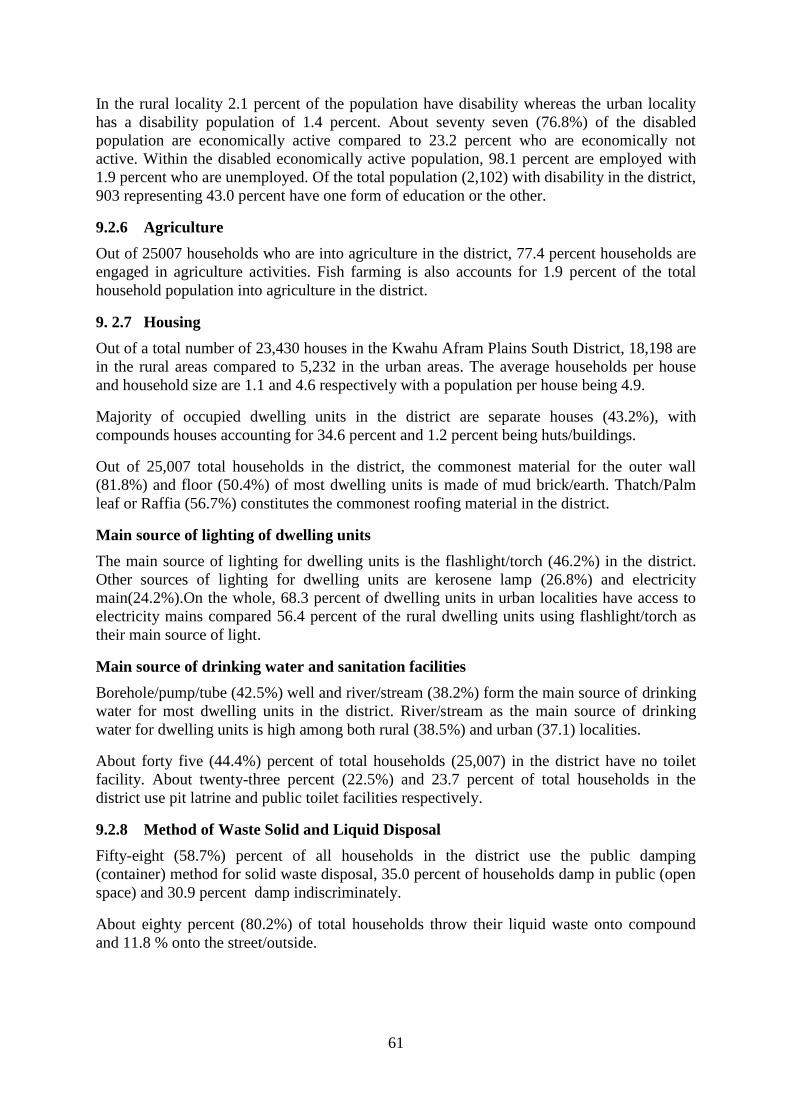
61
In the rural locality 2.1 percent of the population have disability whereas the urban locality
has a disability population of 1.4 percent. About seventy seven (76.8%) of the disabled
population are economically active compared to 23.2 percent who are economically not
active. Within the disabled economically active population, 98.1 percent are employed with
1.9 percent who are unemployed. Of the total population (2,102) with disability in the district,
903 representing 43.0 percent have one form of education or the other.
9.2.6 Agriculture
Out of 25007 households who are into agriculture in the district, 77.4 percent households are
engaged in agriculture activities. Fish farming is also accounts for 1.9 percent of the total
household population into agriculture in the district.
9. 2.7 Housing
Out of a total number of 23,430 houses in the Kwahu Afram Plains South District, 18,198 are
in the rural areas compared to 5,232 in the urban areas. The average households per house
and household size are 1.1 and 4.6 respectively with a population per house being 4.9.
Majority of occupied dwelling units in the district are separate houses (43.2%), with
compounds houses accounting for 34.6 percent and 1.2 percent being huts/buildings.
Out of 25,007 total households in the district, the commonest material for the outer wall
(81.8%) and floor (50.4%) of most dwelling units is made of mud brick/earth. Thatch/Palm
leaf or Raffia (56.7%) constitutes the commonest roofing material in the district.
Main source of lighting of dwelling units
The main source of lighting for dwelling units is the flashlight/torch (46.2%) in the district.
Other sources of lighting for dwelling units are kerosene lamp (26.8%) and electricity
main(24.2%).On the whole, 68.3 percent of dwelling units in urban localities have access to
electricity mains compared 56.4 percent of the rural dwelling units using flashlight/torch as
their main source of light.
Main source of drinking water and sanitation facilities
Borehole/pump/tube (42.5%) well and river/stream (38.2%) form the main source of drinking
water for most dwelling units in the district. River/stream as the main source of drinking
water for dwelling units is high among both rural (38.5%) and urban (37.1) localities.
About forty five (44.4%) percent of total households (25,007) in the district have no toilet
facility. About twenty-three percent (22.5%) and 23.7 percent of total households in the
district use pit latrine and public toilet facilities respectively.
9.2.8 Method of Waste Solid and Liquid Disposal
Fifty-eight (58.7%) percent of all households in the district use the public damping
(container) method for solid waste disposal, 35.0 percent of households damp in public (open
space) and 30.9 percent damp indiscriminately.
About eighty percent (80.2%) of total households throw their liquid waste onto compound
and 11.8 % onto the street/outside.
62
9.3 Recommendations
The characteristics of the population in Kwahu Afram Plains South District as observed at the
2010 Population and Housing Census have implications for the general wellbeing of the
people in the district. These characteristics therefore suggest that policies are required to
manage the population to ensure that its human resource potentials can be fully realized for
the economic progress of the district and the entire nation. The goals of any such policies
must therefore be within the general human development agenda of Ghana.
The pursuit of goals such as generation of employment for the youth can meet the needs of
the youth more appropriately. For instance, the low skill employment among the employed
population who are mostly self-employed with employees must be attended to by
strengthening the Ghana Youth Employment and Entrepreneurial Development Agency
(GYEEDA) to adequately equip participants who excel during their training to be able to
employ others. On the other hand, the higher unemployment levels in the urban population
suggest that serious consideration of adverse conditions in urban areas also receive the
attention of policy makers in the district. In this regards specific categories must be targeted.
The poor sanitation in the District could be curbed through the promotion of integrated waste
management strategies in the District through the development of a comprehensive
Environmental Action Plans that are targeted towards sanitation improvements. It’s further
recommended that the National Commission for Civic Education (NCCE) should educate and
inform the people about their right to basic sanitation as spelt out in the United Nations
declarations concerning individual’s responsibilities towards sanitation.
Infant and maternal mortality are regarded as one of the most powerful indicators of health
and quality of life in the country. To avert such a phenomenon there is the need for a proper
and effective Primary Health Care (PHC) delivery which should be made accessible to all
especially to rural dwellers.
There is a generally low level of education among PWDs which can no longer be overlooked.
It is the suggestion of this report that, the Kwahu Afram Plains South District must make it an
effort to sponsor at least some number of PWDs each year to attain a certain level of
education.
Most households in the district do not have toilet facilities in their dwelling units and as such
resort to other means of convenience to them. Open space defecation could be common in the
district. This practice can pose serious health implications if not checked. The District
Planning and Coordinating Unit and the District Works Department should ensure toilet
facilities are included in building plans before issuing building permit to developers. The
works department should ensure that toilet facilities are actually provided in the buildings
after completion of building. The district assembly should enact by-laws to punish defaulters
In a related development, the district must provide enough solid waste disposal bins to the
communities placed at vantage points that can be easily accessible to all in order to forestall the
status quo.
63
REFERENCES
Ghana National Disability Document, 2000
Ghana Statistical Service, (2009). 2010 Population and Housing Census, Enumerator’s
Manual.
Global Monitoring Report, 2007
Richard Boateng, Published in IFIP, 4 Newsletter, Vol20, no.1, Feb. 2010
Kwahu North District Assembly Medium Term Development Plan
Sonny Yenibey Namouz, January, 2013.
www. Isisghana.com
www.ict.gov.gh
www.ghanaweb.com
www.en.wikipedia.org/water_supply_and_sanitation
www.data.worldbank.org
www.investopedia.com
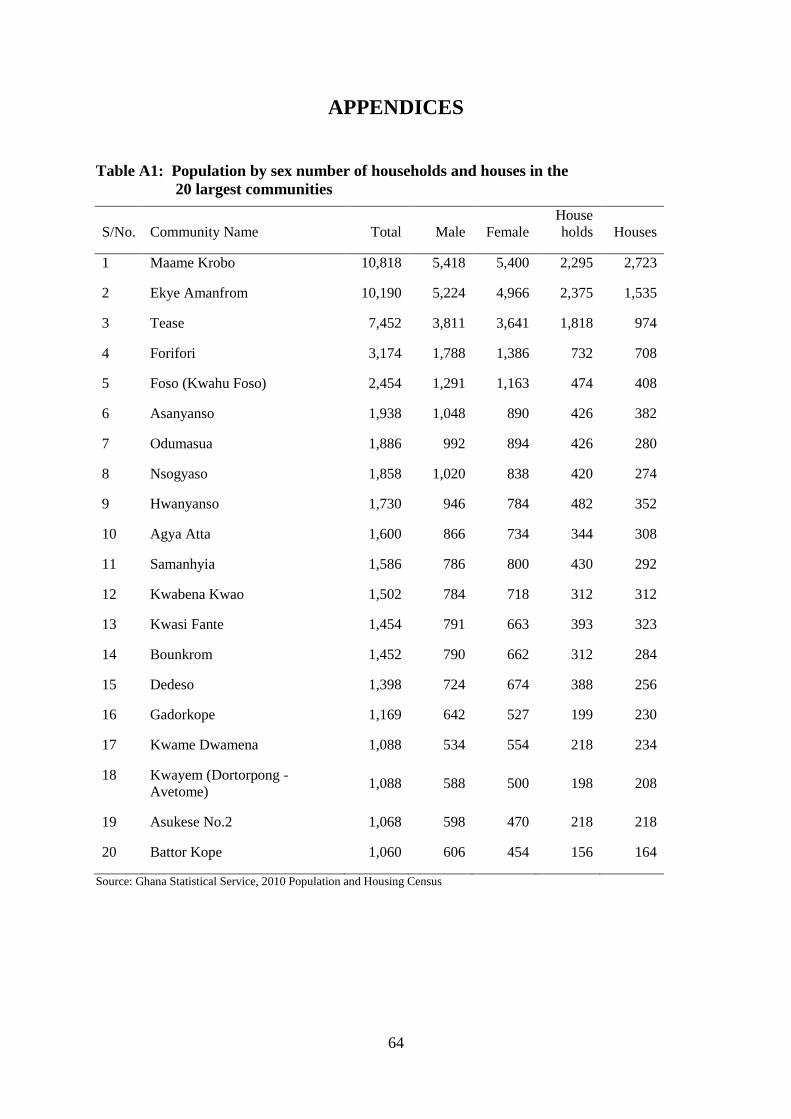
64
APPENDICES
Table A1: Population by sex number of households and houses in the
20 largest communities
S/No. Community Name Total Male Female
House
holds Houses
1 Maame Krobo 10,818 5,418 5,400 2,295 2,723
2 Ekye Amanfrom 10,190 5,224 4,966 2,375 1,535
3 Tease
7,452 3,811 3,641 1,818 974
4 Forifori
3,174 1,788 1,386 732 708
5 Foso (Kwahu Foso) 2,454 1,291 1,163 474 408
6 Asanyanso 1,938 1,048 890 426 382
7 Odumasua 1,886 992 894 426 280
8 Nsogyaso
1,858 1,020 838 420 274
9 Hwanyanso 1,730 946 784 482 352
10 Agya Atta 1,600 866 734 344 308
11 Samanhyia 1,586 786 800 430 292
12 Kwabena Kwao 1,502 784 718 312 312
13 Kwasi Fante 1,454 791 663 393 323
14 Bounkrom 1,452 790 662 312 284
15 Dedeso
1,398 724 674 388 256
16 Gadorkope 1,169 642 527 199 230
17 Kwame Dwamena 1,088 534 554 218 234
18 Kwayem (Dortorpong -
Avetome) 1,088 588 500 198 208
19 Asukese No.2 1,068 598 470 218 218
20 Battor Kope 1,060 606 454 156 164
Source: Ghana Statistical Service, 2010 Population and Housing Census
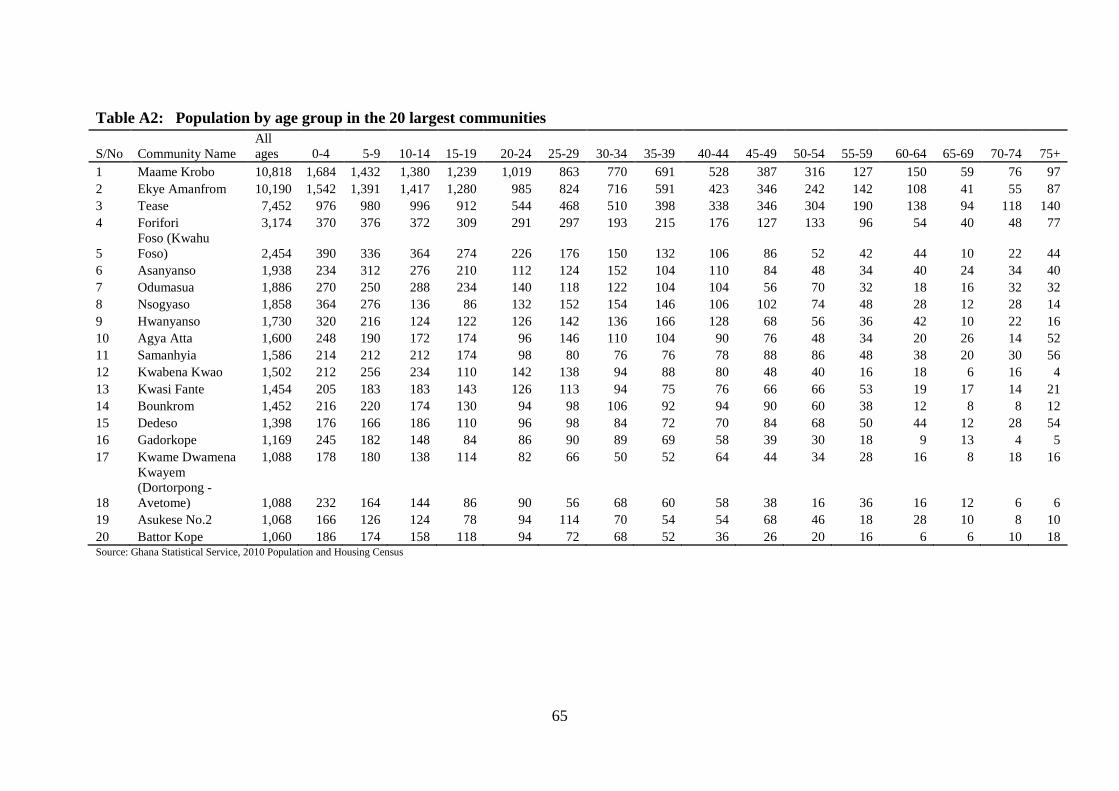
65
Table A2: Population by age group in the 20 largest communities
S/No Community Name
All
ages 0-4 5-9 10-14 15-19 20-24 25-29 30-34 35-39 40-44 45-49 50-54 55-59 60-64 65-69 70-74 75+
1 Maame Krobo 10,818 1,684 1,432 1,380 1,239 1,019 863 770 691 528 387 316 127 150 59 76 97
2 Ekye Amanfrom 10,190 1,542 1,391 1,417 1,280 985 824 716 591 423 346 242 142 108 41 55 87
3 Tease 7,452 976 980 996 912 544 468 510 398 338 346 304 190 138 94 118 140
4 Forifori 3,174 370 376 372 309 291 297 193 215 176 127 133 96 54 40 48 77
5
Foso (Kwahu
Foso) 2,454 390 336 364 274 226 176 150 132 106 86 52 42 44 10 22 44
6 Asanyanso 1,938 234 312 276 210 112 124 152 104 110 84 48 34 40 24 34 40
7 Odumasua 1,886 270 250 288 234 140 118 122 104 104 56 70 32 18 16 32 32
8 Nsogyaso 1,858 364 276 136 86 132 152 154 146 106 102 74 48 28 12 28 14
9 Hwanyanso 1,730 320 216 124 122 126 142 136 166 128 68 56 36 42 10 22 16
10 Agya Atta 1,600 248 190 172 174 96 146 110 104 90 76 48 34 20 26 14 52
11 Samanhyia 1,586 214 212 212 174 98 80 76 76 78 88 86 48 38 20 30 56
12 Kwabena Kwao 1,502 212 256 234 110 142 138 94 88 80 48 40 16 18 6 16 4
13 Kwasi Fante 1,454 205 183 183 143 126 113 94 75 76 66 66 53 19 17 14 21
14 Bounkrom 1,452 216 220 174 130 94 98 106 92 94 90 60 38 12 8 8 12
15 Dedeso 1,398 176 166 186 110 96 98 84 72 70 84 68 50 44 12 28 54
16 Gadorkope 1,169 245 182 148 84 86 90 89 69 58 39 30 18 9 13 4 5
17 Kwame Dwamena 1,088 178 180 138 114 82 66 50 52 64 44 34 28 16 8 18 16
18
Kwayem
(Dortorpong -
Avetome) 1,088 232 164 144 86 90 56 68 60 58 38 16 36 16 12 6 6
19 Asukese No.2 1,068 166 126 124 78 94 114 70 54 54 68 46 18 28 10 8 10
20 Battor Kope 1,060 186 174 158 118 94 72 68 52 36 26 20 16 6 6 10 18 Source: Ghana Statistical Service, 2010 Population and Housing Census
66
LIST OF CONTRIBUTORS
Project Secretariat
Dr. Philomena Nyarko, Government Statistician
Mr. Baah Wadieh, Deputy Government Statistician
Mr. David Yenukwa Kombat, Acting Census Coordinator
Mr. Sylvester Gyamfi, DISDAP Project Coordinator
Mrs. Abena A. Osei-Akoto, Data Processing
Mr. Rochester Appiah Kubi Boateng, Data Processing
Mrs. Jacqueline Anum, Data Processing
Mrs. Samilia Mintah, Data Processing
Mr. Yaw Misefa, Data Processing
Mr. Ernest Enyan, Data Processing
Mr. Kobina Abaka Ansah, Regional Statistician
Mrs. Hanna Frempong Konadu, Formatting/Typesetting
Mrs. Hellen Ayitevie, Formatting/Typesetting
Mrs. Agnes Ananae, Formatting/Typesetting
Writers
Mr. John Abeiku Dennis
Mr. Eugene Kob
Consultant
Dr. Osei-Assibey
Editor/ Reviewers
Prof. John K. Anarfi
Mr. Stephen Amoah
Mr. Kobina Abaka Ansah