Embed Size (px)
Citation preview

It’s different here.2014 Annual Report

It’s different here.2014 Annual Report
Table of Contents
Financial Highlights 4
Letter from the Chairman of the Board 5
Credit Union Highlights 6
Letter from the CEO 7
Board of Directors 8
Management and Supervisory Committee 9
FIGFCU Gives Back 11
Independent Auditor’s Report 15
Statements of Financial Condition 17
Statements of Income 18
Statements of Comprehensive Income 19
Statements of Members’ Equity 20
Statements of Cash Flows 21
Notes to the Financial Statements 23
Financial Highlights 2011-2014
$87,
762,
386
2014
$80,
863,
746
2013
$77,
118,
494
2012
$72,
500,
581
2011
Retained Earnings
$6,8
98,6
40
2014
$3,7
45,2
5220
13
$4,6
17,9
1320
12
$8,4
23,3
1020
11
Net Income
$556
,439
,50
020
14
$517
,060
,869
2013
$481
,127
,580
2012
$472
,678
,960
2011
Total Net Loans
$559
,106
,826
2014
$543
,175
,430
2013
$527
,632
,525
2012
$503
,717
,346
2011
Member Shares
5It’s different here.FARMERS INSURANCE GROUP FEDERAL CREDIT UNION | 2014 Annual Report4
Letter from the ChairmanThe theme for this year’s report, It’s Different Here, is a testament to the Credit Union staff and the Farmers Family that make banking at FIGFCU a unique and rewarding experience. I am proud to say that the Credit Union experienced another successful year in all areas of growth, quality, productivity, and profitability. On behalf of the Board of Directors, I want to thank management and staff for their dedication and service.
The Credit Union achieved gross income of $40,165,000, and net income of $6,898,640. We continued to grow net worth to its highest level in our history, at 13.4% of record-high assets of $653,489,671. As a result, the Credit Union was able to return an extra $1.4 million to members in the form of cash dividends, loan rebates and higher dividend rates. These earnings would normally go back to stockholders at a for-profit institution, but because FIGFCU is not-for-profit, we were able to give it back to our valued members. It’s Different Here.
In addition, the Credit Union achieved its highest Member Service Satisfaction Score ever—members are happy with the service provided in the branch, on the phone and in lending. Our score is a reflection of the dedication Credit Union staff has to ensuring that our members feel valued and appreciated. It’s Different Here.
On behalf of the Board of Directors, I would like to thank you for your membership and support. Our Board is most grateful and appreciative to retiring Director, Ken Carroll, for his service and many contributions over the years. We exist solely to serve our membership and to enhance our members’ financial lives. Share your experiences with family and co-workers. Growth will continue with your active membership. We will never lose sight of that—our commitment is to you, our valued member-owners. It’s Different Here.
Scott LindquistScott Lindquist, Chairman of the Board

Credit Union Highlights 2011-2014
46,7
6820
14
45,2
2020
13
43,9
8220
12
42,6
5320
11
Total Members
$653
,489
,671
2014
$629
,623
,519
2013
$610
,272
,479
2012
$582
,783
,096
2011
Total Assets
92.4
0%20
14
90.6
9%20
13
88.8
4%20
12
85.3
1%20
11
Member Satisfaction
7It’s different here.FARMERS INSURANCE GROUP FEDERAL CREDIT UNION | 2014 Annual Report6
Letter from the CEOFirst things first. I want to thank our members for making our Credit Union so successful. Clearly, our member-owners make FIGFCU go, and grow. 2014 was a great year in myriad ways. Net income was historically strong, and net worth (the reserves we retain for unforeseen economic hardships such as what happened in 2008 – 2010 in the general economy) reached its historic high, of almost $100 million. Our member service satisfaction, as measured in thousands of member surveys sent out every year, was the best ever. We are very proud of the fact that almost 92% of our members think highly of our service.
Our pricing is always highly competitive across the full range of our products and services. But in addition to our excellent “regular” rates, we also returned an extra $1.43 million to you, our active members, last year. We hope to do even better there in 2015. The many productive and rewarding relationships that the Credit Union has with our 47,000 members are testimonies to the clear conclusion that things overall are going well. Very well. So, what are some of FIGFCU’s challenges? First, like every other credit union and bank, we need our members’ help in fighting fraud. One new service we are adding in 2015 is the delivery of your FICO® Scores on your quarterly statement, but you have to opt in for this service. Contact our Call Center or any Branch to sign up. It will cost you nothing. Keeping tabs on your FICO® Score is not only the best way to make sure your credit profile is where it should be, but that also helps us fight fraud if you notice a material change in your score that you weren’t expecting. Change is afoot in our Credit Union. We are now working on our biggest operations project ever, converting our legacy core software to a new and more effective system. You will see some changes after February 2016, such as statement format, and the look and feel of Online Banking, etc., but in terms of how all your accounts operate and interact with other players in the economy, the conversion will be largely transparent. We are all working hard to make it a success. Thank you for allowing us to serve your personal and agency business financial needs. FIGFCU exists to enhance your financial life. We do that by maximizing, not minimizing, the return of economic values to you.
Mark Herter, Chief Executive Officer

Board of Directors
From Top Left to Right
Scott Lindquist, ChairmanExecutive Vice President and Chief Financial Officer
Michael AsheAgent, Las Vegas, NV
Frank CeglarRetired
Danny DavisonDistrict Manager, Portland, OR
Marilyn HuntamerAgent, San Diego, CA
Ed McMahanDistrict Manager, Phoenix, AZ
Andy ReserHead of Sales and Agency Management
Jim SnikerisRetired
Rudy TrevinoChief Compliance Officer, FGI
Management Team
From Top Left to Right
Mark HerterChief Executive Officer
Laura CampbellPresident
Harland BengsChief Financial Officer
Kathy ChicasVice President, Operations
Brian LeonardChief Lending Officer
Yusef MustafaChief Information Officer
Beth RodgersChief Marketing Officer
Supervisory Committee(Not Pictured)
Lewis Williams, ChairmanZFUS Director of IT Finance
Karen JenkinsHead of Distribution Compliance
Katherine P. CodyHead of Distribution, Finance, Analytics and Operations
9FARMERS INSURANCE GROUP FEDERAL CREDIT UNION | 2014 Annual Report8 It’s different here.

11FARMERS INSURANCE GROUP FEDERAL CREDIT UNION | 2014 Annual Report10 It’s different here.
As we approach our 80th year serving the Farmers Family, we look forward to continuing to build better financial futures
for all of our member-owners. Your Credit Union steadily moved forward and grew income, member services, and financial products.
2014 Highlights
� Served 46,768 members
� Achieved a net income of nearly $6.9 million
� Loan portfolio closed year-end at
$565,105,000
� Checking accounts grew nearly 10%
� Savings accounts grew nearly 10%
� Mobile Banking increased users by nearly 115%
� Online Deposit increased enrollment by nearly 70%
FIGFCU Gives Back Last year, your Credit Union gave back more than $1.4 million to you, our members. This took the form of lending promotions including 0% APR for 3 months on Signature Loans, 0% APR for 6 months on Home Equity Lines of Credit, 1% rebate on Commercial Real Estate Loans, up to 2% rebates on Auto Loans and Agency Secured Loans and Lines of Credit, a $300 rebate on Home Loans, and deposit promotions including up to 1.3% APY on 13 Month Term Certificates.
FIGFCU also rewarded Championship Agent members by awarding them with cash bonuses at the Championship Expo in San Antonio, Texas.
Additionally, over 88% of members were eligible for cash back during your Credit Union’s 2014 FIGFCU Gives Back campaign. Eligibility was based on the members’ relationship with FIGFCU. And, we’re proud to say, we gave back over $600,000 in cash to members during this campaign. Based on our strong financial condition, this is the third year in a row we have been able to give cash back to our members.
Based on our strong financial condition, this is the third year in a row we have been able to give cash back to our members.

13FARMERS INSURANCE GROUP FEDERAL CREDIT UNION | 2014 Annual Report12 It’s different here.
You Have More Choices
In 2014, we introduced several new products and services to help keep our members on a healthy financial track.
Credit Rewards � An enhancement to the Credit Card Rewards program
with better redemption options
� Visibility to your rewards balance on monthly statements
DocuSign � A simpler way to submit
documents to us
� Increases the speed of processing applications and forms
Prescription Savings Card � Provides all members a
discount to help save money on prescriptions and over-the-counter medicines as well as stay financially healthy
� Conveniently accepted at over 60,000 pharmacies nationwide
Car Buying Service, powered by TRUECar™ � Provides you with the opportunity to shop online
for your next vehicle with confidence and at your convenience
� Offers exclusive member discounts on vehicles with a network of Certified Dealers for a hassle-free car buying experience
Giving Agents More
As the Farmers Agent model continues to evolve, FIGFCU evolves with it. This year, we launched two new loan products exclusively for Farmers Agents to meet changing demands – the Smart Office Loan, designed to help agents get financing to meet Farmers Smart Office requirements, and the Retail Agent Loan, designed to help new Retail agents get their businesses going.
Going Above and Beyond
Our philosophy of providing value, safety and service to enhance members’ financial lives continues to inspire our daily work and sets FIGFCU apart from other financial institutions.
Today, we propel the personal and financial growth of our members by continually offering products and services that
meet and exceed your ever growing and changing needs. Since we started reporting the Member Service Satisfaction Score in 2011 with a score of 85.31%, we have steadily achieved higher scores year after year. In 2014, we achieved a score of 92.40%, our highest ever.
And that is all because of you, our members, for your continued trust, loyalty and advocacy. We will continue to uphold your financial interests as our utmost priority in 2015 and beyond.
“The personal attention and speed at
which FIGFCU turns around answers,
small business lending decisions,
and account transactions are always
prompt, I’ve never waited longer than
24 hours. There have been times when
issues have arisen or opportunities
come up last minute, and they always
make it happen.”
Chad Geissler,
Farmers Insurance Agent,
Kellogg, ID
“With my recent commercial real estate
loan, the service provided by FIGFCU
far exceeded any expectations I had.
I refinanced my office, as well as my
father’s building, as he was a 50-year
Farmers agent. Our family is proud
to be FIGFCU members and we could
not be happier with their competitive
rates and versatile agent products. As a
proud member, I wish every agent knew
about FIGFCU’s exceptional services.”
E. Bob White II,
Farmers Insurance Agent,
Bakersfield, CA
“As a 20 plus year Farmers agent, I know
how hard it can be to access business
loans for my agency office, as most
financial institutions don’t understand
contract value. The Commercial
Lending Department at FIGFCU was
very easy to deal with. I refinanced
with FIGFCU and was able to pay off
all of my debt. Today, I have a beautiful
building and a growing agency because
of my relationship with FIGFCU and for
that I will be forever thankful. FIGFCU
is the oxygen that fuels my agency.”
Dr. Keith M. Wagner, PhD,
Farmers Insurance Agent,
The Woodlands, TX
“GREAT credit union! Through
FIGFCU’s Give Back program, I’ve
received cash back for just being a
member and I can pay all my bills on
time with auto pay through the FIGFCU
Mobile Banking APP! I don’t have to
worry about a darn thing!”
Tara A.,
FIGFCU Member
“FIGFCU is professional and caring,
and they have the best rates and best
banking products. Been a member over
33 years and have never had a negative
experience. FIGFCU is part of my
financial future.”
Jane O.,
FIGFCU Member
“I absolutely love this credit union.
They have the best member service I’ve
ever experienced. They know who I am
when I walk in and are just great all
around.”
Paul H.,
FIGFCU Member
“Just wanted to say thank you to
FIGFCU and Community Mortgage
Funding (CMF) for helping make my
dream home a reality. They were able
to understand my unique financial
situation as a Farmers Agent and help
me find a mortgage loan that fits my
needs. They were timely, efficient and
great to work with. The loan process
was smooth and I am happy I chose to
do business with them. I definitely will
use them again in the future for any
mortgage needs and will be referring
everyone to them!”
Soutsakhone S.,
FIGFCU Member

INDEPENDENT AUDITOR’S REPORT
March 24, 2015
To the Supervisory Committee ofFarmers Insurance Group Federal Credit Union
We have audited the accompanying financial statements of Farmers Insurance Group Federal CreditUnion, which comprise the statements of financial condition as of December 31, 2014 and 2013, andthe related statements of income, comprehensive income, members’ equity, and cash flows for theyears then ended, and the related notes to the financial statements.
Management’s Responsibility for the Financial Statements
Management is responsible for the preparation and fair presentation of these financial statementsin accordance with accounting principles generally accepted in the United States of America; thisincludes the design, implementation, and maintenance of internal control relevant to the preparationand fair presentation of financial statements that are free from material misstatement, whether dueto fraud or error.
Auditor’s Responsibility
Our responsibility is to express an opinion on these financial statements based on our audits. Weconducted our audits in accordance with auditing standards generally accepted in the United Statesof America. Those standards require that we plan and perform the audits to obtain reasonableassurance about whether the financial statements are free from material misstatement.
An audit involves performing procedures to obtain audit evidence about the amounts and disclosuresin the financial statements. The procedures selected depend on the auditor’s judgment, includingthe assessment of the risks of material misstatement of the financial statements, whether due to fraudor error. In making those risk assessments, the auditor considers internal control relevant to theentity’s preparation and fair presentation of the financial statements in order to design auditprocedures that are appropriate in the circumstances, but not for the purpose of expressing anopinion on the effectiveness of the entity’s internal control. Accordingly, we express no suchopinion. An audit also includes evaluating the appropriateness of accounting policies used and thereasonableness of significant accounting estimates made by management, as well as evaluating theoverall presentation of the financial statements. We believe that the audit evidence we have obtainedis sufficient and appropriate to provide a basis for our audit opinion.
Orth, Chakler, Murnane and Company, CPAsA Professional Association
12060 S. W. 129 Court, Suite 201, Miami, Florida 33186-4582 ! Telephone 305-232-8272 ! Fax 305-232-8388th
Web site: www.ocmcpa.com
Douglas J. Orth, CPA, CFE, Managing Partner James A. Griner, CPA
Hugh S. Chakler, CPA, CISA, CITP, CFE Lori J. Carmichael, CPA
John J. Murnane, CPA Daniel C. Moulton, CPA
Jack D. Kenney, CPA
OCM&CoA PROFESSIONAL ASSOCIATION
CPAS
15FARMERS INSURANCE GROUP FEDERAL CREDIT UNION | 2014 Annual Report14 It’s different here.
Our Community
As a member-owned financial institution, our priority is taking care of our members’ needs first and foremost. While we mainly focus on financial needs, we also have the opportunity to give back in other ways, including donating our time and money to support charitable organizations in our communities. Thanks to the generosity and fundraising efforts of FIGFCU staff and members, in 2014, we gave back over $15,000 to worthy causes, including long-standing traditions of supporting March of Dimes, Children’s Miracle Network Hospitals, and the Farmers Family Fund.
Social Media and You
We also found new ways to connect with our communities in 2014 and get your feedback. Social media, particularly Facebook, provided an important outlet to reach members and non-members and engage in a two-way dialogue. In 2014, we grew our fan base by over 600%.
This impressive growth is due to our members’ desire to engage with us, and members shared this appreciation by posting overwhelmingly positive reviews of their experiences with FIGFCU. Additionally, social media provided an outlet to spread financial literacy and knowledge to the Farmers Family and beyond, building a stronger community.

To the Supervisory Committee ofFarmers Insurance Group Federal Credit UnionPage 2
Opinion
In our opinion, the financial statements referred to above present fairly, in all material respects, the financial position of Farmers Insurance Group Federal Credit Union as of December 31, 2014 and2013, and the results of its operations and its cash flows for the years then ended in accordance withaccounting principles generally accepted in the United States of America.
Orth, Chakler, Murnane & Co.
Orth, Chakler, Murnane & CompanyCertified Public AccountantsMiami, FL
OCM&CoA PROFESSIONAL ASSOCIATION
CPAS
FARMERS INSURANCE GROUP FEDERAL CREDIT UNIONSTATEMENTS OF FINANCIAL CONDITION
ASSETS
As of December 31,2014 2013
Cash $1,976,559 $4,016,722Investments:
Available-for-sale 16,416,769 20,188,811Held-to-maturity 10,955,783 17,375,938Other 50,645,498 50,611,467
Loans to members, net of allowance for loan losses 556,439,500 517,060,869Accrued interest receivable:
Investments 50,135 72,369Loans 2,247,957 2,239,956
Other real estate owned (OREO) 40,119 2,332,721Prepaid and other assets 7,812,536 8,692,073Property and equipment, net 1,516,247 1,718,010NCUSIF deposit 5,388,568 5,314,583
Total assets $653,489,671 $629,623,519
LIABILITIES AND MEMBERS’ EQUITY
As of December 31,2014 2013
LIABILITIES:Members’ shares and deposits $559,106,826 $543,175,430Interest payable 265,064 278,118Accounts payable and accrued liabilities 6,218,798 5,168,027
Total liabilities 565,590,688 548,621,575
Commitments and contingent liabilities
MEMBERS’ EQUITY:
Regular reserve 16,966,743 16,966,743Undivided earnings 70,795,643 63,897,003Accumulated other comprehensive income 136,597 138,198
Total members’ equity 87,898,983 81,001,944
Total liabilities and members’ equity $653,489,671 $629,623,519
The accompanying notes are an integralpart of these financial statements.
3
17FARMERS INSURANCE GROUP FEDERAL CREDIT UNION | 2014 Annual Report16 It’s different here.

FARMERS INSURANCE GROUP FEDERAL CREDIT UNIONSTATEMENTS OF INCOME
For the years ended
December 31, 2014 2013
INTEREST INCOME:Loans to members $31,857,080 $29,232,375Investments 523,554 637,141
Total interest income 32,380,634 29,869,516
INTEREST EXPENSE:Members’ shares and deposits 3,221,612 3,513,481
Net interest income 29,159,022 26,356,035
PROVISION FOR LOAN LOSSES 1,647,123 2,970,773Net interest income after
provision for loan losses 27,511,899 23,385,262
NON-INTEREST INCOME:Overdraft and checking fees 3,338,289 3,306,216Service charges and other fees 2,646,367 2,578,493Interchange income 1,352,579 1,263,418Other 283,150 1,113,593Gain on sale of OREO, net 163,698 65,976
Total non-interest income 7,784,083 8,327,696
35,295,982 31,712,958NON-INTEREST EXPENSE:
Compensation and employee benefits 15,347,429 14,091,760Office operating costs 5,995,070 6,041,151Educational and promotional expense 1,968,742 1,566,283Loan servicing expense 1,697,153 2,222,335Office occupancy 1,357,263 1,354,776Other expenses 1,205,449 1,737,838Professional and outside services 826,236 953,563
Total non-interest expense 28,397,342 27,967,706
Net income $6,898,640 $3,745,252
The accompanying notes are an integralpart of these financial statements.
4
FARMERS INSURANCE GROUP FEDERAL CREDIT UNIONSTATEMENTS OF COMPREHENSIVE INCOME
For the years endedDecember 31,
2014 2013
NET INCOME $6,898,640 $3,745,252
OTHER ITEMS OF COMPREHENSIVE INCOME:Net unrealized loss on investments classified
as available-for-sale (1,601) (60,410)Other comprehensive loss (1,601) (60,410)
Comprehensive income $6,897,039 $3,684,842
The accompanying notes are an integralpart of these financial statements.
5
19FARMERS INSURANCE GROUP FEDERAL CREDIT UNION | 2014 Annual Report18 It’s different here.

FARMERS INSURANCE GROUP FEDERAL CREDIT UNIONSTATEMENTS OF MEMBERS’ EQUITY
For the years ended
December 31, 2014 and 2013
AccumulatedOther
Regular Undivided ComprehensiveReserve Earnings Income/(Loss) Total
Balance,December 31, 2012 $16,966,743 $60,151,751 $198,608 $77,317,102
Net income — 3,745,252 — 3,745,252
Other comprehensiveloss — — (60,410) (60,410)
Balance,December 31, 2013 16,966,743 63,897,003 138,198 81,001,944
Net income — 6,898,640 — 6,898,640
Other comprehensiveloss — — (1,601) (1,601)
Balance,December 31, 2014 $16,966,743 $70,795,643 $136,597 $87,898,983
The accompanying notes are an integralpart of these financial statements.
6
FARMERS INSURANCE GROUP FEDERAL CREDIT UNIONSTATEMENTS OF CASH FLOWS
For the years endedDecember 31,
2014 2013CASH FLOWS FROM OPERATING ACTIVITIES:
Net income $6,898,640 $3,745,252Adjustments:
Provision for loan losses 1,647,123 2,970,773Depreciation and amortization 806,202 966,974Amortization of investment premiums/discounts, net 160,568 196,951Gain on sale of OREO, net (163,698) (65,976)
Changes in operating assets and liabilities:Accrued interest receivable 14,233 101,331Prepaid and other assets 879,537 (1,837,974)Interest payable (13,054) (25,518)Accounts payable and accrued liabilities 1,050,771 148,811
Net cash provided by operating activities 11,280,322 6,200,624
CASH FLOWS FROM INVESTING ACTIVITIES:Proceeds from maturities and repayments
of available-for-sale investments 3,770,441 4,732,269Proceeds from maturities of held-to-maturity
investments 9,413,000 4,362,000Purchase of held-to-maturity investments (3,153,413) (4,753,424)Net change in other investments (34,031) 15,503,506Net change in loans, net of charge-offs (41,561,657) (40,680,300)Recoveries on loans charged off 345,384 376,905Proceeds from sale of OREO 2,646,819 1,571,098Expenditures for property and equipment (604,439) (940,354)Change in NCUSIF deposit (73,985) (159,776)Net cash used in investing activities (29,251,881) (19,988,076)
CASH FLOWS FROM FINANCING ACTIVITIES:Net change in members’ shares and
deposits 15,931,396 15,542,905Net cash provided by financing activities 15,931,396 15,542,905
Net change in cash (2,040,163) 1,755,453
Cash at beginning of year 4,016,722 2,261,269
Cash at end of year $1,976,559 $4,016,722
The accompanying notes are an integralpart of these financial statements.
7
21FARMERS INSURANCE GROUP FEDERAL CREDIT UNION | 2014 Annual Report20 It’s different here.

FARMERS INSURANCE GROUP FEDERAL CREDIT UNIONSTATEMENTS OF CASH FLOWS
Cash Flows: (continued)
For the years endedDecember 31,
2014 2013 SUPPLEMENTAL CASH FLOW DISCLOSURES:
Interest paid $3,234,666 $3,538,999
SCHEDULE OF NON-CASH TRANSACTIONS:
Other comprehensive loss ($1,601) ($60,410)
Transfer from loans to members to OREO $190,519 $1,399,333
The accompanying notes are an integralpart of these financial statements.
8
FARMERS INSURANCE GROUP FEDERAL CREDIT UNIONNOTES TO THE FINANCIAL STATEMENTS
NOTE 1: SIGNIFICANT ACCOUNTINGPOLICIES
ORGANIZATION
Farmers Insurance Group Federal Credit Union (the Credit Union), is a cooperative associationorganized in accordance with the provisions of the Federal Credit Union Act for the purpose ofpromoting thrift among, and creating a source of credit for, its members. Participation in the CreditUnion is limited to those who qualify for membership. The field of membership is defined by theCredit Union’s Charter and Bylaws.
FINANCIAL STATEMENTS/USE OF ESTIMATES
The preparation of financial statements in conformity with accounting principles generally acceptedin the United States of America requires management to make estimates and assumptions that affectthe reported amounts of assets and liabilities and the disclosure of contingent assets and liabilitiesas of the dates of the financial statements and the reported amounts of revenues and expenses forthe periods then ended. Actual results could differ from those estimates. Estimates that areparticularly susceptible to change relate to the determination of the allowance for loan losses andthe fair value of financial instruments. The significant accounting principles and policies used inthe preparation of these financial statements, together with certain related information, aresummarized below.
CASH
Cash includes cash on hand and amounts due from banks and credit unions. Amounts due frombanks and credit unions may, at times, exceed federally insured limits.
INVESTMENTS
Investments are classified into the following categories: available-for-sale, held-to-maturity andother. Investment securities classified as available-for-sale are measured at fair value as of thestatement of financial condition date. Unrealized gains and losses on available-for-sale investmentsare reported as a separate component of members' equity. Investment securities classified as held-to-maturity are measured at amortized cost. This classification is based upon the Credit Union'sintent and ability to hold these investment securities to full maturity. Realized gains and losses ondisposition, if any, are computed using the specific identification method. Investments are adjustedfor the amortization of premiums and accretion of discounts as an adjustment to interest income oninvestments over the term of the investment by a method which approximates the interest method. The Credit Union has elected to classify certain cash equivalents as other investments. This electionis available to the Credit Union according to the terms of the Statement of Cash Flows Topic of theFinancial Accounting Standards Board (FASB) Accounting Standards Codification (ASC).
9
23FARMERS INSURANCE GROUP FEDERAL CREDIT UNION | 2014 Annual Report22 It’s different here.

FARMERS INSURANCE GROUP FEDERAL CREDIT UNIONNOTES TO THE FINANCIAL STATEMENTS
Note 1: (continued)
LOANS TO MEMBERS AND ALLOWANCE FOR LOAN LOSSES
Loans to members are stated at the amount of unpaid principal net of deferred loan origination feesand costs and an allowance for loan losses (ALL). The ALL is increased by a provision for loanlosses charged to expense and decreased by charge-offs (net of recoveries). The ALL is maintainedat a level considered adequate to provide for optimal loss coverage for the entire loan portfolio overthe next twelve months. Individually significant, non-homogeneous loans are measured forimpairment in accordance with the Subsequent Measurement of Receivables Topic of the FASBASC. These loans are evaluated individually based on an examination of the current financialinformation of the borrower and an estimate of the value of the collateral, if any. If the carryingvalue of any of these loans is greater than the estimated net realizable value of the property or of thecollateral securing these loans, a reserve is established for the difference. Management’s periodicevaluation of the adequacy of the ALL also considers such factors as changes in the nature andvolume of the loan portfolio, review of specific problem loans, and current economic conditions thatmay affect the borrower’s ability to repay.
Interest on loans to members is recognized over the terms of the loans and is calculated on principalamounts outstanding. The accrual of interest is discontinued when a loan reaches 90 days delinquentor when management believes that collection of interest is doubtful. Loan fees and direct loanorigination costs are deferred and the net fee or cost is recognized as an adjustment to interestincome on loans using a method that approximates the interest method over the estimated life of theloans.
ALL METHODOLOGY
Management has an established methodology to determine the adequacy of the ALL that assessesthe risks and losses inherent in the entire loan portfolio. For the purpose of determining the ALLdisclosures, the Credit Union has segmented loans in the portfolio by product type. Loans aredivided into the following segments: Consumer, Residential Real Estate, and Commercial. TheCredit Union further disaggregates these segments into classes based on the associated risks withinthose segments.
Consumer loans are divided into four classes: Other secured, Unsecured, New auto, and Used auto. Residential real estate loans are divided into three classes: First mortgage, Second mortgage, andHome equity line of credit (HELOC). Commercial loans are all classified as real estate. Each classof loans requires significant judgment to determine the estimation method that fits the credit riskcharacteristics of its portfolio segment. The Credit Union uses both internally developed and vendorsupplied models in the process. The vendor model is supplied by P360, Inc. The P360, Inc. modelprovides meaningful insights into the portfolio’s risk composition, as dictated by the intrinsic valueand other relevant market data. The model is specifically designed to calculate the risk of the loanportfolio on an individual loan level basis to provide optimal loss coverage analysis over the next12 months.
10
FARMERS INSURANCE GROUP FEDERAL CREDIT UNIONNOTES TO THE FINANCIAL STATEMENTS
Note 1: (continued)
Management must use judgment in establishing additional input metrics for the modeling processes. The models and assumptions used to determine the ALL are independently validated and reviewedto ensure that their theoretical foundation, assumptions, data integrity, computational processes,reporting practices, and end-user controls are appropriate and properly documented. The followingis how management determines the balance of the ALL for each segment or class of loans.
CONSUMER PORTFOLIO SEGMENT ALL METHODOLOGY
For consumer loans, the Credit Union determines the ALL on a collective basis utilizing historicaland forecasted losses to represent the best estimate of inherent losses at the measurement date. Loans are pooled, generally by loan types with similar risk characteristics. The Credit Unionidentifies consumer loans that underwent a troubled debt restructuring and evaluates these loans onan individual basis. In addition, the ALL model incorporates numerous other historical factorsbased upon the borrower, collateral type, loan performance, environment, and economy. Thesehistorical factors used in the analysis date back to 2001.
As appropriate, to achieve greater accuracy, further stratification of a selected portfolio may occursuch as by year of origination, geographic location and other predictive characteristics. Theconsumer ALL model primarily uses historical delinquency and default experience. Informationon forecasted delinquency analysis, member credit score trends, unemployment trends, industrytrends and other key economic variables that may influence the frequency and severity of losses foreach class of loan within the consumer segment may also be considered.
The Credit Union’s consumer loan portfolio also includes loans collateralized by contract value.These are considered fully secured unless notified otherwise, as these loans, when written withinthe guidelines established by Farmers Insurance Group Inc. (Farmers), are secured and will be paidin full by Farmers upon member termination if the Credit Union’s collection efforts were toultimately fail. Similarly, loans collateralized by a certificate or share account are also consideredfully secured unless otherwise notified.
RESIDENTIAL REAL ESTATE PORTFOLIO SEGMENT ALL METHODOLOGY
For residential real estate loans not identified as impaired, the Credit Union determines the ALL ona collective basis, utilizing various economic and financial simulations in order to determine the bestestimate of inherent losses at the measurement date. Loans are pooled, generally by loan types withsimilar risk characteristics. In addition, the ALL model incorporates numerous other historicalfactors based upon the borrower, collateral type, loan performance, environment, and economy. These historical factors used in the analysis date back to 2001.
As appropriate, to achieve greater accuracy, further stratification of a selected portfolio may occursuch as by year of origination, geographic location and other predictive characteristics. Informationon member credit score trends, combined loan to value ratios, home price trends, unemploymenttrends, industry trends, and other key economic variables that may influence the frequency andseverity of losses for each class of loan within the residential real estate segment may also beconsidered. The residential real estate ALL also includes an amount for the estimated losses onindividually evaluated impaired loans.
11
25FARMERS INSURANCE GROUP FEDERAL CREDIT UNION | 2014 Annual Report24 It’s different here.

FARMERS INSURANCE GROUP FEDERAL CREDIT UNIONNOTES TO THE FINANCIAL STATEMENTS
Note 1: (continued)
Additionally, a mortgage sample analysis is performed periodically to assess the potential lossexposure within the residential real estate loan portfolio. The Credit Union obtains updated propertyvalues on all existing real estate loans in its portfolio. Using a sample of loans, the Credit Unionperforms individual reviews to assess the potential loss exposure based on various risk factorsincluding combined loan to value, member credit score, delinquency, loan vintage, and type ofcollateral. Results of the sample analysis are extrapolated to the total population to assess theadequacy of the ALL.
COMMERCIAL PORTFOLIO SEGMENT ALL METHODOLOGY
For commercial loans not identified as impaired, the Credit Union determines the ALL on acollective basis utilizing historical and forecasted losses to represent the best estimate of inherentlosses at the measurement date. In addition, the ALL model incorporates numerous other historicalfactors based upon the borrower, collateral type, loan performance, environment, and economy. These historical factors used in the analysis date back to 2001.
Loss estimates for the commercial loan portfolio segment may be adjusted as appropriate based oncredit risk assessment and management's analysis of leading predictors of losses, as well asadditional analysis of long-term average loss experience compared to previously forecasted losses,external loss data, or other risks identified from current economic conditions and credit qualitytrends. The commercial ALL may also include an additional ALL for individually evaluated highrisk loans and an amount for the estimated losses on individually evaluated impaired loans.
LOAN CHARGE-OFF POLICIES
The Credit Union’s quality control process includes preparing lists to monitor and track delinquentand special mention loans. Tracking loans on these lists enables management to assess theperformance of the loan portfolio and act to mitigate risk therein through necessary changes inpolicy and procedures. The quality control process also serves as a tool to assist the Credit Unionin identifying loans for charge-off on a timely basis. The following is a description of the CreditUnion’s loan charge-off policies:
Consumer, residential real estate, and commercial loans are generally charged-off when the loan isdeemed to be uncollectible. A loan is deemed uncollectible when:
! the member has gained relief through bankruptcy;
! the loan is a deficiency balance from the sale of collateral and the borrower hasindicated an unwillingness to make further payments;
! the borrower is determined to be a “skip”;
! the member is deceased, collateral has been liquidated and there is no co-maker orestate to pursue for payment;
! the loan is 180 days or more delinquent, unless one of the following conditionsexists:
12
FARMERS INSURANCE GROUP FEDERAL CREDIT UNIONNOTES TO THE FINANCIAL STATEMENTS
Note 1: (continued)
� the borrower is making monthly payments but cannot qualify forrefinancing or re-aging;
� the Credit Union or the member is waiting for settlement of adocumented insurance/bond claim;
� the borrower is deceased, and the Credit Union has substantial reasonto expect settlement from the estate, co-makers, or relatives;
� the Credit Union is waiting for the proceeds from the sale ofrepossessed collateral.
Uncollectible loans to be charged off to the ALL are approved by the Board of Directors eachmonth. For repossessed collateral, including foreclosed property, the loan is charged off to the ALLand the net realizable value moved to other assets.
OTHER REAL ESTATE OWNED (OREO)Assets acquired through, or in lieu of, loan foreclosure or repossession are held for sale and areinitially recorded at fair value at the date of foreclosure or repossession, establishing a new costbasis. Subsequent to foreclosure or repossession, valuations are periodically performed bymanagement and the assets are carried at the lower of carrying amount or fair value less estimatedcosts to sell.
PROPERTY AND EQUIPMENT
Property and equipment are carried at cost less accumulated depreciation. Furniture and equipmentare depreciated using the straight-line method over the estimated useful lives of the assets. The costof leasehold improvements is amortized using the straight-line method over the term of the lease,or the estimated life of the asset, whichever is less. The Credit Union reviews property andequipment (long-lived assets) for impairment whenever events or changes in circumstances indicatethat the carrying amount may not be recoverable.
NCUSIF DEPOSIT
The deposit in the National Credit Union Share Insurance Fund (NCUSIF) is in accordance withNational Credit Union Administration (NCUA) regulations, which require the maintenance of adeposit by each insured credit union. The deposit would be refunded to the Credit Union if itsinsurance coverage is terminated, it converts to insurance coverage from another source, or theoperations of the fund are transferred from the NCUA Board.
MEMBERS’ SHARES AND DEPOSITS
Members’ shares are subordinated to all other liabilities of the Credit Union upon liquidation. Interest on members’ shares and deposits is based on available earnings at the end of an interestperiod and is not guaranteed by the Credit Union. Interest rates on members’ share accounts are setby the Board of Directors, based on an evaluation of current and future market conditions.
13
27FARMERS INSURANCE GROUP FEDERAL CREDIT UNION | 2014 Annual Report26 It’s different here.
FARMERS INSURANCE GROUP FEDERAL CREDIT UNIONNOTES TO THE FINANCIAL STATEMENTS
Note 1: (continued)
REGULAR RESERVE
The Credit Union is required to maintain a statutory reserve (regular reserve) in accordance with theFederal Credit Union Act. This statutory reserve represents a regulatory restriction and is notavailable for the payment of interest.
FEDERAL AND STATE TAX EXEMPTION
The Credit Union is exempt from most federal, state, and local taxes under the provisions of theInternal Revenue Code and state tax laws. The Income Taxes Topic of the FASB ASC clarifiesaccounting for uncertainty in income taxes reported in the financial statements. The interpretationprovides criteria for assessment of individual tax positions and a process for recognition andmeasurement of uncertain tax positions. Tax positions are evaluated on whether they meet the“more likely than not” standard for sustainability on examination by tax authorities. Federal creditunions are tax-exempt under Internal Revenue Code sections 501(c)(1)(a)(I) and 501(c)(14)(A). Assuch, the Credit Union has no uncertain tax positions that qualify for either recognition or disclosurein the financial statements. Additionally, no interest or penalties have been recorded in theaccompanying financial statements related to uncertain tax positions.
RECLASSIFICATIONS
Certain 2013 financial statement amounts have been reclassified to conform with classificationsadopted in 2014.
SUBSEQUENT EVENTS
Management has evaluated subsequent events through March 24, 2015, the date the financialstatements were available to be issued. Management has not identified any items requiringrecognition or disclosure.
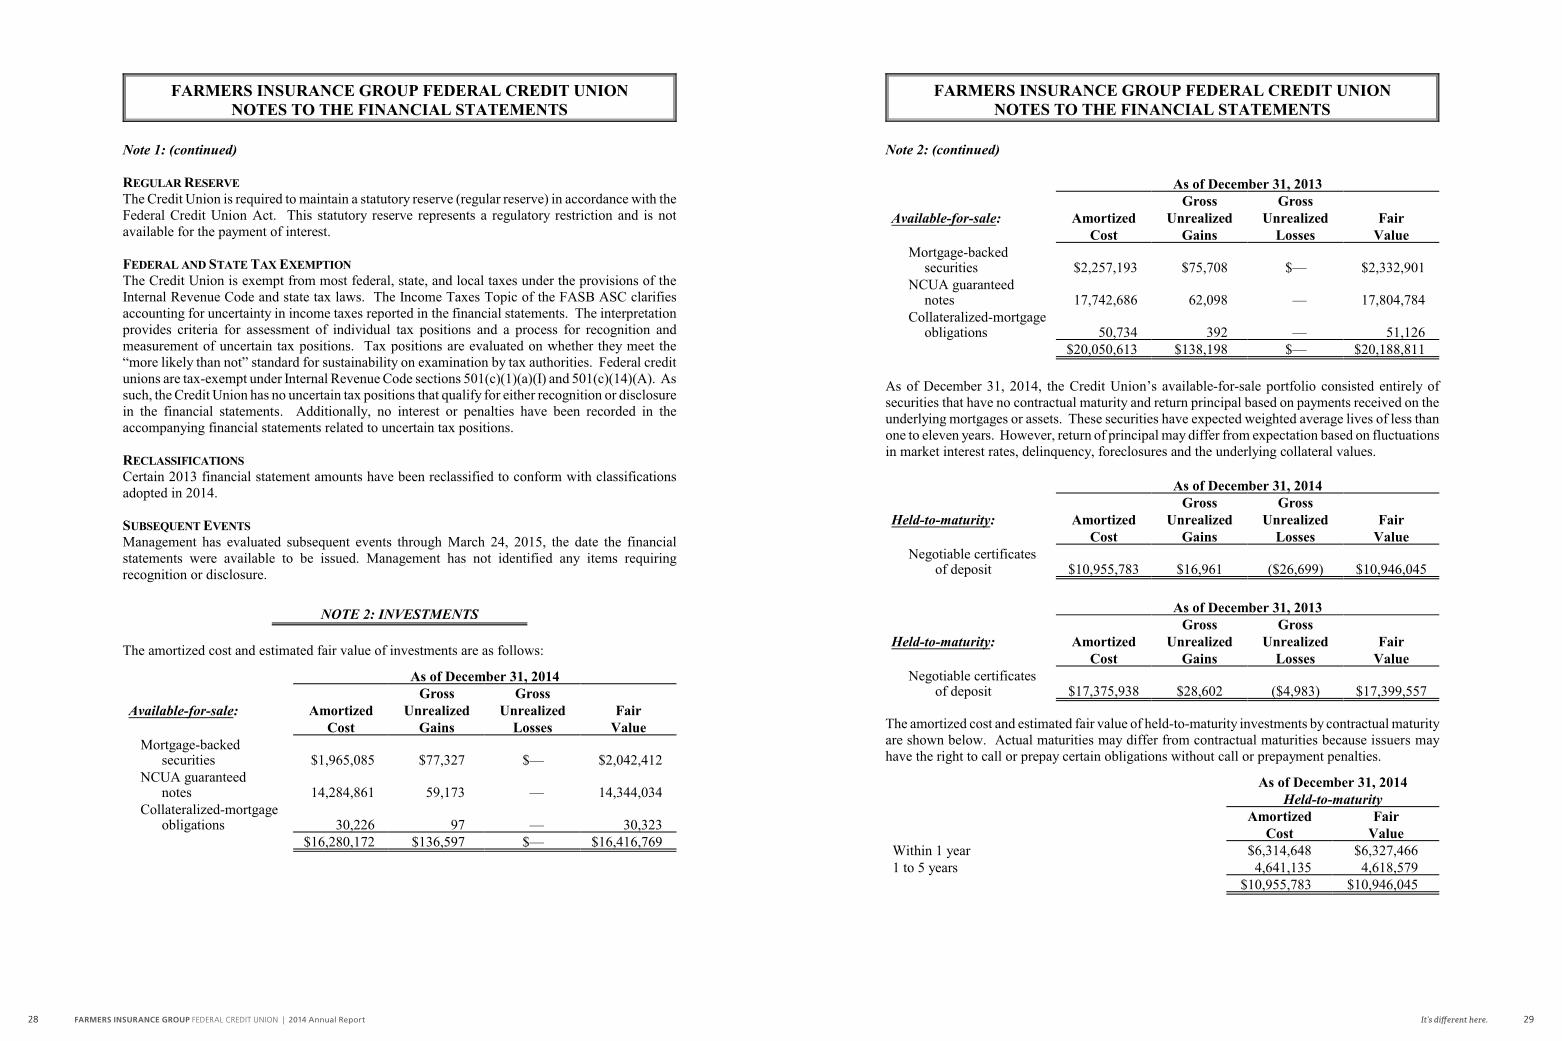
NOTE 2: INVESTMENTS
The amortized cost and estimated fair value of investments are as follows:
As of December 31, 2014Gross Gross
Available-for-sale: Amortized Unrealized Unrealized FairCost Gains Losses Value
Mortgage-backed securities $1,965,085 $77,327 $— $2,042,412
NCUA guaranteednotes 14,284,861 59,173 — 14,344,034
Collateralized-mortgageobligations 30,226 97 — 30,323
$16,280,172 $136,597 $— $16,416,769
14
FARMERS INSURANCE GROUP FEDERAL CREDIT UNIONNOTES TO THE FINANCIAL STATEMENTS
Note 2: (continued)
As of December 31, 2013Gross Gross
Available-for-sale: Amortized Unrealized Unrealized FairCost Gains Losses Value
Mortgage-backed securities $2,257,193 $75,708 $— $2,332,901
NCUA guaranteednotes 17,742,686 62,098 — 17,804,784
Collateralized-mortgageobligations 50,734 392 — 51,126
$20,050,613 $138,198 $— $20,188,811
As of December 31, 2014, the Credit Union’s available-for-sale portfolio consisted entirely ofsecurities that have no contractual maturity and return principal based on payments received on theunderlying mortgages or assets. These securities have expected weighted average lives of less thanone to eleven years. However, return of principal may differ from expectation based on fluctuationsin market interest rates, delinquency, foreclosures and the underlying collateral values.
As of December 31, 2014Gross Gross
Held-to-maturity: Amortized Unrealized Unrealized FairCost Gains Losses Value
Negotiable certificatesof deposit $10,955,783 $16,961 ($26,699) $10,946,045
As of December 31, 2013Gross Gross
Held-to-maturity: Amortized Unrealized Unrealized FairCost Gains Losses Value
Negotiable certificates of deposit $17,375,938 $28,602 ($4,983) $17,399,557
The amortized cost and estimated fair value of held-to-maturity investments by contractual maturityare shown below. Actual maturities may differ from contractual maturities because issuers mayhave the right to call or prepay certain obligations without call or prepayment penalties.
As of December 31, 2014Held-to-maturity
Amortized FairCost Value
Within 1 year $6,314,648 $6,327,4661 to 5 years 4,641,135 4,618,579
$10,955,783 $10,946,045
15
29FARMERS INSURANCE GROUP FEDERAL CREDIT UNION | 2014 Annual Report28 It’s different here.

FARMERS INSURANCE GROUP FEDERAL CREDIT UNIONNOTES TO THE FINANCIAL STATEMENTS
Note 2: (continued)
Other investments: As of December 31,2014 2013
Federal Reserve Bank $30,876,344 $8,157,341Certificates of deposit 12,886,000 33,458,000Corporate credit union deposits 3,883,154 5,996,126CUSO investments 3,000,000 3,000,000
$50,645,498 $50,611,467
The Credit Union maintains deposits at corporate credit unions and banks which normally exceedfederally insured limits. Included in these deposits are uninsured perpetual contributed capitalshares with Catalyst Corporate Federal Credit Union (CCFCU). Perpetual contributed capital isuninsured, has no maturity and cannot be withdrawn without NCUA approval; however, it isrequired to be a member of CCFCU. Perpetual contributed capital can be used by CCFCU to absorbany operating losses that exceed the balance of retained earnings. As of December 31, 2014 and2013, the Credit Union maintained approximately $600,000 in perpetual contributed capital sharesat CCFCU.
The following tables show the gross unrealized losses and fair value of investments, aggregated bylength of time individual securities have been in a continuous unrealized loss position.
As of December 31, 2014
Held-to-maturity
Less than 12 Months 12 Months or Longer Total
Gross Gross Gross
Fair Unrealized Fair Unrealized Fair Unrealized
Value Losses Value Losses Value Losses
Negotiable certificatesof deposit $3,323,301 ($26,699) $— $— $3,323,301 ($26,699)
As of December 31, 2013
Held-to-maturity
Less than 12 Months 12 Months or Longer Total
Gross Gross Gross
Fair Unrealized Fair Unrealized Fair Unrealized
Value Losses Value Losses Value Losses
Negotiable certificatesof deposit $3,708,109 ($4,983) $— $— $3,708,109 ($4,983)
Unrealized losses on negotiable certificates of deposit have not been recognized into income becausethe principal balances of these deposits are guaranteed by the Federal Deposit InsuranceCorporation. Additionally, management has the ability and intent to hold these securities throughto recovery of fair value, which may be maturity.
16
FARMERS INSURANCE GROUP FEDERAL CREDIT UNIONNOTES TO THE FINANCIAL STATEMENTS
NOTE 3: LOANS TO MEMBERS
The composition of loans to members is as follows:
As of December 31,
2014 2013Consumer:
Other secured $174,310,451 $180,107,879Unsecured 105,167,654 90,192,947New auto 31,297,712 24,829,854Used auto 40,846,941 43,434,873
Total consumer 351,622,758 338,565,553Residential Real Estate:
First mortgage 89,923,911 88,234,782Second mortgage 10,922,464 10,550,458HELOC 18,569,234 12,394,825
Total residential real estate 119,415,609 111,180,065Commercial:
Real estate 94,197,579 78,184,494Total loans 565,235,946 527,930,112
Deferred loan origination fees/costs, net (130,868) (238,810)565,105,078 527,691,302
Less ALL (8,665,578) (10,630,433)$556,439,500 $517,060,869
A summary of the activity in the ALL by portfolio segment is as follows:
For the years ended
December 31, 2014 and 2013
ConsumerResidentialReal Estate Commercial Total
Balance,
December 31, 2012 $2,129,224 $3,374,775 $5,187,859 $10,691,858
Provision for loan losses 2,736,676 (809,037) 1,043,134 2,970,773
Recoveries 280,950 95,955 — 376,905
Loans charged off (2,226,050) (331,199) (851,854) (3,409,103)
Balance,
December 31, 2013 2,920,800 2,330,494 5,379,139 10,630,433
Provision for loan losses 2,538,952 (260,263) (631,566) 1,647,123
Recoveries 244,826 91,558 9,000 345,384
Loans charged off (2,312,241) (242,315) (1,402,806) (3,957,362)
Balance,
December 31, 2014 $3,392,337 $1,919,474 $3,353,767 $8,665,578
17
31FARMERS INSURANCE GROUP FEDERAL CREDIT UNION | 2014 Annual Report30 It’s different here.

FARMERS INSURANCE GROUP FEDERAL CREDIT UNIONNOTES TO THE FINANCIAL STATEMENTS
Note 3: (continued)
As of December 31, 2014
ConsumerResidentialReal Estate Commercial Total
Ending balance $3,392,337 $1,919,474 $3,353,767 $8,665,578
Individually evaluated for impairment $57,637 $1,527,514 $3,128,662 $4,713,813
Collectively evaluated for impairment $3,334,700 $391,960 $225,105 $3,951,765
As of December 31, 2013
ConsumerResidentialReal Estate Commercial Total
Ending balance $2,920,800 $2,330,494 $5,379,139 $10,630,433
Individually evaluated for impairment $38,960 $1,725,707 $5,168,766 $6,933,433
Collectively evaluated for impairment $2,881,840 $604,787 $210,373 $3,697,000
A summary of the recorded investment in loans, by portfolio segment, is as follows:
As of December 31, 2014
ConsumerResidentialReal Estate Commercial Total
Ending balance $351,665,487 $119,338,264 $94,101,327 $565,105,078
Individually evaluated for impairment $362,052 $8,801,245 $8,304,160 $17,467,457
Collectively evaluated for impairment $351,303,435 $110,537,019 $85,797,167 $547,637,621
As of December 31, 2013
ConsumerResidentialReal Estate Commercial Total
Ending balance $338,602,395 $111,112,537 $77,976,370 $527,691,302
Individually evaluated for impairment $383,064 $9,305,021 $15,672,728 $25,360,813
Collectively evaluated for impairment $338,219,331 $101,807,516 $62,303,642 $502,330,489
IMPAIRED LOANS
A loan is impaired when it is probable, based on current information and events, that the CreditUnion will be unable to collect all contractual principal and interest payments due in accordancewith the terms of the loan agreement. When management identifies a loan as impaired, theimpairment is measured based on the present value of expected future cash flows, discounted at theloan’s effective interest rate, except when the sole (remaining) source of repayment for the loan isthe operation or liquidation of the collateral. In these cases, management uses the current fair valueof the collateral, less selling costs, when foreclosure is probable, instead of discounted cash flows.
18
FARMERS INSURANCE GROUP FEDERAL CREDIT UNIONNOTES TO THE FINANCIAL STATEMENTS
Note 3: (continued)
The following tables include the recorded investment and unpaid principal balances for impairedloans with the associated ALL amount, if applicable. Also presented are the average recordedinvestments in the loans and the related amount of interest recognized during the time within theperiod that the loans were individually evaluated for impairment. Interest is credited to interestincome when received, under the cash basis method. The average balances are calculated based onthe year-end balances of the loans of the period reported.
Payments received on impaired loans are recorded as a reduction of principal or as interest incomedepending on management’s assessment of the ultimate collectability of the loan principal.Generally, interest income on an impaired loan is recorded on a cash basis when the outstandingprincipal is brought current. Interest income recorded on impaired loans for all periods presentedwas recorded on a cash basis.
The tables below summarize key information for impaired loans:
As of December 31, 2014For the year endedDecember 31, 2014
RecordedInvestment
UnpaidPrincipalBalance
SpecificAllowance
AverageRecorded
Investment
InterestIncome
Recognized
With no allowance recorded:
Residential Real EstateHELOC $49,938 $49,635 $— $49,635 $1,980
With an allowance recorded:
Consumer:Other secured $138,580 $138,580 $1,813 $109,711 $5,091
Unsecured $134,029 $134,029 $16,163 $181,390 $16,325
New auto $13,006 $13,006 $11,546 $11,094 $200
Used auto $76,437 $76,437 $28,115 $70,363 $2,287
Residential Real EstateFirst mortgage $8,646,574 $8,664,953 $1,520,703 $8,891,229 $356,272
Second mortgage $104,733 $104,733 $6,811 $136,935 $8,887
Commercial:Real estate $8,304,160 $8,325,336 $3,128,662 $11,988,444 $570,861
Totals:Consumer $362,052 $362,052 $57,637 $372,558 $23,903
Residential Real Estate $8,801,245 $8,819,321 $1,527,514 $9,077,799 $367,139
Commercial $8,304,160 $8,325,336 $3,128,662 $11,988,444 $570,861
19
33FARMERS INSURANCE GROUP FEDERAL CREDIT UNION | 2014 Annual Report32 It’s different here.

FARMERS INSURANCE GROUP FEDERAL CREDIT UNIONNOTES TO THE FINANCIAL STATEMENTS
Note 3: (continued)
As of December 31, 2013For the year endedDecember 31, 2013
RecordedInvestment
UnpaidPrincipalBalance
SpecificAllowance
AverageRecorded
Investment
InterestIncome
Recognized
With an allowance recorded:
Consumer:Other secured $80,841 $80,841 $899 $129,008 $10,040
Unsecured $228,751 $228,751 $32,984 $217,567 $25,379
New auto $9,182 $9,182 $453 $9,414 $333
Used auto $64,290 $64,290 $4,624 $63,566 $3,240
Residential Real EstateFirst mortgage $9,135,884 $9,167,204 $1,659,240 $8,831,838 $391,027
Second mortgage $169,137 $169,137 $66,467 $173,855 $11,840
Commercial:Real estate $15,672,728 $15,948,471 $5,168,766 $16,215,476 $850,888
Totals:Consumer $383,064 $383,064 $38,960 $419,555 $38,992
Residential Real Estate $9,305,021 $9,336,341 $1,725,707 $9,005,693 $402,867
Commercial $15,672,728 $15,948,471 $5,168,766 $16,215,476 $850,888
The tables below provide an age analysis of past due loans by class:
As of December 31, 2014
TotalDelinquent
LoansTotal Current
LoansTotal Loans
Days Delinquent
30 - 59 60 - 89 90 or more
Consumer:
Other secured $16,596 $14,388 $126,080 $157,064 $174,153,387 $174,310,451
Unsecured 1,229,970 466,236 585,303 2,281,509 102,928,874 105,210,383
New auto 222,106 24,409 58,070 304,585 30,993,127 31,297,712
Used auto 431,971 140,027 144,029 716,027 40,130,914 40,846,941
Total 1,900,643 645,060 913,482 3,459,185 348,206,302 351,665,487
Residential Real Estate:
First mortgage 318,219 375,723 504,994 1,198,936 88,534,235 89,733,171
Second mortgage 179,024 14,667 26,833 220,524 10,701,940 10,922,464
HELOC 446,787 98,060 2,107 546,954 18,135,675 18,682,629
Total 944,030 488,450 533,934 1,966,414 117,371,850 119,338,264
Commercial:
Real estate 3,001 101,107 785,217 889,325 93,212,002 94,101,327
Total 3,001 101,107 785,217 889,325 93,212,002 94,101,327
Grand Total $2,847,674 $1,234,617 $2,232,633 $6,314,924 $558,790,154 $565,105,078
20
FARMERS INSURANCE GROUP FEDERAL CREDIT UNIONNOTES TO THE FINANCIAL STATEMENTS
Note 3: (continued)
As of December 31, 2013
TotalDelinquent
LoansTotal Current
LoansTotal Loans
Days Delinquent
30 - 59 60 - 89 90 or more
Consumer:
Other secured $194,417 $32,239 $257,685 $484,341 $179,623,538 $180,107,879
Unsecured 1,062,274 403,367 482,287 1,947,928 88,281,861 90,229,789
New auto 48,388 51,510 28,928 128,826 24,701,028 24,829,854
Used auto 501,472 201,723 125,295 828,490 42,606,383 43,434,873
Total 1,806,551 688,839 894,195 3,389,585 335,212,810 338,602,395
Residential Real Estate:
First mortgage 591,850 316,044 668,646 1,576,540 86,389,036 87,965,576
Second mortgage 101,934 102,593 — 204,527 10,345,931 10,550,458
HELOC 56,843 203,443 — 260,286 12,336,217 12,596,503
Total 750,627 622,080 668,646 2,041,353 109,071,184 111,112,537
Commercial:
Real estate 870,135 1,554,480 4,762,863 7,187,478 70,788,892 77,976,370
Total 870,135 1,554,480 4,762,863 7,187,478 70,788,892 77,976,370
Grand Total $3,427,313 $2,865,399 $6,325,704 $12,618,416 $515,072,886 $527,691,302
The Credit Union places loans on non-accrual status when the loan reaches 90 days past due or whenthe collection of interest or principal becomes uncertain. Loans on which the accrual of interest hasbeen discontinued or reduced approximated $2,233,000 and $6,326,000 as of December 31, 2014and 2013, respectively. There were no loans 90 days or more past due and still accruing interest asof December 31, 2014 or 2013.
TROUBLED DEBT RESTRUCTURING
The Credit Union’s loan portfolio includes certain loans that have been modified in a Troubled DebtRestructuring (TDR), where economic concessions have been granted to borrowers who haveexperienced or are expected to experience financial difficulties. These concessions typically resultfrom the Credit Union’s loss mitigation activities and could include reductions in the interest rate,payment extensions, forgiveness of principal, forbearance or other actions.
When the Credit Union modifies a collateral dependent loan, management uses the current fair valueof the collateral, less selling costs, to determine the net realizable value of the collateral. Ifmanagement determines that the value of the modified loan is less than the recorded investment inthe loan, impairment is recognized by segment or class of loan, as applicable, through the ALL.
The following tables include TDRs approved during the period. There were no TDRs performedduring the periods that then defaulted in the same period. The Credit Union defines a TDR assubsequently defaulted when the TDR is 90 days past due or the member files bankruptcy.
21
35FARMERS INSURANCE GROUP FEDERAL CREDIT UNION | 2014 Annual Report34 It’s different here.

FARMERS INSURANCE GROUP FEDERAL CREDIT UNIONNOTES TO THE FINANCIAL STATEMENTS
Note 3: (continued)
The following table presents the TDRs performed by class of loans during the year ended December31, 2014:
Number
Pre-ModificationOutstanding
RecordedInvestment
Post-ModificationOutstanding
RecordedInvestment
Consumer:Unsecured 3 $13,311 $13,350Used auto 1 19,565 19,640
Commercial:Real estate 4 1,907,666 1,902,826
$1,940,542 $1,935,816
The following table presents the TDRs performed by class of loans during the year ended December31, 2013:
Number
Pre-ModificationOutstanding
RecordedInvestment
Post-ModificationOutstanding
RecordedInvestment
Consumer:Unsecured 6 $102,324 $93,307Used auto 1 23,626 22,287
Residential Real Estate:First mortgage 66 2,295,225 2,294,943
Commercial:Real estate 4 2,549,701 2,551,911
$4,970,876 $4,962,448
CREDIT QUALITY INDICATORS
The Credit Union uses the P360, Inc. model to monitor credit quality for the consumer, residentialreal estate, and commercial loan portfolios. The P360, Inc. model analyzes each loan’s risk. Whenanalyzing each loan, the model identifies a set of numbers, or vectors, which represent theborrower’s probability of default and the loss severity of the loan over a set of different economicscenarios. These vectors are used to calculate the loan risk grade and run risk adjusted cash flowswhich result in the value-at-risk, pricing, and loan valuation.
The model incorporates over 150 data points covering more than credit score and collateral value. These loan level factors include institution and borrower specific data points as well as economicmeasures that feed into the risk analysis. They provide value reconciliation when refreshingproperty values and add updated values for the new and used auto portfolios. They continue toenhance the risk model by incorporating new technologies and applying all loan data available. Inaddition to credit score, the model incorporates numerous other factors based upon the borrower,collateral, loan performance, environment, institution, and economy as follows:
22
FARMERS INSURANCE GROUP FEDERAL CREDIT UNIONNOTES TO THE FINANCIAL STATEMENTS
Note 3: (continued)
Macro-economic - This segment’s data points are used to depict the overall health of the nationaleconomy such as: national unemployment, GDP growth, Treasury rate curves and forecasts, industrydelinquencies and charge-offs, national credit scores, borrower bankruptcy rates, etc.
Institution - This segment focuses on the Credit Union and is used to model the borrower’s profile,stability, and fine tune the risk adjustments to the specific institution. Examples of data pointsinclude delinquency rates and trends, charge-offs, and bankruptcies per 1,000 members.
Regional geography - This segment focuses on local economic factors such as unemployment,growth, and real estate values.
Loan - Additional data points added to this analysis are payment trend, auto pay, updated seniorbalances, last payment amounts, and use of proceeds.
Borrower - Examples of data points in this segment are disposable income, updated cash reserves,employment status, and direct deposit.
Asset - In addition to using different automated valuation model products for the residentialportfolio, the model includes new data to improve vehicle valuations for the new and used autoportfolios.
The following tables represent the recorded investment of consumer, residential real estate, andcommercial loan credit exposures by P360, Inc. risk grade as of December 31, 2014 and 2013. Theuse of the P360, Inc. risk grades permits management to estimate a portion of credit risk. Categoryratings are reviewed quarterly, at which time management analyzes the resulting grades, as well asother external statistics and factors, to track loan performance. Loans that trend upward towardhigher levels generally have a higher risk factor associated. Whereas, loans that migrate towardlower ratings generally will result in a lower risk factor being applied to those related loan balances. The risk ratings from Business Partners are taken into consideration when the P360, Inc. risk gradesare applied to the individual commercial real estate loan participations.
The P360, Inc. risk grades are as follows:
V1 - Minimal risk - These loans generally show the ability to cover expenses with a minimalchance of default. The typical characteristics for these loans are long-term Credit Union memberswith excellent credit history, strong cash flow, quality money management, excellent access toalternative sources of financing, and well collateralized. These loans typically have very lowpotential loss, no greater than one percent of the loan balance in most cases when factoring thedefault probability and loss severity.
23
37FARMERS INSURANCE GROUP FEDERAL CREDIT UNION | 2014 Annual Report36 It’s different here.
FARMERS INSURANCE GROUP FEDERAL CREDIT UNIONNOTES TO THE FINANCIAL STATEMENTS
Note 3: (continued)
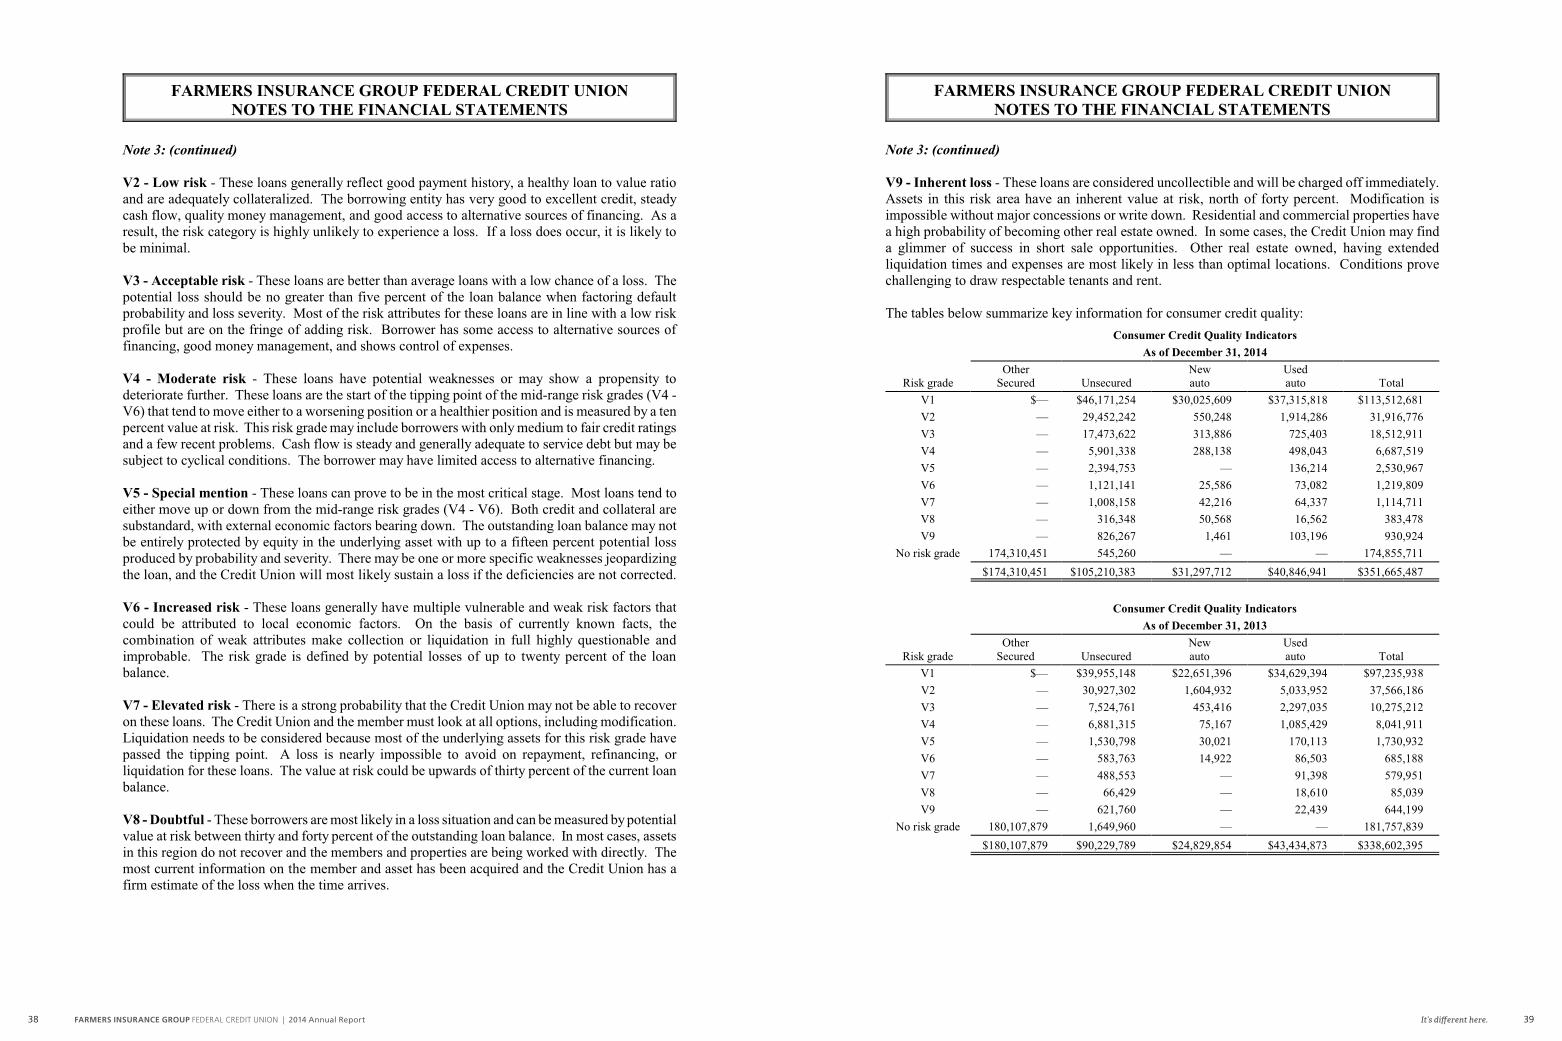
V2 - Low risk - These loans generally reflect good payment history, a healthy loan to value ratioand are adequately collateralized. The borrowing entity has very good to excellent credit, steadycash flow, quality money management, and good access to alternative sources of financing. As aresult, the risk category is highly unlikely to experience a loss. If a loss does occur, it is likely tobe minimal.
V3 - Acceptable risk - These loans are better than average loans with a low chance of a loss. Thepotential loss should be no greater than five percent of the loan balance when factoring defaultprobability and loss severity. Most of the risk attributes for these loans are in line with a low riskprofile but are on the fringe of adding risk. Borrower has some access to alternative sources offinancing, good money management, and shows control of expenses.
V4 - Moderate risk - These loans have potential weaknesses or may show a propensity todeteriorate further. These loans are the start of the tipping point of the mid-range risk grades (V4 -V6) that tend to move either to a worsening position or a healthier position and is measured by a tenpercent value at risk. This risk grade may include borrowers with only medium to fair credit ratingsand a few recent problems. Cash flow is steady and generally adequate to service debt but may besubject to cyclical conditions. The borrower may have limited access to alternative financing.
V5 - Special mention - These loans can prove to be in the most critical stage. Most loans tend toeither move up or down from the mid-range risk grades (V4 - V6). Both credit and collateral aresubstandard, with external economic factors bearing down. The outstanding loan balance may notbe entirely protected by equity in the underlying asset with up to a fifteen percent potential lossproduced by probability and severity. There may be one or more specific weaknesses jeopardizingthe loan, and the Credit Union will most likely sustain a loss if the deficiencies are not corrected.
V6 - Increased risk - These loans generally have multiple vulnerable and weak risk factors thatcould be attributed to local economic factors. On the basis of currently known facts, thecombination of weak attributes make collection or liquidation in full highly questionable andimprobable. The risk grade is defined by potential losses of up to twenty percent of the loanbalance.
V7 - Elevated risk - There is a strong probability that the Credit Union may not be able to recoveron these loans. The Credit Union and the member must look at all options, including modification. Liquidation needs to be considered because most of the underlying assets for this risk grade havepassed the tipping point. A loss is nearly impossible to avoid on repayment, refinancing, orliquidation for these loans. The value at risk could be upwards of thirty percent of the current loanbalance.
V8 - Doubtful - These borrowers are most likely in a loss situation and can be measured by potentialvalue at risk between thirty and forty percent of the outstanding loan balance. In most cases, assetsin this region do not recover and the members and properties are being worked with directly. Themost current information on the member and asset has been acquired and the Credit Union has afirm estimate of the loss when the time arrives.
24
FARMERS INSURANCE GROUP FEDERAL CREDIT UNIONNOTES TO THE FINANCIAL STATEMENTS
Note 3: (continued)
V9 - Inherent loss - These loans are considered uncollectible and will be charged off immediately. Assets in this risk area have an inherent value at risk, north of forty percent. Modification isimpossible without major concessions or write down. Residential and commercial properties havea high probability of becoming other real estate owned. In some cases, the Credit Union may finda glimmer of success in short sale opportunities. Other real estate owned, having extendedliquidation times and expenses are most likely in less than optimal locations. Conditions provechallenging to draw respectable tenants and rent.
The tables below summarize key information for consumer credit quality:
Consumer Credit Quality Indicators
As of December 31, 2014
Risk gradeOther
Secured UnsecuredNewauto
Usedauto Total
V1 $— $46,171,254 $30,025,609 $37,315,818 $113,512,681
V2 — 29,452,242 550,248 1,914,286 31,916,776
V3 — 17,473,622 313,886 725,403 18,512,911
V4 — 5,901,338 288,138 498,043 6,687,519
V5 — 2,394,753 — 136,214 2,530,967
V6 — 1,121,141 25,586 73,082 1,219,809
V7 — 1,008,158 42,216 64,337 1,114,711
V8 — 316,348 50,568 16,562 383,478
V9 — 826,267 1,461 103,196 930,924
No risk grade 174,310,451 545,260 — — 174,855,711
$174,310,451 $105,210,383 $31,297,712 $40,846,941 $351,665,487
Consumer Credit Quality Indicators
As of December 31, 2013
Risk gradeOther
Secured UnsecuredNewauto
Usedauto Total
V1 $— $39,955,148 $22,651,396 $34,629,394 $97,235,938
V2 — 30,927,302 1,604,932 5,033,952 37,566,186
V3 — 7,524,761 453,416 2,297,035 10,275,212
V4 — 6,881,315 75,167 1,085,429 8,041,911
V5 — 1,530,798 30,021 170,113 1,730,932
V6 — 583,763 14,922 86,503 685,188
V7 — 488,553 — 91,398 579,951
V8 — 66,429 — 18,610 85,039
V9 — 621,760 — 22,439 644,199
No risk grade 180,107,879 1,649,960 — — 181,757,839
$180,107,879 $90,229,789 $24,829,854 $43,434,873 $338,602,395
25
39FARMERS INSURANCE GROUP FEDERAL CREDIT UNION | 2014 Annual Report38 It’s different here.

FARMERS INSURANCE GROUP FEDERAL CREDIT UNIONNOTES TO THE FINANCIAL STATEMENTS
Note 3: (continued)
The tables below summarize key information for residential real estate credit quality:
Residential Real Estate Credit Quality Indicators
As of December 31, 2014
Risk gradeFirst
mortgageSecond
mortgage HELOC Total
V1 $81,805,443 $7,478,636 $17,445,237 $106,729,316
V2 4,496,614 2,460,978 496,691 7,454,283
V3 959,933 623,665 402,132 1,985,730
V4 — 259,521 288,631 548,152
V5 104,063 — — 104,063
V6 — 58,164 19,516 77,680
V7 223,029 14,667 28,315 266,011
V8 196,976 — — 196,976
V9 — 26,833 2,107 28,940
No risk grade 1,947,113 — — 1,947,113
$89,733,171 $10,922,464 $18,682,629 $119,338,264
Residential Real Estate Credit Quality Indicators
As of December 31, 2013
Risk gradeFirst
mortgageSecond
mortgage HELOC Total
V1 $60,362,481 $4,237,549 $9,546,263 $74,146,293
V2 12,037,444 1,328,809 1,293,857 14,660,110
V3 4,858,642 1,744,098 635,846 7,238,586
V4 6,315,752 1,310,338 334,621 7,960,711
V5 2,266,644 1,077,439 16,088 3,360,171
V6 1,080,557 360,781 121,469 1,562,807
V7 772,762 152,981 514,511 1,440,254
V8 — 107,043 133,848 240,891
V9 — 231,420 — 231,420
No risk grade 271,294 — — 271,294
$87,965,576 $10,550,458 $12,596,503 $111,112,537
26
FARMERS INSURANCE GROUP FEDERAL CREDIT UNIONNOTES TO THE FINANCIAL STATEMENTS
Note 3: (continued)
The tables below summarize key information for commercial credit quality:
Commercial Credit Quality IndicatorsAs of December 31, 2014
Risk grade Real estateV1 $56,768,614V2 23,692,941V3 6,472,419V4 5,135,334V5 —V6 —V7 1,437,407V8 —V9 594,612
No risk grade —Total $94,101,327
Commercial Credit Quality IndicatorsAs of December 31, 2013
Risk grade Real estateV1 $39,033,147V2 18,304,954V3 7,635,319V4 4,885,627V5 2,808,367V6 730,353V7 2,523,800V8 1,115,283V9 939,520
No risk grade —
Total $77,976,370
NOTE 4: PROPERTY AND EQUIPMENT
A summary of the Credit Union’s property and equipment is as follows:
As of December 31,2014 2013
Furniture and equipment $9,602,861 $9,952,424Leasehold improvements 2,460,645 2,417,294
12,063,506 12,369,718Less accumulated depreciation and amortization (10,547,259) (10,651,708)
$1,516,247 $1,718,010
27
41FARMERS INSURANCE GROUP FEDERAL CREDIT UNION | 2014 Annual Report40 It’s different here.

FARMERS INSURANCE GROUP FEDERAL CREDIT UNIONNOTES TO THE FINANCIAL STATEMENTS
NOTE 5: MEMBERS’ SHARES AND DEPOSITS
Members’ shares and deposits are summarized as follows:
As of December 31,2014 2013
Share drafts $94,502,195 $87,407,378Regular shares 99,162,129 90,256,849
Money market accounts 214,493,130 203,201,459IRA shares 29,857,288 30,206,929Share and IRA certificates 121,092,084 132,102,815
$559,106,826 $543,175,430
The aggregate balance of members’ time deposit accounts in denominations that meet or exceed$250,000 was approximately $12,669,000 and $15,112,000 as of December 31, 2014 and 2013,respectively. Negative share and share draft accounts reclassified to loans to members wereapproximately $525,000 and $504,000 as of December 31, 2014 and 2013, respectively.
Scheduled maturities of share and IRA certificates are as follows:
As ofDecember 31, 2014
Within 1 year $86,086,5731 to 2 years 15,357,6912 to 3 years 9,577,7413 to 4 years 6,312,7454 to 5 years 3,757,334
$121,092,084
SHARE INSURANCE
As of December 31, 2014, members’ shares were insured by the NCUSIF to a maximum of$250,000 for each member. Individual Retirement Accounts are insured by the NCUSIF for anadditional $250,000 of coverage.
NOTE 6: EMPLOYEE BENEFITS
CASH BALANCE PROGRAM AND 401(K) PENSION PLAN
On January 1, 2009, the Credit Union’s defined benefit pension plan was modified and only vestedemployees who were age 40 and over, or who had 10 years of service as of December 31, 2008,were grandfathered into the existing pension plan. All remaining and new employees becameparticipants of the Cash Balance Program. Farmers makes quarterly contributions to the employees’cash balance account, which is based on a percentage of the employees’ salaries. Also, thenoncontributory deferred profit sharing plan was terminated and replaced with a 401(k) plan throughFarmers, which allows employees to defer a portion of their salary into the 401(k) plan up to certainlimits established by the Internal Revenue Service. The Credit Union makes discretionary matchingcontributions each year. Participants are always 100% vested in all their voluntary contributions. The Credit Union’s matching contributions become fully vested at the completion of three years ofservice.
28
FARMERS INSURANCE GROUP FEDERAL CREDIT UNIONNOTES TO THE FINANCIAL STATEMENTS
Note 6: (continued)
Retirement plan costs are accrued and funded on a current basis. Total retirement plan costs paidby the Credit Union to Farmers for the years ended December 31, 2014 and 2013 was approximately$852,000 and $821,000, respectively.
NOTE 7: COMMITMENTS AND CONTINGENT LIABILITIES
LEASE COMMITMENTS
The Credit Union leases several branch locations. The minimum remaining noncancellable leaseobligations approximate the following as of December 31, 2014:
Year endingDecember 31, Amount
2015 $1,007,0002016 960,0002017 938,0002018 799,0002019 688,000
$4,392,000
Rental expense under operating leases was approximately $1,168,000 and $1,208,000 for the yearsended December 31, 2014 and 2013, respectively.
LINES OF CREDIT As of December 31, 2014, the Credit Union maintained two unused lines of credit with CCFCU. The terms of the agreement requires the pledging of all presently owned and later acquiredunencumbered assets as security for obligations under the line-of-credit agreement. As of December31, 2014, the total unused lines of credit under the CCFCU agreement approximated $50,000,000.
The Credit Union has entered into a credit availability agreement with UBS Bank USA which allowsthe Credit Union to borrow against its securities held in safekeeping. As of December 31, 2014, thetotal unused line of credit under this agreement was $9,500,000.
The Credit Union maintains a credit availability agreement with the Federal Reserve Bank of Atlantato comply with NCUA regulations Part 741.12: Maintaining Access to Emergency Liquidity. Thiscredit availability agreement allows the Credit Union to borrow against its vehicle loan portfolio. The Credit Union is able to borrow according to the percentages published in the current “FederalReserve Discount Window and Payment System Risk Collateral Margins Table” which is availableon the Federal Reserve Bank’s website. As of December 31 2014, the total unused line of creditunder this agreement was approximately $48,589,000.
MISCELLANEOUS LITIGATION
The Credit Union is a party to various miscellaneous legal actions normally associated with financialinstitutions, the aggregate effect of which, in management’s opinion, would not be material to theCredit Union’s financial statements.
29
43FARMERS INSURANCE GROUP FEDERAL CREDIT UNION | 2014 Annual Report42 It’s different here.

FARMERS INSURANCE GROUP FEDERAL CREDIT UNIONNOTES TO THE FINANCIAL STATEMENTS
NOTE 8: OFF-BALANCE-SHEET RISK AND CONCENTRATIONS OF CREDIT RISK
OFF-BALANCE-SHEET RISK
The Credit Union is a party to financial instruments with off-balance-sheet risk in the normal courseof business to meet the financing needs of its members and to reduce its own exposure tofluctuations in interest rates. These financial instruments include commitments to extend credit. These instruments involve, to varying degrees, elements of credit and interest-rate risk in excess ofthe amount recognized in the statements of financial condition.
Commitments to extend credit are agreements to lend to a member as long as there is no violationof any condition established in the contract. Commitments generally have fixed expiration dates orother termination clauses. Since many of the commitments may expire without being fully drawnupon, the total commitment amounts do not necessarily represent future cash requirements. As ofDecember 31, 2014, total unfunded commitments under such lines of credit approximated$161,304,000. The Credit Union evaluates each member’s creditworthiness on a case-by-case basis. The amount of collateral obtained, if any, is based on management’s credit evaluation of themember.
CONCENTRATIONS OF CREDIT RISK A significant amount of the Credit Union’s business activity is with members who are employeesor former employees of Farmers. The Credit Union also may be exposed to credit risk from aregional economic standpoint, since a significant concentration of its borrowers work or reside inthe state of California. However, the loan portfolio is well diversified and the Credit Union doesnot have any significant concentration of credit risk, except unsecured loans, which by their nature,increase the risk of loss compared to those loans that are collateralized.
NOTE 9: REGULATORY CAPITAL
The Credit Union is subject to various regulatory capital requirements administered by the NCUA.Failure to meet minimum capital requirements can initiate certain mandatory-and possibly additionaldiscretionary-actions by regulators that, if undertaken, could have a direct material effect on theCredit Union’s financial statements. Under capital adequacy regulations and the regulatoryframework for prompt corrective action, the Credit Union must meet specific capital regulations thatinvolve quantitative measures of the Credit Union’s assets, liabilities, and certain off-balance-sheetitems as calculated under generally accepted accounting practices. The Credit Union’s capitalamounts and net worth classification are also subject to qualitative judgments by the regulatorsabout components, risk weightings, and other factors.
Quantitative measures established by regulation to ensure capital adequacy require the Credit Unionto maintain minimum amounts and ratios (set forth in the table below) of net worth (as defined inNCUA Regulations) to total assets (as defined in NCUA Regulations). Credit unions are alsorequired to calculate a Risk-Based Net Worth Requirement (RBNWR) which establishes whetheror not the Credit Union will be considered “complex” under the regulatory framework. The CreditUnion’s RBNWR as of December 31, 2014 and 2013 was 6.41% and 6.39%, respectively. Theminimum requirement to be considered complex under the regulatory framework is 6.00%. Management believes, as of December 31, 2014, that the Credit Union meets all capital adequacyrequirements to which it is subject.
30
FARMERS INSURANCE GROUP FEDERAL CREDIT UNIONNOTES TO THE FINANCIAL STATEMENTS
Note 9: (continued)
As of December 31, 2014, the most recent call reporting period, the NCUA categorized the CreditUnion as “well capitalized” under the regulatory framework for prompt corrective action. To becategorized as “well capitalized” the Credit Union must maintain a minimum net worth ratio of7.00% of assets. There are no conditions or events since that notification that management believeshave changed the Credit Union’s category.
The Credit Union’s actual and required net worth amounts and ratios are as follows:
As of As ofDecember 31, 2014 December 31, 2013
AmountRatio/
Requirement AmountRatio/
Requirement
Actual net worth $87,762,386 13.43% $80,863,746 12.84%
Amount needed to be classifiedas “well capitalized” $45,744,277 7.00% $44,073,646 7.00%
Amount needed to meet RBNWR $41,888,688 6.41% $40,232,943 6.39%
Amount needed to be classifiedas “adequately capitalized” $39,209,380 6.00% $37,777,411 6.00%
Because the RBNWR is less than the net worth ratio, the Credit Union retains its original category. Further, in performing its calculation of total assets, the Credit Union used the quarter-end option,as permitted by regulation.
NOTE 10: CHANGES IN ACCUMULATED OTHER COMPREHENSIVE INCOME
The following table presents the changes in accumulated other comprehensive income during theyear ended December 31, 2014:
Unrealized Gains onAvailable-for-Sale
SecuritiesBalance as of December 31, 2013 $138,198Other comprehensive loss before reclassification (1,601)Amounts reclassified from other comprehensive income —Net other comprehensive loss (1,601)
Balance as of December 31, 2014 $136,597
31
45FARMERS INSURANCE GROUP FEDERAL CREDIT UNION | 2014 Annual Report44 It’s different here.

FARMERS INSURANCE GROUP FEDERAL CREDIT UNIONNOTES TO THE FINANCIAL STATEMENTS
NOTE 11: FAIR VALUES OF FINANCIAL INSTRUMENTS
The Fair Value Measurements and Disclosures Topic of the FASB ASC provides a framework formeasuring fair value and requires an entity to derive fair value from the price that would be receivedto sell an asset or paid to transfer a liability in an orderly transaction between market participantsat the measurement date within its principal market for the asset or liability, or in the absence of aprincipal market, the most advantageous market for the asset or liability. To increase consistencyand comparability in fair value measurements and related disclosures, a three-level hierarchyprioritizes the inputs to valuation techniques used to measure fair value with the highest priority tounadjusted quoted prices in active markets for identical assets or liabilities (Level 1) and the lowestpriority to unobservable inputs (Level 3) as further described below:
Level 1Level 1 inputs are quoted prices (unadjusted) in active markets for identical assets or liabilities thatthe Credit Union has the ability to access at the measurement date. An active market for the assetor liability is a market in which transactions for the asset or liability occur with sufficient frequencyand volume to provide pricing information on an ongoing basis.
Level 2Level 2 inputs are inputs other than quoted prices included within Level 1 that are observable forthe asset or liability, either directly or indirectly. If the asset or liability has a specified (contractual)term, a Level 2 input must be observable for substantially the full term of the asset or liability. Level 2 inputs include: quoted prices for similar assets or liabilities in active markets; quoted pricesfor identical or similar assets or liabilities in markets that are inactive; inputs other than quotedprices that are observable for the asset or liability; inputs that are derived principally from orcorroborated by observable market data by correlation or other means.
Level 3Level 3 inputs are unobservable inputs for the asset or liability which reflect the Credit Union’s ownassumptions about the assumptions that market participants would use in pricing the asset orliability. Assumptions about risk include risk inherent in a particular valuation technique used tomeasure fair value, typically pricing models and/or discounted cash flow methodologies.
The methodologies and associated inputs used may produce a fair value calculation that may not beindicative of net realizable value or reflective of future fair values. Furthermore, while the CreditUnion believes its valuation methods and associated inputs are appropriate and consistent with othermarket participants, the use of different methodologies or assumptions to determine the fair valueof certain financial instruments could result in a different fair value measurement at the reportingdate.
Certain assets and liabilities may be required to be measured at fair value on a non-recurring basis. These non-recurring fair value measurements usually result from the application of lower of costor market accounting or the write-down of individual assets due to impairment.
32
FARMERS INSURANCE GROUP FEDERAL CREDIT UNIONNOTES TO THE FINANCIAL STATEMENTS
Note 11: (continued)
RECURRING BASIS
AVAILABLE-FOR-SALE SECURITIES
The Credit Union receives pricing for available-for-sale securities from a third-party pricing service. These securities are classified as Level 2 in the fair value hierarchy. All available-for-sale securitiesare valued based on quoted market prices on similar assets in the marketplace and the vintage of theunderlying collateral.
NON-RECURRING BASIS
OTHER REAL ESTATE OWNED (OREO)OREO properties acquired through or in lieu of foreclosure are initially recorded at fair value lessestimated selling costs at the date of foreclosure. Depending on the accessability of the property,the Credit Union may utilize broker price opinions (BPOs), full appraisals or use an automatedvaluation model to estimate the fair market value of OREO properties. These methods consider thevalue of similar surrounding properties, sales trends in the neighborhood, an estimate of any of thecosts associated with getting the property ready for sale, and/or the cost of any needed repairs. TheCredit Union evaluates the reasonableness by analyzing significant fluctuations in property valueson a period-by-period basis. Fair value less costs to sell is an estimated value based on relevantrecent historical data that are considered unobservable inputs, and as such, OREO is classified asLevel 3 in the fair value hierarchy and valued on a non-recurring basis.
During the holding period, valuations are updated to reflect changes in fair value, and the OREO iscarried at the lower of the amount recorded at acquisition date or estimated fair value less costs tosell. Holding costs such as insurance, maintenance, taxes and utility costs are expensed as incurred.The Credit Union markets the OREO properties for sale to the public and generally does not holdOREO for longer than one year. Valuation adjustments on these assets as well as gains or lossesrealized from disposition of such properties are reflected in “other non-interest income” on thestatements of income.
The following tables set forth by level, within the fair value hierarchy, the Credit Union’s financialinstruments at fair value on a recurring basis.
Assets at Fair Value as of December 31, 2014Level 1 Level 2 Level 3 Total
Available-for-sale securities:Mortgage-backed
securities $— $2,042,412 $— $2,042,412NCUA guaranteed
notes — 14,344,034 — 14,344,034Collateralized-mortgage
obligations — 30,323 — 30,323$— $16,416,769 $— $16,416,769
33
47FARMERS INSURANCE GROUP FEDERAL CREDIT UNION | 2014 Annual Report46 It’s different here.

FARMERS INSURANCE GROUP FEDERAL CREDIT UNIONNOTES TO THE FINANCIAL STATEMENTS
Note 11: (continued)
Assets at Fair Value as of December 31, 2013Level 1 Level 2 Level 3 Total
Available-for-sale securities:Mortgage-backed
securities $— $2,332,901 $— $2,332,901NCUA guaranteed
notes — 17,804,784 — 17,804,784Collateralized-mortgage
obligations — 51,126 — 51,126$— $20,188,811 $— $20,188,811
The tables below present the items measured at fair value on the statements of financial conditionon a non-recurring basis when certain assets are measured at the lower of cost of market that wererecognized at fair value below cost at the end of the period.
Assets at Fair Value as of December 31, 2014Level 1 Level 2 Level 3 Total
OREO $— $— $40,119 $40,119
Assets at Fair Value as of December 31, 2013Level 1 Level 2 Level 3 Total
OREO $— $— $2,332,721 $2,332,721
The estimated fair value amounts have been determined using available market information andappropriate valuation methodologies. However, considerable judgment is required to interpretmarket data to develop the estimates of fair value. Accordingly, the estimates presented are notnecessarily indicative of amounts that could be realized in a market exchange. The use of differentassumptions and estimation methodologies may have a material effect on the estimated fair valueamounts. The following methods and assumptions were used to estimate fair value of each of thefinancial instruments for which it is practicable to estimate.
CASH
The carrying amount is a reasonable estimation of fair value.
INVESTMENTS
Estimated fair values for investments are obtained from observable market data for similarinstruments. The fair values for available-for-sale securities take into account recent market activityas well as other market observable data such as interest rate, spread and prepayment information.
LOANS TO MEMBERS, NET
The fair value of loans was estimated by discounting the estimated cash flows using market-basedassumptions for expected prepayment rates, default rates, loss severity, and required rates of return.
ACCRUED INTEREST RECEIVABLE
The carrying amount is a reasonable estimation of fair value.
34
FARMERS INSURANCE GROUP FEDERAL CREDIT UNIONNOTES TO THE FINANCIAL STATEMENTS
Note 11: (continued)
MEMBERS’ SHARES AND DEPOSITS
The estimated fair value of demand deposit accounts is the carrying amount. The fair value of fixed-rate certificates was estimated by discounting the estimated cash flows using the current rate atwhich similar certificates would be issued.
INTEREST PAYABLE
The carrying amount is a reasonable estimation of fair value.
COMMITMENTS TO EXTEND CREDIT The Credit Union’s unused loan commitments to extend credit have no carrying amount and havebeen estimated to have no realizable fair value. The Credit Union does not charge fees in connectionwith these commitments and a majority of the unused loan commitments have historically not beendrawn upon.
The carrying value and estimated fair value of the Credit Union’s financial instruments are asfollows:
As of As ofDecember 31, 2014 December 31, 2013
Carrying Fair Carrying FairAmount Value Amount Value
Financial assets:Cash $1,976,559 $1,976,559 $4,016,722 $4,016,722Investments:
Available-for-sale $16,416,769 $16,416,769 $20,188,811 $20,188,811Held-to-maturity $10,955,783 $10,946,045 $17,375,938 $17,399,557Other $50,645,498 $50,645,498 $50,611,467 $50,611,467
Loans to members, net $556,439,500 $557,489,863 $517,060,869 $520,746,938Accrued interest receivable:
Investments $50,135 $50,135 $72,369 $72,369Loans $2,247,957 $2,247,957 $2,239,956 $2,239,956
Financial liabilities:Members’ shares and
deposits $559,106,826 $559,102,576 $543,175,430 $544,386,996Interest payable $265,064 $265,064 $278,118 $278,118
�������
35
49FARMERS INSURANCE GROUP FEDERAL CREDIT UNION | 2014 Annual Report48 It’s different here.

4601 Wilshire Blvd., Ste. 110, Los Angeles, CA 90010www.figfcu.com � 800.877.2345