Embed Size (px)
Citation preview
8/13/2019 20130918 PC Jeweller Ltd IER InitiationReport 2
http://slidepdf.com/reader/full/20130918-pc-jeweller-ltd-ier-initiationreport-2 1/28
CRISIL IER IndependentEquityResearch
Enhancing investment decisions
PC Jeweller Ltd
Initiating Coverage

8/13/2019 20130918 PC Jeweller Ltd IER InitiationReport 2
http://slidepdf.com/reader/full/20130918-pc-jeweller-ltd-ier-initiationreport-2 2/28
CRISIL IER IndependentEquityResearch
Explanation of CRISIL Fundamental and Valuation (CFV) matrix
The CFV Matrix (CRISIL Fundamental and Valuation Matrix) addresses the two important analysis of an investment making process – Analysis
of Fundamentals (addressed through Fundamental Grade) and Analysis of Returns (Valuation Grade) The fundamental grade is assigned on a
five-point scale from grade 5 (indicating Excellent fundamentals) to grade 1 (Poor fundamentals) The valuation grade is assigned on a five-
point scale from grade 5 (indicating strong upside from the current market price (CMP)) to grade 1 (strong downside from the CMP).
CRISILFundamental Grade Assessment
CRISILValuation Grade Assessment
5/5 Excellent fundamentals 5/5 Strong upside (>25% from CMP)4/5 Superior fundamentals 4/5 Upside (10-25% from CMP)3/5 Good fundamentals 3/5 Align (+-10% from CMP)2/5 Moderate fundamentals 2/5 Downside (negative 10-25% from CMP)1/5 Poor fundamentals 1/5 Strong downside (<-25% from CMP)
About CRISIL LimitedCRISIL is a global analytical company providing ratings, research, and risk and policy advisory services. We are India’s leading ratings agency.We are also the foremost provider of high-end research to the world’s largest banks and leading corporations.
About CRISIL ResearchCRISIL Research is India's largest independent and integrated research house. We provide insights, opinions, and analysis on the Indianeconomy, industries, capital markets and companies. We are India's most credible provider of economy and industry research. Our industryresearch covers 70 sectors and is known for its rich insights and perspectives. Our analysis is supported by inputs from our network of morethan 4,500 primary sources, including industry experts, industry associations, and trade channels. We play a key role in India's fixed incomemarkets. We are India's largest provider of valuations of fixed income securities, serving the mutual fund, insurance, and banking industries.We are the sole provider of debt and hybrid indices to India's mutual fund and life insurance industries. We pioneered independent equity
research in India, and are today India's largest independent equity research house. Our defining trait is the ability to convert information anddata into expert judgements and forecasts with complete objectivity. We leverage our deep understanding of the macroeconomy and ourextensive sector coverage to provide unique insights on micro-macro and cross-sectoral linkages. We deliver our research through aninnovative web-based research platform. Our talent pool comprises economists, sector experts, company analysts, and informationmanagement specialists.
CRISIL PrivacyCRISIL respects your privacy. We use your contact information, such as your name, address, and email id, to fulfil your request and serviceyour account and to provide you with additional information from CRISIL and other parts of McGraw Hill Financial you may find of interest.
For further information, or to let us know your preferences with respect to receiving marketing materials, please visit www.crisil.com/privacy .You can view McGraw Hill Financial’s Customer Privacy Policy at http://www.mhfi.com/privacy .
Last updated: May, 2013
Analyst DisclosureEach member of the team involved in the preparation of the grading report, hereby affirms that there exists no conflict of interest that can biasthe grading recommendation of the company.
Disclaimer:This Company commissioned CRISIL IER report is based on data publicly available or from sources considered reliable. CRISIL Ltd.(CRISIL) does not represent that it is accurate or complete and hence, it should not be relied upon as such. The data / report is subject tochange without any prior notice. Opinions expressed herein are our current opinions as on the date of this report. Nothing in this reportconstitutes investment, legal, accounting or tax advice or any solicitation, whatsoever. The subscriber / user assume the entire risk of any usemade of this data / report. CRISIL especially states that, it has no financial liability whatsoever, to the subscribers / users of this report. Thisreport is for the personal information only of the authorised recipient in India only. This report should not be reproduced or redistributed orcommunicated directly or indirectly in any form to any other person – especially outside India or published or copied in whole or in part, for any
purpose.

8/13/2019 20130918 PC Jeweller Ltd IER InitiationReport 2
http://slidepdf.com/reader/full/20130918-pc-jeweller-ltd-ier-initiationreport-2 3/28
P̀C Jeweller LtdSpreading the sheen
Fundamental Grade 3/5 (Good fundamentals)
Valuation Grade 5/5 (CMP has strong upside)
Industry Speciality retail
1
September 18, 2013
Fair Value ₹ 150CMP ₹ 87
For detailed initiating coverage report please visit: www.ier.co.inCRISIL Independent Equity Research reports are also available on Bloomberg (CRI <go>) and Thomson Reuters.
Jewellery retailer PC Jeweller Ltd (PCJ) has entrenched itself firmly in North India based on a
strong brand recall and successful branch expansion (from one to 36 showrooms in the pastseven years). Increasing market share of organised players along with company’s focus ondiamond jewellery augurs well for the company. However, intensifying competition,weakening consumer sentiment and stringent regulations on gold imports are key risks. Weinitiate coverage on PCJ with a fundamental grade of 3/5.
Strong foothold in NCR; retail expansion at a fast pace National Capital Region (NCR) dominates its domestic sales with 60%+ contribution.
Aggressive expansion (2.5x increases in retail space) over FY10-13 to 166k sq f t and furtherexpansion lined over the next two years is expected to lower PCJ’s dependence on NCR.
Focus on high-margin diamond jewellery In a bid to better its margins, PCJ has been increasing its focus on high-margin diamond
jewellery. Its share increased from 18% of FY10 domestic s ales to 31% in FY13, improvingEBITDA margin from 10% to 12.5% during the same period. Going ahead, we expect PCJ’sdiamond jewellery to hover around 30-32% of domestic sales.
Gold jewellery demand to be steady, organised players to gain market shareDomestic gold jewellery market grew 24% y-o-y to ₹ 2,125 bn, mainly led by a 17% rise ingold price during FY13; the jewellery industry grew by 15% during the same period owing tostrong demand for jewellery during festivals/weddings. For FY14, we expect demand for
jewellery to increase with marginal decline in gold prices (2-3% y-o-y). Further, shift inconsumer preference towards branded jewellery is expected to increase the share oforganised players from the current ~18%.
Ability to withstand competition; regulatory concerns - key monitorable PCJ plans to add 20 more showrooms (100k sq ft more) in FY14 and ~12 more showroomsin FY15 across India; it is looking at new markets in southern and western India. Withaggressive expansion plans of many regional and national players, along with weakconsumer demand, competition is expected to intensify. Given the lower pick-up in storesoutside NCR, PCJ’s ability to successfully penetrate these regions and establish a brand is akey monitorable. Also, changes in the Reserve Bank of India’s (RBI’s) regulations to curbgold imports may lead to difficulty in getting a metal loan; this is a monitorable too.
Expect two-year revenue CAGR of 18.7%; EBITDA margins to decline We expect revenues to register a two-year CAGR of 18.7% to ₹ 56 bn in FY15 driven by newstore openings and consumer’s demand for jewellery. We expect EBITDA margin to declinemarginally to 10.5% in FY15 owing low profitability of new stores.
Valuations: Current market price has strong upsideWe have used the price-to-earnings ratio (P/E) method to value PCJ. We assign a P/Emultiple of 8x to FY15 EPS of ₹ 18.8 and arrive at a fair value of ₹ 150 per share. At thecurrent market price of ₹ 87, our valuation grade is 5/5.
KEY FORECAST(₹ mn) FY11 FY12 FY13 FY14E FY15EOperating income 19,772 30,419 40,184 49,403 56,628 EBITDA 1,965 3,314 4,825 5,319 5,918
Adj net income 1,453 2,334 2,937 3,305 3,368 Adj EPS ( ₹ ) 32.6 17.4 16.4 18.5 18.8 EPS growth (%) 96.5 (46.5) (5.9) 12.5 1.9 Dividend yield (%) - - 0.9 4.3 4.3 RoCE (%) 53.3 40.8 34.4 29.6 29.0 RoE (%) 57.8 53.3 30.3 21.5 18.2 PE (x) - - 7.0 3.8 3.7 P/BV (x) - - 1.5 0.7 0.6 EV/EBITDA (x) 0.6 1.5 3.2 1.3 0.9
NM: Not meaningful; CMP: Current market priceSource: Company, CRISIL Research estimates
CFV MATRIX
KEY STOCK STATISTICSNIFTY/SENSEX 5850/19804NSE/BSE ticker PCJEWELLERFace value ( ₹ per share) 10Shares outstanding (mn) 179Market cap ( ₹ mn)/(US$ mn) 15,740/249Enterprise value ( ₹ mn)/(US$ mn) 14,405/22852-week range ( ₹ )/(H/L) 195/66Beta 0.9Free float (%) 30.0%
Avg daily volumes (30-days) 466,852 Avg daily value (30-days) ( ₹ mn) 41.3
SHAREHOLDING PATTERN
PERFORMANCE VIS-À-VIS MARKETReturns
1-m 3-m 6-m 12-mPCJ -30% -31% -57% NANIFTY 3% 5% -1% 15%
ANALYTICAL CONTACTMohit Modi (Director) [email protected] Bandekar [email protected] Vishal Rampuria [email protected] Client servicing desk
+91 22 3342 3561 [email protected]
1 2 3 4 5
1
2
3
4
5
Valuation Grade
F u n
d a m e n
t a l G r a
d e
PoorFundamentals
ExcellentFundamentals
S t r o n g
D o w n s
i d e
S t r o n g
U p s i d e
70.02% 70.02% 70.02%
11.3% 13.4% 12.9%3.95% 3.58% 3.46%14.8% 13.0% 13.7%
0%
10%
20%
30%
40%
50%
60%
70%
80%
90%
100%
Dec-12 13-Mar 13-JunPromoter FII DII Others
8/13/2019 20130918 PC Jeweller Ltd IER InitiationReport 2
http://slidepdf.com/reader/full/20130918-pc-jeweller-ltd-ier-initiationreport-2 4/28
CRISIL IERIndependentEquityResearch
2
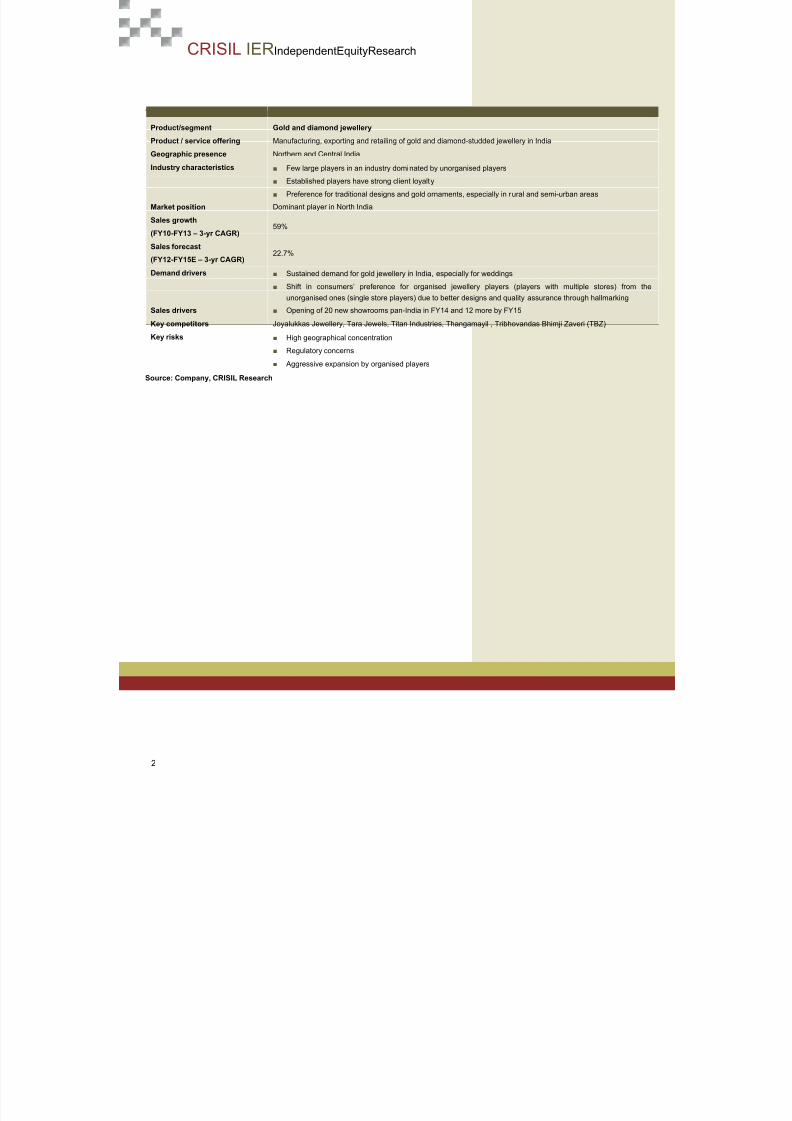
Table 1: PCJ - Business environment
Product/segment Gold and diamond jewellery
Product / service offering Manufacturing, exporting and retailing of gold and diamond-studded jewellery in India
Geographic presence Northern and Central India
Industry characteristics ■ Few large players in an industry dominated by unorganised players ■ Established players have strong client loyalty■ Preference for traditional designs and gold ornaments, especially in rural and semi-urban areas
Market position Dominant player in North India
Sales growth
(FY10-FY13 – 3-yr CAGR)59%
Sales forecast
(FY12-FY15E – 3-yr CAGR)22.7%
Demand drivers ■ Sustained demand for gold jewellery in India, especially for weddings
■ Shift in consumers’ preference for organised jewellery players (players with multiple stores) from theunorganised ones (single store players) due to better designs and quality assurance through hallmarking
Sales drivers ■ Opening of 20 new showrooms pan-India in FY14 and 12 more by FY15
Key competitors Joyalukkas Jewellery, Tara Jewels, Titan Industries, Thangamayil , Tribhovandas Bhimji Zaveri (TBZ)
Key risks ■ High geographical concentration■ Regulatory concerns
■ Aggressive expansion by organised players
Source: Company, CRISIL Research

8/13/2019 20130918 PC Jeweller Ltd IER InitiationReport 2
http://slidepdf.com/reader/full/20130918-pc-jeweller-ltd-ier-initiationreport-2 5/28
`
PC Jeweller Ltd
3
Grading Rationale
A dominant player in NCR with strong brand recallPCJ, promoted by brothers Padam Chand Gupta and Balram Garg, has emerged as one of
the leading retail jewellery players in Delhi. It has gradually expanded from one (flagship)
showroom in Karol Bagh, Delhi in 2005 to 36 stores as of Q1FY14 across North and Central
India. A strong in-house design team and five manufacturing facilities support its retail
expansion. With promoters’ two-decade-plus experience in the jewellery industry, PCJ has
been able to create a strong brand recall in the NCR.
Better growth than peers
Over the past five years, PCJ has grown at a CAGR of 59%; the growth pace is faster than
that of the other organised players. Revenues from stores in NCR constituted over 60% of
total domestic sales over the past three years (FY11-13), highlighting the dominance of NCR
in PCJ’s geographic spread. In FY13, 13 showrooms in NCR contributed 65% of total
domestic sales; showrooms located in Delhi’s Karol Bagh and South Extension accounted for
14% and 11%, respectively, of the total domestic sales in FY13. Over FY11-13, PCJ has
grown at a CAGR of 42%; and with aggressive retail expansion plans, we expect PCJ to
record moderate revenue growth.
Figure 1: Clocked faster growth than peers (FY09-13 revenue CAGR)
Source: Company, CRISIL Research
Geographical concentration to continue; dependence on flagship storedown sharply
PCJ’s flagship Karol Bagh store recorded stable revenue sales in FY13 but with the fast-
paced expansion of retail stores across India, the contribution of the Karol Bagh store dropped
to 14% in FY13 from 30% in FY11. Going forward, sales from Karol Bagh will mature with
increase in sales from new stores. However, we expect sales at the Karol Bagh store to record
stable growth in FY14 based on increase in demand for jewellery following a dip in gold price.
Revenues from NCR stores constituted 65% of total domestic sales in FY13, highlighting the
geographical concentration of PCJ. Going forward, we expect the dominance of NCR in PCJ’s
revenue share to continue as PCJ is yet to establish its foothold in other regions.
27%34%
59%
25%
58%
0%
10%
20%
30%
40%
50%
60%
70%
Titan Gitanjali PCJ TBZ Thangamayil
Strong foothold in NCR, whichincludes Delhi and 19 districts inHaryana, Uttar Pradesh andRajasthan
8/13/2019 20130918 PC Jeweller Ltd IER InitiationReport 2
http://slidepdf.com/reader/full/20130918-pc-jeweller-ltd-ier-initiationreport-2 6/28
CRISIL IERIndependentEquityResearch
4
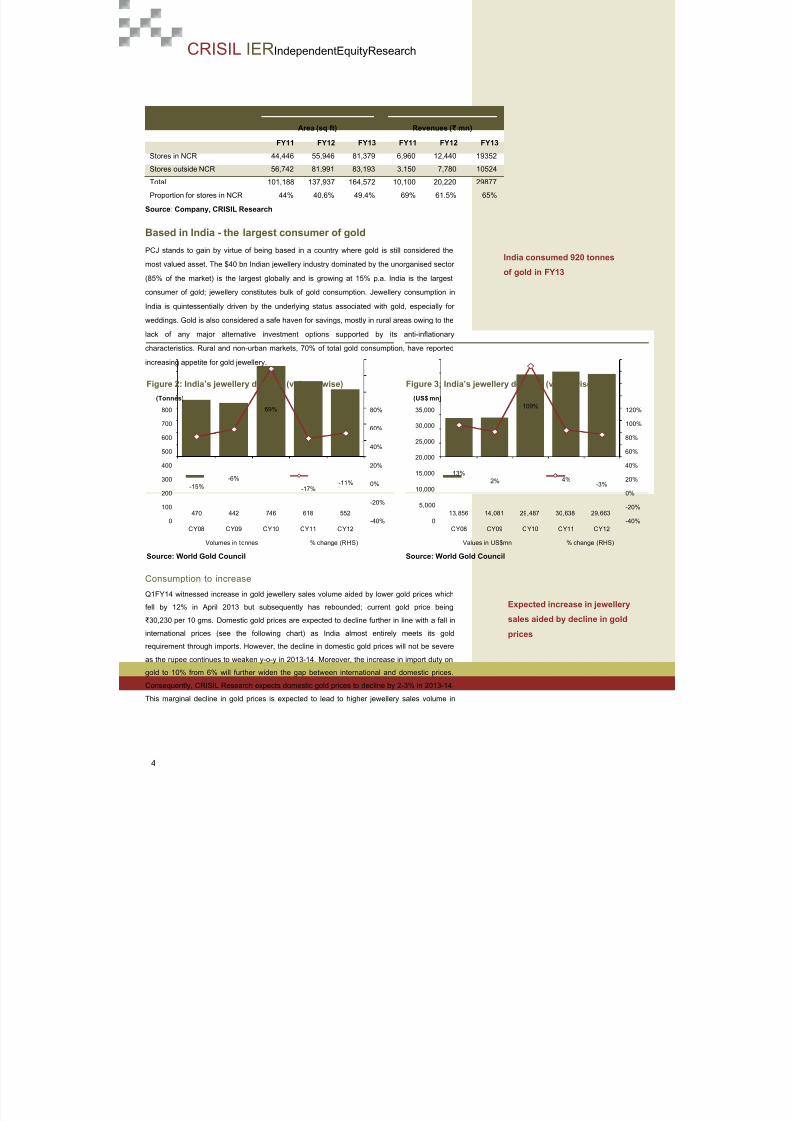
Table 2: Steady revenues from NCR
Area (sq ft) Revenues ( ₹ mn)
FY11 FY12 FY13 FY11 FY12 FY13
Stores in NCR 44,446 55,946 81,379 6,960 12,440 19352
Stores outside NCR 56,742 81,991 83,193 3,150 7,780 10524
Total 101,188 137,937 164,572 10,100 20,220 29877
Proportion for stores in NCR 44% 40.6% 49.4% 69% 61.5% 65%
Source : Company, CRISIL Research
Based in India - the largest consumer of gold
PCJ stands to gain by virtue of being based in a country where gold is still considered the
most valued asset. The $40 bn Indian jewellery industry dominated by the unorganised sector
(85% of the market) is the largest globally and is growing at 15% p.a. India is the largestconsumer of gold; jewellery constitutes bulk of gold consumption. Jewellery consumption in
India is quintessentially driven by the underlying status associated with gold, especially for
weddings. Gold is also considered a safe haven for savings, mostly in rural areas owing to the
lack of any major alternative investment options supported by its anti-inflationary
characteristics. Rural and non-urban markets, 70% of total gold consumption, have reported
increasing appetite for gold jewellery.
Figure 2: India’s jewellery demand (volume-wise) Figure 3: India’s jewellery demand (value-wise)
Source: World Gold Council Source: World Gold Council
Consumption to increase
Q1FY14 witnessed increase in gold jewellery sales volume aided by lower gold prices which
fell by 12% in April 2013 but subsequently has rebounded; current gold price being
₹ 30,230 per 10 gms. Domestic gold prices are expected to decline further in line with a fall in
international prices (see the following chart) as India almost entirely meets its gold
requirement through imports. However, the decline in domestic gold prices will not be severe
as the rupee continues to weaken y-o-y in 2013-14. Moreover, the increase in import duty on
gold to 10% from 6% will further widen the gap between international and domestic prices.
Consequently, CRISIL Research expects domestic gold prices to decline by 2-3% in 2013-14.
This marginal decline in gold prices is expected to lead to higher jewellery sales volume in
470 442 746 618 552
-15%-6%
69%
-17%-11%
-40%
-20%
0%
20%
40%
60%
80%
0
100
200
300
400
500
600
700
800
CY08 CY09 CY10 CY11 CY12
(Tonnes)
Volumes in tonnes % change (RHS)
13,856 14,081 29,487 30,638 29,663
13%2%
109%
4%-3%
-40%
-20%
0%
20%
40%
60%
80%
100%
120%
0
5,000
10,000
15,000
20,000
25,000
30,000
35,000
CY08 CY09 CY10 CY11 CY12
(US$ mn)
Values in US$mn % change (RHS)
Expected increase in jewellery
sales aided by decline in gold
prices
India consumed 920 tonnes
of gold in FY13
8/13/2019 20130918 PC Jeweller Ltd IER InitiationReport 2
http://slidepdf.com/reader/full/20130918-pc-jeweller-ltd-ier-initiationreport-2 7/28
`
PC Jeweller Ltd
5
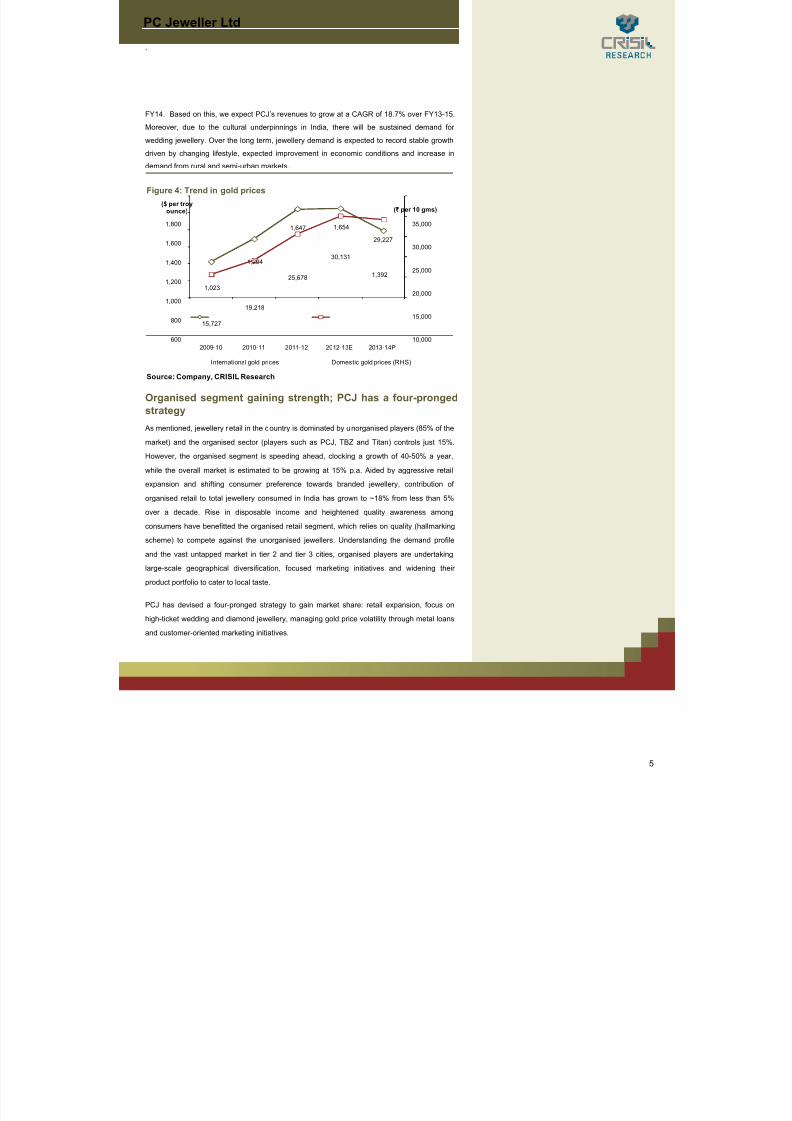
FY14. Based on this, we expect PCJ’s revenues to grow at a CAGR of 18.7% over FY13-15.
Moreover, due to the cultural underpinnings in India, there will be sustained demand for
wedding jewellery. Over the long term, jewellery demand is expected to record stable growthdriven by changing lifestyle, expected improvement in economic conditions and increase in
demand from rural and semi-urban markets.
Figure 4: Trend in gold prices
Source: Company, CRISIL Research
Organised segment gaining strength; PCJ has a four-pronged
strategy As mentioned, jewellery retail in the country is dominated by unorganised players (85% of the
market) and the organised sector (players such as PCJ, TBZ and Titan) controls just 15%.
However, the organised segment is speeding ahead, clocking a growth of 40-50% a year,
while the overall market is estimated to be growing at 15% p.a. Aided by aggressive retail
expansion and shifting consumer preference towards branded jewellery, contribution of
organised retail to total jewellery consumed in India has grown to ~18% from less than 5%
over a decade. Rise in disposable income and heightened quality awareness among
consumers have benefitted the organised retail segment, which relies on quality (hallmarking
scheme) to compete against the unorganised jewellers. Understanding the demand profile
and the vast untapped market in tier 2 and tier 3 cities, organised players are undertakinglarge-scale geographical diversification, focused marketing initiatives and widening their
product portfolio to cater to local taste.
PCJ has devised a four-pronged strategy to gain market share: retail expansion, focus on
high-ticket wedding and diamond jewellery, managing gold price volatility through metal loans
and customer-oriented marketing initiatives.
1,023
1,294
1,647 1,654
1,392
15,727
19,218
25,678
30,131
29,227
10,000
15,000
20,000
25,000
30,000
35,000
600
800
1,000
1,200
1,400
1,600
1,800
2009-10 2010-11 2011-12 2012-13E 2013-14P
(₹ per 10 gms)($ per troy
ounce)
International gold prices Domestic gold prices (RHS)

8/13/2019 20130918 PC Jeweller Ltd IER InitiationReport 2
http://slidepdf.com/reader/full/20130918-pc-jeweller-ltd-ier-initiationreport-2 8/28
CRISIL IERIndependentEquityResearch
6
Table 3: Strong growth of organised players
Players’ profile Unit Titan Gitanjali PCJ TBZ Thangamayil
Sales (FY13) ₹ mn 101,233 72,090 40,184 16,494 15,248Sales 3-yr CAGR % 23% 32% 43% 18% 52%No. of stores (POS) in FY13 No. 179 4,000 30 25 26Current sq ft (FY13) sq ft 602,000 1,700,000 164,572 82,368 60,383
Retail model Franchisees, COCO,SISFranchisees, SIS,
COCO & distributorsOwn stores Own stores Own stores
Source: Company, CRISIL Research
Aggressive retail expansi on
In the past three years, PCJ has opened 26 stores across 10 states in India. As of Q1FY14, it
has 36 stores. PCJ’s expansion is based on the cluster strategy - targeting cities and towns
with higher income segment in a particular region. During FY08-10, its initial focus was onNCR and it targeted popular cities to gain a strong foothold in this region. It opened nine
stores in the same period: six in NCR and one each in Panchkula, Chandigarh and Dehradun.
In order to further penetrate in the North, it has expanded aggressively since FY11 targeting
major cities in UP, Rajasthan, Punjab and Uttarakhand. During the same period, it also made
its presence felt in Central India (four stores in FY11-12). In FY13, it opened five stores in
NCR and one in the North. The strategically located network of retail showrooms has helped
PCJ consolidate its position in NCR and North India.
The cluster strategy has helped PCJ to achieve scalability, increased brand awareness, better
operating efficiency and a huge customer base. For instance, noting that the customers fromthe region where the company operates share similar taste for jewellery, PCJ uses this
characteristic to attain scale. Also, due to its expanded network in the same regions, it has the
option to move slow selling items in different stores for better inventory management and
achieve economies of scale by producing similar designs. It also aided PCJ to expand at a
faster pace compared to other organised players and helped it achieve breakeven within one-
two years of operations of new stores.
Figure 5: PCJ’s expansion plan Figure 6: Space – added more than 30,000 sq ft each year
Source: Company, CRISIL Research Source: Company, CRISIL Research
1 1 2 3
7 7 8
13
1 2 3
7
12 13
3 4 4
0
2
4
6
8
10
12
14
F Y 0 6
F Y 0 7
F Y 0 8
F Y 0 9
F Y 1 0
F Y 1 1
F Y 1 2
F Y 1 3
(nos)
NCR North India (ex NCR) Central India (ex NCR)
13 13 1327 35
65
101
138
14
730
36
37
33
0
20
40
60
80
100
120
140160
180
F Y 0 6
F Y 0 7
F Y 0 8
F Y 0 9
F Y 1 0
F Y 1 1
F Y 1 2
F Y 1 3
(000' sqft)
Existing showrooms Addit ion of showrooms
PCJ opened 26 stores in the past
three years; currently has 36
stores

8/13/2019 20130918 PC Jeweller Ltd IER InitiationReport 2
http://slidepdf.com/reader/full/20130918-pc-jeweller-ltd-ier-initiationreport-2 9/28
`
PC Jeweller Ltd
7
We believe the relatively low penetration of the organised sector, particularly in the metro, tier
I and tier II cities and towns in India, provides significant growth opportunities for PCJ. The
company plans to further expand its retail network across various cities in North and CentralIndia and in certain key markets in the rest of India. PCJ plans to add 20 showrooms in FY14
and 20 more in FY15. Addition of stores will not only aid the company to garner more
revenues but also increase the brand visibility and geographical presence, thereby leading to
higher market share.
Table 4: Retail sales analysis FY13 FY12
Operational stores 30 24Total retail sales ( ₹ mn) 29,876 20,395Stores with annual revenues < ₹ 500 mn 7 12Stores with annual revenues btw ₹ 500-1000 mn 15 8Stores with annual revenues > ₹ 1000 mn 8 4
Source: Company, CRISIL Research
Table 5: Typical store level economics for a mature storeIndicative workings for a store with an area of 5,000 sq ft ( ₹ mn) Indicative capital employed at store level ( ₹ mn)
Target annual store sales 600 Rental deposit 3Gold: diamond jewellery mix 70:30 Security deposit for inventory 50Gross margins-gold 10% Store set-up cost@ ₹ 4,500 per sq ft 22.5Gross margins-diamond 30% Other 40Blended gross margins 96 (16%) Total capital employed (TCE) 115.5Store costs (% of sales)Rentals 1% Inventory at store level
Advertisement expenses 1% Total inventory 250Employee costs 1% Store inventory 187.5Other expenses/overhead 0.80% Back-end inventory 62.5EBITDA margins 73.2 (12.2%)Finance cost 18(3%) Target store-level return on total capital employedPBT 55.2 (9.2%) PAT ( ₹ mn) 38.64Tax 16.56 (30% on PBT) TCE ( ₹ mn) 115.5PAT 38.64 (6.5%) RoCE for the store 33%
Source: Company, CRISIL Research
Establishing f oothold in western and southern India will be challenging
Until FY13, PCJ lacked presence in western and southern India. Although it has now
expanded into western India by opening one store each in Ahmedabad (Gujarat) and
Vadodara (Gujarat) as of Q1FY14, it still lacks presence in southern India. However, with
many regional and national jewellery retailers as well as jewellery manufacturers and
exporters lining up aggressive expansion (Table 4) plans, competition is expected to intensify.
In FY12-13, the contribution of stores outside NCR to total revenues was 38% and 35%
respectively. Going forward, PCJ’s ability to successfully penetrate these regions and
establish a brand is a key monitorable.
Southern and western India on
the expansion plan
Plans to add 20 showrooms in
FY14 and 20 more in FY15
8/13/2019 20130918 PC Jeweller Ltd IER InitiationReport 2
http://slidepdf.com/reader/full/20130918-pc-jeweller-ltd-ier-initiationreport-2 10/28
CRISIL IERIndependentEquityResearch
8
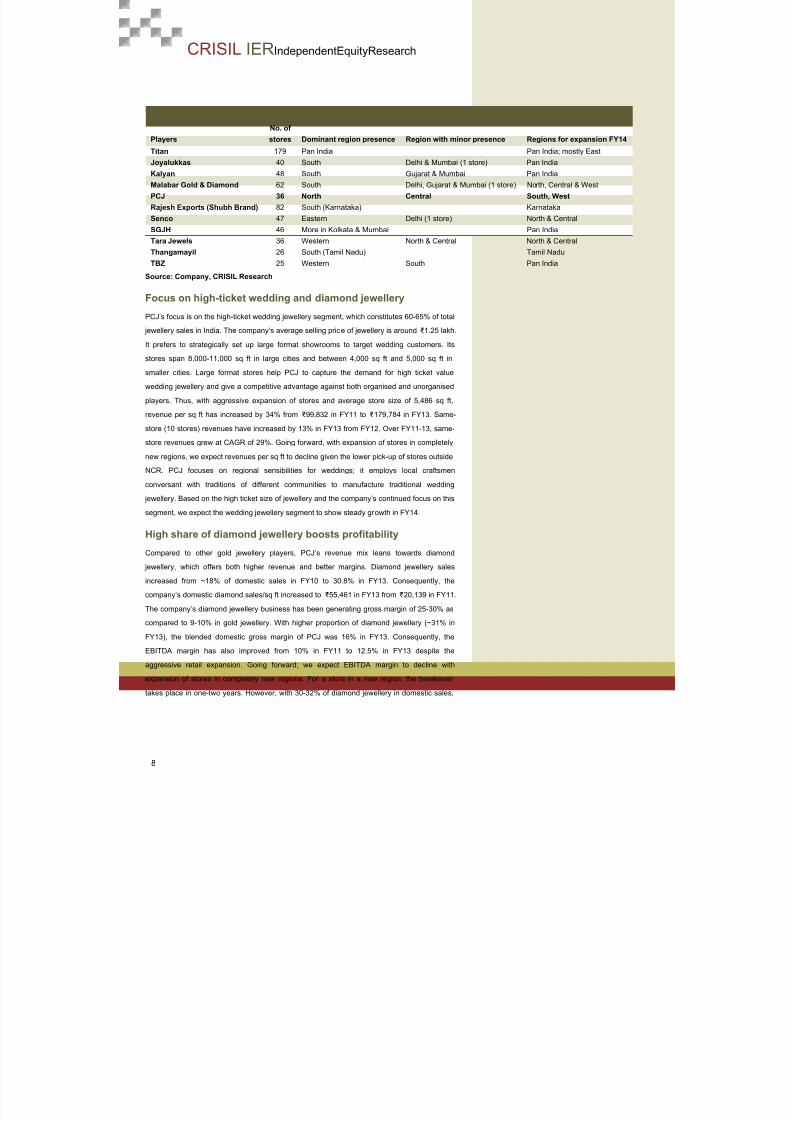
Table 6: Dominant regional and national players across India
Players
No. of
stores Dominant region presence Region with minor presence Regions for expansion FY14 Titan 179 Pan India Pan India; mostly EastJoyalukkas 40 South Delhi & Mumbai (1 store) Pan IndiaKalyan 48 South Gujarat & Mumbai Pan IndiaMalabar Gold & Diamond 62 South Delhi, Gujarat & Mumbai (1 store) North, Central & WestPCJ 36 North Central South, WestRajesh Exports (Shubh Brand) 82 South (Karnataka) KarnatakaSenco 47 Eastern Delhi (1 store) North & CentralSGJH 46 More in Kolkata & Mumbai Pan IndiaTara Jewels 36 Western North & Central North & Central Thangamayil 26 South (Tamil Nadu) Tamil NaduTBZ 25 Western South Pan India
Source: Company, CRISIL Research
Focus on high-ticket wedding and diamond jewellery
PCJ’s focus is on the high-ticket wedding jewellery segment, which constitutes 60-65% of total
jewellery sales in India. The company’s average selling price of jewellery is around ₹ 1.25 lakh.
It prefers to strategically set up large format showrooms to target wedding customers. Its
stores span 8,000-11,000 sq ft in large cities and between 4,000 sq ft and 5,000 sq ft in
smaller cities. Large format stores help PCJ to capture the demand for high ticket value
wedding jewellery and give a competitive advantage against both organised and unorganised
players. Thus, with aggressive expansion of stores and average store size of 5,486 sq ft,
revenue per sq ft has increased by 34% from ₹ 99,832 in FY11 to ₹ 179,784 in FY13. Same-store (10 stores) revenues have increased by 13% in FY13 from FY12. Over FY11-13, same-
store revenues grew at CAGR of 29%. Going forward, with expansion of stores in completely
new regions, we expect revenues per sq ft to decline given the lower pick-up of stores outside
NCR. PCJ focuses on regional sensibilities for weddings; it employs local craftsmen
conversant with traditions of different communities to manufacture traditional wedding
jewellery. Based on the high ticket size of jewellery and the company’s continued focus on this
segment, we expect the wedding jewellery segment to show steady growth in FY14.
High share of diamond jewellery boosts profitability
Compared to other gold jewellery players, PCJ’s revenue mix leans towards diamond jewellery, which offers both higher revenue and better margins. Diamond jewellery sales
increased from ~18% of domestic sales in FY10 to 30.8% in FY13. Consequently, the
company’s domestic diamond sales/sq ft increased to ₹ 55,461 in FY13 from ₹ 20,139 in FY11.
The company’s diamond jewellery business has been generating gross margin of 25-30% as
compared to 9-10% in gold jewellery. With higher proportion of diamond jewellery (~31% in
FY13), the blended domestic gross margin of PCJ was 16% in FY13. Consequently, the
EBITDA margin has also improved from 10% in FY11 to 12.5% in FY13 despite the
aggressive retail expansion. Going forward; we expect EBITDA margin to decline with
expansion of stores in completely new regions. For a store in a new region, the breakeven
takes place in one-two years. However, with 30-32% of diamond jewellery in domestic sales,

8/13/2019 20130918 PC Jeweller Ltd IER InitiationReport 2
http://slidepdf.com/reader/full/20130918-pc-jeweller-ltd-ier-initiationreport-2 11/28
`
PC Jeweller Ltd
9
the decline in EBITDA margin will be marginal. Compared to other organised retail players,
PCJ had average revenues/sq ft/month of ~ ₹ 15,000 in FY13 due to the high proportion of
diamond jewellery. Despite the aggressive retail expansion, PCJ was able to maintain RoCE
at around 35% in FY13. The increasing share of high-margin diamond jewellery in sales has
contributed to better return ratios over the past few years. However, diamond jewellery poses
a high risk of inventory obsolescence and higher inventory days as compared to gold
jewellery. Even with the exposure to this risk, PCJ has been able to maintain its margins over
the years.
Figure 7: Increase in diamond jewellery sales
Figure 8: Increased focus of competitors on diamond jewellery
Source: Company, CRISIL Research Source: Company, CRISIL Research
Manages gold price volatility via metal loansPCJ procures 100% of the gold required for manufacturing under the gold loan schemes from
canalising agencies and international bullion suppliers. Under this arrangement, price of the
gold purchased is fixed on the basis of the then prevailing gold rate for sale to customers. This
mechanism minimises any risk relating to gold price fluctuations between the time of raw
material procurement and the sale of finished products to customers. This protects the
company from a sharp fall in gold prices and limits the upside in terms of inventory gain.
However, PCJ is exposed to the risk of volatility in diamond prices.
New regulations on gold im ports
Earlier, the RBI had banned banks from importing gold on a consignment basis for domestic
consumption. It had also mandated that nominated banks and other agencies could import
gold only on 100% cash basis, unlike using letter of credit (LC) benefits. This has now been
replaced with new norms, wherein the RBI has placed restrictions on gold import, and has
mandated that banks and nominated agencies should retain 20% (or one-fifth) of imported
gold in customs bonded warehouses. The importers will be able to further import gold only if
3/4 th of this 20% (3/4 th of the gold in warehouses) is exported (in any form, say jewellery).
Further, the RBI has excluded supplies to units in Special Economic Zones (SEZs) and export
units and to star/premier trading houses from being counted towards the 3/4th
(of 20%) export
81.20% 76.40% 72.60% 68.50%
17.90% 22.90% 26.70% 30.80%
0.90% 0.70% 0.70% 0.72%
0%
10%
20%
30%
40%
50%
60%
70%
80%
90%
100%
FY10 FY11 FY12 FY13Gold Jewellery Diamond Jewellery Other Jewellery
48
70 69 75
52
30 31 25
0%
10%
20%
30%
40%
50%
60%
70%
80%
90%
100%
Gitanjali Titan PCJ TBZ
Gold Jewellery Diamond Jewellery
Procures 100% of its goldrequirement under the gold loanschemes

8/13/2019 20130918 PC Jeweller Ltd IER InitiationReport 2
http://slidepdf.com/reader/full/20130918-pc-jeweller-ltd-ier-initiationreport-2 12/28
CRISIL IERIndependentEquityResearch
10
quota. The impact of these norms on PCJ would not be significant as it has both SEZ and
non-SEZ units that can cater to the export market. At the same time, many local players, who
trade only in the domestic market might witness tight supplies.
Regulations to benefit organised players compared to unorganised peers
Stringent regulations reduced imports in June 2013 to 35 tonnes from average 70 tonnes in
FY13 triggering a sharp rise in premium in the local market, thus making the survival of local
players difficult. Over the medium to long term, organised players will gain significant share
from unorganised players as they have funding cost advantage through metals loans .
Competitive landscape
Compared to other large traditional/regional players, PCJ has expanded at a faster pace and
has been able to break even within one-two years of operations of new stores. Also, PCJ hasbetter profit margins and has been able to maintain these margins despite aggressive retail
expansion.
Table 7: Better return ratios than competitors
Profitability/ratios (%) PCJ TBZ Thangamayil Gitanjali Titan
EBITDA margin (3-yr avg.) 11.1 8.4 8.6 7.2 9.6
PAT margin (3-yr avg.) 7.4 4.2 4.3 3.4 6.9
RoE (3-yr avg.) 46.9 43 40.7 15.1 46.7
RoCE (3-yr avg.) 42.8 22 30.4 26.5 43.7
Source: Company, CRISIL Research
The shift from unbranded jewellery to branded jewellery should provide some room for the
players to co-exist and compete on customer loyalty and variety, underlined by quality
assurance. On the flip side, this will likely lead to higher spending on advertising, lower
volumes and realisations and/or suppressed margins on gold jewellery. Given, the lower pick-
up in stores outside Delhi, PCJ’s ability to successfully penetrate these regions and establish
a brand is a key monitorable.
Low focus on exports
Exports’ contribution to total revenues has decreased from 33.5% in FY10 to 25% in FY13.
PCJ exports jewellery (80% gold and rest diamond as of FY13) to wholesalers in Dubai,Singapore and Hong Kong, with whom it enjoys a long-term relationship. Going forward, the
focus on exports will be lower due to rising competition from other countries. We estimate
export revenues to continue to contribute about ₹ 10 bn over the long term. This move is likely
to help the company reduce its working capital cycle in the long term as inventory and debtor
days are higher in the export markets than in the domestic market. Rising proportion of
diamond jewellery and slower growth in the export market will help PCJ maintain its margins.

8/13/2019 20130918 PC Jeweller Ltd IER InitiationReport 2
http://slidepdf.com/reader/full/20130918-pc-jeweller-ltd-ier-initiationreport-2 13/28
`
PC Jeweller Ltd
11
Figure 9: Decline in exports
Source: Company, CRISIL Research
67% 66% 67%74%
34% 34% 33%26%
0%
10%
20%
30%
40%
50%
60%
70%
80%
90%
100%
FY10 FY11 FY12 FY13
Domestic Sales Export Sales
8/13/2019 20130918 PC Jeweller Ltd IER InitiationReport 2
http://slidepdf.com/reader/full/20130918-pc-jeweller-ltd-ier-initiationreport-2 14/28
CRISIL IERIndependentEquityResearch
12
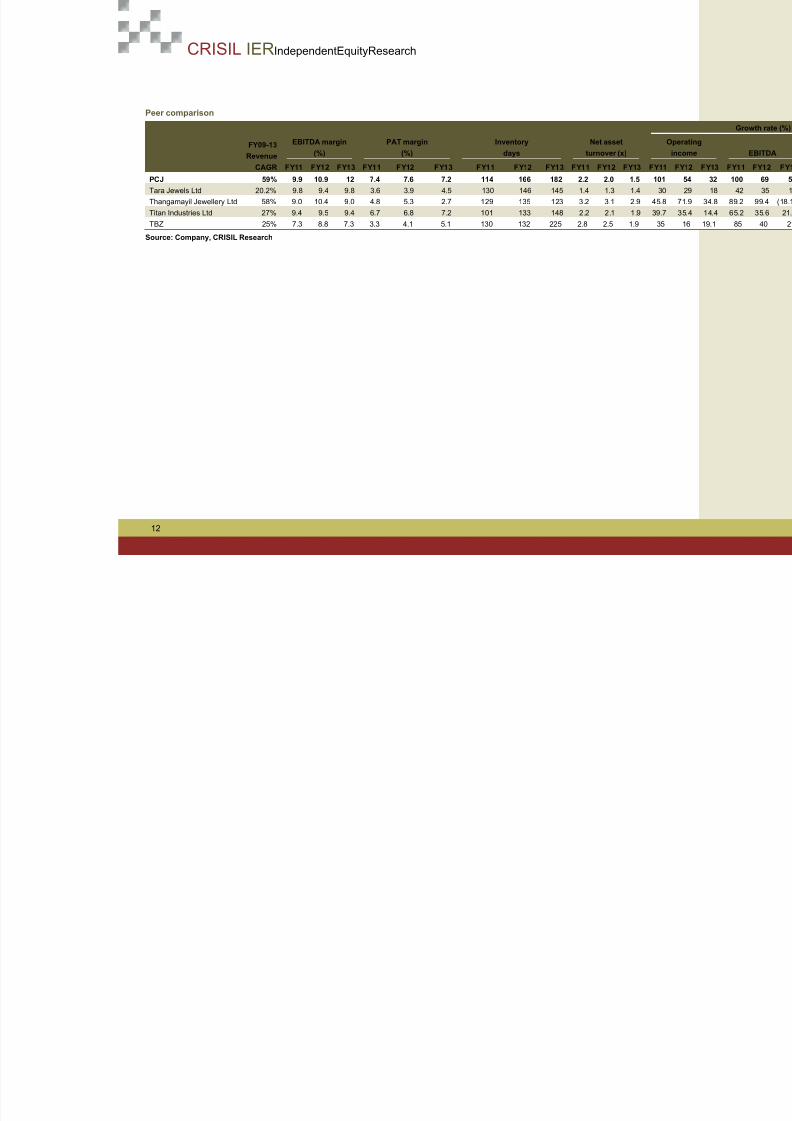
Peer comparison
FY09-13Revenue
CAGR
EBITDA margin(%)
PAT margin(%)
Inventorydays
Net assetturnover (x)
Opin
FY11 FY12 FY13 FY11 FY12 FY13 FY11 FY12 FY13 FY11 FY12 FY13 FY11 FY12 F
PCJ 59% 9.9 10.9 12 7.4 7.6 7.2 114 166 182 2.2 2.0 1.5 101 54 Tara Jewels Ltd 20.2% 9.8 9.4 9.8 3.6 3.9 4.5 130 146 145 1.4 1.3 1.4 30Thangamayil Jewellery Ltd 58% 9.0 10.4 9.0 4.8 5.3 2.7 129 135 123 3.2 3.1 2.9 45.8 7Titan Industries Ltd 27% 9.4 9.5 9.4 6.7 6.8 7.2 101 133 148 2.2 2.1 1.9 39.7 3TBZ 25% 7.3 8.8 7.3 3.3 4.1 5.1 130 132 225 2.8 2.5 1.9 35 16
Source: Company, CRISIL Research

8/13/2019 20130918 PC Jeweller Ltd IER InitiationReport 2
http://slidepdf.com/reader/full/20130918-pc-jeweller-ltd-ier-initiationreport-2 15/28
`
PC Jeweller Ltd
13
Key RisksSector under scanner due to high CAD
At 920 tonnes in 2012-13, India's gold consumption (Jewellery and Bars and Coins) is the
largest globally. It meets most of its requirements through imports. Gold accounts for about
10% of India's overall imports in value terms. Robust demand and high prices of the yellow
metal weigh heavily on the country's current account deficit (CAD), especially at times when
export growth is decelerating. In FY13 CAD was high at 5.1% of GDP. This necessitated
stronger measures to control gold imports. The government hiked the import duty from 2% (a
year ago) in phased steps to 10% and the RBI has put further curbs on gold import mandating
that banks and nominated agencies should retain 20% (or one-fifth) of every lot of gold
imports in the customs bonded warehouses. Going ahead, with stringent restrictions on
imports to control CAD, the availability of gold supplies will be in question. This could raisedomestic gold premiums, driving up raw material costs and, thus, affecting profitability of
jewellery retailers.
High geographic concentrationPCJ’s addressable market is largely restricted to North India with some presence in Central
India. With aggressive expansion plans of organised players such as TBZ and Titan;
competition is expected to intensify. Until FY13, the company had no presence in southern
and western India. PCJ will find it challenging to enter the South market which already has
established players such Thangamayil, Joyalukkas, Kalyan and pan-India players such as
Titan whose scale of operations is much larger. Moreover, most of the regional players suchas Malabar, Tara Jewels and Senco have plans to expand in North India. This will further
intensify competition for PCJ in North India. Coupled with little brand equity outside North,
PCJ’s addressable market is restricted compared to other players such as Titan who have
managed to create a brand outside their respective strongholds and reduced their
geographical concentration.
Inventory RiskPCJ has been increasing its focus on high-margin diamond jewellery. Its share increased from
18% of FY10 domestic sales to 31% in FY13. In case of old/unsold diamond jewellery
inventory, the cost in terms of time spent in removing small-sized diamonds from jewellery ishigh. Also, it is difficult to use recycled small diamonds for new jewellery due to the different
size, shapes and cuts of small di amonds.
Measures to curb gold importslikely to marginally impact PCJ

8/13/2019 20130918 PC Jeweller Ltd IER InitiationReport 2
http://slidepdf.com/reader/full/20130918-pc-jeweller-ltd-ier-initiationreport-2 16/28
CRISIL IERIndependentEquityResearch
14
Financial Outlook
Sales to grow at a CAGR of 18.7% over FY13-15 EBITDA margin to be steady
Source: Company, CRISIL Research Source: Company, CRISIL Research
PAT margins to decline, PAT to grow at steady level RoE and RoCE to fall, though will remain healthy
Source: Company, CRISIL Research Source: Company, CRISIL Research
Revenue per sq ft to decline due to aggressive expansion EPS to be steady
Source: Company, CRISIL Research Source: Company, CRISIL Research
19,772 30,419 40,184 49,403 56,628
101
54
3223
15
-
20
40
60
80
100
120
-
10,000
20,000
30,000
40,000
50,000
60,000
FY11 FY12 FY13 FY14E FY15E
(₹ mn)
Revenues Growth (%) (RHS)
1,965 3,314 4,825 5,319 5,918
9.910.9
12.010.8
10.5
0.0
2.0
4.0
6.0
8.0
10.0
12.0
14.0
-
1,000
2,000
3,000
4,000
5,000
6,000
7,000
FY11 FY12 FY13 FY14E FY15E
(%)(₹ mn)
EBIDTA EBIDTA Margin (RHS)
1,453 2,334 2,937 3,305 3,368
7.4 7.77.3
6.75.9
-
1.0
2.0
3.0
4.0
5.0
6.0
7.0
8.0
9.0
-
500
1,000
1,500
2,000
2,500
3,000
3,500
4,000
FY11 FY12 FY13 FY14E FY15E
(%)(₹ mn)
Adj PAT Adj PAT M argin (RHS)
57.853.3
30.3
21.518.2
53.3
40.834.4
29.6 29.0
0
10
20
30
40
50
60
70
FY11 FY12 FY13 FY14E FY15E
(₹ mn)
ROE ROCE
10,61612,733
14,87412,078 11,564
-
2,000
4,000
6,000
8,000
10,000
12,00014,000
16,000
FY11 FY12 FY13 FY14E FY15E
(₹ )
Revenues/Sqft/month (Rs)
32.6
17.4 16.4 18.5 18.8
-
5.0
10.0
15.0
20.0
25.0
30.0
35.0
FY11 FY12 FY13 FY14E FY15E
(₹ )
Adj EPS

8/13/2019 20130918 PC Jeweller Ltd IER InitiationReport 2
http://slidepdf.com/reader/full/20130918-pc-jeweller-ltd-ier-initiationreport-2 17/28
`
PC Jeweller Ltd
15
Management OverviewCRISIL's fundamental grading methodology includes a broad assessment of management
quality, apart from other key factors such as industry and business prospects, and financial
performance. Overall, we believe that the management has an established track record and
strong understanding of the jewellery business.
Family-run business, experienced managementThe promoters have been in the jewellery business in India for more than two decades. They
are closely involved in the overall strategy, direction and management of the business and
have been responsible for the growth of the business. Mr Balram Garg, 42, is the managing
director and Mr Padam Chand Gupta, 55, is the chairman. The entire decision-making process
at PCJ is centralised.
Second line of managementThe top management is supported by Mr Gupta’s sons and a team of professionals. The
management personnel have vast experience in their domain and are associated with the
company for over half a decade.
Designation Employee Background
Chief operating officer Mr R. K. Sharma M Com; over 29 years of experience in foreign exchange, credit andadministration sectors
Chief finance officer Mr Sanjeev Bhatia MA, MBA; over 25 years of experience in the finance sector
President (HR & business development) Mr T. M. Lakshmi Kanthan B.Sc; over 40 years of experience in the banking sector
President (diamond manufacturing) Mr Nitin Gupta B Com, Delhi University; over 15 years of experience in the jewellery sector
President (gold manufacturing) Mr Sachin Gupta B Com, Delhi University; over 15 years of experience in the jewellerysector
Senior vice president (accounts & taxation) Mr Raja Ram Sugla B Com, CA; over 10 years of experience in the jewellery sector
Senior vice president (projects & audit) Mr Kuldeep Singh B.Sc, CA; over five years of experience in accounts and taxation
Company secretary & compliance officer Mr Vijay Pawar B.Sc, CS; over six years of experience in legal and secretarial functions

8/13/2019 20130918 PC Jeweller Ltd IER InitiationReport 2
http://slidepdf.com/reader/full/20130918-pc-jeweller-ltd-ier-initiationreport-2 18/28
CRISIL IERIndependentEquityResearch
16
Corporate Governance
CRISIL’s fundamental grading methodology includes a broad assessment of corporate
governance and management quality, apart from other key factors such as industry and
business prospects, and financial performance. In this context, CRISIL Research analyses the
shareholding structure, board composition, typical board processes, disclosure standards and
related-party transactions. Any qualifications by regulators or auditors also serve as useful
inputs while assessing a company’s corporate governance. Overall, corporate governance at
PCJ meets the minimum levels supported by reasonably good board practices and an
independent board.
Board composition
The board comprises four directors, of which two are independent directors. The independent
directors have been on the board since September 2011. This is in keeping with SEBI’s
Clause 49. Based on our interaction with the independent directors, we believe they possess
a fair understanding of the company’s business and processes.
Profile of independent directors
Name Age Qualification Date of appointment Experience
Manohar LalSingla
54 Master’s degree in Business Administration and Doctor ofPhilosophy in Management from the University of Delhi
September 2011Over 25 years ineducation
Krishan KumarKhurana
55 Master’s degree in Arts from Kurukshetra University, Kurukshetra;Bachelor’s degree in Law from the University of Delhi
September 2011Over 25 years inlegal services
Source: Company
Board’s processes
The company’s quality of disclosure can be considered good judged by the level of
information and details furnished in the annual report, websites and other publicly available
data. The company has all the necessary committees – audit, remuneration and investor
grievance - in place to support corporate governance practices. The audit committee is
chaired by an independent director, Mr Manohar Lal Singla.
Compensation level of key management personnel is l ow
The compensation structure for key management personnel (FY12) appears low which can
result in attrition. However, most of the senior people in the management have been
associated with the company for a long time which minimises this risk. The compensation
structure for key management personnel for FY13 is not available to us. Going forward, the
company is contemplating about ESOPs to retain key managerial personnel.
8/13/2019 20130918 PC Jeweller Ltd IER InitiationReport 2
http://slidepdf.com/reader/full/20130918-pc-jeweller-ltd-ier-initiationreport-2 19/28
`
PC Jeweller Ltd
17
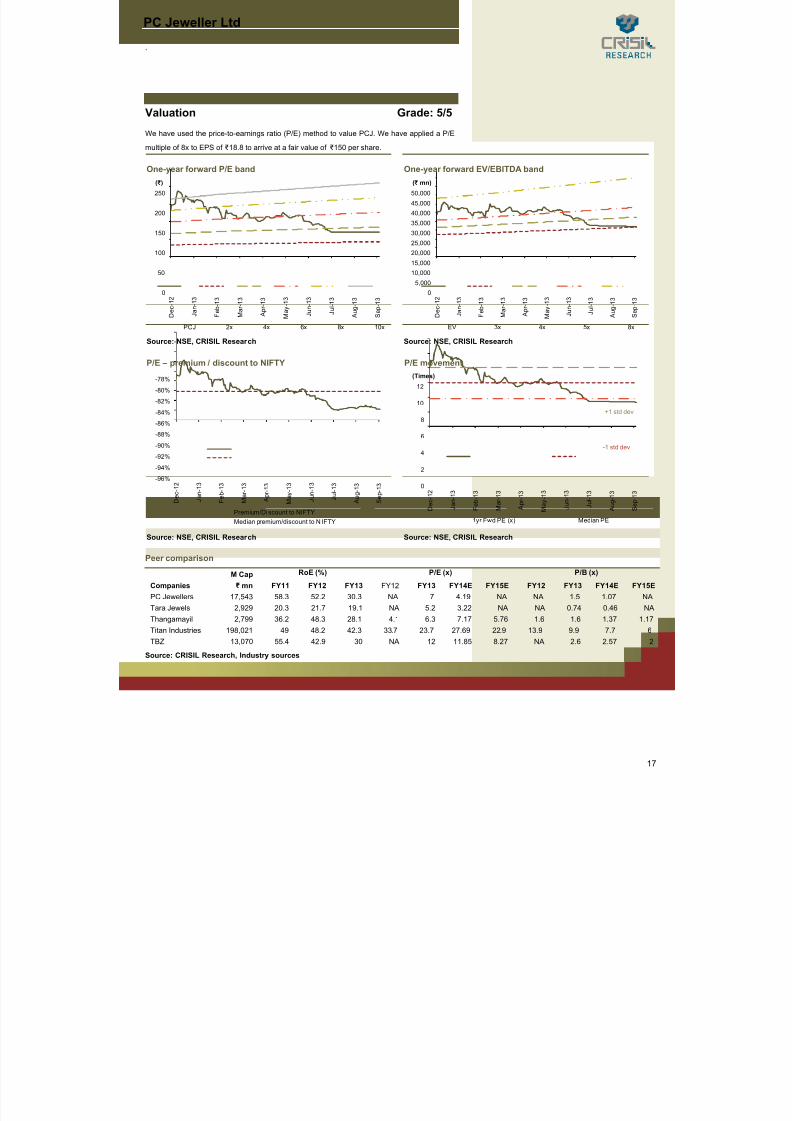
Valuation Grade: 5/5We have used the price-to-earnings ratio (P/E) method to value PCJ. We have applied a P/E
multiple of 8x to EPS of ₹ 18.8 to arrive at a fair value of ₹ 150 per share.
One-year forward P/E band One-year forward EV/EBITDA band
Source: NSE, CRISIL Research Source: NSE, CRISIL Research
P/E – premium / discount to NIFTY P/E movement
Source: NSE, CRISIL Research Source: NSE, CRISIL Research
Peer comparison
CompaniesM Cap RoE (%) P/E (x) P/B (x)₹ mn FY11 FY12 FY13 FY12 FY13 FY14E FY15E FY12 FY13 FY14E FY15E
PC Jewellers 17,543 58.3 52.2 30.3 NA 7 4.19 NA NA 1.5 1.07 NATara Jewels 2,929 20.3 21.7 19.1 NA 5.2 3.22 NA NA 0.74 0.46 NAThangamayil 2,799 36.2 48.3 28.1 4.1 6.3 7.17 5.76 1.6 1.6 1.37 1.17Titan Industries 198,021 49 48.2 42.3 33.7 23.7 27.69 22.9 13.9 9.9 7.7 6TBZ 13,070 55.4 42.9 30 NA 12 11.85 8.27 NA 2.6 2.57 2
Source: CRISIL Research, Industry sources
0
50
100
150
200
250
D e c - 1
2
J a n - 1
3
F e b - 1
3
M a r - 1 3
A p r - 1 3
M a y - 1
3
J u n - 1
3
J u l - 1 3
A u g - 1
3
S e p - 1
3
(₹ )
PCJ 2x 4x 6x 8x 10x
05,000
10,00015,000
20,00025,00030,00035,00040,00045,000
50,000
D e c - 1
2
J a n - 1
3
F e b - 1
3
M a r - 1 3
A p r - 1 3
M a y - 1
3
J u n - 1
3
J u l - 1 3
A u g - 1
3
S e p - 1
3
(₹ mn)
EV 3x 4x 5x 8x
-96%
-94%
-92%
-90%
-88%
-86%-84%
-82%
-80%
-78%
D e c - 1
2
J a n - 1
3
F e b - 1
3
M a r - 1 3
A p r - 1 3
M a y - 1
3
J u n - 1
3
J u l - 1 3
A u g - 1
3
S e p - 1
3
Premium/Di scount to NIFTYMedian premium/discount to N IFTY
0
2
4
6
8
10
12
D e c - 1
2
J a n - 1
3
F e b - 1
3
M a r - 1 3
A p r - 1 3
M a y - 1
3
J u n - 1
3
J u l - 1 3
A u g - 1
3
S e p - 1
3
(Times)
1yr Fwd PE (x) Median PE
+1 std dev
-1 std dev

8/13/2019 20130918 PC Jeweller Ltd IER InitiationReport 2
http://slidepdf.com/reader/full/20130918-pc-jeweller-ltd-ier-initiationreport-2 20/28
CRISIL IERIndependentEquityResearch
18
Company Overview
PCJ was established in 2005 after a split between the two promoter families of PP Jewellers.
PP Jewellers was set up in 1993 by Mr Padam Chand Gupta and Mr Kamal Gupta; after the
business was split in 2005, Mr PC Gupta retained the flagship showroom in Karol Bagh under
PCJ. PCJ (Delhi-based) is promoted by brothers Mr Padam Chand Gupta and Mr Balram
Garg. The company is largely a domestic retail player well established in North India. In 2012,
PCJ was listed on the NSE and the BSE through an IPO of ₹ 6,000 mn.
Business profile
Retailing of gold and diamond-studded jewellery : PCJ manufactures jewellery made of
gold, diamond and other precious stones, platinum and silver. It retails gold jewellery and
diamond-studded jewellery under the PC Jeweller brand. In FY13, domestic operations
accounted for 75% of total revenues. As of FY13 it has 30 showrooms in 23 cities in North and
Central India totalling ~166k sq ft. The company intends to add 20 new showrooms in FY14
(133,000 sq ft) using the proceeds from the IPO. In Q1FY14, PCJ opened six stores adding
33,000 sq ft, expanding its reach in 28 cities in 10 states.
Manufacturing facilities
Location Commissioning date Purpose Area in sq ft
Noida SEZ, Uttar Pradesh 20-Nov-07 Jewellery for exports 36,570Noida SEZ, Uttar Pradesh 3-Mar-11 Jewellery for exports 3,938Selaqui, Dehradun, Uttarakhand 30-Mar-10 Jewellery for domestic market 8,611Noida, Uttar Pradesh 17-Nov-11 Jewellery for domestic 34,000
Source: CRISIL Research
Export: PCJ exports gold and diamond jewellery to international distributors in Dubai,
Singapore and Hong Kong. The export sales contribution to total revues was 25% in FY13.
Going forward, the focus on export will be lower.
Key Milestones
2005 ■ The company was incorporated as P Chand Jewellers Private Ltd■ Showroom in Karol Bagh (New Delhi) opened
2007 ■ Showrooms in Noida and Panchkula (New Delhi) opened■ Export operations from the manufacturing unit in the Noida SEZ c ommenced
2008 ■ Showrooms in Faridabad and Dehradun opened
2009 ■ Operations at the manufacturing unit in Selaqui, Dehradun commenced■ Showrooms in Pitampura (New Delhi) and Chandigarh opened
2010 ■ Operations at the second manufacturing unit in Selaqui, Dehradun commenced■ Showrooms opened in Preet Vihar (New Delhi), Ghaziabad, Gurgaon, Lucknow, Indore, Bhopal, Raipur, Jodhpur and Bhilwara
2011 ■ Converted from private limited to public limited
■ Operations from the second export unit in the Noida SEZ c ommenced■ Showrooms opened in Ludhiana, Haridwar, Bilaspur, Pali, South Extension (New Delhi), Beawar, Ajmer and Amritsar■ Operations at the manufacturing unit in Noida commenced
2012 ■ Showrooms opened in Kanpur, Rohtak, Indirapuram (Ghaziabad), Rajouri Garden (New Delhi), Kingsway Camp (New Delhi) and
Greater Kailash-I (New Delhi)

8/13/2019 20130918 PC Jeweller Ltd IER InitiationReport 2
http://slidepdf.com/reader/full/20130918-pc-jeweller-ltd-ier-initiationreport-2 21/28
`
PC Jeweller Ltd
19
Annexure: Financial
*Quarterly numbers are available from Q3FY13
Source: CRISIL Research
Income statement Balance Sheet(₹ m n) FY11 FY12 FY13 FY14E FY15E (₹ mn) FY11 FY12 FY13 FY14E FY15EOperating income 19,772 30,419 40,184 49,403 56,628 LiabilitiesEBITDA 1,965 3,314 4,825 5,319 5,918 Equity share capital 447 1,340 1,791 1,791 1,791 EBITDA margin 9.9% 10.9% 12.0% 10.8% 10.5% Reserves 2,807 4,162 12,097 15,128 18,217 Depreciation 30 66 100 142 206 Minorities - - - - - EBIT 1,935 3,248 4,725 5,177 5,712 Net worth 3,254 5,502 13,888 16,919 20,008 Interest 369 751 1,251 1,305 1,503 Convertible debt - - - - 1 Operating PBT 1,566 2,497 3,474 3,872 4,208 Other debt 1,396 5,783 2,331 1,822 599 Other income 77 174 202 594 536 Total debt 1,396 5,783 2,331 1,822 600 Exceptional inc/(exp) 14 (21) (411) - - Deferred tax liability (net) (4) (4) (50) (50) (50) PBT 1,657 2,650 3,265 4,467 4,744 Total liabilities 4,645 11,280 16,169 18,691 20,558 Tax provision 189 337 739 1,161 1,376 AssetsMinority interest - - - - - Net fixed assets 317 566 628 986 1,279 PAT (Reported) 1,467 2,313 2,527 3,305 3,368 Capital WIP 50 219 292 292 292
Less: Exceptionals 14 (21) (411) - - Total fixed assets 366 784 919 1,277 1,571 Adjusted PAT 1,453 2,334 2,937 3,305 3,368 Investments - 0 1 1 1 Current assets
Ratios 59% Inventory 5,501 11,724 17,137 22,333 24,513 FY11 FY12 FY13 FY14E FY15E Sundry debtors 4,248 6,985 6,762 8,314 9,530
Growth Loans and advances 467 929 2,659 2,470 2,831 Operating income (%) 100.5 53.9 32.1 22.9 14.6 Cash & bank balance 223 791 2,846 3,157 3,298 EBITDA (%) 99.5 68.7 45.6 10.3 11.3 Marketable securities - - 4,429 4,429 4,429
Adj PAT (%) 118.5 60.6 25.9 12.5 1.9 Total current assets 10,439 20,430 33,833 40,702 44,601 Adj EPS (%) 96.5 (46.5) (5.9) 12.5 1.9 Total current liabilities 6,160 9,944 18,595 23,299 25,625
Net current assets 4,279 10,486 15,239 17,403 18,976 Profitability Intangibles/Misc. expenditure - 10 10 10 10 EBITDA margin (%) 9.9 10.9 12.0 10.8 10.5 Total assets 4,645 11,280 16,169 18,691 20,558
Adj PAT Margin (%) 7.4 7.7 7.3 6.7 5.9 RoE (%) 57.8 53.3 30.3 21.5 18.2 Cash flowRoCE (%) 53.3 40.8 34.4 29.6 29.0 (₹ mn) FY11 FY12 FY13 FY14E FY15E
RoIC (%) 57.3 43.7 36.8 35.9 32.9 Pre-tax profit 1,643 2,671 3,676 4,467 4,744 Total tax paid (186) (337) (785) (1,161) (1,376)
Valuations Depreciation 30 66 100 142 206 Price-earnings (x) - - 7.0 3.8 3.7 Working capital changes (2,122) (5,639) 1,730 (1,854) (1,432) Price-book (x) - - 1.5 0.7 0.6 Net cash from operations (636) (3,239) 4,722 1,594 2,143 EV/EBITDA (x) 0.6 1.5 3.2 1.3 0.9 Cash from investmentsEV/Sales (x) 0.1 0.2 0.4 0.1 0.1 Capital expenditure (141) (494) (235) (500) (500) Dividend payout ratio (%) - - 7.1 16.2 15.9 Investments and others - (0) (4,429) - - Dividend yield (%) 0.9 4.3 4.3 Net cas h from investm ents (141) (494) (4,665) (500) (500)
Cash from financingB/S ratios Equity raised/(repaid) 270 668 5,633 - - Inventory days 114 166 182 191 183 Debt raised/(repaid) 561 4,387 (3,452) (509) (1,222) Creditors days 125 126 181 185 176 Dividend (incl. tax) - - (210) (537) (537) Debtor days 78 84 61 61 61 Others (incl extraordinaries) (248) (754) 26 263 258 Working capital days 75 116 72 73 73 Net cash from financing 583 4,301 1,997 (783) (1,501) Gross as set turnover ( x) 61.9 55.9 51.5 44.5 35.2 Change in cash position (194) 568 2,054 311 141
Net asset turnover (x) 75.5 69.0 67.3 61.2 50.0 Closing cash 223 791 2,846 3,157 3,298 Sales /o perating as sets (x ) 6 3.7 52.9 47.2 45.0 39.8 Current ratio (x) 1.7 2.1 1.8 1.7 1.7 Quarterly financials*Debt-equity (x) 0.4 1.1 0.2 0.1 0.0 (₹ mn) Q1FY13 Q2FY13 Q3FY13 Q4FY13 Q1FY14Net debt/equity (x) 0.4 0.9 (0.4) (0.3) (0.4) Net Sales 10,185 11,442 13,790 Interest coverage 5.2 4.3 3.8 4.0 3.8 Change (q-o-q) 12% 21%
EBITDA 1,132 1,323 1,552 Per share Change (q-o-q) - 17% 17%
FY11 FY12 FY13 FY14E FY15E EBITDA margin 11% 11.6% 11.3% Adj EPS ( ₹ ) 32.6 17.4 16.4 18.5 18.8 PAT 669 825 900 CEPS 33.2 17.9 17.0 19.2 20.0 Adj PAT 669 825 900 Book value 72.9 41.1 77.5 94.5 111.7 Change (q-o-q) 23% 9%Dividend ( ₹ ) - - 1.0 3.0 3.0 Adj PAT margin 7% 7% 6.5%
Actual o/s shares (mn) 44.7 133.9 179.1 179.1 179.1 Adj EPS 3.7 4.6 5.0
8/13/2019 20130918 PC Jeweller Ltd IER InitiationReport 2
http://slidepdf.com/reader/full/20130918-pc-jeweller-ltd-ier-initiationreport-2 22/28
CRISIL IERIndependentEquityResearch
20
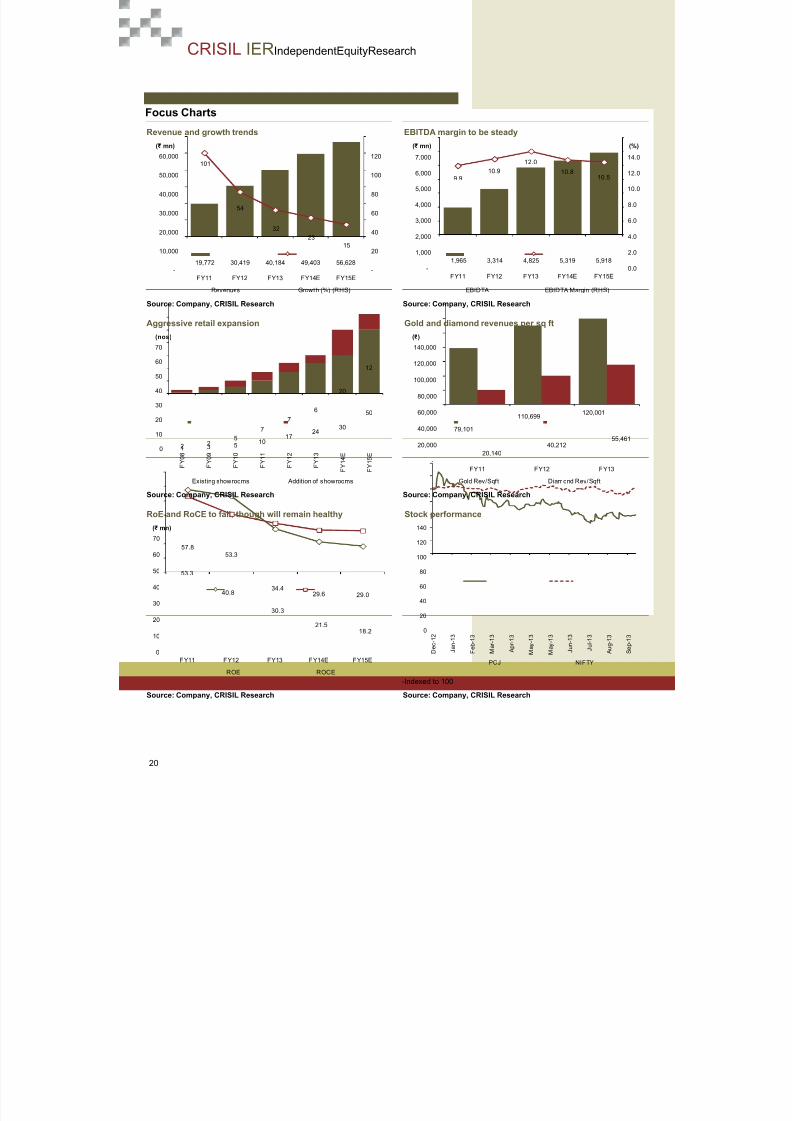
Focus Charts
Revenue and growth trends EBITDA margin to be steady
Source: Company, CRISIL Research Source: Company, CRISIL Research
Aggressive retail expansion Gold and diamond revenues per sq ft
Source: Company, CRISIL Research Source: Company, CRISIL Research
RoE and RoCE to fall, though will remain healthy Stock performance
-Indexed to 100
Source: Company, CRISIL Research Source: Company, CRISIL Research
19,772 30,419 40,184 49,403 56,628
101
54
3223
15
-
20
40
60
80
100
120
-
10,000
20,000
30,000
40,000
50,000
60,000
FY11 FY12 FY13 FY14E FY15E
(₹ mn)
Revenues Growth (%) (RHS)
1,965 3,314 4,825 5,319 5,918
9.910.9
12.010.8
10.5
0.0
2.0
4.0
6.0
8.0
10.0
12.0
14.0
-
1,000
2,000
3,000
4,000
5,000
6,000
7,000
FY11 FY12 FY13 FY14E FY15E
(%)(₹ mn)
EBIDTA EBIDTA Margin (RHS)
1 3 5 1017
2430
50
2 25
7
76
20
12
0
10
20
30
40
50
60
70
F Y 0 8
F Y 0 9
F Y 1 0
F Y 1 1
F Y 1 2
F Y 1 3
F Y 1 4 E
F Y 1 5 E
(nos)
Existing showrooms Addition of showrooms
79,101
110,699 120,001
20,14040,212
55,461
-
20,000
40,000
60,000
80,000
100,000
120,000
140,000
FY11 FY12 FY13
(₹ )
Gold Rev/Sqft Diamond Rev/Sqft
57.853.3
30.3
21.518.2
53.3
40.834.4
29.6 29.0
0
10
20
30
40
50
60
70
FY11 FY12 FY13 FY14E FY15E
(₹ mn)
ROE ROCE
0
20
40
60
80
100
120
140
D e c - 1
2
J a n - 1
3
F e b - 1
3
M a r - 1 3
A p r - 1 3
M a y - 1
3
M a y - 1
3
J u n - 1
3
J u l - 1 3
A u g - 1
3
S e p - 1
3
PCJ NIFTY

8/13/2019 20130918 PC Jeweller Ltd IER InitiationReport 2
http://slidepdf.com/reader/full/20130918-pc-jeweller-ltd-ier-initiationreport-2 23/28
This page is intentionally l eft blank

8/13/2019 20130918 PC Jeweller Ltd IER InitiationReport 2
http://slidepdf.com/reader/full/20130918-pc-jeweller-ltd-ier-initiationreport-2 24/28
CRISIL IERIndependentEquityResearch
This page is intentionally l eft blank

8/13/2019 20130918 PC Jeweller Ltd IER InitiationReport 2
http://slidepdf.com/reader/full/20130918-pc-jeweller-ltd-ier-initiationreport-2 25/28
This page is intentionally l eft blank

8/13/2019 20130918 PC Jeweller Ltd IER InitiationReport 2
http://slidepdf.com/reader/full/20130918-pc-jeweller-ltd-ier-initiationreport-2 26/28

8/13/2019 20130918 PC Jeweller Ltd IER InitiationReport 2
http://slidepdf.com/reader/full/20130918-pc-jeweller-ltd-ier-initiationreport-2 27/28
Our Capabilities
Making Markets Function Better
Economy and Industry Research▪ Largest team of economy and industry research analysts in India
▪ Coverage on 70 industries and 139 sub-sectors; provide growth forecasts, profitability analysis, emerging trends,expected investments, industry structure and regulatory frameworks
▪ 90 per cent of India’s commercial banks use our industry research for credit decisions
▪ Special coverage on key growth sectors including real estate, infrastructure, logistics, and financial services
▪ Inputs to India’s leading corporates in market sizing, demand forecasting, and project feasibility
▪ Published the first India-focused report on Ultra High Net-worth Individuals
▪ All opinions and forecasts reviewed by a highly qualified panel with over 200 years of cumulative experience
Funds and Fixed Income Research▪ Largest and most comprehensive database on India’s debt market, covering more than 15,000 securities
▪ Largest provider of fixed income valuations in India
▪ Value more than ₹ 53 trillion (USD 960 billion) of Indian debt securities, comprising outstanding securities
▪ Sole provider of fixed income and hybrid indices to mutual funds and insurance companies; we maintain 12standard indices and over 100 customised indices
▪ Ranking of Indian mutual fund schemes covering 70 per cent of assets under management and ₹ 4.7 trillion(USD 85 billion) by value
▪ Retained by India’s Employees’ Provident Fund Organisation, the world’s largest retirement scheme coveringover 60 million individuals, for selecting fund managers and monitoring their performance
Equity and Company Research▪ Largest independent equity research house in India, focusing on small and mid-cap companies; coverage
exceeds 125 companies
▪ Released company reports on 1,442 companies listed and traded on the National Stock Exchange; a global firstfor any stock exchange
▪ First research house to release exchange-commissioned equity research reports in India▪ Assigned the first IPO grade in India

8/13/2019 20130918 PC Jeweller Ltd IER InitiationReport 2
http://slidepdf.com/reader/full/20130918-pc-jeweller-ltd-ier-initiationreport-2 28/28
Our OfficeAhmedabad706, Venus AtlantisNr. Reliance Petrol PumpPrahladnagar, Ahmedabad, IndiaPhone: +91 79 4024 4500Fax: +91 79 2755 9863
Hyderabad3rd Floor, Uma ChambersPlot No. 9&10, Nagarjuna Hills,(Near Punjagutta Cross Road)Hyderabad - 500 482, IndiaPhone: +91 40 2335 8103/05Fax: +91 40 2335 7507
BengaluruW-101, Sunrise Chambers,22, Ulsoor Road,Bengaluru - 560 042, IndiaPhone: +91 80 2558 0899
+91 80 2559 4802Fax: +91 80 2559 4801
KolkataHorizon, Block 'B', 4th Floor57 Chowringhee RoadKolkata - 700 071, IndiaPhone: +91 33 2289 1949/50
Fax: +91 33 2283 0597
ChennaiThapar House,43/44, Montieth Road, Egmore,Chennai - 600 008, IndiaPhone: +91 44 2854 6205/06
+91 44 2854 6093Fax: +91 44 2854 7531
Pune1187/17, Ghole Road,Shivaji Nagar,Pune - 411 005, IndiaPhone: +91 20 2553 9064/67Fax: +91 20 4018 1930
Gurgaon
Plot No. 46Sector 44Opp. PF OfficeGurgaon - 122 003, IndiaPhone: +91 124 6722 000
CRISIL LimitedCRISIL House, Central Avenue,Hiranandani Business Park, Powai, Mumbai – 400076. IndiaPhone: +91 22 3342 3000 | Fax: +91 22 3342 8088