Embed Size (px)
Citation preview

2013 U.S. Housing Market Forecast
(800) 611-3060
www.NoradaRealEstate.com
Your Premier Source for Turnkey Cash-Flow Investment Property
SPECIAL REPORT
Appreciation Edition
Updated: 2/25/2013

www.NoradaRealEstate.com Page 2
Top 10 Real Estate Markets in the United States
The question most real estate investors ask is, “Where do I invest now?”
As always, there are local housing markets around the country where homes are affordable, the
underlying economy is strong, and appreciation is imminent. These are the markets you should
consider for your next long‐term real estate investment.
Norada Real Estate Investments tracks the economic conditions and real estate trends of nearly
400 markets across the country. Because of the dynamic nature of real estate market
conditions, we continually monitor and rank the top markets to make it easier for you, as an
investor, to concentrate on the areas that will give you the greatest opportunity for success.
While you might be inclined to look for bargains in areas that have seen the largest price
corrections in the past, watch out – there is no guarantee that home prices in areas of high
speculation will ever rebound to boom levels.
The following is a list of the top 10 metropolitan areas for real estate investing based on
forecasts for price appreciation and future job growth. These areas are ideal for real estate
investors seeking growth markets with strong appreciation potential.
You will also find a complete list and ranking of the 100 largest metropolitan areas on page 15. Continued success, Marco Santarelli President & Founder Norada Real Estate Investments

www.NoradaRealEstate.com Page 3
About Metropolitan Statistical Areas and This Report
This report focuses primarily on Metropolitan Statistical Areas (MSA), the geographic building blocks of
America’s economy and society. Why metropolitan areas? Unlike individual cities and towns, or large
political units like states, these are the places within which most people live their daily lives. Most
Americans (84 percent) live in metropolitan areas. Most workers (58 percent) commute to jobs within
their metropolitan area, but in a city or town different from the one in which they live. Most
metropolitan residents who move (79 percent) choose another location within the same metro area.
We do our shopping in different parts of metropolitan areas, get our media from metro‐wide
newspapers and television stations, and root for sports teams and visit cultural institutions that service
whole regions. We share natural resources and infrastructure — air, water, roads, airports — at the
metropolitan level. Related businesses cluster and share innovations and labor force expertise within
metro areas. In short, metropolitan areas represent the critical geographic lens through which to
understand a changing housing market trend.
Metropolitan areas as a statistical concept join cities and their suburbs together to represent local and
regional markets. In the United States, Metropolitan Statistical Areas are defined by the U.S. Office of
Management and Budget (OMB) based on data gathered by the Census Bureau. The OMB locates these
areas around a densely populated core, typically a city, of at least 50,000 people. Counties that have
strong commuting ties to the core are then included in the definition of the metropolitan area. The
OMB currently identifies 366 metropolitan areas nationwide, with populations ranging from 55,000
(Carson City, NV) to 19 million (New York–Northern New Jersey–Long Island, NY‐NJ‐PA).
Within this group of metropolitan areas, this report concentrates the bulk of its attention on the 100
largest, which in 2008 coincided almost exactly with those metro areas having populations of at least
500,000. While there is nothing especially magical about the half million‐person threshold, these
metropolitan areas are fairly recognizable places to most Americans. Moreover, nearly all of their
largest cities have populations of at least 100,000. Even more remarkably, these large metro areas
continue to slowly but steadily increase their share of the nation’s population. At the turn of the 20th
century, 44 percent of Americans lived in the counties that today make up the 100 largest metro areas.
By 2000 that share had risen to 65 percent, and by 2009 reached 66 percent.
Figures within this report are based on single‐family residential properties, and future job growth
percentages are 10‐year projections unless otherwise noted.
Forecasts are created by over one dozen economists and real estate professionals providing data for the
economic forecast model. Data sources include but are not limited to the following: U.S. Census Bureau,
Bureau of Labor Statistics, Consumer Price Index, Federal Housing Finance Agency (FHFA), Uniform
Crime Reports, Federal Bureau of Investigation, Consumer Expenditure Survey Index, Moody’s
Economy.com, The Brookings Institution, National Association of Realtors, State Association of Realtors,
National Association of Home Builders, Hanley Wood and the Expert Metropolitan Board.

www.NoradaRealEstate.com Page 4
Change in Housing Prices in the Largest 100 Metropolitan Areas
The map below displays the change in the Federal Housing Finance Administration’s House Price Index (HPI), which
measures the price of single‐family properties whose mortgages have been purchased or securitized by Fannie
Mae or Freddie Mac, from the trough quarter to the third quarter of 2012, for the 100 largest metro areas.
Most of these metro areas (88) saw home values rise during the third quarter of 2012, providing evidence that a
broadly rooted recovery is underway in the market. It is a nascent recovery, however, with the second quarter of
2013 marking the low point of the housing market for more than three‐quarters (76) of large metro areas.
The strongest performances over the last quarter were in those parts of the country hardest hit by the housing
crisis. Phoenix, Modesto, North Port, Lakeland, and Bakersfield led the way during the quarter and seven of the
top ten performing metro areas were in Florida or California. The Intermountain West region also performed well,
and Jackson (MS), Augusta (GA), and Detroit – itself among the hardest hit metro areas – rounded out the top
performers.
With the strongest recoveries occurring in the places that were hardest hit — and the recovery period limited to
just one quarter in most places — it is not surprising that these are also the places with the furthest left to go.
Home prices are down by more than 60 percent in Las Vegas, Modesto, and Stockton from their pre‐recession
peaks. Of the 22 markets where home values are down by more than 40 percent, 17 are in California or Florida.
Sources: The Brookings Institution, Federal Housing Finance Administration (fhfa.gov).

www.NoradaRealEstate.com Page 5
1. McAllen–Edinburg–Mission, Texas
Population: 774,769 Peak House Price: 2006 Q4
Population Change: (since 2000) 36.1% Trough House Price: 2011 Q2
Change: (Trough to 2012 Q3) 0.2%
Cost of Living Index: (US avg. = 100) 75
Foreclosure Activity: (6 month trend) Rising
Unemployment Rate: 11.0% Foreclosure Ratio: (% of total units) 0.02%
Recent Job Growth: 2.8% (US avg= 0.11%)
Future Job Growth: (10 year) 34.6% Median Sales Price: (Nov ‘12 ‐ Jan ‘13) $60,500
Change: (Year‐over‐Year) ‐ 40.1%
Peak Unemployment: 2007 Q4
Trough Unemployment: 2010 Q4 Appreciation Forecast: (3 Year) 20.8%Change: (Trough to 2012 Q3) ‐ 1.20% Appreciation Forecast: (5 Year) 33.2%
www.NoradaRealEstate.com Page 6
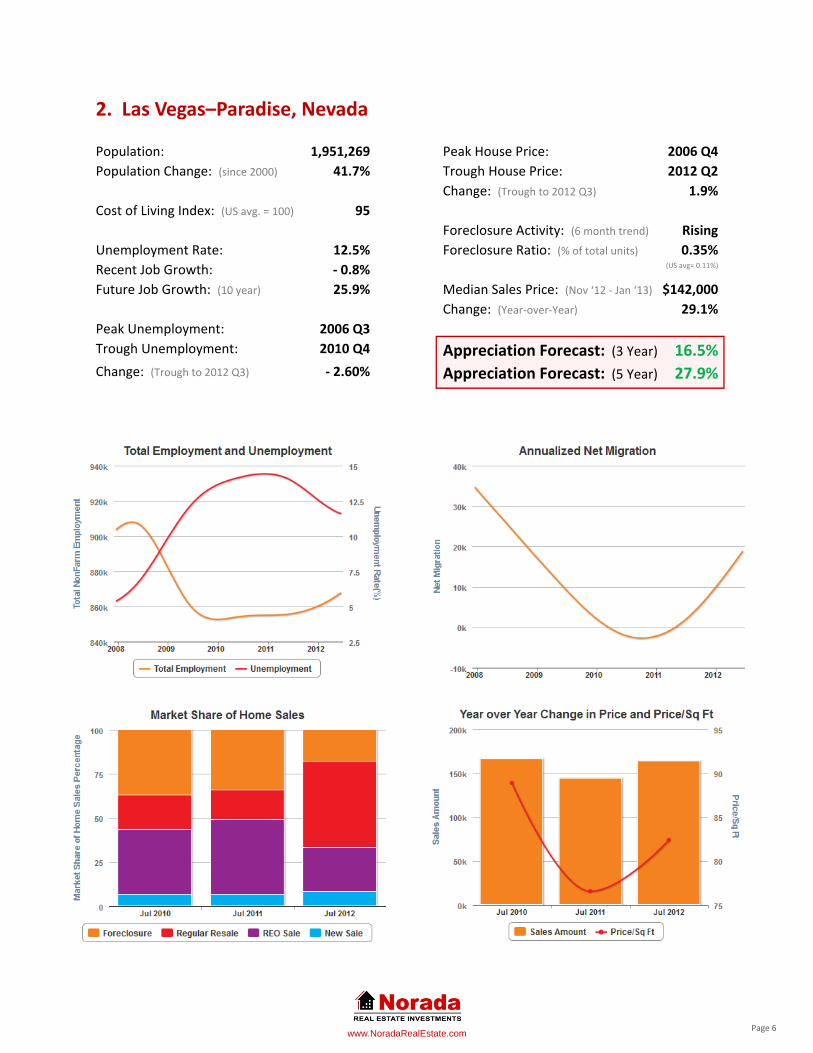
2. Las Vegas–Paradise, Nevada
Population: 1,951,269 Peak House Price: 2006 Q4
Population Change: (since 2000) 41.7% Trough House Price: 2012 Q2
Change: (Trough to 2012 Q3) 1.9%
Cost of Living Index: (US avg. = 100) 95
Foreclosure Activity: (6 month trend) Rising
Unemployment Rate: 12.5% Foreclosure Ratio: (% of total units) 0.35%
Recent Job Growth: ‐ 0.8% (US avg= 0.11%)
Future Job Growth: (10 year) 25.9% Median Sales Price: (Nov ‘12 ‐ Jan ‘13) $142,000
Change: (Year‐over‐Year) 29.1%
Peak Unemployment: 2006 Q3
Trough Unemployment: 2010 Q4 Appreciation Forecast: (3 Year) 16.5%Change: (Trough to 2012 Q3) ‐ 2.60% Appreciation Forecast: (5 Year) 27.9%
www.NoradaRealEstate.com Page 7
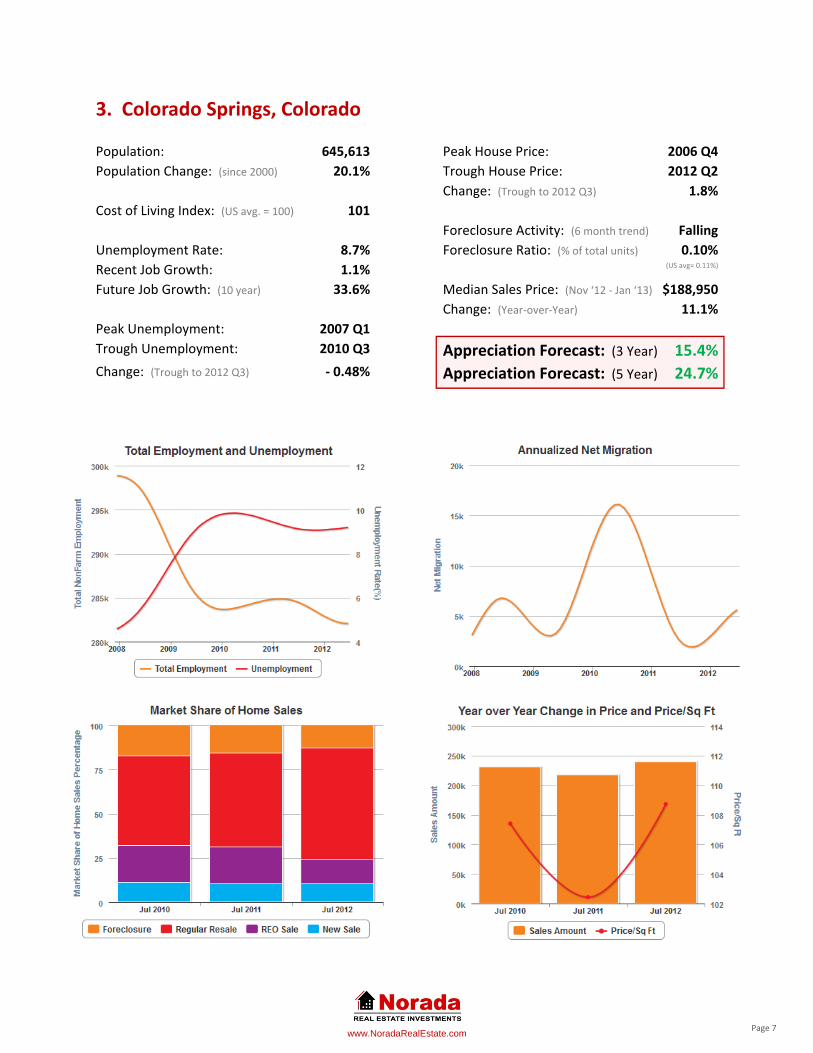
3. Colorado Springs, Colorado
Population: 645,613 Peak House Price: 2006 Q4
Population Change: (since 2000) 20.1% Trough House Price: 2012 Q2
Change: (Trough to 2012 Q3) 1.8%
Cost of Living Index: (US avg. = 100) 101
Foreclosure Activity: (6 month trend) Falling
Unemployment Rate: 8.7% Foreclosure Ratio: (% of total units) 0.10%
Recent Job Growth: 1.1% (US avg= 0.11%)
Future Job Growth: (10 year) 33.6% Median Sales Price: (Nov ‘12 ‐ Jan ‘13) $188,950
Change: (Year‐over‐Year) 11.1%
Peak Unemployment: 2007 Q1
Trough Unemployment: 2010 Q3 Appreciation Forecast: (3 Year) 15.4%Change: (Trough to 2012 Q3) ‐ 0.48% Appreciation Forecast: (5 Year) 24.7%
www.NoradaRealEstate.com Page 8
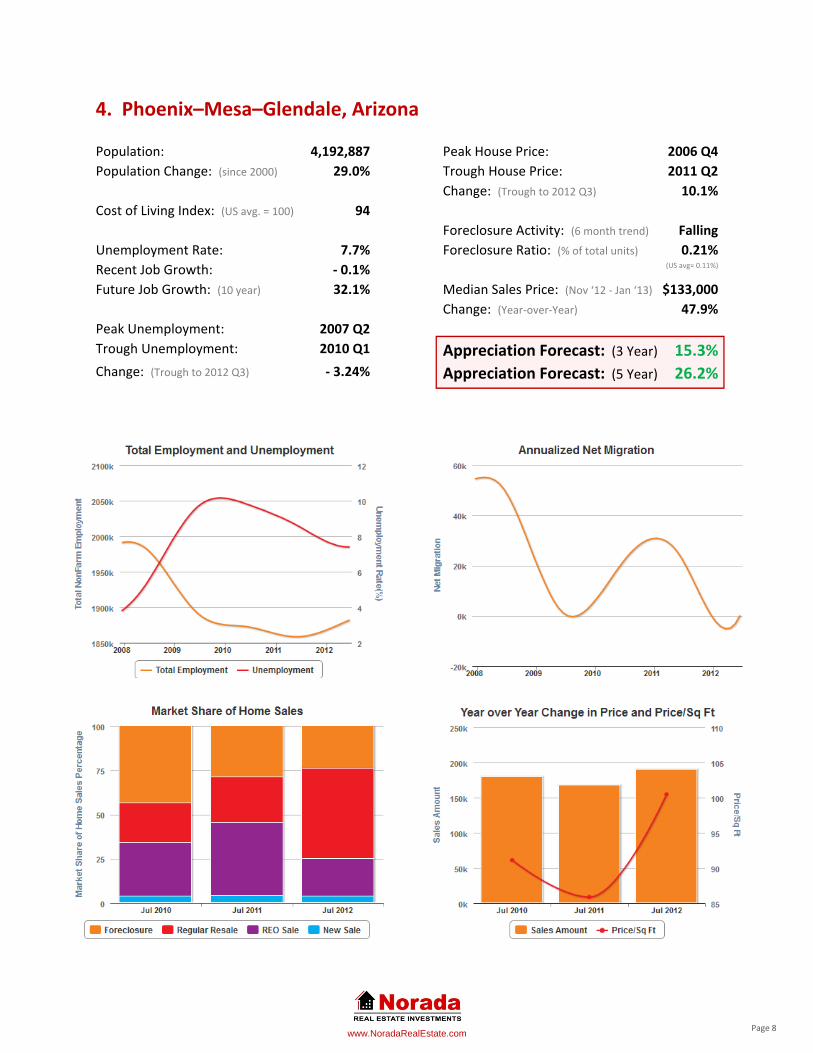
4. Phoenix–Mesa–Glendale, Arizona
Population: 4,192,887 Peak House Price: 2006 Q4
Population Change: (since 2000) 29.0% Trough House Price: 2011 Q2
Change: (Trough to 2012 Q3) 10.1%
Cost of Living Index: (US avg. = 100) 94
Foreclosure Activity: (6 month trend) Falling
Unemployment Rate: 7.7% Foreclosure Ratio: (% of total units) 0.21%
Recent Job Growth: ‐ 0.1% (US avg= 0.11%)
Future Job Growth: (10 year) 32.1% Median Sales Price: (Nov ‘12 ‐ Jan ‘13) $133,000
Change: (Year‐over‐Year) 47.9%
Peak Unemployment: 2007 Q2
Trough Unemployment: 2010 Q1 Appreciation Forecast: (3 Year) 15.3%Change: (Trough to 2012 Q3) ‐ 3.24% Appreciation Forecast: (5 Year) 26.2%
www.NoradaRealEstate.com Page 9
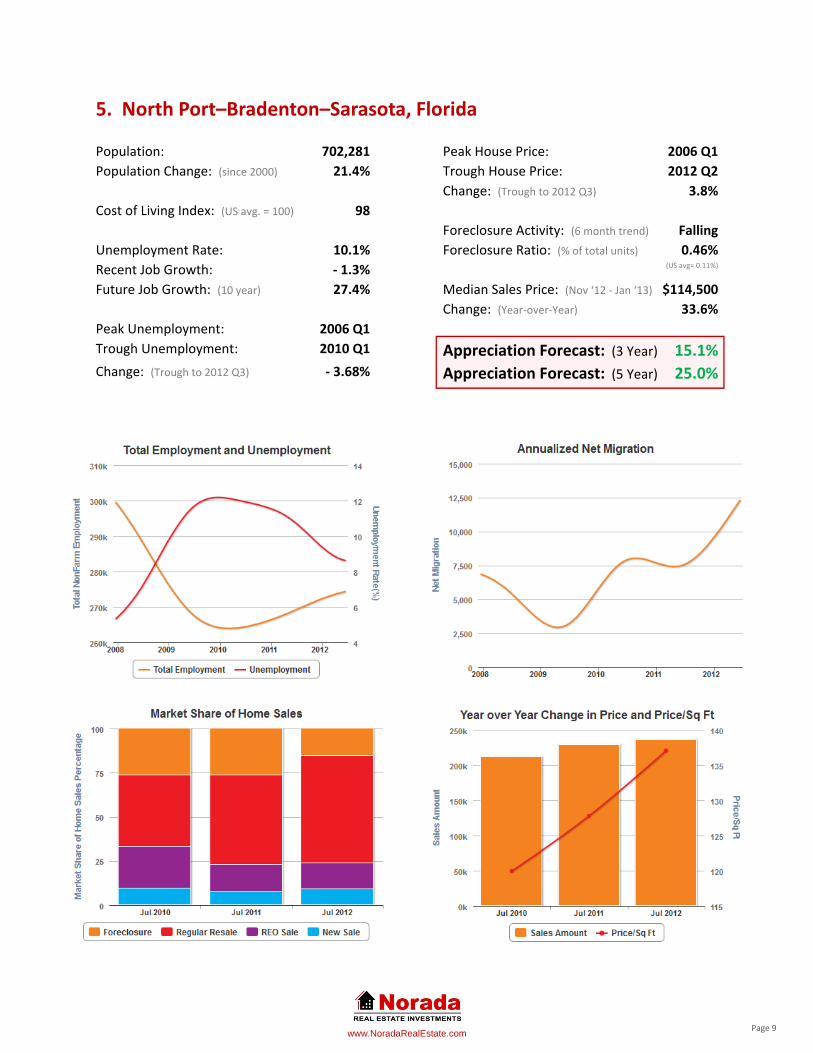
5. North Port–Bradenton–Sarasota, Florida
Population: 702,281 Peak House Price: 2006 Q1
Population Change: (since 2000) 21.4% Trough House Price: 2012 Q2
Change: (Trough to 2012 Q3) 3.8%
Cost of Living Index: (US avg. = 100) 98
Foreclosure Activity: (6 month trend) Falling
Unemployment Rate: 10.1% Foreclosure Ratio: (% of total units) 0.46%
Recent Job Growth: ‐ 1.3% (US avg= 0.11%)
Future Job Growth: (10 year) 27.4% Median Sales Price: (Nov ‘12 ‐ Jan ‘13) $114,500
Change: (Year‐over‐Year) 33.6%
Peak Unemployment: 2006 Q1
Trough Unemployment: 2010 Q1 Appreciation Forecast: (3 Year) 15.1%Change: (Trough to 2012 Q3) ‐ 3.68% Appreciation Forecast: (5 Year) 25.0%
www.NoradaRealEstate.com Page 10
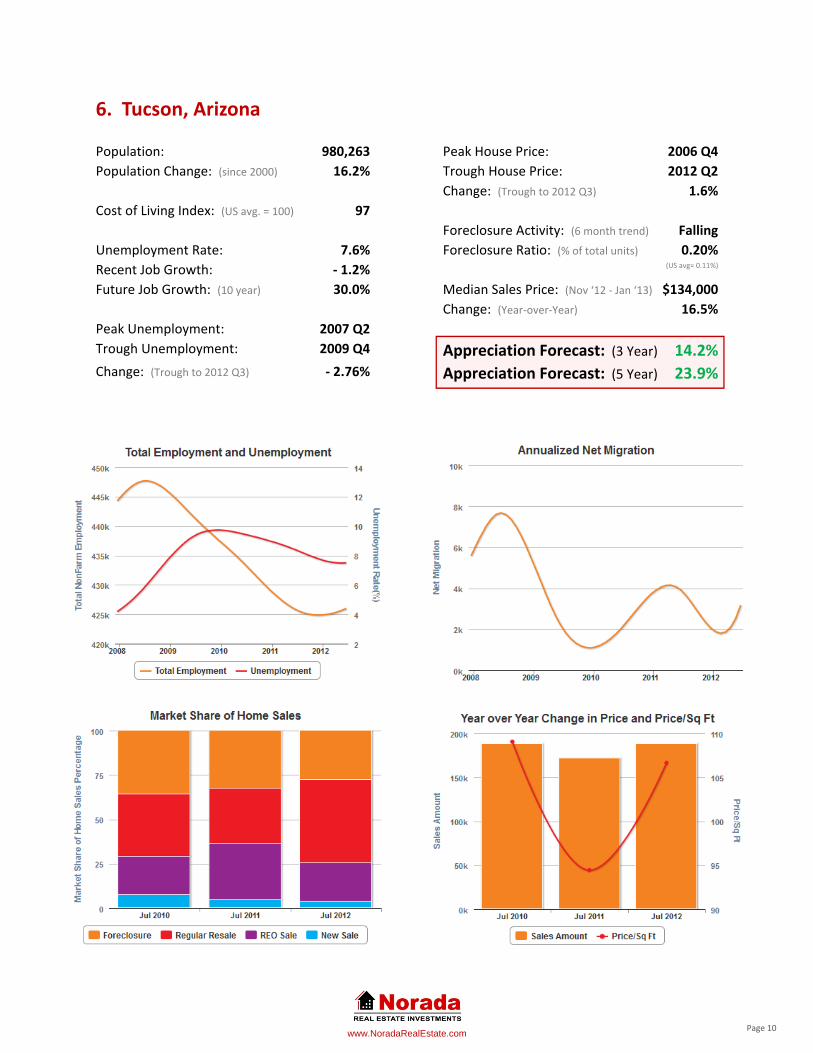
6. Tucson, Arizona
Population: 980,263 Peak House Price: 2006 Q4
Population Change: (since 2000) 16.2% Trough House Price: 2012 Q2
Change: (Trough to 2012 Q3) 1.6%
Cost of Living Index: (US avg. = 100) 97
Foreclosure Activity: (6 month trend) Falling
Unemployment Rate: 7.6% Foreclosure Ratio: (% of total units) 0.20%
Recent Job Growth: ‐ 1.2% (US avg= 0.11%)
Future Job Growth: (10 year) 30.0% Median Sales Price: (Nov ‘12 ‐ Jan ‘13) $134,000
Change: (Year‐over‐Year) 16.5%
Peak Unemployment: 2007 Q2
Trough Unemployment: 2009 Q4 Appreciation Forecast: (3 Year) 14.2%Change: (Trough to 2012 Q3) ‐ 2.76% Appreciation Forecast: (5 Year) 23.9%
www.NoradaRealEstate.com Page 11
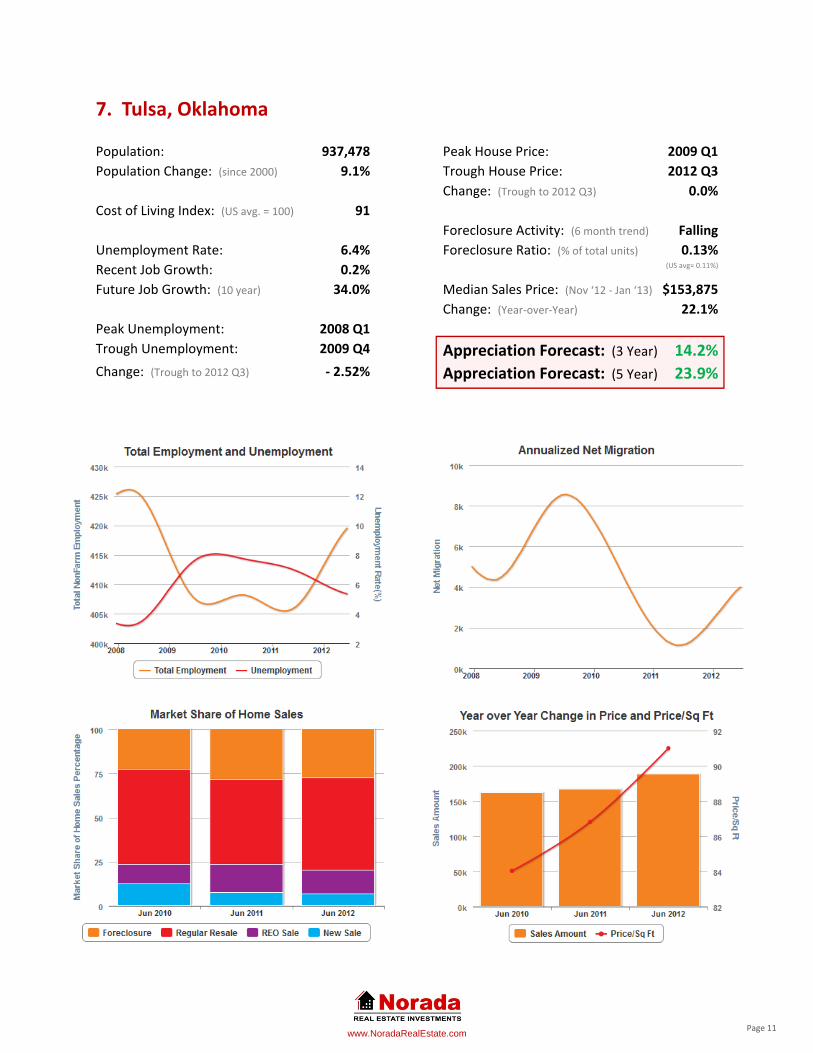
7. Tulsa, Oklahoma
Population: 937,478 Peak House Price: 2009 Q1
Population Change: (since 2000) 9.1% Trough House Price: 2012 Q3
Change: (Trough to 2012 Q3) 0.0%
Cost of Living Index: (US avg. = 100) 91
Foreclosure Activity: (6 month trend) Falling
Unemployment Rate: 6.4% Foreclosure Ratio: (% of total units) 0.13%
Recent Job Growth: 0.2% (US avg= 0.11%)
Future Job Growth: (10 year) 34.0% Median Sales Price: (Nov ‘12 ‐ Jan ‘13) $153,875
Change: (Year‐over‐Year) 22.1%
Peak Unemployment: 2008 Q1
Trough Unemployment: 2009 Q4 Appreciation Forecast: (3 Year) 14.2%Change: (Trough to 2012 Q3) ‐ 2.52% Appreciation Forecast: (5 Year) 23.9%

www.NoradaRealEstate.com Page 12
8. Denver–Aurora–Broomfield, Colorado
Population: 2,543,487 Peak House Price: 2005 Q1
Population Change: (since 2000) 16.7% Trough House Price: 2011 Q2
Change: (Trough to 2012 Q3) 2.7%
Cost of Living Index: (US avg. = 100) 112
Foreclosure Activity: (6 month trend) Falling
Unemployment Rate: 7.9% Foreclosure Ratio: (% of total units) 0.08%
Recent Job Growth: 1.9% (US avg= 0.11%)
Future Job Growth: (10 year) 35.8% Median Sales Price: (Nov ‘12 ‐ Jan ‘13) $230,750
Change: (Year‐over‐Year) 21.5%
Peak Unemployment: 2007 Q1
Trough Unemployment: 2010 Q1 Appreciation Forecast: (3 Year) 13.9%Change: (Trough to 2012 Q3) ‐ 1.17% Appreciation Forecast: (5 Year) 22.7%
www.NoradaRealEstate.com Page 13
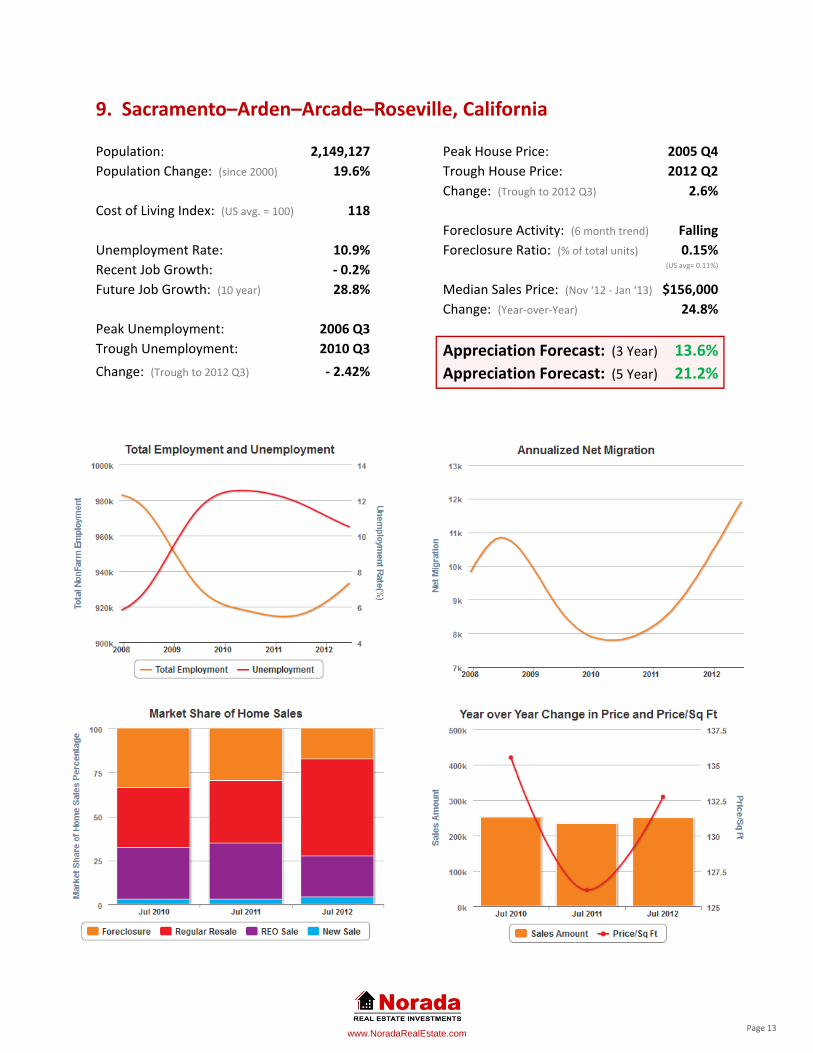
9. Sacramento–Arden–Arcade–Roseville, California
Population: 2,149,127 Peak House Price: 2005 Q4
Population Change: (since 2000) 19.6% Trough House Price: 2012 Q2
Change: (Trough to 2012 Q3) 2.6%
Cost of Living Index: (US avg. = 100) 118
Foreclosure Activity: (6 month trend) Falling
Unemployment Rate: 10.9% Foreclosure Ratio: (% of total units) 0.15%
Recent Job Growth: ‐ 0.2% (US avg= 0.11%)
Future Job Growth: (10 year) 28.8% Median Sales Price: (Nov ‘12 ‐ Jan ‘13) $156,000
Change: (Year‐over‐Year) 24.8%
Peak Unemployment: 2006 Q3
Trough Unemployment: 2010 Q3 Appreciation Forecast: (3 Year) 13.6%Change: (Trough to 2012 Q3) ‐ 2.42% Appreciation Forecast: (5 Year) 21.2%
www.NoradaRealEstate.com Page 14
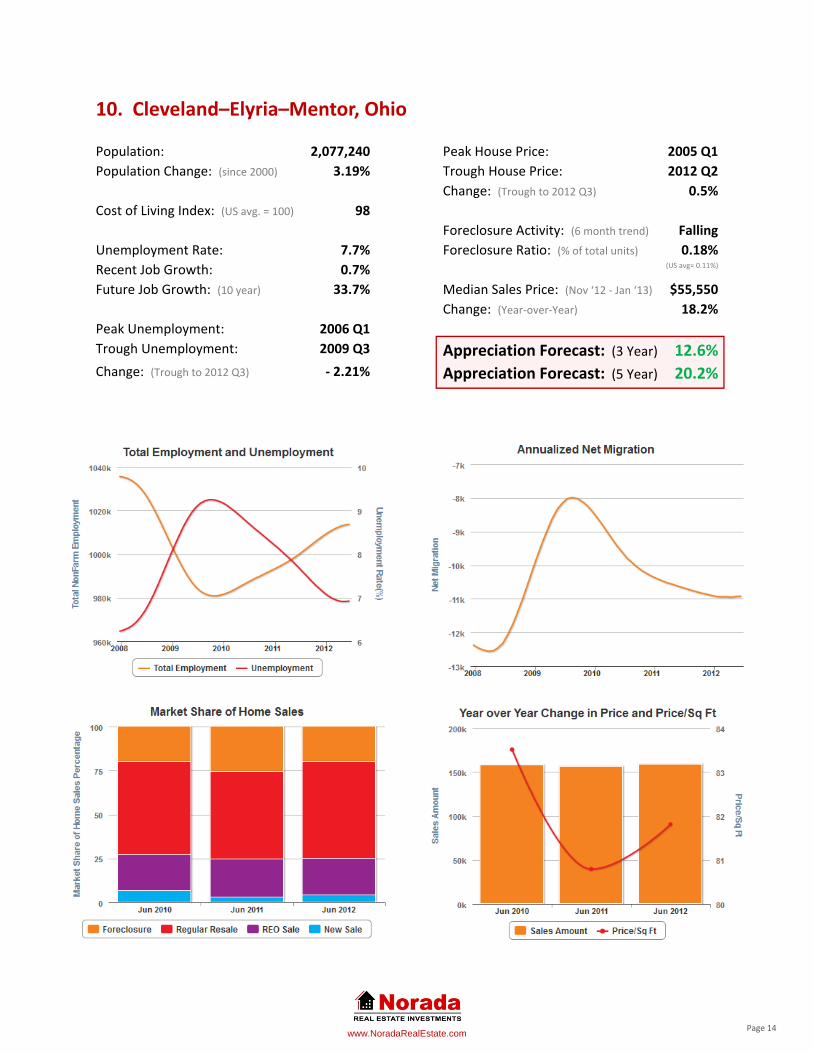
10. Cleveland–Elyria–Mentor, Ohio
Population: 2,077,240 Peak House Price: 2005 Q1
Population Change: (since 2000) 3.19% Trough House Price: 2012 Q2
Change: (Trough to 2012 Q3) 0.5%
Cost of Living Index: (US avg. = 100) 98
Foreclosure Activity: (6 month trend) Falling
Unemployment Rate: 7.7% Foreclosure Ratio: (% of total units) 0.18%
Recent Job Growth: 0.7% (US avg= 0.11%)
Future Job Growth: (10 year) 33.7% Median Sales Price: (Nov ‘12 ‐ Jan ‘13) $55,550
Change: (Year‐over‐Year) 18.2%
Peak Unemployment: 2006 Q1
Trough Unemployment: 2009 Q3 Appreciation Forecast: (3 Year) 12.6%Change: (Trough to 2012 Q3) ‐ 2.21% Appreciation Forecast: (5 Year) 20.2%
www.NoradaRealEstate.com Page 15
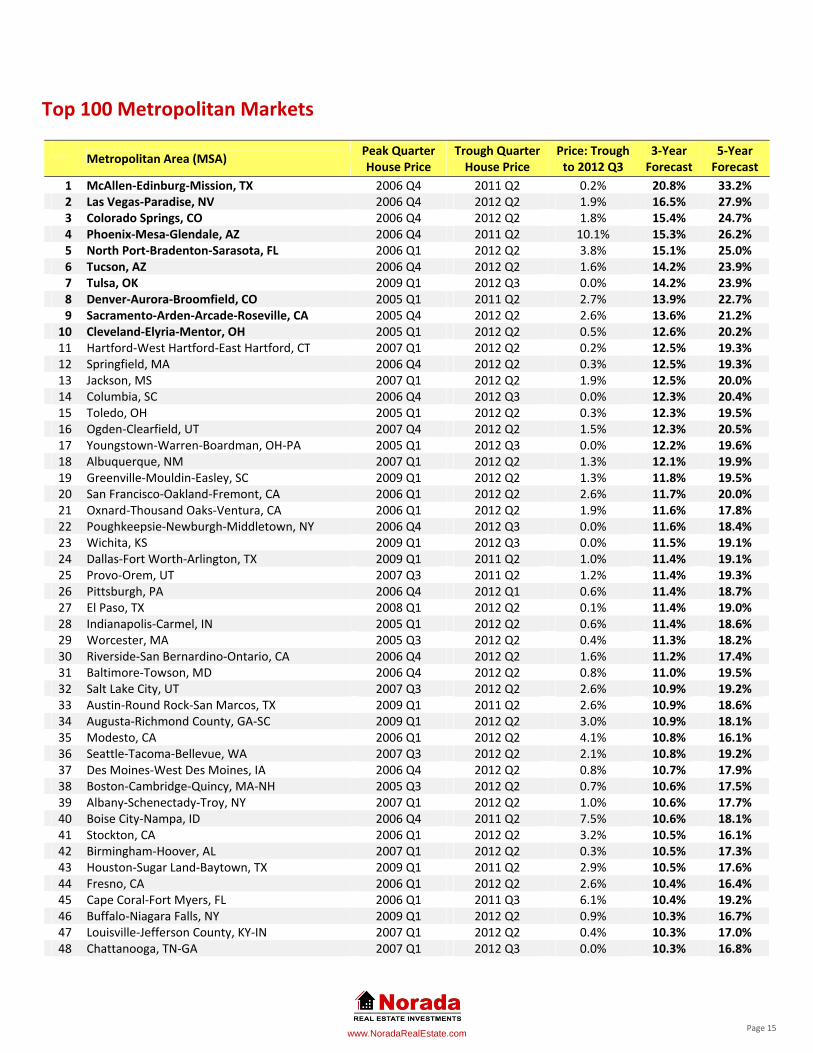
Top 100 Metropolitan Markets
Metropolitan Area (MSA)
Peak Quarter House Price
Trough Quarter House Price
Price: Trough to 2012 Q3
3‐Year Forecast
5‐Year Forecast
1 McAllen‐Edinburg‐Mission, TX 2006 Q4 2011 Q2 0.2% 20.8% 33.2%2 Las Vegas‐Paradise, NV 2006 Q4 2012 Q2 1.9% 16.5% 27.9%3 Colorado Springs, CO 2006 Q4 2012 Q2 1.8% 15.4% 24.7%4 Phoenix‐Mesa‐Glendale, AZ 2006 Q4 2011 Q2 10.1% 15.3% 26.2%5 North Port‐Bradenton‐Sarasota, FL 2006 Q1 2012 Q2 3.8% 15.1% 25.0%6 Tucson, AZ 2006 Q4 2012 Q2 1.6% 14.2% 23.9%7 Tulsa, OK 2009 Q1 2012 Q3 0.0% 14.2% 23.9%8 Denver‐Aurora‐Broomfield, CO 2005 Q1 2011 Q2 2.7% 13.9% 22.7%9 Sacramento‐Arden‐Arcade‐Roseville, CA 2005 Q4 2012 Q2 2.6% 13.6% 21.2%
10 Cleveland‐Elyria‐Mentor, OH 2005 Q1 2012 Q2 0.5% 12.6% 20.2%11 Hartford‐West Hartford‐East Hartford, CT 2007 Q1 2012 Q2 0.2% 12.5% 19.3%12 Springfield, MA 2006 Q4 2012 Q2 0.3% 12.5% 19.3%13 Jackson, MS 2007 Q1 2012 Q2 1.9% 12.5% 20.0%14 Columbia, SC 2006 Q4 2012 Q3 0.0% 12.3% 20.4%15 Toledo, OH 2005 Q1 2012 Q2 0.3% 12.3% 19.5%16 Ogden‐Clearfield, UT 2007 Q4 2012 Q2 1.5% 12.3% 20.5%17 Youngstown‐Warren‐Boardman, OH‐PA 2005 Q1 2012 Q3 0.0% 12.2% 19.6%18 Albuquerque, NM 2007 Q1 2012 Q2 1.3% 12.1% 19.9%19 Greenville‐Mouldin‐Easley, SC 2009 Q1 2012 Q2 1.3% 11.8% 19.5%20 San Francisco‐Oakland‐Fremont, CA 2006 Q1 2012 Q2 2.6% 11.7% 20.0%21 Oxnard‐Thousand Oaks‐Ventura, CA 2006 Q1 2012 Q2 1.9% 11.6% 17.8%22 Poughkeepsie‐Newburgh‐Middletown, NY 2006 Q4 2012 Q3 0.0% 11.6% 18.4%23 Wichita, KS 2009 Q1 2012 Q3 0.0% 11.5% 19.1%24 Dallas‐Fort Worth‐Arlington, TX 2009 Q1 2011 Q2 1.0% 11.4% 19.1%25 Provo‐Orem, UT 2007 Q3 2011 Q2 1.2% 11.4% 19.3%26 Pittsburgh, PA 2006 Q4 2012 Q1 0.6% 11.4% 18.7%27 El Paso, TX 2008 Q1 2012 Q2 0.1% 11.4% 19.0%28 Indianapolis‐Carmel, IN 2005 Q1 2012 Q2 0.6% 11.4% 18.6%29 Worcester, MA 2005 Q3 2012 Q2 0.4% 11.3% 18.2%30 Riverside‐San Bernardino‐Ontario, CA 2006 Q4 2012 Q2 1.6% 11.2% 17.4%31 Baltimore‐Towson, MD 2006 Q4 2012 Q2 0.8% 11.0% 19.5%32 Salt Lake City, UT 2007 Q3 2012 Q2 2.6% 10.9% 19.2%33 Austin‐Round Rock‐San Marcos, TX 2009 Q1 2011 Q2 2.6% 10.9% 18.6%34 Augusta‐Richmond County, GA‐SC 2009 Q1 2012 Q2 3.0% 10.9% 18.1%35 Modesto, CA 2006 Q1 2012 Q2 4.1% 10.8% 16.1%36 Seattle‐Tacoma‐Bellevue, WA 2007 Q3 2012 Q2 2.1% 10.8% 19.2%37 Des Moines‐West Des Moines, IA 2006 Q4 2012 Q2 0.8% 10.7% 17.9%38 Boston‐Cambridge‐Quincy, MA‐NH 2005 Q3 2012 Q2 0.7% 10.6% 17.5%39 Albany‐Schenectady‐Troy, NY 2007 Q1 2012 Q2 1.0% 10.6% 17.7%40 Boise City‐Nampa, ID 2006 Q4 2011 Q2 7.5% 10.6% 18.1%41 Stockton, CA 2006 Q1 2012 Q2 3.2% 10.5% 16.1%42 Birmingham‐Hoover, AL 2007 Q1 2012 Q2 0.3% 10.5% 17.3%43 Houston‐Sugar Land‐Baytown, TX 2009 Q1 2011 Q2 2.9% 10.5% 17.6%44 Fresno, CA 2006 Q1 2012 Q2 2.6% 10.4% 16.4%45 Cape Coral‐Fort Myers, FL 2006 Q1 2011 Q3 6.1% 10.4% 19.2%46 Buffalo‐Niagara Falls, NY 2009 Q1 2012 Q2 0.9% 10.3% 16.7%47 Louisville‐Jefferson County, KY‐IN 2007 Q1 2012 Q2 0.4% 10.3% 17.0%48 Chattanooga, TN‐GA 2007 Q1 2012 Q3 0.0% 10.3% 16.8%
www.NoradaRealEstate.com Page 16
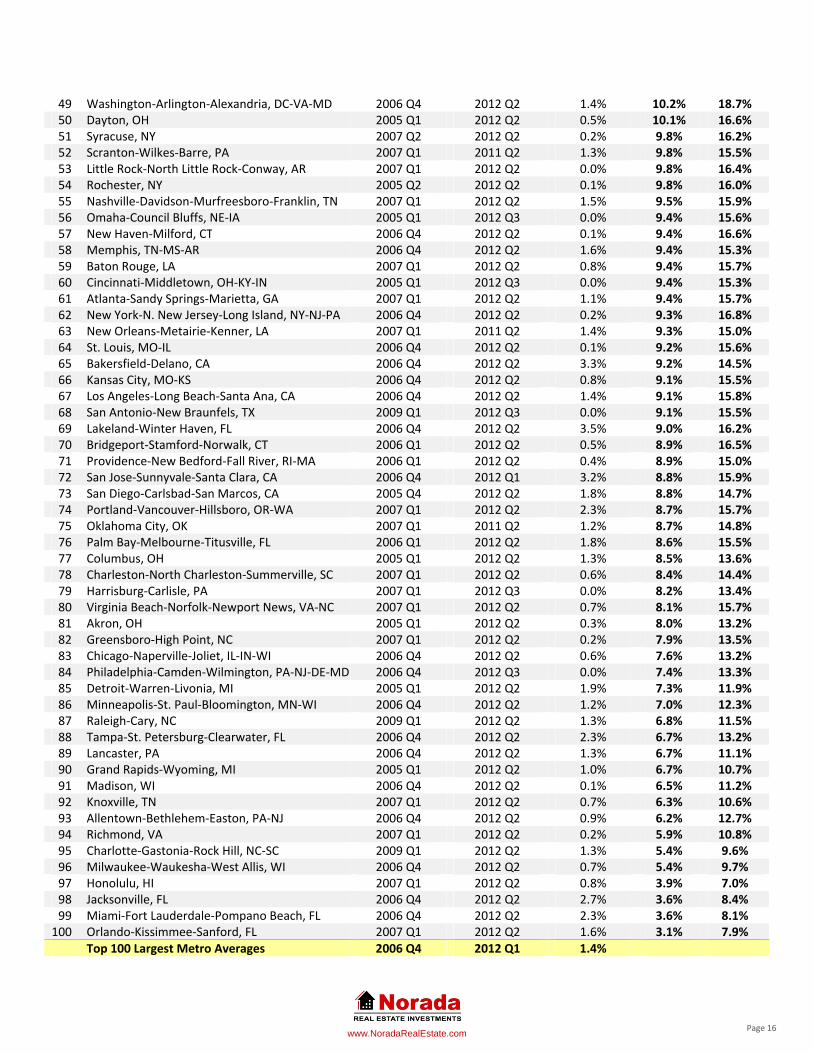
49 Washington‐Arlington‐Alexandria, DC‐VA‐MD 2006 Q4 2012 Q2 1.4% 10.2% 18.7%50 Dayton, OH 2005 Q1 2012 Q2 0.5% 10.1% 16.6%51 Syracuse, NY 2007 Q2 2012 Q2 0.2% 9.8% 16.2%52 Scranton‐Wilkes‐Barre, PA 2007 Q1 2011 Q2 1.3% 9.8% 15.5%53 Little Rock‐North Little Rock‐Conway, AR 2007 Q1 2012 Q2 0.0% 9.8% 16.4%54 Rochester, NY 2005 Q2 2012 Q2 0.1% 9.8% 16.0%55 Nashville‐Davidson‐Murfreesboro‐Franklin, TN 2007 Q1 2012 Q2 1.5% 9.5% 15.9%56 Omaha‐Council Bluffs, NE‐IA 2005 Q1 2012 Q3 0.0% 9.4% 15.6%57 New Haven‐Milford, CT 2006 Q4 2012 Q2 0.1% 9.4% 16.6%58 Memphis, TN‐MS‐AR 2006 Q4 2012 Q2 1.6% 9.4% 15.3%59 Baton Rouge, LA 2007 Q1 2012 Q2 0.8% 9.4% 15.7%60 Cincinnati‐Middletown, OH‐KY‐IN 2005 Q1 2012 Q3 0.0% 9.4% 15.3%61 Atlanta‐Sandy Springs‐Marietta, GA 2007 Q1 2012 Q2 1.1% 9.4% 15.7%62 New York‐N. New Jersey‐Long Island, NY‐NJ‐PA 2006 Q4 2012 Q2 0.2% 9.3% 16.8%63 New Orleans‐Metairie‐Kenner, LA 2007 Q1 2011 Q2 1.4% 9.3% 15.0%64 St. Louis, MO‐IL 2006 Q4 2012 Q2 0.1% 9.2% 15.6%65 Bakersfield‐Delano, CA 2006 Q4 2012 Q2 3.3% 9.2% 14.5%66 Kansas City, MO‐KS 2006 Q4 2012 Q2 0.8% 9.1% 15.5%67 Los Angeles‐Long Beach‐Santa Ana, CA 2006 Q4 2012 Q2 1.4% 9.1% 15.8%68 San Antonio‐New Braunfels, TX 2009 Q1 2012 Q3 0.0% 9.1% 15.5%69 Lakeland‐Winter Haven, FL 2006 Q4 2012 Q2 3.5% 9.0% 16.2%70 Bridgeport‐Stamford‐Norwalk, CT 2006 Q1 2012 Q2 0.5% 8.9% 16.5%71 Providence‐New Bedford‐Fall River, RI‐MA 2006 Q1 2012 Q2 0.4% 8.9% 15.0%72 San Jose‐Sunnyvale‐Santa Clara, CA 2006 Q4 2012 Q1 3.2% 8.8% 15.9%73 San Diego‐Carlsbad‐San Marcos, CA 2005 Q4 2012 Q2 1.8% 8.8% 14.7%74 Portland‐Vancouver‐Hillsboro, OR‐WA 2007 Q1 2012 Q2 2.3% 8.7% 15.7%75 Oklahoma City, OK 2007 Q1 2011 Q2 1.2% 8.7% 14.8%76 Palm Bay‐Melbourne‐Titusville, FL 2006 Q1 2012 Q2 1.8% 8.6% 15.5%77 Columbus, OH 2005 Q1 2012 Q2 1.3% 8.5% 13.6%78 Charleston‐North Charleston‐Summerville, SC 2007 Q1 2012 Q2 0.6% 8.4% 14.4%79 Harrisburg‐Carlisle, PA 2007 Q1 2012 Q3 0.0% 8.2% 13.4%80 Virginia Beach‐Norfolk‐Newport News, VA‐NC 2007 Q1 2012 Q2 0.7% 8.1% 15.7%81 Akron, OH 2005 Q1 2012 Q2 0.3% 8.0% 13.2%82 Greensboro‐High Point, NC 2007 Q1 2012 Q2 0.2% 7.9% 13.5%83 Chicago‐Naperville‐Joliet, IL‐IN‐WI 2006 Q4 2012 Q2 0.6% 7.6% 13.2%84 Philadelphia‐Camden‐Wilmington, PA‐NJ‐DE‐MD 2006 Q4 2012 Q3 0.0% 7.4% 13.3%85 Detroit‐Warren‐Livonia, MI 2005 Q1 2012 Q2 1.9% 7.3% 11.9%86 Minneapolis‐St. Paul‐Bloomington, MN‐WI 2006 Q4 2012 Q2 1.2% 7.0% 12.3%87 Raleigh‐Cary, NC 2009 Q1 2012 Q2 1.3% 6.8% 11.5%88 Tampa‐St. Petersburg‐Clearwater, FL 2006 Q4 2012 Q2 2.3% 6.7% 13.2%89 Lancaster, PA 2006 Q4 2012 Q2 1.3% 6.7% 11.1%90 Grand Rapids‐Wyoming, MI 2005 Q1 2012 Q2 1.0% 6.7% 10.7%91 Madison, WI 2006 Q4 2012 Q2 0.1% 6.5% 11.2%92 Knoxville, TN 2007 Q1 2012 Q2 0.7% 6.3% 10.6%93 Allentown‐Bethlehem‐Easton, PA‐NJ 2006 Q4 2012 Q2 0.9% 6.2% 12.7%94 Richmond, VA 2007 Q1 2012 Q2 0.2% 5.9% 10.8%95 Charlotte‐Gastonia‐Rock Hill, NC‐SC 2009 Q1 2012 Q2 1.3% 5.4% 9.6%96 Milwaukee‐Waukesha‐West Allis, WI 2006 Q4 2012 Q2 0.7% 5.4% 9.7%97 Honolulu, HI 2007 Q1 2012 Q2 0.8% 3.9% 7.0%98 Jacksonville, FL 2006 Q4 2012 Q2 2.7% 3.6% 8.4%99 Miami‐Fort Lauderdale‐Pompano Beach, FL 2006 Q4 2012 Q2 2.3% 3.6% 8.1%100 Orlando‐Kissimmee‐Sanford, FL 2007 Q1 2012 Q2 1.6% 3.1% 7.9%
Top 100 Largest Metro Averages 2006 Q4 2012 Q1 1.4%

www.NoradaRealEstate.com Page 17
Understanding the Graphs
Total Employment and Unemployment Total employment refers to non‐farm wage and salaried employees in the area. The unemployment rate is the percentage of
unemployed persons in the region’s labor force. Employment data are based upon a survey of businesses, while unemployment
rate information is based upon a survey of households.
How to Use It Total employment and the unemployment rate typically have an inverse relationship. These metrics can be used to determine
the health of the local labor market. Jobs are a major factor for housing demand. High levels of employment and low
unemployment rates tend to lead to healthier housing markets.
Annualized Net Migration The difference between the number of people who immigrate in and emigrate out of a particular region. These graphs show
annualized data updated monthly.
How to Use It Can be used to forecast population trends. Migration trends can be indicative of demographic and employment trends in a
particular area. Market areas with substantial inflows of new residents will have greater demand for new and existing homes.
Market areas with negative net migration will have less demand for additional homes.
Market Share of Home Sales Displays home closing share by sale type with each type representing their percentage of the entire market. Sale types are New
Homes, Regular Resale Homes (typical resale transactions between private parties), REO Sales (Real‐Estate Owned by Banks),
and Foreclosures (properties being transferred from homeowners to mortgage holders).
How to Use It Communicates the segments in the local housing market which are most active in the current month as well as in the same
month one and two years prior. Seeing the change in percentage from one year to a next is an indicator of the performance of
that sale type. This can also be a gauge of market health; for instance, a large percentage of activity in REO Sales and
Foreclosure Sales may imply a distressed market.
Year over Year Change in Price and Price/Sq Ft Displays the average closing sales amount and the average price per square foot for the current month along with the same
month a year ago and the year prior to that. These price metrics include all re‐sales, REO sales, and new home sales in the
market and therefore take into account all arm’s length transactions.
How to Use It Provides a trending view of year‐over‐year pricing in the market. Year‐over‐year comparisons are more reliable to follow than
month‐over‐month as seasonal differences can impact monthly trends. Taken together, the two pricing trends enable reliable
insights into the pricing strength of the market. A positive trend in both indicates a healthy and strong market. A negative
trend in both reveals weakness. A mixed trend, such as one where the average closing price is increasing but price per square
foot is decreasing reflects likely changes in product mix and so conflicting pricing trends do not provide reliable insights in such
a mixed scenario.

www.NoradaRealEstate.com Page 18
About Us
Norada Real Estate Investments
Norada Real Estate Investments is a premier real estate investment firm providing investors with quality
new and refurbished investment properties in growth markets throughout the United States.
Our turnkey rental properties, ranging from single‐family homes to fourplex multi‐units, make financial
sense the day you buy them and provide investors with good wealth‐building investments.
Norada Real Estate Investments helps take the guesswork out of real estate investing. By researching
top real estate growth markets and structuring complete turn‐key real estate investments, we help you
succeed by minimizing risk and maximizing profitability.
Marco Santarelli
Marco Santarelli is an investor, author, and the founder of Norada Real Estate Investments. He is also
the creator of DealGrader™ – a scoring system that measures the investment quality of a real estate
investment, giving you an overall snapshot of its profitability and investment risk.
Marco purchased his first real estate investment at the age of 18 and successfully handled the entire
process from rehabilitating the property to actively managing it without ever reading a book or taking a
course on the subject.
Because of his love and passion for real estate, and his desire to help others succeed in building their
wealth through real estate, he founded Norada Real Estate Investments in 2003.
Today, Marco Santarelli is a licensed California real estate broker and continues to run his successful real
estate firm with a focus on helping other investors build wealth through the power of real estate.
LEGAL DISCLAIMER AND TERMS OF USE
You do not have resell rights or giveaway rights to any portion of this Publication. Only customers that have purchased this publication are authorized to view it. This publication contains
material protected under International and Federal Copyright Laws and Treaties. No part of this publication may be transmitted or reproduced in any way without the prior written permission
of the author. Violations of this copyright will be enforced to the full extent of the law.
The information and resources provided in this publication are based upon the current real estate environment. The information presented in this publication may change, cease or expand
with time. We cannot be held responsible for changes that may affect the applicability of this information.
The reader understands that no warranty may be created from the information contained herein and it may not be suitable for your specific situation. Reader also understands that the
information contained herein is not a recommendation for any particular property, transaction, real estate market, or investment strategy. Reader further understands that none of the
information provided is advice concerning the nature, potential, value, or suitability of any particular property, real estate market, transaction, investment strategy, or other matter. To the
extent any of the content may be deemed to be investment advice, such information is impersonal and not tailored to the investment needs of any specific person.
All product names, logos and artwork are copyrights of their respective owners. None of the owners have sponsored or endorsed this publication. While all attempts have been made to verify
information provided, the author assumes no responsibility for errors, omissions, or contrary interpretation on the subject matter herein. Any perceived slights of peoples or organizations are
unintentional. The purchaser or reader of this publication assumes responsibility for the use of these materials and information. No guarantees of income are made. The author reserves the
right to make changes and assumes no responsibility or liability whatsoever on behalf of any reader or purchaser of these materials.