Embed Size (px)
Citation preview

OFFICER JUDICIAL RECOVERY PLAN May 2016

AGENDA Origins of the Crisis
Payment Proposal
Forecast Overview
Detailed Income Statement Forecast
09
14
21
25
2
Detailed Cash Flow Forecast 30
Company Overview 04
Next Steps 35

SUMÁRIO EXECUTIVO
3
• During the year of 2015, Officer (“Company”) faced a financial and economic crisis, caused by external (Brazil’s macroeconomic deterioration) and internal factors (high leverage, supply disruption and worsening of the cash flow cycle)
• Due to a severe liquidity crisis the Company filled for Judicial Recovery in October 2015
• The above considerations contributed for the company to enter a lack of liquidity vicious cycle – that precipitated a revenue collapse of approximately 90% and made the current fixed cost structure unfeasible for the new company's reality
• Facing this new scenario, Officer’s management build a business plan with three main sections that are already being implemented: (i) revenue rebound; (ii) debt/terms of payment renegotiation; (iii) adjustment of the fixed expenses
• The forecast presented in this plan, despite being conservative, considers the initiatives above to be successful
• In this plan it is evident that Officer will compromise all its operational cash flow to settle its judicial recovery debt during the next 10 years

1. COMPANY OVERVIEW
4

COMPANY OVERVIEW
Officer is a leading company in the technology distribution sector in Brazil
OFFICER OVERVIEW OFFICER SHAREHOLDER’S STRUCTURE
OFFICER HISTORY
2008
2007
2005
2004
1999
1993
2010
2012
Establishment of Officer Distribuidora
Sonda (a Chilean company) acquires Officer shares
Gross Income reaches US$300 millions¹
Ideiasnet acquires 50% of Officer’s share
Ideiasnet buys the remaining shares (50%) of Officer
Gross Income reaches US$500 millions²
Acquisition of BP Solutions
Officer finishes the ERP system implementation - and makes R$50 million debenture offering
• Throughout the last 22 years in the distribution sector, Officer increased its client base to approximately 12 thousand. It became the national leader in IT distribution
• Officer offers a wide portfolio of products, including hardwares, softwares and automation products
• The Company works with the world’s biggest technology manufacturers
• Besides its distribution centers, the Company has a wide range of dealers spread all over national territory
• Officer’s history of success brought the acclaim of clients and specialized publications like the Revista Exame and CRN
• In 2013, the Company won the Top of Mind IT Distributor Award – 92% of dealers said that Officer was their Company first choice supplier
Note: 1. US$/R$ 2.66 2. US$/R$ 2.34 Source: Officer 5
100.00%
Ideiasnet FIC
FIP II
IDCO Capital, LC 100.00%
81.76%
FIP I
18.24%
50.20%
5225 49.80%
100.00%
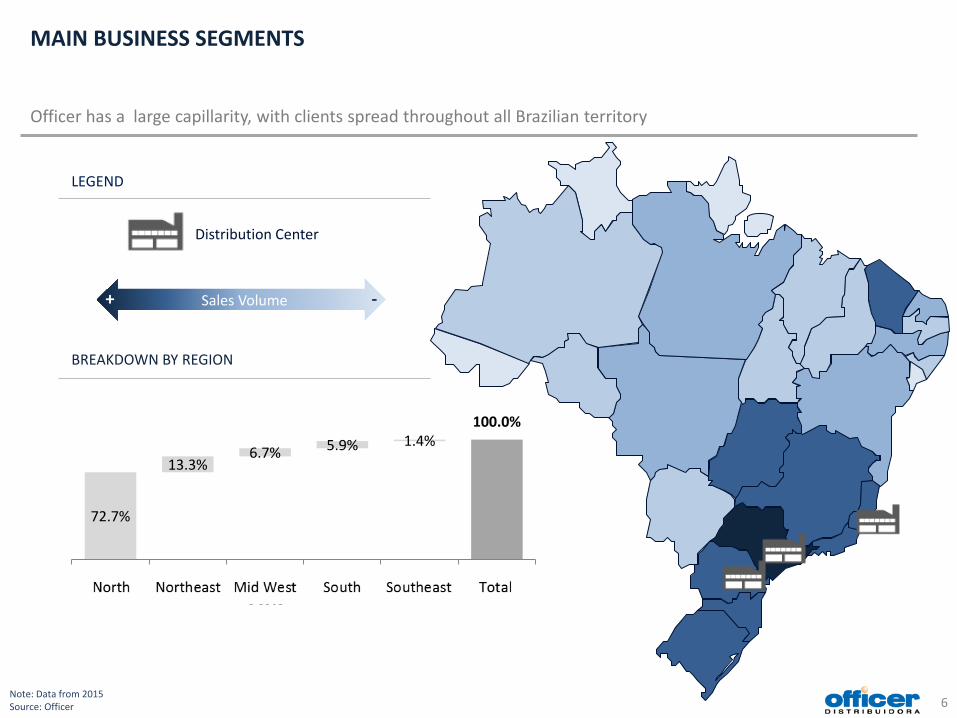
100.0%
72.7%
13.3% 6.7% 5.9% 1.4%
Sudeste Sul CentroOeste
Nordeste Norte Total
MAIN BUSINESS SEGMENTS Officer has a large capillarity, with clients spread throughout all Brazilian territory
Note: Data from 2015 Source: Officer
Distribution Center
LEGEND
BREAKDOWN BY REGION
6
Sales Volume + -

The Company has major competitive differentials
7 Source: Officer
Few Fixed Assets and Highly Scalable
Operation
b Logistic Capabilities
Multiple Sales Channels
Renowned National and International
Suppliers Wide Spread
Customer Portfolio
Nationwide Coverage
Recognized Brand
COMPETITIVE ADVANTAGES

PRODUCT MIX Despite the crisis, Officer has succeed on improving its product mix to preserve gross margin
PRODUCT MIX
Source: Officer 8
78.9% 78.1% 76.6% 72.8%
45.4%
58.2%
45.0%
17.5% 18.8% 19.8% 22.9%
43.0%
31.8% 35.8%
3.6% 3.1% 3.6% 4.3% 11.6% 10.1%
19.2%
3Q14 4Q14 1Q15 2Q15 3Q15 4Q15 1Q16
Hardware Software AutomaçãoAutomation

2. ORIGINS OF THE CRISIS
9

MACROECONOMIC OVERVIEW The third sector has been more affected in the recession...
IN 2016, IPCA (PRICE INDEX) WILL BE ABOVE ITS TARGET FAMILIES INDEBTENDNESS HAS GROWN CONSUMER CONFIDENCE INDEX (ICC¹) IS
CLOSE TO ITS HISTORICAL LOW
Note: 1. Consumer Confidence Index Source: Banco Central do Brasil; IPEADATA; Fecomercio; IBGE; Bradesco
UNEMPLOYMENT RATE FORECAST IS OVER ITS 10 YEAR HIGH
MARKET FORECAST A GDP RETRATION IN 2016
10
8.8% 10.0%
9.3% 7.9% 8.1%
6.7% 6.0% 5.5% 5.4% 4.8%
6.8%
10.2%
2005A 2006A 2007A 2008A 2009A 2010A 2011A 2012A 2013A 2014A 2015A 2016E
3.1% 4.0%
6.0% 5.0%
-0.2%
7.6%
3.9%
1.8% 2.7%
0.1% -3.8% -3.7% 2005A 2006A 2007A 2008A 2009A 2010A 2011A 2012A 2013A 2014A 2015A 2016E
CAGR 2005/11: 4.2% CAGR 2012/16: -0.6%
HIGHLIGHTS • Economic and political crisis
results in a worst market perspective
• Rise of unemployment
• Increase of families indebtedness and GDP contraction (the third sector, in which Officer competes, has been more affected)
0
50
100
150
ICC Mínima ICC 55%
48% 49%
43%
39%
49%
55% 52% 51%
30%
35%
40%
45%
50%
55%
60%
Jan-14 May-14 Sep-14 Jan-15 May-15 Sep-15 Jan-16
5.7% 3.1%
4.5% 5.9%
4.3% 5.9% 6.5% 5.8% 5.9% 6.4%
10.7%
7.3%
00%
02%
04%
06%
08%
10%
12%
00%
02%
04%
06%
08%
10%
12%
2005A 2006A 2007A 2008A 2009A 2010A 2011A 2012A 2013A 2014A 2015A 2016E
CAGR 2005/11: 5.1% CAGR 2012/16: 7.2%
Price Index Target
ICC Min.

LOW LIQUIDITY VICIOUS CYCLE
… which drove the Company to a low liquidity vicious cycle …
Source: Officer
Reduction in payment deadlines and suppliers on
hold
High funding cost Low liquidity Funding with suppliers and payment delays
Inventory sale without proper replenishment
Commercial Problems: inefficiency, negative market
reaction, replacement for competitors
Deterioration of the operational performance
Working capital impact
Inventory rupture Low utilization of installed capacity
11

OFFICER HAS ALSO SUFFERED ... that worsened Officer’s financial performance and forced the company to a Judicial Recovery...
NET REVENUE DECLINE... EXCESSIVE LEVERAGE AND LOW AVAILABILITY OF NEW CREDIT LINES¹...
... LEAD OFFICER TO FINANCED ITSELF WITH ITS SUPPLIERS DURING 2015…
2% (20%) 131% 124%
33.1 33.8 26.9 62.4
139.9
Dec-13 Jun-14 Dec-14 Jun-15 Oct-15
52.5 78.2
112.5 143.4
173.0 176.5 201.6
142.8²
2008A 2009A 2010A 2011A 2012A 2013A 2014A 2015A
Note: Data in R$ Million; 1. Consolidated debt between Officer and 5225; 2. Considering the collateral taken by banks; 3. Considering the outstanding payments Source: Officer; IdeiasNet 12
HIGHLIGHTS • Revenue decrease in 2016 – ~90% of
the 2012 level
• Due to the negative financial results and large long term investments, the Company sought funding
• Refinancing interruption lead to an increase in outstanding payments
• Those decisions led to an unfeasible cash flow and request for Judicial Recovery
... THOSE DECISIONS LED TO AN UNFEASIBLE CASH FLOW IN OCTOBER 2015³
-159.1
-196.6
Oct-15 Nov-15
...IMPACTING EBITDA
649 727 704
853 1,170
1,502 1,409
1,195
655
162 226 384
13.0 23.6
13.0 25.2
44.5 48.4
22.5
-16.0
-45.6
-11.6 -1.7
11.3

NET ASSET VALUE ... that reduced Officer’s Enterprise Value, currently unfeasible to pay all its debts in case of bankruptcy
13
NET ASSET VALUE
23,7
58,7 10,6 1,2
94,2 (77,0)
(0,9) (7,5)
(209,8) (200,6)
In R$ Million
Note: 1. Includes banks collateral, restructuring expenses, expected cost of further dismissals, and minimum value of tax legal disputes 2. Forced sale values Source: Officer

3. PAYMENT PROPOSAL OVERVIEW
14

ANALYSIS OF OFFICER’S JUDICIAL RECOVERY LIABILITIES (BY CLASS)
There are 1,202 creditors distributed in three classes of debt: I, III and IV...
Source: Officer 15
In R$ Thousand 268,671
899
266,544 1,227
Classe I Classe II Classe III Classe IV TotalClass I Class II Class III Class IV Total
# of creditors 201 - 424 575 1,200
Main constituents of each class
Employees and law firms - Financial institutions,
suppliers and dealers Small and Micro
suppliers and dealers -
Percentage of credits inferior to R$ 10
thousand 94.0% - 75.9% 95.5% 88.3%
GENERAL LIST OF CREDITORS¹

# Supplier Value Class III Repr. (%) Product Segment
1 Oracle 30.06 11.3% HW 2 VmWare e EMC 20.34 7.6% HW 3 Lenovo 12.58 4.7% HW 4 Symantec 8.15 3.1% SW 5 Cisco 6.71 2.5% HW 6 Zebra 6.61 2.5% AT 7 LG 5.66 2.0% HW 8 IBM 5.50 2.1% HW 9 HP 5.32 2.0% HW
10 Epson 4.66 1.7% HW Total 105.59 39.6%
Suppliers
CLASS III ... of which Class III concentrates most of the debt, Class III can be broken in 3 subclasses
16
Per capita Value Per capita (< R$ 10 Thousand)
Value (< R$ 10 Thousand)
Financial Intitutions 7 R$ 133.2 M - -
Suppliers 138 R$ 132.2 M 66 R$ 0.2 M
Dealers 279 R$ 1.1 M 256 R$ 0.5 M
Total 424 R$ 266.5 M 322 R$ 0.7 M
BREAKDOWN DA CLASSE III
In R$ Millions
Source: Officer

PAYMENT PROPOSAL Payment proposal overview – Except Financial Institutions and Suppliers
LABOR RELATED DEBTS (CLASS I)
DEALERS (CLASS III)
Note: 1. Remaining Value: Residual credit after the R$ 10,000 payment to every creditor Source: Officer 17
Payment at sight¹ Remaining Value (after payment at sight)
Within 30 days after the Plan’s judicial
approval Haircut Payment
Methodology Number of Instalments
Grace Period (principal)
Monetary Correction
Grace Period (M.C) Cash Sweep
R$ 10 thousand 0% Straight Line 4 monthly installments 8 months TR Monthly, no grace
period No
Payment at sight¹ Remaining Value
Within 30 days after the Plan’s judicial
approval Haircut Payment
Methodology Number of Instalments
Grace Period (principal)
Monetary Correction
Grace Period (M.C) Cash Sweep Supporting
Creditor
R$ 10 thousand 0% Straight Line 60 monthly installments 8 months TR Monthly, no grace
period No No
R$ 10 thousand 0% Straight Line 24 monthly installments 8 months TR Monthly, no grace
period No Yes*
*Supporting Dealers will have to buy a minimum of R$ 500 thousand until the end of the year
MICRO & SMALL CREDITORS (CLASS IV)
Payment at sight¹ Remaining Value
Within 30 days after the Plan’s judicial
approval Haircut Payment
Methodology Number of
Installments Grace Period
(principal) Monetary Correction
Grace Period (M.C) Cash Sweep
R$ 10 thousand 0% Straight Line 24 monthly installments 8 months TR Monthly, no grace
period No

PAYMENT PROPOSAL
OPTION A OPTION B
Supporting Creditor¹ No Yes
Minimum of 60 days of terms of payment, on average
R$ 10 thousand Payment Yes¹ Yes¹
Compliance Bonus 70% 35%
Monetary Correction TR - BRL Libor USD (6 Months) – USD
TR - BRL Libor USD (6 Months) - USD
Grace period (Monetary Correction) Until Jan/18 Until Jan/18
Amortization Plan Staggered Payment (slide 19)
Staggered Payment (slide 19)
Cash Sweep² No Yes
Minimum balance N/A
1º year: 70% of remaining debt 2º year: 85% of remaining debt
3º year onward: 100% of remaining debt Always limited to R$ 10 millions
Refusal of new purchases for supporting creditors N/A
Supporting suppliers can refuse to sell a specific product if Officer have 60 or more days of sales of
this product in stock³
Maximum admission of supporting creditors - 50%4
PAYMENT PROPOSAL FOR SUPPLIERS Overview of the payment proposal for creditors - Suppliers
Note: 1. Creditor that allows Officer to pay for purchases within 60 or more days, on average; 2. Cash Sweep: 20% será distribuído com base em ranking de lucro bruto e 10% com base no pagamento da Verba Champion; 3. Inventory in value , to compute days sales will be considered the average sales of the last 3 months . 4. If 50% of creditors (in value) choose Option B, the remaining credit must be paid according to Option A, witch in this case will have priority for cash sweep funds Source: Officer 18

0.00% 0,00% 0.00% 0.00% 0.00% 0.30% 0.30% 0.30% 0.30% 0.45% 0.45% 1.50% 1.50% 1.50%
2.25% 2.25% 2.25% 2.25% 3.00% 3.00% 3.00%
5.40%
30.00%
35.00%
35.00% 70.00%
2016 2017 2018 2019 2020 2021 2022 2023 2024 2025 2026 2027 2028 2029 2030 2031 2032 2033 2034 2035 2036 2037 2038 2039 Total
Pagamento Bônus de Adimplência
0.00% 0.00% 3.25% 3.90% 5.20% 9.75%
9.75% 13.65%
19.50%
65.00%
35.00% 35.00%
2016 2017 2018 2019 2020 2021 2022 2023 2024 2025 Total
Pagamento Bônus de Adimplência
Within 30 days after judicial approval of the Plan C.B.² Monetary Correction Cash Sweep
R$ 10 thousand 35% TR – BRL Libor - USD 30% of what exceeds NOPAT4
PAYMENT PROPOSAL FOR SUPPLIERS Overview of the staggered payment proposal - Suppliers
OPTION A – NON-SUPPORTING CREDITORS STAGGERED PAYMENT PROPOSAL
Grace Period Amortization Plan Within 30 days after judicial
approval of the Plan C.B.¹ Monetary Correction Cash Sweep
R$ 10 thousand 70% TR - BRL Libor - USD No
OPTION B – SUPPORTING CREDITORS STAGGERED PAYMENT PROPOSAL¹³
Amortization Plan
Note: 1. Principal amortization on monthly installments 2.C.B. – Compliance Bonus; 3. Creditor that allows Officer to pay for purchases within a average of 60 or more days; 4. 20% will be shared based on the gross income ranking and 10% based on champion funds Source: Officer 19
C.B.²
100.00%
100.00%
C.B.² Grace Period
Payment Compliance Bonus
Payment Compliance Bonus

100.0%
0.5% 0.5% 0.5% 0.5% 0.8% 0.8% 2.5% 2.5% 2.5% 3.8% 3.8% 3.8% 3.8% 5.0% 5.0% 5.0% 9.0%
50.0%
Total 2016 2017 2018 2019 2020 2021 2022 2023 2024 2025 2026 2027 2028 2029 2030 2031 2032 2033 2034 2035 2036 2037
Pagamento Deságio
PAYMENT PROPOSAL FOR FINANCIAL INSTITUTIONS Overview of the staggered payment proposal - Banks
20
PAYMENT PROPOSAL
Option A Option B
R$ 10 thousand payment at sight Yes Yes
Haircut 50%(Applied in Dec/16) 50%(Applied in May/17)
Monetary Correction Starting on Jan/17
CDI – BRL Libor USD (6 Months) - USD
Starting on Jun/17 CDI – BRL
Libor USD (6 Months) - USD
Grace Period (Monetary Correction) Until Jan/21 Until Jan/21
Amortization Plan Staggered Payment Staggered Payment
AMORTIZATION PLAN FOR FINANCIAL INSTITUTIONS¹
Grace Period Amortization Plan
Payment Haircut
Note: 1. Principal amortization made on monthly installments Source: Officer

4. FORECAST OVERVIEW
21
FORECASTED INCOME STATEMENT FOR THE COMING YEARS¹
FORECASTED INCOME STATEMENT The Company returns to a sustainable profitability in 2019...
Note: 1. In R$ thousand and nominal terms Source: Officer 22
Income Statement 2015A 2016E 2017E 2018E 2019E 2020E 2021E 2022E 2023E 2024E 2025E
Gross Revenue 820,622 200,460 282,790 484,489 602,032 676,952 740,455 809,915 885,891 968,993 1,059,892
Rev. Growth(%) (40.5%) (75.6%) 41.1% 71.3% 24.3% 12.4% 9.4% 9.4% 9.4% 9.4% 9.4%
Net Revenue 655,308 161,810 226,325 384,872 478,247 537,763 588,209 643,387 703,741 769,757 841,965
(-) COGS (551,063) (133,368) (185,407) (314,247) (388,274) (436,593) (477,548) (522,346) (571,345) (624,942) (683,565)
Gross Income 104,245 28,442 40,918 70,625 89,973 101,170 110,660 121,041 132,395 144,815 158,400
Gross Margin (%) 15.9% 17.6% 18.1% 18.4% 18.8% 18.8% 18.8% 18.8% 18.8% 18.8% 18.8%
(-) Expenses (176,481) (40,064) (42,666) (59,336) (71,950) (80,835) (88,381) (96,702) (105,778) (115,996) (127,138)
EBITDA (45,562) (11,622) (1,749) 11,289 18,023 20,335 22,280 24,339 26,618 28,819 31,261
EBITDA Margin (%) (7.0%) (7.2%) (0.8%) 2.9% 3.8% 3.8% 3.8% 3.8% 3.8% 3.7% 3.7%

FORECASTED CASHFLOW ... and due to creditors payments, only in 2025 the company will have a positive cash flow
FORECASTED CASH FLOW FOR THE COMING YEARS¹
23
Cash Flow 2016E 2017E 2018E 2019E 2020E 2021E 2022E 2023E 2024E 2025E
Operational Cash flow 3,336 (1,478) 7,643 18,270 15,336 19,778 21,202 22,319 23,820 24,920
EBITDA² (7,836) (1,749) 11,289 18,023 20,335 22,280 24,339 26,618 28,819 31,261
Tax 0 0 0 0 (235) (1,382) (1,913) (2,961) 0 (4,741)
Working Capital 25,663 2,540 (3,253) (2,083) (4,180) (4,476) (4,896) (5,355) (5,857) (6,407)
Others (14,491) (2,269) (393) 2,329 (585) 3,356 3,672 4,016 858 4,806
Investments Cash Flow (682) (1,615) (1,585) (1,525) (1,570) (647) (753) (828) (912) (1,004)
CAPEX (682) (1,615) (1,585) (1,525) (1,570) (647) (753) (828) (912) (1,004)
Financing Cash Flow³ (7,670) (3,529) (9,969) (10,546) (11,851) (25,318) (25,660) (24,658) (26,488) (13,604)
Interest Expenses (3,147) (425) (4,720) (5,089) (5,500) (14,751) (15,146) (12,930) (11,303) (10,330)
Debt Amortization (3,701) (1,459) (2,987) (2,989) (3,884) (8,099) (8,046) (10,902) (15,185) (1,360)
Collateral release 0 0 0 0 0 0 0 0 0 0
Tax installments (822) (1,645) (2,262) (2,468) (2,468) (2,468) (2,468) (827) 0 (1,914)
Free Cash Flow Generation (5,016) (6,621) (3,911) 6,198 1,914 (6,186) (5,210) (3,168) (3,580) 10,311
Note: 1. In R$ thousand and nominal terms; 2. 2016 EBITDA only refer to the period from march to December (forecasted) 3. Disregarding collateral and cash sweep payments Source: Officer
0.4 9.5 9.4 9.3 9.2 9.4
1.9 1.9 1.9
2.2 2.2 2.2 2.1 2.3
0.6 4.3 4.7 5.6
8.7 8.5 11.2 15.1
3.5 1.3
6.6 6.7 7.5
20.4 20.1 22.6
26.5
11.7
,00
5,00
10,00
15,00
20,00
25,00
30,00
2016E 2017E 2018E 2019E 2020E 2021E 2022E 2023E 2024E 2025E
Classe I Bancos Fornecedores NCol. Fornecedores Col. Revendas Classe IV
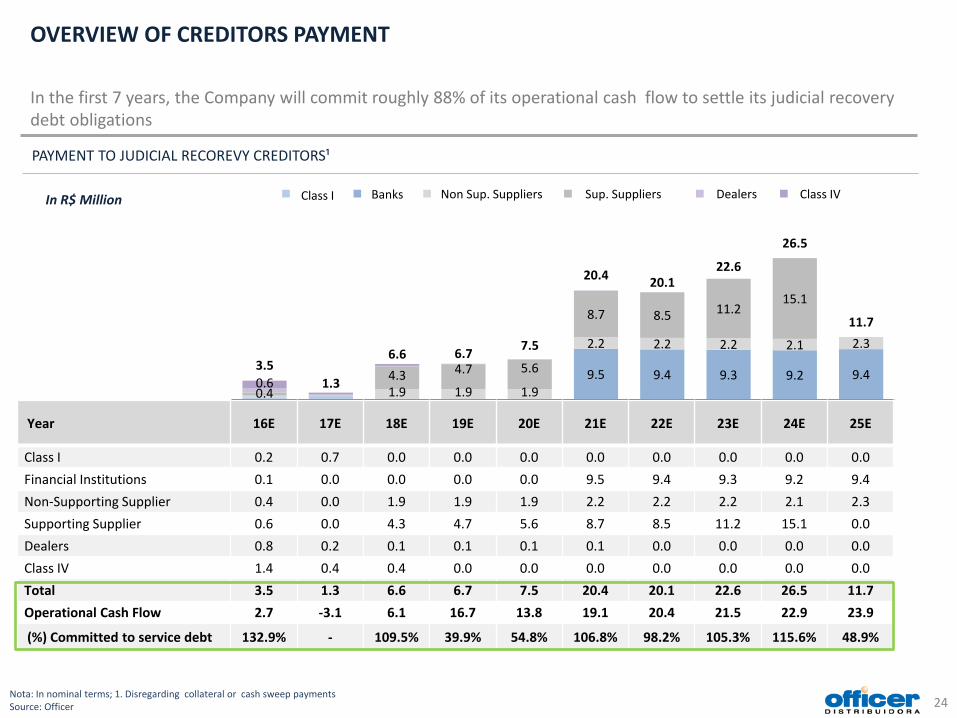
OVERVIEW OF CREDITORS PAYMENT
In the first 7 years, the Company will commit roughly 88% of its operational cash flow to settle its judicial recovery debt obligations
PAYMENT TO JUDICIAL RECOREVY CREDITORS¹
24
Year 16E 17E 18E 19E 20E 21E 22E 23E 24E 25E
Class I 0.2 0.7 0.0 0.0 0.0 0.0 0.0 0.0 0.0 0.0 Financial Institutions 0.1 0.0 0.0 0.0 0.0 9.5 9.4 9.3 9.2 9.4 Non-Supporting Supplier 0.4 0.0 1.9 1.9 1.9 2.2 2.2 2.2 2.1 2.3 Supporting Supplier 0.6 0.0 4.3 4.7 5.6 8.7 8.5 11.2 15.1 0.0 Dealers 0.8 0.2 0.1 0.1 0.1 0.1 0.0 0.0 0.0 0.0 Class IV 1.4 0.4 0.4 0.0 0.0 0.0 0.0 0.0 0.0 0.0 Total 3.5 1.3 6.6 6.7 7.5 20.4 20.1 22.6 26.5 11.7 Operational Cash Flow 2.7 -3.1 6.1 16.7 13.8 19.1 20.4 21.5 22.9 23.9
(%) Committed to service debt 132.9% - 109.5% 39.9% 54.8% 106.8% 98.2% 105.3% 115.6% 48.9%
In R$ Million Class IV Dealers Sup. Suppliers Non Sup. Suppliers Banks Class I
Nota: In nominal terms; 1. Disregarding collateral or cash sweep payments Source: Officer
5. DETAILED INCOME STATEMENT FORECAST
25

REVENUE FORECAST Due to the lack of working capital, the company expects a slower revenue rebound...
GROSS REVENUE FORECAST
26
Forecast Historical In R$ Million
1,556.6
1,379.0
820.6
200.5 282.8
484.5 602.0
677.0 740.5 809.9 885.9
969.0 1,059.9
2013A 2014A 2015A 2016E 2017E 2018E 2019E 2020E 2021E 2022E 2023E 2024E 2025EYear 13A 14A 15A 16E 17E 18E 19E 20E 21E 22E 23E 24E 25E
Revenue (real terms)¹ - - - 188.4 253.1 413.0 491.1 528.5 553.1 579.0 606.0 634.3 663.9
(%) Gross Revenue Growth (11.4%) (40.5%) (75.6%) 41.1% 71.3% 24.3% 12.4% 9.4% 9.4% 9.4% 9.4% 9.4%
Max . Cash Exposure¹² - - - 3.7 12.1 8.2 8.2 11.3 10.1 4.9 1.7 (1.8) (0.7)
Note: In real terms; 1.Data for forecasted values only; 2. Monthly data, not necessarily the final cash position of the year Source: Officer

GROSS INCOME FORECAST ... but with less negative impact on gross income, due to improvements in the product mix
GROSS INCOME FORECAST
27
Forecast Historical In R$ Million
231.5
187.7
104.2
28.4 40.9
70.6 90.0 101.2 110.7 121.0 132.4
144.8 158.4
00
50
100
150
200
250
2013A 2014A 2015A 2016E 2017E 2018E 2019E 2020E 2021E 2022E 2023E 2024E 2025EYear 13A 14A 15A 16E 17E 18E 19E 20E 21E 22E 23E 24E 25E
(%) Gross Margin 16.4% 15.7% 15.9% 17.6% 18.1% 18.4% 18.8% 18.8% 18.8% 18.8% 18.8% 18.8% 18.8%
During the last months, Officer already succeeded to shift a share of its product mix towards software products, segment with higher gross margin . Its expected that the company manages to keep this shift
Note: In nominal terms Source: Officer

FIXED AND VARIABLE EXPENSES ANALYSIS
FIXED AND VARIABLE EXPENSES ANALYSIS
28
From the reductions already mentioned, the company will reduce its fixed expenses structure...
Forecast Historical In R$ Million
76.9 85.2 75.1 19.3 16.3 17.8 20.2 22.5 24.6 27.1 29.8 32.9 36.4
91.5 111.4
96.0
20.7 26.4 41.5 51.7 58.3 63.8 69.6 76.0 83.1 90.7
168.4
196.6
171.1
40.1 42.7 59.3 71.9 80.8 88.4 96.7
105.8 116.0 127.1
0
50
100
150
200
250
0
50
100
150
200
250
2013A 2014A 2015A 2016E 2017E 2018E 2019E 2020E 2021E 2022E 2023E 2024E 2025E
Despesas Fixas Despesas Var.
Year 13A 14A 15A 16E 17E 18E 19E 20E 21E 22E 23E 24E 25E
(%) Fix. Expen./ Net Rev. 5.5% 7.1% 11.5% 12.0% 7.2% 4.6% 4.2% 4.2% 4.2% 4.2% 4.2% 4.3% 4.3%
(%) Var. Expen./ Net Rev. 7.3% 10.3% 12.0% 12.8% 11.7% 10.8% 10.8% 10.8% 10.8% 10.8% 10.8% 10.8% 10.8%
The sharp revenue decline brought a increase of the fixed expenses share on total expenses in 2016 – to balance this proportion, the company is implementing several reductions
Fixed Expenses Var. Expenses
Note: In nominal terms Source: Officer
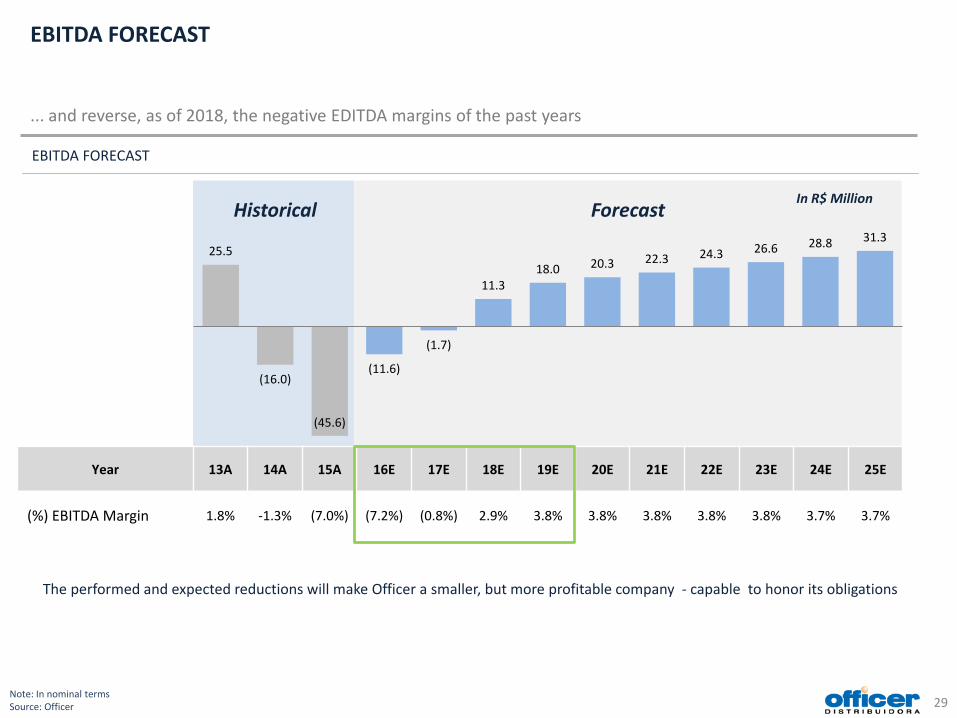
EBITDA FORECAST ... and reverse, as of 2018, the negative EDITDA margins of the past years
EBITDA FORECAST
29
Forecast Historical In R$ Million
25.5
(16.0)
(45.6)
(11.6)
(1.7)
11.3 18.0 20.3 22.3 24.3 26.6 28.8 31.3
2013A 2014A 2015A 2016E 2017E 2018E 2019E 2020E 2021E 2022E 2023E 2024E 2025EYear 13A 14A 15A 16E 17E 18E 19E 20E 21E 22E 23E 24E 25E
(%) EBITDA Margin 1.8% -1.3% (7.0%) (7.2%) (0.8%) 2.9% 3.8% 3.8% 3.8% 3.8% 3.8% 3.7% 3.7%
Note: In nominal terms Source: Officer
The performed and expected reductions will make Officer a smaller, but more profitable company - capable to honor its obligations

6. DETAILED CASH FLOW FORECAST
30
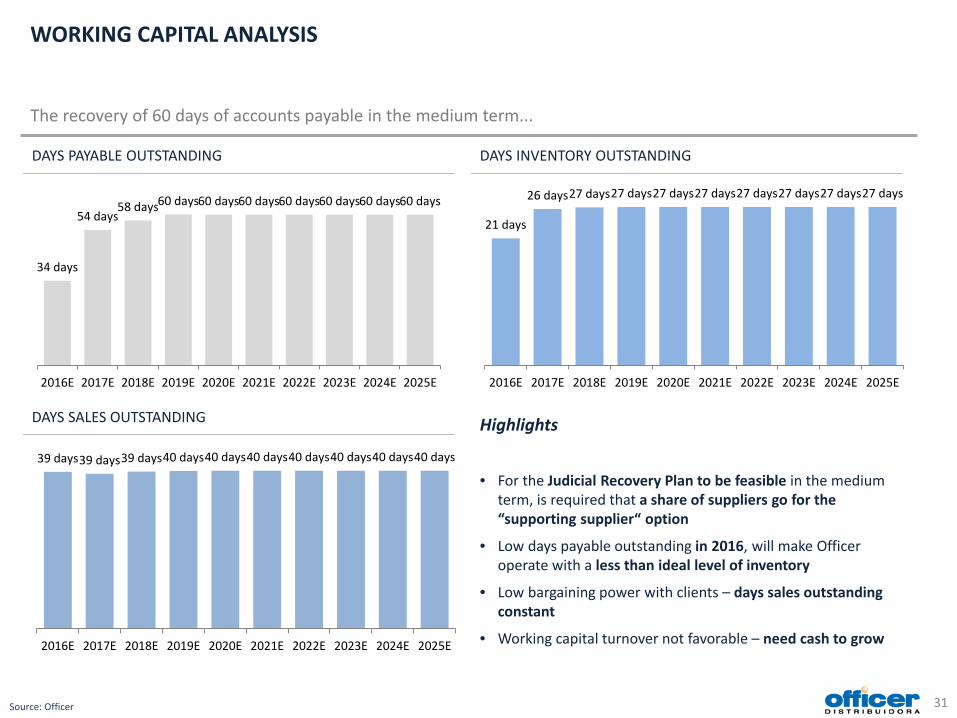
WORKING CAPITAL ANALYSIS The recovery of 60 days of accounts payable in the medium term...
DAYS PAYABLE OUTSTANDING
Source: Officer 31
DAYS INVENTORY OUTSTANDING
DAYS SALES OUTSTANDING
39 days 39 days 39 days 40 days 40 days 40 days 40 days 40 days 40 days 40 days
2016E 2017E 2018E 2019E 2020E 2021E 2022E 2023E 2024E 2025E
21 days
26 days 27 days 27 days 27 days 27 days 27 days 27 days 27 days 27 days
2016E 2017E 2018E 2019E 2020E 2021E 2022E 2023E 2024E 2025E
34 days
54 days 58 days 60 days 60 days 60 days 60 days 60 days 60 days 60 days
2016E 2017E 2018E 2019E 2020E 2021E 2022E 2023E 2024E 2025E
Highlights
• For the Judicial Recovery Plan to be feasible in the medium term, is required that a share of suppliers go for the “supporting supplier“ option
• Low days payable outstanding in 2016, will make Officer operate with a less than ideal level of inventory
• Low bargaining power with clients – days sales outstanding constant
• Working capital turnover not favorable – need cash to grow

FIXED ASSETS INVESTMENTS ... combined with a low requirement of long term investments...
LONG TERM INVESTMENTS¹
32
Forecast Historical In R$ Millions
Through out the last years, Officer made large investments in intangible (Ex: ERP) and fixed assets, a element that is a virtue of the company, as there is no asset bottleneck to stall the expected growth
4.8 5.1
0.5 0.7
1.6 1.6 1.5 1.6
0.6 0.8 0.8 0.9 1.0
2013A 2014A 2015A 2016E 2017E 2018E 2019E 2020E 2021E 2022E 2023E 2024E 2025E
Note: In nominal terms; 1. Only accounts investments in intangibles and fixed assets Source: Officer

269
181 189 193 197 201 193 185 174
135 134 132 128 123 119 112 105 98 92 82 73 64
Dív.RJ¹
2016E 2017E 2018E 2019E 2020E 2021E 2022E 2023E 2024E 2025E 2026E 2027E 2028E 2029E 2030E 2031E 2032E 2033E 2034E 2035E 2036E 2037E
JUDICIAL RECOVERY DEBT ANALYSIS ... will allow Officer to settle its debts in the long run
ANALYSIS OF REESTRUCTURABLE DEBT AND AMORTIZATION PLAN KEY DATES¹
33
Payments at sight and haircut (Banks)
Beginning of amortization plan of Class III dealers, Class IV and Class I
Dealers debt fully settled and start of Class III Financial Institutions and suppliers amortization plan (non-supporting)
Supporting suppliers debt fully settled
Final debt settlement of financial institutions and non-supporting suppliers
End of grace period for monetary correction (suppliers) and start of amortization plan for creditors Class III (supporting suppliers)
Debt²
Note: In nominal terms; 1. Disregarding cash sweep payments; 2. Debt subject to judicial recovery Source: Officer
In R$ Millions

FORECAST OVERVIEW In summary, the objective is to create a proposal that generates value to all stakeholders
Income and Cash flow Statement 2016E¹ 2017E 2018E 2019E 2020E 2021E 2022E 2023E 2024E 2025E Gross Revenue 200,460 282,790 484,489 602,032 676,952 740,455 809,915 885,891 968,993 1,059,892 Revenue Growth. -75.6% 41.1% 71.3% 24.3% 12.4% 9.4% 9.4% 9.4% 9.4% 9.4% In real terms 188,402 253,124 413,013 491,114 528,452 553,133 578,967 606,008 634,312 663,937 Net Revenue 161,810 226,325 384,872 478,247 537,763 588,209 643,387 703,741 769,757 841,965 COGS (133,368) (185,407) (314,247) (388,274) (436,593) (477,548) (522,346) (571,345) (624,942) (683,565) Gross Income 28,442 40,918 70,625 89,973 101,170 110,660 121,041 132,395 144,815 158,400 Gross Margin 17.6% 18.1% 18.4% 18.8% 18.8% 18.8% 18.8% 18.8% 18.8% 18.8% Var. Expenses (20,715) (26,400) (41,487) (51,728) (58,315) (63,762) (69,618) (76,023) (83,051) (90,738) Fixed Expenses (19,350) (16,267) (17,849) (20,221) (22,519) (24,619) (27,084) (29,755) (32,945) (36,401) Var. Expen./ Net Rev. 12.8% 11.7% 10.8% 10.8% 10.8% 10.8% 10.8% 10.8% 10.8% 10.8% Fixed Expen./ Net Rev. 12.0% 7.2% 4.6% 4.2% 4.2% 4.2% 4.2% 4.2% 4.3% 4.3% EBITDA (11,622) (1,749) 11,289 18,023 20,335 22,280 24,339 26,618 28,819 31,261 EBITDA Mrg. -7.2% -0.8% 2.9% 3.8% 3.8% 3.8% 3.8% 3.8% 3.7% 3.7% Tax 0 0 0 0 (235) (1,382) (1,913) (2,961) 0 (4,741) Δ Kgiro 25,663 2,540 (3,253) (2,083) (4,180) (4,476) (4,896) (5,355) (5,857) (6,407) Others (14,491) (2,269) (393) 2,329 (585) 3,356 3,672 4,016 858 4,806 Capex (682) (1,615) (1,585) (1,525) (1,570) (647) (753) (828) (912) (1,004) FC Op - Capex 2,654 (3,093) 6,058 16,744 13,766 19,132 20,450 21,490 22,908 23,916
Financial Cash Flow² (7,670) (3,529) (9,969) (10,546) (11,851) (25,318) (25,660) (24,658) (26,488) (13,746) Class I (185) (723) 0 0 0 0 0 0 0 0 Financial Institutions (70) 0 0 0 0 (9,471) (9,382) (9,294) (9,206) (9,433) Non Supporting Suppliers (445) 0 (1,933) (1,933) (1,933) (2,166) (2,160) (2,154) (2,147) (2,257) Supporting Suppliers (617) 0 (4,284) (4,690) (5,553) (8,740) (8,547) (11,175) (15,136) 0 Dealers (821) (177) (58) (57) (55) (54) 0 0 0 0 Class IV (1,389) (368) (359) 0 0 0 0 0 0 0 Non Judicial Recovery Obligations (4,142) (2,260) (3,335) (3,866) (4,310) (4,886) (5,570) (2,036) 0 (2,057)
Free Cash Flow Generation (5,016) (6,621) (3,911) 6,198 1,914 (6,186) (5,210) (3,168) (3,580) 10,311
Cash (end of period) 18,726 12,105 8,194 14,392 16,307 10,121 4,910 1,742 (1,838) 8,474
34 Note: In R$ thousand and nominal terms; 1. 2016 cash flow values only consider data from March forward; 2 Disregarding bank collateral and expected cash sweep payments Source: Officer

7. NEXT STEPS
35

NEXT STEPS SCHEDULE Agenda for next weeks
Source: Officer 36
* Justice approval expected on June, 2016
Holiday Time required to perform each task
Month April May June
Week 1ª Week 2ª Week 3ª Week 4ª Week 5ª Week 6ª Week 7ª Week
Day 25 26 27 28 29 2 3 4 5 6 9 10 11 12 13 16 17 18 19 20 23 24 25 26 27 30 31 1 2 3 6 7 8 9 10 Negotiation rounds
Plan publication
Convocation notice
1ª Convocation
2ª Convocation
SCHEDULE

CONCLUSION
37
• Macroeconomic deterioration, troublesome negotiations with suppliers and scarce working capital resulted in significantly inferior performance in the first quarter compared with the last years
• In a conservative approach, the management decided to introduce a new perspective of Officer’s results, more aligned with the current macro/micro scenarios
• The payment proposal is adequate to the Company new reality and can be improved in case of it achieving a performance better than expected (cash sweep for supporting suppliers)
• The Company believes that its success does not come only with the approval of its Judicial Recovery Plan, but also with the understanding of creditors of the need to reestablish pre-crisis business relationships
• It is important to emphasize that the postponement of the general assembly imply in extending the company cash burn, that is harmful to the Company and the creditors as well
• To carry out the established agenda in this short period of time, its imperative for all players to be aligned and engaged in the process

CONTACTS
Rua Surubim, 577, 9º andar – Cidade Monções
São Paulo/ SP CEP: 04571-050
Telephone: +55 (11) 5506-4059
Av. Gen. Valdomiro de Lima, 833 – Jabaquara
São Paulo/ SP CEP: 04344-070
Telephone: +55 (11) 5014-2000
Av. Brg. Faria Lima, 3900 – Itaim Bibi
São Paulo/ SP CEP: 04543-030
Telephone: +55(11) 3041-1500
38


![The Latest Trend of the Inkjet Printing Industry …English).pdfMulti-Client Study SUMMARY [2018 version of Inkjet Printing Market Forecast] =Detailed analysis of hardware devices,](https://img.pdfslide.us/doc/110x75/5fcfe5eb3e467001843f2beb/the-latest-trend-of-the-inkjet-printing-industry-englishpdf-multi-client-study.jpg)