Embed Size (px)
Citation preview

Grange St. Paul’s Hotel, London
18 October 2012
2012 Insurance Market Briefing -Europe

Welcome
2012 Insurance Market Briefing - Europe 18 October 2012 2
Dr Roger Sellek,Chief Executive Officer,A.M. Best EMEA & Asia-Pacific

10:35 European Outlook
11:20 Reinsurance Panel
12:05 Emerging Markets
12:45 Open Q&A
13:00
Agenda
2012 Insurance Market Briefing - Europe 18 October 2012 3
08:30 Registration
09:00 Welcome
09:10 EMEA Market Overview
09:30 Key Note Speaker
10:15

EMEA Market Overview
2012 Insurance Market Briefing - Europe 18 October 2012 4
Stefan HolzbergerManaging Director, AnalyticsA.M. Best Europe – Rating Services Ltd

2% 2%8%
14%
36%
25%
9%3% 1%
AA+ AA AA‐ A+ A A‐ BBB+ BBB BBB‐
Rating distribution as of 1 October, 2012
Western Europe
2012 Insurance Market Briefing - Europe 18 October 2012 5
• Key Market Characteristics– Economic uncertainty and
volatility– Heightened investment risk
– Sound underwriting and reserving fundamentals
– ERM advancements

Western Europe
2012 Insurance Market Briefing - Europe 18 October 2012 6
• Review– Strong technical profits– Baseline capital strength improved– Stressed capital strength currently
supports ratings• Preview
– Turbulent market conditions– Regulatory uncertainty– ERM focus
75%
15%
10%AffirmDowngradeUpgrade
14%86% Positive
NegativeStable
Rating Actions
Outlook Summary

Emerging Markets: Non-MENA
2012 Insurance Market Briefing - Europe 18 October 2012 7
• CEE Key Characteristics– Hard hit by financial crisis– Exceptions: Poland, Czech
Republic and Slovakia– Influence of Western insurers
• CIS Key Characteristics– Severe market contraction– Banking sector crisis– Consolidation– Tax optimisation schemes
0%
12%8%
19%
35%
15%8%
3% 0%
A A‐ BBB+ BBB BBB‐ BB+ BB BB‐ B+Rating distribution as of 1 October, 2012

63%
23%
14%
AffirmDowngradeUpgrade
4%
12%
84%
PositiveNegativeStable
Emerging Markets: Non-MENA
2012 Insurance Market Briefing - Europe 18 October 2012 8
• Review– Good technical profitability– Increased retention– Increased regulatory capital
requirements– Clampdown on tax avoidance
• Preview– Competition increasing– Feeling strain from financial crisis– Premium volumes recovering– Increase in foreign direct
investment
CEE
CIS
CEE
CIS
Rating Actions
Outlook Summary

Middle East & North Africa
2012 Insurance Market Briefing - Europe 18 October 2012 9
• Key Market Characteristics– Insurance market dominated
by Motor and Medical lines– Greatest threat: political
instability
– Competition heating up– ERM and regulatory
environment considered weak
0%
9%
26% 26%22%
17%
0%
A+ A A‐ BBB+ BBB BBB‐ BB+
Rating distribution as of 1 October, 2012

96%
4%
AffirmDowngradeUpgrade
Middle East & North Africa
2012 Insurance Market Briefing - Europe 18 October 2012 10
• Review– Country Risk issues– Low retention– High investment risk– Strong technical performance
• Preview– Profits squeezed– New entrants– Sound balance sheets– Takaful market growing
3%
17%
80%
PositiveNegativeStable
Rating Actions
Outlook Summary

Innovation in Insurance –Can Europe Compete?
2012 Insurance Market Briefing - Europe 18 October 2012 11
David LawGlobal Insurance LeaderPricewaterhouseCoopers LLP

Innovation in insurance –Can Europe compete?
www.pwc.co.uk/insurance
David Law, PwC Global Insurance leader
October 2012

PwC
Transformation of Mature Industries: Kodak
13
1880 1885
Kodak is founded by George Eastman
Invents roll film, the backbone of the motion picture business and portable cameras
Introduces the first model of
the lightweight and effective
Kodak handheld
camera
The company sells 90% of the photographic film and 85% of the cameras in the US market
1976 2010
Kodak resorts to patent litigation and
patent licensing to generate revenue
1888
Kodak’s Brownie low cost camera triggers the creation of a new mass market for amateur photography
1900
Kodak’s introduces Kodachrome, the first 35 mm color film
1935
Kodak invents the digital camera
1975
Kodak ranks No. 7 in US
digital camera sales
2009
Start of erosion of Kodak’s US photography film market share due
to effective foreign competitors in the market
1984
Kodak initiates
strategy of moving towards
digital technology
1990
Kodak ranks No. 1 in US
digital camera s sales
2005
Cellphones and tablets displace digital cameras as the preferred means of digital photography
Kodak’s attempts to increase its global footprint are thwarted as penetrating the world's second largest film market proves to be nearly impossible
1997 2001
Film sales worldwide significantly drop with the increasing penetration of digital photography devices
Ma
rket
Per
form
an
ceIn
nov
ati
ons
Kodak files Chapter 11 -Bankruptcy Protection
2012
Source: PwC analysis

PwC
‘The future isn’t what it used to be’
October 2012Innovation in insurance – Can Europe compete?Slide 14
The environment in which executives have spent most, if not all, of their careers is changing

PwC
Telematics: Best practice – Progressive, State Farm and Allstate
October 2012Innovation in insurance – Can Europe compete?Slide 15

PwC
Carriers are layering unstructured and sensor data over Geographic Information System data to analyze and better manage concentration risk
Basic GIS has been used for• Accurate underwriting and rating at the point of sale• Risk concentration assessment of their catastrophic
risk management activities
GIS data can be layered with• Wildfire hazard assessment, terrain slope, road
network etc.• Community investment in fire protection, location of
fire hydrants• Smart sensor data on temperature, moisture at various
locations
Build sophisticated predictive analytics• Non-catastrophic portion of expected losses at the
policy level by peril• New variables that are better indicators
of losses• Scenario modelling of concentration risks
October 2012Innovation in insurance – Can Europe compete?Slide 16
Concentration risk analyzer

PwC
Focus on underwriting
October 2012Innovation in insurance – Can Europe compete?Slide 17
Underwriting resource requirement
High
Low
Risk complexity
HighLow
Avoid using underwriting talent inefficiently
Find opportunities to automate and standardise to free up underwriting talent
If the risk complexity is high, assign underwriting resource to it
Align underwriting resources to risk complexity

PwC
SMEs are evolving their service models, and needing to interact and transact through a variety of channels…
October 2012Innovation in insurance – Can Europe compete?Slide 18
Survey of small and medium enterprises on Preferred channels for purchasing insurance
Source: Defaqto Insight, ‘The Future is Online’, April 2010Source: ‘Businesses embrace iPads, but don’t know why,’ CNET News, May 2011
There is an increasing use of tablets by businesses for core operations, information gathering and transacting …
… 49% of SMEs now using the Internet to supplement or replace agents and brokers in their search for commercial insurance
We have no plans to deploy tablets
20%We have already deployed tablets
22%
Sometime thisyear (2011)
22%Sometime
next year (2012)24%
In two years(2013)10%
More thantwo yearsfrom now
2%
Would only consider using their Agent/Broker
51% Would use the internet for research and quotes
16%
Would consider using the Internet to buy direct instead of
through an agent…

PwC
The resulting operating model is expected to support unprecedented connectivity, speed and customization
Insurers are reworking their operations to provide complete service and solutions to meet specialized customer and distributor expectations of customized solutions, speedy service and seamless information integration across all channels
October 2012Innovation in insurance – Can Europe compete?Slide 19
13
26
29
19
14
%
Likelihood of scenarios over next 10 years
1. Businesses use online channels to research insurance products, but use traditional channels for purchasing
2. Businesses use online channels for research; some small businesses use online channels for purchasing; however, mid to large companies use traditional channels for purchasing
3. Small and mid-large businesses use multiple channels to interact with insurers expecting speedy service and seamless information integration across all channels
4. Small business customers expect price transparency and customized bundled packages, speedy issuance, service and claims payment; Mid-to-large business customers seek even greater customization
5. A large proportion of commercial products get ‘standardized’ and all business groups (small, mid-market, large) can customize their coverage using agents/brokers and online tools
Source: PwC international Insurer Survey ‘Project Blue’ , 2011-12

PwC
PwC’s recent global CEO survey shows that Insurance is just behind technology, communications, and entertainment sectors in business model innovationInsurance CEOs are ‘significantly increasing’ the emphasis of business model innovation in their company’s overall innovation portfolio
October 2012Innovation in insurance – Can Europe compete?Slide 20

PwC
Businesses are evaluating new ways of thinking about geographies, products, customer segments and channels
October 2012Innovation in insurance – Can Europe compete?Slide 21
Wh
y
Social
Technology
Economy
Environment
Political
Where
What
How
Information advantage
through ‘big data’
Distribution disruption
and customer
revolutionEvolving business models‘big and
fast’
‘Two-speed’ global
growth
1
4
2 3

PwC
Strategic questions to guide your future
October 2012Innovation in insurance – Can Europe compete?Slide 22
What risks and opportunities do these trends and potential disruptors present you (or others)?
1How does what you have today position you for any potential changes?
2
Where might you need to be on a different path?
4Where might you need to stay on the same path but increase investment and speed?
3

PwC
Speaker
October 2012Innovation in insurance – Can Europe compete?Slide 23
David LawGlobal Insurance leaderPartner PwC +44 (0)7710 173 [email protected]

This publication has been prepared for general guidance on matters of interest only, and does not constitute professional advice. You should not act upon the information contained in this publication without obtaining specific professional advice. No representation or warranty (express or implied) is given as to the accuracy or completeness of the information contained in this publication, and, to the extent permitted by law, PricewaterhouseCoopers does not accept or assume any liability, responsibility or duty of care for any consequences of you or anyone else acting, or refraining to act, in reliance on the information contained in this publication or for any decision based on it.
© 2012 PricewaterhouseCoopers LLP. All rights reserved. In this document, "PwC" refers to the UK member firm, and may sometimes refer to the PwC network. Each member firm is a separate legal entity. Please see www.pwc.com/structure for further details.
121012-104530-RP-OS

Grange St. Paul’s Hotel, London
18 October 2012
2012 Insurance Market Briefing -Europe

United Kingdom Non-Life and London Market
2012 Insurance Market Briefing - Europe 18 October 2012 26
Catherine ThomasDirector, AnalyticsA.M. Best Europe – Rating Services Ltd
UK Non-Life:Current State of the Market
2012 Insurance Market Briefing - Europe 18 October 2012 27
• Profit margins under pressure, in spite of modest rate increases for most lines of business
• Flood losses in June, July and September• Reserve releases expected to make a positive, albeit lower,
contribution to earnings• Low investment returns• Weak economic conditions persist• Partially insulated from financial instability in the Eurozone

Performance of the Top 100 Companies
2012 Insurance Market Briefing - Europe 18 October 2012 28
• Underwriting performance helped by rate increases and benign weather experience in the UK
• Investment earnings down due to financial market volatility and low interest rates
2011 2010
Underwriting result* 1,132 183
Pre-tax profit* 3,144 3,847
Capital and surplus 55,024 52,050
Data: GBP millions
Source: A.M. Best Co. based on FSA returns
Underwriting Result is before transfers to/from Equalisation Provision and includes allocated investment return
Capital and Surplus includes equalisation provisions
*Underwriting result and pre-tax profit do not include data for Aviva Insurance Ltd as comparable 2011 and 2010 data are not available.

UK Motor:Results Improved Last Year
2012 Insurance Market Briefing - Europe 18 October 2012 29
• Substantial rate increases led to better accident-year earnings• Prior-year development stabilised• Upward rate momentum beginning to slow• Claims environment remains unfavourable
UK Motor – Combined Ratios 2007 2008 2009 2010 2011Accident-Year Combined Ratio 113% 115% 122% 114% 105%
Effect of Prior Years Reserve Movements -12% -9% -2% 5% 0%Calendar-Year Combined Ratio 101% 106% 120% 119% 105%
Data based on FSA returns for all firms reporting on a one-year underwriting basis.
Source: Best's Statement File – United Kingdom

40%
45%
50%
55%
60%
65%
70%
75%
80%
2007 2008 2009 2010 2011
20072008200920102011
UK Property:Performance Driven by Weather
2012 Insurance Market Briefing - Europe 18 October 2012 30
• 14 percentage point drop in the gross ultimate loss ratio• Reserve strengthening required for 2010 freeze claims
Gross Ultimate Accident-Year Loss Ratio Development (2007-2011)Source: A.M. Best Co. based on FSA returns

UK Liability:Rate Increases Subdued
2012 Insurance Market Briefing - Europe 18 October 2012 31
• Reserve strengthening required for business written in 2009 and 2010
30%
40%
50%
60%
70%
80%
90%
100%
2002 2003 2004 2005 2006 2007 2008 2009 2010 2011
2002200320042005200620072008200920102011
Gross Ultimate Accident-Year Loss Ratio Development (2002-2011)Source: A.M. Best Co. based on FSA returns

Employers’ Liability:Accident-Year Loss Ratios
2012 Insurance Market Briefing - Europe 18 October 2012 32
• Increase in trip and slip claims
40%
50%
60%
70%
80%
90%
100%
2009 2010 2011
200920102011
Gross Ultimate Accident-Year Loss Ratio Development (2009-2011)Source: A.M. Best Co. based on FSA returns

Professional Indemnity:Accident-Year Loss Ratios
2012 Insurance Market Briefing - Europe 18 October 2012 33
• Financial crisis related claims experience
40%
50%
60%
70%
80%
90%
100%
2009 2010 2011
200920102011
Gross Ultimate Accident-Year Loss Ratio Development (2009-2011)Source: A.M. Best Co. based on FSA returns

London Market:Catastrophe Losses
2012 Insurance Market Briefing - Europe 18 October 2012 34
London Market Company* Results
Company Currency(millions)
Pre-tax profit 2011
Year end 2011 SHF
Year end 2010 SHF
Net catastrophe losses
2011 cats as a % of 2010 SHF
Aspen Insurance Holdings Ltd USD -143 3,172 3,242 534 16%
Beazley plc USD 63 1,071 1,083 215 20%
Catlin Group Ltd USD 71 3,298 3,448 678 20%
Hiscox Ltd GBP 17 1,256 1,266 270 21%
Amlin plc GBP -194 1,420 1,728 501 29%
Hardy GBP -42 108 153 73 48%
Novae Group plc GBP -6 266 294 70 24%
Omega Insurance Holdings Ltd USD -95 333 422 86 20%
*Listed companies which write a significant portion of their business in the London marketSource: 2011 company report and accounts
Post Event Analysis
2012 Insurance Market Briefing - Europe 18 October 2012 35
• Loss estimate vs risk appetite
• Peer group comparison
• Extent of capital erosion
• Catastrophe risk and aggregate management
• Financial flexibility

London Market 2012
2012 Insurance Market Briefing - Europe 18 October 2012 36
• Material rate increases being achieved for loss affected business• Market conditions for non-catastrophe exposed classes remain
competitive • Capacity has not contracted substantially, in spite of 2011 loss
experience• Stagnant economic growth is curbing demand• Continued favourable reserve development

Lloyd’s Casualty Business
2012 Insurance Market Briefing - Europe 18 October 2012 37
2011 2010 2009 2008 2007 2006
Accident-year combined ratio 98.4% 101.1% 99.1% 103.9% 101.8% 96.3%
Prior year reserve movement -1.8% -4.5% -8.3% -8.8% -9.1% -7.3%
Calendar-year combined ratio 96.6% 96.6% 90.8% 95.1% 92.7% 89.0%
Source: Lloyd's annual reports

M&A Involving Lloyd’s Vehicles(2011-2012)
2012 Insurance Market Briefing - Europe 18 October 2012 38
Acquired Acquirer Deal Value
Hardy Underwriting Bermuda Ltd CNA Financial Corp GBP 143.0 million
Omega Insurance Holdings Ltd Canopius Group Ltd GBP 163.6 million
Flagstone Reinsurance Holdings ANV Holdings BV GBP 31.0 million
Whittington Insurance Markets Ltd Tawa plc, Icat Managers/Paraline Group, Skuld Group Not Disclosed
TSM Agencies Ltd ProSight Specialty Insurance Not Disclosed
Jubilee Group Holdings Ltd Ryan Specialty Group, LLC GBP 35.0 million
Chaucer Holdings plc 440 Tessera Ltd/The Hanover Insurance Group Inc GBP 313.0 million
Brit Insurance Holdings NV Achilles Netherlands Holdings BV GBP 888.0 million

European Non-Life Market Outlook
2012 Insurance Market Briefing - Europe 18 October 2012 39
Sam DobbynAssociate Director, AnalyticsA.M. Best Europe – Rating Services Ltd

Eurozone Financial Crisis
2012 Insurance Market Briefing - Europe 18 October 2012 40

Economy in Recession
2012 Insurance Market Briefing - Europe 18 October 2012 41
6
7
8
9
10
11
12
-6
-4
-2
0
2
4
6
2007 2008 2009 2010 2011 2012
GD
P G
row
th R
ate
(%)
Eurozone GDP Growth and Unemployment Rate
Une
mpl
oym
ent R
ate
(%)
Source: OECD
Fear of a Greek Exit
2012 Insurance Market Briefing - Europe 18 October 2012 42
020406080100120140160180
0
5
10
15
20
25
30
35
2009 2010 2011 2012
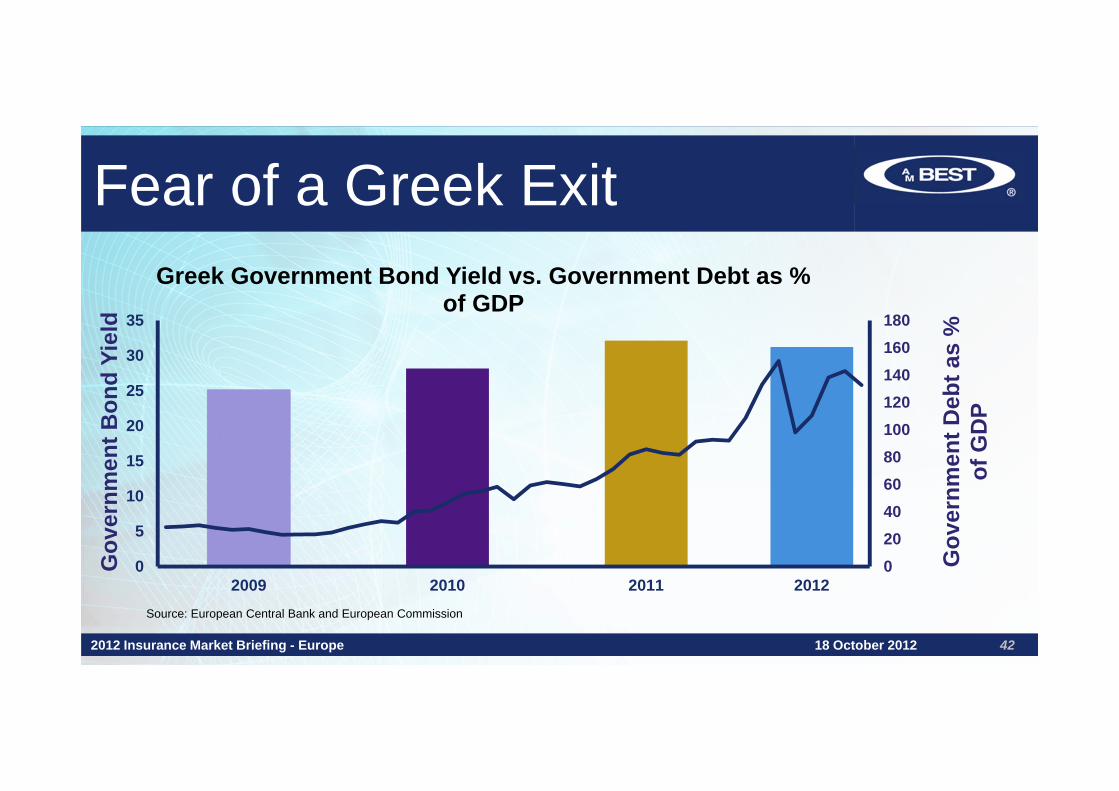
Greek Government Bond Yield vs. Government Debt as % of GDP
Source: European Central Bank and European Commission
Gov
ernm
ent B
ond
Yiel
d
Gov
ernm
ent D
ebt a
s %
of
GD
P

Italy and Spain: Yields
2012 Insurance Market Briefing - Europe 18 October 2012 43
3
4
5
6
7
8
2008 2009 2010 2011 2012
%
Government Bond Yields
Spain
Source: European Central Bank
Italy

ECB’s Policy Response
2012 Insurance Market Briefing - Europe 18 October 2012 44
ECB Target Policy Rate
Source: European Central Bank

Timeline Recap:Now What?
2012 Insurance Market Briefing - Europe 18 October 2012 45
Portugal receives a
€78bn bailout
25 EU members sign new fiscal
pact
20142013
Greece & Ireland receive EU-IMF loans (€110bn and
€85bn)
Oct. 26: EU
officials unveil plan
Nov.2010
Feb. 2011
Oct. 2011
Dec. 2011
ECB gives banks
3 years of unlimited funds
June 2011
Greece gets 3rd loan
Greece passes austerity
measures in return for
bailout and write- down
debt
Jan.2012
March2012
June2012
Spanish banks receive bailout
EU Summit concluded with
several agreements
Greek Yields: 11.7%
Italian Yields: 4.7%
Spanish Yields: 5.4%
Greek Yields: 21.1%
Italian Yields: 6.8%
Spanish Yields: 5.5%
Greek Yields: 25.8%
Italian Yields: 6.0%
Spanish Yields: 6.8%
What is the future of the Euro?
‘Draghi Plan’ ECB OMT
Sep2012
Will any members leave the
Eurozone?
Economic Pressures
2012 Insurance Market Briefing - Europe 18 October 2012 46
• Recessionary effects
– Less economic activity = lower claims
– This has maintained market profitability despite increase in recession related claims
– Lower demand remains a problem
• Investment effects
– Emphasis on technical profitability
– Search for yield in ‘safe-haven’ countries
Pressure on Ratings
2012 Insurance Market Briefing - Europe 18 October 2012 47
Economic Concerns
– EU Policy hurdles
– Recessionary conditions
– High unemployment
– Backlash to austerity
– Banks recapitalising
– Pressure on top line / performance
Investment risk
– Sovereign debt
– Pressure on FI
– Financial flexibility
– Cost of capital
– Guarantees
– Contagion
0%
50%
100%
150%
200%
250%
Peripheral Sov / C&S Eurozone FI / C&S Debt (2 yrs) / C&S BCAR BCAR(stressed)
Top Tier Bottom Tier
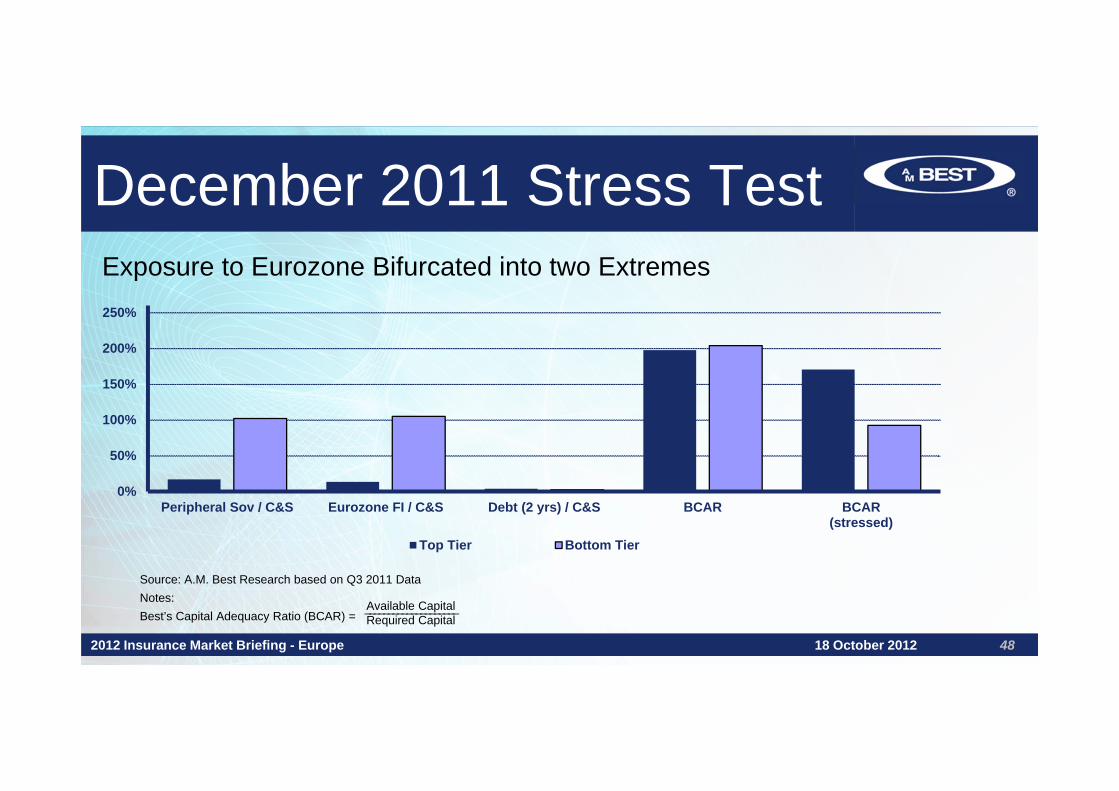
December 2011 Stress Test
2012 Insurance Market Briefing - Europe 18 October 2012 48
Exposure to Eurozone Bifurcated into two Extremes
Source: A.M. Best Research based on Q3 2011 DataNotes:Best’s Capital Adequacy Ratio (BCAR) =
Available Capital––––––––––––––––––––Required Capital

June 2012 Stress Test
2012 Insurance Market Briefing - Europe 18 October 2012 49
0%
50%
100%
150%
200%
250%
Peripheral Sov / C&S Eurozone FI / C&S Debt (2 yrs) / C&S BCAR BCAR(stressed)
Top Tier Bottom Tier
Companies are Managing Down Eurozone Exposure
Source: A.M. Best Research based on Q3 2011 DataNotes:Best’s Capital Adequacy Ratio (BCAR) =
Available Capital––––––––––––––––––––Required Capital
Primary vs Reinsurer
2012 Insurance Market Briefing - Europe 18 October 2012 50
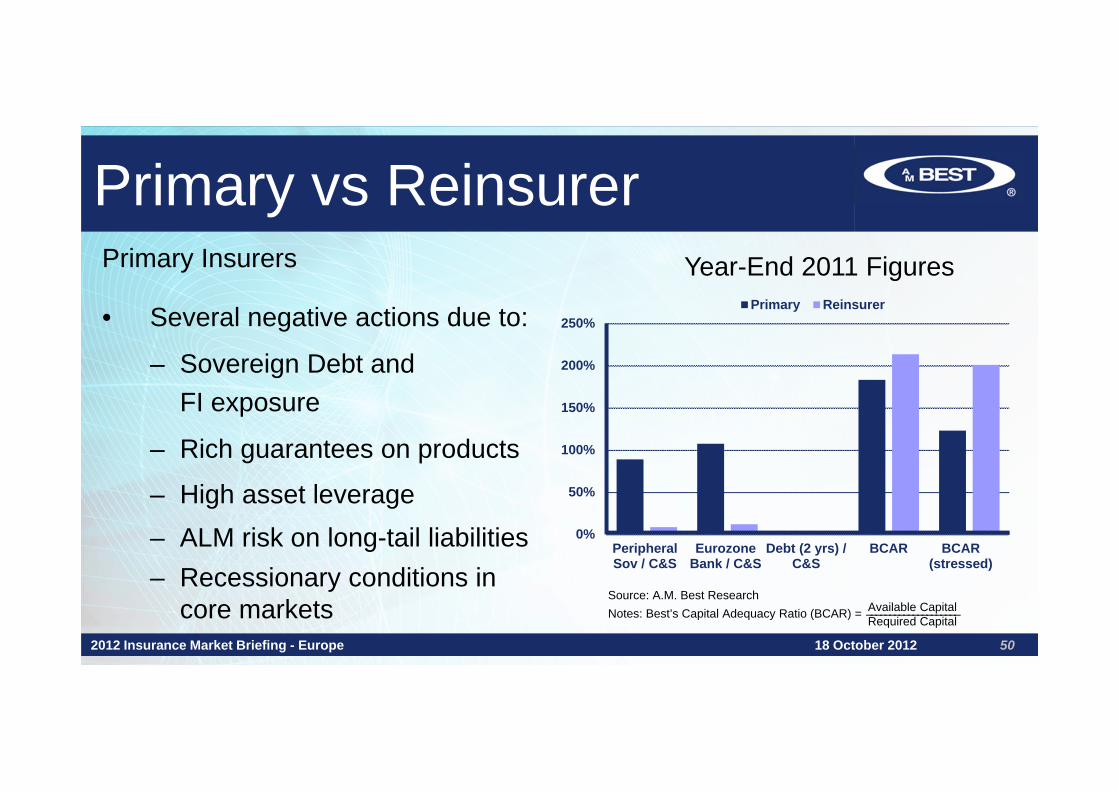
Primary Insurers
• Several negative actions due to:
– Sovereign Debt and FI exposure
– Rich guarantees on products
– High asset leverage– ALM risk on long-tail liabilities– Recessionary conditions in
core markets
Year-End 2011 Figures
0%
50%
100%
150%
200%
250%
PeripheralSov / C&S
EurozoneBank / C&S
Debt (2 yrs) /C&S
BCAR BCAR(stressed)
Primary Reinsurer
Source: A.M. Best ResearchNotes: Best’s Capital Adequacy Ratio (BCAR) = Available Capital––––––––––––––––––––Required Capital
Primary vs Reinsurer
2012 Insurance Market Briefing - Europe 18 October 2012 51
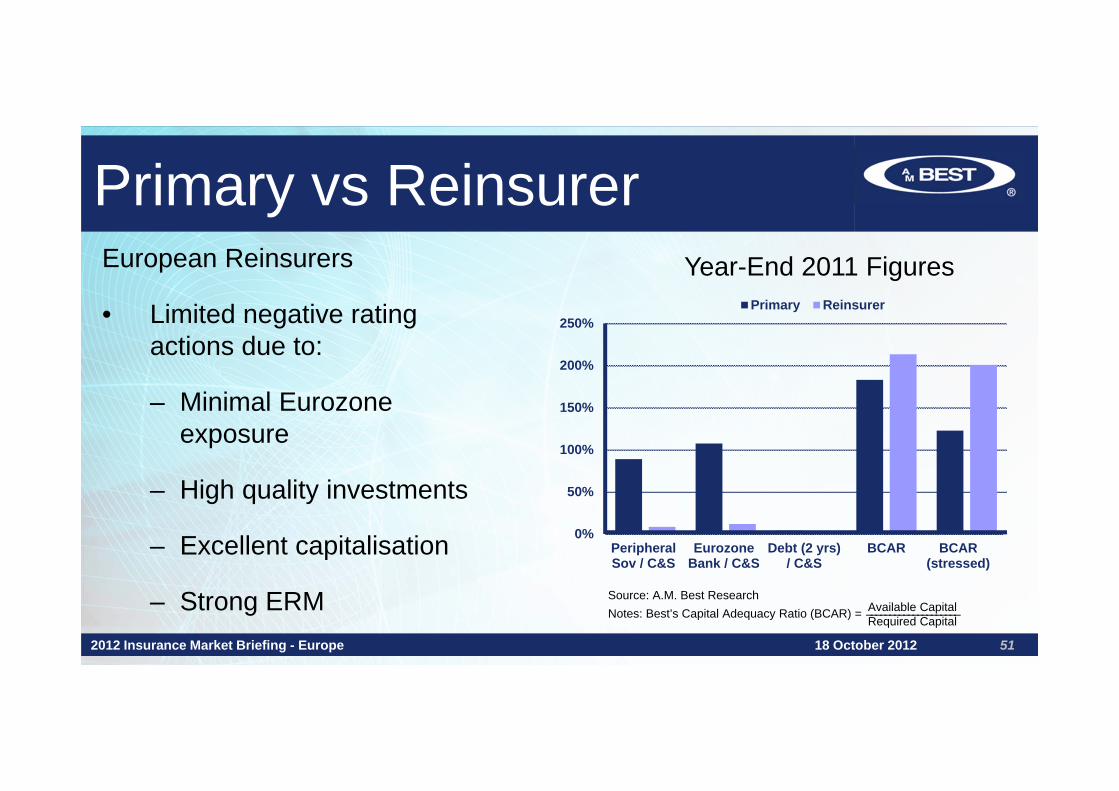
European Reinsurers
• Limited negative rating actions due to:
– Minimal Eurozone exposure
– High quality investments
– Excellent capitalisation
– Strong ERM
Year-End 2011 Figures
0%
50%
100%
150%
200%
250%
PeripheralSov / C&S
EurozoneBank / C&S
Debt (2 yrs)/ C&S
BCAR BCAR(stressed)
Primary Reinsurer
Source: A.M. Best ResearchNotes: Best’s Capital Adequacy Ratio (BCAR) = Available Capital––––––––––––––––––––Required Capital
Company Actions
2012 Insurance Market Briefing - Europe 18 October 2012 52
• Hedging Activity
• Adverse scenario planning
• De-risking investment portfolio
• Maintaining strong cash position
• Focusing on price adequacy / risk selection

Outlook
2012 Insurance Market Briefing - Europe 18 October 2012 53
• Increase in negative rating actions over the past twelve months
• Increase in assignment of negative rating outlooks
• On-going discussions with management
• Consideration for ERM, earnings strength and competitive market position
• Monitor investment portfolios
• Legislative developments critical to solving crisis

European Life Insurance Market Outlook
2012 Insurance Market Briefing - Europe 18 October 2012 54
Carlos Wong-FupuySenior Director, AnalyticsA.M. Best Europe – Rating Services Ltd
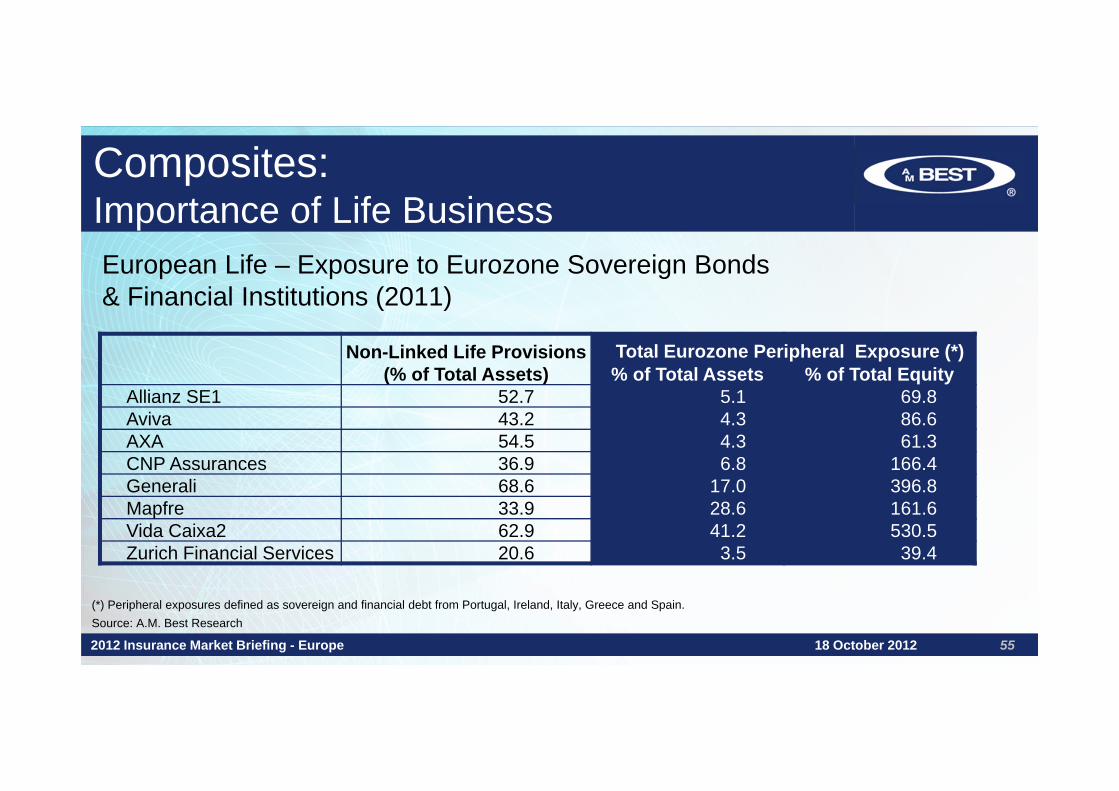
Non-Linked Life Provisions (% of Total Assets) % of Total Assets % of Total Equity
Allianz SE1 52.7 5.1 69.8Aviva 43.2 4.3 86.6AXA 54.5 4.3 61.3CNP Assurances 36.9 6.8 166.4Generali 68.6 17.0 396.8Mapfre 33.9 28.6 161.6Vida Caixa2 62.9 41.2 530.5Zurich Financial Services 20.6 3.5 39.4
Composites:Importance of Life Business
2012 Insurance Market Briefing - Europe 18 October 2012 55
European Life – Exposure to Eurozone Sovereign Bonds & Financial Institutions (2011)
Total Eurozone Peripheral Exposure (*)
(*) Peripheral exposures defined as sovereign and financial debt from Portugal, Ireland, Italy, Greece and Spain.Source: A.M. Best Research

Composites:Importance of Life Business
2012 Insurance Market Briefing - Europe 18 October 2012 56
Savings participatory Business – Historically Two Models
asset ‐ equity driven
asset ‐ fixed income driven
policy values
0 t
€/£

Composites:Importance of Life Business
2012 Insurance Market Briefing - Europe 18 October 2012 57
• Equity Driven Model – Stock market crisis late 1990s
- Deliberate asset liability mis-matching pursuing higher expected returns. Sizeable surpluses
- Asset shares < Policy values
- Options and guarantees reduced
- Investment portfolios de-risked
- Model virtually abandoned and closed to new business

Composites:Importance of Life Business
2012 Insurance Market Briefing - Europe 18 October 2012 58
• Fixed Income Driven Model – much less affected
– Tighter ALM. Less room for surpluses
– OK for as long as moderate yields could be achieved
– Sovereign credit risk has not been an issue

Composites:Importance of Life Business
2012 Insurance Market Briefing - Europe 18 October 2012 59
German Life – Guaranteed Rates & Net Investment Returns (2006-2012)
0%
1%
2%
3%
4%
5%
6%
2006 2007 2008 2009 2010 2011 2012
Minimum guaranteed rates
Current return onpolicyholder's creditbalance
Average guaranteedreturn across all lifecontracts
Net return on investments
Source: GDV and Deutsche Bundesbank eurosystem

Composites:Significance of Life Business
2012 Insurance Market Briefing - Europe 18 October 2012 60
French Life – Return on Investment (2011) (Gross of tax)
-20 -15 -10 -5 0 5 10
Traditional Life Insurance
Unit-Linked Life Insurance
Livret A (savings account)
PEL (home savings plan)
Equities
Real Estate
Source: FFSA

Composites:Significance of Life Business
2012 Insurance Market Briefing - Europe 18 October 2012 61
• Today’s challenges:
– Low interest rate environments
– Consumer appetite for “old style” with-profits
– Domestic investments “match” consumers’ investment profile
– Life insurers’ role as institutional investors
– Regulatory approach to sovereign credit risk

Composites:Importance of Life Business
2012 Insurance Market Briefing - Europe 18 October 2012 62
Available options:• Reduce guarantees? Close to new business? • Move to unit-linked?• Accept “some” level of credit risk?
– Even if assuming a zero default risk:• Need to manage cash flow generation very carefully• In particular given the increase in surrenders and lapses• And declines in new business

Composites:Importance of Life Business
2012 Insurance Market Briefing - Europe 18 October 2012 63
Italy: Life market compositionJuly2012
July2011
Amount(EUR millions) %
Amount(EUR millions) % Variance
Traditional Products 22,598 76.2% 28,205 81.3% -19.9%
Linked Products 7,017 23.7% 6,456 18.6% 8.7%
Others 48 0.2% 48 0.1% -0.6%
Total 29,663 34,709 -14.5%Source: ANIA fact-pack mercato vita, September 2012

Composites:Importance of Life Business
2012 Insurance Market Briefing - Europe 18 October 2012 64
France: Performance of life sector
2011 2010 2009 2008 2007
Life premiums 124 147.8 140.7 138.4 152
Claims paid 117 94 87.1 106.8 82.6 Increase/decrease in math reserves -13.5 53.4 65.3 -28.4 77.6
Technical result 1.5 4.2 4 2.5 5
Overall result 2.8 4.2 3.9 4.1 5.1
EUR billionsSource: FFSA

Composites:Importance of Life Business
2012 Insurance Market Briefing - Europe 18 October 2012 65
Conclusions:• Any change in new business strategy is likely to take time• Assets risks to remain in the balance sheet for a while• Eurozone stress BCAR recognises:
- Any surpluses in savings participatory funds- The ability of PH liabilities partially to absorb investment losses
• But this ability is not unlimited, due to contractual and business reasons

Reinsurance Panel
2012 Insurance Market Briefing - Europe 18 October 2012 66
Chair:Nick Charteris-Black, Managing Director, Market Development - EMEAA.M. Best EuropeDavid Flandro, Managing Director, Head of Global Business, Guy Carpenter & Co LtdJohn Andre, Group Vice President, A.M. Best CompanySam Dobbyn, Associate Director, Analytics, A.M. Best Europe

Current Position
2012 Insurance Market Briefing - Europe 18 October 2012 67
• Capitalisation strong on both an absolute and risk-adjusted basis• Both base line and stressed capital ratios trending favourably• Capital stress tested for catastrophe losses and negative economic
scenarios– Catastrophe stress test includes two PMLs– Multiple economic stress tests contemplating write down of assets– Diminished level of reserve adequacy consequence
of soft casualty market• Companies performed well through live stress tests• Financial flexibility constrained by current stock valuations, however
capital markets remained accessible

Current Position
2012 Insurance Market Briefing - Europe 18 October 2012 68
• Rating actions reflect the financial resilience of the market• Mostly affirmations, average rating for the sector is ICR “a+” FSR ”A”• Multiple loss events in 2011 detracted from earnings but within loss
tolerances• Impact from underwriting losses were tempered by investment income
and capital gains on investments• Companies took advantage of the low interest rate environment to
refinance existing debt and extend duration • Favourable trends have continued through six months 2012 with global
capital up about 7%

Global Reinsurance Rating Outlook
2012 Insurance Market Briefing - Europe 18 October 2012 69
• Outlook remains stable
• Loss events, though large, equated to earnings events
• Capital cushion only slightly eroded, balance sheets remain sound
• Asset risk conservatively managed
• Market remains disciplined from an underwriting perspective
• Pricing momentum has turned positive (for now)
• Enterprise risk management tested and functioning well

Global Reinsurance Rating Outlook
2012 Insurance Market Briefing - Europe 18 October 2012 70
• Concerns:
– Possibility for short-lived pricing improvements– Investment situation puts more emphasis on underwriting
margins– Regulatory uncertainty– Financial flexibility
Developments in Central and Eastern Europe
2012 Insurance Market Briefing - Europe 18 October 2012 71
Carlos Wong-FupuySenior Director, AnalyticsA.M. Best Europe – Rating Services Ltd
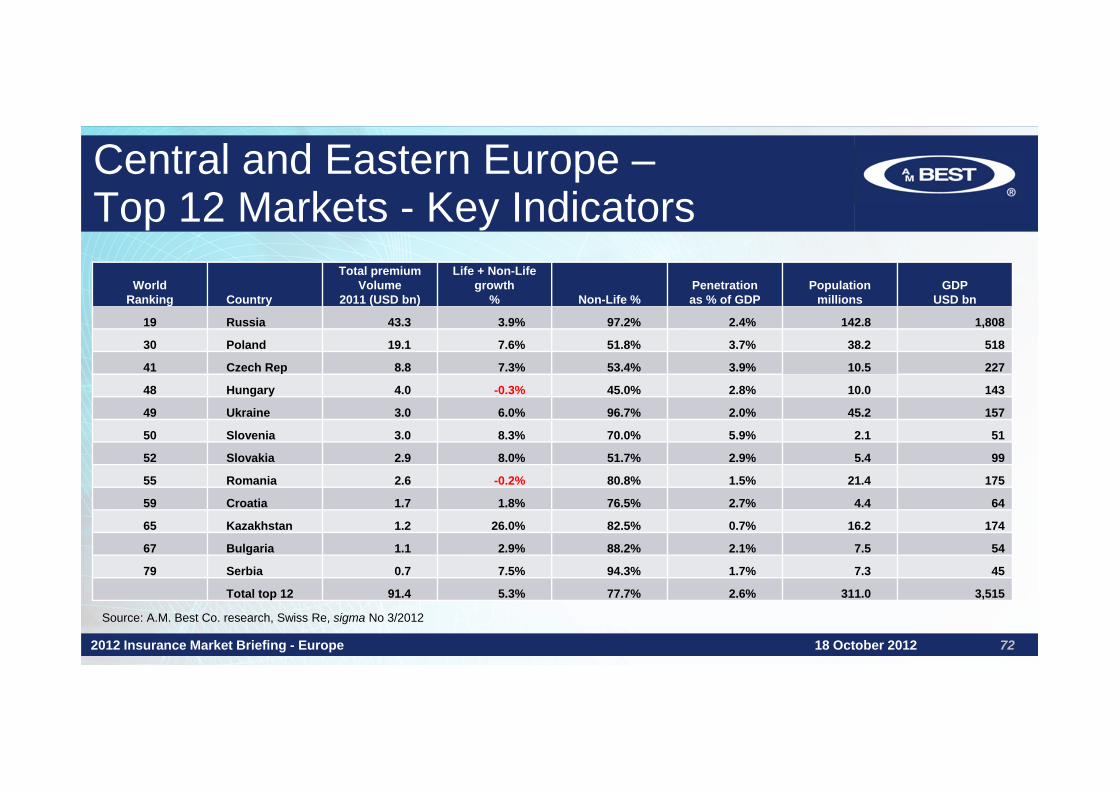
Central and Eastern Europe –Top 12 Markets - Key Indicators
2012 Insurance Market Briefing - Europe 18 October 2012 72
WorldRanking Country
Total premium Volume
2011 (USD bn)
Life + Non-Lifegrowth
% Non-Life %Penetrationas % of GDP
Populationmillions
GDPUSD bn
19 Russia 43.3 3.9% 97.2% 2.4% 142.8 1,808
30 Poland 19.1 7.6% 51.8% 3.7% 38.2 518
41 Czech Rep 8.8 7.3% 53.4% 3.9% 10.5 227
48 Hungary 4.0 -0.3% 45.0% 2.8% 10.0 143
49 Ukraine 3.0 6.0% 96.7% 2.0% 45.2 157
50 Slovenia 3.0 8.3% 70.0% 5.9% 2.1 51
52 Slovakia 2.9 8.0% 51.7% 2.9% 5.4 99
55 Romania 2.6 -0.2% 80.8% 1.5% 21.4 175
59 Croatia 1.7 1.8% 76.5% 2.7% 4.4 64
65 Kazakhstan 1.2 26.0% 82.5% 0.7% 16.2 174
67 Bulgaria 1.1 2.9% 88.2% 2.1% 7.5 54
79 Serbia 0.7 7.5% 94.3% 1.7% 7.3 45
Total top 12 91.4 5.3% 77.7% 2.6% 311.0 3,515
Source: A.M. Best Co. research, Swiss Re, sigma No 3/2012

Central and Eastern Europe –Top 12 Markets - Key Indicators
2012 Insurance Market Briefing - Europe 18 October 2012 73
Total CEE – Top 12 Comparable to
Population > 300 million United States
GDP > USD 3,500 billion Germany /Brazil + Mexico combined
Total premiums > USD 90 billion Australia
Penetration (% of GDP) 2.6% Latin AmericaMoroccoBahrain

EU Countries + Croatia and Serbia
2012 Insurance Market Briefing - Europe 18 October 2012 74
Impact from Financial Crisis
Country € Comments ImpactPoland N Importance of domestic market Moderate
Czech Republic N EU exports / Germany, Italy Moderate
Hungary N High foreign debt / devaluation / low FDI Severe
Slovenia Y High indebtedness / banking crisis Severe
Slovakia Y EU exports / Germany Moderate
Romania N Slight recovery / Weak fundamentals Severe
Croatia N Early stages of privatisation and FDI Severe
Bulgaria Peg High FDI / Weak institutions Severe
Serbia N Dependent on EU exports / Weak institutions Severe

0% 10% 20% 30% 40% 50% 60% 70% 80%
Poland
Czech Republic
Hungary
Slovenia
Slovakia
Romania
Croatia
Bulgaria
Serbia
EU Average
EU Countries + Croatia and Serbia
2012 Insurance Market Briefing - Europe 18 October 2012 75
Motor business as a % of non-life premiums
EU Countries + Croatia and Serbia
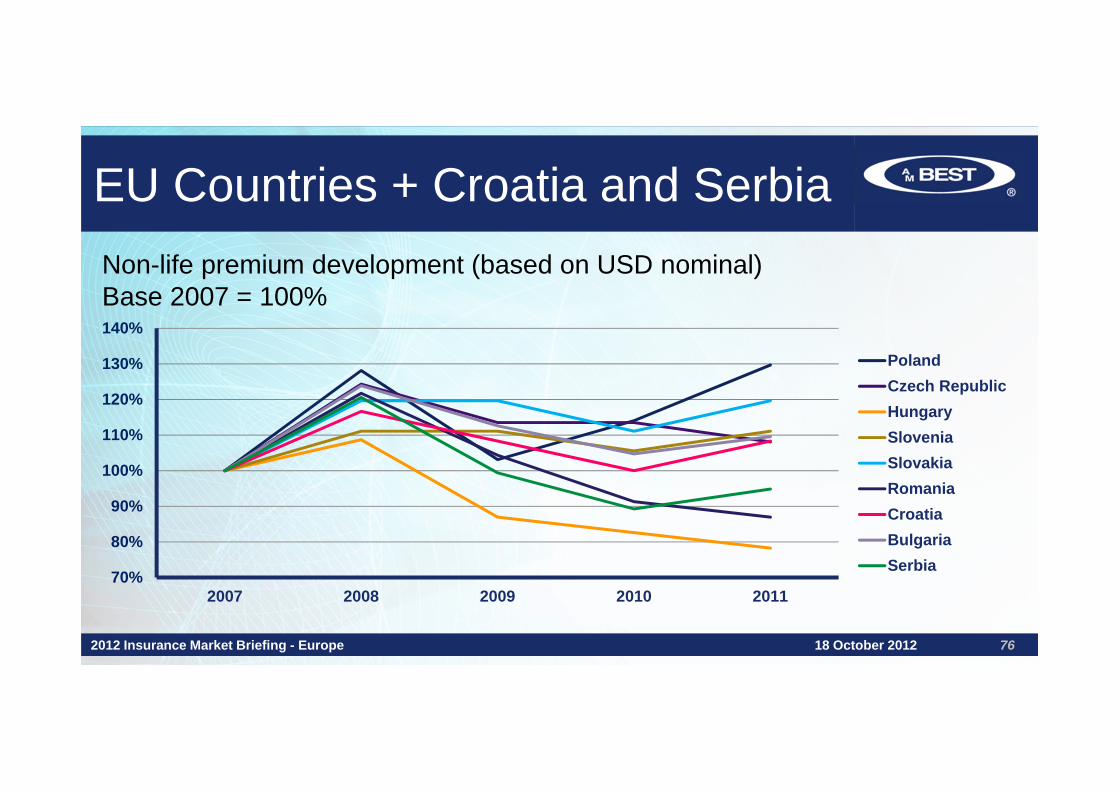
2012 Insurance Market Briefing - Europe 18 October 2012 76
Non-life premium development (based on USD nominal)Base 2007 = 100%
70%
80%
90%
100%
110%
120%
130%
140%
2007 2008 2009 2010 2011
PolandCzech RepublicHungarySloveniaSlovakiaRomaniaCroatiaBulgariaSerbia

EU Countries + Croatia and Serbia
2012 Insurance Market Briefing - Europe 18 October 2012 77
• Severe losses due to floods in the region in 2010• Hardening pricing environment since then• In general, profitable technical accounts despite strong competition in
particular in MTPL• Romania loss making after EU accession and market liberalisation• Croatia – profits driven by MTPL / pre-liberalisation / still rigid market
dominated by national insurer / shrinking market• Most markets slightly contracting in real terms

EU Countries + Croatia and Serbia
2012 Insurance Market Briefing - Europe 18 October 2012 78
Foreign Participants• Main foreign players –
– VIG, Allianz, Generali, Ergo, Uniqa– Also KBC, Groupama– Recently Talanx/HDI: Poland’s Warta
• Retentions increased • International programmes – from proportional to XL

EU Countries + Croatia and Serbia
2012 Insurance Market Briefing - Europe 18 October 2012 79
State Participation• Poland: PZU• Slovenia: Triglav and Sava Re• Croatia: Croatia Osiguranje• Romania and Serbia: Disaster pools• Credit Insurance• Regional expansion plans

Central and Eastern Europe –Russia, Ukraine and Kazakhstan
2012 Insurance Market Briefing - Europe 18 October 2012 80
• Commodity driven economies• Relatively low level of foreign participation• Ukraine and Kazakhstan – source of reinsurance business
into Russia• Market trends towards consolidation• Tax avoidance schemes remain an issue• Extremely low loss ratios – debatable insurance content?• Poor quality of asset portfolios• Low capitalisation in an overcrowded market

Central and Eastern Europe –Russia, Ukraine and Kazakhstan
2012 Insurance Market Briefing - Europe 18 October 2012 81
Non-life premium development (based on USD nominal)Base 2007 = 100%
60%
70%
80%
90%
100%
110%
120%
130%
140%
2007 2008 2009 2010 2011
RussiaUkraineKazakhstan

Central and Eastern Europe –Russia
2012 Insurance Market Briefing - Europe 18 October 2012 82
Foreign Participation• 25% foreign shareholding cap – to 50% following WTO accession• Generali (Ingosstrakh), Allianz (Rosno), AXA (Reso Garantia)• Interest from International Development Banks

Central and Eastern Europe –Russia, Ukraine and Kazakhstan
2012 Insurance Market Briefing - Europe 18 October 2012 83
• Mainly local ownership• Strong links with industrial groups• Banking ownership – KZ• No direct state participation except for credit insurance
and State Annuity company in Kazakhstan

Central and Eastern Europe –Russia, Ukraine and Kazakhstan
2012 Insurance Market Briefing - Europe 18 October 2012 84
Market trends towards consolidationCountry GWP
USD bnNumber of companies
Average GWPUSD mn
Top 5 companies
Russia 43.3 600 72.0 40%
Ukraine 3.0 450 6.7 30%
Kazakhstan 1.2 38 31.6 45%

Conclusions
2012 Insurance Market Briefing - Europe 18 October 2012 85
CEE – EU countries, Croatia and Serbia
• Almost all countries, except for Poland, Czech Republic and Slovakia severely impacted by the financial crisis
• Foreign investor presence important
• Retentions relatively high • Market motor driven• State control still material in some economies• Consolidation opportunities

Conclusions
2012 Insurance Market Briefing - Europe 18 October 2012 86
CEE – Russia, Ukraine, Kazakhstan
• Some recovery after severe crisis in 2008-09
• Poor quality of investment portfolios
• Low capitalisation: Russia and Ukraine
• Dominated by local companies
• Strong links to industrials and banks
• “Financial schemes” remain an issue
• Consolidation opportunities

Middle East, North Africa and Takaful
2012 Insurance Market Briefing - Europe 18 October 2012 87
Mahesh MistryAssociate Director, AnalyticsA.M. Best Europe – Rating Services Ltd

Middle East & North Africa Overview
2012 Insurance Market Briefing - Europe 18 October 2012 88
• Despite challenging market conditions, the Middle East & North Africa insurance markets continue to grow
• The slowdown is attributed to depressed financial markets, regional political instability and delay in the implementation of compulsory lines
Gross Premiums Written for Middle East & North Africa
0%
10%
20%
30%
40%
0
5
10
15
20
25
2005 2006 2007 2008 2009 2010 2011 2012e
Gro
wth
(% C
hang
e)
(USD
bill
ions
)
Source: A.M. Best research (excludes Israel and Iran)

0.0
1.0
2.0
3.0
4.0
5.0
6.0
7.0
UAE SaudiArabia
Morocco Egypt Lebanon Algeria Qatar Tunisia Kuwait Oman Jordan Bahrain
USD
(bill
ions
) Non-Life Life
Source: A.M. Best research – Life and Non‐Life Premium Volumes (2011)
Middle East & North Africa Overview
2012 Insurance Market Briefing - Europe 18 October 2012 89
• Dominated by the UAE and the Saudi Arabia, with non-life being the key component in the region

Middle East & North Africa Overview
2012 Insurance Market Briefing - Europe 18 October 2012 90
• Young markets with significant potential
+ Small market size, with low penetration rates
+ Oil prices above budgets will foster growth in the region
+ Expansion of compulsory lines
+ Changing demographics in the region- Political instability creates
challenging environment
• Competition
+ Top players consolidating their position
+ Slowdown in new entrants- Fragmented markets- Companies chasing top line growth
+/- Regional expansion by top players+/- Consolidation / M&A

Middle East & North Africa:Political Instability
2012 Insurance Market Briefing - Europe 18 October 2012 91
• Slowdown in growth in affected markets
• Rated companies have shown resilience, despite difficult trading conditions
• Tightening of policy wordings
• Review of risk management and business continuity plans
• The longer the disruption, the greater the impact on their country risk and company ratings
• Operating environment is more challenging
Country Country Risk Tier
Political Risk Assessment
Algeria CRT-5 Low
Bahrain CRT-3 Moderate
Egypt CRT-5 High
Jordan CRT-4 Low
Libya CRT-5 High
Morocco CRT-4 Low
Syria CRT-5 High
Tunisia CRT-5 High
Source: AM Best, September 2012
CRT-1 (low risk) to CRT-5 (high risk)

Middle East & North Africa:Technical Performance
2012 Insurance Market Briefing - Europe 18 October 2012 92
• Strong, albeit declining technical profitability
• New entrants and fierce competition adds pressure on performance
• Low retention on commercial lines highlights dependence on inward reinsurance commission
• Top companies maintain strong underwriting performance
• Smaller players’ profitability under strain
A.M. Best Rated Primary Insurers Technical Performance (2006-2011)
0%10%20%30%40%50%60%70%80%90%100%
201120102009200820072006
Combined ratio Loss ratioExpense ratio Acquisition cost ratio

Middle East & North Africa:Investment Profile
2012 Insurance Market Briefing - Europe 18 October 2012 93
• Weak investment profiles / aggressive strategies
• High asset concentration in equities and real estate
• High concentration in financial institutions, restricted to few assets
• Profitability impacted by volatile investment performance
• Gradual de-risking of investment profile
• Investment strategy largely dictated by board
A.M. Best Rated Primary Insurers Investment Split
12%10%11%9%9%10%
21%24%22%28%41%36%
16%15%15%12%
8%8%
12%12%11%10%
10%13%
38%39%41%40%32%33%
0%
25%
50%
75%
100%
201120102009200820072006Others Shares Real estate Bonds Cash

Middle East & North Africa:Strong Capital but Weak ERM
2012 Insurance Market Briefing - Europe 18 October 2012 94
• Balance Sheet Strength+ Strong risk-adjusted capitalisation+ Absorb aggressive investment policy+ No leverage+ Low CAT exposure– Surplus capital used for aggressive
investment policy– Limited capital modelling capabilities– High dividend payout ratios– High counter-party credit risk
• ERM+ Some companies have made
significant improvements+ Deployment of resources and skills
should improve controls and risk mitigation
– Generally low ERM awareness– Dependence on consultants– Models are in use, however, with
limited understanding

Middle East & North Africa: Takaful
2012 Insurance Market Briefing - Europe 18 October 2012 95
• Global Takaful contributions reached USD 8.3 billion in 2010, up 19% from 2009
• The five-year compound annual growth rate between 2005-2009 was 29%
207 285 375 453 610 694544 695 901 11091479
1951
174239
558842
991
1313
1065
1850
2289
2911
3896
4370
0
1000
2000
3000
4000
5000
6000
7000
8000
9000
2005 2006 2007 2008 2009 2010e
SaudiCooperative
GCC (exclKSA)
S.E. Asia
Other
Source: Ernst & Young World Takaful Report 2012

Basic Takaful Model
2012 Insurance Market Briefing - Europe 18 October 2012 96

Takaful
2012 Insurance Market Briefing - Europe 18 October 2012 97
• Competition– Compete in the same space as
conventional insurers– Conventional companies expanding
offering through Takaful windows or subsidiaries
• Weak capital strength of policyholders’ fund– Difficulty in generating surpluses in the
policyholders’ fund• Poor underwriting results• High management charges and
fees
– Dependence on Qard’ Hasan– Gradual improvement in surplus
generation• Regulation
– Lack of transparency on regulation implies unclear protection to policyholders
– Conflict between regulators and Sharia board
– Stronger regulation expected as countries adopt specific Takaful regulation
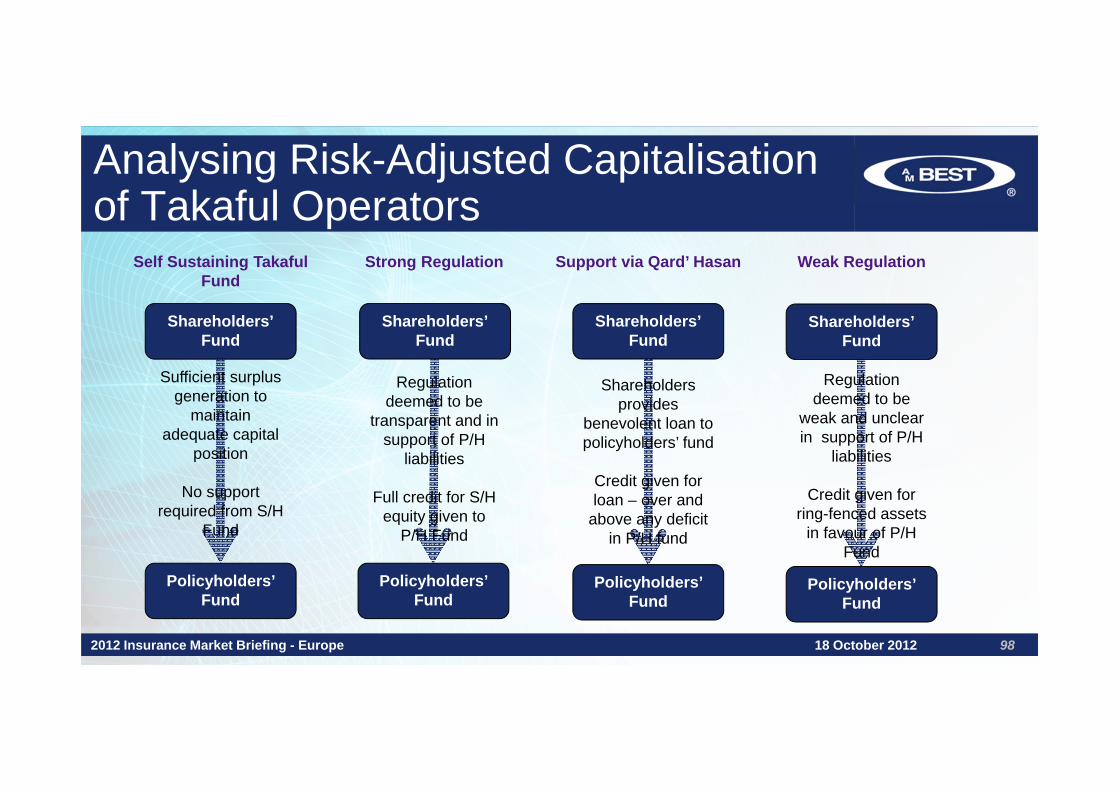
Analysing Risk-Adjusted Capitalisation of Takaful Operators
2012 Insurance Market Briefing - Europe 18 October 2012 98
Self Sustaining Takaful Fund
Shareholders’Fund
Policyholders’ Fund
Sufficient surplus generation to
maintain adequate capital
position
No support required from S/H
Fund
Shareholders’Fund
Policyholders’ Fund
Regulation deemed to be
transparent and in support of P/H
liabilities
Full credit for S/H equity given to
P/H Fund
Strong Regulation
Shareholders’Fund
Policyholders’ Fund
Support via Qard’ Hasan
Shareholders provides
benevolent loan to policyholders’ fund
Credit given for loan – over and
above any deficit in P/H fund
Shareholders’Fund
Policyholders’ Fund
Weak Regulation
Regulation deemed to be
weak and unclear in support of P/H
liabilities
Credit given for ring-fenced assets
in favour of P/H Fund

Middle East & North Africa:Conclusion
2012 Insurance Market Briefing - Europe 18 October 2012 99
• Market Potential– Growth by energy prices and expansion of compulsory medical – Changing dynamics of underlying population
• Political instability– Create volatility and reduce growth prospects– Longer disruptions may impact ratings
• Competition– Expected to be fierce with top companies strengthening their
positions, with consolidation expected in the medium term

Middle East & North Africa:Conclusion
2012 Insurance Market Briefing - Europe 18 October 2012 100
• ERM– Current climate highlights weaknesses (capital and investment
management, regional instability)– Rebalancing of portfolios; focus on underwriting over investments
activity• Regulation
– Must keep pace as companies and markets continue to develop– Start regulating and increasing insurance awareness

Q & A
2012 Insurance Market Briefing - Europe 18 October 2012 101
Nick Charteris-Black, Managing Director, Market Development - EMEAA.M. Best Europe

2012 Insurance Market Briefing - Europe 18 October 2012 102
© AM Best Company (AMB) and/or its licensors and affiliates. All rights reserved. ALL INFORMATION CONTAINED HEREIN IS PROTECTED BY COPYRIGHT LAW AND NONE OF SUCH INFORMATION MAY BE COPIED OR OTHERWISE REPRODUCED, REPACKAGED, FURTHER TRANSMITTED, TRANSFERRED, DISSEMINATED, REDISTRIBUTED OR RESOLD, OR STORED FOR SUBSEQUENT USE FOR ANY SUCH PURPOSE, IN WHOLE OR IN PART, IN ANY FORM OR MANNER OR BY ANY MEANS WHATSOEVER, BY ANY PERSON WITHOUT AM Best Company PRIOR WRITTEN CONSENT. All information contained herein is obtained by AMB from sources believed by it to be accurate and reliable. Because of the possibility of human or mechanical error as well as other factors, however, all information contained herein is provided “AS IS” without warranty of any kind. Under no circumstances shall AM Best Company have any liability to any person or entity for (a) any loss or damage in whole or in part caused by, resulting from, or relating to, any error (negligent or otherwise) or other circumstance or contingency within or outside the control of AM Best or any of its directors, officers, employees or agents in connection with the procurement, collection, compilation, analysis, interpretation, communication, publication or delivery of any such information, or (b) any direct, indirect, special, consequential, compensatory or incidental damages whatsoever (including without limitation, lost profits), even if AM Best Company is advised in advance of the possibility of such damages, resulting from the use of or inability to use, any such information. The ratings, financial reporting analysis, projections, and other observations, if any, constituting part of the information contained herein are, and must be construed solely as, statements of opinion and not statements of fact or recommendations to purchase, sell or hold any securities. NO WARRANTY, EXPRESS OR IMPLIED, AS TO THE ACCURACY, TIMELINESS, COMPLETENESS, MERCHANTABILITY OR FITNESS FOR ANY PARTICULAR PURPOSE OF ANY SUCH RATING OR OTHER OPINION OR INFORMATION IS GIVEN OR MADE BY AM BEST COMPANY IN ANY FORM OR MANNER WHATSOEVER. Each rating or other opinion must be weighed solely as one factor in any investment decision made by or on behalf of any user of the information contained herein, and each such user must accordingly make its own study and evaluation of each security and of each issuer and guarantor of, and each provider of credit support for, each security that it may consider purchasing, holding or selling.

Grange St. Paul’s Hotel, London
18 October 2012
2012 Insurance Market Briefing -Europe