Embed Size (px)
Citation preview
A.M. Best 2017 Insurance Market Briefing
Stefan Holzberger Chief Rating Officer
October 11, 2017

Agenda
2
2:00 – 2:40 Market Review and Trends: Property & Casualty, Reinsurance and ILS
2:45 – 3:20 Market Review and Trends: Life, Annuity & Health
3:30 – 4:30 Benchmarking A.M. Best’s Ratings
4:30 – 6:30 Cocktail Reception

Personal Lines Market John Andre
Managing Director, P/C Ratings
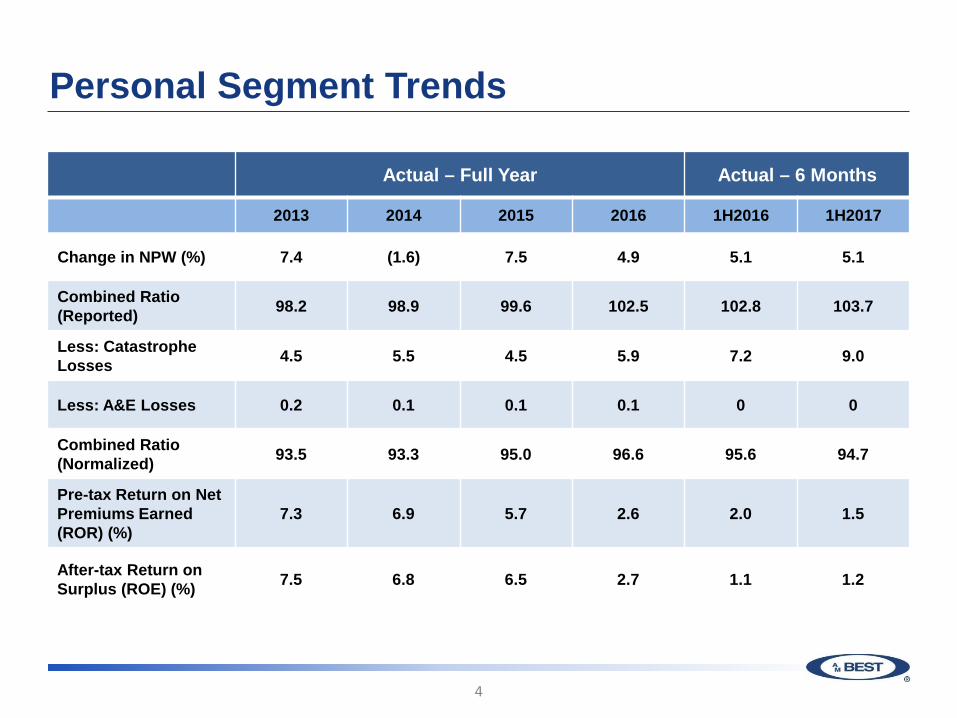
Personal Segment Trends
4
Actual – Full Year Actual – 6 Months
2013 2014 2015 2016 1H2016 1H2017
Change in NPW (%) 7.4 (1.6) 7.5 4.9 5.1 5.1
Combined Ratio (Reported) 98.2 98.9 99.6 102.5 102.8 103.7
Less: Catastrophe Losses 4.5 5.5 4.5 5.9 7.2 9.0
Less: A&E Losses 0.2 0.1 0.1 0.1 0 0
Combined Ratio (Normalized) 93.5 93.3 95.0 96.6 95.6 94.7
Pre-tax Return on Net Premiums Earned (ROR) (%)
7.3 6.9 5.7 2.6 2.0 1.5
After-tax Return on Surplus (ROE) (%) 7.5 6.8 6.5 2.7 1.1 1.2

Segment Outlook– Personal Lines
5
Headwinds Tailwinds
Auto combined ratios above break-even Excess capital
Auto frequency & severity pressures with some improvement noted mid year Favorable reinsurance pricing (for now)
Increasing frequency and severity of cats – HIM Impacts Rate increases taken in Auto
Favorable Reserve Releases Diminishing Strong Core Property performance
Low levels of investment income Advanced pricing segmentation / Technological Advances
Balance sheets are strong and well supportive of current ratings. Performance, profile and ERM are largely in line with expectations. Stable outlook assigned for 2017

Personal Lines
• Prior to the August-September cat events, six month catastrophe losses for the segment increased
– $3.4 billion (32% greater than the prior year)
– Driven by both frequency as well as severity of losses
– Added 9 points to the personal lines combined ratio
– By far, the worse first half result in years
6

Automobile
• Mutuals still dominating the personal lines segment – State Farm Mutual had a $7 billion auto loss but still
added approximately $5 billion to PHS at year end 2016
• Personal showed some improvement through six months as many are picking up good sized rate increases – Auto Liab DPW up 8.8% & Auto PD 7.8% at 6/30/17
• Technology/pricing sophistication gap has narrowed for regional companies, but scale remains a key differentiator
7

InsurTech
• On August 28, 2017, A.M. Best assigned an initial ICR of “a-” to HiRoad Assurance Company, a subsidiary of State Farm Mutual Automobile Insurance Company – Will operate exclusively in Rhode Island, where State
Farm doesn’t have captive agents – HiRoad will market business to more “mobile-centric”
consumers – This venture has been entered into with BlueOwl LLC,
in which SF has a limited liability interest – Blue Owl has built technology, data and product
solutions for HiRoad
8

Florida Ratings
• A.M. Best has ratings coverage on just four of the top twenty Florida property writers (based on those that have the majority of their book written in the state).These companies, many of which are less than ten years old, have opted not to engage with AMB for rating coverage
• Two Florida-centric primary companies had ratings affirmed in September. One with a negative outlook (significantly driven by AOB issue, as well as by Matthew and Irma losses)
9

Comments on Hurricane Irma Impacts on AMB Ratings
• What are we asking rating companies?
– Gross and net losses (including reinstatement costs)
– Claims experience regarding access to independent field adjusters, trends and volume
– Business continuity as it pertains to building closures and offsite locations
10
Hurricane Irma
• While a significant event, gross losses have been within reinsurance limits for all A.M. Best rated entities
• Most companies have moderate retentions with the majority of losses being paid by the reinsurers
• The FHCF layers will be hit though not completely exhausted
• More of an earnings event than a capital event
• Liquidity concerns partially offset by cash calls
11
Catastrophe Programs
• AMB rated companies have purchased protection to limits beyond the 1:100 return period
• All programs appear to be working as intended • All companies purchase coverage for multiple events
making use of reinstatements and drop-down features. Some have purchased additional coverage for a 3rd and 4th event post-Irma
• Companies are also being protected by their purchase of cat aggregate programs
12
Hurricane Irma Summary
• Irma acted as a good test for newly formed companies that have not yet been hit with a significant event
• Of the newly formed entities that A.M. Best rates, reinsurance programs appear to be responding as intended and providing solid risk mitigation, which goes the same for the established entities as well
13
Hurricane Irma Summary (cont.)
• Will take time to assess the ultimate impact on all Florida entities (not just AMB rated). Potential for consolidation as companies assess their risk appetites and position in the market
• Too soon to tell if a shift in reinsurance pricing could impact companies risk appetites
14

Hurricane Maria– Puerto Rico and the Caribbean
• Similar concerns as Florida concerning gross losses, net losses and reinsurance costs
• Coverage bought beyond 1 in 100
• Some companies are buying third event covers
• Most balance sheets can absorb insured losses
• Liquidity concerns are being offset by cash call provisions in reinsurance contracts
• Some companies with access to capital if necessary
• Business continuity issues are a challenge
15

Hurricane Maria– Puerto Rico and the Caribbean
• Maria will likely be a wind event (CAT 5)
• Less than half (maybe a third) of the homes in PR are insured
• Majority of losses will be BI and contingent BI with the magnitude of insured loss depending on the amount and time covered
• Economic losses will far exceed insured due to low take up rates and the extent of the damages to infrastructure (power, roads, airports, ports) and tourism
• Minimal flood (FIP) take up in PR. Likely even less in the USVI
16

Hurricane Maria– Puerto Rico and the Caribbean
• After discussions with the market, the AIR range for PR range from $34 million to $72 million appears to be too high
• Structural damage has occurred but not as much as the news reports have indicated
• While the risk-adjusted capital of a few companies may have been weakened; there have been no rating actions at this time
• Our analysis is continuing
17

Commercial Lines
Jennifer Marshall Director, P/C Ratings

Agenda
19
Financial Overview and Outlook
Loss Reserves
Workers’ Compensation
Commercial Auto
Catastrophes

Commercial Segment Trends
20
Actual – Full Year Actual – 6 Months
2013 2014 2015 2016 1H2016 1H2017
Change in NPW (%) 2.4 4.0 1.1 0.6 1.4 1.3
Combined Ratio (Reported) 96.5 96.6 97.0 99.7 96.8 96.4
Less: Catastrophe Losses 3.3 2.5 2.1 3.0 4.0 3.5
Less: A&E Losses 1.2 0.9 0.6 0.8 0.5 0.5
Combined Ratio (Normalized) 92.0 93.2 94.3 95.9 92.3 92.5
Pre-tax Return on Net Premiums Earned (ROR) (%)
13.1 12.4 10.9 12.4 14.6 14.1
After-tax Return on Surplus (ROE) (%) 9.3 9.2 8.1 8.2 4.9 4.1
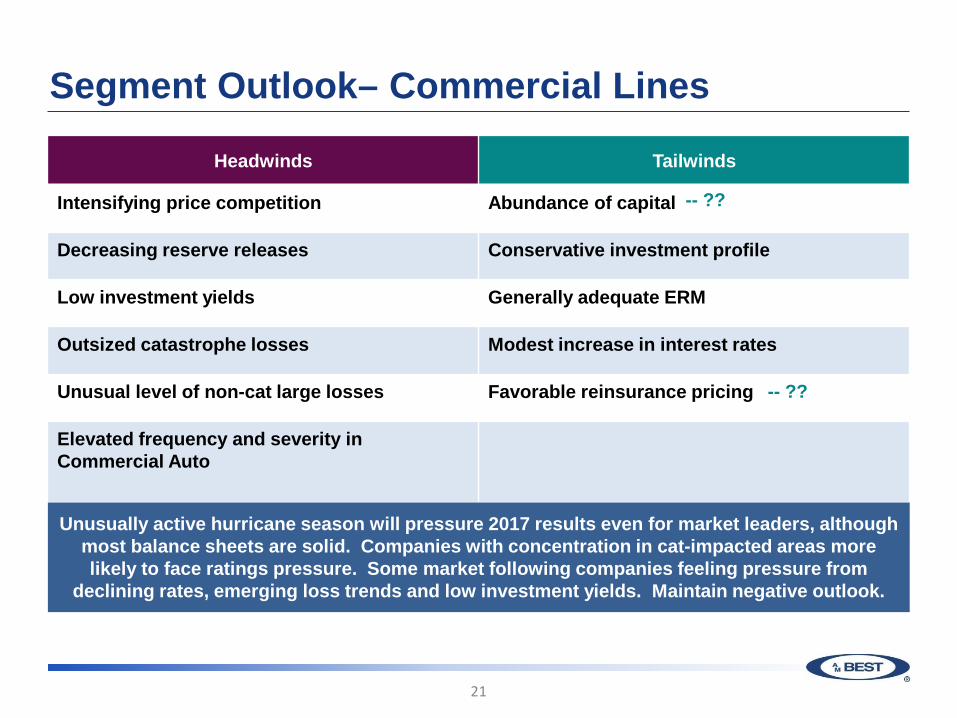
Segment Outlook– Commercial Lines
21
Headwinds Tailwinds
Intensifying price competition Abundance of capital
Decreasing reserve releases Conservative investment profile
Low investment yields Generally adequate ERM
Outsized catastrophe losses Modest increase in interest rates
Unusual level of non-cat large losses Favorable reinsurance pricing
Elevated frequency and severity in Commercial Auto
Unusually active hurricane season will pressure 2017 results even for market leaders, although most balance sheets are solid. Companies with concentration in cat-impacted areas more likely to face ratings pressure. Some market following companies feeling pressure from
declining rates, emerging loss trends and low investment yields. Maintain negative outlook.
-- ??
-- ??

Loss Reserves– Ongoing Concerns
22
Loss development factors will continue to
increase
Premiums/ rates continue to
soften across commercial lines
Uncertainty of inflation on loss
costs increasing?

Loss Reserves– Observations
23
Most companies continue to report
favorable development
Increasing number of companies reporting
overall adverse development
A number of companies strengthened
commercial casualty reserves in 2016
All of above = Greater Uncertainty/Volatility

Workers Compensation
• Premium growth slowing, but continues mostly due to exposure growth
• Trend of favorable development being maintained
• Calendar year direct loss ratio still improving
24

Workers’ Comp – Quarterly Price Trends
25
-15
-10
-5
0
5
10
15
(%)
Q1 Q2 Q3 Q4
Source: Council of Insurance Agents & Brokers (CIAB)

Workers’ Comp – Why Today Seems Different
26
Enhanced enterprise risk management
Greater utilization of
data and analytics
More responsive to
changes in market
Execution is key

Commercial Auto
• Rate increases accelerating
• Adverse development continues
– AY 2016 was worse than AY 2015
– More adverse development at 12 months for AY 2015 than 2014
• After peaking in 2016, A.M. Best expects combined ratio for the line to improve marginally in 2017, reflecting rate increases
27

3Q2017 Catastrophes
• Through 2Q17, worse than recent years but slightly better than at 2Q16
• Harvey, Irma and Maria losses will be material for earnings, but not expected to be capital issue for the industry
• 3Q Earnings most impacted, but do expect some companies to have substantial impact on full year earnings
• Even among rated companies with concentrated exposure, expect very few (if any) rating actions
28
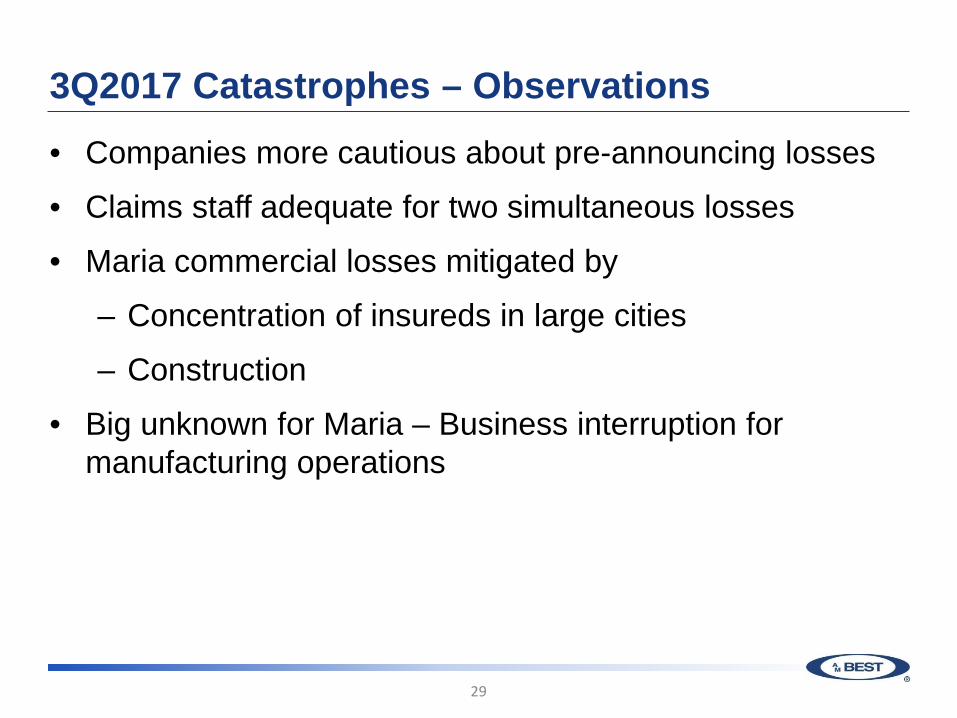
3Q2017 Catastrophes – Observations
• Companies more cautious about pre-announcing losses
• Claims staff adequate for two simultaneous losses
• Maria commercial losses mitigated by
– Concentration of insureds in large cities
– Construction
• Big unknown for Maria – Business interruption for manufacturing operations
29

Appendix
• Loss Reserves • Workers Comp • Commercial Auto
30
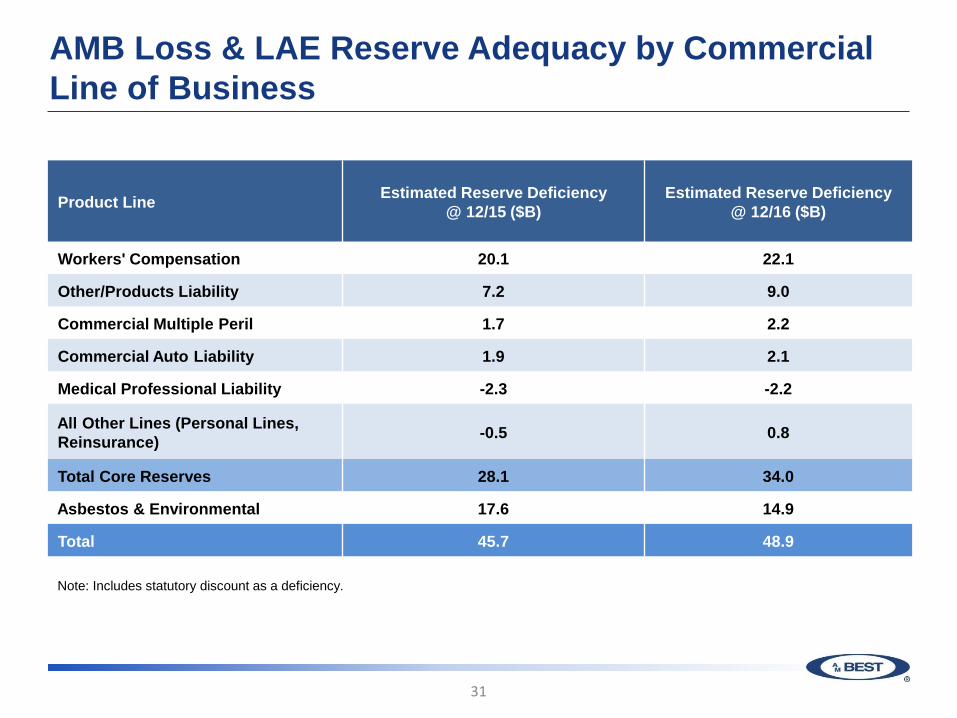
AMB Loss & LAE Reserve Adequacy by Commercial Line of Business
31
Product Line Estimated Reserve Deficiency @ 12/15 ($B)
Estimated Reserve Deficiency @ 12/16 ($B)
Workers' Compensation 20.1 22.1
Other/Products Liability 7.2 9.0
Commercial Multiple Peril 1.7 2.2
Commercial Auto Liability 1.9 2.1
Medical Professional Liability -2.3 -2.2
All Other Lines (Personal Lines, Reinsurance) -0.5 0.8
Total Core Reserves 28.1 34.0
Asbestos & Environmental 17.6 14.9
Total 45.7 48.9
Note: Includes statutory discount as a deficiency.
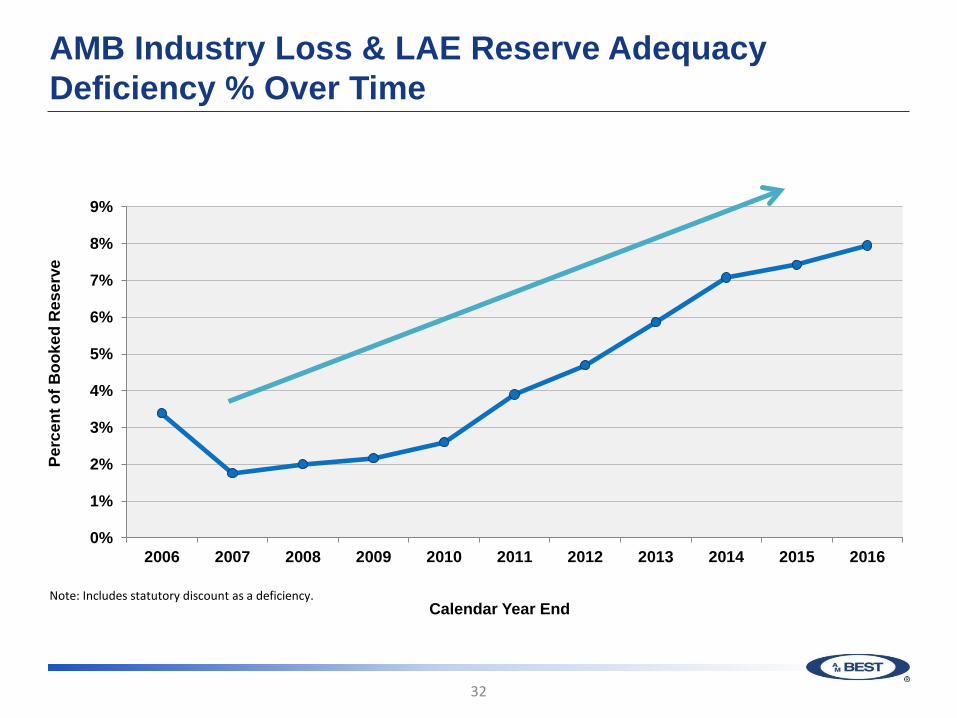
AMB Industry Loss & LAE Reserve Adequacy Deficiency % Over Time
32
Note: Includes statutory discount as a deficiency.
0%
1%
2%
3%
4%
5%
6%
7%
8%
9%
2006 2007 2008 2009 2010 2011 2012 2013 2014 2015 2016
Perc
ent o
f Boo
ked
Res
erve
Calendar Year End
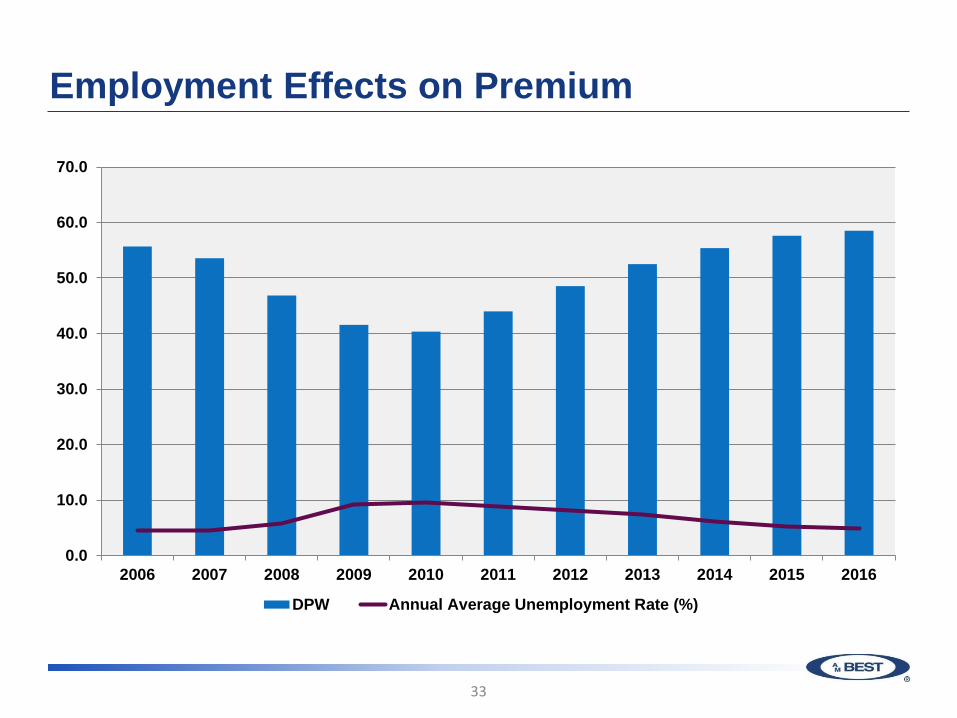
Employment Effects on Premium
33
0.0
10.0
20.0
30.0
40.0
50.0
60.0
70.0
2006 2007 2008 2009 2010 2011 2012 2013 2014 2015 2016
DPW Annual Average Unemployment Rate (%)

WC– Reserve Development Trends
34
-3
-2
-1
0
1
2
3
4
5
2000 2001 2002 2003 2004 2005 2006 2007 2008 2009 2010 2011 2012 2013 2014 2015 2016
1 Year Development

WC– Accident Year Development Trends
35
0.0
20.0
40.0
60.0
80.0
100.0
120.0
1997 1998 1999 2000 2001 2002 2003 2004 2005 2006 2007 2008 2009 2010 2011 2012 2013 2014 2015 2016
Original
Developed
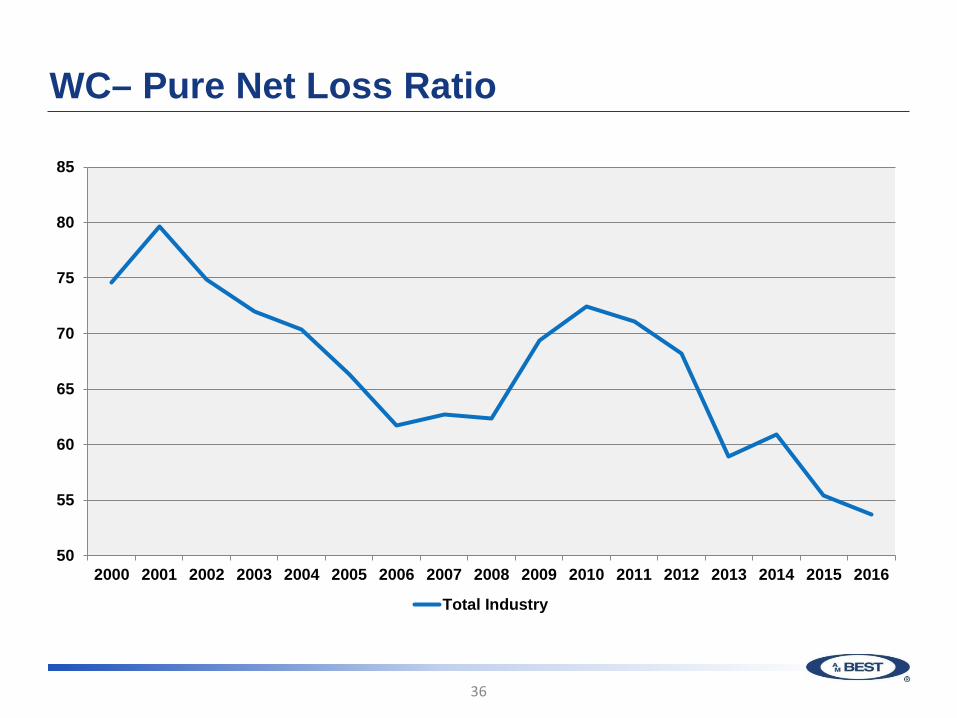
WC– Pure Net Loss Ratio
36
50
55
60
65
70
75
80
85
2000 2001 2002 2003 2004 2005 2006 2007 2008 2009 2010 2011 2012 2013 2014 2015 2016
Total Industry
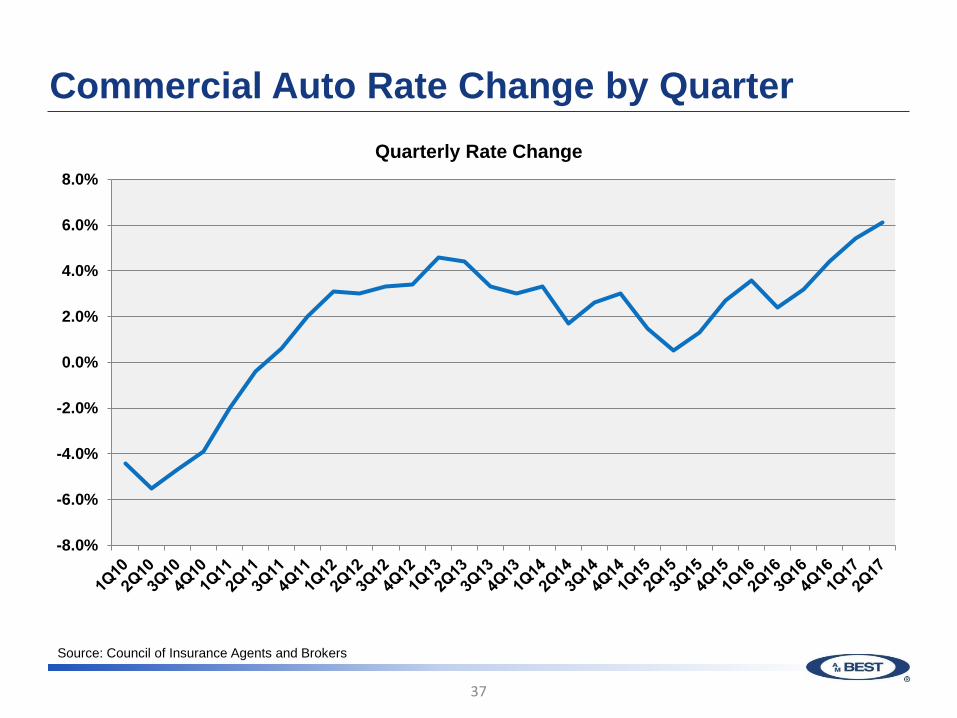
Commercial Auto Rate Change by Quarter
37
-8.0%
-6.0%
-4.0%
-2.0%
0.0%
2.0%
4.0%
6.0%
8.0%Quarterly Rate Change
Source: Council of Insurance Agents and Brokers

Commercial Auto Pure Net Loss Ratio
38
40
45
50
55
60
65
70
75
80
2000 2001 2002 2003 2004 2005 2006 2007 2008 2009 2010 2011 2012 2013 2014 2015 2016
Net Loss Ratio
Net Loss Ratio
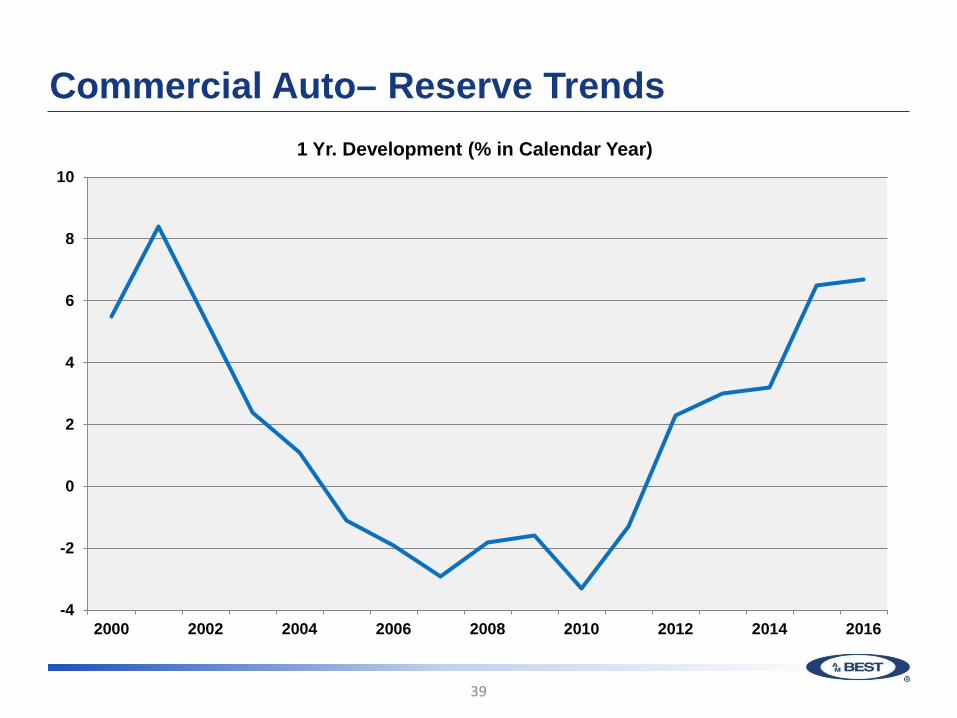
Commercial Auto– Reserve Trends
39
-4
-2
0
2
4
6
8
10
2000 2002 2004 2006 2008 2010 2012 2014 2016
1 Yr. Development (% in Calendar Year)

Reinsurance Market
Robert DeRose Senior Director
Agenda
41
Global Reinsurance Results and Trends
Market Capacity
Global Market Developments
Reinsurance Sector Outlook

42
Global Reinsurance Results and Trends
Global Market Trends
43
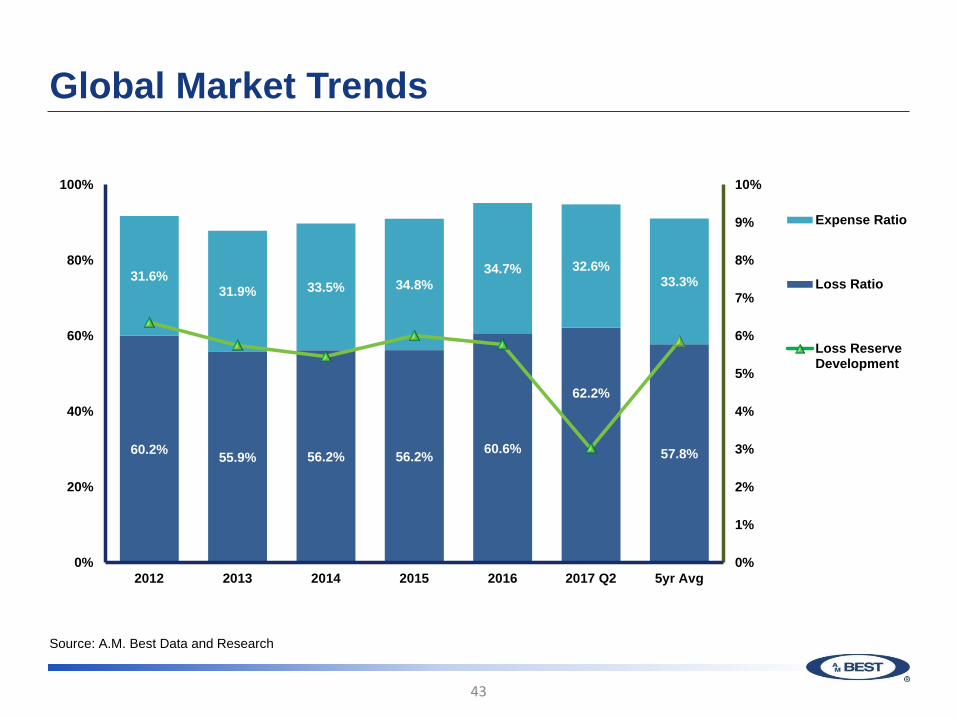
60.2% 55.9% 56.2% 56.2% 60.6%
62.2%
57.8%
31.6% 31.9% 33.5% 34.8%
34.7% 32.6% 33.3%
0%
1%
2%
3%
4%
5%
6%
7%
8%
9%
10%
0%
20%
40%
60%
80%
100%
2012 2013 2014 2015 2016 2017 Q2 5yr Avg
Expense Ratio
Loss Ratio
Loss ReserveDevelopment
Source: A.M. Best Data and Research

Global Market Trends
44
Source: A.M. Best Data and Research
93% 87% 87%
91% 92% 93%
2012 2013 2014 2015 2016 2017Q2
91% 87% 88% 90%
98%
2012 2013 2014 2015 2016 2017Q2
Combined Ratios by Reinsurance Sector
European “Big Four” U.S. & Bermuda Lloyd’s
91% 89% 92% 92% 96% 97%
0%
20%
40%
60%
80%
100%
120%
2012 2013 2014 2015 2016 2017Q2

Global Market Trends
45
Source: A.M. Best Data and Research
Return on Equity (2012 to present) and Five-Year Average
12.4% 13.0%
11.6%
9.5% 8.2% 8.1%
0%
2%
4%
6%
8%
10%
12%
14%
2012 2013 2014 2015 2016 2017 Q2
Return on Equity Five-Year Average

Global Market Trends
46
13.0% 13.1%
11.0% 11.5% 9.7%
8.1%
0%
5%
10%
15%
20%
2012 2013 2014 2015 2016 2017 Q2
10.6% 11.4%
10.9%
7.5% 6.8% 8.1%
2012 2013 2014 2015 2016 2017Q2
15.1% 16.2%
14.7%
8.9% 8.1%
2012 2013 2014 2015 2016 2017Q2
Return on Equity by Reinsurance Sector
European “Big Four” U.S. & Bermuda Lloyd’s
Source: A.M. Best Data and Research
Global Market Trends
47
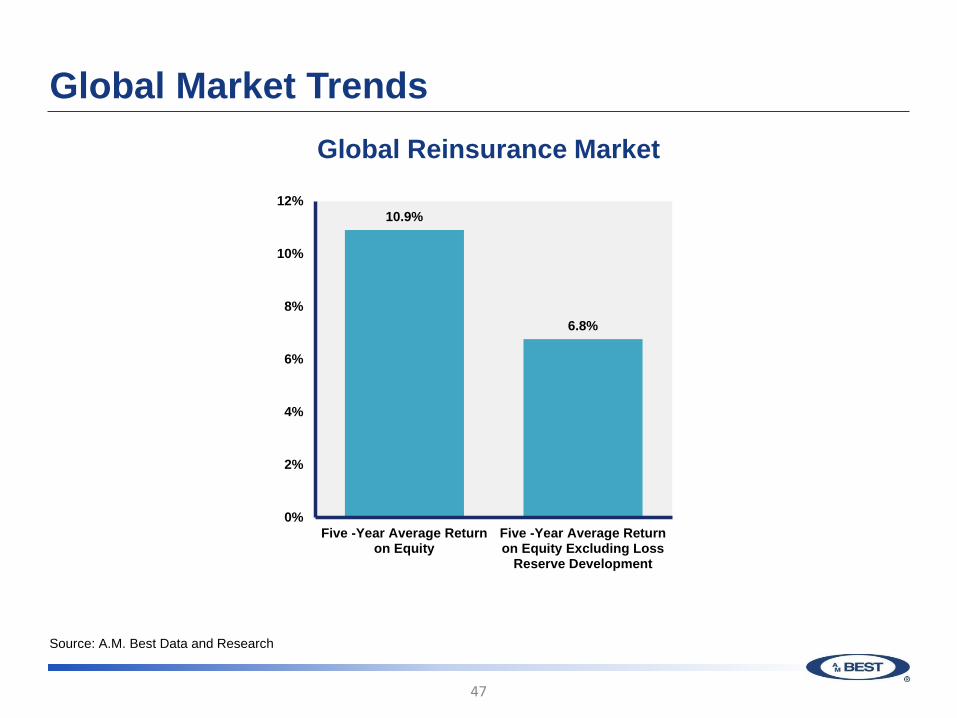
10.9%
6.8%
0%
2%
4%
6%
8%
10%
12%
Five -Year Average Returnon Equity
Five -Year Average Returnon Equity Excluding Loss
Reserve Development
Global Reinsurance Market
Source: A.M. Best Data and Research

Global Market Trends
48
15.0%
10.0%
13.3% 12.4% 12.4%
4.2%
0%
2%
4%
6%
8%
10%
12%
14%
16%
2012 2013 2014 2015 2016 2017 Q2
Operating Cash Flow as a Percentage of Equity
Source: A.M. Best Data and Research

Global Market Trends
49
19.2%
11.4%
17.9% 17.1%
15.4%
5.5%
0%
5%
10%
15%
20%
2012 2013 2014 2015 2016 2017Q2
10.9% 10.4%
11.4%
9.7% 9.9%
2.9%
2012 2013 2014 2015 2016 2017Q2
13.2%
5.4% 6.0% 7.2%
10.9%
2012 2013 2014 2015 2016 2017Q2
Operating Cash Flow as a Percentage of Equity by Reinsurance Sector
European “Big Four” U.S. & Bermuda Lloyd’s
Source: A.M. Best Data and Research

50
Market Capacity

Global Market Trends
51
Swiss Re Ltd. Munich Reinsurance Company
Lloyd's Hannover Ruck SE
Berkshire Hathaway Inc. SCOR S.E.
Transatlantic Holdings, Inc Everest Re Group Ltd.
PartnerRe Ltd. XL Group plc
Top 10 Global Reinsurance Groups – Non-Life
Top 10 Global Reinsurance Groups – Life
Source: A.M. Best Data and Research. Ranked by unaffiliated gross premium written in 2016.
Munich Reinsurance Company Swiss Re Ltd.
Reinsurance Group of America Inc. SCOR S.E.
Hannover Ruck SE Great West Lifeco
Berkshire Hathaway Inc. Pacific Life Corp PartnerRe Ltd.
Assicurazioni Generali SpA
Global Market Trends
52
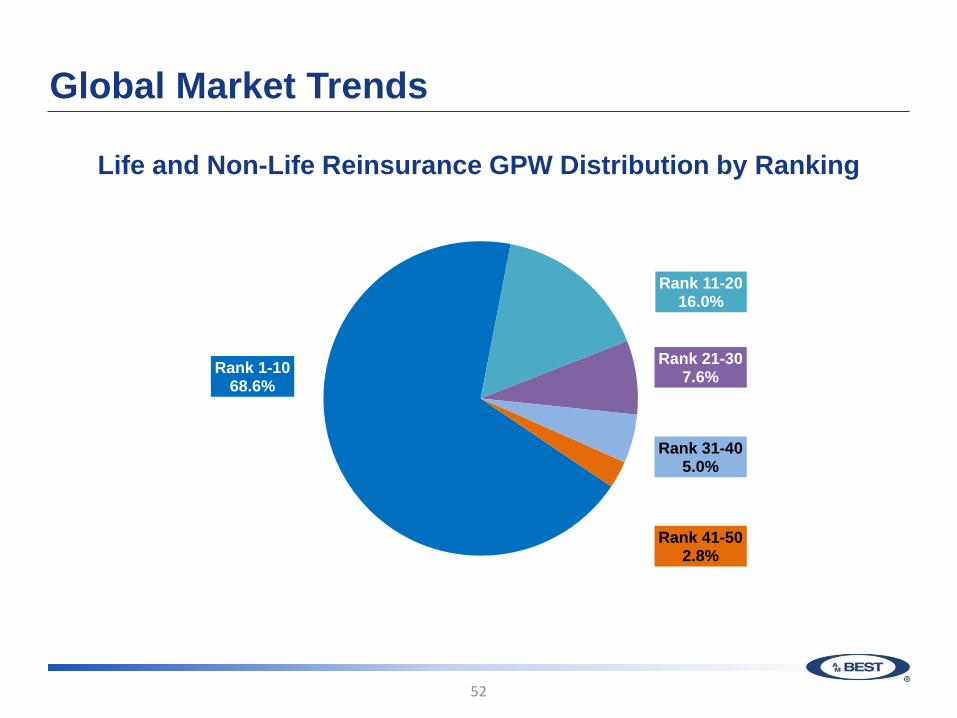
Life and Non-Life Reinsurance GPW Distribution by Ranking
Rank 1-10 68.6%
Rank 11-20 16.0%
Rank 21-30 7.6%
Rank 31-40 5.0%
Rank 41-50 2.8%

Global Market Trends
53
Estimate for Total Dedicated Reinsurance Capacity (USD billions)
320 340 332 345 355
48 60 68
75 80
2013 2014 2015 2016 2017E
ConvergenceCapacity
TraditionalCapacity
Notes and Sources: Estimates by Guy Carpenter and A.M. Best
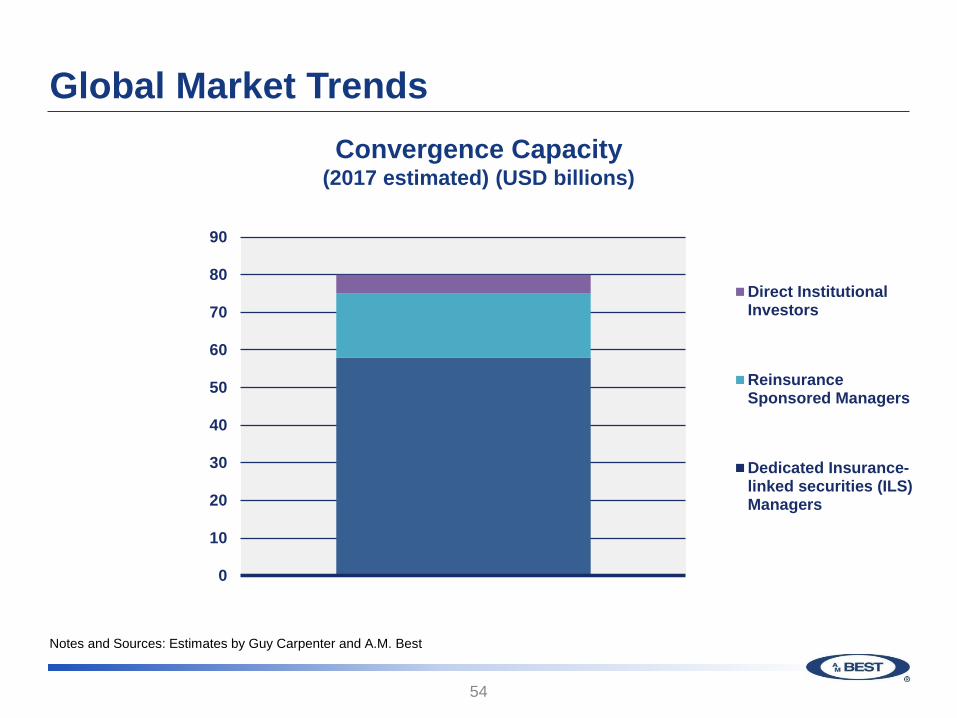
Global Market Trends
54
0
10
20
30
40
50
60
70
80
90
Direct InstitutionalInvestors
ReinsuranceSponsored Managers
Dedicated Insurance-linked securities (ILS)Managers
Convergence Capacity (2017 estimated) (USD billions)
Notes and Sources: Estimates by Guy Carpenter and A.M. Best

55
Global Market Developments
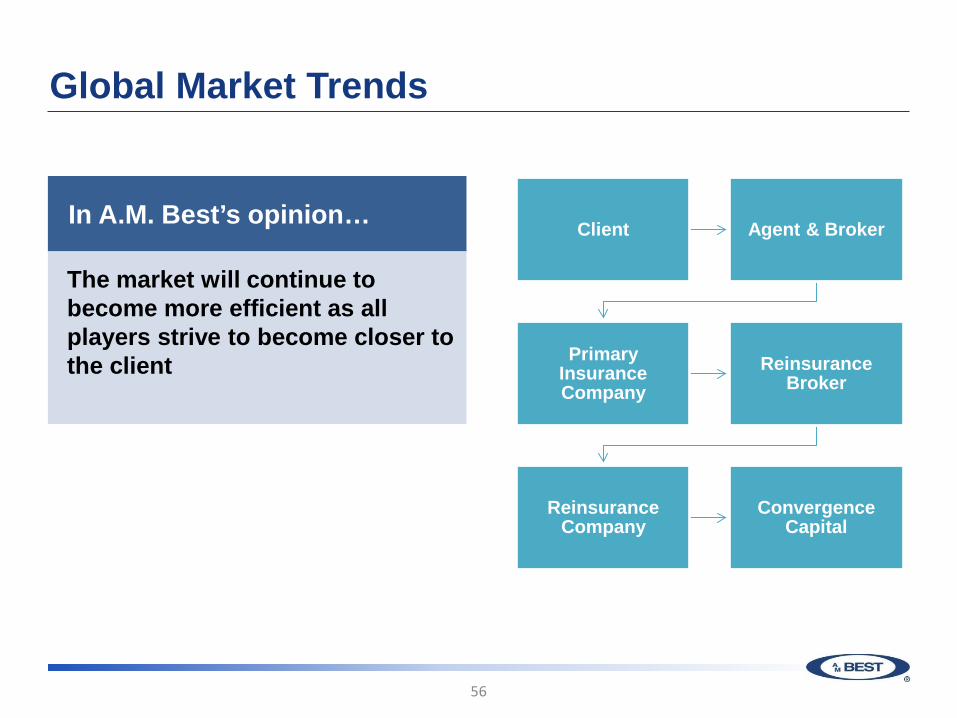
Global Market Trends
56
Client Agent & Broker
Primary Insurance Company
Reinsurance Broker
Reinsurance Company
Convergence Capital
In A.M. Best’s opinion…
The market will continue to become more efficient as all players strive to become closer to the client

Global Market Trends
57
Traditional Dual Platform
Control the client
Build primary business
Alternative Capital Platform
Manage or have a relationship with alternative capital
Build fee income stream
Mergers & Acquisitions
Relevance and size
Ability to be small and nimble with
parental protection
Strategy Evolution

Global Market Trends
58
Potential Opportunities
Cyber Insurance
Flood
Mortgage
Limited Improvement in Cat Pricing
InsurTech

Reinsurance Sector Outlook
59
A.M. Best Maintains Negative Outlook
Capitalisation remains strong but…
Performance has been deteriorating and pressure on margins continues to mount
Returns for some reinsurance companies will fall short on a risk-adjusted basis
Headwinds
Convergence capital pressure
Intense competition
Earnings under pressure
Slippage in terms &
conditions
Tailwinds
Favourable reserve
development
(Catastrophes)
Increased cessions

P/C ILS Market Activities
Emmanuel Modu Managing Director and Global Head of
Insurance-Linked Securities

Overview of the Current State of the ILS Market
• ILS capital in all forms continues to provide capacity to the reinsurance market – Current estimates put the ILS market around $75 billion
• 2017 will be a record in catastrophe bond issuance • Peak exposures still dominate cat bond issuances: U.S. wind
and earthquake, European wind, and Japan earthquake and typhoon
• Collateralized reinsurance continues to be the fastest growing portion of the ILS market
• Uncertainty in total insured losses due to HIM in 2017 • ILS fund managers’ participation in the reinsurance market
continues to grow with increase in Assets Under Management
61
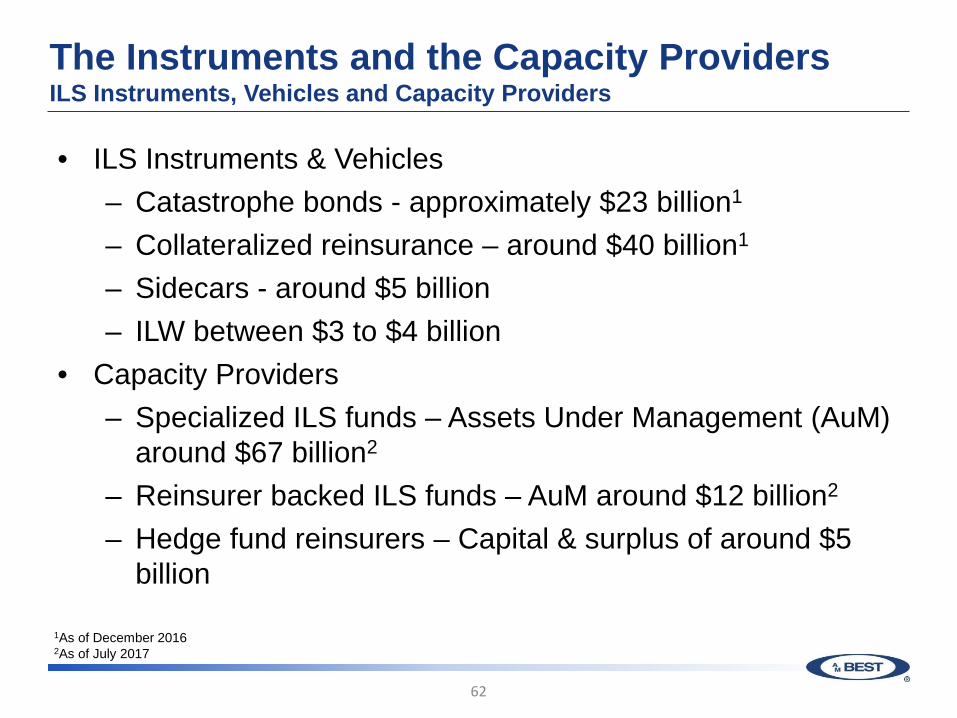
The Instruments and the Capacity Providers ILS Instruments, Vehicles and Capacity Providers
• ILS Instruments & Vehicles – Catastrophe bonds - approximately $23 billion1
– Collateralized reinsurance – around $40 billion1
– Sidecars - around $5 billion – ILW between $3 to $4 billion
• Capacity Providers – Specialized ILS funds – Assets Under Management (AuM)
around $67 billion2 – Reinsurer backed ILS funds – AuM around $12 billion2 – Hedge fund reinsurers – Capital & surplus of around $5
billion
62
1As of December 2016 2As of July 2017
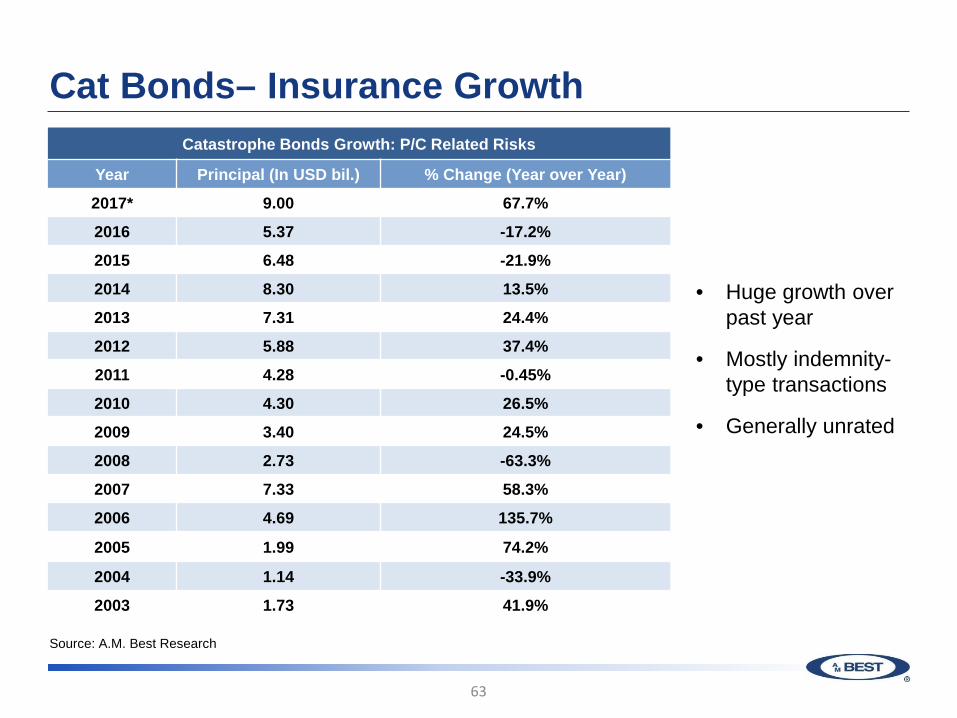
Cat Bonds– Insurance Growth
63
Catastrophe Bonds Growth: P/C Related Risks
Year Principal (In USD bil.) % Change (Year over Year)
2017* 9.00 67.7%
2016 5.37 -17.2%
2015 6.48 -21.9%
2014 8.30 13.5%
2013 7.31 24.4%
2012 5.88 37.4%
2011 4.28 -0.45%
2010 4.30 26.5%
2009 3.40 24.5%
2008 2.73 -63.3%
2007 7.33 58.3%
2006 4.69 135.7%
2005 1.99 74.2%
2004 1.14 -33.9%
2003 1.73 41.9%
• Huge growth over past year
• Mostly indemnity-type transactions
• Generally unrated
Source: A.M. Best Research
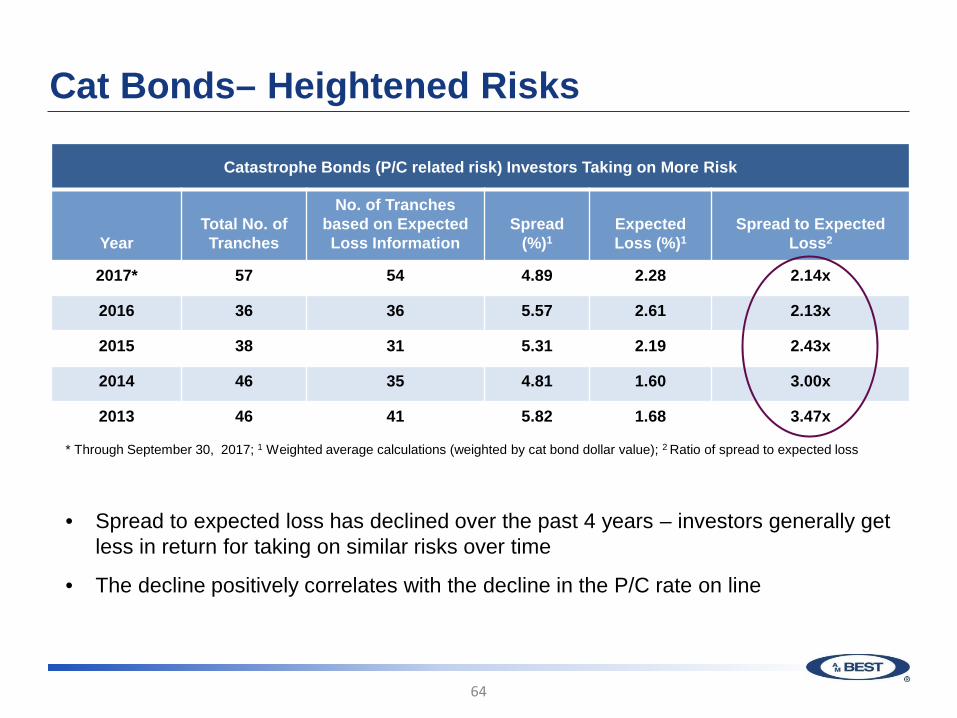
Cat Bonds– Heightened Risks
64
Catastrophe Bonds (P/C related risk) Investors Taking on More Risk
Year
Total No. of Tranches
No. of Tranches based on Expected Loss Information
Spread
(%)1
Expected Loss (%)1
Spread to Expected
Loss2
2017* 57 54 4.89 2.28 2.14x
2016 36 36 5.57 2.61 2.13x
2015 38 31 5.31 2.19 2.43x
2014 46 35 4.81 1.60 3.00x
2013 46 41 5.82 1.68 3.47x
* Through September 30, 2017; 1 Weighted average calculations (weighted by cat bond dollar value); 2 Ratio of spread to expected loss
• Spread to expected loss has declined over the past 4 years – investors generally get less in return for taking on similar risks over time
• The decline positively correlates with the decline in the P/C rate on line

Cat Bonds– Recent Non-Peak Transactions
65
Catastrophe Bonds Issues in 2017 and 2016: Other P/C Non-Peak Risks/Exposures
Issue Date Vehicle Sponsor Size
($mm) Peril Trigger
Apr 2017 Oaktown Re Ltd National Mortgage Insurance Co. 211.32 Mortgage
Insurance Indemnity
Dec 2016 Horse Capital I DAC1 Assicurazioni Generali S.p.A 265.20 Motor Third Party Liability Losses Indemnity
May 2016 Operational Risk Re Ltd2 Zurich Insurance Company 221.78 Operational Risks Indemnity
Apr 2016 Bellemeade Re II Ltd United Guaranty Corporation 298.58 Mortgage
Insurance Indemnity
1 USD equivalent of 220.20 million Swiss francs debt at closing date (1 CHF = 1.00807 USD) 2 USD equivalent of 255.00 million Euros debt at closing date (1 Euro = 1.04 USD)
• Over the past two years, 4 P&C bonds unrelated to peak risks/exposures were issued
• The mortgage-related transactions appear to be repeatable
Source: A.M. Best Research

Cat Bonds– Recent Non-Peak Transactions Bellemeade Re– Reinsured Cover and Attachment Structure
66
Ceding Insurer
140,168,000
Coverage Level M-2
Coverage Level B-2
Coverage Level B-1
144,291,000
14,429,000
129,862,100
Bellemeade Re Ltd.
Coverage Level M-1
7,816,439,000 Ceding Insurer Coverage Level A
• Risk Covered - Risk In Force = 25% of $32B
of Unpaid Principal Balance = About $8B
• Excess of Loss Structure - 3.6% of RIF Excess of 1.6%
• Risk Environment Transactions Benefitting From: - Stronger underwriting
environment (FICO, Docs) - Cleaner product origination
– Regulatory penalties for bad product originations
– No “No Doc “ loans – No Neg. Amort.
Products – No Int. only pmt. loans

Cat Bonds– Stress Due to Recent Catastrophes
67
At-Risk Bonds Due to Recent Catastrophes
Vehicle
Sponsor
Tranches Amount (mm) Stress On Bond
IBRD Catastrophe-Linked Notes1
AGROASEMEX S.A./FONDEN $150.0 Default: Loss Event – Mexico
Earthquake
Manatee Re Ltd.1 Safepoint Ins. Company $20.0 Default: Loss Event – Hurricane Irma
Kilimanjaro Re 2014-B Everest Re $200.00
Aggregate loss associated with Harvey, Irma, Maria Loss
Event – Downgraded from BB-(sf) to B-(sf)
Others Yet Unknown
• Unclear which bonds will experience stress – losses are too uncertain • Lane Financial states that cat bonds priced at 80% of par or below is about $900mm
(out of outstanding) • In general, catastrophe bonds have very high attachment points so we expect less
losses than with collateralized reinsurance structures
1Not yet finalized
Source: A.M. Best Research and Trading Risk
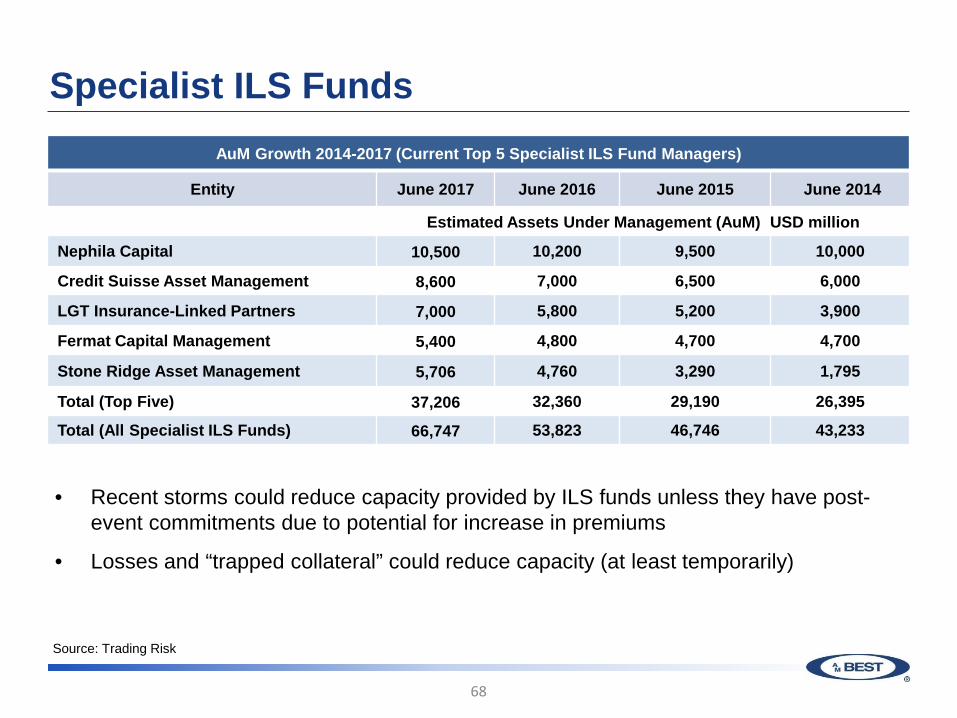
Specialist ILS Funds
68
AuM Growth 2014-2017 (Current Top 5 Specialist ILS Fund Managers)
Entity June 2017 June 2016 June 2015 June 2014
Estimated Assets Under Management (AuM) USD million
Nephila Capital 10,500 10,200 9,500 10,000
Credit Suisse Asset Management 8,600 7,000 6,500 6,000
LGT Insurance-Linked Partners 7,000 5,800 5,200 3,900
Fermat Capital Management 5,400 4,800 4,700 4,700
Stone Ridge Asset Management 5,706 4,760 3,290 1,795
Total (Top Five) 37,206 32,360 29,190 26,395
Total (All Specialist ILS Funds) 66,747 53,823 46,746 43,233
Source: Trading Risk
• Recent storms could reduce capacity provided by ILS funds unless they have post-event commitments due to potential for increase in premiums
• Losses and “trapped collateral” could reduce capacity (at least temporarily)
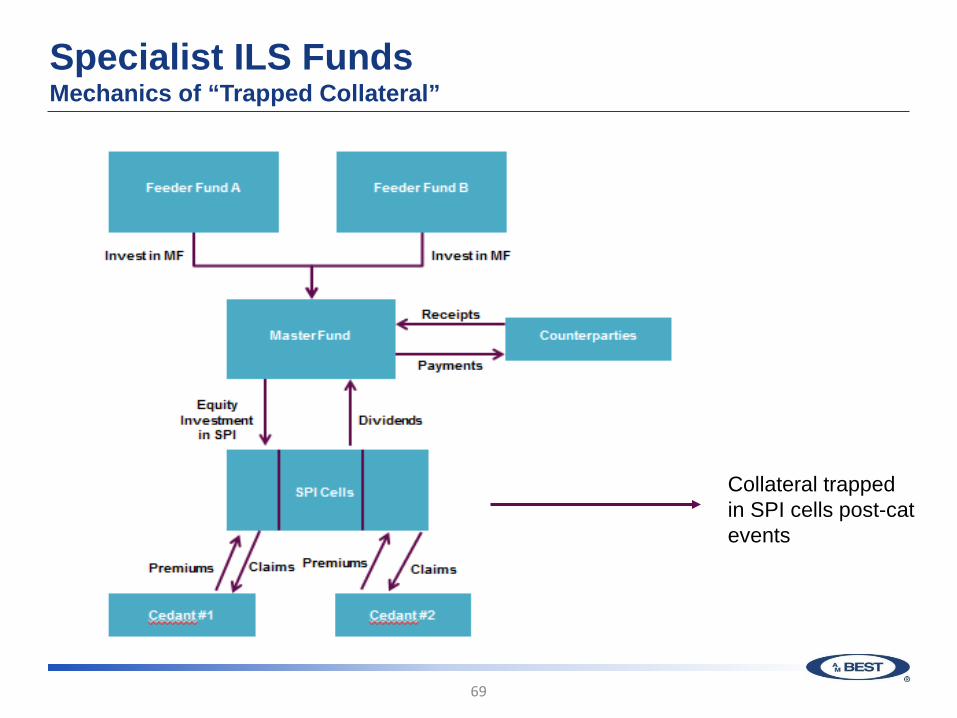
Specialist ILS Funds Mechanics of “Trapped Collateral”
69
Collateral trapped in SPI cells post-cat events

Specialist ILS Funds Mechanics of “Trapped Collateral”
70
Example of Buffer Loss Factors
Months Since Date of Loss Occurrence *Windstorm Earthquake Other
0 to 3 200% 300% 250%
> 3 to 6 150% 200% 175%
> 6 to 9 125% 175% 150%
> 9 to 12 110% 150% 130%
> 12 to 15 105% 125% 115%
> 15 to 18 100% 120% 110%
Thereafter 100% 100% 100% *Includes hurricane, rainstorm, storm, tempest, tornado, cyclone, typhoon and hail
Amount of Collateral Trapped = Buffer * (Actual Losses + LAE Expenses + IBNR + Misc.)

ILS Takeaways • Collateralized reinsurance will continue to be the fastest
growing portion of the ILS market – Access to risks not available to cat bond instrument – Investors’ desire to achieve a target risk/return profile – Flexibility of coverage design required by ceding insurers – ILS Funds seeking to increase leverage through various
funding arrangement • Repeatable transactions outside of peak risks (except for
mortgage risks) will probably continue to be rare • Trapped collateral could reduce capacity depending on an ILS
funds renewal cycle and ability to raise additional funds • To some extent, HIM is a test for the ILS market but a more
severe test would help the market solidify its position in reinsurance
71

U.S. Life/Annuity Recent Trends Ken Frino, Managing Director Rosemarie Mirabella, Director

Agenda
73
Outlook
Industry Trends
Financial Trends - 2016 - 2Q 2017
Forecast

U.S. Life/Annuity Ratings Outlook
74
Moderate Economic Growth
Low Interest Rates
Regulatory
Equity Market Valuations
Benign Credit Environment
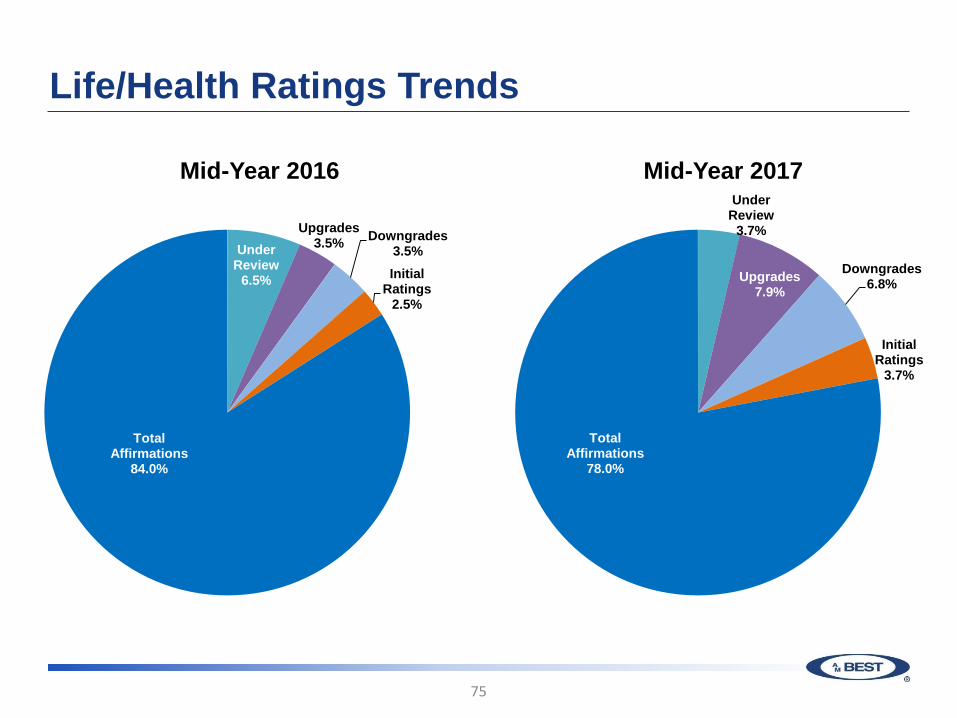
Life/Health Ratings Trends
75
Under Review
6.5%
Upgrades 3.5% Downgrades
3.5% Initial
Ratings 2.5%
Total Affirmations
84.0%
Under Review
3.7%
Upgrades 7.9%
Downgrades 6.8%
Initial Ratings
3.7%
Total Affirmations
78.0%
Mid-Year 2016 Mid-Year 2017
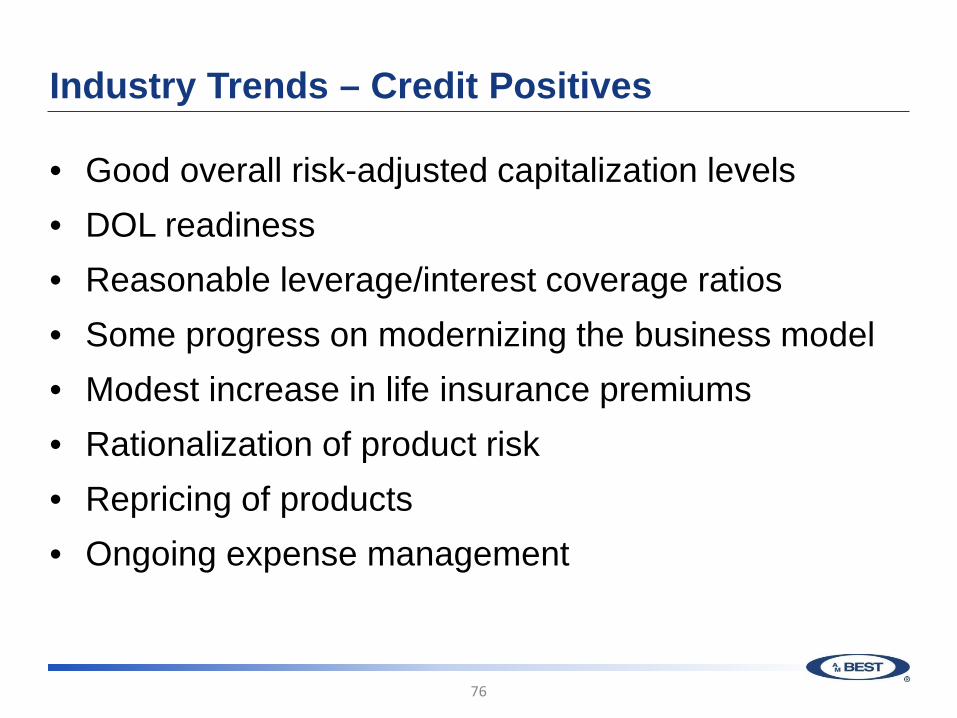
Industry Trends – Credit Positives
• Good overall risk-adjusted capitalization levels • DOL readiness • Reasonable leverage/interest coverage ratios • Some progress on modernizing the business model • Modest increase in life insurance premiums • Rationalization of product risk • Repricing of products • Ongoing expense management
76

Industry Trends – Credit Negatives
• Diminished capacity to improve margins near term • Ongoing spread compression • Mixed mortality trends/volatility • Diminished investment flexibility • Aging distribution • Need for innovation and technology improvements • Increasing longevity exposure • Regulatory
77
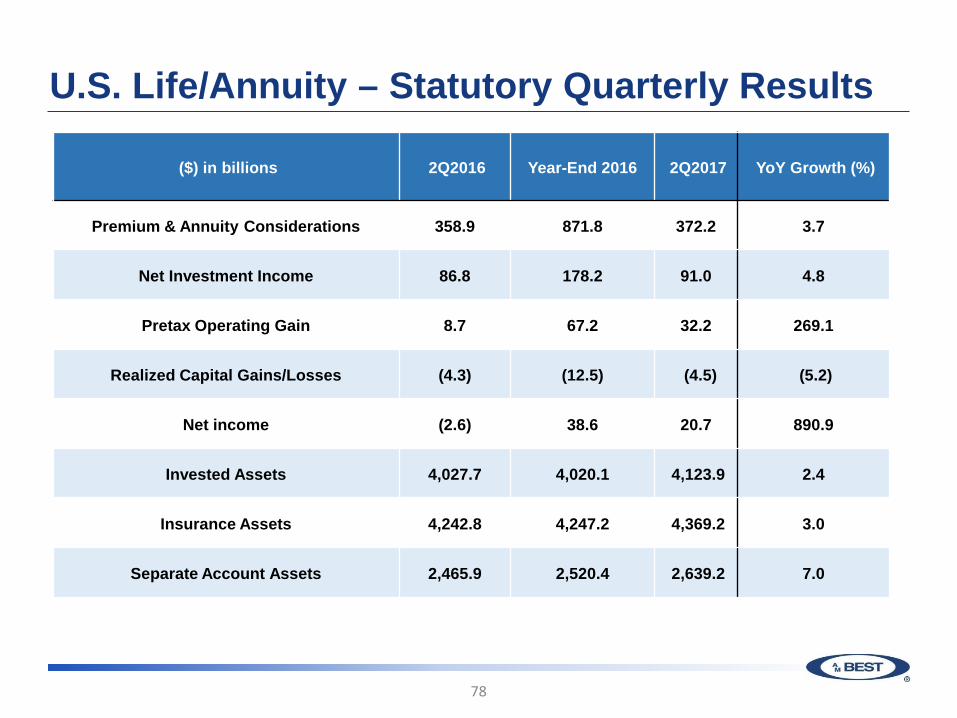
U.S. Life/Annuity – Statutory Quarterly Results
78
($) in billions 2Q2016 Year-End 2016 2Q2017 YoY Growth (%)
Premium & Annuity Considerations 358.9 871.8 372.2 3.7
Net Investment Income 86.8 178.2 91.0 4.8
Pretax Operating Gain 8.7 67.2 32.2 269.1
Realized Capital Gains/Losses (4.3) (12.5) (4.5) (5.2)
Net income (2.6) 38.6 20.7 890.9
Invested Assets 4,027.7 4,020.1 4,123.9 2.4
Insurance Assets 4,242.8 4,247.2 4,369.2 3.0
Separate Account Assets 2,465.9 2,520.4 2,639.2 7.0
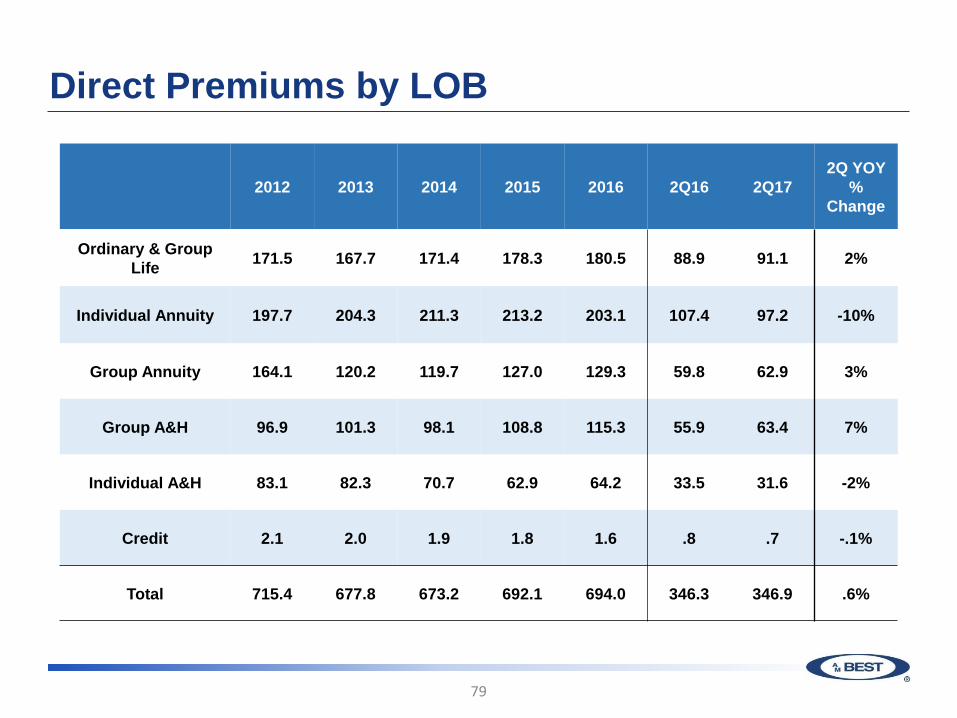
Direct Premiums by LOB
79
2012 2013 2014 2015 2016 2Q16 2Q17 2Q YOY
% Change
Ordinary & Group Life 171.5 167.7 171.4 178.3 180.5 88.9 91.1 2%
Individual Annuity 197.7 204.3 211.3 213.2 203.1 107.4 97.2 -10%
Group Annuity 164.1 120.2 119.7 127.0 129.3 59.8 62.9 3%
Group A&H 96.9 101.3 98.1 108.8 115.3 55.9 63.4 7%
Individual A&H 83.1 82.3 70.7 62.9 64.2 33.5 31.6 -2%
Credit 2.1 2.0 1.9 1.8 1.6 .8 .7 -.1%
Total 715.4 677.8 673.2 692.1 694.0 346.3 346.9 .6%
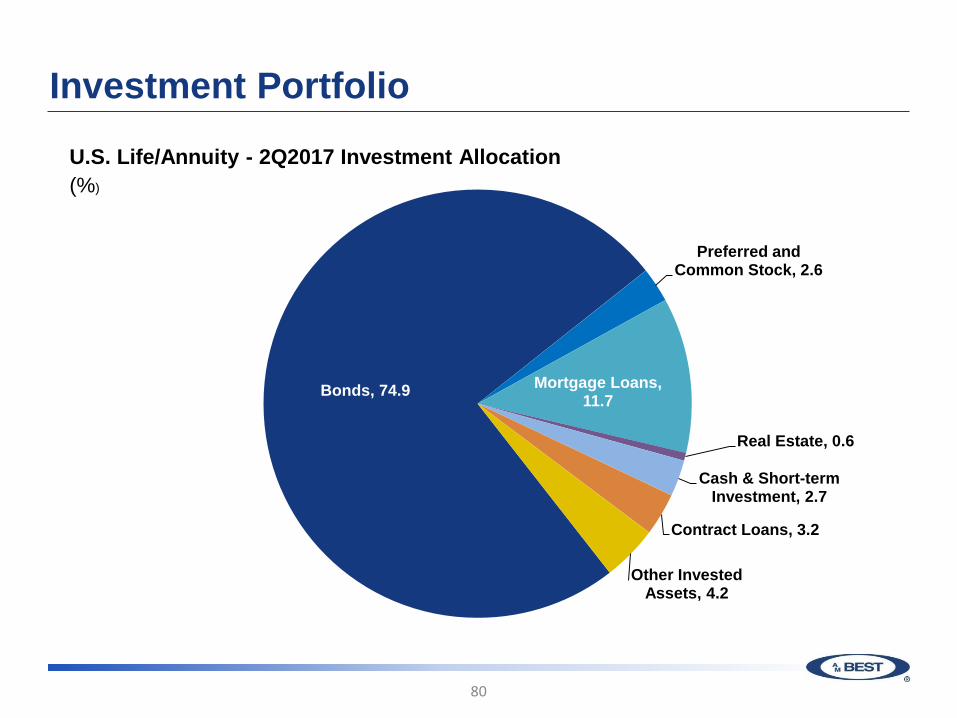
Investment Portfolio
80
Bonds, 74.9
Preferred and Common Stock, 2.6
Mortgage Loans, 11.7
Real Estate, 0.6
Cash & Short-term Investment, 2.7
Contract Loans, 3.2
Other Invested Assets, 4.2
U.S. Life/Annuity - 2Q2017 Investment Allocation (%)

Operating – Portfolio Yields
81
172.0 173.4
177.2 176.4 178.2
180.5
5.0 5.0 4.9 4.7
4.6 4.6
4.0
4.5
5.0
5.5
6.0
6.5
150
155
160
165
170
175
180
185
2006 2007 2008 2009 2010 2011 2012 2013 2014 2015 2016 2017*
Net Yield (%
) $ B
illio
ns
Net Investment Income Net Yield (%)*A.M. Best Estimate
Best's Statement File - L/H, U.S. Source:

Life/Annuity Operating Forecast
82
55.2
67.2
32.2
62.8
0
2
4
6
8
10
12
14
16
18
0
10
20
30
40
50
60
70
80
2010 2011 2012 2013 2014 2015 2016 2Q2017 2017*
RO
E (%) $
Bill
ions
Pretax NOG Return on equity* A.M. Best Estimate
Health – Performance and Outlook
Sally Rosen, Director– LH Doniella Pliss, Associate Director– LH

U.S. Health Ratings Outlook - Negative
Uncertainty on the future of ACA
Financial losses in ACA segment
Lack of growth in commercial segment
Growth in lower margin government business
Declining capitalization trends
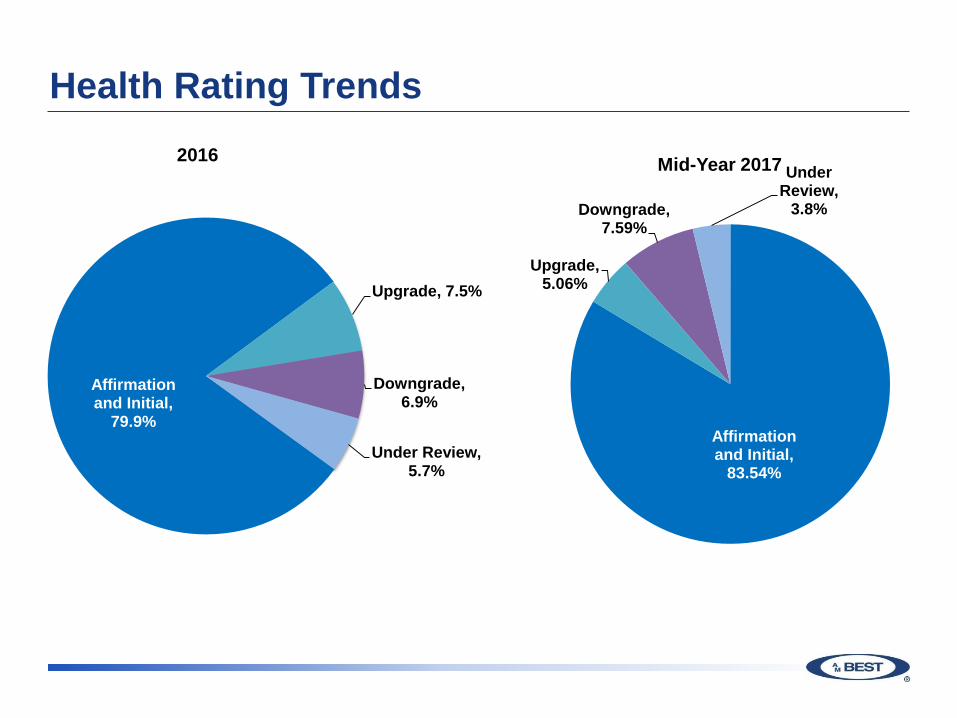
Health Rating Trends
Affirmation and Initial,
83.54%
Upgrade, 5.06%
Downgrade, 7.59%
Under Review,
3.8%
Mid-Year 2017
Affirmation and Initial,
79.9%
Upgrade, 7.5%
Downgrade, 6.9%
Under Review, 5.7%
2016
2017 Industry Trends
• Temporary reprieve from the Health Insurer Fee (HIF) • Lower prescription drug trends • Stable cost trends • Growth in value-based reimbursements • Moderating ACA losses • Compression in Medicaid margins • Termination of large M&A transactions • Stable to declining financial leverage
86

U.S. Health – Financial Performance ($ Billions)
2012 2013 2014 2015 2016 2Q 2016 2Q 2017
Net Premium Written 558.0 579.3 652.4 732.1 785.9 383.8 407.5
U/W Income 16.1 14.5 12.3 13.4 15.9 6.5 16.9
Investment Income 4.7 5.1 4.6 3.9 5.1 1.8 2.8
Realized Gains/Losses 1.3 1.3 1.6 0.9 1.0 0.4 0.3
Net Income 16.5 15.6 10.8 9.0 12.8 3.5 14.4
Capital & Surplus 125.3 143.3 141.7 150.7 162.0 150.8 172.4
ROE 12.7 10.6 6.5 5.5 7.6 2.1 8.7
87

U.S. Health – Net Premiums Written ($ Billions)
88
258.8 261.7 277.0 288.4 300.2
124.0 131.3 157.6 175.6 188.3
92.9 103.8 140.5
186.6 212.1
82.1 82.2
77.2
81.4 85.2
-
100
200
300
400
500
600
700
800
900
2012 2013 2014 2015 2016
($) i
n B
illio
ns
Comp Medicare Medicaid Other

Anticipated Issues 2018 • Medicare Advantage subject to changes in government
funding; increased dependency on star ratings and benchmarking limitations
• Margin compression for Medicare Advantage business • Limited growth potential for new Medicaid contracts • Lack of growth in higher margin business (group
commercial) • Provider consolidation • Growing role of technology/data analytics
89

Anticipated Issues 2018 • ACA related concerns:
– Uncertainty of CSR’s – Concern about further deterioration of exchange pools;
failure to bring in younger enrollees; multiple markets with a single carrier; declining enrollment
– Companies not participating with exchanges will be challenged to offer replacement for grandmothered policies
– Return of the Health Insurer Fee (HIF) – Possible modification to ACA – Repeal/Replace – where
do we go from here
90

John Andre, Managing Director Anthony Diodato, Managing Director
U.S. Property/Casualty Industry

Agenda
92
Discuss Building Block Approach
Review of the Rating Drivers in A. M. Best’s New Methodology

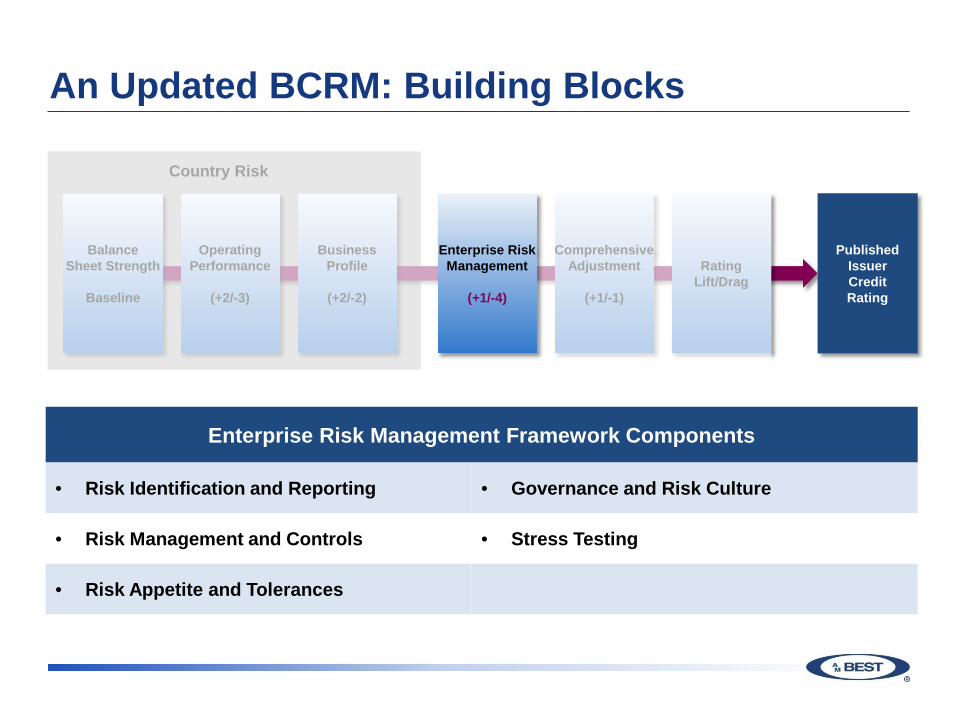
An Updated BCRM: Building Blocks
93
Balance Sheet Strength
Baseline
Published Issuer Credit Rating
Rating Lift/Drag
Operating Performance
(+2/-3)
Business Profile
(+2/-2)
Enterprise Risk Management
(+1/-4)
Comprehensive Adjustment
(+1/-1)
Maximum +2

An Updated BCRM: Building Blocks
Balance Sheet Strength
Baseline
Published Issuer Credit Rating
Rating Lift/Drag
Comprehensive Adjustment
(+1/-1)
Country Risk
Balance Sheet Strength Components
• BCAR • Quality of Capital
• Stress Tests • Quality of Reinsurance
• Liquidity • Reinsurance Dependence
• Asset Liability Management • Appropriateness of Reinsurance Program
• Internal Capital Models • Financial Flexibility
Enterprise Risk Management
(+1/-4)
Business Profile
(+2/-2)
Operating Performance
(+2/-3)
Balance Sheet Strength
Baseline
94
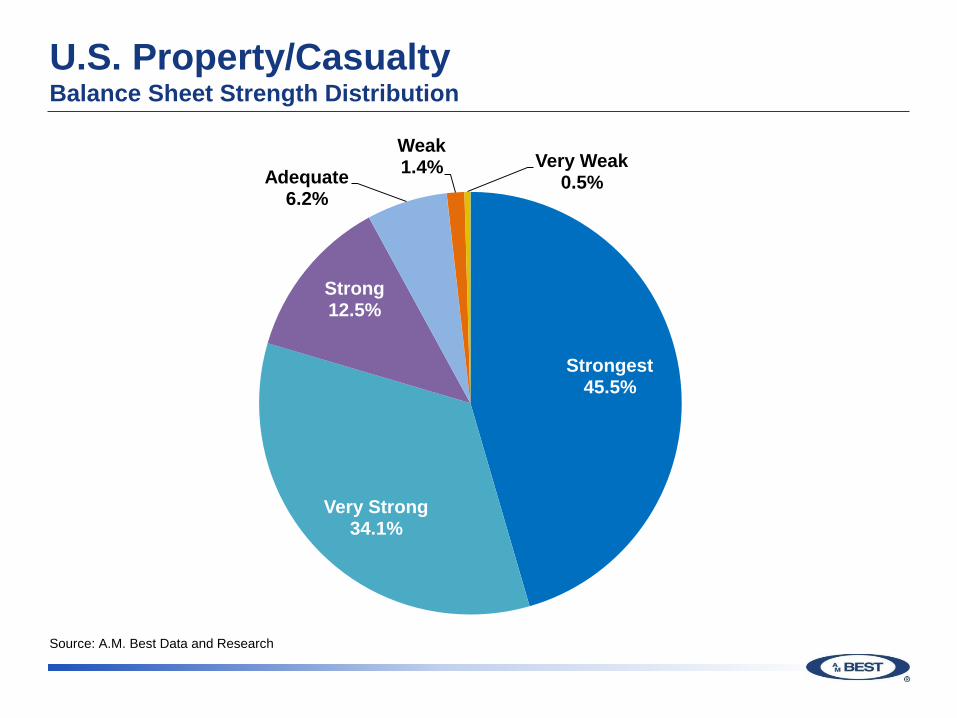
U.S. Property/Casualty Balance Sheet Strength Distribution
95
Strongest 45.5%
Very Strong 34.1%
Strong 12.5%
Adequate 6.2%
Weak 1.4% Very Weak
0.5%
Source: A.M. Best Data and Research
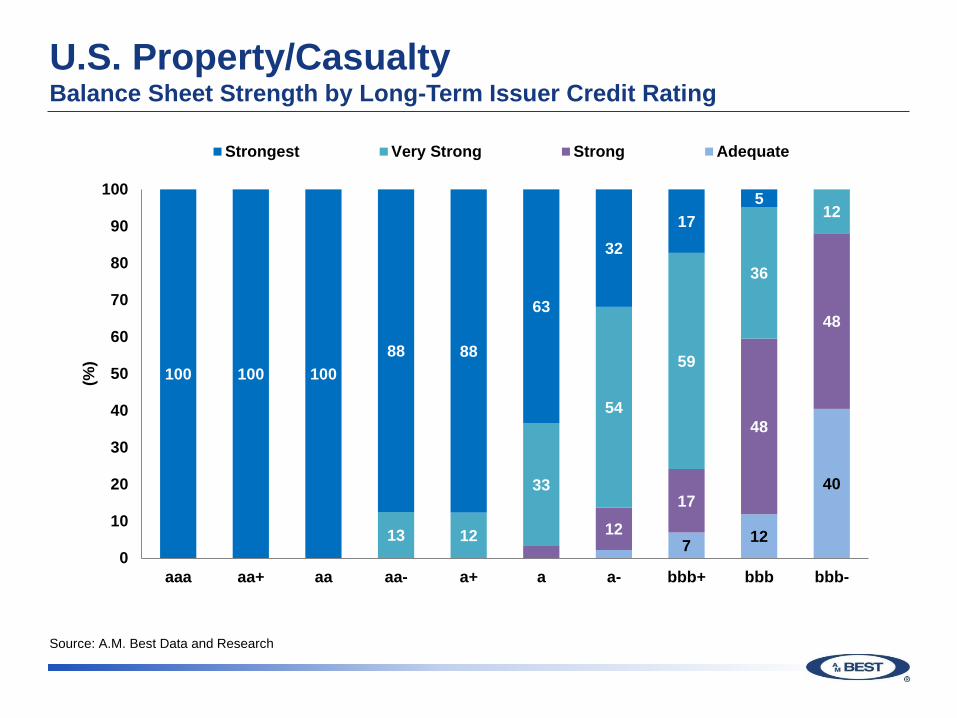
U.S. Property/Casualty Balance Sheet Strength by Long-Term Issuer Credit Rating
96
7 12
40
12
17
48
48
13 12
33
54
59
36
12
100 100 100 88 88
63
32 17
5
0
10
20
30
40
50
60
70
80
90
100
aaa aa+ aa aa- a+ a a- bbb+ bbb bbb-
(%)
Strongest Very Strong Strong Adequate
Source: A.M. Best Data and Research

U.S. Property/Casualty Median BCAR Score by Balance Sheet Strength
97
Source: A.M. Best Data and Research
-240
-210
-180
-150
-120
-90
-60
-30
0
30
60
90
VaR 95% VaR 99% VaR 99.5% VaR 99.6% VaR 99.8%
Med
ian
BC
AR S
core
Strongest Very Strong Strong Adequate Weak Very Weak
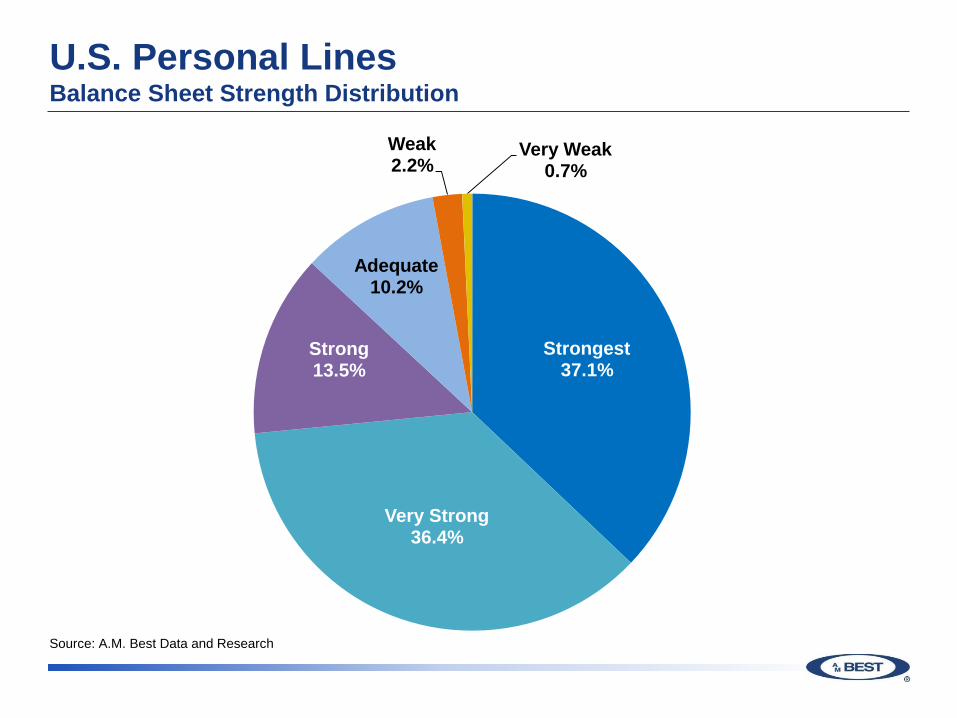
U.S. Personal Lines Balance Sheet Strength Distribution
98
Source: A.M. Best Data and Research
Strongest 37.1%
Very Strong 36.4%
Strong 13.5%
Adequate 10.2%
Weak 2.2%
Very Weak 0.7%

U.S. Personal Lines Median BCAR Score by Balance Sheet Strength
99
Source: A.M. Best Data and Research
-160
-120
-80
-40
0
40
80
VaR 95% VaR 99% VaR 99.5% VaR 99.6% VaR 99.8%
Med
ian
BC
AR S
core
Strongest Very Strong Strong Adequate Weak Very Weak
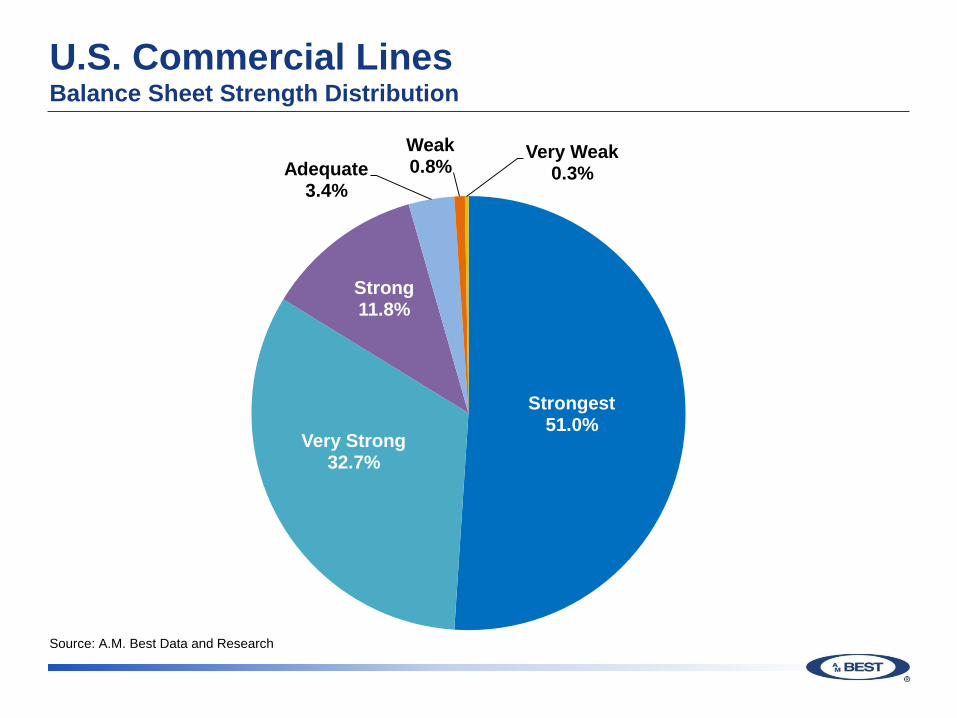
U.S. Commercial Lines Balance Sheet Strength Distribution
100
Source: A.M. Best Data and Research
Strongest 51.0%
Very Strong 32.7%
Strong 11.8%
Adequate 3.4%
Weak 0.8%
Very Weak 0.3%

U.S. Commercial Lines Median BCAR Score by Balance Sheet Strength
101
Source: A.M. Best Data and Research
-20
-10
0
10
20
30
40
50
60
70
80
VaR 95% VaR 99% VaR 99.5% VaR 99.6% VaR 99.8%
Med
ian
BC
AR S
core
Strongest Very Strong Strong Adequate Weak

An Updated BCRM: Building Blocks
Balance Sheet Strength
Baseline
Published Issuer Credit Rating
Rating Lift/Drag
Comprehensive Adjustment
(+1/-1)
Country Risk
Operating Performance Components
• Change in NPW • Pre-Tax Total Return
• Change in Total Reserves • Pre-Tax Operating ROR
• Financial Forecasts/Plans • Operating ROE
• Combined Ratio
Enterprise Risk Management
(+1/-4)
Business Profile
(+2/-2)
Operating Performance
(+2/-3)
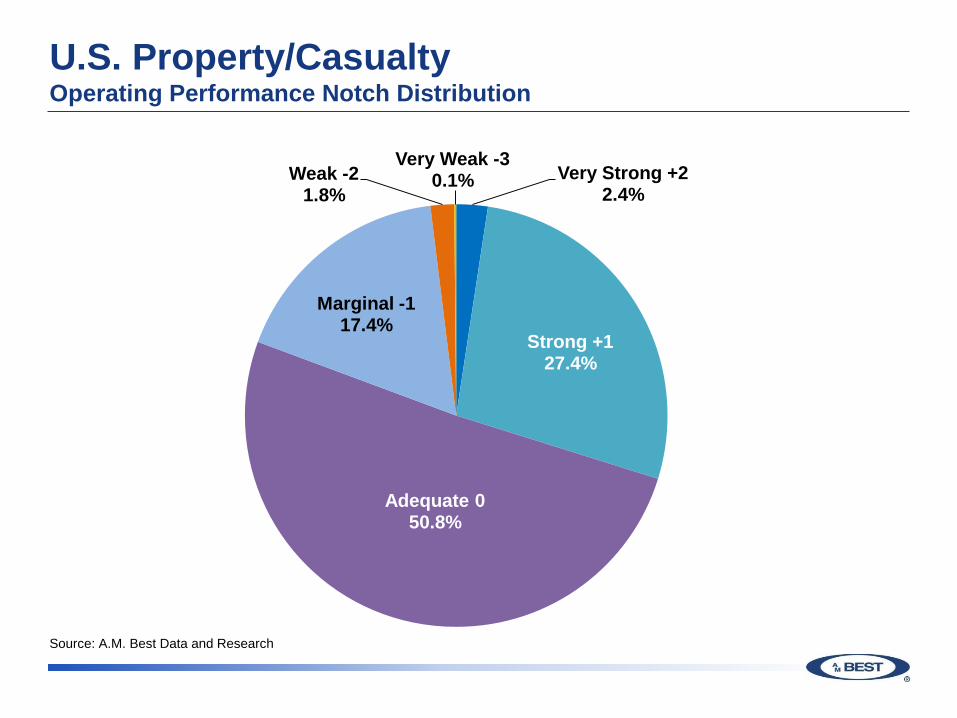
U.S. Property/Casualty Operating Performance Notch Distribution
103
Source: A.M. Best Data and Research
Very Strong +2 2.4%
Strong +1 27.4%
Adequate 0 50.8%
Marginal -1 17.4%
Weak -2 1.8%
Very Weak -3 0.1%

U.S. Property/Casualty Operating Performance Notch by Long-Term Issuer Credit Rating
104
8 7 4 6 17
28
43 60
33 33
63
64
59
43
36
58
85
55 60
29 19 14
7
100
42
8 10
0
10
20
30
40
50
60
70
80
90
100
aaa aa+ aa aa- a+ a a- bbb+ bbb bbb-
(%)
Very Strong +2 Strong +1 Adequate 0 Marginal -1 Weak -2 Very Weak -3
Source: A.M. Best Data and Research

U.S. Property/Casualty Median 5-Year Average Combined Ratio by Operating Performance Notch
105
Source: A.M. Best Data and Research
84.9 88.9 98.0
104.1
118.1
166.4
0
20
40
60
80
100
120
140
160
180
+2 +1 0 -1 -2 -3
Very Strong Strong Adequate Marginal Weak Very Weak
Med
ian
5-Yr
. Avg
. Com
bine
d R
atio
(%)
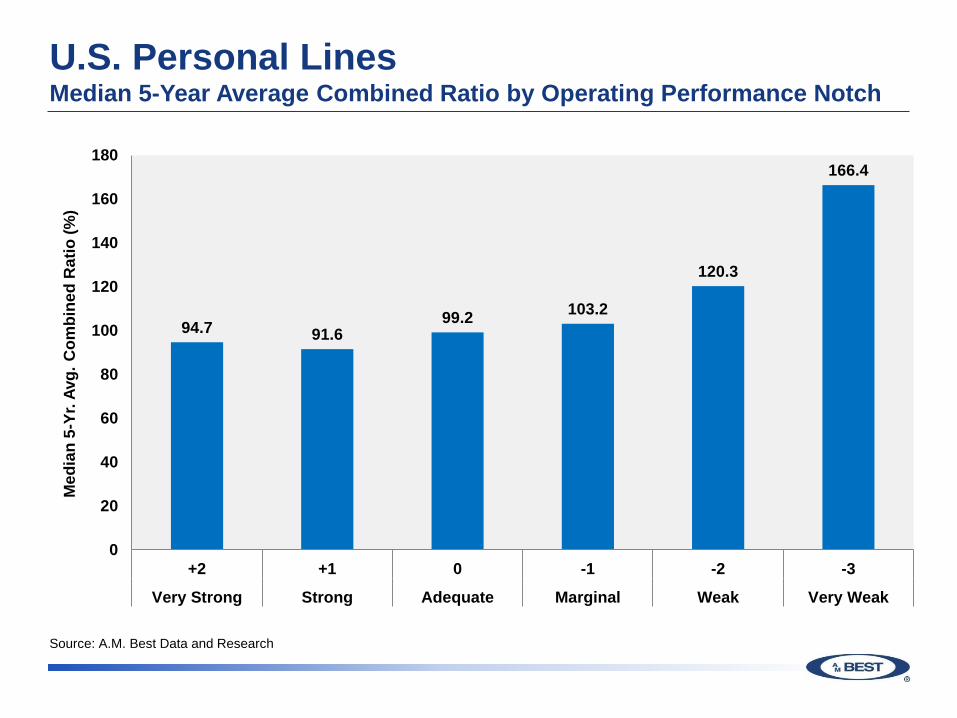
U.S. Personal Lines Median 5-Year Average Combined Ratio by Operating Performance Notch
106
Source: A.M. Best Data and Research
94.7 91.6 99.2 103.2
120.3
166.4
0
20
40
60
80
100
120
140
160
180
+2 +1 0 -1 -2 -3
Very Strong Strong Adequate Marginal Weak Very Weak
Med
ian
5-Yr
. Avg
. Com
bine
d R
atio
(%)

U.S. Commercial Lines Median 5-Year Average Combined Ratio by Operating Performance Notch
107
Source: A.M. Best Data and Research
84.0 86.2 96.2
106.8 115.8
0
20
40
60
80
100
120
140
+2 +1 0 -1 -2
Very Strong Strong Adequate Marginal Weak
Med
ian
5-Yr
. Avg
. Com
bine
d R
atio
(%)
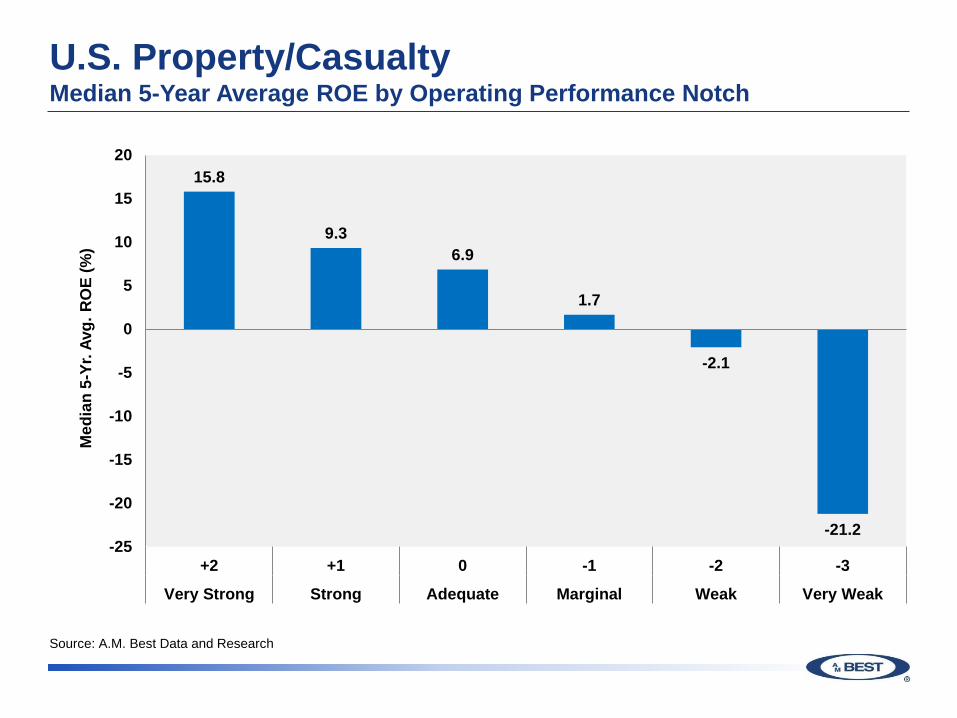
U.S. Property/Casualty Median 5-Year Average ROE by Operating Performance Notch
108
Source: A.M. Best Data and Research
15.8
9.3 6.9
1.7
-2.1
-21.2 -25
-20
-15
-10
-5
0
5
10
15
20
+2 +1 0 -1 -2 -3
Very Strong Strong Adequate Marginal Weak Very Weak
Med
ian
5-Yr
. Avg
. RO
E (%
)
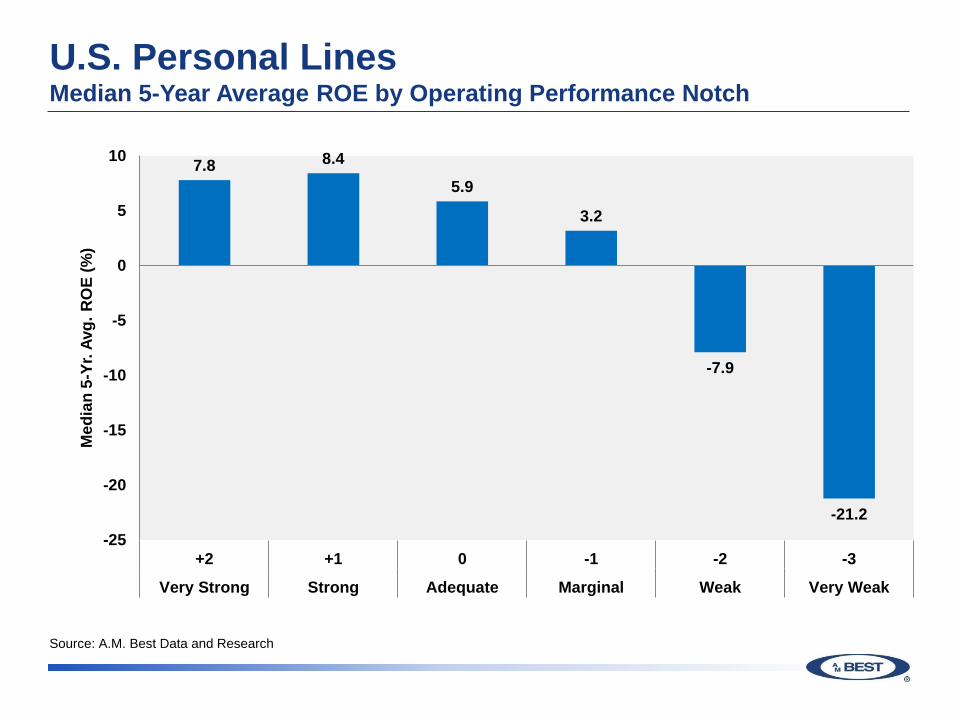
U.S. Personal Lines Median 5-Year Average ROE by Operating Performance Notch
109
Source: A.M. Best Data and Research
7.8 8.4
5.9
3.2
-7.9
-21.2 -25
-20
-15
-10
-5
0
5
10
+2 +1 0 -1 -2 -3
Very Strong Strong Adequate Marginal Weak Very Weak
Med
ian
5-Yr
. Avg
. RO
E (%
)

U.S. Commercial Lines Median 5-Year Average ROE by Operating Performance Notch
110
Source: A.M. Best Data and Research
16.7
10.4
7.3
1.3
-1.9
-5
0
5
10
15
20
+2 +1 0 -1 -2
Very Strong Strong Adequate Marginal Weak
Med
ian
5-Yr
. Avg
. RO
E (%
)

An Updated BCRM: Building Blocks
Business Profile Components
• Market Position • Management Quality
• Pricing Sophistication & Data Quality • Regulatory, Event, and Country Risks
• Product Risk • Distribution Channels
• Degree of Competition • Product/Geographic Concentration
Balance Sheet Strength
Baseline
Published Issuer Credit Rating
Rating Lift/Drag
Operating Performance
(+2/-3)
Enterprise Risk Management
(+1/-4)
Comprehensive Adjustment
(+1/-1)
Country Risk
Business Profile
(+2/-2)

U.S. Property/Casualty Business Profile Notch Distribution
112
Source: A.M. Best Data and Research
Very Favorable +2 0.7% Favorable +1
7.6%
Neutral 0 37.6%
Limited -1 50.4%
Very Limited -2 3.6%

U.S. Property/Casualty Business Profile Notch by Long-Term Issuer Credit Rating
113
7 12 5 11
37
69 76
83 83
17 15
48
79
59
28 21
10 5
33
67
85
45
10
67
17
0
10
20
30
40
50
60
70
80
90
100
aaa aa+ aa aa- a+ a a- bbb+ bbb bbb-
(%)
Very Favorable +2 Favorable +1 Neutral 0 Limited -1 Very Limited -2
Source: A.M. Best Data and Research
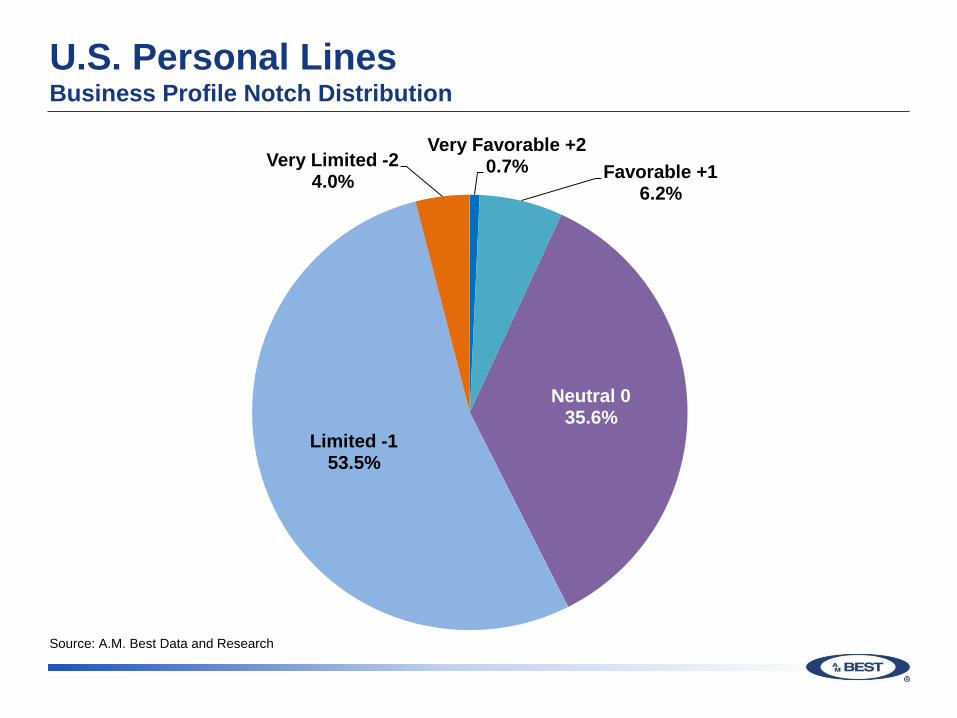
U.S. Personal Lines Business Profile Notch Distribution
114
Source: A.M. Best Data and Research
Very Favorable +2 0.7% Favorable +1
6.2%
Neutral 0 35.6%
Limited -1 53.5%
Very Limited -2 4.0%

U.S. Commercial Lines Business Profile Notch Distribution
115
Source: A.M. Best Data and Research
Very Favorable +2 0.3% Favorable +1
8.9%
Neutral 0 39.2%
Limited -1 48.3%
Very Limited -2 3.4%
An Updated BCRM: Building Blocks
Enterprise Risk Management Framework Components
• Risk Identification and Reporting • Governance and Risk Culture
• Risk Management and Controls • Stress Testing
• Risk Appetite and Tolerances
Balance Sheet Strength
Baseline
Published Issuer Credit Rating
Rating Lift/Drag
Operating Performance
(+2/-3)
Comprehensive Adjustment
(+1/-1)
Country Risk
Business Profile
(+2/-2)
Enterprise Risk Management
(+1/-4)
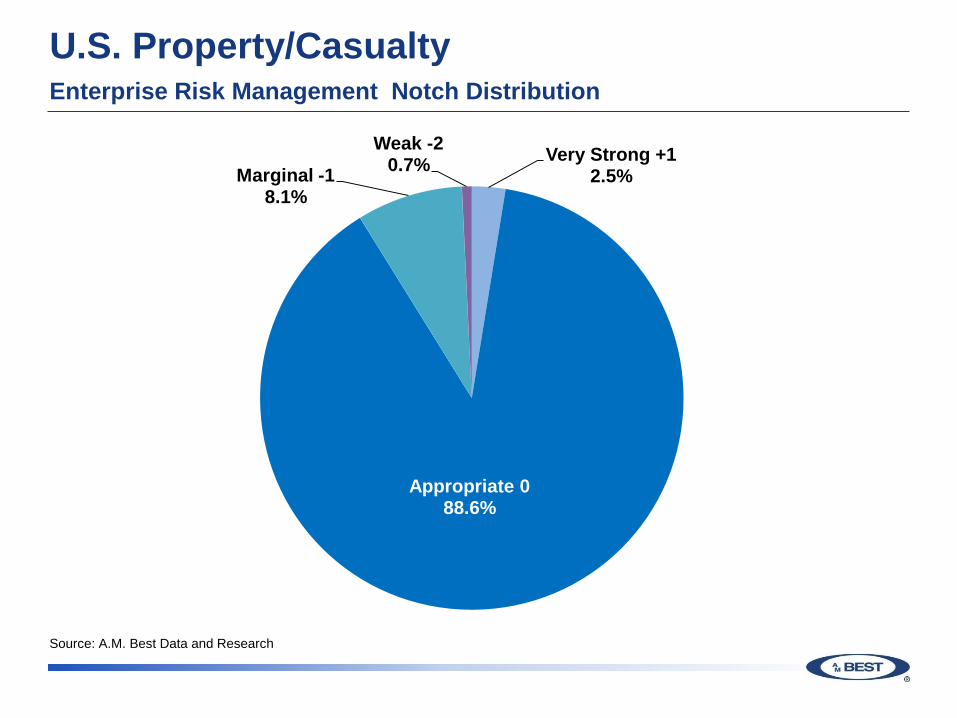
U.S. Property/Casualty Enterprise Risk Management Notch Distribution
117
Source: A.M. Best Data and Research
Very Strong +1 2.5%
Appropriate 0 88.6%
Marginal -1 8.1%
Weak -2 0.7%
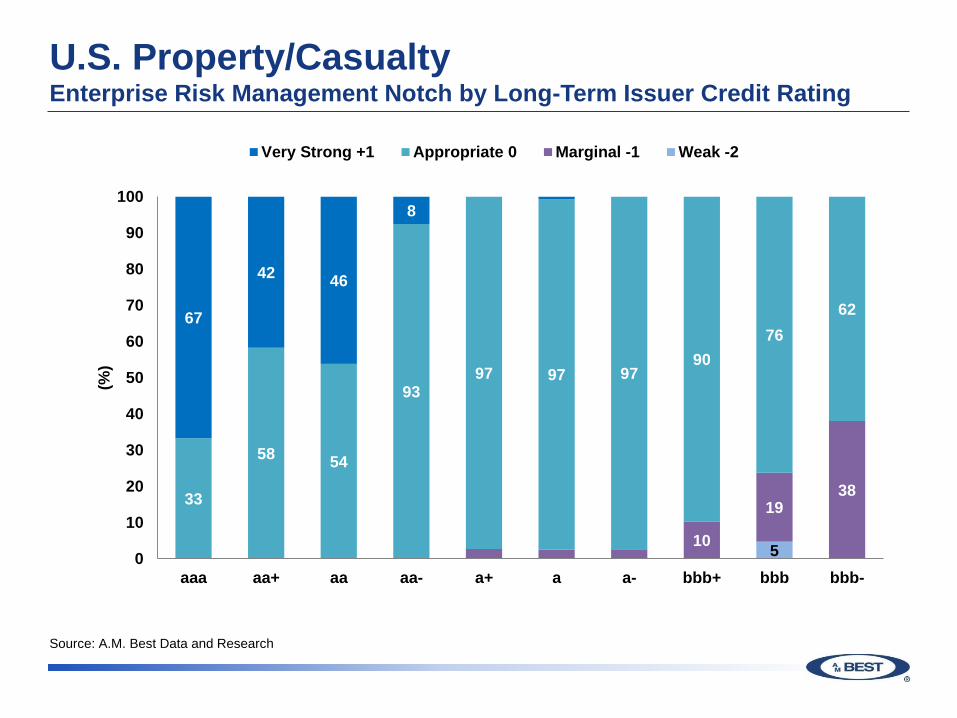
U.S. Property/Casualty Enterprise Risk Management Notch by Long-Term Issuer Credit Rating
118
5 10
19 38 33
58 54
93 97 97 97
90 76
62 67
42 46
8
0
10
20
30
40
50
60
70
80
90
100
aaa aa+ aa aa- a+ a a- bbb+ bbb bbb-
(%)
Very Strong +1 Appropriate 0 Marginal -1 Weak -2
Source: A.M. Best Data and Research
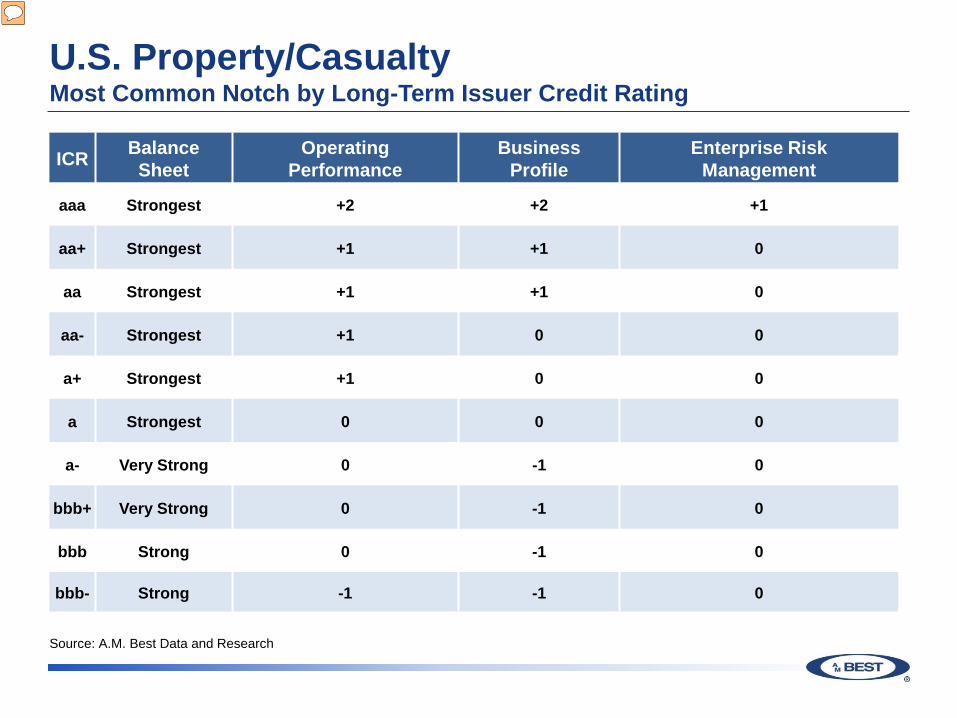
U.S. Property/Casualty Most Common Notch by Long-Term Issuer Credit Rating
119
ICR Balance Sheet
Operating Performance
Business Profile
Enterprise Risk Management
aaa Strongest +2 +2 +1
aa+ Strongest +1 +1 0
aa Strongest +1 +1 0
aa- Strongest +1 0 0
a+ Strongest +1 0 0
a Strongest 0 0 0
a- Very Strong 0 -1 0
bbb+ Very Strong 0 -1 0
bbb Strong 0 -1 0
bbb- Strong -1 -1 0
Source: A.M. Best Data and Research

U.S. Property/Casualty Long-Term Issuer Credit Rating and Outlook Distribution
120
Exceptional & Superior
11.1%
Excellent 67.8%
Good 16.8%
Fair & Below 4.2%
Stable 80.4%
Positive 7.1%
Negative 11.1%
Under Review
1.4%
ICR Distribution Outlook Distribution
The ICR rating and outlook distributions are as of October 2, 2017.
Source: A.M. Best Data and Research

Ken Johnson, CFA, CAIA, FRM Senior Director
Edward Kohlberg, CPA, FLMI, CLU Associate Director
U.S. Life/Annuity Benchmarking
Agenda
Discuss Building Block Approach
Review of the Rating Drivers in A. M. Best’s New Methodology
122

Balance Sheet Strength
Baseline
Published Issuer Credit Rating
Rating Lift/Drag
Operating Performance
(+2/-3)
Business Profile
(+2/-2)
Enterprise Risk Management
(+1/-4)
Comprehensive Adjustment
(+1/-1)
An Updated BCRM: Building Blocks
Country Risk
Maximum +2
123
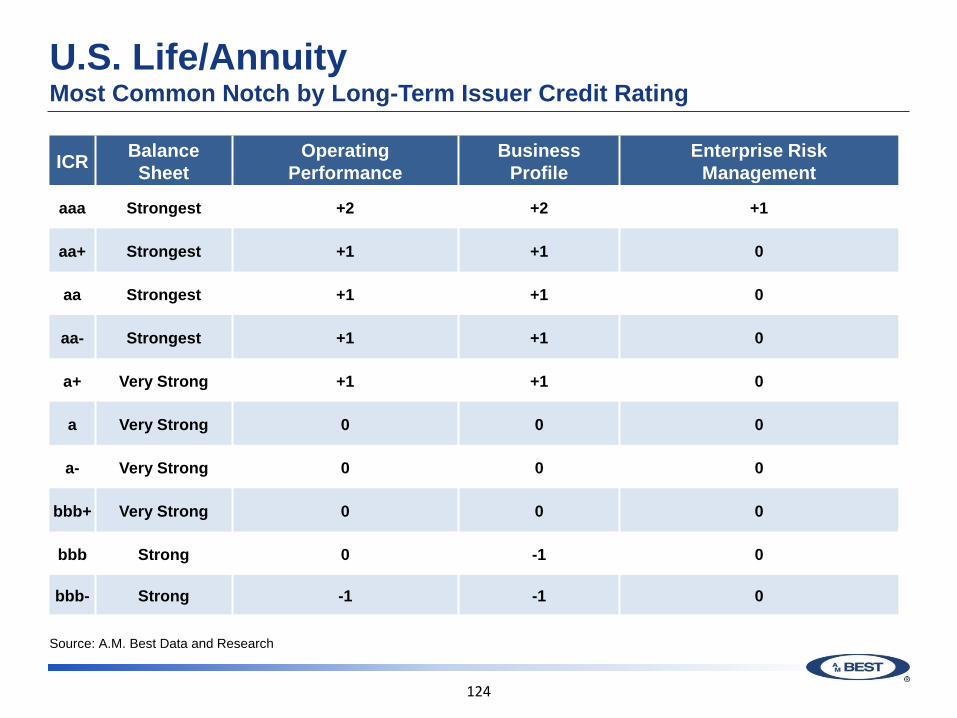
U.S. Life/Annuity Most Common Notch by Long-Term Issuer Credit Rating
ICR Balance Sheet
Operating Performance
Business Profile
Enterprise Risk Management
aaa Strongest +2 +2 +1
aa+ Strongest +1 +1 0
aa Strongest +1 +1 0
aa- Strongest +1 +1 0
a+ Very Strong +1 +1 0
a Very Strong 0 0 0
a- Very Strong 0 0 0
bbb+ Very Strong 0 0 0
bbb Strong 0 -1 0
bbb- Strong -1 -1 0
Source: A.M. Best Data and Research
124
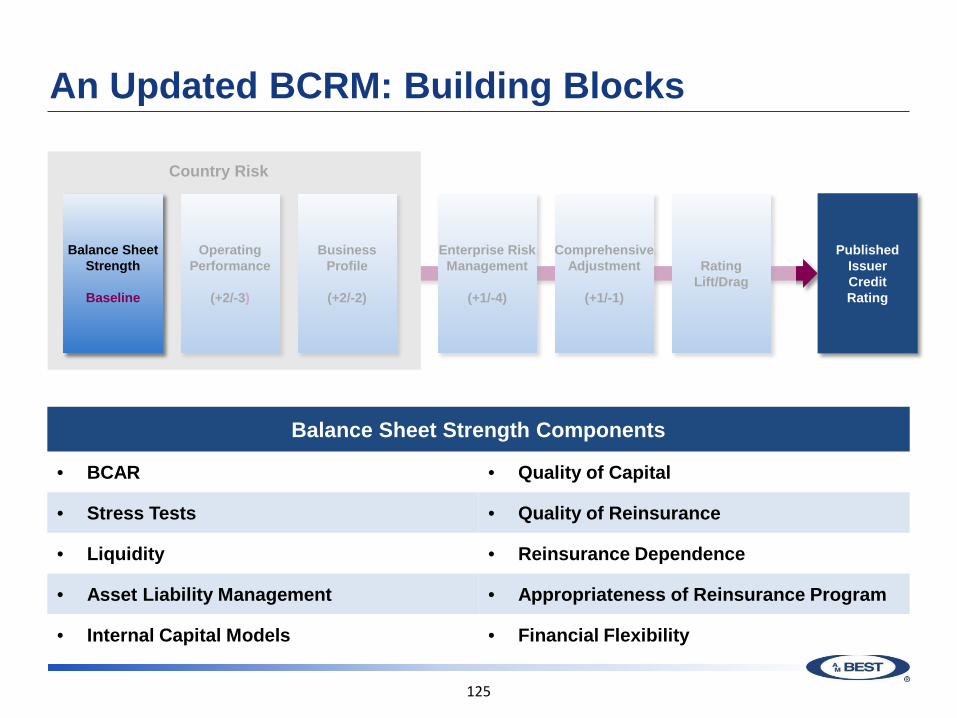
An Updated BCRM: Building Blocks
Balance Sheet Strength
Baseline
Published Issuer Credit Rating
Rating Lift/Drag
Comprehensive Adjustment
(+1/-1)
Country Risk
Balance Sheet Strength Components
• BCAR • Quality of Capital
• Stress Tests • Quality of Reinsurance
• Liquidity • Reinsurance Dependence
• Asset Liability Management • Appropriateness of Reinsurance Program
• Internal Capital Models • Financial Flexibility
Enterprise Risk Management
(+1/-4)
Business Profile
(+2/-2)
Operating Performance
(+2/-3)
Balance Sheet Strength
Baseline
125

U.S. Life/Annuity Balance Sheet Strength Distribution
Strongest 21.9%
Very Strong 33.9%
Strong 25.4%
Adequate 15.2%
Weak 3.1%
Very Weak 0.4%
Source: A.M. Best Data and Research
126

U.S. Life/Annuity Median BCAR Score by Balance Sheet Strength
-40
-30
-20
-10
0
10
20
30
40
50
60
70
VaR 95% VaR 99% VaR 99.5% VaR 99.6% VaR 99.8%
Med
ian
BC
AR S
core
Strongest Very Strong Strong Adequate Weak
Source: A.M. Best Data and Research
127

U.S. Life/Annuity Balance Sheet Strength by Long-Term Issuer Credit Rating
11 13
33
8 9 4 10
33
33 30
11
27
13
32
22
33 39
20
38
45
54
42
33
22 17
100
80 67
43
18 29
16 11
0
10
20
30
40
50
60
70
80
90
100
aaa aa+ aa aa- a+ a a- bbb+ bbb bbb-
(%)
Strongest Very Strong Strong Adequate Weak
Source: A.M. Best Data and Research
128

An Updated BCRM: Building Blocks
Balance Sheet Strength
Baseline
Published Issuer Credit Rating
Rating Lift/Drag
Comprehensive Adjustment
(+1/-1)
Country Risk
Operating Performance Components
• Change in NPW • Net Yield
• Change in Total Reserves • Pre-Tax Total Return
• Financial Forecasts/Plans • Pre-Tax Operating ROR
• NOG to Total Assets • Operating ROE
Enterprise Risk Management
(+1/-4)
Business Profile
(+2/-2)
Operating Performance
(+2/-3)
129

U.S. Life/Annuity Operating Performance Notch Distribution
Very Strong +2 4.0%
Strong +1 28.6%
Adequate 0 45.5%
Marginal -1 20.1%
Weak -2 1.8%
Source: A.M. Best Data and Research
130

U.S. Life/Annuity Operating Performance Notch by Long-Term Issuer Credit Rating
9 14 8 23
33
11
39
20 22
41
71 60
56
67
35
25
60 100
68
41
17 15 11
22 17
75
20 8
0
10
20
30
40
50
60
70
80
90
100
aaa aa+ aa aa- a+ a a- bbb+ bbb bbb-
(%)
Very Strong +2 Strong +1 Adequate 0 Marginal -1 Weak -2
Source: A.M. Best Data and Research
131

U.S. Life/Annuity Median 5-Year Average ROE by Operating Performance Notch
20.0
11.5
6.3
3.1
5.4
0
5
10
15
20
25
+2 +1 0 -1 -2
Very Strong Strong Adequate Marginal Weak
Med
ian
5-Yr
. Avg
. RO
E (%
)
Source: A.M. Best Data and Research
132

An Updated BCRM: Building Blocks
Business Profile Components
• Market Position • Management Quality
• Pricing Sophistication & Data Quality • Regulatory, Event, and Country Risks
• Product Risk • Distribution Channels
• Degree of Competition • Product/Geographic Concentration
Balance Sheet Strength
Baseline
Published Issuer Credit Rating
Rating Lift/Drag
Operating Performance
(+2/-3)
Enterprise Risk Management
(+1/-4)
Comprehensive Adjustment
(+1/-1)
Country Risk
Business Profile
(+2/-2)
133

U.S. Life/Annuity Business Profile Notch Distribution
Very Favorable +2
1.8%
Favorable +1 19.6%
Neutral 0 43.3%
Limited -1 31.7%
Very Limited -2 3.6%
Source: A.M. Best Data and Research
134

U.S. Life/Annuity Business Profile Notch by Long-Term Issuer Credit Rating
5 6 11 13 20 18
25
39 39
56 52
20
24
41
71
55 56
33 35
25
60
100
70
41
75
0
10
20
30
40
50
60
70
80
90
100
aaa aa+ aa aa- a+ a a- bbb+ bbb bbb-
(%)
Very Favorable +2 Favorable +1 Neutral 0 Limited -1 Very Limited -2
Source: A.M. Best Data and Research
135

An Updated BCRM: Building Blocks
Enterprise Risk Management Framework Components
• Risk Identification and Reporting • Governance and Risk Culture
• Risk Management and Controls • Stress Testing
• Risk Appetite and Tolerances
Balance Sheet Strength
Baseline
Published Issuer Credit Rating
Rating Lift/Drag
Operating Performance
(+2/-3)
Comprehensive Adjustment
(+1/-1)
Country Risk
Business Profile
(+2/-2)
Enterprise Risk Management
(+1/-4)
136

U.S. Life/Annuity Enterprise Risk Management Notch Distribution
Very Strong +1 8.0%
Appropriate 0 76.3%
Marginal -1 13.4%
Weak -2 2.2%
Source: A.M. Best Data and Research
137
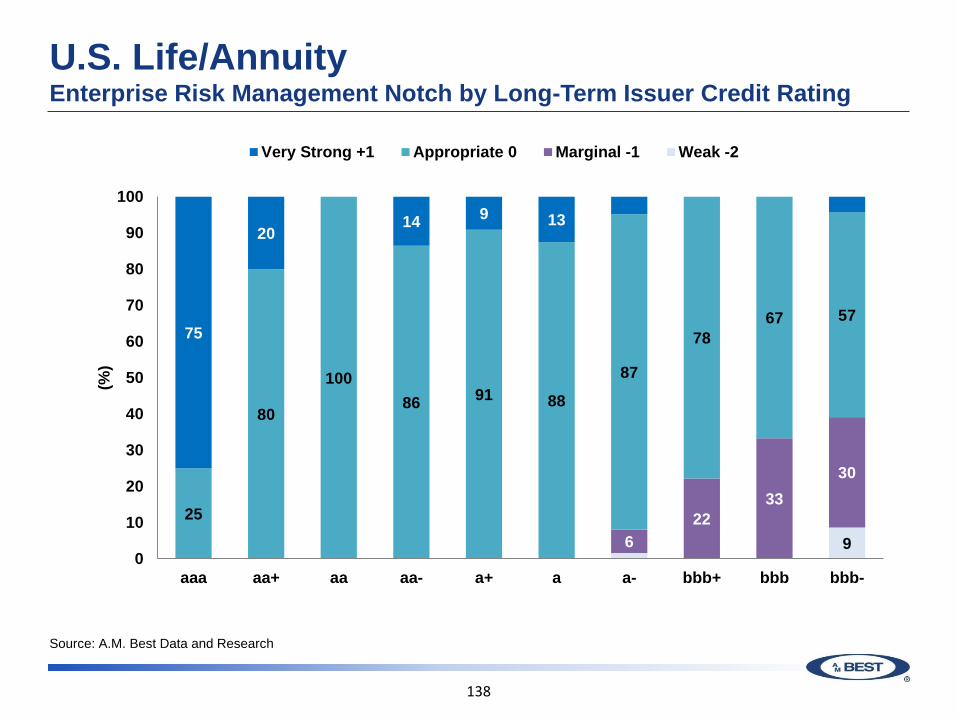
U.S. Life/Annuity Enterprise Risk Management Notch by Long-Term Issuer Credit Rating
9 6 22
33 30
25
80
100 86 91 88
87
78 67 57
75
20 14 9 13
0
10
20
30
40
50
60
70
80
90
100
aaa aa+ aa aa- a+ a a- bbb+ bbb bbb-
(%)
Very Strong +1 Appropriate 0 Marginal -1 Weak -2
Source: A.M. Best Data and Research
138
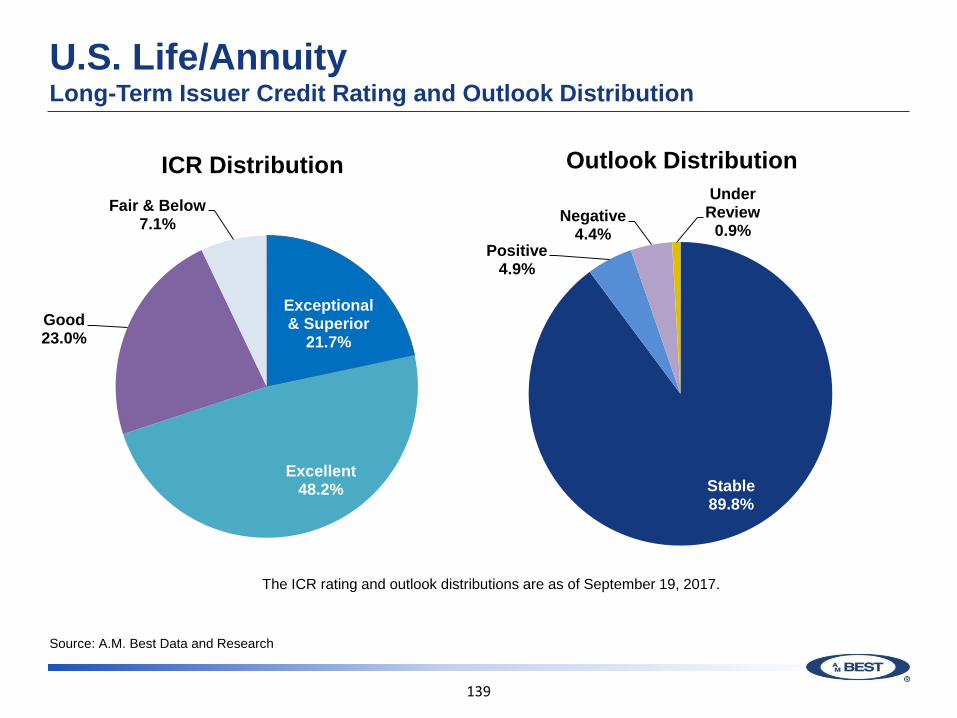
U.S. Life/Annuity Long-Term Issuer Credit Rating and Outlook Distribution
Exceptional & Superior
21.7%
Excellent 48.2%
Good 23.0%
Fair & Below 7.1%
Stable 89.8%
Positive 4.9%
Negative 4.4%
Under Review
0.9%
ICR Distribution Outlook Distribution
The ICR rating and outlook distributions are as of September 19, 2017.
Source: A.M. Best Data and Research
139
Sally Rosen, Senior Director
U.S. Health Industry

Agenda
141
Review of the Rating Drivers in A.M. Best’s New Methodology
Discuss Building Block Approach
Next Steps Towards the Final Release of the New Methodology

U.S. Health Most Common Notch by Long-Term Issuer Credit Rating
Canadian Life Ins - Insurance Market Briefing Canada September 6, 2017 142
ICR Balance Sheet
Operating Performance
Business Profile
Enterprise Risk Management
aa- Strongest +1 0 0
a+ Very Strong +1 0 0
a Strongest 0 0 0
a- Strongest 0 0 0
bbb+ Very Strong -1 -1 0
bbb Very Strong 0 -1 0
bbb- Adequate 0 -1 0
Source: A.M. Best Data and Research

An Updated BCRM: Building Blocks
143
Balance Sheet Strength
Baseline
Published Issuer Credit Rating
Rating Lift/Drag
Comprehensive Adjustment
(+1/-1)
Country Risk
Balance Sheet Strength Components
• BCAR • Quality of Capital Stress
• Tests • Quality of Reinsurance
• Liquidity • Reinsurance Dependence
• Asset Liability Management • Appropriateness of Reinsurance Program
• Internal Capital Models • Distribution Channels
Enterprise Risk Management
(+1/-4)
Business Profile
(+2/-2)
Operating Performance
(+2/-3)
Balance Sheet Strength
Baseline

U.S. Health Balance Sheet Strength Distribution
Canadian Life Ins - Insurance Market Briefing Canada September 6, 2017 144
Strongest 35.3%
Very Strong 25.9%
Strong 15.5%
Adequate 15.5%
Weak 4.3%
Very Weak 3.4%
Source: A.M. Best Data and Research
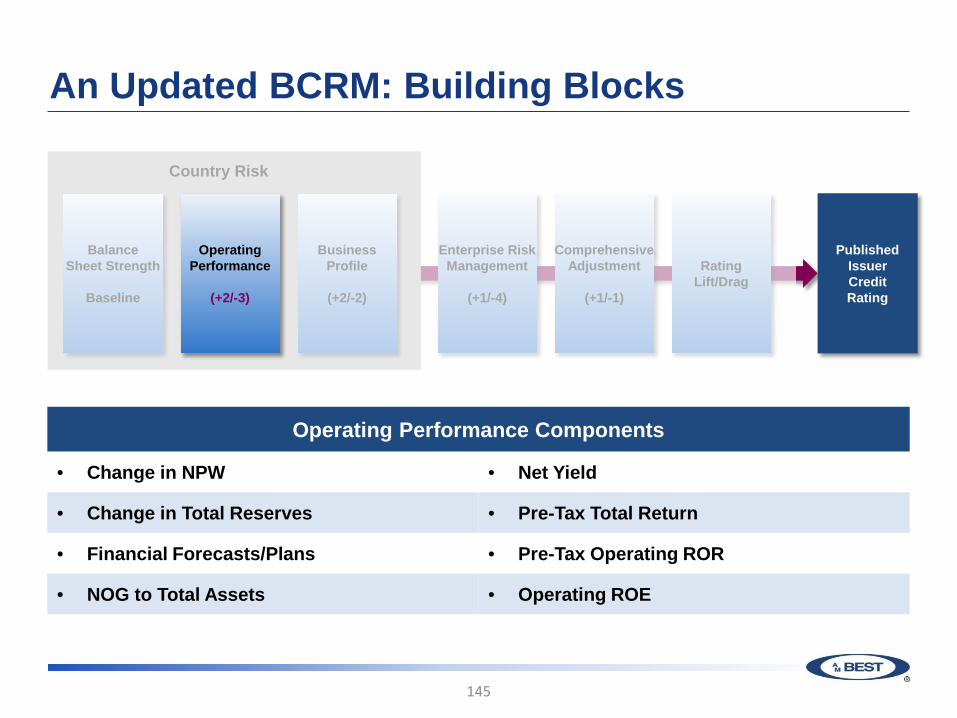
An Updated BCRM: Building Blocks
145
Balance Sheet Strength
Baseline
Published Issuer Credit Rating
Rating Lift/Drag
Comprehensive Adjustment
(+1/-1)
Country Risk
Operating Performance Components
• Change in NPW • Net Yield
• Change in Total Reserves • Pre-Tax Total Return
• Financial Forecasts/Plans • Pre-Tax Operating ROR
• NOG to Total Assets • Operating ROE
Enterprise Risk Management
(+1/-4)
Business Profile
(+2/-2)
Operating Performance
(+2/-3)

U.S. Health Operating Performance Notch Distribution
Canadian Life Ins - Insurance Market Briefing Canada September 6, 2017 146
Source: A.M. Best Data and Research
Strong +1 15.5%
Adequate 0 57.8%
Marginal -1 24.1%
Weak -2 2.6%

U.S. Health Median 5-Year Average ROR by Operating Performance Notch
Canadian Life Ins - Insurance Market Briefing Canada September 6, 2017 147
Source: A.M. Best Data and Research
4.9 2.7
-0.2
-30.3 -35
-30
-25
-20
-15
-10
-5
0
5
10
+1 0 -1 -2
Strong Adequate Marginal Weak
Med
ian
5-Yr
. Avg
. RO
R (%
)

An Updated BCRM: Building Blocks
148
Business Profile Components
• Market Position • Management Quality
• Pricing Sophistication & Data Quality • Regulatory, Event, and Country Risks
• Product Risk • Distribution Channels
• Degree of Competition • Product/Geographic Concentration
Balance Sheet Strength
Baseline
Published Issuer Credit Rating
Rating Lift/Drag
Operating Performance
(+2/-3)
Enterprise Risk Management
(+1/-4)
Comprehensive Adjustment
(+1/-1)
Country Risk
Business Profile
(+2/-2)

U.S. Health Business Profile Notch Distribution
Canadian Life Ins - Insurance Market Briefing Canada September 6, 2017 149
Source: A.M. Best Data and Research
Very Favorable +2 0.9%
Favorable +1 8.6%
Neutral 0 41.4%
Limited -1 44.8%
Very Limited -2 4.3%

An Updated BCRM: Building Blocks
150
Enterprise Risk Management Framework Components
• Risk Identification and Reporting • Governance and Risk Culture
• Risk Management and Controls • Stress Testing
• Risk Appetite and Tolerances
Balance Sheet Strength
Baseline
Published Issuer Credit Rating
Rating Lift/Drag
Operating Performance
(+2/-3)
Comprehensive Adjustment
(+1/-1)
Country Risk
Business Profile
(+2/-2)
Enterprise Risk Management
(+1/-4)

U.S. Health Enterprise Risk Management Notch Distribution
Canadian Life Ins - Insurance Market Briefing Canada September 6, 2017 151
Source: A.M. Best Data and Research
Appropriate 0 87.9%
Marginal -1 12.1%

U.S. Health Long-Term Issuer Credit Rating and Outlook Distribution
Canadian Life Ins - Insurance Market Briefing Canada September 6, 2017 152
Exceptional & Superior
5.0%
Excellent 57.1%
Good 28.6%
Fair & Below 9.2%
Stable 85.7%
Positive 8.4%
Negative 4.2%
Under Review
1.7%
ICR Distribution Outlook Distribution
The ICR rating and outlook distributions are as of October 5, 2017.
Source: A.M. Best Data and Research

153
Q & A
154
Thank You
© AM Best Company, Inc. (AMB) and/or its licensors and affiliates. All rights reserved. ALL INFORMATION CONTAINED HEREIN IS PROTECTED BY COPYRIGHT LAW AND NONE OF SUCH INFORMATION MAY BE COPIED OR OTHERWISE REPRODUCED, REPACKAGED, FURTHER TRANSMITTED, TRANSFERRED, DISSEMINATED, REDISTRIBUTED OR RESOLD, OR STORED FOR SUBSEQUENT USE FOR ANY SUCH PURPOSE, IN WHOLE OR IN PART, IN ANY FORM OR MANNER OR BY ANY MEANS WHATSOEVER, BY ANY PERSON WITHOUT AMB’s PRIOR WRITTEN CONSENT. All information contained herein is obtained by AMB from sources believed by it to be accurate and reliable. AMB does not audit or otherwise independently verify the accuracy or reliability of information received or otherwise used and therefore all information contained herein is provided “AS IS” without warranty of any kind. Under no circumstances shall AMB have any liability to any person or entity for (a) any loss or damage in whole or in part caused by, resulting from, or relating to, any error (negligent or otherwise) or other circumstance or contingency within or outside the control of AMB or any of its directors, officers, employees or agents in connection with the procurement, collection, compilation, analysis, interpretation, communication, publication or delivery of any such information, or (b) any direct, indirect, special, consequential, compensatory or incidental damages whatsoever (including without limitation, lost profits), even if AMB is advised in advance of the possibility of such damages, resulting from the use of or inability to use, any such information. The credit ratings, financial reporting analysis, projections, and other observations, if any, constituting part of the information contained herein are, and must be construed solely as, statements of opinion and not statements of fact or recommendations to purchase, sell or hold any securities, insurance policies, contracts or any other financial obligations, nor does it address the suitability of any particular financial obligation for a specific purpose or purchaser. Credit risk is the risk that an entity may not meet its contractual, financial obligations as they come due. Credit ratings do not address any other risk, including but not limited to, liquidity risk, market value risk or price volatility of rated securities. AMB is not an investment advisor and does not offer consulting or advisory services, nor does the company or its rating analysts offer any form of structuring or financial advice. NO WARRANTY, EXPRESS OR IMPLIED, AS TO THE ACCURACY, TIMELINESS, COMPLETENESS, MERCHANTABILITY OR FITNESS FOR ANY PARTICULAR PURPOSE OF ANY SUCH RATING OR OTHER OPINION OR INFORMATION IS GIVEN OR MADE BY AMB IN ANY FORM OR MANNER WHATSOEVER. Each credit rating or other opinion must be weighed solely as one factor in any investment or purchasing decision made by or on behalf of any user of the information contained herein, and each such user must accordingly make its own study and evaluation of each security or other financial obligation and of each issuer and guarantor of, and each provider of credit support for, each security or other financial obligation that it may consider purchasing, holding or selling.
155