Embed Size (px)
Citation preview
©2009, SIA. All rights reserved.1
Nordic Market 2009.10
Kelly Davis – [email protected]
CCSAA Conference April 7, 2010
Oregon

©2009, SIA. All rights reserved.
The Economy OverallRecession is Over But Lack of Jobs Will Prolong Recovery Period
• Unemployment in January and February stabilizing in snow sports demographic at 5.1% in January and 5% in February 2010.
• All retail sectors’ sales up 3.9% compared with February 2009 • Snow Sports Up 3% (Season to Date Aug to February)
– Clothing Retailers flat .3%– Department Stores down .5%– Sporting Goods up 2.3%
• Consumer confidence took a dive after 3 months of gains in February from 56.5 in January to 46 in February (scale is 0 to 100) representing a 27 year low. The Conference Board blames the decrease on extreme pessimism about income prospects,
• Labor productivity over all non-farm business sectors up 6.9% in Q4 2009. The gain reflects a 7.6% increase in output partially offset by a .6% increase in hours worked.
• Manufactured goods new orders increased 3% in January but shipments of durable goods fell off by .2% after four consecutive monthly increases
• Stocks are gaining value but have not yet recovered all losses suffered since Fall 2007. The recession is over but recovery could take up to three years
Sources: Bureau of Labor Statistics Unemployment Situation, employment by educational attainment, March 2010 – Not Seasonally Adjusted. U.S. Census Bureau – Retail Trade and Food Services Sales Assessment Not Seasonally Adjusted, February 2010, Conference Board Consumer Confidence survey March 2010, BLS Labor, Productivity and Costs Q4 2009, Manufacturing Orders, Shipments, and Inventories March 2010.
©2009, SIA. All rights reserved.
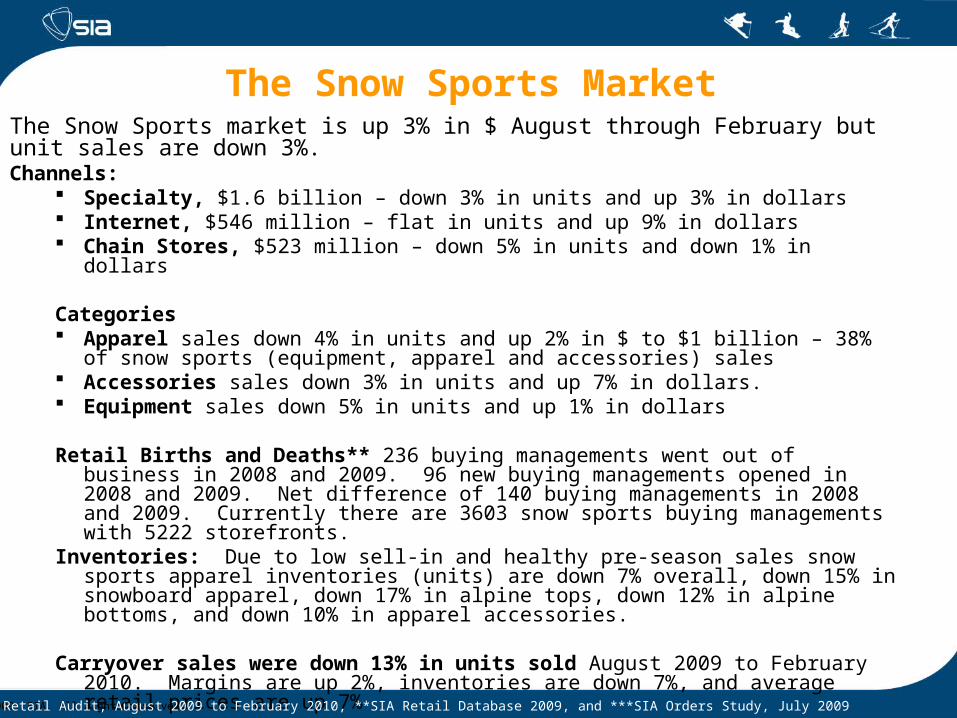
The Snow Sports MarketThe Snow Sports market is up 3% in $ August through February but unit sales are down 3%. Channels:
Specialty, $1.6 billion – down 3% in units and up 3% in dollars Internet, $546 million – flat in units and up 9% in dollars Chain Stores, $523 million – down 5% in units and down 1% in dollars
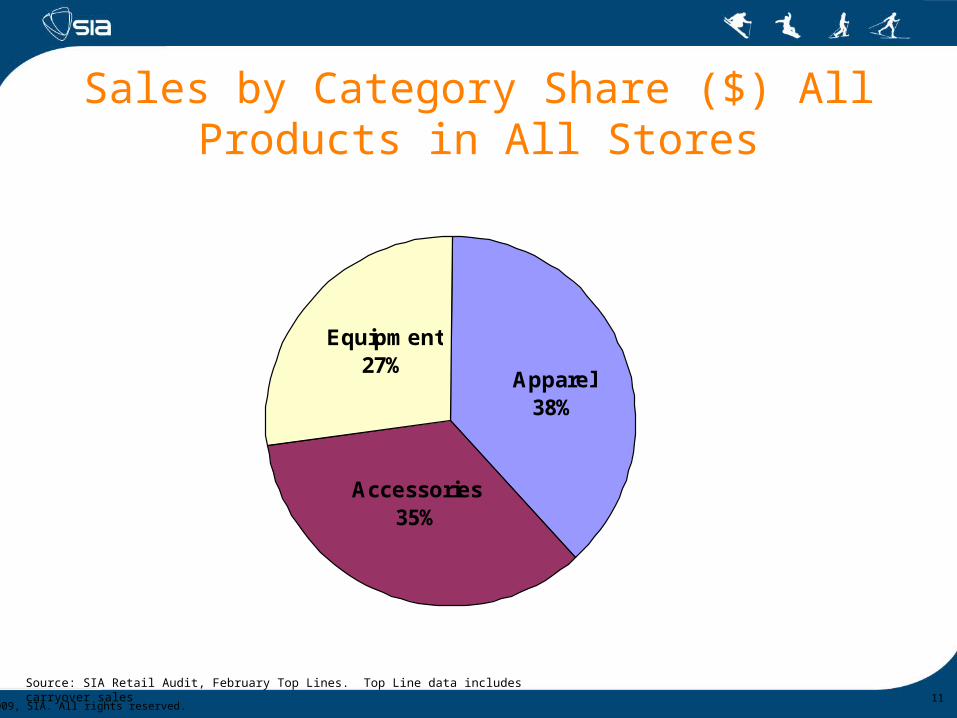
Categories Apparel sales down 4% in units and up 2% in $ to $1 billion – 38% of snow sports
(equipment, apparel and accessories) sales Accessories sales down 3% in units and up 7% in dollars. Equipment sales down 5% in units and up 1% in dollars
Retail Births and Deaths** 236 buying managements went out of business in 2008 and 2009. 96 new buying managements opened in 2008 and 2009. Net difference of 140 buying managements in 2008 and 2009. Currently there are 3603 snow sports buying managements with 5222 storefronts.
Inventories: Due to low sell-in and healthy pre-season sales snow sports apparel inventories (units) are down 7% overall, down 15% in snowboard apparel, down 17% in alpine tops, down 12% in alpine bottoms, and down 10% in apparel accessories.
Carryover sales were down 13% in units sold August 2009 to February 2010. Margins are up 2%, inventories are down 7%, and average retail prices are up 7%
Source: *SIA Retail Audit, August 2009 to February 2010, **SIA Retail Database 2009, and ***SIA Orders Study, July 2009
©2009, SIA. All rights reserved.
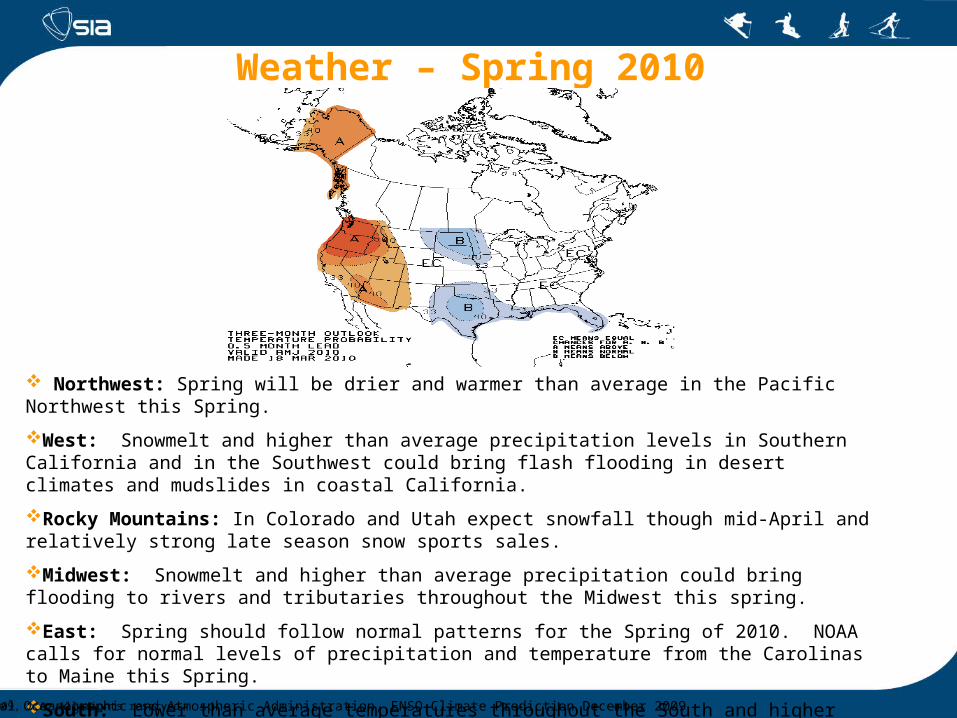
Weather – Spring 2010
Northwest: Spring will be drier and warmer than average in the Pacific Northwest this Spring.
West: Snowmelt and higher than average precipitation levels in Southern California and in the Southwest could bring flash flooding in desert climates and mudslides in coastal California.
Rocky Mountains: In Colorado and Utah expect snowfall though mid-April and relatively strong late season snow sports sales.
Midwest: Snowmelt and higher than average precipitation could bring flooding to rivers and tributaries throughout the Midwest this spring.
East: Spring should follow normal patterns for the Spring of 2010. NOAA calls for normal levels of precipitation and temperature from the Carolinas to Maine this Spring.
South: Lower than average temperatures throughout the South and higher than average precipitation levels in Texas and Florida.
National Oceanographic and Atmospheric Administration, ENSO Climate Prediction December 2009
©2009, SIA. All rights reserved.
Snow above 5000’ in the NW
©2009, SIA. All rights reserved.6
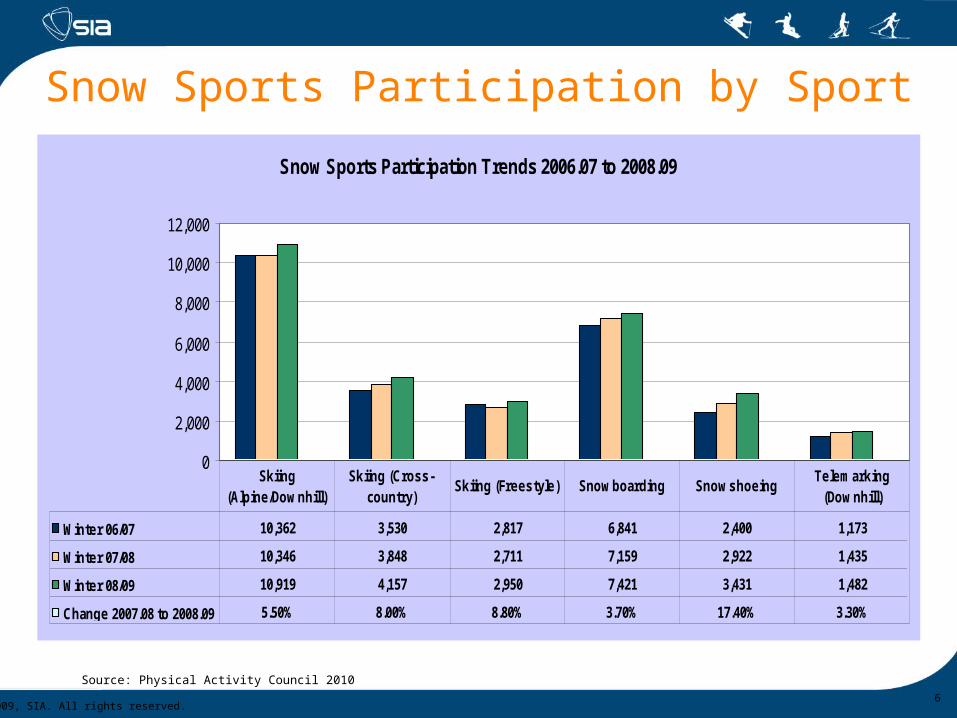
Source: Physical Activity Council 2010
Snow Sports Participation by Sport
Snow Sports Participation Trends 2006.07 to 2008.09
0
2,000
4,000
6,000
8,000
10,000
12,000
Winter 06/07 10,362 3,530 2,817 6,841 2,400 1,173
Winter 07/08 10,346 3,848 2,711 7,159 2,922 1,435
Winter 08/09 10,919 4,157 2,950 7,421 3,431 1,482
Change 2007.08 to 2008.09 5.50% 8.00% 8.80% 3.70% 17.40% 3.30%
Skiing (Alpine/Downhill)
Skiing (Cross-country)
Skiing (Freestyle) Snowboarding SnowshoeingTelemarking
(Downhill)
©2009, SIA. All rights reserved.7
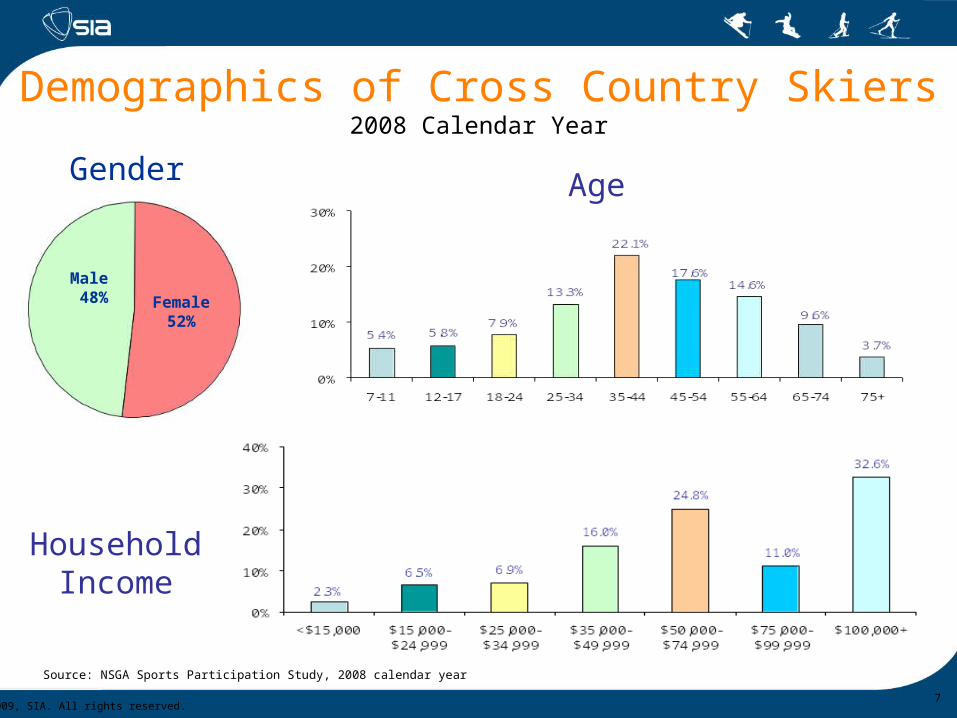
Demographics of Cross Country Skiers2008 Calendar Year
Age
Household Income
Source: NSGA Sports Participation Study, 2008 calendar year
Male 48% Female
52%
Gender
©2009, SIA. All rights reserved.8
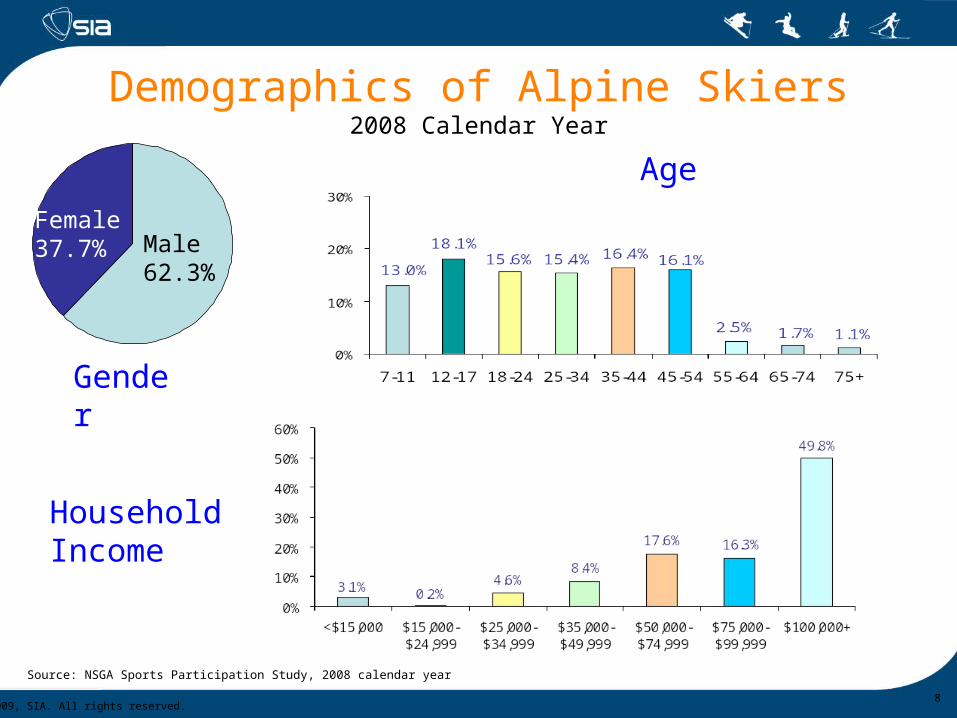
Demographics of Alpine Skiers2008 Calendar Year
Age
Household Income
Source: NSGA Sports Participation Study, 2008 calendar year
Gender
Male62.3%
Female 37.7%
©2009, SIA. All rights reserved.9
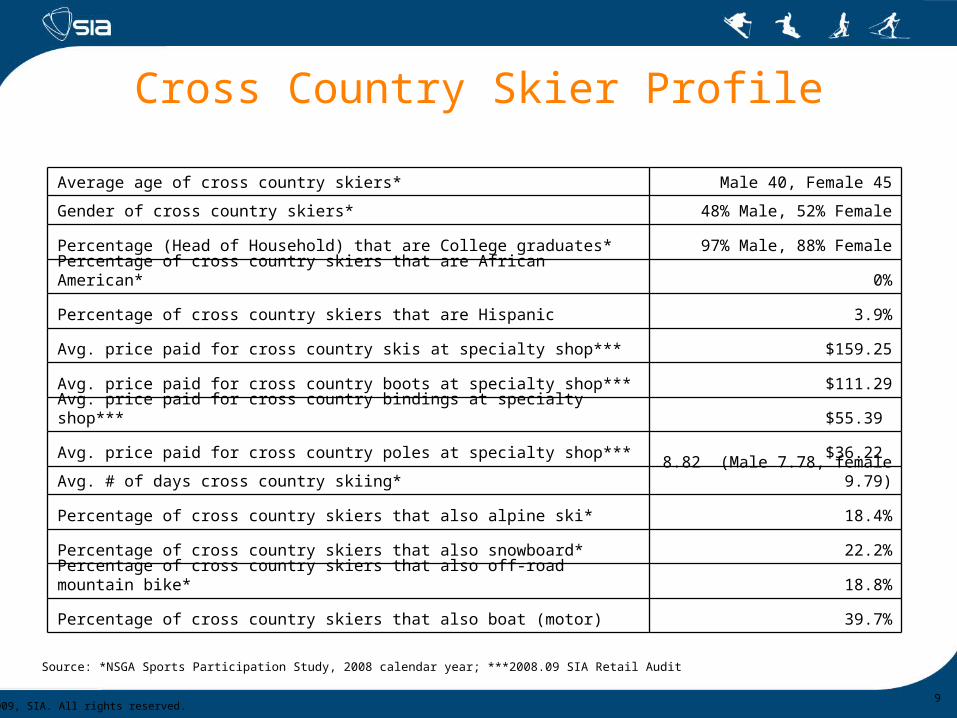
Cross Country Skier Profile
Source: *NSGA Sports Participation Study, 2008 calendar year; ***2008.09 SIA Retail Audit
Average age of cross country skiers* Male 40, Female 45
Gender of cross country skiers* 48% Male, 52% Female
Percentage (Head of Household) that are College graduates* 97% Male, 88% Female
Percentage of cross country skiers that are African American* 0%
Percentage of cross country skiers that are Hispanic 3.9%
Avg. price paid for cross country skis at specialty shop*** $159.25
Avg. price paid for cross country boots at specialty shop*** $111.29
Avg. price paid for cross country bindings at specialty shop*** $55.39
Avg. price paid for cross country poles at specialty shop*** $36.22
Avg. # of days cross country skiing* 8.82 (Male 7.78, female 9.79)
Percentage of cross country skiers that also alpine ski* 18.4%
Percentage of cross country skiers that also snowboard* 22.2%
Percentage of cross country skiers that also off-road mountain bike* 18.8%
Percentage of cross country skiers that also boat (motor) 39.7%
©2009, SIA. All rights reserved.
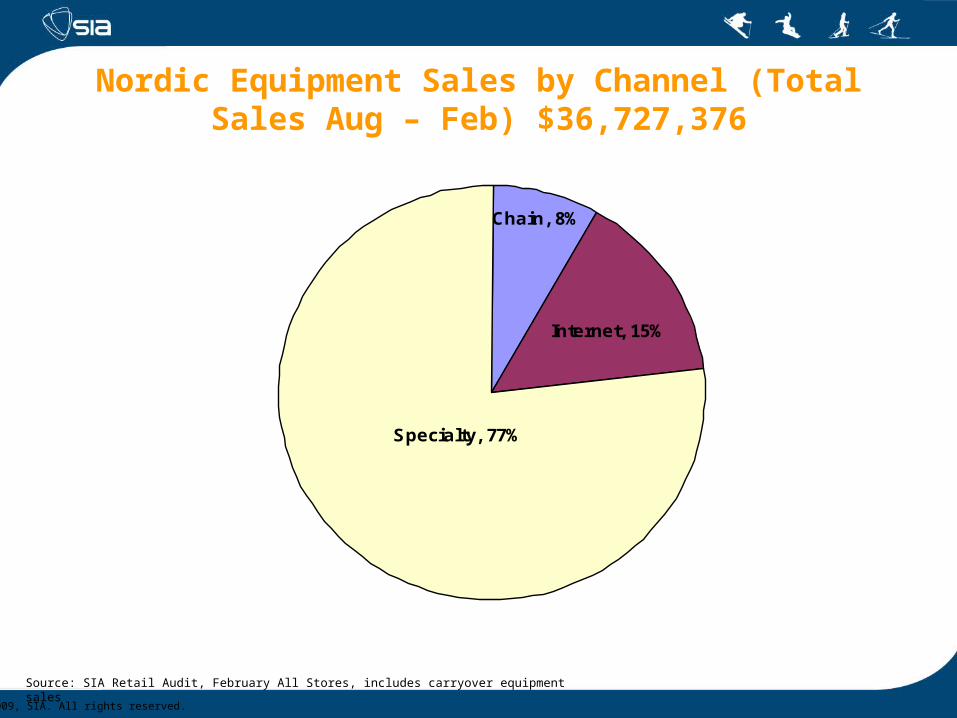
Nordic Equipment Sales by Channel (Total Sales Aug – Feb) $36,727,376
Chain, 8%
Internet, 15%
Specialty, 77%
Source: SIA Retail Audit, February All Stores, includes carryover equipment sales
©2009, SIA. All rights reserved.11
Sales by Category Share ($) All Products in All Stores
Source: SIA Retail Audit, February Top Lines. Top Line data includes carryover sales
Apparel 38%
Equipment27%
Accessories35%
©2009, SIA. All rights reserved.12
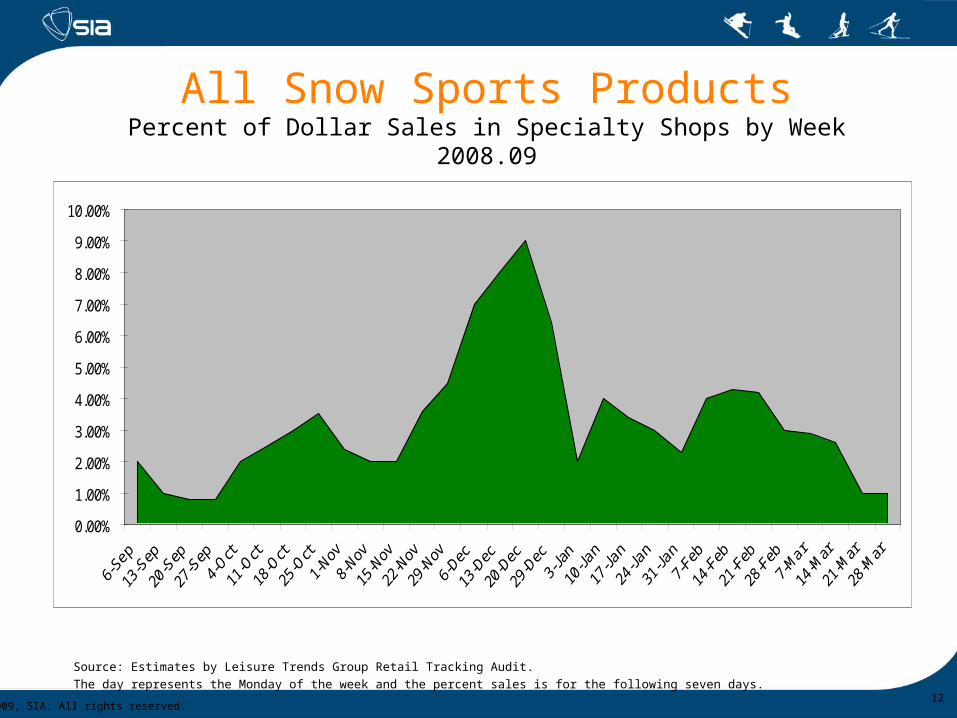
All Snow Sports ProductsPercent of Dollar Sales in Specialty Shops by Week
2008.09
Source: Estimates by Leisure Trends Group Retail Tracking Audit.
The day represents the Monday of the week and the percent sales is for the following seven days.
0.00%
1.00%
2.00%
3.00%
4.00%
5.00%
6.00%
7.00%
8.00%
9.00%
10.00%
©2009, SIA. All rights reserved.
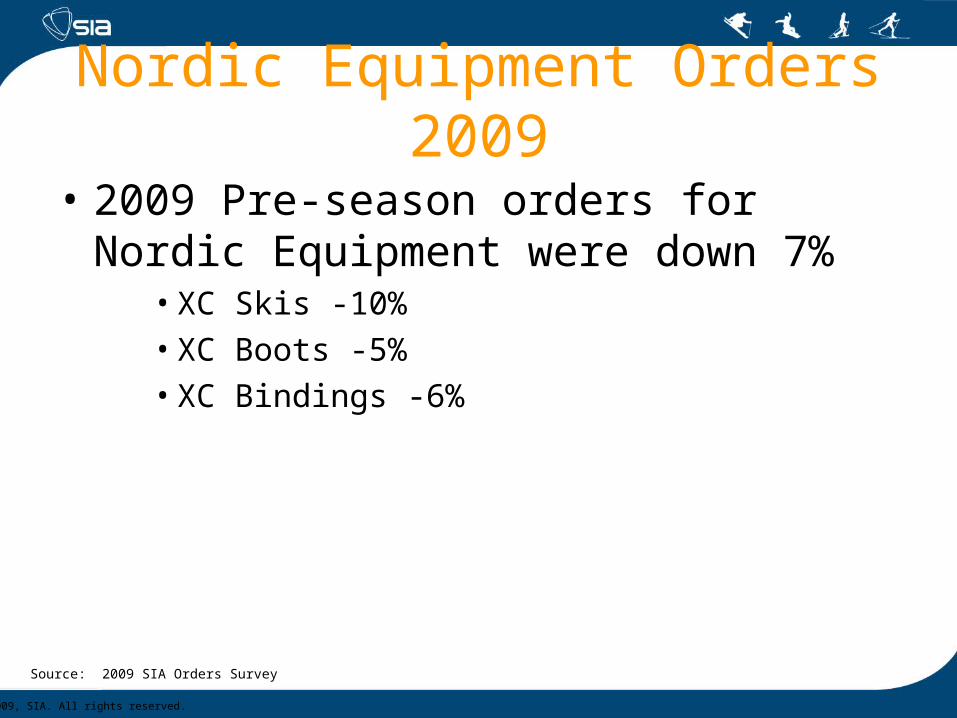
Nordic Equipment Orders 2009
• 2009 Pre-season orders for Nordic Equipment were down 7%
• XC Skis -10%• XC Boots -5%• XC Bindings -6%
Source: 2009 SIA Orders Survey
©2009, SIA. All rights reserved.14
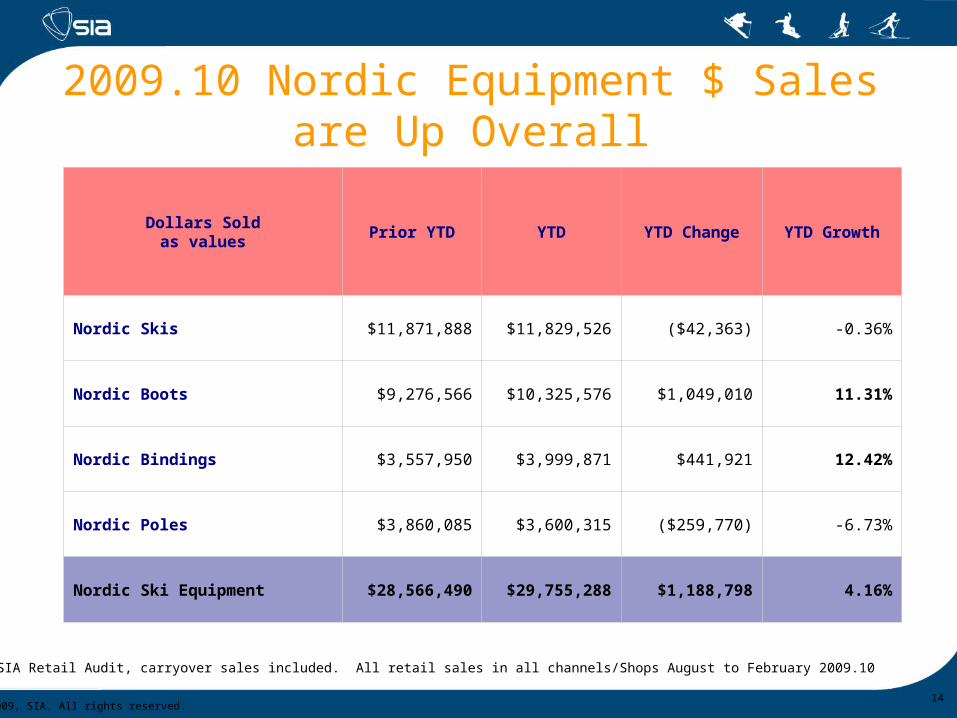
2009.10 Nordic Equipment $ Sales are Up Overall
Source: SIA Retail Audit, carryover sales included. All retail sales in all channels/Shops August to February 2009.10
Dollars Soldas values
Prior YTD YTD YTD Change YTD Growth
Nordic Skis $11,871,888 $11,829,526 ($42,363) -0.36%
Nordic Boots $9,276,566 $10,325,576 $1,049,010 11.31%
Nordic Bindings $3,557,950 $3,999,871 $441,921 12.42%
Nordic Poles $3,860,085 $3,600,315 ($259,770) -6.73%
Nordic Ski Equipment $28,566,490 $29,755,288 $1,188,798 4.16%
©2009, SIA. All rights reserved.15
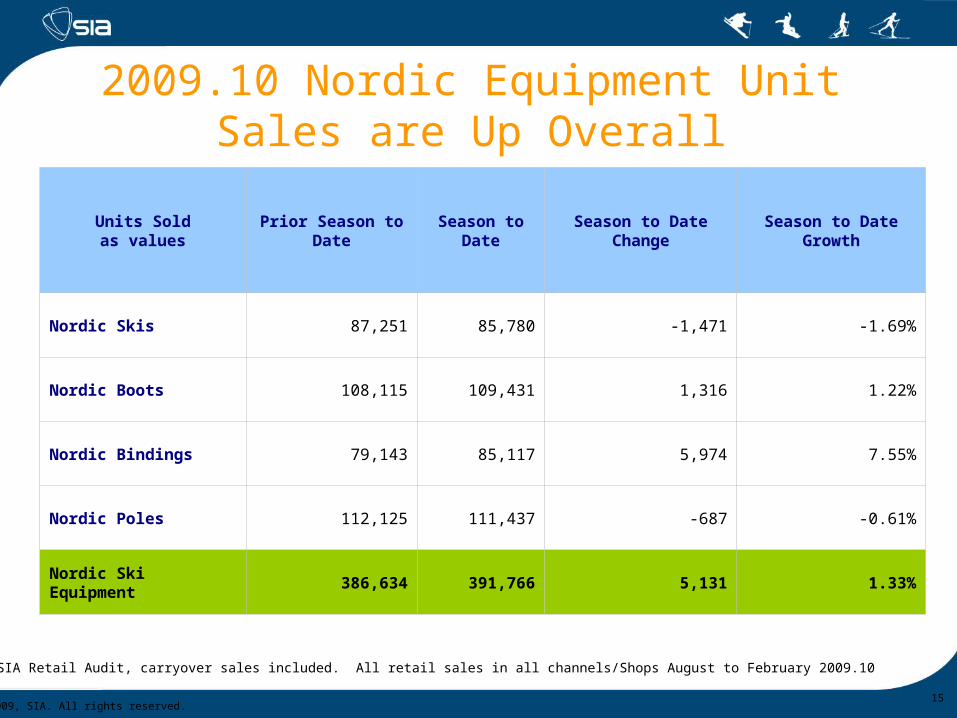
2009.10 Nordic Equipment Unit Sales are Up Overall
Source: SIA Retail Audit, carryover sales included. All retail sales in all channels/Shops August to February 2009.10
Units Soldas values
Prior Season to Date
Season to Date
Season to Date Change
Season to Date Growth
Nordic Skis 87,251 85,780 -1,471 -1.69%
Nordic Boots 108,115 109,431 1,316 1.22%
Nordic Bindings 79,143 85,117 5,974 7.55%
Nordic Poles 112,125 111,437 -687 -0.61%
Nordic Ski Equipment 386,634 391,766 5,131 1.33%
©2009, SIA. All rights reserved.
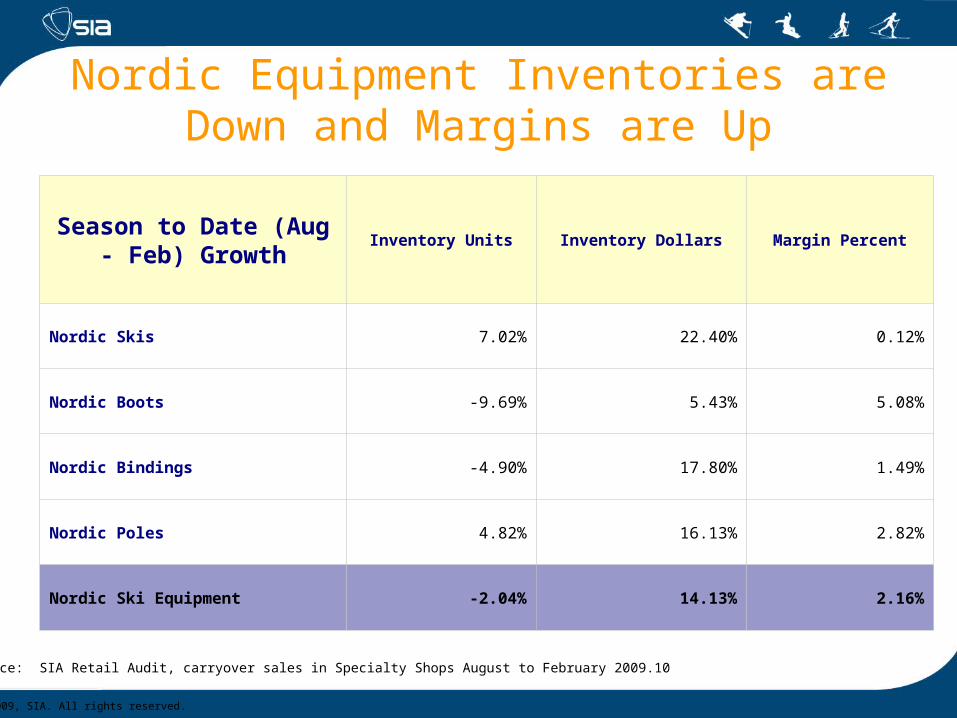
Nordic Equipment Inventories are Down and Margins are Up
Source: SIA Retail Audit, carryover sales in Specialty Shops August to February 2009.10
Season to Date (Aug - Feb) Growth
Inventory Units Inventory Dollars Margin Percent
Nordic Skis 7.02% 22.40% 0.12%
Nordic Boots -9.69% 5.43% 5.08%
Nordic Bindings -4.90% 17.80% 1.49%
Nordic Poles 4.82% 16.13% 2.82%
Nordic Ski Equipment -2.04% 14.13% 2.16%
©2009, SIA. All rights reserved.
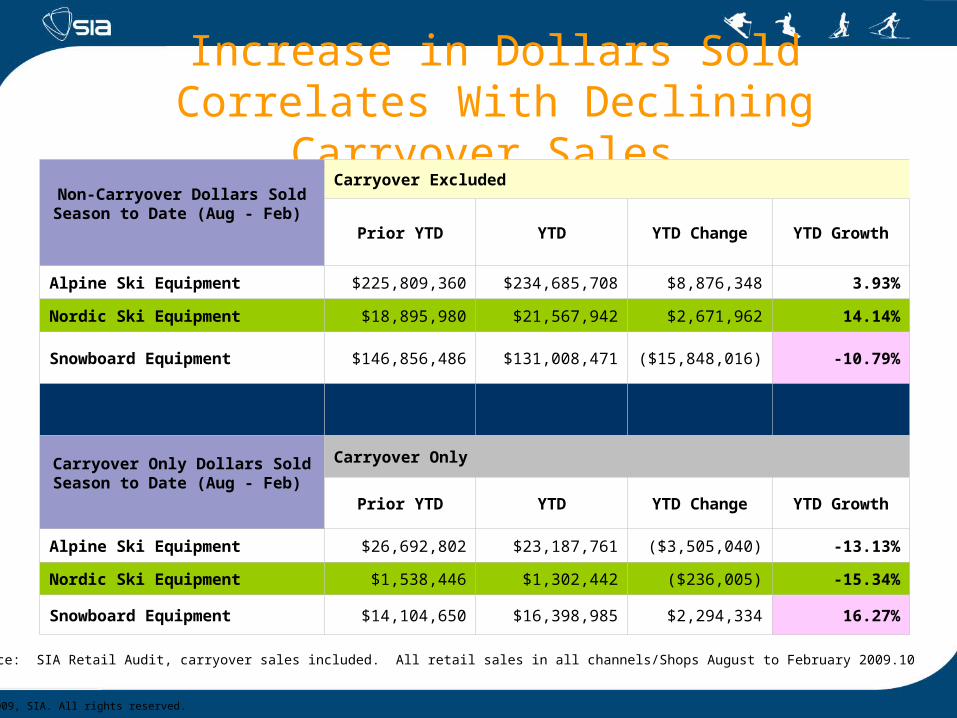
Source: SIA Retail Audit, carryover sales included. All retail sales in all channels/Shops August to February 2009.10
Increase in Dollars Sold Correlates With Declining Carryover Sales
Non-Carryover Dollars Sold Season to Date (Aug - Feb)
Carryover Excluded
Prior YTD YTD YTD Change YTD Growth
Alpine Ski Equipment $225,809,360 $234,685,708 $8,876,348 3.93%
Nordic Ski Equipment $18,895,980 $21,567,942 $2,671,962 14.14%
Snowboard Equipment $146,856,486 $131,008,471 ($15,848,016) -10.79%
Carryover Only Dollars Sold Season to Date (Aug - Feb)
Carryover Only
Prior YTD YTD YTD Change YTD Growth
Alpine Ski Equipment $26,692,802 $23,187,761 ($3,505,040) -13.13%
Nordic Ski Equipment $1,538,446 $1,302,442 ($236,005) -15.34%
Snowboard Equipment $14,104,650 $16,398,985 $2,294,334 16.27%
©2009, SIA. All rights reserved.
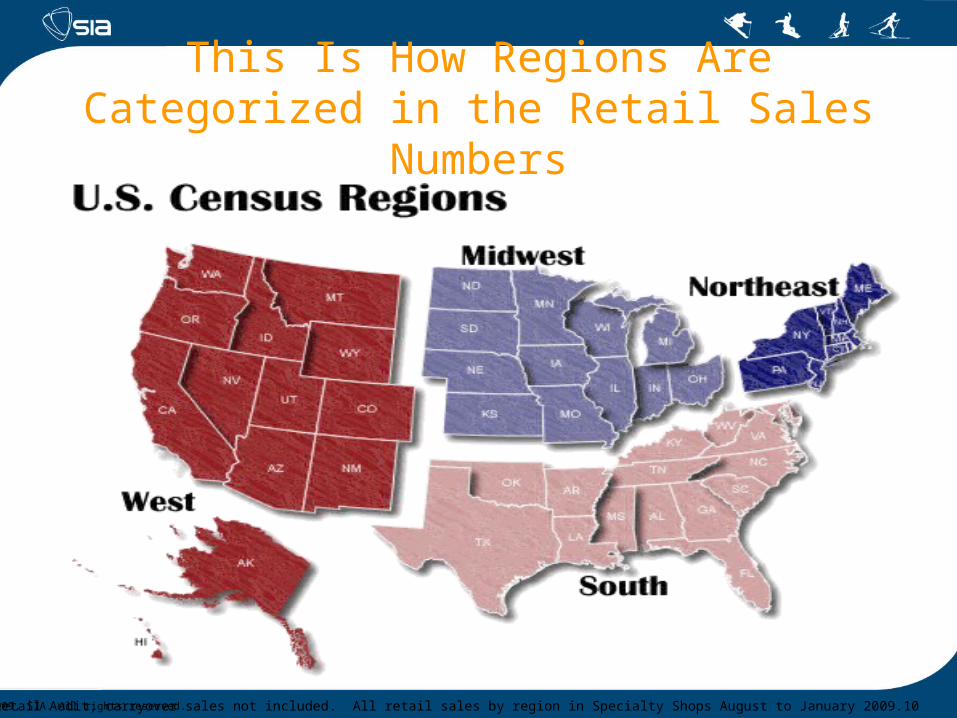
This Is How Regions Are Categorized in the Retail Sales Numbers
Source: SIA Retail Audit, carryover sales not included. All retail sales by region in Specialty Shops August to January 2009.10
©2009, SIA. All rights reserved.
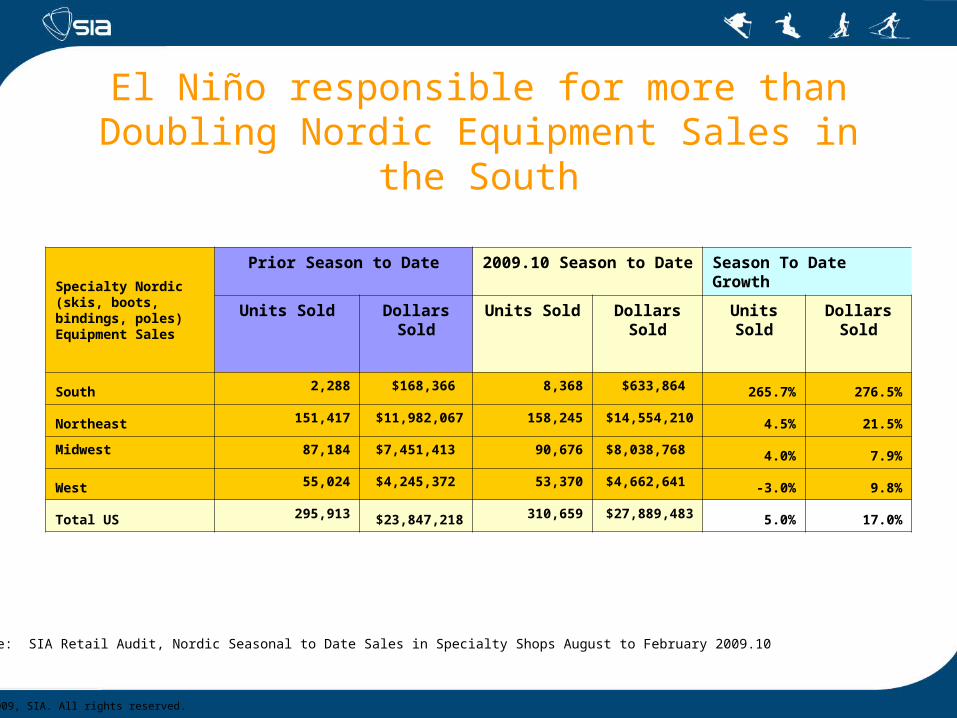
El Niño responsible for more than Doubling Nordic Equipment Sales in the South
Source: SIA Retail Audit, Nordic Seasonal to Date Sales in Specialty Shops August to February 2009.10
Specialty Nordic (skis, boots, bindings, poles) Equipment Sales
Prior Season to Date 2009.10 Season to DateSeason To Date Growth
Units Sold Dollars Sold Units Sold Dollars Sold
Units Sold Dollars Sold
South 2,288 $168,366 8,368 $633,864 265.7% 276.5%
Northeast 151,417 $11,982,067 158,245 $14,554,210 4.5% 21.5%
Midwest 87,184 $7,451,413 90,676 $8,038,768 4.0% 7.9%
West 55,024 $4,245,372 53,370 $4,662,641 -3.0% 9.8%
Total US 295,913 $23,847,218 310,659 $27,889,483 5.0% 17.0%
©2009, SIA. All rights reserved.
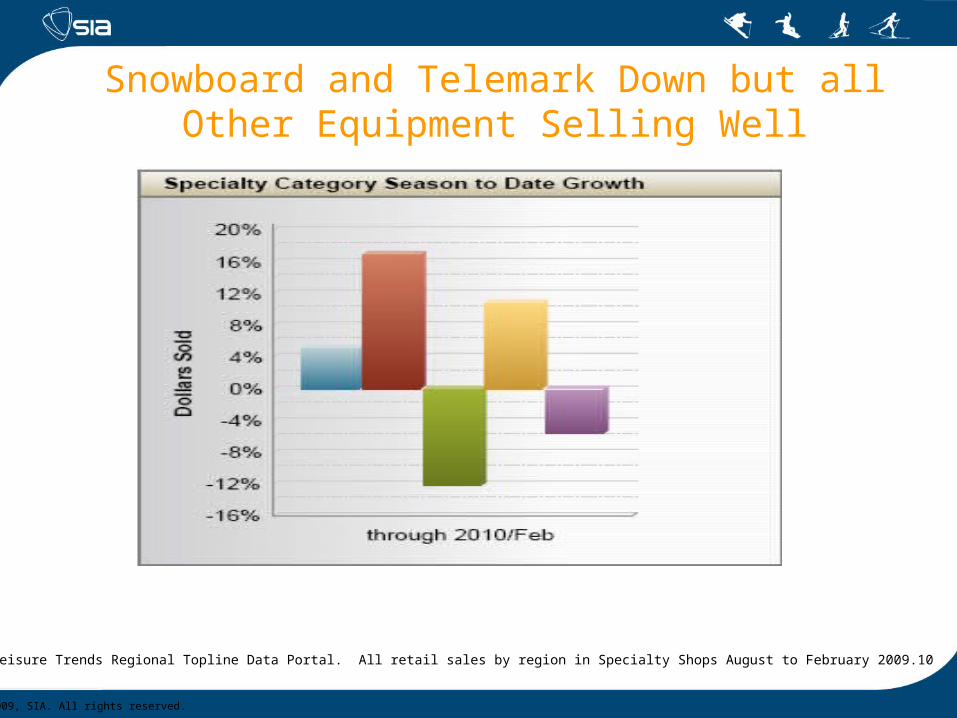
Snowboard and Telemark Down but all Other Equipment Selling Well
Source: SIA/Leisure Trends Regional Topline Data Portal. All retail sales by region in Specialty Shops August to February 2009.10
©2009, SIA. All rights reserved.
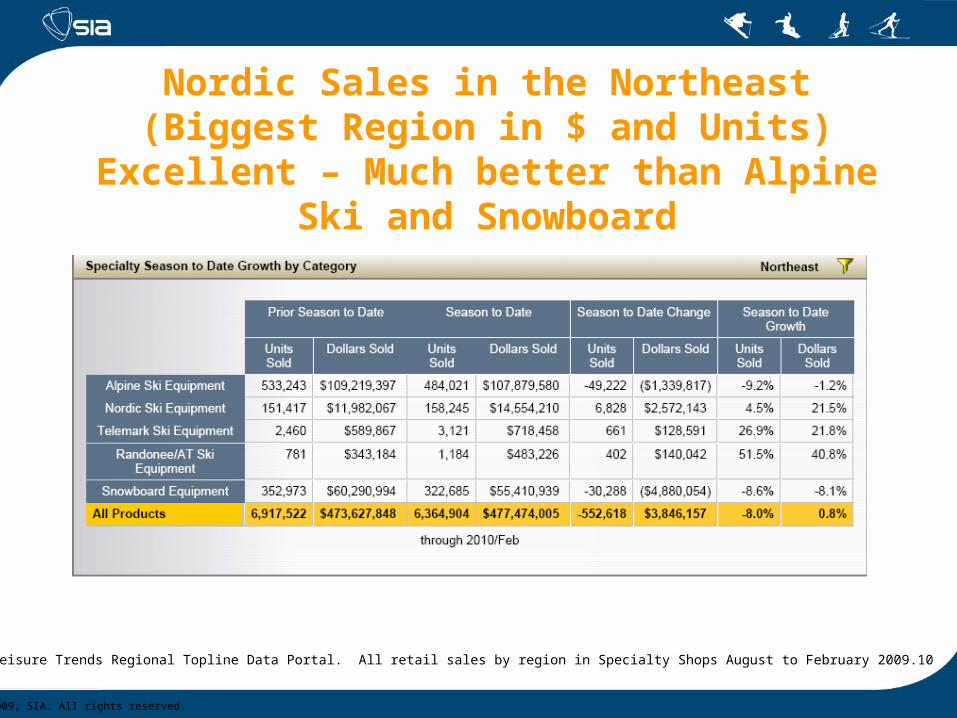
Nordic Sales in the Northeast (Biggest Region in $ and Units) Excellent – Much better than
Alpine Ski and Snowboard
Source: SIA/Leisure Trends Regional Topline Data Portal. All retail sales by region in Specialty Shops August to February 2009.10
©2009, SIA. All rights reserved.
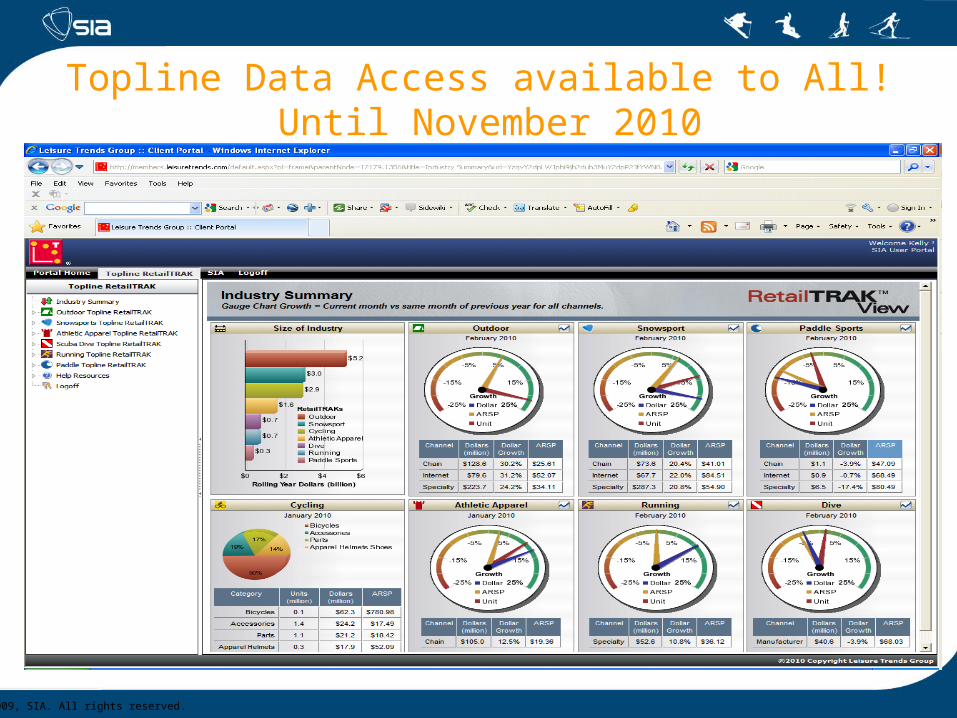
Topline Data Access available to All! Until November 2010
©2009, SIA. All rights reserved.
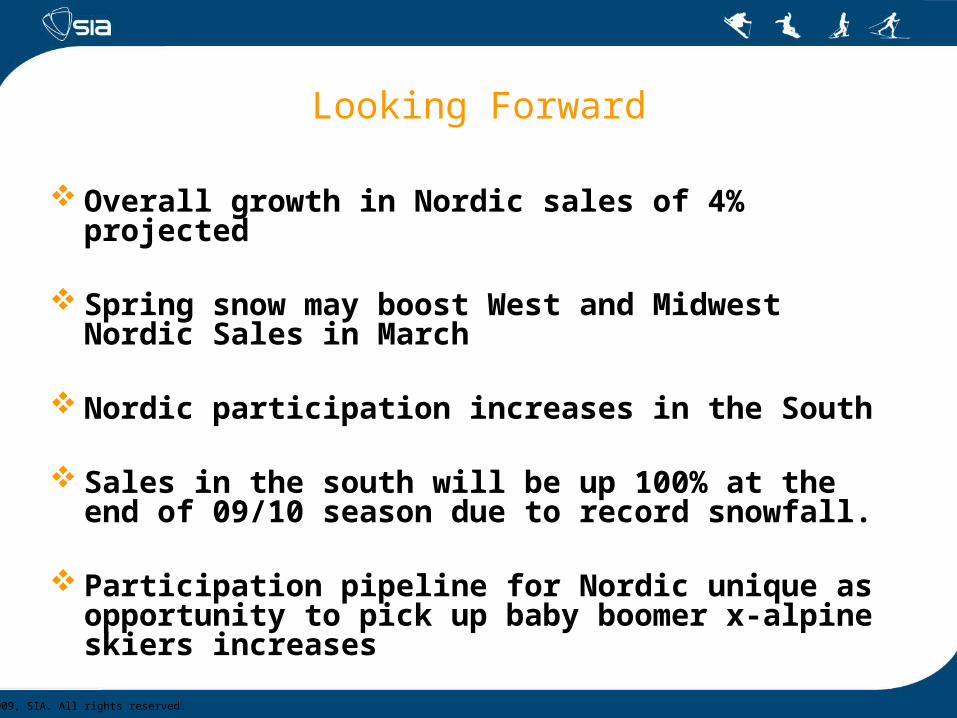
Looking Forward
Overall growth in Nordic sales of 4% projected
Spring snow may boost West and Midwest Nordic Sales in March
Nordic participation increases in the South
Sales in the south will be up 100% at the end of 09/10 season due to record snowfall.
Participation pipeline for Nordic unique as opportunity to pick up baby boomer x-alpine skiers increases
©2009, SIA. All rights reserved.
Thank You!
Discussion….
Kelly DavisSIA Research Director
©2009, SIA. All rights reserved.
Binding Types• New Nordic Norm• New Nordic Norm (NNN) was developed by Rottefella Company in
1985 and redesigned in 1990. The design consists of a horizontal rod mounted just underneath the tip of the boot toe and two ridges running parallel down the binding plate. Modern NNN boots (NNN II) are not compatible with the earlier NNN I design bindings or the Salomon systems.
• Salomon Nordic System• Salomon Nordic System (SNS) is similar in function to the NNN
binding system, but the toe rod from which the boot pivots is in front of the toes instead of just beneath them. The binding plate is composed of one wide ridge instead of two parallel ridges. This design makes the binding less prone to icing up, but it is slightly less stable when torsion is applied. Fischer also makes SNS-compatible boots.