Embed Size (px)
Citation preview
Offering strategic advice to Singapore Airlines
Customer satisfaction and operations efficiency
Special Report 2011
Executive Summary
The Strategy Team at Singapore Airlines (SIA) conducted a statistical investigation to provide the Board of Directors with recommendations as to how to strengthen the company’s competitive advantage. The two core competencies analyzed were customer satisfaction and operations at SIA. Singaporean travellers are less satisfied on average with SIA’s services than travellers from the US and the UK. Economy-‐class travellers at SIA are more satisfied with value-‐for-‐money as their ratings are on average 25% higher than those of Business-‐class travellers. The Boeing 777 is found most comfortable amongst Economy travellers, whereas the Airbus A380 wins in terms of Business class comfort. Asiana Airlines rates higher than SIA in terms of seat comfort in both Economy and Business-‐class. Concerning operations, SIA should maximize efforts to increase passenger load factor, as a 1% increase results in 220,174,000 SGD annual net income. Also, SIA should reduce the advertising budget; for every 1 SGD invested, net income is reduced by 22 SGD. In terms of the fleet age, SIA has one of the lowest of the industry and it should strive to maintain this position; for every year the average fleet age increases, SIA suffers an annual net income loss of 97,376,000 SGD. In total, 8 recommendations are given in the report.
2
Table of contents
Introduction 3
PART I – Customer satisfaction 4 Model
Data Collection
Statistical analysis
PART II – Operations efficiency 12 Model
Data Collection
Statistical analysis
Recommendations 16 Contact 19
Appendix 20
3
Introduction
A few days ago, on Nov. 3rd of 2011, Singapore Airlines (SIA) published a 49% drop in second
quarter net profit. Rising external pressures such as wildly fluctuating fuel prices, countries being
more protective over domestic carries, and security concerns, are threatening SIA’s leading
position. In addition, competitors are hot on SIA’s heels striving at closing the gap in both service
excellence and efficiency. The Board of Directors at SIA is unsure of what strategy to pursue in
order to regain its sustained competitive edge. As part of SIA’s Strategy Team, we have therefore
been asked by the Board to look into possible areas of improvement, at any level of the firm.
SIA’s core objective is to provide excellent service to its customers. Moreover, change is not just
seen as inevitable, but as a way of maintaining competitive advantage over our industry rivals.
SIA’s corporate culture fosters a strong sense of continuous innovation, unique customer service
and profit-‐consciousness in all of its employees. The company is both a cost-‐leader and a
differentiator in its industry, which defies Michael Porter’s view of both being mutually exclusive.
SIA is the exception to Porter’s strategy rule and this has attracted a lot of attention from its
competitors. Now that these are closing in, SIA must continue to gain insight as to how to
continue to outperform its rivals through further innovation. SIA recognizes that to sustain its
differentiation, it must maintain continuous improvement. As Chew ChooSeng, former SIA CEO
and current Chairman of both Singapore Exchange and Singapore Tourism Board, once said:
“The day we (SIA) stop having visions or objectives to work to, then that is the day we atrophy. I
can assure you we have no intention of doing that (…) Our passengers are our raison d’être. If SIA
is successful, it is largely because we have never allowed ourselves to forget that important fact.”
Our approach to the Board’s pressing request is to statistically analyze two of SIA’s core
competencies: customer satisfaction and operations efficiency. The former deals with information
gathered from customer reviews based on aircraft type, travel class, seat dimensions etc. whereas
the latter focuses on issues such as maintenance costs, load factor, fuel cost and other
operational factors of the business. The report will be subdivided into two parts which will then
be integrated to provide holistic recommendations to the Board.
4
PART I: Customer satisfaction at Singapore Airlines
It is irrefutable that SIA has a reputation for delivering premium services to its customers. The
company is characterized by top-‐management commitment to excellence, customer-‐focused staff
and systems, and a customer-‐oriented culture. Our Strategy Team (ST) at SIA is therefore focusing
its efforts on better understanding customer preferences to better satisfy their needs; all
feedback is taken very seriously at SIA since it is an influential source of innovation. In order to
make suitable recommendations, we will use relevant statistical techniques to answer the
following main questions:
• Does customer nationality affect the perceived level of service quality at SIA?
• Does customer satisfaction vary by travel class at SIA?
• Does customer satisfaction at SIA vary by aircraft model?
• Does customer satisfaction at SIA differ from that of other 5-‐star1 airlines?
• How are seat characteristics (e.g. length, width, privacy, comfort) reviewed by customers?
Across aircraft models?
Model
Customers flying Economy and Business on SKYTRAX’s 5 star airlines were chosen as population.
Analysis of First-‐class travellers was amended as not enough data sets from First-‐class travellers
were available. We identified the following parameters and variables: passenger nationality,
travel class (economy, business), seat reviews economy (legroom, seat recline, seat width, TV
screen, access to seat), seat reviews business (sleep comfort, sitting comfort, seat length, seat
width, seat privacy), flight user review and airplane model.
Data collection
Secondary data was used to conduct the analyses of SIA’s customer satisfaction. The largest
airline and airport review and ranking site SKYTRAX was chosen for secondary data for SIA’s
customer satisfaction. Annually, SKYTRAX carries out international-‐traveller surveys to find the
best cabin staff, airport, airline, airline lounge, in-‐flight entertainment system, on-‐board catering
1 SKYTRAX Airline Ranking – http://www.airlinequality.com/StarRanking/5star.htm
5
and several other elements of air travel. SKYTRAX is well known for their annual World Airline
Awards as well as the World Airport Awards. Apart from these rankings SKYTRAX offers customers
the chance to engage in an airline forum where they can publish seat reviews and flight
experiences, and evaluate these with certain criteria.
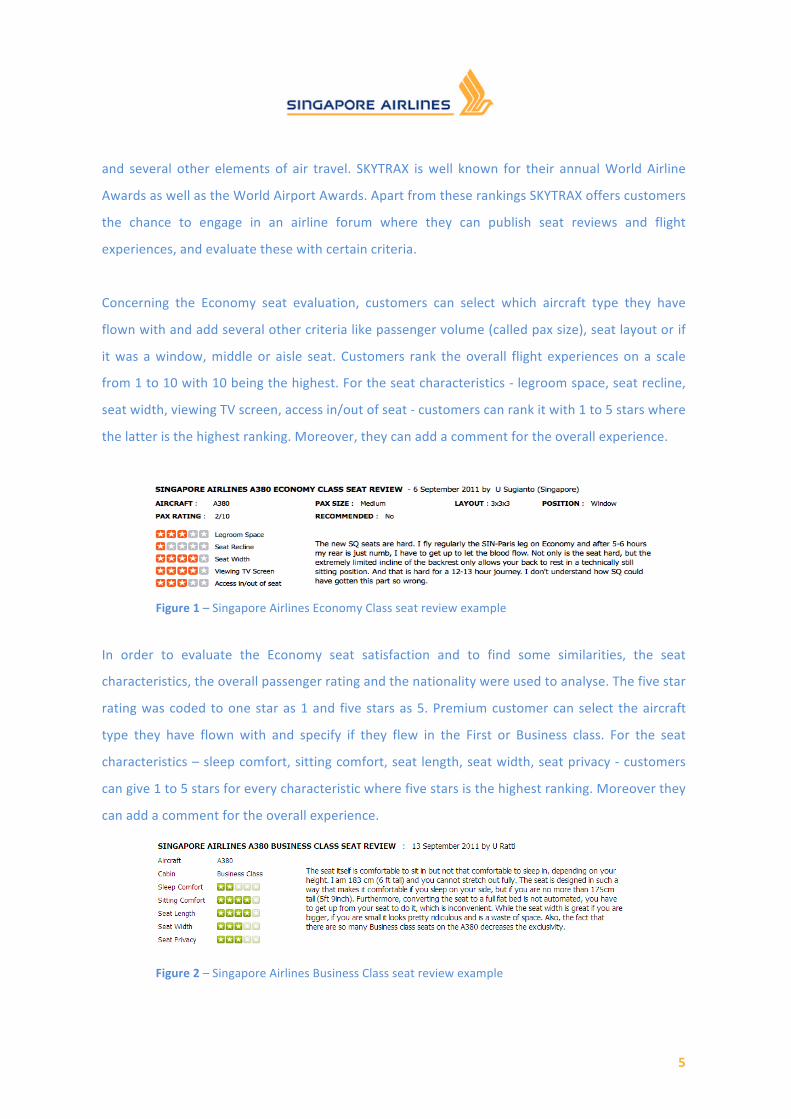
Concerning the Economy seat evaluation, customers can select which aircraft type they have
flown with and add several other criteria like passenger volume (called pax size), seat layout or if
it was a window, middle or aisle seat. Customers rank the overall flight experiences on a scale
from 1 to 10 with 10 being the highest. For the seat characteristics -‐ legroom space, seat recline,
seat width, viewing TV screen, access in/out of seat -‐ customers can rank it with 1 to 5 stars where
the latter is the highest ranking. Moreover, they can add a comment for the overall experience.
Figure 1 – Singapore Airlines Economy Class seat review example
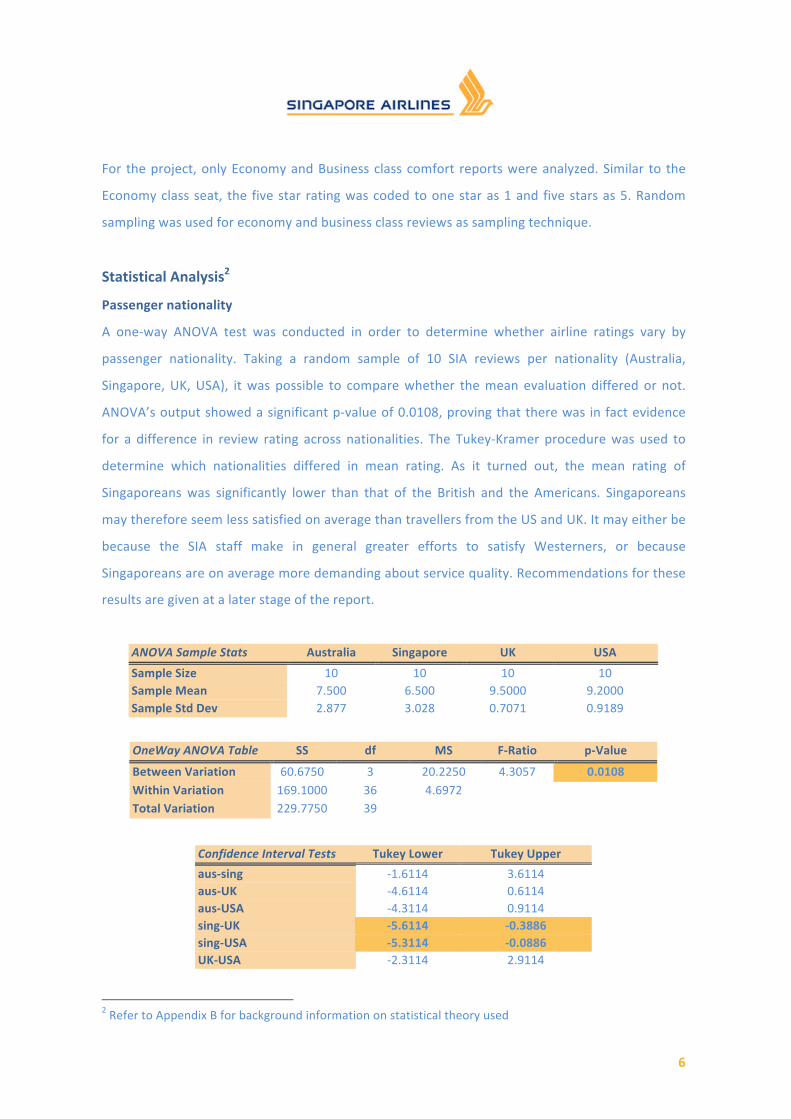
In order to evaluate the Economy seat satisfaction and to find some similarities, the seat
characteristics, the overall passenger rating and the nationality were used to analyse. The five star
rating was coded to one star as 1 and five stars as 5. Premium customer can select the aircraft
type they have flown with and specify if they flew in the First or Business class. For the seat
characteristics – sleep comfort, sitting comfort, seat length, seat width, seat privacy -‐ customers
can give 1 to 5 stars for every characteristic where five stars is the highest ranking. Moreover they
can add a comment for the overall experience.
Figure 2 – Singapore Airlines Business Class seat review example
6
For the project, only Economy and Business class comfort reports were analyzed. Similar to the
Economy class seat, the five star rating was coded to one star as 1 and five stars as 5. Random
sampling was used for economy and business class reviews as sampling technique.
Statistical Analysis2
Passenger nationality
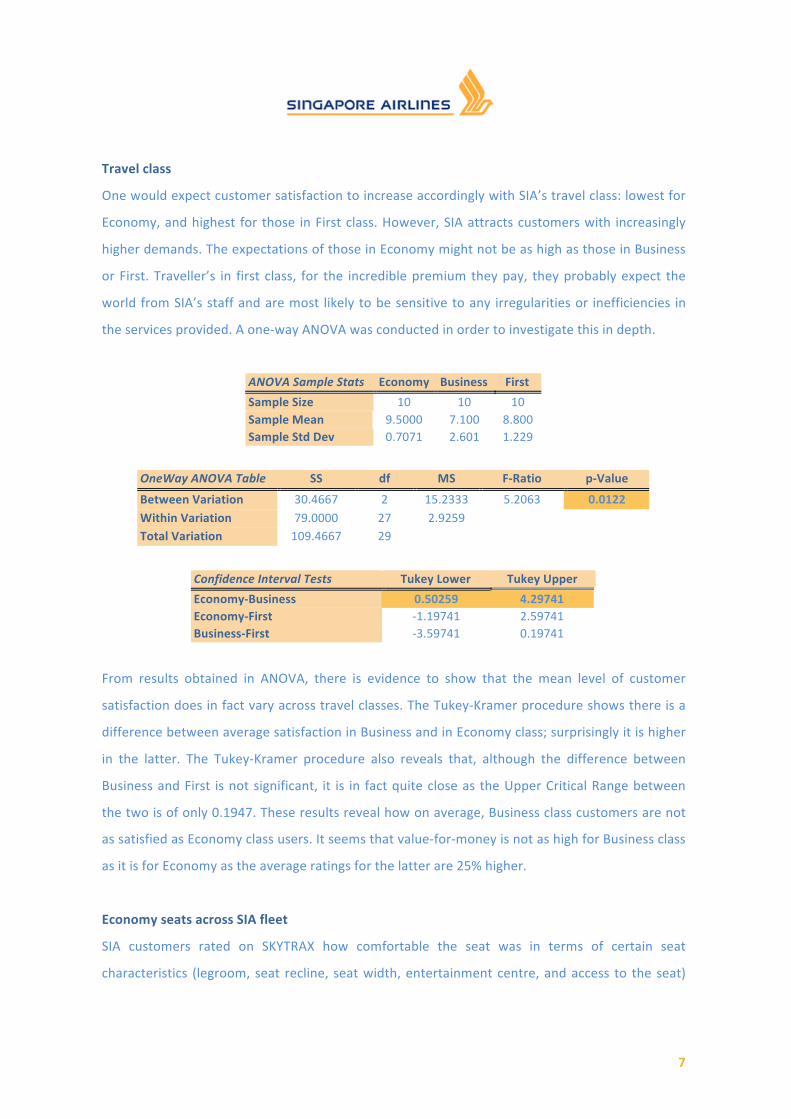
A one-‐way ANOVA test was conducted in order to determine whether airline ratings vary by
passenger nationality. Taking a random sample of 10 SIA reviews per nationality (Australia,
Singapore, UK, USA), it was possible to compare whether the mean evaluation differed or not.
ANOVA’s output showed a significant p-‐value of 0.0108, proving that there was in fact evidence
for a difference in review rating across nationalities. The Tukey-‐Kramer procedure was used to
determine which nationalities differed in mean rating. As it turned out, the mean rating of
Singaporeans was significantly lower than that of the British and the Americans. Singaporeans
may therefore seem less satisfied on average than travellers from the US and UK. It may either be
because the SIA staff make in general greater efforts to satisfy Westerners, or because
Singaporeans are on average more demanding about service quality. Recommendations for these
results are given at a later stage of the report.
ANOVA Sample Stats Australia Singapore UK USA
Sample Size 10 10 10 10 Sample Mean 7.500 6.500 9.5000 9.2000 Sample Std Dev 2.877 3.028 0.7071 0.9189
OneWay ANOVA Table SS df MS F-‐Ratio p-‐Value
Between Variation 60.6750 3 20.2250 4.3057 0.0108 Within Variation 169.1000 36 4.6972 Total Variation 229.7750 39
Confidence Interval Tests Tukey Lower Tukey Upper
aus-‐sing -‐1.6114 3.6114 aus-‐UK -‐4.6114 0.6114 aus-‐USA -‐4.3114 0.9114 sing-‐UK -‐5.6114 -‐0.3886 sing-‐USA -‐5.3114 -‐0.0886 UK-‐USA -‐2.3114 2.9114
2 Refer to Appendix B for background information on statistical theory used
7
Travel class
One would expect customer satisfaction to increase accordingly with SIA’s travel class: lowest for
Economy, and highest for those in First class. However, SIA attracts customers with increasingly
higher demands. The expectations of those in Economy might not be as high as those in Business
or First. Traveller’s in first class, for the incredible premium they pay, they probably expect the
world from SIA’s staff and are most likely to be sensitive to any irregularities or inefficiencies in
the services provided. A one-‐way ANOVA was conducted in order to investigate this in depth.
ANOVA Sample Stats Economy Business First
Sample Size 10 10 10 Sample Mean 9.5000 7.100 8.800 Sample Std Dev 0.7071 2.601 1.229
OneWay ANOVA Table SS df MS F-‐Ratio p-‐Value
Between Variation 30.4667 2 15.2333 5.2063 0.0122 Within Variation 79.0000 27 2.9259 Total Variation 109.4667 29
Confidence Interval Tests Tukey Lower Tukey Upper
Economy-‐Business 0.50259 4.29741 Economy-‐First -‐1.19741 2.59741 Business-‐First -‐3.59741 0.19741
From results obtained in ANOVA, there is evidence to show that the mean level of customer
satisfaction does in fact vary across travel classes. The Tukey-‐Kramer procedure shows there is a
difference between average satisfaction in Business and in Economy class; surprisingly it is higher
in the latter. The Tukey-‐Kramer procedure also reveals that, although the difference between
Business and First is not significant, it is in fact quite close as the Upper Critical Range between
the two is of only 0.1947. These results reveal how on average, Business class customers are not
as satisfied as Economy class users. It seems that value-‐for-‐money is not as high for Business class
as it is for Economy as the average ratings for the latter are 25% higher.
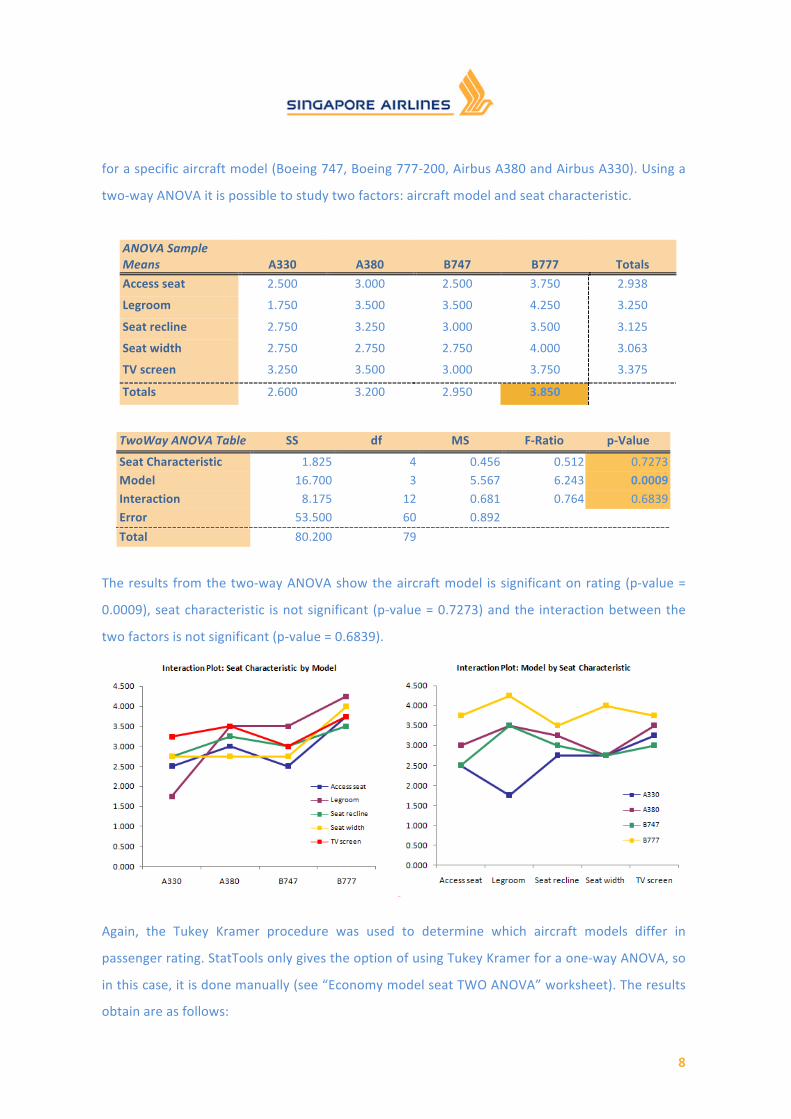
Economy seats across SIA fleet
SIA customers rated on SKYTRAX how comfortable the seat was in terms of certain seat
characteristics (legroom, seat recline, seat width, entertainment centre, and access to the seat)
8
for a specific aircraft model (Boeing 747, Boeing 777-‐200, Airbus A380 and Airbus A330). Using a
two-‐way ANOVA it is possible to study two factors: aircraft model and seat characteristic.
ANOVA Sample Means
A330
A380
B747
B777
Totals
Access seat 2.500 3.000 2.500 3.750 2.938
Legroom 1.750 3.500 3.500 4.250 3.250
Seat recline 2.750 3.250 3.000 3.500 3.125
Seat width 2.750 2.750 2.750 4.000 3.063
TV screen 3.250 3.500 3.000 3.750 3.375
Totals 2.600 3.200 2.950 3.850
TwoWay ANOVA Table SS df MS F-‐Ratio p-‐Value
Seat Characteristic 1.825 4 0.456 0.512 0.7273 Model 16.700 3 5.567 6.243 0.0009 Interaction 8.175 12 0.681 0.764 0.6839 Error 53.500 60 0.892
Total 80.200 79
The results from the two-‐way ANOVA show the aircraft model is significant on rating (p-‐value =
0.0009), seat characteristic is not significant (p-‐value = 0.7273) and the interaction between the
two factors is not significant (p-‐value = 0.6839).
Again, the Tukey Kramer procedure was used to determine which aircraft models differ in
passenger rating. StatTools only gives the option of using Tukey Kramer for a one-‐way ANOVA, so
in this case, it is done manually (see “Economy model seat TWO ANOVA” worksheet). The results
obtain are as follows:
9
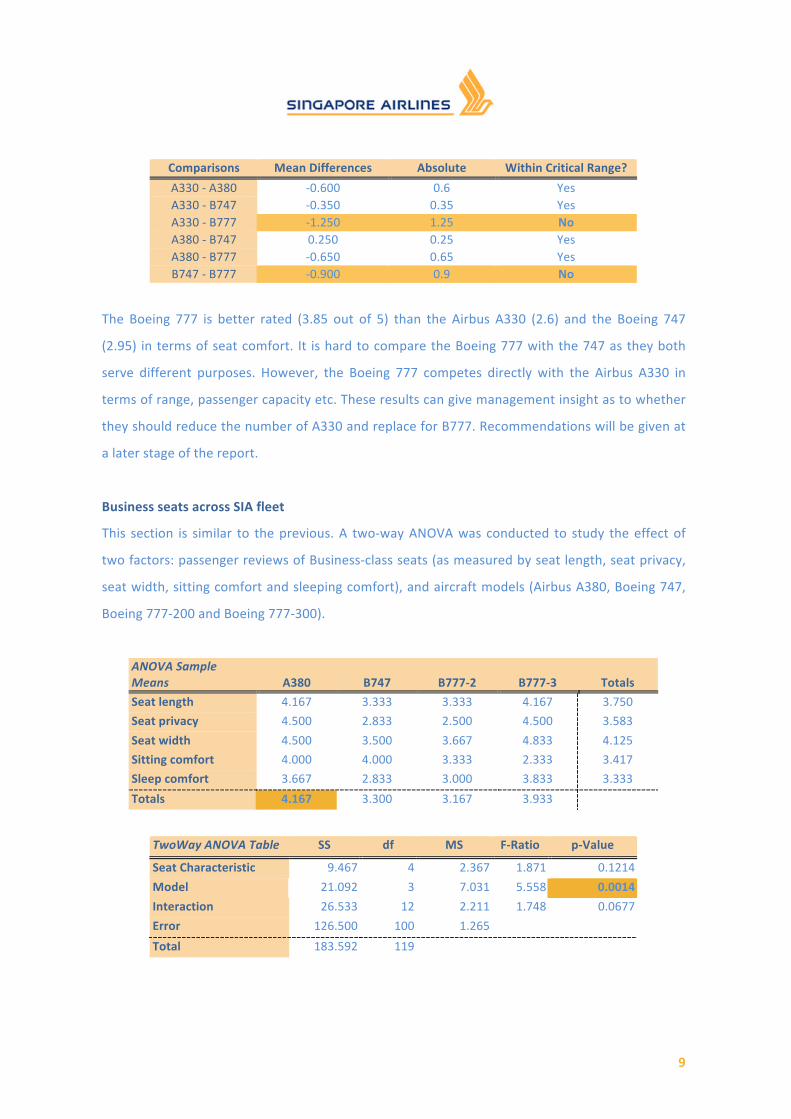
Comparisons Mean Differences Absolute Within Critical Range?
A330 -‐ A380 -‐0.600 0.6 Yes A330 -‐ B747 -‐0.350 0.35 Yes A330 -‐ B777 -‐1.250 1.25 No A380 -‐ B747 0.250 0.25 Yes A380 -‐ B777 -‐0.650 0.65 Yes B747 -‐ B777 -‐0.900 0.9 No
The Boeing 777 is better rated (3.85 out of 5) than the Airbus A330 (2.6) and the Boeing 747
(2.95) in terms of seat comfort. It is hard to compare the Boeing 777 with the 747 as they both
serve different purposes. However, the Boeing 777 competes directly with the Airbus A330 in
terms of range, passenger capacity etc. These results can give management insight as to whether
they should reduce the number of A330 and replace for B777. Recommendations will be given at
a later stage of the report.
Business seats across SIA fleet
This section is similar to the previous. A two-‐way ANOVA was conducted to study the effect of
two factors: passenger reviews of Business-‐class seats (as measured by seat length, seat privacy,
seat width, sitting comfort and sleeping comfort), and aircraft models (Airbus A380, Boeing 747,
Boeing 777-‐200 and Boeing 777-‐300).
ANOVA Sample Means
A380
B747
B777-‐2
B777-‐3
Totals
Seat length 4.167 3.333 3.333 4.167 3.750
Seat privacy 4.500 2.833 2.500 4.500 3.583
Seat width 4.500 3.500 3.667 4.833 4.125
Sitting comfort 4.000 4.000 3.333 2.333 3.417
Sleep comfort 3.667 2.833 3.000 3.833 3.333
Totals 4.167 3.300 3.167 3.933
TwoWay ANOVA Table SS df MS F-‐Ratio p-‐Value
Seat Characteristic 9.467 4 2.367 1.871 0.1214
Model 21.092 3 7.031 5.558 0.0014
Interaction 26.533 12 2.211 1.748 0.0677
Error 126.500 100 1.265
Total 183.592 119
10
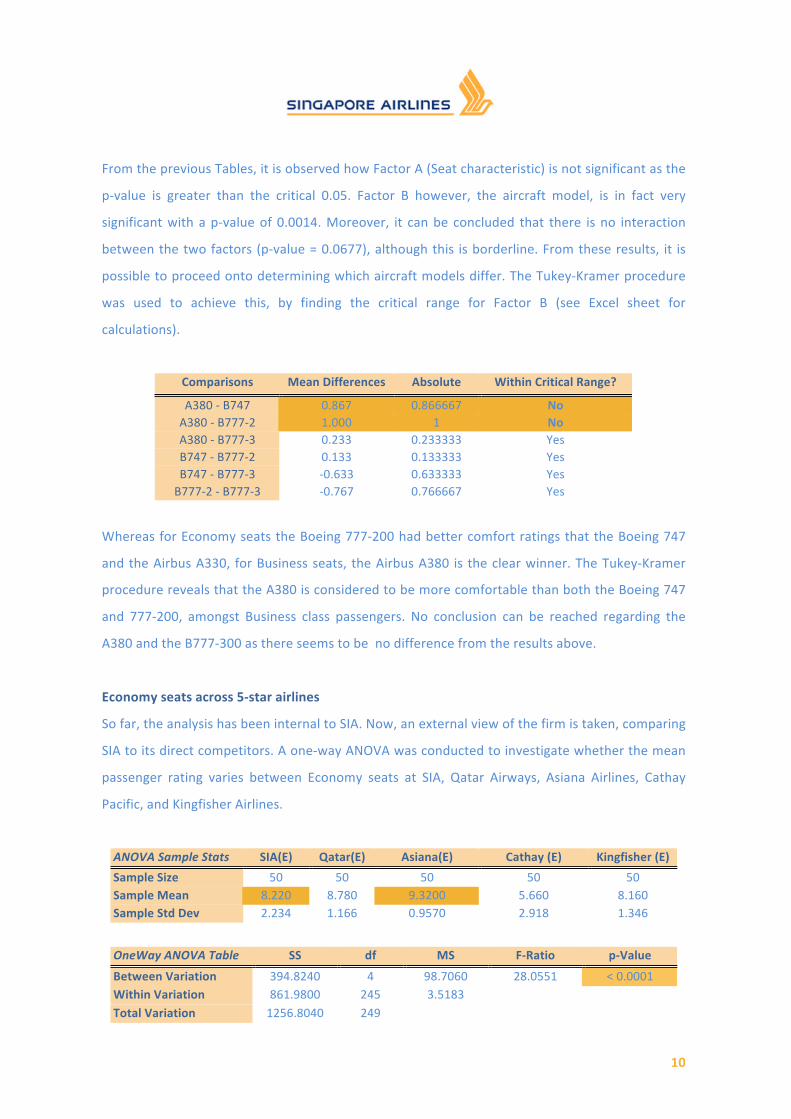
From the previous Tables, it is observed how Factor A (Seat characteristic) is not significant as the
p-‐value is greater than the critical 0.05. Factor B however, the aircraft model, is in fact very
significant with a p-‐value of 0.0014. Moreover, it can be concluded that there is no interaction
between the two factors (p-‐value = 0.0677), although this is borderline. From these results, it is
possible to proceed onto determining which aircraft models differ. The Tukey-‐Kramer procedure
was used to achieve this, by finding the critical range for Factor B (see Excel sheet for
calculations).
Comparisons Mean Differences Absolute Within Critical Range?
A380 -‐ B747 0.867 0.866667 No A380 -‐ B777-‐2 1.000 1 No A380 -‐ B777-‐3 0.233 0.233333 Yes B747 -‐ B777-‐2 0.133 0.133333 Yes B747 -‐ B777-‐3 -‐0.633 0.633333 Yes B777-‐2 -‐ B777-‐3 -‐0.767 0.766667 Yes
Whereas for Economy seats the Boeing 777-‐200 had better comfort ratings that the Boeing 747
and the Airbus A330, for Business seats, the Airbus A380 is the clear winner. The Tukey-‐Kramer
procedure reveals that the A380 is considered to be more comfortable than both the Boeing 747
and 777-‐200, amongst Business class passengers. No conclusion can be reached regarding the
A380 and the B777-‐300 as there seems to be no difference from the results above.
Economy seats across 5-‐star airlines
So far, the analysis has been internal to SIA. Now, an external view of the firm is taken, comparing
SIA to its direct competitors. A one-‐way ANOVA was conducted to investigate whether the mean
passenger rating varies between Economy seats at SIA, Qatar Airways, Asiana Airlines, Cathay
Pacific, and Kingfisher Airlines.
ANOVA Sample Stats SIA(E) Qatar(E) Asiana(E) Cathay (E) Kingfisher (E)
Sample Size 50 50 50 50 50 Sample Mean 8.220 8.780 9.3200 5.660 8.160 Sample Std Dev 2.234 1.166 0.9570 2.918 1.346
OneWay ANOVA Table SS df MS F-‐Ratio p-‐Value
Between Variation 394.8240 4 98.7060 28.0551 < 0.0001 Within Variation 861.9800 245 3.5183 Total Variation 1256.8040 249
11
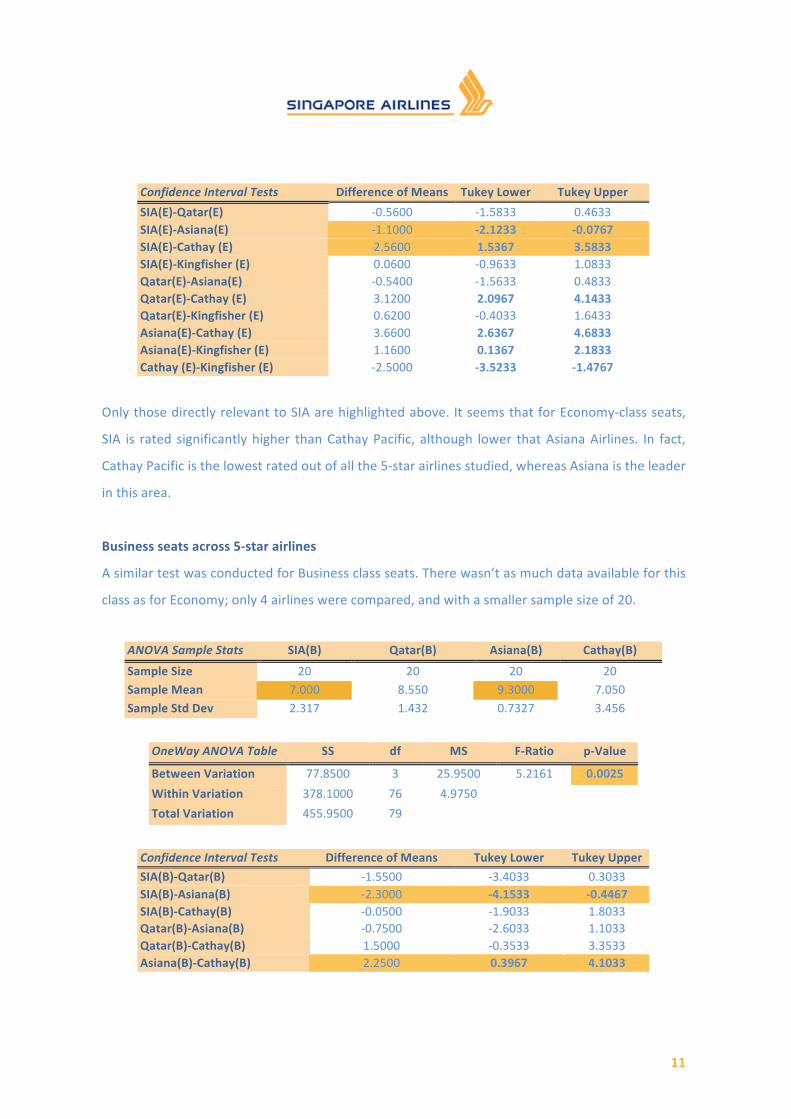
Confidence Interval Tests Difference of Means Tukey Lower Tukey Upper
SIA(E)-‐Qatar(E) -‐0.5600 -‐1.5833 0.4633 SIA(E)-‐Asiana(E) -‐1.1000 -‐2.1233 -‐0.0767 SIA(E)-‐Cathay (E) 2.5600 1.5367 3.5833 SIA(E)-‐Kingfisher (E) 0.0600 -‐0.9633 1.0833 Qatar(E)-‐Asiana(E) -‐0.5400 -‐1.5633 0.4833 Qatar(E)-‐Cathay (E) 3.1200 2.0967 4.1433 Qatar(E)-‐Kingfisher (E) 0.6200 -‐0.4033 1.6433 Asiana(E)-‐Cathay (E) 3.6600 2.6367 4.6833 Asiana(E)-‐Kingfisher (E) 1.1600 0.1367 2.1833 Cathay (E)-‐Kingfisher (E) -‐2.5000 -‐3.5233 -‐1.4767
Only those directly relevant to SIA are highlighted above. It seems that for Economy-‐class seats,
SIA is rated significantly higher than Cathay Pacific, although lower that Asiana Airlines. In fact,
Cathay Pacific is the lowest rated out of all the 5-‐star airlines studied, whereas Asiana is the leader
in this area.
Business seats across 5-‐star airlines
A similar test was conducted for Business class seats. There wasn’t as much data available for this
class as for Economy; only 4 airlines were compared, and with a smaller sample size of 20.
ANOVA Sample Stats SIA(B) Qatar(B) Asiana(B) Cathay(B)
Sample Size 20 20 20 20 Sample Mean 7.000 8.550 9.3000 7.050 Sample Std Dev 2.317 1.432 0.7327 3.456
OneWay ANOVA Table SS df MS F-‐Ratio p-‐Value
Between Variation 77.8500 3 25.9500 5.2161 0.0025
Within Variation 378.1000 76 4.9750
Total Variation 455.9500 79
Confidence Interval Tests Difference of Means Tukey Lower Tukey Upper
SIA(B)-‐Qatar(B) -‐1.5500 -‐3.4033 0.3033 SIA(B)-‐Asiana(B) -‐2.3000 -‐4.1533 -‐0.4467 SIA(B)-‐Cathay(B) -‐0.0500 -‐1.9033 1.8033 Qatar(B)-‐Asiana(B) -‐0.7500 -‐2.6033 1.1033 Qatar(B)-‐Cathay(B) 1.5000 -‐0.3533 3.3533 Asiana(B)-‐Cathay(B) 2.2500 0.3967 4.1033
12
The one-‐way ANOVA conducted is considered to be significant (p-‐value = 0.0025). In terms of
Business class ratings, Asiana still outperforms SIA. The average rating for SIA in Business class is 7
(out of 10) whereas for Asiana it’s 9.3. This difference is confirmed when conducting the Tukey
Kramer procedure, as highlighted in the previous Tables. When it comes to Economy seats, SIA
should learn from Asiana Airlines since it outperforms it in seat comfort for both Economy and
Business class. This could involve having SIA spies on Asiana flights to better understand the root
of their success.
PART II: Operations efficiency at Singapore Airlines
The operations behind SIA are equally important as customer satisfaction. Whereas in the
previous part the attention was focused to external services (i.e. customer-‐focused), in this
section we look at the internal services at SIA. We especially focus on factors influencing the
financial performance of SIA as these figures are essential for the future success of SIA’s
operations.
Model
The population consists of available data for SIA over the last eleven years beginning in the year
2000. Parameters and variables defined for this study were revenue, net income, advertising &
sales costs , aircraft maintenance and overhaul costs, fuel costs, costs of in-‐flight meals, rental on
lease of aircraft (all in thousand SGD), load factor passenger (in %), distance flown (in million km),
number of employees (person), number of aircraft (in unit), age of aircraft (in month), amount of
destination cities (in unit), distance flown (in million km), time flown (in hrs).
Data collection
Secondary data was used to conduct the analyses of SIA’s operational efficiency. The database
CEIC Data3 was chosen as the source for the data set. CEIC Data offers datasets for economic
research on emerging and developed markets around the world. CEIC Data provides detailed
information about SIA operational performance on the parameters named above. Random
sampling was used as sampling technique.
3 CEIC Data Company Ltd. -‐http://ceicdata.securities.com.libproxy1.nus.edu.sg/login.html
13
Statistical Analysis4
Time flown
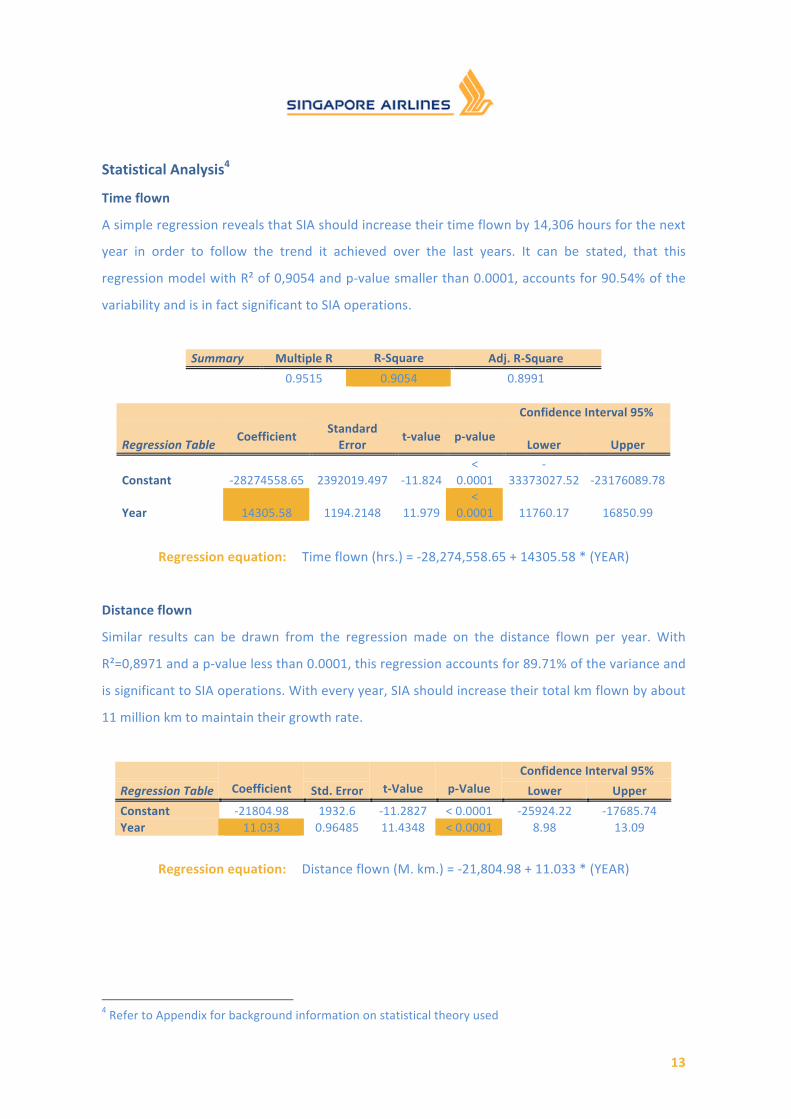
A simple regression reveals that SIA should increase their time flown by 14,306 hours for the next
year in order to follow the trend it achieved over the last years. It can be stated, that this
regression model with R² of 0,9054 and p-‐value smaller than 0.0001, accounts for 90.54% of the
variability and is in fact significant to SIA operations.
Summary Multiple R R-‐Square Adj. R-‐Square
0.9515 0.9054 0.8991
Confidence Interval 95%
Regression Table Coefficient
Standard Error
t-‐value p-‐value Lower Upper
Constant -‐28274558.65 2392019.497 -‐11.824 <
0.0001 -‐
33373027.52 -‐23176089.78
Year 14305.58 1194.2148 11.979 <
0.0001 11760.17 16850.99
Regression equation: Time flown (hrs.) = -‐28,274,558.65 + 14305.58 * (YEAR)
Distance flown
Similar results can be drawn from the regression made on the distance flown per year. With
R²=0,8971 and a p-‐value less than 0.0001, this regression accounts for 89.71% of the variance and
is significant to SIA operations. With every year, SIA should increase their total km flown by about
11 million km to maintain their growth rate.
Confidence Interval 95%
Regression Table
Coefficient Std. Error
t-‐Value
p-‐Value Lower Upper
Constant -‐21804.98 1932.6 -‐11.2827 < 0.0001 -‐25924.22 -‐17685.74 Year 11.033 0.96485 11.4348 < 0.0001 8.98 13.09
Regression equation: Distance flown (M. km.) = -‐21,804.98 + 11.033 * (YEAR)
4 Refer to Appendix for background information on statistical theory used
14
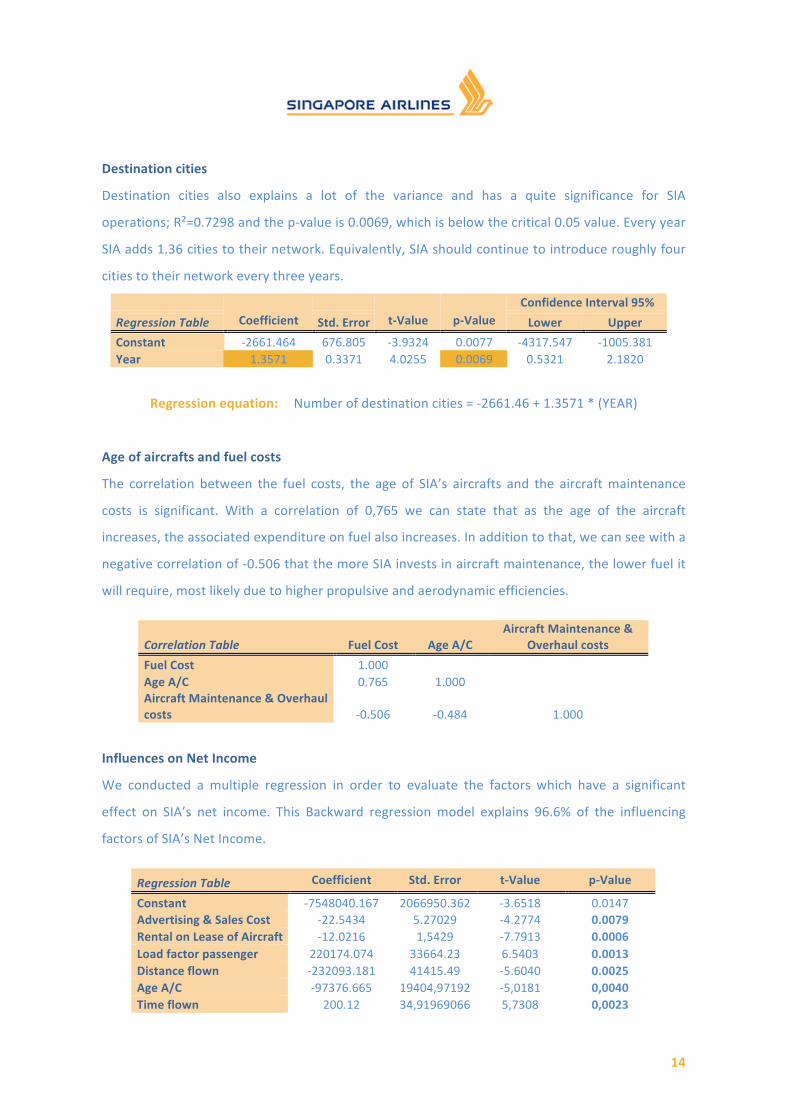
Destination cities
Destination cities also explains a lot of the variance and has a quite significance for SIA
operations; R²=0.7298 and the p-‐value is 0.0069, which is below the critical 0.05 value. Every year
SIA adds 1.36 cities to their network. Equivalently, SIA should continue to introduce roughly four
cities to their network every three years.
Confidence Interval 95%
Regression Table
Coefficient Std. Error
t-‐Value
p-‐Value Lower Upper
Constant -‐2661.464 676.805 -‐3.9324 0.0077 -‐4317.547 -‐1005.381 Year 1.3571 0.3371 4.0255 0.0069 0.5321 2.1820
Regression equation: Number of destination cities = -‐2661.46 + 1.3571 * (YEAR)
Age of aircrafts and fuel costs
The correlation between the fuel costs, the age of SIA’s aircrafts and the aircraft maintenance
costs is significant. With a correlation of 0,765 we can state that as the age of the aircraft
increases, the associated expenditure on fuel also increases. In addition to that, we can see with a
negative correlation of -‐0.506 that the more SIA invests in aircraft maintenance, the lower fuel it
will require, most likely due to higher propulsive and aerodynamic efficiencies.
Correlation Table Fuel Cost Age A/C Aircraft Maintenance &
Overhaul costs
Fuel Cost 1.000 Age A/C 0.765 1.000 Aircraft Maintenance & Overhaul costs -‐0.506 -‐0.484 1.000
Influences on Net Income
We conducted a multiple regression in order to evaluate the factors which have a significant
effect on SIA’s net income. This Backward regression model explains 96.6% of the influencing
factors of SIA’s Net Income.
Regression Table Coefficient Std. Error t-‐Value p-‐Value
Constant -‐7548040.167 2066950.362 -‐3.6518 0.0147 Advertising & Sales Cost -‐22.5434 5.27029 -‐4.2774 0.0079 Rental on Lease of Aircraft -‐12.0216 1,5429 -‐7.7913 0.0006 Load factor passenger 220174.074 33664.23 6.5403 0.0013 Distance flown -‐232093.181 41415.49 -‐5.6040 0.0025 Age A/C -‐97376.665 19404,97192 -‐5,0181 0,0040 Time flown 200.12 34,91969066 5,7308 0,0023
15
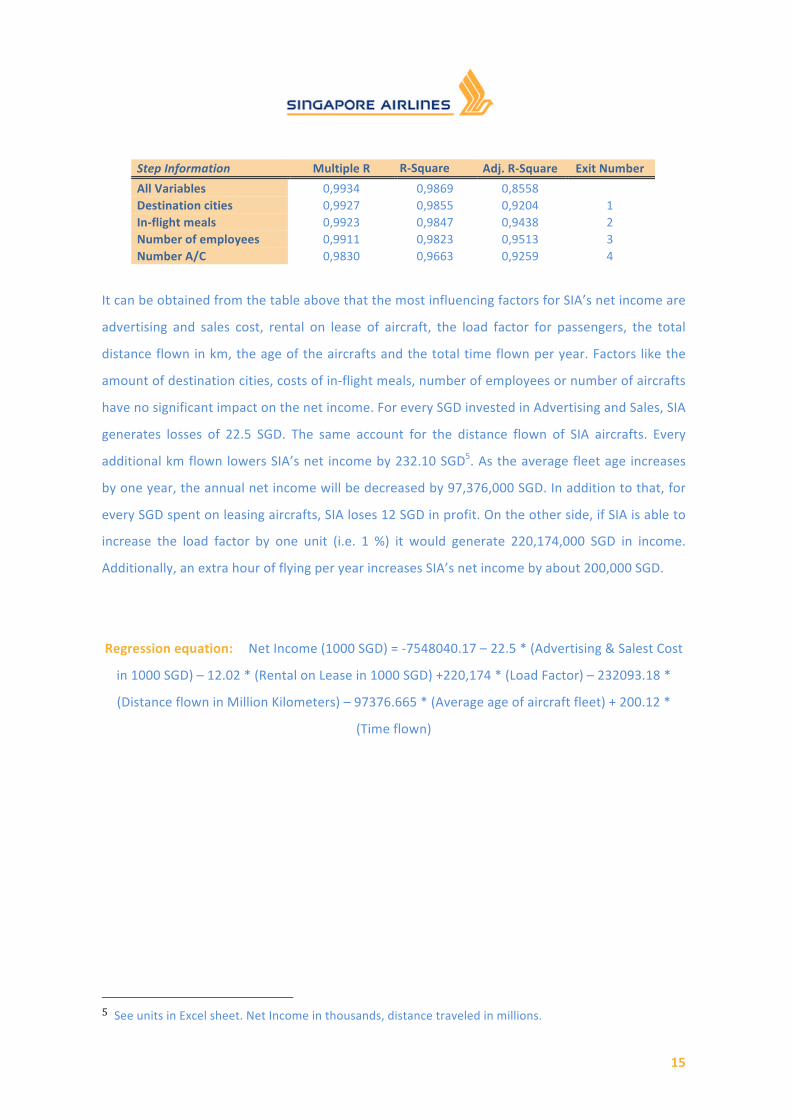
Step Information Multiple R R-‐Square Adj. R-‐Square Exit Number
All Variables 0,9934 0,9869 0,8558 Destination cities 0,9927 0,9855 0,9204 1 In-‐flight meals 0,9923 0,9847 0,9438 2 Number of employees 0,9911 0,9823 0,9513 3 Number A/C 0,9830 0,9663 0,9259 4
It can be obtained from the table above that the most influencing factors for SIA’s net income are
advertising and sales cost, rental on lease of aircraft, the load factor for passengers, the total
distance flown in km, the age of the aircrafts and the total time flown per year. Factors like the
amount of destination cities, costs of in-‐flight meals, number of employees or number of aircrafts
have no significant impact on the net income. For every SGD invested in Advertising and Sales, SIA
generates losses of 22.5 SGD. The same account for the distance flown of SIA aircrafts. Every
additional km flown lowers SIA’s net income by 232.10 SGD5. As the average fleet age increases
by one year, the annual net income will be decreased by 97,376,000 SGD. In addition to that, for
every SGD spent on leasing aircrafts, SIA loses 12 SGD in profit. On the other side, if SIA is able to
increase the load factor by one unit (i.e. 1 %) it would generate 220,174,000 SGD in income.
Additionally, an extra hour of flying per year increases SIA’s net income by about 200,000 SGD.
Regression equation: Net Income (1000 SGD) = -‐7548040.17 – 22.5 * (Advertising & Salest Cost
in 1000 SGD) – 12.02 * (Rental on Lease in 1000 SGD) +220,174 * (Load Factor) – 232093.18 *
(Distance flown in Million Kilometers) – 97376.665 * (Average age of aircraft fleet) + 200.12 *
(Time flown)
5 See units in Excel sheet. Net Income in thousands, distance traveled in millions.
16
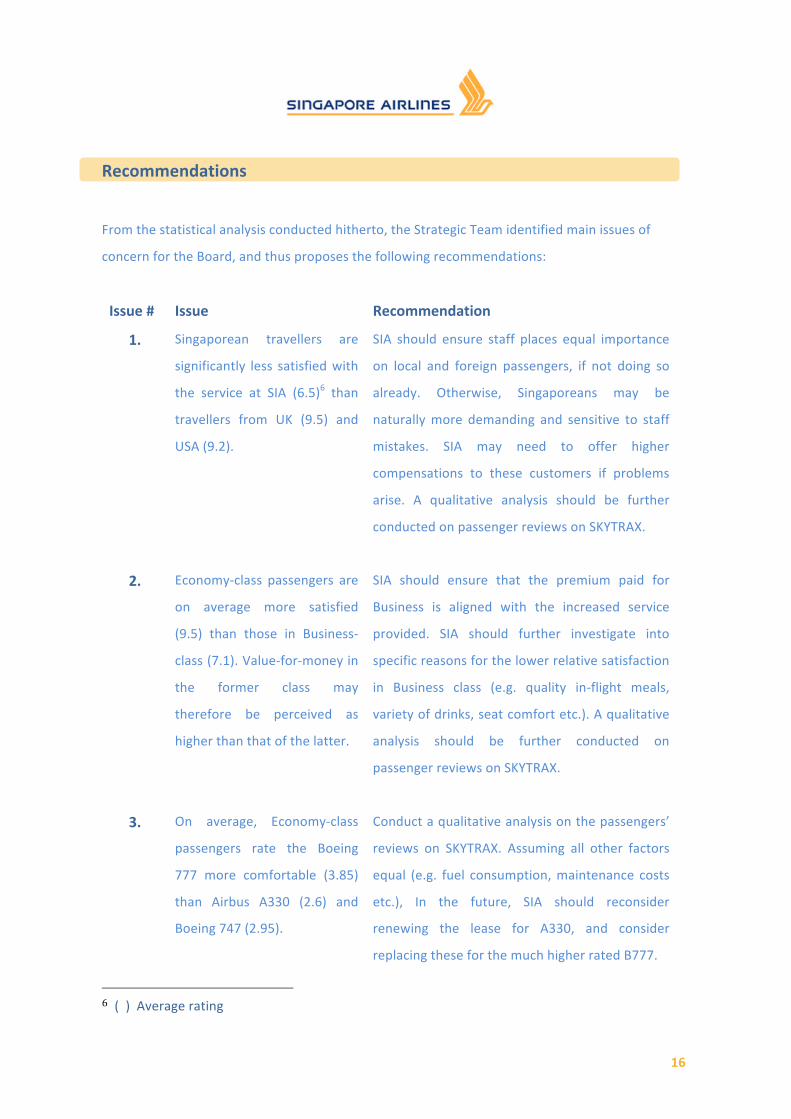
Recommendations
From the statistical analysis conducted hitherto, the Strategic Team identified main issues of
concern for the Board, and thus proposes the following recommendations:
Issue # Issue Recommendation
1. Singaporean travellers are
significantly less satisfied with
the service at SIA (6.5)6 than
travellers from UK (9.5) and
USA (9.2).
SIA should ensure staff places equal importance
on local and foreign passengers, if not doing so
already. Otherwise, Singaporeans may be
naturally more demanding and sensitive to staff
mistakes. SIA may need to offer higher
compensations to these customers if problems
arise. A qualitative analysis should be further
conducted on passenger reviews on SKYTRAX.
2. Economy-‐class passengers are
on average more satisfied
(9.5) than those in Business-‐
class (7.1). Value-‐for-‐money in
the former class may
therefore be perceived as
higher than that of the latter.
SIA should ensure that the premium paid for
Business is aligned with the increased service
provided. SIA should further investigate into
specific reasons for the lower relative satisfaction
in Business class (e.g. quality in-‐flight meals,
variety of drinks, seat comfort etc.). A qualitative
analysis should be further conducted on
passenger reviews on SKYTRAX.
3. On average, Economy-‐class
passengers rate the Boeing
777 more comfortable (3.85)
than Airbus A330 (2.6) and
Boeing 747 (2.95).
Conduct a qualitative analysis on the passengers’
reviews on SKYTRAX. Assuming all other factors
equal (e.g. fuel consumption, maintenance costs
etc.), In the future, SIA should reconsider
renewing the lease for A330, and consider
replacing these for the much higher rated B777.
6 ( ) Average rating
17
4. On average, Business-‐class
passengers rate the Airbus
A380 more comfortable
(4.167) than the Boeing 747
(3.3) and 777-‐200 (3.167).
SIA should further investigate reviews for First-‐
class customers. If positive as the ones obtained
in this case, SIA should continue to place orders
for the A380, which could replace the older and
less comfortable Boeing 747s (see Appendix A)
5. Both Economy and Business-‐
class passengers rate on
average SIA lower than Asiana
Airlines (12-‐25% lower).
SIA should investigate the cause of this.
Comparing websites, services provided, user-‐
friendliness, iPad apps, on-‐board services etc.
Conducting on-‐board spying to better understand
Asiana’s success. A qualitative analysis should be
further conducted on passenger reviews on
SKYTRAX.
6. The regression analysis on
distance flown, time flown
and cities served stated that
SIA should increase their km
flown per year by 11mn, hours
by 14,306 and add 1.35 cities
per year.
SIA should further analyze which of its routes is
reaching capacity limits and therefore increase
the capacity by introducing new airplanes.
Moreover it should constantly revise which
possible new destinations it could add to its
network. South America and Africa remain
largely unexploited.
7. With a correlation of 0.765 the
age of the aircraft and the
associated fuel costs have a
correlation of 0.765 In
addition to that, a negative
correlation of -‐0.506 exists
between the aircraft
maintenance and the fuel
costs.
SIA should try to continue their efforts in having
one of the youngest fleets in the industry. It was
statistically proven that the maintenance costs
can be reduced with a young fleet. Moreover this
young fleet consumes less fuel than an older one.
18
8. The most influencing factors
for SIA’s net income are
advertising and sales cost,
rental on lease of aircraft, the
load factor for passengers, the
total distance flown in km, the
age of the aircrafts and the
total time flown per year
For the detailed significance and influences of the
parameters please refer to Part II. As the
passenger load factor has a positive influence on
SIA’s net income, it is advisable that SIA tries to
increase their load factor by a good revenue
management which optimizes the capacity for
every route offered. Moreover, we can obtain
that the age of aircraft has a significant negative
influence on SIA’s net income. As stated earlier,
SIA should try to keep its fleet as young as
possible. Although leasing has a negative
influence on the net income of SIA, it helps SIA to
staff airplanes more flexible according to
demand. In addition to that leasing costs can be
deducted from the tax payables. Therefore no
change in SIA’s leasing strategy is recommended.
The advertising budget should be reviewed, and
possibly reduced, as it is not proving to be
effective for increasing net income.
The statistical analysis has served a strong purpose of determining areas of improvement. A
limitation however remains in the fact that no specifics can be given in terms of what exactly
needs to be improved. A powerful tool arises when combining a quantitative analysis with a
qualitative one. For this reason, SIA should conduct in-‐depth qualitative analysis from customer
reviews, from both SKYTRAX and obtained internally through SIA.
19
Contact
To have a deeper understanding of this subject, please contact Strategy Team 9:
Jose Arizaga
Teo Kim Chwee
Motoka Mouri
Marc Trevisany
20
Appendix
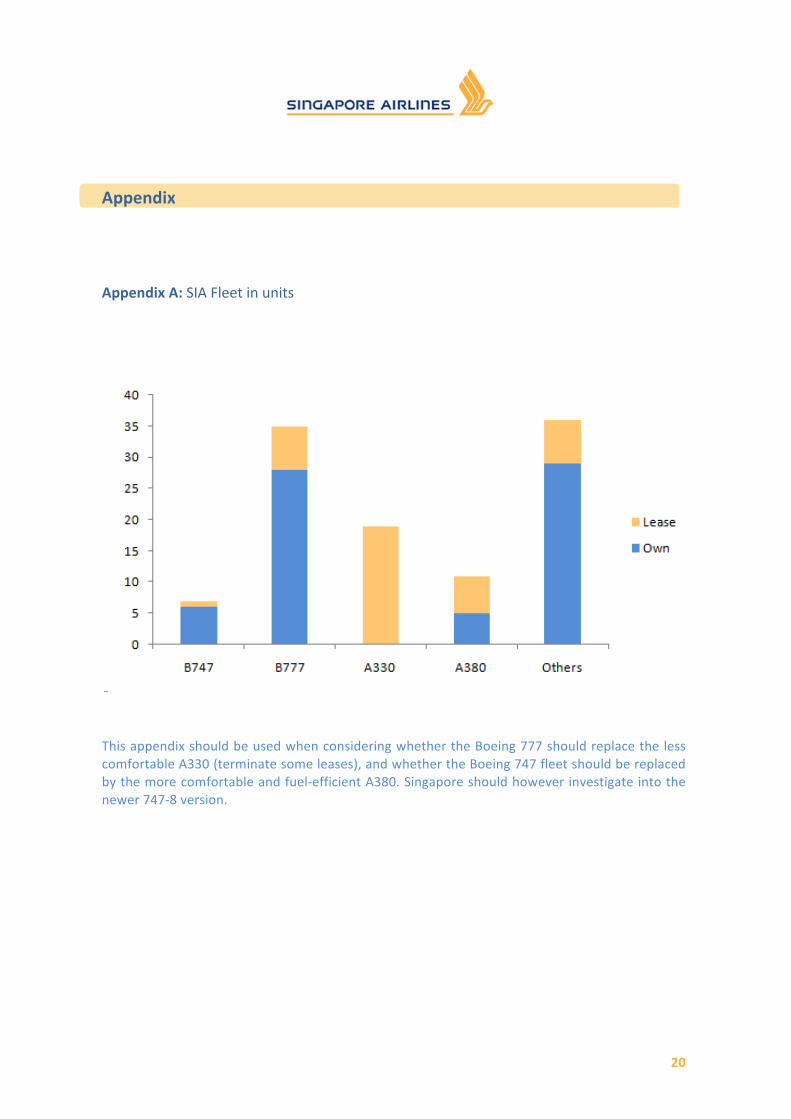
Appendix A: SIA Fleet in units
This appendix should be used when considering whether the Boeing 777 should replace the less comfortable A330 (terminate some leases), and whether the Boeing 747 fleet should be replaced by the more comfortable and fuel-‐efficient A380. Singapore should however investigate into the newer 747-‐8 version.
21
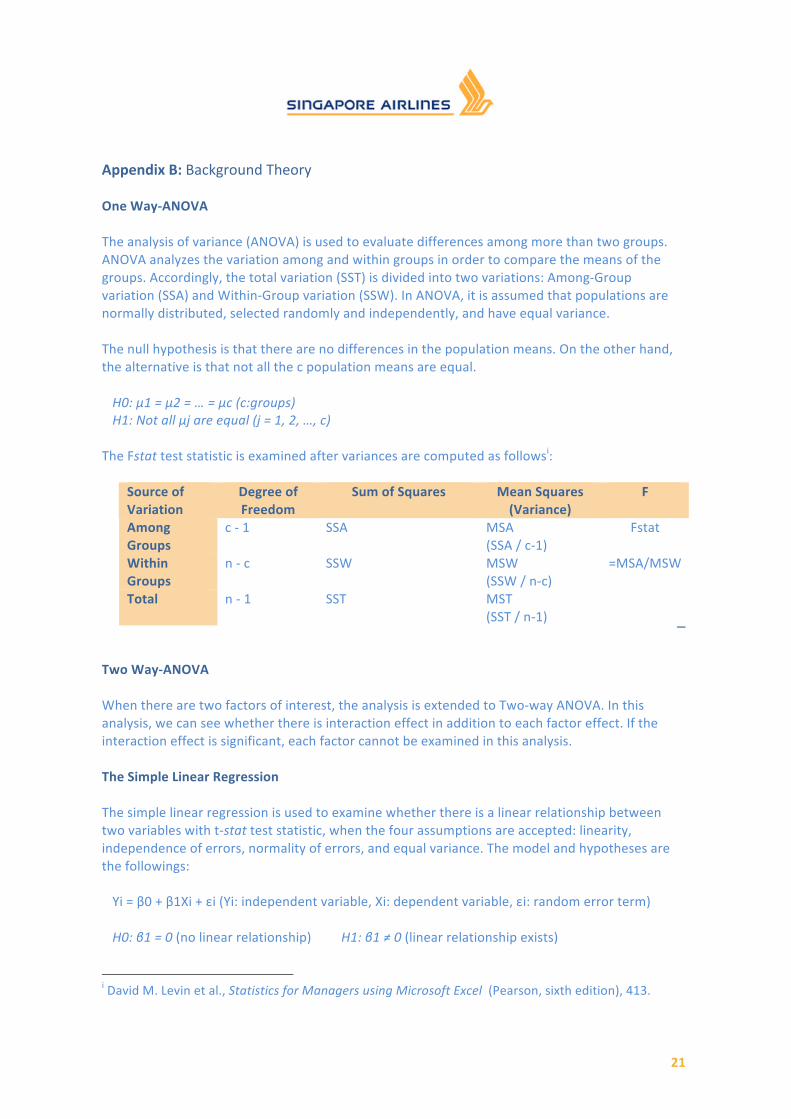
Appendix B: Background Theory One Way-‐ANOVA The analysis of variance (ANOVA) is used to evaluate differences among more than two groups. ANOVA analyzes the variation among and within groups in order to compare the means of the groups. Accordingly, the total variation (SST) is divided into two variations: Among-‐Group variation (SSA) and Within-‐Group variation (SSW). In ANOVA, it is assumed that populations are normally distributed, selected randomly and independently, and have equal variance. The null hypothesis is that there are no differences in the population means. On the other hand, the alternative is that not all the c population means are equal. H0: μ1 = μ2 = … = μc (c:groups) H1: Not all μj are equal (j = 1, 2, …, c)
The Fstat test statistic is examined after variances are computed as followsi:
Source of Variation
Degree of Freedom
Sum of Squares Mean Squares (Variance)
F
Among Groups
c -‐ 1 SSA
MSA (SSA / c-‐1)
Within Groups
n -‐ c SSW
MSW (SSW / n-‐c)
Total n -‐ 1 SST
MST (SST / n-‐1)
Fstat
=MSA/MSW
Two Way-‐ANOVA When there are two factors of interest, the analysis is extended to Two-‐way ANOVA. In this analysis, we can see whether there is interaction effect in addition to each factor effect. If the interaction effect is significant, each factor cannot be examined in this analysis. The Simple Linear Regression The simple linear regression is used to examine whether there is a linear relationship between two variables with t-‐stat test statistic, when the four assumptions are accepted: linearity, independence of errors, normality of errors, and equal variance. The model and hypotheses are the followings: Yi = β0 + β1Xi + εi (Yi: independent variable, Xi: dependent variable, εi: random error term)
H0: β1 = 0 (no linear relationship) H1: β1 ≠ 0 (linear relationship exists)
i David M. Levin et al., Statistics for Managers using Microsoft Excel (Pearson, sixth edition), 413.