Embed Size (px)
Citation preview

1
CES 341:Transportation Engineering and Planning
Chapter 8Traffic Analysis Techniques
Asst. Prof. Dr. Mongkut PiantanakulchaiEmail: [email protected]

CES 341 Transportation Engineering and
Planning
Chapter8: Traffic Analysis Techniques 2
8.1 Space-Time Relationships
Figure 8.1 Space-time diagram
t1
t2

CES 341 Transportation Engineering and
Planning
Chapter8: Traffic Analysis Techniques 3
8.1 Space-Time Relationships
t1
t2
Note: Assume vehicle’s length is negligible

CES 341 Transportation Engineering and
Planning
Chapter8: Traffic Analysis Techniques 4
8.1.1 Direct Graphical SolutionFig. 8.2 Location and size of double-track sections
Transit systemSingle track
15 km longTrain 10 min
interval dispatched from each end (W-E)
5 min layoversNeglect stop
time at stations
Uniform speed 45 km/h both directions
• Determine number and location of double-track sections, and the minimum length required for such sections in order for trains running as much as 2 min behind schedule to pass one another without delay

CES 341 Transportation Engineering and
Planning
Chapter8: Traffic Analysis Techniques 5
8.1.1 Direct Graphical Solution Fig. 8.3 Train dispatch problem
Rail line 90 km long
7.5 km long double-track section located between 60-67.5 km from W end
A train leaves W end at 1:00 p.m. and travel E at constant speed of 45 km/h
The second train leaves from the E end at 1:30 p.m. and may travel at any speed up to 90 km/h
1) Determine earliest time the W-bound train can arrive at the W end of the line2) Determine the latest dispatch time (after 1:00 p.m.) that will allow the W-bound train to reach its destination without unnecessary delay

CES 341 Transportation Engineering and
Planning
Chapter8: Traffic Analysis Techniques 6
8.1.2 Development of Analytical Solutions
Complicated space-time problems Space-time diagrams are used to
derive analytical solutions

CES 341 Transportation Engineering and
Planning
Chapter8: Traffic Analysis Techniques 7
Example: Runway Capacity Analysis
Fig. 8.4 Time separation at runway threshold, vi ≤ vj
Fig. 8.5 Time separation at runway threshold, vi ≥ vj
jij vt
ijjij vvvt
11

CES 341 Transportation Engineering and
Planning
Chapter8: Traffic Analysis Techniques 8
Example: Runway Capacity Analysis
iji j
ijmin tph
jiij ppp
minhC
1
Weighted average of interarrival time
where pij = probability of arrival pair i-j
Note: Assume arrivals only, no departuresMore details in CES 446 Port and Airport Engineering
If arrivals are independent
(10.2)
(10.3)
Capacity is expressed by
(10.1)

CES 341 Transportation Engineering and
Planning
Chapter8: Traffic Analysis Techniques 9
8.1.3 Development of Simulation Models
More complicated problems Space-time diagrams are used to develop
simulation models Behavior of system in a step-by-step manner

CES 341 Transportation Engineering and
Planning
Chapter8: Traffic Analysis Techniques 10
Example: Block Signal Control System for Rail Line Objective: To protect
train collisions and other hazards such as broken rails
System consists of• Electronically
insulated section of tracks = blocks
• Train detection system: to determine if a train is in a particular block (the block is occupied)
• Signal system (warn or control)
System of blocks and aspects (combination of signal lights)

CES 341 Transportation Engineering and
Planning
Chapter8: Traffic Analysis Techniques 11
Example: Block Signal Control System for Rail Line
Fig. 8.6 Block signal control systems

CES 341 Transportation Engineering and
Planning
Chapter8: Traffic Analysis Techniques 12
Example: Block Signal Control System
0.75 km long blocks Three-block, four aspect system
•RR –stop and proceed at 7.5 km/h prepared to stop
•RY – proceed at 30 km/h, prepare to stop at next signal
•GY – proceed at 60 km/h
•GG – proceed at full speed
CES 341 Transportation Engineering and
Planning
Chapter8: Traffic Analysis Techniques 13
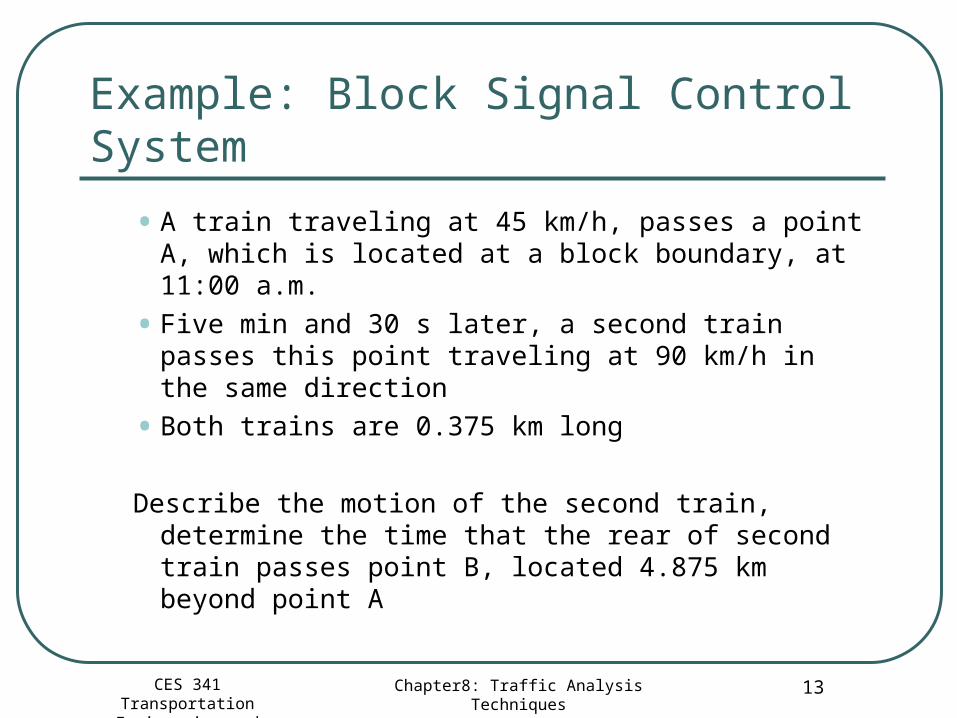
Example: Block Signal Control System
•A train traveling at 45 km/h, passes a point A, which is located at a block boundary, at 11:00 a.m.
•Five min and 30 s later, a second train passes this point traveling at 90 km/h in the same direction
•Both trains are 0.375 km long
Describe the motion of the second train, determine the time that the rear of second train passes point B, located 4.875 km beyond point A

CES 341 Transportation Engineering and
Planning
Chapter8: Traffic Analysis Techniques 14
Time-space diagram of the first train

CES 341 Transportation Engineering and
Planning
Chapter8: Traffic Analysis Techniques 15
Signal indication after the first train

CES 341 Transportation Engineering and
Planning
Chapter8: Traffic Analysis Techniques 16
Trajectory of the second train according to block signals

CES 341 Transportation Engineering and
Planning
Chapter8: Traffic Analysis Techniques 17
Trajectory of the second train (front) according to block signals

CES 341 Transportation Engineering and
Planning
Chapter8: Traffic Analysis Techniques 18
Trajectory of the second train (front&rear) according to block signals

CES 341 Transportation Engineering and
Planning
Chapter8: Traffic Analysis Techniques 19
8.14 Non-trajectory Space-Time Diagrams
Display information about traffic states (speed, flow rate, density) as well as vehicle trajectories
Contour diagram can be used to display region with similar traffic state values

CES 341 Transportation Engineering and
Planning
Chapter8: Traffic Analysis Techniques 20
8.14 Non-trajectory Space-Time Diagrams
Figure 8.11 Speed contours
CES 341 Transportation Engineering and
Planning
Chapter8: Traffic Analysis Techniques 21
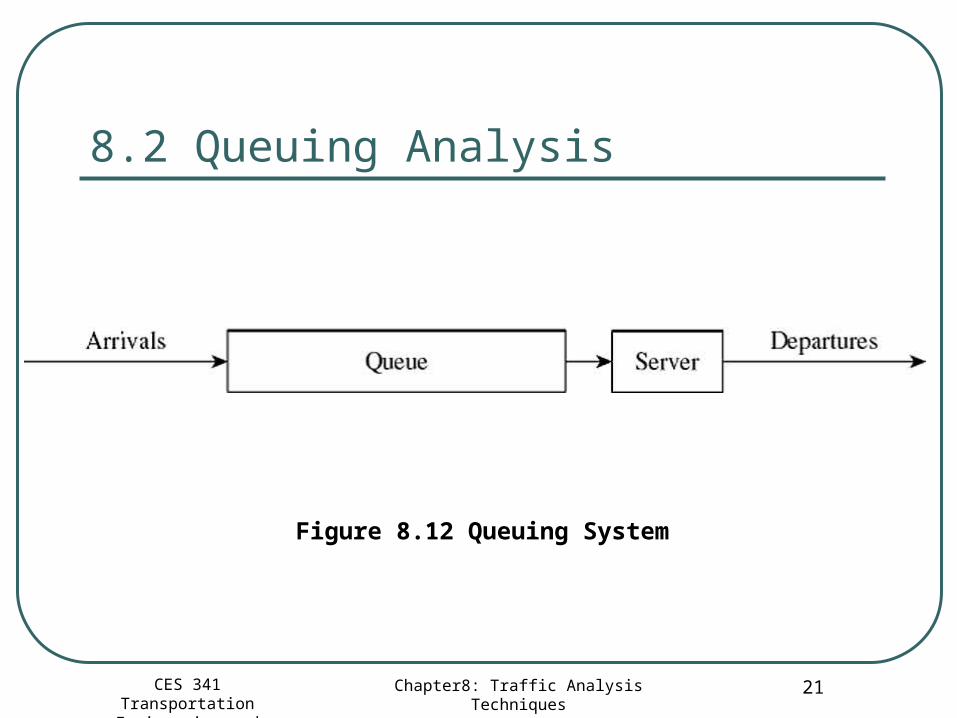
8.2 Queuing Analysis
Figure 8.12 Queuing System

CES 341 Transportation Engineering and
Planning
Chapter8: Traffic Analysis Techniques 22
8.2.1 Queuing Theory Fundamentals
Figure 8.13 Arrival function for airport runway
Figure 8.14 Arrival and departure functions for airport runway

CES 341 Transportation Engineering and
Planning
Chapter8: Traffic Analysis Techniques 23
8.2.1 Queuing Theory Fundamentals
Figure 8.14 Queuing diagram features
Figure 8.14 Queuing diagram, smooth curve approximation

CES 341 Transportation Engineering and
Planning
Chapter8: Traffic Analysis Techniques 24
8.2.2 Queue Discipline
First-in, first-out (FIFO) Last-in, first-out (LIFO) Random service Priority service
CES 341 Transportation Engineering and
Planning
Chapter8: Traffic Analysis Techniques 25
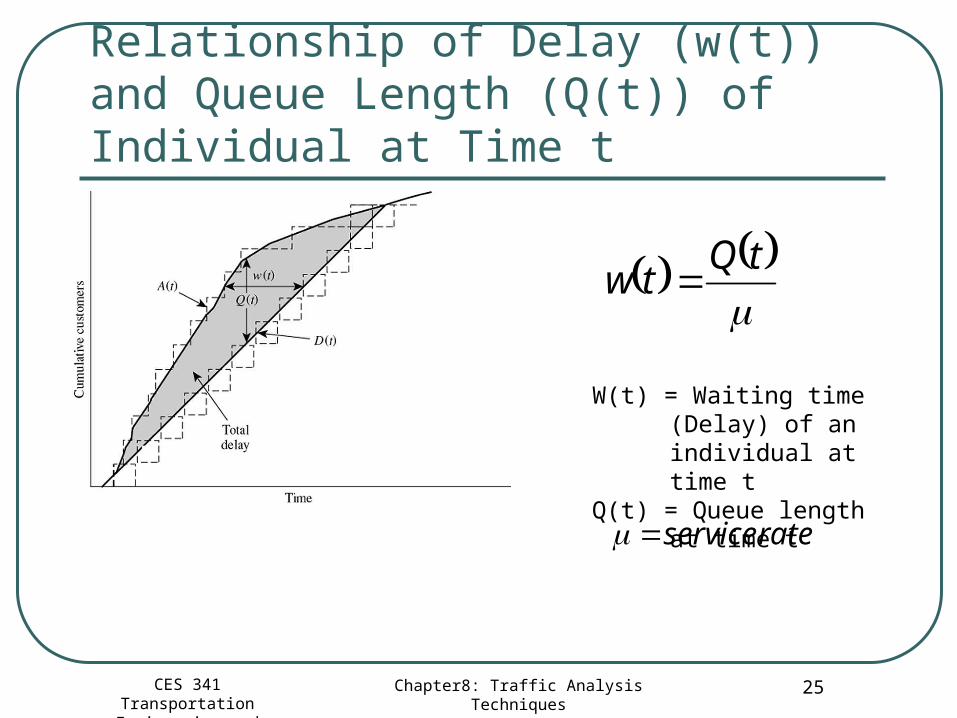
Relationship of Delay (w(t)) and Queue Length (Q(t)) of Individual at Time t
tQ
tw
W(t) = Waiting time (Delay) of an individual at time t
Q(t) = Queue length at time t
rateservice

CES 341 Transportation Engineering and
Planning
Chapter8: Traffic Analysis Techniques 26
8.2.3 Stochastic Queuing Models
Deterministic queuing models – arrival and service rate are deterministic (known as some function)
Stochastic queuing models • constant long term arrival and service rates
• short-term random fluctuations around the average rates
• arrival rate may exceed service rate for short time intervals and queues will form

CES 341 Transportation Engineering and
Planning
Chapter8: Traffic Analysis Techniques 27
Stochastic Queuing Models
M/D/1
M/M/1
ArrivalsExponentiallyDistributed
ServiceDeterministic(No random variation)
One Channel
Inter-arrival times followNegative Exponential Distribution

CES 341 Transportation Engineering and
Planning
Chapter8: Traffic Analysis Techniques 28
M/D/1
12
2
12
1
2
t
w
Q
system in thespent
timeaveraget
time waitingaveragew
length queue averageQ
intensitytraffic
rateservice
ratearrival

CES 341 Transportation Engineering and
Planning
Chapter8: Traffic Analysis Techniques 29
M/M/1
1
1
2
t
w
Q
system in thespent
timeaveraget
time waitingaveragew
length queue averageQ
intensitytraffic
rateservice
ratearrival

CES 341 Transportation Engineering and
Planning
Chapter8: Traffic Analysis Techniques 30
General relationships
1
wt
tQ

CES 341 Transportation Engineering and
Planning
Chapter8: Traffic Analysis Techniques 31
8.2.4 Transportation Applications of Queuing Theory
Server opens after arrivals beginArrival rate temporary exceedsconstant service rate
Service rate varies Server temporarily shut down

CES 341 Transportation Engineering and
Planning
Chapter8: Traffic Analysis Techniques 32
8.2.5 Queue Density, Storage, and Spillback
Density (vehicles per unit distance) Occupancy – fraction of time vehicles
are over the detector Objectives of studying queue density
•Locating queues and bottlenecks in traffic
•Determine the length of the queue and space needed for queue storage, control the queue spillback to upstream section

CES 341 Transportation Engineering and
Planning
Chapter8: Traffic Analysis Techniques 33
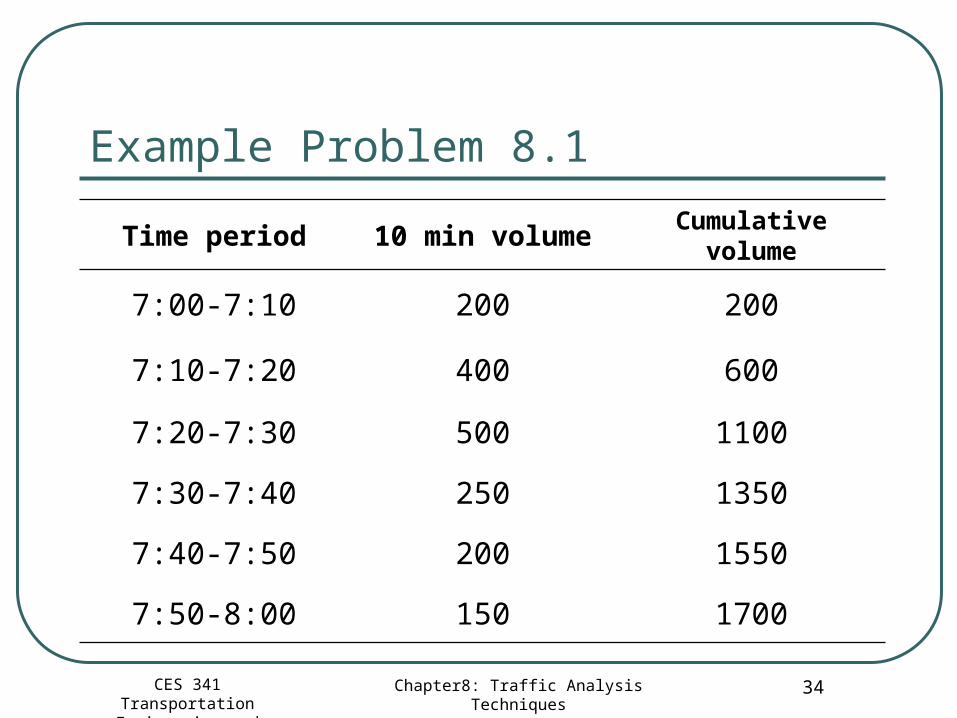
Example Problem 8.1
Morning peak traffic upstream of a toll booth is given in the table
The toll plaza consists of three booths, each of which can handle an average of one vehicle every 6 s.
Using queuing diagram, determine the maximum queue, the longest delay to an individual vehicle, and the total delay
CES 341 Transportation Engineering and
Planning
Chapter8: Traffic Analysis Techniques 34
Example Problem 8.1
Time period 10 min volumeCumulative
volume
7:00-7:10 200 200
7:10-7:20 400 600
7:20-7:30 500 1100
7:30-7:40 250 1350
7:40-7:50 200 1550
7:50-8:00 150 1700

CES 341 Transportation Engineering and
Planning
Chapter8: Traffic Analysis Techniques 358-21
300 veh/min, D(t)
Cumulative volume, A(t)
D(t)>A(t) {Show A(t), No queues}

CES 341 Transportation Engineering and
Planning
Chapter8: Traffic Analysis Techniques 36
8.3 Network Analysis
Network•Nodes : Usually points of facilities intersect
•Origins or destinations of trips (source or sink nodes)
•Decision points
•Links : Usually road or railway segments Link characteristics
•Link costs: Distance, travel time, generalized costs (weighted sum of several costs)

CES 341 Transportation Engineering and
Planning
Chapter8: Traffic Analysis Techniques 378-23
Network Elements

CES 341 Transportation Engineering and
Planning
Chapter8: Traffic Analysis Techniques 388-25
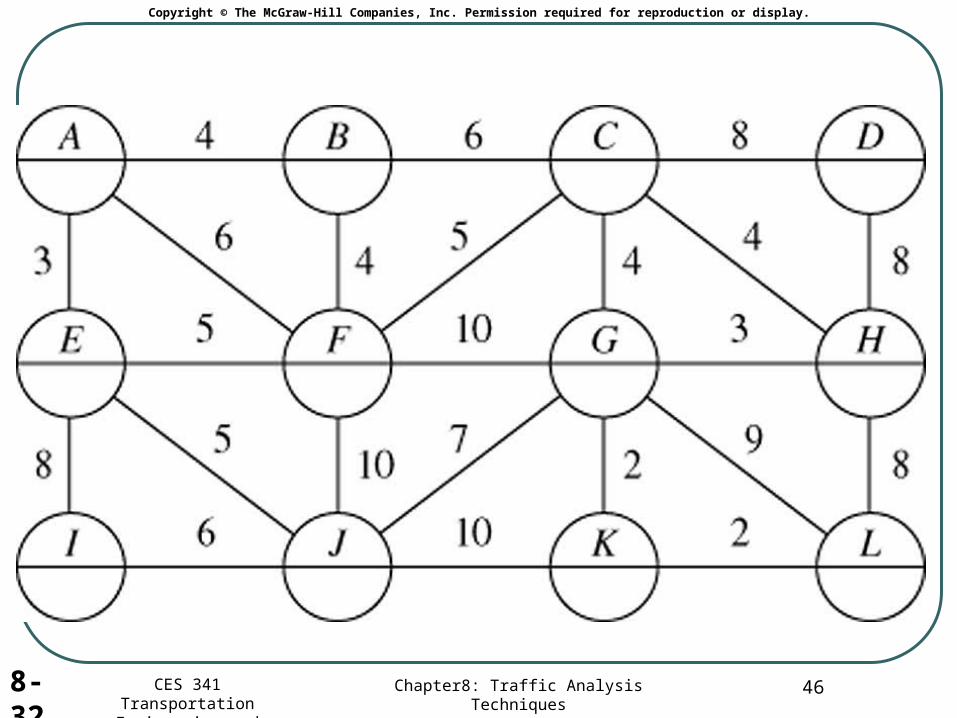
Example networkMinimum path algorithm, step 1

CES 341 Transportation Engineering and
Planning
Chapter8: Traffic Analysis Techniques 398-26
Minimum path algorithm, step 2

CES 341 Transportation Engineering and
Planning
Chapter8: Traffic Analysis Techniques 408-27
Minimum path algorithm, step 3

CES 341 Transportation Engineering and
Planning
Chapter8: Traffic Analysis Techniques 418-28
Minimum path algorithm, step 4

CES 341 Transportation Engineering and
Planning
Chapter8: Traffic Analysis Techniques 428-29
Minimum path algorithm, step 5

CES 341 Transportation Engineering and
Planning
Chapter8: Traffic Analysis Techniques 438-30
Minimum path algorithm, step 6

CES 341 Transportation Engineering and
Planning
Chapter8: Traffic Analysis Techniques 44
Table 8.1 Link-cost array
Node
Node
1 2 3 4 5 6
1 -1 8 -1 2 -1 -1
2 8 -1 4 -1 2 -1
3 -1 -1 -1 -1 -1 3
4 2 -1 -1 -1 -1 -1
5 -1 2 -1 3 -1 10
6 -1 -1 3 -1 10 -1

CES 341 Transportation Engineering and
Planning
Chapter8: Traffic Analysis Techniques 458-31
CES 341 Transportation Engineering and
Planning
Chapter8: Traffic Analysis Techniques 46
Copyright © The McGraw-Hill Companies, Inc. Permission required for reproduction or display.
8-32

CES 341 Transportation Engineering and
Planning
Chapter8: Traffic Analysis Techniques 47
Copyright © The McGraw-Hill Companies, Inc. Permission required for reproduction or display.
8-33

CES 341 Transportation Engineering and
Planning
Chapter8: Traffic Analysis Techniques 48
Copyright © The McGraw-Hill Companies, Inc. Permission required for reproduction or display.
8-34


![Guide - [ 341 ] - P4](https://img.pdfslide.us/doc/110x75/55cf8ab155034654898d0647/guide-341-p4.jpg)


![Guide - [ 341 ] - P1](https://img.pdfslide.us/doc/110x75/55cf8ab155034654898d0648/guide-341-p1.jpg)