Embed Size (px)
Citation preview

© WorldpanelTM division of TNS 2008
Edward GarnerCommunications Director Worldpanel – UK
Ethical Consumption – Market TrendsBirmingham – April 2008

© WorldpanelTM division of TNS 2008
Agenda
Background
Organic Overview
Organic Markets
Fairtrade Overview
Fairtrade Markets
Free Range
Retail Aspects
Markets & Lifestyles

© WorldpanelTM division of TNS 2008
Agenda
Background
Organic Overview
Organic Markets
Fairtrade Overview
Fairtrade Markets
Free Range
Retail Aspects
Markets & Lifestyles

© WorldpanelTM division of TNS 2008
Real Household Disposable Income Per Head
0
50
100
150
200
250
1970
1971
1972
1973
1974
1975
1976
1977
1978
1979
1980
1981
1982
1983
1984
1985
1986
1987
1988
1989
1990
1991
1992
1993
1994
1995
1996
1997
1998
1999
2000
2001
2002
2003
2004
2005
2006
2007
*
Constant Prices - Indexed on 1970Source: ONS Series IHXZ * to June

© WorldpanelTM division of TNS 2008
Food and Drink as a Proportion of UK Household Expenditure %
0
5
10
15
20
25
19
63
19
64
19
65
19
66
19
67
19
68
19
69
19
70
19
71
19
72
19
73
19
74
19
75
19
76
19
77
19
78
19
79
19
80
19
81
19
82
19
83
19
84
19
85
19
86
19
87
19
88
19
89
19
90
19
91
19
92
19
93
19
94
19
95
19
96
19
97
19
98
19
99
20
00
20
01
20
02
20
03
20
04
20
05
20
06
20
07
*
Source: ONS Series ABQI / ABZV * MAT to June

© WorldpanelTM division of TNS 2008
Premium Private Label Sales Trends
0
10
20
30
40
50
60
70
80
90
2000
2001
2002
2003
2004
2005
2006
2007
2008
Sa
les
(E
xp
en
dit
ure
£m
)
Tesco Finest Sainsbury Taste the Difference Asda Extra Special Safeway/MorrisonsThe Best

© WorldpanelTM division of TNS 2008
Tesco PL Lifestyle Indices
Tesco Finest
Tesco Value
“I regard myself as a connoisseur of food and wine”
158 75
“Price is the most important factor when buying a product”
76 133
Share indexed on Total Trade – 52 w/e Apr 22 2007

“We are seeing a shift away from value-for-money to
what we call
[Prof. Tim Lang, City University Jan 2007]
‘values-for-money’….”

© WorldpanelTM division of TNS 2008
Hard Discounters Share of Till Roll Grocers
0
1
2
3
4
5
6
7
Ap
r 24
200
5
May
22
2005
Jun
19
2005
Jul 1
7 20
05
Au
g 1
4 20
05
Sep
11
2005
Oct
09
2005
No
v 06
200
5
Dec
04
2005
Jan
01
2006
Jan
29
2006
Feb
26
2006
Mar
26
2006
Ap
r 23
200
6
May
21
2006
Jun
18
2006
Jul 1
6 20
06
Au
g 1
3 20
06
Sep
10
2006
Oct
08
2006
No
v 05
200
6
Dec
03
2006
Dec
31
2006
Jan
28
2007
Feb
25
2007
Mar
25
2007
Ap
r 22
200
7
May
20
2007
Jun
17
2007
Jul 1
5 20
07
Au
g 1
2 20
07
Sep
09
2007
Oct
07
2007
No
v 04
200
7
Dec
02
2007
Dec
30
2007
Jan
27
2008
Feb
24
2008
Mar
23
2008
Weekly 3 Point Centred Moving Average
Sh
are
(E
xp
en
dit
ure
)
Aldi / Lidl / Netto Aldi / Lidl / Netto Baseline

© WorldpanelTM division of TNS 2008
Long-Term Share of Till Roll Grocers
0
1
2
3
4
19
93
19
94
19
95
19
96
19
97
19
98
19
99
20
00
20
01
20
02
20
03
20
04
20
05
20
06
20
07
20
08
Sh
are
(E
xp
en
dit
ure
)
Aldi Lidl Netto

© WorldpanelTM division of TNS 2008
Kwik Save Share of Till Roll Grocers
0
0.5
1
1.5
2
Ap
r 24
200
5
May
22
2005
Jun
19
2005
Jul 1
7 20
05
Au
g 1
4 20
05
Sep
11
2005
Oct
09
2005
No
v 06
200
5
Dec
04
2005
Jan
01
2006
Jan
29
2006
Feb
26
2006
Mar
26
2006
Ap
r 23
200
6
May
21
2006
Jun
18
2006
Jul 1
6 20
06
Au
g 1
3 20
06
Sep
10
2006
Oct
08
2006
No
v 05
200
6
Dec
03
2006
Dec
31
2006
Jan
28
2007
Feb
25
2007
Mar
25
2007
Ap
r 22
200
7
May
20
2007
Jun
17
2007
Jul 1
5 20
07
Au
g 1
2 20
07
Sep
09
2007
Oct
07
2007
No
v 04
200
7
Dec
02
2007
Dec
30
2007
Jan
27
2008
Feb
24
2008
Mar
23
2008
Weekly 3 Point Centred Moving Average
Sh
are
(E
xp
en
dit
ure
)
Kwik Save Kwik Save Baseline

© WorldpanelTM division of TNS 2008
Kwik Save + Discounters
0
1
2
3
4
5
6
7
8
12-S
ep-0
4
10-O
ct-0
4
07-N
ov-0
4
05-D
ec-0
4
02-J
an-0
5
30-J
an-0
5
27-F
eb-0
5
27-M
ar-0
5
24-A
pr-0
5
22-M
ay-0
5
19-J
un-0
5
17-J
ul-0
5
14-A
ug-0
5
11-S
ep-0
5
09-O
ct-0
5
06-N
ov-0
5
04-D
ec-0
5
01-J
an-0
6
29-J
an-0
6
26-F
eb-0
6
26-M
ar-0
6
23-A
pr-0
6
21-M
ay-0
6
18-J
un-0
6
16-J
ul-0
6
13-A
ug-0
6
10-S
ep-0
6
08-O
ct-0
6
05-N
ov-0
6
03-D
ec-0
6
31-D
ec-0
6
28-J
an-0
7
25-F
eb-0
7
25-M
ar-0
7
22-A
pr-0
7
20-M
ay-0
7
17-J
un-0
7
15-J
ul-0
7
12-A
ug-0
7
09-S
ep-0
7
07-O
ct-0
7
04-N
ov-0
7
02-D
ec-0
7
30-D
ec-0
7
27-J
an-0
8
24-F
eb-0
8
23-M
ar-0
8
Kwik Save + Discounters

© WorldpanelTM division of TNS 2008
12
6
39
1
2
11
10
5
4
7
8
12
6
39
1
2
11
10
5
4
7
8
12
6
39
1
2
11
10
5
4
7
8
12
6
39
1
2
11
10
5
4
7
8
34%
11%
55%
40%
23%
37%
Usage occasionsby stated reasons
1995 2007Source: TNS Worldpanel Usage, Foods ConsumptionYear to August 2007

© WorldpanelTM division of TNS 2008
Agenda
Background
Organic Overview
Organic Markets
Fairtrade Overview
Fairtrade Markets
Free Range
Retail Aspects
Markets & Lifestyles

© WorldpanelTM division of TNS 2008
0
10
20
30
40
50
60
70
80
90
1001998
1999
2000
2001
2002
2003
2004
2005
2006
2007
2008
£m’s
Total Organic Products
Annualised Value = £1,300m

7.50.121.721.60Price per Vol
-8.9-0.161.61.8Trip Vol
-2.1-0.062.762.81Trip Spend
-2.1-0.6329.830.4AWP (Vol per Buyer)
5.22.5551.1748.62AWP (Spend per Buyer)
7.51.2918.617.3Purchase Frequency
7.05.7888.883.0Penetration %
5.534185655777621592Volume (000s Units)
13.41328451126755993911Expenditure (£000s)
% Change
Actual Change
52 w/e 23 Mar 08
52 w/e 25 Mar 07
-2E+05
-1E+05
-50000 0 50000 100000
150000
200000
250000
Penetration % Purchase Frequency
Trip Vol Price per Vol
Key Performance Indicators for Organic Grocery –Value up 13.4% worth £132.8m
Expenditure (£000s)
Volume (000s Units)
Penetration % *
Purchase FrequencyTrip Vol
AWP (Vol per Buyer)
Price per Vol
£1126.8m +13.4%
Increase of £132.8m
655.8m vol +5.5%
Contribution = £59.7m
88.8% +7%
Contribution = £75.7m
18.6 trips +7.5%
Contribution = £73.3m
1.6 vol -8.9%
Contribution = -£89.3m
29.8 vol -2.1%
Contribution = -£16m
£1.72 +7.5%
Contribution = £73.1m
* Pen Contribution includes Population
growth of 0.7%

© WorldpanelTM division of TNS 2008
Total Organics-£ Spend by Frequency Group
12
37
6
20
9
17
19
14
66
1
% Homes Buying % Spend
27+
13-26 Occasions
7-12 Occasions
2-6 Occasions
1 Occasion
12% of Organic buyers purchase once during the year & account for only 1% of spend14% of Organic buyers represent 66% of money spent on Organics
52 w/e Mar 23 2008

© WorldpanelTM division of TNS 2008

© WorldpanelTM division of TNS 2008
Agenda
Background
Organic Overview
Organic Markets
Fairtrade Overview
Fairtrade Markets
Free Range
Retail Aspects
Markets & Lifestyles
© WorldpanelTM division of TNS 2008
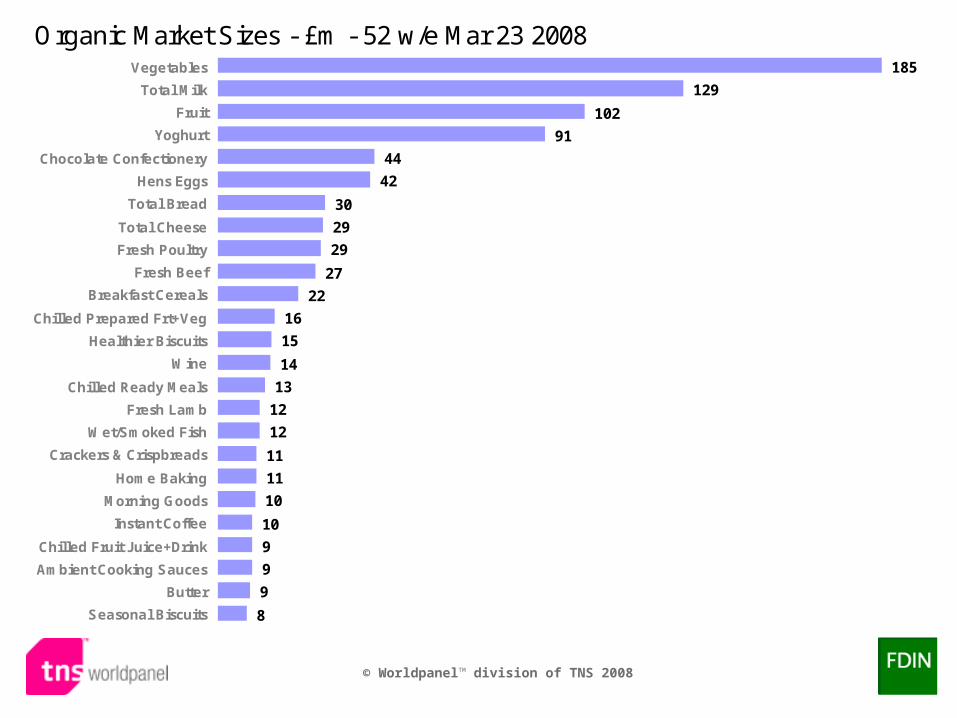
Organic Market Sizes - £m - 52 w/e Mar 23 2008185
129
102
91
44
42
30
29
29
27
22
16
15
14
13
12
12
11
11
10
10
9
9
9
8
Vegetables
Total Milk
Fruit
Yoghurt
Chocolate Confectionery
Hens Eggs
Total Bread
Total Cheese
Fresh Poultry
Fresh Beef
Breakfast Cereals
Chilled Prepared Frt+Veg
Healthier Biscuits
Wine
Chilled Ready Meals
Fresh Lamb
Wet/Smoked Fish
Crackers & Crispbreads
Home Baking
Morning Goods
Instant Coffee
Chilled Fruit Juice+Drink
Ambient Cooking Sauces
Butter
Seasonal Biscuits

© WorldpanelTM division of TNS 2008
Organic Proportion - £% - 52 w/e Mar 23 200824.4
16.9
12.2
9.2
9.1
8.9
8.3
8.1
7.4
6.8
6.7
6.6
6.5
6.3
5.9
4.8
4.7
4.7
4.5
4.4
4.3
4.2
4.0
3.9
3.8
Chilled Gravy+Stock
Canned Lemonade
Herbal Tea
Dry Pulses+Cereal
Ambient Flavoured Milk
Yoghurt
Vinegar
Ambient Vgtrn Products
Peanut Butter
Chilled Vegetarian
Hens Eggs
Honey
Flour
Syrup & Treacle
Chilled Salad Accomps
Cous Cous
Seasonal Biscuits
Liquid+Grnd Coffee+Beans
Crackers & Crispbreads
Total Milk
Vegetable
Dry Pasta
Healthier Biscuits
Tomato Products
Fresh Soup

© WorldpanelTM division of TNS 2008
Organic Growth - £m - 52 w/e Mar 23 2008 v. year ago17.6
14.1
14.0
9.4
7.7
7.0
5.3
3.7
3.7
3.0
2.9
2.8
2.6
2.4
2.4
2.2
2.1
2.0
2.0
1.9
1.8
1.7
1.5
1.3
1.3
Vegetables
Chocolate Confectionery
Total Milk
Yoghurt
Seasonal Biscuits
Fruit
Hens Eggs
Fresh Beef
Crackers & Crispbreads
Chilled Prepared Frt+Veg
Wine
Fresh Poultry
Shellfish
Chilled Ready Meals
Total Cheese
Nuts
Chilled Desserts
Beer+Lager
Fresh Sausages
Total Bread
Cooked Meats
Fresh Bacon Rashers
Dry Pasta
Tomato Products
Home Baking

© WorldpanelTM division of TNS 2008
Agenda
Background
Organic Overview
Organic Markets
Fairtrade Overview
Fairtrade Markets
Free Range
Retail Aspects
Markets & Lifestyles

-22.2-0.541.882.41Price per Vol
-7.9-0.060.70.8Trip Vol
-28.4-0.531.351.88Trip Spend
53.02.938.45.5AWP (Vol per Buyer)
19.02.5315.8513.32AWP (Spend per Buyer)
66.14.6811.77.1Purchase Frequency
23.612.8167.154.3Penetration %
90.46681714072973912Volume (000s Units)
48.185718264002178284Expenditure (£000s)
% Change
Actual Change
52 w/e 23 Mar 08
52 w/e 25 Mar 07
-100000 -50000 0 50000 100000 150000 200000
Penetration % Purchase Frequency
Trip Vol Price per Vol
Key Performance Indicators for Fairtrade Grocery –Value up 48.1% worth £85.7m
Expenditure (£000s)
Volume (000s Units)
Penetration % *
Purchase FrequencyTrip Vol
AWP (Vol per Buyer)
Price per Vol
£264m +48.1%
Increase of £85.7m
140.7m vol +90.4%
Contribution = £129.4m
67.1% +23.6%
Contribution = £39.1m
11.7 trips +66.1%
Contribution = £105.8m
0.7 vol -7.9%
Contribution = -£15.5m
8.4 vol +53%
Contribution = £90.3m
£1.88 -22.2%
Contribution = -£43.7m
* Pen Contribution includes Population
growth of 0.7%

© WorldpanelTM division of TNS 2008
Total Fairtrade-£ Spend by Frequency Group
27
41
19
14
17
12
28
6
32
4
% Homes Buying % Spend
27+
13-26 Occasions
7-12 Occasions
2-6 Occasions
1 Occasion
27% of Fairtrade buyers purchase once during the year & account for only 4% of spend6% of Fairtrade buyers represent 32% of money spent on Fairtrade
52 w/e Mar 23 2008

© WorldpanelTM division of TNS 2008
Agenda
Background
Organic Overview
Organic Markets
Fairtrade Overview
Fairtrade Markets
Free Range
Retail Aspects
Markets & Lifestyles

© WorldpanelTM division of TNS 2008
Fairtrade Market Sizes - £m - 52 w/e Mar 23 2008140.4
27.0
21.2
20.3
15.0
13.6
4.4
2.8
2.0
1.6
1.5
1.4
1.4
1.4
1.4
1.3
1.1
1.1
0.9
0.7
0.7
0.4
0.4
0.3
0.2
Fruit
Instant Coffee
Liquid+Grnd Coffee+Beans
Tea
Chocolate Confectionery
Wine
Food Drinks
Sugar
Ambnt Fruit/Yght Juc+Drnk
Chocolate Biscuit Bars
Ambient Cakes+Pastries
Vegetables
Preserves
Nuts
Beer+Lager
Total Ice Cream
Honey
Healthier Biscuits
Powd Desserts&Custard
Home Baking
Herbs+Spices
Crackers & Crispbreads
Chilled Fruit Juice+Drink
Chilled Prepared Frt+Veg
Breakfast Cereals

© WorldpanelTM division of TNS 2008
Fairtrade Proportion - £% - 52 w/e Mar 23 200814.7
4.5
4.43.8
2.9
1.51.4
1.1
1.00.9
0.8
0.60.50.50.4
0.40.40.4
0.30.20.2
0.20.20.1
0.1
Liquid+Grnd Coffee+Beans
Tea
Instant Coffee
Fruit
Food Drinks
Honey
Powd Desserts&Custard
Sugar
Ambient Sponge Puddings
Preserves
Chocolate Confectionery
Herbs+Spices
Nuts
Chocolate Biscuit Bars
Ambnt Fruit/Yght Juc+Drnk
Wine
Chocolate Spread
Chilled Flavoured Milk
Healthier Biscuits
Total Ice Cream
Home Baking
Crackers & Crispbreads
Special Treats
Chilled One Shot Drinks
Ambient Cakes+Pastries

© WorldpanelTM division of TNS 2008
Fairtrade Growth - £m - 52 w/e Mar 23 2008 v. year ago72.9
2.9
2.4
1.1
1.0
1.0
0.9
0.9
0.9
0.9
0.7
0.7
0.6
0.5
0.4
0.4
0.2
0.1
0.1
0.1
0.1
0.1
0.1
0.0
0.0
Fruit
Wine
Chocolate Confectionery
Sugar
Beer+Lager
Preserves
Instant Coffee
Powd Desserts&Custard
Liquid+Grnd Coffee+Beans
Chocolate Biscuit Bars
Total Ice Cream
Healthier Biscuits
Nuts
Herbs+Spices
Home Baking
Crackers & Crispbreads
Chilled Prepared Frt+Veg
Chilled Flavoured Milk
Ambient Sponge Puddings
Chilled Fruit Juice+Drink
Honey
Vegetable
Cleaning Accessories
Ambient One Shot Drinks
Breakfast Cereals

© WorldpanelTM division of TNS 2008
Agenda
Background
Organic Overview
Organic Markets
Fairtrade Overview
Fairtrade Markets
Free Range
Retail Aspects
Markets & Lifestyles

© WorldpanelTM division of TNS 2008
Hens Eggs - Pricing Trends
4p
6p
8p
10p
12p
14p
16p
18p
20p
22p
24p
26p
28p
30p
32p
19
98
19
99
20
00
20
01
20
02
20
03
20
04
20
05
20
06
20
07
20
08
Free Range Non-Free Range Organic
Ave. Price per Egg

© WorldpanelTM division of TNS 2008
Hens Eggs - Organic Share Trends
0
1
2
3
4
5
6
7
8
9
19
98
19
99
20
00
20
01
20
02
20
03
20
04
20
05
20
06
20
07
20
08
Organic
Share - £%

© WorldpanelTM division of TNS 2008
Hens Eggs - 'Free Range' Share Trends
28
30
32
34
36
38
40
42
44
46
48
50
52
54
56
58
60
19
98
19
99
20
00
20
01
20
02
20
03
20
04
20
05
20
06
20
07
20
08
Free Range
Share - £%

© WorldpanelTM division of TNS 2008
Free Range Eggs - Performance Analysis
39.4 40.6
46.148.1
52.054.3
147140
133 132 134 138
20
25
30
35
40
45
50
55
60
52 w/e Jul 21 2002
52 w/e Jul 20 2003
52 w/e Jul 17 2005
52 w/e Mar26 2006
52 w/e Mar25 2007
52 w/e Mar23 2008
Sh
are
£%
100
150
200
250
Pri
ce p
er V
olu
me
Ind
ex
Share of Eggs Price per Volume Index

© WorldpanelTM division of TNS 2008
Free Range Chickens - Performance Analysis
7.48.0
9.0
129137 138
0
5
10
52 w/e Mar 26 2006 52 w/e Mar 25 2007 52 w/e Mar 23 2008
Sh
are
£%
100
150
200
250
Pri
ce p
er V
olu
me
Ind
ex
Share of Chickens Price per Volume Index

© WorldpanelTM division of TNS 2008
Free-range Market Share
0
2
4
6
8
10
12
14
Ap
r 2
4 2
00
5
Ma
y 2
2 2
00
5
Jun
19
20
05
Jul 1
7 2
00
5
Au
g 1
4 2
00
5
Se
p 1
1 2
00
5
Oct
09
20
05
No
v 0
6 2
00
5
De
c 0
4 2
00
5
Jan
01
20
06
Jan
29
20
06
Fe
b 2
6 2
00
6
Ma
r 2
6 2
00
6
Ap
r 2
3 2
00
6
Ma
y 2
1 2
00
6
Jun
18
20
06
Jul 1
6 2
00
6
Au
g 1
3 2
00
6
Se
p 1
0 2
00
6
Oct
08
20
06
No
v 0
5 2
00
6
De
c 0
3 2
00
6
De
c 3
1 2
00
6
Jan
28
20
07
Fe
b 2
5 2
00
7
Ma
r 2
5 2
00
7
Ap
r 2
2 2
00
7
Ma
y 2
0 2
00
7
Jun
17
20
07
Jul 1
5 2
00
7
Au
g 1
2 2
00
7
Se
p 0
9 2
00
7
Oct
07
20
07
No
v 0
4 2
00
7
De
c 0
2 2
00
7
De
c 3
0 2
00
7
Jan
27
20
08
Fe
b 2
4 2
00
8
Ma
r 2
3 2
00
8
Chickens

© WorldpanelTM division of TNS 2008
Free-range Market Share
0
10
20
30
40
50
60
70
Ap
r 2
4 2
00
5
Ma
y 2
2 2
00
5
Jun
19
20
05
Jul 1
7 2
00
5
Au
g 1
4 2
00
5
Se
p 1
1 2
00
5
Oct
09
20
05
No
v 0
6 2
00
5
De
c 0
4 2
00
5
Jan
01
20
06
Jan
29
20
06
Fe
b 2
6 2
00
6
Ma
r 2
6 2
00
6
Ap
r 2
3 2
00
6
Ma
y 2
1 2
00
6
Jun
18
20
06
Jul 1
6 2
00
6
Au
g 1
3 2
00
6
Se
p 1
0 2
00
6
Oct
08
20
06
No
v 0
5 2
00
6
De
c 0
3 2
00
6
De
c 3
1 2
00
6
Jan
28
20
07
Fe
b 2
5 2
00
7
Ma
r 2
5 2
00
7
Ap
r 2
2 2
00
7
Ma
y 2
0 2
00
7
Jun
17
20
07
Jul 1
5 2
00
7
Au
g 1
2 2
00
7
Se
p 0
9 2
00
7
Oct
07
20
07
No
v 0
4 2
00
7
De
c 0
2 2
00
7
De
c 3
0 2
00
7
Jan
27
20
08
Fe
b 2
4 2
00
8
Ma
r 2
3 2
00
8
Chickens
Hens eggs

© WorldpanelTM division of TNS 2008
Agenda
Background
Organic Overview
Organic Markets
Fairtrade Overview
Fairtrade Markets
Free Range
Retail Aspects
Markets & Lifestyles

© WorldpanelTM division of TNS 2008
I Regard Myself As A Connoisseur Of Food And Wine 215I Am Prepared To Pay More For Organic Food 202Country Of Origin Is Important To Me When Choosing Groceries 169The BBC Is An Institution That I Can Rely On 163I Look For Supermarkets That Are Less Crowded And Less Stressful To Shop In 160I Think It Is Worth Paying More To Shop Where I Can Get In And Out Of Quickly 159I Try To Support Regional Food Producers 159I Am Prepared To Pay More For Quality Ingredients 155I Try To Buy Local Produce Whenever I Can 145I Feel Good About Buying Fair Trade Products 145I Buy Free Range Products Whenever I Can 145I Always Pay My Credit Card Bills In Full 143I Eat Out Regularly 143I Believe In A Holistic Approach To Medical Treatment 140I Try To Buy Environmentally Friendly Products 139I Don't Tend To Compromise On Quality If I Can't Find What I Want 138I Don't Mind Paying For Quality 136I Think Of Myself As A Brand Loyal Consumer 136I Think We Should All Try To Buy More Fair Trade Products 135I/My Partner Enjoy Cooking To Entertain Friends And Family 134
Worldpanel Lifestyles - Waitrose Share Index
Till Roll Share indexed on All Shoppers – 52 w/e Feb 24 2008
© WorldpanelTM division of TNS 2008
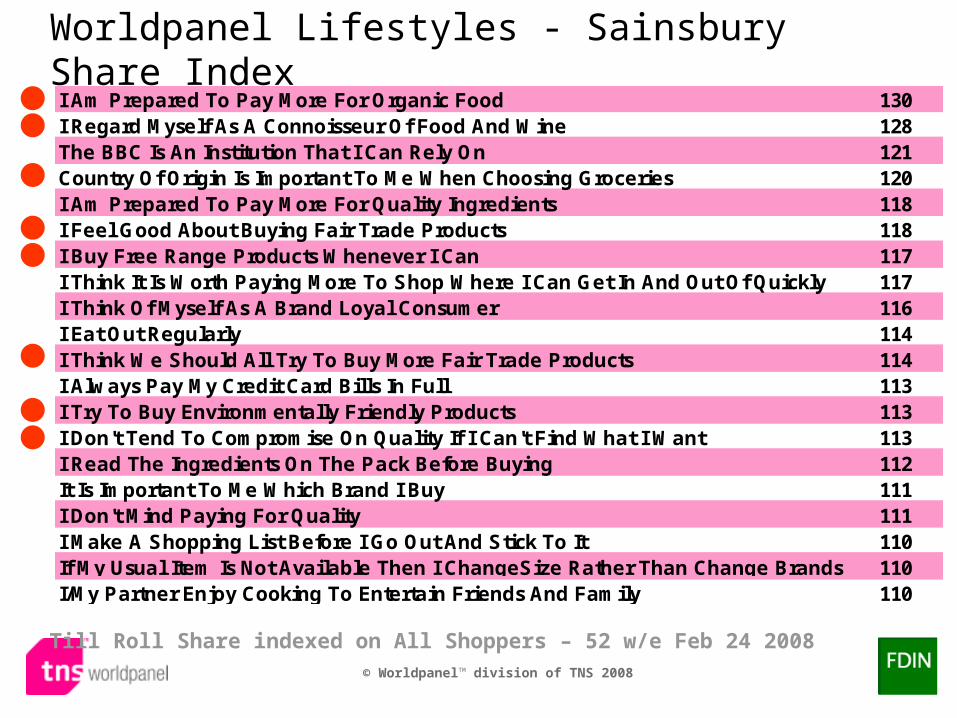
I Am Prepared To Pay More For Organic Food 130I Regard Myself As A Connoisseur Of Food And Wine 128The BBC Is An Institution That I Can Rely On 121Country Of Origin Is Important To Me When Choosing Groceries 120I Am Prepared To Pay More For Quality Ingredients 118I Feel Good About Buying Fair Trade Products 118I Buy Free Range Products Whenever I Can 117I Think It Is Worth Paying More To Shop Where I Can Get In And Out Of Quickly 117I Think Of Myself As A Brand Loyal Consumer 116I Eat Out Regularly 114I Think We Should All Try To Buy More Fair Trade Products 114I Always Pay My Credit Card Bills In Full 113I Try To Buy Environmentally Friendly Products 113I Don't Tend To Compromise On Quality If I Can't Find What I Want 113I Read The Ingredients On The Pack Before Buying 112It Is Important To Me Which Brand I Buy 111I Don't Mind Paying For Quality 111I Make A Shopping List Before I Go Out And Stick To It 110If My Usual Item Is Not Available Then I ChangeSize Rather Than Change Brands 110I/My Partner Enjoy Cooking To Entertain Friends And Family 110
Till Roll Share indexed on All Shoppers – 52 w/e Feb 24 2008
Worldpanel Lifestyles - Sainsbury Share Index

© WorldpanelTM division of TNS 2008
I Visit Different Shops For The Best Prices
151
139
130
130
126
117
106
103
101
100
95
89
87
83
Netto
Lidl
Aldi
Iceland
Farm Foods
Somerfield
Morrisons
Tot Indepts
Total Co-op
Asda
Tesco
Sainsbury
M & S
Waitrose
Outlet Share Index52 w/e Feb 24 2008

© WorldpanelTM division of TNS 2008
Organic Index v Social Class
Farm FoodsNetto Aldi
LidlIndepts
Co-op
Iceland
Morrisons
Waitrose
Somerfield
Asda
Tesco
Sainsbury
Tot Grocers
0
50
100
150
200
250
300
350
400
450
20 25 30 35 40 45 50 55 60 65 70
ABC1
Org
an
ic In
de
x
52 w/e Jan 27 2008

© WorldpanelTM division of TNS 2008
The Olive Index

© WorldpanelTM division of TNS 2008
The Olive Index
M & S
Farm Foods
Netto
Aldi
LidlTot Indepts
Total Co-op
Iceland
Morrisons
Waitrose
Kwik Save
SomerfieldAsda
Tesco
Sainsbury
0
5
10
15
20
25
30
35
40
0 50 100 150 200 250 300 350 400
Olive Trading Index
% C
las
s A
B
52 w/e Mar 23 2008

© WorldpanelTM division of TNS 2008
Organic Indices
445
151
140
103
100
61
55
49
37
33
22
21
10
1
0
Waitrose
Sainsbury
M & S
Tesco
Total Grocers
Asda
Co-op
Morrisons
Tot Indepts
Somerfield
Lidl
Aldi
Netto
Farm Foods
Iceland
Share of Organic Indexed onTotal Grocery Share - 52 w/e Mar 23 2008

© WorldpanelTM division of TNS 2008
Fairtrade Indices
379
331
226
200
100
54
52
42
37
15
12
10
1
0
0
Co-op
Waitrose
Sainsbury
M & S
Total Grocers
Morrisons
Asda
Tesco
Somerfield
Lidl
Tot Indepts
Netto
Aldi
Farm Foods
Iceland
Share of Fairtrade Indexed onTotal Grocery Share - 52 w/e Mar 23 2008

© WorldpanelTM division of TNS 2008
Asda Demographic SignaturesTill RollOutlet Share within Demographic Group - MAT to March
0
5
10
15
20
25
Class AB Class C1 Class C2 Class D Class E
2006 2007 2008
Social Class
0
5
10
15
20
25
Age under28
Age 28-34 Age 35-44 Age 45-64 Age 65+
2006 2007 2008
Housewife Age
0
5
10
15
20
25
1 in HH 2 in HH 3 in HH 4 in HH 5+ in HH
2006 2007 2008
Household Size
0
5
10
15
20
25
No Children 1 Child HH 2 Child HH 3+ Child HH
2006 2007 2008
No. of Children
13.5 C2DE Large households
Younger With children

© WorldpanelTM division of TNS 2008
Share of Total Grocers - Organic
32.6
25.8
18.2
9.1
6.4
3.6
2.4
1.4
0.7
0.2
0.2
0.1
0.0
0.0
0.0
0.0
33.2
25.2
17.6
10.1
6.2
4.6
2.4
1.3
0.7
0.5
0.5
0.1
0.0
0.0
0.0
0.0
Tesco
Sainsbury
Waitrose
Asda
Morrisons
M & S
Total Co-op
Somerfield
Tot Indepts
Lidl
Aldi
Netto
Safeway
Kwik Save
Iceland
Farm Foods
52 w/e Feb 24 200852 w/e Feb 25 2007

© WorldpanelTM division of TNS 2008
Year-on-Year Expenditure TrendsOrganic
23
13
11
8
7
7
Asda
Tesco
Tot Grocers
Sainsbury
Waitrose
Morrisons
52 w/e Feb 24 2008% Change
Strong performance in Organic

© WorldpanelTM division of TNS 2008
£% Change y/y 52 w/e Mar 23 2008
TPR Multibuy TPR Multibuy
All Outlets 15 -24 28 10Tesco 21 -23 55 25Asda 7 -22 51 -19 Sainsbury 28 -22 47 -10 Morrisons 24 -17 60 1Somerfield -2 -28 21 -27 Iceland -13 -18 -18 -99 Total Co-op -6 -55 -13 -42 Boots #N/A #N/A 18 8Superdrug #N/A #N/A 14 38
Total Grocery
Promotion Trends

© WorldpanelTM division of TNS 2008
Favourite Promotions amongst the Obese
107
106
104
104
100
99
Extra Free
Y for £X
2F1
MultiBuy
TPR
No Promotion
Share of Promotional PurchasingIndexed on All Households52 w/e Jan 27 2008

© WorldpanelTM division of TNS 2008
Fairtrade Bananas - Performance Analysis
20.0
21.5
27.7
129 130124
14
16
18
20
22
24
26
28
52 w/e Mar 26 2006 52 w/e Mar 25 2007 52 w/e Mar 23 2008
Sh
are
£%
100
150
200
250
Pri
ce p
er V
olu
me
Ind
ex
Share of Pre-packed Bananas Price per Volume Index

© WorldpanelTM division of TNS 2008
Fairtrade Prepacked Bananas Market Share
0
10
20
30
40
50
60
70
80
90
100
Apr
24
2005
May
22
2005
Jun
19 2
005
Jul 1
7 20
05
Aug
14
2005
Sep
11
2005
Oct
09
2005
Nov
06
2005
Dec
04
2005
Jan
01 2
006
Jan
29 2
006
Feb
26
2006
Mar
26
2006
Apr
23
2006
May
21
2006
Jun
18 2
006
Jul 1
6 20
06
Aug
13
2006
Sep
10
2006
Oct
08
2006
Nov
05
2006
Dec
03
2006
Dec
31
2006
Jan
28 2
007
Feb
25
2007
Mar
25
2007
Apr
22
2007
May
20
2007
Jun
17 2
007
Jul 1
5 20
07
Aug
12
2007
Sep
09
2007
Oct
07
2007
Nov
04
2007
Dec
02
2007
Dec
30
2007
Jan
27 2
008
Feb
24
2008
Mar
23
2008
Total Grocers
Sainsbury's

© WorldpanelTM division of TNS 2008
Free-range Eggs Market Share
30
40
50
60
70
80
90
100
Ap
r 2
4 2
00
5
Ma
y 2
2 2
00
5
Jun
19
20
05
Jul 1
7 2
00
5
Au
g 1
4 2
00
5
Se
p 1
1 2
00
5
Oct
09
20
05
No
v 0
6 2
00
5
De
c 0
4 2
00
5
Jan
01
20
06
Jan
29
20
06
Fe
b 2
6 2
00
6
Ma
r 2
6 2
00
6
Ap
r 2
3 2
00
6
Ma
y 2
1 2
00
6
Jun
18
20
06
Jul 1
6 2
00
6
Au
g 1
3 2
00
6
Se
p 1
0 2
00
6
Oct
08
20
06
No
v 0
5 2
00
6
De
c 0
3 2
00
6
De
c 3
1 2
00
6
Jan
28
20
07
Fe
b 2
5 2
00
7
Ma
r 2
5 2
00
7
Ap
r 2
2 2
00
7
Ma
y 2
0 2
00
7
Jun
17
20
07
Jul 1
5 2
00
7
Au
g 1
2 2
00
7
Se
p 0
9 2
00
7
Oct
07
20
07
No
v 0
4 2
00
7
De
c 0
2 2
00
7
De
c 3
0 2
00
7
Jan
27
20
08
Fe
b 2
4 2
00
8
Ma
r 2
3 2
00
8
Total Grocers
Sainsbury's

© WorldpanelTM division of TNS 2008
Free-range Eggs Market Share
30
40
50
60
70
80
90
100
Ap
r 2
4 2
00
5
Ma
y 2
2 2
00
5
Jun
19
20
05
Jul 1
7 2
00
5
Au
g 1
4 2
00
5
Se
p 1
1 2
00
5
Oct
09
20
05
No
v 0
6 2
00
5
De
c 0
4 2
00
5
Jan
01
20
06
Jan
29
20
06
Fe
b 2
6 2
00
6
Ma
r 2
6 2
00
6
Ap
r 2
3 2
00
6
Ma
y 2
1 2
00
6
Jun
18
20
06
Jul 1
6 2
00
6
Au
g 1
3 2
00
6
Se
p 1
0 2
00
6
Oct
08
20
06
No
v 0
5 2
00
6
De
c 0
3 2
00
6
De
c 3
1 2
00
6
Jan
28
20
07
Fe
b 2
5 2
00
7
Ma
r 2
5 2
00
7
Ap
r 2
2 2
00
7
Ma
y 2
0 2
00
7
Jun
17
20
07
Jul 1
5 2
00
7
Au
g 1
2 2
00
7
Se
p 0
9 2
00
7
Oct
07
20
07
No
v 0
4 2
00
7
De
c 0
2 2
00
7
De
c 3
0 2
00
7
Jan
27
20
08
Fe
b 2
4 2
00
8
Ma
r 2
3 2
00
8
Total Grocers
Sainsbury's
Waitrose

© WorldpanelTM division of TNS 2008
Morrisons+Safeway Year-on-Year Trends - Till Roll £%
-20
-15
-10
-5
0
5
10
12-S
ep-0
4
10-O
ct-0
4
07-N
ov-
04
05-D
ec-0
4
02-J
an-0
5
30-J
an-0
5
27-F
eb-0
5
27-M
ar-0
5
24-A
pr-
05
22-M
ay-0
5
19-J
un
-05
17-J
ul-
05
14-A
ug
-05
11-S
ep-0
5
09-O
ct-0
5
06-N
ov-
05
04-D
ec-0
5
01-J
an-0
6
29-J
an-0
6
26-F
eb-0
6
26-M
ar-0
6
23-A
pr-
06
21-M
ay-0
6
18-J
un
-06
16-J
ul-
06
13-A
ug
-06
10-S
ep-0
6
08-O
ct-0
6
05-N
ov-
06
03-D
ec-0
6
31-D
ec-0
6
28-J
an-0
7
25-F
eb-0
7
25-M
ar-0
7
22-A
pr-
07
20-M
ay-0
7
17-J
un
-07
15-J
ul-
07
12-A
ug
-07
09-S
ep-0
7
07-O
ct-0
7
04-N
ov-
07
02-D
ec-0
7
30-D
ec-0
7
27-J
an-0
8
24-F
eb-0
8
23-M
ar-0
8
12 w/e Periods
Store sell-offs
Now stable

© WorldpanelTM division of TNS 2008
© WorldpanelTM division of TNS 2008

© WorldpanelTM division of TNS 2008
Morrisons Shoppers – London Lifestyles
Till Roll Share indexed on All Shoppers – 52 w/e Mar 25 2007
I Only Eat To Fill Up 142I Think Health Foods Are Only Bought By Fanatics 142It's A Struggle To Pay Bills At The End Of The Month 140I'm Not Really Worried About Eating Healthily 131I Work To A Strict Budget When I'm Buying Groceries 127I Visit Different Shops For The Best Prices 126People Regularly Smoke In My House 122I Shop Around To Take Advantage Of Special Offers 114I Buy Clothes For Comfort Not Style 112I'm Often On A Diet To Lose Weight 112I Consider That Price Is The Most Important Factor 111
111111110108
I Like Having My Evening Meal In Front Of The TV 108108
I Live For The Moment 108107107
© WorldpanelTM division of TNS 2008
In the opinion of Londoners………
=

© WorldpanelTM division of TNS 2008


© WorldpanelTM division of TNS 2008


© WorldpanelTM division of TNS 2008
Latest Quarter Till Roll Totals Expenditure Trends
12
11
11
8
8
7
6
6
5
4
2
Iceland
Morrisons
Total Hard Disc
Waitrose
Asda
Tot Grocers
Tesco
Tot Indepts
Sainsbury
Somerfield
Total Co-op
12 w/e Mar 23 2008y/y % Change

© WorldpanelTM division of TNS 2008
I Try To Support Regional Food Producers
70
75
80
85
90
95
100
105
110
115
12024
-Ap
r-05
22-M
ay-0
5
19-J
un
-05
17-J
ul-
05
14-A
ug
-05
11-S
ep-0
5
09-O
ct-0
5
06-N
ov-
05
04-D
ec-0
5
01-J
an-0
6
29-J
an-0
6
26-F
eb-0
6
26-M
ar-0
6
23-A
pr-
06
21-M
ay-0
6
18-J
un
-06
16-J
ul-
06
13-A
ug
-06
10-S
ep-0
6
08-O
ct-0
6
05-N
ov-
06
03-D
ec-0
6
31-D
ec-0
6
28-J
an-0
7
25-F
eb-0
7
25-M
ar-0
7
22-A
pr-
07
20-M
ay-0
7
17-J
un
-07
15-J
ul-
07
12-A
ug
-07
09-S
ep-0
7
07-O
ct-0
7
04-N
ov-
07
02-D
ec-0
7
30-D
ec-0
7
27-J
an-0
8
24-F
eb-0
8
23-M
ar-0
8
Sainsbury
Tesco
Asda
Morrisons
Till Roll Share Index - Share amongst respondents agreeing with statement indexed on All Respondents
© WorldpanelTM division of TNS 2008
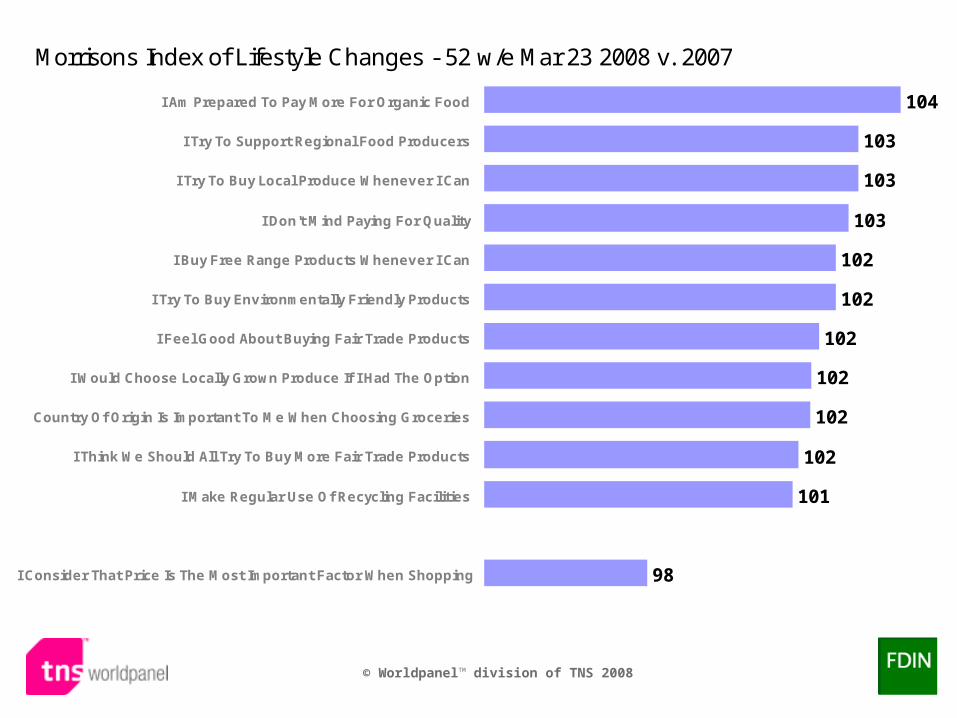
Morrisons Index of Lifestyle Changes - 52 w/e Mar 23 2008 v. 2007
104
103
103
103
102
102
102
102
102
102
101
98
I Am Prepared To Pay More For Organic Food
I Try To Support Regional Food Producers
I Try To Buy Local Produce Whenever I Can
I Don't Mind Paying For Quality
I Buy Free Range Products Whenever I Can
I Try To Buy Environmentally Friendly Products
I Feel Good About Buying Fair Trade Products
I Would Choose Locally Grown Produce If I Had The Option
Country Of Origin Is Important To Me When Choosing Groceries
I Think We Should All Try To Buy More Fair Trade Products
I Make Regular Use Of Recycling Facilities
I Consider That Price Is The Most Important Factor When Shopping

© WorldpanelTM division of TNS 2008
Agenda
Background
Organic Overview
Organic Markets
Fairtrade Overview
Fairtrade Markets
Free Range
Retail Aspects
Markets & Lifestyles

© WorldpanelTM division of TNS 2008
I Feel Good About Buying Fair Trade Products
146
134
131
127
127
127
124
122
120
119
119
118
117
116
116
115
115
114
113
Chilled Olives
Chilled Vegetarian
Herbal Tea
Dry Pulses+Cereal
Fresh Soup
Frozen Vegetarian Prods
Liquid+Grnd Coffee+Beans
Home Baking
Chilled Salad Accomps
Fresh Stuffing
Wet/Smoked Fish
Flour
Chilled Dips
Mincemeat (Sweet)
Fresh Pasta
Honey
Syrup & Treacle
Chilled Fruit Juice+Drink
Chilled One Shot Drinks
Market Share Index52 w/e Mar 23 2008

© WorldpanelTM division of TNS 2008
I Try To Buy Environmentally Friendly Products
139
131
130
130
124
123
121
121
120
120
120
119
119
118
117
115
115
113
113
Chilled Vegetarian
Frozen Vegetarian Prods
Dry Pulses+Cereal
Herbal Tea
Chilled Olives
Liquid+Grnd Coffee+Beans
Flour
Ambient Vgtrn Products
Fresh Soup
Honey
Syrup & Treacle
Home Baking
Wet/Smoked Fish
Mincemeat (Sweet)
Chilled Dips
Cous Cous
Soda Water
Peanut Butter
Fortified Wines
Market Share Index52 w/e Mar 23 2008

© WorldpanelTM division of TNS 2008
I Try To Buy Local Produce Whenever I Can 131
128
126
126
126
126
125
125
125
124
123
122
122
122
121
120
119
118
118
Fresh Other Meat & Offal
Mincemeat (Sweet)
Honey
Liquid+Grnd Coffee+Beans
Herbal Tea
Flour
Ginger Ale
Dry Pulses+Cereal
Suet
Fresh Stuffing
Wet/Smoked Fish
Fresh/Chilled Pastry
Home Baking
Tonic Water
Fortified Wines
Fresh Soup
Ready To Use Icing
Chilled Olives
Vinegar
Market Share Index52 w/e Mar 23 2008

© WorldpanelTM division of TNS 2008
I Am Prepared To Pay More For Organic Food
180
175
166
157
157
149
146
146
142
142
142
139
138
136
136
135
135
132
131
Chilled Vegetarian
Fresh Soup
Dry Pulses+Cereal
Chilled One Shot Drinks
Herbal Tea
Honey
Chilled Salad Accomps
Chilled Olives
Chilled Dips
Frozen Vegetarian Prods
Soda Water
Liquid+Grnd Coffee+Beans
Chilled Cooking Sauces
Chilled Fruit Juice+Drink
Fresh Pasta
Home Baking
Cous Cous
Flour
Ambient Vgtrn Products
Market Share Index52 w/e Mar 23 2008

© WorldpanelTM division of TNS 2008
I Buy Free Range Products Whenever I Can
142
136
133
132
131
128
126
125
124
119
119
118
118
117
117
117
116
116
115
Chilled Vegetarian
Chilled Olives
Herbal Tea
Frozen Vegetarian Prods
Fresh Soup
Dry Pulses+Cereal
Honey
Liquid+Grnd Coffee+Beans
Wet/Smoked Fish
Fresh Other Meat & Offal
Chilled Prepared Fish
Flour
Home Baking
Chilled Cooking Sauces
Fresh Pasta
Tonic Water
Chilled Dips
Vinegar
Chilled Salad Accomps
Market Share Index52 w/e Mar 23 2008

© WorldpanelTM division of TNS 2008
I Make Regular Use Of Recycling Facilities
109
108
108
108
108
108
107
107
107
107
107
107
106
106
106
106
106
106
105
Home Baking
Suet
Flour
Honey
Mincemeat (Sweet)
Chilled Olives
Herbal Tea
Fresh Other Meat & Offal
Liquid+Grnd Coffee+Beans
Syrup & Treacle
Frozen Stuffing
Wet/Smoked Fish
Tonic Water
Wine
Ginger Ale
Ready To Use Icing
Fresh Stuffing
Instant Milk
Dry Pulses+Cereal
Market Share Index52 w/e Mar 23 2008

© WorldpanelTM division of TNS 2008
27
30
% of French homes buying
‘organic’ 2005 2007
12
22
% of French homes buying
‘fair trade’
2005 2007

© WorldpanelTM division of TNS 2008
Will pay for quality
42676065
GB France Spain Germany
Like to keep myself in shape
617385
46
GB France Spain Germany

© WorldpanelTM division of TNS 2008
Reminders

© WorldpanelTM division of TNS 2008
Reminders
Background

© WorldpanelTM division of TNS 2008
Organic
Reminders
Background

© WorldpanelTM division of TNS 2008
Background
Fairtrade
Reminders
Organic

© WorldpanelTM division of TNS 2008
Free Range
Background
Reminders
Organic
Fairtrade

© WorldpanelTM division of TNS 2008
Background
Reminders
RetailAspects
Organic
Fairtrade
Free Range

© WorldpanelTM division of TNS 2008
Markets&
Lifestyles
Background
Reminders
Organic
Fairtrade
Free Range
RetailAspects