Embed Size (px)
Citation preview

- RESEARCH REPORT -
TITLE
The Relationship between Neighbourhood Preferences, Building Attributes and
Location of Office Property Portfolios in Pretoria
by
Mathemba Mosery
0707177A
Submitted in fulfilment of the requirements for the degree M Sc. Building (Property Development and Management)
in the FACULTY OF CONSTRUCTION ECONOMICS AND MANAGEMENT SCIENCES
at the UNIVERSITY OF WITWATERSRAND
Research Supervisor: (Dr Y Adewunmi)
(2017)

ii
DECLARATION
I, Mathemba Mosery, declare that this research report is my own, unaided work. This
report is being submitted for the Degree of Masters in Building (Property Development
and Management) at the University of the Witwatersrand, Johannesburg, South Africa.
It has not been submitted before for any degree or examination at any other University.
……………………………………………………………………………
(Signature of Candidate)
……….. day of …………….., ……………

iii
ABSTRACT
Purpose – This study set out to investigate whether neighbourhood preferences and
building attributes have a relationship with business and firm office location decisions.
The investigation had a particular focus on a predominantly government-owned
administrative city, Pretoria Metro, and on private-sector property market decision
making with regard to relocations, redevelopments, investments and their profiles.
Method – This study used a survey method, with a multilevel questionnaire comprising
a Likert Scale for neighbourhood preferences, safety, social, functionality and
physicality; and building attributes, presentation, management, functionality, services,
accessibility and amenities; and selecting the preferred precinct among the categories
“prestige”, “historic”, “heritage” and “government”. The questionnaires were sent to
real-estate practitioners.
Findings – Safety, with a mean score of 1.83, was the most important factor and
functionality, with a mean score of 2.36, was the least important factor for
neighbourhood preference. Management, with a mean score of 1.72, was the most
important factor and amenities, with a mean score of 2.74, was the least important
factor for building attributes. All factors were generally important with mean scores
ranging between 1.58 and 2.63 for neighbourhood preferences, and 1.29 and 3.25 for
all building attributes. The majority of businesses (67%) would not prefer to locate
within the Pretoria CBD. The most preferred precinct that the businesses would prefer
to locate near or within was prestige, followed by government and historic, with
heritage being the least preferred. The results for the relationship between
neighbourhood preferences, at 0.52, building attributes, at 0.63, and the office location
choice are both positive and strong.
Implications/Value – Efforts to attract businesses back to the Pretoria CBD based on
neighbourhood preference should focus on maintaining the area, making the area safe
for property and persons and dealing with the traffic nuisance. With regard to building
attributes emphasis should be on providing good management of the building and
improving external and internal finishes of the buildings.
Keywords: Building attributes, corporate real estate, neighbourhood preference, office
location decision, Pretoria

iv
ACKNOWLEDGEMENTS
I would like to express my sincere and heartfelt gratitude to everyone who assisted me
in completing this research report, particularly Ms R Billett and Ms M Sithole.
My special and sincere thank you goes to Dr Yewande Adewunmi who assisted me in
every step of the way. This study would not have been possible without your invaluable
input.
My genuine gratitude goes out to Dr Samuel Azasu for his relentless encouragement
and moral support over the last few years.
I am also grateful to all the individuals who took the time to respond to the survey and
in turn helped to shape the future of corporate real estate research in South Africa.
Lastly, a special thank you to my family who have all in some way contributed to the
successful completion of this research.

v
CONTENTS
1.1 BACKGROUND TO THE STUDY .......................................................................... 1
1.2 RESEARCH PROBLEM/STATEMENT .................................................................. 3
1.3 AIM/PURPOSE ..................................................................................................... 4
1.4 CONTRIBUTION/SIGNIFICANCE ......................................................................... 4
1.5 RESEARCH QUESTIONS ..................................................................................... 5
1.6 THE OBJECTIVES ................................................................................................ 6
1.7 THE CONTEXT ..................................................................................................... 6
1.8 LIMITATIONS ........................................................................................................ 8
1.9 THE STRUCTURE OF THE REPORT ................................................................... 8
2.1 OVERVIEW OF LOCATION CHOICE ................................................................... 9
2.2 THE IMPORTANCE OF CORPORATE REAL ESTATE, NEIGHBOURHOOD
PREFERENCES AND BUILDING ATTRIBUTES .................................................10
2.2.1 The Importance of CRE .................................................................................10
2.2.2 The Traditional Urban Spatial Structure .........................................................10
2.2.3 Edge City Concept .........................................................................................11
2.2.4 Neighbourhood Satisfaction ...........................................................................11
2.2.5 Liveability .......................................................................................................11
2.2.6 Sense of Place ..............................................................................................12
2.3 THE THEORETICAL AND CONCEPTUAL FRAMEWORK ..................................12
2.3.1 Neighbourhood Preferences ..........................................................................13
2.3.2 Building Attributes ..........................................................................................13
2.3.3 Repelling Factors ...........................................................................................14
2.3.4 The Essence of the Study ..............................................................................14
2.4 SOME DEVELOPMENTS OF STUDIES IN REAL ESTATE–FIRM LOCATION
DECISIONS..........................................................................................................15
3.1 RESEARCH DESIGN ...........................................................................................16
3.2 SAMPLING METHOD ..........................................................................................16
3.2.1 Target Population ..........................................................................................17
3.2.2 Sampling .......................................................................................................17
3.2.3 Sample Size ..................................................................................................17

vi
3.3 DATA COLLECTION ............................................................................................18
3.3.1 Measurement .................................................................................................19
3.3.2 Validity and Reliability of Instrument Used .....................................................20
3.4 DATA ANALYSIS .................................................................................................20
3.5 ETHICAL CONSIDERATIONS .............................................................................21
4.1 DESCRIPTION AND ANALYSIS ..........................................................................22
4.1.1 Response Rate ..............................................................................................22
4.1.2 Respondent Profile ........................................................................................22
4.1.3 Organisation Profile .......................................................................................23
4.1.4 Office Space Requirements ...........................................................................24
4.1.5 Demographics ...............................................................................................25
4.1.6 Relative Importance of Factors ......................................................................25
4.1.7 Relative Importance of Factors by Respondent Groups .................................27
4.1.8 Relative Importance of Sub-Factors ...............................................................28
4.1.9 Location Choice – Preferences and Attributes ...............................................31
4.1.10 Neighbourhood Preference and Building Attributes from Factors ...................34
4.2 RELATIONSHIP BETWEEN NEIGHBOURHOOD PREFERENCES, BUILDING
ATTRIBUTES AND OFFICE LOCATION CHOICE ...............................................37
4.3 FINDINGS ............................................................................................................39
4.4 DISCUSSION .......................................................................................................40
5.1 CONCLUSION .....................................................................................................43
5.2 RECOMMENDATIONS ........................................................................................43
5.3 FUTURE RESEARCH ..........................................................................................44

vii
LIST OF TABLES
Table 3.1: Neighbourhood Factors and Sub-Factors ................................................................. 19
Table 3.2: Building Factors and Sub-factors .............................................................................. 20
Table 4.1: Descriptive Statistics of Mean Rating for Neighbourhood Preferences ..................... 26
Table 4.2: Descriptive Statistics of Mean Rating for Building Attribute ....................................... 27
Table 4.3: Means for Neighbourhood Preference Indicated by Respondent Groups ................. 27
Table 4.4: Means for Building Attributes Indicated by Respondent Groups ............................... 28
Table 4.5: Descriptive Statistic for Neighbourhood Preferences and Sub-Factors ..................... 28
Table 4.6: Mean Rating for Neighbourhood Preferences Sub-Factors ...................................... 29
Table 4.7: Descriptive Statistics of Mean Rating for Building Attributes and Sub-Factors ..................................................................................................................... 30
Table 4.8: Mean Rating for Building Attributes Sub-Factors ...................................................... 31
Table 4.9: Mode for Location Choice – Preferred Precinct in Pretoria CBD ............................... 33
Table 4.10: Ranking – Preferred Precinct in Pretoria CBD .......................................................... 33
Table 4.11: Mean and Rank for Neighbourhood Preferences ...................................................... 34
Table 4.12: Mean and Rank for Building Attributes ..................................................................... 36
Table 4.13: Correlation between Neighbourhood Preference and Location Choice ..................... 38
Table 4.14: Correlation between Building Attributes and Location Choice ................................... 39
Table 1a: Category of participants, population and their proportion .......................................... 51

viii
LIST OF FIGURES
Figure 1.1: Pretoria Metro, CBD and Surroundings ...................................................................... 3
Figure 1.2: Pretoria CBD .............................................................................................................. 7
Figure 1.3: Pretoria CBD Proposed Office Development .............................................................. 8
Figure 2.1: Conceptual and Theoretical Framework ................................................................... 13
Figure 3.1: Profile of Participants ............................................................................................... 18
Figure 4.1: Percentage of Respondents per Category ................................................................ 22
Figure 4.2: Number of Respondents per Category ..................................................................... 23
Figure 4.3: Organisational Profile of Respondents ..................................................................... 23
Figure 4.4: Percentage of Organisations’ Role within the Office Sector ...................................... 24
Figure 4.5: Percentage of Office Space Currently Occupied....................................................... 24
Figure 4.6: Percentage of Office Space Currently Required ....................................................... 24
Figure 4.7: Gender and Age ....................................................................................................... 25
Figure 4.8: Education and Experience ........................................................................................ 25
Figure 4.9: Mean Rating for Neighbourhood Preferences ........................................................... 26
Figure 4.10: Mean Rating for Building Attribute ............................................................................ 26
Figure 4.11: Percentage of Firms Willing to Locate in the Pretoria CBD ....................................... 32
Figure 4.12: Percentage of Participants’ Choices of Preferred Precinct to Locate to in the Pretoria CBD ...................................................................................................... 32
Figure 4.13: Mode of Preferred Precinct ....................................................................................... 33
Figure 4.14: Mean and Rank for Neighbourhood Preferences ...................................................... 34
Figure 4.15: Mean Rating for Neighbourhood Preferences by Groups of Respondents ................ 35
Figure 4.16: The Count of Indications per Factor for Neighbourhood Preferences ....................... 35
Figure 4.17: Mean and Rank for Building Attributes ..................................................................... 36
Figure 4.18: Mean Rating and Relative Importance of Building Attributes for Group Respondents ............................................................................................................ 36
Figure 4.19: Frequency of Relative Importance of Building Attributes ........................................... 37
Figure 4.20: Scatter Plot for Neighbourhood Preferences and Location Choice in Pretoria CBD ............................................................................................................ 38
Figure 4.21: Scatter Plot for Building Attributes and Location Choice in Pretoria CBD ................. 38

1
CHAPTER 1 – INTRODUCTION
1.1 BACKGROUND TO THE STUDY
A number of significant decisions are made daily by participants in the real estate
industry about their business and firm location. These location choices require
decisions about neighbourhood choice and in particular building choices (Des Rosiers
et al., 2000; Hess and Liang, 2003; Ho et al., 2005; Nappi-Choulet and Decamps,
2013). This study is centred on the office building sector in the Pretoria Metro.
Office buildings are a place of work, a way to market a firm and a significant financial
investment. As a consequence, the neighbourhood a firm chooses and the specific
building where it locates itself becomes very important (Leishman et al., 2011; Jackson
and Or, 2011).
Individuals and firms take decisions about the location of their businesses in order to
enhance their competitive advantage and transform their structure and image (Roulac
et al., 2003). These decisions about locating in certain neighbourhoods, and in
particular buildings, are at the core of corporate real estate (CRE), and have an impact
on the businesses’ future revenue and costs, and on their corporate mission (Manning,
Rodriguez and Ghosh, 1999; Rabianski, DeLisle and Carn, 2001). However, these
decisions are not only influenced by the individuals, but are also an integral part of
institutional investment activity and decision making, and are phenomena of the
economics of location (Leishman and Watkins, 2004; Guy, Henneberry and Rowley,
2002; Healey, 1995; Kilkenny and Thisse, 1998).
Cities in Africa will grow to accommodate one billion residents by 2050 (“African Cities
2063”, 2015). To support the infrastructure developments that will be required in a
sustainable manner a substantial tax base will have to be built to cater for and fund this
growth. Pretoria is an administrative capital and also houses private sector businesses
and firms. What is unknown is which factors determine private sector firms’ decisions to
locate in particular neighbourhoods in the Pretoria Metro and in which specific
buildings, and what determines office space choice and corporate image (Sing et al.,
2006; Skevin, 2011). To this end cities, in this study Pretoria Metro, will have to attract
substantially sized businesses and firms to the CBDs and keep them there. They must
embark on regeneration programmes that take into account the issues of smart cities,
climate change and sustainable development (Guy, Henneberry and Rowley, 2002;
Korthals Altes, 2002).

2
At some point in the life of a city, in particular the CBD, there are cyclical developments
that participants in the real estate industry should look at closely and provide solutions
to. In some instances the CBD enjoys a time of growth followed by stagnation and a
decline in activity (Korthals Altes, 2002; Guy and Henneberry, 2000). In these
instances the institutional investors will, to a large extent, control the nature of the
developments and the direction of investments away from the CBD or back to the CBD,
as is the case in Pretoria. Major office space investments, in the recent past, have
been away from the CBD. A few nodes in the periphery have been the recipients,
Menlyn, Brooklyn, Centurion and Lynwood being the most important of these
investments.
Research has suggested that firms chose to agglomerate in centres that offer
comparative location advantages, labour, transport and convenient contacts (Sing et
al., 2006). In office location choice there are a number of determinants and factors that
have been identified by researchers over the years. The principal factors pertaining to
neighbourhood preferences and building attributes are:
location attributes (public transport and major transportation grid, adequate
parking, safety, cleanliness, near competitors, culture and history);
service attributes (public meeting rooms, restaurant, reception service, health
service, dry cleaning, beauty care);
building attributes (air conditioning, lighting, elevator, shower, energy
efficiency, open double volume, other players’ competition); and
work space attributes (space layout, efficiency and effectiveness).
These have necessitated an urgent need for institutional investors, developers, agents,
designers, policy developers and occupiers to have a clear and focused understanding
of potential occupier requirements and needs in order to achieve success in changing
the business environment (Luoma et al., 2010).
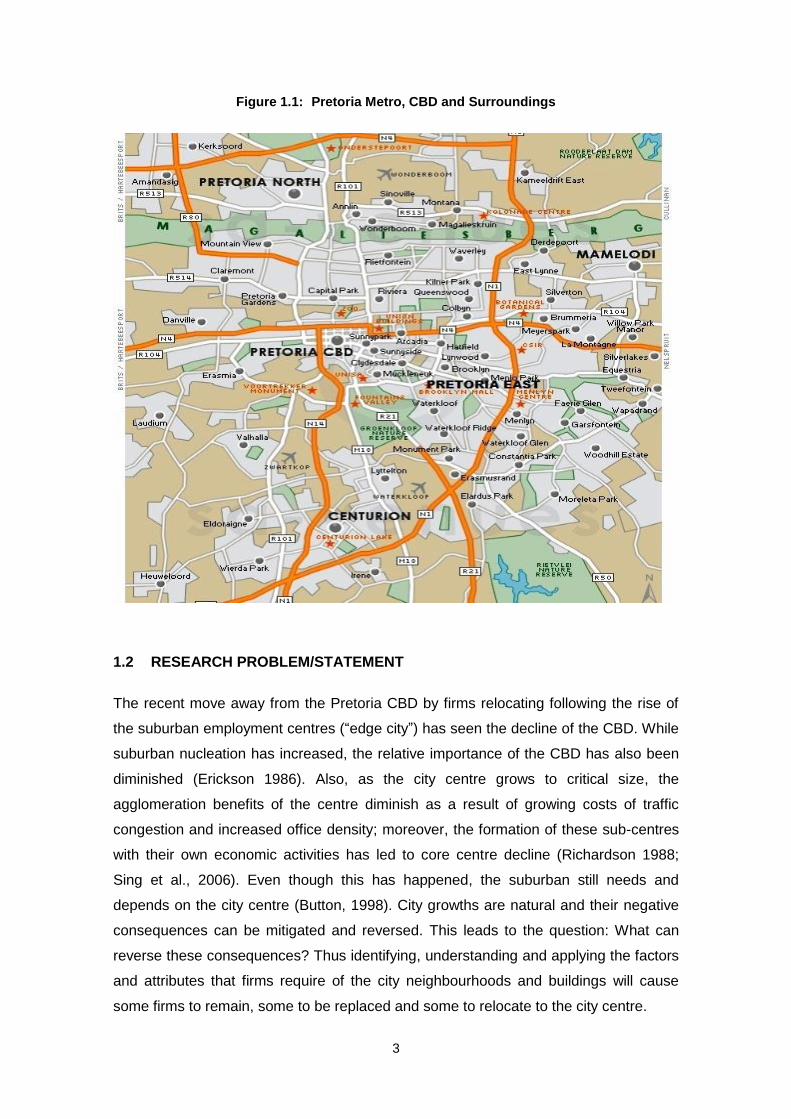
3
Figure 1.1: Pretoria Metro, CBD and Surroundings
1.2 RESEARCH PROBLEM/STATEMENT
The recent move away from the Pretoria CBD by firms relocating following the rise of
the suburban employment centres (“edge city”) has seen the decline of the CBD. While
suburban nucleation has increased, the relative importance of the CBD has also been
diminished (Erickson 1986). Also, as the city centre grows to critical size, the
agglomeration benefits of the centre diminish as a result of growing costs of traffic
congestion and increased office density; moreover, the formation of these sub-centres
with their own economic activities has led to core centre decline (Richardson 1988;
Sing et al., 2006). Even though this has happened, the suburban still needs and
depends on the city centre (Button, 1998). City growths are natural and their negative
consequences can be mitigated and reversed. This leads to the question: What can
reverse these consequences? Thus identifying, understanding and applying the factors
and attributes that firms require of the city neighbourhoods and buildings will cause
some firms to remain, some to be replaced and some to relocate to the city centre.

4
While the traditional theories are plausible in explaining these phenomena and
sometimes the unintended outcomes of movements from and to the CBDs (relocations
and what needs to be arranged to reverse these), the situation in South Africa, and in
particular Pretoria, is to a certain degree different from the traditional phenomena. This
is attributable to the structure and patterns of property assets in the country, the office
market in particular, and also institutional investors’ preferences and their investment
preferences between CBD and suburban offices, and of tenants’ profile and make-up,
owing to the apartheid history of South Africa. Advancing investigation of what is to be
addressed to balance these and by some means create the reverse effect and attract
them back is the crux of this research paper. This will create a new urban spatial
equilibrium in the CBD which has to do with determining and identifying the factors that
make neighbourhoods and buildings great (Vandell and Lane, 1989; Baum, 1993).
1.3 AIM/PURPOSE
This study sets out to investigate how neighbourhood preferences and building
attributes influence business and firm office location decisions.
The investigation particularly focuses on Pretoria Metro, a predominantly government-
owned administrative city, and its relative importance in the private sector property
market decision making with regard to relocations, redevelopments, investments and
their profiles. Prestige, historic and heritage dimensions are factors taken into account
in the order of preference of these dimensions, to further determine new precincts
within the CBD node.
In the case of Pretoria Metro the study identifies those dimensions that enable real-
estate participants to understand the factors that will encourage businesses and firms
to prefer a location in the CBD. These in turn will have positive contribution on raising
the firms’ profile and structure within the Pretoria Metro, in that this will attract bigger
and better businesses and firms.
1.4 CONTRIBUTION/SIGNIFICANCE
This study will make a contribution in that the variables of the construct of
neighbourhood and building choices will be tested in a different and unique context of a
capital city that is predominantly governmental, focusing on executive and
administrative functions. Secondly, it extends to other dimensions and adds new routes
in the construct of eliciting the preferences for particular nodes within the CBD. Further,

5
it will provide useful insights to decision makers within the commercial property industry
space, in particular the office sector in Pretoria.
The use of a multilevel survey questionnaire design method, explained under data
collection, comprising a Likert Scale for Neighbourhood Preferences and Building
Attributes and analysis for ranking the precincts is also a novelty (Ho, Newell and
Walker, 2005; Leby and Hashim, 2010; Aluko, 2011).
This study is significant in the current context where cities are merging in Gauteng
between Johannesburg, Pretoria and Ekurhuleni, opening up new nodes at the
periphery, which provide new and smart working places compared to the old CBDs.
This rivalry makes an interesting foundation for these studies in the South African
context.
The implications of these movements are also significant for practitioners and
professionals in the property industry, from policy frameworks for policy makers and
investors, to development strategies for developers and financing structures for
investors.
1.5 RESEARCH QUESTIONS
This study seeks to examine office location decision criteria within and among private
sector firms in terms of their firms’ location decisions with regard to neighbourhood
choice (preferences) and building choice (attributes).
In order to achieve the objectives set for this study, the following questions are
addressed:
What is the relative importance of neighbourhood preferences and building
attributes in Pretoria?
What is the relationship between neighbourhood preferences, building attributes
and office location choice?
These core questions are topical and relevant, since like most other major city CBDs in
South Africa, Pretoria CBD has slowed down drastically in terms of new development
or redevelopment of office space, and as a result firms are moving out of the CBD to
suburban nodes because of new office developments in those areas.

6
1.6 THE OBJECTIVES
The study objectives are:
To determine the relative importance of neighbourhood preferences and
building attributes in Pretoria; and
To determine the relationship between neighbourhood preferences, building
attributes and office location choice.
1.7 THE CONTEXT
The study was conducted in the Pretoria Metro office sector, specifically the CBD.
Pretoria is the administrative capital of the Republic of South Africa and it houses its
executive and administration and it predominantly comprises low- to high-rise office
buildings. Pretoria CBD is bound by Proes Street in the northwest, Madiba Street in the
east, Visagie Street in the south and DF Malan Street in the west. The CBD houses
historical, prestige, heritage and iconic buildings and sites such as the Union Buildings,
South African Reserve Bank, Kruger Square, Kruger Memorial, Freedom Park and the
Voertrekker Monument. Amenities include the University of South Africa, the National
Library, National Museum and the National Zoo (see Figure 1.2).

7
Figure 1.2: Pretoria CBD
The major owner and occupier of office space in Pretoria is the government at all three
levels (national, provincial and local). At the national level, the national Department of
Public Works is the landlord, and has under its custodianship, nationally, about
110,000 land parcels with an average of 2.5 buildings per land parcel. Of these,
Pretoria Metro accounts for several thousand (taking into account all spheres –
national, provincial and local, excluding institutions), and of that Pretoria CBD accounts
for 330 land parcels of government property under the custodianship of the National
Department of Public Works with an average of 4.5 buildings per land parcel (low- and
high-rise offices). In addition, national government leases 310 buildings with over 2.0
million square meters and about R100 million per month rent (IPD 2015; RODE report,
2015; Hess and Liang, 2003) (see Figure 1.3).

8
Figure 1.3: Pretoria CBD Proposed Office Development
1.8 LIMITATIONS
Due to time constraints the researcher could not reach as many participants as was
desired; therefore, the sample and cannot be generalised with much confidence. Also,
due to time constraints, sampling over time could not be done, which would have
refined the study more, as testing over a time span can provide time series insight.
1.9 THE STRUCTURE OF THE REPORT
The report is structured as follows. Chapter 2 is a background and literature review,
which comprises first the conceptual framework, explained according to the various
dimensions, perceived importance of neighbourhood and building factors. In Chapter 3
the methodology and design of the research are discussed. In Chapter 4 the results,
analysis and presentation are described. Chapter 5 presents the conclusion,
recommendations and suggestions for further research.

9
CHAPTER 2 – BACKGROUND AND LITERATURE REVIEW
This chapter first provides an overview and gives a background to location choice.
Secondly, it discusses the importance of CRE, neighbourhood preferences and
building attributes. Third, the theoretical and conceptual framework is reviewed. Lastly,
some developments of location decisions in real estate are discussed.
2.1 OVERVIEW OF LOCATION CHOICE
Location choices, micro or macro, determine the success of businesses and firms, and
a number of real estate researchers concern themselves with these issues (Kilkenny
and Thisse, 1998).
This has its origins in the ideas of geographic returns to scale first introduced by
Thunen (1825) and later Marshall (1890), and to the firm relocation decisions model in
an urban economy with multiple locations (Brinkman, Coen-Pirani and Sieg, 2011).
These concepts have led to the discussions of new social organisation of the property
sector delivering new structures of property provision and use (Guy and Henneberry,
2000). This extended to the concept of the ‘edge city’ in the 1990s where utility gains
from lower average land rents and other economies have provided employment and
developed commercial nodes that have greatly affected suburban life, creating new
commercial nodes and suburban agglomeration (Button, 1998).
A number of studies have also dealt with the concept of multinucleation, of business
and firm location relating to locational and spatial issues in general, and in particular
decentralisation, relocation of firms, regeneration and redevelopment to suburb node
establishment and why these occur (Wong, 2002; Erickson, 2005; Kryvobokov, 2005).
More specifically, a few of these studies have dealt with locational concepts at the level
of neighbourhood preference and building attributes (Verburg et al., 2004; Leby and
Hashim, 2005; Ho, Newell and Walker, 2005; Doak and Karadimitriou, 2007; Aluko,
2011; Nappi-Choulet and Decamps, 2013). Interestingly, there is much in common
between investor character and behaviour worldwide and engagement with these same
concepts and constructs within the Pretoria Metro and CBD situation, in particular the
office sector. These are driven by strong institutional and investor attitudes and
behaviour in the area and likewise elsewhere in the country (Adair, Berry, McGreal,
Deddis and Hirst 2000; Guy, Henneberry and Rowley, 2002; Hess and Liang, 2003).
Economic activity in general takes place within a spatial setting and while other
branches of economics ignore the spatial aspects of decision making, this study

10
focuses on a city as representing the centre of economic activity and will pay specific
attention to the determinants or influences of location decisions of firms.
Many spatial economic topics can be analysed within either a neighbourhood or nodal
context as some economic phenomena primarily affect local areas while others are felt
over larger areas.
2.2 THE IMPORTANCE OF CORPORATE REAL ESTATE, NEIGHBOURHOOD
PREFERENCES AND BUILDING ATTRIBUTES
2.2.1 The Importance of CRE
Recently there has been an increasing importance and recognition of CRE within
organisations (Manning et al., 1999; Gibson, Virginia, Lizieri, Colin, 2001; Hsiao-Chi
Chen, Ya-Wen Yu, 2008). What is becoming more and more important for CRE agents,
in the current and in future, within organisations is the rationalisation of these property
portfolios and it is evident that there is a rising level of professionalism and experience
within the sector (Roulac et al., 2002). This has made the office sector particularly
important for the firm’s identity and image which are at the heart of this study.
2.2.2 The Traditional Urban Spatial Structure
Traditional urban spatial structure is best defined by the monocentric city model and
describes the formation, function and development of cities. In a number of these
studies formation and development, followed by the phenomenon of movement away
from these city centres (city centre decline), has been widely explored (Alonso et al.,
1960; Ho et al., 2005). However, concepts relating to movements back to the centre
have not been explored. In Pretoria these spatial patterns have not been “traditional”
(Erickson and Wasylenko, 1980), especially for the greater Pretoria Metro and the
CBD, given that apartheid planning in South Africa caused unusual spatial allocations.
At the micro level of these decisions and choices about neighbourhood preferences
and building attributes, there few studies that attempt to define the decisions to relocate
businesses and firms back to the CBD. The available studies deal in the main with
decentralisation to suburban nodes as motivated by the traditional city models and
linear city model (Hotelling, 1929).

11
2.2.3 Edge City Concept
As defined by the polycentric city model, it has been suggested that city growth is
sometimes the cause of city’s own decline and the formation of edge cities due to
temporary shocks in the system, including “privatopia” of new corporate offices (Button,
1998). It is also argued that transport systems facilitate industry around the edge city.
The decisions made to location in new corporate offices are largely driven by:
Congestion, in that it decreases the quality of life;
lack or inadequate parking, for workers and visitors creating annoyance;
additional or new entrants to the work place, it increases the space requirement
of the business or firm;
political groups (social groups), the need to associate or identify with particular
groups; and
institutional investor behavior, competitor attitude or behavior in that when one
investor invest in or out of a particular area the others follow.
The movement of services to edge cities as a result of the increase of corporate
business and agglomeration is at the cornerstone of attracting businesses and firms to
areas that have embarked on these initiatives (Button, 1998).
2.2.4 Neighbourhood Satisfaction
Neighbourhood satisfaction distinguishes between groups of determinants ranging from
demographic characteristics, subjective evaluation of neighbourhood attributes and of
the dwelling, and objective neighbourhood characteristics which focus on how
individuals see (satisfaction) and think others see (perception of reputation) their
neighbourhood, in measuring the determinants that are important for location choice
(Des Rosiers et al., 2000; Permentier et al., 2011). These provide the criteria for
neighbourhood and building preference that are being tested in this study
2.2.5 Liveability
The concept of liveability, which is defined as the measure of the overall quality of life,
is a derivative of sustainable land development concepts which drive compact city
initiatives (Howley, Scott and Redmond, 2009; Leby and Hashim, 2010). Compact city
concepts, and their perceived effect on quality of life, may if taken too far, spoil the
quality of life, thereby creating an unintended inverse relationship with liveability. The
notion that urban intensification gives rise to poor neighbourhoods and buildings and

12
leads to neighbourhood dissatisfaction is the major focus of this study. The factors
defined in the construct of liveability that improve services and facilities, deliver better
public transportation and vibrant cultural life are therefore defined by better
neighbourhoods and buildings.
2.2.6 Sense of Place
The concept of sense of place explains how places have or do not have meaning to
individuals or groups (Wardner, 2012). This has three dimensions, the physical
structure, activities that take place and the meaning individuals give to it. At its simplest
it takes place at neighbourhood (preference) and building (attributes) level.
2.3 THE THEORETICAL AND CONCEPTUAL FRAMEWORK
While all of these studies portray the application of various determinants in defining
these concepts, they converge into plausible studies of location dimension and lack the
other dimensions of participants’ attitudes and behaviour influenced by broader real
estate fundamentals. In Howley et al. (2009) and in Permentier et al. (2011), it is
suggested that perceived personal characteristics have no significant effect on
neighbourhood satisfaction and perceived reputation is in itself insignificant. However,
in Leby and Hashim (2010) analyses and understanding of subjective indicators shed a
lot of light beyond the objective indicators.
These efforts can be said to have been of some value, but have not extended the
dimensions they test to holistically include the importance and the interdependence of
its parts, and the formulation and determination of new nodes. Furthermore these
analyses have focused on generalisation (general application meaning generalisability)
rather than specialisation (special application). In this study the units that are being
tested, the investigation and the results are based on an area and on a particular
building of a specific neighbourhood (preference) and on a specific building (attributes).

13
Figure 2.1: Conceptual and Theoretical Framework
2.3.1 Neighbourhood Preferences
This study looks specifically at the neighbourhood preferences and building attributes.
First the neighbourhood preferences are looked at in so far as social, safety, physical
and functional dimensions are perceived to be important, and determine preference
(De Rosiers et al., 2000; Cervero and Duncan, 2004; Leby and Hashim, 2010; Aluko,
2011; Permentier et al., 2011). In addition prestige, historic and heritage dimensions
are added to rank the order of preference of these nodes, which in turn will determine
new precincts within the CBD node.
2.3.2 Building Attributes
Second, the building attributes will be looked at with presentation, management,
functionality, services, access and circulation, and amenities being ranked in order of
importance (Ho, 1999; De Rosiers et al., 2000; Ho, Newell and Walker, 2005; Des
Rosiers et al., 2007; Aluko, 2011; Permentier et al., 2011). In addition, attractiveness of
a building depends on more than just quality and architecture; it also closely relates to

14
the factors such as the desire to locate near the centre of the city, distance from
transportation and demand for office space near public parking lots (Hough and Kratz,
1983). These factors were added to this dimension and are closely related to
occupier’s space choice and decisions (Leishman and Watkins, 2004; Sing et al., 2006;
Luoma et al., 2010).
2.3.3 Repelling Factors
There are number of factors that cause decentralisation or repel business and firms
from the CBD to urban periphery as mentioned above. These include:
overpopulation as a result of densification;
traffic congestion and lack of parking areas near or within walking distances
from work the place; and
poor or lack of access to public transportation within walking distances from
work the place.
2.3.4 The Essence of the Study
The concepts neighbourhood preference and building attributes are not dealt with
exclusively enough in the literature to elicit the intrinsic dimension of each, which is the
key approach in this study. Neighbourhood preferences are strongly explained by a
combination of belonging, status and prestige (Permentier et al., 2011) and building
attributes are strongly represented by a combination of image, stature and association
(De Rosiers et al., 2000).
This study extends the focus, by distinguishing between neighbourhood preferences
and building attributes and tests these separately to establish their measure of
importance in determining the location decisions by businesses and firms. This
combination of dimensions has not been articulated in previous research.
This research is about what will bring or relocate firms from the suburbs to the CBD by
investigating and looking into the factors, preferences, attributes and criteria of
neighbourhood preferences and building attributes, and determining their importance.
These should provide some valuable insights into neighbourhood satisfaction,
liveability and sense of place, and to further research.

15
2.4 SOME DEVELOPMENTS OF STUDIES IN REAL ESTATE–FIRM LOCATION
DECISIONS
As mentioned previously, several studies have been undertaken to define and
articulate the decisions by businesses’ and firms’ location or relocation, with particular
focus on why and how decentralisation from the city centres occurs (Erickson and
Wasylenko, 1980; Cohen, 2000; Korthals Altes, 2002). Important questions are why
decentralised or suburban nodes form as a result of city growth (Hough and Kratz,
1983), and why and how the participants’ socio-economic-political orientation
influences these decisions (Healey, 1995; Adair, Berry, McGreal, Deddis and Hirst
2000; Guy, Henneberry and Rowley, 2002). However, whenever decentralisation has
occurred the relocating firms have been replaced by smaller and less established
businesses. Very seldom have the city centres completely disappeared. These
movements have been defined largely as “CBD to suburb” (Richardson, 1988; Kilkenny
and Thisse, 1998).
In this study the reverse is propounded and is dealt with within the context of the move
from suburb to CBD. Here the neighbourhood preferences and building attributes that
attract and influence businesses and firms’ decisions to locate in the CBD are
investigated. The study examines whether they would be relocating back, locating for
the first time or making a choice to stay. Understanding of the issues that determine
neighbourhood preferences and building attributes that will support and promote
businesses’ and firms’ location decision making by identifying the preferences and
attributes that are important in creating a healthy and comfortable office environment
becomes significant (Vandell and Lane, 1989; Cervero and Duncan, 2004; Des Rosiers
et al., 2007; Permentier et al., 2011).
This study draws on the above concepts to arrive at firms’ neighbourhood preferences
and building attributes that are fundamental in influencing firms’ location decisions.

16
CHAPTER 3 – METHODOLOGY
This chapter discusses research design, sampling (including targeted population,
sampling method and sample size), data collection and data analysis
This study is a descriptive research and encompasses quantitative analysis of data
collected from a non-probability selective sample (purposive sampling method) (see
Figure 3.1) (Roulac, 2002; Hess and Liang, 2003). This is done in order to gain a
representative sample (Ho, Newell and Walker, 2005; Leby and Hashim, 2010; Aluko,
2011).
Both primary data from the survey questionnaire and secondary data from credible
publications are used in this study.
3.1 RESEARCH DESIGN
This study used a survey method, with a multilevel questionnaire comprising a Likert
Scale for neighbourhood preferences and building attributes and selecting the
preferred precinct (Ho, Newell and Walker, 2005; Leby and Hashim, 2010; Aluko,
2011).
A self-administered survey questionnaire was used to obtain participants’ preferences
or degree of importance or agreement with a statement or set of statements.
Respondents were asked to indicate their level of agreement with a given statement by
way of an ordinal scale.
The relationship between neighbourhood preferences, building attributes and office
location choice was tested using correlation.
3.2 SAMPLING METHOD
A purposive sampling method was used. A selection from a population of individuals
that are decision makers on issues of real estate within their organisations or firms,
were sampled (see Figure 3.1). These organisations or firms had or were looking for
office premises within the greater Pretoria area, including the CBD. These
organisations were a combination of a pre-determined proportional representation from
institutional investors, government entities, occupiers, designers, developers and
managing firms (Roulac, 2002; Hess and Liang, 2003). These firms were identified by

17
the researcher from his own knowledge of the firms involved in real estate activity in
and around the area.
3.2.1 Target Population
The population comprised of about 840 businesses in the categories mentioned above,
see also Table 1a, this was established from the yellow pages of Pretoria Central. The
target population was persons that are decision makers in issues of CRE in general
within their organisations or firms. The organisations or firms they represent had been
located within the greater Pretoria area for no less than two years, giving them enough
property-related knowledge of the area. In some cases individuals were not residents
within the greater Pretoria but had enough knowledge and understanding of the
intricacies and nuances of the subject area: these individuals were identified on site by
the researcher when distributing the questionnaires.
The organisations or firms were conducting their business and occupied office space
within the economic sector population segments shown in Figure 3.1.
3.2.2 Sampling
The researcher delivered by hand and presented the questionnaires to each
participant. The questionnaires were collected from participants after a few weeks. The
participants were mostly drawn from the private sector and some from public sector
entities in the proportions shown in Figure 3.1.
3.2.3 Sample Size
The targeted number of participating organisations is as shown in Figure 3.1. This
provided an adequate proportional spread of the sample of firms among the targeted
economic sectors and populations, and an adequate sample size. The sample size is
265, Krejcie and Morgan, 1970.

18
Figure 3.1: Profile of Participants
These individual participants were expected to complete the questionnaires, which
were collected after a few weeks. Ethical considerations are discussed in section 3.5.
3.3 DATA COLLECTION
Data was collected by way of self-administered questionnaires to individuals that were
representatives or owners of firms or businesses within the real-estate market and are
conducting their business in Pretoria and from government institutions located in
Pretoria, regardless of their head office locations. They were selected based on criteria
identified from literature. No incentives were provided to encourage participants. The
data collection took place between October 2016 and December 2016, as provided by
the research timelines.
Other pertinent data on demographics, census, property economics of Pretoria, etc.
that are not elicited from questionnaires were gathered from periodicals and
publications by reputable publishers in South Africa, to look at firm size (big, medium,
small), demographics, availability of property or lack thereof, supply and demand and
absorption of office space in the Pretoria Metro.
Door-to-door survey questionnaires were distributed by way of personal delivery to the
selected participants by the researcher. Then 20 to 30 minutes were spent with the
participant running through the intentions of the research, and explaining briefly the
problem statement and then clarifying and explaining some difficult questions. The
questionnaire had the following structure: Section 1: Organisational Information,
Section 2: Neighbourhood Preferences, Section 3: Building Attributes, Section 4: Office
Space Requirements, Section 5: Demographic Information.
20 20
70
30 30 30
5 6 4 3 2 4
Investors Government Occupiers Designers Developers Managing
Anticipated Actual

19
The structure of this questionnaire was multilevel as mentioned above, in the sense
that it gathered information and data about the demographics in general (Section 5)
and organisational makeup in particular (Section 1), then gathered information about
the city, then about the neighbourhood (Section 2) and then about the building
(Sections 3 and 4).
3.3.1 Measurement
Four factors and 12 sub-factors for neighbourhood preferences and six factors and 18
sub-factors for building attributes were tested and analysed in order to determine the
relative importance and rank (Ho et al., 2005; Leby and Hashim, 2010, Aluko, 2011);
see Tables 3.1 and 3.2.
3.3.1.1 Neighbourhood Preferences
Table 3.1: Neighbourhood Factors and Sub-Factors
Preferences Sub-Factors
Safety Property Safety
Personal Safety
Police Visibility
Physical Maintenance of Area
Traffic Nuisances
Open Spaces
Functionality Shopping and Postal Centres
Employment Levels
Health and School Facilities
Social Neighbour Behaviour
Sociability of People
Friends and Family

20
3.3.1.2 Building Attributes
Table 3.2: Building Factors and Sub-factors
Attributes Sub-Factors
Presentation External and Internal Finishes
Age of Building
Number of Storeys
Management Maintenance and Cleaning
Security and Access control
Energy Consumption
Services Toilet Facilities
Electrical and IT Services
HVAC Capacity
Functionality Floor Sizes
Space Efficiency
Column Layout
Accessibility Parking in Building
Lifts Performance
Ingress
Amenities Food Outlets
Banks and Postal Services
Gym and Health
3.3.2 Validity and Reliability of Instrument Used
The method that was used in evaluating the questionnaires was an informal,
individually-based expert review. An independent expert review on the assigned
questionnaire was conducted by a statistician to determine whether each questionnaire
item was problematic. Improvements were effected by eliminating ambiguity and more
protection of the identity of the participants was achieved.
3.4 DATA ANALYSIS
To analyse data a mixture of descriptive statistics, graphs and some correlation was
used. In this study it is sound to apply nonparametric methods to the data collected,
because the data from the questionnaires can mostly be described as scores rather
than true measurements. Questionnaire-derived data is likely to be nonparametric.

21
The specific descriptive statistics about the broad categories were further broken down
to sub-factors or variables which were gathered and analysed. The presentation of
results combines tables, charts and graphs.
3.5 ETHICAL CONSIDERATIONS
For ethical concerns, this research adhered to the framework and policies of the School
of Construction Economics and Management and the University of the Witwatersrand
Research Ethics Committee. Any data for research publication purposes was treated
with anonymity unless permission was granted for it to be used otherwise. In addition,
the data obtained was not used for either commercial purposes or made available to
third parties without express written consent from the participants. All the participants in
the study expressed their consent to use the data for research purposes.

22
CHAPTER 4 – RESULTS
This chapter consists of a description and analysis of results, which includes response
rate, respondents’ profiles, organisation profiles, requirements for office space of the
respondents, demographics, relative importance of factors and sub-factors, relative
importance of factors by respondent groups, location choice and attributes, and
preferred precinct and findings.
The presentation of results combines description, analysis, tables, charts and graphs.
4.1 DESCRIPTION AND ANALYSIS
4.1.1 Response Rate
Between October 2016 and February 2017, 60 questionnaires were distributed and 24
completed and collected (40%). The percentage breakdown of the respondents is
shown in Figure 4.1. According to Krejcie and Morgan, 1970, the response rate is 9%.
The sample was composed of individuals who are decision makers in matters relating
to real estate, in particular to their firm location decision.
Figure 4.1: Percentage of Respondents per Category
4.1.2 Respondent Profile
The respondents were sourced and grouped according to categories of investors (5 =
21%), government (6 = 25%), occupiers (4 = 17%), designers (3 = 12%), developers (2
= 8%) and managing (4 = 17%) firms. The numbers of respondents per category
depicted by these percentages are shown in Figure 4.2.
21%
25%
17%
12%
8%
17%
Investors Government Occupiers Designers Developers Managing

23
Figure 4.2: Number of Respondents per Category
4.1.3 Organisation Profile
Figure 4.3 indicates the percentages of private and public entities: 71% are private
while the remaining 29% are public and or government entities, and the size of these
entities range from small, medium to large based on assets under their management,
number of employees and turnover.
Figure 4.3: Organisational Profile of Respondents
Private or Public Size of the organisation
Figure 4.4 represents the percentage breakdown of organisations’ roles within the
office sector in Pretoria Metro. Of the responding individual organisations, 21% are
owners of property assets, 17% are institutional investors, 8% are individual investors,
and 21% are in the business of managing property assets.

24
Figure 4.4: Percentage of Organisations’ Role within the Office Sector
4.1.4 Office Space Requirements
Figures 4.5 and 4.6 provide percentages of office space currently occupied and
required by the participating firms in the Pretoria Metro. The majority, at 33%, occupies
and requires more than 2500 m2 of space.
Figure 4.5: Percentage of Office Space Currently Occupied
Figure 4.6: Percentage of Office Space Currently Required

25
4.1.5 Demographics
Fifty percent of respondents were male and 50% female with the majority being
between the ages of 25 and 34, at 50%; 54% had a degree level of education; and
38% had five to 10 years of work experience (see Figures 4.7 and 4.8).
Figure 4.7: Gender and Age
Gender Age
Figure 4.8: Education and Experience
Education Experience
4.1.6 Relative Importance of Factors
The mean scores for neighbourhood preferences and building attributes were
computed by averaging the mean of the sub-factors included in each factor, (see
Figure 4.9 and Table 4.1, Figure 4.10 and Table 4.2).
The mean scores are compared to determine the relative importance of neighbourhood
preferences and building attributes. The mean scores were rated based on a scale of 5
= not important, 1 = very important. Safety (1.83) was the most important factor and
functionality (2.36) was the least important factor for neighbourhood preference.
Management (1.72) was the most important factor and amenities (2.7) was the least
important factor for building attributes. It is noted that mean scores for neighbourhood
preference range from 1.83 to 2.36, and building attributes range from 1.72 to 2.76.
These factors are consistent with being important to moderately important

26
4.1.6.1 Neighbourhood Preference
Figure 4.9: Mean Rating for Neighbourhood Preferences
Table 4.1: Descriptive Statistics of Mean Rating for Neighbourhood Preferences
Standard
Error Median Range Minimum Maximum Standard
Deviation Mean Rank
Safety 0.16 1.67 3 1 4 0.79 1.83 1
Physicality 0.16 2 2.33 1 3.33 0.76 2.03 2
Social 0.15 2.33 3 1 4 0.75 2.32 3
Functionality 0.18 2.33 3 1 4 0.86 2.36 4
4.1.6.2 Building Attributes
Figure 4.10: Mean Rating for Building Attribute
1.83 2.03 2.32 2.36
Safety Physical Social Functionality
Me
an
1 - Very Important 2 - Important 3 - Moderate Important 4 - Slightly Important 5 - Not Important
1.72 1.82 2.01 2.03 2.47
2.76
Management Services Functionality Accessebility Presentation Amenities
Me
an
1 - Very Important 2 - Important 3 - Moderate Important 4 - Slightly Important 5 - Not Important

27
Table 4.2: Descriptive Statistics of Mean Rating for Building Attribute
Standard Error
Median Range Minimum Maximum Standard Deviation
Mean Rank
Management 0.15 1.33 2.33 1 3.33 0.73 1.72 1
Services 0.19 1.33 2.67 1 3.67 0.91 1.82 2
Functionality 0.20 2 4 1 5 0.97 2.01 3
Accessibility 0.19 1.83 2.67 1.00 3.67 0.91 2.03 4
Presentation 0.17 2.33 3 1 4 0.84 2.47 5
Amenities 0.18 3 3 1 4 0.87 2.76 6
4.1.7 Relative Importance of Factors by Respondent Groups
4.1.7.1 Neighbourhood Preference
Table 4.3 shows the mean scores for neighbourhood preference as indicated by
institutional investors. Safety (with mean score of 1.2) was the most important factor for
neighbourhood preference and social (with mean score of 3.6) was the least important
factor. Note the average of the mean scores for neighbourhood preference for
investors is the second smallest factor at 2.25.
Table 4.3: Means for Neighbourhood Preference Indicated by Respondent Groups
Group Safety Social Functionality Physical
Neighbourhood
Preference
Investors 1.2 3.6 2.6 1.6
2.25
Government 2 2.5 2.2 2
2.17
Occupiers 1.3 2.8 1.5 1.3
1.69
Designers 1 2.3 2 1
1.58
Developers 1 1 1 1
1
Managing 2 3.3 2 2.3
2.38
Avg. 1.41 2.57 1.88 1.52
1.84
4.1.7.2 Building Attributes
Table 4.4 illustrates the means for building attributes as indicated by institutional
investors. Management (with a mean score of 1.2) was the most important factor for
neighbourhood preference and functionality (with a mean score of 2.6) was the least
important. Note the average of the mean scores for building attributes for investors is
the second smallest factor at 2.00.

28
Table 4.4: Means for Building Attributes Indicated by Respondent Groups
Group Presentation Services Management Functionality Accessibility Amenities
Building Attributes
Investors 1.4 1.8 1.2 2.6 2.0 2.4
2
Government 1 1.8 2.7 2 2 1.8
2
Occupiers 1 1.5 1.3 1.5 1.3 2
1.42
Designers 2 1.7 1 1.7 1.7 1.3
1.56
Developers 1 1 1 1 1 2
1.17
Managing 1.8 2.5 2.3 2.5 3.5 4.3
2.79
Avg. 1.41 1.72 1.56 1.88 1.96 2.30
1.81
4.1.8 Relative Importance of Sub-Factors
4.1.8.1 Neighbourhood Preferences
Table 4.5 shows the relative importance and rank for all sub-factors that compose the
factors for neighbourhood preference. The most important factor, safety (with a mean
score of 1.83) is composed of the mean of sub-factors, property safety (1.58), personal
safety (1.71) and police visibility (2.21); and the least important factor, functionality
(2.36), is composed of the mean of sub-factors, shopping and postal centres (2.17),
employment levels (2.29), health and school facilities (2.63). See also Appendix A.
Table 4.5: Descriptive Statistic for Neighbourhood Preferences and Sub-Factors
Standard Error
Median Range Minimum Maximum Standard Deviation
Mean Rank
Safety 0.16 1.67 3 1 4 0.79 1.83 1
Property Safety 0.169 1 3 1 4 0.830 1.583 1
Personal Safety 0.213 1 3 1 4 1.042 1.708 2
Police Visibility 0.217 2 3 1 4 1.062 2.208 3
Physicality 0.16 2 2.33 1 3.33 0.76 2.03 2
Maintenance of Area
0.169 1 3 1 4 0.830 1.583 1
Traffic Nuisances
0.213 1 3 1 4 1.042 1.708 2
Open Spaces 0.217 2 3 1 4 1.062 2.208 3
Social 0.15 2.33 3 1 4 0.75 2.32 3
Shopping and Postal Centres
0.169 1 3 1 4 0.830 1.583 1
Employment Levels
0.213 1 3 1 4 1.042 1.708 2
Health and School Facilities
0.217 2 3 1 4 1.062 2.208 3

29
Standard Error
Median Range Minimum Maximum Standard Deviation
Mean Rank
Functionality 0.18 2.33 3 1 4 0.86 2.36 4
Neighbour Behaviour
0.169 1 3 1 4 0.830 1.583 1
Sociability of People
0.213 1 3 1 4 1.042 1.708 2
Friends and Family
0.217 2 3 1 4 1.062 2.208 3
Table 4.6 indicates the means for individual sub-factors and are ranked 1 to 12 from
the most important, which is maintenance of the area (with a mean score of 1.50), to
the least important sub-factor which is open spaces (with a mean score of 2.75).
Table 4.6: Mean Rating for Neighbourhood Preferences Sub-Factors
Sub-Factors Mean Rank
Maintenance of Area 1.50 1
Property Safety 1.58 2
Personal Safety 1.71 3
Traffic Nuisances 1.83 4
Neighbour Behaviour 2.13 5
Shopping and Postal Centres 2.17 6
Police Visibility 2.21 7
Sociability of People 2.25 8
Employment Levels 2.29 9
Friends and Family 2.58 10
Health and School Facilities 2.63 11
Open Spaces 2.75 12
4.1.8.2 Building Attributes
Table 4.7 illustrates the relative importance and rank of all sub-factors that compose
the factors for building attributes. The most important factor, management (with a mean
score of 1.72) is composed of the mean scores of sub-factors, toilet facilities (with a
mean score of 1.54), electrical and IT services (with a mean score of 1.75) and HVAC
capacity (with a mean score of 2.17); and the least important factor, amenities (with a
mean score of 2.76) is composed of the mean of sub-factors, gym and health (with a

30
mean score of 2.71), food outlets (with a mean score of 2.79), banks and postal
services (2.79) (see also Appendix A).
Table 4.7: Descriptive Statistics of Mean Rating for Building Attributes and Sub-Factors
Standard Error
Median Range Minimum Maximum Standard Deviation
Mean Rank
Management 0.15 1.33 2.33 1 3.33 0.73 1.72 1
Toilet Facilities 0.17 1 2 1 3 0.83 1.54 1 Electrical and IT Services 0.22 1 3 1 4 1.07 1.75 2
HVAC Capacity 0.26 2 4 1 5 1.27 2.17 3
Services 0.19 1.33 2.67 1 3.67 0.91 1.82 2
Maintenance and Cleaning 0.17 1 2 1 3 0.83 1.54 1 Security and Access Control 0.22 1 3 1 4 1.07 1.75 2
Energy Consumption 0.26 2 4 1 5 1.27 2.17 3
Functionality 0.20 2.00 4.00 1 5.00 0.97 2.01 3
Floor Sizes 0.19 2 4 1 5 0.93 1.79 1
Column Layout 0.27 1 4 1 5 1.33 1.96 2
Space Efficiency 0.23 2 4 1 5 1.12 2.29 3
Accessibility 0.19 1.83 2.67 1 3.67 0.91 2.03 4
Lifts Performance 0.20 1 3 1 4 0.99 1.75 1
Parking in Building 0.18 2 3 1 4 0.88 1.79 2
Ingress 0.28 2 4 1 5 1.35 2.54 3
Presentation 0.17 2.33 3.00 1 4.00 0.84 2.47 5
External and Internal Finishes 0.13 1 2 1 3 0.65 1.42 1
Number of Storeys 0.28 2.5 4 1 5 1.39 2.75 2
Age of Building 0.27 3 4 1 5 1.33 3.25 3
Amenities 0.18 3.00 3.00 1 4.00 0.87 2.76 6
Gym and Health 0.24 2.5 4 1 5 1.20 2.71 1
Food Outlets 0.20 3 3 1 4 0.98 2.79 2 Banks and Postal Services 0.21 3 4 1 5 1.02 2.79 3

31
Table 4.8 shows the means for individual sub-factors, which are ranked 1 to 18 from
the most important, which is maintenance and cleaning (with a mean score of 1.29) to
the least important sub-factor which is number of storeys (with a mean score of 3.25).
Table 4.8: Mean Rating for Building Attributes Sub-Factors
Sub-Factors Mean Rank
Maintenance and Cleaning 1.29 1
External and Internal Finishes 1.42 2
Toilet Facilities 1.54 3
Electrical and IT Services 1.75 4
Security and Access Control 1.75 5
Parking in Building 1.75 6
Floor Sizes 1.79 7
Lifts Performance 1.79 8
Space Efficiency 1.96 9
Energy Consumption 2.13 10
HVAC Capacity 2.17 11
Column Layout 2.29 12
Ingress 2.54 13
Food Outlets 2.71 14
Age of Building 2.75 15
Banks and Postal Services 2.79 16
Gym and Health 2.79 17
Number of Storeys 3.25 18
4.1.9 Location Choice – Preferences and Attributes
The participants were then asked if they would locate their businesses or firms within
the Pretoria CBD.
Figure 4.11 depicts the percentage of businesses willing to locate in the CBD of
Pretoria. Of the responding individuals only 33% said they would be willing and the
majority, 67%, indicated they would not be willing to locate their business or firm within
the Pretoria CBD.

32
Figure 4.11: Percentage of Firms Willing to Locate in the Pretoria CBD
The participants were then asked to choose a precinct within which they would prefer
to locate their businesses or firms, among which were prestige, government, heritage
and historic. Figure 4.12 depicts the percentages of participants’ choice of preferred
precinct. The precinct that was most preferred to locate near or within in the CBD of
Pretoria was prestige (58%), which is shown to have the most number of 1 = most
preferred, and heritage (58%) was the least preferred, with the most 4 = least
preferred, to locate near or within. Government precinct was the next preferred after
prestige at 2 (42%) and next historic at 3 (42%).
Figure 4.12: Percentage of Participants’ Choices of Preferred Precinct to Locate to in the
Pretoria CBD
Table 4.9 depicts that the majority of businesses preferred to locate near or within the
prestige precinct in the Pretoria CBD, the number that appears most was 1 = most
preferred and heritage precinct was the least preferred, with the number that appears
most being 4 = least preferred (see also Appendix B).
58%
21%
8% 4%
17%
42%
17% 8% 8% 8%
42%
29%
17%
29% 33%
58%
Prestige Government Historic Heritage

33
Table 4.9: Mode for Location Choice – Preferred Precinct in Pretoria CBD
Group Prestige Heritage Historical Government
Preferred Precinct
Investors 1 3 3 2
Prestige
Government 1 4 2 4
Prestige
Occupiers 1 4 4 2
Prestige
Designers 1 4 4 2
Prestige
Developers - - - 1
Government
Managing 1 4 3 2
Prestige
MODE 1 4 3 2
Prestige
Table 4.10 portrays the order of ranking of the precincts. The most preferred precinct is
prestige, second government, third historic, fourth and last heritage.
Table 4.10: Ranking – Preferred Precinct in Pretoria CBD
Precinct Rank
Prestige 1
Government 2
Heritage 4
Historical 3
4.1.9.1 Sub-Factors – Preferred Precinct
Figure 4.13 defines the precinct that was most preferred to locate near to or within the
CBD of Pretoria. Prestige (14) is shown to have the largest number of 1 = most
preferred and heritage (14) was the least preferred, with the most 4 = least preferred,
to locate near or within. Government precinct was the next preferred after prestige with
most 2 (10) and next Historic with the most 3 (10).
Figure 4.13: Mode of Preferred Precinct
1 - MP 4 - LP
1 - MP 4 - LP
34
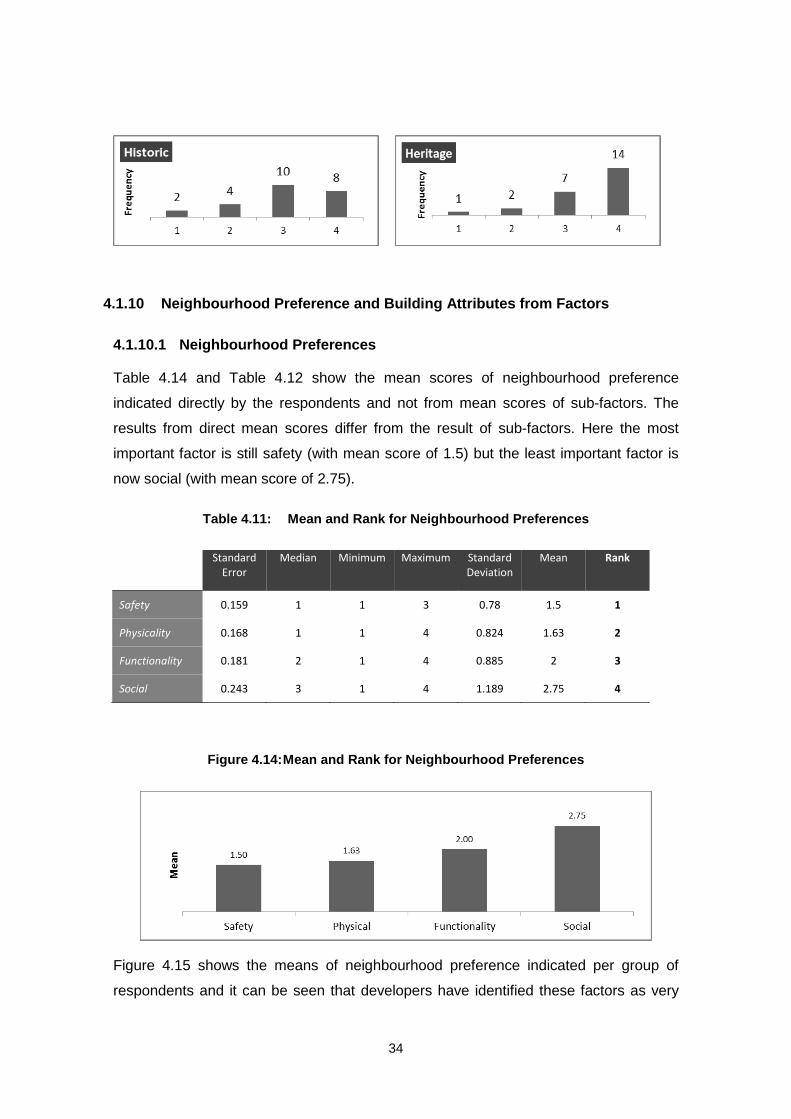
4.1.10 Neighbourhood Preference and Building Attributes from Factors
4.1.10.1 Neighbourhood Preferences
Table 4.14 and Table 4.12 show the mean scores of neighbourhood preference
indicated directly by the respondents and not from mean scores of sub-factors. The
results from direct mean scores differ from the result of sub-factors. Here the most
important factor is still safety (with mean score of 1.5) but the least important factor is
now social (with mean score of 2.75).
Table 4.11: Mean and Rank for Neighbourhood Preferences
Standard Error
Median Minimum Maximum Standard Deviation
Mean Rank
Safety 0.159 1 1 3 0.78 1.5 1
Physicality 0.168 1 1 4 0.824 1.63 2
Functionality 0.181 2 1 4 0.885 2 3
Social 0.243 3 1 4 1.189 2.75 4
Figure 4.14: Mean and Rank for Neighbourhood Preferences
Figure 4.15 shows the means of neighbourhood preference indicated per group of
respondents and it can be seen that developers have identified these factors as very

35
important (with mean scores of 1.0) and the institutional investor group registering the
least (slightly important factor) as social (with a mean score of 3.6).
Figure 4.15: Mean Rating for Neighbourhood Preferences by Groups of Respondents
Figure 4.16 demonstrates the number of counts per factor that indicated how many
indicated a particular factor as very important, important, moderately important or
slightly important.
Figure 4.16: The Count of Indications per Factor for Neighbourhood Preferences
4.1.10.2 Building Attributes
Table 4.12 and Figure 4.17 display the mean of neighbourhood preference indicated
directly by the respondents and not from the mean of sub-factors. The results from
direct means differ from the result of sub-factors; here the most important factor is still
safety (with a mean score of 0.5) but the least important factor is social (with a mean
score of 2.75).
13 8
2 1
VI I MI SI
Physicality

36
Table 4.12: Mean and Rank for Building Attributes
Standard Error
Median Minimum Maximum Standard Deviation
Mean Rank
Presentation 0.133 1 1 3 0.654 1.417 1
Management 0.213 1 1 4 1.042 1.708 2
Services 0.17 2 1 4 0.833 1.792 3
Functionality 0.233 2 1 5 1.142 2 4
Accessibility 0.275 1.5 1 5 1.349 2.083 5
Amenities 0.26 2 1 5 1.274 2.333 6
Figure 4.17: Mean and Rank for Building Attributes
Figure 4.18 shows the means of building attributes indicated per group of respondents
and it can be seen that investors have indicated these factors as very important and
the managing firms group registering the least i.e. slightly important factor, social (4.3).
Figure 4.18: Mean Rating and Relative Importance of Building Attributes for Group Respondents
1.4 1 1
2
1
1.8 1.8 1.8 1.5 1.7
1
2.5
1.2
2.7
1.3 1 1
2.3 2.6
2
1.5 1.7
1
2.5
2.0 2
1.3 1.7
1
3.5
2.4
1.8 2
1.3
2
4.3
Investors Government Occupiers Designers Developers Managing
Me
ans
Presentation
Services
Management
Functionality
Accessebility
Amenities

37
Figure 4.9 demonstrates the number of counts per factor that depicts how many
indicated a particular factor as very important, important, moderately important or
slightly important
Figure 4.19: Frequency of Relative Importance of Building Attributes
4.2 RELATIONSHIP BETWEEN NEIGHBOURHOOD PREFERENCES, BUILDING
ATTRIBUTES AND OFFICE LOCATION CHOICE
Figure 4.20 depicts the scatter plot for neighbourhood preference mean scores with
office location within the Pretoria CBD. This shows there is a positive relationship
between the two.

38
Figure 4.20: Scatter Plot for Neighbourhood Preferences and Location Choice in Pretoria CBD
Table 4.13 represents the computed correlation results for neighbourhood preference
mean scores with office location within the Pretoria CBD. The results show a
moderately positive relationship between the two at 0.52.
Table 4.13: Correlation between Neighbourhood Preference and Location Choice
Neighbourhood Preference
Location Choice
Neighbourhood Preference 1
Location Choice 0.5213 1
Figure 4.21 portrays the scatter plot for building attributes mean scores with office
location within the Pretoria CBD. This shows there is a positive relationship between
the two.
Figure 4.21: Scatter Plot for Building Attributes and Location Choice in Pretoria CBD
Loca
tio
n C
ho
ise
Neighbourhood Preference
Loca
tio
n C
ho
ice
Building Attributes

39
Table 4.14 represents the computed correlation results for building attributes’ mean
scores with office location within the Pretoria CBD. The results show a little more than
moderately positive relationship between the two at 0.63.
Table 4.14: Correlation between Building Attributes and Location Choice
Building Attributes Location Choice
Building Attributes 1
Location Choice 0.6278 1
4.3 FINDINGS
The factors and their sub-factors were identified from literature, and from the results it
can be argued that they are all related to office location decision making, based on
their mean scores calculated both by direct questions as to their importance to
neighbourhood preferences and building attributes, and by their mean scores
calculated from their sub-factors.
All factors are between very important and moderately important with mean scores
ranging between 1.5 and 2.75 for all neighbourhood preferences, and 1.29 and 3.25 for
all building attributes.
The majority of businesses would not prefer to locate within the Pretoria CBD, with
33% saying yes and 67% saying no. The most preferred precinct that the business
would prefer to locate near or within is prestige, followed by government, and historic,
with heritage being the least preferred.
The results for the relationship between neighbourhood preferences, at 0.52, building
attributes, at 0.63 and the office location choice are both positive and moderate
meaning that they are relatively strong.
Looking at the respondents by groups, the developers firms’ mean scores for
neighbourhood preferences (mean score of 1.0) was the highest, implying
neighbourhood preference factors are very important, and the managing firms’ mean
score for same neighbourhood preference (mean score of 2.79) was the lowest,
implying that they are moderately important, while the other groups lay in between. The
institutional investors together with government institutions showed the highest mean
score of 2.0 for building attributes, implying that these factors were important, and

40
managing firms had the lowest mean score of 2.79, implying that these factors were
slightly important.
Looking at the factors from the direct question about the importance of the factors the
mean scores for neighbourhood preference are safety (1.83), physicality (2.03), social
(2.32) and functionality (2.36) whereas the mean scores from sub-factors for
neighbourhood preferences are safety (1.5), physicality (1.63), functionality (2.0) and
social (2.75). Here, besides the differing means, functionality trades places with social
as being the least important factor.
Looking at the factors from the direct question about the importance of the factors, the
mean scores for building attributes are management (1.72), services (1.82),
functionality (2.01), accessibility (2.03), presentation (2.47) and amenities (2.76),
whereas the means scores from sub-factors for building attributes are presentation
(1.42) management (1.71), services (1.79), functionality (2.0), accessibility (2.08) and
amenities (2.33). Here, besides the differing means, presentation trades places with
management as being the most important factor.
These results are for those who took part in this study and without running a test for
significance we cannot infer the same relationship to the rest of the population of office
location decision makers from which the sample was drawn.
4.4 DISCUSSION
This research is about investigating what will bring or relocate businesses’ and firms’
offices from the suburbs back to Pretoria CBD by looking into the influencing factors,
preferences, attributes and criteria for neighbourhoods and buildings, and determining
their importance. The findings of the study provide insight into the participants’
perceptions and attitudes towards the importance of the various neighbourhood
preferences and building attributes that influence firms’ office location decisions.
Further, it gives insights to their attitudes to locating their firms within the Pretoria CBD,
and also provides insight into their interest in locating their firms near or within a
particular precinct or node within the CBD of Pretoria.
The respondents’ profiles comprise institutional investors, government institutions,
occupier firms, designer firms, developer firms and managing firms or businesses
within the office market sector in Pretoria Metro. These participants have reflected what
the office location decision makers’ preferences and towards locating their firms in the
Pretoria CBD and greater Pretoria Metro.

41
The results of the questionnaire have shown safety to be the most important factor
(mean score of 1.83 from sub-factors and mean score of 1.50 from factors) for
neighbourhood preferences. Management and presentation were the most important
factors (with mean scores of 1.71 for sub-factors and 1.42 from factors) for building
attributes. This shows the general feeling, by the participants, of being unsafe when
one is in the CBD, in terms of personal safety, property safety and visibility of police
within the Pretoria Metro, in that order of importance. Second in importance is the look
and feel of the area, as expressed by the mean scores for management and
presentation of the areas and buildings, with regard to maintenance and cleaning,
security and access control, energy consumption, and external and internal finishes.
This is not peculiar to South Africa and Pretoria CBD; there has been a drastic and
systemic degeneration and decline of major CBDs in general, and Pretoria CBD is no
exception to this phenomenon. Also when cities grow they became their own problem,
because of noise, traffic and congestion, leading to discomfort and a feeling of the area
being unsafe and dilapidated.
As in other studies, safety has scored the highest with regard to neighbourhood
preferences (Leby, 2010). However, unexpectedly and contrary to previous studies,
management and presentation scored the highest regarding building attributes, while in
other studies functionality scored the highest (Ho et al., 2005).
Safety and physicality scored the highest with mean scores of 1.00 and 2.30
respectively, with functionality being moderately important and social less so.
When grouping the results of the neighbourhood preference sub-factors three broad
ranges are displayed. The first cluster, ranging between very important and important,
were maintenance of the area, property and personal safety and traffic nuisances. The
second most important (moderately important) were neighbourhood behaviour,
shopping and postal centres, sociability of people, and employment levels. The third
range is between moderately important and slightly important; these are friends and
family, health and school facilities and open spaces.
Management and services were the most important attributes speaking to the
operations of the buildings, cleanliness, and security issues within the buildings, which
is in line with neighbourhood preferences.
When grouping the results of the building attributes sub-factors, four broad clusters are
revealed. The first group, very important, is maintenance and cleanliness, and external

42
and internal finishes of the buildings. The second group is very important to important,
which ranges from building services and facilities to performance and efficiency of the
building. The third, important to moderately important, includes energy consumption,
HVAC capacity and column layout, relating mostly to functionality of the building.
Fourth and lastly, moderately important to slightly important, includes ingress and
amenities like food outlets, banks and postal services.
Most respondents elected not to relocate their businesses to the CBD, because of the
major concerns with the safety, management and presentation of the area and its
buildings. Most of the respondents were renting space in newer premises and areas on
the periphery of the city and felt relocating to old Pretoria was undesirable. However,
most would choose to be located near a prestige precinct, which incorporated areas
near the Treasury Department and The Reserve Bank, and government precincts near
the Union Buildings. This is because of the consciousness of the prestige of Pretoria as
the capital of the country. Most respondents were private entities who ordinarily do not
do business with government; therefore, relocating to a predominantly government
CBD did not add any value to their business.
There is strong positive relationship between the neighbourhood factors, building
factors and office location choices within the Pretoria CBD, meaning improving
neighbourhoods and building safety, presentation and management will increase the
number of businesses and firms looking to locate within the area.
The results for the relationship between neighbourhood preferences, at 0.52, building
attributes, at 0.63, and the office location choice are both positive, meaning that they
are strong motivators.

43
CHAPTER 5 – CONCLUSION AND RECOMMENDATIONS
This chapter discusses first the conclusions from the findings, and second,
recommendations to the stakeholders including the institutional investors in charge of
making investment decisions, government institutions in charge of providing a policy
framework to enable the investment to take place; and the property practitioners in
charge of design, development and the management of these property portfolios.
Lastly it discusses considerations for future research.
5.1 CONCLUSION
The findings of this study have provided a better understanding of the important
variables with regard to neighbourhood preferences and building attributes in modern
urban studies, and sets out to find a solution to the possible degeneration of the
Pretoria CBD through its failing to attract investments and businesses who want to
locate in the CBD. Individuals occupying differing settings will differ in their subjective
assessments of these factors and concepts. This provides for a dynamic environment
for the various actors in this space, from investors to government to the professionals
and ultimately to the users and occupiers of these office spaces.
5.2 RECOMMENDATIONS
It is evident that different groups have varying perceptions of what would create a more
conducive neighbourhood and building environment in which to work. The analysis
indicates that efforts to promote the CBD should focus on ensuring the overall safety of
property and persons, and management and cleanliness of the areas and the buildings,
because these tend to enhance the image, and make people think highly of the areas
they are in or would be willing to relocate to.
Accordingly policy, investment and design that take into account, factors such as
neighbourhood preferences and building attributes identified as most important to
moderately important are required in order to attract business back to Pretoria CBD.
Government institutions that are tasked with policy and administration should use these
findings in generating policy that enables investment and property practices that
promote safety, management and presentation of the areas and buildings.

44
Institutional investors should take into consideration development initiatives that cover
issues of safety, management and presentation of the areas and buildings because
these to some extent can ensure that their investments will be lucrative.
Property practitioners, including designers, developers and managing firms, should
also consider the outcomes of this study, as this will ensure that occupiers of their
areas and buildings are satisfied.
5.3 FUTURE RESEARCH
Given that this study tries to suggest a new combination of factors for office location
decision making within the CBD, there remain numerous factors that require further
research. More detailed research into the effects of neighbourhood preferences and
building attributes, in particular office location in Pretoria CBD and other city centres in
South Africa, needs to be undertaken. Furthermore, a detailed investigation is needed
that looks into the attitudes of the various real-estate practitioner groups, especially
institutional investor attitudes, towards investing in these metros and government in
creating a favourable policy and administration environment (framework) for these
investments to take place.
Refinement of the approach and methodology, and tools to gather data scales between
factor intervals, for example between very important and important, by deriving other
scales in between or by introducing a combination of tools in future studies will refine
the scores and solve the problems of larger variances affecting validity and reliability.
In this study the factors were tested in two ways, by taking the mean of sub-factors and
by direct mean of the factors, which yielded some variation in the mean scores, and
therefore rankings in future using one of the two ways will not create validity and
reliability problems.

45
REFERENCES
Adair, A., Berry, J., McGreal, S., Deddis, B. and Hirst, S., (1999), "Evaluation of
Investor Behaviour in Urban Regeneration", Urban Studies, Vol. 36, No. 12, pp.
2031-2045
Adair, A., Berry, J., McGreal, S., Deddis, B. and Hirst, S., (2000) "The financing of
urban regeneration", Land Use Policy, 17, pp. 147-156
Adair, A., Berry, J., McGreal, S., Hutchson, N., Watkins, C. and Gibb, K., (2003),
"Urban regeneration and property investments performance", Journal of Property
Research, Vol. 20(4), pp. 371-386
African Cities 2063” (2015)
Alonso, W., (1960), "A theory of the Urban Land Market", PAPERS AND
PROCEEDINGS OF THE REGIONAL SCIENCE ASSOCIATION, VOLUME 6.
Aluko, O. (2011), "The effects of Location and Neighbourhood Attributes on Housing
Values in Metropolitan Lagos", Ethiopian Journal of Environmental Studies and
Management, Vol. 4, No. 2, pp. 69 - 82
Baum, A. E., (1993), "Quality, Depreciation, and Property Performance", The Journal of
Real Estate Research, Vol. 8 (4), pp. 541 - 565
Brinkman, J., Coen-Pirani, D. and Sieg, H., (2011), "Agglomeration Externalities and
the Dynamics of Firm Location Choices within an Urban Economy", Down loaded
from www.scholargoogle.com
Button, K., (1998), "Where did the 'New Urban Economics' go after 25 Years?” Paper
to the '38th Congress of the European Regional Science Association', Vienna, 28
August.
Cervero, R. and Duncan, M., (2004), "Neighbourhood Composition and Residential
Land Prices: Does Exclusion Raise or Lower Values?”, Urban Studies, Vol. 41, No.
2, pp. 299 - 315, February
Cohen, N., (2000), "Business Location Decision-Making and the Cities: Bringing
Companies Back", A working Paper presented for 'The Brookings Institution' Centre
on Urban and Metropolitan Policy"

46
Des Rosiers, F., Riault, M., Kesten, Y. and Villeneuve, P., (2007) "Landscaping
Attributes and Property Buyers’ Profiles: Their Joint Effect on House Prices",
Housing Studies, Vol. 22, No. 6, pp. 945 - 964, November
Des Rosiers, F., Thériault, M. and Villeneuve, P., (2000),"Sorting out access and
neighbourhood factors in hedonic price modelling", Journal of Property Investment &
Finance, Vol. 18 Iss 3 pp. 291 - 315
Doak, J. and Karadimitriou, N., (2007) "(Re)development, Complexity and Networks: A
Framework for Research" Urban Studies, Vol. 44, No. 2, pp. 209 - 229, February
2007
Duranton, D., (2008), "Spatial Economics", The New Palgrave Dictionary of
Economics, Second Edition, 2008. Edited by Steven N. Durlauf and Lawrence E.
Blume
Erickson, R.A. and Wasylenko, M., (1980), "Firm Relocation and Site Selection in
Suburban Municipalities", JOURNAL OF URBAN ECONOMICS, 8, pp. 69-85
Erikoson, R. A., (1986), "Multinucleation in Metropolitan Economies" Annals of the
Association of American Geographers, Vol. 76, Issue 3, pp. 331–346, September
Gibson, Virginia A; Lizieri, Colin M., (2001), "Friction and inertia: Business change,
corporate real estate portfolios and the U.K. office market", The Journal of Real
Estate Research, Jul-Oct 2001; 22, 1/2; ProQuest Central pp. 59
Guy, S. and Henneberry, J., (2000), "Understanding Urban Development Processes:
Integrating the Economic and the Social in Property Research" Urban Studies, Vol.
37, No. 13, pp. 2399-2416
Guy, S., Henneberry, J. and Rowley, S., (2002) "Development Cultures and Urban
Regeneration’, Urban Studies, Vol. 39, No. 10, pp. 1833–1863, 2002
Henry O. Pollakowski, H.O., Wachter, S.M. and Lloyd Lynford, (1992), "Did Office
Market Size Matter in the 1980s? A Time - Series Cross-Sectional Analysis of
Metropolitan Area Office Markets", Journal of the American Real Estate and Urban
Economics Association 1992, V20,l: pp. 303-324
Hess, R. and Liang, Y., (2003), "Some Structural Attributes of Institutional Office
Investments", Journal of Real Estate Portfolio Management, Vol. 9, No. 1, pp. 59

47
Ho, D., (1999), "Preferences on Office Quality Attributes", International Real estate
Conference, pp. 26-31 January
Ho, D., Newell, G. and Walker, A., (2005),"The importance of property-specific
attributes in assessing CBD office building quality", Journal of Property Investment &
Finance, Vol. 23 Iss 5 pp. 424 – 444
Hotelling, H., (1929), "Stability in Competition", The Economic Journal, Vol. 39, No.
153, pp. 41-57
Hough, D. and Kratz, C., (1983), "Can “Good” Architecture Meet the Market Test?"
JOURNAL OF URBAN ECONOMICS, 14, pp. 40-54
Howley, P., Scott, M. and Redmond, D., (2009), "Sustainability versus liveability: an
investigation of neighbourhood satisfaction", Journal of Environmental Planning and
Management, Vol. 52, Issue 6, pp. 847 - 864
Hsiao-Chi Chen, Ya-Wen Yu, (2008),"Using a strategic approach to analysis the
location selection for high-tech firms in Taiwan", Management Research News, Vol.
31 Iss: 4 pp. 228 – 244
Jackson, C. and Orr, A. (2011), "Real estate stock selection and attributes
preferences", Journal of Property Research, 28(4), pp. 317-339
Kaya, Sezgin, (2004),"Relating building attributes to end user's needs: "The owners -
designers - end users" equation", Facilities, 22, 9/10; ProQuest Central pp. 247
Kilkenny, M. and Thisse, J. (1998), "Economics of location: A selective survey",
Computer Operations research, 26, pp. 1369-1394
Korthals Altes, W. K., (2002), "Local Government and the Decentralisation of Urban
Regeneration Policies in The Netherlands", Urban Studies, Vol. 39, No. 8, 1439 -
1452
Krejcie R.V. and Morgan D.W. (1970), “Determining Sample Size for Research”,
Educational and Psychological Measurement, 30, pp. 607-610
Kryvobokov, M., (2005), "What location attributes are the most important for the market
value? Extraction of attributes from regression models", Property Management, Vol.
25 (3), pp. 257-286
48
Leby, J.L. and Hashim, A.H., (2010), "Liveability Dimensions and Attributes: Their
Relative Importance in the Eyes of Neighbourhood Residents", Journal of
Construction in Developing Countries, Vol. 15(11), pp. 67-91
Leishman C., Duse N.A., Warren F.J. and Watkins C., (2003), "Office space
requirements: comparing occupiers’ preferences with agents’ perceptions" Journal
of Property Investment & Finance, Vol. 20 Iss: 1 pp. 45 - 60
Leishman C., Orr A. and Pellegrini-Masini G., (2011), "The impact of Carbon Emission
Reducing Design Features on Office Occupiers’ Choice of Premises" Urban Studies,
Vol. 49 pp. 2419
Leishman, C. and Watkins, C., (2004),"The decision-making behaviour of office
occupiers", Journal of Property Investment & Finance, Vol. 22 Iss 4 pp. 307 - 319
Lizieri C. M., (2003), "Occupier Requirements in Commercial Real Estate Markets",
Urban Studies, Vol. 40 Iss. 5-6, pp. 1151 - 1169
Luoma T., Niemi, J., Rothe P., Lindholm A., (2010), "Office Occupiers’ Real Estate
Attributes - Identifying Occupiers’ Preferences" FIG Congress: Facing the
Challenges - Building the Capacity, Sydney, Australia, 11 - 16 April
Manning C., Rodriguez M. and Ghosh C., (1999), "Devising a Corporate Facility
Location Strategy to Maximize Shareholder Wealth", The Journal of Real Estate
Research, Vol. 17 Iss: 3 pp. 321
Nappi-Choulet I. and Decamps A., (2013), "Can Sustainability Enhance Business
District Attractiveness? A Survey of Corporate Property Decision In France", Urban
Studies, Vol. 50 pp. 3283
Nappi-Choulet, I., (2006), "The Role and Behaviour of Commercial Property Investors
and Developers in French Urban Regeneration: The Experience of the Paris
Region" Urban Studies, Vol. 43, No. 9, pp. 1511 - 1535, August 2006
Patsy Healey, P., (1995), "The institutional challenge for sustainable urban
regeneration" Cities, Vol. 12, No. 4, pp. 221-230
Permentier, M., Bolt, G. and van Ham, M., (2011), "Determinants of Neighbourhood
Satisfaction and Perception of Neighbourhood Reputation", Urban Studies, 48(5) pp.
977 - 996, April 2011

49
Rabianski, J.S., DeLisle, J.R. and Carn, N.G., (2001), "Corporate real estate site
selection: A community - specific information framework", JRER, Vol. 22, No. 1/2,
Jul - Oct, pp. 165 - 197
Richardson, H.W., (1988), "Monocentric vs. Polycentric Models: The future of Urban
Economics in Regional Science", The Annals of Regional Science, July, Volume 22,
Issue 2, pp 1-12
Roulac S., et al., (2002), "Corporate Real estate: A Profile of the Leading Companies in
Ireland", Journal of Real Estate Literature, Vol. 10 Iss: 1 pp. 95-107
Roulac, S. et al., (200), "Corporate Real estate in Ireland: A current perspective on
corporate strategic decision making", Journal of Property Investments and Finance,
21 (1), pp. 31 - 44
Sing T., et al., 2006, “Network connectivity and office occupiers’ space decision: The
case of Suntec City” Journal of Property Investment & Finance, Vol. 24 Iss: 3 pp.
221-238
Skevin, P., (2011), "COMMERCIAL REAL ESTATE MARKETING - THE
IMPORTANCE OF OFFICE LOCATION ON CORPORATE IMAGE",
http://hrcak.srce.hr/file/117281
Thunen, (1826), "The Isolated State"
Vandell, K.D. and Jonathan S. Lane, J., (1989), "The Economics of Architecture and
Urban Design: Some Preliminary Findings", AREUEA Journal, Vol. 17, No. 2.
Verburg, P.H. et al., (2004), "A method to analyse neighbourhood characteristics of
land use patterns", Computers, Environment and Urban Systems, Vol. 28, pp. 667-
690
Wardner, P., (2012), "Understanding the 'Sense of Place' in Office Location decision",
18TH ANNUAL PACIFIC-RIM REAL ESTATE SOCIETY CONFERENCE
ADELAIDE, AUSTRALIA, 15 –18 JANUARY 2012
Wong, C., (2002), "Developing Indicators to Inform Local Economic Development in
England" Urban Studies, Vol. 39, No. 10, pp. 1833 - 1863

50
APPENDIX A:
Descriptive Statistic for Neighbourhood Preferences and Sub-Factors

51
Table 1a: Category of participants, population and their proportion
Intended Sample Size = 200
Firm Category Population
(Approximate)
Proportional Participation (%)
Actual Participation
Institutional Investors, including Population Proportional
Participation (%) Actual Participation
Insurance Companies, and 59
(10%) (21%)
Banks 42
Government Institutions, including Population Proportional
Participation (%) Actual Participation
National, Provincial and Local, 62
(10%) (25%)
State Owned Enterprises. 38
Occupier Firms, including Population Proportional
Participation (%) Actual Participation
Finance / Insurance / Real Estate 41
(35%) (17%)
Retail / Wholesale 37
Business services 12
Services … Other 14
Law/Accounting/Medical/Consultants 389
Engineering / Architecture 40
Agriculture / Mining / Utilities 5

52
Intended Sample Size = 200
Firm Category Population
(Approximate)
Proportional Participation (%)
Actual Participation
Communication 10
Designers Firms, including Population Proportional
Participation (%) Actual Participation
Architecture; 10
(15%) (12%)
Consultants. 18
Developers Firms, including Population Proportional
Participation (%) Actual Participation
Contractors 19
(15%) (8%)
Consultants. 23
Managing Firms, including Population Proportional
Participation (%)
Actual Participation
Asset Management 7
(15%) (17%) Property Management 9
Facilities Management 13
Total 839
100 %
200 Number
100 %
24 Number

53
Table 1b - Listing the results by order and rank, and by participant
Neighbourhood
Preferences
Building
Attributes
Neighbourhood Preferences Building Attributes
Safety Socio Functionality Physical Presentation Management Services Functionality Access Amenities
Investors 2 2.25 1.2 3.6 2.6 1.6 1.4 1.8 1.2 2.6 2.0 2.4
Government 2 2.17 2 2.5 2.2 2 1 1.8 2.7 2 2 1.8
Occupiers 1.42 1.69 1.3 2.8 1.5 1.3 1 1.5 1.3 1.5 1.3 2
Designers 1.56 1.58 1 2.3 2 1 2 1.7 1 1.7 1.7 1.3
Developers 1.17 1 1 1 1 1 1 1 1 1 1 2
Managing 2.79 2.38 2 3.3 2 2.3 1.8 2.5 2.3 2.5 3.5 4.3
AVERAGES 1.81 1.84 1.41 2.57 1.88 1.52 1.41 1.72 1.56 1.88 1.96 2.30
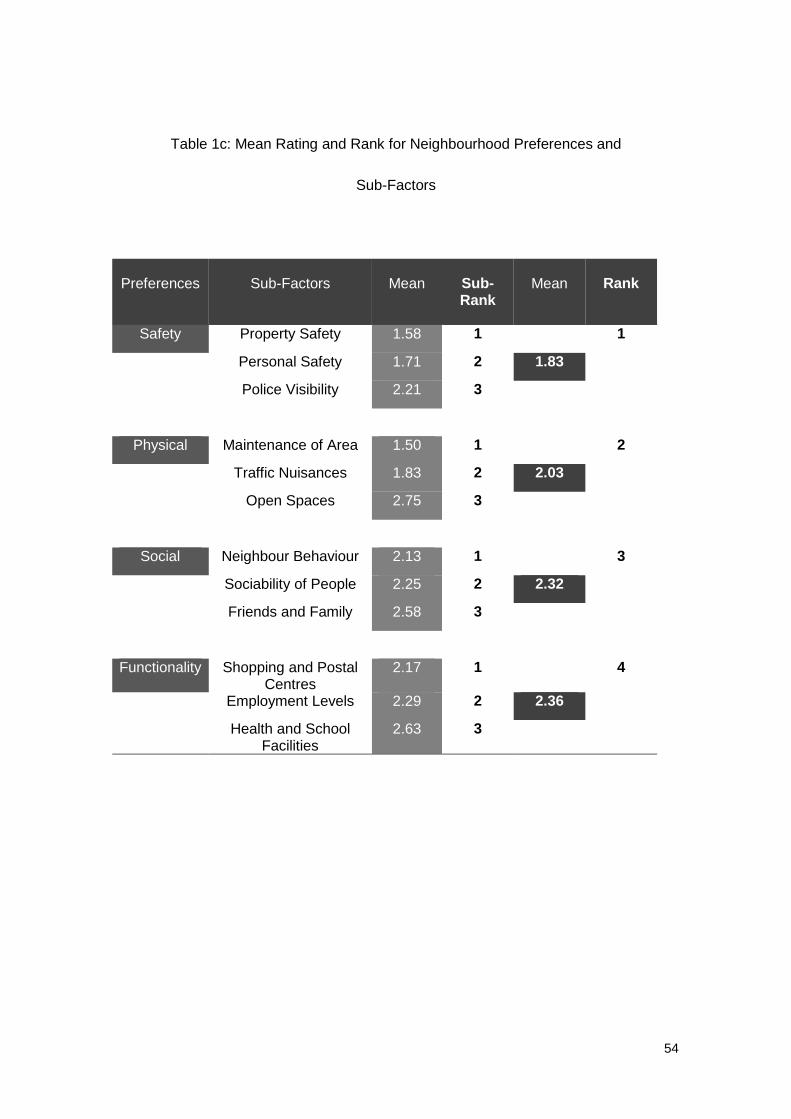
54
Table 1c: Mean Rating and Rank for Neighbourhood Preferences and
Sub-Factors
Preferences Sub-Factors Mean Sub-Rank
Mean Rank
Safety Property Safety 1.58 1 1
Personal Safety 1.71 2 1.83
Police Visibility 2.21 3
Physical Maintenance of Area 1.50 1 2
Traffic Nuisances 1.83 2 2.03
Open Spaces 2.75 3
Social Neighbour Behaviour 2.13 1 3
Sociability of People 2.25 2 2.32
Friends and Family 2.58 3
Functionality Shopping and Postal Centres
2.17 1 4
Employment Levels 2.29 2 2.36
Health and School Facilities
2.63 3

55
Table 1d: Mean Rating and Rank for Building Attributes and
Sub-Factors
Attributes Sub-Factors Mean Sub-
Rank
Mean Rank
Presentation External and Internal
Finishes 1.42 1
1
Age of Building 2.75 2 1.42
Number of Storeys 3.25 3
Management Maintenance and
Cleaning 1.29 1
2
Security and Access
control 1.75 2 1.71
Energy Consumption 2.13 3
Services Toilet Facilities 1.54 1
3
Electrical and IT
Services 1.75 2 1.79
HVAC Capacity 2.17 3
Functionality Floor Sizes 1.79 1
4
Space Efficiency 1.96 2 2.00
Column Layout 2.29 3
Accessibility Parking in Building 1.75 1
5
Lifts Performance 1.79 2 2.08
Ingress 2.54 3
Amenities Food Outlets 2.71 1
6
Banks and Postal
Services 2.79 2 2.33
Gym and Health 2.79 3
Neighbourhood Preference and Building Attributes for all Factors

56
Figures 1a below shows combined Neighbourhood Preference means for all the
factors. Safety is ranked the most important and Functionality the least important.
Figures 1b below shows combined Building Attributes means for all the factors.
Presentation is ranked the most important and Amenities the least important.

57
Figure 1a: Means and Ranks for Neighbourhood Preference
Figure 1b: Means and Ranks for Building Attributes
1.29
1.75
2.13
1.54 1.75
2.17
1.79 1.96
2.29
1.75 1.79
2.54
1.42
2.75
3.25
2.71 2.79 2.79
Maintainanceand Cleaning
Security andAccesscontrol
EnergyConsumption
ToiletFacilities
Electrical andIT Services
HVACCapacity
Floor Sizes SpaceEfficiency
ColumnLayout
Parking inBuilding
Liftserformance
Ingress External andInternalFinishes
Age ofBuilding
Number ofStoreys
Food Outlets Banks andPostal
Services
Gym andHealth
Management Services Functionality Accessebility Presentation Amenities
1 = 1.72 2 = 1.82 3 = 2.01 4 = 2.03 5 = 2.47 6 = 2.76
Me
an
1.58 1.71
2.21
1.50
1.83
2.75
2.13 2.25
2.58
2.17 2.29
2.63
Property Safety Personal Safety Police Visibility Maintanance ofArea
Traffic Nuisances Open Spaces NeighbourBehaviour
Sociability ofPeople
Friends andFamily
Shopping andPostal Centres
EmploymentLevels
Health andSchool Facilities
Safety Physical Social Functionality
1 = 1.83 2 = 2.03 3 = 2.32 4 = 2.36
Me
an

58
Relative Importance of Factors by Group
Investors
Figure 2a Illustrates the means for Neighbourhood Preference and Building
Attributes as indicated by Institutional Investors. They picked Safety (1.2) as the
most important factor for neighbourhood preference and Social (3.6) as the least
important. For Building Attributes they picked Management (1.4) as the most
important and Functionality (2.6) as the least important.
Figure 2a: Means for Neighbourhood Preference and Building Attributes indicated
by Institutional Investors
Neighbourhood Preferences Building Attributes
Government
Figure 2b Illustrates the means for Neighbourhood Preference and Building
Attributes as indicated by government. They picked Safety (2.0) as the most
important factor for neighbourhood preference and Social (2.5) as the least
important. For Building Attributes they picked Management (1.0) as the most
important and Functionality (2.7) as the least important.

59
Figure 2b: Means for Neighbourhood Preference and Building Attributes indicated
by Government Institutions
Neighbourhood Preferences Building Attributes
Occupiers
Figure 2c Illustrates the means for Neighbourhood Preference and Building
Attributes as indicated by occupiers. They picked Safety (1.3) as the most important
factor for neighbourhood preference and Social (2.5) as the least important. For
Building Attributes they picked Management (1.3) as the most important and
Functionality and Service share (1.5) as the least important.
Figure 2c: Means for Neighbourhood Preference and Building Attributes indicated by
Occupiers
Neighbourhood Preferences Building Attributes
Designers
Figure 2d Illustrates the means for Neighbourhood Preference and Building
Attributes as indicated by Designers. They picked Safety and Physicality share (1.0)
2.00 2.50
2.17 2.00
1.33 1.83
2.67
2.00 2.33
1.83
1.25
2.75
1.50 1.25
1.00 1.50
1.25 1.50
1.25
2.00

60
as the most important factor for neighbourhood preference and Social (2.3) as the
least important. For Building Attributes they picked Management (1.0) as the most
important and Functionality, Services and Accessibility share (1.7) as the least
important.
Figure 2d: Means for Neighbourhood Preference and Building Attributes indicated
by Designers
Neighbourhood Preferences Building Attributes
Developers
Figure 2e Illustrates the means for Neighbourhood Preference and Building
Attributes as indicated by Developers. They picked all factors (1.0) as the most
important factor for neighbourhood preference. For Building Attributes they picked
all(1.0) as the most important except for Amenities (2.0) as the least important.
Figure 2e: Means for Neighbourhood Preference and Building Attributes indicated
by Developers
Neighbourhood Preferences Building Attributes
1.00
2.33 2.00
1.00
2.00 1.67
1.00
1.67 1.67 1.33
1.00 1.00 1.00 1.00
1.00 1.00 1.00 1.00 1.00
2.00

61
Managing
Figure 2f Illustrates the means for Neighbourhood Preference and Building
Attributes as indicated by Managing. They picked Safety and Functionality share
(2.0) as the most important factor for neighbourhood preference and Social (3.3) as
the least important. For Building Attributes they picked Management (1.8) as the
most important and Amenities (4.3) as the least important.
Figure 2f: Means for Neighbourhood Preference and Building Attributes indicated by Managing
Neighbourhood Preferences Building Attributes
2.00
3.25
2.00 2.25 1.75 2.50 2.25 2.50
3.50 4.25

62
APPENDIX B:
Preferred Precinct
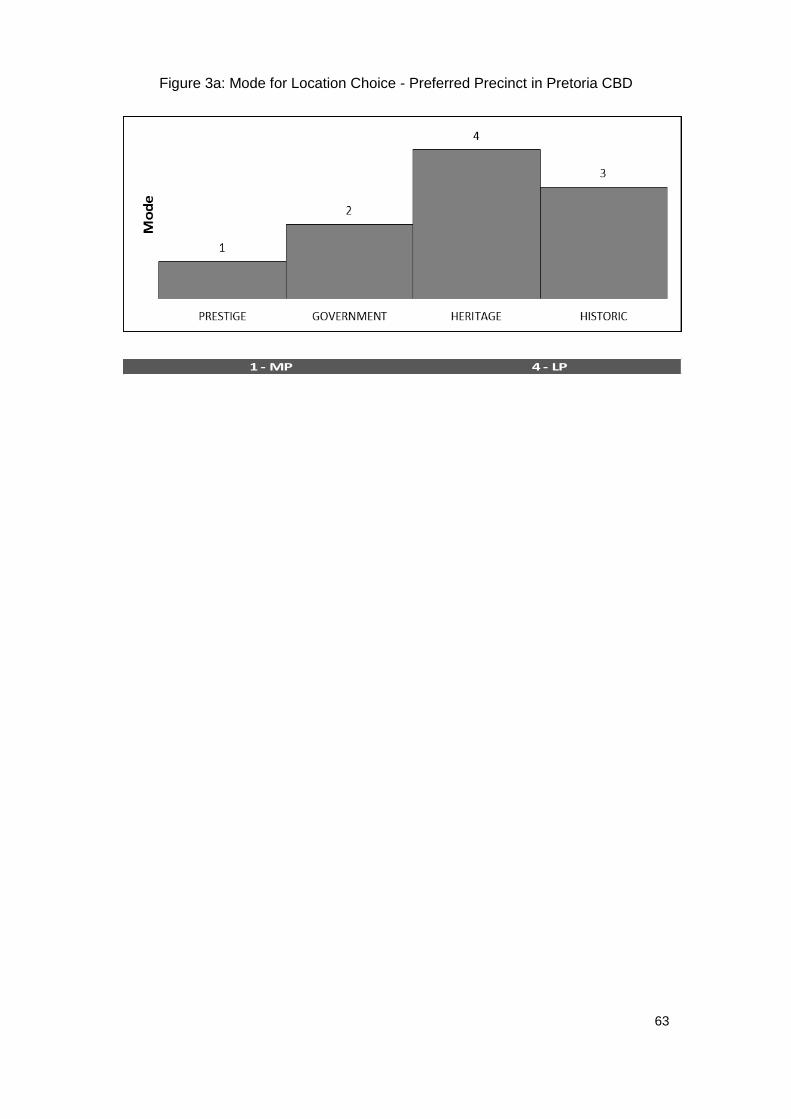
63
Figure 3a: Mode for Location Choice - Preferred Precinct in Pretoria CBD
1 - MP 4 - LP

64
APPENDIX C:
Questionnaire

65
- RESEARCH QUESTIONNAIRE -
PROPOSED TITLE (The Importance of Government Property Portfolio: Neighbourhood
Preferences, Building Attributes and Office Location in Pretoria) by
Mathemba Mosery 0707177A
Submitted in partial fulfilment of the requirements for the degree
M Sc. Building (Property Development and Management) in the
FACULTY OF CONSTRUCTION ECONOMICS AND MANAGEMENT SCIENCES at the
UNIVERSITY OF WITWATERSRAND
Date of submission
(August 2016)

66
Please complete all questions before the 30 September 2016, this questionnaire will be fetched from you. The outputs will assist me on my dissertation. Feel free to answer all questions fully and with honesty. Note that no names of organisations or individuals participation will be disclosed in the report.
Organisation Name
Title and Capacity (Role)
SECTION 1: Organisation Information
1. 4
.
Is your organisation Private, Public or Government
……………………………………… ………………………………………
2. 5.
What is the main business of your organisation
3. 6.
What is the size of your organisation: Assets under management
Number of employees
Turn-Over
……………………………………… ………………………………………

67
SECTION 2: Neighbourhood Preferences Please mark the appropriate block “X”
ITEM NO.
QUESTIONS RATINGS
1.
Question: How would you categorise your organisations role within the office sector in the Pretoria Metro? Comments …………………………………… ……………………………………
1 Own Assets
2 Owner Occupier
3 Institutional Investor
4 Individual Investor
5 Developer
6 Designer
7 Managing
2.
Question: With respect to Neighbourhood Preference, how would you rate the following in order of preferences? SAFETY: pertaining to personal safety, property safety and police and security guards visibility in the neighbourhood SOCIAL: pertaining neighbours behaviour and relationship; sociability, cordiality, friendship and sense of the people; and distance from friends. FUNCTIONALITY: pertaining to health and school facilities, shopping and postal centres; employment level and opportunities. PHYSICAL: pertaining to maintenance and collection of rubbish on streets and open arears; traffic nuisance; and provision of
1 - Very Important 2 - Important 3 - Moderately Important 4 - Slightly Important 5 - Not Important
1 2 3 4 5
1 2 3 4 5
1 2 3 4 5
1 2 3 4 5
1 2 3 4 5

68
open spaces. Comments …………………………………… ……………………………………
3.
Question: From Neighbourhood safety factors, how would you rate the following in order of preferences? PERSONAL SAFETY: with regards to felling personally safe. PROPERTY SAFETY: with regards to felling your property and possessions are safe. POLICE VISIBILITY: with regards to police and security guards visibility. Comments …………………………………… ……………………………………
0 = Not Important 1 = Little Important 2 = Average Important 3 = Very Important 4 = Extremely Essential
1 2 3 4 5
1 2 3 4 5
1 2 3 4 5
4.
Question: From Neighbourhood social factors, how would you rate the following in order of preferences? NEIGHBOUR BEHAVIOR: with regards to attitude, behaviour and relationship of your work neighbours. SOICIABILITY OF PEOPLE: with regards to cordiality, friendship and sense of the people, within the
0 = Not Important 1 = Little Important 2 = Average Important 3 = Very Important 4 = Absolutely Essential
1 2 3 4 5
1 2 3 4 5

69
work environment FRIENDS AND FAMILY: with regards to distance from friends and family. Comments …………………………………… ……………………………………
1 2 3 4 5
5.
Question: From Neighbourhood functional factors, how would you rate the following in order of preferences? HEALTH AND SHOOL FACILITIES: with regards to health and school facilities. SHOPPING AND POSTAL CENTRES: with regards to shopping and postal centres. EMPLOYMENT LEVELS: with regards to employment level and opportunities. Comments ……………………………………
1 - Very Important 2 - Important 3 - Moderately Important 4 - Slightly Important 5 - Not Important
1 2 3 4 5
1 2 3 4 5
1 2 3 4 5
6.
Question: From Neighbourhood physical factors, how would you rate the following in order of preferences? MAINTENANCE OF AREA: with regards to maintenance and collection of rubbish on streets and open arears.
1 - Very Important 2 - Important 3 - Moderately Important 4 - Slightly Important 5 - Not Important
1 2 3 4 5

70
TRAFFIC NUISANCES: with regards to traffic nuisance. OPEN SPACES: with regards to availability and provision of open spaces. Comments …………………………………… ……………………………………
1 2 3 4 5
1 2 3 4 5
7.
Question: Please mark with 1 - 4, the following in order of importance to your organisation. PRESTIGE: Locating in a building or near a building of prestigious importance HERITAGE: Locating in a building or near a building of heritage importance HISTORIC: Locating in a building or near a building of historic importance. GOVERNMENT: Locating in a building or near a building of government importance Comments …………………………………… ……………………………………
1 - Being the most
preferred
4 - Being the least
preferred

71
SECTION 3: Building Attributes Please mark the appropriate block “X”
ITEM NO.
QUESTIONS RATINGS
8.
Question: With respect to Building Attributes, how would you rate the following in order of preferences? PRESENTATION: with regards to external and internal finishes (façade, identity, entrance, foyer, common areas), number of storeys, and age of building SERVICES: with regards to toilet facilities; electrical and IT services; and HVAC control and capacity. MANAGEMENT: with regards to maintenance and cleaning services, security and access control, and energy consumption. FUNCTIONAL: with regards to floor sizes; column layout and sub divisibility; and space efficiency. ACESSES AND CIRCULATION: with regards to lifts (passenger and goods); parking in building; and ingress of persons and cars. AMENITIES: with regards to bank, laundry, pharmaceutical and other services; gym and health clubs; and restaurant, kitchen and food outlets. Comments …………………………………… ……………………………………
1 - Very Important 2 - Important 3 - Moderately Important 4 - Slightly Important 5 - Not Important
1 2 3 4 5
1 2 3 4 5
1 2 3 4 5
1 2 3 4 5
1 2 3 4 5
1 2 3 4 5
1 2 3 4 5

72
9.
Question: With respect to Building presentation factors, how would you rate the following in order of preferences? EXTERNAL AND INTERNAL FINISHES: with regards to external (façade and identity) and internal (entrance, foyer and common areas) finishes NUMBER OF STOREYS: with regards to low or high rise building, or number of floors. AGE OF BUILDING with regards to whether the building is old or new. Comments …………………………………… ……………………………………
1 - Very Important 2 - Important 3 - Moderately Important 4 - Slightly Important 5 - Not Important
1 2 3 4 5
1 2 3 4 5
1 2 3 4 5
10.
Question: With respect to Building services factors, how would you rate the following in order of preferences? TOILET FACILITIES: with regards to availability and cleanliness. ELECTRICAL AND IT SERVICES: with regards to lighting and bandwidth. HVAC CAPACITY: with regards to HVAC control and capacity. Comments ……………………………………
1 - Very Important 2 - Important 3 - Moderately Important 4 - Slightly Important 5 - Not Important
1 2 3 4 5
1 2 3 4 5
1 2 3 4 5

73
11.
Question: With respect to Building management factors, how would you rate the following in order of preferences? MAINTENCE AND CLEANING: with regards to callouts and cleanliness of building. SECURITY AND ACCESSE CONTROL: with regards to urgency and ease. ENERGY CONSUMPTION: with regards to energy conservancy Comments …………………………………… ……………………………………
1 - Very Important 2 - Important 3 - Moderately Important 4 - Slightly Important 5 - Not Important
1 2 3 4 5
1 2 3 4 5
1 2 3 4 5
12.
Question: With respect to Building functionality factors, how would you rate the following in order of preferences? FLOOR SIZES: with regards to available space for work stations. COLUMN LAYOUT: with regards to column layout, sub divisibility and flexibility of space. SPACE EFFICIENCY: with regards to space efficiency and number of work stations. Comments ……………………………………
1 - Very Important 2 - Important 3 - Moderately Important 4 - Slightly Important 5 - Not Important
1 2 3 4 5
1 2 3 4 5
1 2 3 4 5

74
13.
Question: With respect to Building access and circulation factors, how would you rate the following in order of preferences? LIFTS PERFORMANCE: with regards to lifts loading and control (passenger and goods). PARKING IN BUILDING: with regards to number and availability. INGRESS: with regards to ingress of persons and cars. Comments …………………………………… ……………………………………
1 - Very Important 2 - Important 3 - Moderately Important 4 - Slightly Important 5 - Not Important
1 2 3 4 5
1 2 3 4 5
1 2 3 4 5
14.
Question: With respect to Building amenities factors, how would you rate the following in order of preferences? BANKS AND POSTAL SERVICES: with regards to bank, laundry, pharmaceuticals and other services. GYM AND HEALTH CLUB: with regards to gym and health clubs. FOOD OUTLETS: with regards to restaurant, kitchen and food outlets. Comments ……………………………………
1 - Very Important 2 - Important 3 - Moderately Important 4 - Slightly Important 5 - Not Important
1 2 3 4 5
1 2 3 4 5
1 2 3 4 5

75
SECTION 5: Office Space Requirements Please mark the appropriate block “X”
15.
Question: What office space size does your organisation currently occupy? Comments ……………………………… ………………………………
1 = 0 - 250 m2
2 = 0 - 350 m2
3 = > = 1000 m2
4 = > = 2500 m2
5 = Do not know
16.
Question: What office space size does your organisation require? Comments ……………………………… ………………………………
1 = 0 - 250 m2
2 = 0 - 350 m2
3 = > = 1000 m2
4 = > = 2500 m2
5 = Do not know
17.
Question: what age of building does your organisation occupy? Comments ……………………………… ………………………………
1 = < = 15
2 = > 15, but < = 35
3 = > 35, but < = 75
4 = > 75
5 = Do not know
18.
Question: what age of building does your organisation require? Comments ……………………………… ………………………………
1 = < = 15
2 = > 15, but < = 35
3 = > 35, but < = 75
4 = > 75
5 = Do not know
19.
Question: Is the office space occupied by your organisation adequate?
Yes No
1 2 3 4 5

76
. Comments ……………………………… ………………………………
20. .
Question: would your organisation or firm locate in the CBD of Pretoria? Comments ……………………………… ………………………………
Yes No
21.
Question: There is plenty available / or How would you describe the following? Please indicate the most appropriate? Public transport: within walking distance from the office. Parking around: within walking distance from the office. Cleanliness around: property and facilities management in the CBD of Pretoria Safety: visibility of law enforcement and I feel safe when I am around the CBD of Pretoria. Comments ………………………………
1 - Strongly Agree 2 - Agree 3 - Undecided 4 - Disagree 5 - Strongly disagree
1 2 3 4 5
1 2 3 4 5
1 2 3 4 5
1 2 3 4 5

77
SECTION 4: Demographics Information Please fill the appropriate block
22.
Race:
Black
Coloured
India
Whites
Other:
Specify: ……………………………………………
23.
Age:
1 = 18 - 24
2 = 25 - 34
3 = 35 - 50
4 = 49 - 65
5 = > 65
24. Gender:
Female Male
25.
Education:
National Certificate (Matric)
National Diploma
Degree
Post Graduate Degree
PhD / Doctoral Degree
Other:
Specify: ……………………………………………

78
26. Please state your years of experience:
0 to 2 Years
2 to 5 Years
5 to 10 Years
10 to 15 Years
15 Years and above
27.
Income per month:
R 0 to R 3 500.00
R 3 500.00 to R 10 000.00
R 10 000.00 to R 30 000.00
R 30 000.00 to R 50 000.00
R 50 000.00 and above


![HMRC research report 566: Understanding Employment … · 2020. 9. 15. · HM Revenue and Customs Research Report 566 Trinh Tu and Ralph Halliday . Ipsos MORI | [Report title]](https://img.pdfslide.us/doc/110x75/5ff887af1800d437d47af487/hmrc-research-report-566-understanding-employment-2020-9-15-hm-revenue-and.jpg)