Embed Size (px)
Citation preview
FINAL RESEARCH REPORT
Date: November 2009 Research Provider: NIWA
Project Code: BEN200601 Objective 5
Project Title: Mapping the spatial and temporal extent of fishing in the NZ EEZ Report Title: Extent of coverage of 15 environmental classes within the New Zealand EEZ by
commercial trawling with seafloor contact Principal Investigator: SJ BAIRD
Authors: Baird, S.J.; Wood, B.A.
Project Start Date: Expected Project End Date: 31 July 2009
EXECUTIVE SUMMARY
The trawl footprint and the cumulative swept area determined from 16 years of commercial trawling on or near the
seafloor within the New Zealand 200 n. mile Exclusive Economic Zone (including the 12 n. mile Territorial Sea) were compared with the distribution of 15 benthic-optimised marine environment classes using an Albers equal
area projection in ArcGIS. The classes were mainly determined by depth, temperature, and salinity for waters with
depths of 3000 m or less. The extent of coverage by the 16-year footprint was influenced by the size of each class and the location of established fishing grounds. The footprint covered more than 50% of two environmental
classes: one in shelf waters generally deeper than 100 m and shallower than 250 m and distributed from the west coast South Island north across the shelf to encompass the depth range around the North Island, and the other in
eastern waters south of 42° S in 250–750 m, mainly across the southern Chatham Rise slope south to the southern
edge of the Stewart-Snares shelf. Over 30% of the areas of five classes in shelf and slope waters were covered by the footprint, and classes with little footprint area were mainly in deep waters below 1600 m. Most of the annual
variation in the cumulative swept area and the footprint is a result of changes in effort for hoki (Macruronus novaezelandiae) and squid (Nototodarus sloanii) in 200–800 m and inshore species including snapper (Pagrus auratus) and tarakihi (Nemadactylus macropterus). The footprint and cumulative areas are both seriously underestimated for waters shallower than 200 m, particularly around the South Island, because about 50% of the
annual effort data for these waters was reported on forms that could not be included in this analysis. Some
underestimation is likely also for deeper waters, but of a much lower magnitude. This report provides managers with a broad scale assessment of fishing effort on or near the seafloor and indicates waters of varying levels of
intensity and frequency as a basis for spatial management at the EEZ scale.
OVERALL OBJECTIVE:
1. To determine the distribution, frequency, and return times of New Zealand bottom trawl and dredge fisheries.
SPECIFIC OBJECTIVE:
5. To integrate information on the distribution, frequency, and magnitude of fishing disturbance with habitat
characteristics throughout the EEZ, using information stored in national databases, expert opinion, and the MEC.
2
INTRODUCTION
A measure of the nature and extent of modification of the seafloor by fishing pressure requires information on the spatial and temporal distribution of the fishing effort and on the environment in which the fishing occurs (Jennings
& Kaiser 1998, NRC 2002). Coupled with a classification of the marine environment based on relevant
environmental and biological parameters, the spatial distribution of fishing pressure can indicate areas of high or low pressure for classes of different sensitivities (Kaiser et al. 2002). Ministry of Fisheries managers are required to
consider the environmental effects of fishing alongside the sustainability of the target species, and spatial management provides one opportunity to manage any adverse effects on different marine environments or
habitats within the New Zealand 200 n. mile Exclusive Economic Zone (EEZ). This report was prepared as part completion of Objective 5 of Ben200601 and provides an overview of the 16 years of trawl fishing on or near the
seafloor (reported by Baird et al. 2009 for Objectives 1–4) in relation to the benthic-optimised marine environment
classification completed by Leathwick et al (2009). These two reports are the basis for the sections below.
Distribution of the trawl footprint
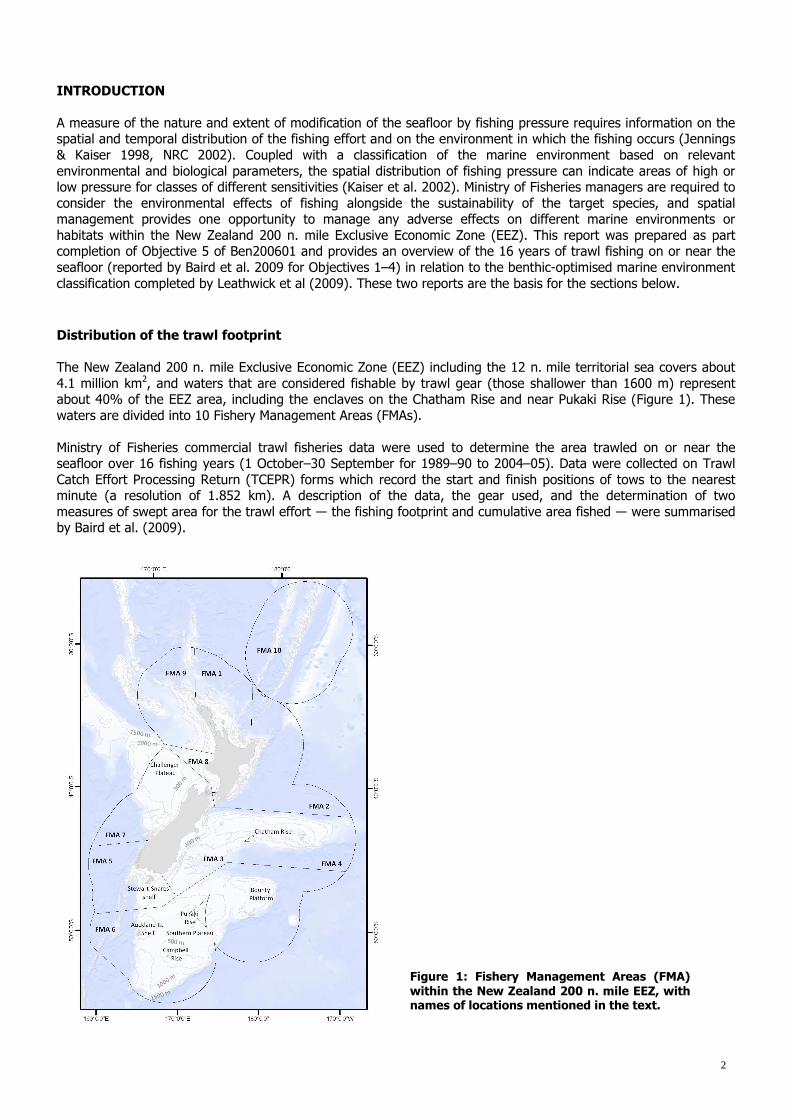
The New Zealand 200 n. mile Exclusive Economic Zone (EEZ) including the 12 n. mile territorial sea covers about
4.1 million km2, and waters that are considered fishable by trawl gear (those shallower than 1600 m) represent about 40% of the EEZ area, including the enclaves on the Chatham Rise and near Pukaki Rise (Figure 1). These
waters are divided into 10 Fishery Management Areas (FMAs).
Ministry of Fisheries commercial trawl fisheries data were used to determine the area trawled on or near the seafloor over 16 fishing years (1 October–30 September for 1989–90 to 2004–05). Data were collected on Trawl
Catch Effort Processing Return (TCEPR) forms which record the start and finish positions of tows to the nearest minute (a resolution of 1.852 km). A description of the data, the gear used, and the determination of two
measures of swept area for the trawl effort ― the fishing footprint and cumulative area fished ― were summarised by Baird et al. (2009).
Figure 1: Fishery Management Areas (FMA)
within the New Zealand 200 n. mile EEZ, with names of locations mentioned in the text.

3
The 970 420 tows included in the area analyses represent about 50% of all trawl effort on or near the seafloor in the time period (a total of about 2 million tows). Trawl data not included here were reported on Catch Effort
Landing Return (CELR) forms which record daily effort, rather than tow-by-tow data, at a coarse scale of fishery Statistical Areas (shown in Figure 1.1 in Appendix 1). These CELR data represent the effort of small vessels
(generally less than 28 m), that fish inshore waters. Over the years, some fishers have moved from reporting effort
on CELRs to TCEPRs, thus increasing the available data for fine-scale analysis. On an annual basis, the proportion of tows reported on TCEPRs rose from 34% in 1989–90 to about 48% in 2004–05 in terms of the numbers of tows
that used bottom trawl gear, or midwater gear within a metre of the seafloor. However, the uptake of the use of TCEPRs by small vessel fishers has been variable, depending on the location of the fishing as shown in the effort in
coastal Statistical Areas (Figure 1.2 in Appendix 1); thus, some areas are consistently poorly represented by the trawl footprint (for example, Statistical Areas 013, 022, 024–026, and 038). However, the data do represent a high
proportion of trawl effort with seafloor contact in waters deeper than 200 m because fishers of vessels over 28 m
targeting middle depths and deepwater species report trawl effort on TCEPRs. For each tow, the trackline created between the start and finish positions was buffered using a doorspread value appropriate for the gear and vessel size to generate a trawl polygon as a relative, not absolute, indicative measure
of trawl contact, based on several assumptions, including that the tow followed a straight line, the gear had seafloor contact throughout the tow, the doorspread was a reasonable representation of the trawl gear width, and
that no part of the seafloor was unfishable (Baird et al. 2009). Tows with a single valid start or finish position were
assigned a doorspread-based polygon centred on the point location; and for each very short tow for deepwater targets with the same start and finish locations (about 3% of the nearly million tows in the analysis), a circle
polygon sized by the estimated swept area based on the recorded tow speed, calculated time taken, and the assigned doorspread was centred on the point location. The fishing footprint is defined as the coverage swept area
(measured in km2) and represents the seafloor area estimated to have been contacted by trawl gear. The cumulative area represents the sum of all tow-specific swept areas. These area calculations were assigned to a
5 x 5-km cell grid in a customised Albers equal area projection, with the following spatial data properties: Central
Meridian: 175.00; Standard parallel_1: -30.00; Standard parallel_2: -50.00; Latitude of origin: -40.00; Datum: WGS84.
The 66 853 25-km2 cells within the EEZ (including the enclaves and the 12. n. mile territorial sea as shown in
Figure 1) considered to be of fishable depths (that is, the depth measured at the midpoint of each cell was shallower than 1600 m) are referred to as available cells. The fishing footprint and cumulative swept areas from
the 16-year dataset crossed 36 792 cells, and these cells are referred to as fished cells and represent 55% of the
available cells. The areas of the 16-year footprint within each fished cell varied from less than 0.5 m2 (in a cell that the representative trawl polygon just touched an edge of the cell) to the entire area of each cell (in cells that were
entirely covered by the footprint of trawls). The cumulative area data ranged from less than 0.5 m2 swept area per fished cell to almost 2150 km2 per cell over the 16-year dataset.
The 16-year fishing footprint was distributed throughout the EEZ, though very little fishing occurred in FMA 10
(Figure 2). The footprint delineates the main fishing grounds, particularly in waters shallower than 800 m: inshore
fisheries of the North Island in FMAs 1, 2, & 9 mainly targeting John dory (Zeus faber), red gurnard (Chelidonichthys kumu), snapper (Pagrus auratus), tarakihi (Nemadactylus macropterus), and trevally
(Pseudocaranx dentex ); jack mackerel (Trachurus spp.) fisheries in deeper water in FMAs 8 & 9; hoki (Macruronus novaezelandiae) and middle depths fisheries in FMA 7; middle depths and shallow water species including squid
(mainly Nototodarus sloanii) in southern waters off Stewart-Snares shelf in FMA 5 and east towards Pukaki Rise in
FMA 6; squid and scampi (Metanephrops challengeri) off the Auckland Islands Shelf in FMA 6; inshore red cod (Pseudophycis bachus) fisheries in FMA 3 and mainly middle depth species on the Chatham Rise in FMAs 3 & 4.
The smaller footprint in deeper waters off the slope resulted from the relatively smaller swept area values for effort that targets deepwater species such as orange roughy (Hoplostethus atlanticus) and oreo species (including
Allocyttus niger, Neocyttus rhomboidalis, Pseudocyttus maculatus) (see Baird et al. 2009).
The areas where the 16-year footprint is equal to at least 80% of a cell area are also those which were fished from
one year to the next (see Figure 2 where each fished cell is coloured to indicate the numbers of years the cell was fished). Over the 16 fishing years, 20% of all fished cells were crossed by one or more trawls in one year only,
30% in 2–5 years, 18% in 6–10 years, 22% in 11–15 years, and 10% in every year (Figure 3). Cells with fishing in several years were generally outside the main fishing areas and probably reflect the extremes of a trawl polygon
such as the end of a tow or the buffered trackline contacting cells peripheral to the main estimated trawl path as
well as areas where occasional tows were made.

Figure 2: Distribution of cells based on the number of years at least one trawl crossed a cell (left) and the intensity of the 16-year cell footprint (right), where cells are coloured to represent the numbers of years with fishing.

Over the time series, between 65 and 47% of the available cells were not fished each year and of the remainder:
27–37% had footprints of between 0.1 and 5.0 km2 (where 5 km2 represents 20% of the cell area); 4–7% had
footprints of 5.1–10.0 km2; 2–4% had footprints of 10.1–15.0 km2, 1–3% of 15.1–20.0 km2; and 1–3% of available cells had 20.1–25.0 km2 footprints. Thus, on an annual basis, footprints for 15–19% of available cells covered up
to 4% of the cell area and 0.2–0.4% of cells in fishable depths were completely covered by the cell footprint.
Technological advances in electronic and acoustic gear allow fishers to accurately place the net, to follow and capture fish schools, or to trawl around known areas of foul ground. The physical limits of trawling in deep waters
restrict the available fishing areas, as does the underlying topography of the seafloor, such as where the shelf
drops off steeply. Other areas where fishing is unlikely to occur are areas of rough bottom or where there appear to be few fish, perhaps because of low productivity as modelled by Bradford-Grieve et al. (2003) for the Southern
Plateau and suggested by the lack of fishing on the Challenger Plateau.
Fishing restrictions (legislative and voluntary) relevant to the time period covered by the analysis of the trawl
footprint relate to target fisheries, fishing gear use and size, vessel size and nationality, season and time of day may prohibit trawling by some vessels in New Zealand waters (for example, Figure 1.3 in Appendix 1). Some parts
of the fishable depths within the EEZ are closed to all trawling, for example, seafloor areas where cables and pipelines are in place, marine reserves, marine parks, and marine mammal reserves.
Marine Environment Classification
Several environmental classifications have been developed for New Zealand waters in recent years. Snelder et al.
(2006) developed a Marine Environment Classification (MEC) for the New Zealand region based on environmental variables including depth, seafloor slope, wave disturbance, annual solar radiation, annual amplitude and gradient
of winter sea surface temperature, and tidal currents, with biological inputs of demersal fish distribution collated
from trawl surveys, chlorophyll A, and some benthic invertebrates. Leathwick et al. (2006) used the distribution of a larger set of demersal fish data, similar environmental variables, and trawl characteristics to determine variation
in species richness. In a more recent classification of rivers and streams a more refined approach based on Generalised Dissimilarity Modelling (GDM) of Ferrier et al. (2007) was used to discriminate biological groups
(Leathwick et al. 2008).
This GDM approach was utilised to define a benthic-optimised marine environment classification (BOMEC) of
waters in waters shallower than 3000 m within the New Zealand EEZ (Leathwick et al. 2009) (reproduced in Figure 2.1 in Appendix 2). Environmental data from the previous MEC were supplemented with sediment data and derived
resuspension values, and distribution data for 8 taxonomic groups (data from trawl survey databases, MFish observer database, and species distributional databases (Leathwick et al. 2009)). This work defined a 15-class
BOMEC with classes strongly defined by depth, temperature, and salinity into 5 major groups: inshore and shelf,
upper slope, northern mid-depths, southern mid-depths, and deeper waters. A description of these classes is provided by Leathwick et al. (2009). This classification (at a 1 x 1 km cell resolution), by taking into account the
distribution of sediment information and benthic biological groups and being constrained to depths less than 3000 m, represents the best available marine classification with relevance to the benthos and the modification of
the seafloor by mobile fishing methods, at the scale of the EEZ.
0
5
10
15
20
25
1 2 3 4 5 6 7 8 9 10 11 12 13 14 15 16
No. yea rs fi shed
To
tal
cell
s (%
)
70
Figure 3: Annual frequency of fished cells (n = 36 792) (left) and annual footprint area frequency for available cells (n = 66 863) (right), where the footprint of fished cells covers the cell area at 25 km2.
0
10
20
30
40
50
60
70
0 1 2 3 4 5 6 7 8 9 10 11121314 15161718 19202122 232425
Footprint area per cell (sq.km)
To
tal
cells
(%)

6
METHODS
To determine where the trawl footprint and cumulative swept area contacted the seafloor for each BOMEC class,
the final BOMEC layer (as shown in Figure 2.1 of Appendix 2) was joined to the EEZ 25-km2 cells layer: each cell was allocated to the BOMEC class that contained the centre of the cell using the customised Albers equal area
projection within PostGIS: Central Meridian: 175.00; Standard parallel_1: -30.00; Standard parallel_2: -50.00;
Latitude of origin: -40.00; Datum: WGS84.
The BOMEC layer and fishing footprint layer were then exported into ArcGIS and overlaid to indicate where, and to
what degree, the seafloor had been contacted by trawl gear within each BOMEC class and the cell-based database was interrogated to describe broad trends in intensity and frequency in each BOMEC class over 16 fishing years.
Figure 4 shows the footprint as consisting of buffered trawl tracklines and point polygons for those tows that had only a start or finish position. The area of the seafloor contacted by trawls was calculated in ArcMap for each
BOMEC class.
These measures of area swept represent the estimated values based on the assumed spread of the gear, the
estimated distance travelled, and the speed at which the gear was towed. They do not account for any seafloor area peripheral to the estimated gear path that may be modified in some way as a result of sediment plumes or
structural habitat displacement.
RESULTS
This section firstly provides a summary of the overlay of the 16-year fishing footprint on the BOMEC polygons, and
secondly describes these results by individual BOMEC class. Additional figures and tables are given in Appendix 3.
Spatial fishing footprint for all BOMEC classes
The BOMEC classes extend to waters bounded by 3000 m depth contour. The two BOMEC classes with the largest
areas are mainly in waters outside the depths fished by trawlers (that is, waters deeper than 1600 m); hence there is little overlap of the 16-year fishing footprint and classes N and O (Figure 5). The distribution of the BOMEC
classes relative to the main fishing grounds and the size (area) of each class influence the proportion of the
seafloor in each class that was contacted by trawl gear. The 16-year fishing footprint is greatest in BOMEC Classes C, H, I, J, and L; at least 40 000 km2 of the seafloor were estimated as contacted by trawl gear in each of these
areas, and the total (16-year) trawl footprint represented between about 20 and 70% of these classes. The footprint in BOMEC classes A, C, E, H, and I represented at least 40% of the class areas.
Figure 4: A section of the waters off the North Island west coast showing the trawl footprint for each BOMEC class and the underlying BOMEC classes on 1 1-km grid. The grey area is the North Island west coast.

7
For the inshore and shelf areas identified in Figure 5, the 16-year trawl footprint covered at least 30% of these classes, except for class B. For all these classes the footprint is likely to be grossly underestimated, particularly for
class B and classes A and C off the North Island east coast and South Island west coast where many trawls made by smaller vessels were reported on CELRs and thus not included in the footprint (see Figures 1.2 & 1.2 in
Appendix 1).
The upper slope BOMEC areas are located in different latitudes, with class F featured in the Southern Plateau
waters; class G mostly in Cook Strait as well as off the South Island west coast and in an isolated thin patch in the Bay of Plenty; and class H across the slope of the Chatham Rise, off the northern South Island west coast, and as
a thin strip around the outer boundary of class C. The 16-year footprint represents about 15% of the class F area, 35% of class G, and 45% of class H.
The fishing footprint with the highest area coverage of a class is found in class I, one of the northern mid-depths classes. The area of this class is small compared with class J (in the same broad environment grouping), where
about 20% of the area has been trawled. The other northern mid-depths class, K, is tiny in area and has very little fishing. The southern mid-depths classes are relatively large (about 200 000 km2), and the 16-year trawl footprint
represents about 20% of class L and under 5% of class M (an area of generally deeper waters). Very little of the
largest “deep water” classes (N and O) have fishing, because their extent is defined largely by depths greater than 1250 m out to 3000 m.
Figure 5: Map showing the BOMEC classes A–O overlaid with the fishing footprint of trawls on or near the seafloor based on coverage swept area values for each 25-km2 cell, for combined data for 1989–90 to 2004–05, and plots of the areas of each BOMEC class (upper), the fishing footprint shown on the map (centre), and percentage of each BOMEC Class area covered by the fishing footprint (lower). The outer extent of the classes is the 3000 m contour.
Area of BOMEC Classes
0
200
400
600
800
1000
A B C D E F G H I J K L M N O
BOMEC Clas s
Are
a (
10
00
sq
.km
)
Fishing footprint area
0
20
40
60
80
100
A B C D E F G H I J K L M N O
BOMEC Class
Are
a (
10
00
sq
.km
)
Footprint percentage
0102030405060708090
100
A B C D E F G H I J K L M N O
BOMEC Clas s
Pe
rce
nta
ge
Insh
ore
&
she
lf
Up
pe
r sl
op
e
No
rth
ern
mid
de
pth
s
So
uth
ern
mid
de
pth
s
De
ep
wa
ter
A B C D E F G H I J K L M N O
BOMEC Class

8
INSHORE AND SHELF AREAS
BOMEC CLASS A BOMEC class A includes waters in all FMAs except FMAs 4, 6, and 10 (Figure 6) and covers about 27 557 km2. Of
all the classes, it has the highest values for temperature, salinity, suspended particulate matter, dissolved organic
matter, productivity, and sediment resuspension (Leathwick et al. 2009). Depths in this class are mainly shallower than 50 m, and thus the fishing effort associated with it is mainly targeted at shallow water species such as John
dory, red gurnard, snapper, tarakihi, and trevally (with all class A fishing effort reported from waters shallower than 100 m (Figure 3.1 in Appendix 3). About 44% of the tows in class A waters started in FMA 1, 38% in FMA 9,
9% in FMA 2, 7.5% in FMA 8, 1% in FMA 7, and the remainder in isolated pockets in FMAs 3 and 5. Vessels fishing here were generally under 46 m in length, with at least 96% of tows in FMAs 1 & 2 and 65% of FMA 9 tows by
vessels under 28 m. In FMA 8, 40% of tows were by vessels under 28 m, 60% by 28–46 m vessels, and in FMA 7,
57% of tows were from the smallest vessels and 41% by 28–46 m vessels.
Over all the fishing years, the area of seabed in class A trawled by gear on or near the seafloor (fishing footprint) totalled about 11 708 km2 ― about 42.5% of the total area of class A. Fishing was concentrated in several
locations (see Figure 6). Those parts of class A with no fishing footprint include seabed areas closed to trawling
because of undersea cables or marine reserves and parks (the largest being the Hauraki Gulf Marine Park) (see Figure 1.3 in Appendix 1), and areas of “foul” where bottom trawling is considered impossible (Morrison et al.
2001).
The annual fishing footprint increased from about 120 km2 in 1989–90 to about 3000 km2 in the mid-late 1990s and 3500–4000 km2 after 1999–2000. The increase in area seen in the early-mid 1990s is largely a result of the
fishers reporting more of their effort on the form type that provides these data (TCEPR, see Baird et al. 2009).
0
5
10
15
20
25
19
90
19
92
19
94
19
96
19
98
20
00
20
02
20
04
Are
a (
10
00
sq
.km
)
Cumulative area (max. 6980 sq.km)
Footprint area (max. 4026 sq.km)
% Class A covered per year
Max. 15%
0
10
20
30
40
19
90
19
92
19
94
199
6
19
98
20
00
20
02
20
04
Cla
ss a
rea
(%
)
Figure 6: Map showing the BOMEC class A overlaid with the fishing footprint of trawls on or near the seafloor based on swept area values for each 25-km2 cell, for data from 1989–90 (1990) to 2004–05 (2005). The plots show the annual footprint and cumulative areas in class A (upper) and the proportion of the class A area covered by the fishing footprint each fishing year (lower).
From the mid 1990s, at least 11% of class A area was trawled annually, with between 13 and 15% in recent fishing years. The cumulative area has fluctuated about 5000 km2 per year since 1995–96. In most years, the
cumulative area was at least 1.5 times the footprint area. Both footprint and cumulative area are likely to be
grossly underestimated because a high proportion of trawling effort in the waters of class A was reported on forms that could not be included in this analysis. This effect would have a greater influence on data collected before
1995–96 when little if any effort of small vessels was reported on TCEPRs; and this influence would vary with area because of the level of uptake of the TCEPR form in different areas. For example, the effort of small vessels off the
North Island west coast (Statistical Areas 042–047, see Figures 1.1 and 1.2 in Appendix 1) was largely reported on
CELRs until 1995–96, after which a higher proportion was reported on TCEPRs; whereas vessels operating off the east coast were more likely to retain the use of CELRs, particularly in Statistical Areas 007, 012, 013, and 014.
In most years since the mid 1990s, 60–65% of the 25-km2 cells in class A were fished (Table 3.1 of Appendix 3).
Of the 1099 25-km2 cells in class A, 15% had no trawl contact, about 7.5% were contacted to some extent by trawl in one year, and almost 50% were contacted in at least 12 fishing years (Figure 3.2 in Appendix 3). The
mean annual footprint per cell increased to about 5.5 km2 in 1995–96 and again to 6.4 km2 in 2000–01 and 2003–
04 (Figure 3.3). Few cells had 80–100% of the cell area covered by the annual footprint (Figure 3.4).
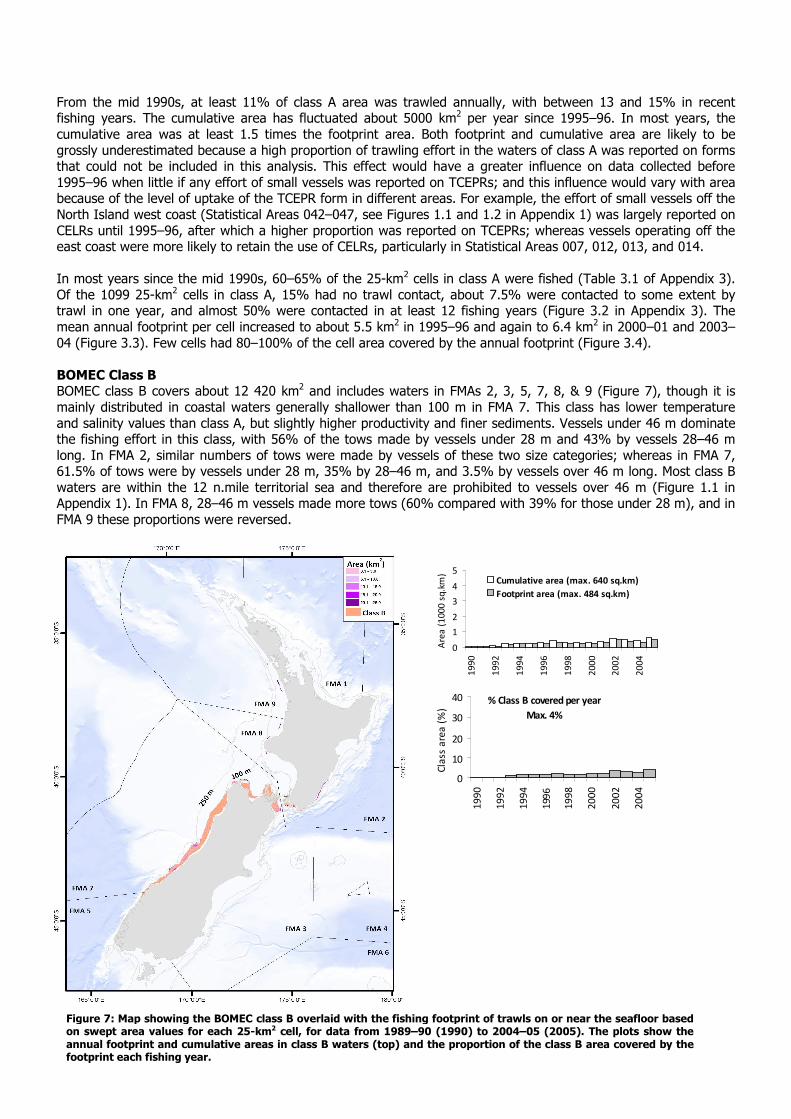
BOMEC Class B BOMEC class B covers about 12 420 km2 and includes waters in FMAs 2, 3, 5, 7, 8, & 9 (Figure 7), though it is
mainly distributed in coastal waters generally shallower than 100 m in FMA 7. This class has lower temperature
and salinity values than class A, but slightly higher productivity and finer sediments. Vessels under 46 m dominate the fishing effort in this class, with 56% of the tows made by vessels under 28 m and 43% by vessels 28–46 m
long. In FMA 2, similar numbers of tows were made by vessels of these two size categories; whereas in FMA 7, 61.5% of tows were by vessels under 28 m, 35% by 28–46 m, and 3.5% by vessels over 46 m long. Most class B
waters are within the 12 n.mile territorial sea and therefore are prohibited to vessels over 46 m (Figure 1.1 in Appendix 1). In FMA 8, 28–46 m vessels made more tows (60% compared with 39% for those under 28 m), and in
FMA 9 these proportions were reversed.
0
1
2
3
4
5
19
90
19
92
19
94
19
96
19
98
20
00
20
02
20
04
Are
a (
10
00
sq
.km
)
Cumulative area (max. 640 sq.km)
Footprint area (max. 484 sq.km)
% Class B covered per year
Max. 4%
0
10
20
30
40
19
90
19
92
19
94
199
6
19
98
20
00
20
02
20
04
Cla
ss a
rea
(%
)
Figure 7: Map showing the BOMEC class B overlaid with the fishing footprint of trawls on or near the seafloor based on swept area values for each 25-km2 cell, for data from 1989–90 (1990) to 2004–05 (2005). The plots show the annual footprint and cumulative areas in class B waters (top) and the proportion of the class B area covered by the footprint each fishing year.

10
The fishing footprint area in class B totalled about 2368 km2 ― about 19% of the area covered by class B. Fishing was mainly concentrated in slivers of class B in FMAs 8, 9, and 2 (see Figure 7), and in discrete patches in FMA 7.
The area contacted by trawl gear will be grossly underestimated because of the lack of data, throughout the time
series, for smaller vessels that fish inshore: particularly effort for targets such as flatfish, barracouta, red cod, and tarakihi which are mainly reported on CELRs in Statistical Areas 033–038 in FMA 7 (see Figures 1.1 and 1.2 in
Appendix 1). This effect will be greater in the inshore areas and those closed to trawling by larger vessels; the higher proportions of TCEPR trawl effort in the FMA 7 Statistical Areas (greater than 30–40% each year for 034–
037) will be in deeper waters outside class B.
In most years there was little difference between the cumulative area and the footprint, with the cumulative area
being at least 1.2 times the footprint area. The area of class B covered by the footprint peaked at under 500 km2 in 2004–05, and the cumulative area peaked at 640 km2 in that year. In most years, about 2% of the area of Class B
was contacted by trawls, with a maximum of 4% in 2004–05.
Most cells in this class were fished in a smaller number of years than other classes in shallow waters (Figure 3.2 in
Appendix 3), and a small proportion were not contacted by the footprint. The proportion of cells contacted by the footprint has fluctuated between 19 and 58%; less than 50% had some footprint cover in the last two years of the
dataset (Table 3.1). The mean footprint per cell increased slightly over the 16 years, with an increase in the numbers of fished cells with more than 25% of the cell area covered by the footprint (Figures 3.3 & 3.4).
BOMEC Class C Class C is characterised by moderately high temperature and salinity, relatively fine sediments, and the deeper
depths (relative to classes A & B) results in less sediment resuspension (Leathwick et al. 2009). The class covers about 89 710 km2 and is distributed in waters generally shallower than about 250 m, north of 44° S on the west
and 42° S on the east of New Zealand, mainly in FMAs 1, 2, and 7–9 (Figure 8, Figure 3.1. in Appendix 3). The trawling effort in FMAs 1 and 2 was by vessels under 46 m, whereas all vessels fished in FMAs 7, 8, & 9. In FMA 7,
19% of tows were reported by vessels under 28 m, 26% by vessels 28–46 m, 21.5% by 46–80 m vessels, and
33.5% by over 80 m vessels. For FMA 8, the respective proportions of effort were (from small to large), 15%, 20%, 17%, and 48%; and for FMA 9, 63% for under 28 m, 32% for 28–46 m, and 5% for over 80 m vessels.
0
5
10
15
20
25
19
90
19
92
19
94
19
96
19
98
20
00
20
02
20
04
Are
a (
10
00
sq
.km
)
Cumulative area (max. 17 035 sq.km)
Footprint area (max. 11 374 sq.km)
% Class C covered per year
Max. 13%
0
10
20
30
40
19
90
19
92
19
94
199
6
19
98
20
00
20
02
20
04
Cla
ss a
rea
(%
)
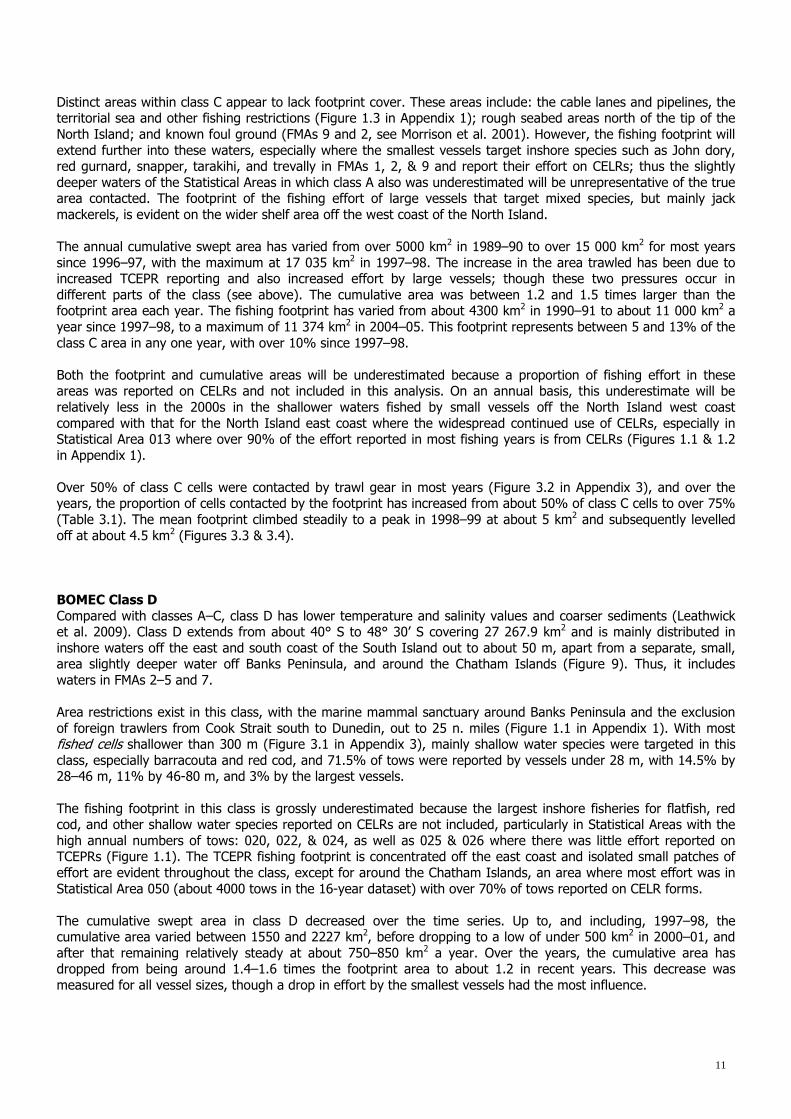
Figure 8: Map showing the BOMEC class C overlaid with the fishing footprint of trawls on or near the seafloor based on swept area values for each 25-km2 cell, for data from 1989–90 (1990) to 2004–05 (2005). The plots show the annual footprint and cumulative areas in class C waters (top) and the proportion of the class C area covered by the footprint each fishing year.
11
Distinct areas within class C appear to lack footprint cover. These areas include: the cable lanes and pipelines, the territorial sea and other fishing restrictions (Figure 1.3 in Appendix 1); rough seabed areas north of the tip of the
North Island; and known foul ground (FMAs 9 and 2, see Morrison et al. 2001). However, the fishing footprint will
extend further into these waters, especially where the smallest vessels target inshore species such as John dory, red gurnard, snapper, tarakihi, and trevally in FMAs 1, 2, & 9 and report their effort on CELRs; thus the slightly
deeper waters of the Statistical Areas in which class A also was underestimated will be unrepresentative of the true area contacted. The footprint of the fishing effort of large vessels that target mixed species, but mainly jack
mackerels, is evident on the wider shelf area off the west coast of the North Island.
The annual cumulative swept area has varied from over 5000 km2 in 1989–90 to over 15 000 km2 for most years
since 1996–97, with the maximum at 17 035 km2 in 1997–98. The increase in the area trawled has been due to increased TCEPR reporting and also increased effort by large vessels; though these two pressures occur in
different parts of the class (see above). The cumulative area was between 1.2 and 1.5 times larger than the footprint area each year. The fishing footprint has varied from about 4300 km2 in 1990–91 to about 11 000 km2 a
year since 1997–98, to a maximum of 11 374 km2 in 2004–05. This footprint represents between 5 and 13% of the
class C area in any one year, with over 10% since 1997–98.
Both the footprint and cumulative areas will be underestimated because a proportion of fishing effort in these areas was reported on CELRs and not included in this analysis. On an annual basis, this underestimate will be
relatively less in the 2000s in the shallower waters fished by small vessels off the North Island west coast
compared with that for the North Island east coast where the widespread continued use of CELRs, especially in Statistical Area 013 where over 90% of the effort reported in most fishing years is from CELRs (Figures 1.1 & 1.2
in Appendix 1).
Over 50% of class C cells were contacted by trawl gear in most years (Figure 3.2 in Appendix 3), and over the years, the proportion of cells contacted by the footprint has increased from about 50% of class C cells to over 75%
(Table 3.1). The mean footprint climbed steadily to a peak in 1998–99 at about 5 km2 and subsequently levelled
off at about 4.5 km2 (Figures 3.3 & 3.4).
BOMEC Class D
Compared with classes A–C, class D has lower temperature and salinity values and coarser sediments (Leathwick et al. 2009). Class D extends from about 40° S to 48° 30’ S covering 27 267.9 km2 and is mainly distributed in
inshore waters off the east and south coast of the South Island out to about 50 m, apart from a separate, small, area slightly deeper water off Banks Peninsula, and around the Chatham Islands (Figure 9). Thus, it includes
waters in FMAs 2–5 and 7.
Area restrictions exist in this class, with the marine mammal sanctuary around Banks Peninsula and the exclusion
of foreign trawlers from Cook Strait south to Dunedin, out to 25 n. miles (Figure 1.1 in Appendix 1). With most fished cells shallower than 300 m (Figure 3.1 in Appendix 3), mainly shallow water species were targeted in this
class, especially barracouta and red cod, and 71.5% of tows were reported by vessels under 28 m, with 14.5% by 28–46 m, 11% by 46-80 m, and 3% by the largest vessels.
The fishing footprint in this class is grossly underestimated because the largest inshore fisheries for flatfish, red cod, and other shallow water species reported on CELRs are not included, particularly in Statistical Areas with the
high annual numbers of tows: 020, 022, & 024, as well as 025 & 026 where there was little effort reported on TCEPRs (Figure 1.1). The TCEPR fishing footprint is concentrated off the east coast and isolated small patches of
effort are evident throughout the class, except for around the Chatham Islands, an area where most effort was in
Statistical Area 050 (about 4000 tows in the 16-year dataset) with over 70% of tows reported on CELR forms.
The cumulative swept area in class D decreased over the time series. Up to, and including, 1997–98, the cumulative area varied between 1550 and 2227 km2, before dropping to a low of under 500 km2 in 2000–01, and
after that remaining relatively steady at about 750–850 km2 a year. Over the years, the cumulative area has dropped from being around 1.4–1.6 times the footprint area to about 1.2 in recent years. This decrease was
measured for all vessel sizes, though a drop in effort by the smallest vessels had the most influence.

12
This trend was reflected in the trawl footprint, with a peak at 1575 km2 in 1992–93 and a low of 400 km2 in 2000–01. The 16-year footprint represents 30% of the class D area (27 268 km2) ― under 6% of the class D area
annually and under 3% in the last seven years of the time series.
The proportion of class D cells with some footprint cover dropped from 50% to an average of 35% over the last
four years (Table 3.1 in Appendix 3). The lack of inshore effort data of small vessels is reflected in the relatively large proportion of unfished cells in class D (Figure 3.2 in Appendix 3). A similar proportion of cells was fished in
one year as was fished in 16 years. The mean footprint per cell dropped from 3.5% to 2.5% over the time series, with fewer cells with over 25% of the cell area fished after the late 1990s (Figures 3.3 & 3.4).
BOMEC Class E Class E covers about 60 990 km2 and is mainly in depths of 50–250 m in waters east and south of the South Island
between 42° and 50° 30’ S, including around the Chatham Islands (Figure 10). It is characterised by high productivity, strong SST gradients, strong tidal currents, and coarse sediments (Leathwick et al. 2009). This class
includes waters in FMAs 3–6, with much of the area over the Stewart-Snares shelf. Areas not fished in class E
include waters of rough seabed such as the Mernoo Bank and Stewart-Snares shelf and areas within 25 n. miles of the shore (north of Dunedin) where large vessels are unable to fish.
About 61% of the fishing effort fishing in this class in FMA 3 was by the larger vessels (44.3% of tows were by 46–
80 m vessels and 16.4% by over 80 m vessels) and 99% of tows in FMA 5 were by vessels greater than 46 m
(58% of tows were by over 80 m vessels). The major targets were squid, barracouta, hoki, red cod, jack mackerel and silver warehou in FMAs 3 & 5; barracouta and red cod in waters around Chatham Islands in FMA 4; and squid
in FMA 6. Both footprint and cumulative area will be underestimated because of the lack of CELR data, especially for small vessels fishing off the south-east South Island coast (including waters restricted to small vessel
operations) and to a lesser extent around the Chatham Islands (see class D discussion above). Although fished cells in this class included those with depths down to 600 m, most were in depths shallower than 200 m (Figure
3.1 in Appendix 3).
0
1
2
3
4
5
19
90
19
92
19
94
19
96
19
98
20
00
20
02
20
04
Are
a (
10
00
sq
.km
)
Cumulative area (max. 2293 sq.km)
Footprint area (max. 1602 sq.km)
% Class D covered per year
Max. 6%
0
10
20
30
40
19
90
19
92
19
94
19
96
19
98
20
00
20
02
20
04
Cla
ss a
rea
(%
)
Figure 9: Map showing the BOMEC class D overlaid with the fishing footprint of trawls on or near the seafloor based on swept area values for each 25-km2 cell, for data from 1989–90 (1990) to 2004–05 (2005). The plots show the annual footprint and cumulative areas in class D waters (top) and the proportion of the class D area covered by the footprint each fishing year.

13
The cumulative swept area varied between 15 000 and 21 000 km2 between 1990–91 and 1996–97, peaked in
1997–98 at 23 485 km2, then dropped to about 16 000 km2 until 2004–05 when it rose to over 19 000 km2. In
most years, the cumulative swept area was three times the size of the footprint area, up to four times in the last two years. The latter fluctuated between 5500 and 6500 km2 before peaking at just over 7100 km2 in 1997–98,
then decreased to under 5000 km2 in the last two years of the time series. In those years, the footprint represented under 8% of the area of class E, whereas in most other years it was generally near or above 10%.
Over the 16-year dataset, the footprint represented 40% of the class E area.
The proportion of class E cells with some level of fishing footprint decreased by about 10% over the years (Table
3.1 in Appendix 3). About 18% of class E cells were fished every year (Figure 3.2 in Appendix 3). The mean footprint per cell was reasonably steady from one year to another at about 5 km2, with peaks of about 6 km2 in
1997–98 and 1998–99 (Figure 3.3), and throughout the time series, the footprint of most fished cells covered under 25% of the cell area, but each year the footprint covered 80–100% of some fished cells (Figure 3.4).
0
10
20
30
40
19
90
19
92
19
94
19
96
19
98
20
00
20
02
20
04
Are
a (
10
00
sq
.km
)
Cumulative area (max. 23 485 sq.km)
Footprint area (max. 7108 sq.km)
% Class E covered per year
Max. 12%
0
10
20
30
40
19
90
19
92
19
94
199
6
19
98
20
00
20
02
20
04
Cla
ss a
rea
(%
)
Figure 10: Map showing the BOMEC class E overlaid with the fishing footprint of trawls on or near the seafloor based on swept area values for each 25-km2 cell, for data from 1989–90 (1990) to 2004–05 (2005). The plots show the annual footprint and cumulative areas in class E waters (top) and the proportion of the class E area covered by the footprint each fishing year.
14
UPPER SLOPE AREAS
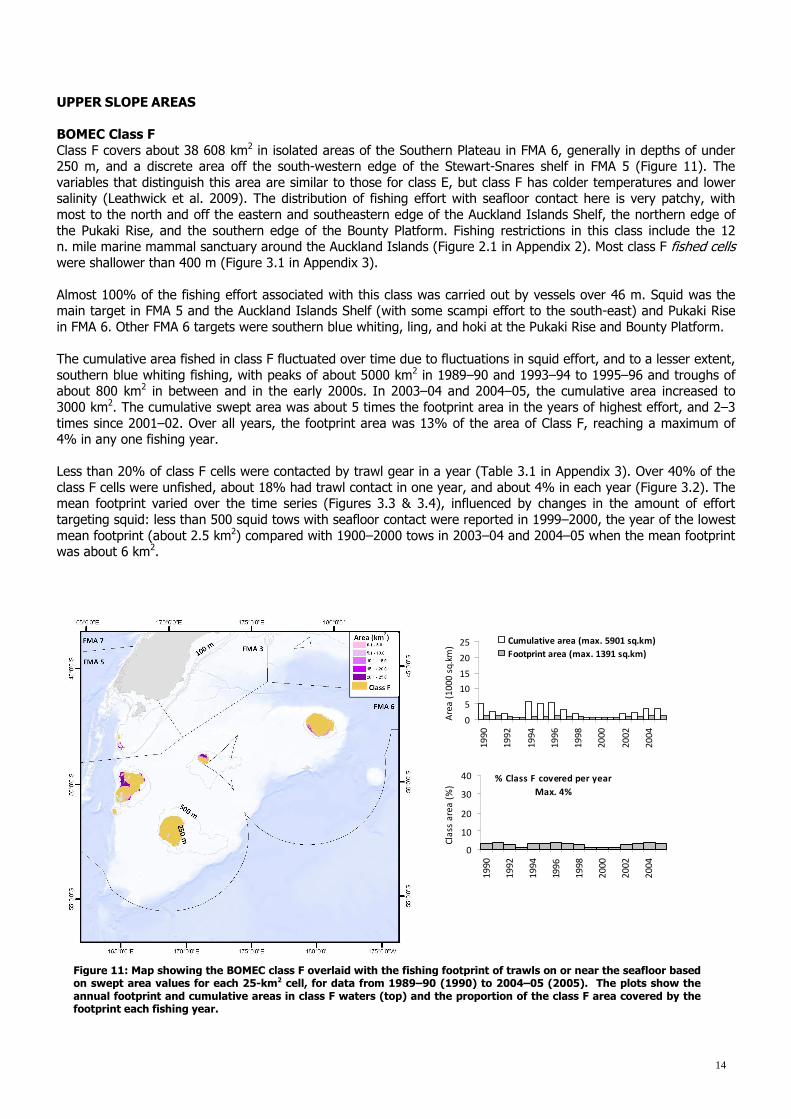
BOMEC Class F
Class F covers about 38 608 km2 in isolated areas of the Southern Plateau in FMA 6, generally in depths of under 250 m, and a discrete area off the south-western edge of the Stewart-Snares shelf in FMA 5 (Figure 11). The
variables that distinguish this area are similar to those for class E, but class F has colder temperatures and lower salinity (Leathwick et al. 2009). The distribution of fishing effort with seafloor contact here is very patchy, with
most to the north and off the eastern and southeastern edge of the Auckland Islands Shelf, the northern edge of
the Pukaki Rise, and the southern edge of the Bounty Platform. Fishing restrictions in this class include the 12 n. mile marine mammal sanctuary around the Auckland Islands (Figure 2.1 in Appendix 2). Most class F fished cells were shallower than 400 m (Figure 3.1 in Appendix 3).
Almost 100% of the fishing effort associated with this class was carried out by vessels over 46 m. Squid was the main target in FMA 5 and the Auckland Islands Shelf (with some scampi effort to the south-east) and Pukaki Rise
in FMA 6. Other FMA 6 targets were southern blue whiting, ling, and hoki at the Pukaki Rise and Bounty Platform.
The cumulative area fished in class F fluctuated over time due to fluctuations in squid effort, and to a lesser extent,
southern blue whiting fishing, with peaks of about 5000 km2 in 1989–90 and 1993–94 to 1995–96 and troughs of about 800 km2 in between and in the early 2000s. In 2003–04 and 2004–05, the cumulative area increased to
3000 km2. The cumulative swept area was about 5 times the footprint area in the years of highest effort, and 2–3
times since 2001–02. Over all years, the footprint area was 13% of the area of Class F, reaching a maximum of 4% in any one fishing year.
Less than 20% of class F cells were contacted by trawl gear in a year (Table 3.1 in Appendix 3). Over 40% of the
class F cells were unfished, about 18% had trawl contact in one year, and about 4% in each year (Figure 3.2). The mean footprint varied over the time series (Figures 3.3 & 3.4), influenced by changes in the amount of effort
targeting squid: less than 500 squid tows with seafloor contact were reported in 1999–2000, the year of the lowest
mean footprint (about 2.5 km2) compared with 1900–2000 tows in 2003–04 and 2004–05 when the mean footprint was about 6 km2.
Figure 11: Map showing the BOMEC class F overlaid with the fishing footprint of trawls on or near the seafloor based on swept area values for each 25-km2 cell, for data from 1989–90 (1990) to 2004–05 (2005). The plots show the annual footprint and cumulative areas in class F waters (top) and the proportion of the class F area covered by the footprint each fishing year.
0
5
10
15
20
25
19
90
19
92
19
94
19
96
19
98
20
00
20
02
20
04
Are
a (
10
00
sq
.km
)
Cumulative area (max. 5901 sq.km)
Footprint area (max. 1391 sq.km)
% Class F covered per year
Max. 4%
0
10
20
30
40
19
90
19
92
19
94
199
6
19
98
20
00
20
02
20
04
Cla
ss a
rea
(%
)

15
BOMEC Class G Class G extends over 6342 km2 in isolated areas, with pockets in depths of 250–500 m off the North Island east
coast from about 37° 50’ S to 42° 42’ S off the South Island east coast, in 100–250 m in Cook Strait, and south of
42° 30’ S off the South Island west coast in 100–500 m (Figure 12). Class G waters have steep topography and strong tidal currents (Leathwick et al. 2009). These waters contain some areas restricted to trawling, including the
cable path in Cook Strait. The patches of this class are all in waters accessible only to vessels under 46 m and hoki was the main target in each area, and other targets were barracouta, red cod, scampi, and tarakihi. Class G cells
were in depths down to 600 m (Figure 3.1 in Appendix 3).
The cumulative area increased from under 250 km2 in 1989–90 to about 5500 km2 in the mid 1990s, then dropped
to a reasonably steady level of around 1000 km2. The annual cumulative areas were between 2 and 3 times that of the footprint. The increase seen in the mid 1990s was from vessels fishing for hoki in Cook Strait as a result of new
vessels entering the fishery, increased effort by the fleet, and change in reporting form use. The subsequent decline in effort is related to the lowering of the hoki TACC from 250 000 t to 100 000 t (Ministry of Fisheries
2009). The footprint for the 16-year dataset covered 34% of the class G area, with the largest extent of area
trawled seen in 1996–97 (13%). About 6–7% of class G is covered by the footprint in the most recent years. Both the cumulative and footprint will be underestimated for this class because of the lack of small vessel data.
The cells with no apparent trawl contact in class G waters (about 15%, Figure 3.2) were off the shelf edge off the
southern South Island west coast, including the fiords (see Figure 12), whereas the 24% of fished cells with trawl
contact in 15 or 16 years were in Cook Strait. The variation in the hoki effort is mirrored in the annual mean footprint values (Figure 3.3), with the means ranging between 2 and 5.5 km2 over the 16 years and about 3.5 km2
in 2003–04 and 2004–05. The footprint covered more than 80% of the cell area for very few cells (Figure 3.4 of Appendix 3).
Figure 12: Map showing the BOMEC class G overlaid with the fishing footprint of trawls on or near the seafloor based on swept area values for each 25-km2 cell, for data from 1989–90 (1990) to 2004–05 (2005). The plots show the annual footprint and cumulative areas in class G waters (top) and the proportion of the class G area covered by the footprint each fishing year.
0
1
2
3
4
5
19
90
19
92
19
94
19
96
19
98
20
00
20
02
20
04
Are
a (
10
00
sq
.km
)
Cumulative area (max. 2750 sq.km)
Footprint area (max. 833 sq.km)
% Class G covered per year
Max. 13%
0
10
20
30
40
19
90
19
92
19
94
19
96
19
98
20
00
20
02
20
04
Cla
ss a
rea
(%
)

16
BOMEC Class H Class H is characterised by moderately high temperatures and salinity (Leathwick et al. 2009) and covers about
138 550 km2 mainly in depths of 200–500 m that extend north from 43° 30’ S off the South Island west coast
around the North Island and down the east coast to 44° 30’ S and across the Chatham Rise, as well as waters south of the South Island to a lower limit of about 50° S (Figure 13). A tiny portion of class H occurs on the
Kermadec Ridge south of 28° 30’ S. The area class H occupies on the Chatham Rise accounts for almost 60% of class H area. Fishing restrictions that may affect the extent of the trawl footprint in this class include a hoki vessel
code of practice (since 2000) that restricts vessels using bottom trawl gear in depths shallower than 450 m on the
Chatham Rise, changes in the hoki quota (see Ministry of Fisheries 2009), marine parks and reserves (particularly in northern waters), known foul grounds, and 25 n. mile fishing restrictions (Figure 1.3 in Appendix 1).
Fished cells in class H dominated the cell distribution by depth in 200–500 m, especially from the late 1990s
(Figure 3.1 in Appendix 3). The geographical distribution of this class means that separate areas are contacted by quite different target fisheries (and thus different fishing pressure). Across the Chatham Rise in FMAs 3 & 4, most
of the reported effort (tows) is by vessels over 46 m: in FMA 3, 46–80 m vessels accounted for 62%, and over
80 m vessels made another 21% of tows in this class, and in FMA 4, the proportions were 51% and 23% respectively. Smaller vessels fished around the Chatham Islands in FMA 4. In these FMAs, vessels mainly targeted
hoki, squid, barracouta, hake, and scampi in class H waters. About 95% of the FMA 5 effort was by vessels over 46 m that targeted hoki, squid, silver warehou, and ling, and the small amount of fishing in FMA 6 in class H was
by larger vessels targeting squid.
Off the west coast South Island in FMA 7, this class is fished mainly by 46–80 m vessels (37% of tows) and over
80 m vessels (55%) targeting mainly hoki, jack mackerels, and barracouta. Some of the largest vessels fished in FMAs 8 & 9 targeting jack mackerels, and vessels under 46 m targeted primarily tarakihi, gemfish, and snapper in
FMA 9. In the eastern FMAs, where the smaller vessels operate, scampi, gemfish, tarakihi, snapper, and trevally were the main targets in FMA 1 and scampi, hoki, and gemfish were predominant in FMA 2.
Figure 13: Map showing the BOMEC class H overlaid with the fishing footprint of trawls on or near the seafloor based on swept area values for each 25-km2 cell, for data from 1989–90 (1990) to 2004–05 (2005). The plots show the annual footprint and cumulative areas in class H waters (top) and the proportion of the class H area covered by the footprint each fishing year.
05
1015202530354045
19
90
19
92
19
94
19
96
19
98
20
00
20
02
20
04
Are
a (
10
00
sq
.km
)
Cumulative area (max. 43 181 sq.km)
Footprint area (max. 20 343 sq.km)
% Class H covered per year
Max. 15%
0
10
20
30
40
19
90
19
92
19
94
199
6
19
98
20
00
20
02
20
04
Cla
ss a
rea
(%
)

17
Throughout the time series the cumulative area is twice that of the trawl footprint. The cumulative area increased to a peak of over 43 000 km2 in 2002–03 and dropped to about 30 000 km2 in 2004–05. The extent and amount of
the hoki effort on the Chatham Rise had a large influence on the distribution of the swept areas in class H (see
Baird et al. 2009). The peak of the footprint area was in 2002–03 at 20 343 km2 and this represents 15% of the class H area. Over the 16-year period, the footprint covered almost 45% of Class H.
Over the 16 years, the proportion of cells with fishing increased from 36% in 1989–90 to over 50% in 2004–05
(Table 3.1 in Appendix 3). About 8% of class H cells had no fishing and slightly more were contacted by trawls in
one year only, and 15% were contacted every year (Figure 3.2). Over the 16 years there was an increase in the mean footprint per cell, from 5.5 km2 to about 6.5–6.8 km2 during 1995–96 to 2002–03 (Figure 3.3). In the
following two years, this dropped to about 5.5 km2, the mean area for 1989–90. A small proportion of fished cells each year were completely covered by the footprint (Figure 3.4).
NORTHERN MID-DEPTHS
BOMEC Class I
Class I covers about 52 224 km2 and is generally in waters deeper than 250 m and shallower than 750 m in latitudes south of 42° S, in FMAs 3–6 (Figure 14). These colder waters with lower salinity than class H have
relatively high productivity being at the southern fringe of the Subtropical Front (Leathwick et al. 2009). In the
shallower parts of this class on the Chatham Rise, the hoki code of practice that restricts the use of bottom trawl gear in waters shallower than 450 m may affect the fishing footprint on the Chatham Rise. Some areas of foul
ground limit fishing at the southern edge of the Stewart–Snares shelf.
Most effort in these waters was by vessels over 46 m: in FMA 3, 61% of tows were by 46–80 m vessels and 19.5% by over 80 m vessels, with hoki, barracouta, squid, and silver warehou the main targets. In FMA 4, the main target
was hoki and larger vessels made most tows in class I waters, with 79% of tows with seafloor contact by 46–80 m
vessels, 17% by over 80 m vessels, and 5% by 28–46 m vessels. Larger vessels also dominated the effort reported in FMAs 5 & 6: 56% of mainly squid, hoki, and silver warehou tows in FMA 5 were made by 46–80 m vessels and
43.5% by over 80 m vessels; and for FMA 6 squid, hoki, and ling effort off the Stewart-Snares shelf, the proportions for these two vessel size classes were 78% (including some southern blue whiting tows at the Bounty
Platform) and 21% respectively.
Figure 14: Map showing the BOMEC class I overlaid with the fishing footprint of trawls on or near the seafloor based on swept area values for each 25-km2 cell, for data from 1989–90 (1990) to 2004–05 (2005). The plots show the annual footprint and cumulative areas in class I waters (top) and the proportion of the class I area covered by the footprint each fishing year.
05
1015202530354045
19
90
19
92
19
94
19
96
19
98
20
00
20
02
20
04
Are
a (
10
00
sq
.km
)
Cumulative area (max. 42 671 sq.km)
Footprint area (max. 18 016 sq.km)
% Class I covered per year
Max. 35%
0
10
20
30
40
19
90
19
92
19
94
199
6
19
98
20
00
20
02
20
04
Cla
ss a
rea
(%
)

18
The cumulative area doubled in the first few years of the fishing time series, from 11 430 km2 in 1989–90 to almost 43 000 km2 in 1998–99. In subsequent years, the cumulative area steadily decreased to just over 20 000
km2. This trend reflects the changes in effort for hoki and squid (Baird et al. 2009). In most years, the cumulative
area was at least twice that of the footprint, which reached its maximum in 1998–99 when it covered 35% of the Class I area. In the last year this had dropped to under 20%. The 16-year footprint covered 70% of class I. The
main waters where there was no or very little fishing on or near the seafloor were off the Bounty Platform.
This class had the highest annual proportions of cells with some footprint cover (over 70% in most years, Table 3.1
in Appendix 3). Few cells in class I waters had no trawl contact over the 16 years, and over 75% were contacted by the footprint in more than 10 years (30% in every year) (Figure 3.2). This class had the highest footprint
means, with increasing and decreasing trends shown in Figure 3.3 a reflection of the changes in the hoki TACC (see Ministry of Fisheries 2009). During the peak effort years, the mean footprint per cell was between 10 and
12 km2; the higher coverage of cells, including those with 80–100% coverage, is evident in Figure 3.4.
BOMEC Class J Class J has the largest area of the classes in the northern mid-depths BOMEC group, with an area of 311 361 km2.
It occurs between 28° and 52° S, generally in 500–1250 m (Figure 15). About 60% of the class area is off the west coast (including the Challenger Plateau), and another extensive area is on the Chatham Rise slope. This class is
characterised by fine sediments and slightly lower temperature and salinity values than class H which it surrounds
in many places (Leathwick et al 2009). Restrictions to trawling in class J include foul ground (generally where few fish are found, such as the Challenger Plateau apart from the hoki grounds at the Hokitika Canyon and the orange
roughy grounds towards the EEZ boundary), some areas off the southern slope of the Chatham Rise, and in steeply sloping waters off the South Island west coast in FMA 5, within the territorial sea. Vessels over 46 m were
restricted from FMAs 1 & 2, and in the Solander Trench south of the South Island (Figure 1.3 in Appendix 1).
05
1015202530354045
19
90
19
92
19
94
19
96
19
98
20
00
20
02
20
04
Are
a (
10
00
sq
.km
)
Cumulative area (max. 31 719 sq.km)
Footprint area (max. 15 974 sq.km)
% Class J covered per year
Max. 5%
0
10
20
30
40
19
90
19
92
19
94
199
6
19
98
20
00
20
02
20
04
Cla
ss a
rea
(%
)
Figure 15: Map showing the BOMEC class J overlaid with the fishing footprint of trawls on or near the seafloor based on swept area values for each 25-km2 cell, for data from 1989–90 (1990) to 2004–05 (2005). The plots show the annual footprint and cumulative areas in class J waters (top) and the proportion of the class J area covered by the footprint each fishing year.

19
Distinct fishing areas are evident in this class. Most fishing was by vessels over 46 m, and in areas where restrictions precluded the activity of larger vessels the footprint is smaller. Effort in FMA 1 targeted mainly scampi,
cardinalfish, alfonsino, hoki, and gemfish, and in FMA 2 the smaller vessels mainly targeted orange roughy, scampi,
hoki, alfonsino, cardinalfish, and gemfish. In FMAs 3 & 4 hoki and hake were the main species fished in middle depths and orange roughy, oreos, alfonsino, and bluenose were targeted in deeper waters. In this class, most
vessels in FMAs 3 & 4 were over 28 m: in FMA 3, 41% were 28–46 m, 49% were 46–80 m, and 7% over 80 m, and in FMA 4 the proportions were 34%, 54%, and 12% respectively. In FMA 5 hoki, ling, squid, red cod,
warehou, oreos, and orange roughy were the primarily targets, and all vessel sizes trawled here: 6% were under
28 m, 11% were 28–46 m, 62% 46–80 m, and 21% over 80 m. The fishing effort in the sliver of class J in FMA 6 targeted squid, hoki, and ling, with 97% of the effort by vessels over 46 m. The winter hoki spawning fishery
accounted for most effort in FMA 7, apart from orange roughy effort in deeper waters near the EEZ outer boundary, and although some smaller vessels reported effort in class J waters in FMA 7 (3% under 28 m vessels
and 8% 28–46 m vessels), most was by larger vessels (48% 46–80 m and 41% over 80 m vessels). Relatively few tows were reported from this class in FMA 8 & 9: in FMA 8, 53% were by under 28 m vessels and 11% by 28–46
m targeting tarakihi and orange roughy, and 35% by over 80 m vessels targeting jack mackerels.
The cumulative area fished each year remained reasonably steady over the 16 years, increasing from about
20 670 km2 in 1989–90 to over 30 000 km2 in the peak years, before dropping back down to about 20 000 km2 in 2004–05. In most years, this represented about twice the footprint area. The 16-year footprint covered about 18%
of the class area and represented under 5% of the class area in any fishing year.
Compared with other areas, the annual proportions of fished cells in class J were relatively steady, about 21–27%
in most years (Table 3.1 in Appendix 3). Over 30% of class J cells were not touched by the trawl footprint, about 7.5% were contacted in one year only, and less than 5% in all 16 years (Figure 3.2). The mean footprint per cell
fluctuated over the time series between about 4 and 5.5 km2 with the full range of coverage from zero to 100% in all years (Figures 3.3 & 3.4).
BOMEC Class K
Class K is the smallest class (about 1290 km2) and is distributed off the tip of the North Island in small discrete narrow areas that drop off steeply in depths of 500–1500 m across the boundary between FMAs 1 & 9 (Figure 16).
These waters are characterised by warm temperatures and strong tidal currents (Leathwick et al. 2009).
Over the 16 years, there have been less than 20 tows in this class (over 8 years), by smaller vessels with reported
targets of tarakihi, trevally, John dory, orange roughy, and hoki. Fished cells with some footprint contact in class K had midpoint depths of 600–1400 m (Figure 3.1 in Appendix 3). Cumulative areas ranged from 0.0 to 2.4 km2
(Table 3.2 in Appendix 3) and the 16-year footprint covered 0.6% of the class area.
Of the 51 cells in class K, over 65% were not contacted by the 16-year trawl footprint (Figure 3.2), and 20% of
those with contact were touched in one year only.
Figure 16: Map showing the BOMEC class K overlaid with the fishing footprint of trawls on or near the seafloor based on swept area values for each 25-km2 cell, for data from 1989–90 (1990) to 2004–05 (2005).
20
SOUTHERN MID-DEPTHS
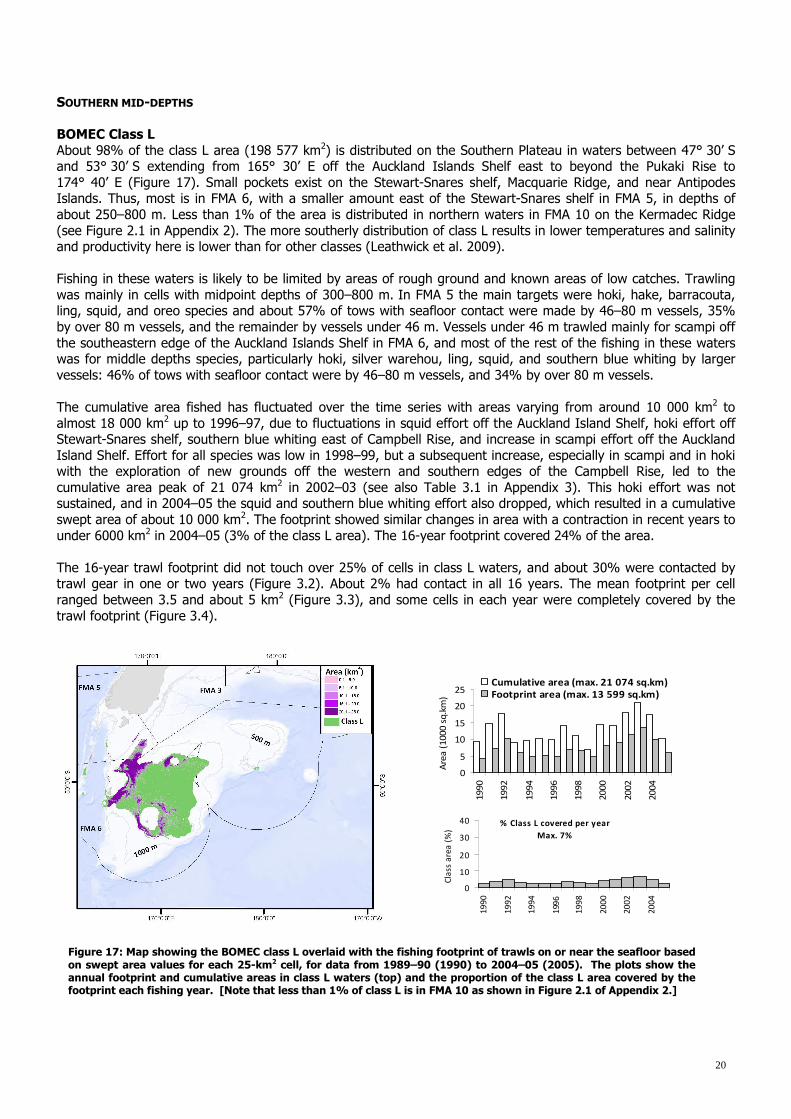
BOMEC Class L
About 98% of the class L area (198 577 km2) is distributed on the Southern Plateau in waters between 47° 30’ S and 53° 30’ S extending from 165° 30’ E off the Auckland Islands Shelf east to beyond the Pukaki Rise to
174° 40’ E (Figure 17). Small pockets exist on the Stewart-Snares shelf, Macquarie Ridge, and near Antipodes Islands. Thus, most is in FMA 6, with a smaller amount east of the Stewart-Snares shelf in FMA 5, in depths of
about 250–800 m. Less than 1% of the area is distributed in northern waters in FMA 10 on the Kermadec Ridge
(see Figure 2.1 in Appendix 2). The more southerly distribution of class L results in lower temperatures and salinity and productivity here is lower than for other classes (Leathwick et al. 2009).
Fishing in these waters is likely to be limited by areas of rough ground and known areas of low catches. Trawling
was mainly in cells with midpoint depths of 300–800 m. In FMA 5 the main targets were hoki, hake, barracouta, ling, squid, and oreo species and about 57% of tows with seafloor contact were made by 46–80 m vessels, 35%
by over 80 m vessels, and the remainder by vessels under 46 m. Vessels under 46 m trawled mainly for scampi off
the southeastern edge of the Auckland Islands Shelf in FMA 6, and most of the rest of the fishing in these waters was for middle depths species, particularly hoki, silver warehou, ling, squid, and southern blue whiting by larger
vessels: 46% of tows with seafloor contact were by 46–80 m vessels, and 34% by over 80 m vessels.
The cumulative area fished has fluctuated over the time series with areas varying from around 10 000 km2 to
almost 18 000 km2 up to 1996–97, due to fluctuations in squid effort off the Auckland Island Shelf, hoki effort off Stewart-Snares shelf, southern blue whiting east of Campbell Rise, and increase in scampi effort off the Auckland
Island Shelf. Effort for all species was low in 1998–99, but a subsequent increase, especially in scampi and in hoki with the exploration of new grounds off the western and southern edges of the Campbell Rise, led to the
cumulative area peak of 21 074 km2 in 2002–03 (see also Table 3.1 in Appendix 3). This hoki effort was not sustained, and in 2004–05 the squid and southern blue whiting effort also dropped, which resulted in a cumulative
swept area of about 10 000 km2. The footprint showed similar changes in area with a contraction in recent years to
under 6000 km2 in 2004–05 (3% of the class L area). The 16-year footprint covered 24% of the area.
The 16-year trawl footprint did not touch over 25% of cells in class L waters, and about 30% were contacted by trawl gear in one or two years (Figure 3.2). About 2% had contact in all 16 years. The mean footprint per cell
ranged between 3.5 and about 5 km2 (Figure 3.3), and some cells in each year were completely covered by the
trawl footprint (Figure 3.4).
0
5
10
15
20
25
19
90
19
92
19
94
19
96
19
98
20
00
20
02
20
04
Are
a (
10
00
sq
.km
)
Cumulative area (max. 21 074 sq.km)
Footprint area (max. 13 599 sq.km)
% Class L covered per year
Max. 7%
0
10
20
30
40
19
90
19
92
19
94
199
6
19
98
20
00
20
02
20
04
Cla
ss a
rea
(%
)
Figure 17: Map showing the BOMEC class L overlaid with the fishing footprint of trawls on or near the seafloor based on swept area values for each 25-km2 cell, for data from 1989–90 (1990) to 2004–05 (2005). The plots show the annual footprint and cumulative areas in class L waters (top) and the proportion of the class L area covered by the footprint each fishing year. [Note that less than 1% of class L is in FMA 10 as shown in Figure 2.1 of Appendix 2.]

21
BOMEC Class M Class M covers about 233 825 km2 and extends over waters in FMAs 3, 5, and 6 off the southern, eastern, and
northern edges of the Southern Plateau up to 44° 45’ S off the South Island east coast and off the Bounty
Platform, in depths deeper than 500 m to about 1000–1250 m (Figure 18). The environmental characteristics of this class are similar to those for class L (Leathwick et al. 2009). Much of this area is rough or too deep for
trawling, and most fishing effort was in cells with midpoint depths between 600 and 1200 m (Figure 3.1 in Appendix 3).
All vessel sizes trawled in FMA 3: 26% of tows with seafloor contact were by under 28 m vessels, 27% by 28–46 m vessels, 35% by 46–80 m vessels, and 12% by over 80 m vessels. Hoki and squid were the main targets, with
other effort for barracouta, red cod, silver warehou, and oreo species. In FMA 5 hoki and ling were the main targets and 9% of tows were by 28–46 m vessels, 72% by 46–80 m vessels, and 18% by over 80 m vessels. The
effort in FMA 6 was mainly for hoki, ling, and squid (with a small amount of effort for southern blue whiting at the Bounty Platform), and though all vessels sizes were represented here, 51% was by 46–80 m vessels, 29% by over
80 m vessels, and vessel under 46 m accounting for the remaining 20%.
The increase in the hoki effort in waters off the Stewart-Snares shelf in the early years of the time series increased
the cumulative area in those years. Although the oreo effort increased, and in the mid 1990s the effort for orange roughy also grew, these deepwater fisheries were generally on hills and swept area of each deepwater target trawl
may represent a small proportion of a hoki trawl swept area (see Baird et al. 2009), with only a small effect on the
cumulative area. The increase seen in 2001–02 is the result of the extension of hoki effort into class M waters south of Campbell Rise. This was not sustained in the following years.
The annual cumulative area was generally about 1.5 to 2 times the annual footprint area, though after 2001–02
there was little difference. The 16-year footprint covered about 6% of the class M area, and the maximum in any one year covered 2% of the class area.
About 60% of class M cells had no trawl footprint, and about 15% were contacted by the footprint in one year only (Figure 3.2 in Appendix 3). The mean annual footprints ranged from 2 to over 5 km2 and in the later years the
footprint per cell contracted and in 2004–05 the greatest cell footprint was 15 km2 (Figures 3.3 & 3.4).
Figure 18: Map showing the BOMEC class M overlaid with the fishing footprint of trawls on or near the seafloor based on swept area values for each 25-km2 cell, for data from 1989–90 (1990) to 2004–05 (2005). The plots show the annual footprint and cumulative areas in class M waters (top) and the proportion of the class M area covered by the footprint each by fishing year.
0
5
10
15
20
25
19
90
19
92
19
94
19
96
19
98
20
00
20
02
20
04
Are
a (
10
00
sq
.km
) Cumulative area (max. 8130 sq.km)
Footprint area (max. 2308 sq.km)
% Class M covered per year
Max. 2%
0
10
20
30
40
19
90
19
92
19
94
199
6
19
98
20
00
20
02
20
04
Cla
ss a
rea
(%
)

22
DEEP WATER GROUPS
Class N and Class O
Both these areas are distributed throughout the EEZ in waters deeper than 1000 m, with class O mainly in waters 1750–3000 m (Figure 19). Class N area (493 034 km2) is half that of class O (935 315 km2). Both classes have fine
sediments and low sea surface temperature gradients and tidal currents (Leathwick et al. 2009). Little fishing occurred in these classes, because of the depth range: the cumulative area was under 2000 km2 in most years in
class N, and under 42 km2 a year in class O. The 16-year footprint covered 1.5% of class N and 0.02% of class O.
The main species targeted are orange roughy, oreos, cardinalfish, alfonsino, and bluenose. Some effort included in
class N targets species generally caught in shallower waters and thus may represent the ends of tow tracks. The main distribution of the fishing effort is in the steep seabed areas off the east coast of the North and South Islands
and localised areas off the northern, southeastern and southern slope of the Chatham Rise.
Figure 19: Map showing the BOMEC classes N & O overlaid with the fishing footprint of trawls on or near the seafloor based on swept area values for each 25-km2 cell, for data from 1989–90 (1990) to 2004–05 (2005). The plots show the annual footprint and cumulative areas in classes N & O waters (top) and the proportion of the classes N & O area covered by the footprint each fishing year.
0
1
2
3
4
5
19
90
19
92
19
94
19
96
19
98
20
00
20
02
20
04
Are
a (
10
00
sq
.km
) Cumulative area (max. 2342 sq.km)
Footprint area (max. 1019 sq.km)
% Class N covered per year
Max. 0.2%
0
10
20
30
40
19
90
19
92
19
94
199
6
19
98
20
00
20
02
20
04
Cla
ss a
rea
(%
)

23
DISCUSSION & CONCLUSIONS
Even on this broad scale study of the seafloor area contacted by trawl gear as reported on TCEPRs, the patchiness
of targeted intensive and frequent fishing effort is evident, with fishers returning regularly to established fishing grounds to revisit trawl lines. Of the area in depths shallower than 1600 m, the 16-year footprint covered about
19% and the cumulative area was seven times the footprint area ― about twice the footprint in each year (Baird et al. 2009). These areas are indicative of the trawling activity and represent the estimated amount of seafloor
contacted by the trawl gear, with the estimated doorspread providing a measure of the gear width for the distance
travelled for each tow. Thus, they do not account for any areas peripheral to the trawl paths that may be modified as a result of the trawling activity, nor do they provide any information on the type or effect of the contact, with all
trawls assumed to have an equal contact along a straight track, on a homogeneous seafloor, between start and finish positions.
With most fishing effort in waters shallower than 800 m, the depth distinction in the BOMEC classes results in
those classes in deeper waters being contacted by the footprint and cumulative areas to a lesser extent. These
classes are also where the trawl footprint is relatively smaller per tow because of the shorter tows for deeper water species and fishing areas are likely to be more localised in these depths. The very deep classes (N and O) cover an
area similar in size to the sum of the areas of all the other classes, but trawling is restricted by depth in these waters. In the shallow coastal waters, the lack of data for small vessels severely limits the estimation of an
indicative coverage, particularly in under 200 m, and the extent to which this coverage is underestimated will vary
because of spatial differences in the use of the data collection forms: fishers in waters off the west coast of the North Island were more likely to adopt the TCEPR in the mid 1990s than those operating off the east coast,
whereas fishers trawling in waters off the South Island tended to continue to use the CELRs throughout the 1989–90 to 2004–05 fishing years. Thus, the footprint of the inshore North Island effort may be reasonably
representative in the latter years of the dataset, but the cumulative area will be underestimated; but for South Island inshore areas both measures of area will seriously under-represent the seafloor contacted by trawl gear,
both in the number of cells contacted and in the intensity and extent within the cells.
However, the available TCEPR data indicated some distinct differences between classes in the number of years in
which the 25-km2 cells were partly or completely covered by the trawl footprint (Figure 3.2 in Appendix 3). Less than 10% of the cells in classes B, C, H, I were not touched by the trawl footprint, and those classes in deeper
water or in steeply sloping areas (J, K, M, N, & O) had at least 30% of cells unfished (maximum of almost 100% in
class 0). Classes A and C had over 50% of cells contacted by the footprint each year for 12–16 years, whereas over 60% of class B cells were contacted between 1 and 6 years. It is likely that these proportions would be
substantially higher with the inclusion of a measure of the CELR swept area. About 30% of class I cells, 18% of class E, 15% of class H cells, and 10% of class G cells were contacted each year.
In the inshore and shelf classes, in most years, the mean footprint per 25-km2 fished cell was generally less than 6 km2 (about 25% of the cell area), with higher means in classes A, C, & E (see Figures 3.3 & 3.4). Since the late
1990s when fishing was at its greatest, class A means have been about 6 km2, whereas class E have decreased to about 5 km2, class C to about 4.5 km2, and classes B & D to 2–2.5 km2. The upper slope classes had a similar
range of mean footprints per cell; the mean coverage for class F fluctuated over the years between about 2 and 6 km2; class G showed an overall decrease after a peak at almost 6 km2 in 1995–96 to under 4 km2 in 2004–05,
and class H remained fairly steady throughout the period at about 6 km2.
The highest mean footprints per cell were from class I where means ranged from 6 km2 to almost 12 km2 in
1997–98 and down to 8 km2 in 2004–05. The larger number of cells with greater footprints, particularly in the late 1990s to mid 2000s, is evident in Figure 3.4. Class J means ranged between 4 and 5.5 km2 per cell, and the small
amount of effort in class K in some years generally covered about 1 km2 per cell on average. Mean footprints per
fished cell were smaller in the remaining classes, with 3.5–5.5 km2 for class L and 2–5 km2 for class M, showing a decreasing trend in the last three years of the time series. Mean values for the deep water classes N & O were
1–2 km2. Classes E, H, I, J, & L had cells each year that were completely covered by the footprint.
Many of the classes contain areas where trawling is prohibited, either for all vessels, a size range of vessels, a gear type, a target species, a season, or time of day. These affect the available amount of area for trawling as does the
seafloor topography, substrate type, and the productivity of an area. Within any of the BOMEC classes there are
different gradients of trawling presence and pressure, and the effect of these will depend on the characteristics of the class as well as of the fishing (including intensity, frequency, gear size, and degree of seafloor contact). Even

24
at the scale used for this work (5 x 5 km cells for the fishing effort), the cell summary allows a good evaluation of how often a class is swept by trawl gear and some distinction between areas that have very little trawl contact,
that is just touched by part of the trawl polygon, and areas where the trawl-seafloor contact is extensive, with the
area of each cell completely covered by trawl paths ― at least once.
However, there are several aspects that limit the interpretation, other than those relevant to the environmental data, resolution, and modelling (see Leathwick et al. 2009), the lack of fishing effort data discussed above, and
various aspects of the fishing effort data collection and the swept area estimation (see Baird et al. 2009). The
spatial overlay is summarised at the scale of the fishing effort cell size (25-km2) and each cell is defined by the depth at its centre. By assigning these cells based on their midpoints relative to a BOMEC class (created as
polygons at the finer-scale 1 x 1 km resolution) it is inevitable that a 25-km2 cell on the periphery of a class polygon is allocated to a class that only a proportion of its area lies in. Related to this is a potential mismatch for
those parts of the EEZ where the BOMEC classes are thin polygons (possibly as narrow as the minimum width of 1 km). Also, by restricting the cell depth to 1600 m (which is the depth at the cell midpoint), there may be cells in
deeper water that contain underwater hills or seamounts that are not included in the deeper classes.
In BOMEC classes that cover large areas, or those that have wide latitudinal or longitudinal ranges, the fishing
footprint is likely to vary spatially in the type of seafloor contact because of the different gear components and substrate types. For example, in class H mainly large vessels (making relatively long tows with large heavy
groundgear assisted by sophisticated electronic gear to precisely position the trawl gear) operated on the fishing
grounds on the Chatham Rise, and smaller vessels with relatively light gear (and narrower spread) operated close to the Chatham Islands. The larger vessels also operate in the class H in FMAs 7–9; whereas in the northern part
of FMA 9 and in FMAs 1 & 2 smaller gear is used by smaller vessels that fished there and the amount of effort is larger. Similarly, in class C, the large shelf area to the west was fished mainly by large vessels whereas only small
vessels operate in FMAs 1 & 2 in this class.
Further characterisation of the fishing footprint (including a finer temporal scale to represent the seasonality in
some target trawl effort) and finer classification of the BOMEC classes would allow further distinction for smaller areas, such as the Chatham Rise, to determine different effects from gradients of fishing pressure and to indicate
areas where sensitive habitats may be protected under some form of spatial management. The underlying database structure developed for the fishing effort data during this work can easily be adapted to refine
parameters to measure the effort or to provide a subset of data for a (smaller) defined area of analysis using an
appropriate cell size that represents the trawl footprint and minimises any discrepancies at class boundaries caused by overlaying different cell sizes ― an effect more important in some classes than others. Knowledge and
understanding of the scale at which the fishing occurs (in time and space) relative to that of various habitats (for example, Hall 1999, Cryer et al. 2002, Clark & O’Driscoll 2003) is in its infancy, particularly in deeper water
environments. This work gives a broad-scale EEZ-wide indication of spatial and temporal extent of trawling over 16
fishing years within broad environmental classes and coupled with the current (and growing) knowledge of the marine habitats and the effects of trawling activity (for example, in coastal environments (Thrush et al. 1998) and
Cryer et al. (2002) in deeper waters) can be used to identify areas of special interest depending on management objectives.
ACKNOWLEDGEMENTS
Thanks to the MFish Data Group especially Juliane Sellers and Sarah Lealand for provision of NABIS shapefiles and
to John Leathwick (NIWA) who modelled the environment data (provided by NIWA scientists) to produce the benthic-optimised marine environment classification used here. Thanks also to Martin Cryer, MFish, for discussion
and valuable comments. This work was completed under Objective 5 of Ministry of Fisheries project BEN200601.

25
REFERENCES
Baird, S.J.; Wood, N.W.; Wood, B.A. (2009). Nature and extent of commercial fishing effort on or near the seafloor
within the New Zealand 200 n. mile exclusive economic zone. Draft AEBR prepared as completion of Objective
1–4 of BEN200601 for the Ministry of Fisheries. 48 p.
Bradford-Grieve, J.; Probert, P.K.; Nodder, S.D.; Thompson, D.; Hall, J.; Hanchet, S.; Boyd, P.; Zeldis, J.; Baker,
A.N.; Best, H. A.; Broekhuizen, N.; Childerhouse, S.; Clark, M.; Hadfield, M.; Safi, K.; Wilkinson, I. (2003). Pilot trophic model for subantarctic water over the Southern Plateau, New Zealand: a low biomass, high transfer
efficiency system. Journal of Experimental Marine Biology and Ecology 289(2): 223–262.
Clark, M.R.; O’Driscoll, R.L. (2003). Deepwater fisheries and aspects of their impact on seamount habitat in New
Zealand. Journal of Northwest Atlantic Fishery Science 31: 441−458.
Cryer, M.; Hartill, B.; O’Shea, S. (2002). Modification of marine benthos by trawling: toward a generalization for the
deep ocean. Ecological Applications 12(6): 1824–1839.
Ferrier, S.; Manion, G.; Elith, J.; Richardson, K. (2007). Using generalised dissimilarity modelling to analyse and
predict patterns of beta-diversity in regional biodiversity assessment. Diversity and Distributions 13: 252–264.
Hall, S.J (1999). The effects of fishing on marine ecosystems and communities. Fish and Aquatic Resource Series 1. Blackwell Science, Oxford. 296 p.
Jennings, S.; Kaiser, M.J. (1998). The effects of fishing on marine ecosystems. Advanced Marine Biology 34: 201–
352.
Kaiser, M.J.; Collie, J.S.; Hall, S.J.; Jennings, S.; Potter, I.R. (2002). Modification of marine habitats by trawling
activities: prognosis and solutions. Fish and Fisheries 3: 114–136.
Leathwick, J.; Dey, K.; Julian, K. (2006). Development of an environmental classification optimised for demersal
fish. NIWA Client Report: HAM2006-063. 20p.
Leathwick, J.R.; Julian, K.; Elith, J.; Chadderton, L.; Ferrier, S.; Snelder, T. (2008). A biologically-optimised
environmental classification of New Zealand rivers and streams: reanalysis excluding human impacts variables. NIWA Client Report HAM2008-027.
Leathwick, J.R., Overton, J.M., McLeod, M. (2003) An environmental domain analysis of New Zealand, and its
application to biodiversity conservation. Conservation Biology 17: 1612–1623.
Leathwick, J.R.; Rowden, A.; Nodder, S.; Gorman, R.; Bardsley, S.; Pinkerton, M.; Baird, S.J.; Hadfield, M. ; Currie,
K.; Goh, A. (2009). Development of a benthic-optimised marine environment classification for waters within the New Zealand EEZ. Draft Final Research Report prepared as part completion of Objective 5 of BEN200601 for the
Ministry of Fisheries. 52 p.
Ministry of Fisheries (2009). Report from the Fishery Assessment Plenary, May 2008: stock assessments and yield
estimates. Ministry of Fisheries.
Morrison, M.A.; Stevenson, M.L.; Hanchet, S.M. (2001). Review of west coast North Island trawl survey time series, 1986-96. NIWA Technical Report 97. 56 p.
NRC (2002). Effects of Trawling and Dredging on Seafloor Habitat: Committee on Ecosystem Effects of Fishing:
Phase 1—Effects of Bottom Trawling on Seafloor Habitats. National Academy Press, Washington. 126 p.
Snelder, T.H., Dey, K.L., Leathwick, J.R. (2007). A procedure for making optimal selection of input variables for multivariate environmental classifications. Conservation Biology, 21, 365–375.
Snelder, T.H., Leathwick, J.R., Dey, K.L., Rowden, A.A., Weatherhead, M.A., Fenwick, G.D., Francis, M.P., Gorman, R.M., Grieve, J.M., Hadfield, M.G., Hewitt, J.E., Richardson, K.M., Uddstrom, M.J., Zeldis, J.R. (2006).
Development of an ecological marine classification in the New Zealand region. Environmental Management, 39, 12–29.
Thrush, S.F.; Hewitt, J.E.; Cummings, V.J.; Dayton, P.K.; Cryer, M.; Turner, S.J.; Funnell, G.A.; Budd, R.G.;
Milburn, C.J.; Wilkinson, M.R. (1998). Disturbance of the marine benthic habitat by commercial fishing: impacts at the scale of the fishery. Ecological Applications 8: 866–879.
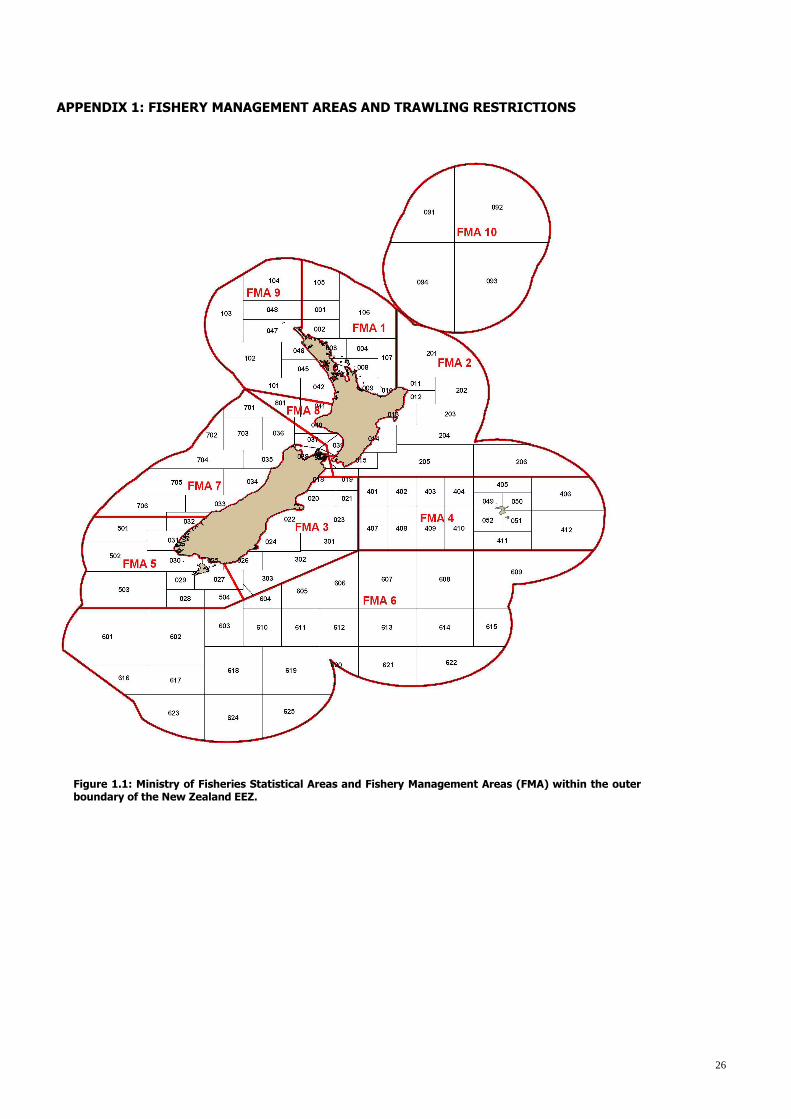
26
APPENDIX 1: FISHERY MANAGEMENT AREAS AND TRAWLING RESTRICTIONS
Figure 1.1: Ministry of Fisheries Statistical Areas and Fishery Management Areas (FMA) within the outer boundary of the New Zealand EEZ.
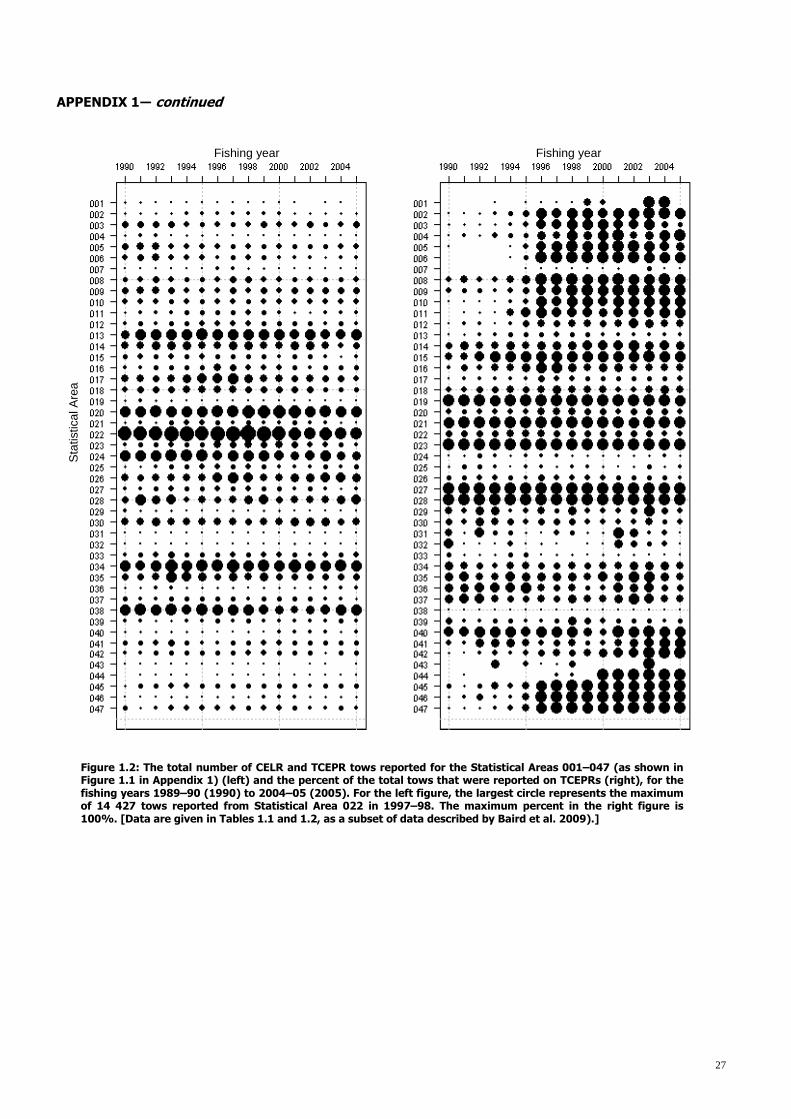
27
APPENDIX 1― continued
Fishing year Fishing year
Sta
tistic
al A
rea
Figure 1.2: The total number of CELR and TCEPR tows reported for the Statistical Areas 001–047 (as shown in Figure 1.1 in Appendix 1) (left) and the percent of the total tows that were reported on TCEPRs (right), for the fishing years 1989–90 (1990) to 2004–05 (2005). For the left figure, the largest circle represents the maximum of 14 427 tows reported from Statistical Area 022 in 1997–98. The maximum percent in the right figure is 100%. [Data are given in Tables 1.1 and 1.2, as a subset of data described by Baird et al. 2009).]

28
APPENDIX 1― continued
Figure 1.3: Major spatial restrictions to trawling present at some stage during 1989–90 to 2004–05 and the Ministry of Fisheries Fishery Management Areas (FMA) within the outer boundary of the New Zealand EEZ (Ministry of Fisheries NABIS data, with reference to Department of Conservation (2004)).
Note: The 12 n.mile Territorial Sea is limited to vessels under 28 m. Auckland Regs show the Fisheries (Auckland Kermadecs Commercial Fishing) Regulations 1986 pertaining to trawling, including an gear restricted (codend mesh size) area from the FMA 8/FMA 9 boundary to the FMA 1/FMA 2 boundary, area in the Bay of Plenty that excludes pair-trawling, harbours and bays prohibited to trawling, several stretches of waters outside the 12 n.mile sea that exclude vessels over 46 m, and various seasonal, time of day, vessel size, and gear type restrictions. Central Regs are the Fisheries (Central Area Commercial Fishing) Regulations 1986 that include areas where trawling and fishing are prohibited and waters in Cook Strait and off Taranaki Bight where trawlers over 46 m are excluded. Challenger Regs are the Fisheries (Challenger Area Commercial Fishing) Regulations 1986 that include seasonal, vessel size, and gear size (headline height) restrictions in Golden Bay and Tasman Bay, gear restrictions in inshore waters of South Island northeast coast, and areas off the South Island west coast, outer Golden-Tasman bays, and Cook Strait where vessels over 46 m are excluded. Southeast Regs are the Fisheries (South East Area Commercial Fishing) Regulations 1986 that include seasonal and trawl restrictions in inshore waters and bays and a stretch of water beyond the 12 n. mile Territorial Sea that exclude trawling by vessels over 46 m. Southland/subant Regs are the Fisheries (Southland and Sub-Antarctic Areas Commercial Fishing) Regulations 1991 that include prohibition of trawling in harbours, fiords, and bays, gear restriction (headline height) inshore Southland coast, and exclusion of vessels over 46 m (Solander Trench).
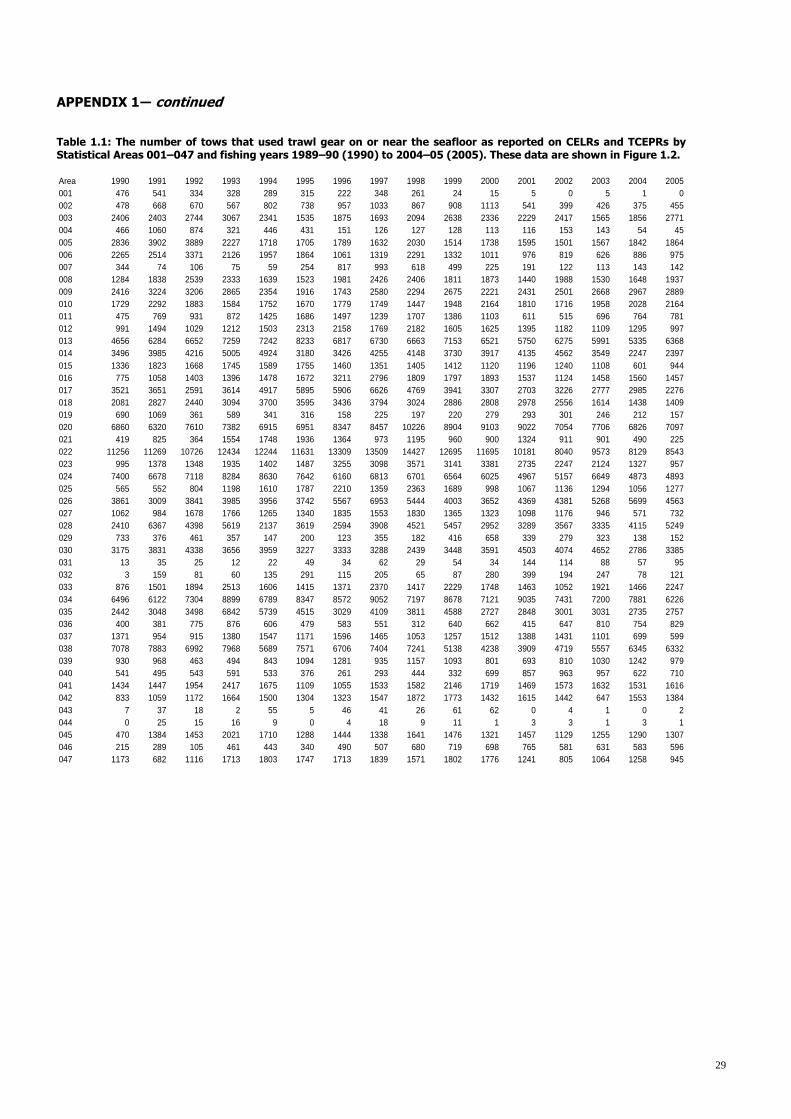
29
APPENDIX 1― continued Table 1.1: The number of tows that used trawl gear on or near the seafloor as reported on CELRs and TCEPRs by Statistical Areas 001–047 and fishing years 1989–90 (1990) to 2004–05 (2005). These data are shown in Figure 1.2. Area 1990 1991 1992 1993 1994 1995 1996 1997 1998 1999 2000 2001 2002 2003 2004 2005001 476 541 334 328 289 315 222 348 261 24 15 5 0 5 1 0002 478 668 670 567 802 738 957 1033 867 908 1113 541 399 426 375 455003 2406 2403 2744 3067 2341 1535 1875 1693 2094 2638 2336 2229 2417 1565 1856 2771004 466 1060 874 321 446 431 151 126 127 128 113 116 153 143 54 45005 2836 3902 3889 2227 1718 1705 1789 1632 2030 1514 1738 1595 1501 1567 1842 1864006 2265 2514 3371 2126 1957 1864 1061 1319 2291 1332 1011 976 819 626 886 975007 344 74 106 75 59 254 817 993 618 499 225 191 122 113 143 142008 1284 1838 2539 2333 1639 1523 1981 2426 2406 1811 1873 1440 1988 1530 1648 1937009 2416 3224 3206 2865 2354 1916 1743 2580 2294 2675 2221 2431 2501 2668 2967 2889010 1729 2292 1883 1584 1752 1670 1779 1749 1447 1948 2164 1810 1716 1958 2028 2164011 475 769 931 872 1425 1686 1497 1239 1707 1386 1103 611 515 696 764 781012 991 1494 1029 1212 1503 2313 2158 1769 2182 1605 1625 1395 1182 1109 1295 997013 4656 6284 6652 7259 7242 8233 6817 6730 6663 7153 6521 5750 6275 5991 5335 6368014 3496 3985 4216 5005 4924 3180 3426 4255 4148 3730 3917 4135 4562 3549 2247 2397015 1336 1823 1668 1745 1589 1755 1460 1351 1405 1412 1120 1196 1240 1108 601 944016 775 1058 1403 1396 1478 1672 3211 2796 1809 1797 1893 1537 1124 1458 1560 1457017 3521 3651 2591 3614 4917 5895 5906 6626 4769 3941 3307 2703 3226 2777 2985 2276018 2081 2827 2440 3094 3700 3595 3436 3794 3024 2886 2808 2978 2556 1614 1438 1409019 690 1069 361 589 341 316 158 225 197 220 279 293 301 246 212 157020 6860 6320 7610 7382 6915 6951 8347 8457 10226 8904 9103 9022 7054 7706 6826 7097021 419 825 364 1554 1748 1936 1364 973 1195 960 900 1324 911 901 490 225022 11256 11269 10726 12434 12244 11631 13309 13509 14427 12695 11695 10181 8040 9573 8129 8543023 995 1378 1348 1935 1402 1487 3255 3098 3571 3141 3381 2735 2247 2124 1327 957024 7400 6678 7118 8284 8630 7642 6160 6813 6701 6564 6025 4967 5157 6649 4873 4893025 565 552 804 1198 1610 1787 2210 1359 2363 1689 998 1067 1136 1294 1056 1277026 3861 3009 3841 3985 3956 3742 5567 6953 5444 4003 3652 4369 4381 5268 5699 4563027 1062 984 1678 1766 1265 1340 1835 1553 1830 1365 1323 1098 1176 946 571 732028 2410 6367 4398 5619 2137 3619 2594 3908 4521 5457 2952 3289 3567 3335 4115 5249029 733 376 461 357 147 200 123 355 182 416 658 339 279 323 138 152030 3175 3831 4338 3656 3959 3227 3333 3288 2439 3448 3591 4503 4074 4652 2786 3385031 13 35 25 12 22 49 34 62 29 54 34 144 114 88 57 95032 3 159 81 60 135 291 115 205 65 87 280 399 194 247 78 121033 876 1501 1894 2513 1606 1415 1371 2370 1417 2229 1748 1463 1052 1921 1466 2247034 6496 6122 7304 8899 6789 8347 8572 9052 7197 8678 7121 9035 7431 7200 7881 6226035 2442 3048 3498 6842 5739 4515 3029 4109 3811 4588 2727 2848 3001 3031 2735 2757036 400 381 775 876 606 479 583 551 312 640 662 415 647 810 754 829037 1371 954 915 1380 1547 1171 1596 1465 1053 1257 1512 1388 1431 1101 699 599038 7078 7883 6992 7968 5689 7571 6706 7404 7241 5138 4238 3909 4719 5557 6345 6332039 930 968 463 494 843 1094 1281 935 1157 1093 801 693 810 1030 1242 979040 541 495 543 591 533 376 261 293 444 332 699 857 963 957 622 710041 1434 1447 1954 2417 1675 1109 1055 1533 1582 2146 1719 1469 1573 1632 1531 1616042 833 1059 1172 1664 1500 1304 1323 1547 1872 1773 1432 1615 1442 647 1553 1384043 7 37 18 2 55 5 46 41 26 61 62 0 4 1 0 2044 0 25 15 16 9 0 4 18 9 11 1 3 3 1 3 1045 470 1384 1453 2021 1710 1288 1444 1338 1641 1476 1321 1457 1129 1255 1290 1307046 215 289 105 461 443 340 490 507 680 719 698 765 581 631 583 596047 1173 682 1116 1713 1803 1747 1713 1839 1571 1802 1776 1241 805 1064 1258 945
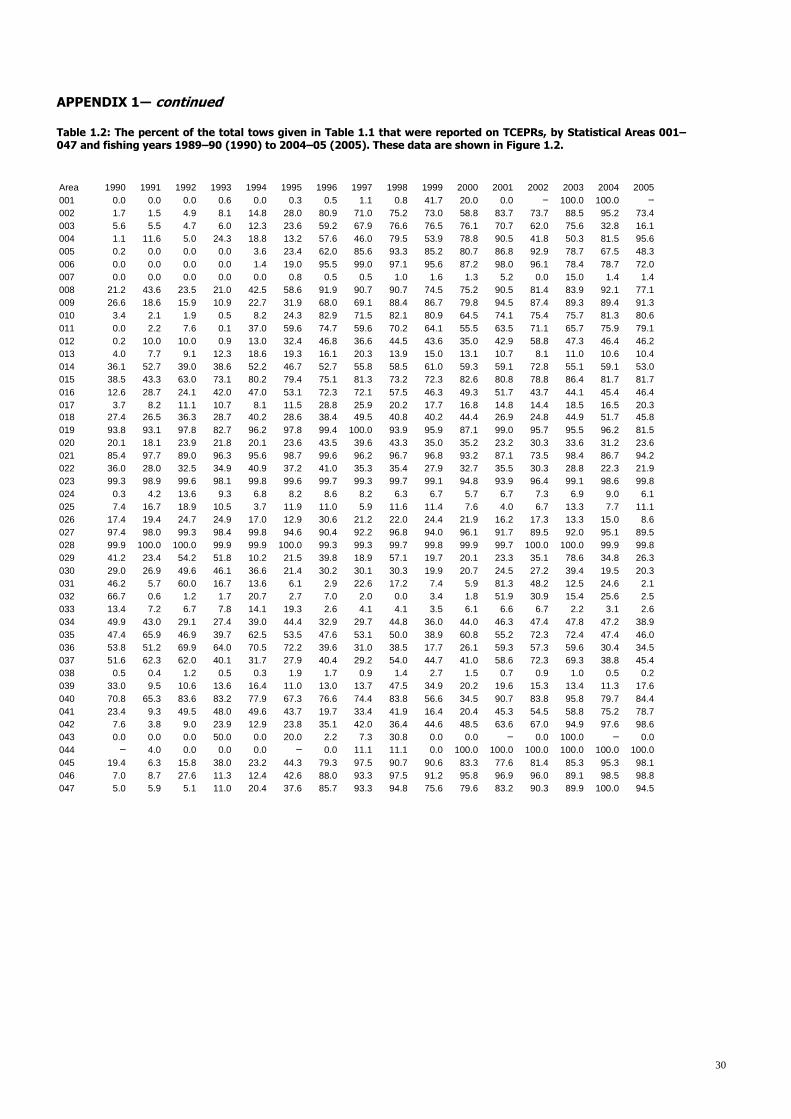
30
APPENDIX 1― continued Table 1.2: The percent of the total tows given in Table 1.1 that were reported on TCEPRs, by Statistical Areas 001–047 and fishing years 1989–90 (1990) to 2004–05 (2005). These data are shown in Figure 1.2.
Area 1990 1991 1992 1993 1994 1995 1996 1997 1998 1999 2000 2001 2002 2003 2004 2005001 0.0 0.0 0.0 0.6 0.0 0.3 0.5 1.1 0.8 41.7 20.0 0.0 – 100.0 100.0 –
002 1.7 1.5 4.9 8.1 14.8 28.0 80.9 71.0 75.2 73.0 58.8 83.7 73.7 88.5 95.2 73.4003 5.6 5.5 4.7 6.0 12.3 23.6 59.2 67.9 76.6 76.5 76.1 70.7 62.0 75.6 32.8 16.1004 1.1 11.6 5.0 24.3 18.8 13.2 57.6 46.0 79.5 53.9 78.8 90.5 41.8 50.3 81.5 95.6005 0.2 0.0 0.0 0.0 3.6 23.4 62.0 85.6 93.3 85.2 80.7 86.8 92.9 78.7 67.5 48.3006 0.0 0.0 0.0 0.0 1.4 19.0 95.5 99.0 97.1 95.6 87.2 98.0 96.1 78.4 78.7 72.0007 0.0 0.0 0.0 0.0 0.0 0.8 0.5 0.5 1.0 1.6 1.3 5.2 0.0 15.0 1.4 1.4008 21.2 43.6 23.5 21.0 42.5 58.6 91.9 90.7 90.7 74.5 75.2 90.5 81.4 83.9 92.1 77.1009 26.6 18.6 15.9 10.9 22.7 31.9 68.0 69.1 88.4 86.7 79.8 94.5 87.4 89.3 89.4 91.3010 3.4 2.1 1.9 0.5 8.2 24.3 82.9 71.5 82.1 80.9 64.5 74.1 75.4 75.7 81.3 80.6011 0.0 2.2 7.6 0.1 37.0 59.6 74.7 59.6 70.2 64.1 55.5 63.5 71.1 65.7 75.9 79.1012 0.2 10.0 10.0 0.9 13.0 32.4 46.8 36.6 44.5 43.6 35.0 42.9 58.8 47.3 46.4 46.2013 4.0 7.7 9.1 12.3 18.6 19.3 16.1 20.3 13.9 15.0 13.1 10.7 8.1 11.0 10.6 10.4014 36.1 52.7 39.0 38.6 52.2 46.7 52.7 55.8 58.5 61.0 59.3 59.1 72.8 55.1 59.1 53.0015 38.5 43.3 63.0 73.1 80.2 79.4 75.1 81.3 73.2 72.3 82.6 80.8 78.8 86.4 81.7 81.7016 12.6 28.7 24.1 42.0 47.0 53.1 72.3 72.1 57.5 46.3 49.3 51.7 43.7 44.1 45.4 46.4017 3.7 8.2 11.1 10.7 8.1 11.5 28.8 25.9 20.2 17.7 16.8 14.8 14.4 18.5 16.5 20.3018 27.4 26.5 36.3 28.7 40.2 28.6 38.4 49.5 40.8 40.2 44.4 26.9 24.8 44.9 51.7 45.8019 93.8 93.1 97.8 82.7 96.2 97.8 99.4 100.0 93.9 95.9 87.1 99.0 95.7 95.5 96.2 81.5020 20.1 18.1 23.9 21.8 20.1 23.6 43.5 39.6 43.3 35.0 35.2 23.2 30.3 33.6 31.2 23.6021 85.4 97.7 89.0 96.3 95.6 98.7 99.6 96.2 96.7 96.8 93.2 87.1 73.5 98.4 86.7 94.2022 36.0 28.0 32.5 34.9 40.9 37.2 41.0 35.3 35.4 27.9 32.7 35.5 30.3 28.8 22.3 21.9023 99.3 98.9 99.6 98.1 99.8 99.6 99.7 99.3 99.7 99.1 94.8 93.9 96.4 99.1 98.6 99.8024 0.3 4.2 13.6 9.3 6.8 8.2 8.6 8.2 6.3 6.7 5.7 6.7 7.3 6.9 9.0 6.1025 7.4 16.7 18.9 10.5 3.7 11.9 11.0 5.9 11.6 11.4 7.6 4.0 6.7 13.3 7.7 11.1026 17.4 19.4 24.7 24.9 17.0 12.9 30.6 21.2 22.0 24.4 21.9 16.2 17.3 13.3 15.0 8.6027 97.4 98.0 99.3 98.4 99.8 94.6 90.4 92.2 96.8 94.0 96.1 91.7 89.5 92.0 95.1 89.5028 99.9 100.0 100.0 99.9 99.9 100.0 99.3 99.3 99.7 99.8 99.9 99.7 100.0 100.0 99.9 99.8029 41.2 23.4 54.2 51.8 10.2 21.5 39.8 18.9 57.1 19.7 20.1 23.3 35.1 78.6 34.8 26.3030 29.0 26.9 49.6 46.1 36.6 21.4 30.2 30.1 30.3 19.9 20.7 24.5 27.2 39.4 19.5 20.3031 46.2 5.7 60.0 16.7 13.6 6.1 2.9 22.6 17.2 7.4 5.9 81.3 48.2 12.5 24.6 2.1032 66.7 0.6 1.2 1.7 20.7 2.7 7.0 2.0 0.0 3.4 1.8 51.9 30.9 15.4 25.6 2.5033 13.4 7.2 6.7 7.8 14.1 19.3 2.6 4.1 4.1 3.5 6.1 6.6 6.7 2.2 3.1 2.6034 49.9 43.0 29.1 27.4 39.0 44.4 32.9 29.7 44.8 36.0 44.0 46.3 47.4 47.8 47.2 38.9035 47.4 65.9 46.9 39.7 62.5 53.5 47.6 53.1 50.0 38.9 60.8 55.2 72.3 72.4 47.4 46.0036 53.8 51.2 69.9 64.0 70.5 72.2 39.6 31.0 38.5 17.7 26.1 59.3 57.3 59.6 30.4 34.5037 51.6 62.3 62.0 40.1 31.7 27.9 40.4 29.2 54.0 44.7 41.0 58.6 72.3 69.3 38.8 45.4038 0.5 0.4 1.2 0.5 0.3 1.9 1.7 0.9 1.4 2.7 1.5 0.7 0.9 1.0 0.5 0.2039 33.0 9.5 10.6 13.6 16.4 11.0 13.0 13.7 47.5 34.9 20.2 19.6 15.3 13.4 11.3 17.6040 70.8 65.3 83.6 83.2 77.9 67.3 76.6 74.4 83.8 56.6 34.5 90.7 83.8 95.8 79.7 84.4041 23.4 9.3 49.5 48.0 49.6 43.7 19.7 33.4 41.9 16.4 20.4 45.3 54.5 58.8 75.2 78.7042 7.6 3.8 9.0 23.9 12.9 23.8 35.1 42.0 36.4 44.6 48.5 63.6 67.0 94.9 97.6 98.6043 0.0 0.0 0.0 50.0 0.0 20.0 2.2 7.3 30.8 0.0 0.0 – 0.0 100.0 – 0.0044 – 4.0 0.0 0.0 0.0 – 0.0 11.1 11.1 0.0 100.0 100.0 100.0 100.0 100.0 100.0045 19.4 6.3 15.8 38.0 23.2 44.3 79.3 97.5 90.7 90.6 83.3 77.6 81.4 85.3 95.3 98.1046 7.0 8.7 27.6 11.3 12.4 42.6 88.0 93.3 97.5 91.2 95.8 96.9 96.0 89.1 98.5 98.8047 5.0 5.9 5.1 11.0 20.4 37.6 85.7 93.3 94.8 75.6 79.6 83.2 90.3 89.9 100.0 94.5

31
APPENDIX 2: BENTHIC-OPTIMISED MARINE ENVIRONMENT CLASSIFICATION
(Leathwick et al. 2009)
Figure 2.1: The benthic-optimised marine environment classification (BOMEC) developed using a Generalised Dissimilarity Modelling approach by Leathwick et al. (2009). Fifteen classes were defined and categorised as Inshore and shelf (classes A–E); Upper slope (F–H); Northern mid-depths (I–K); Southern mid-depths (L–M); and Deeper waters (N–O).

32
APPENDIX 3: CELL DATA SUMMARIES
Figure 3.1: The number of cells in each fishing year and BOMEC class for 100-m depth zones, where the depth is the depth at the midpoint of a cell, 1989–90 (1990) to 2004–05 (2005). The maximum number in each class is given in parentheses.
BO
ME
C c
lass
B
OM
EC
cla
ss
BO
ME
C c
lass
B
OM
EC
cla
ss
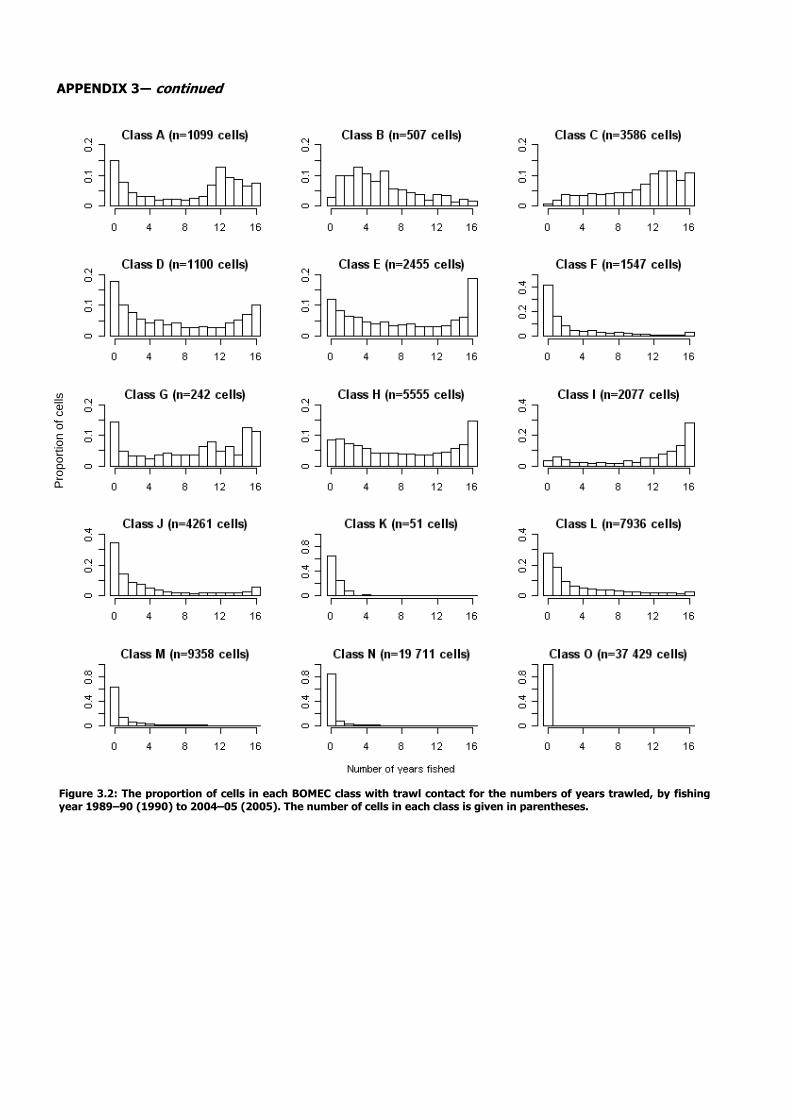
APPENDIX 3― continued
Figure 3.2: The proportion of cells in each BOMEC class with trawl contact for the numbers of years trawled, by fishing year 1989–90 (1990) to 2004–05 (2005). The number of cells in each class is given in parentheses.
Pro
port
ion
of c
ells

34
APPENDIX 3― continued
Figure 3.3: The mean footprint (km2) for each 25-km2 fished cell for each BOMEC class by fishing year 1989–90 (1990) to 2004–05 (2005).

35
APPENDIX 3― continued
Figure 3.4: The number of cells for given values of footprint swept area, where 25 km2 is the whole cell area, for each BOMEC class by fishing year 1989–90 (1990) to 2004–05 (2005). The maximum number in each class is given in parentheses.

Appendix 3 ― continued Table 3.1: Percent of the total number of 25-km2 cells in each BOMEC class that were contacted by trawl gear in each fishing year.
BOMEC class
Fishing year A B C D E F G H I J K L M N O
1990 18.0 19.0 52.0 50.0 52.0 19.0 36.0 36.0 50.0 21.0 0.0 18.0 6.0 3.0 0.0
1991 27.0 12.0 50.0 45.0 50.0 26.0 34.0 38.0 59.0 24.0 0.0 24.0 9.0 3.0 0.0
1992 34.0 20.0 59.0 51.0 54.0 25.0 35.0 43.0 76.0 22.0 2.0 35.0 9.0 3.0 0.0
1993 39.0 37.0 58.0 57.0 62.0 20.0 49.0 49.0 76.0 24.0 0.0 19.0 7.0 3.0 0.0
1994 51.0 41.0 66.0 49.0 50.0 20.0 62.0 45.0 71.0 23.0 0.0 17.0 4.0 4.0 0.0
1995 58.0 44.0 67.0 48.0 56.0 20.0 68.0 51.0 71.0 25.0 2.0 16.0 5.0 3.0 0.0
1996 65.0 27.0 69.0 56.0 56.0 22.0 61.0 49.0 74.0 23.0 6.0 20.0 6.0 4.0 0.0
1997 66.0 28.0 67.0 40.0 51.0 17.0 70.0 49.0 72.0 27.0 4.0 19.0 6.0 4.0 0.0
1998 65.0 27.0 68.0 45.0 54.0 18.0 67.0 57.0 75.0 30.0 14.0 22.0 9.0 5.0 0.0
1999 62.0 40.0 59.0 38.0 48.0 15.0 60.0 54.0 78.0 33.0 0.0 21.0 6.0 5.0 0.0
2000 50.0 48.0 58.0 36.0 50.0 18.0 50.0 55.0 76.0 30.0 16.0 27.0 9.0 4.0 0.0
2001 60.0 30.0 70.0 27.0 45.0 14.0 58.0 57.0 75.0 26.0 0.0 31.0 10.0 4.0 0.0
2002 63.0 58.0 77.0 34.0 48.0 20.0 58.0 58.0 75.0 25.0 4.0 41.0 15.0 4.0 0.0
2003 61.0 54.0 79.0 36.0 46.0 16.0 54.0 61.0 74.0 26.0 2.0 35.0 10.0 4.0 0.0
2004 63.0 43.0 76.0 39.0 41.0 15.0 55.0 52.0 69.0 26.0 0.0 29.0 10.0 4.0 0.0
2005 63.0 49.0 77.0 31.0 42.0 15.0 52.0 54.0 64.0 22.0 0.0 22.0 10.0 4.0 0.0
Total cells 1 099 507 2 586 1 100 2 455 1 547 242 5 555 2077 12 444 51 7 936 9 358 19 711 37 429

Appendix 3 ― continued Table 3.2: Number of cells (upper table) and footprint (km2) (lower table) in each BOMEC class, by fishing year 1989–90 (1990) to 2004–05 (2005).
A B C D E F G H I J K L M N O 1990 203 98 1854 547 1265 293 88 1981 1042 2658 0 1428 584 627 5 1991 295 60 1783 500 1238 402 83 2114 1234 3044 0 1885 834 564 9 1992 374 103 2110 564 1335 381 84 2392 1580 2693 1 2756 855 529 20 1993 434 188 2077 628 1515 303 118 2702 1569 2966 0 1514 637 579 11 1994 562 207 2358 542 1222 313 151 2503 1482 2825 0 1310 420 732 20 1995 635 221 2406 531 1386 310 165 2813 1468 3062 1 1260 467 672 26 1996 713 135 2477 617 1387 337 147 2709 1529 2843 3 1574 545 744 24 1997 728 141 2393 444 1240 263 170 2707 1494 3407 2 1543 577 824 34 1998 710 135 2427 500 1331 275 161 3139 1562 3773 7 1752 812 895 43 1999 677 202 2126 416 1167 228 144 3000 1618 4051 0 1634 607 901 25 2000 545 241 2087 399 1234 274 120 3055 1583 3760 8 2130 886 834 33 2001 658 153 2526 296 1105 223 140 3181 1555 3216 0 2456 976 814 19 2002 691 296 2758 370 1169 305 141 3238 1565 3121 2 3241 1414 850 26 2003 673 274 2846 398 1141 243 130 3394 1537 3273 1 2761 966 790 25 2004 691 220 2724 424 1015 234 134 2905 1442 3201 0 2320 924 749 20 2005 691 249 2774 337 1030 229 127 3009 1331 2788 0 1760 919 790 26 A B C D E F G H I J K L M N O 1990 121.2 61.9 5761.9 1601.7 5445.1 1220.3 160.2 9583.2 5510.9 10614.5 0.0 4238.3 924.9 1053.7 1.7 1991 267.0 40.1 4271.4 1181.1 5951.7 1315.1 165.7 10780.6 6736.5 12036.0 0.0 7221.9 2328.6 601.1 3.3 1992 684.6 80.4 6531.6 1420.0 5974.0 1003.7 131.7 13399.6 13212.3 10856.7 0.2 10226.6 3016.9 710.9 11.0 1993 1378.6 183.4 7333.9 1574.9 6778.2 571.6 229.1 14041.6 13059.5 13596.0 0.0 5970.0 2797.8 888.6 12.9 1994 1227.5 215.5 7243.7 1089.8 5214.6 1132.1 321.4 12637.1 9580.8 10468.7 0.0 4740.5 894.8 1051.8 16.4 1995 1741.2 246.6 7087.3 1287.6 6091.5 1170.7 470.4 14641.1 12423.4 12245.4 0.1 5182.4 1256.2 922.0 20.6 1996 3525.6 218.7 9648.3 1592.6 6593.3 1390.6 758.1 16065.3 13858.0 11447.5 1.1 5002.3 1080.5 747.5 14.1 1997 3505.1 305.7 8992.1 1266.9 6008.6 1142.9 832.6 15320.5 14799.4 14496.8 0.9 6855.3 1372.5 847.1 27.2 1998 3360.5 210.9 11190.0 1378.1 7107.7 955.7 567.7 18497.9 17892.9 15099.2 2.1 6604.3 1735.7 1018.7 27.9 1999 3077.9 246.5 10485.6 767.9 6128.0 518.0 452.6 18230.2 18016.1 14173.5 0.0 4769.3 1332.8 930.2 18.1 2000 2935.8 282.0 8714.8 823.7 6064.8 516.7 450.4 17810.8 17754.6 15074.6 2.4 8031.5 2106.3 831.3 19.0 2001 3872.9 298.9 10295.1 377.4 4959.4 571.9 376.9 19393.1 17290.3 15277.7 0.0 9092.5 2307.6 704.7 17.0 2002 3906.9 468.1 11081.8 708.3 5392.5 1037.7 346.0 17913.2 16598.8 15974.7 0.5 11283.8 4389.6 787.7 20.7 2003 3428.3 390.1 11250.9 752.6 5264.3 1184.7 382.1 20343.6 16343.7 15392.2 0.1 13598.8 1866.9 723.3 18.0 2004 4026.3 327.7 11115.6 679.5 4046.2 1322.5 425.4 16670.8 13334.6 13975.8 0.0 10168.9 1917.6 703.8 20.8 2005 3682.0 484.4 11374.2 596.6 4760.9 1274.4 405.5 15126.9 10125.4 10942.4 0.0 5791.6 1156.8 703.9 23.8

38

PUBLICATIONS
NONE TO DATE
DATA STORAGE Data files provided to the Ministry of Fisheries data manager (NIWA) contained the BOMEC shapefile, the fishing
footprint shapefile, the BEN200601 database tables used to produce fishing summaries, and explanatory notes for
these data layers.