Embed Size (px)
Citation preview
1
EVALUATIONS OF PREJUDICE AND STEREOTYPE RESEARCH: HOW DO PEOPLE VIEW THE VALIDITY OF PSYCHOLOGICAL SCIENCE AND SCIENTISTS?
By
TATIANA OROZCO SCHEMBER
A DISSERTATION PRESENTED TO THE GRADUATE SCHOOL OF THE UNIVERSITY OF FLORIDA IN PARTIAL FULFILLMENT
OF THE REQUIREMENTS FOR THE DEGREE OF DOCTOR OF PHILOSOPHY
UNIVERSITY OF FLORIDA
2013

2
© 2013 Tatiana Orozco Schember

3
To John

4
ACKNOWLEDGMENTS
First, I would like to thank Dr. Gregory Webster for inviting me to the University of
Florida to pursue my graduate studies and for being an extraordinary mentor. I could not
ask for a better advisor. I would also like to thank the other members of my supervisory
committee, Dr. James Shepperd, Dr. Bonnie Moradi; and Dr. James Algina; their help
and advice has been immeasurable.
Special thanks go to my family and close friends, especially to my mom, Robert,
Ellie, and Rachel, for all their support and for believing in me. Finally, I thank my
husband, John, for all his help, love, understanding, and encouragement.
5
TABLE OF CONTENTS page
ACKNOWLEDGMENTS .................................................................................................. 4
LIST OF TABLES ............................................................................................................ 7
LIST OF FIGURES .......................................................................................................... 9
ABSTRACT ................................................................................................................... 10
CHAPTER
1 INTRODUCTION .................................................................................................... 12
Attitudes, Social Influence, and Authority................................................................ 16 Overview of the Present Research ......................................................................... 21
2 STUDY 1 ................................................................................................................. 23
Method .................................................................................................................... 23 Participants ....................................................................................................... 23
Design and Variables ....................................................................................... 24
Procedure ......................................................................................................... 24
Dependent Measures and Demographics ........................................................ 25 Predictions .............................................................................................................. 25
Results .................................................................................................................... 26 Discussion .............................................................................................................. 27
3 STUDY 2 ................................................................................................................. 37
Method .................................................................................................................... 38 Participants ....................................................................................................... 38
Design and Variables ....................................................................................... 38 Procedure ......................................................................................................... 39
Dependent measures and manipulation check .......................................... 40 Individual difference measures .................................................................. 41
Predictions .............................................................................................................. 42 Predictions for Independent Variables .............................................................. 42 Predictions for Individual Difference Measures ................................................ 42
Results .................................................................................................................... 44 Data Preparation and Preliminary Analyses ..................................................... 45 Main Analyses .................................................................................................. 47
Dependent variable: evaluations of research quality .................................. 49 Dependent variable: funding and future research ...................................... 52 Dependent variable: researcher credibility ................................................. 56
Discussion .............................................................................................................. 57
6
Researcher gender effects ............................................................................... 57 Expertise covariate effects ............................................................................... 58 Benevolent sexism covariate effects ................................................................ 59
Hostile sexism covariate effects ....................................................................... 60 Participant gender covariate effects ................................................................. 61
4 OVERALL DISCUSSION ........................................................................................ 84
Limitations and Future Directions ........................................................................... 86 Implications and Conclusions ................................................................................. 89
APPENDIX
A EVALUATIONS OF RESEARCH AND RESEARCHER CREDIBILITY SCALE ...... 92
B MANIPULATION CHECK, ATTENTION CHECKS, & QUALITY CHECKS (STUDY 2) .............................................................................................................. 95
C WHAT CONSTITUTES AN EXPERT (WCE) .......................................................... 96
D AMBIVALENT SEXISM INVENTORY (ASI; GLICK & FISKE, 1996) ...................... 97
E DEMOGRAPHICS .................................................................................................. 99
REFERENCES ............................................................................................................ 101
BIOGRAPHICAL SKETCH .......................................................................................... 103
7
LIST OF TABLES
Table page 2-1 Contrast Coding for Multiple Regression Predictors (Study 1)............................ 30
2-2 Correlations for Dependent Variables and Descriptive Statistics (Study 1) ........ 31
2-3 Cell Means (Study 1) .......................................................................................... 32
2-4 Regression – Evaluations of Research (Study 1) ............................................... 33
2-5 Regression – Funding & Future Research (Study 1) .......................................... 34
2-6 Regression – Researcher Credibility (Study 1) ................................................... 35
3-1 Squared Multiple Correlations ............................................................................ 62
3-2 Goodness of Fit .................................................................................................. 62
3-3 Contrast Coding for Multiple Regression Predictors (Study 2)............................ 62
3-4 Correlations for Dependent Variables and Covariates; Descriptive Statistics (Study 2) ............................................................................................................. 63
3-5 Cell Means (Study 2) .......................................................................................... 63
3-6 Regression – Evaluations of Research, WCE covariate (Study 2) ..................... 64
3-7 Regression – Funding & Future Research, WCE covariate (Study 2) ................ 65
3-8 Regression – Researcher Credibility, WCE covariate (Study 2) ......................... 66
3-9 Regression – Evaluations of Research, ASI-benevolent covariate (Study 2) ..... 67
3-10 Regression – Funding & Future Research, ASI-benevolent covariate (Study 2) ............................................................................................................. 68
3-11 Regression – Researcher Credibility, ASI-benevolent covariate (Study 2) ......... 69
3-12 Regression – Evaluations of Research, ASI-hostile covariate (Study 2) ............ 70
3-13 Regression – Funding & Future Research, ASI-hostile covariate (Study 2) ....... 71
3-14 Regression – Researcher Credibility, ASI-hostile covariate (Study 2) ................ 72
3-15 Regression – Evaluations of Research, participant gender (Study 2) ................. 73
8
3-16 Regression – Funding & Future Research, participant gender (Study 2) ........... 74
3-17 Regression – Researcher Credibility, participant gender (Study 2) .................... 75

9
LIST OF FIGURES
Figure page 2-1 Summary Article of Ayres, I., & Siegelman, P. (1995) ........................................ 36
3-1 Screenshot: Summary Article of Petersen, J. L., & Hyde, J. (2010) ................... 76
3-2 Pictures used in female researcher, male researcher, and control conditions .... 77
3-3 Factor structure for the full (8 item) What Constitutes an Expert scale ............... 78
3-4 Factor structure for the reduced (5 item) What Constitutes an Expert scale ...... 79
3-5 Predicted scores on the evaluations of research quality dependent variable for one SD above and one SD below the mean on the What Constitutes an Expert covariate. ................................................................................................. 80
3-6 Predicted scores on the evaluations of research quality dependent variable for one SD above and one SD below the mean on the hostile sexism (ASI-hostile) covariate. ............................................................................................... 80
3-7 Predicted scores on the funding & future research dependent variable for one SD above and one SD below the mean on the What Constitutes an Expert covariate. ............................................................................................................ 81
3-8 Predicted scores on the funding and future research dependent variable for one SD above and one SD below the mean on the benevolent sexism (ASI-benevolent) covariate. ........................................................................................ 81
3-9 Predicted scores on the funding and future research dependent variable for one SD above and one SD below the mean on the benevolent sexism (ASI-benevolent) covariate. ........................................................................................ 82
3-10 Predicted scores on the funding and future research dependent variable for one SD above and SD below the mean on the hostile sexism (ASI-hostile) covariate. ............................................................................................................ 82
3-11 Predicted scores on the researcher credibility dependent variable for one SD above and one SD below the mean on the benevolent sexism (ASI-benevolent) covariate. ........................................................................................ 83
10
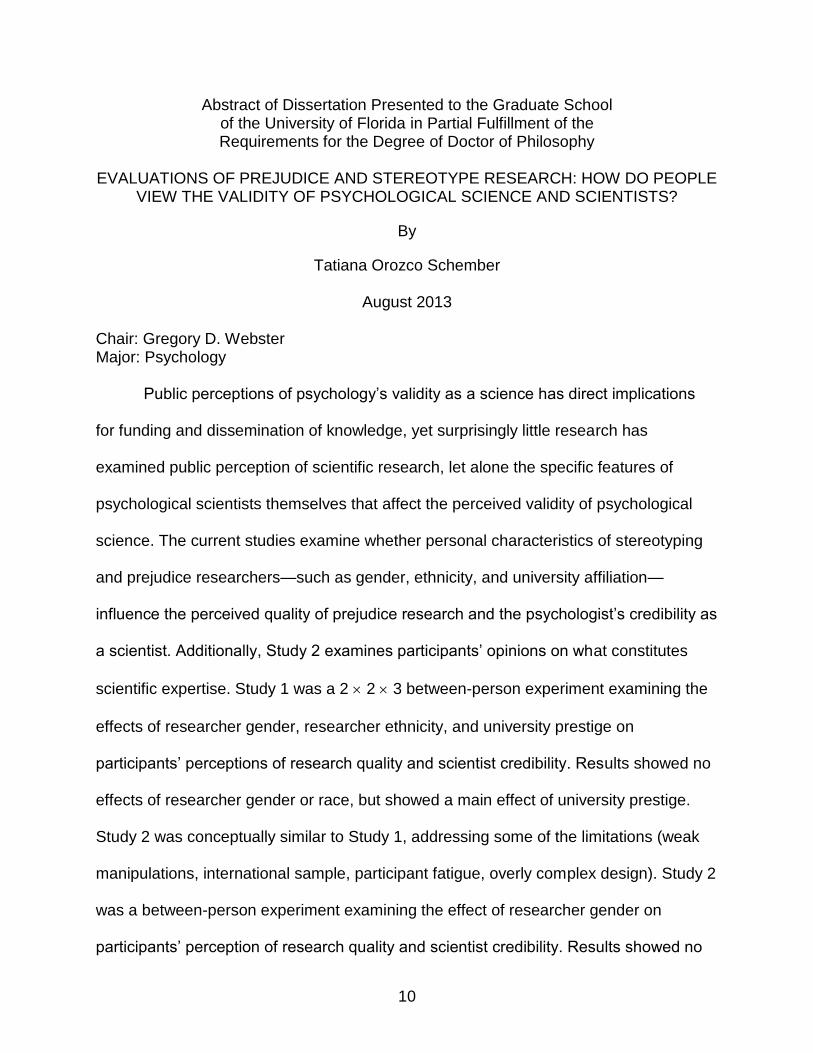
Abstract of Dissertation Presented to the Graduate School of the University of Florida in Partial Fulfillment of the Requirements for the Degree of Doctor of Philosophy
EVALUATIONS OF PREJUDICE AND STEREOTYPE RESEARCH: HOW DO PEOPLE
VIEW THE VALIDITY OF PSYCHOLOGICAL SCIENCE AND SCIENTISTS?
By
Tatiana Orozco Schember
August 2013
Chair: Gregory D. Webster Major: Psychology
Public perceptions of psychology’s validity as a science has direct implications
for funding and dissemination of knowledge, yet surprisingly little research has
examined public perception of scientific research, let alone the specific features of
psychological scientists themselves that affect the perceived validity of psychological
science. The current studies examine whether personal characteristics of stereotyping
and prejudice researchers—such as gender, ethnicity, and university affiliation—
influence the perceived quality of prejudice research and the psychologist’s credibility as
a scientist. Additionally, Study 2 examines participants’ opinions on what constitutes
scientific expertise. Study 1 was a 2 2 3 between-person experiment examining the
effects of researcher gender, researcher ethnicity, and university prestige on
participants’ perceptions of research quality and scientist credibility. Results showed no
effects of researcher gender or race, but showed a main effect of university prestige.
Study 2 was conceptually similar to Study 1, addressing some of the limitations (weak
manipulations, international sample, participant fatigue, overly complex design). Study 2
was a between-person experiment examining the effect of researcher gender on
participants’ perception of research quality and scientist credibility. Results showed no
11
significant main effects of gender, but showed some significant gender covariate
interactions; participants in the male researcher condition rated the research differently
depending on their level of sexism and their preferences for firsthand experience versus
detachment in a scientist.
12
CHAPTER 1 INTRODUCTION
In August of 2010, Chief U.S. District Judge Vaughn Walker ruled that California
Proposition 8—the infamous gay marriage ban proposition—violated the due process
and equal protection clauses of the fourteenth amendment of the U.S. Constitution
(Walker, 2010). In April of 2011, a group called “Protect Marriage” filed a motion to void
Walker’s ruling on the grounds that Walker was in a long-term, same-sex relationship
and therefore could not be an impartial judge (Badash, 2011). Walker, however, told
reporters that he never considered stepping down from ruling on the case because his
sexual orientation was irrelevant in deciding whether Proposition 8 violated the U.S.
Constitution. Further, he asserted that it would be inappropriate for judges to recuse
themselves based on ethnicity, national origin, gender, or sexual orientation, because
that would be “a very slippery slope.” (Levine, 2011) Protect Marriage saw Judge
Walker’s potential to gain from the ruling (i.e., the potential for him to marry his partner)
as problematic for his suitability to rule on the case. However, people could argue that
his membership in the potentially affected group (regardless of any intention to marry
his partner) gives him special insight into the case, thereby enhancing his suitability to
rule on the case. One could argue that the insights of partnered gay, lesbian, and
bisexual people are necessary and enhance the decision-making process; firsthand
experience of being denied a right could make one better at recognizing the issue as
one of civil liberties.
As was the case with Judge Walker and the Proposition 8 ruling, people
generally recognize the importance of authorities but do not always agree with an
authority’s opinions, behaviors, and decisions. Agreement with an authority may vary as
13
a function of audience’s perceptions of the characteristics of an authority figure, the
characteristics of the audience, or the communications between authority and audience
(Strong, 1968). These general ideas can apply more specifically to lay perceptions of
psychological scientists and their research. Although people may recognize that
scientists are authorities in their respective fields, they may sometimes disagree with
scientists’ research methods or results. It is possible that various characteristics of a
scientist can influence the perception of that scientist and his or her research, such as
the scientist’s education, prestige, or even race and gender. Likewise, various
characteristics of a lay person can influence the perceptions of scientists and their
research, such as personal opinions regarding what type of person constitutes a
scientific authority for the given field.
Although many psychological scientists may prefer to focus their efforts on
producing rigorous scientific research, the perceptions of this research and of the
psychologists who conduct it are of paramount importance. The perception of
psychologists as competent scientists has direct implications for funding and
dissemination of knowledge (Lilienfeld, 2012). People may distinguish between the
goals of basic and applied science, but it is probably the case that even basic
psychological scientists desire, through their research, to solve problems outside of the
lab. For example, “basic” psychologists who study prejudice, stereotyping, and
discrimination most surely hope that their research adds to a knowledge base that will
help reduce these problems.
A positive general impression of these psychologists and their research is
important for the dissemination and application of their research. Unfortunately, the
14
current view of psychology is largely negative (Lilienfeld, 2012). Lilienfeld (2012)
suggests that some of this negativity may be deserved, citing psychologists’ failure to
police questionable practices in the field. Nevertheless, some of this negativity is likely
due to the way psychologists have portrayed—or perhaps more accurately, neglected to
try to portray—themselves and their research to the general public (Lilienfeld, 2012).
However, with all their accumulated knowledge of human cognition and behavior,
psychologists have the ability to more accurately portray psychological science to the
general public and to shift public perception towards a greater match between
perception and actual state of scientific rigor.
Given the current negative perceptions of psychological science and scientists,
and the fact that these negative perceptions have such strong implications for funding
and dissemination of knowledge (Lilienfield, 2012), it is surprising that psychologists
have conducted little research specific to this issue. There has been some research on
perceptions of scientific research, however. For example, Wilson et al. (1993) showed
that scientists were more likely to overlook methodological flaws in a study when the
topic was considered important. Two scientist samples—medical school faculty and
research psychologists—read brief summaries of methodologically flawed, fictitious
studies and then completed questionnaires evaluating the scientific rigor and
publishability of the studies (some of Wilson et al.’s items were adapted for the present
research). Both scientist samples were more willing to overlook methodological flaws
(e.g., causal inferences from correlational data) when the topic of study was perceived
as important relative to when it was perceived as less important (e.g., heart disease vs.
heartburn).
15
In a study on perceptions of scientific research and methodology, Munro (2010)
found that people will dismiss results of scientific research that are at odds with their
own beliefs, claiming that the topic of research is not suitable for scientific investigation.
Further, this “scientific impotence” belief extended to unrelated topics. Participants read
short research summary articles that either confirmed or disconfirmed their belief that
homosexuality is a mental illness. Participants whose beliefs were disconfirmed by the
summary article reported greater agreement with an item stating that the topic
addressed in the summaries (homosexuality) could not be examined through scientific
methods. Participants in the belief-disconfirming condition were more likely to report that
other, unrelated questions (e.g., regarding the effectiveness of spanking or the
existence of clairvoyance) could not be answered using scientific methods. Munro
called this reaction the “scientific impotence excuse” (Munro, 2010).
Beyond these studies, there is little other research (to my knowledge) that
examines perceptions of scientific research, let alone scientific prejudice and stereotype
research specifically. The purpose of the research presented in this dissertation is to
examine some characteristics of both psychological scientists and the general public
that affect the perceived quality of the psychological research and the credibility of
psychological scientists. In particular, this research examines the variables that affect
the perception of prejudice, discrimination, and stereotyping research, as well as the
psychologists who conduct it. The driving questions of this research are what
constitutes an authority in prejudice research, and what characteristics of a prejudice
researcher influence the perception of that researcher’s authority on the topic. Expertise
and trustworthiness are what grant the perception of “expert power” (Kenrick, Neuberg,
16
& Cialdini, 2010), but is an expert in prejudice and stereotyping someone who is a
member of a stigmatized group because of that first-hand experience? Or is an expert in
prejudice someone who is specifically not a member of a stigmatized group, and so
may be perceived as more detached, objective, and free of any “emotional baggage”
that may be assumed to accompany membership in a stigmatized group?
In the following text, I present a brief and non-exhaustive review of research on
attitudes, persuasion, and authority influence. Afterwards, I will present methods and
results from two experiments designed to examine some potential variables affecting
the perceived quality of prejudice and stereotyping research and perceived researcher
credibility. I will then discuss the findings and implications of this research.
Attitudes, Social Influence, and Authority
Much of the social psychological research on attitudes and persuasion has
focused on identifying the variables that lead to attitude formation and change. Attitudes
towards a target stimulus are not always shaped by features of the stimulus itself;
rather, attitudes are often shaped by external factors that have nothing to do with the
stimulus (Cacioppo & Petty, 1986). In particular, the elaboration likelihood model
(Cacioppo and Petty 1986) purports that recipients of a persuasive message form their
attitudes about that message through one of two possible routes: a central route and a
peripheral route. When the central route is activated, people pay close attention to the
message and process it thoughtfully, focusing on the important, “central” features such
as whether the arguments are logical. On the other hand, when the peripheral route is
activated, people focus on features that are irrelevant to the quality of the message,
such as speaker characteristics (Cacioppo & Petty, 1986). Attributes such as the
physical attractiveness and the perceived expertise of the speaker, for example, affect
17
the persuasiveness of a message (e.g., Chaiken, 1979; Olson & Cal, 1984). Consistent
with this research, critics of Judge Walker’s ruling on Proposition 8 found his ruling
problematic based on personal information about Walker himself, despite the fact that
the constitutionality of Proposition 8 was at the heart of the case, and that sexual
orientation is irrelevant to determining constitutionality.
In addition to examining information processing in attitude formation—focusing
on the cognition and behavior of the perceiver or target of influence—psychologists
have also studied authority influence as an effective means of attitude formation and
change, focusing on variables specific to the authority figure or agent of influence rather
than the perceiver or target. One reason people may defer to authority figures is that
authorities have the power to punish or reward behavior. Interestingly however, people
still defer to someone who they perceive as an authority even though the perceived
authority lacks the power to punish or reward. People may defer to authorities because
doing so can, but will not always, lead to quick and accurate decisions (Kenrick,
Neuberg, & Cialdini, 2002).
Appeals to authority are prevalent in advertising and have consistently proven to
be a powerful tool of persuasion (Jung & Kellaris, 2006; Kenrick, Neuberg, & Cialdini,
2010). Authority influence is so potent that the mere appearance of authority—which
can be easily faked by titles, clothes, and trappings—is sufficient to produce its effects
(Kenrick, Neuberg, & Cialdini, 2010; Sagarin, Cialdini, Rice, & Serna, 2002). In a study
on resistance to persuasion (Sagarin et al., 2002), participants rated magazine ads
containing both “legitimate” authorities (experts on the product they are trying to sell)
and “illegitimate” authorities (non-experts). Before rating the ads, participants randomly
18
assigned to the experimental condition first read a packet of information about the use
of legitimate and illegitimate authority in advertising, instructions on how to distinguish
between legitimate and illegitimate authorities, and example ads. Participants in the
control condition read a packet of information about the use of color and tone in
advertisements, with accompanying example ads. Participants in the control condition
rated the ads with illegitimate authority as less unduly manipulative and more
persuasive, relative to participants in the experimental condition.
In a study examining the effects of reputation (a proxy for expertise or authority),
college students were asked to evaluate poetry (Aronson, Turner, & Carlsmith, 1963).
Afterwards, participants read an essay that described the use of form in poetry and
used the same stanzas just evaluated by participants as either good or bad examples.
This essay was attributed to either T.S. Elliot or to a student at a small college.
Participants then re-evaluated the poetry. For participants who showed a wide
discrepancy between their initial evaluations and the essay’s evaluations of those same
stanzas—i.e., participants who showed attitude change—people in the high expertise
(T.S. Elliot) condition showed greater attitude change in their second evaluations than
did participants in the low expertise (college student) condition.
The personal characteristics of someone who is delivering a message are
generally considered a peripheral feature according to the elaboration likelihood model;
Judge Walker himself essentially made this point when he argued that his sexual
orientation was irrelevant to deliberating Proposition 8’s constitutionality. Regardless,
some people view personal characteristics as central and relevant to determining
authority status, as Protect Marriage’s attack demonstrates. Protect Marriage’s attack

19
and Judge Walker’s defense of his Proposition 8 ruling show that people have differing
opinions on what constitutes a legitimate authority figure, and further, that the perceived
legitimacy of authority figures can influence the perceived legitimacy of their decisions.
But what constitutes a legitimate authority? Jung and Kellaris (2006) point out the
existence of multiple authority types and acknowledge that there is a range of factors
that influence the effectiveness of an authority appeal. They note that celebrity endorser
appeals and true authority appeals (appeals from superiors in academia, the workplace,
or government) both tend to fall under the broad umbrella term of "appeals to authority”
(Jung & Kellaris, 2006), though some researchers have begun to distinguish between
authority types (e.g., Sagarin et al., 2002).
According to social psychologists such as Kenrick, Neuberg, and Cialdini (2010),
an authority is someone who is considered expert and trustworthy (Kenrick, Neuberg, &
Cialdini, 2010). Counseling psychologists have also stressed the importance of
expertise and trustworthiness . Strong (1968) reviewed social psychological research on
communicator variables that affect opinion change and recommended application of this
research to the field of counseling, likening counselors to agents of persuasion. Strong
asserted that, similar to a communicator attempting to influence an audience towards
some predetermined direction, counselors attempt to influence their clients towards
achieving the goals of counseling. Counselors may communicate information or
opinions that are discrepant with a client’s opinions, and characteristics of the counselor
can affect the counselor’s success in attempts to influence clients (Strong, 1968).
Reviewing both social psychological and counseling research on social influence
(e.g., Aronson, Turner, and Carlsmith, 1963), Strong identified client’s perceptions of
20
counselor’s expertise as a variable affecting a counselor’s success in helping the client
to achieve his or her counseling goals. A client must believe that the counselor knows
what he or she is doing (Strong, 1968). A counselor can convey expertise by displaying
objective indexes (such as diplomas and certifications) and through behavior (through
strategically structuring the client and counselor interview). These displays and
behaviors can show the client that the counselor is an expert—someone who knows
what he or she is doing and who is a source of valid assertions (Strong, 1968). Strong
also identified trustworthiness as an important variable affecting counseling success
(1968). He defined trustworthiness as a function of reputation for honesty, social role,
sincerity and openness, and perceived lack of motivation for personal gain. Strong
suggested that trustworthiness may play a stronger role than expertise, weakening the
influence of expertise when trustworthiness is low, or compensating for low expertise
when trustworthiness is high (Strong, 1968). A counselor can establish trustworthiness
by paying attention to client’s concerns and behaviors and by communicating his or her
concern for the client’s welfare (Strong, 1968).
The definition of authority as someone who is both expert and trustworthy does
not confine the notion of “authority” strictly to people with conferred power, such as
judges, police officers, employers, and professors. Hence, people without power to
directly reward or punish others can still exert authority influence based on their “expert
power,” which is power that comes with competence and knowledge in a given domain
(Kenrick, Neuberg, & Cialdini, 2010). Thus, even though Judge Walker had legal power,
it is likely that members of the Protect Marriage group saw him as lacking in
21
trustworthiness or in “expert power” to judge impartially and objectively; they therefore
felt justified in protesting against his legal power.
The implications of people’s beliefs about what constitutes an expert authority
extend beyond perceptions of the legitimacy of judges and their rulings. The public
perception of psychology as science can have a direct impact not only on funding for
psychological research, but also on researchers’ ability to disseminate knowledge and
thereby contribute to positive social change. Psychologists who hope to combat
prejudice through their research may be undercut by public perception that they are not
legitimate authorities on prejudice for one reason or another. This begs the question of
what constitutes an authority in prejudice research, and what characteristics of a
prejudice researcher influence the perception of that researcher’s authority on the topic.
Expertise and trustworthiness are what grant the perception of “expert power,” but is an
expert in prejudice and stereotyping someone who is a member of a stigmatized group
and who has first-hand experience with prejudice and stereotyping, because personal
experience may grant expertise? Or is an expert in prejudice someone who is
specifically not a member of a stigmatized group, and so may be perceived as more
detached, objective, and free of any “emotional baggage” that may be assumed to
accompany membership in a stigmatized group?
Overview of the Present Research
There are two major goals for the proposed studies. The first goal is to examine
how participants perceive the quality of research and the credibility of the researchers
when they are given certain personal characteristics about the researcher
(characteristics which portray membership—or lack thereof—in a group that is
stereotyped or discriminated against). The second goal is to examine how participants
22
own personal characteristics, particularly their perceptions of what constitutes an expert,
affect perceptions of research quality and researcher credibility.
23
CHAPTER 2 STUDY 1
Study 1 served as a pilot study; its goal was to examine whether people evaluate
prejudice research differently depending on whether or not the research was conducted
by a member of a stigmatized group. Participants in this study were randomly assigned
to read one of 12 versions of an article summarizing research by Ayres and Siegelman
(1995), which showed gender and racial discrimination in price negotiations in car sales.
The content of this article was consistent across conditions, but the primary
researcher’s ethnicity, gender, and university affiliation varied across conditions.
Method
Participants
Participants were 244 people recruited from Amazon.com’s Mechanical Turk
(Mturk; http://mturk.com), a website that allows its user to request and compensate work
from other users of the site. Participants eligible to complete this study on Mturk were
those who had a previous approval rating of at least 95% (i.e., the majority of their prior
Mturk work had been compensated and deemed acceptable, rather than rejected and
deemed unacceptable, by Mturk requesters) and whose location was not India,
Pakistan, or the Philippines. Large differences in minimum wage between these
countries and the United States, as well as increasing prevalence of Mturk workers from
these countries (India in particular; see Ross, Irani, Silberman, Zaldivar, & Tomlinson,
2010) could lead to over-sampling, with workers from these countries completing tasks
before participants from other countries have the opportunity to do so.

24
Of the 244 participants who started this study on Mturk and Qualtrics, 143
completed it and 132 of those participants passed all quality checks, resulting in a
sample of 132 for analysis (54%). Participants received US$0.26 as compensation.
Design and Variables
The design of this study was a 2 (researcher ethnicity: African-American vs.
European-American) 2 (researcher gender: female vs. male) 3 (university prestige:
high vs. low vs. no information given) between-person experiment. The dependent
variables were participants’ evaluations of research quality, perceptions of researcher
credibility, and opinions regarding whether future funding and research should be
devoted to the research topic (Appendix A).
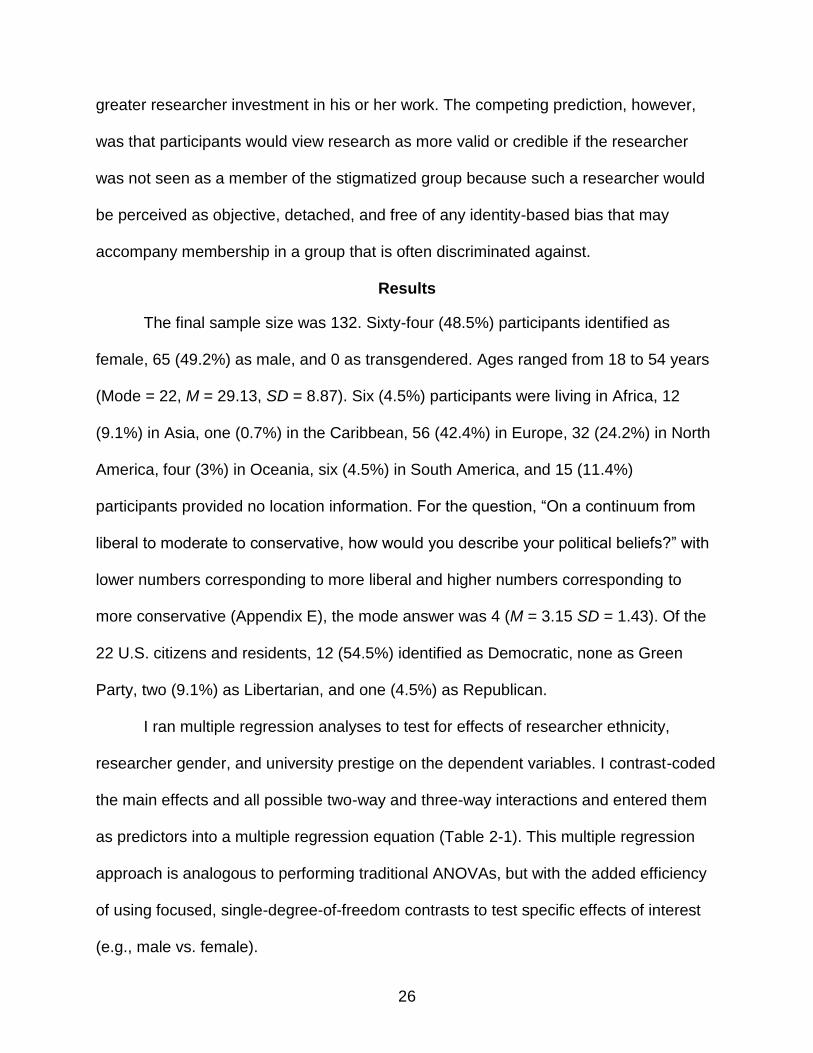
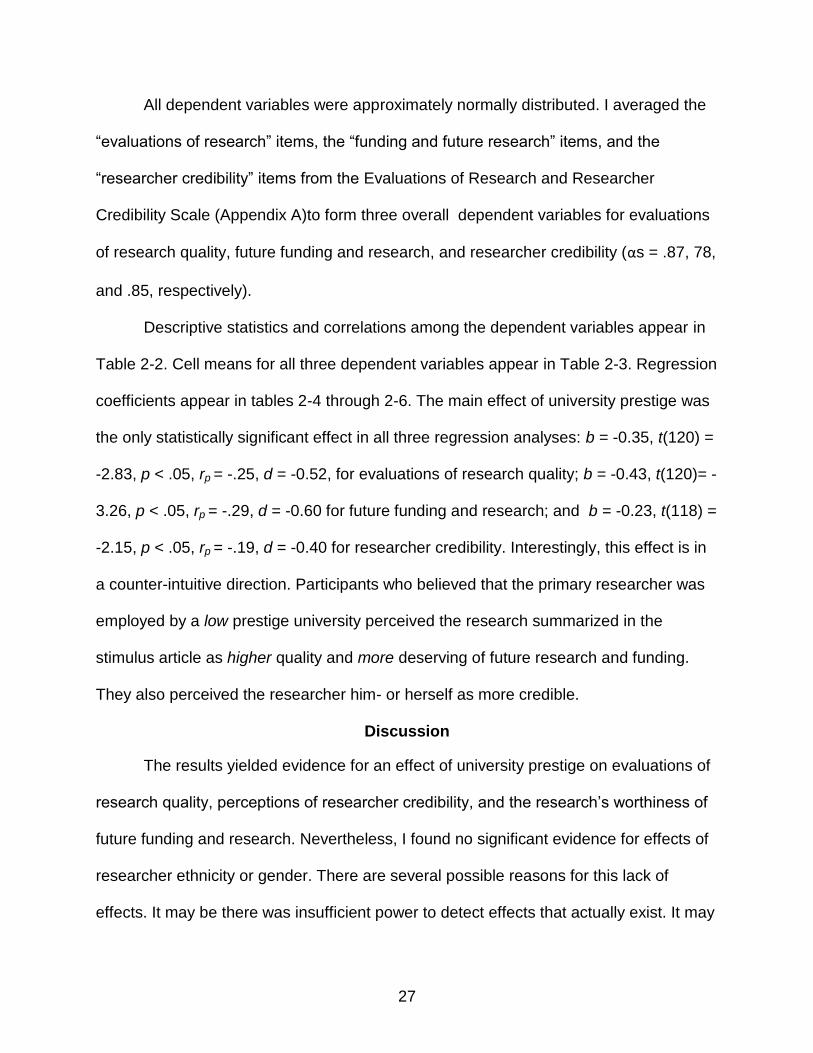
Procedure
Participants completed Study 1 over the Internet via a Qualtrics survey
(participants were redirected from the Mturk website after starting the study on Mturk).
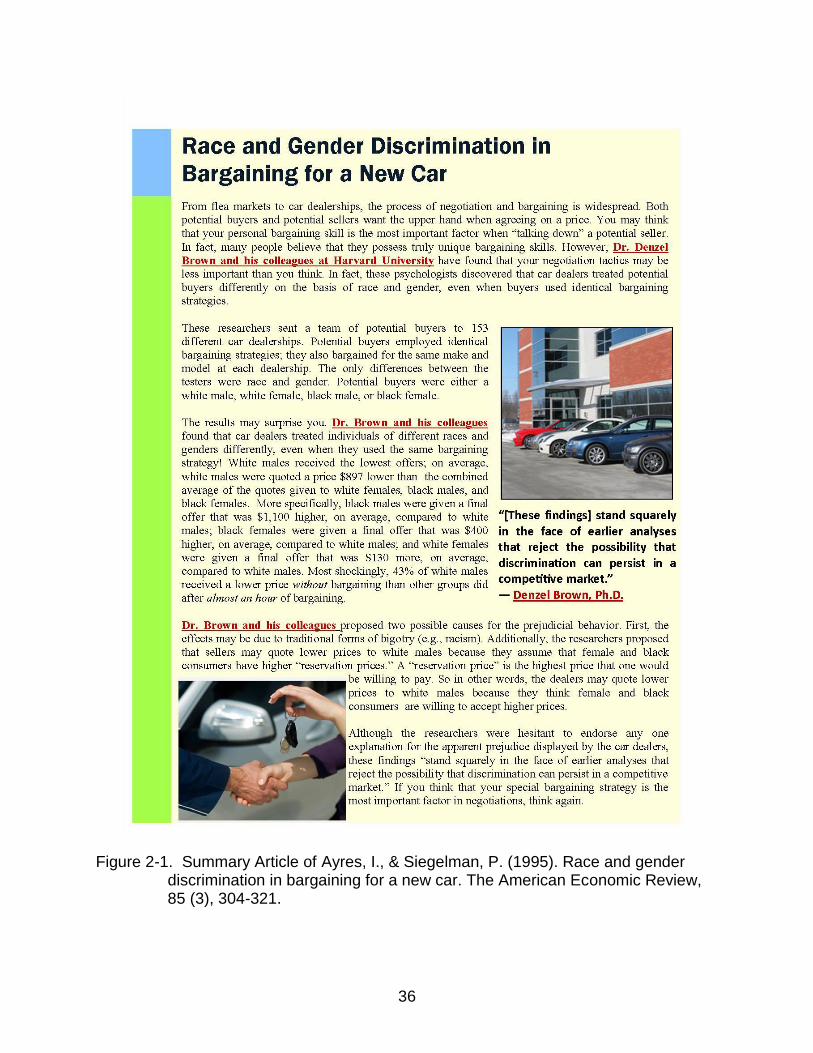
After providing consent to participate in this study, participants were presented with a
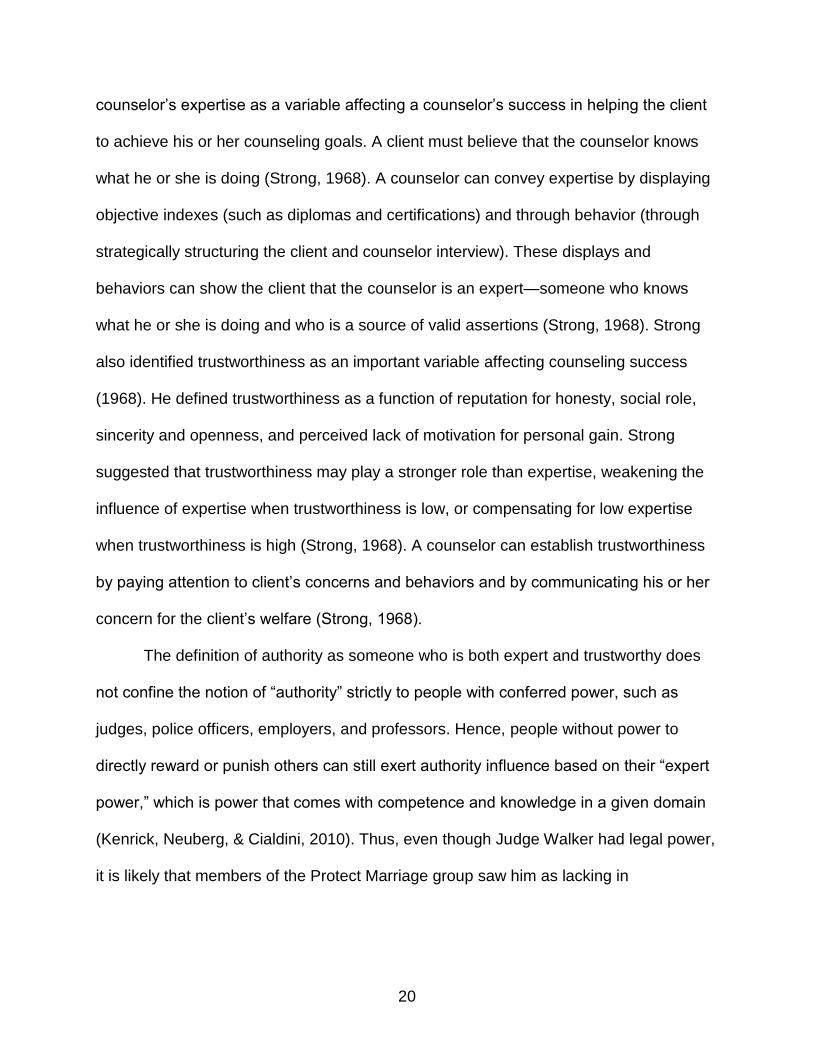
stimulus article (see Figure 2-1 for an example; red, bolded, and underlined text
indicates text that was changed per condition). This article summarized a study
examining racial and gender discrimination in car price negotiations (Ayres &
Siegelman, 1995). This article was identical across all twelve conditions except for the
ostensible primary researcher’s name and university affiliation. The name varied across
conditions to convey both researcher gender and ethnicity.
I compiled a list of first and last names from baby name websites, U.S. Census
data (1990 & 2000), and suggestions from University of Florida undergraduate students.
I then pilot-tested this list to determine which names were most strongly associated with
men, women, African-Americans, and European-Americans. Using the results of this

25
pretest, I chose the names most strongly associated with African-American men (e.g.,
Denzel Brown), African-American women (e.g., Imani Jackson), European-American
men (e.g., Charles Collins), and European-American women (e.g., Kim Smith) for use
in Study 1, with three names per condition for the purposes of stimulus sampling (Wells
& Windschitl, 1999).
Dependent Measures and Demographics
After reading the Ayres and Siegelman (1995) summary article, participants
evaluated the quality of the research itself, the credibility and trustworthiness of the
primary researcher, and the research’s worthiness of funding and future study
(Appendix A). Several of the research quality items from this scale were taken from a
study that examined whether the importance of a research topic influenced scientists’
willingness to overlook methodological flaws when reading about scientific research
(Wilson, DePaulo, Mook, & Kristen, 1993). A sample item from this scale was “How
methodologically sound or flawed would you say the design of this study is?” These
questions were interspersed with distractor items to reduce suspicion (e.g., “Would your
grandmother understand the research you just read about?”) and quality checks to
ensure participant attention (e.g., “Please select ‘4’ for this question”). Afterwards,
participants completed a demographics questionnaire (Appendix E).
Predictions
I made two competing predictions regarding the effects of researcher ethnicity
and gender. The first prediction was that participants would view prejudice research as
more valid or credible if the researcher was seen as a member of the stigmatized group
because such a researcher may be perceived as having first-hand knowledge of the
phenomenon that he or she is studying. This high personal relevance may also foster
26
greater researcher investment in his or her work. The competing prediction, however,
was that participants would view research as more valid or credible if the researcher
was not seen as a member of the stigmatized group because such a researcher would
be perceived as objective, detached, and free of any identity-based bias that may
accompany membership in a group that is often discriminated against.
Results
The final sample size was 132. Sixty-four (48.5%) participants identified as
female, 65 (49.2%) as male, and 0 as transgendered. Ages ranged from 18 to 54 years
(Mode = 22, M = 29.13, SD = 8.87). Six (4.5%) participants were living in Africa, 12
(9.1%) in Asia, one (0.7%) in the Caribbean, 56 (42.4%) in Europe, 32 (24.2%) in North
America, four (3%) in Oceania, six (4.5%) in South America, and 15 (11.4%)
participants provided no location information. For the question, “On a continuum from
liberal to moderate to conservative, how would you describe your political beliefs?” with
lower numbers corresponding to more liberal and higher numbers corresponding to
more conservative (Appendix E), the mode answer was 4 (M = 3.15 SD = 1.43). Of the
22 U.S. citizens and residents, 12 (54.5%) identified as Democratic, none as Green
Party, two (9.1%) as Libertarian, and one (4.5%) as Republican.
I ran multiple regression analyses to test for effects of researcher ethnicity,
researcher gender, and university prestige on the dependent variables. I contrast-coded
the main effects and all possible two-way and three-way interactions and entered them
as predictors into a multiple regression equation (Table 2-1). This multiple regression
approach is analogous to performing traditional ANOVAs, but with the added efficiency
of using focused, single-degree-of-freedom contrasts to test specific effects of interest
(e.g., male vs. female).
27
All dependent variables were approximately normally distributed. I averaged the
“evaluations of research” items, the “funding and future research” items, and the
“researcher credibility” items from the Evaluations of Research and Researcher
Credibility Scale (Appendix A)to form three overall dependent variables for evaluations
of research quality, future funding and research, and researcher credibility (αs = .87, 78,
and .85, respectively).
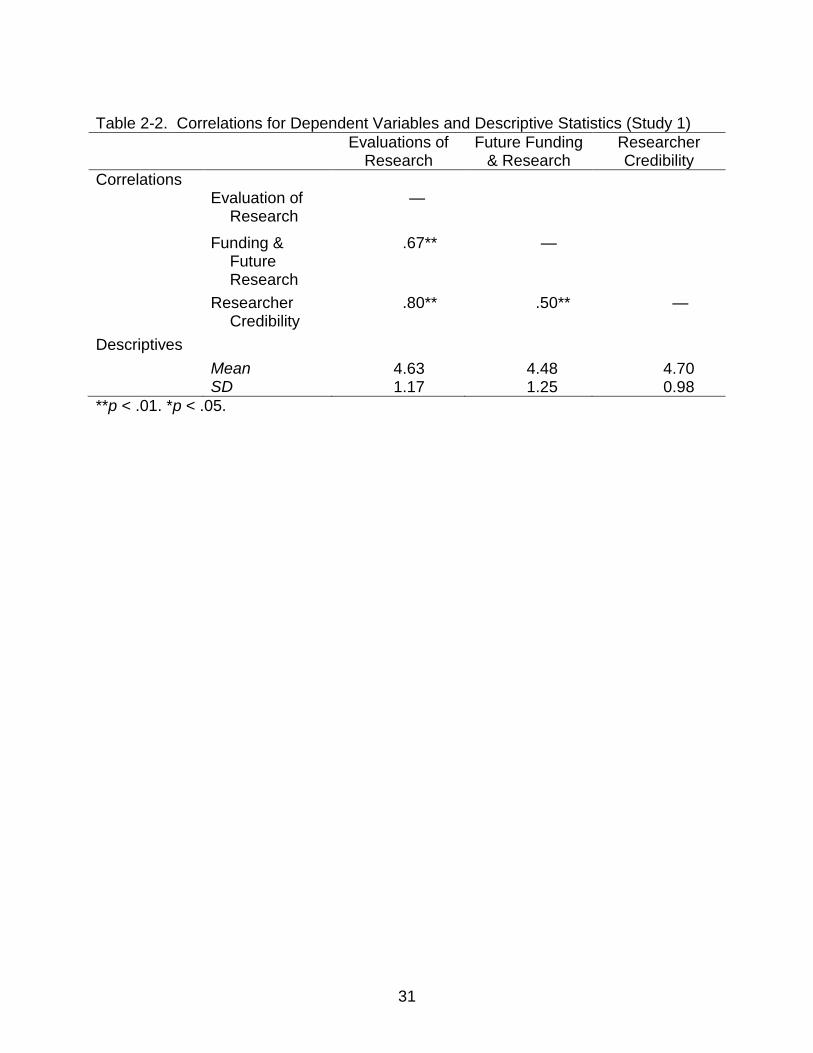
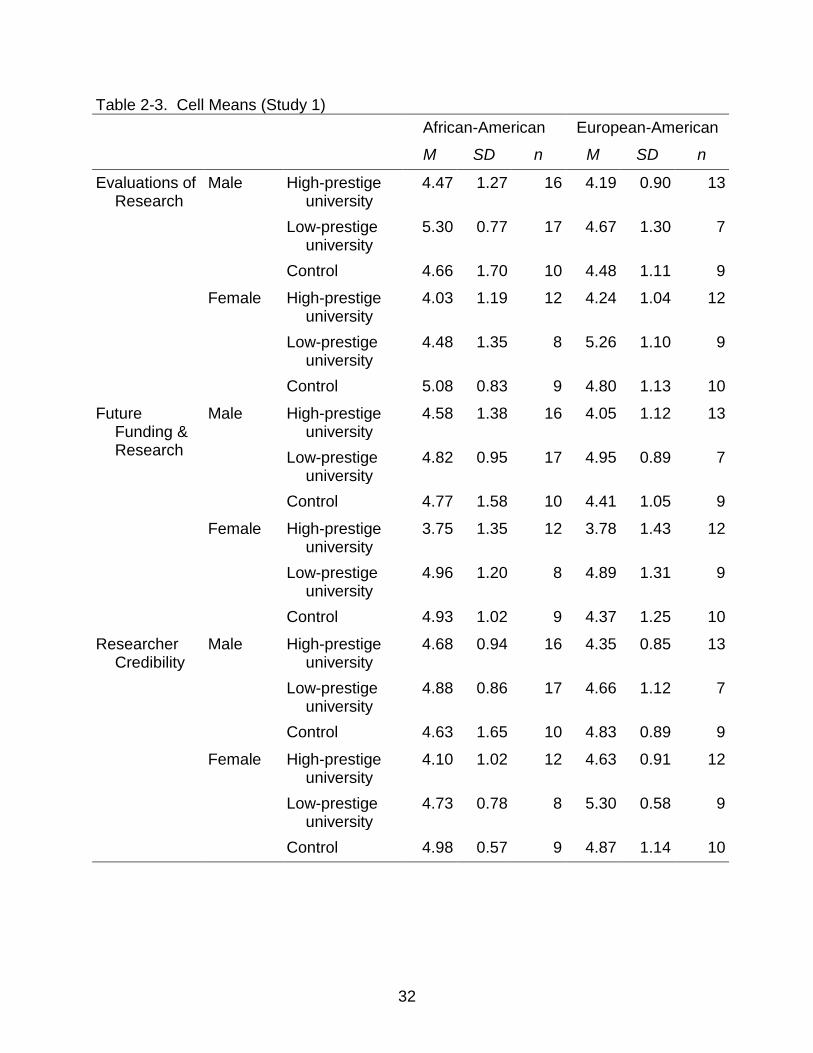
Descriptive statistics and correlations among the dependent variables appear in
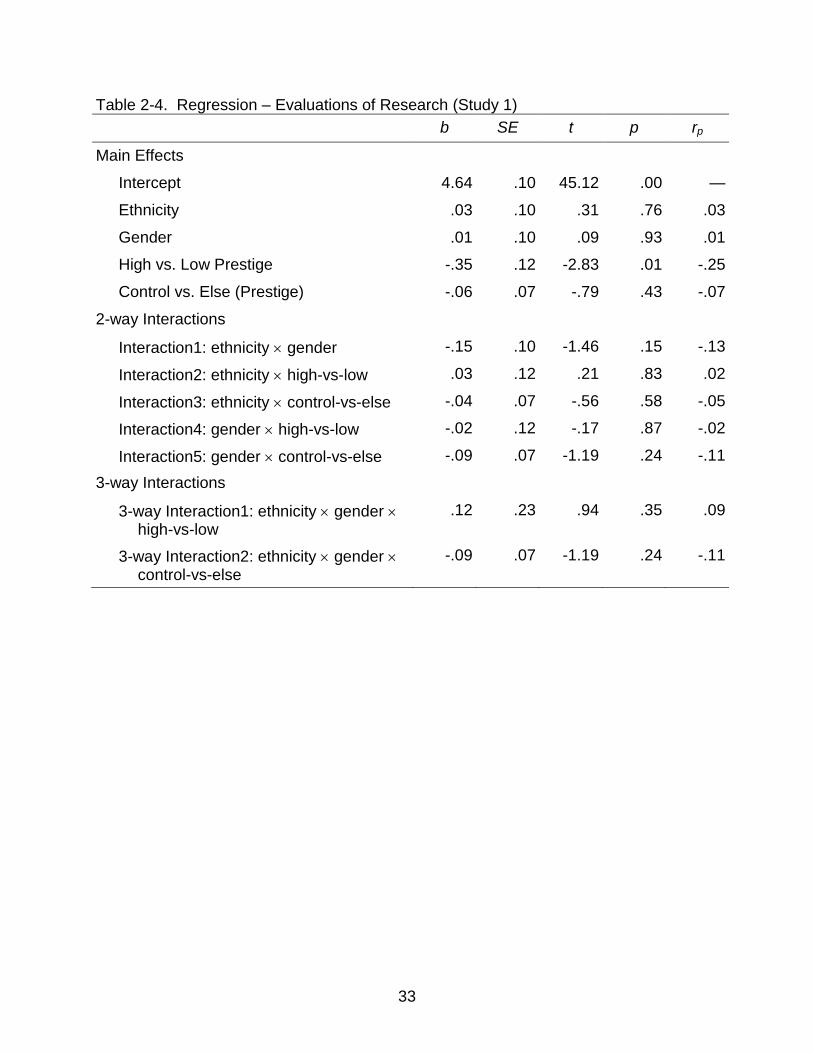
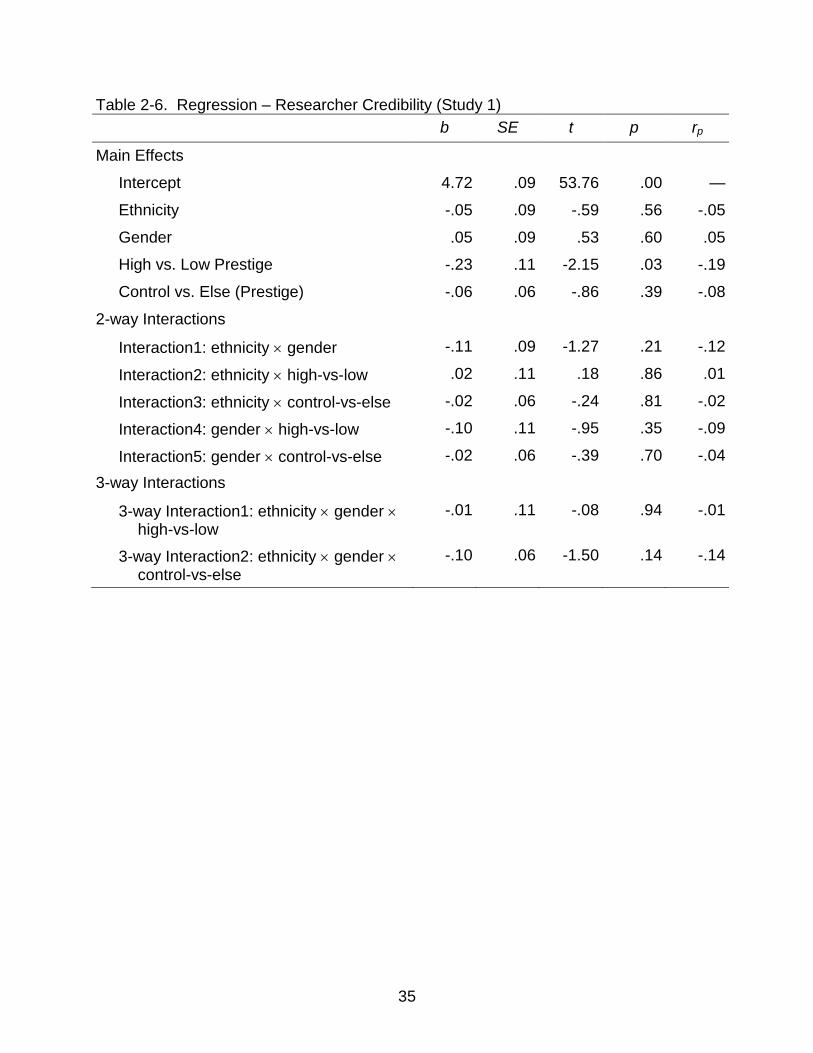
Table 2-2. Cell means for all three dependent variables appear in Table 2-3. Regression
coefficients appear in tables 2-4 through 2-6. The main effect of university prestige was
the only statistically significant effect in all three regression analyses: b = -0.35, t(120) =
-2.83, p < .05, rp = -.25, d = -0.52, for evaluations of research quality; b = -0.43, t(120)= -
3.26, p < .05, rp = -.29, d = -0.60 for future funding and research; and b = -0.23, t(118) =
-2.15, p < .05, rp = -.19, d = -0.40 for researcher credibility. Interestingly, this effect is in
a counter-intuitive direction. Participants who believed that the primary researcher was
employed by a low prestige university perceived the research summarized in the
stimulus article as higher quality and more deserving of future research and funding.
They also perceived the researcher him- or herself as more credible.
Discussion
The results yielded evidence for an effect of university prestige on evaluations of
research quality, perceptions of researcher credibility, and the research’s worthiness of
future funding and research. Nevertheless, I found no significant evidence for effects of
researcher ethnicity or gender. There are several possible reasons for this lack of
effects. It may be there was insufficient power to detect effects that actually exist. It may
28
also be that the manipulations were not meaningful to participants outside of the U.S.
and too subtle—even for U.S. participants—to produce a detectable effect. It may be
that the article was too long and detailed, causing participant fatigue and further
weakening the manipulations. It may be that the results of the Ayres and Siegelman
(1995) study were expected or easy enough to believe that participants were not
inclined to question the research or the person who conducted it, regardless of the
researcher’s race or gender. Or it may simply be that people are much more swayed by
university prestige than by personal characteristics of a researcher, such as gender and
ethnicity. As for the direction of the university affiliation main effect, it is possible that
this effect was due to a failure in stimulus sampling and negative perceptions of elitism
for the specific high-prestige universities. Although pilot testing showed that the
universities used here were considered prestigious, that prestige may not have been a
good thing in the minds of participants. At least some participants may have viewed
these specific universities as being too far-removed from “the real world” to take their
research seriously. Alternatively, some participants may view researchers from these
universities as biased liberals with an agenda, and therefore not trustworthy. These
interesting possibilities invite further study.
As for the lack of significant effects for the other independent variables, I suspect
in particular that the manipulations were too weak. Although I pre-tested the names with
North American university students, the sample for Study 1 was international, and so
was not limited to either university students or North Americans. Additionally, even if the
names did properly convey gender, ethnicity, or both, the impression that a person’s
name leaves may be fleeting, as well as too weak to overcome any initial assumptions
29
participants had formed upon reading the article title but before receiving any
information about the researchers.
In Study 2, I addressed the problem of overly subtle manipulations, an
international sample, and participant fatigue. I also more closely examined the concept
of researcher credibility. In addition to the problems of low power and weak
manipulations, it may be that any effects of researcher ethnicity and gender were
“washed out” because some participants responded one way while other participants
responded the opposite way, based on personal opinions regarding expertise. Multiple
individual difference measures may predict the direction of the effects of researcher
ethnicity and gender, but I suspected that the strongest individual difference was
perception of what constitutes a good researcher. Thus, I collected more information on
what participants prefer in a researcher—impartiality and emotional detachment, or first-
hand personal experience and relevance.

30
Table 2-1. Contrast Coding for Multiple Regression Predictors (Study 1) African-American European-American Male Female Male Female High Low Control High Low Control High Low Control High Low Control
Ethnicity -1 -1 -1 -1 -1 -1 1 1 1 1 1 1
Gender 1 1 1 -1 -1 -1 1 1 1 -1 -1 -1
High vs. Low Prestige
1 -1 0 1 -1 0 1 -1 0 1 -1 0
Control vs. Else 1 1 -2 1 1 -2 1 1 -2 1 1 -2
Interaction1: ethnicity
gender
-1 -1 -1 1 1 1 1 1 1 -1 -1 -1
Interaction2: ethnicity
high-vs-low
-1 1 0 -1 1 0 1 -1 0 1 -1 0
Interaction3: ethnicity
control-vs-else
-1 -1 2 -1 -1 2 1 1 -1 1 1 -2
Interaction4: gender
high-vs-low
1 -1 0 -1 1 0 1 -1 0 -1 1 0
Interaction5: gender
control-vs-else
1 1 -2 -1 -1 2 1 1 -2 -1 -1 2
3-way Interaction1:
ethnicity gender
high-vs-low
-1 1 0 1 -1 0 1 -1 0 -1 1 0
3-way Interaction2:
ethnicity gender
control-vs-else
-1 -1 2 1 1 -2 1 1 -2 -1 -1 2
31
Table 2-2. Correlations for Dependent Variables and Descriptive Statistics (Study 1)
Evaluations of Research
Future Funding & Research
Researcher Credibility
Correlations Evaluation of
Research —
Funding & Future Research
.67** —
Researcher Credibility
.80** .50** —
Descriptives
Mean 4.63 4.48 4.70 SD 1.17 1.25 0.98
**p < .01. *p < .05.
32
Table 2-3. Cell Means (Study 1)
African-American European-American
M SD n M SD n
Evaluations of Research
Male
High-prestige university
4.47 1.27 16 4.19 0.90 13
Low-prestige university
5.30 0.77 17 4.67 1.30 7
Control 4.66 1.70 10 4.48 1.11 9
Female High-prestige university
4.03 1.19 12 4.24 1.04 12
Low-prestige university
4.48 1.35 8 5.26 1.10 9
Control 5.08 0.83 9 4.80 1.13 10
Future Funding & Research
Male High-prestige university
4.58 1.38 16 4.05 1.12 13
Low-prestige university
4.82 0.95 17 4.95 0.89 7
Control 4.77 1.58 10 4.41 1.05 9
Female High-prestige university
3.75 1.35 12 3.78 1.43 12
Low-prestige university
4.96 1.20 8 4.89 1.31 9
Control 4.93 1.02 9 4.37 1.25 10
Researcher Credibility
Male High-prestige university
4.68 0.94 16 4.35 0.85 13
Low-prestige university
4.88 0.86 17 4.66 1.12 7
Control 4.63 1.65 10 4.83 0.89 9
Female High-prestige university
4.10 1.02 12 4.63 0.91 12
Low-prestige university
4.73 0.78 8 5.30 0.58 9
Control 4.98 0.57 9 4.87 1.14 10
33
Table 2-4. Regression – Evaluations of Research (Study 1)
b SE t p rp
Main Effects
Intercept 4.64 .10 45.12 .00 —
Ethnicity .03 .10 .31 .76 .03
Gender .01 .10 .09 .93 .01
High vs. Low Prestige -.35 .12 -2.83 .01 -.25
Control vs. Else (Prestige) -.06 .07 -.79 .43 -.07
2-way Interactions
Interaction1: ethnicity gender -.15 .10 -1.46 .15 -.13
Interaction2: ethnicity high-vs-low .03 .12 .21 .83 .02
Interaction3: ethnicity control-vs-else -.04 .07 -.56 .58 -.05
Interaction4: gender high-vs-low -.02 .12 -.17 .87 -.02
Interaction5: gender control-vs-else -.09 .07 -1.19 .24 -.11
3-way Interactions
3-way Interaction1: ethnicity gender high-vs-low
.12 .23 .94 .35 .09
3-way Interaction2: ethnicity gender control-vs-else
-.09 .07 -1.19 .24 -.11

34
Table 2-5. Regression – Funding & Future Research (Study 1)
b SE t p rp
Main Effects
Intercept 4.52 .11 40.82 .00 —
Ethnicity .11 .11 1.03 .31 .09
Gender -.08 .11 -.69 .49 -.06
High vs. Low Prestige -.43 .13 -3.26 .00 -.29
Control vs. Else (Prestige) -.05 .08 -.05 -.60 -.06
2-way Interactions
Interaction1: ethnicity gender -.01 .11 -.12 .90 -.01
Interaction2: ethnicity high-vs-low .07 .133 .53 .60 .05
Interaction3: ethnicity control-vs-else -.06 .08 -.73 .47 -.07
Interaction4: gender high-vs-low -.15 .13 -1.11 .27 -.10
Interaction5: gender control-vs-else -.05 .08 -.66 .51 -.06
3-way Interactions
3-way Interaction1: ethnicity gender high-vs-low
.10 .13 -.71 .48 -.07
3-way Interaction2: ethnicity gender control-vs-else
-.03 .08 -.40 .69 -.04
35
Table 2-6. Regression – Researcher Credibility (Study 1)
b SE t p rp
Main Effects
Intercept 4.72 .09 53.76 .00 —
Ethnicity -.05 .09 -.59 .56 -.05
Gender .05 .09 .53 .60 .05
High vs. Low Prestige -.23 .11 -2.15 .03 -.19
Control vs. Else (Prestige) -.06 .06 -.86 .39 -.08
2-way Interactions
Interaction1: ethnicity gender -.11 .09 -1.27 .21 -.12
Interaction2: ethnicity high-vs-low .02 .11 .18 .86 .01
Interaction3: ethnicity control-vs-else -.02 .06 -.24 .81 -.02
Interaction4: gender high-vs-low -.10 .11 -.95 .35 -.09
Interaction5: gender control-vs-else -.02 .06 -.39 .70 -.04
3-way Interactions
3-way Interaction1: ethnicity gender high-vs-low
-.01 .11 -.08 .94 -.01
3-way Interaction2: ethnicity gender control-vs-else
-.10 .06 -1.50 .14 -.14
36
Figure 2-1. Summary Article of Ayres, I., & Siegelman, P. (1995). Race and gender
discrimination in bargaining for a new car. The American Economic Review, 85 (3), 304-321.
37
CHAPTER 3 STUDY 2
Study 2 was conceptually similar to Study 1 but with a key addition; it delved
further into examining individual differences in opinions of expertise. In addition, Study 2
was limited to U.S. participants. Different countries may hold different stereotypes and
have different minority and stigmatized groups, so the stimuli and questions in Study 1
may not have been as relevant, resulting in weaker manipulations. Limiting Study 2’s
sample to U.S. participants increased the likelihood that the stimuli and questions were
meaningful to participants.
I also altered the stimuli in Study 2 to make the manipulation stronger. Instead of
reading a summary of the Ayres and Siegelman (1995) car negotiation study (see Study
1), participants read a summary of a gender differences meta-analysis (Petersen &
Hyde, 2010). The results of this meta-analysis supported the gender similarities
hypothesis, with the majority of gender differences yielding small effect sizes. I
suspected that while people in the U.S. are ready to believe that women and racial
minorities have historically been discriminated against regarding mechanics or sales,
many people probably think of men and women in terms of their differences rather than
similarities. Participants may therefore have been more likely to question the research
quality and researcher credibility, or at least vary in the extent to which they did so.
To further strengthen the manipulation, participants saw a photo of the supposed
researcher instead of having to infer race, gender, or other physical characteristics from
author names. Participants viewed an ostensible screenshot from a psychology
department website showcasing one of the department’s professors and some of that
professor’s research. This screenshot showed a photo of the ostensible researcher
38
accompanying a few paragraphs summarizing the gender differences meta-analysis by
Petersen and Hyde (2010). Participants then evaluated the quality of the research and
the researcher’s credibility, as they did in Study 1.
Finally, unlike Study 1, Study 2 included questions to examine what participants
believe constitutes a good researcher, and in particular, whether participants believe
that personal experience or an emotionally detached perspective is more desirable for a
research psychologist. It may be that different opinions about personal experiences
versus an emotionally detached perspective may moderate effects of researcher
characteristics on perceived quality of research or perceived researcher credibility.
Method
Participants
Participants were 360 Mturk workers. Participants eligible to complete this study
on Mturk were people who had a previous approval rating of at least 95% and whose
location was in the United States.
Of the 360 participants who began this study, 268 participants (74%) completed
it, passed all quality checks, and—for those not in the control condition—passed the
manipulation check (see “preliminary analyses” for more information). Participants
received US$1.01 as compensation.
Design and Variables
The independent variable was researcher gender (female, male, or control). The
dependent variables were participants’ evaluations of research quality, perceptions of
researcher credibility, and opinions regarding whether funding and future research
should be devoted to the research topic (Appendix A).
39
Participants were randomly assigned to view one of three website screenshots:
one that showed a picture of a man, a woman, or standard symbols for male and
female. I used optimal design (McClelland, 1997) and stimulus sampling (Wells &
Windschitl, 1999) techniques in creating stimulus materials to manipulate the
independent variable and in assigning participants to conditions. I used four female
pictures and four male pictures (Figure 3-2). Each participant’s probability of being
assigned to the female researcher, male researcher, and control condition was 0.4, 0.4,
and 0.2, respectively.
Five of the eight researcher photos were volunteered by friends, while three were
purchased from http://istockphoto.com. Because Mturk participants may have seen many
stock photos during the course of their Mturk work and general Web-browsing, photos
from http://istockphoto.com were selected to reduce the likelihood that Mturk participants
would have recognized them from another website. Two of the three stock photos had
never been purchased, while the other had been purchased only once. All three photos
had less than 150 views when purchased. All photos were cropped to show only head
and shoulders, and were set against a blue background made to resemble those used
in professional photo studios.
Procedure
Participants completed Study 2 over the Internet via a Qualtrics survey
(participants were redirected from the Mturk website after starting the study on Mturk).
After providing consent, participants saw what they believed to be a screenshot from a
university psychology department’s website. The screenshot featured a summary of the
Petersen and Hyde (2010) gender differences meta-analysis, accompanied by a picture
of the ostensible principal investigator (or in the case of the control condition, a picture
40
of gender symbols; Figure 3-2). The screenshot was identical across all conditions
except for the picture, which featured either a man, a woman, or a picture of male and
female symbols.
To increase the likelihood that participants would actually read the research
summary on the screenshot as instructed, I imposed a 30-s delay before the “next”
button would appear. This ensured that the “next” button would be available for people
who took the time to read the research summary, but would not be available for
participants who were just trying to click through the study as fast as possible. After the
30-s had elapsed, the “next” button appeared at the bottom of the screen and
participants were free to proceed to the dependent measures, individual difference
measures, and demographic questionnaire. Finally, participants were debriefed and
given a unique completion code to enter on Mturk for compensation. The debriefing
included the correct citation for the Petersen and Hyde (2010) meta-analysis.
Four quality check items were interspersed throughout the questionnaires and
scales described below (e.g., “Please select ‘4’ for this question”). Within each scale or
questionnaire, all items appeared in random order; the scales and questionnaires
themselves, however, appeared in the same order.
Dependent measures and manipulation check
After reading the research summary on the screenshot, participants completed
the primary dependent measures of interest, evaluating the quality of the research itself,
the credibility and trustworthiness of the principal investigator, and the research’s
worthiness of funding and future research (Appendix A). The items on this scale were
identical to those in Study 1, with the exception that the word “psychologist” replaced

41
“primary researcher.” Distractor items were embedded in this questionnaire to reduce
participant suspicion.
Next, participants answered the manipulation check item (“What was the gender
of the psychologist who conducted the gender differences research you just read
about?”) and two attention checks (Appendix B).
Individual difference measures
After completing the dependent measures and manipulation and attention
checks, participants completed individual difference measures. First, participants
completed questions assessing personal opinions regarding expertise (Appendix C). An
example item for this scale is “a researcher should have a lot of personal experience in
his or her chosen field of work.” This scale is scored so that higher scores indicate a
preference for experts or scientists with firsthand experience and personal relevance in
their topic of study, while lower scores indicate a preference for experts or scientists
with more emotional detachment from their topic of study. These questions formed the
primary covariate of interest in the analyses that follow.
Participants next completed the Ambivalent Sexism Inventory (Glick & Fiske,
1997; Appendix D). The Ambivalent Sexism Inventory is composed of two subscales,
benevolent sexism and hostile sexism, with eleven items for each subscale. According
to Glick and Fiske (1997), benevolent and hostile sexism are not mutually exclusive.
Hostile sexists tend to have negative feelings toward—and hold negative stereotypes
about—women who reject traditional female roles. Benevolent sexists tend to have
positive feelings toward —and hold positive stereotypes about—women who embrace
traditional female roles, such as home-makers or mothers. Benevolent sexists are not
necessarily hostile to women who reject traditional female roles, unless they are also
42
hostile sexists. An example item from the benevolent subscale is “Many women have a
quality of purity that few men possess.” An example item from the hostile subscale is
“Women are too easily offended.” Higher scores on each subscale correspond to higher
sexism.
Finally, participants provided demographic information (Appendix E) before being
debriefed and given a unique completion code to enter on Mturk for compensation.
Predictions
Predictions for Independent Variables
In Study 1, I made two competing predictions regarding the effect of researcher
personal characteristics. Study 1 yielded no significant effects of researcher race or
gender, but because these lack of effects may have resulted from problems with Study
1, I retained these two competing predictions for Study 2. Participants may view the
gender differences meta-analysis summary as more valid if they believe that the
principal investigator was a woman because they believe that being a woman may
foster greater investment in the work and allows for first-hand knowledge of gender
difference stereotypes. Conversely, participants may view the gender differences meta-
analysis summary as more valid if they believe the principal investigator to be a man
because they believe his lack of membership in a group that has historically been a
target of sexism would render him objective, detached, and free of any identity-based
bias that may accompany membership in a group that has historically been a frequent
target of sexism.
Predictions for Individual Difference Measures
In addition to addressing the question of whether a scientist’s personal
characteristics affect participants’ perceived quality and credibility of psychological
43
science and scientists, another major purpose of this study was to examine the effect of
individual differences in opinions regarding expertise. I predicted that individual
differences in opinions regarding expertise (Appendix C) would moderate the effect of
researcher gender in this study. Specifically, participants who value personal relevance
and firsthand experience in a scientist should view the research and researcher as
especially credible if the researcher is a woman (for the same reasons listed above). On
the other hand, participants who value detachment in a scientist should view the
research and researcher as especially credible when the researcher is a man.
Glick and Fiske (1996) provided evidence for two related but distinct dimensions
of sexism in their Ambivalent Sexism Inventory (ASI): hostile sexism and benevolent
sexism. Hence, I made separate predictions for the hostile and benevolent subscales of
the ASI. I predicted that participants who were high in the hostile sexism subscale of the
Ambivalent Sexism Inventory would view the research and researcher especially
negatively if the researcher was a woman, due to hostile sexists’ negative perceptions
of women who reject traditional female roles. Benevolent sexists have positive
perceptions of women who embrace traditional female roles, but may or may not have
negative perceptions of women who reject traditional roles. To the extent that
benevolent sexists may also be hostile sexists, it is possible that benevolent sexist
participants would view the research and researcher especially negatively when the
researcher was thought to be a woman (i.e., benevolent sexists may respond like
hostile sexists). On the other hand, benevolent sexists may have positive feelings
toward and stereotypes about women in general; therefore, it is possible that
benevolent sexists would view the research and researcher as especially credible if they
44
believed the researcher to be a woman. Therefore, I made no specific predictions about
the direction of effect for benevolent sexism. Note, however, that a person can be high
in both hostile and benevolent sexism (meaning he or she is high in ambivalent sexism),
so it is possible that effects of the hostile and benevolent subscales would be obscured
by ambivalent sexism. I therefore made no specific predictions about the total score
(i.e., ambivalent sexism) on the Ambivalent Sexism Inventory.
Results
Although 360 participants were recruited and paid on Mturk, the final sample size
for analysis was 268 (74%). Participants who did not provide unique, matching
completion codes on Mturk and Qualtrics were excluded from the analysis to ensure
that all data analyzed came from participants who had been compensated. Participants
who did not correctly answer all four quality-check items were excluded from data
analyses (Appendix B). Finally, participants who did not correctly answer the
manipulation check item as “male” in the male researcher condition and “female” in the
female researcher condition were excluded from analyses. An option for “not sure” was
allowed on the manipulation check item, but to allow for the possibility that participants
would try to guess a researcher gender even if they were in the control condition
(thinking they may have accidentally skipped this information while reading the research
summary), control condition participants who gave any answer to this question were
included in the data analyses.
I designed Study 2 so that each participant’s probability of being assigned to the
female researcher, male researcher, and control conditions were 0.4, 0.4, and 0.2,
respectively; with no participation exclusion this would result in cell sizes of 144 for the
experimental conditions (both 40% of the total sample size) and 72 for the control

45
condition (20% of the total sample size). The actual cell sizes were 93 for the female
researcher condition (34.7%), 108 for the male researcher condition (40.3%), and 67 for
the control condition (25%). Although this deviation is not ideal, the probability of
random assignment producing exactly the desired cell sizes in a given study is low due
to error variance. The exclusion of participants also contributed to this deviation
because of the more stringent manipulation check requirements for the experimental
conditions. I made this manipulation check restriction before analyzing the data.
Of the 268 participants, 144 (53.7%) identified as female, 119 (44.4%) as male,
three (1%) as transgendered, and two (0.7%) did not provide gender information.
Participants’ ages ranged from 18 to 73 years (Modes = 21 and 26, M = 34.46, SD =
12.59). For the question, “On a continuum from liberal to moderate to conservative, how
would you describe your political beliefs?” with lower numbers corresponding to more
liberal and higher numbers corresponding to more conservative (Appendix E), the mode
answer was 2, (M = 3.22 and SD = 1.63). One hundred thirty-five (50.4%) participants
identified as Democratic, 10 (3.7%) as Green Party, 20 (7.5%) as Libertarian, 41
(15.3%) as Republican, and 62 (23.1%) as “other/no party affiliation” (Appendix E).
Data Preparation and Preliminary Analyses
I averaged the “evaluations of research” items, “funding and future research”
items, and “researcher credibility” items from the Evaluations of Research and
Researcher Credibility Scale (Appendix A) to form three overall dependent variables for
evaluations of research quality, funding and future research, and researcher credibility
(αs = .87, .80, and .87, respectively). Visual inspection of frequency histograms for the
overall dependent variables revealed that they were approximately normally distributed.
46
Items from the What Constitutes an Expert scale (Appendix C) yielded a
Cronbach’s α of .49. I conducted a confirmatory factor analysis in Amos Graphics
(version 18) to test whether the items on this scale loaded on a single “expertise” factor.
Figure 3-3 shows the proposed factor structure and item loadings. Squared multiple
correlations appear in Table 3-1. None of the items loaded significantly on the expertise
factor, though five of the loadings were greater than .40. Three of the eight items on this
scale, Items 1, 2, and 7, had especially weak loadings (.03, -.13, and .11, respectively).
The fit of this model was poor, χ2(20) = 101.15, p < .05 (Table 3-2). I conducted a
second confirmatory factor analysis, dropping items 1, 2, and 7. Figure 3-4 shows the
new proposed factor structure and item loadings. Squared multiple correlations appear
in Table 3-1. All items now loaded significantly on the factor and fit indices met
goodness-of-fit criteria (Table 3-2). Because the five-item expertise factor model
showed acceptable fit, those five items in the What Constitutes an Expert scale were
combined to form an overall questions of what constitutes an expert covariate (WCE).
This new scale yielded a Cronbach’s α of .65 and a mean inter-item correlation (MIC) of
.28. While the alpha for the WCE scale is lower than for the other scales, the WCE
scale had the fewest items. Because coefficient alpha is a function of both MIC and
number of items (holding MIC constant, alpha increases as items increase; Schmitt,
1996), a five-item scale with an alpha of .65 and a moderate MIC of .28 is adequate.
Indeed, a 10-item scale with the same MIC of .28 would yield an alpha of .80. Visual
inspection of the frequency histogram for the WCE covariate revealed that it was
approximately normally distributed.
47
Because of Glick and Fiske’s (1996) data supporting hostile and benevolent
sexism as related but separate factors and because of my different predictions for the
hostile and benevolent subscales of the Ambivalent Sexism Inventory (ASI), I analyzed
the hostile and benevolent items from the ASI separately. Items from the benevolent
subscale of the ASI (Appendix D) yielded a Cronbach’s α of .89 and were combined to
form an overall benevolent sexism covariate (ASI-benevolent). Visual inspection of the
frequency histogram for ASI-benevolent revealed that it was approximately normally
distributed.
The 11 items from the hostile subscale of the Ambivalent Sexism Inventory
yielded a Cronbach’s α of .91 and were combined to form an overall hostile sexism
covariate (ASI-hostile). Visual inspection of the frequency histogram for ASI-hostile
revealed that it was approximately normally distributed.
Descriptive statistics and correlations among the dependent variables and
covariates appear in Table 3-4. Cell means for the dependent variables appear in Table
3-5.
Main Analyses
I collapsed across the four female researcher photos for the female researcher
condition and collapsed across the four male researcher photos for the male researcher
condition. I then used multiple regression analysis to test for effects of researcher
gender. A potential problem with this collapsing across photos is that it ignores stimuli
nesting in the study design, with participants nested within photos, which are in turn
nested within broader categories of male and female faces. If individual photos account
for variance, then collapsing across photos may result in p-values that are spuriously
small for any effects involving researcher gender; in other words, collapsing across
48
photos and analyzing with multiple regression may be an overly liberal analysis method.
Analyzing these data with multi-level modeling would account for the nesting problem.
However, a multi-level modeling approach would present other problems. For example,
while the male and female photos were stimulus sampled so that there were multiple
photos nested within each category, the control condition was not stimulus sampled,
and so there was only one control image nested with the control category. Additionally,
the level-2 sample size in a multi-level model would be nine (eight faces, plus one
control condition image), and p-values based on only nine observations may be too
conservative.
In any case, I conducted a regression analysis for each dependent variable,
using photo as the unit of analysis (not collapsing across any photos). There were no
gender effects for research quality, funding and future research, or researcher credibility
dependent variables; however, because only eight photos were used, these tests were
woefully underpowered. Thus, we moved forward with testing participants as the unit of
analysis.
Using participants as the unit of analysis, I ran multiple regression analyses to
test for effects of researcher gender. The comparisons of (a) male versus female
researcher and (b) control versus the average of male and female were contrast-coded
and entered as predictors into a multiple regression equation (Table 3-3). Regression
coefficients for these effects appear in Tables 3-6 through 3-17. For the purposes of this
dissertation, the male-versus-female researcher contrast is the most important, but the
control-versus-else contrast is necessary for the primary contrast to be interpretable.
Further, this contrast accounts for error variance and allows the regression results to be
49
analogous to results from a traditional AN(C)OVA. This multiple regression approach
has the added efficiency of using focused, single-degree-of-freedom tests to assess
specific effects of interest (e.g., male vs. female).
In the first step of each regression analysis, I entered the gender comparisons as
predictors into the regression equation. In the second step, I mean-centered the
covariate (either the What Constitutes an Expert scale, the benevolent subscale of the
Ambivalent Sexism Inventory, or the hostile subscale of the Ambivalent Sexism
Inventory) and entered it into the regression equation. In the third step, I entered the
gender covariate interactions (male-vs.-female covariate, control-vs.-else
covariate) into the regression equation.
Dependent variable: evaluations of research quality
Main effect and WCE covariate. There were no significant main effects of
gender on the evaluations of research quality dependent variable. When I entered the
WCE covariate into the model in Step 2, the effect of the covariate was significant, b =
0.33, t(264)= 4.86, p < .05, rp = .29. As WCE scores increased, so did perceived quality
of the research presented in the gender differences meta-analysis summary. Thus,
participants who valued personal relevance more than emotional detachment rated the
research as higher quality. When I entered the WCE gender interactions into the
regression model in Step 3, the covariate effect was again significant (b = 0.30, t(262)=
4.25, p < .05, rp = .25) along with a female-vs.-male WCE interaction (b = 0.19, t(262)
= 2.41, p < .05, rp = .15, d = 0.30; Figure 3-5).
A simple effects test revealed that for participants who scored relatively low (by
convention, 1 SD below the mean; see Aiken & West, 1991) on the WCE, those in the

50
male researcher condition rated the research as lower in quality, b = -0.24, t(262)= -
2.11, p < .05, rp = -.13, d = -0,26. For participants who scored relatively high on the
WCE, however, ratings of male and female researchers did not differ significantly. In
other words, people who valued emotional detachment in an expert rated research
ostensibly conducted by a man as lower in quality, while participants who valued
firsthand experience in an expert did not differ according to researcher gender in their
research quality ratings (see Figure 3-5).
A simple effects test for the WCE covariate showed that, for participants in the
male researcher condition, ratings of the research quality increased along with
participant score on the WCE covariate, b = 0.45, t(262)= 4.73, p < .05, rp = .15, d =
0.58. This covariate simple effect was not significant for the female researcher
condition. In other words, the more participants valued firsthand experience in a
researcher, the greater they perceived quality of the research, but only when they
believed the research had been conducted by a man.
Benevolent sexism covariate. In a separate regression analysis (still using
evaluations of research quality as the dependent variable), I entered ASI-benevolent
into the model in Step 2. There were no significant effects, but there was a marginally
significant main effect for the covariate with a small effect size, b = -0.14, t(264)= -1.81,
p = .07, rp = -.11. As benevolent sexism increased, perceptions of research quality
decreased (though again, this effect was not statistically significant). When I entered the
ASI-benevolent gender interactions into the regression model in Step 3, results
showed no significant effects. The marginally significant covariate effect from Step 2
decreased in significance and effect size, b = -0.12, t(262)= -1.61, p = .11, rp = -.10.

51
Hostile sexism covariate. In a separate regression analysis, I entered ASI-
hostile into the model in Step 2. The hostile sexism covariate effect was significant, b = -
0.25, t(264)= -3.23, p < .05, rp = -.20. As hostile sexism increased, perceptions of
research quality decreased. When I entered the ASI-hostile gender into the regression
model in Step 3, the covariate effect was again significant (b = -0.22, t(262)= -2.88, p <
.05, rp = -.18).The ASI-hostile control-vs.-else interaction was also significant, b =
0.13, t(262)= 2.41, p < .05, rp = .15, d = 0.30 (Figure 3-6).
A simple effects test revealed that, for participants low on hostile sexism, ratings
of research quality were higher in experimental conditions than in the control condition,
b = -0.18, t(262)= -2.57, p < .05, rp = -.16, d = -0.32. For participants high on hostile
sexism, however, ratings of research quality did not differ between experimental and
control conditions. In other words, for participants low on hostile sexism, the gender
differences research summary was perceived as higher quality when it was
accompanied by a picture of the researcher (regardless of researcher gender),
compared to when the research summary was accompanied by a picture of the
standard gender symbols (when no researcher gender information was given).
Participants high in hostile sexism did not show this difference (Figure 3-6).
A simple effects test for the ASI-hostile covariate revealed that, for experimental
conditions only, ratings of research quality decreased as hostile sexism increased, b = -
0.35, t(262)= -4.02, p < .05, rp = -.24, d = -0.50.
Participant gender covariate. Although I made no predictions about participant
gender, I tested the participant gender main effects as well as the participant gender
researcher gender interactions for all three dependent variables. (Participants who
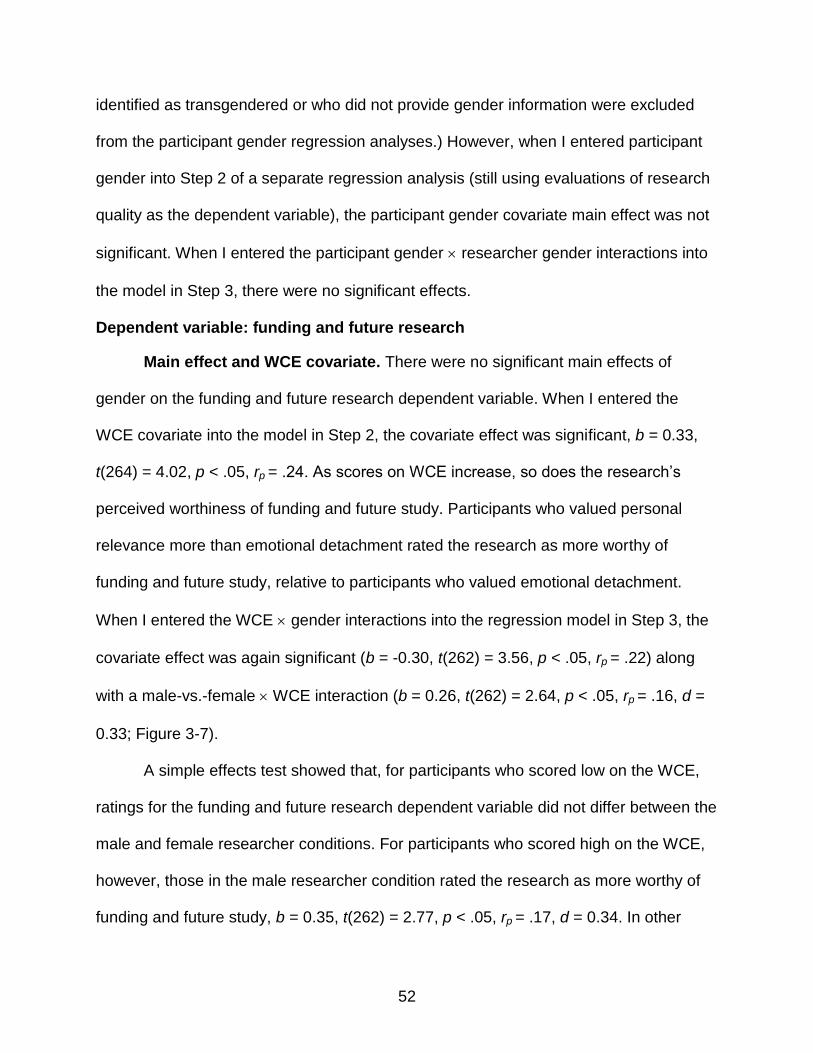
52
identified as transgendered or who did not provide gender information were excluded
from the participant gender regression analyses.) However, when I entered participant
gender into Step 2 of a separate regression analysis (still using evaluations of research
quality as the dependent variable), the participant gender covariate main effect was not
significant. When I entered the participant gender researcher gender interactions into
the model in Step 3, there were no significant effects.
Dependent variable: funding and future research
Main effect and WCE covariate. There were no significant main effects of
gender on the funding and future research dependent variable. When I entered the
WCE covariate into the model in Step 2, the covariate effect was significant, b = 0.33,
t(264) = 4.02, p < .05, rp = .24. As scores on WCE increase, so does the research’s
perceived worthiness of funding and future study. Participants who valued personal
relevance more than emotional detachment rated the research as more worthy of
funding and future study, relative to participants who valued emotional detachment.
When I entered the WCE gender interactions into the regression model in Step 3, the
covariate effect was again significant (b = -0.30, t(262) = 3.56, p < .05, rp = .22) along
with a male-vs.-female WCE interaction (b = 0.26, t(262) = 2.64, p < .05, rp = .16, d =
0.33; Figure 3-7).
A simple effects test showed that, for participants who scored low on the WCE,
ratings for the funding and future research dependent variable did not differ between the
male and female researcher conditions. For participants who scored high on the WCE,
however, those in the male researcher condition rated the research as more worthy of
funding and future study, b = 0.35, t(262) = 2.77, p < .05, rp = .17, d = 0.34. In other
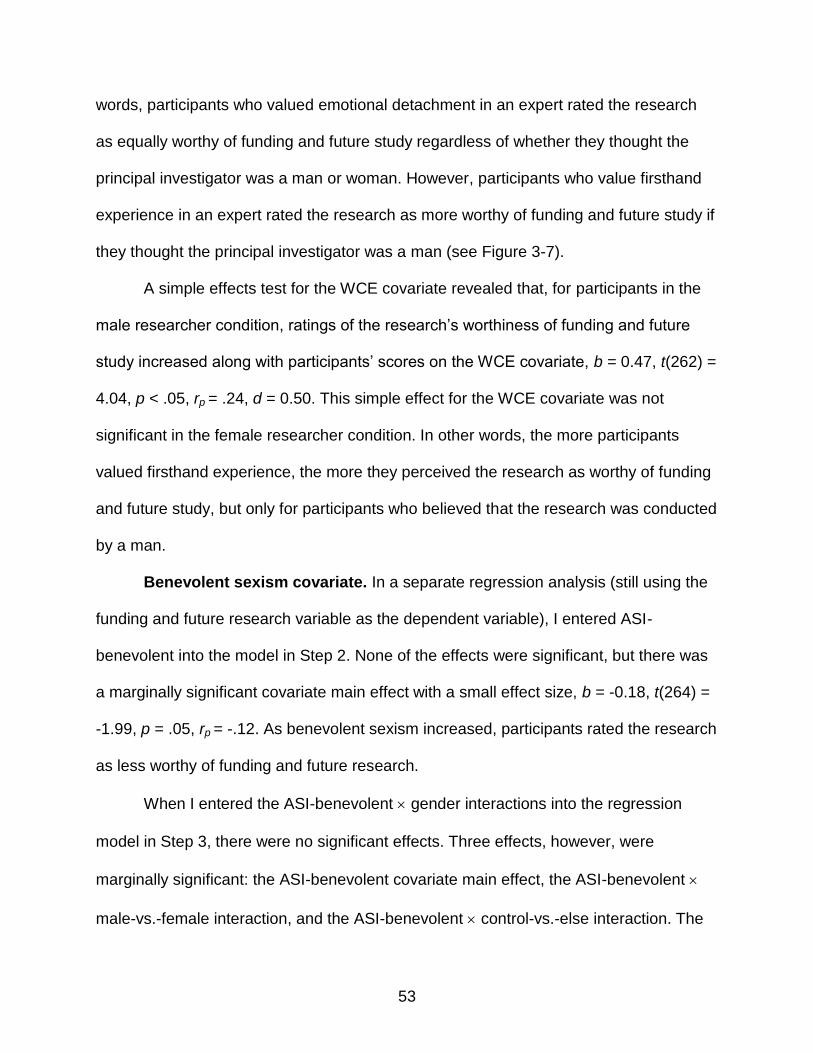
53
words, participants who valued emotional detachment in an expert rated the research
as equally worthy of funding and future study regardless of whether they thought the
principal investigator was a man or woman. However, participants who value firsthand
experience in an expert rated the research as more worthy of funding and future study if
they thought the principal investigator was a man (see Figure 3-7).
A simple effects test for the WCE covariate revealed that, for participants in the
male researcher condition, ratings of the research’s worthiness of funding and future
study increased along with participants’ scores on the WCE covariate, b = 0.47, t(262) =
4.04, p < .05, rp = .24, d = 0.50. This simple effect for the WCE covariate was not
significant in the female researcher condition. In other words, the more participants
valued firsthand experience, the more they perceived the research as worthy of funding
and future study, but only for participants who believed that the research was conducted
by a man.
Benevolent sexism covariate. In a separate regression analysis (still using the
funding and future research variable as the dependent variable), I entered ASI-
benevolent into the model in Step 2. None of the effects were significant, but there was
a marginally significant covariate main effect with a small effect size, b = -0.18, t(264) =
-1.99, p = .05, rp = -.12. As benevolent sexism increased, participants rated the research
as less worthy of funding and future research.
When I entered the ASI-benevolent gender interactions into the regression
model in Step 3, there were no significant effects. Three effects, however, were
marginally significant: the ASI-benevolent covariate main effect, the ASI-benevolent
male-vs.-female interaction, and the ASI-benevolent control-vs.-else interaction. The
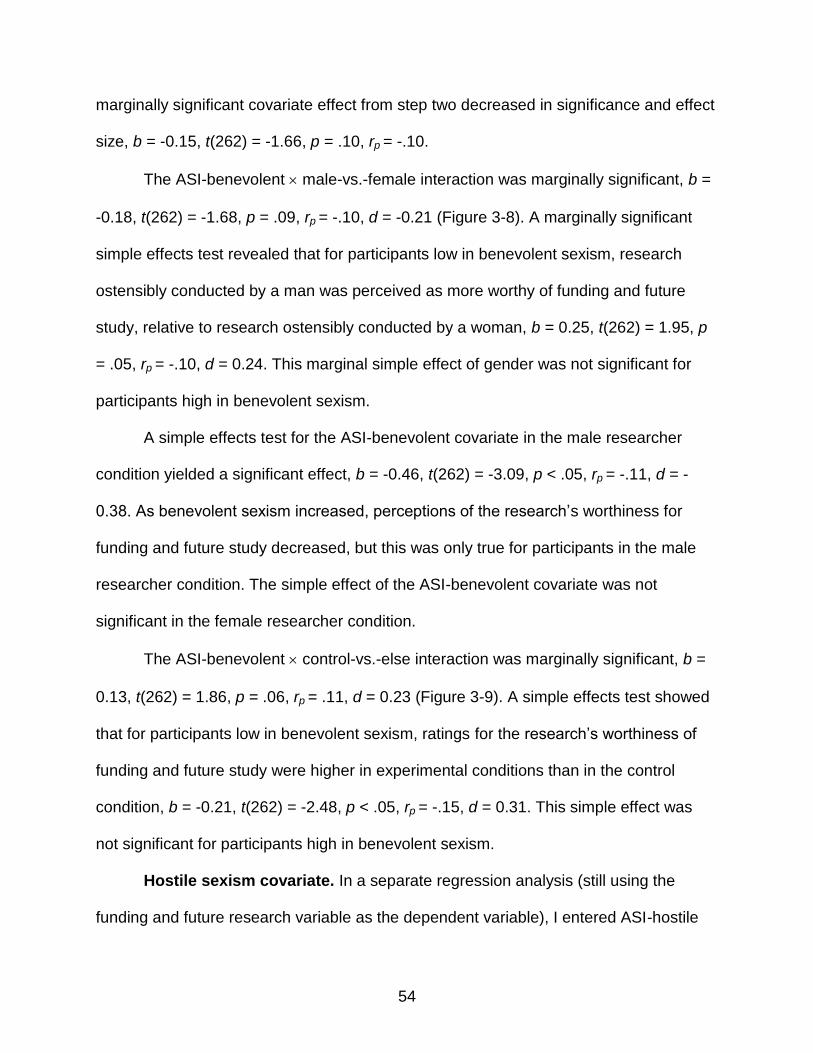
54
marginally significant covariate effect from step two decreased in significance and effect
size, b = -0.15, t(262) = -1.66, p = .10, rp = -.10.
The ASI-benevolent male-vs.-female interaction was marginally significant, b =
-0.18, t(262) = -1.68, p = .09, rp = -.10, d = -0.21 (Figure 3-8). A marginally significant
simple effects test revealed that for participants low in benevolent sexism, research
ostensibly conducted by a man was perceived as more worthy of funding and future
study, relative to research ostensibly conducted by a woman, b = 0.25, t(262) = 1.95, p
= .05, rp = -.10, d = 0.24. This marginal simple effect of gender was not significant for
participants high in benevolent sexism.
A simple effects test for the ASI-benevolent covariate in the male researcher
condition yielded a significant effect, b = -0.46, t(262) = -3.09, p < .05, rp = -.11, d = -
0.38. As benevolent sexism increased, perceptions of the research’s worthiness for
funding and future study decreased, but this was only true for participants in the male
researcher condition. The simple effect of the ASI-benevolent covariate was not
significant in the female researcher condition.
The ASI-benevolent control-vs.-else interaction was marginally significant, b =
0.13, t(262) = 1.86, p = .06, rp = .11, d = 0.23 (Figure 3-9). A simple effects test showed
that for participants low in benevolent sexism, ratings for the research’s worthiness of
funding and future study were higher in experimental conditions than in the control
condition, b = -0.21, t(262) = -2.48, p < .05, rp = -.15, d = 0.31. This simple effect was
not significant for participants high in benevolent sexism.
Hostile sexism covariate. In a separate regression analysis (still using the
funding and future research variable as the dependent variable), I entered ASI-hostile
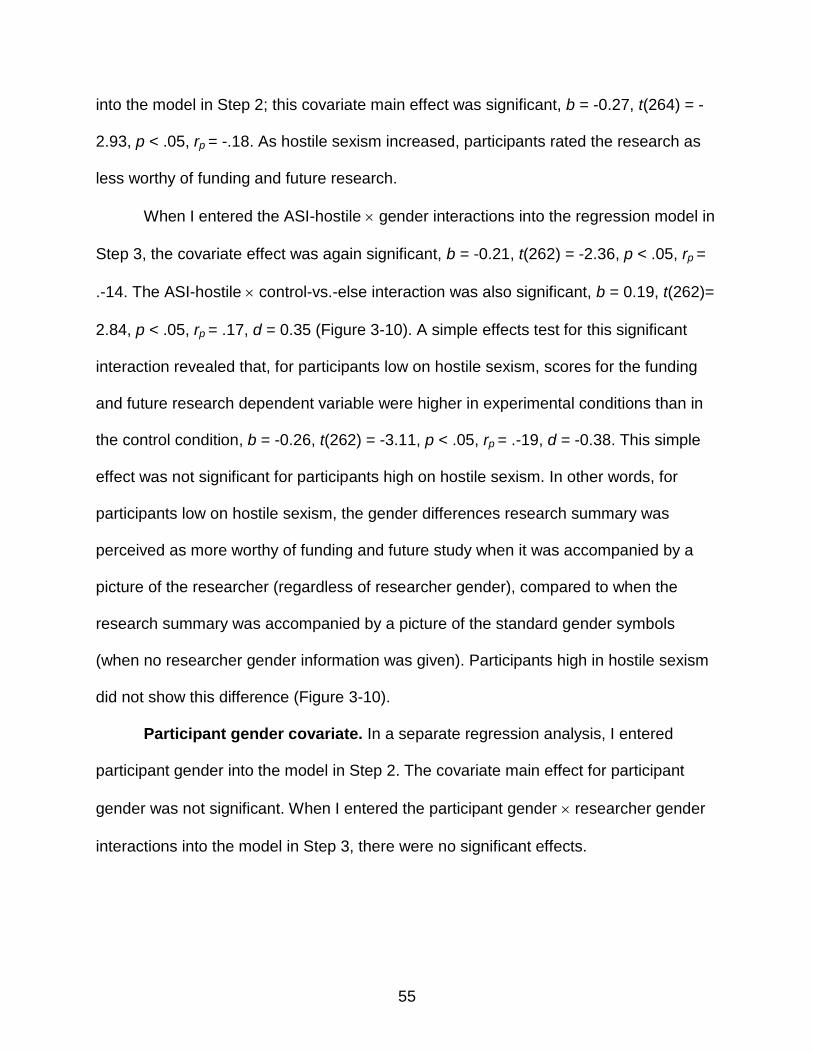
55
into the model in Step 2; this covariate main effect was significant, b = -0.27, t(264) = -
2.93, p < .05, rp = -.18. As hostile sexism increased, participants rated the research as
less worthy of funding and future research.
When I entered the ASI-hostile gender interactions into the regression model in
Step 3, the covariate effect was again significant, b = -0.21, t(262) = -2.36, p < .05, rp =
.-14. The ASI-hostile control-vs.-else interaction was also significant, b = 0.19, t(262)=
2.84, p < .05, rp = .17, d = 0.35 (Figure 3-10). A simple effects test for this significant
interaction revealed that, for participants low on hostile sexism, scores for the funding
and future research dependent variable were higher in experimental conditions than in
the control condition, b = -0.26, t(262) = -3.11, p < .05, rp = .-19, d = -0.38. This simple
effect was not significant for participants high on hostile sexism. In other words, for
participants low on hostile sexism, the gender differences research summary was
perceived as more worthy of funding and future study when it was accompanied by a
picture of the researcher (regardless of researcher gender), compared to when the
research summary was accompanied by a picture of the standard gender symbols
(when no researcher gender information was given). Participants high in hostile sexism
did not show this difference (Figure 3-10).
Participant gender covariate. In a separate regression analysis, I entered
participant gender into the model in Step 2. The covariate main effect for participant
gender was not significant. When I entered the participant gender researcher gender
interactions into the model in Step 3, there were no significant effects.
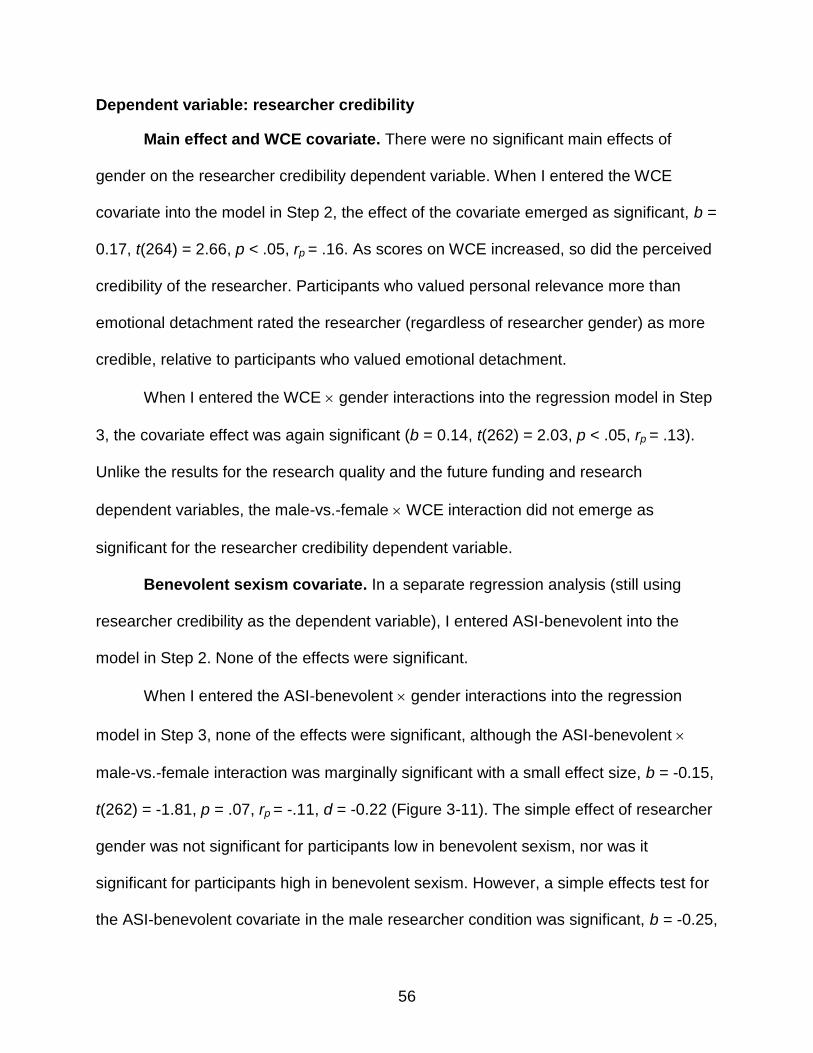
56
Dependent variable: researcher credibility
Main effect and WCE covariate. There were no significant main effects of
gender on the researcher credibility dependent variable. When I entered the WCE
covariate into the model in Step 2, the effect of the covariate emerged as significant, b =
0.17, t(264) = 2.66, p < .05, rp = .16. As scores on WCE increased, so did the perceived
credibility of the researcher. Participants who valued personal relevance more than
emotional detachment rated the researcher (regardless of researcher gender) as more
credible, relative to participants who valued emotional detachment.
When I entered the WCE gender interactions into the regression model in Step
3, the covariate effect was again significant (b = 0.14, t(262) = 2.03, p < .05, rp = .13).
Unlike the results for the research quality and the future funding and research
dependent variables, the male-vs.-female WCE interaction did not emerge as
significant for the researcher credibility dependent variable.
Benevolent sexism covariate. In a separate regression analysis (still using
researcher credibility as the dependent variable), I entered ASI-benevolent into the
model in Step 2. None of the effects were significant.
When I entered the ASI-benevolent gender interactions into the regression
model in Step 3, none of the effects were significant, although the ASI-benevolent
male-vs.-female interaction was marginally significant with a small effect size, b = -0.15,
t(262) = -1.81, p = .07, rp = -.11, d = -0.22 (Figure 3-11). The simple effect of researcher
gender was not significant for participants low in benevolent sexism, nor was it
significant for participants high in benevolent sexism. However, a simple effects test for
the ASI-benevolent covariate in the male researcher condition was significant, b = -0.25,
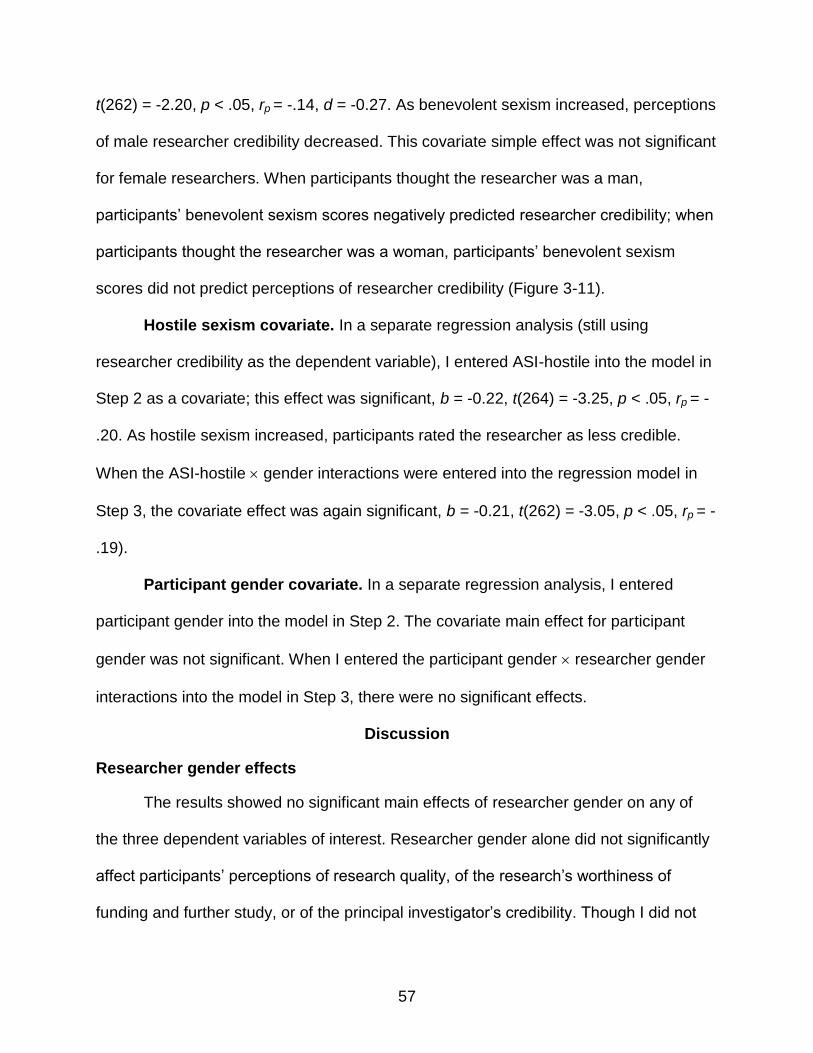
57
t(262) = -2.20, p < .05, rp = -.14, d = -0.27. As benevolent sexism increased, perceptions
of male researcher credibility decreased. This covariate simple effect was not significant
for female researchers. When participants thought the researcher was a man,
participants’ benevolent sexism scores negatively predicted researcher credibility; when
participants thought the researcher was a woman, participants’ benevolent sexism
scores did not predict perceptions of researcher credibility (Figure 3-11).
Hostile sexism covariate. In a separate regression analysis (still using
researcher credibility as the dependent variable), I entered ASI-hostile into the model in
Step 2 as a covariate; this effect was significant, b = -0.22, t(264) = -3.25, p < .05, rp = -
.20. As hostile sexism increased, participants rated the researcher as less credible.
When the ASI-hostile gender interactions were entered into the regression model in
Step 3, the covariate effect was again significant, b = -0.21, t(262) = -3.05, p < .05, rp = -
.19).
Participant gender covariate. In a separate regression analysis, I entered
participant gender into the model in Step 2. The covariate main effect for participant
gender was not significant. When I entered the participant gender researcher gender
interactions into the model in Step 3, there were no significant effects.
Discussion
Researcher gender effects
The results showed no significant main effects of researcher gender on any of
the three dependent variables of interest. Researcher gender alone did not significantly
affect participants’ perceptions of research quality, of the research’s worthiness of
funding and further study, or of the principal investigator’s credibility. Though I did not
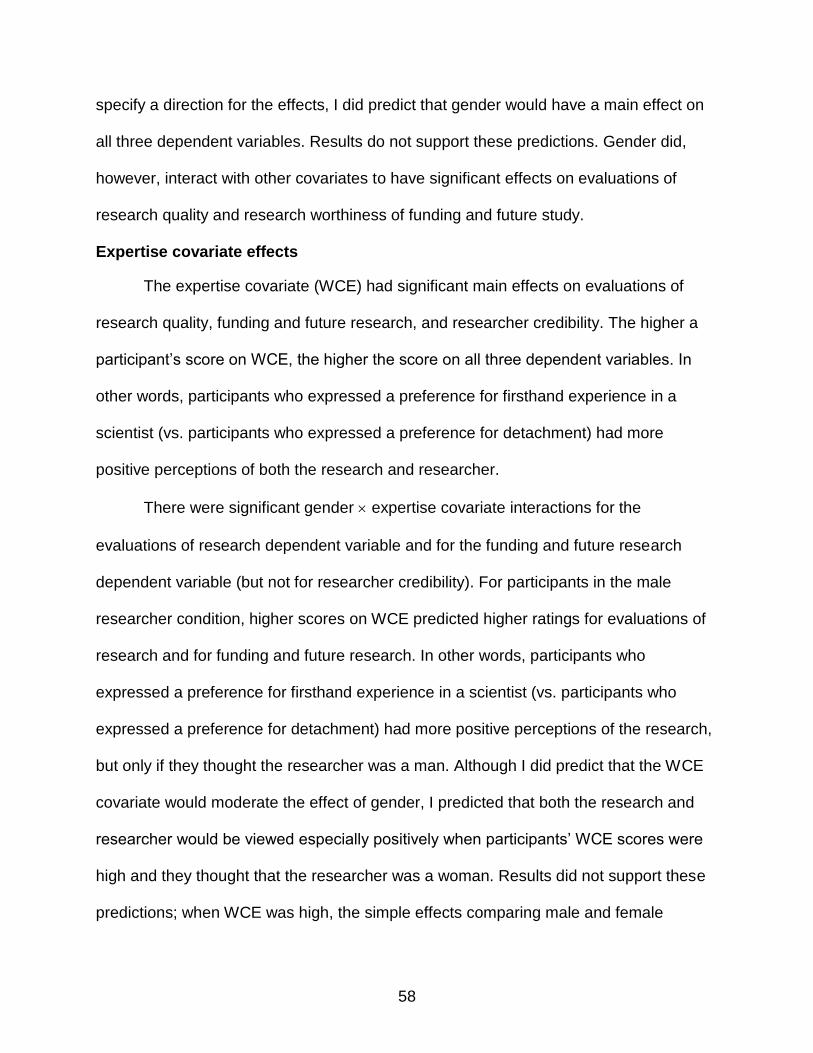
58
specify a direction for the effects, I did predict that gender would have a main effect on
all three dependent variables. Results do not support these predictions. Gender did,
however, interact with other covariates to have significant effects on evaluations of
research quality and research worthiness of funding and future study.
Expertise covariate effects
The expertise covariate (WCE) had significant main effects on evaluations of
research quality, funding and future research, and researcher credibility. The higher a
participant’s score on WCE, the higher the score on all three dependent variables. In
other words, participants who expressed a preference for firsthand experience in a
scientist (vs. participants who expressed a preference for detachment) had more
positive perceptions of both the research and researcher.
There were significant gender expertise covariate interactions for the
evaluations of research dependent variable and for the funding and future research
dependent variable (but not for researcher credibility). For participants in the male
researcher condition, higher scores on WCE predicted higher ratings for evaluations of
research and for funding and future research. In other words, participants who
expressed a preference for firsthand experience in a scientist (vs. participants who
expressed a preference for detachment) had more positive perceptions of the research,
but only if they thought the researcher was a man. Although I did predict that the WCE
covariate would moderate the effect of gender, I predicted that both the research and
researcher would be viewed especially positively when participants’ WCE scores were
high and they thought that the researcher was a woman. Results did not support these
predictions; when WCE was high, the simple effects comparing male and female
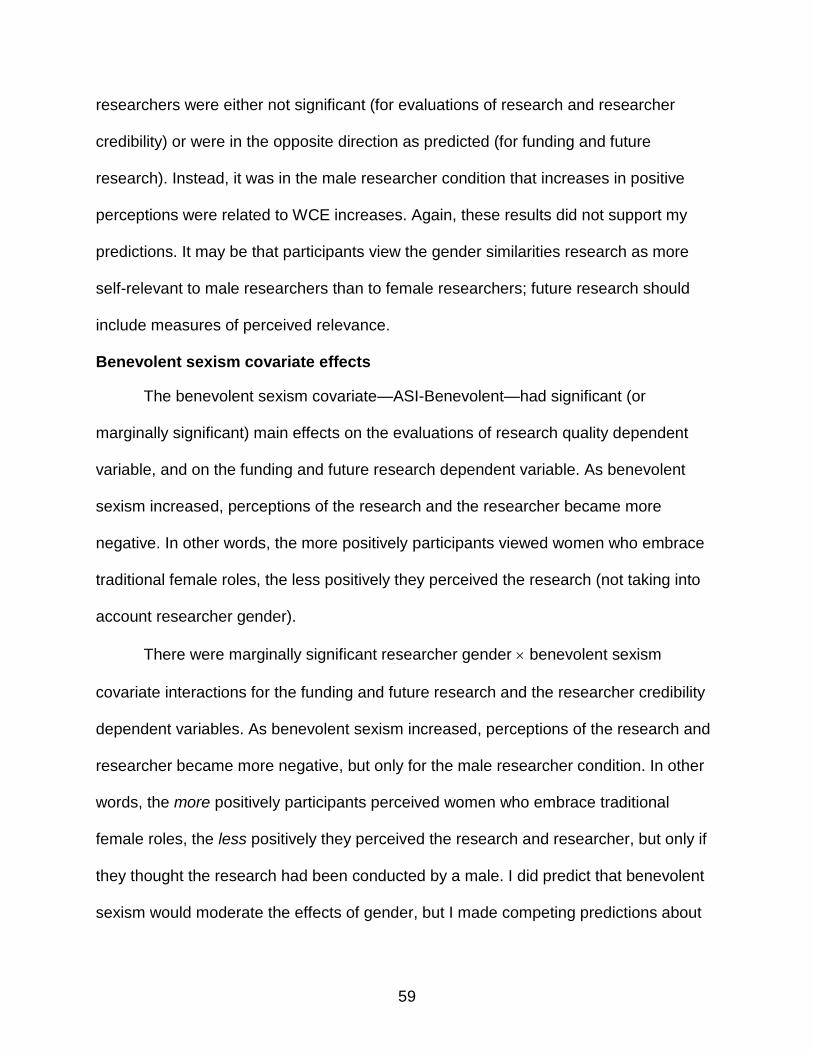
59
researchers were either not significant (for evaluations of research and researcher
credibility) or were in the opposite direction as predicted (for funding and future
research). Instead, it was in the male researcher condition that increases in positive
perceptions were related to WCE increases. Again, these results did not support my
predictions. It may be that participants view the gender similarities research as more
self-relevant to male researchers than to female researchers; future research should
include measures of perceived relevance.
Benevolent sexism covariate effects
The benevolent sexism covariate—ASI-Benevolent—had significant (or
marginally significant) main effects on the evaluations of research quality dependent
variable, and on the funding and future research dependent variable. As benevolent
sexism increased, perceptions of the research and the researcher became more
negative. In other words, the more positively participants viewed women who embrace
traditional female roles, the less positively they perceived the research (not taking into
account researcher gender).
There were marginally significant researcher gender benevolent sexism
covariate interactions for the funding and future research and the researcher credibility
dependent variables. As benevolent sexism increased, perceptions of the research and
researcher became more negative, but only for the male researcher condition. In other
words, the more positively participants perceived women who embrace traditional
female roles, the less positively they perceived the research and researcher, but only if
they thought the research had been conducted by a male. I did predict that benevolent
sexism would moderate the effects of gender, but I made competing predictions about
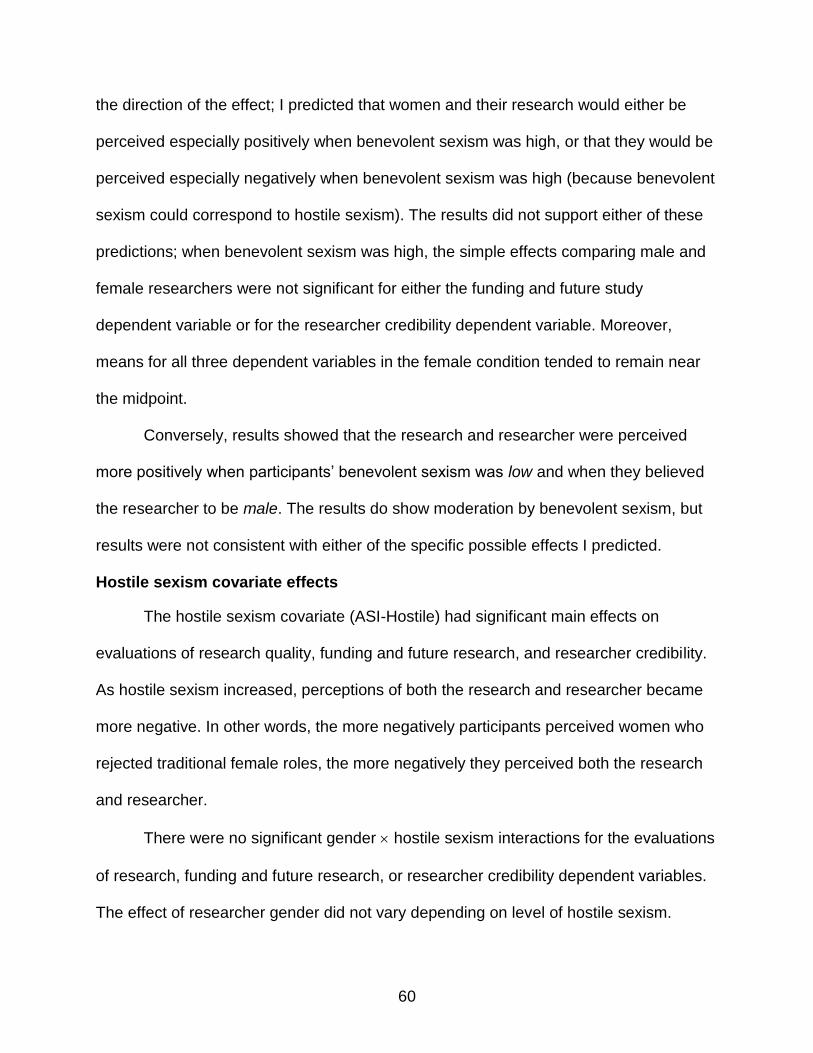
60
the direction of the effect; I predicted that women and their research would either be
perceived especially positively when benevolent sexism was high, or that they would be
perceived especially negatively when benevolent sexism was high (because benevolent
sexism could correspond to hostile sexism). The results did not support either of these
predictions; when benevolent sexism was high, the simple effects comparing male and
female researchers were not significant for either the funding and future study
dependent variable or for the researcher credibility dependent variable. Moreover,
means for all three dependent variables in the female condition tended to remain near
the midpoint.
Conversely, results showed that the research and researcher were perceived
more positively when participants’ benevolent sexism was low and when they believed
the researcher to be male. The results do show moderation by benevolent sexism, but
results were not consistent with either of the specific possible effects I predicted.
Hostile sexism covariate effects
The hostile sexism covariate (ASI-Hostile) had significant main effects on
evaluations of research quality, funding and future research, and researcher credibility.
As hostile sexism increased, perceptions of both the research and researcher became
more negative. In other words, the more negatively participants perceived women who
rejected traditional female roles, the more negatively they perceived both the research
and researcher.
There were no significant gender hostile sexism interactions for the evaluations
of research, funding and future research, or researcher credibility dependent variables.
The effect of researcher gender did not vary depending on level of hostile sexism.
61
Although the hostile sexism covariate did have significant main effects, I predicted that
hostile sexism would moderate the effects of researcher gender; these results did not
support my predictions.
Participant gender covariate effects
There was no evidence for participant gender main effects on any of the three
dependent variables. Further, there was no evidence for participant gender researcher
gender interactions.
In sum, although researcher gender showed no evidence for the main effects I
predicted, it did interact with covariates to produce significant interaction effects. And
although I did predict covariate moderation of the gender effect, the patterns of the
particular independent variable covariate interactions did not match my predictions.
Nevertheless, there is evidence, that perceivers’ benevolent sexism, hostile sexism, and
personal opinions on expertise affect perceptions of prejudice and stereotypes
research. There is also some limited evidence that gender interacts with these variables
to affect perceptions of prejudice and stereotypes research; however, out of the 12
interactions involving researcher gender, only two were significant and two were
marginally significant. As the number of tests increases, so does the probability of Type
I errors (false rejection of a null hypothesis); thus, these results for researcher gender
should be interpreted with caution.

62
Table 3-1. Squared Multiple Correlations
Model 1: Full WCE Model 2: Reduced WCE
WCE – item 1 .00 —
WCE – item 2 [R] .02 —
WCE – item 3 .21 .21
WCE – item 4 [R] .48 .50
WCE – item 5 .18 .19
WCE – item 6 [R] .34 .33
WCE – item 7 [R] .01 —
WCE – item 8 .30 .30
Table 3-2. Goodness of Fit
Model Chi-square CFI TLI RMSEA
Full WCE χ2(20)=101.15, p<.05 .67 .40 .12
Reduced WCE χ2(5)=6.25, p=.28** .99** .98** .03**
*meets historical criteria for goodness of fit. **meets current criteria for goodness of fit. Table 3-3. Contrast Coding for Multiple Regression Predictors (Study 2)
Female Male Control
Female vs. Male -1 1 0
Control vs. Else -1 -1 2
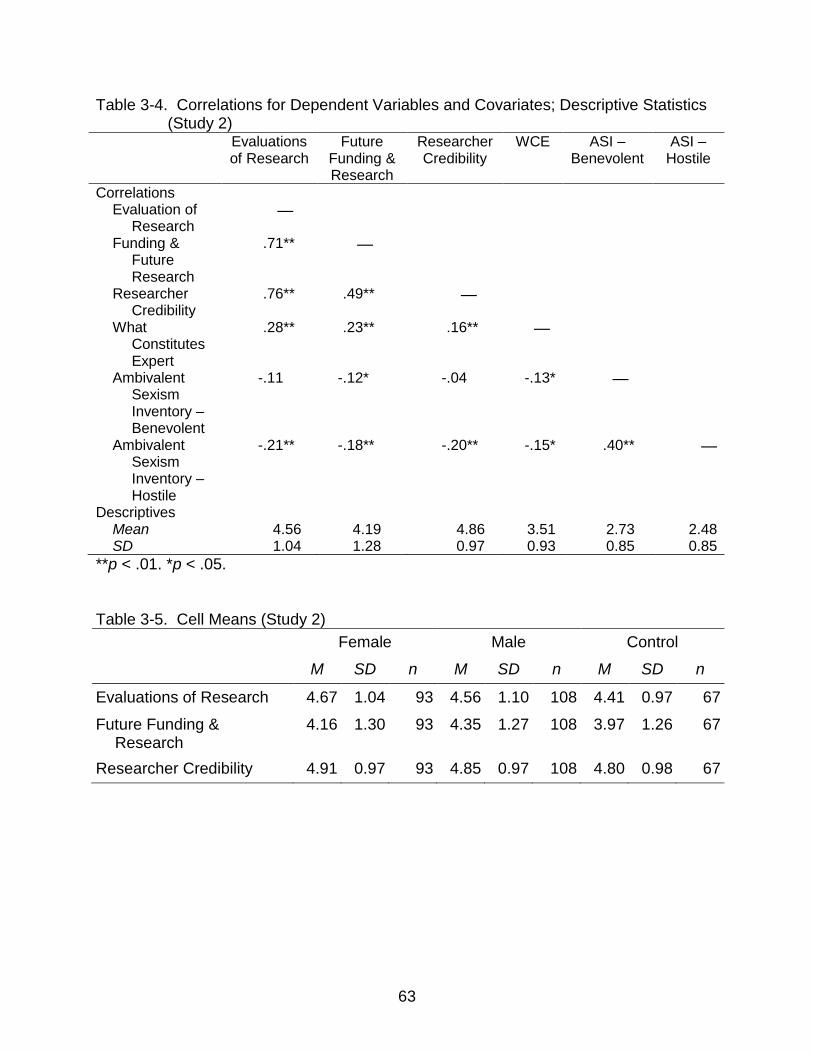
63
Table 3-4. Correlations for Dependent Variables and Covariates; Descriptive Statistics (Study 2)
Evaluations of Research
Future Funding & Research
Researcher Credibility
WCE ASI – Benevolent
ASI – Hostile
Correlations Evaluation of
Research —
Funding & Future Research
.71** —
Researcher Credibility
.76** .49** —
What Constitutes Expert
.28** .23** .16** —
Ambivalent Sexism Inventory – Benevolent
-.11 -.12* -.04 -.13* —
Ambivalent Sexism Inventory – Hostile
-.21** -.18** -.20** -.15* .40** —
Descriptives Mean 4.56 4.19 4.86 3.51 2.73 2.48 SD 1.04 1.28 0.97 0.93 0.85 0.85
**p < .01. *p < .05. Table 3-5. Cell Means (Study 2)
Female Male Control
M SD n M SD n M SD n
Evaluations of Research 4.67 1.04 93 4.56 1.10 108 4.41 0.97 67
Future Funding & Research
4.16 1.30 93 4.35 1.27 108 3.97 1.26 67
Researcher Credibility 4.91 0.97 93 4.85 0.97 108 4.80 0.98 67
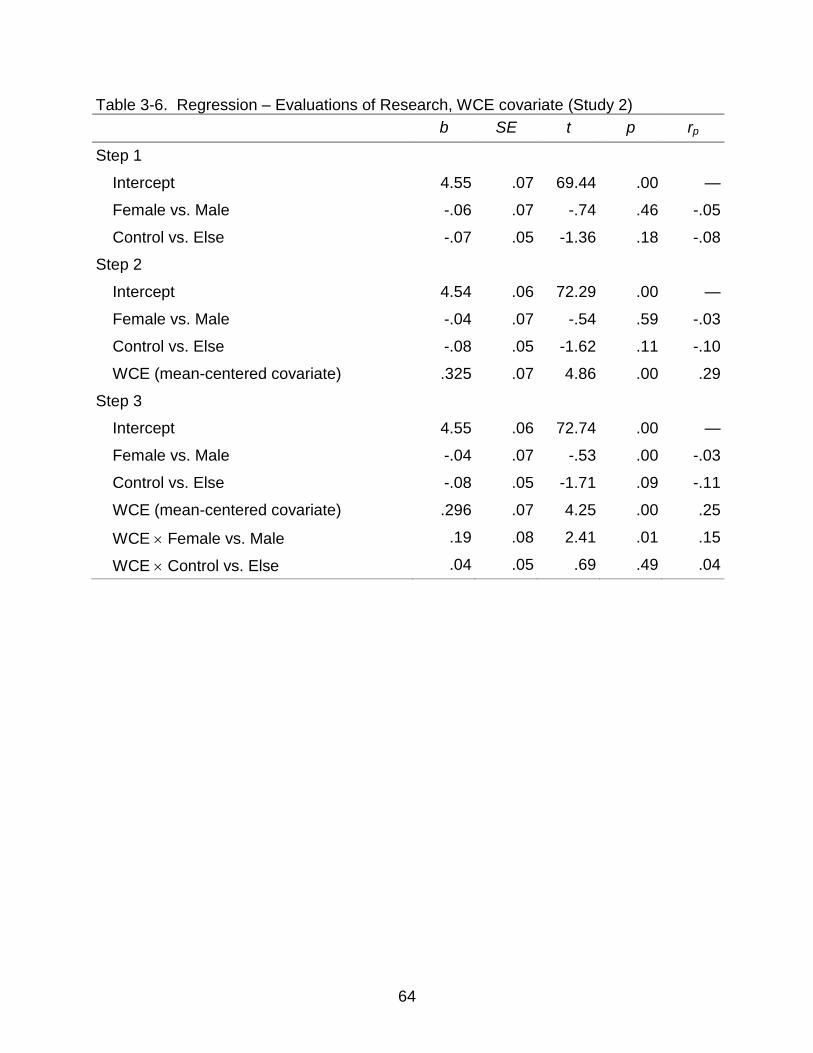
64
Table 3-6. Regression – Evaluations of Research, WCE covariate (Study 2)
b SE t p rp
Step 1
Intercept 4.55 .07 69.44 .00 —
Female vs. Male -.06 .07 -.74 .46 -.05
Control vs. Else -.07 .05 -1.36 .18 -.08
Step 2
Intercept 4.54 .06 72.29 .00 —
Female vs. Male -.04 .07 -.54 .59 -.03
Control vs. Else -.08 .05 -1.62 .11 -.10
WCE (mean-centered covariate) .325 .07 4.86 .00 .29
Step 3
Intercept 4.55 .06 72.74 .00 —
Female vs. Male -.04 .07 -.53 .00 -.03
Control vs. Else -.08 .05 -1.71 .09 -.11
WCE (mean-centered covariate) .296 .07 4.25 .00 .25
WCE Female vs. Male .19 .08 2.41 .01 .15
WCE Control vs. Else .04 .05 .69 .49 .04
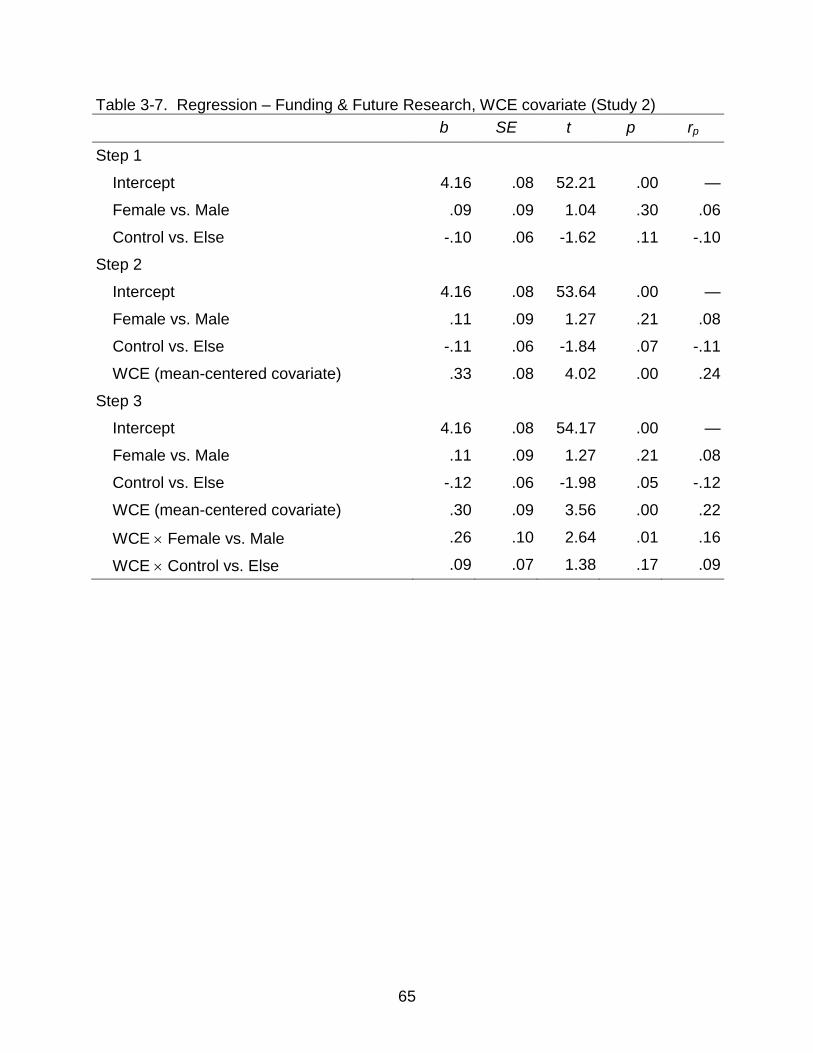
65
Table 3-7. Regression – Funding & Future Research, WCE covariate (Study 2)
b SE t p rp
Step 1
Intercept 4.16 .08 52.21 .00 —
Female vs. Male .09 .09 1.04 .30 .06
Control vs. Else -.10 .06 -1.62 .11 -.10
Step 2
Intercept 4.16 .08 53.64 .00 —
Female vs. Male .11 .09 1.27 .21 .08
Control vs. Else -.11 .06 -1.84 .07 -.11
WCE (mean-centered covariate) .33 .08 4.02 .00 .24
Step 3
Intercept 4.16 .08 54.17 .00 —
Female vs. Male .11 .09 1.27 .21 .08
Control vs. Else -.12 .06 -1.98 .05 -.12
WCE (mean-centered covariate) .30 .09 3.56 .00 .22
WCE Female vs. Male .26 .10 2.64 .01 .16
WCE Control vs. Else .09 .07 1.38 .17 .09
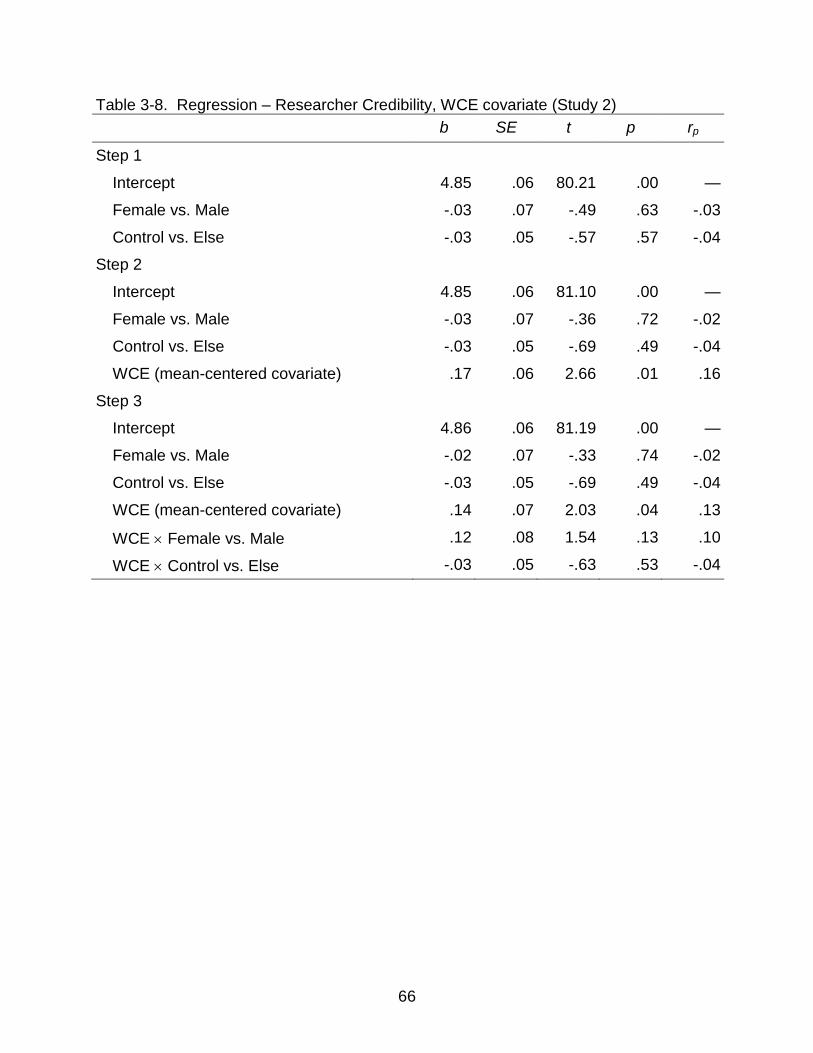
66
Table 3-8. Regression – Researcher Credibility, WCE covariate (Study 2)
b SE t p rp
Step 1
Intercept 4.85 .06 80.21 .00 —
Female vs. Male -.03 .07 -.49 .63 -.03
Control vs. Else -.03 .05 -.57 .57 -.04
Step 2
Intercept 4.85 .06 81.10 .00 —
Female vs. Male -.03 .07 -.36 .72 -.02
Control vs. Else -.03 .05 -.69 .49 -.04
WCE (mean-centered covariate) .17 .06 2.66 .01 .16
Step 3
Intercept 4.86 .06 81.19 .00 —
Female vs. Male -.02 .07 -.33 .74 -.02
Control vs. Else -.03 .05 -.69 .49 -.04
WCE (mean-centered covariate) .14 .07 2.03 .04 .13
WCE Female vs. Male .12 .08 1.54 .13 .10
WCE Control vs. Else -.03 .05 -.63 .53 -.04

67
Table 3-9. Regression – Evaluations of Research, ASI-benevolent covariate (Study 2)
b SE t p rp
Step 1
Intercept 4.55 .07 69.44 .00 —
Female vs. Male -.06 .07 -.74 .46 -.05
Control vs. Else -.07 .05 -1.36 .18 -.08
Step 2
Intercept 4.55 .07 69.74 .00 —
Female vs. Male -.05 .07 -.73 .46 -.05
Control vs. Else -.07 .05 -1.37 .17 -.08
ASI-benevolent (mean-centered covariate) -.137 .08 -1.81 .07 -.11
Step 3
Intercept 4.55 .07 69.96 .00 —
Female vs. Male -.05 .07 -.73 .47 -.05
Control vs. Else -.07 .05 -1.37 .17 -.08
ASI-benevolent (mean-centered covariate) -.12 .08 -1.61 .11 -.10
ASI-benevolent Female vs. Male -.14 .09 -1.60 .11 -.10
ASI-benevolent Control vs. Else .06 .06 1.04 .30 .06
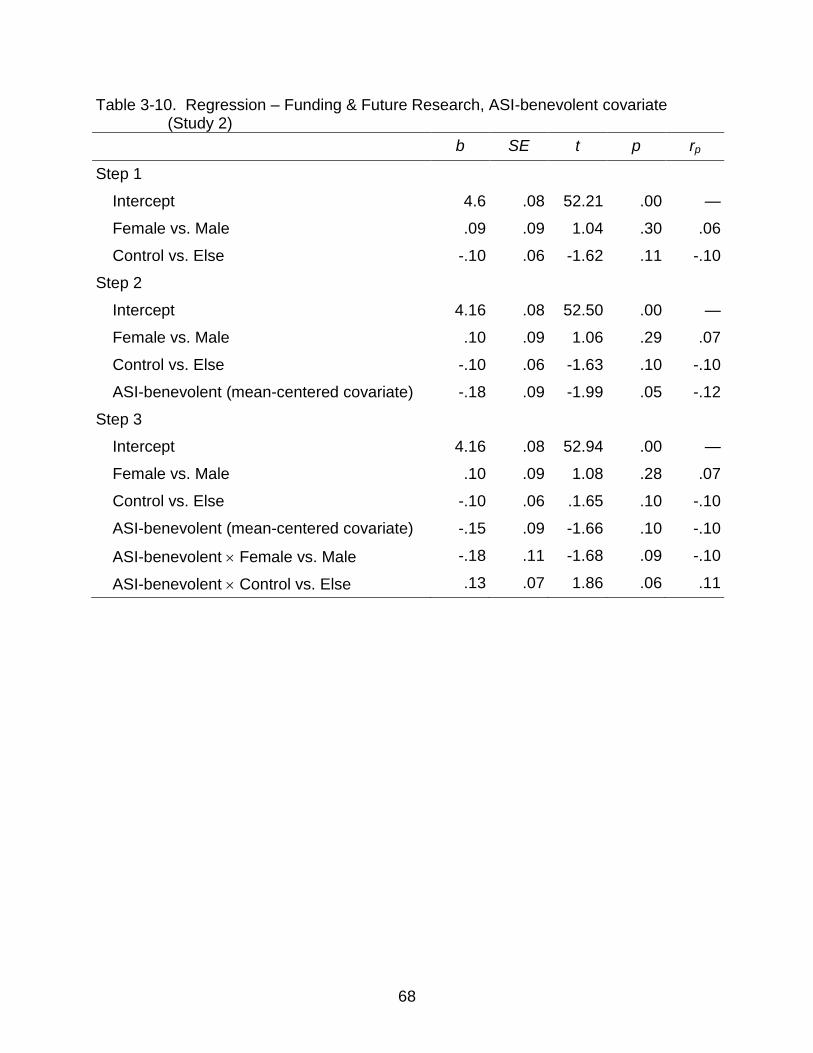
68
Table 3-10. Regression – Funding & Future Research, ASI-benevolent covariate (Study 2)
b SE t p rp
Step 1
Intercept 4.6 .08 52.21 .00 —
Female vs. Male .09 .09 1.04 .30 .06
Control vs. Else -.10 .06 -1.62 .11 -.10
Step 2
Intercept 4.16 .08 52.50 .00 —
Female vs. Male .10 .09 1.06 .29 .07
Control vs. Else -.10 .06 -1.63 .10 -.10
ASI-benevolent (mean-centered covariate) -.18 .09 -1.99 .05 -.12
Step 3
Intercept 4.16 .08 52.94 .00 —
Female vs. Male .10 .09 1.08 .28 .07
Control vs. Else -.10 .06 .1.65 .10 -.10
ASI-benevolent (mean-centered covariate) -.15 .09 -1.66 .10 -.10
ASI-benevolent Female vs. Male -.18 .11 -1.68 .09 -.10
ASI-benevolent Control vs. Else .13 .07 1.86 .06 .11
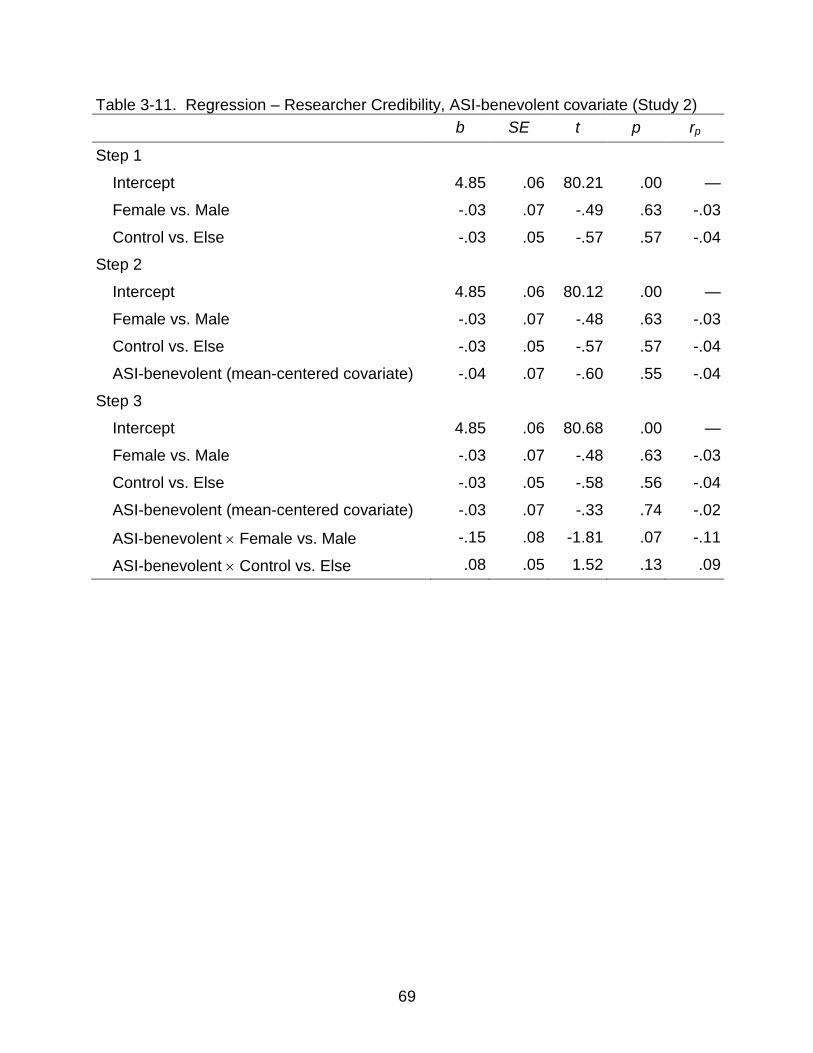
69
Table 3-11. Regression – Researcher Credibility, ASI-benevolent covariate (Study 2)
b SE t p rp
Step 1
Intercept 4.85 .06 80.21 .00 —
Female vs. Male -.03 .07 -.49 .63 -.03
Control vs. Else -.03 .05 -.57 .57 -.04
Step 2
Intercept 4.85 .06 80.12 .00 —
Female vs. Male -.03 .07 -.48 .63 -.03
Control vs. Else -.03 .05 -.57 .57 -.04
ASI-benevolent (mean-centered covariate) -.04 .07 -.60 .55 -.04
Step 3
Intercept 4.85 .06 80.68 .00 —
Female vs. Male -.03 .07 -.48 .63 -.03
Control vs. Else -.03 .05 -.58 .56 -.04
ASI-benevolent (mean-centered covariate) -.03 .07 -.33 .74 -.02
ASI-benevolent Female vs. Male -.15 .08 -1.81 .07 -.11
ASI-benevolent Control vs. Else .08 .05 1.52 .13 .09
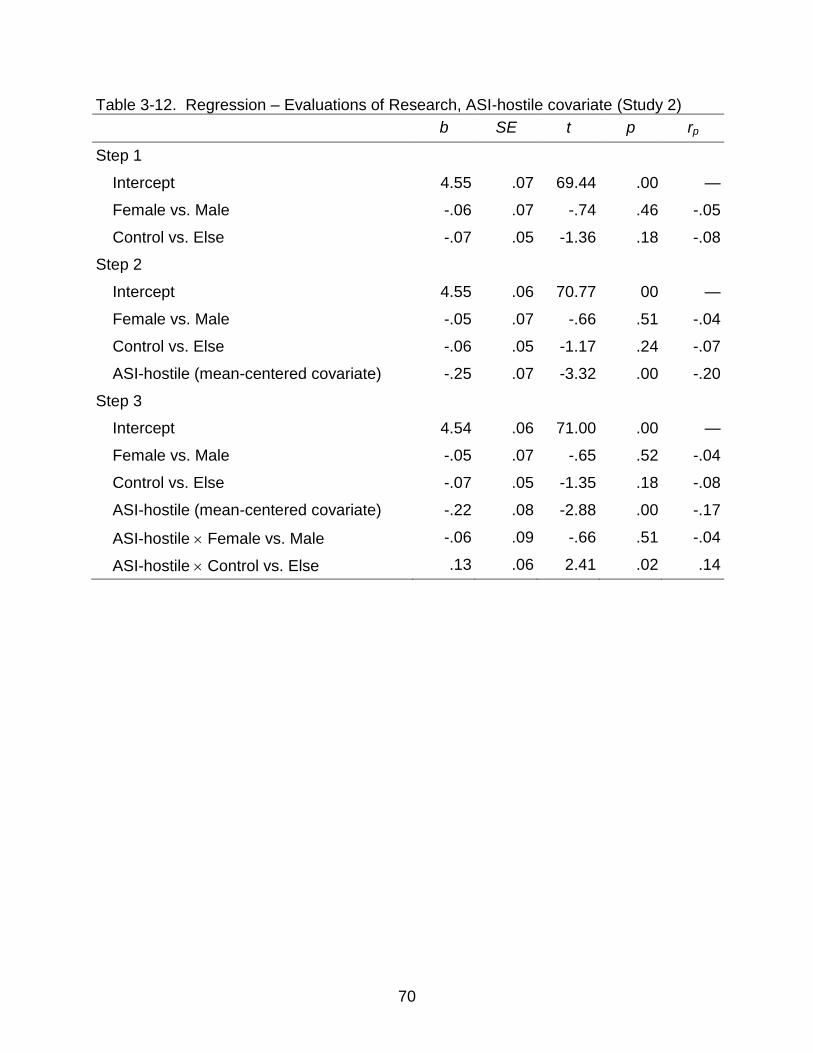
70
Table 3-12. Regression – Evaluations of Research, ASI-hostile covariate (Study 2)
b SE t p rp
Step 1
Intercept 4.55 .07 69.44 .00 —
Female vs. Male -.06 .07 -.74 .46 -.05
Control vs. Else -.07 .05 -1.36 .18 -.08
Step 2
Intercept 4.55 .06 70.77 00 —
Female vs. Male -.05 .07 -.66 .51 -.04
Control vs. Else -.06 .05 -1.17 .24 -.07
ASI-hostile (mean-centered covariate) -.25 .07 -3.32 .00 -.20
Step 3
Intercept 4.54 .06 71.00 .00 —
Female vs. Male -.05 .07 -.65 .52 -.04
Control vs. Else -.07 .05 -1.35 .18 -.08
ASI-hostile (mean-centered covariate) -.22 .08 -2.88 .00 -.17
ASI-hostile Female vs. Male -.06 .09 -.66 .51 -.04
ASI-hostile Control vs. Else .13 .06 2.41 .02 .14
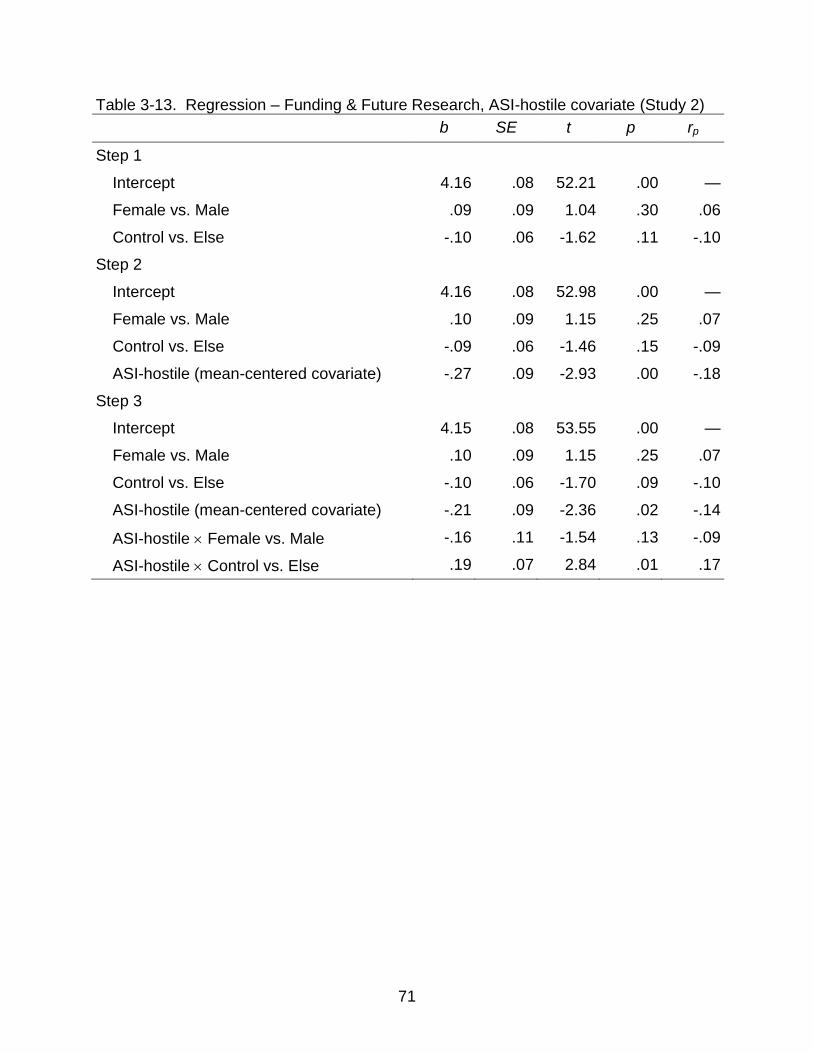
71
Table 3-13. Regression – Funding & Future Research, ASI-hostile covariate (Study 2)
b SE t p rp
Step 1
Intercept 4.16 .08 52.21 .00 —
Female vs. Male .09 .09 1.04 .30 .06
Control vs. Else -.10 .06 -1.62 .11 -.10
Step 2
Intercept 4.16 .08 52.98 .00 —
Female vs. Male .10 .09 1.15 .25 .07
Control vs. Else -.09 .06 -1.46 .15 -.09
ASI-hostile (mean-centered covariate) -.27 .09 -2.93 .00 -.18
Step 3
Intercept 4.15 .08 53.55 .00 —
Female vs. Male .10 .09 1.15 .25 .07
Control vs. Else -.10 .06 -1.70 .09 -.10
ASI-hostile (mean-centered covariate) -.21 .09 -2.36 .02 -.14
ASI-hostile Female vs. Male -.16 .11 -1.54 .13 -.09
ASI-hostile Control vs. Else .19 .07 2.84 .01 .17
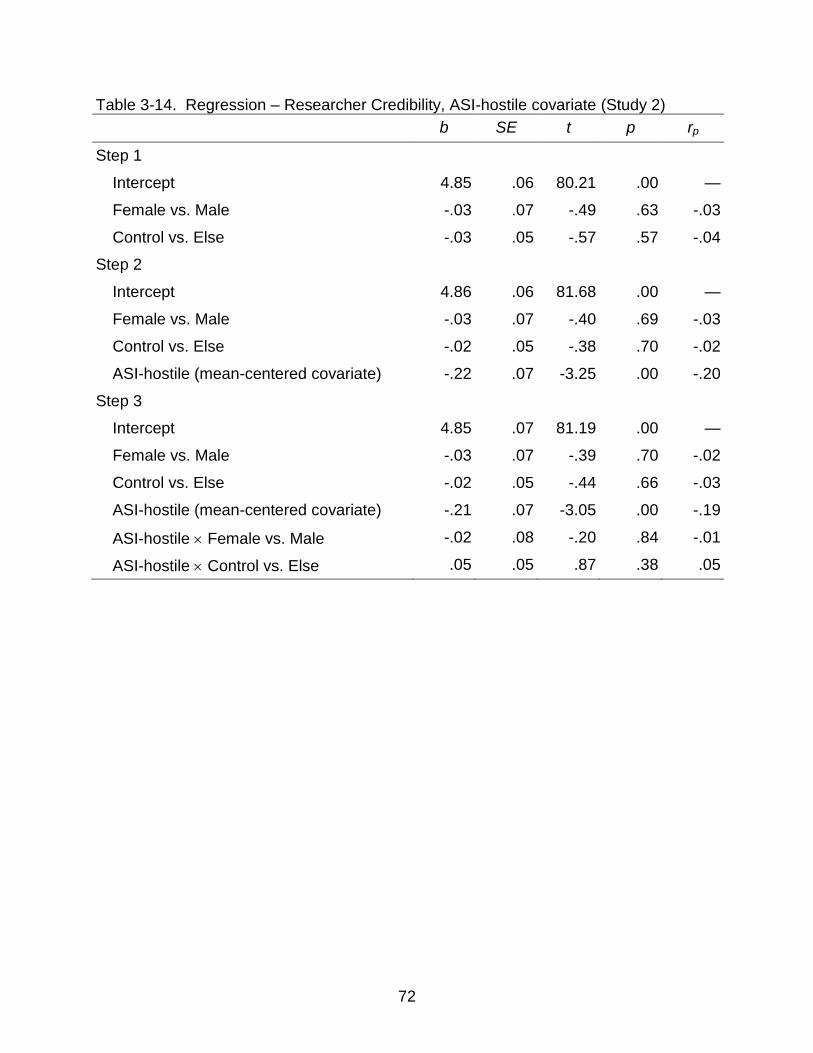
72
Table 3-14. Regression – Researcher Credibility, ASI-hostile covariate (Study 2)
b SE t p rp
Step 1
Intercept 4.85 .06 80.21 .00 —
Female vs. Male -.03 .07 -.49 .63 -.03
Control vs. Else -.03 .05 -.57 .57 -.04
Step 2
Intercept 4.86 .06 81.68 .00 —
Female vs. Male -.03 .07 -.40 .69 -.03
Control vs. Else -.02 .05 -.38 .70 -.02
ASI-hostile (mean-centered covariate) -.22 .07 -3.25 .00 -.20
Step 3
Intercept 4.85 .07 81.19 .00 —
Female vs. Male -.03 .07 -.39 .70 -.02
Control vs. Else -.02 .05 -.44 .66 -.03
ASI-hostile (mean-centered covariate) -.21 .07 -3.05 .00 -.19
ASI-hostile Female vs. Male -.02 .08 -.20 .84 -.01
ASI-hostile Control vs. Else .05 .05 .87 .38 .05
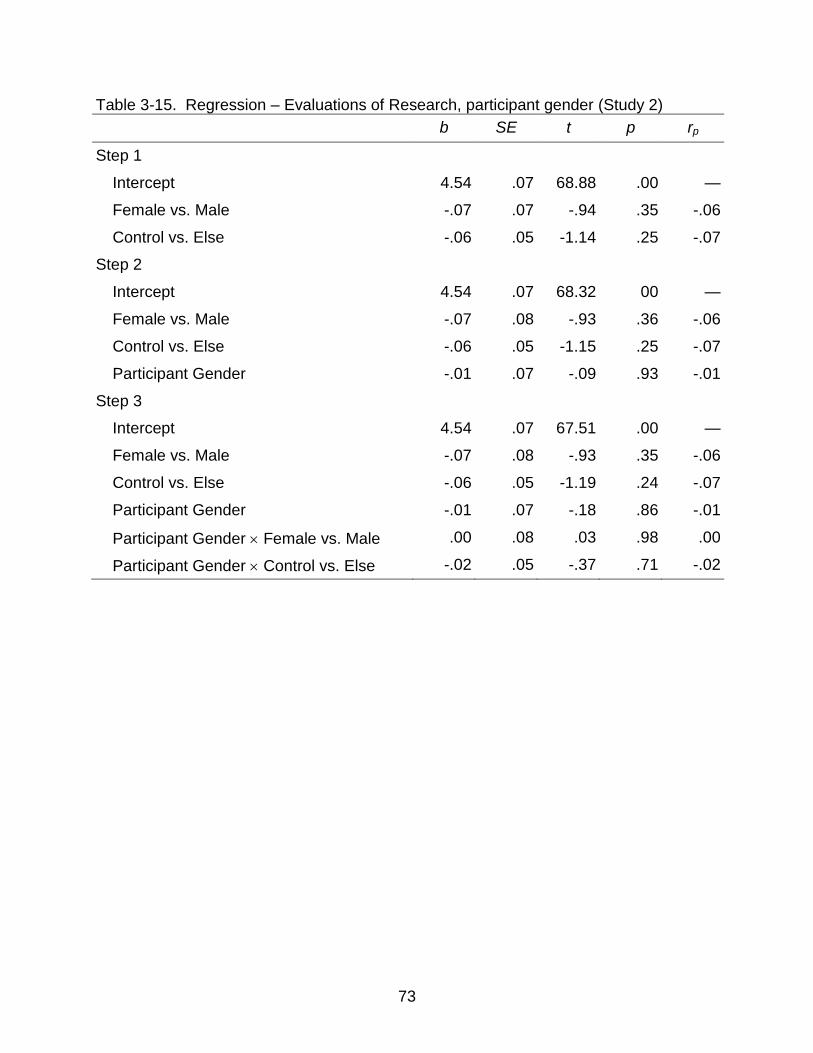
73
Table 3-15. Regression – Evaluations of Research, participant gender (Study 2)
b SE t p rp
Step 1
Intercept 4.54 .07 68.88 .00 —
Female vs. Male -.07 .07 -.94 .35 -.06
Control vs. Else -.06 .05 -1.14 .25 -.07
Step 2
Intercept 4.54 .07 68.32 00 —
Female vs. Male -.07 .08 -.93 .36 -.06
Control vs. Else -.06 .05 -1.15 .25 -.07
Participant Gender -.01 .07 -.09 .93 -.01
Step 3
Intercept 4.54 .07 67.51 .00 —
Female vs. Male -.07 .08 -.93 .35 -.06
Control vs. Else -.06 .05 -1.19 .24 -.07
Participant Gender -.01 .07 -.18 .86 -.01
Participant Gender Female vs. Male .00 .08 .03 .98 .00
Participant Gender Control vs. Else -.02 .05 -.37 .71 -.02
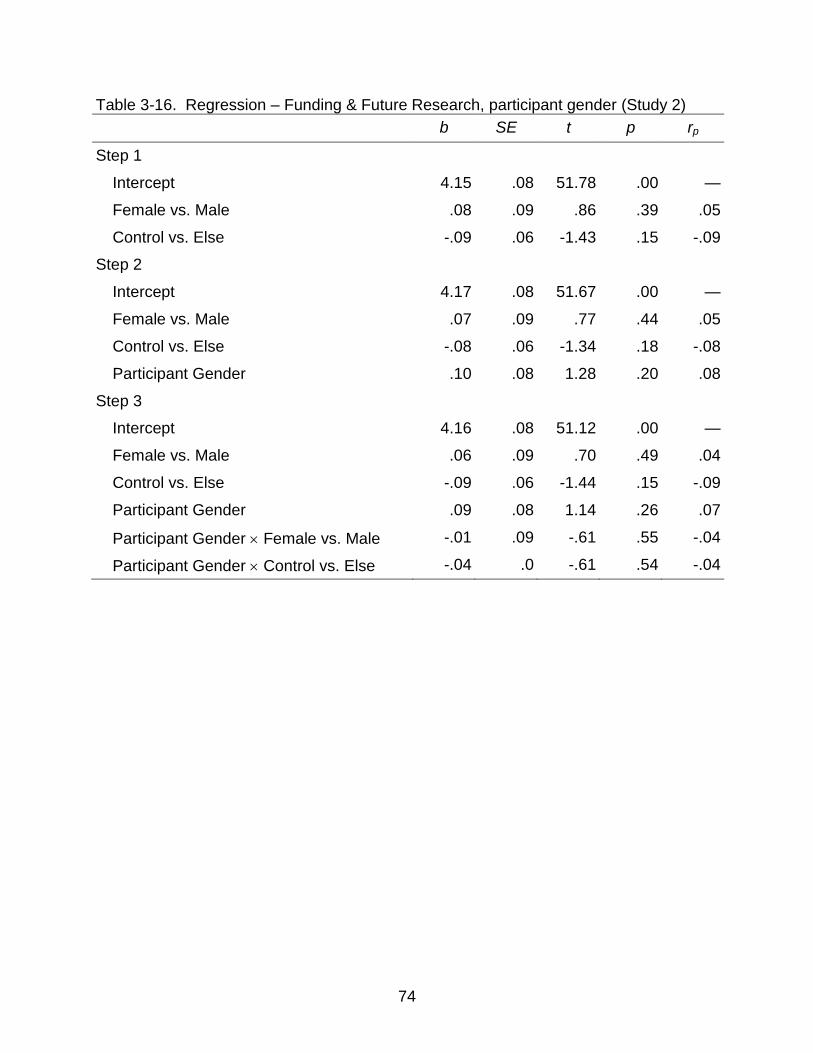
74
Table 3-16. Regression – Funding & Future Research, participant gender (Study 2)
b SE t p rp
Step 1
Intercept 4.15 .08 51.78 .00 —
Female vs. Male .08 .09 .86 .39 .05
Control vs. Else -.09 .06 -1.43 .15 -.09
Step 2
Intercept 4.17 .08 51.67 .00 —
Female vs. Male .07 .09 .77 .44 .05
Control vs. Else -.08 .06 -1.34 .18 -.08
Participant Gender .10 .08 1.28 .20 .08
Step 3
Intercept 4.16 .08 51.12 .00 —
Female vs. Male .06 .09 .70 .49 .04
Control vs. Else -.09 .06 -1.44 .15 -.09
Participant Gender .09 .08 1.14 .26 .07
Participant Gender Female vs. Male -.01 .09 -.61 .55 -.04
Participant Gender Control vs. Else -.04 .0 -.61 .54 -.04
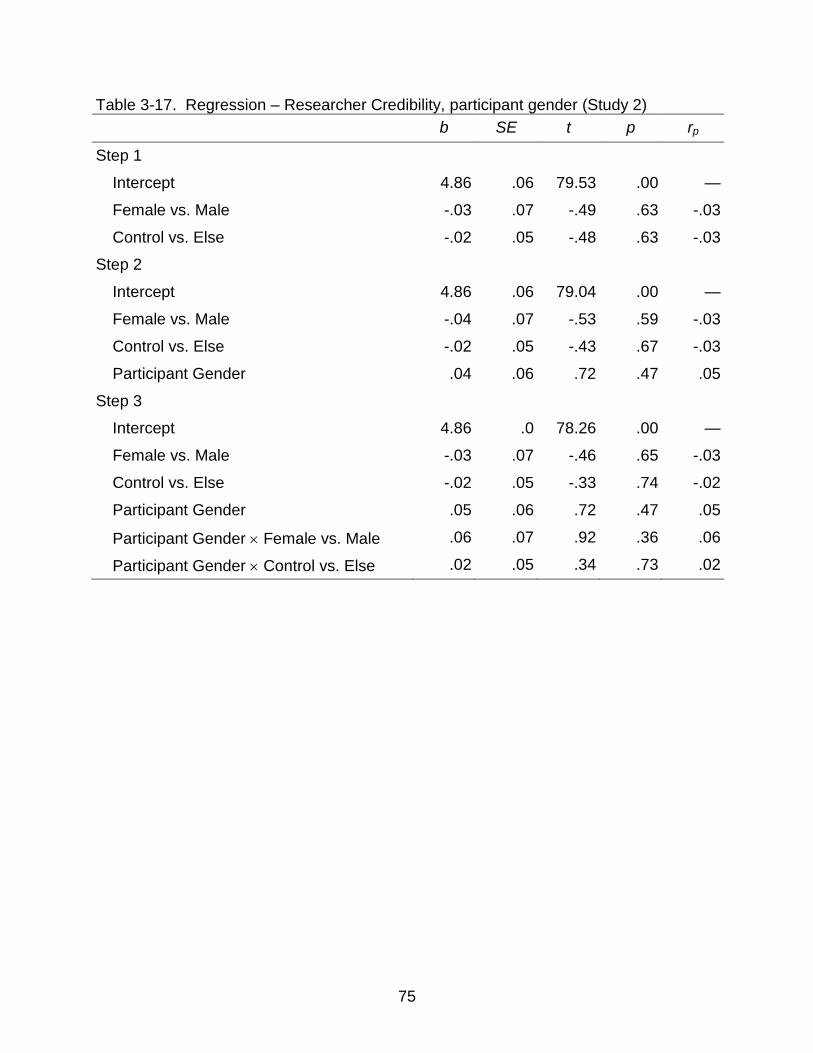
75
Table 3-17. Regression – Researcher Credibility, participant gender (Study 2)
b SE t p rp
Step 1
Intercept 4.86 .06 79.53 .00 —
Female vs. Male -.03 .07 -.49 .63 -.03
Control vs. Else -.02 .05 -.48 .63 -.03
Step 2
Intercept 4.86 .06 79.04 .00 —
Female vs. Male -.04 .07 -.53 .59 -.03
Control vs. Else -.02 .05 -.43 .67 -.03
Participant Gender .04 .06 .72 .47 .05
Step 3
Intercept 4.86 .0 78.26 .00 —
Female vs. Male -.03 .07 -.46 .65 -.03
Control vs. Else -.02 .05 -.33 .74 -.02
Participant Gender .05 .06 .72 .47 .05
Participant Gender Female vs. Male .06 .07 .92 .36 .06
Participant Gender Control vs. Else .02 .05 .34 .73 .02
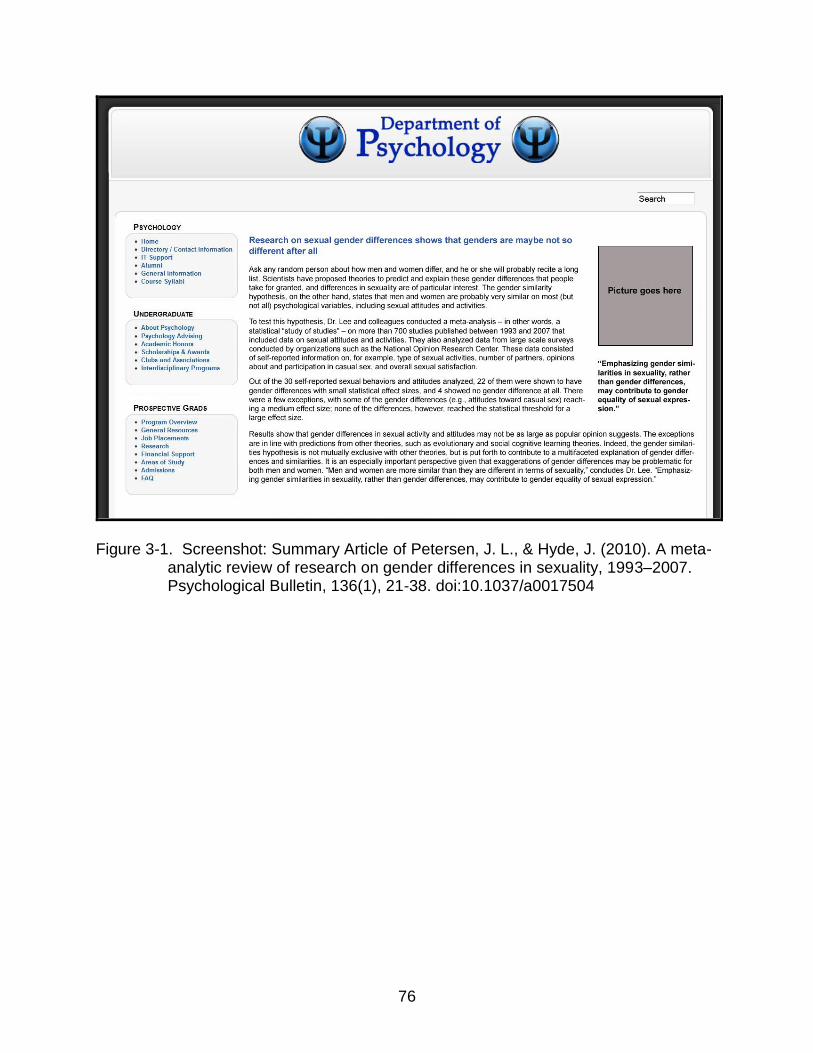
76
Figure 3-1. Screenshot: Summary Article of Petersen, J. L., & Hyde, J. (2010). A meta-
analytic review of research on gender differences in sexuality, 1993–2007. Psychological Bulletin, 136(1), 21-38. doi:10.1037/a0017504
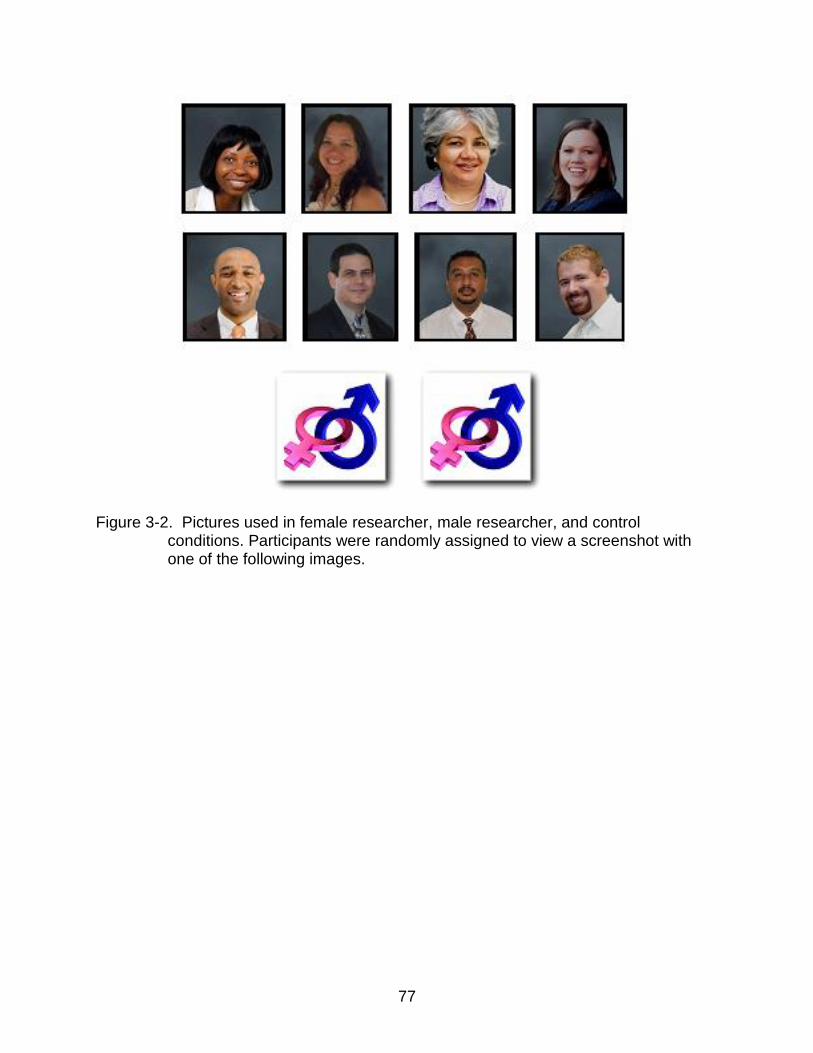
77
Figure 3-2. Pictures used in female researcher, male researcher, and control
conditions. Participants were randomly assigned to view a screenshot with one of the following images.
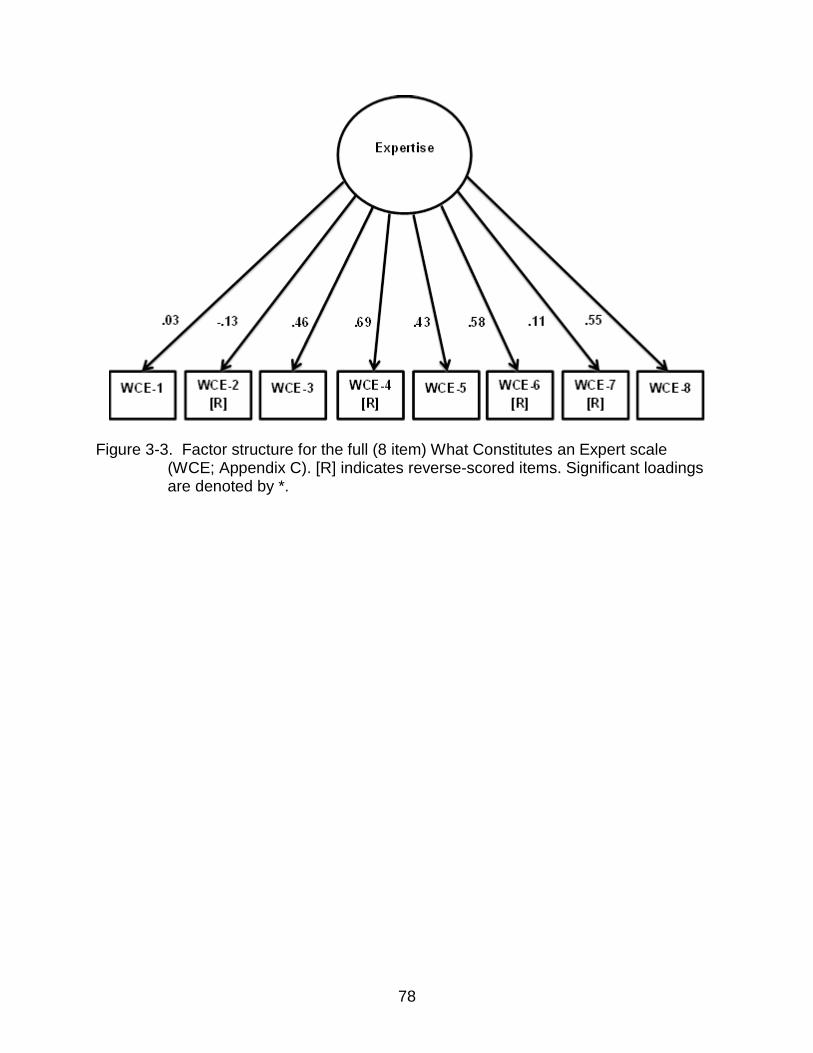
78
Figure 3-3. Factor structure for the full (8 item) What Constitutes an Expert scale
(WCE; Appendix C). [R] indicates reverse-scored items. Significant loadings are denoted by *.
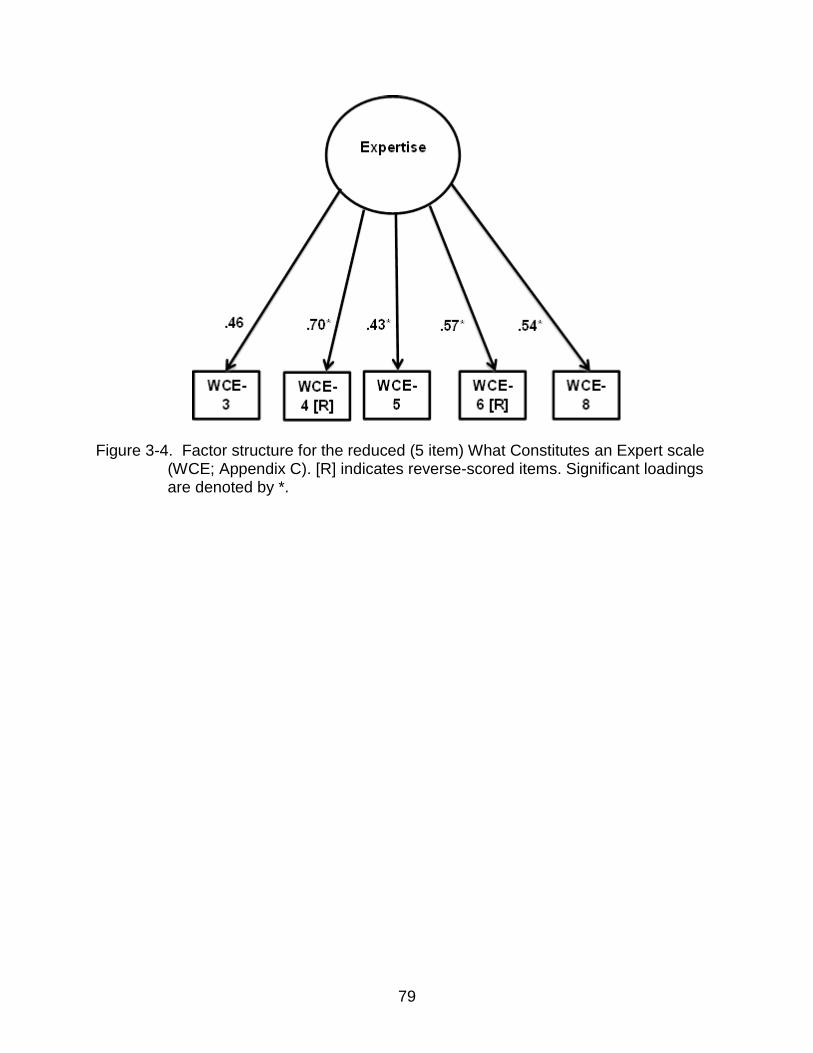
79
Figure 3-4. Factor structure for the reduced (5 item) What Constitutes an Expert scale
(WCE; Appendix C). [R] indicates reverse-scored items. Significant loadings are denoted by *.
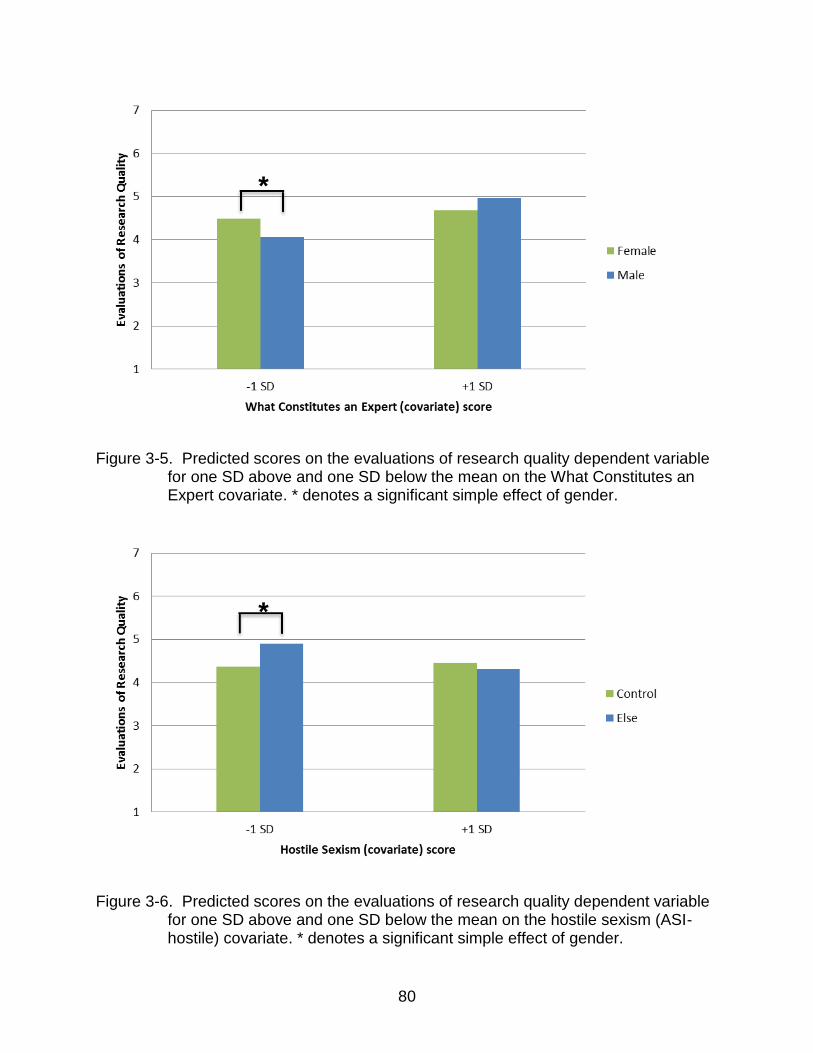
80
Figure 3-5. Predicted scores on the evaluations of research quality dependent variable
for one SD above and one SD below the mean on the What Constitutes an Expert covariate. * denotes a significant simple effect of gender.
Figure 3-6. Predicted scores on the evaluations of research quality dependent variable
for one SD above and one SD below the mean on the hostile sexism (ASI-hostile) covariate. * denotes a significant simple effect of gender.
*
*
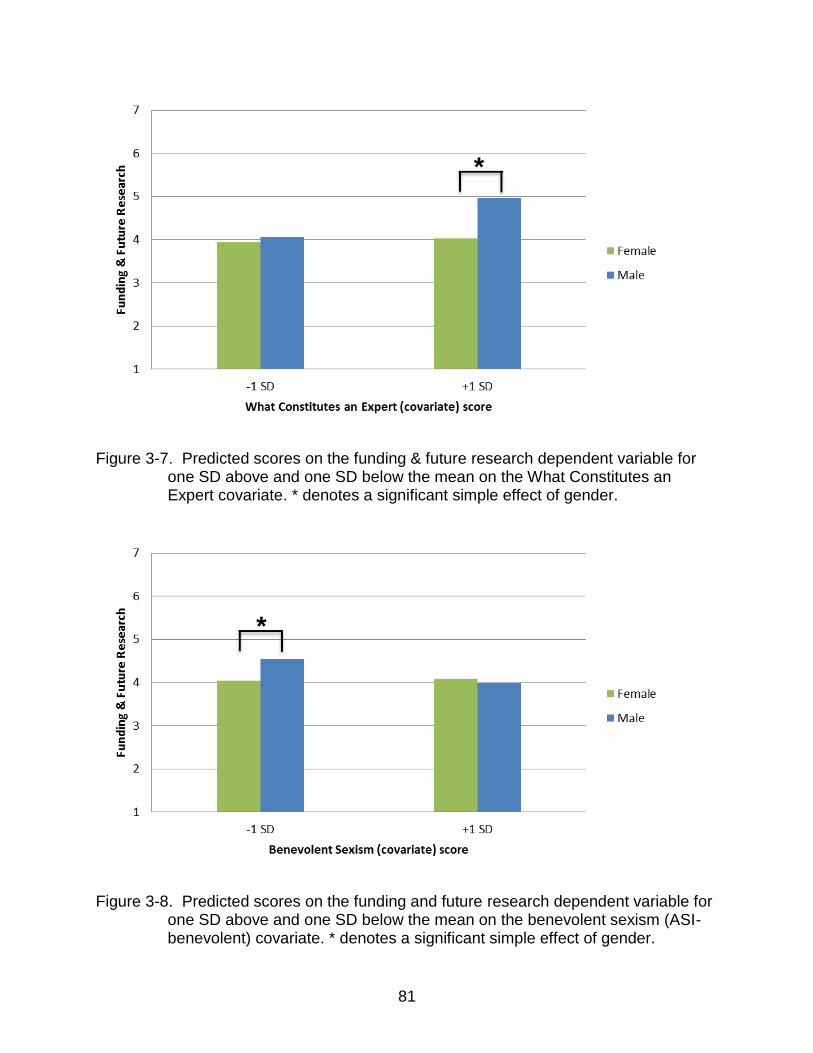
81
Figure 3-7. Predicted scores on the funding & future research dependent variable for
one SD above and one SD below the mean on the What Constitutes an Expert covariate. * denotes a significant simple effect of gender.
Figure 3-8. Predicted scores on the funding and future research dependent variable for
one SD above and one SD below the mean on the benevolent sexism (ASI-benevolent) covariate. * denotes a significant simple effect of gender.
*
*
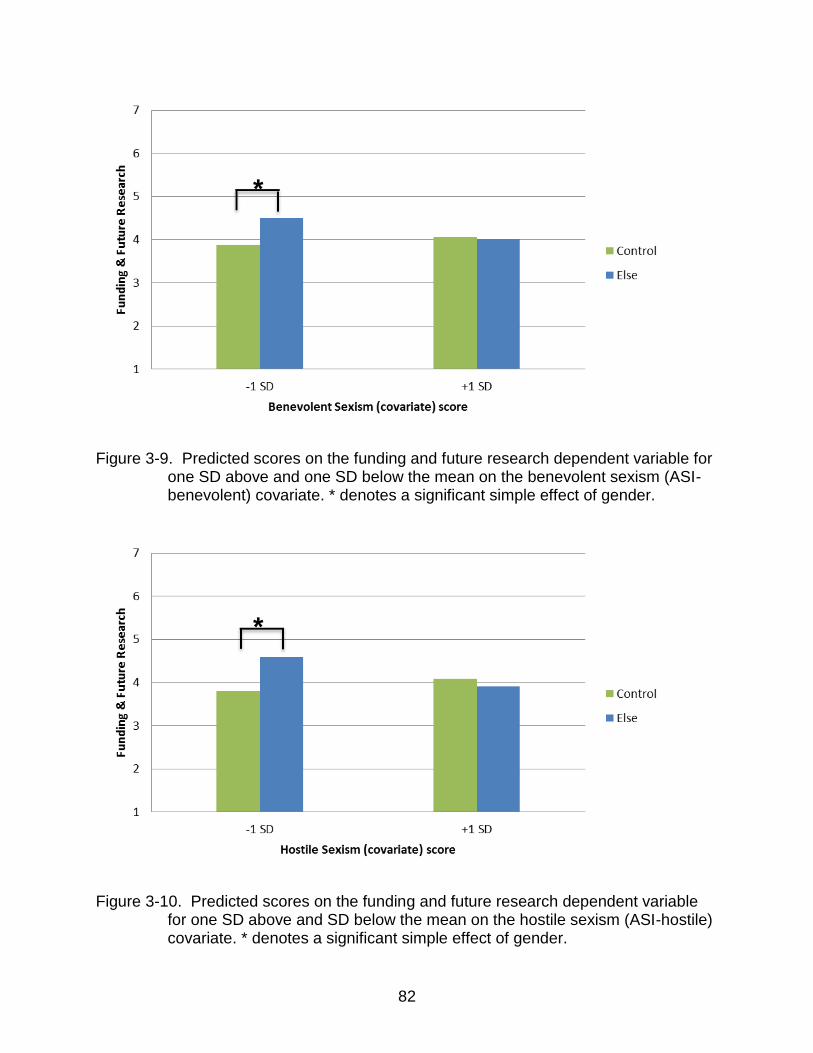
82
Figure 3-9. Predicted scores on the funding and future research dependent variable for
one SD above and one SD below the mean on the benevolent sexism (ASI-benevolent) covariate. * denotes a significant simple effect of gender.
Figure 3-10. Predicted scores on the funding and future research dependent variable
for one SD above and SD below the mean on the hostile sexism (ASI-hostile) covariate. * denotes a significant simple effect of gender.
*
*
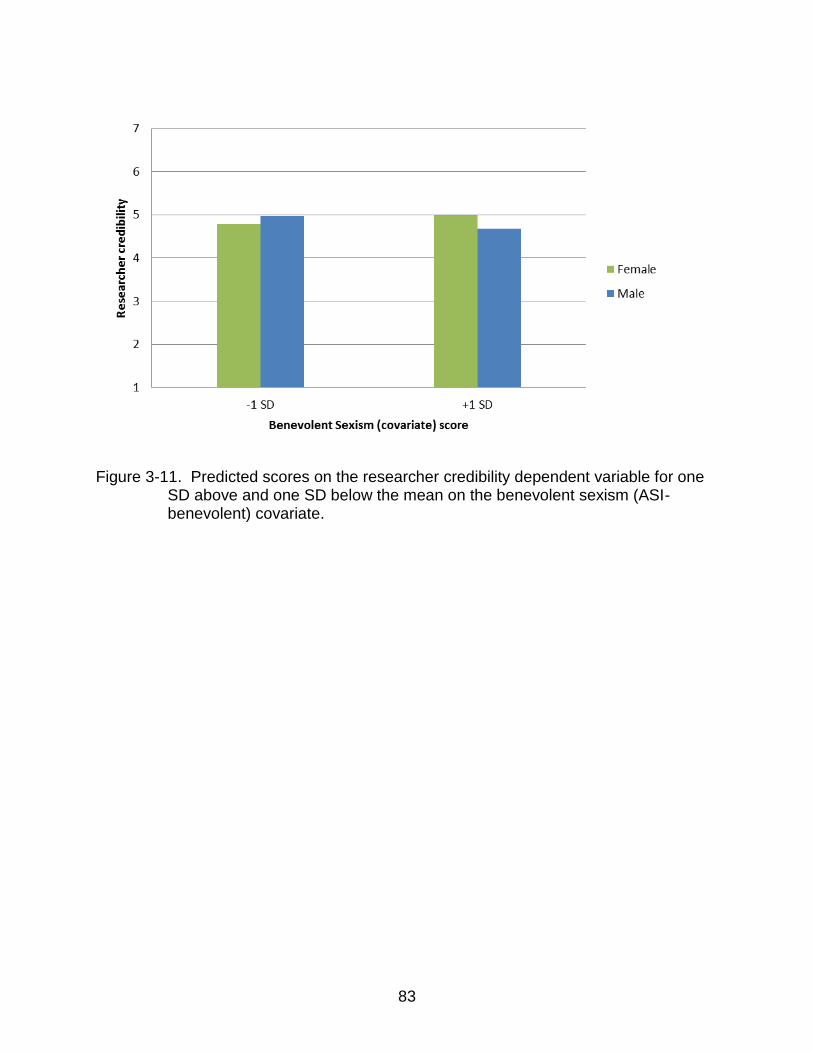
83
Figure 3-11. Predicted scores on the researcher credibility dependent variable for one
SD above and one SD below the mean on the benevolent sexism (ASI-benevolent) covariate.
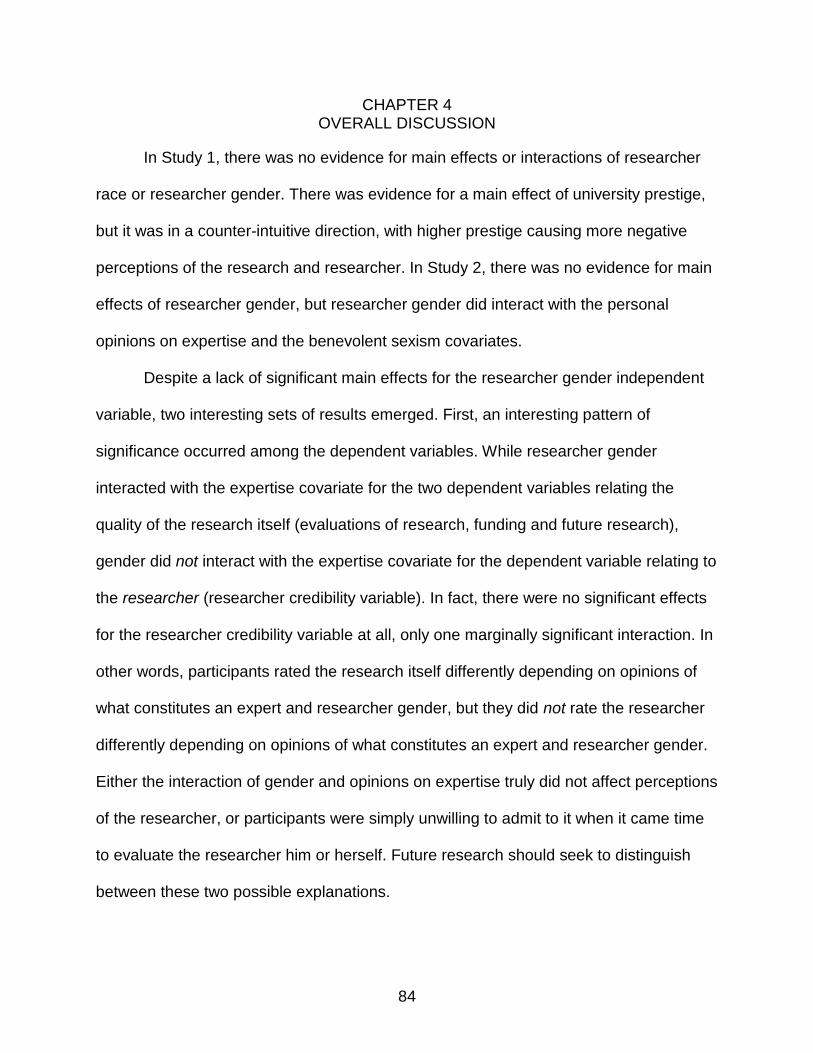
84
CHAPTER 4 OVERALL DISCUSSION
In Study 1, there was no evidence for main effects or interactions of researcher
race or researcher gender. There was evidence for a main effect of university prestige,
but it was in a counter-intuitive direction, with higher prestige causing more negative
perceptions of the research and researcher. In Study 2, there was no evidence for main
effects of researcher gender, but researcher gender did interact with the personal
opinions on expertise and the benevolent sexism covariates.
Despite a lack of significant main effects for the researcher gender independent
variable, two interesting sets of results emerged. First, an interesting pattern of
significance occurred among the dependent variables. While researcher gender
interacted with the expertise covariate for the two dependent variables relating the
quality of the research itself (evaluations of research, funding and future research),
gender did not interact with the expertise covariate for the dependent variable relating to
the researcher (researcher credibility variable). In fact, there were no significant effects
for the researcher credibility variable at all, only one marginally significant interaction. In
other words, participants rated the research itself differently depending on opinions of
what constitutes an expert and researcher gender, but they did not rate the researcher
differently depending on opinions of what constitutes an expert and researcher gender.
Either the interaction of gender and opinions on expertise truly did not affect perceptions
of the researcher, or participants were simply unwilling to admit to it when it came time
to evaluate the researcher him or herself. Future research should seek to distinguish
between these two possible explanations.
85
A second intriguing set of results related to the covariate simple effects observed
when breaking down interaction effects by gender. Across dependent variables, means
for the female researcher condition showed little variation, while means for the male
researcher condition varied significantly according to participants’ covariate scores.
There are at least two possible explanations for this effect. First, despite participants’
benevolent sexism, hostile sexism, or opinions on what constitutes an expert,
participants did not vary in their perceptions of women researchers or of research
conducted by women. In other words, sexism and opinions regarding what constitutes
an expert did not affect how participants viewed women and their research (though it did
seem to affect how participants viewed men and their research). A second possible
explanation is that participants were simply unwilling to admit to perceiving women and
their research any differently according to their own opinions of what constitutes an
expert or their own level of sexism. I suspect that the latter explanation is true; scores
on the dependent variables hovered around scale midpoints for the female researcher
condition, but for the male researcher condition, scores on the dependent variables
varied according to participants’ level of sexism and their opinions regarding what
constitutes an expert. Although many people today may still hold sexist views and
stereotypes that are disparaging to women, there may be social norms against
admitting to them. Future research should determine whether participants’ views of
female scientists and their research are truly unaffected by sexism and opinions
regarding expertise, or if participants are unwilling to admit to being so affected. Future
research could compare implicit and explicit attitudes towards women who study gender
prejudice or stereotypes research.
86
Limitations and Future Directions
There are several limitations to the research presented here. The first limitation is
my choice of multiple regression analysis over multi-level modeling. As discussed
above, multiple regression analysis ignores the nesting in Study 2’s design. However,
there would have been problems with a multilevel model as well (see Main analyses in
the Results section for Study 2). Additionally, although using multiple photos for the two
experimental conditions posed a nesting problem, I believe the stimulus sampling in this
study was an improvement over prior studies that did not use stimulus sampling
techniques. Using one picture for each condition would have circumvented nesting and
obviated the need for a multilevel model. However, failing to stimulus sample would
have posed problems for generalizability and construct validity (Wells & Windschitl,
1999). Using only one female photo and only one male photo would have limited the
results’ generalizability to other male and female faces. More importantly, using only
one female photo and one male photo would confound the effect of gender with the
effect of those particular faces. It would have been impossible to know whether any
observed gender effects were true gender effects or the result of idiosyncratic
differences in the two targets (one male, one female). Using only one photo per
condition could result in Type 1 errors (falsely rejecting a null hypothesis, claiming to
find an effect or difference when in fact there is none), Type 2 errors (falsely retaining a
null hypothesis, claiming that no effect or difference exists when evidence supports its
existence), and an error that Wells and Windschitl (1999) call “diametrical error.” A
diametrical error occurs when a null hypothesis is correctly rejected, but the sample
direction of the effect is in the wrong direction, differing from the population direction of
the effect (Wells & Windschitl, 1999). Wells and Windschitl (1999) showed that failure to
87
stimulus sample could result in any of these three errors, and this compromises a
researcher’s ability to make causal inferences. Thus, while a simpler study design would
have avoided the nesting problem in this study, it would have presented other serious
problems, which would have defeated the purpose of conducting an experiment.
Another limitation is that the dependent variables are self-report, rather than
behavioral. The self-report nature of the dependent variables is appropriate given that
perceptions of prejudice and stereotyping researchers and their work were the outcome
of interest. Nevertheless, to the extent that perceptions affect behavior, it would be ideal
for future research to have some sort of behavioral outcomes. Psychologists should
want to be perceived positively by others for several reasons that extend beyond
perceptions. First, they may want to be viewed positively so that their research-based
recommendations on how to solve problems are taken seriously. Psychologists may
also desire to be perceived positively so that people in power (e.g., grant review
panelists, job search committees) will continue to allocate resources and opportunities
for research to psychologists (e.g., funding, research jobs).
Another limitation to this study is that it examined lay perceptions of prejudice
and stereotyping research, but not necessarily perceptions from the scientific
community. It is possible that some of the participants had careers in science, but it is
likely that the majority did not. Scientist perceptions of prejudice and stereotyping
research and researchers are particularly relevant on the job market. To the extent that
researcher gender could interact with audience variables (e.g., sexism, opinions
regarding scientific expertise) to affect perceptions of research quality and researcher
credibility, stereotype and prejudice researchers may miss job opportunities because a
88
different stereotype and prejudice researcher is seen as more credible, or because
researcher and audience factors combine to negatively influence the perceived quality
or importance of prejudice and stereotyping research. Future research should include
participants sampled from the scientific community, including psychologists and non-
psychologists.
Although the research presented here was focused specifically on prejudice and
stereotype research conducted by relevant stigmatized groups, this specific focus is
limiting. It may be inappropriate to generalize the specific effects found here to other
types of research or other characteristics of scientists. Future studies could examine
other types of prejudice and stereotype research (and relevant personal characteristics),
and could also compare perceptions of stereotype and prejudice research to
perceptions of other social psychological research (e.g., women who study sexism vs.
women who study judgment and decision-making, racial minorities who study racism vs.
racial minorities who study altruism).
Finally, the online nature of these studies poses some limitations. To an extent,
the online nature of this study is efficient—completing a study online rather than coming
to lab is much more convenient for most participants. Further, because these studies
were completed online, they may have had more mundane realism. The circumstances
under which participants completed these studies were probably similar to
circumstances under which participants read about research—at home, listening to
music, chatting online with friends, or switching rapidly among websites. However,
experimenters have much less environmental control in online experiments. When
participants come to the lab to participate in studies, researchers can control the

89
environment around them to minimize distraction and to mitigate any potential
extraneous influences. Unlike participants who come to the lab, there is no such control
over environmental conditions and extraneous influences with most online samples.
Implications and Conclusions
Although perceptions were the outcome of interest in these studies, the
importance of the results extend beyond perceptions to tangible outcomes. Public
perception of psychology’s scientific rigor has serious implications for the field’s future
directions (Lilienfield, 2012). There has been some research on perceptions of scientific
research. For example, a study by Wilson et al. (1993) showed that scientists were
more likely to overlook methodological flaws in a study when the topic was considered
important. In a study on perceptions of scientific research and methodology, Munro
(2010) found that people will dismiss results of scientific research that are at odds with
their own beliefs, claiming that the topic of research is not suitable for scientific
investigation. Beyond these studies, however, there is little other research (to my
knowledge) that examines lay perceptions of psychological research (and none that
specifically examines perceptions of prejudice research and researchers).
The focus of this dissertation was on psychologists who research topics that are
self-relevant, so its application to fields beyond psychology is limited but still possible.
For example, there is nothing inherent about a female or male astronomer, or a
heterosexual or homosexual geologist, that would make a third party think, “This
scientist and research is questionable because the topic is too self-relevant to the
scientist to be unbiased.” However, social psychologists are not the only scientists who
choose self-relevant fields. For example, a biologist who has cancer, or whose close
family member has cancer, may choose to study cancer treatment. A multilingual

90
neurologist may choose to study differences in patterns of brain activation between
bilingual and monolingual children. A Southeast Asian anthropologist may do field work
in Southeast Asia. To the extent that people who study self-relevant topics may be
perceived differently than their colleagues who do not study self-relevant topics, and to
the extent that this self-relevance is readily apparent (a scientist can, if possible, choose
to hide these personal characteristics), the research here may be relevant. Lay people,
job search committee members, grant review panelists, and other third parties may
differ in their opinions on what constitutes a scientific expert, and so may view scientists
differently depending on the perceived self-relevance of those scientists’ research.
These perceptions may in turn affect funding and research opportunities.
Perceptions of science and scientist credibility are important to explore
scientifically because these perceptions can affect funding and job opportunities for
scientists, thereby affecting scientists’ abilities to conduct meaningful research. For
example, prejudice researchers presenting data for a job talk or at an academic
conference may find that the validity of their work or their credibility as scientists is
devalued by their audience, depending on the audience’s opinions regarding what
constitutes expertise and their perceptions of people who study self-relevant prejudice.
A fellow graduate student and friend of mine once voiced his concern that people would
not take his research seriously, “because what does a straight, white, upper-middle
class male know about prejudice?” Similarly, another friend and graduate student said,
“I don’t want to be the Mexican studying Mexicans.” Given the impact perceptions can
have on psychologists’ ability to conduct meaningful research and apply it to solve real-
91
world problems, it is important that we understand when psychological research’s
credibility is undercut by perceptions of bias.
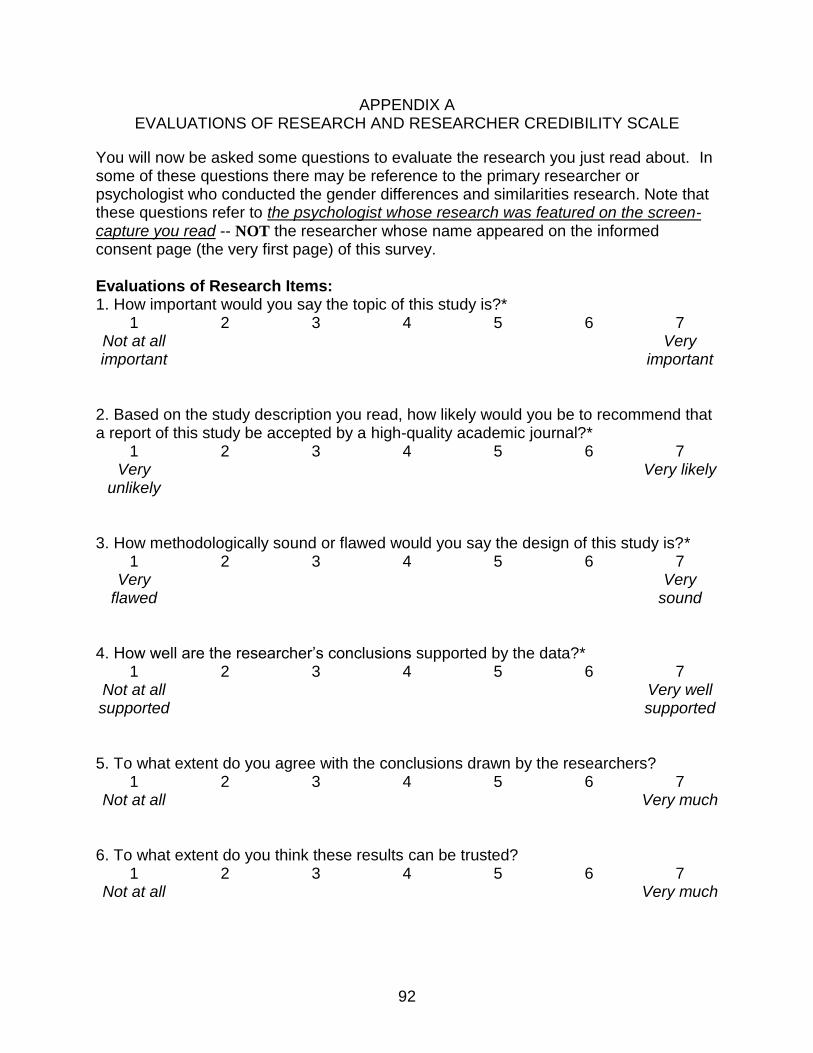
92
APPENDIX A EVALUATIONS OF RESEARCH AND RESEARCHER CREDIBILITY SCALE
You will now be asked some questions to evaluate the research you just read about. In some of these questions there may be reference to the primary researcher or psychologist who conducted the gender differences and similarities research. Note that these questions refer to the psychologist whose research was featured on the screen-capture you read -- NOT the researcher whose name appeared on the informed consent page (the very first page) of this survey. Evaluations of Research Items: 1. How important would you say the topic of this study is?*
1 2 3 4 5 6 7 Not at all important
Very important
2. Based on the study description you read, how likely would you be to recommend that a report of this study be accepted by a high-quality academic journal?*
1 2 3 4 5 6 7 Very
unlikely Very likely
3. How methodologically sound or flawed would you say the design of this study is?*
1 2 3 4 5 6 7 Very
flawed Very
sound 4. How well are the researcher’s conclusions supported by the data?*
1 2 3 4 5 6 7 Not at all supported
Very well supported
5. To what extent do you agree with the conclusions drawn by the researchers?
1 2 3 4 5 6 7 Not at all Very much
6. To what extent do you think these results can be trusted?
1 2 3 4 5 6 7 Not at all Very much
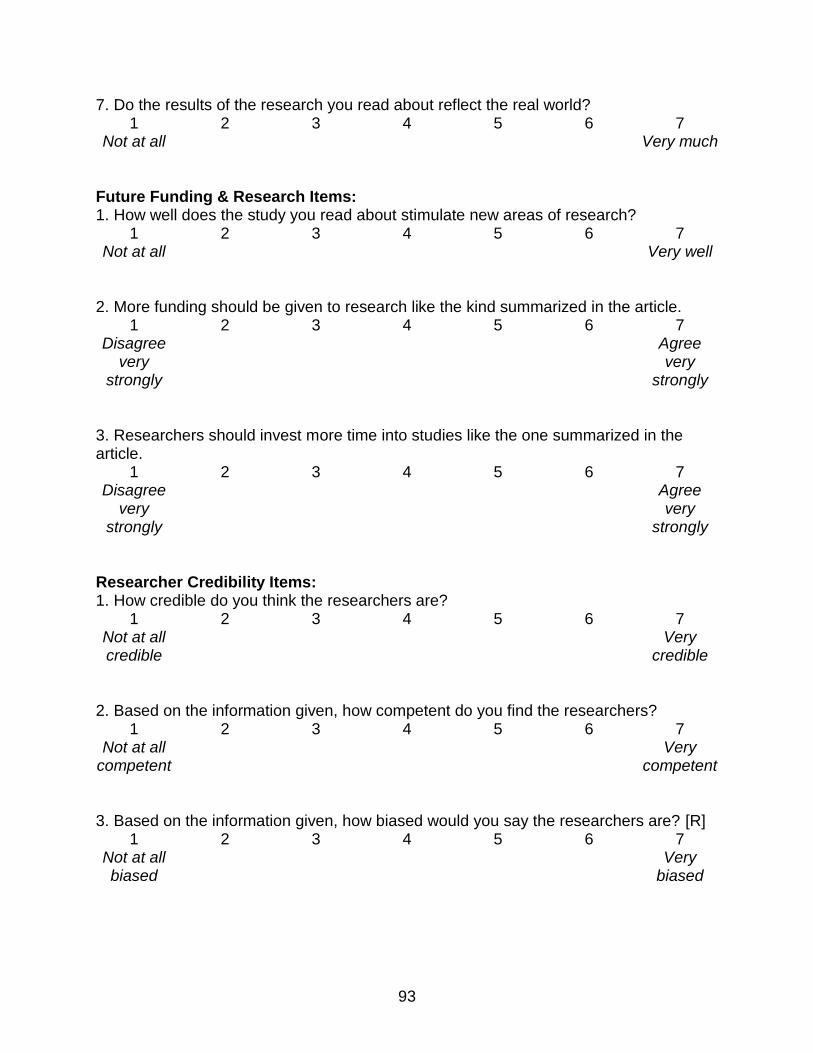
93
7. Do the results of the research you read about reflect the real world? 1 2 3 4 5 6 7
Not at all Very much Future Funding & Research Items: 1. How well does the study you read about stimulate new areas of research?
1 2 3 4 5 6 7 Not at all Very well
2. More funding should be given to research like the kind summarized in the article.
1 2 3 4 5 6 7 Disagree
very strongly
Agree very
strongly 3. Researchers should invest more time into studies like the one summarized in the article.
1 2 3 4 5 6 7 Disagree
very strongly
Agree very
strongly Researcher Credibility Items: 1. How credible do you think the researchers are?
1 2 3 4 5 6 7 Not at all credible
Very credible
2. Based on the information given, how competent do you find the researchers?
1 2 3 4 5 6 7 Not at all
competent Very
competent 3. Based on the information given, how biased would you say the researchers are? [R]
1 2 3 4 5 6 7 Not at all biased
Very biased
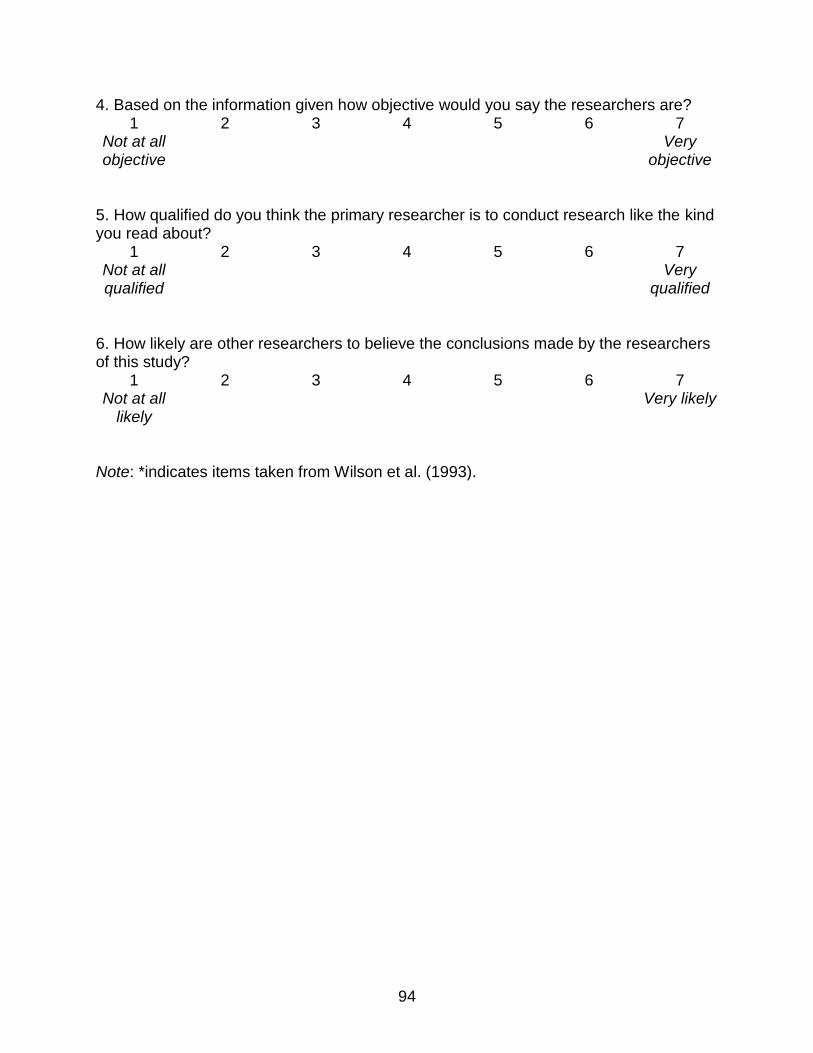
94
4. Based on the information given how objective would you say the researchers are? 1 2 3 4 5 6 7
Not at all objective
Very objective
5. How qualified do you think the primary researcher is to conduct research like the kind you read about?
1 2 3 4 5 6 7 Not at all qualified
Very qualified
6. How likely are other researchers to believe the conclusions made by the researchers of this study?
1 2 3 4 5 6 7 Not at all
likely Very likely
Note: *indicates items taken from Wilson et al. (1993).
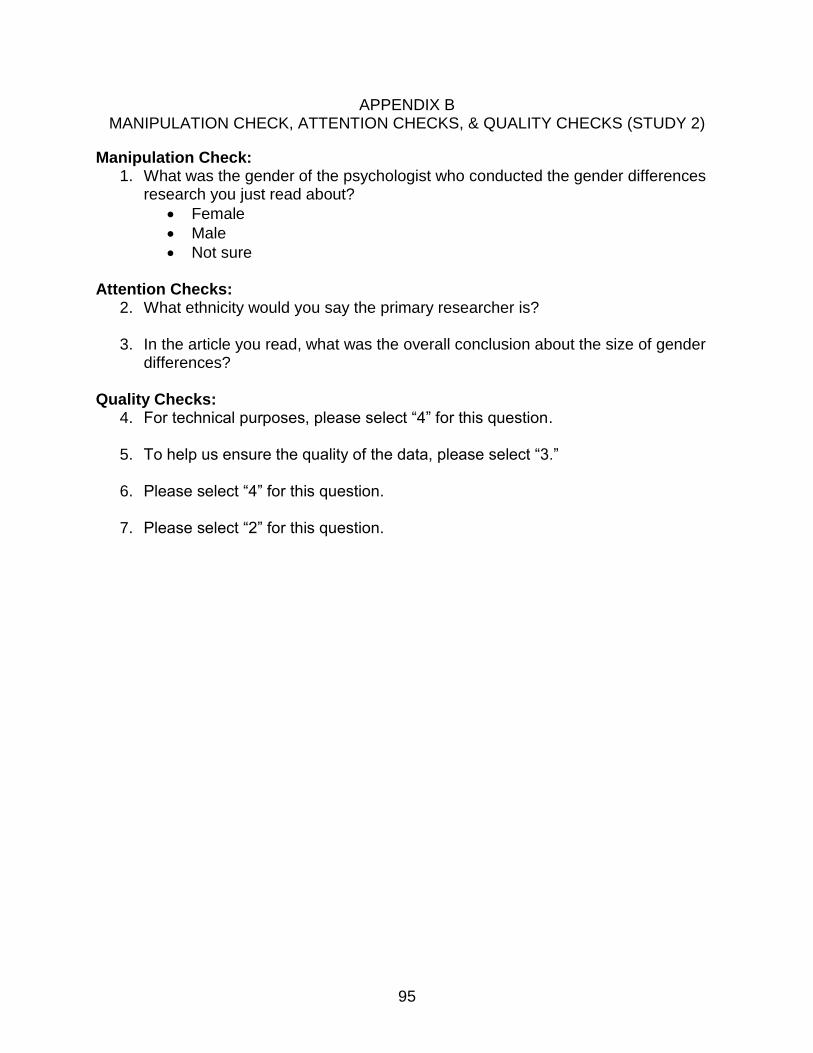
95
APPENDIX B MANIPULATION CHECK, ATTENTION CHECKS, & QUALITY CHECKS (STUDY 2)
Manipulation Check: 1. What was the gender of the psychologist who conducted the gender differences
research you just read about?
Female
Male
Not sure
Attention Checks: 2. What ethnicity would you say the primary researcher is?
3. In the article you read, what was the overall conclusion about the size of gender
differences? Quality Checks:
4. For technical purposes, please select “4” for this question.
5. To help us ensure the quality of the data, please select “3.”
6. Please select “4” for this question.
7. Please select “2” for this question.
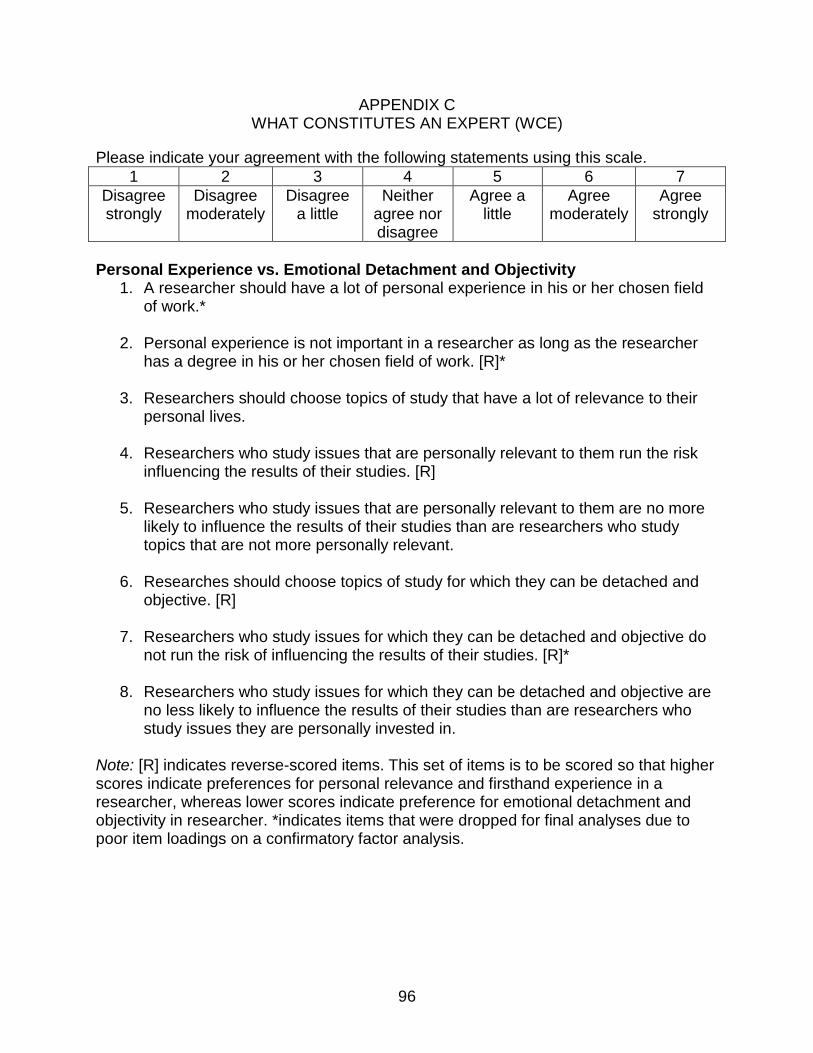
96
APPENDIX C WHAT CONSTITUTES AN EXPERT (WCE)
Please indicate your agreement with the following statements using this scale.
1 2 3 4 5 6 7
Disagree strongly
Disagree moderately
Disagree a little
Neither agree nor disagree
Agree a little
Agree moderately
Agree strongly
Personal Experience vs. Emotional Detachment and Objectivity
1. A researcher should have a lot of personal experience in his or her chosen field of work.*
2. Personal experience is not important in a researcher as long as the researcher
has a degree in his or her chosen field of work. [R]*
3. Researchers should choose topics of study that have a lot of relevance to their personal lives.
4. Researchers who study issues that are personally relevant to them run the risk
influencing the results of their studies. [R]
5. Researchers who study issues that are personally relevant to them are no more likely to influence the results of their studies than are researchers who study topics that are not more personally relevant.
6. Researches should choose topics of study for which they can be detached and
objective. [R]
7. Researchers who study issues for which they can be detached and objective do not run the risk of influencing the results of their studies. [R]*
8. Researchers who study issues for which they can be detached and objective are
no less likely to influence the results of their studies than are researchers who study issues they are personally invested in.
Note: [R] indicates reverse-scored items. This set of items is to be scored so that higher scores indicate preferences for personal relevance and firsthand experience in a researcher, whereas lower scores indicate preference for emotional detachment and objectivity in researcher. *indicates items that were dropped for final analyses due to poor item loadings on a confirmatory factor analysis.
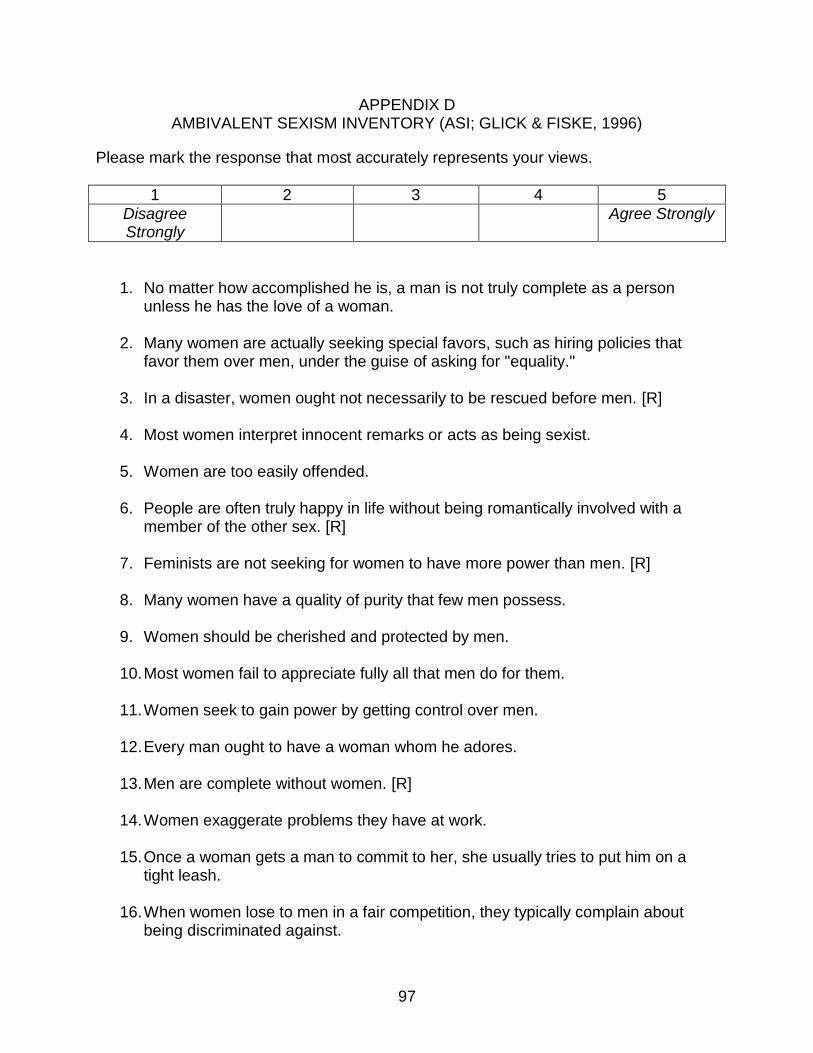
97
APPENDIX D AMBIVALENT SEXISM INVENTORY (ASI; GLICK & FISKE, 1996)
Please mark the response that most accurately represents your views.
1 2 3 4 5
Disagree Strongly
Agree Strongly
1. No matter how accomplished he is, a man is not truly complete as a person unless he has the love of a woman.
2. Many women are actually seeking special favors, such as hiring policies that
favor them over men, under the guise of asking for "equality."
3. In a disaster, women ought not necessarily to be rescued before men. [R]
4. Most women interpret innocent remarks or acts as being sexist.
5. Women are too easily offended.
6. People are often truly happy in life without being romantically involved with a member of the other sex. [R]
7. Feminists are not seeking for women to have more power than men. [R]
8. Many women have a quality of purity that few men possess.
9. Women should be cherished and protected by men.
10. Most women fail to appreciate fully all that men do for them.
11. Women seek to gain power by getting control over men.
12. Every man ought to have a woman whom he adores.
13. Men are complete without women. [R]
14. Women exaggerate problems they have at work.
15. Once a woman gets a man to commit to her, she usually tries to put him on a
tight leash.
16. When women lose to men in a fair competition, they typically complain about being discriminated against.

98
17. A good woman should be set on a pedestal by her man.
18. There are actually very few women who get a kick out of teasing men by
seeming sexually available and then refusing male advances. [R]
19. Women, compared to men, tend to have a superior moral sensibility.
20. Men should be willing to sacrifice their own well-being in order to provide financially for the women in their lives.
21. Feminists are making entirely reasonable demands of men. [R]
22. Women, as compared to men, tend to have a more refined sense of culture and
good taste. Note: [R] indicates reverse-scored items.
Benevolent subscale: items 1, 3, 6, 8, 9, 12, 13, 17, 19, 20, and 22. Hostile subscale: items 2, 4, 5, 7, 10, 11, 14, 15, 16, 18, and 21.
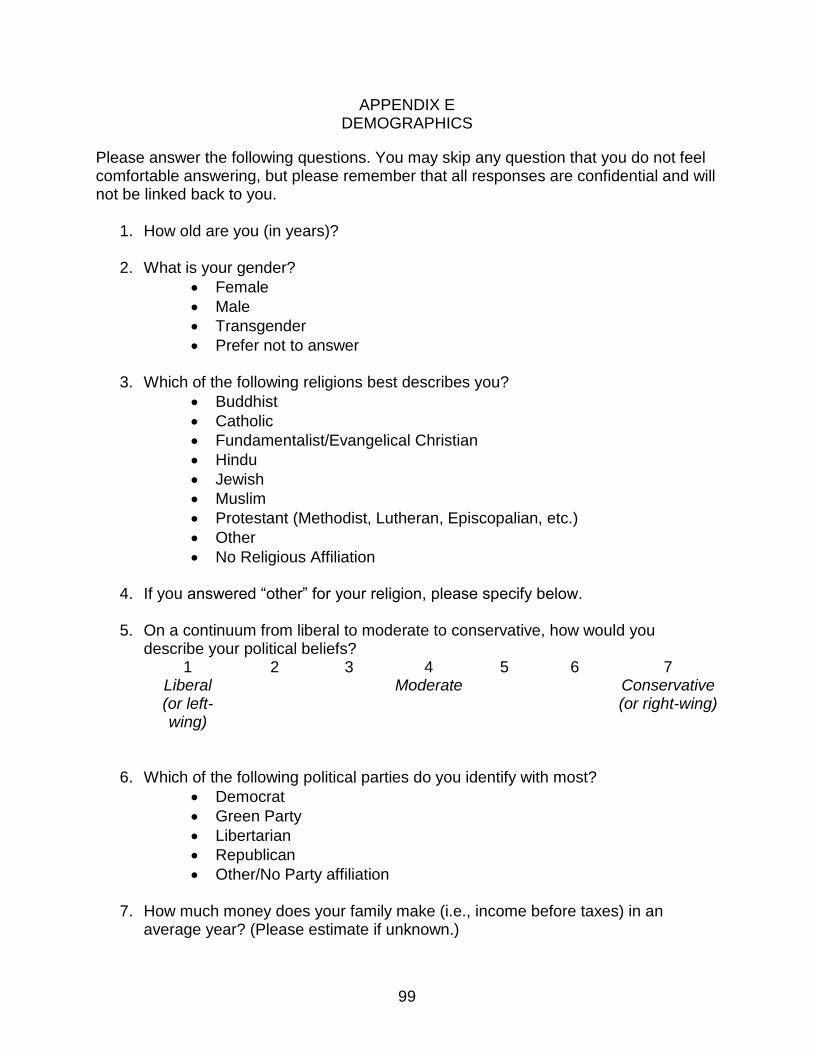
99
APPENDIX E DEMOGRAPHICS
Please answer the following questions. You may skip any question that you do not feel comfortable answering, but please remember that all responses are confidential and will not be linked back to you.
1. How old are you (in years)?
2. What is your gender?
Female
Male
Transgender
Prefer not to answer
3. Which of the following religions best describes you?
Buddhist
Catholic
Fundamentalist/Evangelical Christian
Hindu
Jewish
Muslim
Protestant (Methodist, Lutheran, Episcopalian, etc.)
Other
No Religious Affiliation
4. If you answered “other” for your religion, please specify below.
5. On a continuum from liberal to moderate to conservative, how would you describe your political beliefs?
1 2 3 4 5 6 7 Liberal (or left-wing)
Moderate Conservative (or right-wing)
6. Which of the following political parties do you identify with most?
Democrat
Green Party
Libertarian
Republican
Other/No Party affiliation
7. How much money does your family make (i.e., income before taxes) in an average year? (Please estimate if unknown.)

100
8. How much money do you make (i.e., income before taxes) in an average year? (Please estimate if unknown. Negative income is fine.)
9. How much debt do you have? (Please estimate if unknown)
10. What is the highest level of education you have completed?
Less than High School
High School/GED
Some College
2-year College Degree
4-year College Degree
Master’s Degree
Doctoral Degree
Professional Degree (JD, MD)
11. In which educational categories do you have children? Please select all that apply.
Less than 3 years old
Nursery school or preschool
Kindergarten
Elementary: grades 1-4
Elementary: grades 5-9
High school: grades 9-12
College, undergraduate
Graduate or professional school
Not applicable (don’t have children)
12. Where do you currently live (city, state, country)?
13. Where did you grow up (city, state, country)?
14. Which of the following ethnic groups do you consider yourself a member of? You can check multiple groups.
African
Asian
Caucasian/White
Hispanic/Latino(a)
Pacific Islander
Other
15. If you checked “other” for your ethnic group, please specify.
101
REFERENCES
Aiken, L. S., & West, S. G. (1991). Multiple regression: Testing and interpreting interactions. Thousand Oaks, CA US: Sage Publications, Inc.
Aronson, E., Turner, J. A., & Carlsmith, J. (1963). Communicator credibility and communication discrepancy as determinants of opinion change. The Journal Of Abnormal And Social Psychology, 67(1), 31-36. doi:10.1037/h0045513
Asch, S. E. (1956). Studies of independence and conformity: I. A minority of one against a unanimous majority. Psychological Monographs: General And Applied, 70(9), 1-70. doi:10.1037/h0093718
Ayres, I., & Siegelman, P. (1995). Race and gender discrimination in bargaining for a new car. The American Economic Review, 85 (3), 304-321.
Badash, D. (2011, April 26). Prop 8: Anti-gay lawyer’s motion to vacate Walker ruling – complete text. Retrieved from http://thenewcivilrightsmovement.com/prop-8-anti-gay-lawyers-motion-to-vacate-walker-ruling-complete-text/discrimination/2011/04/26/19289
Cacioppo, J.T., & Petty, R.E. (1986). Communication and persuasion: Central and peripheral routes to attitude change. New York: Springer-Verlag.
Chaiken, S. (1979). Communicator physical attractiveness and persuasion. Journal of Personality and Social Psychology, 37, 1387-1397.
Glick, P., & Fiske, S. T. (1996). The Ambivalent Sexism Inventory: Differentiating hostile and benevolent sexism. Journal Of Personality And Social Psychology, 70(3), 491-512. doi:10.1037/0022-3514.70.3.491
Glick, P., & Fiske, S. T. (1997). Hostile and benevolent sexism: Measuring ambivalent sexist attitudes toward women. Psychology Of Women Quarterly, 21(1), 119-135. doi:10.1111/j.1471-6402.1997.tb00104.x
Jung, J., & Kellaris, J. J. (2006). Responsiveness to authority appeals among young French and American consumers. Journal Of Business Research, 59(6), 735-744. doi:10.1016/j.jbusres.2006.01.011
Kenrick, D. T., Neuberg, S. L., & Cialdini, R. B. (2010). Social psychology: Goals in interaction (5th ed.). Boston, MA: Allyn & Bacon.
Levine, D. (2011, April 6). Gay judge never thought to drop marriage case. Retrieved from http://www.reuters.com/article/2011/04/06/us-gaymarriage-judge-idUSTRE7356TA20110406
102
Lilienfeld, S. O. (2012). Public skepticism of psychology: Why many people perceive the study of human behavior as unscientific. American Psychologist, 67(2), 111-129. doi:10.1037/a0023963
McClelland, G. H. (1997). Optimal design in psychological research. Psychological Methods, 2(1), 3-19. doi:10.1037/1082-989X.2.1.3
Munro, G. D. (2010). The scientific impotence excuse: Discounting belief-threatening scientific abstracts. Journal Of Applied Social Psychology, 40(3), 579-600. doi:10.1111/j.1559-1816.2010.00588.x
Olson, J.M., & Cal, A.V. (1984). Source credibility, attitudes, and the recall of past behaviours. European Journal of Social Psychology, 94, 757-776.
Petersen, J. L., & Hyde, J. (2010). A meta-analytic review of research on gender differences in sexuality, 1993–2007. Psychological Bulletin, 136(1), 21-38. doi:10.1037/a0017504
Ross, J., Irani, L., Silberman, M., Zaldivar, A., & Tomlinson, B. (2010, April). Who are the crowdworkers?: shifting demographics in mechanical turk. In Proceedings of the 28th of the international conference extended abstracts on Human factors in computing systems (pp. 2863-2872). ACM.
Sagarin, B. J., Cialdini, R. B., Rice, W. E., & Serna, S. B. (2002). Dispelling the illusion of invulnerability: The motivations and mechanisms of resistance to persuasion. Journal Of Personality And Social Psychology, 83(3), 526-541. doi:10.1037/0022-3514.83.3.526
Strong, S. R. (1968). Counseling: An Interpersonal Influence Process. Journal Of Counseling Psychology, 15(3), 215-224. doi:10.1037/h0020229
Walker, V.R. (2010, August). Order No C 09-2292 VRW. Retrieved from https://ecf.cand.uscourts.gov/cand/09cv2292/files/09cv2292-ORDER.pdf
Wells, G. L., & Windschitl, P. D. (1999). Stimulus sampling and social psychological experimentation. Personality And Social Psychology Bulletin, 25(9), 1115-1125. doi:10.1177/01461672992512005
Wilson, T. D., DePaulo, B. M., Mook, D. G., & Klaaren, K. J. (1993). Scientists' evaluations of research: The biasing effects of the importance of the topic. Psychological Science, 4(5), 322-325. doi:10.1111/j.1467-9280.1993.tb00572.
103
BIOGRAPHICAL SKETCH
Tatiana Orozco Schember was born in Mesa, Arizona in 1986. She graduated with
highest honors from Hamilton High School in 2004 and enrolled at Arizona State
University in August of 2004. She graduated cum laude with a Bachelor of Science in
Psychology from Arizona State University in May of 2008. She enrolled in the graduate
program for social psychology at the University of Florida in August of 2008. She earned
her M.S. in December 2010; her master’s thesis research focused on reducing prejudice
using a sociofunctional, threat-based approach. She earned her Ph.D. from the
University of Florida in August 2013; her doctoral dissertation research incorporated
social influence research and perspectives to examine lay perceptions of prejudice and
stereotype research.