Embed Size (px)
Citation preview
Presented at 70th Annual Meeting of the ORAU Council of Sponsoring Institutions
Budhendra Bhaduri Corporate Research Fellow Director, Oak Ridge Urban Dynamics Institute
March 04, 2015 Oak Ridge, TN
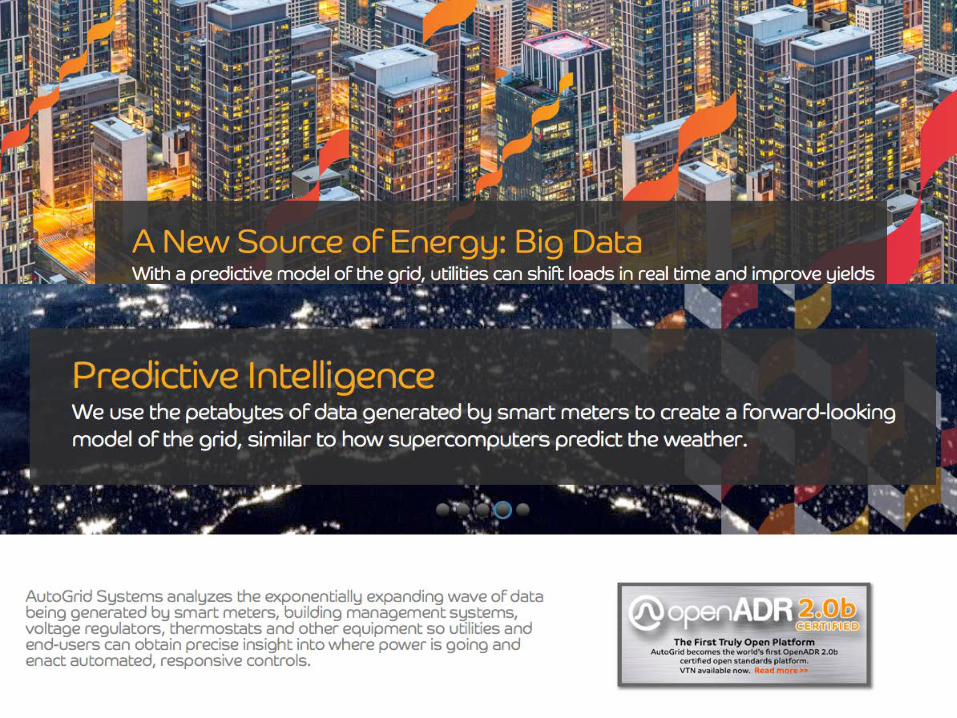
Big Data for Future Energy and Urban Infrastructures: Challenges and Opportunities
Managed by UT-Battelle for the Department of Energy
How I plan to waste your next hour
• Background – Geography and the “Big” issue
• Recent progress in data analysis – Few examples
• Data democratization – Me and my data
• Challenges and future possibilities • Disclaimer
– Almost all pictures are shamelessly borrowed from the Internet
Managed by UT-Battelle for the Department of Energy
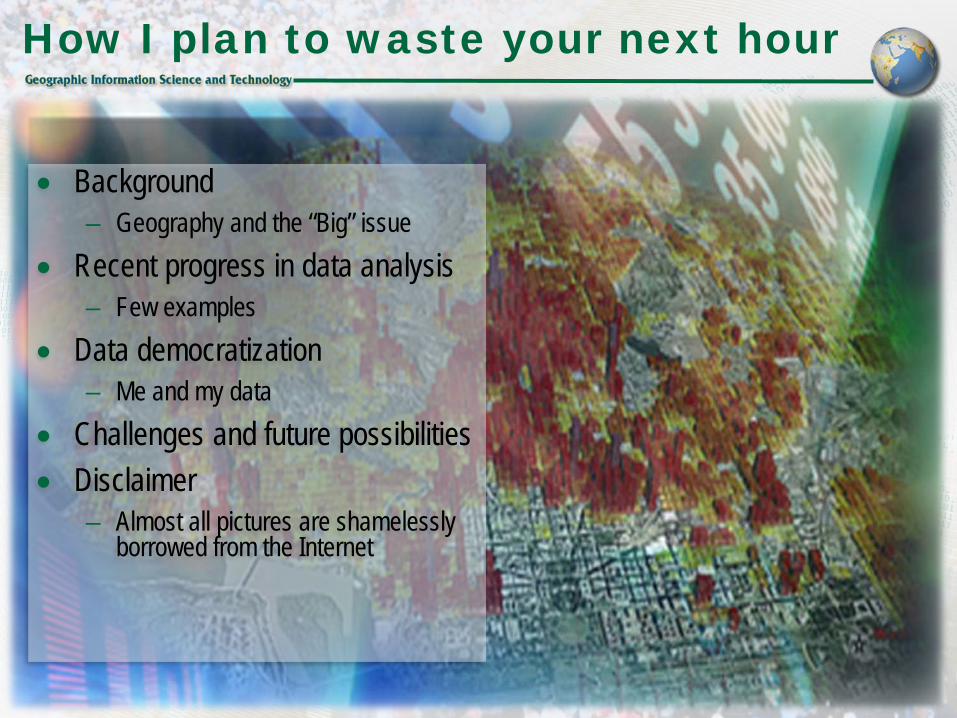
Geographic data has driven innovation
1790 First US Census. 3.9 million people counted.
Census collects data on manufacturing, quantity, and value of products. Census collects data on taxation, churches, pauperism, and crime.
1810 1850
Punched-card tabulating machines are used to count 63 million people. Tabulating Machine Company (TMC) formed.
1890 1896
TMC becomes C-T-R (Computing-Tabulating-Recording) Company. C-T-R becomes International Business Machines (IBM) Corporation.
1911 1924
First use of the phrase “geographic information system”. First commercial GIS software companies formed.
1963 1969
NASA launches first earth observation satellite (Landsat 1). First GPS satellite launched.
1972 1985
Keyhole Corp. creates dynamic 3D mapping of geographic information. Google Earth initiates the “Web Wide World” and visual discovery.
2001 2004
Intelligent Locational Awareness: Real time access to multidimensional information of locations, states, and environments of entities. 20??
Managed by UT-Battelle for the Department of Energy
5 Managed by UT-Battelle for the U.S. Department of Energy
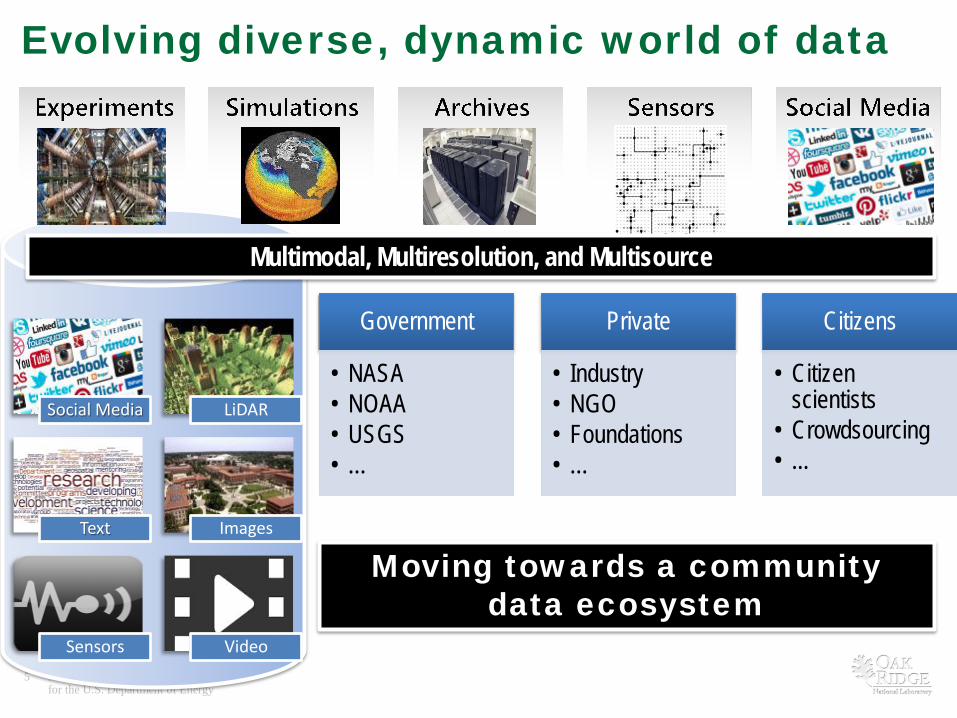
Evolving diverse, dynamic world of data
Social Media LiDAR
Text Images
Sensors Video
Government
• NASA • NOAA • USGS • …
Private
• Industry • NGO • Foundations • …
Citizens
• Citizen scientists
• Crowdsourcing • ...
Multimodal, Multiresolution, and Multisource
Moving towards a community data ecosystem
Managed by UT-Battelle for the Department of Energy
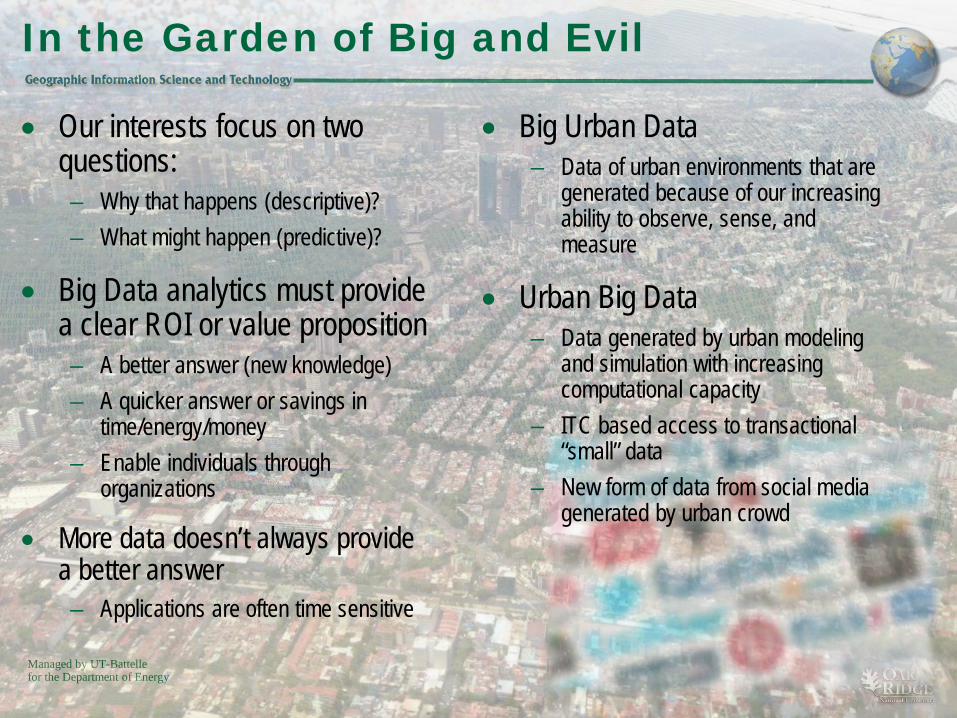
In the Garden of Big and Evil
• Our interests focus on two questions: – Why that happens (descriptive)? – What might happen (predictive)?
• Big Data analytics must provide a clear ROI or value proposition – A better answer (new knowledge) – A quicker answer or savings in
time/energy/money – Enable individuals through
organizations
• More data doesn’t always provide a better answer – Applications are often time sensitive
• Big Urban Data – Data of urban environments that are
generated because of our increasing ability to observe, sense, and measure
• Urban Big Data – Data generated by urban modeling
and simulation with increasing computational capacity
– ITC based access to transactional “small” data
– New form of data from social media generated by urban crowd

7 Presentation name
Managed by UT-Battelle for the Department of Energy
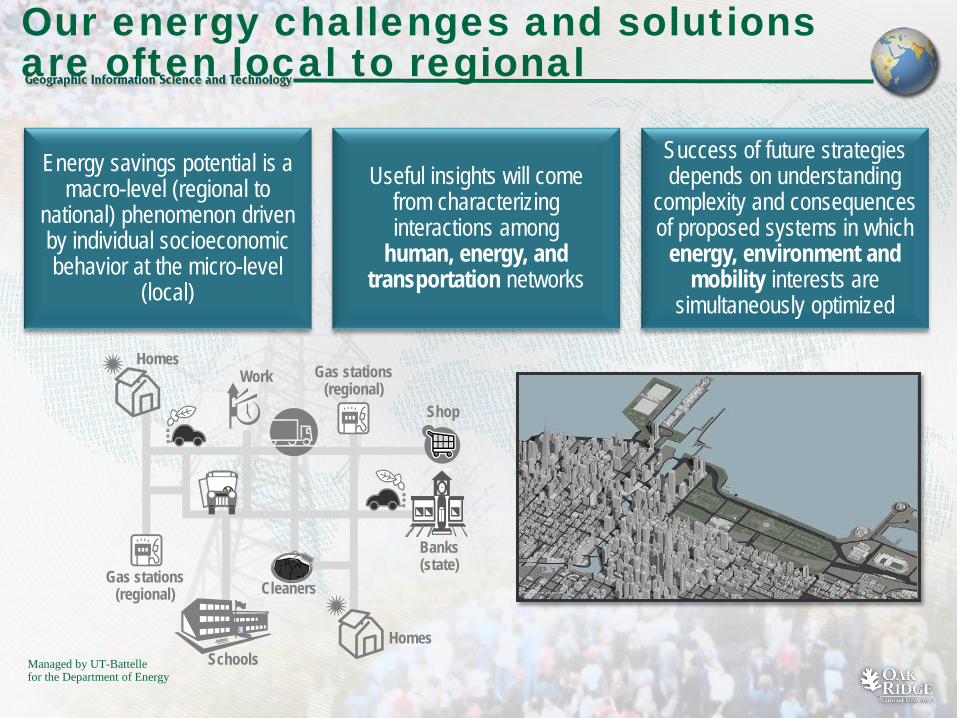
Our energy challenges and solutions are often local to regional
Energy savings potential is a macro-level (regional to
national) phenomenon driven by individual socioeconomic behavior at the micro-level
(local)
Homes Schools
Gas stations (regional)
Shop
Banks (state)
Work
Cleaners
Homes Gas stations
(regional)
Useful insights will come from characterizing interactions among
human, energy, and transportation networks
Success of future strategies depends on understanding
complexity and consequences of proposed systems in which
energy, environment and mobility interests are
simultaneously optimized
9 Presentation name
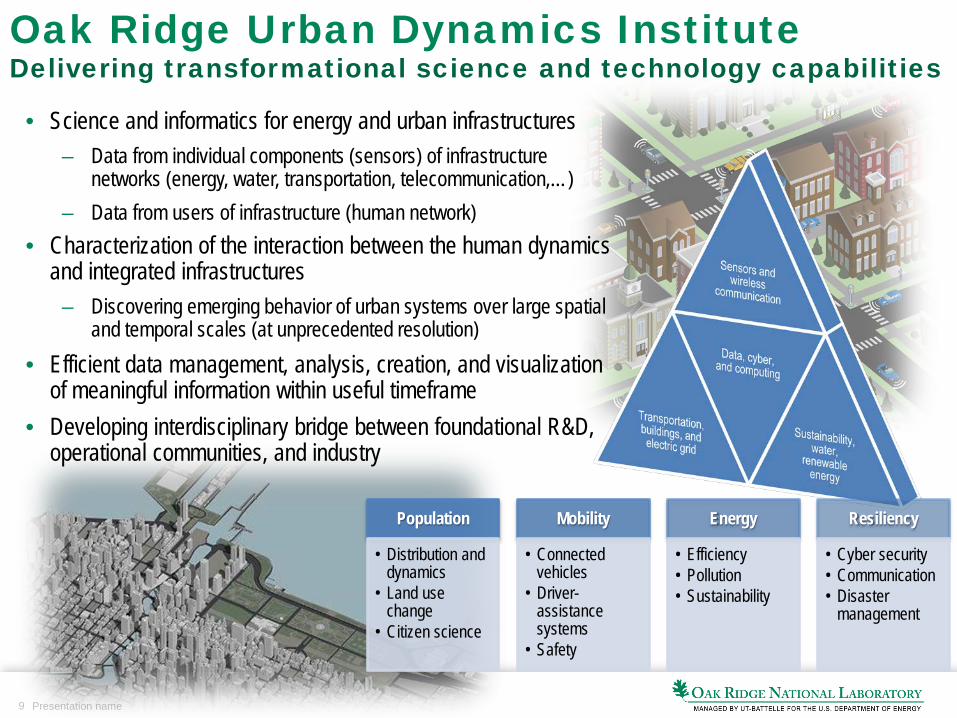
Oak Ridge Urban Dynamics Institute
• Science and informatics for energy and urban infrastructures – Data from individual components (sensors) of infrastructure
networks (energy, water, transportation, telecommunication,…) – Data from users of infrastructure (human network)
• Characterization of the interaction between the human dynamics and integrated infrastructures
– Discovering emerging behavior of urban systems over large spatial and temporal scales (at unprecedented resolution)
• Efficient data management, analysis, creation, and visualization of meaningful information within useful timeframe
• Developing interdisciplinary bridge between foundational R&D, operational communities, and industry
Population
• Distribution and dynamics
• Land use change
• Citizen science
Mobility
• Connected vehicles
• Driver-assistance systems
• Safety
Energy
• Efficiency • Pollution • Sustainability
Resiliency
• Cyber security • Communication • Disaster
management
Delivering transformational science and technology capabilities

Managed by UT-Battelle for the Department of Energy
Managed by UT-Battelle for the Department of Energy
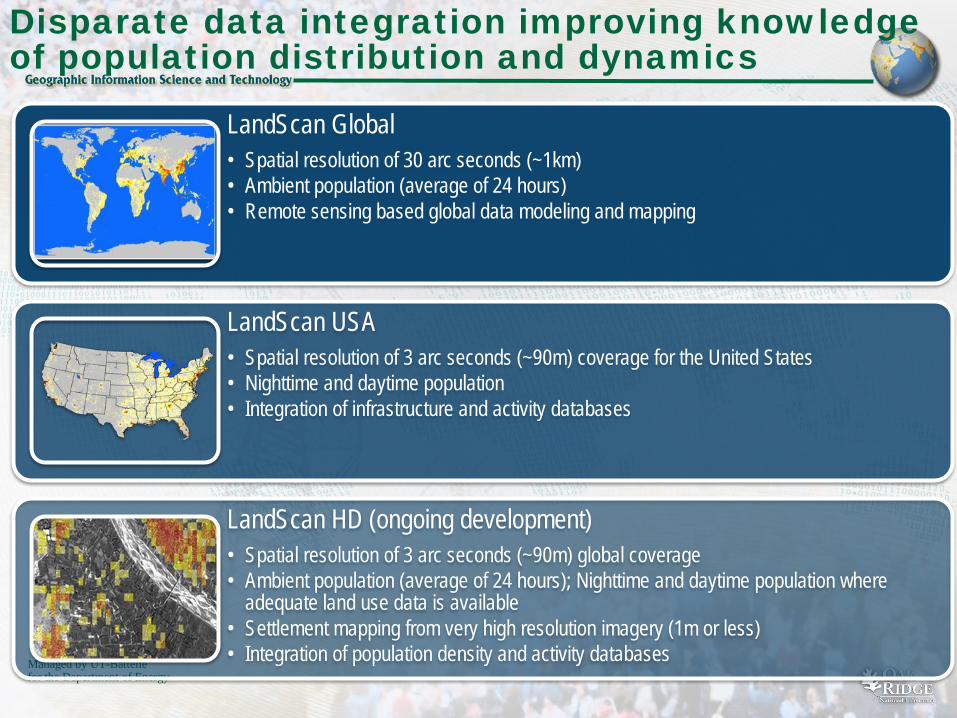
Disparate data integration improving knowledge of population distribution and dynamics
LandScan Global • Spatial resolution of 30 arc seconds (~1km) • Ambient population (average of 24 hours) • Remote sensing based global data modeling and mapping
LandScan USA • Spatial resolution of 3 arc seconds (~90m) coverage for the United States • Nighttime and daytime population • Integration of infrastructure and activity databases
LandScan HD (ongoing development) • Spatial resolution of 3 arc seconds (~90m) global coverage • Ambient population (average of 24 hours); Nighttime and daytime population where
adequate land use data is available • Settlement mapping from very high resolution imagery (1m or less) • Integration of population density and activity databases
Managed by UT-Battelle for the Department of Energy
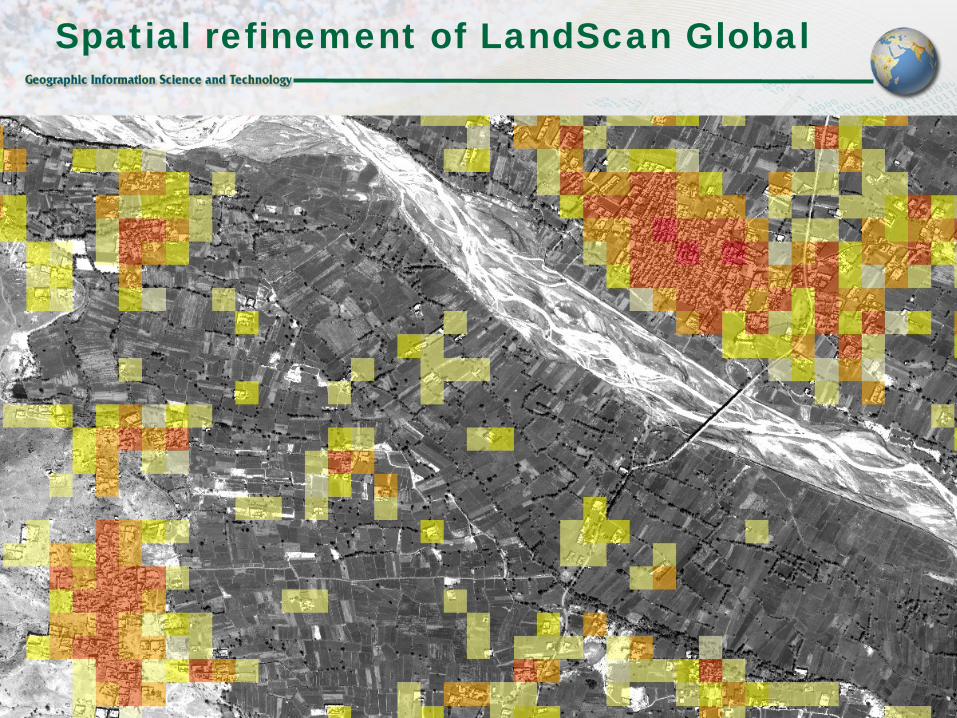
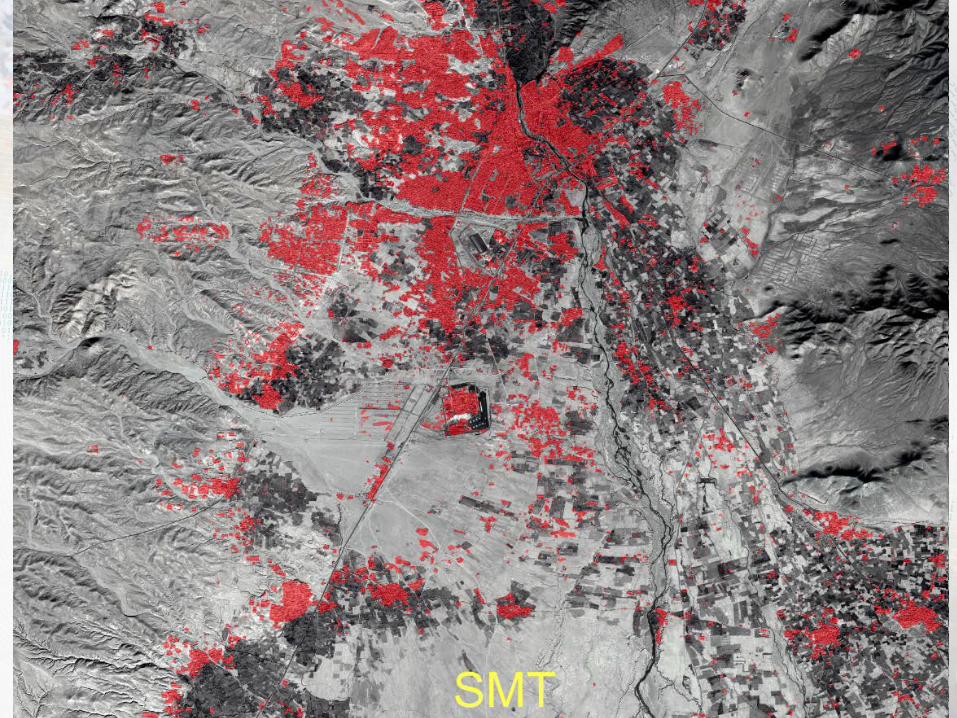
Spatial refinement of LandScan Global
Managed by UT-Battelle for the Department of Energy
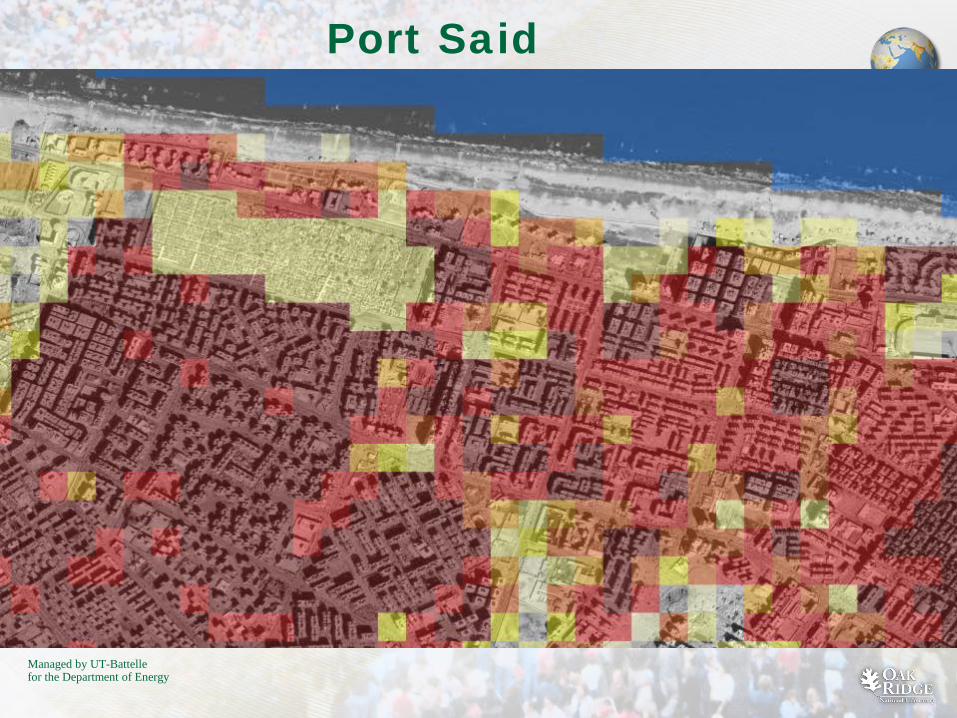
Port Said
Managed by UT-Battelle for the Department of Energy
“Developed Land Cover” Examples

Managed by UT-Battelle for the Department of Energy
Addis Ababa, Ethiopia
2 Xeon Quad core 2.4GHz CPUs + 4 Tesla GPUs + 48GB
Image analyzed (0.3m) 40,000x40,000 pixels
(800 sq. km) RGB bands
Overall accuracy 93% Settlement class 89% Non-settlement class
94%
Total processing time 27 seconds

Managed by UT-Battelle for the Department of Energy
Managed by UT-Battelle for the Department of Energy
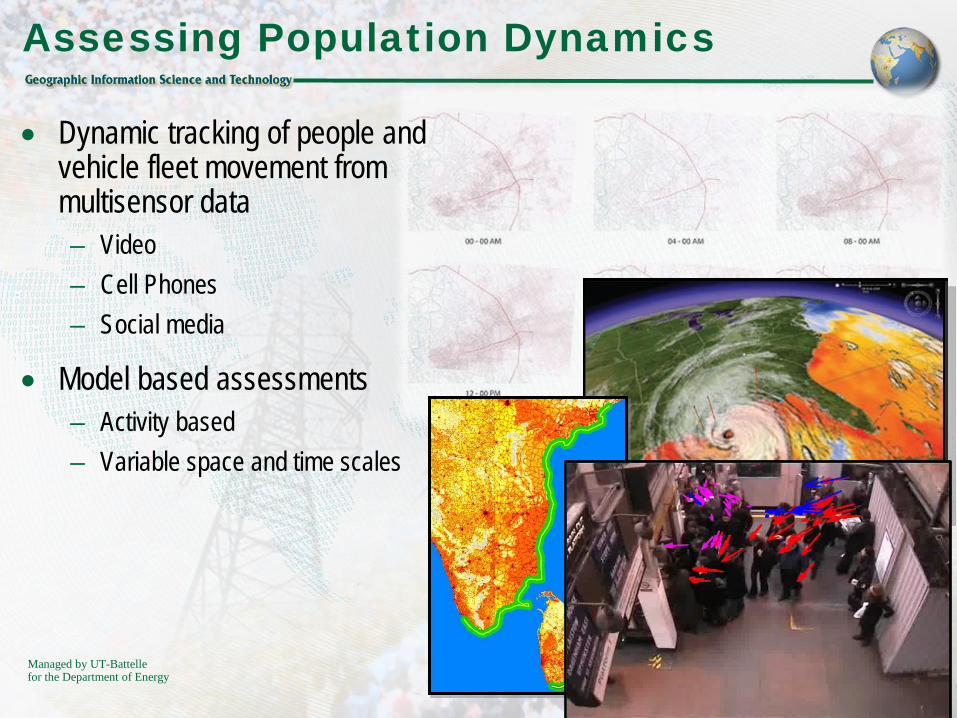
Assessing Population Dynamics
• Dynamic tracking of people and vehicle fleet movement from multisensor data – Video – Cell Phones – Social media
• Model based assessments – Activity based – Variable space and time scales

Managed by UT-Battelle for the Department of Energy
19 Presentation name
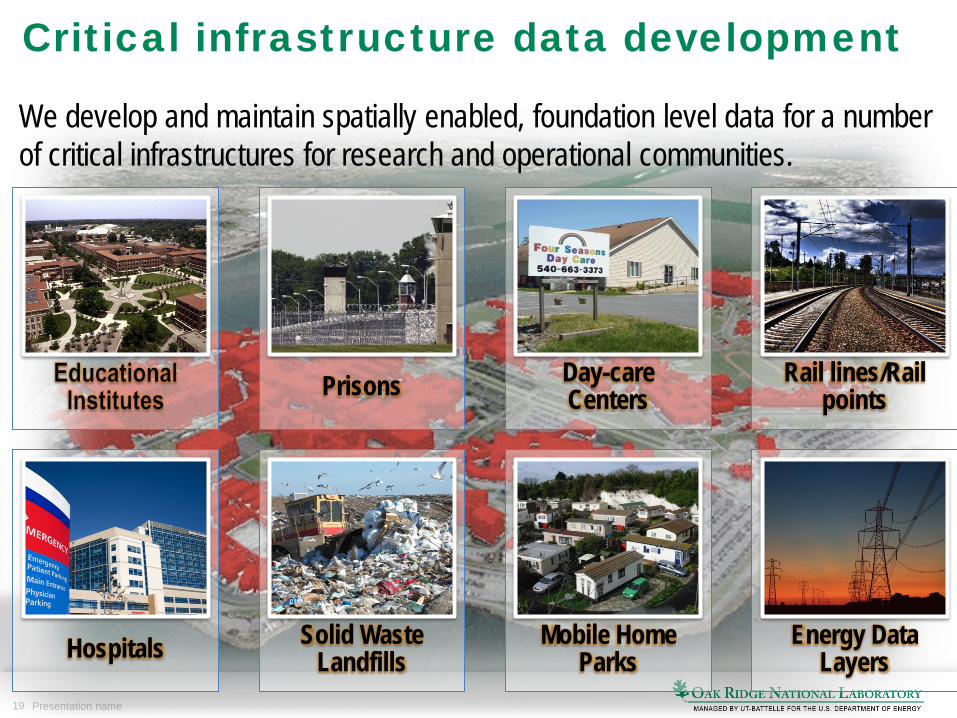
Critical infrastructure data development
Prisons Day-care Centers
Rail lines/Rail points
Hospitals Solid Waste Landfills
Mobile Home Parks
Energy Data Layers
We develop and maintain spatially enabled, foundation level data for a number of critical infrastructures for research and operational communities.
20 Presentation name
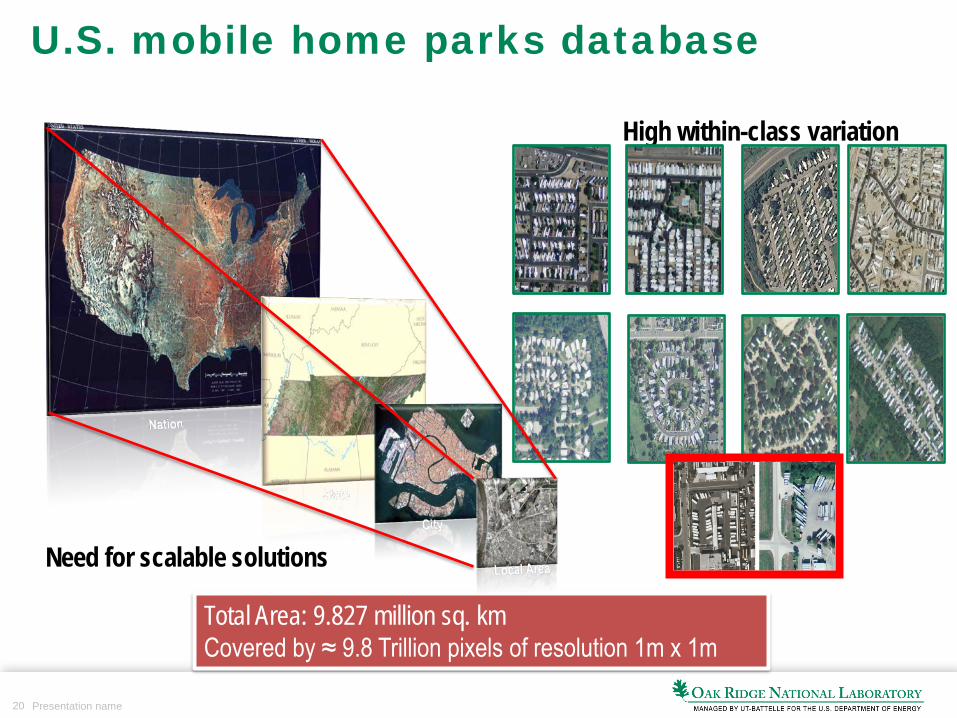
U.S. mobile home parks database
High within-class variation
Need for scalable solutions
Total Area: 9.827 million sq. km Covered by ≈ 9.8 Trillion pixels of resolution 1m x 1m
21 Presentation name
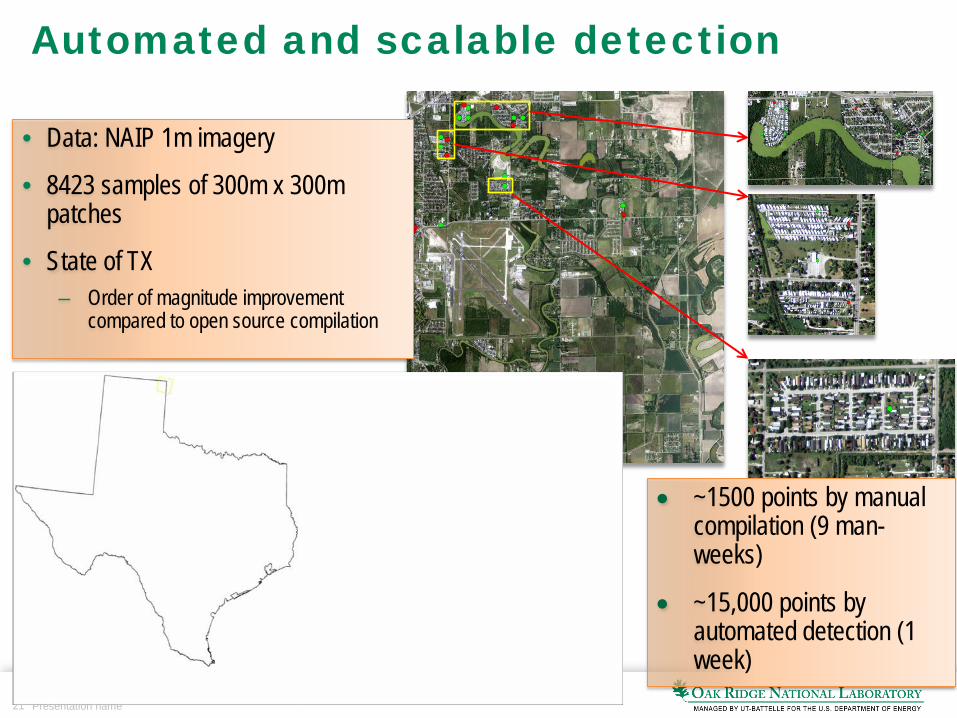
Automated and scalable detection
Database point Detected point
• Data: NAIP 1m imagery
• 8423 samples of 300m x 300m patches
• State of TX – Order of magnitude improvement
compared to open source compilation
• ~1500 points by manual compilation (9 man-weeks)
• ~15,000 points by automated detection (1 week)
Managed by UT-Battelle for the Department of Energy
Managed by UT-Battelle for the Department of Energy
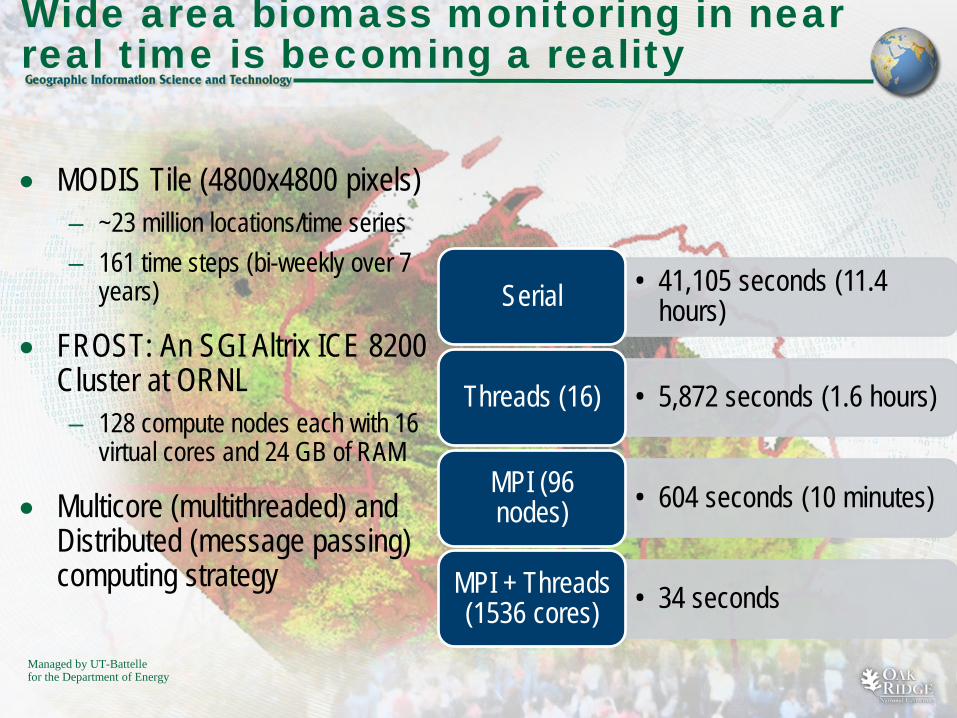
Wide area biomass monitoring in near real time is becoming a reality
• 41,105 seconds (11.4 hours) Serial
• 5,872 seconds (1.6 hours) Threads (16)
• 604 seconds (10 minutes) MPI (96 nodes)
• 34 seconds MPI + Threads (1536 cores)
• MODIS Tile (4800x4800 pixels) – ~23 million locations/time series – 161 time steps (bi-weekly over 7
years)
• FROST: An SGI Altrix ICE 8200 Cluster at ORNL – 128 compute nodes each with 16
virtual cores and 24 GB of RAM
• Multicore (multithreaded) and Distributed (message passing) computing strategy
Managed by UT-Battelle for the Department of Energy
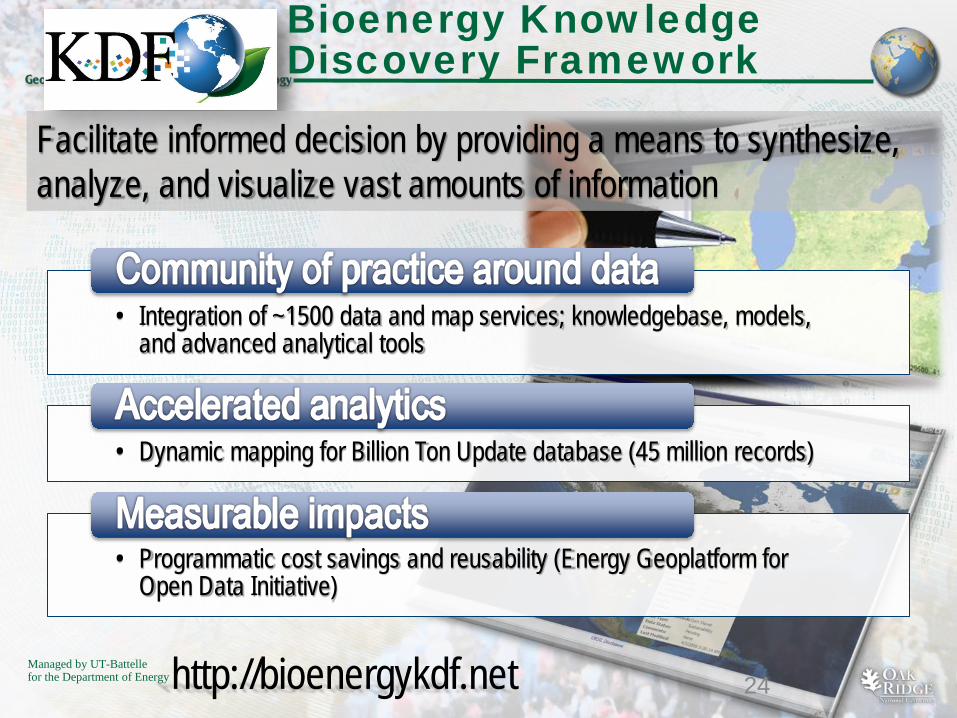
Bioenergy Knowledge Discovery Framework
• Integration of ~1500 data and map services; knowledgebase, models, and advanced analytical tools
• Dynamic mapping for Billion Ton Update database (45 million records)
• Programmatic cost savings and reusability (Energy Geoplatform for Open Data Initiative)
24
Facilitate informed decision by providing a means to synthesize, analyze, and visualize vast amounts of information
http://bioenergykdf.net
25 Managed by UT-Battelle for the U.S. Department of Energy KUB_0905
Managed by UT-Battelle for the Department of Energy
Managed by UT-Battelle for the Department of Energy
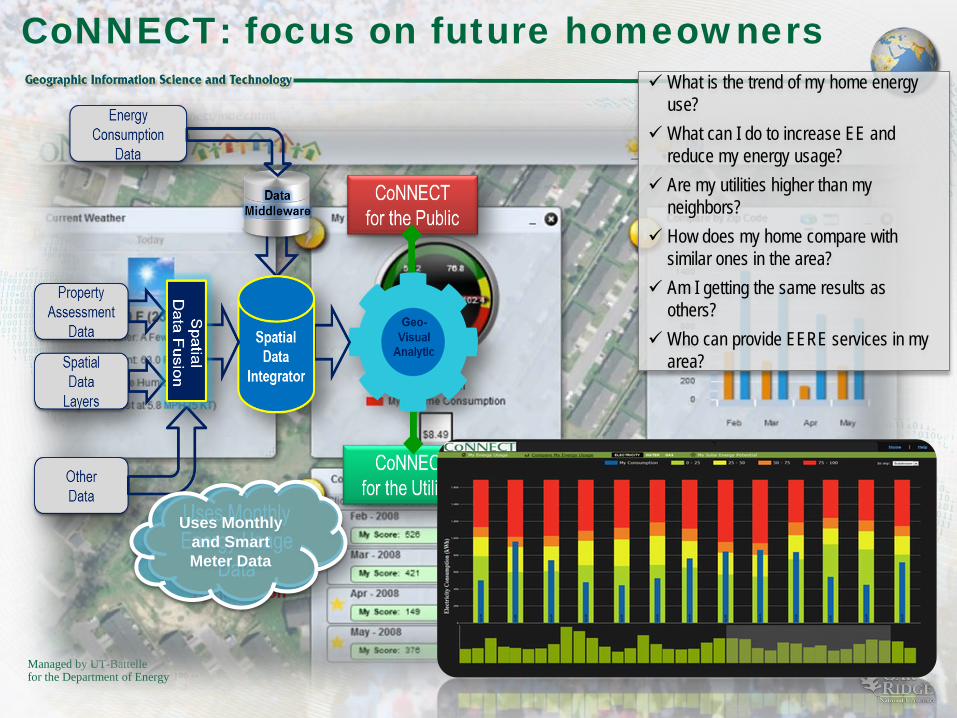
CoNNECT: focus on future homeowners
New User Registration
What is the trend of my home energy use?
What can I do to increase EE and reduce my energy usage?
Are my utilities higher than my neighbors?
How does my home compare with similar ones in the area?
Am I getting the same results as others?
Who can provide EERE services in my area?
Uses Monthly and Smart Meter Data
Managed by UT-Battelle for the Department of Energy
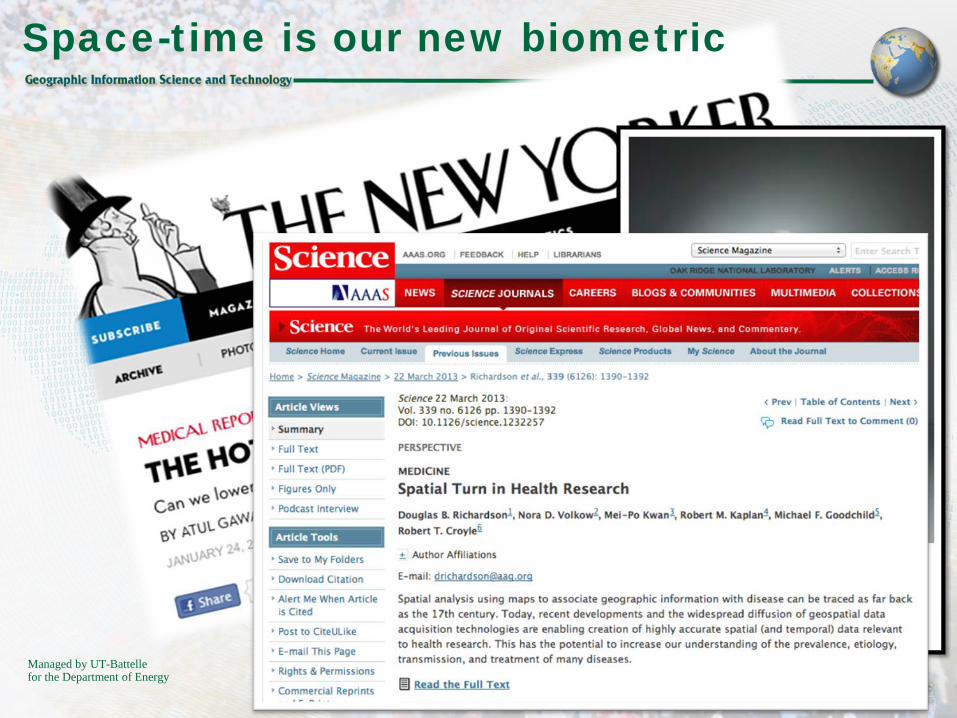
Space-time is our new biometric
29 Managed by UT-Battelle for the U.S. Department of Energy KUB_0905
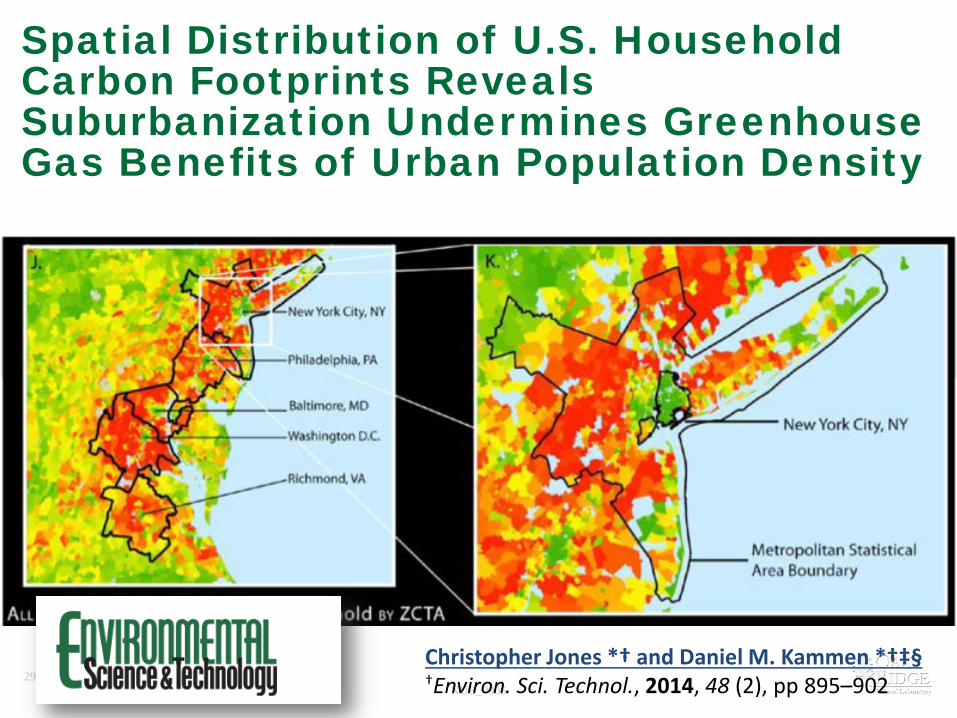
Spatial Distribution of U.S. Household Carbon Footprints Reveals Suburbanization Undermines Greenhouse Gas Benefits of Urban Population Density
Christopher Jones *† and Daniel M. Kammen *†‡§ †Environ. Sci. Technol., 2014, 48 (2), pp 895–902
Managed by UT-Battelle for the Department of Energy
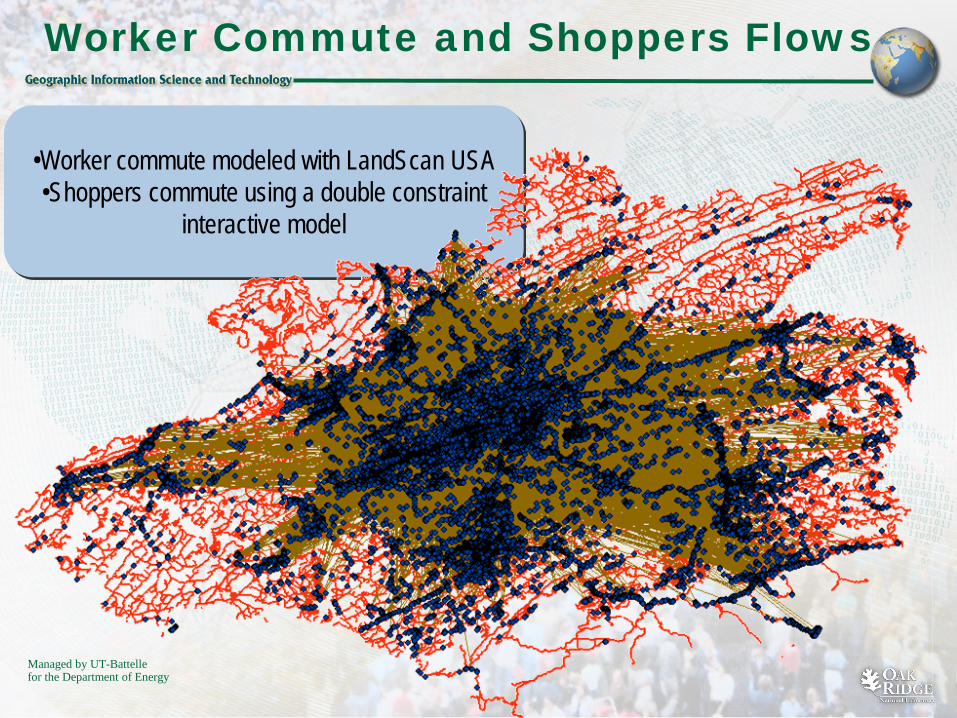
Worker Commute and Shoppers Flows
•Worker commute modeled with LandScan USA •Shoppers commute using a double constraint
interactive model
Managed by UT-Battelle for the Department of Energy
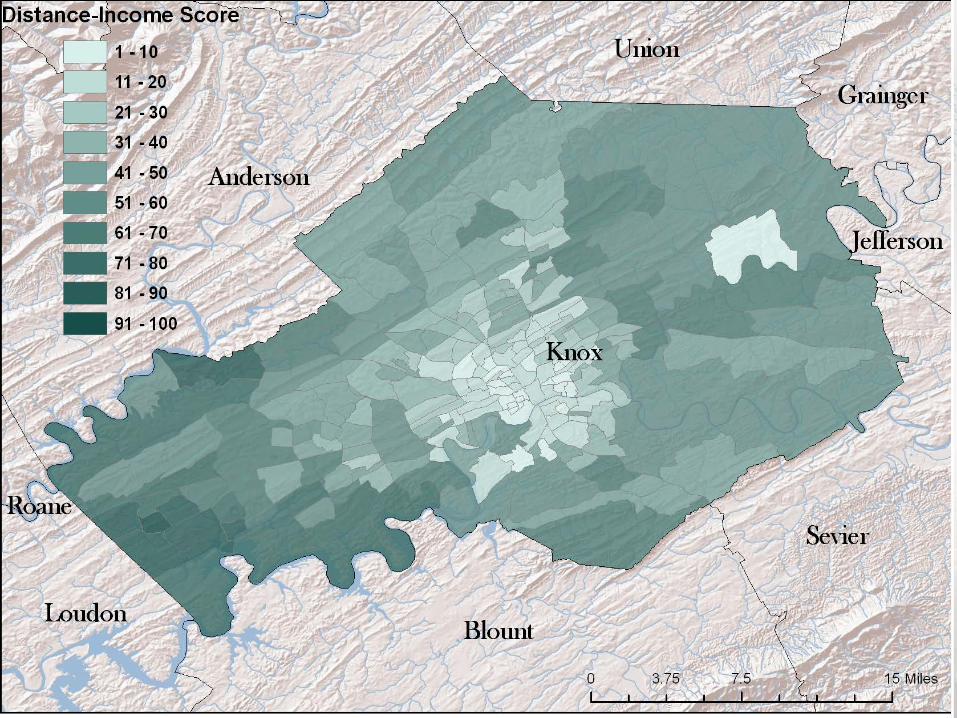
Each Way to Work
Managed by UT-Battelle for the Department of Energy
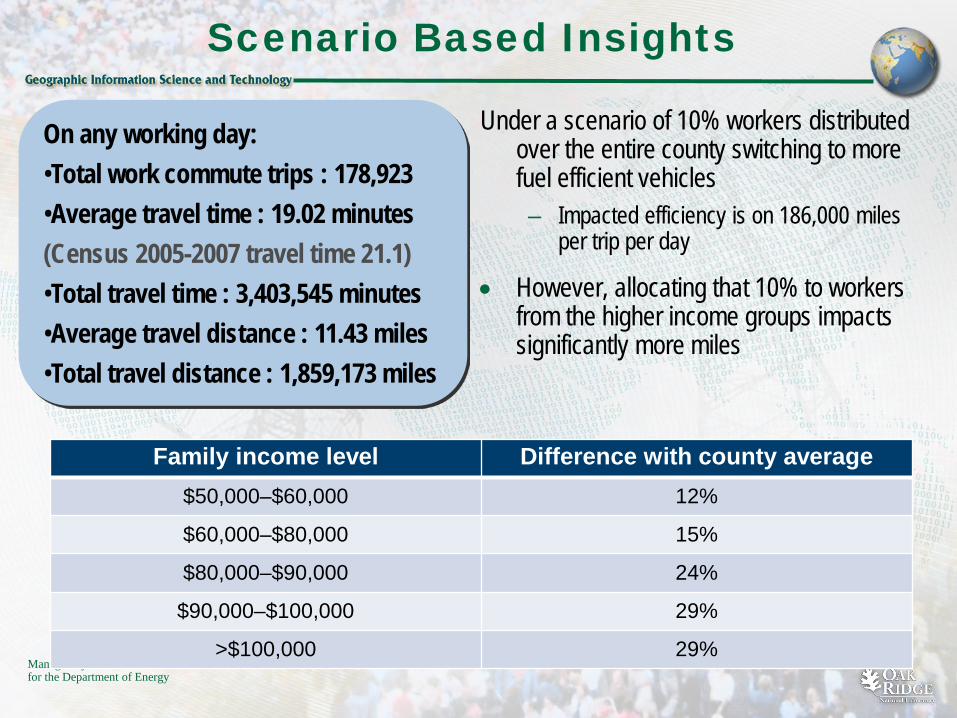
Scenario Based Insights
Under a scenario of 10% workers distributed over the entire county switching to more fuel efficient vehicles – Impacted efficiency is on 186,000 miles
per trip per day
• However, allocating that 10% to workers from the higher income groups impacts significantly more miles
Family income level Difference with county average $50,000–$60,000 12%
$60,000–$80,000 15%
$80,000–$90,000 24%
$90,000–$100,000 29%
>$100,000 29%
On any working day: •Total work commute trips : 178,923 •Average travel time : 19.02 minutes (Census 2005-2007 travel time 21.1) •Total travel time : 3,403,545 minutes •Average travel distance : 11.43 miles •Total travel distance : 1,859,173 miles
Managed by UT-Battelle for the Department of Energy
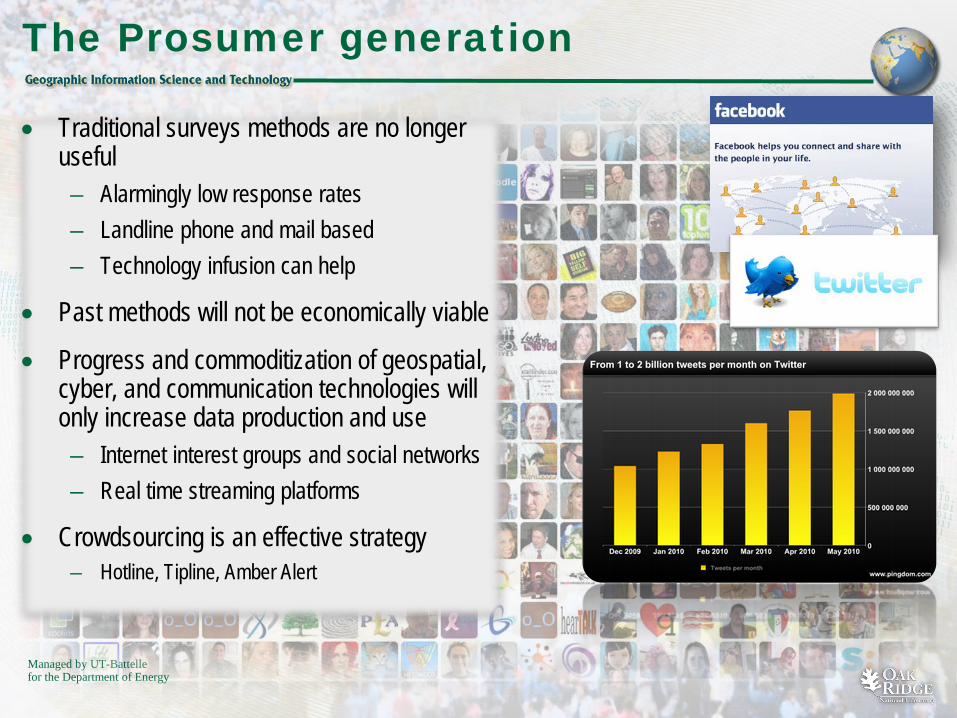
The Prosumer generation
• Traditional surveys methods are no longer useful – Alarmingly low response rates – Landline phone and mail based – Technology infusion can help
• Past methods will not be economically viable
• Progress and commoditization of geospatial, cyber, and communication technologies will only increase data production and use – Internet interest groups and social networks – Real time streaming platforms
• Crowdsourcing is an effective strategy – Hotline, Tipline, Amber Alert

Managed by UT-Battelle for the Department of Energy
The unknown unknowns
Sustainability
Credibility
Ownership
Privacy
• But is a 50% nonrandom sample better than a 5% random sample?
Managed by UT-Battelle for the Department of Energy
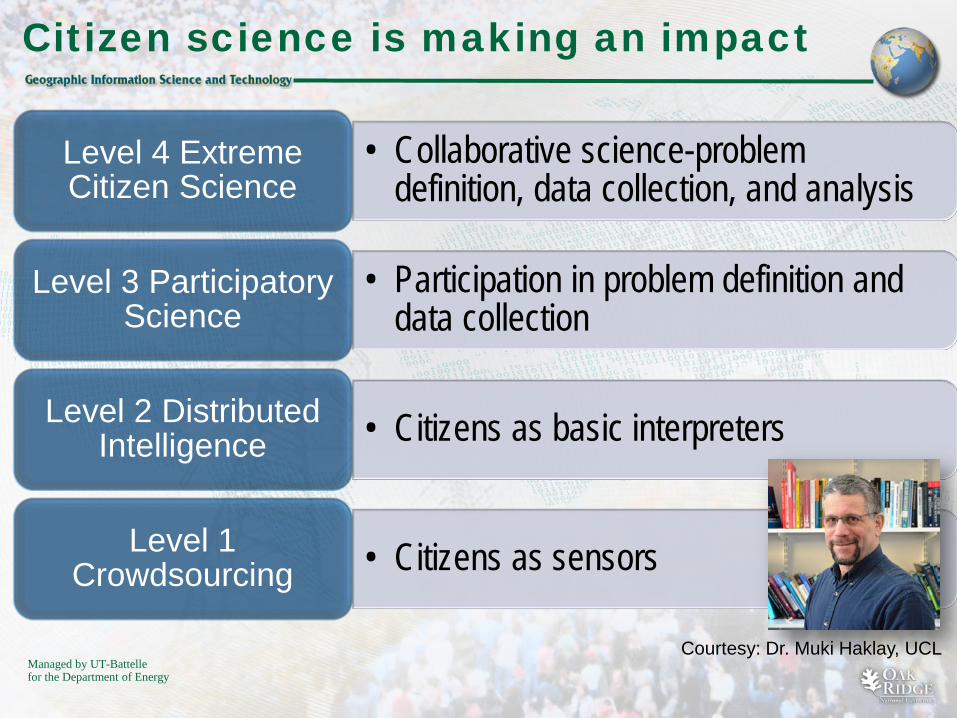
Citizen science is making an impact
• Collaborative science-problem definition, data collection, and analysis
Level 4 Extreme Citizen Science
• Participation in problem definition and data collection
Level 3 Participatory Science
• Citizens as basic interpreters Level 2 Distributed Intelligence
• Citizens as sensors Level 1 Crowdsourcing
Courtesy: Dr. Muki Haklay, UCL
Managed by UT-Battelle for the Department of Energy
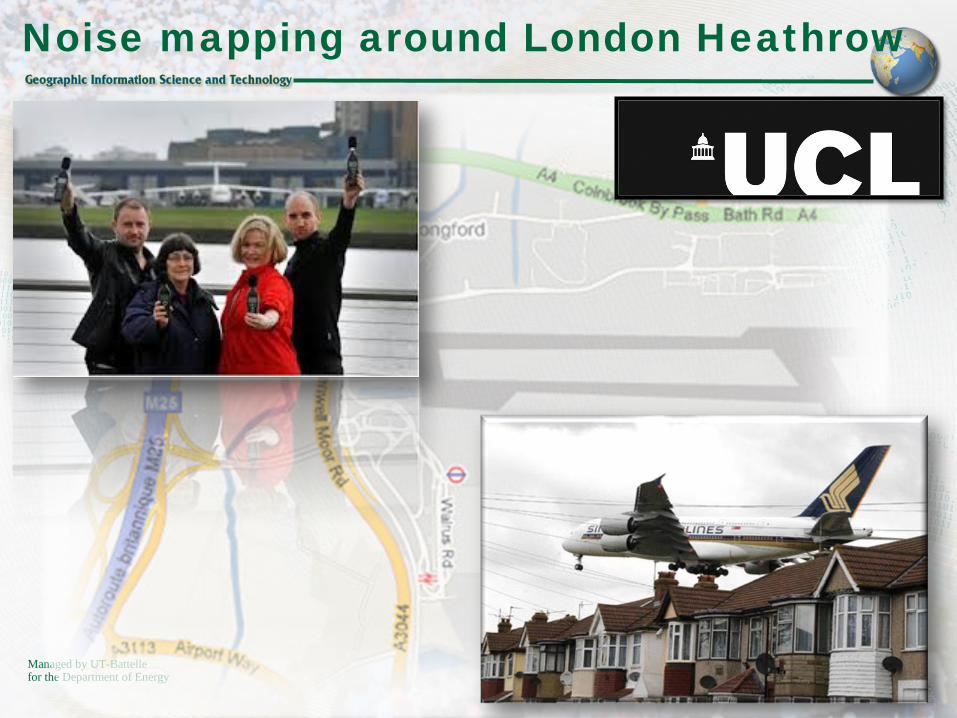
Noise mapping around London Heathrow
37 Presentation name
Managed by UT-Battelle for the Department of Energy
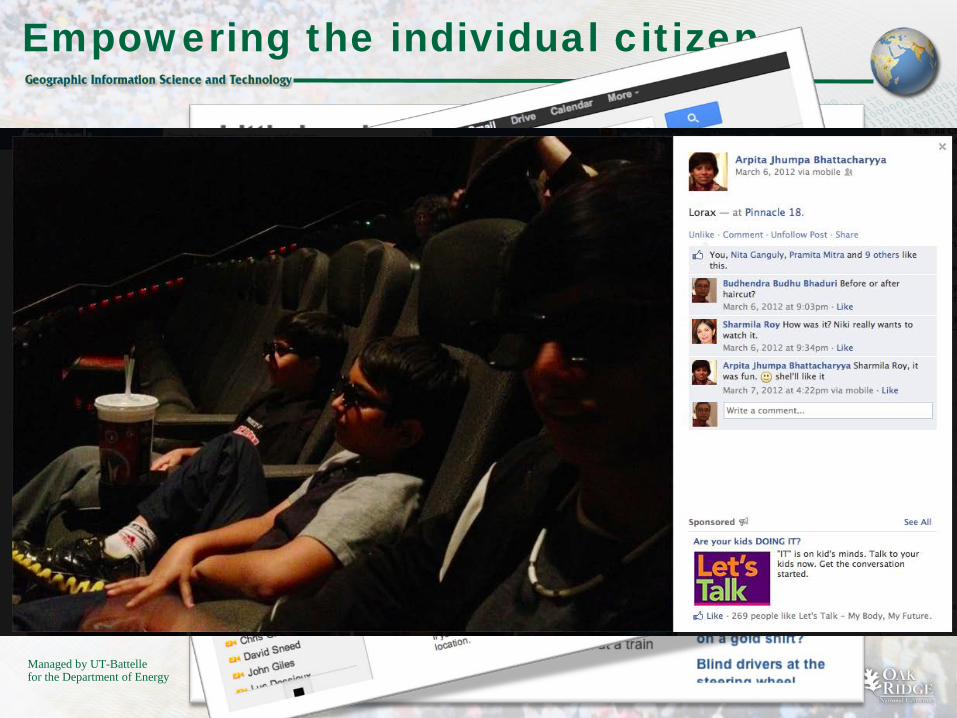
Empowering the individual citizen
Managed by UT-Battelle for the Department of Energy
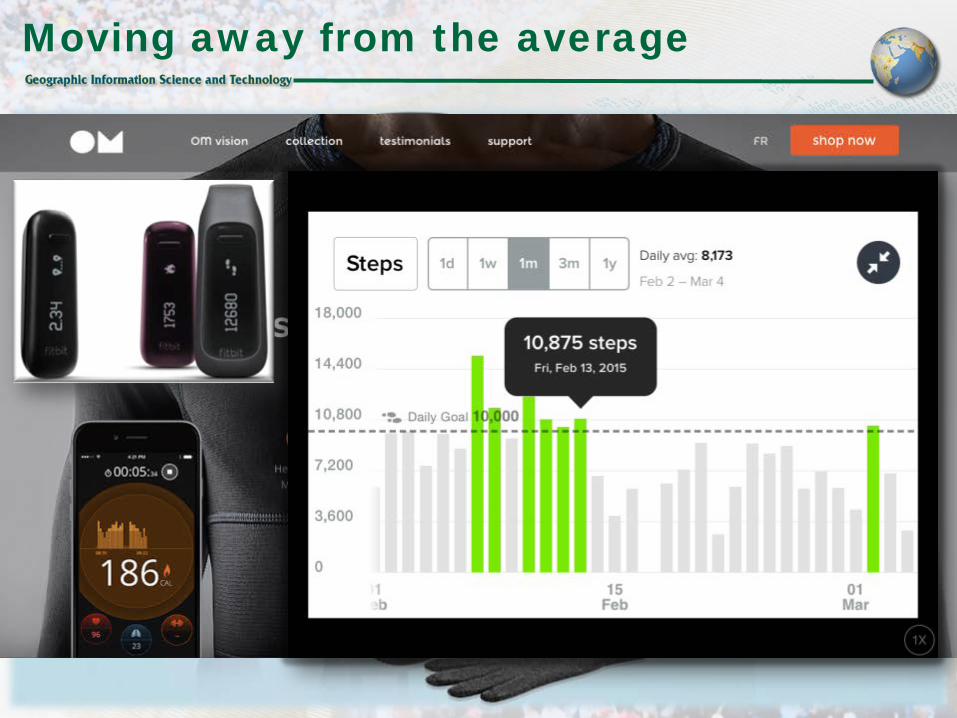
Moving away from the average
40 Managed by UT-Battelle for the U.S. Department of Energy Presentation_name
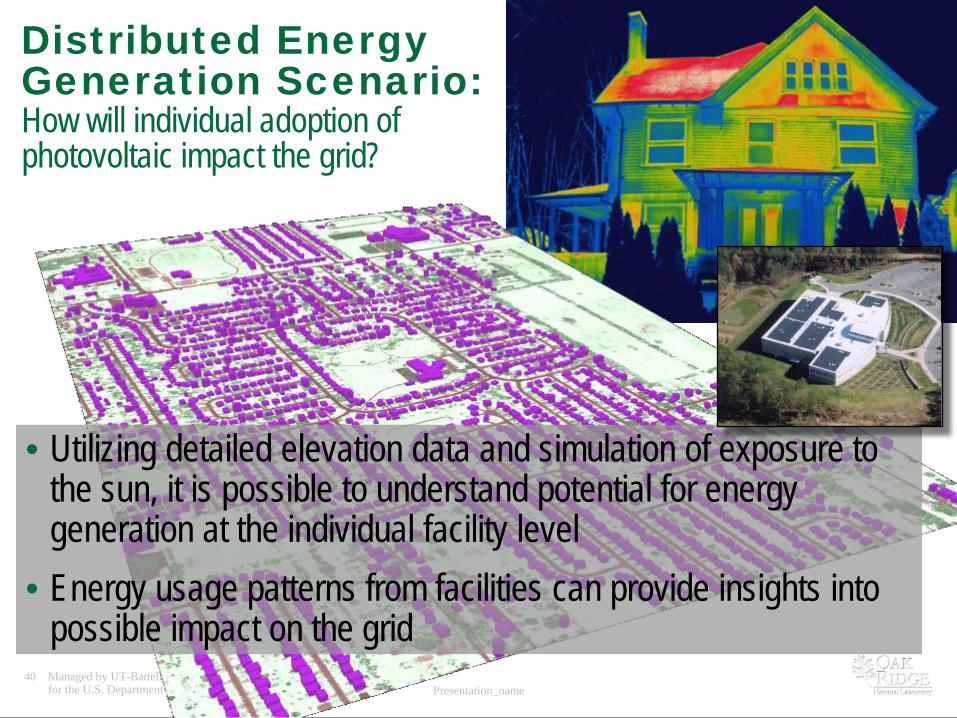
Distributed Energy Generation Scenario: How will individual adoption of photovoltaic impact the grid?
• Utilizing detailed elevation data and simulation of exposure to the sun, it is possible to understand potential for energy generation at the individual facility level
• Energy usage patterns from facilities can provide insights into possible impact on the grid
Managed by UT-Battelle for the Department of Energy
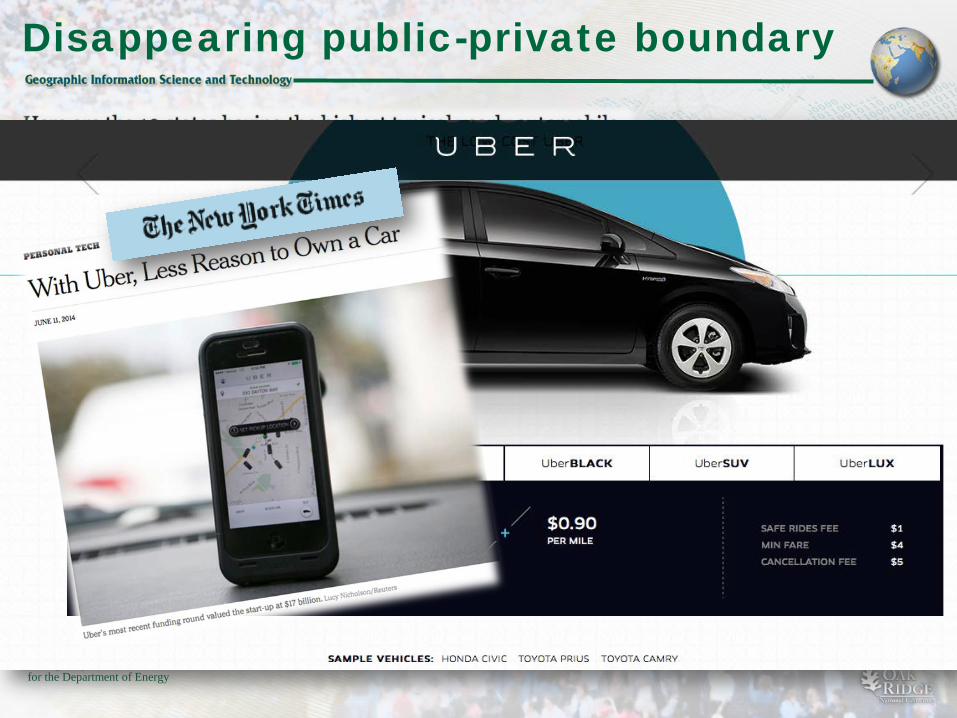
Disappearing public-private boundary
Managed by UT-Battelle for the Department of Energy
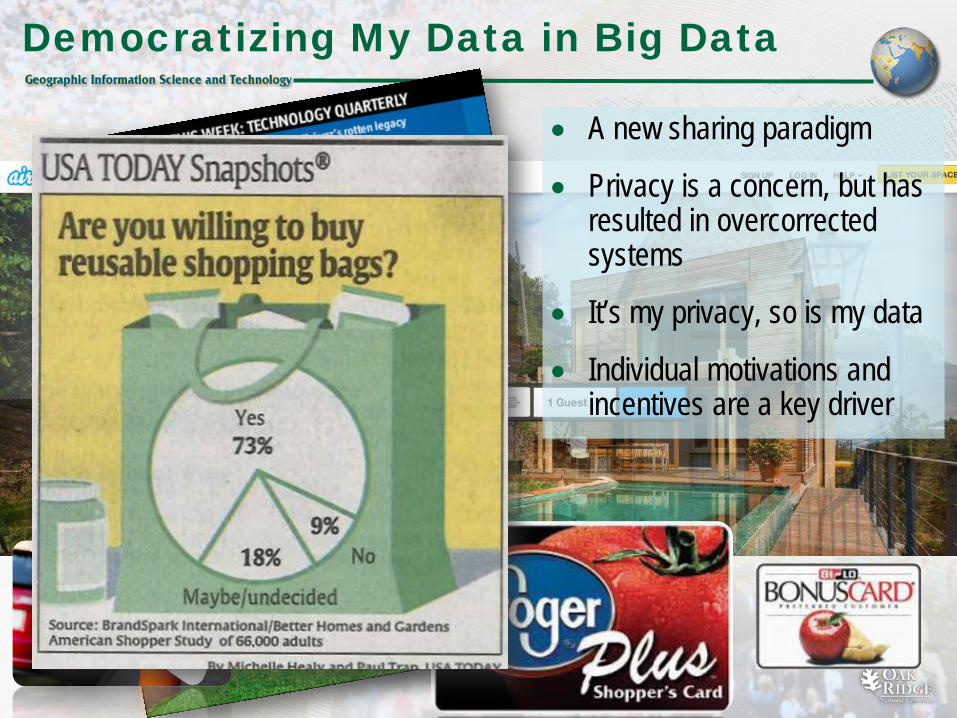
Democratizing My Data in Big Data
• A new sharing paradigm
• Privacy is a concern, but has resulted in overcorrected systems
• It’s my privacy, so is my data
• Individual motivations and incentives are a key driver
Managed by UT-Battelle for the Department of Energy
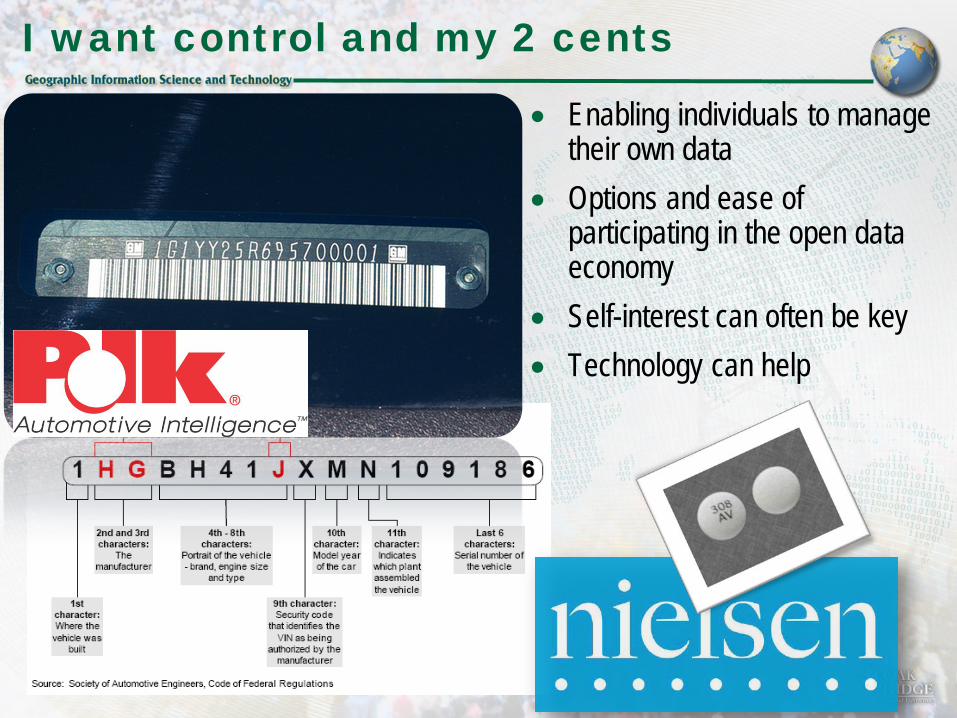
I want control and my 2 cents
• Enabling individuals to manage their own data
• Options and ease of participating in the open data economy
• Self-interest can often be key • Technology can help
Managed by UT-Battelle for the Department of Energy
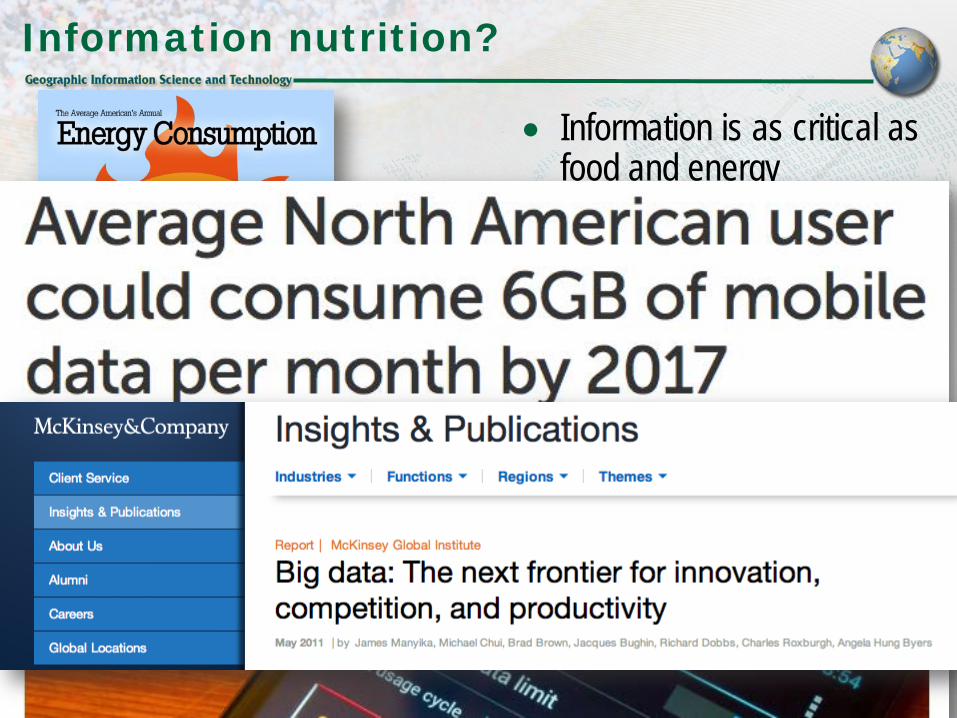
• Information is as critical as food and energy
• How much data does one produce and need?
• Is there an obesity effect?
Information nutrition?
Managed by UT-Battelle for the Department of Energy
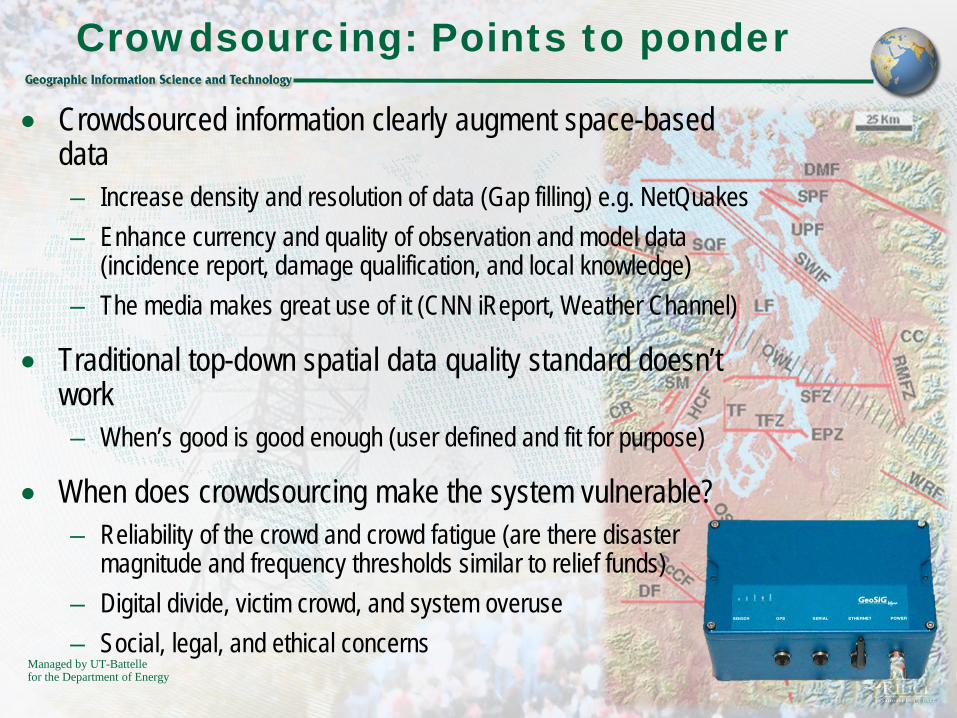
Crowdsourcing: Points to ponder
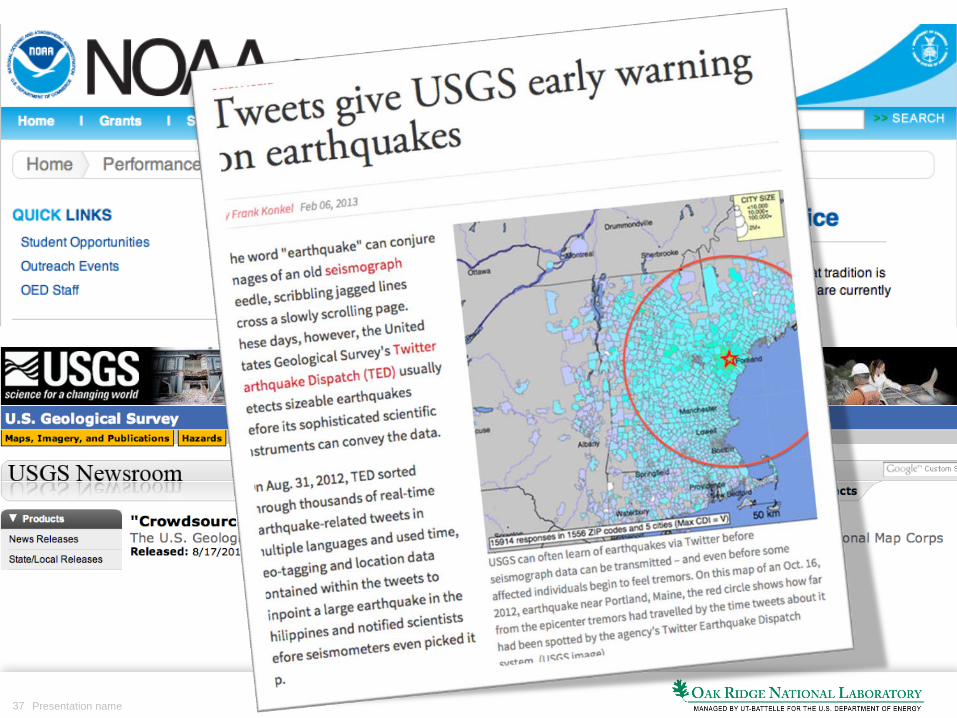
• Crowdsourced information clearly augment space-based data – Increase density and resolution of data (Gap filling) e.g. NetQuakes – Enhance currency and quality of observation and model data
(incidence report, damage qualification, and local knowledge) – The media makes great use of it (CNN iReport, Weather Channel)
• Traditional top-down spatial data quality standard doesn’t work – When’s good is good enough (user defined and fit for purpose)
• When does crowdsourcing make the system vulnerable? – Reliability of the crowd and crowd fatigue (are there disaster
magnitude and frequency thresholds similar to relief funds) – Digital divide, victim crowd, and system overuse – Social, legal, and ethical concerns
Managed by UT-Battelle for the Department of Energy
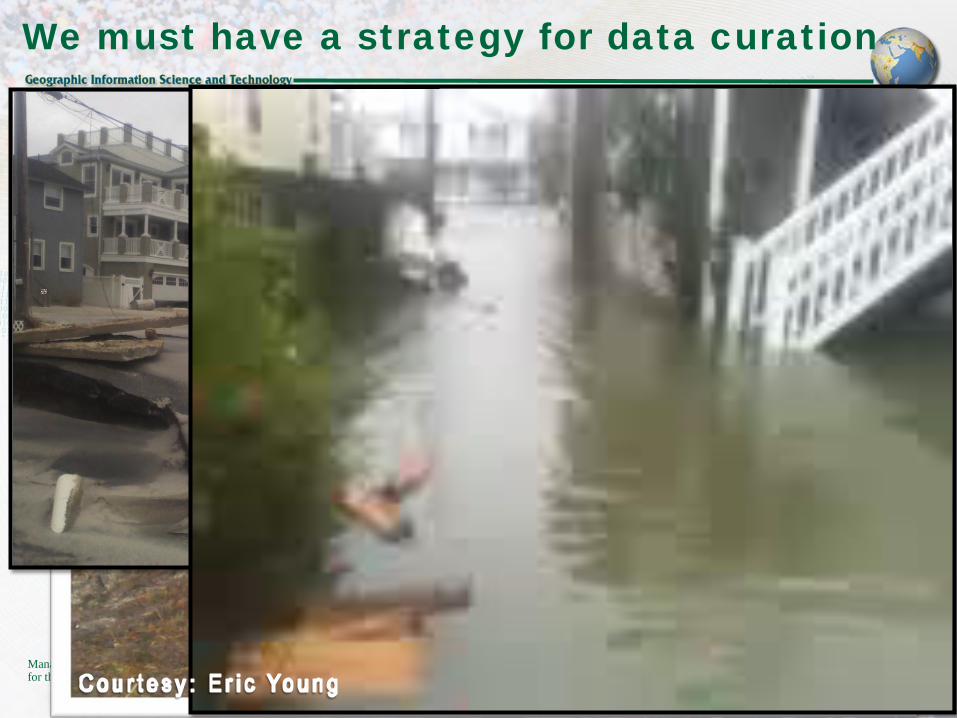
We must have a strategy for data curation

47 Presentation name
The social dimension
Managed by UT-Battelle for the Department of Energy
Acknowledgement • People who do the real work
– Our group members – ….. And many collaborators
• People who make it possible – Our sponsors
Managed by UT-Battelle for the Department of Energy
www.ornl.gov
Oak Ridge National Laboratory: Meeting the challenges of the 21st century