Embed Size (px)
Citation preview
Oil Market Dynamics,
Paradigms and Performance
__________________________________________________________________________________________________________________________________________________________
___________________________________________________________________________________________________________________________
II Congreso Día de la Energía 2013 // 3 July 2013
Ramón Espinasa, Lead Specialist (Oil & Gas)

Dynamics of Petroleum Markets
Oil Sector Performance and Institutional Frameworks
1
3
A New World Energy Paradigm
2
The Peruvian Case
4
1
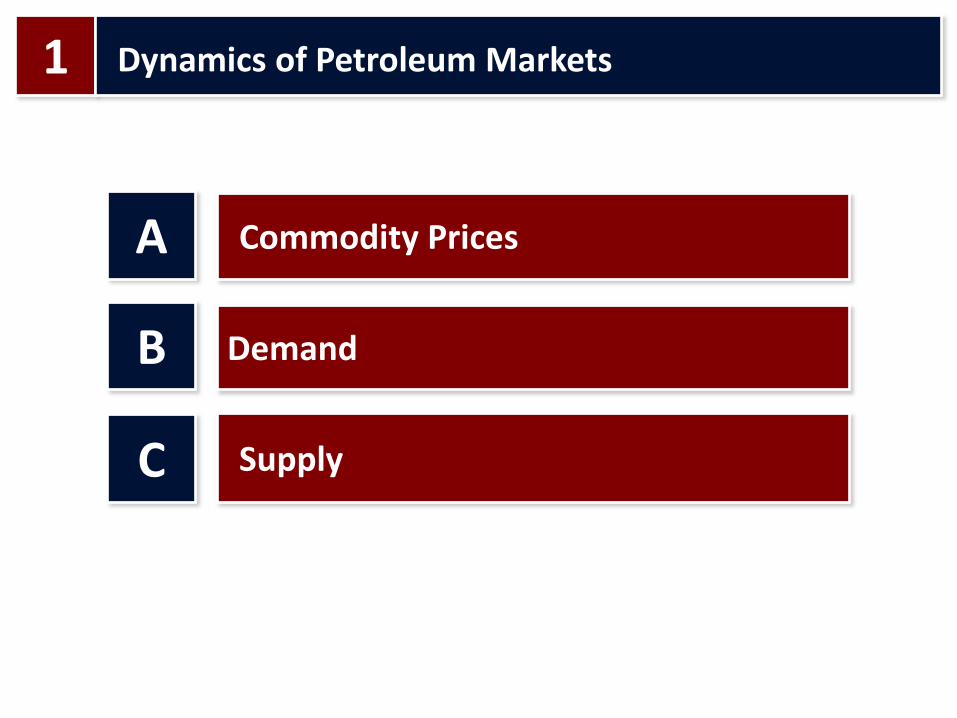
Dynamics of Petroleum Markets
Commodity Prices
Supply
A
Demand B
C

0
20
40
60
80
100
120
19
84
19
85
19
86
19
87
19
88
19
89
19
90
19
91
19
92
19
93
19
94
19
95
19
96
19
97
19
98
19
99
20
00
20
01
20
02
20
03
20
04
20
05
20
06
20
07
20
08
20
09
20
10
20
11
Avg. 1984─2001 US$ 19.9
(nominal prices)
Avg. 2002─2013 US$ 63.4
(nominal prices)
US$
/ b
arre
l, n
om
inal
A
Commodity Prices
Source: BP Statistical Review of World Energy 2012
0
20
40
60
80
100
120
19
84
19
85
19
86
19
87
19
88
19
89
19
90
19
91
19
92
19
93
19
94
19
95
19
96
19
97
19
98
19
99
20
00
20
01
20
02
20
03
20
04
20
05
20
06
20
07
20
08
20
09
20
10
20
11
Avg. 1984─2001 US$ 33.0
(2011 US$ prices)
Avg. 2002─2013 US$ 68.6
(2011 US$ prices)
20
11
US$
/ b
arre
l
A
Commodity Prices
Source: BP Statistical Review of World Energy 2012

-
50
100
150
200
250
ene
-96
jul-
96
ene
-97
jul-
97
ene
-98
jul-
98
ene
-99
jul-
99
ene
-00
jul-
00
ene
-01
jul-
01
ene
-02
jul-
02
ene
-03
jul-
03
ene
-04
jul-
04
ene
-05
jul-
05
ene
-06
jul-
06
ene
-07
jul-
07
ene
-08
jul-
08
ene
-09
jul-
09
ene
-10
jul-
10
ene
-11
jul-
11
ene
-12
jul-
12
ene
-13
Energy
Pri
ce In
de
x, 2
00
5 =
10
0
A
Commodity Prices
Source: World Bank
-
50
100
150
200
250
ene
-96
jul-
96
ene
-97
jul-
97
ene
-98
jul-
98
ene
-99
jul-
99
ene
-00
jul-
00
ene
-01
jul-
01
ene
-02
jul-
02
ene
-03
jul-
03
ene
-04
jul-
04
ene
-05
jul-
05
ene
-06
jul-
06
ene
-07
jul-
07
ene
-08
jul-
08
ene
-09
jul-
09
ene
-10
jul-
10
ene
-11
jul-
11
ene
-12
jul-
12
ene
-13
Energy Food
Pri
ce In
de
x, 2
00
5 =
10
0
A
Commodity Prices
Source: World Bank
-
50
100
150
200
250
ene
-96
jul-
96
ene
-97
jul-
97
ene
-98
jul-
98
ene
-99
jul-
99
ene
-00
jul-
00
ene
-01
jul-
01
ene
-02
jul-
02
ene
-03
jul-
03
ene
-04
jul-
04
ene
-05
jul-
05
ene
-06
jul-
06
ene
-07
jul-
07
ene
-08
jul-
08
ene
-09
jul-
09
ene
-10
jul-
10
ene
-11
jul-
11
ene
-12
jul-
12
ene
-13
Energy Food Metals & minerals
Pri
ce In
de
x, 2
00
5 =
10
0
A
Commodity Prices
Source: World Bank
-
50
100
150
200
250
ene
-96
jul-
96
ene
-97
jul-
97
ene
-98
jul-
98
ene
-99
jul-
99
ene
-00
jul-
00
ene
-01
jul-
01
ene
-02
jul-
02
ene
-03
jul-
03
ene
-04
jul-
04
ene
-05
jul-
05
ene
-06
jul-
06
ene
-07
jul-
07
ene
-08
jul-
08
ene
-09
jul-
09
ene
-10
jul-
10
ene
-11
jul-
11
ene
-12
jul-
12
ene
-13
Energy Food Metals & minerals Non-energy commodities
Pri
ce In
de
x, 2
00
5 =
10
0
A
Commodity Prices
Source: World Bank
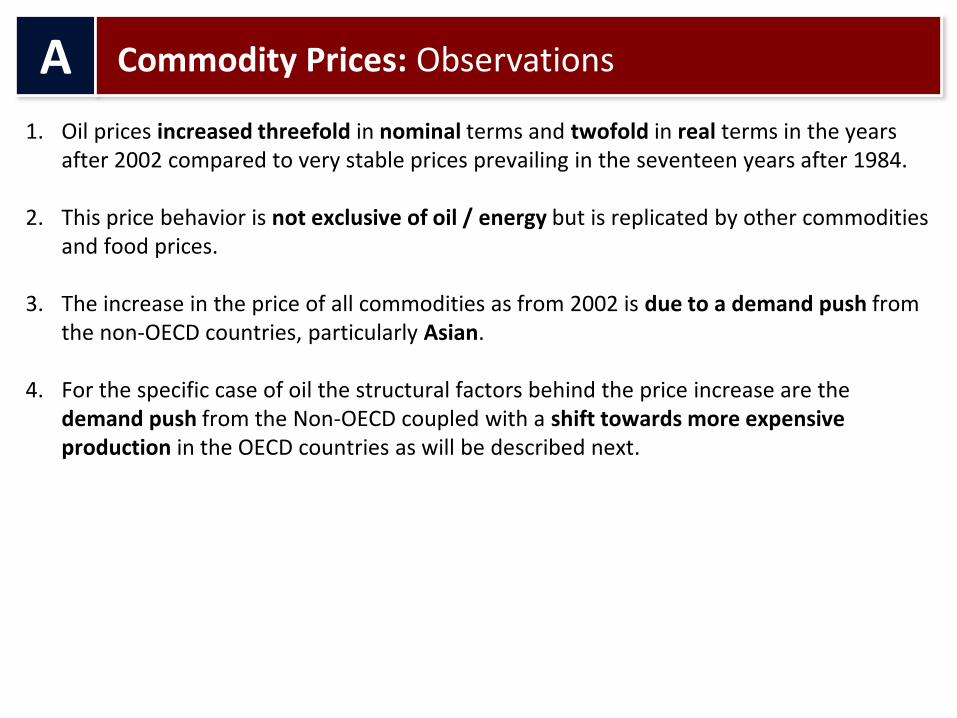
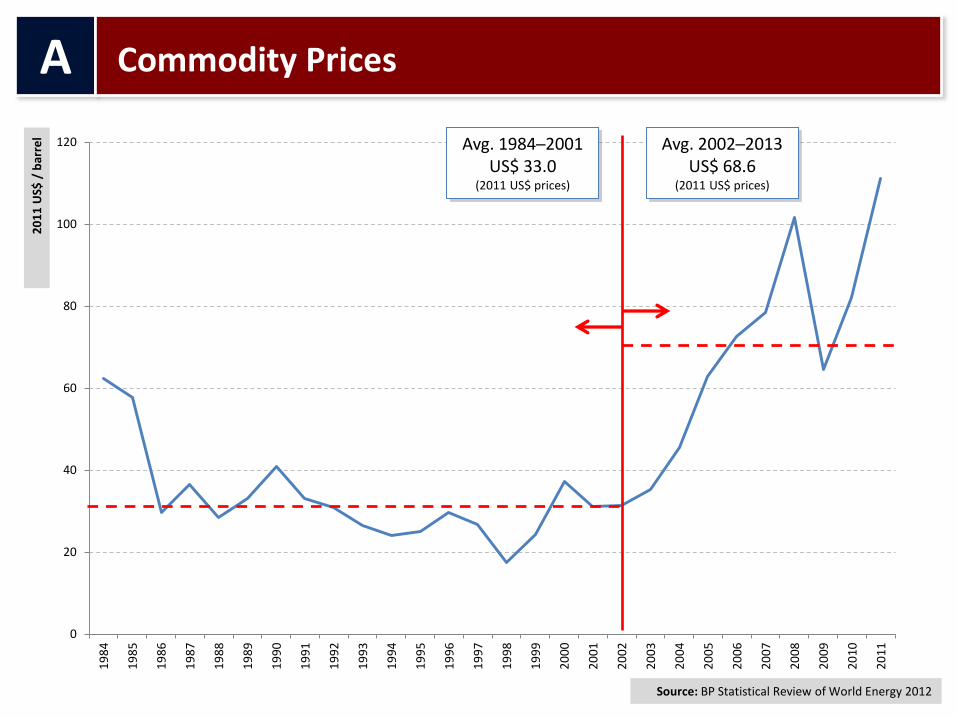
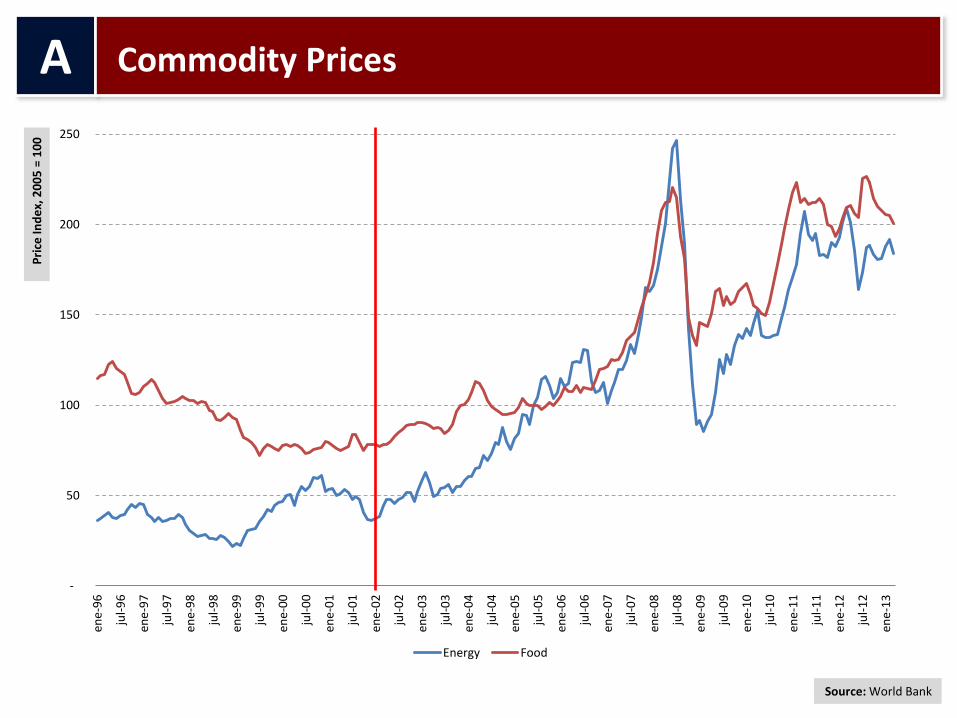
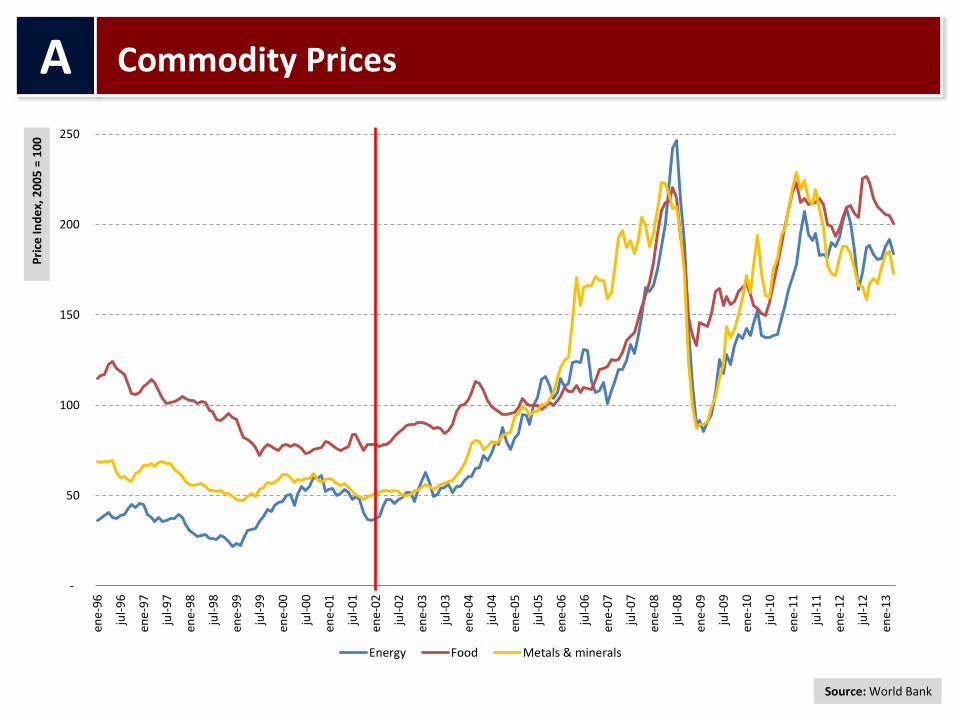
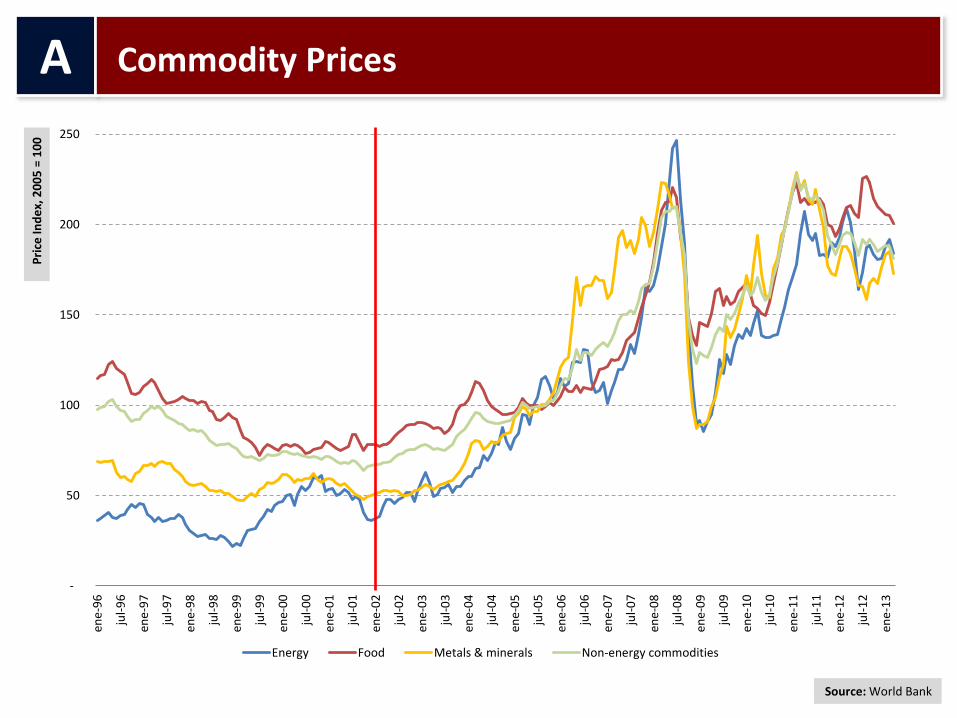
1. Oil prices increased threefold in nominal terms and twofold in real terms in the years after 2002 compared to very stable prices prevailing in the seventeen years after 1984.
2. This price behavior is not exclusive of oil / energy but is replicated by other commodities and food prices.
3. The increase in the price of all commodities as from 2002 is due to a demand push from the non-OECD countries, particularly Asian.
4. For the specific case of oil the structural factors behind the price increase are the demand push from the Non-OECD coupled with a shift towards more expensive production in the OECD countries as will be described next.
A
Commodity Prices: Observations
-
10,000
20,000
30,000
40,000
50,000
60,000
70,000
80,000
90,0001
98
4
19
85
19
86
19
87
19
88
19
89
19
90
19
91
19
92
19
93
19
94
19
95
19
96
19
97
19
98
19
99
20
00
20
01
20
02
20
03
20
04
20
05
20
06
20
07
20
08
20
09
20
10
20
11
20
12
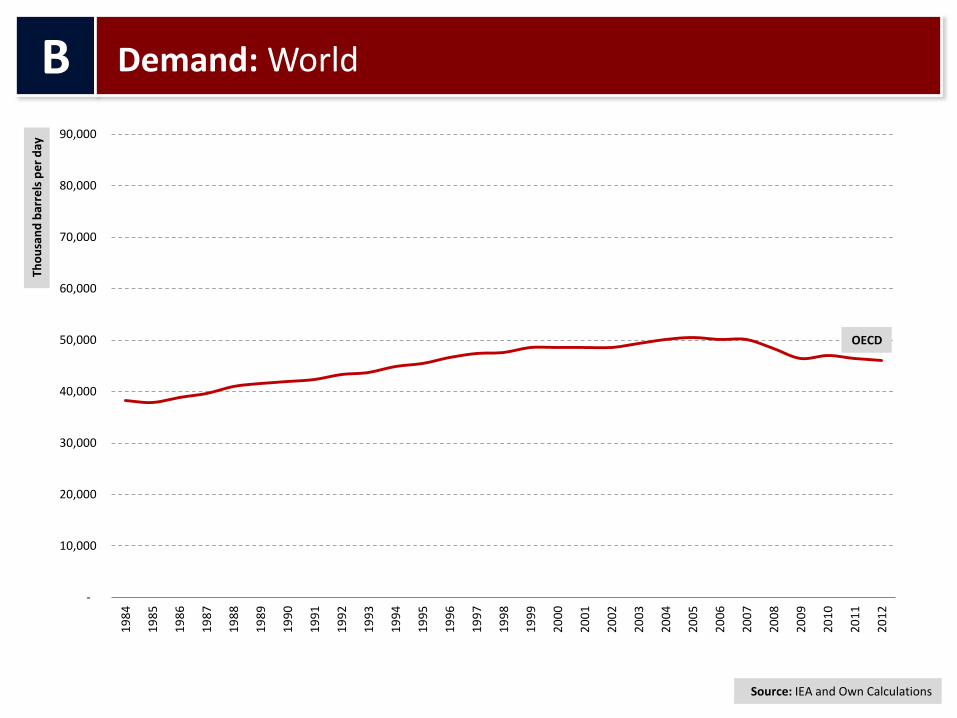
B
Demand: World Th
ou
san
d b
arre
ls p
er
day
OECD
Source: IEA and Own Calculations
-
10,000
20,000
30,000
40,000
50,000
60,000
70,000
80,000
90,0001
98
4
19
85
19
86
19
87
19
88
19
89
19
90
19
91
19
92
19
93
19
94
19
95
19
96
19
97
19
98
19
99
20
00
20
01
20
02
20
03
20
04
20
05
20
06
20
07
20
08
20
09
20
10
20
11
20
12
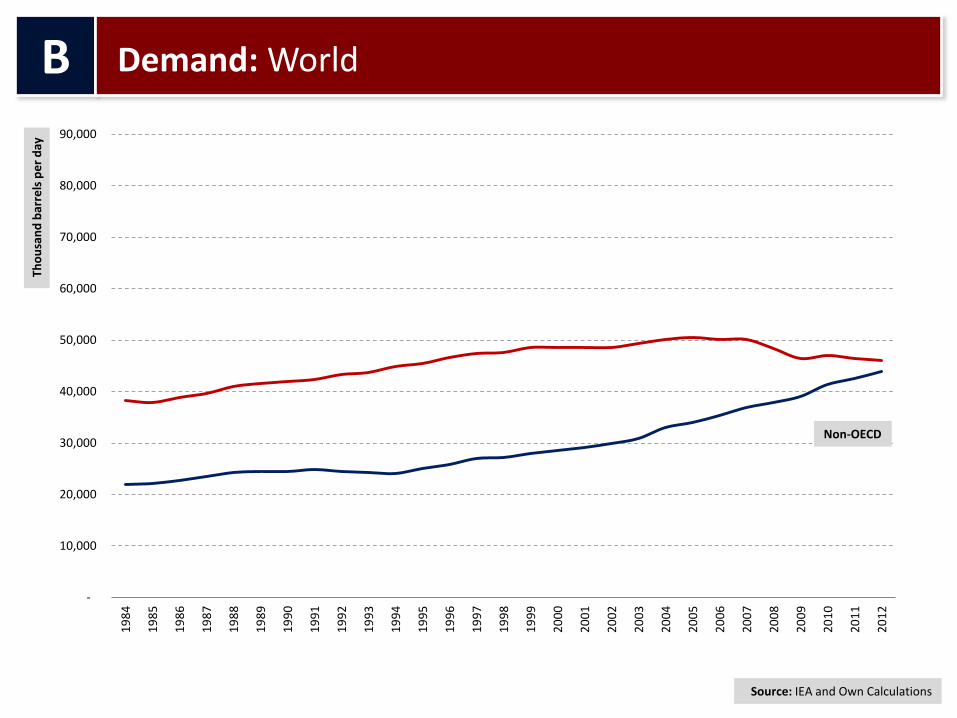
B
Demand: World Th
ou
san
d b
arre
ls p
er
day
Non-OECD
Source: IEA and Own Calculations
-
10,000
20,000
30,000
40,000
50,000
60,000
70,000
80,000
90,0001
98
4
19
85
19
86
19
87
19
88
19
89
19
90
19
91
19
92
19
93
19
94
19
95
19
96
19
97
19
98
19
99
20
00
20
01
20
02
20
03
20
04
20
05
20
06
20
07
20
08
20
09
20
10
20
11
20
12
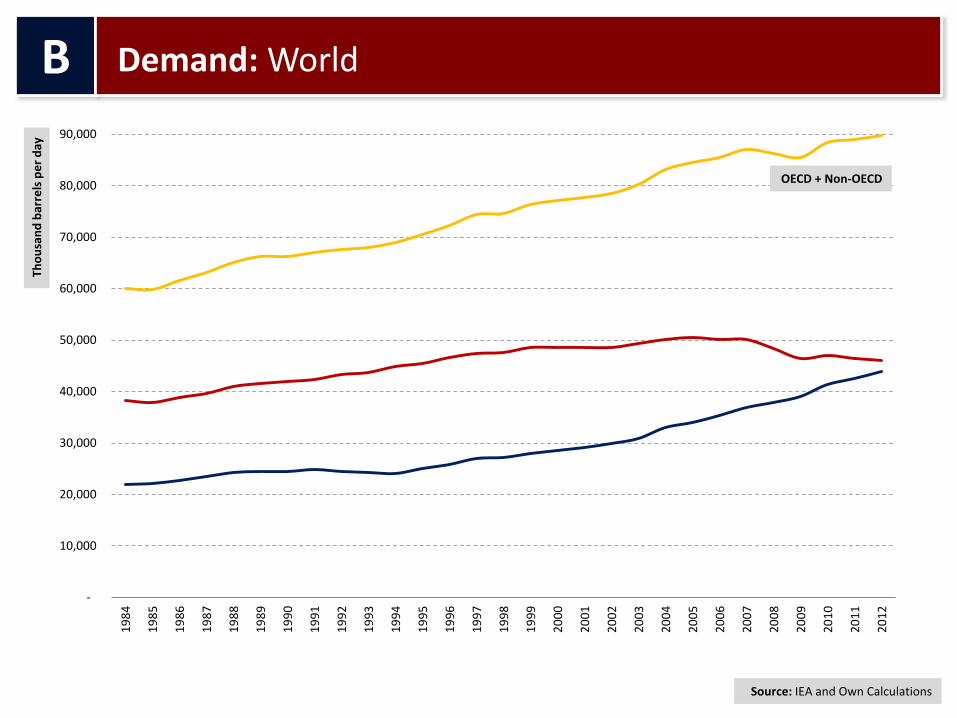
B
Demand: World Th
ou
san
d b
arre
ls p
er
day
OECD + Non-OECD
Source: IEA and Own Calculations
(3,000)
-
3,000
6,000
9,000
12,000
15,000
18,000
21,000
24,000
27,000
30,0001
98
4
19
85
19
86
19
87
19
88
19
89
19
90
19
91
19
92
19
93
19
94
19
95
19
96
19
97
19
98
19
99
20
00
20
01
20
02
20
03
20
04
20
05
20
06
20
07
20
08
20
09
20
10
20
11
20
12
Tho
usa
nd
bar
rels
pe
r d
ay
B
Demand: World Changes
OECD
Source: IEA and Own Calculations

(3,000)
-
3,000
6,000
9,000
12,000
15,000
18,000
21,000
24,000
27,000
30,0001
98
4
19
85
19
86
19
87
19
88
19
89
19
90
19
91
19
92
19
93
19
94
19
95
19
96
19
97
19
98
19
99
20
00
20
01
20
02
20
03
20
04
20
05
20
06
20
07
20
08
20
09
20
10
20
11
20
12
Tho
usa
nd
bar
rels
pe
r d
ay
B
Demand: World Changes
Non-OECD
Source: IEA and Own Calculations
(3,000)
-
3,000
6,000
9,000
12,000
15,000
18,000
21,000
24,000
27,000
30,0001
98
4
19
85
19
86
19
87
19
88
19
89
19
90
19
91
19
92
19
93
19
94
19
95
19
96
19
97
19
98
19
99
20
00
20
01
20
02
20
03
20
04
20
05
20
06
20
07
20
08
20
09
20
10
20
11
20
12
Tho
usa
nd
bar
rels
pe
r d
ay
B
Demand: World Changes
OECD + Non-OECD
Source: IEA and Own Calculations
-
5,000
10,000
15,000
20,000
25,000
30,0001
98
4
19
85
19
86
19
87
19
88
19
89
19
90
19
91
19
92
19
93
19
94
19
95
19
96
19
97
19
98
19
99
20
00
20
01
20
02
20
03
20
04
20
05
20
06
20
07
20
08
20
09
20
10
20
11
20
12
B
Demand: OECD Th
ou
san
d b
arre
ls p
er
day
OECD Americas
Source: IEA and Own Calculations
-
5,000
10,000
15,000
20,000
25,000
30,0001
98
4
19
85
19
86
19
87
19
88
19
89
19
90
19
91
19
92
19
93
19
94
19
95
19
96
19
97
19
98
19
99
20
00
20
01
20
02
20
03
20
04
20
05
20
06
20
07
20
08
20
09
20
10
20
11
20
12
B
Demand: OECD Th
ou
san
d b
arre
ls p
er
day
OECD Asia & Oceania
Source: IEA and Own Calculations

-
5,000
10,000
15,000
20,000
25,000
30,0001
98
4
19
85
19
86
19
87
19
88
19
89
19
90
19
91
19
92
19
93
19
94
19
95
19
96
19
97
19
98
19
99
20
00
20
01
20
02
20
03
20
04
20
05
20
06
20
07
20
08
20
09
20
10
20
11
20
12
B
Demand: OECD Th
ou
san
d b
arre
ls p
er
day
OECD Europe
Source: IEA and Own Calculations
(1,000)
-
1,000
2,000
3,000
4,000
5,000
6,000
7,0001
98
4
19
85
19
86
19
87
19
88
19
89
19
90
19
91
19
92
19
93
19
94
19
95
19
96
19
97
19
98
19
99
20
00
20
01
20
02
20
03
20
04
20
05
20
06
20
07
20
08
20
09
20
10
20
11
20
12
B
Demand: OECD Changes Th
ou
san
d b
arre
ls p
er
day
OECD Americas
Source: IEA and Own Calculations

(1,000)
-
1,000
2,000
3,000
4,000
5,000
6,000
7,0001
98
4
19
85
19
86
19
87
19
88
19
89
19
90
19
91
19
92
19
93
19
94
19
95
19
96
19
97
19
98
19
99
20
00
20
01
20
02
20
03
20
04
20
05
20
06
20
07
20
08
20
09
20
10
20
11
20
12
B
Demand: OECD Changes Th
ou
san
d b
arre
ls p
er
day
OECD Asia & Oceania
Source: IEA and Own Calculations

(1,000)
-
1,000
2,000
3,000
4,000
5,000
6,000
7,0001
98
4
19
85
19
86
19
87
19
88
19
89
19
90
19
91
19
92
19
93
19
94
19
95
19
96
19
97
19
98
19
99
20
00
20
01
20
02
20
03
20
04
20
05
20
06
20
07
20
08
20
09
20
10
20
11
20
12
B
Demand: OECD Changes Th
ou
san
d b
arre
ls p
er
day
OECD Europe
Source: IEA and Own Calculations
-
2,000
4,000
6,000
8,000
10,000
12,0001
98
4
19
85
19
86
19
87
19
88
19
89
19
90
19
91
19
92
19
93
19
94
19
95
19
96
19
97
19
98
19
99
20
00
20
01
20
02
20
03
20
04
20
05
20
06
20
07
20
08
20
09
20
10
20
11
20
12
B
Demand: Non-OECD Th
ou
san
d b
arre
ls p
er
day
Africa
Source: IEA and Own Calculations

-
2,000
4,000
6,000
8,000
10,000
12,0001
98
4
19
85
19
86
19
87
19
88
19
89
19
90
19
91
19
92
19
93
19
94
19
95
19
96
19
97
19
98
19
99
20
00
20
01
20
02
20
03
20
04
20
05
20
06
20
07
20
08
20
09
20
10
20
11
20
12
B
Demand: Non-OECD Th
ou
san
d b
arre
ls p
er
day
China
Source: IEA and Own Calculations
-
2,000
4,000
6,000
8,000
10,000
12,0001
98
4
19
85
19
86
19
87
19
88
19
89
19
90
19
91
19
92
19
93
19
94
19
95
19
96
19
97
19
98
19
99
20
00
20
01
20
02
20
03
20
04
20
05
20
06
20
07
20
08
20
09
20
10
20
11
20
12
B
Demand: Non-OECD Th
ou
san
d b
arre
ls p
er
day
Former USSR
Source: IEA and Own Calculations
-
2,000
4,000
6,000
8,000
10,000
12,0001
98
4
19
85
19
86
19
87
19
88
19
89
19
90
19
91
19
92
19
93
19
94
19
95
19
96
19
97
19
98
19
99
20
00
20
01
20
02
20
03
20
04
20
05
20
06
20
07
20
08
20
09
20
10
20
11
20
12
B
Demand: Non-OECD Th
ou
san
d b
arre
ls p
er
day
Middle East
Source: IEA and Own Calculations

-
2,000
4,000
6,000
8,000
10,000
12,0001
98
4
19
85
19
86
19
87
19
88
19
89
19
90
19
91
19
92
19
93
19
94
19
95
19
96
19
97
19
98
19
99
20
00
20
01
20
02
20
03
20
04
20
05
20
06
20
07
20
08
20
09
20
10
20
11
20
12
B
Demand: Non-OECD Th
ou
san
d b
arre
ls p
er
day
Latin America
Source: IEA and Own Calculations
-
2,000
4,000
6,000
8,000
10,000
12,0001
98
4
19
85
19
86
19
87
19
88
19
89
19
90
19
91
19
92
19
93
19
94
19
95
19
96
19
97
19
98
19
99
20
00
20
01
20
02
20
03
20
04
20
05
20
06
20
07
20
08
20
09
20
10
20
11
20
12
B
Demand: Non-OECD Th
ou
san
d b
arre
ls p
er
day
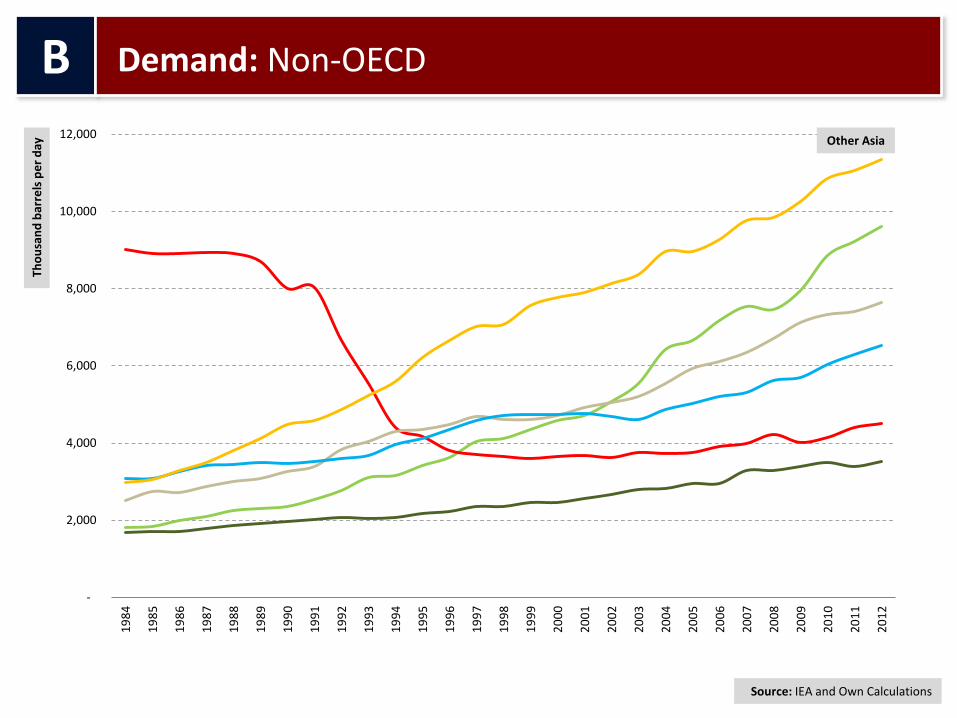
Other Asia
Source: IEA and Own Calculations

(6,000)
(4,500)
(3,000)
(1,500)
-
1,500
3,000
4,500
6,000
7,500
9,0001
98
4
19
85
19
86
19
87
19
88
19
89
19
90
19
91
19
92
19
93
19
94
19
95
19
96
19
97
19
98
19
99
20
00
20
01
20
02
20
03
20
04
20
05
20
06
20
07
20
08
20
09
20
10
20
11
20
12
B
Demand: Non-OECD Changes Th
ou
san
d b
arre
ls p
er
day
Africa
Source: IEA and Own Calculations
(6,000)
(4,500)
(3,000)
(1,500)
-
1,500
3,000
4,500
6,000
7,500
9,0001
98
4
19
85
19
86
19
87
19
88
19
89
19
90
19
91
19
92
19
93
19
94
19
95
19
96
19
97
19
98
19
99
20
00
20
01
20
02
20
03
20
04
20
05
20
06
20
07
20
08
20
09
20
10
20
11
20
12
B
Demand: Non-OECD Changes Th
ou
san
d b
arre
ls p
er
day
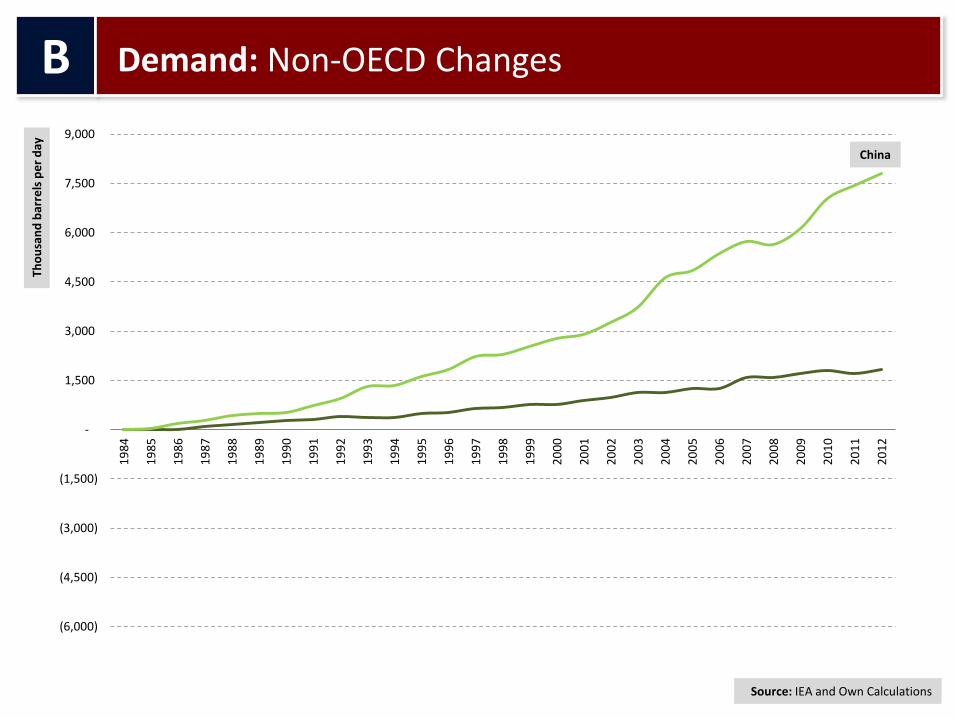
China
Source: IEA and Own Calculations

(6,000)
(4,500)
(3,000)
(1,500)
-
1,500
3,000
4,500
6,000
7,500
9,0001
98
4
19
85
19
86
19
87
19
88
19
89
19
90
19
91
19
92
19
93
19
94
19
95
19
96
19
97
19
98
19
99
20
00
20
01
20
02
20
03
20
04
20
05
20
06
20
07
20
08
20
09
20
10
20
11
20
12
B
Demand: Non-OECD Changes Th
ou
san
d b
arre
ls p
er
day
Former USSR
Source: IEA and Own Calculations

(6,000)
(4,500)
(3,000)
(1,500)
-
1,500
3,000
4,500
6,000
7,500
9,0001
98
4
19
85
19
86
19
87
19
88
19
89
19
90
19
91
19
92
19
93
19
94
19
95
19
96
19
97
19
98
19
99
20
00
20
01
20
02
20
03
20
04
20
05
20
06
20
07
20
08
20
09
20
10
20
11
20
12
B
Demand: Non-OECD Changes Th
ou
san
d b
arre
ls p
er
day
Middle East
Source: IEA and Own Calculations
(6,000)
(4,500)
(3,000)
(1,500)
-
1,500
3,000
4,500
6,000
7,500
9,0001
98
4
19
85
19
86
19
87
19
88
19
89
19
90
19
91
19
92
19
93
19
94
19
95
19
96
19
97
19
98
19
99
20
00
20
01
20
02
20
03
20
04
20
05
20
06
20
07
20
08
20
09
20
10
20
11
20
12
B
Demand: Non-OECD Changes Th
ou
san
d b
arre
ls p
er
day
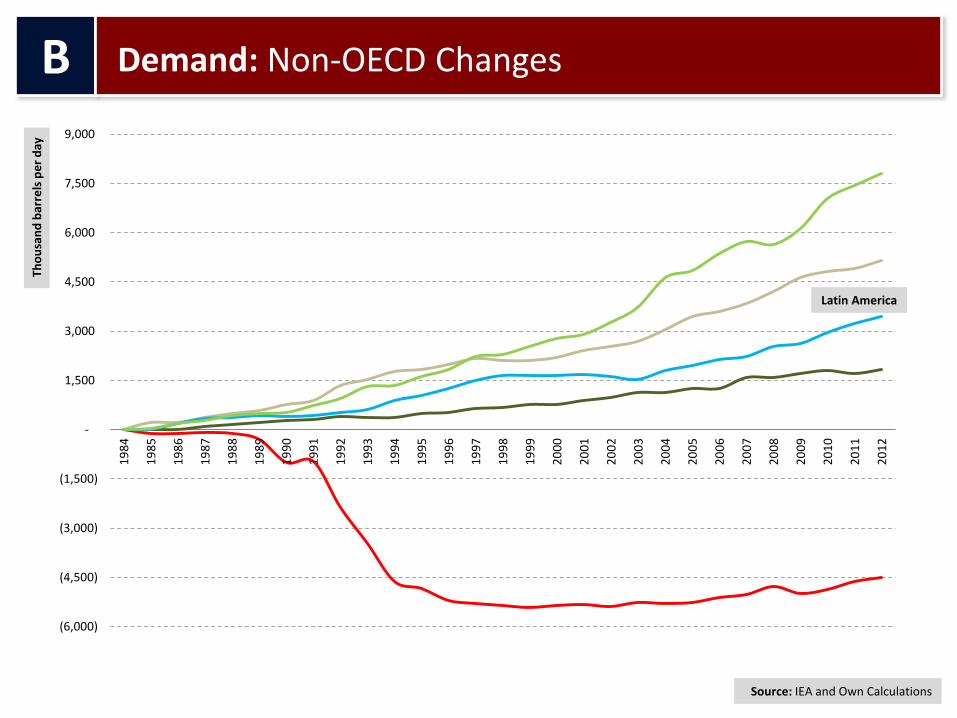
Latin America
Source: IEA and Own Calculations
(6,000)
(4,500)
(3,000)
(1,500)
-
1,500
3,000
4,500
6,000
7,500
9,0001
98
4
19
85
19
86
19
87
19
88
19
89
19
90
19
91
19
92
19
93
19
94
19
95
19
96
19
97
19
98
19
99
20
00
20
01
20
02
20
03
20
04
20
05
20
06
20
07
20
08
20
09
20
10
20
11
20
12
B
Demand: Non-OECD Changes Th
ou
san
d b
arre
ls p
er
day
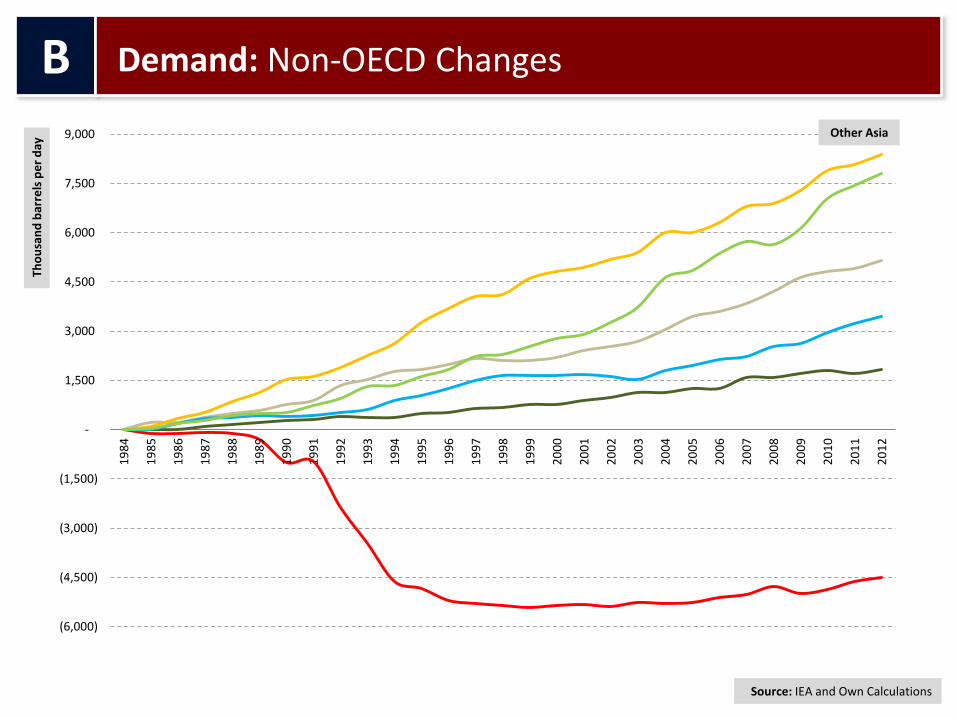
Other Asia
Source: IEA and Own Calculations
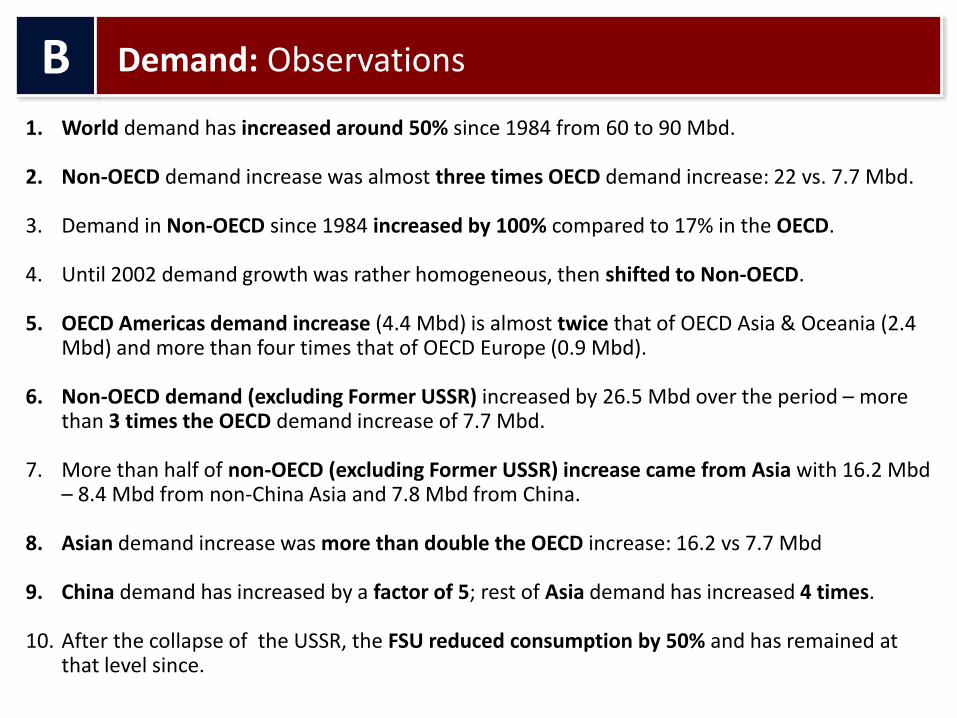
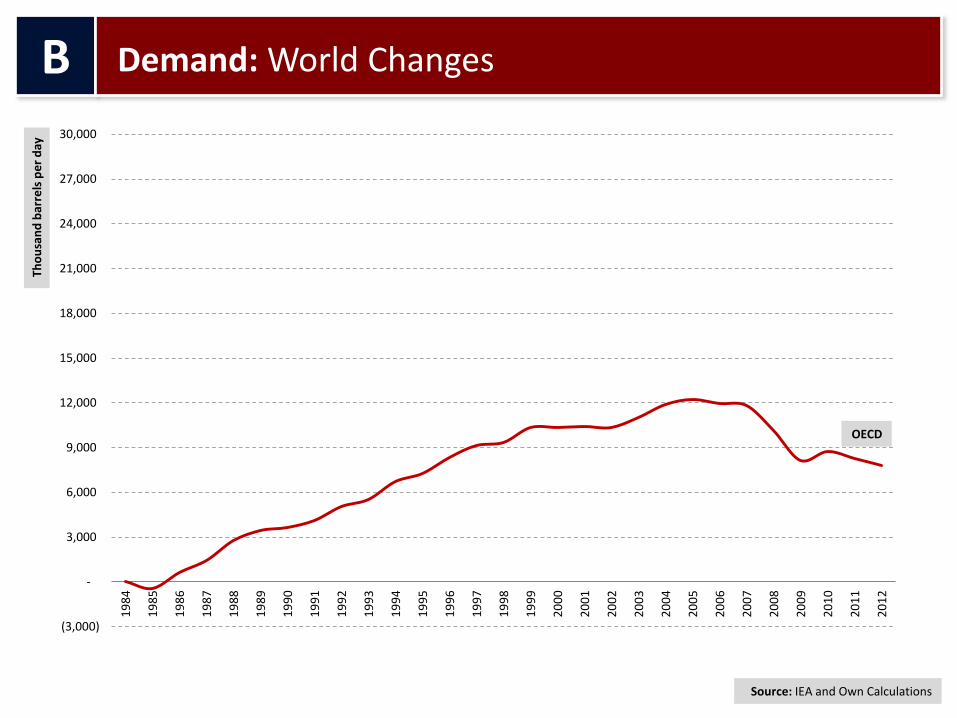
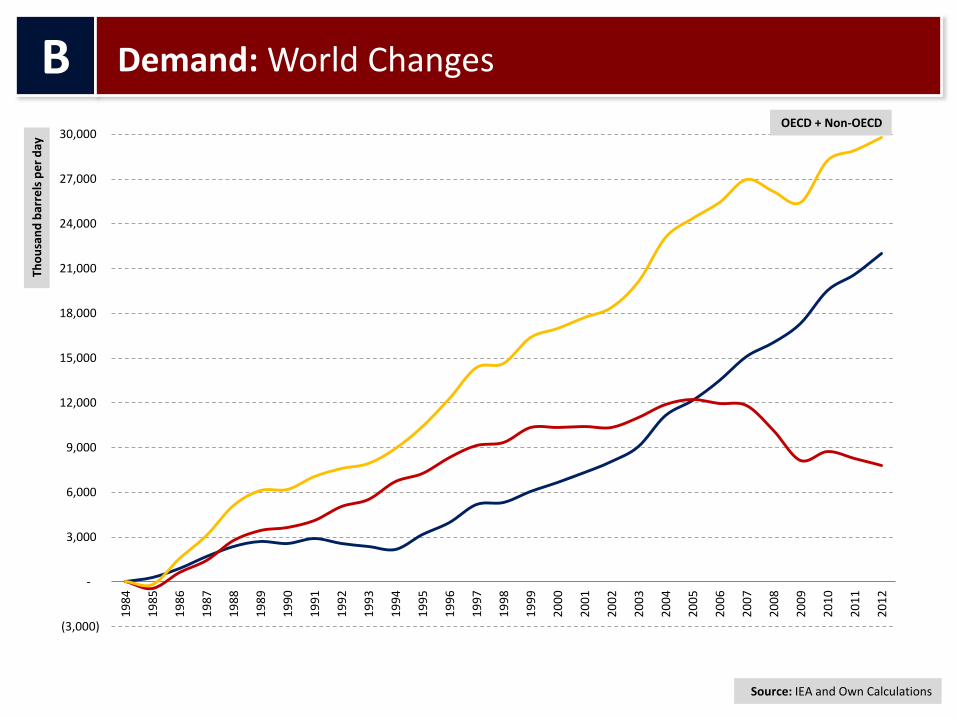
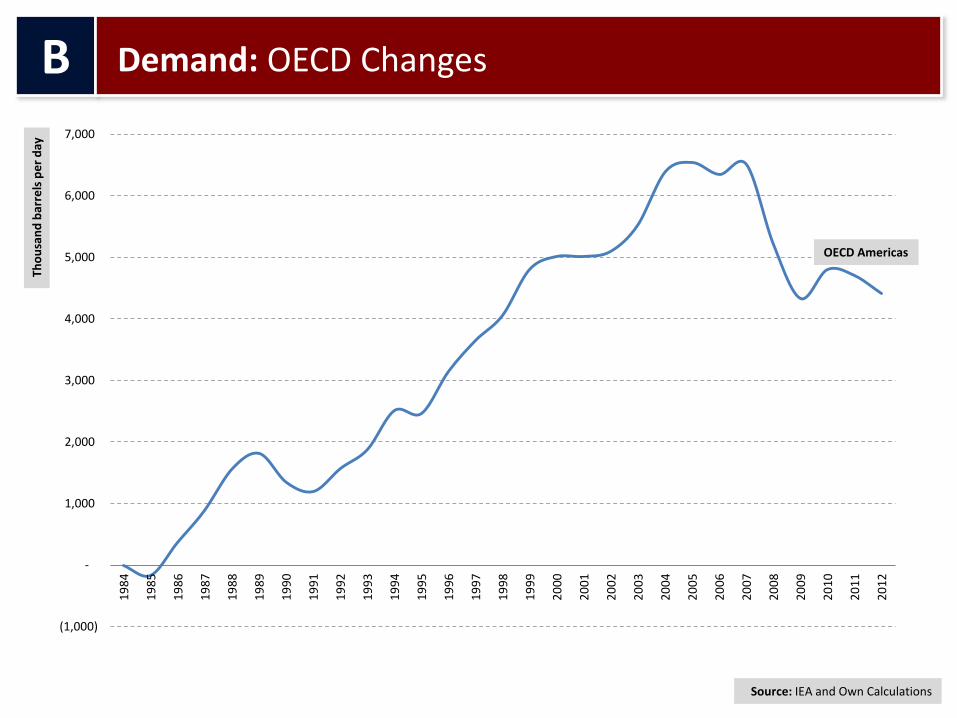
1. World demand has increased around 50% since 1984 from 60 to 90 Mbd. 2. Non-OECD demand increase was almost three times OECD demand increase: 22 vs. 7.7 Mbd.
3. Demand in Non-OECD since 1984 increased by 100% compared to 17% in the OECD.
4. Until 2002 demand growth was rather homogeneous, then shifted to Non-OECD.
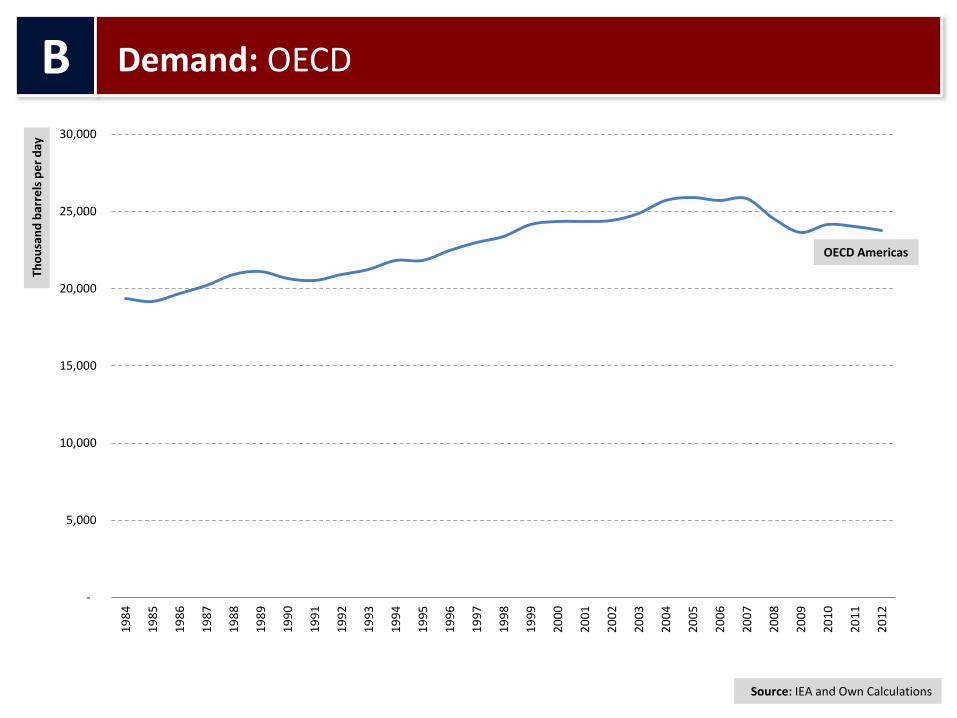
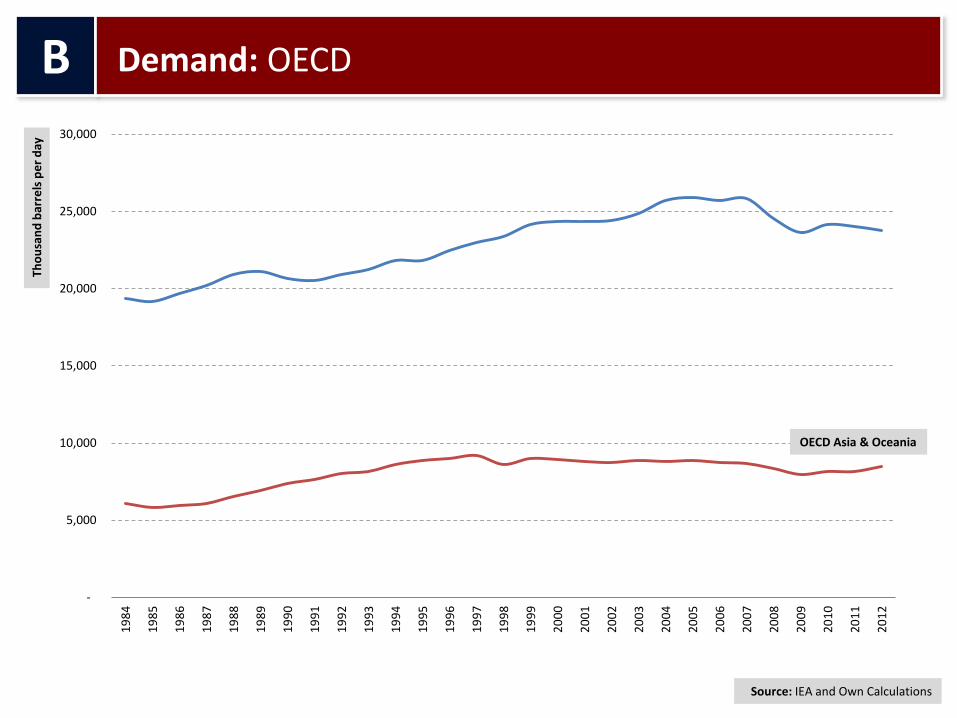
5. OECD Americas demand increase (4.4 Mbd) is almost twice that of OECD Asia & Oceania (2.4
Mbd) and more than four times that of OECD Europe (0.9 Mbd).
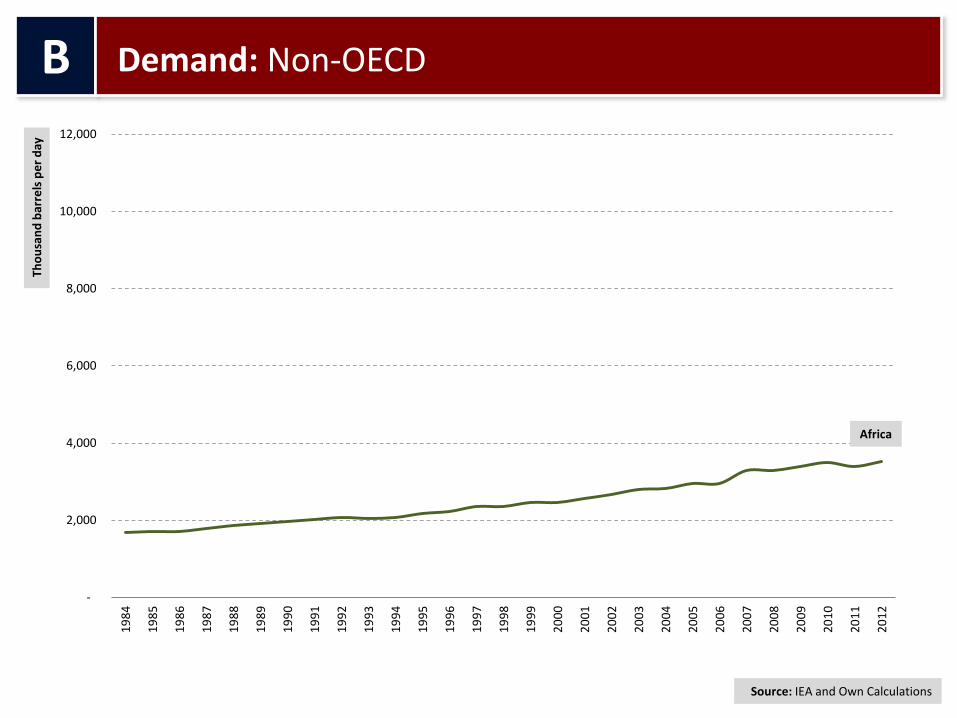
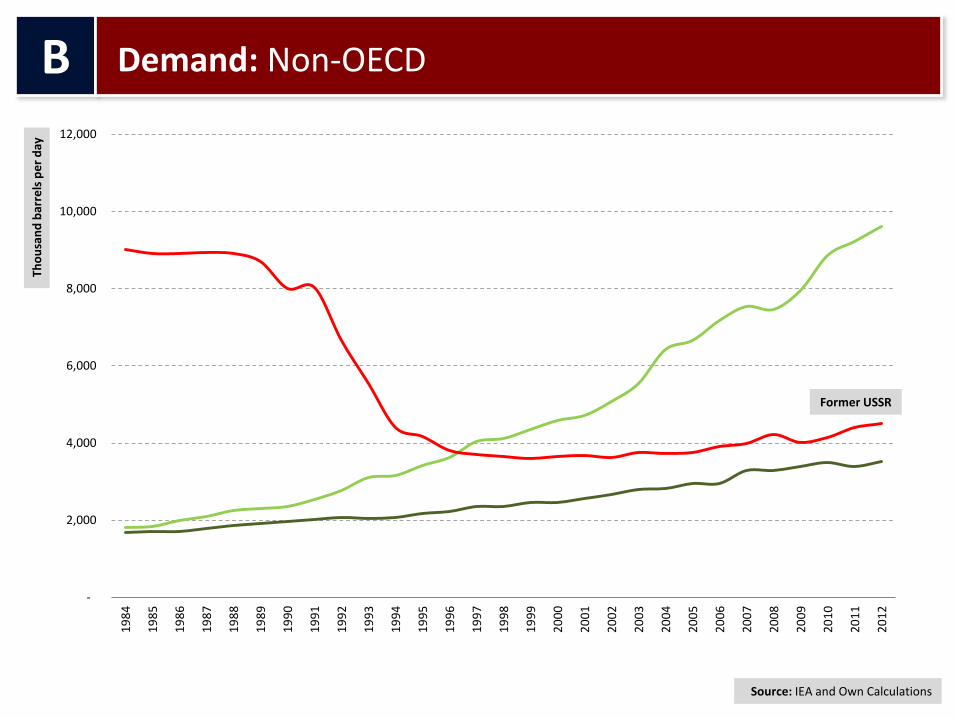
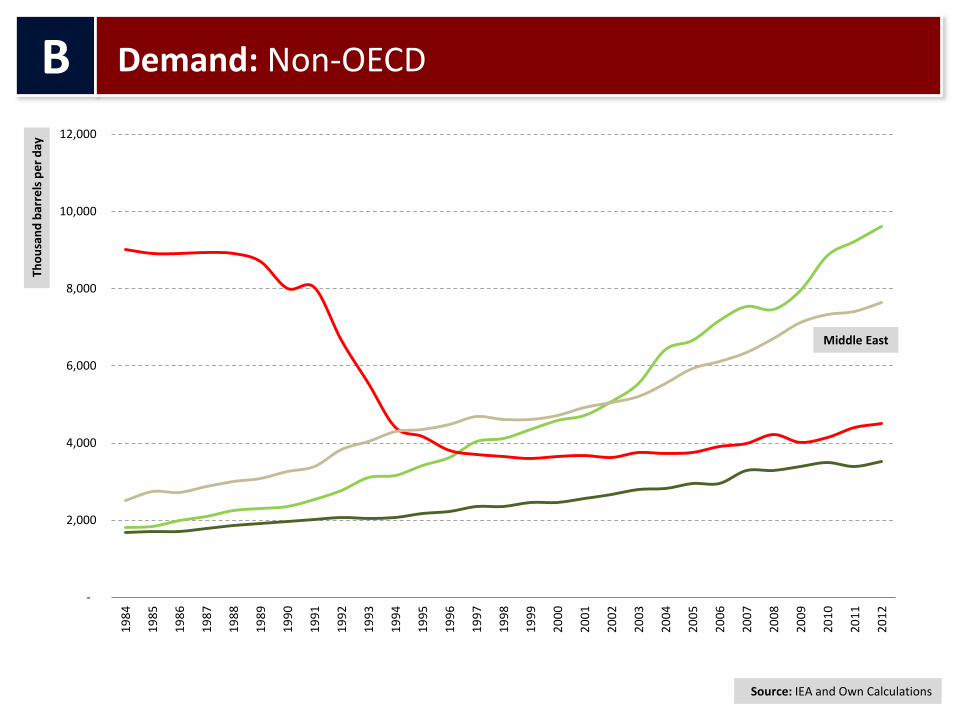
6. Non-OECD demand (excluding Former USSR) increased by 26.5 Mbd over the period – more than 3 times the OECD demand increase of 7.7 Mbd.
7. More than half of non-OECD (excluding Former USSR) increase came from Asia with 16.2 Mbd – 8.4 Mbd from non-China Asia and 7.8 Mbd from China.
8. Asian demand increase was more than double the OECD increase: 16.2 vs 7.7 Mbd
9. China demand has increased by a factor of 5; rest of Asia demand has increased 4 times.
10. After the collapse of the USSR, the FSU reduced consumption by 50% and has remained at that level since.
B
Demand: Observations

-
5,000
10,000
15,000
20,000
25,000
30,000
35,000
40,0001
98
4
19
85
19
86
19
87
19
88
19
89
19
90
19
91
19
92
19
93
19
94
19
95
19
96
19
97
19
98
19
99
20
00
20
01
20
02
20
03
20
04
20
05
20
06
20
07
20
08
20
09
20
10
20
11
20
12
C
Supply: World Th
ou
san
d b
arre
ls p
er
day
OECD
Source: IEA and Own Calculations
-
5,000
10,000
15,000
20,000
25,000
30,000
35,000
40,0001
98
4
19
85
19
86
19
87
19
88
19
89
19
90
19
91
19
92
19
93
19
94
19
95
19
96
19
97
19
98
19
99
20
00
20
01
20
02
20
03
20
04
20
05
20
06
20
07
20
08
20
09
20
10
20
11
20
12
C
Supply: World Th
ou
san
d b
arre
ls p
er
day
OPEC
Source: IEA and Own Calculations
-
5,000
10,000
15,000
20,000
25,000
30,000
35,000
40,0001
98
4
19
85
19
86
19
87
19
88
19
89
19
90
19
91
19
92
19
93
19
94
19
95
19
96
19
97
19
98
19
99
20
00
20
01
20
02
20
03
20
04
20
05
20
06
20
07
20
08
20
09
20
10
20
11
20
12
C
Supply: World Th
ou
san
d b
arre
ls p
er
day
Non-OPEC/OECD
Source: IEA and Own Calculations

(2,500)
-
2,500
5,000
7,500
10,000
12,500
15,000
17,500
20,0001
98
4
19
85
19
86
19
87
19
88
19
89
19
90
19
91
19
92
19
93
19
94
19
95
19
96
19
97
19
98
19
99
20
00
20
01
20
02
20
03
20
04
20
05
20
06
20
07
20
08
20
09
20
10
20
11
20
12
C
Supply: World Changes Th
ou
san
d b
arre
ls p
er
day
OECD
Source: IEA and Own Calculations

(2,500)
-
2,500
5,000
7,500
10,000
12,500
15,000
17,500
20,0001
98
4
19
85
19
86
19
87
19
88
19
89
19
90
19
91
19
92
19
93
19
94
19
95
19
96
19
97
19
98
19
99
20
00
20
01
20
02
20
03
20
04
20
05
20
06
20
07
20
08
20
09
20
10
20
11
20
12
C
Supply: World Changes Th
ou
san
d b
arre
ls p
er
day
OPEC
OECD
Source: IEA and Own Calculations
(2,500)
-
2,500
5,000
7,500
10,000
12,500
15,000
17,500
20,0001
98
4
19
85
19
86
19
87
19
88
19
89
19
90
19
91
19
92
19
93
19
94
19
95
19
96
19
97
19
98
19
99
20
00
20
01
20
02
20
03
20
04
20
05
20
06
20
07
20
08
20
09
20
10
20
11
20
12
C
Supply: World Changes Th
ou
san
d b
arre
ls p
er
day
OPEC
Non-OPEC/OECD
OECD
Source: IEA and Own Calculations

-
2,000
4,000
6,000
8,000
10,000
12,000
14,000
16,0001
98
4
19
85
19
86
19
87
19
88
19
89
19
90
19
91
19
92
19
93
19
94
19
95
19
96
19
97
19
98
19
99
20
00
20
01
20
02
20
03
20
04
20
05
20
06
20
07
20
08
20
09
20
10
20
11
20
12
C
Supply: OECD
Tho
usa
nd
bar
rels
pe
r d
ay
OECD Asia & Oceania
Source: IEA and Own Calculations

-
2,000
4,000
6,000
8,000
10,000
12,000
14,000
16,0001
98
4
19
85
19
86
19
87
19
88
19
89
19
90
19
91
19
92
19
93
19
94
19
95
19
96
19
97
19
98
19
99
20
00
20
01
20
02
20
03
20
04
20
05
20
06
20
07
20
08
20
09
20
10
20
11
20
12
C
Supply: OECD
Tho
usa
nd
bar
rels
pe
r d
ay
OECD Europe
Source: IEA and Own Calculations
-
2,000
4,000
6,000
8,000
10,000
12,000
14,000
16,0001
98
4
19
85
19
86
19
87
19
88
19
89
19
90
19
91
19
92
19
93
19
94
19
95
19
96
19
97
19
98
19
99
20
00
20
01
20
02
20
03
20
04
20
05
20
06
20
07
20
08
20
09
20
10
20
11
20
12
C
Supply: OECD
Tho
usa
nd
bar
rels
pe
r d
ay
OECD Americas
Source: IEA and Own Calculations

(2,000)
(1,500)
(1,000)
(500)
-
500
1,000
1,500
2,000
2,500
3,0001
98
4
19
85
19
86
19
87
19
88
19
89
19
90
19
91
19
92
19
93
19
94
19
95
19
96
19
97
19
98
19
99
20
00
20
01
20
02
20
03
20
04
20
05
20
06
20
07
20
08
20
09
20
10
20
11
20
12
C
Supply: OECD Changes Th
ou
san
d b
arre
ls p
er
day
OECD Asia & Oceania
Source: IEA and Own Calculations
(2,000)
(1,500)
(1,000)
(500)
-
500
1,000
1,500
2,000
2,500
3,0001
98
4
19
85
19
86
19
87
19
88
19
89
19
90
19
91
19
92
19
93
19
94
19
95
19
96
19
97
19
98
19
99
20
00
20
01
20
02
20
03
20
04
20
05
20
06
20
07
20
08
20
09
20
10
20
11
20
12
C
Supply: OECD Changes Th
ou
san
d b
arre
ls p
er
day
OECD Europe
Source: IEA and Own Calculations
(2,000)
(1,500)
(1,000)
(500)
-
500
1,000
1,500
2,000
2,500
3,0001
98
4
19
85
19
86
19
87
19
88
19
89
19
90
19
91
19
92
19
93
19
94
19
95
19
96
19
97
19
98
19
99
20
00
20
01
20
02
20
03
20
04
20
05
20
06
20
07
20
08
20
09
20
10
20
11
20
12
C
Supply: OECD Changes Th
ou
san
d b
arre
ls p
er
day
OECD Americas
Source: IEA and Own Calculations

-
2,500
5,000
7,500
10,000
12,500
15,000
17,500
20,000
22,500
25,000
27,5001
98
4
19
85
19
86
19
87
19
88
19
89
19
90
19
91
19
92
19
93
19
94
19
95
19
96
19
97
19
98
19
99
20
00
20
01
20
02
20
03
20
04
20
05
20
06
20
07
20
08
20
09
20
10
20
11
20
12
C
Supply: OPEC Th
ou
san
d b
arre
ls p
er
day
OPEC Latin America
Source: IEA and Own Calculations
-
2,500
5,000
7,500
10,000
12,500
15,000
17,500
20,000
22,500
25,000
27,5001
98
4
19
85
19
86
19
87
19
88
19
89
19
90
19
91
19
92
19
93
19
94
19
95
19
96
19
97
19
98
19
99
20
00
20
01
20
02
20
03
20
04
20
05
20
06
20
07
20
08
20
09
20
10
20
11
20
12
C
Supply: OPEC Th
ou
san
d b
arre
ls p
er
day
OPEC Africa
Source: IEA and Own Calculations
-
2,500
5,000
7,500
10,000
12,500
15,000
17,500
20,000
22,500
25,000
27,5001
98
4
19
85
19
86
19
87
19
88
19
89
19
90
19
91
19
92
19
93
19
94
19
95
19
96
19
97
19
98
19
99
20
00
20
01
20
02
20
03
20
04
20
05
20
06
20
07
20
08
20
09
20
10
20
11
20
12
C
Supply: OPEC Th
ou
san
d b
arre
ls p
er
day
OPEC Middle East
Source: IEA and Own Calculations
(1,500)
-
1,500
3,000
4,500
6,000
7,500
9,000
10,500
12,000
13,500
15,000
19
84
19
85
19
86
19
87
19
88
19
89
19
90
19
91
19
92
19
93
19
94
19
95
19
96
19
97
19
98
19
99
20
00
20
01
20
02
20
03
20
04
20
05
20
06
20
07
20
08
20
09
20
10
20
11
20
12
C
Supply: OPEC Changes Th
ou
san
d b
arre
ls p
er
day
OPEC Latin America
Source: IEA and Own Calculations
(1,500)
-
1,500
3,000
4,500
6,000
7,500
9,000
10,500
12,000
13,500
15,000
19
84
19
85
19
86
19
87
19
88
19
89
19
90
19
91
19
92
19
93
19
94
19
95
19
96
19
97
19
98
19
99
20
00
20
01
20
02
20
03
20
04
20
05
20
06
20
07
20
08
20
09
20
10
20
11
20
12
C
Supply: OPEC Changes Th
ou
san
d b
arre
ls p
er
day
OPEC Africa
Source: IEA and Own Calculations
(1,500)
-
1,500
3,000
4,500
6,000
7,500
9,000
10,500
12,000
13,500
15,000
19
84
19
85
19
86
19
87
19
88
19
89
19
90
19
91
19
92
19
93
19
94
19
95
19
96
19
97
19
98
19
99
20
00
20
01
20
02
20
03
20
04
20
05
20
06
20
07
20
08
20
09
20
10
20
11
20
12
C
Supply: OPEC Changes Th
ou
san
d b
arre
ls p
er
day
OPEC Middle East
Source: IEA and Own Calculations
-
2,000
4,000
6,000
8,000
10,000
12,000
14,0001
98
4
19
85
19
86
19
87
19
88
19
89
19
90
19
91
19
92
19
93
19
94
19
95
19
96
19
97
19
98
19
99
20
00
20
01
20
02
20
03
20
04
20
05
20
06
20
07
20
08
20
09
20
10
20
11
20
12
C
Supply: Non-OPEC/OECD Th
ou
san
d b
arre
ls p
er
day
Non-OECD Europe
Source: IEA and Own Calculations
-
2,000
4,000
6,000
8,000
10,000
12,000
14,0001
98
4
19
85
19
86
19
87
19
88
19
89
19
90
19
91
19
92
19
93
19
94
19
95
19
96
19
97
19
98
19
99
20
00
20
01
20
02
20
03
20
04
20
05
20
06
20
07
20
08
20
09
20
10
20
11
20
12
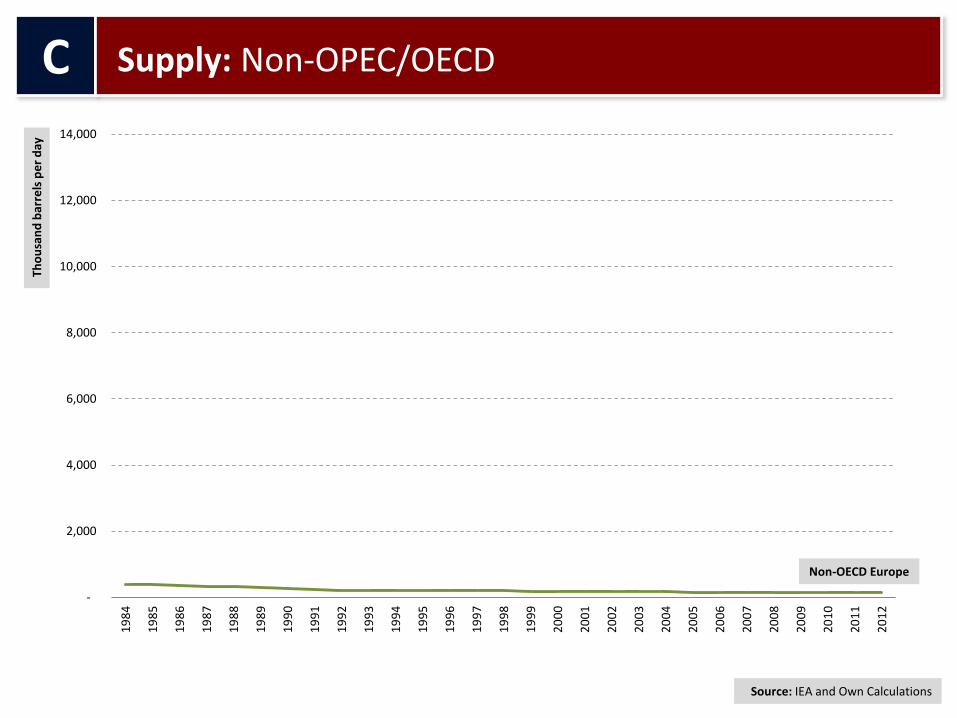
C
Supply: Non-OPEC/OECD Th
ou
san
d b
arre
ls p
er
day
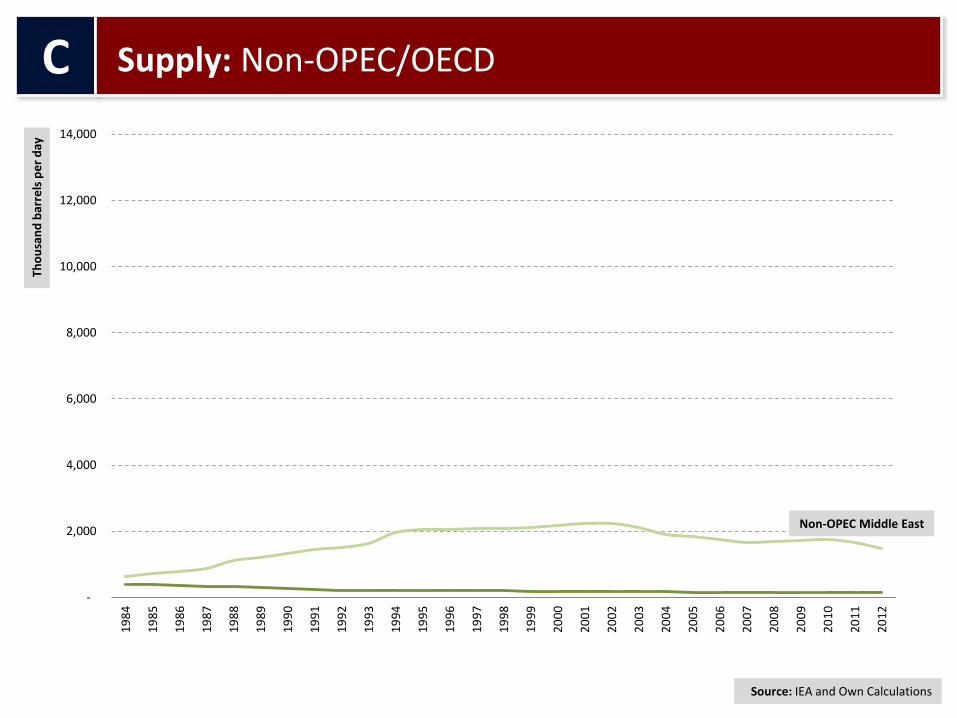
Non-OPEC Middle East
Source: IEA and Own Calculations
-
2,000
4,000
6,000
8,000
10,000
12,000
14,0001
98
4
19
85
19
86
19
87
19
88
19
89
19
90
19
91
19
92
19
93
19
94
19
95
19
96
19
97
19
98
19
99
20
00
20
01
20
02
20
03
20
04
20
05
20
06
20
07
20
08
20
09
20
10
20
11
20
12
C
Supply: Non-OPEC/OECD Th
ou
san
d b
arre
ls p
er
day
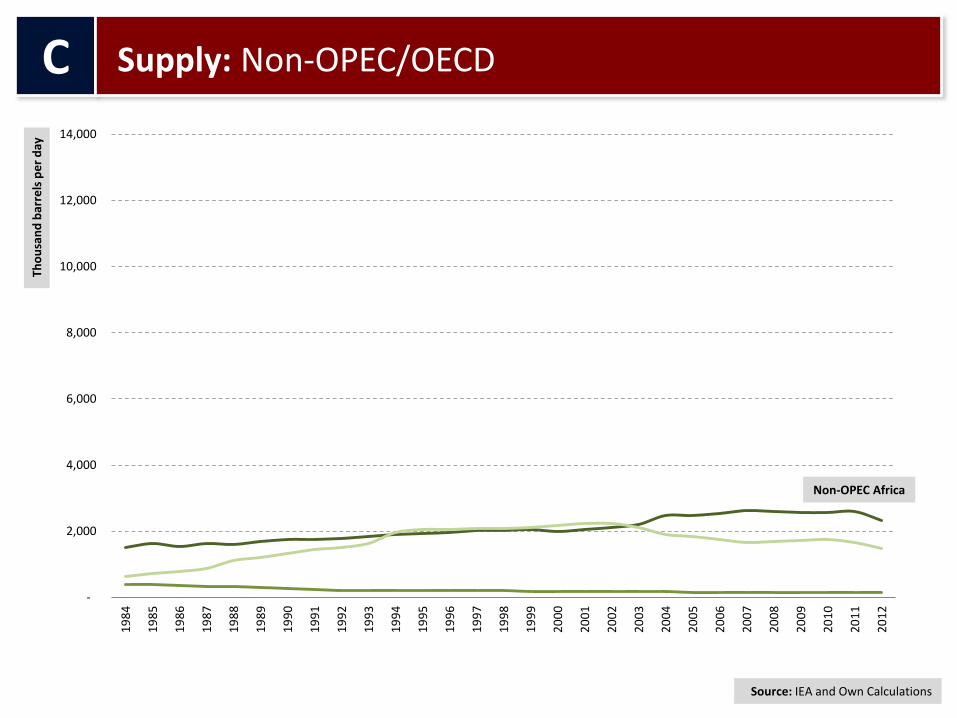
Non-OPEC Africa
Source: IEA and Own Calculations
-
2,000
4,000
6,000
8,000
10,000
12,000
14,0001
98
4
19
85
19
86
19
87
19
88
19
89
19
90
19
91
19
92
19
93
19
94
19
95
19
96
19
97
19
98
19
99
20
00
20
01
20
02
20
03
20
04
20
05
20
06
20
07
20
08
20
09
20
10
20
11
20
12
C
Supply: Non-OPEC/OECD Th
ou
san
d b
arre
ls p
er
day
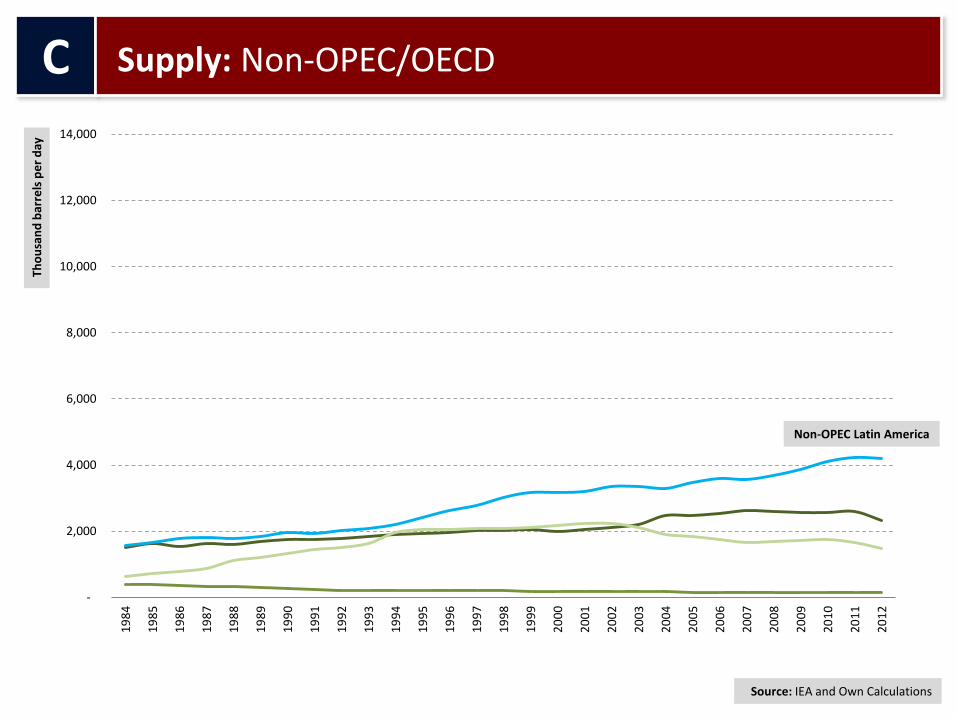
Non-OPEC Latin America
Source: IEA and Own Calculations

-
2,000
4,000
6,000
8,000
10,000
12,000
14,0001
98
4
19
85
19
86
19
87
19
88
19
89
19
90
19
91
19
92
19
93
19
94
19
95
19
96
19
97
19
98
19
99
20
00
20
01
20
02
20
03
20
04
20
05
20
06
20
07
20
08
20
09
20
10
20
11
20
12
C
Supply: Non-OPEC/OECD Th
ou
san
d b
arre
ls p
er
day
Non-OPEC Asia
Source: IEA and Own Calculations
-
2,000
4,000
6,000
8,000
10,000
12,000
14,0001
98
4
19
85
19
86
19
87
19
88
19
89
19
90
19
91
19
92
19
93
19
94
19
95
19
96
19
97
19
98
19
99
20
00
20
01
20
02
20
03
20
04
20
05
20
06
20
07
20
08
20
09
20
10
20
11
20
12
C
Supply: Non-OPEC/OECD Th
ou
san
d b
arre
ls p
er
day
Former USSR
Source: IEA and Own Calculations

(5,000)
(4,000)
(3,000)
(2,000)
(1,000)
-
1,000
2,000
3,0001
98
4
19
85
19
86
19
87
19
88
19
89
19
90
19
91
19
92
19
93
19
94
19
95
19
96
19
97
19
98
19
99
20
00
20
01
20
02
20
03
20
04
20
05
20
06
20
07
20
08
20
09
20
10
20
11
20
12
C
Supply: Non-OPEC/OECD Changes Th
ou
san
d b
arre
ls p
er
day
Non-OECD Europe
Source: IEA and Own Calculations
(5,000)
(4,000)
(3,000)
(2,000)
(1,000)
-
1,000
2,000
3,0001
98
4
19
85
19
86
19
87
19
88
19
89
19
90
19
91
19
92
19
93
19
94
19
95
19
96
19
97
19
98
19
99
20
00
20
01
20
02
20
03
20
04
20
05
20
06
20
07
20
08
20
09
20
10
20
11
20
12
C
Supply: Non-OPEC/OECD Changes Th
ou
san
d b
arre
ls p
er
day
Non-OPEC Middle East
Source: IEA and Own Calculations

(5,000)
(4,000)
(3,000)
(2,000)
(1,000)
-
1,000
2,000
3,0001
98
4
19
85
19
86
19
87
19
88
19
89
19
90
19
91
19
92
19
93
19
94
19
95
19
96
19
97
19
98
19
99
20
00
20
01
20
02
20
03
20
04
20
05
20
06
20
07
20
08
20
09
20
10
20
11
20
12
C
Supply: Non-OPEC/OECD Changes Th
ou
san
d b
arre
ls p
er
day
Non-OPEC Africa
Source: IEA and Own Calculations
(5,000)
(4,000)
(3,000)
(2,000)
(1,000)
-
1,000
2,000
3,0001
98
4
19
85
19
86
19
87
19
88
19
89
19
90
19
91
19
92
19
93
19
94
19
95
19
96
19
97
19
98
19
99
20
00
20
01
20
02
20
03
20
04
20
05
20
06
20
07
20
08
20
09
20
10
20
11
20
12
C
Supply: Non-OPEC/OECD Changes Th
ou
san
d b
arre
ls p
er
day
Former USSR
Source: IEA and Own Calculations
(5,000)
(4,000)
(3,000)
(2,000)
(1,000)
-
1,000
2,000
3,0001
98
4
19
85
19
86
19
87
19
88
19
89
19
90
19
91
19
92
19
93
19
94
19
95
19
96
19
97
19
98
19
99
20
00
20
01
20
02
20
03
20
04
20
05
20
06
20
07
20
08
20
09
20
10
20
11
20
12
C
Supply: Non-OPEC/OECD Changes Th
ou
san
d b
arre
ls p
er
day
Non-OPEC Latin America
Source: IEA and Own Calculations
(5,000)
(4,000)
(3,000)
(2,000)
(1,000)
-
1,000
2,000
3,0001
98
4
19
85
19
86
19
87
19
88
19
89
19
90
19
91
19
92
19
93
19
94
19
95
19
96
19
97
19
98
19
99
20
00
20
01
20
02
20
03
20
04
20
05
20
06
20
07
20
08
20
09
20
10
20
11
20
12
C
Supply: Non-OPEC/OECD Changes Th
ou
san
d b
arre
ls p
er
day
Non-OPEC Asia
Source: IEA and Own Calculations
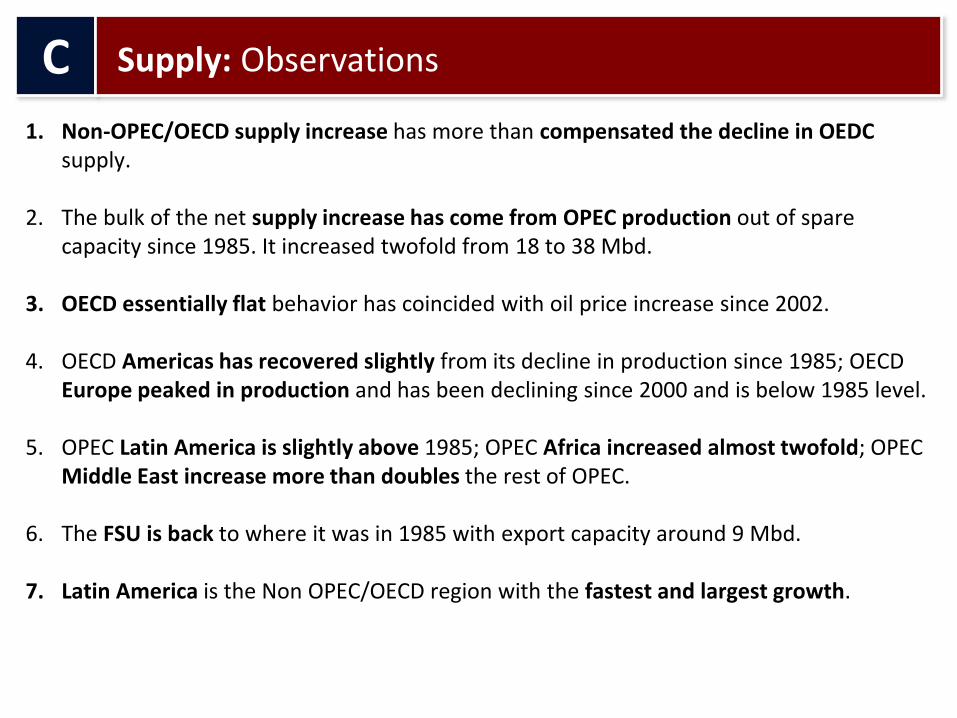
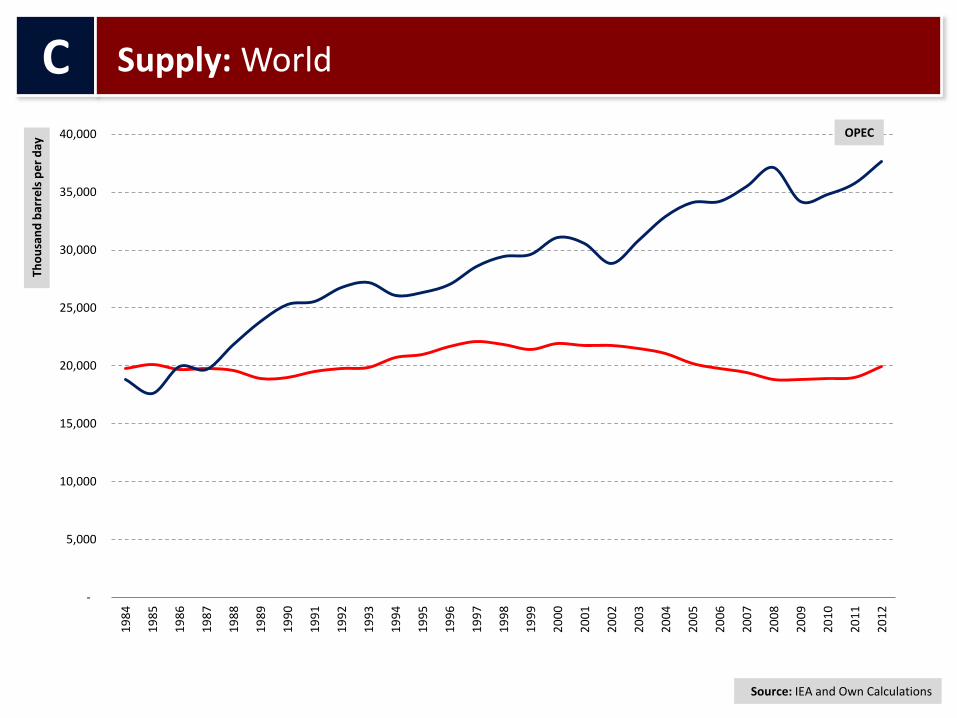
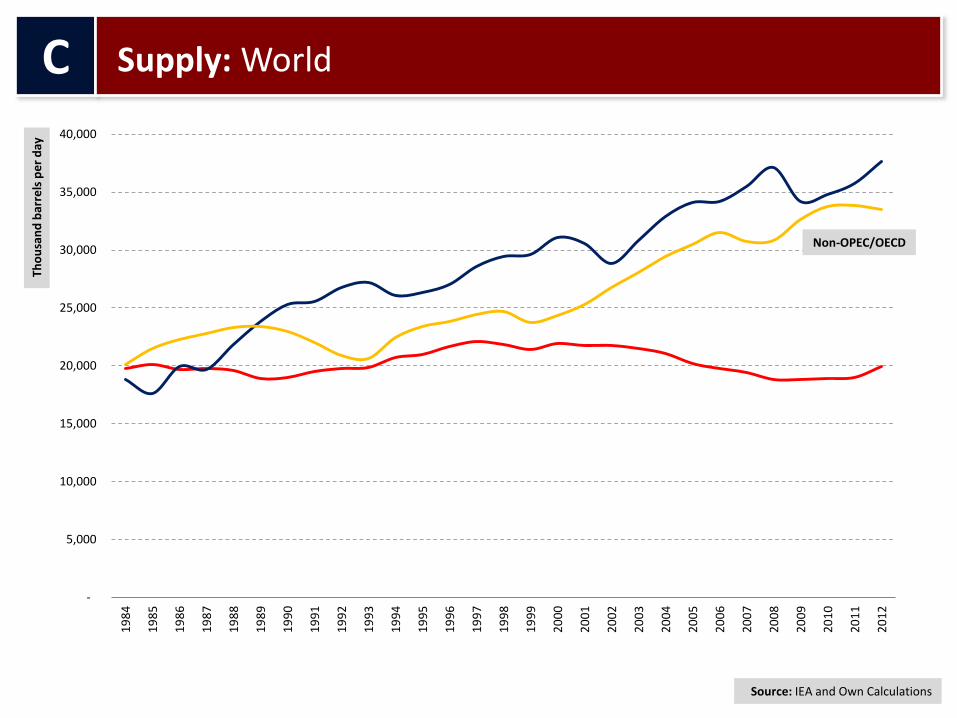
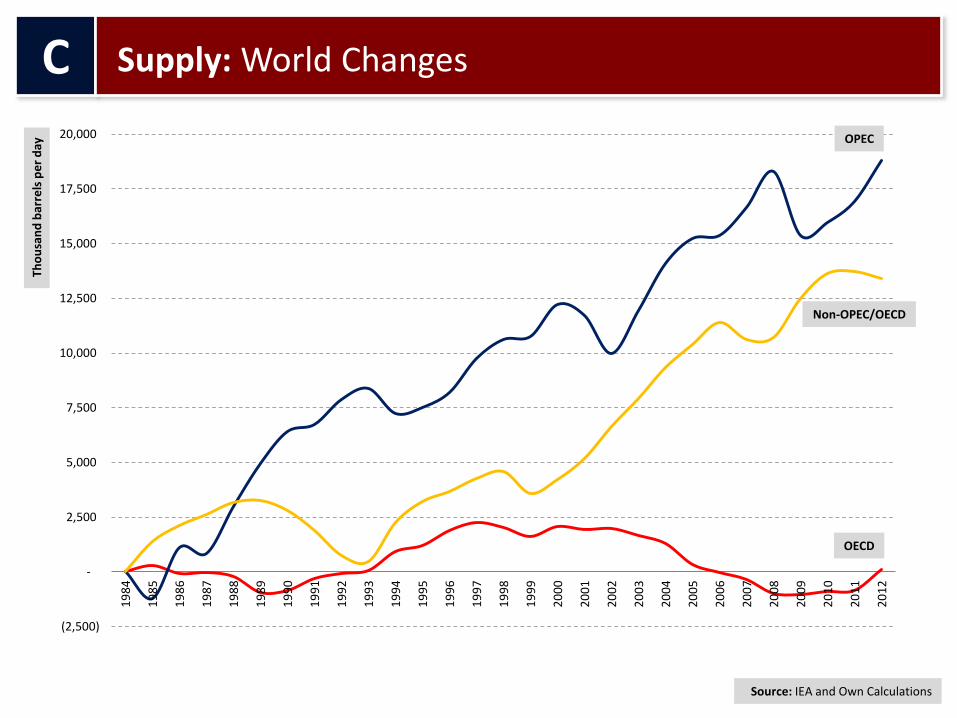
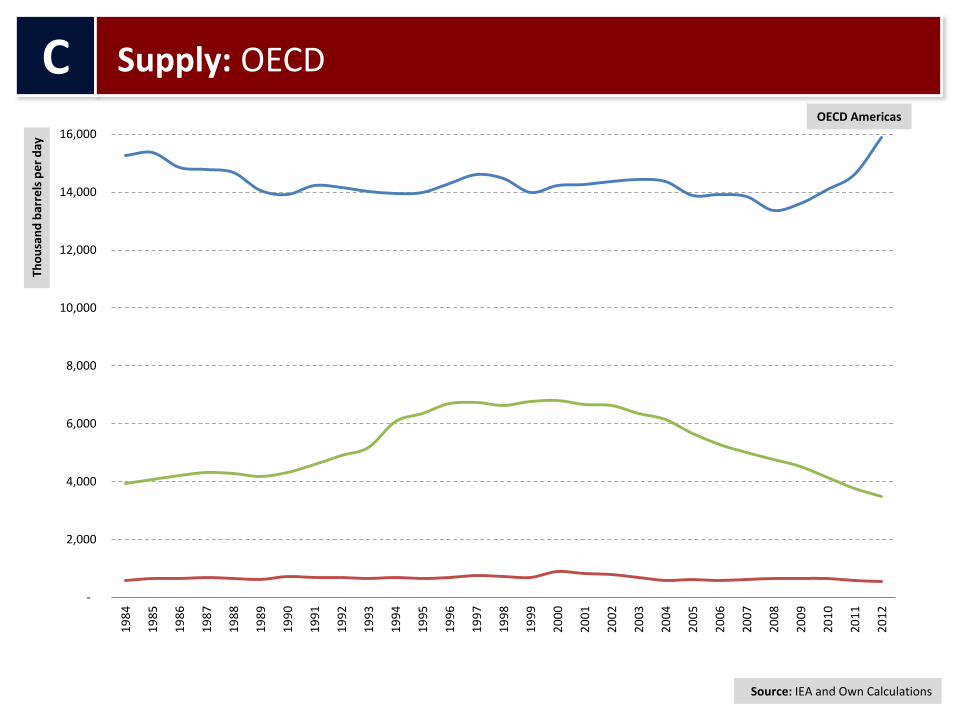
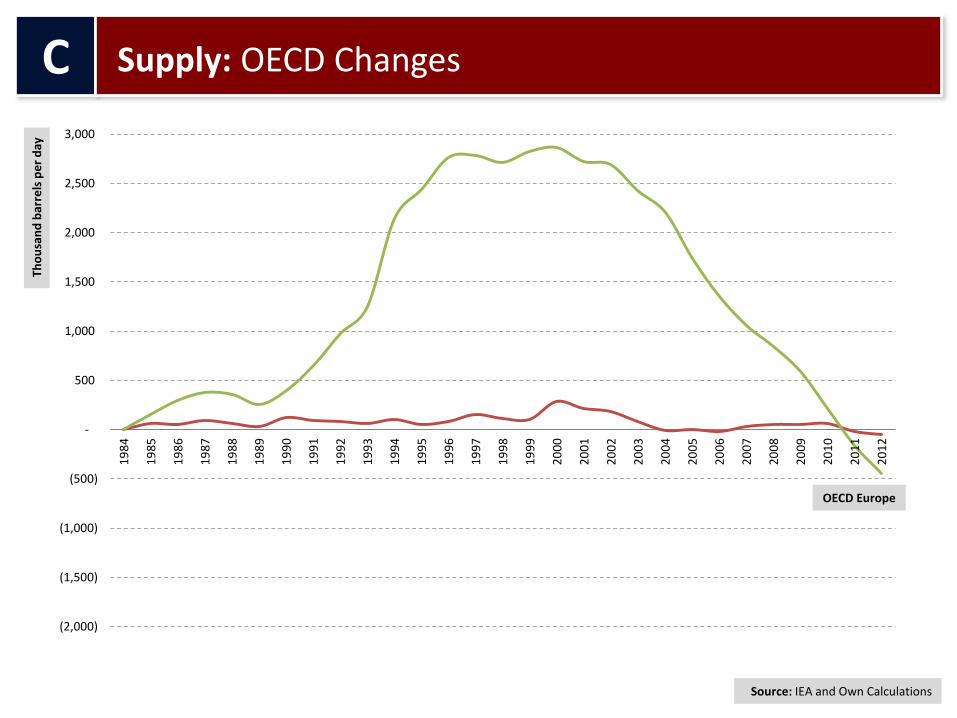
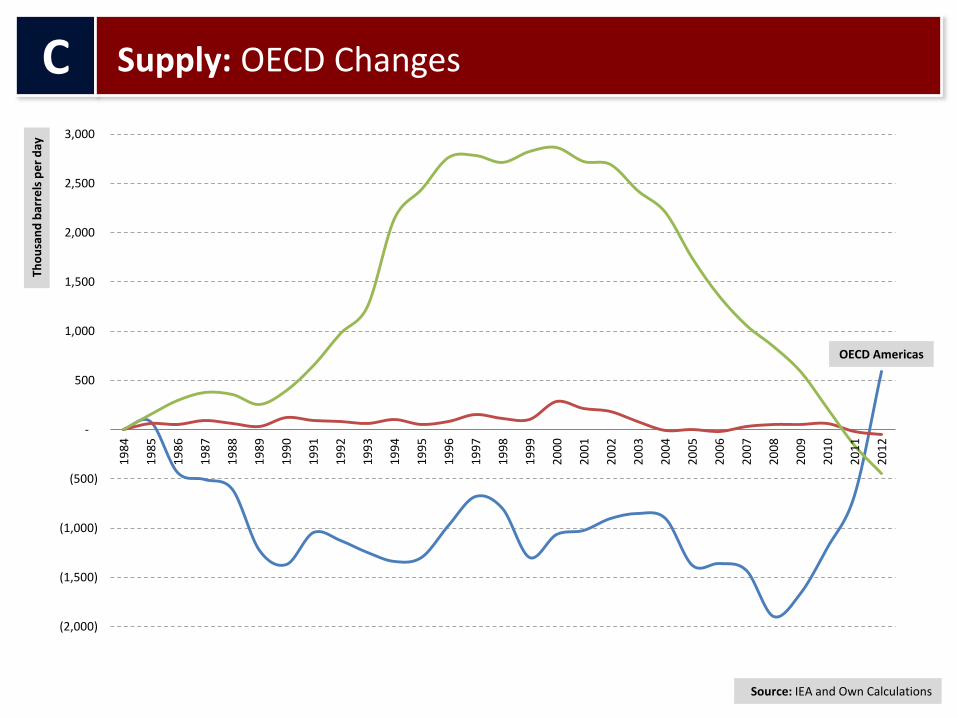
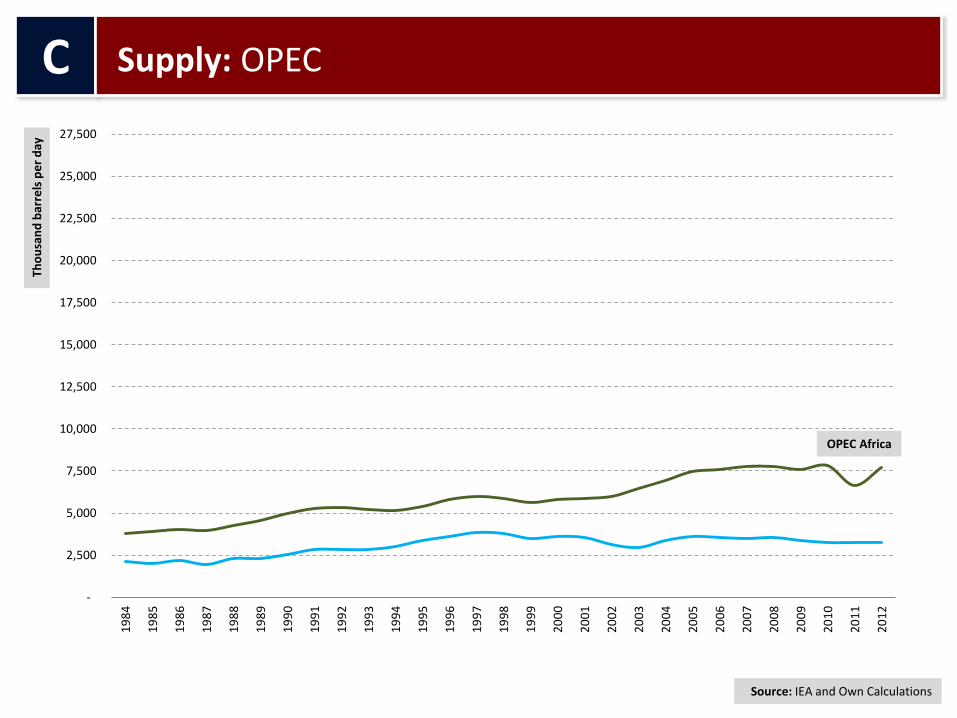
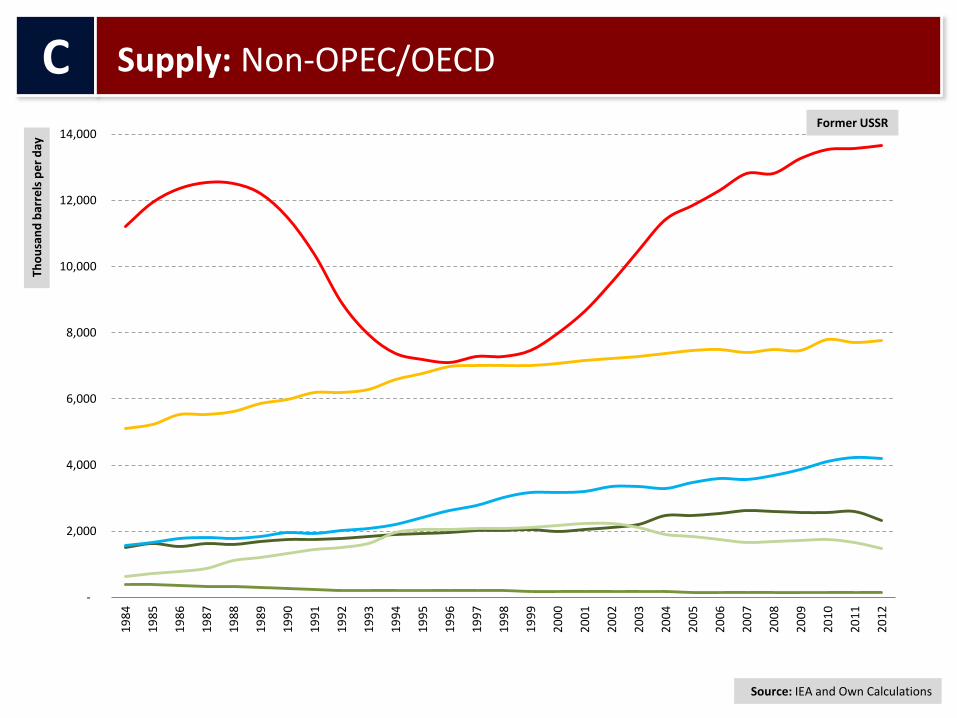
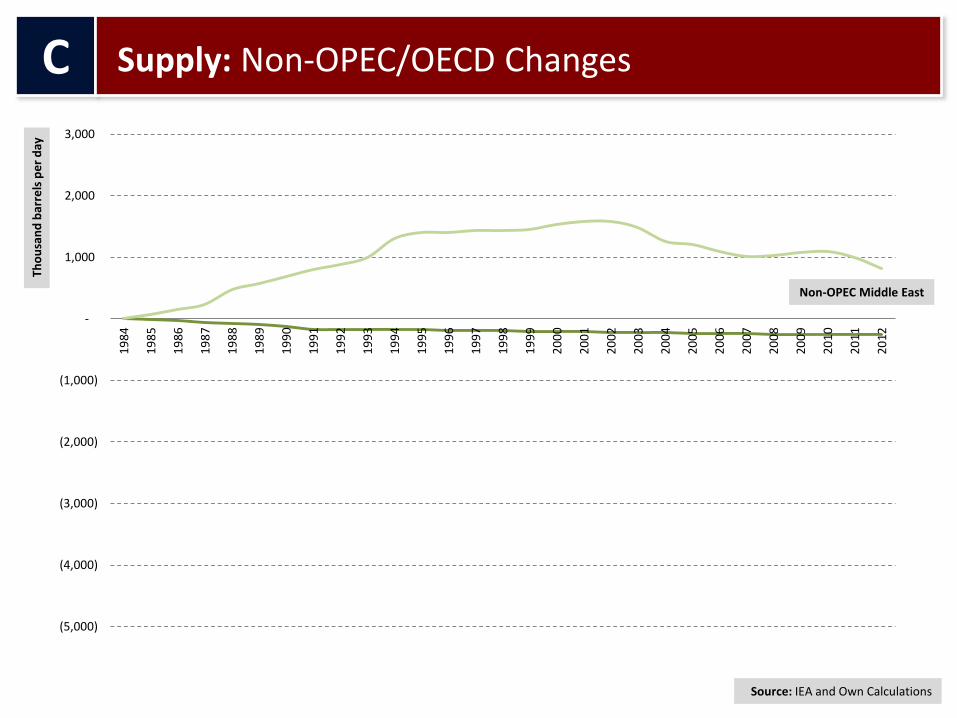
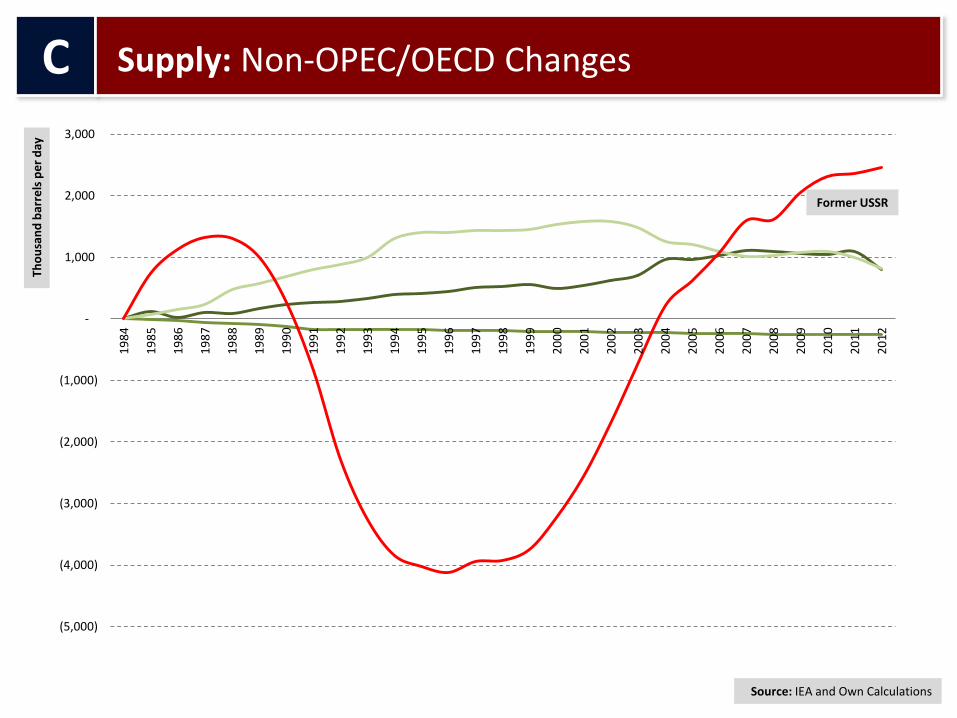
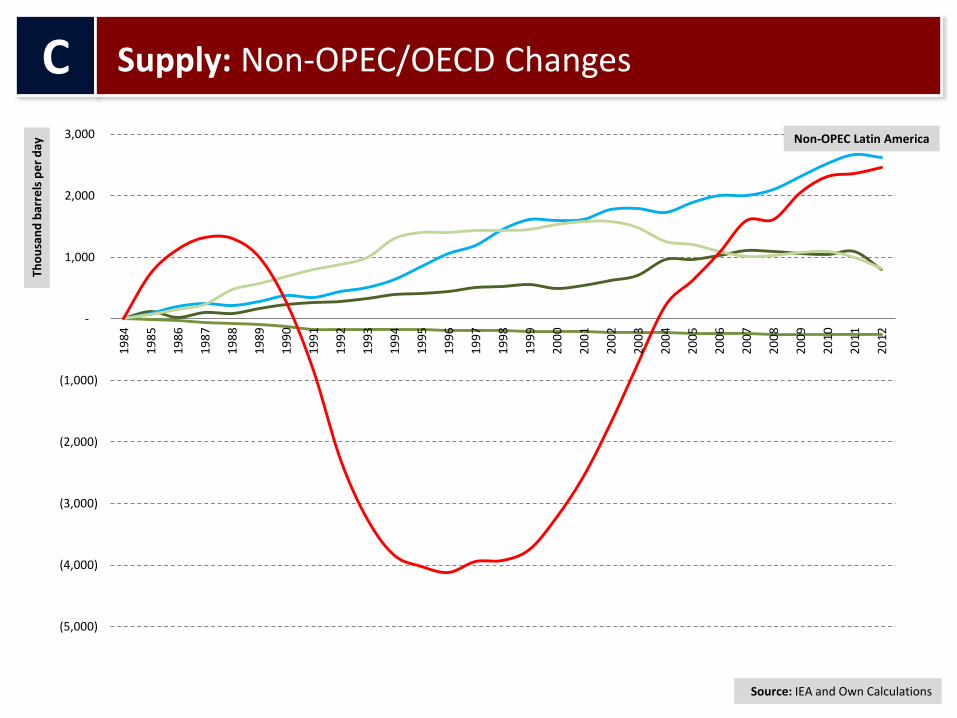
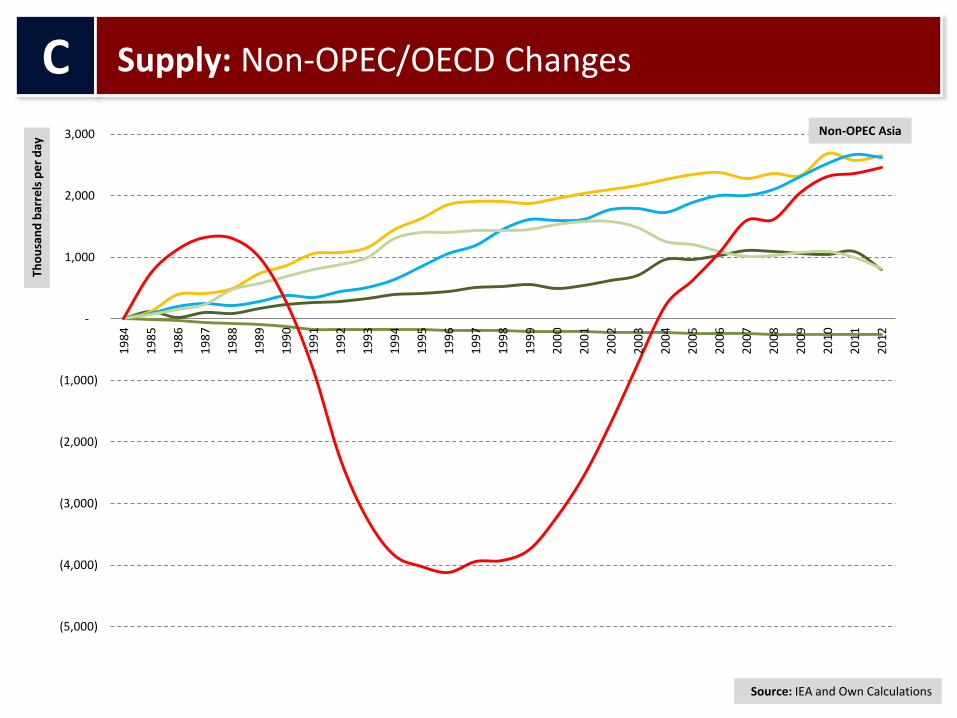
1. Non-OPEC/OECD supply increase has more than compensated the decline in OEDC supply.
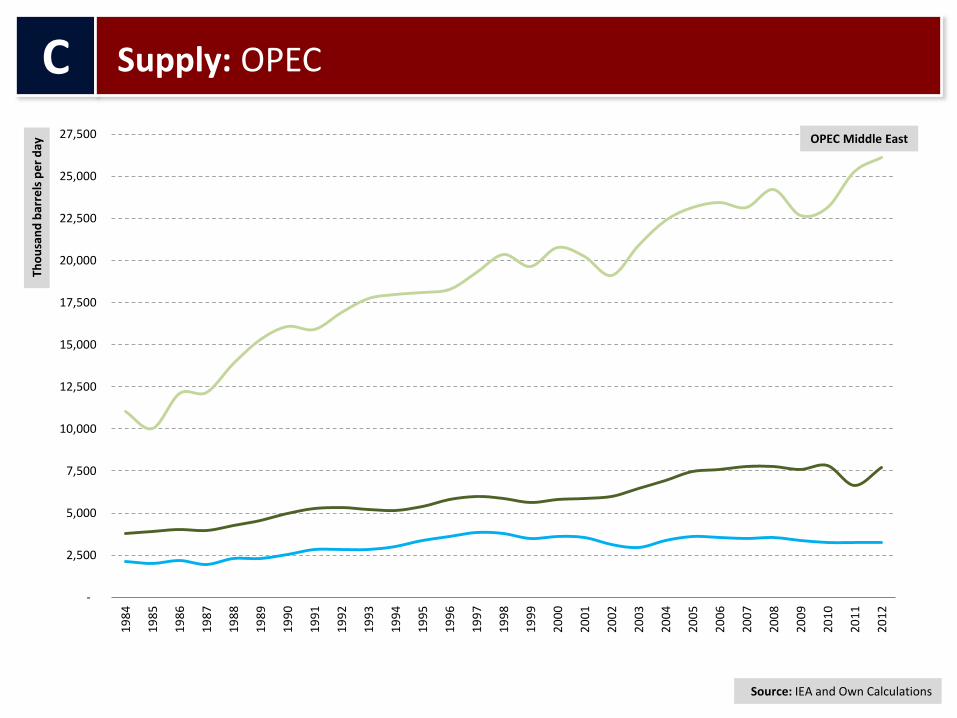
2. The bulk of the net supply increase has come from OPEC production out of spare capacity since 1985. It increased twofold from 18 to 38 Mbd.
3. OECD essentially flat behavior has coincided with oil price increase since 2002.
4. OECD Americas has recovered slightly from its decline in production since 1985; OECD Europe peaked in production and has been declining since 2000 and is below 1985 level.
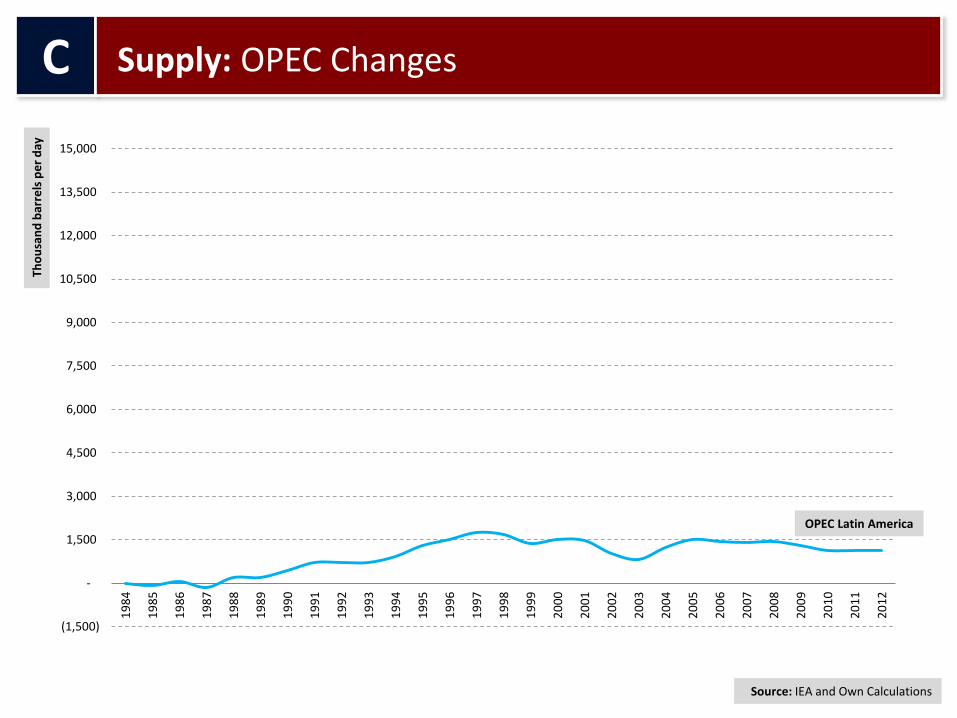
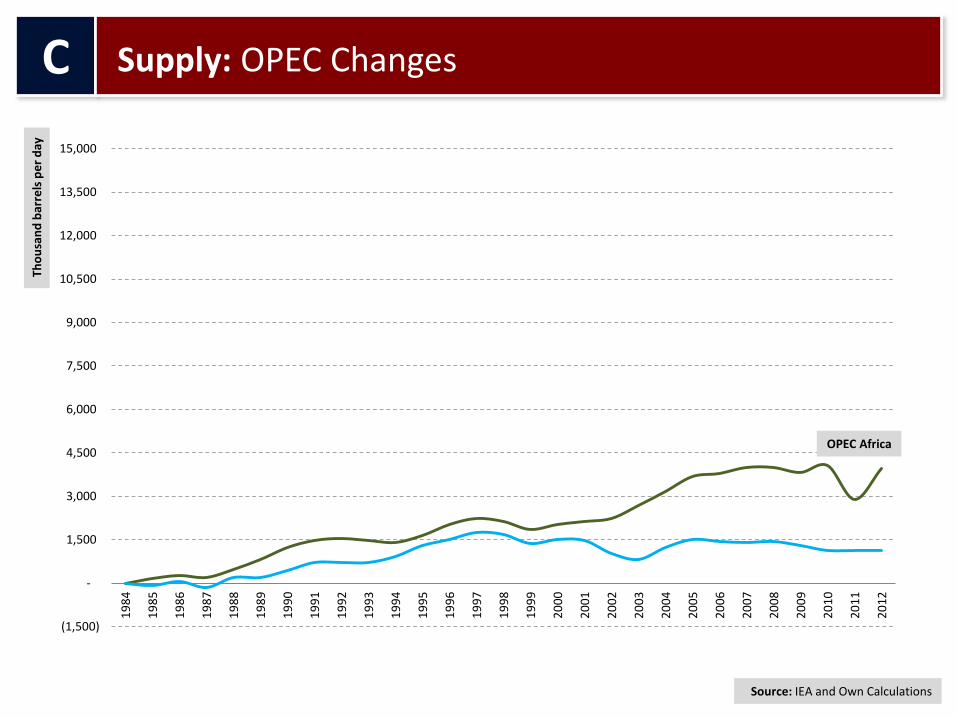
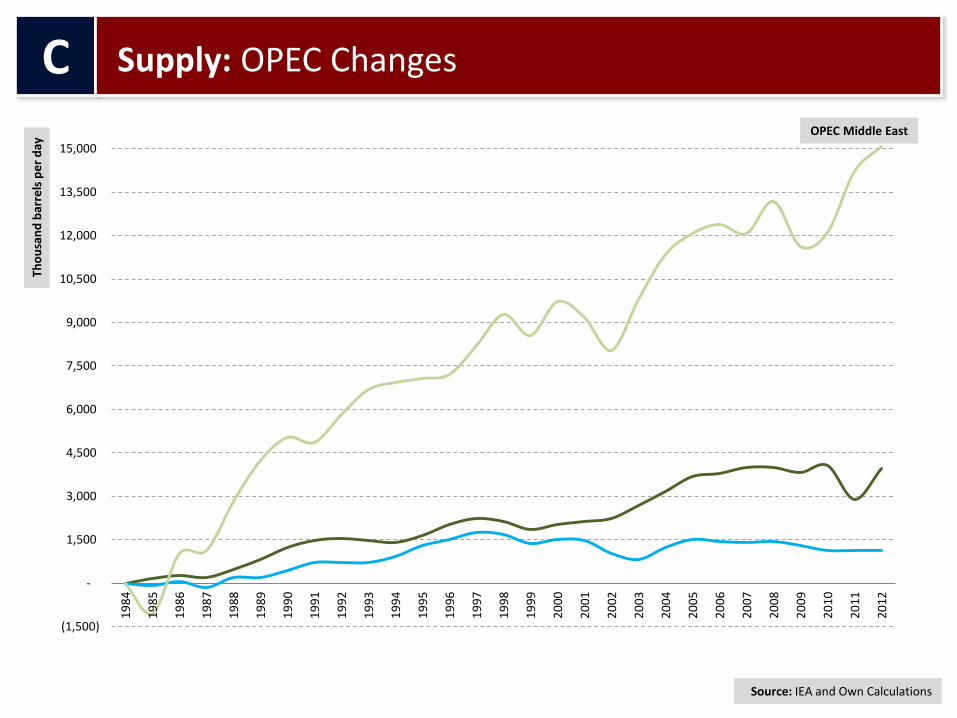
5. OPEC Latin America is slightly above 1985; OPEC Africa increased almost twofold; OPEC Middle East increase more than doubles the rest of OPEC.
6. The FSU is back to where it was in 1985 with export capacity around 9 Mbd.
7. Latin America is the Non OPEC/OECD region with the fastest and largest growth.
C
Supply: Observations
2 A New Energy Paradigm
Price Scenarios
New Sources of Crude
A
B
D
C
Changes in Demand
New Oil Balances
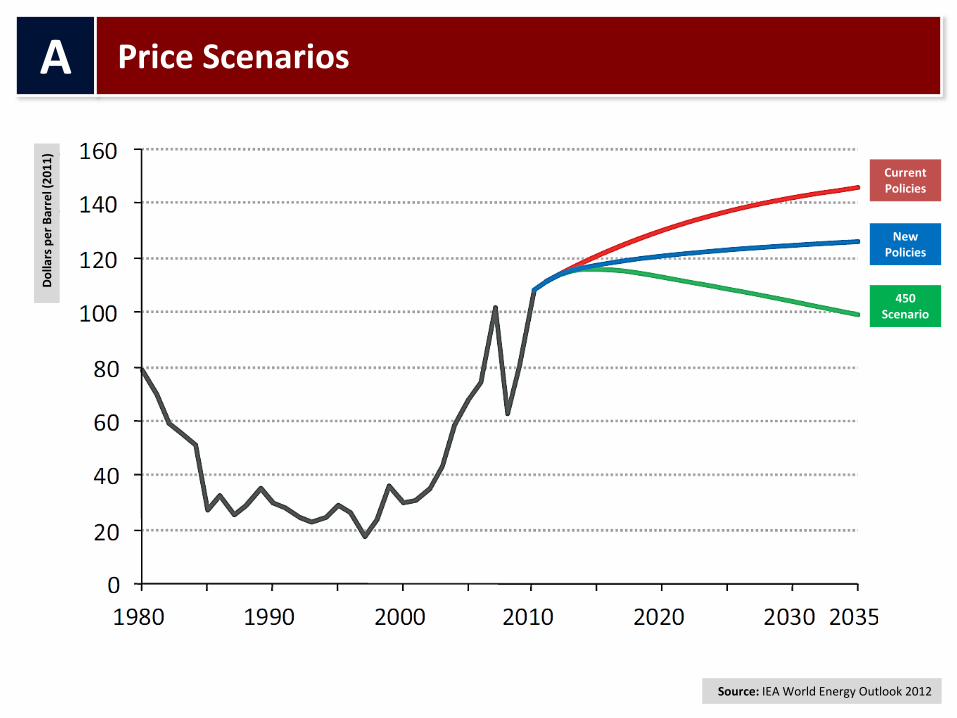
A Price Scenarios
Source: IEA World Energy Outlook 2012
Current Policies
New Policies
450 Scenario
Do
llars
pe
r B
arre
l (2
01
1)

B Changes in World Demand M
illio
n b
arre
ls p
er
day
Source: IEA World Energy Outlook 2012
Do
llars
pe
r b
arre
l (2
01
1)
Current Policies
New Policies
450 Scenario
Source: IEA World Energy Outlook 2012
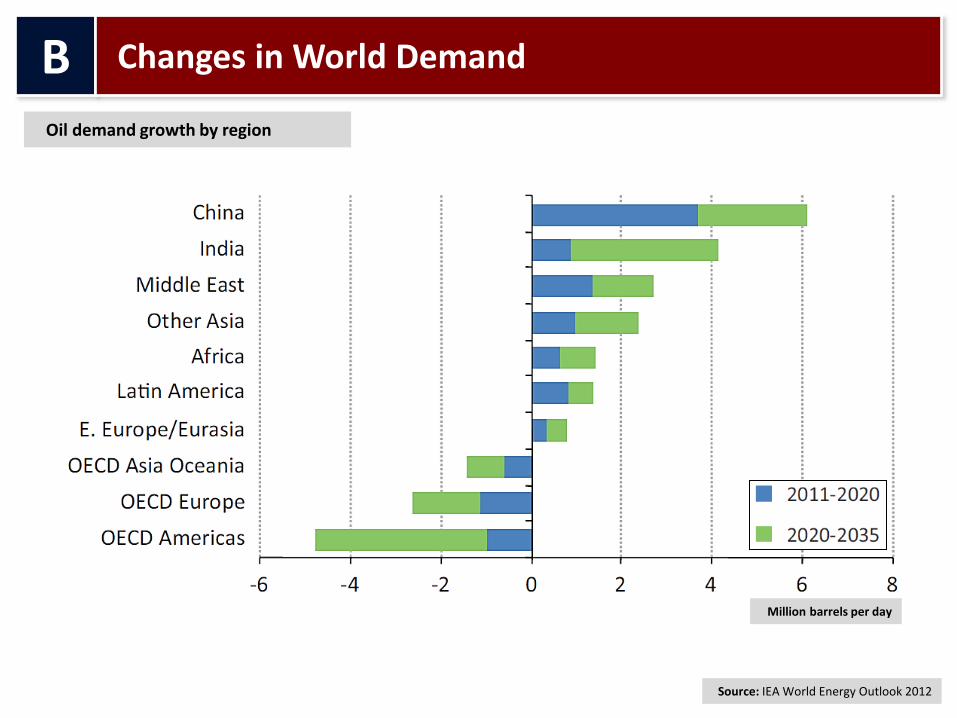
B Changes in World Demand
Oil demand growth by region
Million barrels per day

Source: IEA World Energy Outlook 2012
B Changes in Demand B
illio
n t
on
ne
-Km
Incremental road freight growth by region since 2000

Source: IEA World Energy Outlook 2012
C New Sources of Crude
World oil supply by type
Mill
ion
bar
rels
pe
r d
ay
Processing Gains Light tight oil Other unconventional oil
NGLs Fields yet-to-be found Fields yet-to-be developed Currently producing

Source: IEA World Energy Outlook 2012
C New Sources of Crude
US oil production by type
Mill
ion
bar
rels
pe
r d
ay
Light tight oil Other unconventional oil
Fields yet-to-be found Fields yet-to-be developed Currently producing
NGLs
0
2
4
6
8
10
12
14
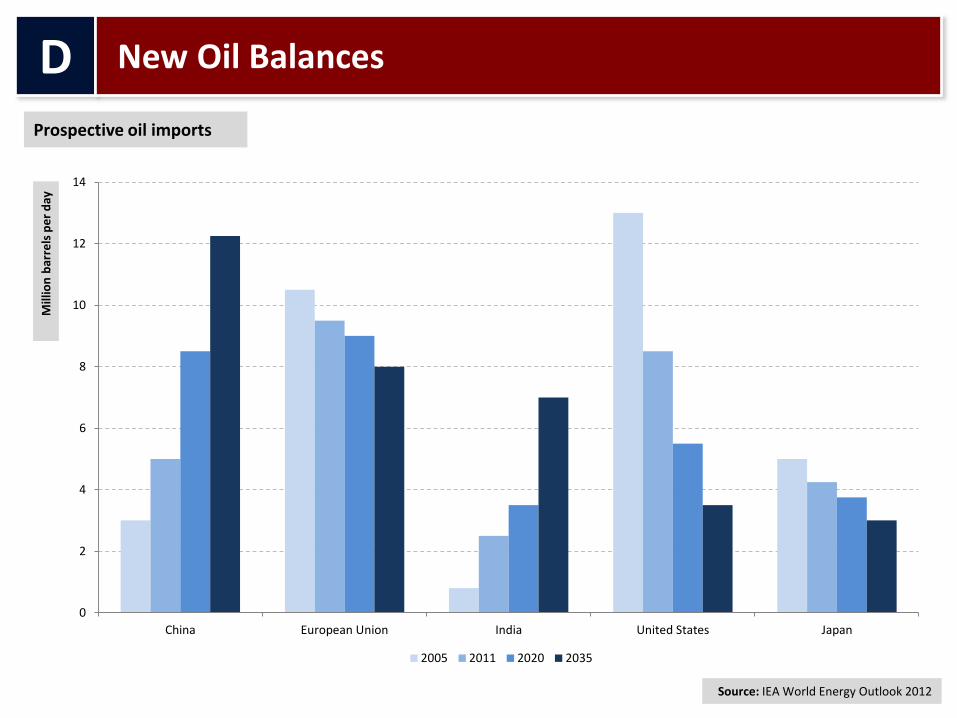
China European Union India United States Japan
2005 2011 2020 2035
Source: IEA World Energy Outlook 2012
D New Oil Balances
Prospective oil imports
Mill
ion
bar
rels
pe
r d
ay
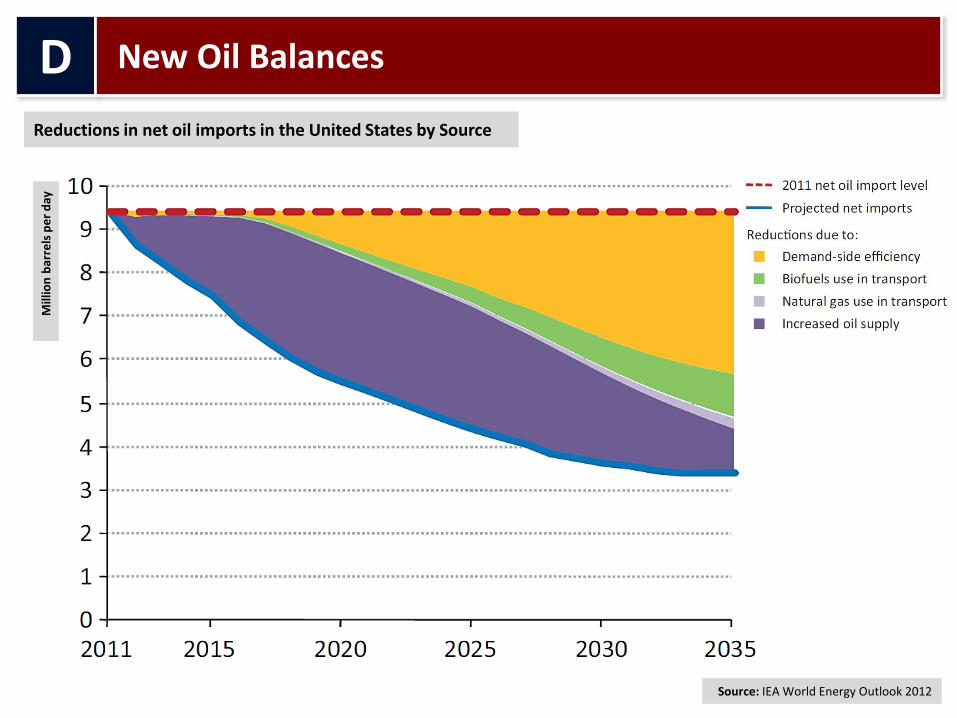
D New Oil Balances
Reductions in net oil imports in the United States by Source
Source: IEA World Energy Outlook 2012
Mill
ion
bar
rels
pe
r d
ay
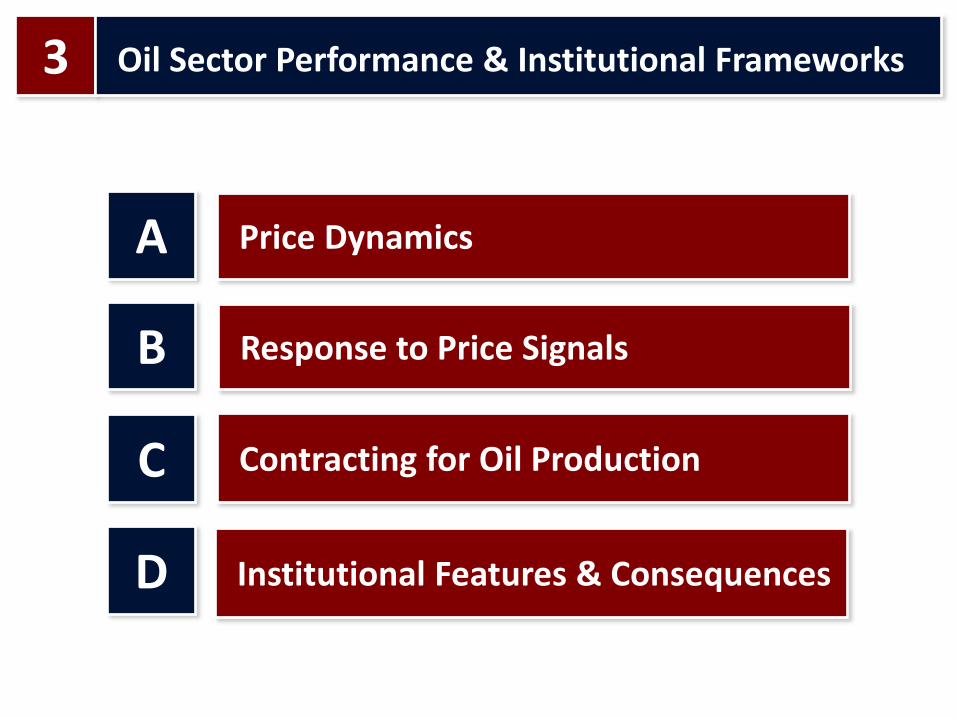
3
Oil Sector Performance & Institutional Frameworks
Price Dynamics
Contracting for Oil Production
A
B
D
C
Response to Price Signals
Institutional Features & Consequences
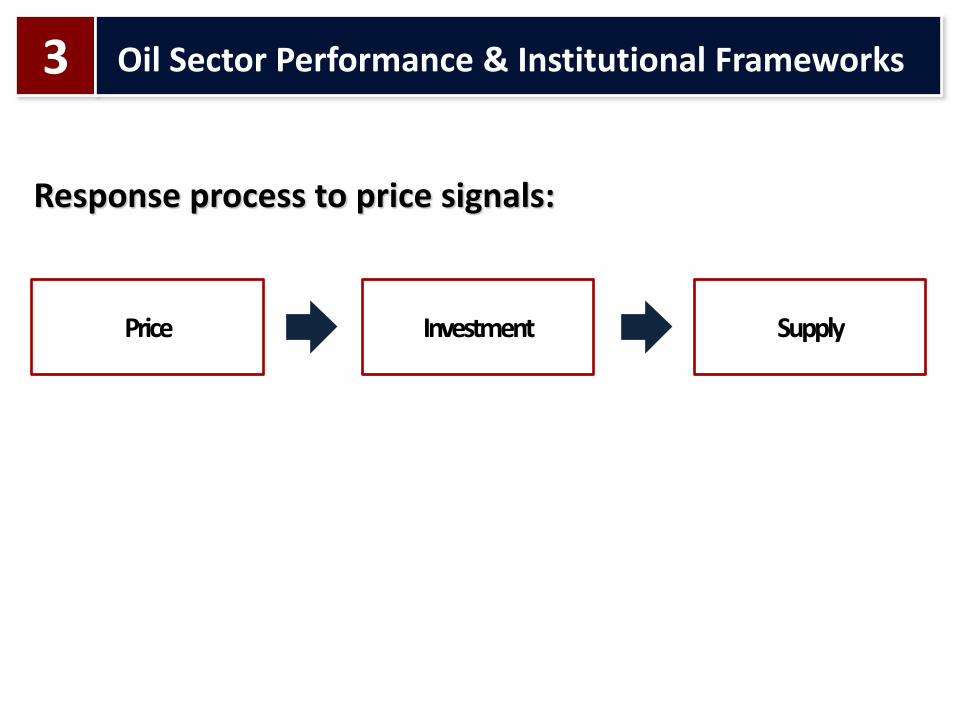
Response process to price signals:
Price Investment Supply
3
Oil Sector Performance & Institutional Frameworks

Response process to price signals:
Price Investment
Active Drilling Rigs
3
Oil Sector Performance & Institutional Frameworks
050
100
150
$/b
bl
1995m1 2000m1 2005m1 2010m1Period
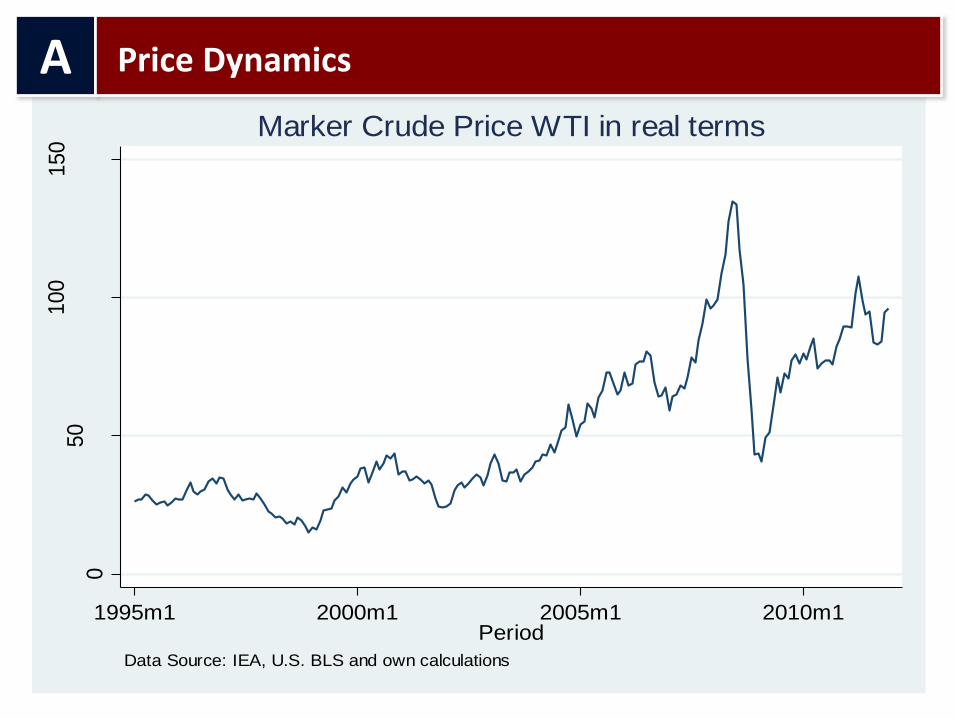
Data Source: IEA, U.S. BLS and own calculations
Marker Crude Price WTI in real terms
A
Price Dynamics
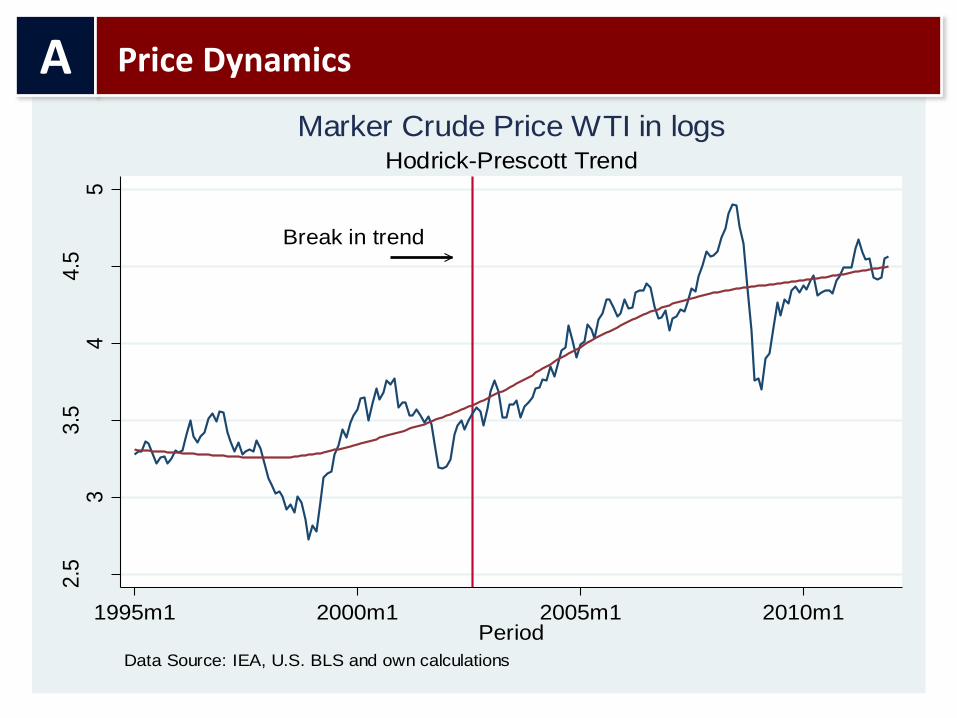
Break in trend
2.5
33.5
44.5
5
WT
I in
logs
1995m1 2000m1 2005m1 2010m1Period
Data Source: IEA, U.S. BLS and own calculations
Hodrick-Prescott Trend
Marker Crude Price WTI in logs
A
Price Dynamics
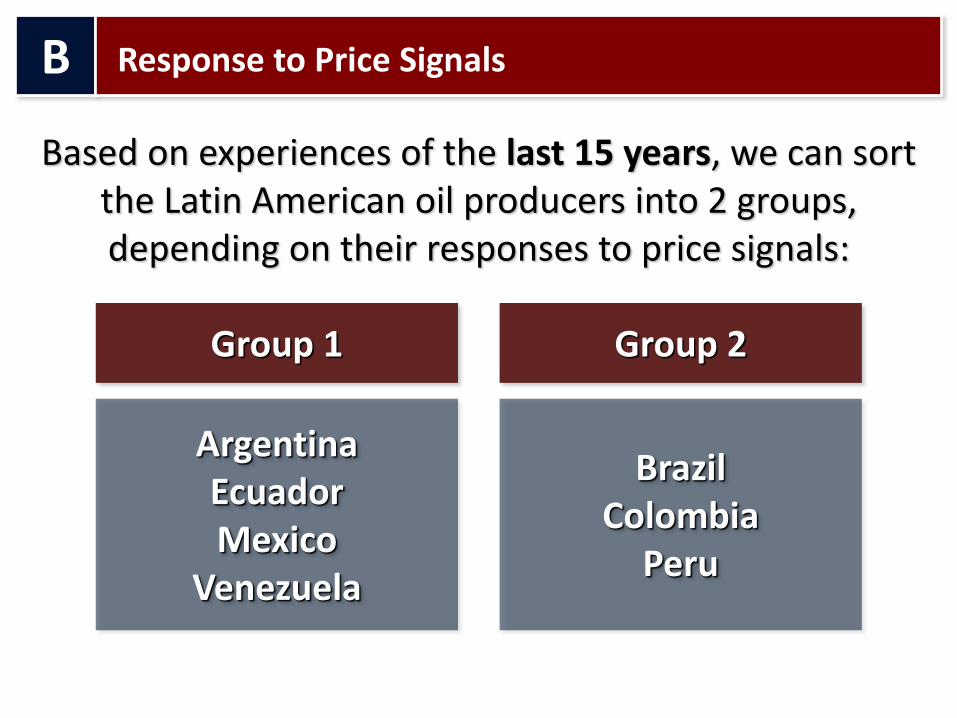
Based on experiences of the last 15 years, we can sort the Latin American oil producers into 2 groups, depending on their responses to price signals:
Group 1 Group 2
Argentina Ecuador Mexico
Venezuela
Brazil Colombia
Peru
B
Response to Price Signals
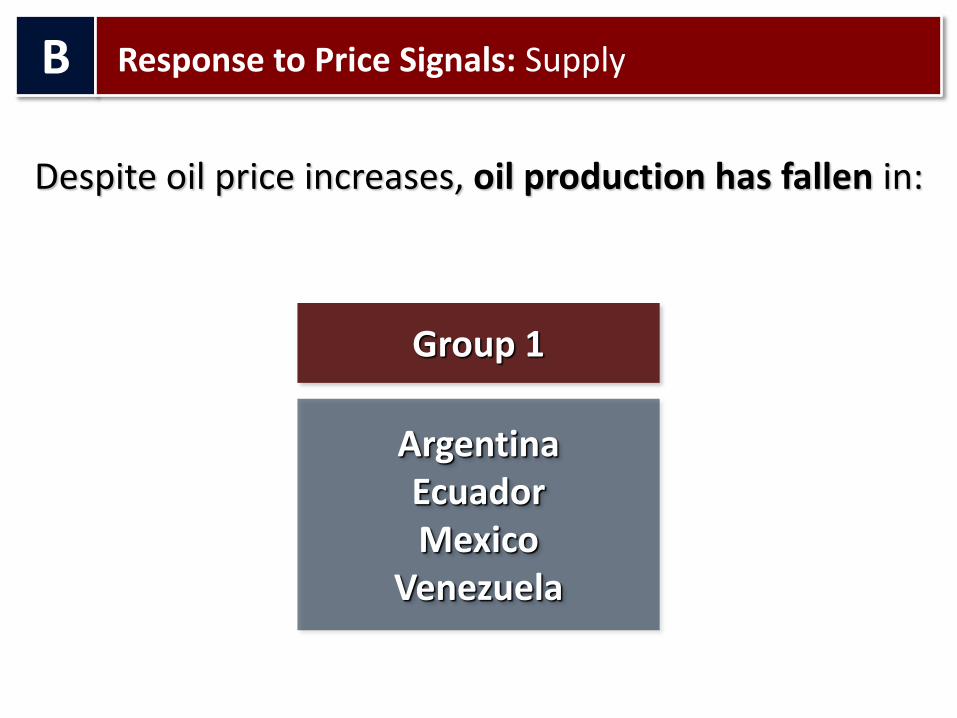
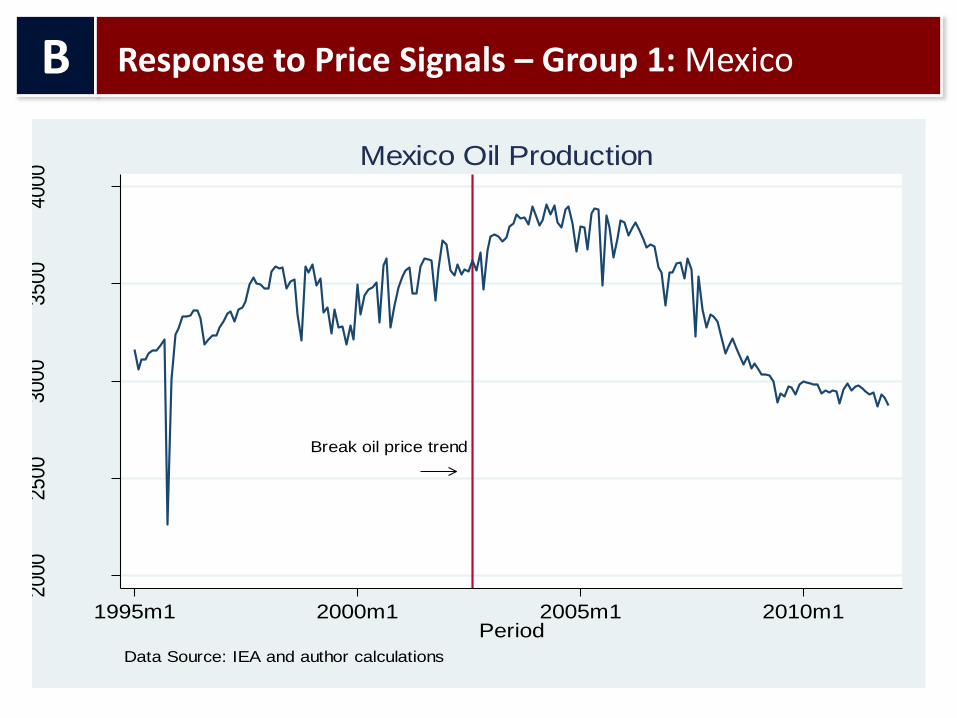
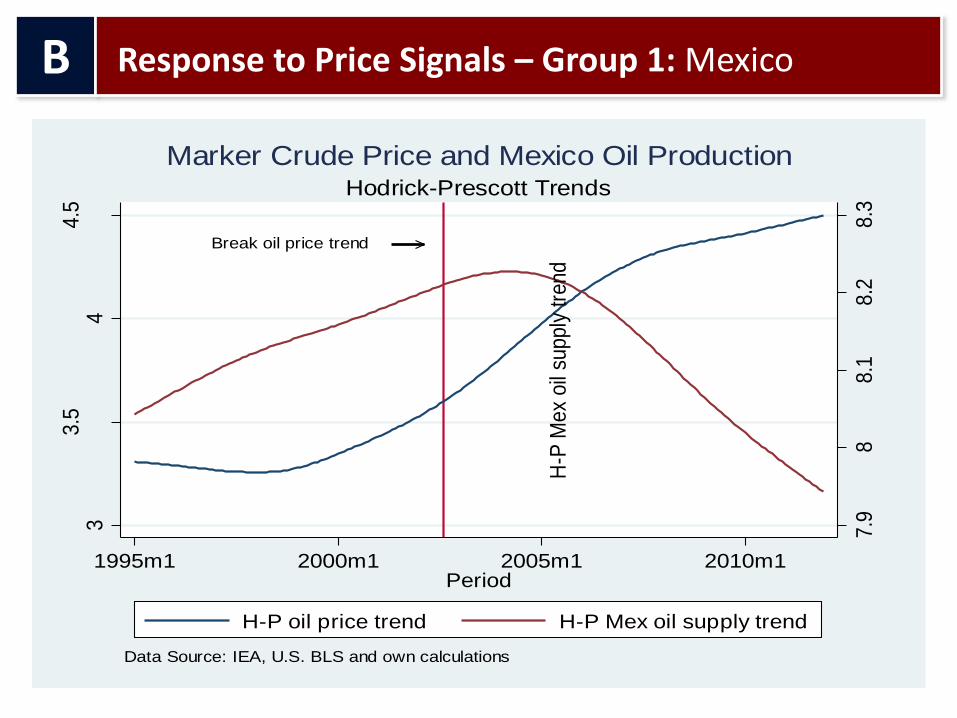
Despite oil price increases, oil production has fallen in:
Group 1
Argentina Ecuador Mexico
Venezuela
B
Response to Price Signals: Supply
Break oil price trend
600
700
800
900
supply
(th
b/d
)
1995m1 2000m1 2005m1 2010m1Period
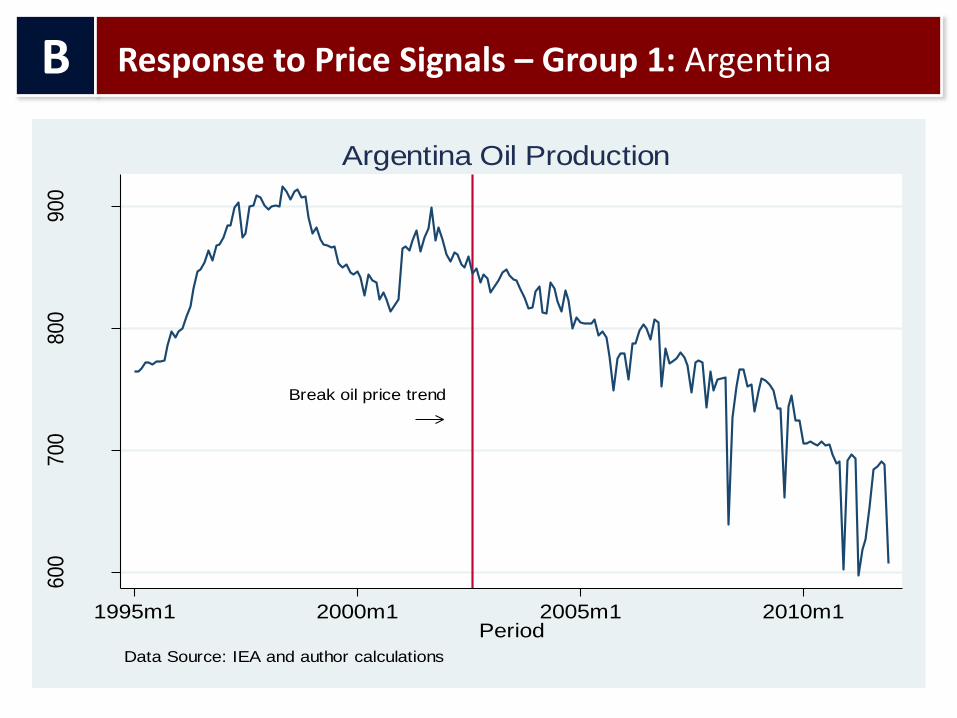
Data Source: IEA and author calculations
Argentina Oil Production
B
Response to Price Signals – Group 1: Argentina
Break oil price trend
6.5
6.6
6.7
6.8
H-P
oil
supply
tre
nd
33.5
44.5
H-P
oil
pri
ce tre
nd
1995m1 2000m1 2005m1 2010m1Period
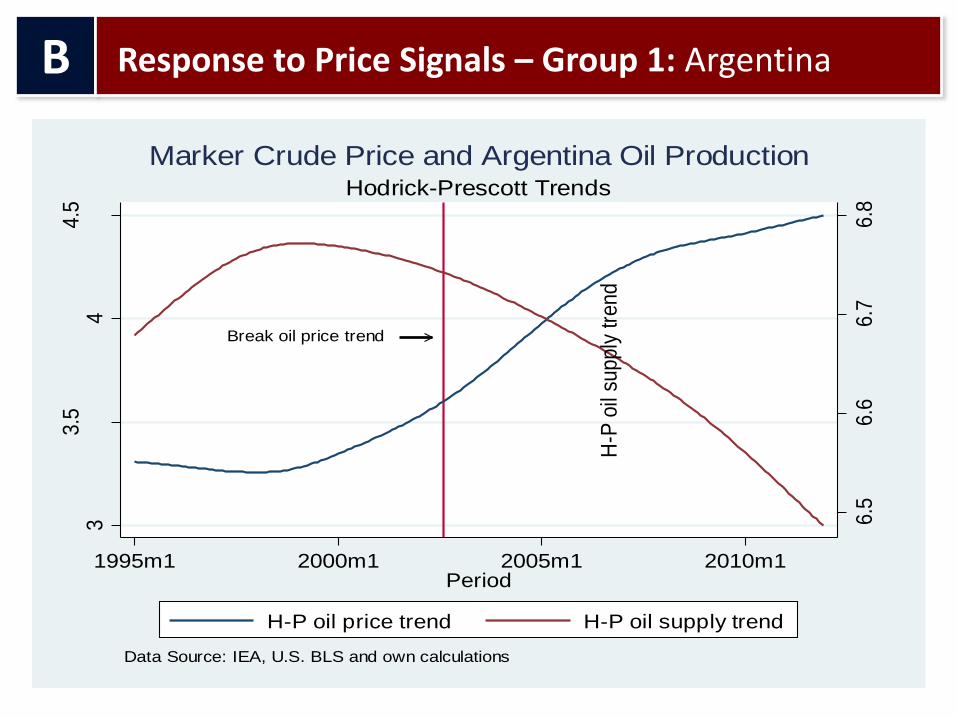
H-P oil price trend H-P oil supply trend
Data Source: IEA, U.S. BLS and own calculations
Hodrick-Prescott Trends
Marker Crude Price and Argentina Oil Production
B
Response to Price Signals – Group 1: Argentina

Break oil price trend
300
350
400
450
500
550
supply
(th
b/d
)
1995m1 2000m1 2005m1 2010m1Period
Data Source: IEA and author calculations
Ecuador Oil Production
B
Response to Price Signals – Group 1: Ecuador
Break oil price trend
5.9
66.1
6.2
6.3
H-P
Ecu
oil
supply
tre
nd
33.5
44.5
H-P
oil
pri
ce tre
nd
1995m1 2000m1 2005m1 2010m1Period
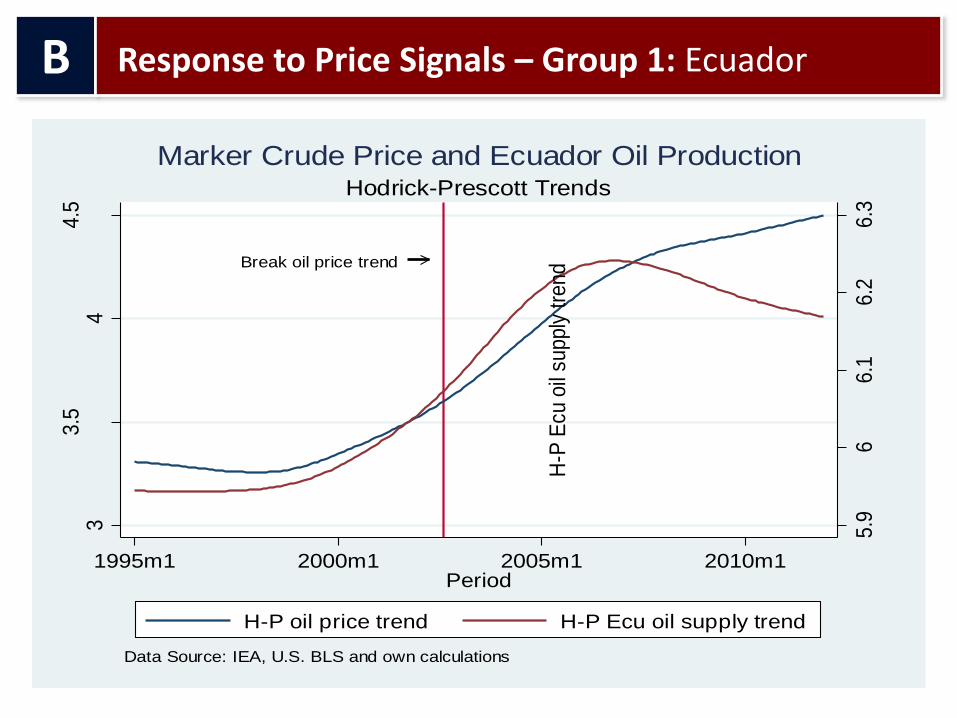
H-P oil price trend H-P Ecu oil supply trend
Data Source: IEA, U.S. BLS and own calculations
Hodrick-Prescott Trends
Marker Crude Price and Ecuador Oil Production
B
Response to Price Signals – Group 1: Ecuador
Break oil price trend
2000
2500
3000
3500
4000
supply
(th
b/d
)
1995m1 2000m1 2005m1 2010m1Period
Data Source: IEA and author calculations
Mexico Oil Production
B
Response to Price Signals – Group 1: Mexico
Break oil price trend
7.9
88.1
8.2
8.3
H-P
Mex
oil
supply
tre
nd
33.5
44.5
H-P
oil
pri
ce tre
nd
1995m1 2000m1 2005m1 2010m1Period
H-P oil price trend H-P Mex oil supply trend
Data Source: IEA, U.S. BLS and own calculations
Hodrick-Prescott Trends
Marker Crude Price and Mexico Oil Production
B
Response to Price Signals – Group 1: Mexico

Break oil price trend
1500
2000
2500
3000
3500
supply
(th
b/d
)
1995m1 2000m1 2005m1 2010m1Period
Data Source: IEA and author calculations
Venezuela Oil Production
B
Response to Price Signals – Group 1: Venezuela

Break oil price trend
7.9
7.9
58
8.0
58.1
H-P
Vzl
a o
il su
pply
tre
nd
33.5
44.5
H-P
oil
pri
ce tre
nd
1995m1 2000m1 2005m1 2010m1Period
H-P oil price trend H-P Vzla oil supply trend
Data Source: IEA, U.S. BLS and own calculations
Hodrick-Prescott Trends
Marker Crude Price and Venezuela Oil Production
B
Response to Price Signals – Group 1: Venezuela
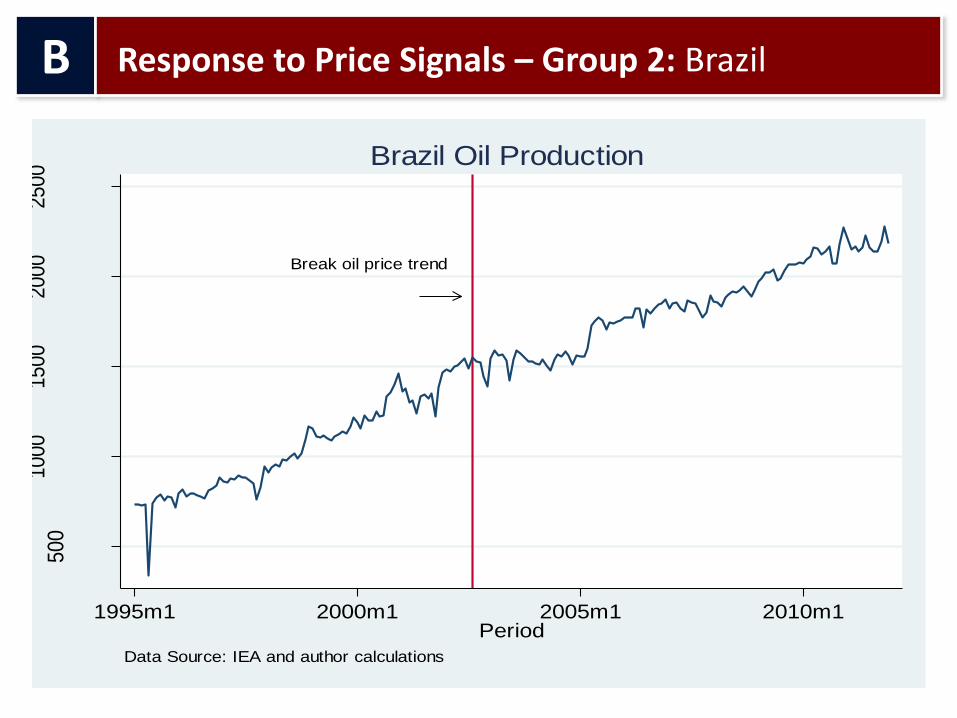
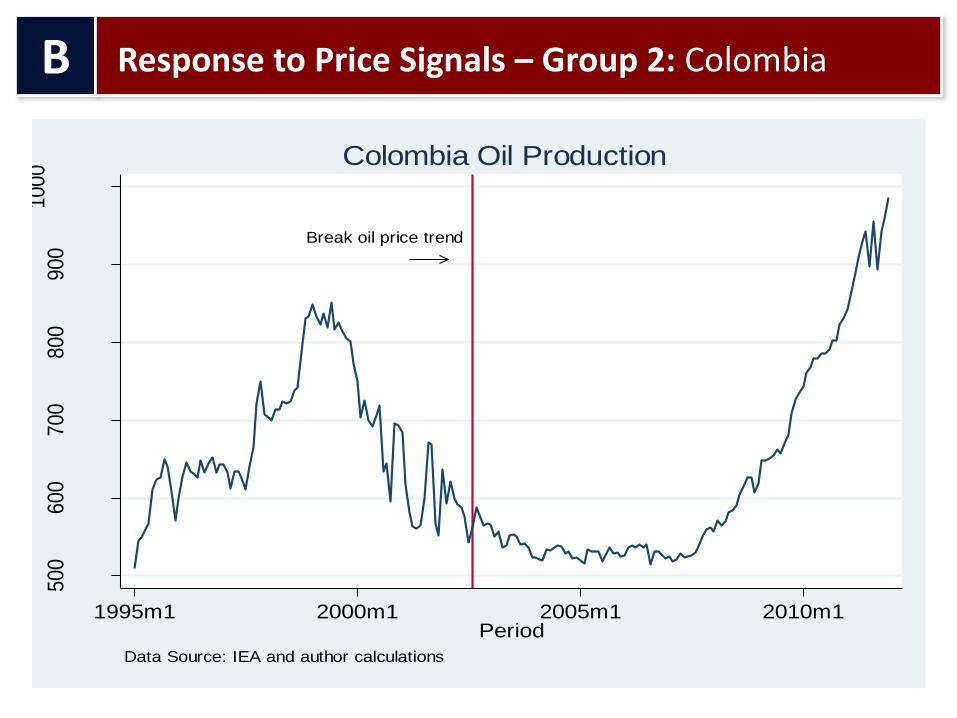
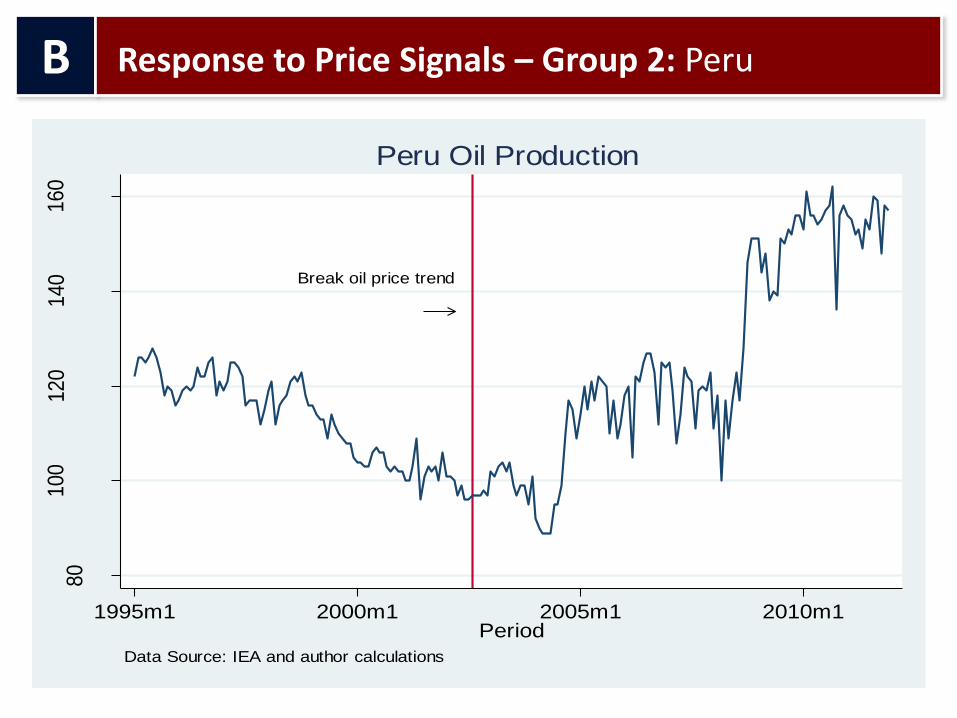
Following oil price increases, oil production has sharply increased in:
Group 2
Brazil Colombia
Peru
B
Response to Price Signals: Supply
Break oil price trend
500
1000
1500
2000
2500
supply
(th
b/d
)
1995m1 2000m1 2005m1 2010m1Period
Data Source: IEA and author calculations
Brazil Oil Production
B
Response to Price Signals – Group 2: Brazil

Break oil price trend
6.5
77.5
8
H-P
Bra
oil
supply
tre
nd
33.5
44.5
H-P
oil
pri
ce tre
nd
1995m1 2000m1 2005m1 2010m1Period
H-P oil price trend H-P Bra oil supply trend
Data Source: IEA, U.S. BLS and own calculations
Hodrick-Prescott Trends
Marker Crude Price and Brazil Oil Production
B
Response to Price Signals – Group 2: Brazil
Break oil price trend
500
600
700
800
900
1000
supply
(th
b/d
)
1995m1 2000m1 2005m1 2010m1Period
Data Source: IEA and author calculations
Colombia Oil Production
B
Response to Price Signals – Group 2: Colombia

Break oil price trend
6.3
6.4
6.5
6.6
6.7
6.8
H-P
Col o
il su
pply
tre
nd
33.5
44.5
H-P
oil
pri
ce tre
nd
1995m1 2000m1 2005m1 2010m1Period
H-P oil price trend H-P Col oil supply trend
Data Source: IEA, U.S. BLS and own calculations
Hodrick-Prescott Trends
Marker Crude Price and Colombia Oil Production
B
Response to Price Signals – Group 2: Colombia
Break oil price trend
80
100
120
140
160
supply
(th
b/d
)
1995m1 2000m1 2005m1 2010m1Period
Data Source: IEA and author calculations
Peru Oil Production
B
Response to Price Signals – Group 2: Peru

Break oil price trend
4.6
4.7
4.8
4.9
55.1
H-P
Per
oil s
upply
tre
nd
33.5
44.5
H-P
oil
pri
ce tre
nd
1995m1 2000m1 2005m1 2010m1Period
H-P oil price trend H-P Per oil supply trend
Data Source: IEA, U.S. BLS and own calculations
Hodrick-Prescott Trends
Marker Crude Price and Peru Oil Production
B
Response to Price Signals – Group 2: Peru
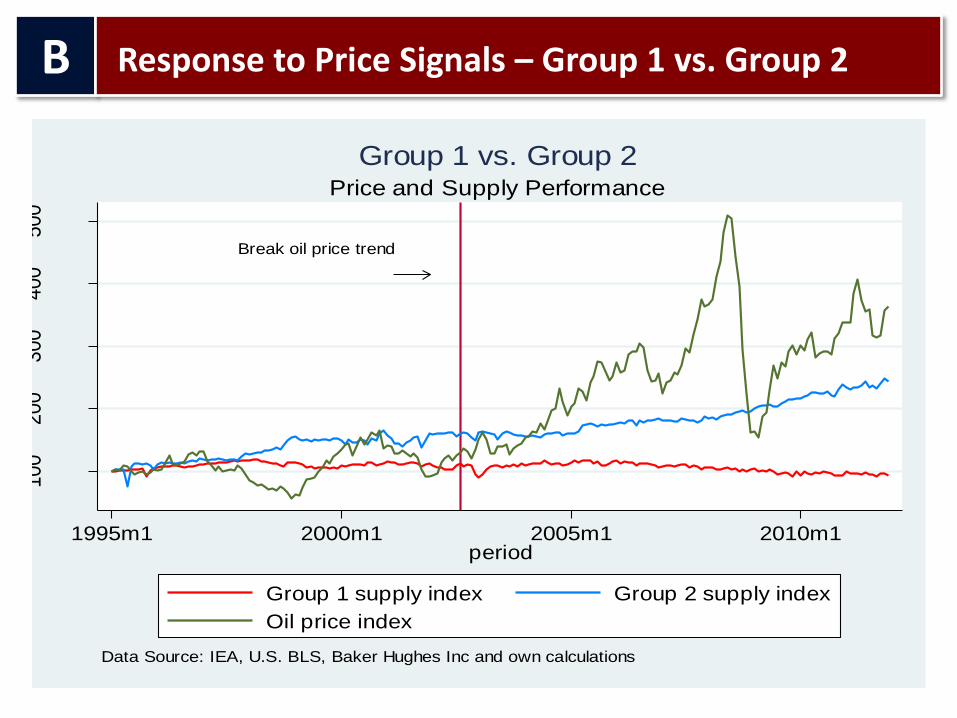
Break oil price trend
100
200
300
400
500
1995m1 2000m1 2005m1 2010m1period
Group 1 supply index Group 2 supply index
Oil price index
Data Source: IEA, U.S. BLS, Baker Hughes Inc and own calculations
Price and Supply Performance
Group 1 vs. Group 2
B
Response to Price Signals – Group 1 vs. Group 2

Over the last 15 years, oil prices increased almost fourfold – in real terms – from $26 / barrel to $96 / barrel
LAC oil producers reacted differently:
Group 1 Group 2
Drilling activity has remained stagnant and oil supply has
fallen
Drilling activity has increased 2.8 x Oil output has
increased 150%
B
Response to Price Signals
Therefore, the situation is: Same price signals Different reactions Why?
Institutional Framework
B
Response to Price Signals
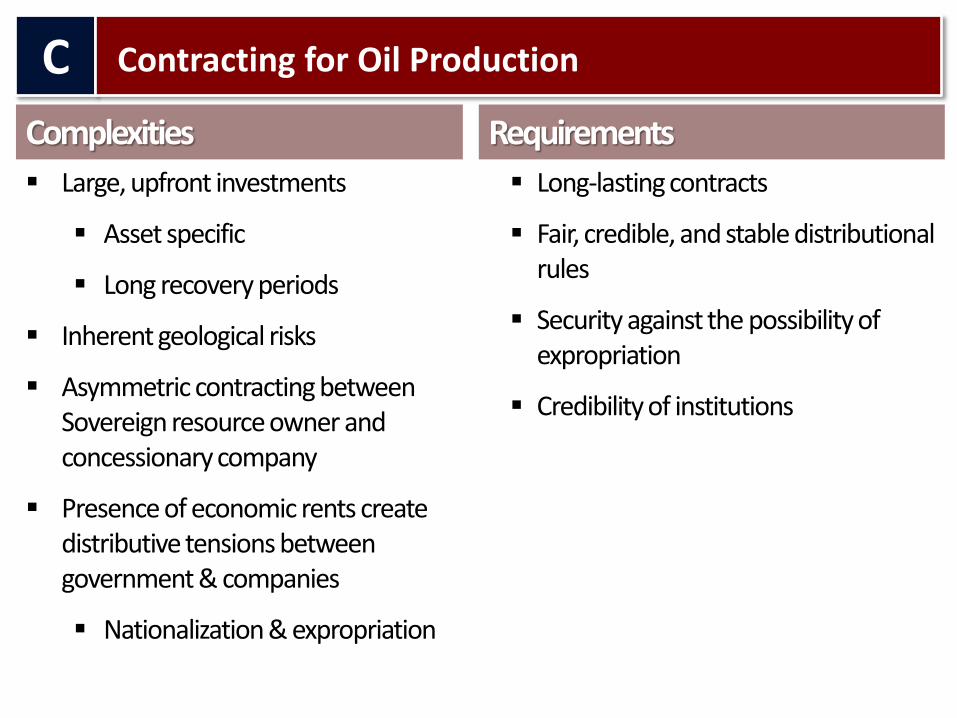
Large, upfront investments
Asset specific
Long recovery periods
Inherent geological risks
Asymmetric contracting between Sovereign resource owner and concessionary company
Presence of economic rents create distributive tensions between government & companies
Nationalization & expropriation
Complexities Requirements
Long-lasting contracts
Fair, credible, and stable distributional rules
Security against the possibility of expropriation
Credibility of institutions
C
Contracting for Oil Production
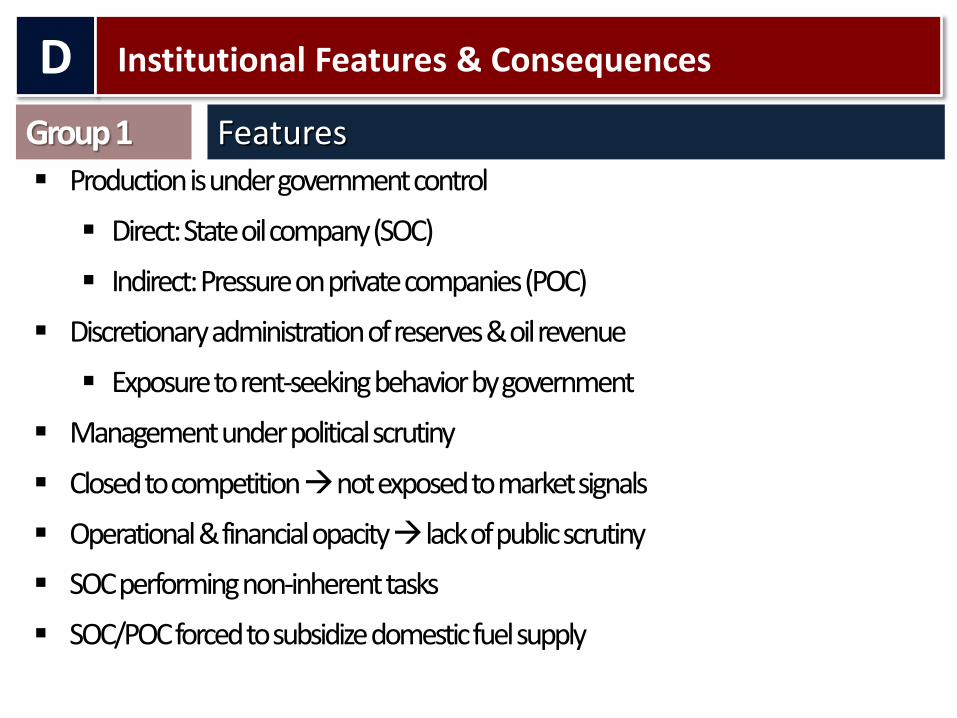
Production is under government control
Direct: State oil company (SOC)
Indirect: Pressure on private companies (POC)
Discretionary administration of reserves & oil revenue
Exposure to rent-seeking behavior by government
Management under political scrutiny
Closed to competition not exposed to market signals
Operational & financial opacity lack of public scrutiny
SOC performing non-inherent tasks
SOC/POC forced to subsidize domestic fuel supply
Group 1 Features
D
Institutional Features & Consequences

Permanent expropriation of revenues
Subsidies, non-oil related activities, and discretionary distribution
Uncertainty regarding revenues & savings
Difficult to undertake large projects
No response to market signals
No behavior as a commercial firm
Lack of competition Leads to inefficiency
Limited access to
Technology, financing , and engineering capacity
Group 1 Consequences
D
Institutional Features & Consequences

6.5
6.6
6.7
6.8
Hodri
ck-P
resc
ott T
rend
1995m1 2000m1 2005m1 2010m1Period
Data Source: IEA and own calculations
Hodrick-Prescott Trend
Argentina Oil Production and Institutional Break
Swearing in Néstor Kischner 05/03
D
Institutional Features – Group 1: Argentina
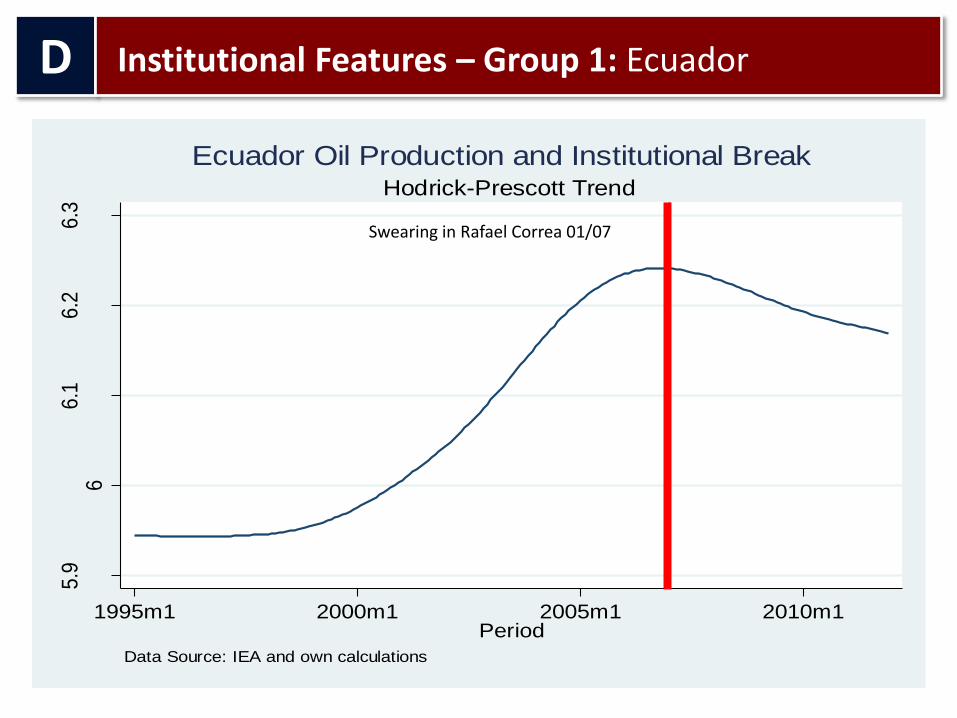
5.9
66.1
6.2
6.3
Hodri
ck-P
resc
ott T
rend
1995m1 2000m1 2005m1 2010m1Period
Data Source: IEA and own calculations
Hodrick-Prescott Trend
Ecuador Oil Production and Institutional Break
Swearing in Rafael Correa 01/07
D
Institutional Features – Group 1: Ecuador
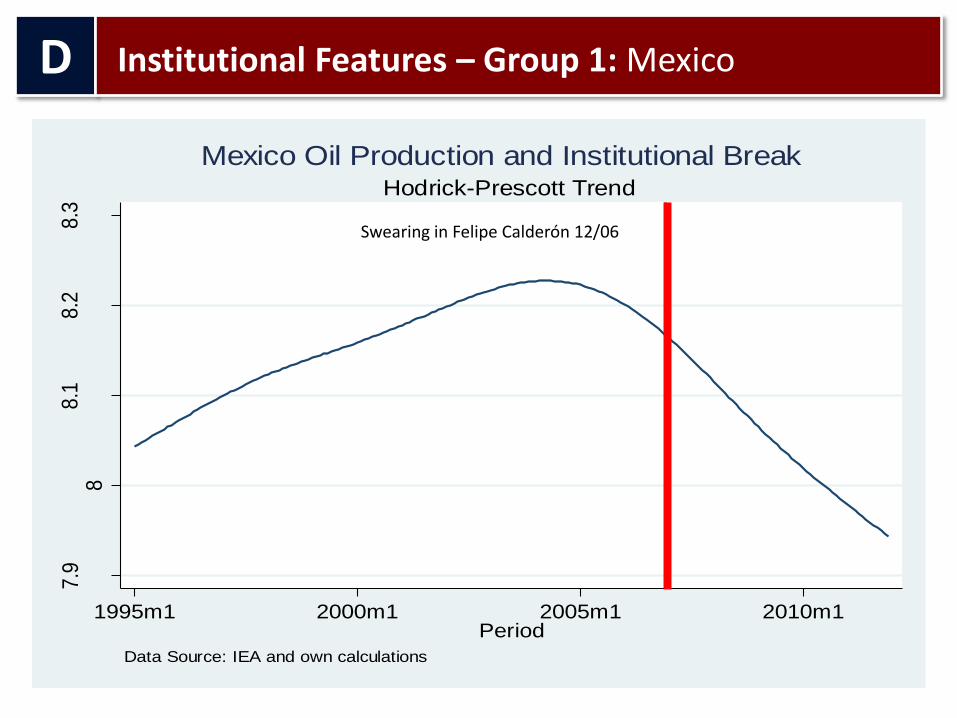
7.9
88.1
8.2
8.3
Hodri
ck-P
resc
ott T
rend
1995m1 2000m1 2005m1 2010m1Period
Data Source: IEA and own calculations
Hodrick-Prescott Trend
Mexico Oil Production and Institutional Break
Swearing in Felipe Calderón 12/06
D
Institutional Features – Group 1: Mexico
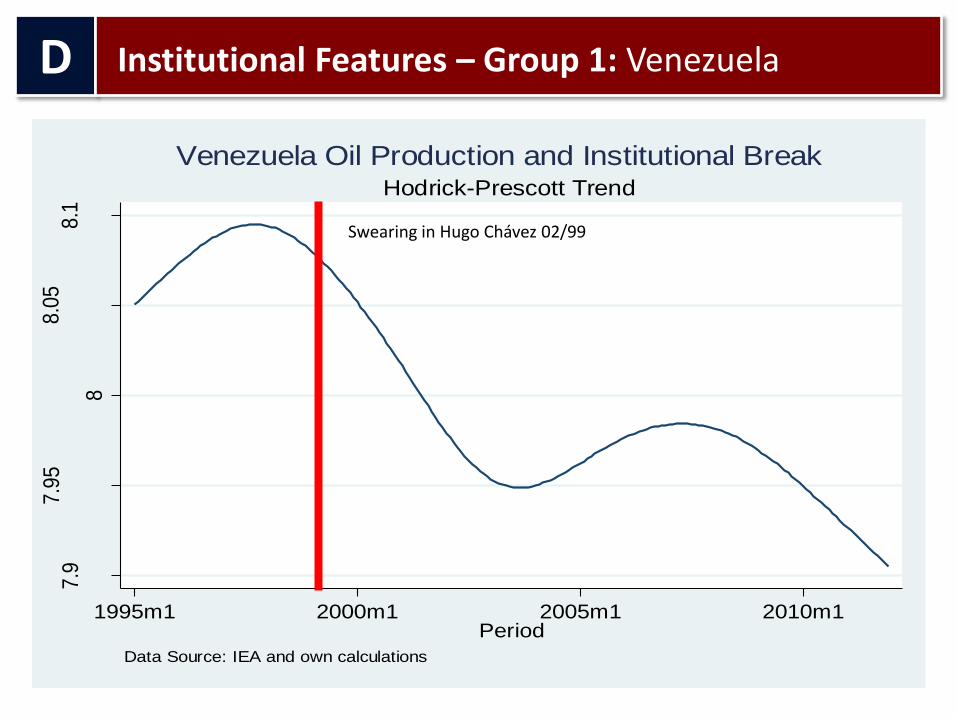
7.9
7.9
5
8
8.0
58.1
Hodri
ck-P
resc
ott T
rend
1995m1 2000m1 2005m1 2010m1Period
Data Source: IEA and own calculations
Hodrick-Prescott Trend
Venezuela Oil Production and Institutional Break
Swearing in Hugo Chávez 02/99
D
Institutional Features – Group 1: Venezuela
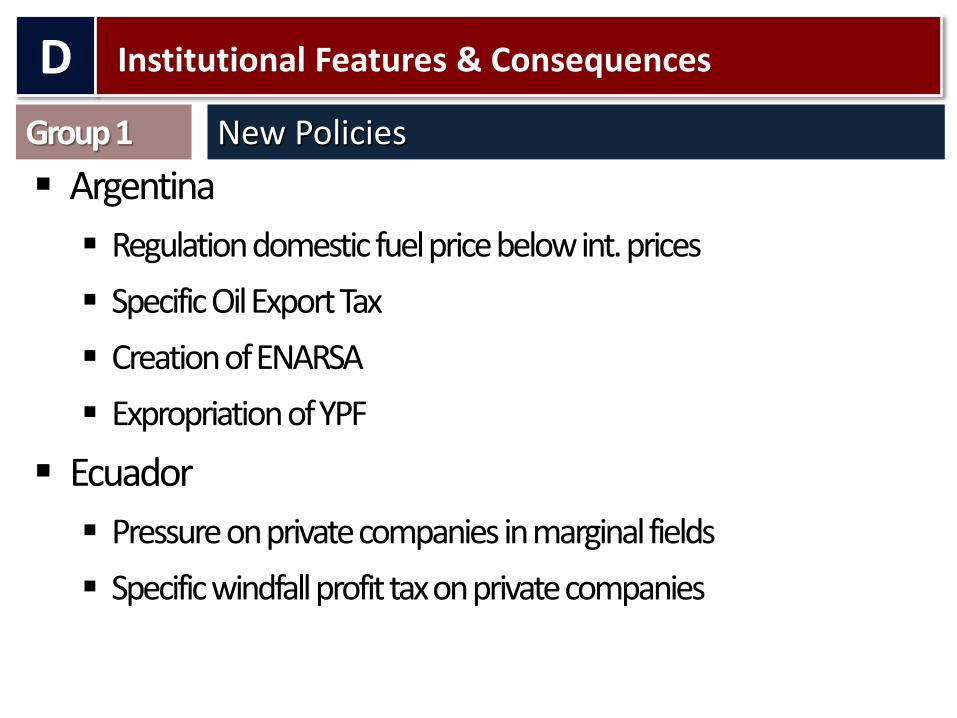
Argentina
Regulation domestic fuel price below int. prices
Specific Oil Export Tax
Creation of ENARSA
Expropriation of YPF
Ecuador
Pressure on private companies in marginal fields
Specific windfall profit tax on private companies
Group 1 New Policies
D
Institutional Features & Consequences

Mexico
Pressure on PEMEX spending in favor of transfers to government
Ceiling on PIDIREGAS debt
Venezuela
Interference on PDVSA professional management
New 2002 Hydrocarbons Law increasing government intervention power
Expropriation of private companies both national and international, core and non-core
Group 1 New Policies
D
Institutional Features & Consequences

Government administers national oil reserves
By a non-operating hydrocarbon agency (NHA)
NHA opens oil bearing lands to competition
National & foreign
Private & state owned
Exposed to market signals
Contractually set rules: distribution & operation
Group 2 Features
D
Institutional Features & Consequences

SOC under same rules as POC
Not subject to discretionary government intervention
SOC focused on industry related activities
Subject to competition & public scrutiny
Subsidy to domestic market
Explicit and assumed by the government
Reserves not in jeopardy
SOC can be partially privatized
Group 2 Features
D
Institutional Features & Consequences
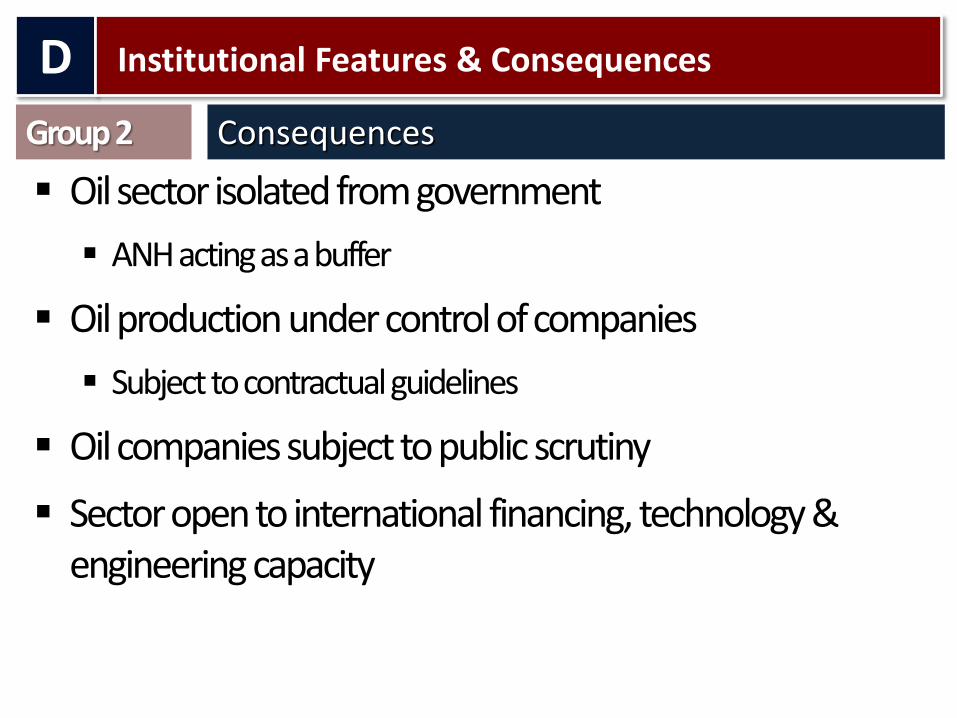
Oil sector isolated from government
ANH acting as a buffer
Oil production under control of companies
Subject to contractual guidelines
Oil companies subject to public scrutiny
Sector open to international financing, technology & engineering capacity
Group 2 Consequences
D
Institutional Features & Consequences
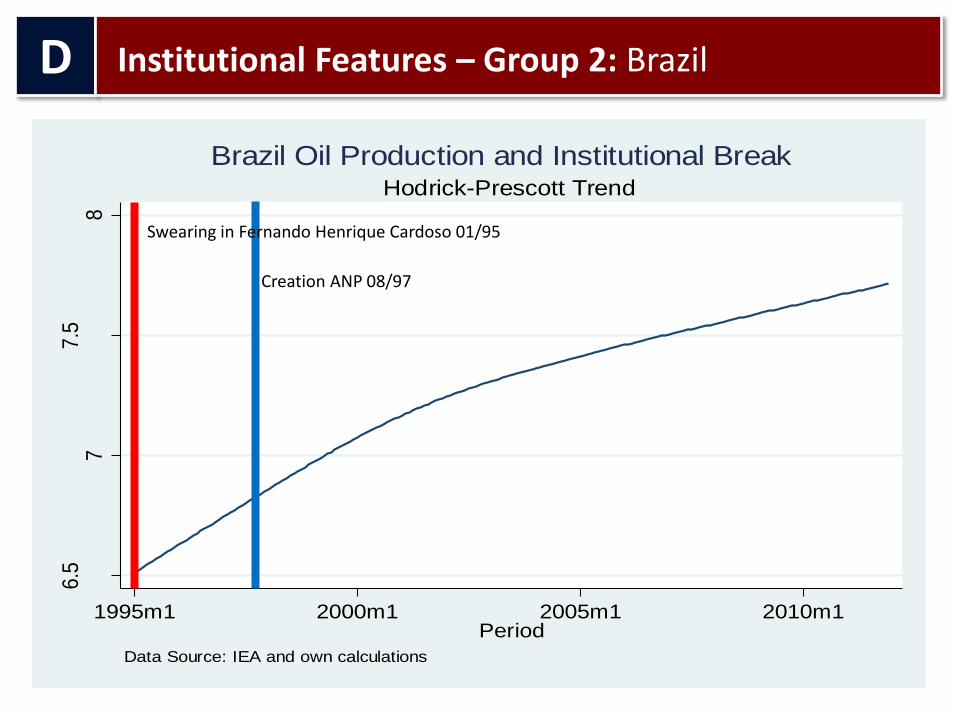
6.5
77.5
8
Hodri
ck-P
resc
ott T
rend
1995m1 2000m1 2005m1 2010m1Period
Data Source: IEA and own calculations
Hodrick-Prescott Trend
Brazil Oil Production and Institutional Break
Swearing in Fernando Henrique Cardoso 01/95
Creation ANP 08/97
D
Institutional Features – Group 2: Brazil
6.3
6.4
6.5
6.6
6.7
6.8
Hodri
ck-P
resc
ott T
rend
1995m1 2000m1 2005m1 2010m1Period
Data Source: IEA and own calculations
Hodrick-Prescott Trend
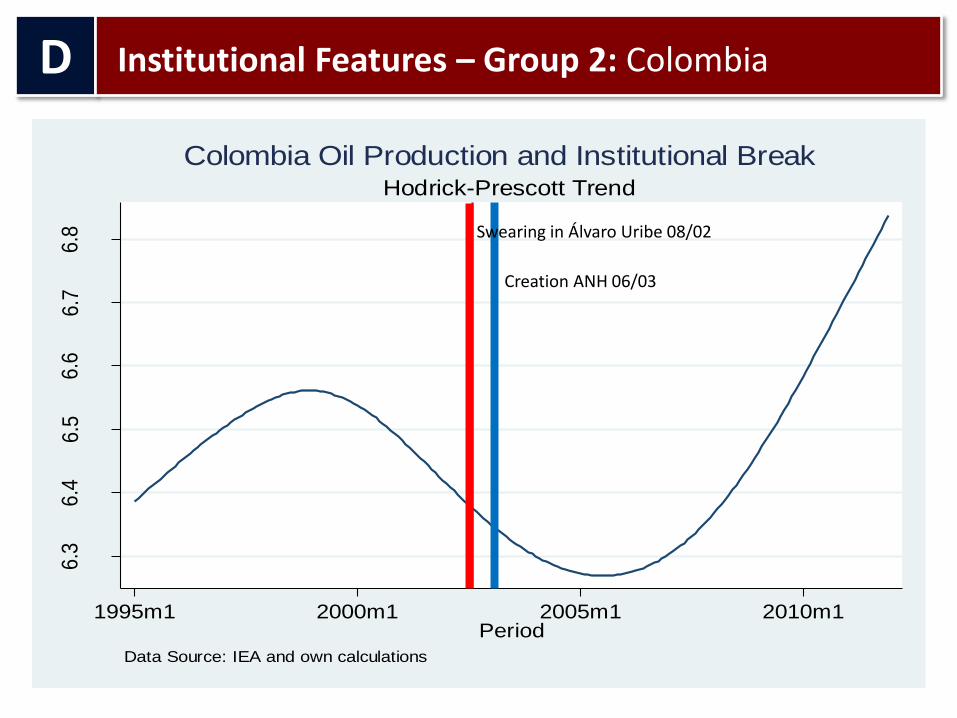
Colombia Oil Production and Institutional Break
Swearing in Álvaro Uribe 08/02
Creation ANH 06/03
D
Institutional Features – Group 2: Colombia
4.6
4.7
4.8
4.9
55.1
Hodri
ck-P
resc
ott T
rend
1995m1 2000m1 2005m1 2010m1Period
Data Source: IEA and own calculations
Hodrick-Prescott Trend
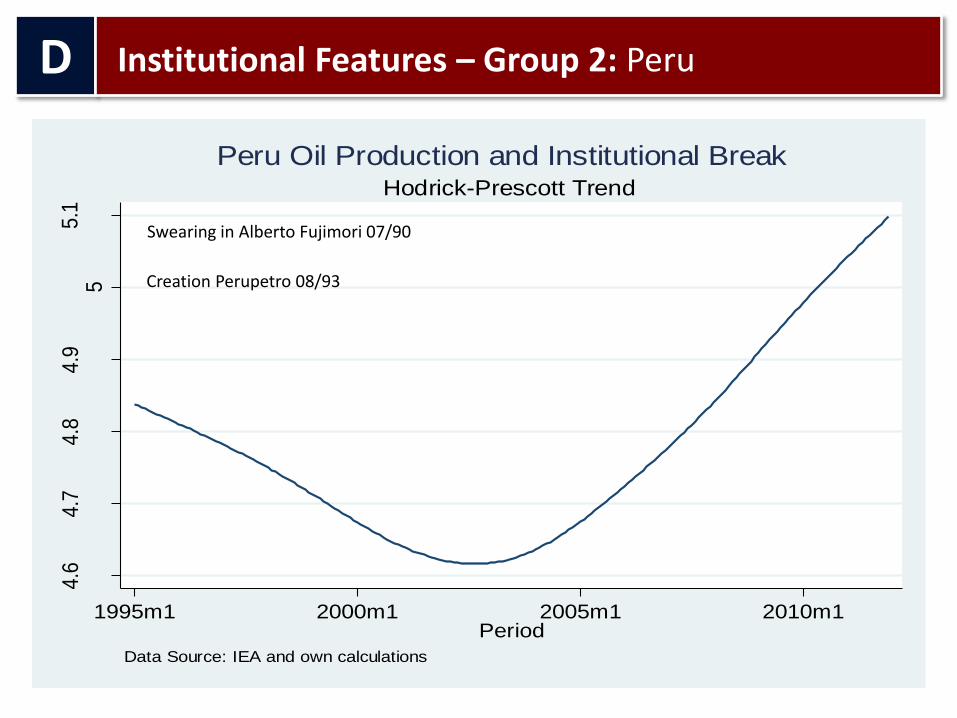
Peru Oil Production and Institutional Break
Swearing in Alberto Fujimori 07/90
Creation Perupetro 08/93
D
Institutional Features – Group 2: Peru
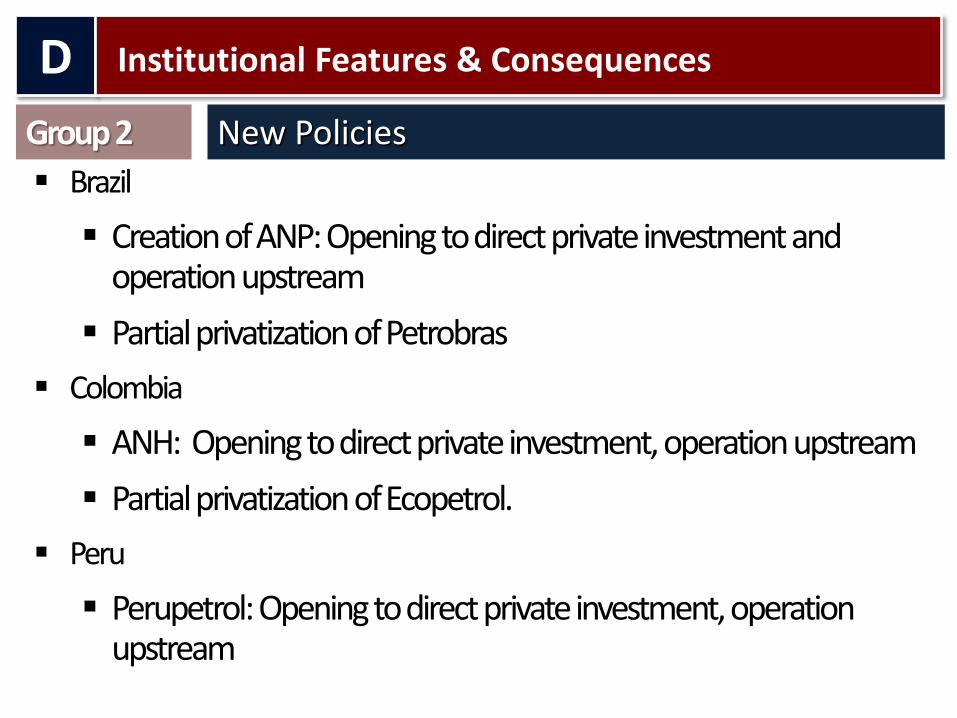
Brazil
Creation of ANP: Opening to direct private investment and operation upstream
Partial privatization of Petrobras
Colombia
ANH: Opening to direct private investment, operation upstream
Partial privatization of Ecopetrol.
Peru
Perupetrol: Opening to direct private investment, operation upstream
Group 2 New Policies
D
Institutional Features & Consequences
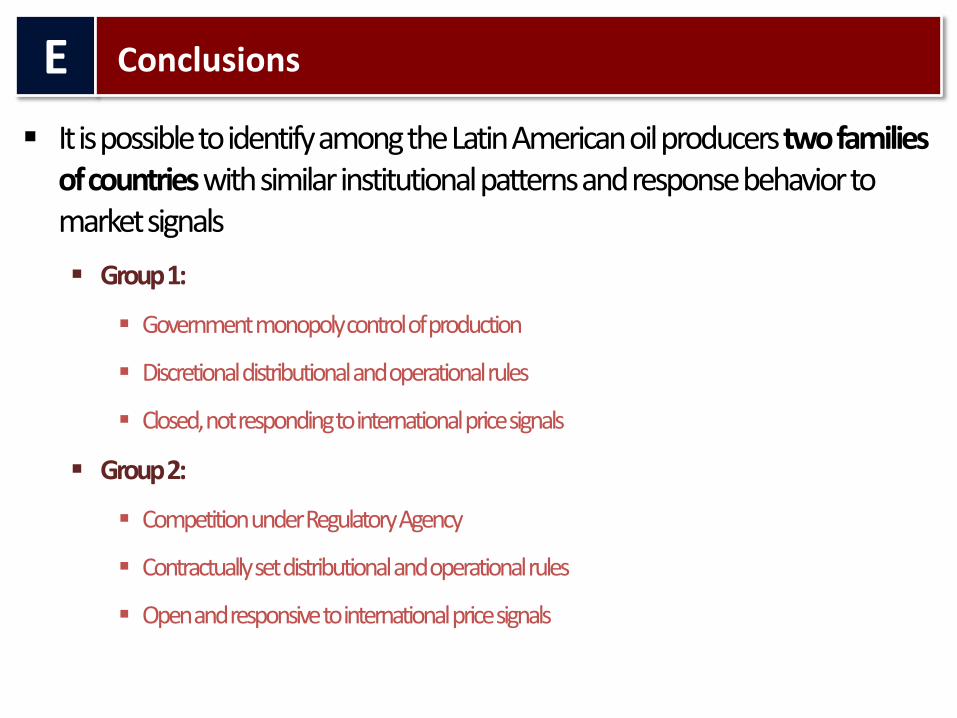
It is possible to identify among the Latin American oil producers two families of countries with similar institutional patterns and response behavior to market signals
Group 1:
Government monopoly control of production
Discretional distributional and operational rules
Closed, not responding to international price signals
Group 2:
Competition under Regulatory Agency
Contractually set distributional and operational rules
Open and responsive to international price signals
E
Conclusions

4
The Peruvian Case
The Oil Market in Peru
Drilling Activity
A
B
C
Natural Gas Growth
Closing Considerations D
A
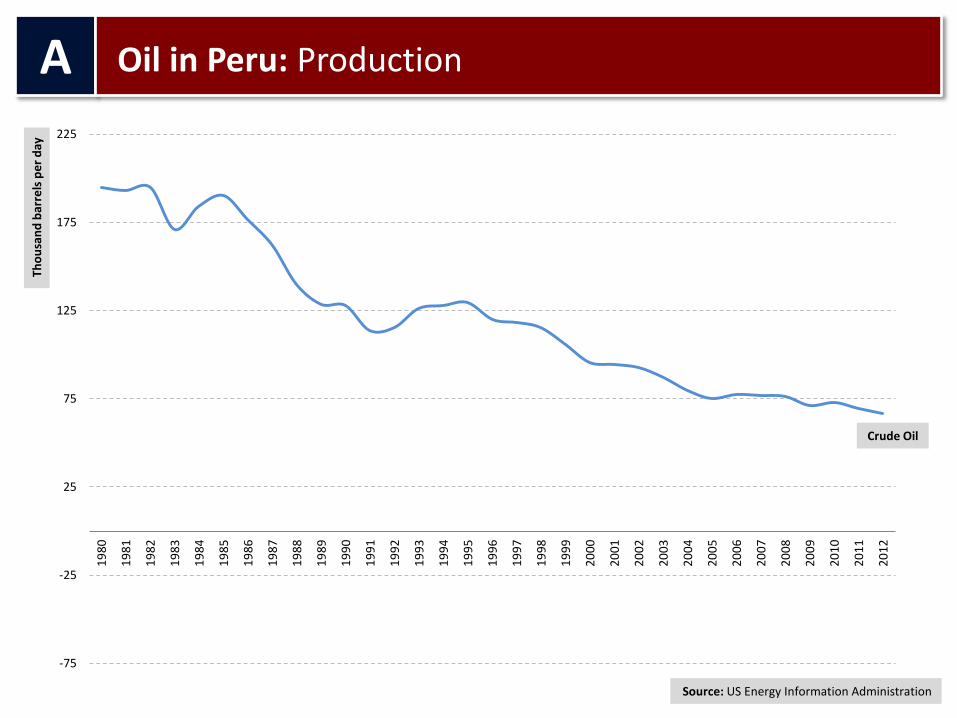
Oil in Peru: Production
Source: US Energy Information Administration
Tho
usa
nd
bar
rels
pe
r d
ay
Crude Oil
-75
-25
25
75
125
175
225
19
80
19
81
19
82
19
83
19
84
19
85
19
86
19
87
19
88
19
89
19
90
19
91
19
92
19
93
19
94
19
95
19
96
19
97
19
98
19
99
20
00
20
01
20
02
20
03
20
04
20
05
20
06
20
07
20
08
20
09
20
10
20
11
20
12

A
Oil in Peru: Production
Source: US Energy Information Administration
Tho
usa
nd
bar
rels
pe
r d
ay
Non-Crude Oil
-75
-25
25
75
125
175
225
19
80
19
81
19
82
19
83
19
84
19
85
19
86
19
87
19
88
19
89
19
90
19
91
19
92
19
93
19
94
19
95
19
96
19
97
19
98
19
99
20
00
20
01
20
02
20
03
20
04
20
05
20
06
20
07
20
08
20
09
20
10
20
11
20
12

A
Oil in Peru: Production
Source: US Energy Information Administration
Tho
usa
nd
bar
rels
pe
r d
ay
Total Oil
-75
-25
25
75
125
175
225
19
80
19
81
19
82
19
83
19
84
19
85
19
86
19
87
19
88
19
89
19
90
19
91
19
92
19
93
19
94
19
95
19
96
19
97
19
98
19
99
20
00
20
01
20
02
20
03
20
04
20
05
20
06
20
07
20
08
20
09
20
10
20
11
20
12
A
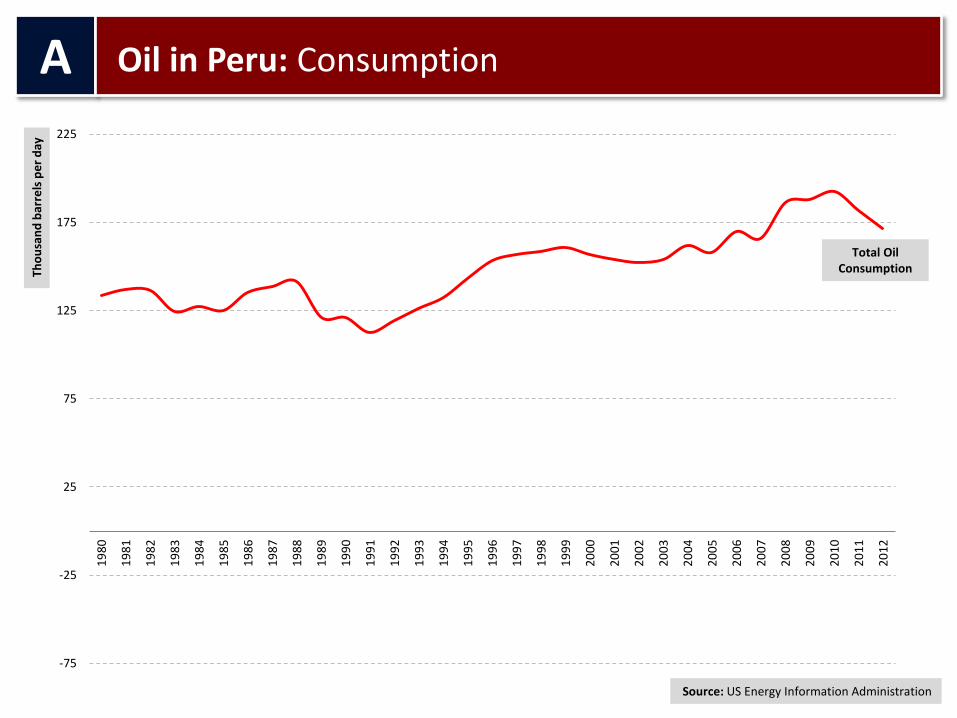
Oil in Peru: Consumption
Source: US Energy Information Administration
Tho
usa
nd
bar
rels
pe
r d
ay
Total Oil Consumption
-75
-25
25
75
125
175
225
19
80
19
81
19
82
19
83
19
84
19
85
19
86
19
87
19
88
19
89
19
90
19
91
19
92
19
93
19
94
19
95
19
96
19
97
19
98
19
99
20
00
20
01
20
02
20
03
20
04
20
05
20
06
20
07
20
08
20
09
20
10
20
11
20
12

A
Oil in Peru: Balance
Source: US Energy Information Administration
Tho
usa
nd
bar
rels
pe
r d
ay
Oil Balance
-75
-25
25
75
125
175
225
19
80
19
81
19
82
19
83
19
84
19
85
19
86
19
87
19
88
19
89
19
90
19
91
19
92
19
93
19
94
19
95
19
96
19
97
19
98
19
99
20
00
20
01
20
02
20
03
20
04
20
05
20
06
20
07
20
08
20
09
20
10
20
11
20
12

B
Natural Gas Growth
Source: US Energy Information Administration
Bill
ion
Cu
bic
Fe
et
0
25
50
75
100
125
150
175
200
225
250
275
300
325
350
375
400
425
19
80
19
81
19
82
19
83
19
84
19
85
19
86
19
87
19
88
19
89
19
90
19
91
19
92
19
93
19
94
19
95
19
96
19
97
19
98
19
99
20
00
20
01
20
02
20
03
20
04
20
05
20
06
20
07
20
08
20
09
20
10
20
11
20
12
Production
Note: 2012 production figure is from Peru’s Ministry of Energy & Mines
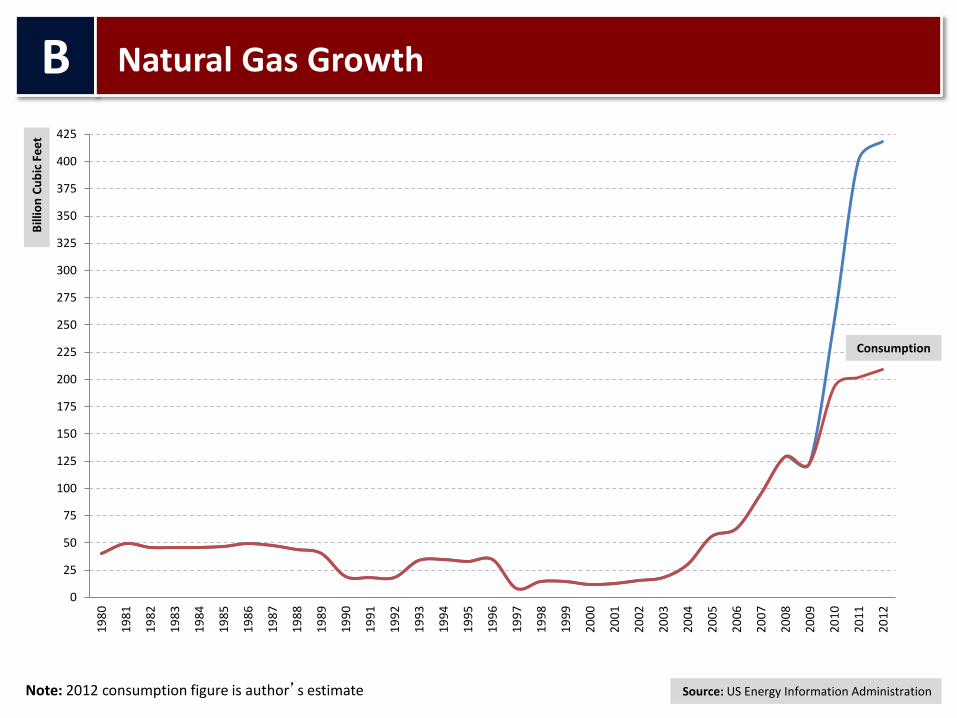
B
Natural Gas Growth B
illio
n C
ub
ic F
ee
t
0
25
50
75
100
125
150
175
200
225
250
275
300
325
350
375
400
425
19
80
19
81
19
82
19
83
19
84
19
85
19
86
19
87
19
88
19
89
19
90
19
91
19
92
19
93
19
94
19
95
19
96
19
97
19
98
19
99
20
00
20
01
20
02
20
03
20
04
20
05
20
06
20
07
20
08
20
09
20
10
20
11
20
12
Consumption
Note: 2012 consumption figure is author’s estimate Source: US Energy Information Administration

B
Natural Gas Growth B
illio
n C
ub
ic F
ee
t
Exportable Surplus
Note: 2012 consumption figure is author’s estimate Source: US Energy Information Administration
0
25
50
75
100
125
150
175
200
225
250
275
300
325
350
375
400
425
19
80
19
81
19
82
19
83
19
84
19
85
19
86
19
87
19
88
19
89
19
90
19
91
19
92
19
93
19
94
19
95
19
96
19
97
19
98
19
99
20
00
20
01
20
02
20
03
20
04
20
05
20
06
20
07
20
08
20
09
20
10
20
11
20
12

C
Drilling Activity since 2000
0
2
4
6
8
10
12
Jan
-00
May
-00
Sep
-00
Jan
-01
May
-01
Sep
-01
Jan
-02
May
-02
Sep
-02
Jan
-03
May
-03
Sep
-03
Jan
-04
May
-04
Sep
-04
Jan
-05
May
-05
Sep
-05
Jan
-06
May
-06
Sep
-06
Jan
-07
May
-07
Sep
-07
Jan
-08
May
-08
Sep
-08
Jan
-09
May
-09
Sep
-09
Jan
-10
May
-10
Sep
-10
Jan
-11
May
-11
Sep
-11
Jan
-12
May
-12
Sep
-12
Jan
-13
Source: Baker Hughes
Act
ive
Dri
llin
g R
igs
(Lan
d &
Off
sho
re)
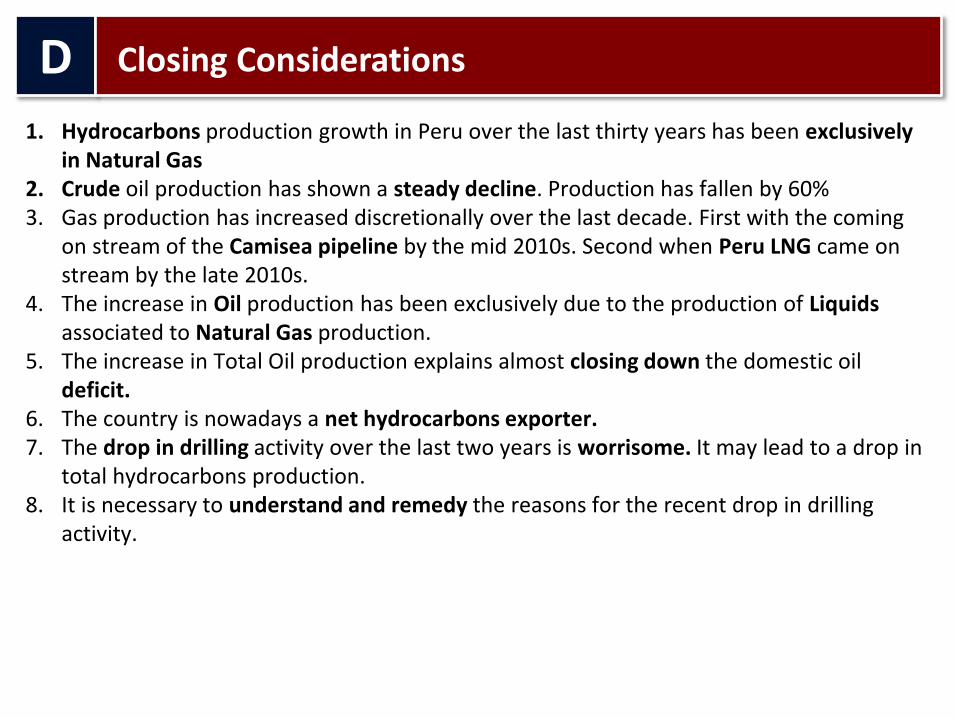
D
Closing Considerations
1. Hydrocarbons production growth in Peru over the last thirty years has been exclusively in Natural Gas
2. Crude oil production has shown a steady decline. Production has fallen by 60% 3. Gas production has increased discretionally over the last decade. First with the coming
on stream of the Camisea pipeline by the mid 2010s. Second when Peru LNG came on stream by the late 2010s.
4. The increase in Oil production has been exclusively due to the production of Liquids associated to Natural Gas production.
5. The increase in Total Oil production explains almost closing down the domestic oil deficit.
6. The country is nowadays a net hydrocarbons exporter. 7. The drop in drilling activity over the last two years is worrisome. It may lead to a drop in
total hydrocarbons production. 8. It is necessary to understand and remedy the reasons for the recent drop in drilling
activity.


![Rad-Tolerant design of all-digital DLL Tuvia Liran [tuvia@ramon-chips.com ] Ran Ginosar [ran@ramon-chips.com ] Dov Alon [dov@ramon-chips.com ] Ramon-Chips](https://img.pdfslide.us/doc/110x75/56649f2e5503460f94c47f47/rad-tolerant-design-of-all-digital-dll-tuvia-liran-tuviaramon-chipscom-.jpg)