Embed Size (px)
DESCRIPTION
Executive Summary: Mobile is reaching critical mass. According to Forrester Research, Inc., mobile commerce will top $6 billion by the end of this year (2011) and is expected to reach $31 billion by 2016. The ubiquity of mobile phones, improved infrastructure, advances in device utility, overall market penetration and the hype around the iPhone and applications are driving phenomenal growth. eBay recorded close to $2 billion in sales on mobile devices in 2010 — expects close to $4 billion in 2011. Google mobile ads are now over a $1 billion business worldwide. Amtrak attributes 2% of its revenue to mobile — $32 million — and notes growth is staggering. Marriott Hotels averaged mobile sales of $6 million per month in 2010 – up 100% from 2009. ASOS’s (U.K.) mobile revenues topped £1m in the U.K. during December — double the retailer’s expectations. 1-800-Flowers.com tops $1 million in quarterly m-commerce sales — up 9,900% from same quarter in 2010. Worldwide, mobile commerce should hit $119 billion in 2015, according to ABI Research. Despite the upbeat forecasts, a large number of businesses are in the planning or early deployment phases of their mobile strategies, but consumers want to connect on mobile devices today.
Citation preview
What Users Want from Mobile A study of consumers’ mobile web and application expectations and experiences conducted by Equation Research on behalf of Compuware
What Users Want from Mobile - July 2011 Page 2
ExEcutivE Summary:
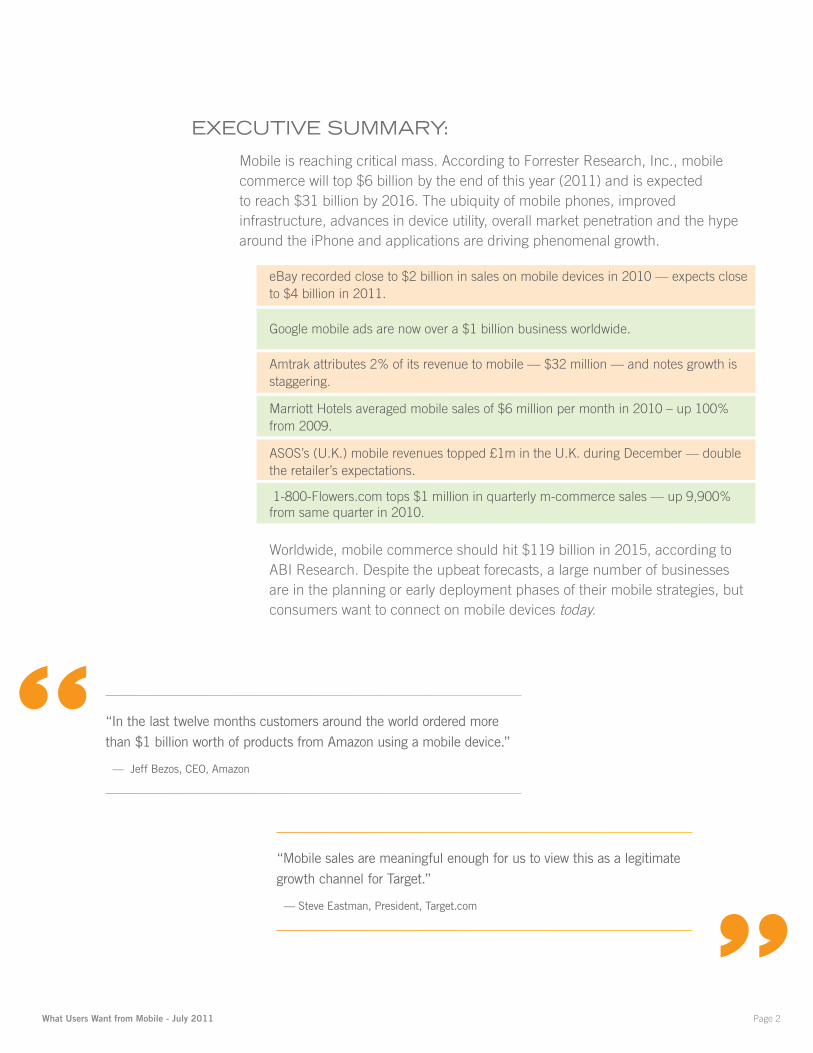
Mobile is reaching critical mass. According to Forrester Research, Inc., mobile commerce will top $6 billion by the end of this year (2011) and is expected to reach $31 billion by 2016. The ubiquity of mobile phones, improved infrastructure, advances in device utility, overall market penetration and the hype around the iPhone and applications are driving phenomenal growth.
eBay recorded close to $2 billion in sales on mobile devices in 2010 — expects close to $4 billion in 2011.
Google mobile ads are now over a $1 billion business worldwide.
Amtrak attributes 2% of its revenue to mobile — $32 million — and notes growth is staggering.
Marriott Hotels averaged mobile sales of $6 million per month in 2010 – up 100% from 2009.
ASOS’s (U.K.) mobile revenues topped £1m in the U.K. during December — double the retailer’s expectations.
1-800-Flowers.com tops $1 million in quarterly m-commerce sales — up 9,900% from same quarter in 2010.
Worldwide, mobile commerce should hit $119 billion in 2015, according to ABI Research. Despite the upbeat forecasts, a large number of businesses are in the planning or early deployment phases of their mobile strategies, but consumers want to connect on mobile devices today.
“In the last twelve months customers around the world ordered more than $1 billion worth of products from Amazon using a mobile device.”
— Jeff Bezos, CEO, Amazon“ “
“Mobile sales are meaningful enough for us to view this as a legitimate growth channel for Target.”
— Steve Eastman, President, Target.com
What Users Want from Mobile - July 2011 Page 3
it’S a “OnE WEb” WOrld
Users are demanding superior web experiences and highly satisfying, convenient, on-the-go mobile site speeds regardless of their mode of access. Most mobile users expect to make sacrifices in terms of content depth and feature-richness in exchange for the convenience of anytime, anyplace mobile Web access. One thing mobile users won’t sacrifice, however, is speed.
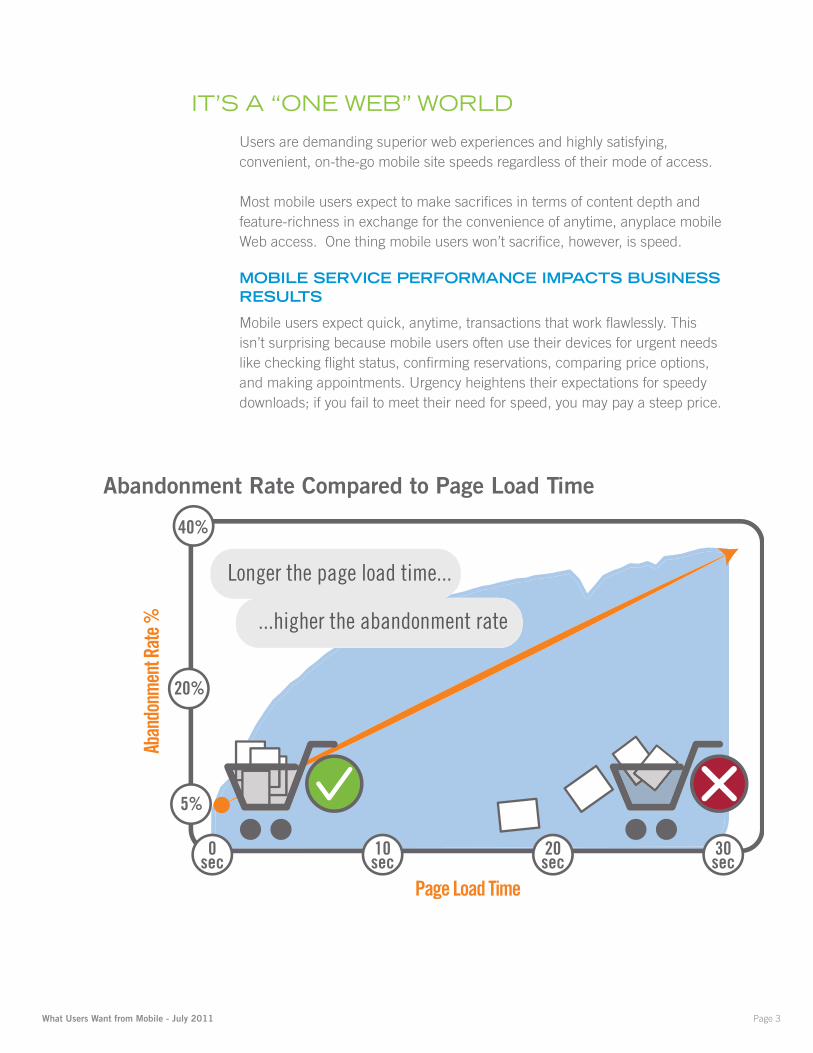
Mobile Service PerforMance iMPactS buSineSS reSultS
Mobile users expect quick, anytime, transactions that work flawlessly. This isn’t surprising because mobile users often use their devices for urgent needs like checking flight status, confirming reservations, comparing price options, and making appointments. Urgency heightens their expectations for speedy downloads; if you fail to meet their need for speed, you may pay a steep price.
What Users Want from Mobile - July 2011 Page 4
Mobile Web anD aPP eXPerienceS are DiSaPPointinG uSerS
In 2009, Compuware commissioned Equation Research to conduct a study of mobile users’ expectations and how they characterized their mobile web experiences. The key takeaway in 2009: the mobile web was disappointing users who had high expectations for mobile web performance and little patience for poor performing sites.
Two years later, we commissioned Equation Research to conduct a follow-on study to find out if users’ mobile web experiences improved. We expanded the study to include global mobile users, and mobile users’ expectations and experiences for mobile applications.
Key finDinGS:
• Mobile users’ expectations for mobile website speed continue to increase. 71% of global mobile web users expect websites to load as quickly, almost as quickly or faster on their mobile phone compared to the computer they use at home – up from 58% in 2009. However, almost half (46%) said websites load more slowly on their phone.
• Nearly 60% of web users say they expect a website to load on their mobile phone in 3 seconds or less and 74% are willing to wait 5 seconds or less for a single web page to load before leaving the site. 50% are only willing to wait 5 seconds or less for an application to load before exiting.
• 57% of global mobile web users had a problem accessing a website in the past year and 47% had a problem accessing an app on their phone. More than 80% of mobile web users would access websites more often from their phone if the experience was as fast and reliable.
• Mobile users do not have much patience for retrying a website or application that is not functioning initially — a third will go to a competitor’s site instead. The majority of mobile web users are only willing to retry a website (78%) or application (80%) two times or less if it does not work initially.
• A bad experience on a mobile website leaves mobile web users much less likely to return to, or recommend, a particular website. Nearly half of mobile web users are unlikely to return to a website that they had trouble accessing from their phone and 57% are unlikely to recommend the site.
What Users Want from Mobile - July 2011 Page 5
Study FindingS: mObilE WEb uSErS’ ExpEctatiOnS and ExpEriEncES
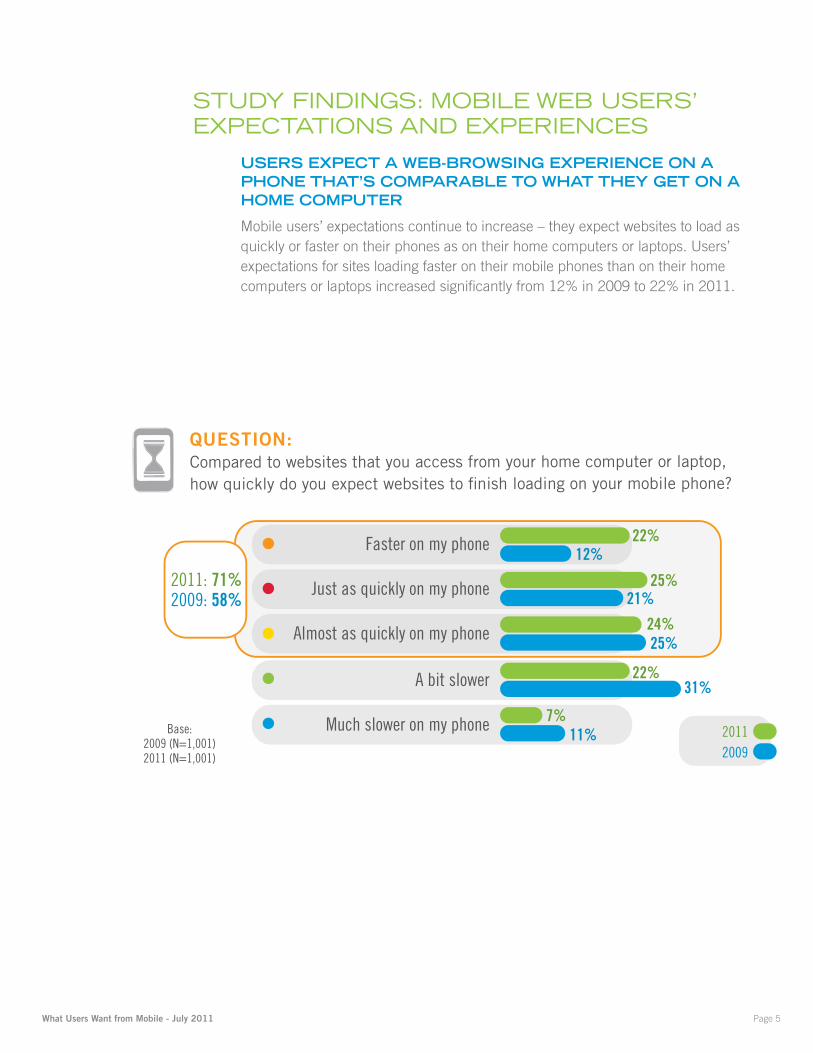
uSerS eXPect a Web-broWSinG eXPerience on a Phone that’S coMParable to What they Get on a hoMe coMPuter
Mobile users’ expectations continue to increase – they expect websites to load as quickly or faster on their phones as on their home computers or laptops. Users’ expectations for sites loading faster on their mobile phones than on their home computers or laptops increased significantly from 12% in 2009 to 22% in 2011.
Much slower on my phone
Just as quickly on my phone
Almost as quickly on my phone
Faster on my phone
A bit slower
QUESTION:Compared to websites that you access from your home computer or laptop, how quickly do you expect websites to finish loading on your mobile phone?
20092011
12%
11%
31%
22%
25%
24%
22%
7%
21%
25%
Base:2009 (N=1,001)2011 (N=1,001)
2011: 71%2009: 58%
What Users Want from Mobile - July 2011 Page 6
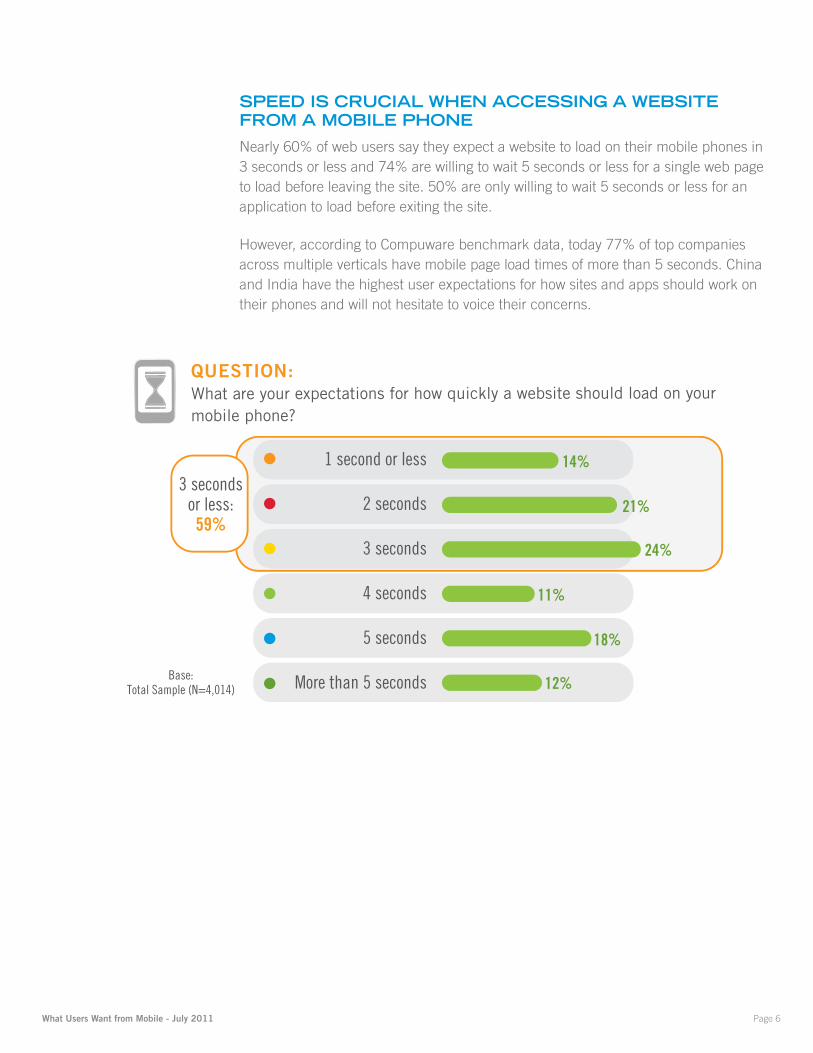
SPeeD iS crucial When acceSSinG a WebSite froM a Mobile Phone
Nearly 60% of web users say they expect a website to load on their mobile phones in 3 seconds or less and 74% are willing to wait 5 seconds or less for a single web page to load before leaving the site. 50% are only willing to wait 5 seconds or less for an application to load before exiting the site.
However, according to Compuware benchmark data, today 77% of top companies across multiple verticals have mobile page load times of more than 5 seconds. China and India have the highest user expectations for how sites and apps should work on their phones and will not hesitate to voice their concerns.
QUESTION:What are your expectations for how quickly a website should load on your mobile phone?
2 seconds
3 seconds
4 seconds
5 seconds
More than 5 seconds
1 second or less
Base:Total Sample (N=4,014)
14%
21%
24%
11%
18%
12%
3 secondsor less:59%
What Users Want from Mobile - July 2011 Page 7
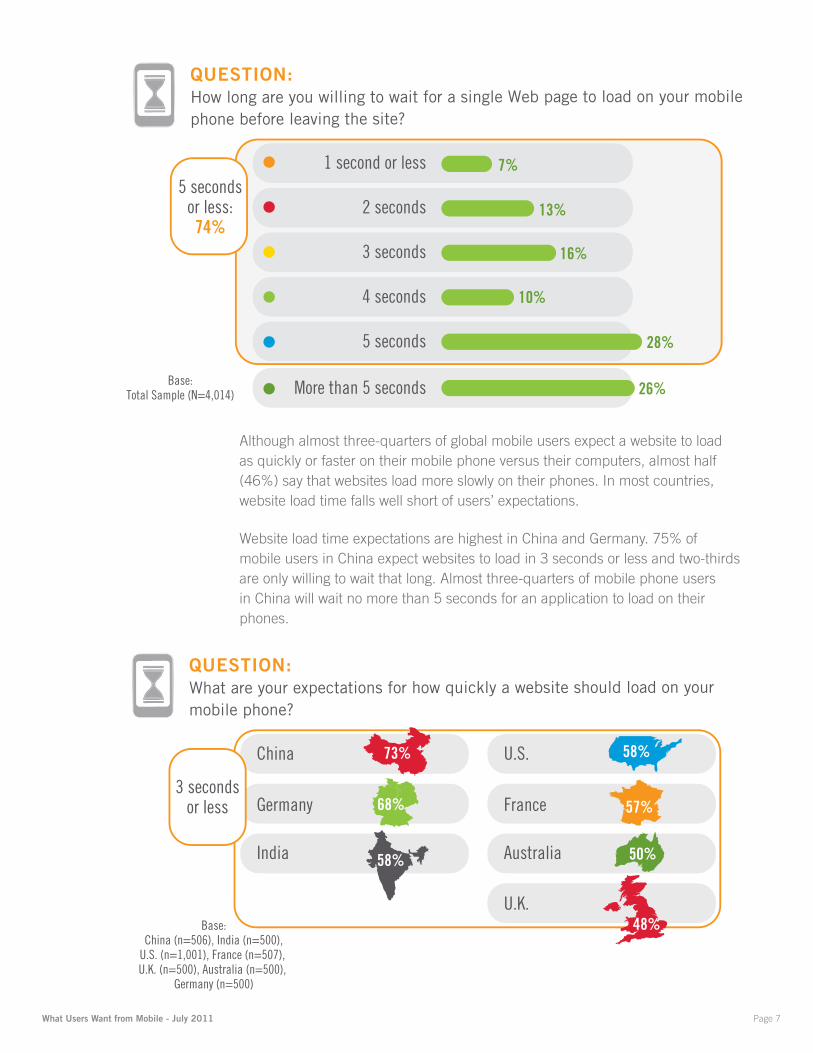
Although almost three-quarters of global mobile users expect a website to load as quickly or faster on their mobile phone versus their computers, almost half (46%) say that websites load more slowly on their phones. In most countries, website load time falls well short of users’ expectations.
Website load time expectations are highest in China and Germany. 75% of mobile users in China expect websites to load in 3 seconds or less and two-thirds are only willing to wait that long. Almost three-quarters of mobile phone users in China will wait no more than 5 seconds for an application to load on their phones.
2 seconds
3 seconds
4 seconds
5 seconds
More than 5 seconds
1 second or less
10%
QUESTION:How long are you willing to wait for a single Web page to load on your mobile phone before leaving the site?
Base:Total Sample (N=4,014)
7%
13%
16%
28%
26%
5 secondsor less:74%
Base:China (n=506), India (n=500),
U.S. (n=1,001), France (n=507), U.K. (n=500), Australia (n=500),
Germany (n=500)
QUESTION:What are your expectations for how quickly a website should load on your mobile phone?
73%
68%
58%
58%
57%
50%
China
Germany
India
U.S.
France
Australia
48%U.K.
3 secondsor less
What Users Want from Mobile - July 2011 Page 8
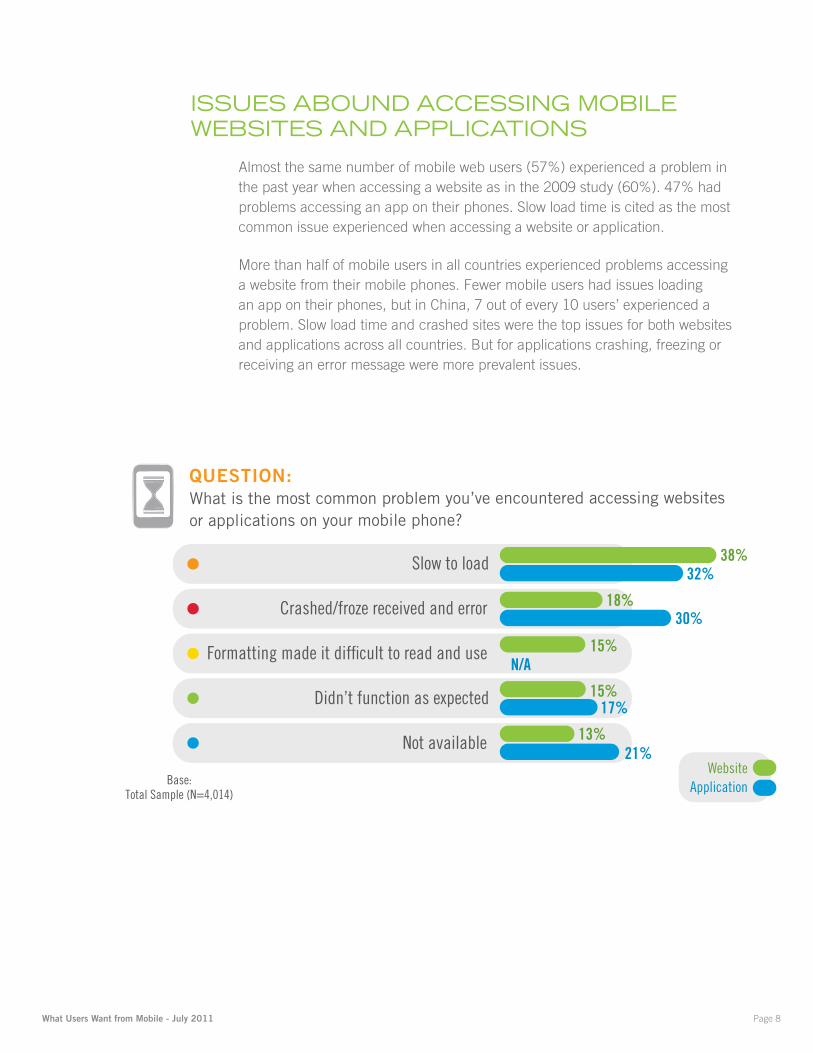
iSSuES abOund accESSing mObilE WEbSitES and applicatiOnS
Almost the same number of mobile web users (57%) experienced a problem in the past year when accessing a website as in the 2009 study (60%). 47% had problems accessing an app on their phones. Slow load time is cited as the most common issue experienced when accessing a website or application.
More than half of mobile users in all countries experienced problems accessing a website from their mobile phones. Fewer mobile users had issues loading an app on their phones, but in China, 7 out of every 10 users’ experienced a problem. Slow load time and crashed sites were the top issues for both websites and applications across all countries. But for applications crashing, freezing or receiving an error message were more prevalent issues.
QUESTION:What is the most common problem you’ve encountered accessing websites or applications on your mobile phone?
ApplicationWebsite
Crashed/froze received and error
Formatting made it difficult to read and use
Didn’t function as expected
Not available
Slow to load
Base:Total Sample (N=4,014)
32%
21%
17%
N/A
38%
18%
15%
15%
13%
30%
What Users Want from Mobile - July 2011 Page 9
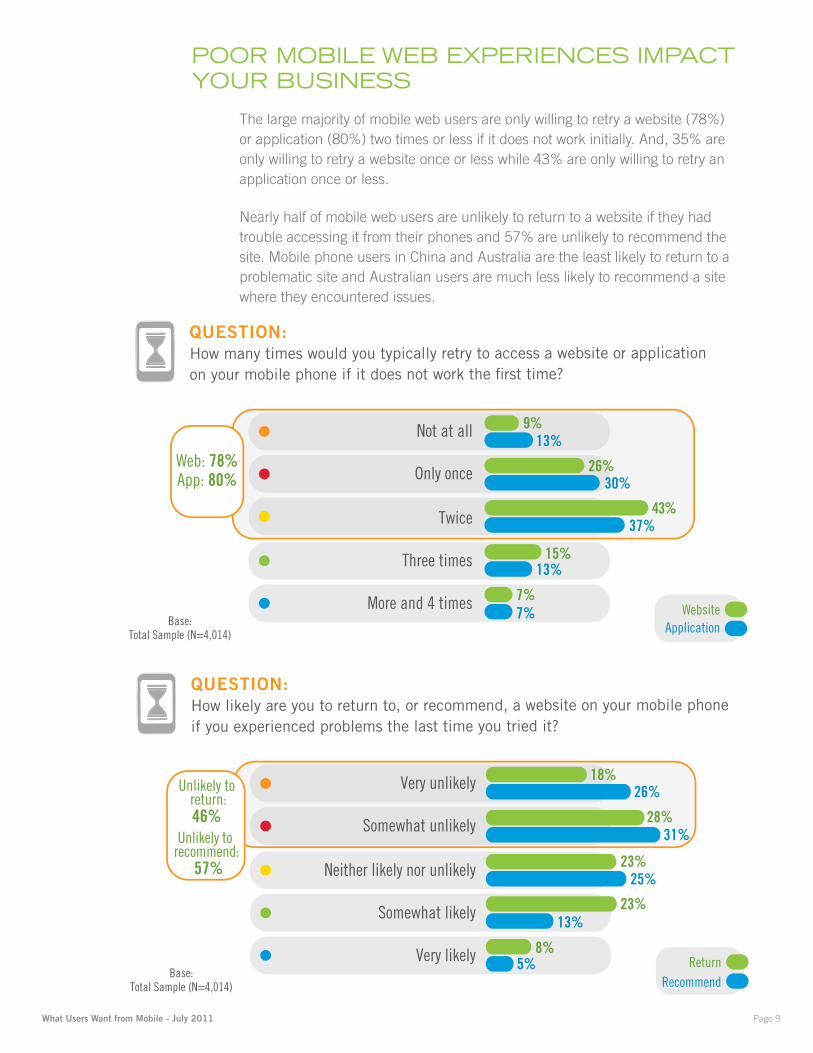
pOOr mObilE WEb ExpEriEncES impact yOur buSinESS
The large majority of mobile web users are only willing to retry a website (78%) or application (80%) two times or less if it does not work initially. And, 35% are only willing to retry a website once or less while 43% are only willing to retry an application once or less.
Nearly half of mobile web users are unlikely to return to a website if they had trouble accessing it from their phones and 57% are unlikely to recommend the site. Mobile phone users in China and Australia are the least likely to return to a problematic site and Australian users are much less likely to recommend a site where they encountered issues.
QUESTION:How many times would you typically retry to access a website or application on your mobile phone if it does not work the first time?
Base:Total Sample (N=4,014)
Only once
Twice
Not at all
ApplicationWebsite
13% 9%
26%30%
37%
Web: 78%App: 80%
43%
Three times 13%15%
More and 4 times7%7%
Base:Total Sample (N=4,014)
QUESTION:How likely are you to return to, or recommend, a website on your mobile phone if you experienced problems the last time you tried it?
Very likely
Very unlikely
Somewhat unlikely
Neither likely nor unlikely
Somewhat likely
5%
13%
25%
31%
18%
28%
23%
23%
8%
26%
Recommend Return
Unlikely to return:46%
Unlikely to recommend:
57%
What Users Want from Mobile - July 2011 Page 10
mEEting ExpEctatiOnS
By every measure, mobile is exploding. Its gaining momentum as a source of revenue and leads, and marketers are paying attention as consumer adoption of mobile continues to grow. However, companies need to understand how their customers are accessing and using mobile in order to capitalize on every single interaction.
Mobile device capabilities have exploded in the last two years, but unfortunately mobile device performance hasn’t kept pace. Delivering fast, reliable mobile experiences is critical for businesses seeking to take advantage of the opportunity provided by increased mobile access. How do you evaluate the quality of the mobile web experiences you deliver? Ask yourself:
• Is your website performing to mobile users’ expectations?
• Are your third parties delivering the performance and availability you expect?
• Do your mobile sites and applications perform as intended across the devices and networks your customers use?
As the novelty of the “anywhere web” wears off, users want mobile websites and apps that perform. Businesses that embrace the mobile opportunity, offer the most usable features, and provide the fastest, most consistent performance will emerge as mobile leaders in their category.
What Users Want from Mobile - July 2011 Page 11
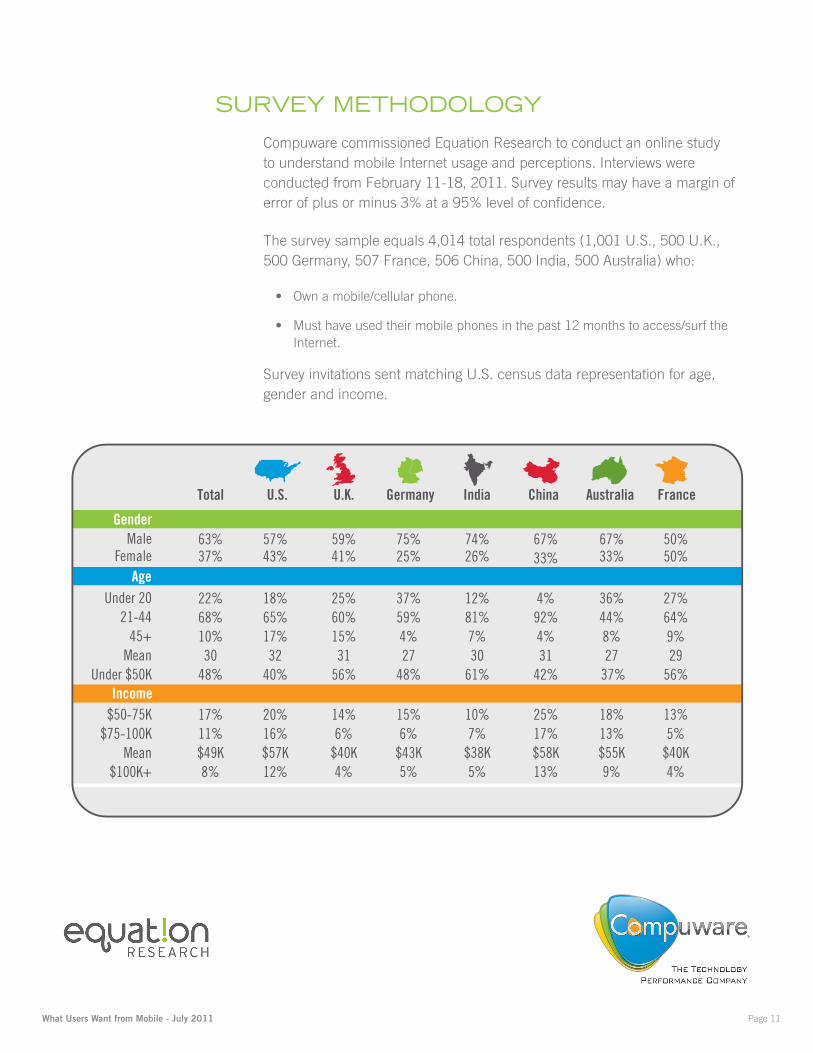
SurvEy mEthOdOlOgy
Compuware commissioned Equation Research to conduct an online study to understand mobile Internet usage and perceptions. Interviews were conducted from February 11-18, 2011. Survey results may have a margin of error of plus or minus 3% at a 95% level of confidence.
The survey sample equals 4,014 total respondents (1,001 U.S., 500 U.K., 500 Germany, 507 France, 506 China, 500 India, 500 Australia) who:
• Own a mobile/cellular phone.
• Must have used their mobile phones in the past 12 months to access/surf the Internet.
Survey invitations sent matching U.S. census data representation for age, gender and income.
Total U.S. U.K. Germany India China Australia France
Gender Male 63% 57% 59% 75% 74% 67% 67% 50%
Female 37% 43% 41% 25% 26% 33% 33% 50% Age
Under 20 22% 18% 25% 37% 12% 4% 36% 27% 21-44 68% 65% 60% 59% 81% 92% 44% 64%
45+ 10% 17% 15% 4% 7% 4% 8% 9% Mean 30 32 31 27 30 31 27 29
IncomeUnder $50K 48% 40% 56% 48% 61% 42% 37% 56%
$50-75K 17% 20% 14% 15% 10% 25% 18% 13% $75-100K 11% 16% 6% 6% 7% 17% 13% 5%
$100K+ 8% 12% 4% 5% 5% 13% 9% 4% Mean $49K $57K $40K $43K $38K $58K $55K $40K