Embed Size (px)
Citation preview

20th ANNIVERSARY OFFER
FREE FOR 1 YEAR( S e e p .9 3 fo r d e t a i l s )
OECD WorldwideOECD Paris Centre
2, rue André-Pascal75775 Paris Cedex 16Tel.: 33 (0) 1 45 24 81 67 Fax: 33 (0) 1 45 24 99 30E-mail: [email protected] ordering: www.oecd.org/bookshop
OECD Berlin Centre
Schumannstrasse 10D-10117 BerlinTel.: 49 30 288 8353Fax: 49 30 288 83545E-mail: [email protected]: www.oecd.org/deutschland
OECD Washington Center
2001 L Street, NW, Suite 650 Washington DC 20036-4922Tel.: 1 202 785 6323Fax: 1 202 785 0350E-mail: [email protected]: www.oecdwash.org
OECD Tokyo Centre
3rd Floor, Nippon Press Center Building2-2-1 Uchisaiwaicho Chiyoda-ku, Tokyo 100-0011Tel.: 81 3 5532 0021 Fax: 81 3 5532 0035E-mail: [email protected]: www.oecdtokyo.org
OECD Mexico Centre
Av. Presidente Mazaryk 526Colonia: Polanco, C.P. 11560 Mexico, D.F.Tel.: 5255 9138 6233 Fax: 5255 5280 0480E-mail: [email protected]: www.oecd.org/centrodemexico
Australia
Austria
Belgium
Canada
Czech Republic
Denmark
Finland
France
Germany
Greece
Hungary
Iceland
Ireland
Italy
Japan
Korea
Luxembourg
Mexico
Netherlands
New Zealand
Norway
Poland
Portugal
Slovak Republic
Spain
Sweden
Switzerland
Turkey
United Kingdom
United States
ISBN 978-92-64-05563-601 2008 06 1 P -:HSTCQE=UZZ[X[:
2008
/Su
pp
leme
nt 1
OE
CD
in Fig
ures 20
08 O
EC
D O
bse
rver
OECD in Figures2008
Demography and health
Economy
Prices and finance
Energy
Labour
Science and technology
Environment
Education
Public finance
International trade and investment
�����������������������

1
OECD in Figures
20th anniversary edition
2008

2
Demography and health 6Demography 6Health spending and resources 8Health status 10
Economy 12Gross domestic product 12Economic growth and performance 14Sectoral contributions to gross value added 16Business statistics 18Services: value added 20Transport 22
Energy 24Energy: supply 24Energy: production 26Energy consumption and electricity generation 28
Labour 30Employment 30Part-time and self-employment 32Unemployment 34Services: employment 36
Science and technology 38Research and development (I) 38Research and development (II) 40Patents and trade in technology 42
Environment 44Resources 44Emissions and pollution 46CO2 emissions 48
Education 50Expenditure 50Performance 52
Public finance 54Agriculture: support estimates 54Government sector 56Taxation 58Development aid 60
International trade and investment 62Direct investment 62Trade 64Trade in services 66
OECD in Figures 2008
Contents

3
Prices and finance 68
Prices and interest rates 68Insurance and pensions 70Financial balance sheets and institutional investment 72Domestic and foreign finance 74
World map 76
OECD in graphs 77GDP growth 78GDP per capita 79Upwardly mobile 80Inflation 81Population growth 82Migration 83Public debt 84Female employment rates 85Health spending 86Road fatalities 87Aid for the environment 88Climate change 89Trading partners 90
General notes 91Glossary 92
Published in English and French
OECD Publications2, rue André-Pascal
75775 Paris Cedex 16, France
[email protected] www.oecd.org
Tel: +33 (0) 1 45 24 82 00
Fax: +33 (0) 1 45 24 99 30
Price: US$ 30 €20 £15 ¥3,200
Free with annual Observer subscription:
US$ 90 €69 £47 ¥9,700
ISSN 0029-7054; [email protected]
Available at www.oecdbookshop.org
© OECD 2008
The online edition is available at www.oecd.org/infigures

4
Also available in French under the title:L'OCDE en chiffres 2008
The OECD is a unique forum where the governments of 30 democracies work together to address the economic, social and environmental challenges of globalisation. The OECD is also at the forefront of efforts to understand and to help governments respond to new developments and concerns, such as corporate governance, the information economy and the challenges of an ageing population. The Organisation provides a setting where governments can compare policy experiences, seek answers to common problems, identify good practice and work to co-ordinate domestic and international policies.
The OECD member countries are: Australia (1971), Austria (1961), Belgium (1961), Canada (1961), Czech Republic (1995), Denmark (1961), Finland (1969), France (1961), Germany (1961), Greece (1961), Hungary (1996), Iceland (1961), Ireland (1961), Italy (1962), Japan (1964), Korea (1996), Luxembourg (1961), Mexico (1994), Netherlands (1961), New Zealand (1973), Norway (1961), Poland (1996), Portugal (1961), Slovak Republic (2000), Spain (1961), Sweden (1961), Switzerland (1961), Turkey (1961), United Kingdom (1961), United States (1961). The Commission of the European Communities takes part in the work of the OECD.
This work is published on the responsibility of the Secretary-General of the OECD. The opinions expressed and arguments employed herein do not
necessarily reflect the official views of the Organisation or of the governments of its member countries.
4 Organisation for Economic Co-operation and Development
OECD Publishing disseminates widely the results of the Organisation’s statistics gathering and research on economic, social and environmental issues, as well as the conventions, guidelines and standards agreed by its members.

5
OEC
D
in F
igur
es
2008
Dem
ogra
phy
and
heal
thEc
onom
yEn
ergy
Labo
urSc
ienc
e an
d te
chno
logy
Envi
ronm
ent
Educ
atio
nPu
blic
fina
nce
Inte
rnat
iona
l tra
de a
nd in
vest
men
tPr
ices
and
fina
nce

6
Dem
ogra
phy
and
heal
th >
Dem
ogra
phy
6
7 6
87 2
0 70
1 1
8 31
1
1.5
3
19
.6
30.2
67
.5
61.3
13
.0
8.5
24
.1
23.3
Aus
tral
ia
84
8 2
82 8
059
0.
6
99
15.7
22
.0
67.6
65
.8
16.7
12
.2
14.1
11
.2+2
Aus
tria
31
10
542
10
157
0.
6
346
17
.0
23.5
65
.8
64.5
17
.2
12.0
12
.5
9.8
Bel
gium
9 9
76 3
2 64
9 2
9 61
1
1.0
3
17
.3
33.7
69
.5
58.7
13
.2
7.6
19
.8
17.4
Cana
da
79
10
251
10
316
0.
3
130
14
.6
25.4
71
.1
64.9
14
.2
9.6
5.
5
4.3
+2Cz
ech
Rep
ublic
43
5 4
35 5
263
0.
3
126
18
.7
25.2
66
.1
64.2
15
.3
10.6
6.
6
5.1
Den
mar
k
33
8 5
267
5 1
25
0.4
16
17
.2
30.4
66
.6
62.3
16
.3
7.3
3.
6
2.1
Finl
and
54
9 6
1 35
3 5
8 02
6
0.6
11
2
18.4
26
.4
65.2
62
.0
16.4
11
.6
8.3
7.
3+3
Fran
ce
35
7 8
2 36
8 8
1 89
5-
0.1
23
1
13.7
21
.3
66.6
67
.8
19.7
10
.8
12.9
-3
11.9
Ger
man
y
13
2 1
1 14
9 1
0 70
9
0.4
84
14
.3
26.1
67
.1
65.8
18
.5
8.1
5.
3
2.8
+2G
reec
e*
93
10
071
10
311
- 0.
2
108
15
.3
25.3
68
.8
65.6
15
.9
9.0
3.
4
2.8
Hun
gary
10
3
304
26
9
2.9
3
21
.5
34.8
66
.9
57.1
11
.6
8.1
....
Icel
and
70
4 2
33 3
626
2.
4
60
20.4
30
.5
68.6
58
.6
10.9
10
.9
14.4
6.
9Ir
elan
d
30
1 5
8 43
5 5
6 82
6
0.5
19
4
14.2
23
.4
66.3
67
.6
19.6
9.
0
5.0
2.
0It
aly*
37
8 1
27 7
70 1
25 8
59
0.0
33
8
13.6
30
.2
65.5
64
.1
20.8
5.
7
1.6
1.
1Ja
pan*
10
0 4
8 29
7 4
5 52
5
0.3
48
4
18.6
42
.3
71.9
54
.8
9.5
2.
9
1.4
0.
3Ko
rea*
3
46
9
416
1.
7
180
18
.4
21.4
67
.5
67.9
14
.1
10.8
34
.8
31.5
Luxe
mbo
urg
1 9
96 1
04 8
74 9
3 13
0
0.9
53
30
.7..
64
.0..
5.
3..
0.
4-1
0.
4-1
Mex
ico
41
16
346
15
531
0.
2
401
18
.2
30.0
67
.4
61.0
14
.4
9.0
10
.6
9.2
Net
herl
ands
26
9 4
185
3 7
32
1.2
16
21
.2
32.9
66
.5
58.5
12
.2
8.7
21
.2
16.2
New
Zea
land
Ital
y*
Japa
n*
Kore
a*
Luxe
mbo
urg
Mex
ico
Net
herl
ands
New
Zea
land
Irel
and
Aus
tria
Bel
gium
Can
ada
Cze
ch R
epub
lic
Den
mar
k
Finl
and
Fran
ce
Ger
man
y
Gre
ece*
Hun
gary
Icel
and
15-6
465
and
ove
rA
s a
% o
f to
tal p
opul
atio
nTh
ous
and
km²
grow
th r
ate,
20
06/2
005
per
km²
2006
1996
2006
Aus
tral
ia
Tota
l are
aPo
pula
tion*
As
a %
of t
otal
pop
ulat
ion
Fore
ign-
born
pop
ulat
ion*
1996
Age
str
uctu
re*
thou
sand
sU
nder
15
1960
2006
1960
2006
1960
2006
2006

7
324
4 6
61 4
381
0.
8
14
19.4
25
.9
65.9
63
.2
14.7
10
.9
8.7
5.
6N
orw
ay
31
3 3
8 13
2 3
8 28
9-
0.1
12
2
16.0
33
.5
70.6
60
.8
13.4
5.
8
1.6
-4..
Pola
nd
92
10
586
9 8
66
0.2
11
5
15.5
..
67.2
..
17.3
..
6.1
5.
4Po
rtug
al
49
5 3
91 5
374
0.
1
110
16
.4
31.6
71
.8
61.5
11
.8
6.9
5.
6..
Slov
ak R
epub
lic
50
5 4
4 06
8 3
9 47
9
1.5
87
14
.5
27.3
68
.8
64.5
16
.7
8.2
11
.9
3.0
+1Sp
ain
45
0 9
081
8 8
41
0.6
20
17
.1
22.4
65
.5
65.9
17
.3
11.8
12
.9
10.7
Swed
en
41
7 4
84 7
072
0.
6
181
15
.9
23.2
68
.0
66.1
16
.1
10.7
24
.1
21.3
Swit
zerl
and
78
1 7
2 97
4 6
2 90
9
1.3
93
28
.1
41.2
66
.0
55.1
6.
0
3.7
..
1.9
+4Tu
rkey
24
5 6
0 58
7 5
8 16
4
0.6
24
7
17.7
23
.3
66.3
64
.9
16.0
11
.7
10.1
7.
1U
nite
d Ki
ngdo
m
9 3
76 2
99 3
98 2
69 3
94
1.0
32
20
.3
31.0
67
.3
59.7
12
.4
9.2
13
.0
10.3
Uni
ted
Stat
es
21
182
722
561
679
776
0.
6
34
17.4
27
.9
66.6
63
.0
16.0
9.
0..
..G
7
3 2
40 3
88 2
00 3
71 9
83
0.5
12
0
15.9
23
.6
66.6
63
.2
17.5
10
.1..
..EU
15
34
804
1 1
75 3
44 1
096
466
0.
7
34
19.1
28
.6
66.9
61
.6
14.0
8.
5..
..O
ECD
tota
l
*A
ddit
iona
l inf
orm
atio
n, in
clud
ing
foo
tnot
es, a
re a
vaila
ble
via
the
Stat
Link
UR
L So
urce
s:
Labo
ur F
orce
Sta
tist
ics:
198
6-20
06, O
ECD
, Par
is, 2
007;
..N
ot a
vaila
ble
or n
ot a
pplic
able
.In
tern
atio
nal M
igra
tion
Out
look
: SO
PEM
I, 2
008
Editi
on, O
ECD
, Par
is, 2
008.
-n
7
12
htt
p://
dx.d
oi.o
rg/1
0.17
87/4
6723
7886
314
Dat
a in
this
cel
l are
fro
m n
yea
rs e
arlie
r (l
ater
, if +
n) t
han
the
refe
renc
e ye
ar. E
.g. i
f the
col
umn
refe
rs
to 2
007,
a d
ata
poin
t wit
h '-1
' att
ache
d re
fers
to
2006
.
Swed
en
Swit
zerl
and
Turk
ey
Uni
ted
King
dom
Uni
ted
Stat
es
G7
EU15
OEC
D t
otal
Spai
n
Nor
way
Pola
nd
Port
ugal
Slo
vak
Rep
ublic

8
De
mog
raph
y and
heal
th >
Heal
th sp
endi
ng an
d res
ourc
es8
8.8
-1 7
.4 6
7.0
-1 6
5.8
4.5
-1 2
999
-1 1
611
14.
2-1
12.
1 3
.5-1
4.1
2.8
-1 2
.5 4
.9 2
.9Au
strali
a
10.
1 9
.7 7
6.2
72.
6 2
.0 3
606
2 25
9 1
2.4
9.2
6.1
6.8
3.6
2.7
16.
8 7
.4+1
Austr
ia
10.
4 8
.2 6
9.1
71.
1 5
.0 3
488
1 85
4 1
6.8
16.
7 4
.3 5
.0 4
.0 3
.5 7
.1 3
.3Be
lgium
10.
0 9
.0 7
0.4
71.
4 4
.7 3
678
2 05
7 1
7.4
13.
8 2
.8-1
4.1
2.1
2.1
6.2
1.4
Cana
da
6.8
7.0
87.
9 9
0.9
4.7
1 4
90 8
99 2
3.4
25.
1 5
.4 7
.0 3
.6 3
.0 3
.8 1
.0Cz
ech R
epub
lic
9.5
8.1
79.
9 7
9.7
4.1
3 3
49 1
871
8.5
9.1
3.1
-1 3
.9 3
.6-2
3.1
10.
2-2
..De
nmar
k
8.2
7.7
76.
0 7
4.1
5.6
2 6
68 1
440
14.
6 1
3.0
3.1
4.0
2.7
2.4
15.
2 4
.3Fin
land
11.
1 9
.9 7
9.7
78.
6 4
.2 3
449
1 99
7 1
6.4
16.
0 3
.7 4
.6 3
.4 3
.2 5
.3 2
.1Fr
ance
10.
6 1
0.1
76.
9 8
1.6
1.4
3 3
71 2
275
14.
8 1
2.9
6.2
7.5
3.5
3.1
7.7
2.3
Germ
any
9.1
8.6
61.
6 5
2.0
7.2
2 4
83 1
264
17.
6 1
5.7
3.9
-1 3
.9 5
.0-1
3.9
13.
2-1
1.9
+2Gr
eece
*
8.3
7.3
70.
9 8
4.0
7.3
1 5
04 6
60 3
1.0
25.
0 5
.5 6
.5 3
.0 3
.0 2
.6 1
.0Hu
ngar
y
9.1
8.2
82.
0 8
3.9
3.6
3 3
40 1
910
13.
1 1
3.4
.. 3
.8 3
.7 3
.0 1
9.7
7.5
Icelan
d
7.5
6.7
78.
3 7
1.9
8.8
3 0
82 1
204
....
2.8
-1 3
.1 2
.9 2
.1 9
.7..
Irelan
d
9.0
7.3
77.
2 7
0.8
2.8
2 6
14 1
538
20.
0 2
0.7
3.3
5.6
3.7
3.9
15.
0-1
2.6
-1Ita
ly
8.2
-1 6
.9 8
2.7
-1 8
3.0
2.5
-1 2
474
-1 1
551
19.
8-1
22.
3 8
.2 1
2.0
2.1
1.8
-1 4
0.1
-1 1
8.8
+1Ja
pan
Finlan
d
Fran
ce
Germ
any
Gree
ce*
Hung
ary
Icelan
d
Irelan
d
Italy
Japa
n
Aust
ralia
Aust
ria
Belgi
um
Cana
da
Czec
h Rep
ublic
Denm
ark
Prac
tisin
g phy
sician
s*M
RI sc
anne
r uni
ts
% of
GDP
% of
tota
l exp
endi
ture
Aver
age
annu
al gr
owth
rate
Per c
apita
USD
PPP
% of
tota
l exp
endit
ure
per 1
000 p
opul
atio
npe
r 1 00
0 pop
ulatio
npe
r milli
on p
opul
atio
n
1995
Tota
l exp
endit
ure
Publi
c exp
endi
ture
*He
alth e
xpen
ditur
ePh
arm
aceu
tical
expe
nditu
reAc
ute c
are b
eds*
1995
2006
1995
2006
2006
2006
1995
1995
1995
2006
2000
-06
2006
2006
1995

9
6
.4 3
.9 5
5.1
38.
1 1
0.7
1 4
80 5
02 2
5.8
29.
8 6
.8 3
.8 1
.7 1
.1 1
3.6
3.9
Kore
a
7.3
5.6
90.
9 9
2.4
8.0
4 3
03 1
911
8.4
-1 1
2.0
4.6
.. 2
.8 2
.2 1
0.9
2.4
Luxe
mbo
urg*
6.6
5.6
44.
2 4
2.1
5.2
794
386
22.
9..
1.0
1.1
1.9
1.7
1.4
..M
exico
9.3
8.3
81.
7 7
1.0
4.1
3 3
91 1
799
.. 1
1.0
3.0
3.4
3.8
2.9
+3 6
.6-1
3.9
Neth
erla
nds*
9.3
7.2
77.
8 7
7.2
6.7
2 4
48 1
244
12.
4 1
4.8
....
2.3
2.0
3.7
-3 2
.7+1
New
Zeal
and
8.7
7.9
83.
6 8
4.2
2.8
4 5
20 1
863
8.5
9.0
3.0
3.3
3.7
2.8
....
Norw
ay
6.2
5.5
69.
9 7
2.9
5.6
910
411
27.
2..
4.7
5.8
2.2
2.3
1.9
..Po
land
10.
2 7
.8 7
0.6
62.
6 3
.3 2
120
1 0
36 2
1.3
23.
6 3
.0-1
3.3
3.4
-1 2
.9 5
.8 2
.8+2
Portu
gal*
7.1
-1 5
.7+2
74.
4-1
91.
7+2
10.
2-1
1 1
30-1
564
+2 3
1.9
-1..
4.9
6.3
+1 3
.1-2
.. 4
.5..
Slova
k Rep
ublic
8.4
7.4
71.
2 7
2.2
6.0
2 4
58 1
193
21.
7 1
9.2
2.5
-1 3
.5 3
.6 2
.5 8
.8 2
.7Sp
ain
9.2
8.0
81.
7 8
6.6
4.7
3 2
02 1
746
13.
3 1
2.3
2.2
3.0
3.5
-1 2
.9..
6.8
Swed
en
11.
3 9
.7 6
0.3
53.
8 3
.2 4
311
2 5
98 1
0.5
-1 1
0.0
3.5
5.5
3.8
3.2
14.
0 1
2.4
+2Sw
itzer
land
5.7
-1 3
.4 7
1.4
-1 7
0.3
7.6
-1 5
91-1
173
.. 3
1.6
-1 2
.5 2
.1 1
.6 1
.1 3
.5 0
.6+1
Turk
ey
8.4
6.9
87.
3 8
3.9
5.1
2 7
60 1
350
.. 1
5.3
2.2
4.1
2.5
1.8
5.6
..Un
ited
King
dom
*
15.
3 1
3.3
45.
8 4
5.3
5.0
6 7
14 3
656
12.
6 8
.9 2
.7 3
.4 2
.4 2
.2 2
6.5
12.
3Un
ited
Stat
es
8.9
7.6
73.
0 7
2.9
5.2
2 8
24 1
494
17.
6 1
6.3
3.9
4.7
3.1
2.6
10.
2 4
.7OE
CD a
vera
ge
*Ad
ditio
nal in
form
atio
n, in
cludi
ng fo
otno
tes,
are
avai
labl
e via
the
Stat
Link U
RL
Sour
ces:
OECD
Hea
lth D
ata
2008
, OEC
D, P
aris,
June
200
8...
Not a
vaila
ble
or n
ot ap
plica
ble.
-n
9
Data
in th
is ce
ll are
from
n ye
ars e
arlie
r (la
ter,
if +n
) tha
n th
e re
fere
nce
year
. E.g
. if t
he co
lum
n re
fers
to
2007
, a d
ata p
oint
with
'-1'
atta
ched
refe
rs to
200
6.
OECD
ave
rage
12
http
://dx
.doi
.org
/10.
1787
/467
3004
4545
6
Unite
d St
ates
Neth
erlan
ds*
New
Zeal
and
Norw
ay
Pola
nd
Portu
gal*
Slova
k Rep
ublic
Spai
n
Swed
en
Switz
erla
nd
Turk
ey
Unite
d Ki
ngdo
m*
Mex
ico
Kore
a
Luxe
mbo
urg*

10
D
emog
raph
y an
d he
alth
> H
ealt
h st
atus
10
83
.5
78.7
81
.1
80.8
75
.0
77.9
1.
81
4.7
5.
7
17.7
-2
24.1
..
19.8
Aus
tral
ia*
82
.7
77.1
79
.9
79.9
73
.3
76.6
1.
41
3.6
5.
4
23.2
24
.3+2
12
.4..
Aus
tria
82
.3
76.6
79
.5
80.4
73
.5
77.0
1.
80
3.7
-1
5.9
22
.0
28.5
12
.7-2
11
.1+2
Bel
gium
82
.7-1
78
.0-1
80
.4-1
81
.1
75.1
78
.1
1.54
5.
4-1
6.
1
17.3
-1
25.5
-1
18.0
-1
12.1
-1C
anad
a
79
.9
73.5
76
.7
76.8
69
.7
73.3
1.
33
3.3
7.
7
24.3
-1
26.2
+1
17.0
-1
11.3
+1C
zech
Rep
ublic
*
80
.7
76.1
78
.4
77.9
72
.7
75.3
1.
85
3.8
5.
1
26.0
-2
35.5
11
.4-1
7.
6-1
Den
mar
k
83
.1
75.9
79
.5
80.4
72
.8
76.6
1.
84
2.8
3.
9
21.4
24
.0
14.3
10
.4Fi
nlan
d
84
.4
77.3
80
.9
81.8
73
.9
77.9
1.
98
3.8
4.
9
25.0
29
.0
10.5
7.
0Fr
ance
82
.4
77.2
79
.8
79.9
73
.3
76.6
1.
33
3.8
5.
3
23.2
-1
24.3
13
.6-1
..G
erm
any
82
.0
77.1
79
.6
80.3
75
.0
77.7
1.
41
3.7
8.
1
38.6
-2
37.0
-1
21.9
-3..
Gre
ece
77
.4
69.0
73
.2
74.5
65
.3
69.9
1.
35
5.7
10
.7
30.4
-3
35.5
-1
18.8
-3..
Hun
gary
83
.0
79.4
81
.2
80.0
75
.9
78.0
2.
07
1.4
6.
0
19.3
26
.8..
..Ic
elan
d
82
.1
77.3
79
.7
78.3
72
.8
75.6
1.
90
3.7
6.
4..
28
.0-1
..
10.0
+3Ir
elan
d
83
.8-2
77
.9-2
80
.9-2
81
.6
75.1
78
.4
1.35
3.
9-2
6.
2
23.0
25
.6
10.2
7.
0-1
Ital
y
85
.8
79.0
82
.4
82.9
76
.4
79.6
1.
32
2.6
4.
3
26.3
37
.0
3.9
-1
2.6
Japa
n
82
.4
75.7
79
.1
77.4
69
.6
73.5
1.
13..
7.
7+1
25
.3-1
35
.2
3.5
-1
2.2
+3Ko
rea
81
.9
76.8
79
.4
80.6
73
.0
76.8
1.
64
2.5
5.
5
21.0
33
.0-3
18
.6-1
14
.9+2
Luxe
mbo
urg
78
.1
73.2
75
.7
75.3
70
.0
72.7
2.
17
18.1
27
.6..
25
.1-2
30
.0..
Mex
ico
81
.9
77.6
79
.8
80.4
74
.6
77.5
1.
72
4.4
5.
5
31.0
36
.0
11.3
6.
9N
ethe
rlan
ds
81
.9
77.9
79
.9
79.7
74
.4
77.1
2.
01
5.2
6.
7
20.7
27
.0
20.9
-3
17.0
+2N
ew Z
eala
nd*
Finl
and
Fran
ce
Ger
man
y
Hun
gary
Icel
and
Irel
and
Ital
y
Japa
n
Kore
a
Luxe
mbo
urg
Mex
ico
Net
herl
ands
New
Zea
land
*
2006
1995
2006
Czec
h Re
publ
ic*
Den
mar
k
Toba
cco
cons
umpt
ion
Obe
sity
*
Num
ber
of y
ears
Gre
ece
% o
f adu
lts w
ith
BMI>
30
kg/m
²
Aus
tral
ia*
Aus
tria
Bel
gium
Cana
da
2006
1995
Child
ren
per
wom
an
15-4
9
per
1 00
0 liv
e bi
rths
1%
of a
dults
sm
okin
g da
ily
1995
1995
Fert
ility
rat
e
2006
Men
Tota
l
Life
exp
ecta
ncy
at b
irth
Infa
nt m
orta
lity
Tota
lW
omen
Wom
enM
en20
06

11
82.9
78
.2
80.6
80
.9
74.8
77
.9
1.90
3.
2
4.0
24
.0
33.0
9.
0-1
5.
0N
orw
ay
79
.6
70.9
75
.3
76.4
67
.6
72.0
1.
27
6.0
13
.6
26.3
-2
31.5
+1
12.5
-2
11.4
+1Po
land
82
.3
75.5
78
.9
79.0
71
.7
75.4
1.
36
3.3
7.
5
17.0
-1
19.5
+1..
11
.5+1
Port
ugal
78
.2
70.4
74
.3
76.3
68
.4
72.4
1.
24
6.6
11
.0
25.0
..
17.6
-1
18.9
-2Sl
ovak
Rep
ublic
84
.4
77.7
81
.1
81.8
74
.4
78.1
1.
38
3.8
5.
5
26.4
33
.7
14.9
10
.3Sp
ain
82
.9
78.7
80
.8
81.4
76
.2
78.8
1.
85
2.8
4.
1
15.9
-1
22.8
10
.7-1
7.
9+2
Swed
en
84
.2
79.2
81
.7
81.9
75
.4
78.7
1.
44
4.4
5.
0..
28
.9+2
..
6.8
+2Sw
itzer
land
74
.0
69.1
71
.6
70.2
65
.6
67.9
2.
18
22.6
43
.0
32.1
-3
47.4
12
.0-3
..Tu
rkey
81
.1-1
77
.1-1
79
.1-1
79
.3
74.0
76
.7
1.84
5.
0
6.2
22
.0
27.0
-1
24.0
16
.0U
nite
d Ki
ngdo
m*
80
.4-1
75
.2-1
77
.8-1
78
.9
72.5
75
.7
2.10
6.
9-1
7.
6
16.7
20
.0
34.3
..U
nite
d St
ates
*
81
.7
76.1
78
.9
79.2
72
.7
76.0
1.
65
5.2
8.
4
23.7
29
.4
15.4
10
.4O
ECD
ave
rage
*A
dditi
onal
info
rmat
ion,
incl
udin
g fo
otno
tes,
are
ava
ilabl
e vi
a th
e St
atLi
nk U
RL
Sour
ces:
1.O
ECD
Hea
lth
Dat
a 20
08,
OEC
D, P
aris
, Jun
e 20
08.
..N
ot a
vaila
ble
or n
ot a
pplic
able
.
-n
11
Dat
a in
this
cel
l are
from
n y
ears
ear
lier
(late
r, if
+n)
tha
n th
e re
fere
nce
year
. E.g
. if t
he c
olum
n re
fers
to
200
7, a
dat
a po
int
with
'-1'
att
ache
d re
fers
to 2
006.
Uni
ted
King
dom
*
Uni
ted
Stat
es*
OEC
D a
vera
ge
12
htt
p://
dx.d
oi.o
rg/1
0.17
87/4
6731
0041
335
In t
he U
nite
d St
ates
, Can
ada,
Japa
n an
d so
me
Nor
dic
coun
trie
s, v
ery
prem
atur
e ba
bies
with
a lo
w
chan
ce o
f sur
viva
l are
reg
iste
red
as li
ve b
irth
s w
hich
may
not
be
the
case
in o
ther
cou
ntri
es. F
or
the
22 E
urop
ean
coun
trie
s, th
e Eu
rost
at N
ewC
hron
os d
atab
ase
is t
he m
ain
data
sou
rce.
Port
ugal
Slov
ak R
epub
lic
Spai
n
Swed
en
Switz
erla
nd
Turk
ey
Pola
nd
Nor
way
12
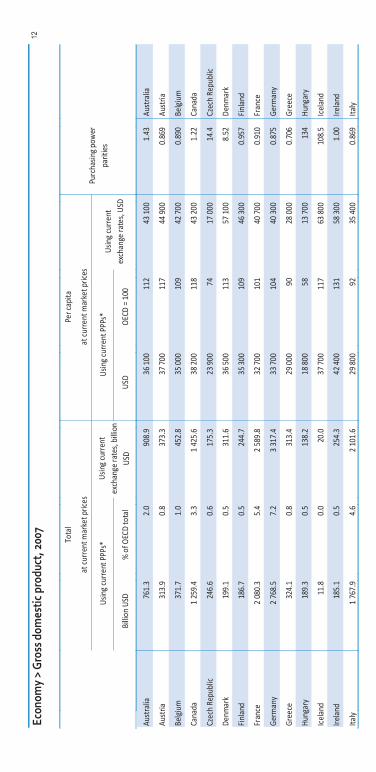
Ec
onom
y >
Gro
ss d
omes
tic p
rodu
ct, 2
007
12
76
1.3
2.
0
908.
9 3
6 10
0
112
43
100
1.43
Aust
ralia
31
3.9
0.
8
373.
3 3
7 70
0
117
44
900
0.86
9Au
stria
37
1.7
1.
0
452.
8 3
5 00
0
109
42
700
0.89
0Be
lgiu
m
1 2
59.4
3.
3 1
425
.6 3
8 20
0
118
43
200
1.22
Cana
da
24
6.6
0.
6
175.
3 2
3 90
0
74 1
7 00
014
.4Cz
ech
Repu
blic
19
9.1
0.
5
311.
6 3
6 50
0
113
57
100
8.52
Denm
ark
18
6.7
0.
5
244.
7 3
5 30
0
109
46
300
0.95
7Fi
nlan
d
2 0
80.3
5.
4 2
589
.8 3
2 70
0
101
40
700
0.91
0Fr
ance
2 7
68.5
7.
2 3
317
.4 3
3 70
0
104
40
300
0.87
5Ge
rman
y
32
4.1
0.
8
313.
4 2
9 00
0
90 2
8 00
00.
706
Gree
ce
18
9.3
0.
5
138.
2 1
8 80
0
58 1
3 70
013
4Hu
ngar
y
11
.8
0.0
20
.0 3
7 70
0
117
63
800
108.
5Ic
elan
d
18
5.1
0.
5
254.
3 4
2 40
0
131
58
300
1.00
Irela
nd
1 7
67.9
4.
6 2
101
.6 2
9 80
0
92 3
5 40
00.
869
Italy
Irela
nd
Italy
Icel
and
Aust
ralia
Aust
ria
Belg
ium
Cana
da
Czec
h Re
publ
ic
Denm
ark
Finl
and
Fran
ce
Germ
any
Gree
ce
Hung
ary
Usin
g cu
rren
t PPP
s*Us
ing
curr
ent P
PPs*
Usin
g cu
rren
t ex
chan
ge ra
tes,
billi
on
USD
Usin
g cu
rren
t ex
chan
ge ra
tes,
USD
Purc
hasin
g po
wer
pa
ritie
s
Tota
lPe
r cap
ita
at cu
rren
t mar
ket p
rices
at cu
rren
t mar
ket p
rices
OEC
D =
100
% o
f OEC
D to
tal
USD
Billi
on U
SD

13
4
273
.5
11.2
4 3
78.8
33
500
10
4 3
4 30
012
1Ja
pan
1 2
03.0
3.
1
969.
8 2
4 80
0
77 2
0 00
074
9Ko
rea
39
.3
0.1
49
.5 8
1 80
0
254
103
000
0.92
0Lu
xem
bour
g
1 3
50.2
3.
5
892.
6 1
2 80
0
40 8
400
7.22
Mex
ico
63
3.0
1.
7
765.
8 3
8 70
0
120
46
800
0.88
4N
ethe
rland
s
11
3.3
0.
3
128.
4 2
7 10
0
84 3
0 70
01.
54N
ew Z
eala
nd
26
0.0
0.
7
390.
5 5
5 30
0
171
83
100
8.80
Nor
way
60
8.5
1.
6
420.
1 1
6 00
0
49 1
1 00
01.
91Po
land
23
1.2
0.
6
223.
0 2
1 80
0
67 2
1 00
00.
705
Port
ugal
10
7.1
0.
3
73.9
19
900
61
13
700
17.0
Slov
ak R
epub
lic
1 3
77.8
3.
6 1
436
.9 3
0 70
0
95 3
2 00
00.
762
Spai
n
33
4.1
0.
9
454.
8 3
6 60
0
113
49
800
9.20
Swed
en
30
3.7
0.
8
423.
4 3
9 90
0
124
55
600
1.67
Switz
erla
nd
89
3.7
2.
3
657.
1 1
2 10
0
37 8
900
0.95
8Tu
rkey
2 1
11.9
5.
5 2
770
.9 3
4 60
0
107
45
500
0.65
6U
nite
d Ki
ngdo
m
13
776.
5
36.0
13
776.
5 4
5 50
0
141
45
500
1.00
Uni
ted
Stat
es
28
038.
0
73.2
30
360.
6 3
8 40
0
119
41
600
..G
7
10
279.
5
26.9
12
122.
4 3
2 40
0
100
38
200
0.86
2Eu
ro a
rea*
38
282.
5
100.
0 4
0 43
8.8
32
300
10
0 3
4 10
0..
OEC
D to
tal
*Ad
ditio
nal i
nfor
mat
ion,
incl
udin
g fo
otno
tes,
are
ava
ilabl
e vi
a th
e St
atLi
nk U
RL
Sour
ces:
Nat
iona
l Acc
ount
s of
OEC
D C
ount
ries,
OEC
D, P
aris
, 200
8.
..N
ot a
vaila
ble
or n
ot a
pplic
able
.13
12
htt
p://
dx.d
oi.o
rg/1
0.17
87/4
6735
0026
020
Spai
n
Swed
en
Switz
erla
nd
Turk
ey
Uni
ted
King
dom
Uni
ted
Stat
es
G7
Euro
are
a*
OEC
D to
tal
Slov
ak R
epub
lic
Japa
n
Kore
a
Luxe
mbo
urg
Mex
ico
Net
herla
nds
New
Zea
land
Nor
way
Pola
nd
Port
ugal

14
E
con
om
y >
Eco
no
mic
gro
wth
an
d p
erfo
rman
ce14
3.
6
4.5
3.
2
3.6
-1
4.5
-1
4.8
-1
6.3
-2-
1.1
-1
6.4
-1A
ustr
alia
2.
5
3.1
3.
4
1.0
1.
8
4.7
2.
8
5.9
11
.8A
ustr
ia
2.
2
2.8
2.
8
2.5
2.
1
5.9
..
2.9
9.
9B
elgi
um
3.
3
2.7
2.
8
4.2
-1
3.3
-1
7.2
-1
6.0
-1
2.6
-1
11.5
-1C
anad
a
3.
6
6.6
6.
8
5.4
-1-
0.7
-1
6.5
-1..
3.
5-1
6.
4-1
Cze
ch R
epu
blic
2.
0
1.8
3.
9
2.5
1.
7
6.1
12
.9-1
1.
1
8.0
Den
mar
k
3.
6
4.5
4.
9
3.2
1.
3
8.5
4.
6-1
5.
1
13.6
Fin
land
2.
3
2.2
2.
2
2.4
1.
4
4.9
2.
3-1
- 1.
9
6.0
Fran
ce
1.
5
2.5
2.
9-
0.5
2.
2
5.0
2.
2
7.0
10
.9G
erm
any
4.
1
4.0
4.
2
3.2
10
.3
4.4
1.
9-
13.2
- 1.
5G
reec
e
4.
1
1.3
3.
9-
0.3
- 6.
2
0.1
..
2.3
2.
8-1
Hun
gary
4.
4
3.8
4.
4
4.2
3.
3-
14.9
14
.0-2
- 10
.6-
1.2
Icel
and
6.
7
6.0
5.
7
5.7
-1
5.5
-1
3.1
-1
5.8
-1
10.7
-1
13.1
-1Ir
elan
d
1.
4
1.5
1.
8
1.5
1.
2
1.2
2.
1-1
- 0.
3
4.0
Ital
y
1.
2
2.1
2.
4
2.0
-1-
0.4
-1
1.3
-1
0.3
-1
1.2
-1
5.8
-1Ja
pan
4.
3
5.0
5.
1
4.5
5.
8
4.0
1.
2
0.8
17
.0K
ore
a
5.
2
4.5
6.
1
2.0
2.
4
15.2
1.
3
30.6
..Lu
xem
bo
urg
3.
2
3.2
4.
8
5.0
-1
6.0
-1
10.0
-1
5.9
-3-
1.3
-1
11.0
-3M
exic
o
2.
5
3.5
3.
0
2.1
2.
7
5.1
6.
0
8.0
13
.7N
ethe
rlan
ds
Irel
and
Ital
y
Jap
an
Kore
a
Luxe
mbo
urg
Mex
ico
Net
her
land
s
Icel
and
Au
stra
lia
Au
stri
a
Bel
gium
Can
ada
Cze
ch R
epub
lic
Den
mar
k
Finl
and
Fran
ce
Ger
man
y
Gre
ece
Hu
ngar
y
Net
nat
ion
al
savi
ng
Ave
rage
an
nual
% v
olum
e ch
ange
Gro
ss fi
xed
capi
tal f
orm
atio
nP
riva
te f
inal
co
nsu
mpt
ion
expe
ndit
ure
Go
vern
men
t fi
nal
cons
umpt
ion
expe
ndi
ture
% o
f GD
P a
t cu
rren
t pr
ices
, 20
07
% o
f G
DP
at
curr
ent
pric
es,
2007
GD
P gr
ow
thG
DP
gro
wth
by
com
pon
ent
Vo
lum
e %
ch
ange
200
6-20
07
Exte
rnal
bal
ance
(g
ood
s an
d
serv
ices
)
Ho
usin
g an
d o
ther
co
nst
ruct
ion
Tota
l20
05-2
006
1997
-200
720
06-2
007

15
3.2
3.
1
1.6
2.
6-1
4.
4-1
- 2.
3-1
- 2.
4-1
- 1.
4-1
0.
8-1
New
Zea
lan
d
2.
5
3.7
2.
5
6.4
3.
6
9.3
8.
2-1
15
.7
25.6
No
rway
4.
2
6.5
6.
2
5.2
0.
7
20.4
13
.7-
1.7
5.
3-1
Po
land
2.
0
1.8
1.
3
1.3
- 0.
1
3.0
- 5.
9-1
- 7.
2-
4.5
Po
rtug
al
4.
6
10.4
8.
3
6.1
-1
4.1
-1
7.3
-1-
1.7
-1-
4.6
-1
1.6
-1Sl
ova
k R
epub
lic
3.
8
3.8
3.
9
3.2
5.
1
5.9
4.
1-
6.5
5.
4Sp
ain
3.
2
2.7
4.
1
3.1
1.
1
8.0
6.
6
7.6
15
.9Sw
eden
2.
1
3.1
3.
5
1.6
-1-
0.9
-1
4.7
-1
3.5
-2
7.7
-1
18.9
-1Sw
itze
rlan
d
4.
0
4.5
6.
9
4.6
2.
8
3.3
..-
5.0
..Tu
rkey
2.
8
3.1
2.
9
3.2
1.
9
6.0
7.
8-1
- 3.
7
3.1
Un
ited
Kin
gdo
m
2.
9
2.0
2.
9
3.1
-1
1.6
-1
2.4
-1-
0.2
-1-
5.8
-1
1.9
-1U
nit
ed S
tate
s
2.
3
2.2
2.
7
2.5
-1
1.1
-1
3.1
-1
1.3
-1-
2.3
-1
4.1
-1G
7
2.
2
2.6
2.
8
1.8
-1
1.9
-1
5.2
-1..
1.
1-1
..Eu
ro a
rea1
2.
5
2.5
3.
0
2.7
-1
1.7
-1
3.9
-1..
- 1.
5-1
..O
ECD
to
tal
1.So
urc
es:
Nat
iona
l Acc
ount
s o f
OEC
D C
ount
ries
, O
ECD
, Par
is, 2
008.
..N
ot a
vaila
ble
or
not
app
licab
le.
-n
15
12
htt
p://
dx.d
oi.o
rg/1
0.17
87/4
6735
4085
611
Incl
udes
onl
y th
e 12
OEC
D m
embe
r co
untr
ies
of t
he E
uro
are
a.
Dat
a in
thi
s ce
ll ar
e fr
om
n y
ears
ear
lier
than
the
ref
eren
ce y
ear.
E.g
. if
the
colu
mn
ref
ers
to
2007
, a d
ata
po
int
wit
h '-1
' att
ache
d r
efer
s to
200
6.
Spai
n
Swed
en
Swit
zerl
and
Turk
ey
Uni
ted
Kin
gdo
m
Uni
ted
Stat
es
G7
Euro
are
a1
OEC
D t
ota
l
Slo
vak
Rep
ublic
New
Zea
land
No
rway
Pola
nd
Port
uga
l

16
E
con
om
y >
Sec
tora
l co
ntr
ibu
tio
ns
to g
ross
val
ue
add
ed1
16
2.
3
3.7
28
.7
27.6
11
.2
14.2
69
.0
68.8
Au
stra
lia
1.
7
2.4
30
.2
30.8
20
.1
19.5
68
.2
66.8
Au
stri
a
0.
9
1.6
24
.2
28.0
16
.9
20.0
74
.9
70.4
Bel
gium
2.
2-2
3.
0
31.7
-2
30.9
16
.2-2
18
.0
66.1
-2
66.1
Can
ada
2.
6
4.7
38
.2
41.8
26
.3
26.3
59
.2
53.5
Cze
ch R
epub
lic
1.
6
3.4
26
.0
25.4
14
.2-1
16
.5
72.5
71
.2D
enm
ark
2.
5
4.0
32
.4
32.0
23
.7
24.3
65
.1
64.0
Finl
and
2.
1
3.3
20
.7
24.1
12
.6
16.0
77
.3
73.1
Fran
ce
0.
9
1.3
29
.4
31.2
22
.7
22.2
69
.8
67.4
Ger
man
y
3.
7
8.2
24
.3
21.3
13
.2
11.1
+4
72.0
70
.2G
reec
e
4.
1
8.3
30
.1
29.8
22
.5
23.5
+4
65.8
62
.5H
un
gary
5.
8-1
10
.8
23.7
-1
27.8
10
.1-1
16
.4+1
70
.5-1
61
.3Ic
elan
d2
1.
7
6.4
34
.9
36.9
23
.3
29.3
63
.4
56.7
Irel
and
2.
1
3.3
26
.8
29.7
18
.3
21.8
71
.1
67.0
Ital
y
1.
4
1.9
29
.1
33.0
20
.7
22.4
69
.5
65.2
Jap
an3
3.
3
6.0
39
.6
41.3
28
.0
26.7
57
.1
52.8
Ko
rea
0.
4
0.9
14
.6
20.2
7.
9
12.5
85
.1
78.9
Luxe
mb
our
g
3.
8-2
5.
9
26.0
-2
27.7
17
.9-2
21
.0
70.2
-2
66.3
Mex
ico
2.
2
3.3
24
.1
26.9
13
.3
16.8
73
.7
69.8
Net
herl
and
s
6.
5-3
7.
2
24.0
-3
25.8
15
.2-3
17
.3
69.5
-3
67.0
New
Zea
lan
d4
1.
5
2.6
45
.0
36.6
9.
7
12.3
53
.5
60.7
No
rway
Irel
and
Ital
y
Jap
an3
Ko
rea
Luxe
mb
ou
rg
Mex
ico
Ne
ther
land
s
Ne
w Z
eala
nd4
No
rway
Icel
and2
Aus
tral
ia
Aus
tria
Bel
giu
m
Can
ada
Cze
ch R
epu
blic
Den
mar
k
Fin
land
Fran
ce
Ge
rman
y
Gre
ece
Hu
ngar
y
% o
f va
lue
adde
dTo
tal
Man
ufa
ctur
ing
% o
f va
lue
add
ed
Agr
icu
ltur
eIn
du
stry
Serv
ices
% o
f va
lue
add
ed
2006
1996
2006
1996
2006
1996
2006
1996

17
4.3
7.
6
31.2
33
.6
18.9
19
.9
64.5
58
.9Po
land
2.
9
5.5
24
.3
28.
9
14.
7-1
19
.0
72.8
65
.6P
ortu
gal
4.
0
5.5
35
.0
39.
1
21.
9
26.0
61
.1
55.4
Slo
vak
Rep
ublic
2.
9
5.1
30
.4
29.1
16
.1
18.6
66
.7
65.8
Spai
n
1.
4
2.6
28
.5
29.
3
20.
0
21.7
70
.1
68.1
Swed
en
1.
2
1.9
27
.7
29.1
19
.9
20.0
71
.2
69.1
Swit
zerl
and
9.
4
12.6
28
.2
36.
7
19.
5
27.2
62
.4
50.6
Turk
ey
0.
9
1.7
22
.9
30.
6
12.
6
20.5
76
.2
67.7
Uni
ted
Kin
gdo
m
1.
1
1.8
22
.4
25.
9
12.
2
16.2
+2
76.5
72
.2U
nite
d St
ates
2
1.So
urce
s:N
atio
na
l Acc
oun
ts o
f OEC
D C
ount
ries
, O
ECD
, Par
is, 2
008
.
2. 3. 4. -n
17
12
htt
p://
dx.d
oi.o
rg/1
0.17
87/4
6735
6167
281
Acc
ord
ing
to t
he 1
993
Syst
em o
f Nat
iona
l Acc
ount
s an
d t
he In
tern
atio
nal
Stan
dard
Indu
stri
al C
lass
ific
atio
n (I
SIC)
, Rev
isio
n 3
(19
90).
Val
ue a
dde
d is
es
timat
ed a
t ba
sic
pric
es a
nd in
clud
es
finan
cial
inte
rmed
iati
on
serv
ices
in
dire
ctly
mea
sure
d (F
ISIM
).
Val
ue a
dded
est
imat
ed a
t fa
cto
r co
st.
Val
ue a
dded
is e
stim
ate
d ap
prox
imat
ely
at m
arke
t pr
ice
s.V
alue
add
ed is
est
imat
ed
at p
rodu
cer'
s pr
ices
.
Dat
a in
this
cel
l are
from
n y
ears
ear
lier
(late
r, if
+n)
tha
n th
e re
fere
nce
year
. E.
g. if
the
col
umn
refe
rs t
o 20
07, a
dat
a po
int
with
'-1'
att
ache
d re
fers
to
2006
.
Spai
n
Swed
en
Switz
erla
nd
Turk
ey
Uni
ted
Kin
gdom
Uni
ted
Stat
es2
Slo
vak
Rep
ublic
Pol
and
Por
tuga
l

18
Ec
onom
y >
Busin
ess s
tatis
tics,
200
5*18
24
2
994
13
1
153
1 7
56
337
16
6 1
005
67
6Au
stra
lia
15
6
598
28
64
53
6
77
48
323
82
Aust
ria
25
4
578
37
95
46
5
134
78
36
4
106
Belg
ium
39
7-2
1 9
47-2
49
-2..
....
....
..Ca
nada
96
-1 1
202
-1
151
-1
23-1
48
9-1
22
7-1
19
-1
299
-1
252
-1Cz
ech
Repu
blic
96
40
1
19
83
421
49
55
32
1
71De
nmar
k
12
9
400
25
31
24
4
47
28
191
49
Finl
and
1 0
89 3
662
25
6
400
3 0
44
702
50
2 2
990
59
5Fr
ance
1 8
14 7
004
20
4
398
3 9
80
415
43
9 3
530
58
7Ge
rman
y
36
-1
296
-1
88-1
....
30
5-1
....
14
5-1
Gree
ce
86
75
4
65
19
484
15
6
14
292
19
4Hu
ngar
y
..
16
3..
23
5
..
14
17Ic
elan
d
13
3
215
4
29
26
0
29
36
155
31
Irela
nd
1 0
38 3
837
51
9
478
1 7
87 1
255
29
2 1
527
1 0
31Ita
ly
2 6
83 7
549
27
7..
10
720
-3..
....
..Ja
pan
83
2 2
727
11
7
331
-4 1
242
-1
899
58
-4 1
149
-1
206
Kore
a
Irela
nd
Italy
Japa
n
Kore
a
Icel
and
Aust
ralia
Aust
ria
Belg
ium
Cana
da
Czec
h Re
publ
ic
Denm
ark
Finl
and
Fran
ce
Germ
any
Gree
ce
Hung
ary
Thou
sand
s
Num
ber o
f en
terp
rises
*
Man
ufac
turin
gW
hole
sale
and
reta
il tr
ade
Busin
ess s
ervi
ces a
nd re
al e
stat
e
Billi
on U
SD
Prod
uctio
n
Thou
sand
s
Num
ber o
f em
ploy
ees*
Thou
sand
s
Num
ber o
f em
ploy
ees*
Thou
sand
s
Num
ber o
f en
terp
rises
*Th
ousa
nds
Num
ber o
f en
terp
rises
*Bi
llion
USD
Prod
uctio
n
Billi
on U
SD
Prod
uctio
n
Thou
sand
s
Num
ber o
f em
ploy
ees*

19
11
37 1
5 3
9
7
7
49
9Lu
xem
bour
g
254
3 4
64-2
34
8-2
81
-2 2
601
-2 1
780
-2 2
9-2
1 1
20-2
15
7-2
Mex
ico
286
72
5
46
135
1 1
58 1
62 1
52 1
214
14
7Ne
ther
land
s
48
27
7
23 2
7
328
53
29
217
13
4Ne
w Z
eala
nd
71
-1
252
-1 9
-2 5
0
332
57
50
213
93
Norw
ay
194
2 2
45
192
12
7 1
460
591
37
632
26
8Po
land
87
85
1
104
41
82
1 2
99 3
3 5
23
207
Portu
gal
36
40
4 7
8
177
17
4
101
11
Slov
ak R
epub
lic
572
2 4
65
220
21
3 2
552
819
194
2 0
19
584
Spai
n
208
70
9
60 6
2
501
124
91
452
21
6Sw
eden
....
.. 6
4-2
52
2-4
40
-3 5
6-2
323
-2
30-3
Switz
erla
nd
200
-1 2
085
-1
281
-1 5
7-1
1 3
33-1
968
-1 1
7-1
401
-1
110
-1Tu
rkey
793
3 1
38
153
46
2 4
595
383
611
4 2
96
617
Unite
d Ki
ngdo
m
4 7
35 1
3 16
9
346
-3..
21
761
-3 1
267
-3..
17
057
-3 1
139
-3Un
ited
Stat
es
*Ad
ditio
nal in
form
atio
n, in
cludi
ng fo
otno
tes,
are
avai
labl
e via
the
Stat
Link U
RL
Sour
ces:
Stru
ctur
al a
nd D
emog
raph
ic Bu
sines
s Sta
tistic
s, O
ECD
data
base
...
Not a
vaila
ble
or n
ot a
pplic
able
.-n
19
12
http
://dx
.doi
.org
/10.
1787
/467
3750
0338
3
Data
in th
is ce
ll are
from
n y
ears
ear
lier t
han
the
refe
renc
e ye
ar. E
.g. i
f the
colu
mn
refe
rs to
20
07, a
dat
a po
int w
ith '-
1' a
ttac
hed
refe
rs to
200
6.
Spai
n
Swed
en
Switz
erla
nd
Turk
ey
Unite
d Ki
ngdo
m
Unite
d St
ates
Slov
ak R
epub
lic
Luxe
mbo
urg
Mex
ico
Neth
erla
nds
New
Zea
land
Norw
ay
Pola
nd
Portu
gal

20
E
cono
my
> S
ervi
ces:
val
ue a
dded
*20
13
.5
14.7
7.
5
8.8
7.
8
6.1
21
.0
19.8
4.
2
4.3
15
.0
14.2
Aus
tral
ia*
17
.4
16.8
7.
0
7.4
5.
4
6.1
18
.0
13.8
5.
8
6.8
15
.0
16.0
Aus
tria
14
.6
13.8
8.
4
8.2
5.
8
6.4
22
.2
19.1
7.
3
7.1
16
.5
15.6
Belg
ium
13
.8-2
13
.4
6.9
-2
7.3
7.
3-2
6.
6
18.2
-2
17.6
5.
8-2
6.
6
14.2
-2
14.8
Cana
da*
14
.4
14.0
10
.3
10.4
3.
3
3.2
13
.8
13.6
5.
7
5.4
11
.3
10.1
Czec
h R
epub
lic
12
.8
14.7
9.
2
7.6
5.
6
5.2
18
.2
17.1
6.
3
6.8
16
.3
20.1
Den
mar
k
12
.2
11.1
10
.4
9.7
2.
3
4.3
18
.5
14.6
5.
0
5.5
17
.4
17.7
Finl
and
12
.9
13.2
6.
4
6.2
4.
6
4.8
27
.4
22.8
7.
6
7.9
18
.0
16.9
Fran
ce*
12
.2
12.3
5.
9
5.7
5.
0
4.6
24
.3
21.8
6.
0
6.7
16
.4
15.5
Ger
man
y
23
.8..
8.
3..
4.
2..
15
.2..
7.
3..
17
.7..
Gre
ece
12
.7
13.1
7.
7
8.0
4.
6
3.8
17
.1
14.8
8.
7
8.4
14
.7
13.9
Hun
gary
12
.2
13.2
+2
6.2
8.
4+2
9.
7
5.4
+2
17.1
12
.5+2
6.
0
4.7
+2
19.6
17
.2+2
Icel
and
11
.9
11.8
5.
3
5.5
10
.3
8.1
14
.9
9.2
4.
5
5.7
15
.0
14.6
Irel
and
15
.4
17.2
7.
8
7.0
4.
6
4.7
22
.3
17.7
6.
5
6.1
14
.3
13.8
Ital
y
13
.0
14.6
6.
5
6.8
7.
2
6.1
20
.3
18.3
5.
9
4.3
17
.4
15.7
Japa
n*
9.
8
11.5
7.
3
6.6
8.
4
6.9
12
.5
11.5
6.
3
5.3
12
.0
9.9
Kore
a
Irel
and
Ital
y
Japa
n*
Kore
a
Icel
and
Aus
tral
ia*
Aus
tria
Bel
gium
Can
ada*
Cze
ch R
epub
lic
Den
mar
k
Finl
and
Fran
ce*
Ger
man
y
Gre
ece
Hun
gary
VI
Cont
ribu
tion
to
tota
l eco
nom
y
% o
f to
tal v
alue
add
ed
Who
lesa
le a
nd r
etai
l tra
de,
rest
aura
nts
and
hote
lsTr
ansp
ort,
sto
rage
and
co
mm
unic
atio
nFi
nanc
e an
d in
sura
nce
Rea
l est
ate,
ren
ting
and
bu
sine
ss s
ervi
ces
Publ
ic a
dmin
istr
atio
n an
d de
fenc
eEd
ucat
ion,
hea
lth, s
ocia
l wor
k an
d ot
her
serv
ices
III
IIIIV
V
2005
1995
2005
1995
2005
1995
2005
1995
2005
1995
2005
1995

21
11.4
13
.1
10.3
8.
2
24.2
22
.1
20.0
17
.2
5.6
5.
6
11.9
11
.1Lu
xem
bour
g
21
.0-1
22
.1
10.5
-1
10.6
3.
4-1
7.
0
16.8
-1
17.4
4.
4-1
3.
8
15.6
-1
15.1
Mex
ico
14
.5
14.8
7.
1
6.9
7.
4
6.3
20
.0
17.9
7.
3
7.9
17
.3
15.3
Net
herl
ands
15
.7-1
16
.0
7.4
-1
8.3
6.
6-1
5.
8
21.7
-1
19.6
4.
4-1
5.
0
13.8
-1
11.3
New
Zea
land
*
9.
4
12.3
7.
5
10.0
3.
9
4.4
14
.0
13.1
4.
4
6.1
16
.2
16.9
Nor
way
8.
4
7.2
7.
2
6.3
4.
1
2.6
13
.7
10.0
6.
2
6.8
13
.1
11.8
Pola
nd
17
.6-1
17
.7
7.0
-1
6.5
6.
7-1
6.
3
14.4
-1
13.6
9.
1-1
8.
1
16.9
-1
13.6
Port
ugal
15
.7
14.0
10
.4
10.5
4.
2
5.7
14
.3
11.8
5.
6
5.2
9.
7
9.1
Slo
vak
Rep
ublic
18
.4
17.5
7.
1
7.0
4.
6
4.7
16
.4
13.6
6.
0
6.6
14
.9
14.4
Spai
n
12
.2-1
12
.5
8.0
-1
8.1
4.
5-1
4.
4
19.8
-1
17.9
5.
5-1
5.
9
20.7
-1
18.1
Swed
en
15
.3-1
..
6.4
-1..
13
.8-1
..
17.4
-1..
10
.6-1
..
8.7
-1..
Swit
zerl
and
20
.9
20.5
15
.0
12.7
4.
5
4.2
4.
7
3.2
10
.0
8.0
4.
2
3.9
Turk
ey*
14
.5
13.7
7.
1
7.7
8.
3
6.4
23
.4
18.1
4.
8
5.8
17
.8
15.7
Uni
ted
King
dom
13
.1
13.3
5.
6
6.4
7.
9
6.8
24
.3
21.9
8.
7
9.4
16
.5
16.0
Uni
ted
Stat
es*
*A
ddit
iona
l inf
orm
atio
n, in
clud
ing
foot
note
s, a
re a
vaila
ble
via
the
Stat
Link
URL
So
urce
s:N
atio
nal A
ccou
nts
of O
ECD
Cou
ntri
es,
OEC
D, P
aris
, 200
6;
..N
ot a
vaila
ble
or n
ot a
pplic
able
.ST
AN
: OEC
D S
truc
tura
l Ana
lysi
s St
atis
tics,
200
5, O
ECD
;
-nN
atio
nal s
ourc
es.
21
Dat
a in
thi
s ce
ll ar
e fr
om n
yea
rs e
arlie
r (la
ter,
if +
n) th
an t
he r
efer
ence
yea
r. E
.g. i
f the
co
lum
n re
fers
to 2
007,
a d
ata
poin
t with
'-1'
att
ache
d re
fers
to
2006
.
12
htt
p://
dx.d
oi.o
rg/1
0.17
87/4
6740
3482
436
Spai
n
Swed
en
Swit
zerl
and
Turk
ey*
Uni
ted
King
dom
Uni
ted
Stat
es*
Slo
vak
Rep
ublic
Luxe
mbo
urg
Mex
ico
Net
herl
ands
New
Zea
land
*
Nor
way
Pola
nd
Port
ugal

22
Ec
onom
y >
Tran
spor
t, 2
006
22
17
0.2
-1
168.
6-1
....
33
8.8
-1
114.
0-1
11
.6-1
18
.2-1
27
0.9
-1
289.
2-1
30
0.8
-1- 1
8.9
..
8A
ustr
alia
21
.0
18.8
2.
4
7.7
49
.9--
9.
3..
....
9.
3- 2
8.9
52
.7
9A
ustr
ia
8.
6
45.7
8.
8
1.6
64
.6..
9.
6
17.1
10
9.4
12
6.5
13
6.1
- 21.
2
66.4
10
Belg
ium
30
6.6
13
4.4
-1
26.7
-1
121.
9
579.
0-1
19
.9-1
1.
4..
47
2.0
....
- 5.6
20
2.8
9
Cana
da
15
.8
50.4
0.
8
2.3
69
.2--
6.
9
9.5
69
.6
79.1
86
.1- 3
2.2
29
.2
10Cz
ech
Repu
blic
1.
9
11.5
--
4.9
18
.3..
5.
9
7.5
62
.4
69.9
75
.8- 4
0.5
6.
8
6D
enm
ark
11
.1
25.5
0.
1--
36
.6
2.7
3.
6
7.5
62
.5
70.0
73
.6- 1
6.8
8.
9
6Fi
nlan
d
40
.8
198.
8
9.0
21
.8
270.
4..
78
.8
44.9
72
3.8
76
8.7
84
7.5
- 44.
9
106.
8
8Fr
ance
10
7.0
33
0.0
64
.0
15.8
51
6.8
..
79.0
66
.2
869.
0
935.
2 1
014
.2- 4
1.9
42
7.4
6
Ger
man
y
0.
7
16.5
----
17
.2..
1.
8
6.1
36
.2
42.3
44
.1- 2
3.2
22
.3
15G
reec
e
10
.2
12.4
1.
9
5.8
30
.3--
9.
6
17.6
46
.9
64.5
74
.1- 4
.9
29.3
13
Hun
gary
--..
----
..
0.1
--
0.6
4.
9
5.5
5.
5
210.
0
1.4
10
Icel
and
0.
2
17.7
----
17
.9
2.0
1.
9..
....
1.
9- 1
9.4
8.
9
9Ir
elan
d
20
.9
168.
7
0.1
11
.1
200.
8
37.1
-1
48.2
98
.7
708.
0
806.
7
854.
9- 1
5.2
33
8.6
10
Ital
y
23
.2
346.
5..
..
369.
7
207.
8
395.
6
84.1
83
3.9
91
7.9
1 3
13.6
- 37.
7 1
104
.6
6Ja
pan
10
.6
100.
9-1
....
11
1.0
-1
26.6
-1
19.1
58
.2-1
14
2.6
-1
200.
8-1
21
9.9
-1- 5
6.5
34
6.6
13
Kore
a
0.
4
0.6
0.
4--
1.
4--
0.
3..
....
0.
3- 4
9.3
1.
2
8Lu
xem
bour
g
73
.7
209.
4--
..
283.
1..
0.
1
437.
0..
43
7.0
43
7.1
....
..M
exic
o
Irel
and
Ital
y
Japa
n
Kore
a
Luxe
mbo
urg
Mex
ico
Tota
l inl
and
frei
ght
Coas
tal
ship
ping
Inla
nd
wat
erw
ays
Oil
pipe
lines
Icel
and
Aus
tral
ia
Aus
tria
Belg
ium
Cana
da
Czec
h Re
publ
ic
Den
mar
k
Finl
and
Fran
ce
Ger
man
y
Gre
ece
Hun
gary
Rail
Road
s
Frei
ght t
rans
port
Pass
enge
r tra
nspo
rtRo
ad a
ccid
ents
Billi
on to
nne-
kilo
met
res
Billi
on p
asse
nger
-kilo
met
res
Kille
d an
d in
jure
d,
thou
sand
s
Kille
d pe
r 10
0 00
0 po
pula
tion
Tota
l pa
ssen
gers
2006
/ 1
996
% o
f fa
talit
ies
com
pare
d
Priv
ate
cars
Tota
l roa
d tr
ansp
ort
Rail
Buse
s an
d co
ache
s

23
6.3
33
.4
43.6
5.
8
89.1
..
15.4
15
.6
148.
0
163.
6
179.
0- 3
8.1
29
.3
4N
ethe
rlan
ds
3.
9-2
18
.5--
--
18.5
----
----
----
- 23.
5
15.6
9
New
Zea
land
2.
4
16.1
--
4.5
23
.0
24.3
3.
3
5.9
51
.8
57.7
61
.0- 5
.1
10.9
5
Nor
way
53
.6
136.
5
1.2
25
.6
216.
9..
18
.6
28.1
21
9.2
24
7.4
26
5.9
- 17.
5
64.4
14
Pola
nd
2.
5
17.6
----
20
.1..
3.
9
10.6
86
.6
97.2
10
1.1
- 59.
5
48.0
9
Port
ugal
10
.0
22.1
0.
9--
33
.0--
2.
2
7.7
26
.3
34.0
36
.2..
....
Slov
ak R
epub
lic
11
.6
235.
8--
9.
2
256.
6
47.4
22
.1
49.4
34
0.9
39
0.3
41
2.4
- 25.
2
147.
6
9Sp
ain
14
.4
35.5
----
49
.8
7.2
9.
6
8.7
97
.0
105.
7
115.
3- 1
7.1
27
.1
5Sw
eden
12
.3
25.4
0.
1
0.2
38
.1--
17
.0
5.3
88
.1
93.5
11
0.4
- 39.
9
27.1
5
Switz
erla
nd
9.
5
173.
7--
2.
4
185.
6..
5.
3..
..
182.
2
187.
4..
....
Turk
ey
22
.1
167.
1
0.2
11
.2
200.
5..
46
.5
46.1
67
5.8
72
1.9
76
8.4
- 12.
1
267.
6
5U
nite
d Ki
ngdo
m
2 5
31.3
-1 1
888
.2-1
40
0.6
-1
835.
1-1
5 6
55.2
-1
384.
7-1
8.
7-1
22
6.8
-1 4
297
.2-1
4 5
24.0
-1 4
532
.6-1
1.
5 2
617
.4
14U
nite
d St
ates
1 9
50.8
19
8.8
86
.7 1
153
.8 3
390
.1
7.6
17
7.8
84
.3..
84
.3
262.
2..
....
Russ
ian
Fede
rati
on
Sour
ces:
..N
ot a
vaila
ble.
Tren
ds in
the
Tra
nspo
rt S
ecto
r, E
CMT,
Par
is, 2
007;
--N
ot a
pplic
able
.IR
TAD
: ww
w.ir
tad.
net.
-n
23
Russ
ian
Fede
rati
on
12
htt
p://
dx.d
oi.o
rg/1
0.17
87/4
6742
5371
234
Dat
a in
thi
s ce
ll ar
e fr
om n
yea
rs e
arlie
r th
an t
he re
fere
nce
year
. E.g
. if t
he c
olum
n re
fers
to
2007
, a d
ata
poin
t with
'-1'
att
ache
d re
fers
to
2006
.
Spai
n
Swed
en
Switz
erla
nd
Turk
ey
Uni
ted
King
dom
Uni
ted
Stat
es
Slov
ak R
epub
lic
Net
herl
ands
New
Zea
land
Nor
way
Pola
nd
Port
ugal

24
En
ergy
> S
uppl
y, 2
006
24
12
2.47
21
.2
0.25
- 13.
6-
-
53.7
5
32.1
38
.76
4.
0
23.4
3
39.4
6.
54
3.7
Aus
tral
ia
34
.23
18
.7
0.16
- 5.0
--
4.
02
15.6
14
.38
16
.0
7.46
9.
9
8.37
35
.8A
ustr
ia
60
.99
3.
2
0.24
- 17.
8
12.1
6
7.6
4.
78- 4
2.2
24
.45
- 2.3
14
.99
26
.9
4.62
72
.5Be
lgiu
m
26
9.74
13
.8
0.32
- 19.
0
25.5
3
5.3
27
.53
6.
3
95.3
4
20.1
79
.47
12
.8
41.8
8
12.6
Cana
da
46
.05
8.
9
0.64
- 17.
7
6.81
10
3.5
20
.83
- 7.7
9.
84
19.7
7.
57
0.4
1.
01
59.1
Czec
h Re
publ
ic
20
.93
- 7.4
0.
12- 2
5.3
--
5.
48- 3
8.5
8.
26- 1
4.3
4.
54
21.5
2.
66+
Den
mar
k
37
.44
19
.1
0.26
- 17.
7
5.97
17
.6
7.36
0.
9
10.5
7
11.8
3.
87
30.6
9.
66
45.6
Finl
and
27
2.67
7.
1
0.19
- 14.
7
117.
32
13.3
13
.20
- 20.
5
90.7
1
1.7
39
.61
21
.2
11.8
3- 6
.1Fr
ance
34
8.56
- 1.3
0.
17- 1
4.8
43
.59
4.
5
82.2
7- 9
.3
123.
55- 1
0.6
79
.47
5.
6
19.6
8
165.
5G
erm
any
31
.12
28
.5
0.19
- 14.
0-
-
8.39
5.
6
17.8
3
21.4
2.
75+
2.
15
40.4
Gre
ece
27
.59
5.
3
0.45
- 31.
7
3.52
- 5.1
3.
08- 3
3.9
7.
62
10.3
11
.45
11
.9
1.92
17
6.1
Hun
gary
4.
33
75.1
0.
40
15.6
--
0.
08
21.2
0.
99
25.1
--
3.
26
101.
7Ic
elan
d
15
.46
32
.6
0.12
- 33.
9-
-
2.40
- 17.
0
8.47
42
.2
4.01
51
.4
0.57
26
3.9
Irel
and
18
4.17
14
.6
0.16
- 0.4
--
16
.67
48
.3
81.1
9- 1
1.5
69
.17
50
.2
17.1
4
45.9
Ital
y
52
7.56
3.
1
0.10
- 7.5
79
.07
0.
4
112.
41
29.1
24
0.57
- 12.
0
77.4
4
37.8
18
.06
8.
7Ja
pan
21
6.50
34
.6
0.32
- 11.
4
38.7
6
101.
2
52.6
1
83.4
93
.61
- 7.2
28
.70
16
3.0
2.
81
162.
1Ko
rea
4.
71
38.2
0.
18- 1
8.0
--
0.
11- 7
7.2
2.
98
61.0
1.
23
101.
9
0.39
- 16.
2Lu
xem
bour
g
17
7.43
31
.0
0.27
- 7.8
2.
83
37.9
8.
74
39.9
10
0.74
20
.2
48.5
6
74.8
16
.56
6.
9M
exic
o
80
.12
5.
2
0.19
- 18.
5
0.90
- 16.
6
7.78
- 16.
1
32.4
0
24.3
34
.25
- 8.5
4.
78
106.
6N
ethe
rlan
ds
17
.54
5.
3
0.28
- 20.
5-
-
2.09
77
.2
6.91
14
.3
3.28
- 25.
4
5.26
4.
4N
ew Z
eala
nd
26
.09
12
.7
0.14
- 13.
2-
-
0.71
- 29.
0
8.87
7.
2
4.74
58
.8
11.7
7
8.2
Nor
way
Irel
and
Ital
y
Japa
n
Kore
a
Luxe
mbo
urg
Mex
ico
Net
herl
ands
New
Zea
land
Nor
way
Icel
and
Aus
tral
ia
Aus
tria
Belg
ium
Cana
da
Czec
h R
epub
lic
Den
mar
k
Finl
and
Fran
ce
Ger
man
y
Gre
ece
Hun
gary
Prim
ary
ener
gy s
uppl
y1
Tota
lN
ucle
arCo
al a
nd p
eat
Oil
Nat
ural
gas
Oth
er2
Mto
e3%
Cha
nge
2006
/199
6 M
toe3
% C
hang
e 20
06/1
996
Mto
e3%
Cha
nge
2006
/199
6 M
toe3
% C
hang
e 20
06/1
996
Mto
e3%
Cha
nge
2006
/199
6 M
toe3
% C
hang
e 20
06/1
996
Ener
gy
inte
nsit
y4
% C
hang
e 20
06/1
996

25
97.7
2- 5
.9
0.46
- 37.
8-
-
57.1
7- 2
0.8
23
.56
31
.5
12.3
7
31.0
4.
62
8.8
Pola
nd
25
.43
24
.0
0.21
- 0.3
--
3.
31- 3
.5
13.6
9
3.7
3.
64-
4.
79
23.3
Port
ugal
18
.68
3.
1
0.67
- 31.
1
4.75
62
.0
4.46
- 16.
4
3.42
2.
3
5.38
- 2.2
0.
68- 3
2.9
Slov
ak R
epub
lic
14
4.56
42
.5
0.20
- 2.2
15
.67
6.
7
17.8
7
11.2
70
.84
29
.4
31.0
1
258.
9
9.16
25
.3Sp
ain
51
.31
- 1.5
0.
18- 2
8.2
17
.45
- 9.8
2.
69- 1
1.2
14
.62
- 8.4
0.
88
9.1
15
.67
21
.1Sw
eden
28
.21
11
.4
0.10
- 7.8
7.
28
10.7
0.
16
9.8
12
.97
3.
3
2.71
13
.9
5.10
39
.0Sw
itzer
land
94
.00
39
.8
0.36
- 6.0
--
26
.45
39
.9
31.3
6
4.0
25
.97
27
1.8
10
.22
- 8.9
Turk
ey
23
1.13
- 1.0
0.
14- 2
5.2
19
.66
- 20.
3
41.2
9- 6
.8
83.8
0- 1
.5
81.0
4
6.7
5.
33
57.7
Uni
ted
King
dom
2 3
20.7
0
8.5
0.
21- 2
0.3
21
2.71
14
.1
550.
96
10.0
93
7.12
13
.1
501.
27- 0
.3
118.
64- 1
.0U
nite
d St
ates
4 1
54.5
2
6.8
0.
18- 1
5.4
49
7.89
8.
4
844.
33
8.7
1 6
52.2
8
4.2
92
7.48
7.
9
232.
55
11.4
G7
1 8
22.4
9
5.8
0.
19- 1
6.8
25
8.12
6.
9
324.
40- 1
0.3
66
8.27
1.
2
437.
76
19.4
13
3.93
43
.7EU
27
5 5
37.4
2
9.8
0.
19- 1
4.7
61
4.00
11
.9 1
138
.65
8.
5 2
209
.42
5.
7 1
210
.25
16
.4
365.
11
15.9
OEC
D to
tal
22
4.13
32
.2
0.29
3.
0
3.58
46
6.2
12
.79
5.
0
90.1
3
14.5
17
.50
27
7.0
10
0.12
36
.5Br
azil
1 8
78.7
4
72.9
0.
90- 2
7.9
14
.29
28
2.5
1 2
06.9
8
79.5
34
4.00
99
.9
47.3
6
206.
4
266.
12
19.4
Chin
a
56
5.82
41
.3
0.80
- 25.
1
4.85
10
5.1
22
2.77
53
.6
136.
08
53.1
31
.39
89
.5
170.
72
15.7
Indi
a
67
6.20
8.
6
1.81
- 32.
8
41.1
2
42.9
10
6.74
- 10.
2
139.
24
0.6
35
8.61
12
.7
30.5
0
65.1
Russ
ian
Fede
ratio
n
12
9.81
22
.4
0.77
- 12.
4
3.07
-
93.0
9
17.2
16
.16
50
.4
3.82
14
7.3
13
.68
21
.3So
uth
Afr
ica
1.So
urce
s:En
ergy
Bal
ance
s of
OEC
D C
ount
ries
, IE
A, P
aris
, 200
8;2.
Ener
gy B
alan
ces
of N
on-O
ECD
Cou
ntrie
s, I
EA, P
aris
, 200
8;M
ain
Econ
omic
Indi
cato
rs,
OEC
D, P
aris
, 200
8.3. 4. -
Nil
or n
eglig
ible
.
+G
row
th o
f mor
e th
an 5
00%
25
Tota
l prim
ary
ener
gy s
uppl
y (in
Mto
e) d
ivid
ed b
y G
DP
(in c
onst
ant p
rices
, 200
0 U
SD).
Russ
ian
Fede
ratio
n
Sout
h Af
rica
12
htt
p://
dx.d
oi.o
rg/1
0.17
87/4
6747
5472
065
Thes
e fig
ures
are
bas
ed o
n an
ass
umpt
ion
of 1
00%
eff
icie
ncy
for
hydr
o-el
ectr
ic, 3
3% fo
r nu
clea
r an
d ap
prox
imat
ely
10%
for g
eoth
erm
al p
lant
s.In
clud
es h
ydro
, geo
ther
mal
, sol
ar, w
ind,
com
bust
ible
ren
ewab
les,
was
te a
nd in
tern
atio
nal t
rade
in
ele
ctric
it y.
Mill
ion
tonn
es o
f oil
equi
vale
nt.
Indi
a
Spai
n
Swed
en
Switz
erla
nd
Turk
ey
Uni
ted
King
dom
Uni
ted
Stat
es
G7
EU27
OEC
D t
otal
Braz
il
Chin
a
Slov
ak R
epub
lic
Pola
nd
Port
ugal

26
En
ergy
> P
rod
ucti
on, 2
006
126
26
7.79
41
.1-
-
201.
36
54.9
23
.08
- 17.
2
36.8
3
43.6
6.
53
3.7
Aus
tral
ia
9.
93
15.0
--
--
99.9
1.
00- 5
.9
1.56
23
.2
7.37
21
.9A
ustr
ia
15
.48
12
.5
12.1
6
7.6
0.
02-
93.9
--
--
3.
31
49.7
Belg
ium
41
1.74
14
.9
25.5
3
5.3
32
.54
- 21
.8
155.
30
32.9
15
4.86
14
.6
43.5
1
7.6
Cana
da
33
.42
2.
9
6.81
10
3.5
23
.73
- 15
.6
0.41
92
.5
0.15
- 19.
1
2.33
26
9.4
Czec
h R
epub
lic
29
.57
67
.4-
--
-
17.2
9
67.5
9.
32
63.2
2.
96
81.3
Den
mar
k
18
.05
32
.6
5.97
17
.6
3.22
45
.5
0.09
--
-
8.76
38
.6Fi
nlan
d
13
7.02
3.
5
117.
32
13.3
0.
28-
94.7
1.
10- 5
7.6
1.
06- 5
6.0
17
.26
- 6.8
Fran
ce
13
6.76
- 4.5
43
.59
4.
5
53.3
7-
27.8
4.
55
31.9
14
.05
- 13.
9
21.2
0
169.
4G
erm
any
10
.03
10
.0-
-
8.14
13
.2
0.09
- 81.
6
0.03
- 43.
9
1.78
26
.1G
reec
e
10
.33
- 21.
4
3.52
- 5.
1
1.76
- 45
.3
1.36
- 35.
6
2.38
- 33.
9
1.31
15
9.0
Hun
gary
3.
26
101.
7-
--
--
--
-
3.26
10
1.7
Icel
and
1.
60- 5
4.9
--
0.
77-
36.3
--
0.
41- 8
1.1
0.
42
149.
2Ir
elan
d
27
.43
- 9.4
--
0.
01-
61.1
6.
10
9.3
8.
99- 4
5.0
12
.32
48
.6It
aly
10
1.07
- 0.7
79
.07
0.
4-
-
0.74
- 13.
3
3.19
57
.0
18.0
6
8.7
Japa
n
43
.73
94
.4
38.7
6
101.
2
1.21
- 43
.8
0.57
-
0.39
-
2.79
16
0.7
Kore
a
0.
08
105.
6-
--
--
--
-
0.08
10
5.6
Luxe
mbo
urg
25
5.97
20
.7
2.83
37
.9
5.51
13
.5
190.
48
17.4
40
.52
47
.9
16.6
2
7.4
Mex
ico
60
.77
- 17.
9
0.90
- 16.
6-
-
2.08
- 34.
7
55.3
8- 1
8.9
2.
41
71.8
Net
herl
ands
13
.05
- 6.6
--
3.
47
64.5
1.
04- 5
7.2
3.
28- 2
5.4
5.
26
4.4
New
Zea
land
22
2.94
7.
6-
-
1.61
+
131.
28- 1
8.0
78
.39
11
3.3
11
.65
15
.4N
orw
ay
77
.88
- 21.
3-
-
67.5
6-
25.7
0.
81
105.
5
3.88
23
.6
5.63
24
.4Po
land
Net
herl
ands
New
Zea
land
Nor
way
Pola
nd
Can
ada
Cze
ch R
epub
lic
Mex
ico
Finl
and
Fran
ce
Ger
man
y
Gre
ece
Hun
gary
Icel
and
Irel
and
Ital
y
Japa
n
Kore
a
Luxe
mbo
urg
Den
mar
k
% C
hang
e 20
06/1
996
Mto
e3%
Cha
nge
2006
/199
6 M
toe3
% C
hang
e 20
06/1
996
Aus
tral
ia
Aus
tria
Bel
gium
Nat
ural
gas
Oth
er2
Mto
e3%
Cha
nge
2006
/199
6 M
toe3
% C
hang
e 20
06/1
996
Tota
lN
ucle
arCo
al a
nd p
eat
Oil
Mto
e3%
Cha
nge
2006
/199
6 M
toe3

27
4.33
14
.0-
--
--
--
-
4.33
14
.0Po
rtug
al
6.
62
33.0
4.
75
62.0
0.
56- 4
5.3
0.
23
215.
0
0.18
- 27.
2
0.91
28
.3Sl
ovak
Rep
ublic
31
.36
- 4.1
15
.67
6.
7
6.05
- 38.
6
0.14
- 72.
9
0.05
- 87.
2
9.44
30
.8Sp
ain
32
.79
2.
5
17.4
5- 9
.8
0.19
- 10.
7-
--
-
15.1
5
22.1
Swed
en
12
.15
17
.7
7.28
10
.7-
--
--
-
4.87
30
.0Sw
itzer
land
26
.33
- 2.9
--
13
.08
6.
7
2.13
- 38.
3
0.74
33
9.3
10
.37
- 7.7
Turk
ey
18
6.62
- 30.
6
19.6
6- 2
0.3
10
.68
- 64.
7
80.0
1- 4
1.3
71
.99
- 5.1
4.
28
120.
9U
nite
d Ki
ngdo
m
1 6
54.2
3- 1
.9
212.
71
14.1
57
6.76
5.
4
317.
81- 1
9.8
43
0.93
- 1.8
11
6.03
- 0.4
Uni
ted
Stat
es
2 6
54.8
6- 2
.4
497.
89
8.4
67
3.64
- 4.0
56
5.61
- 14.
6
685.
06- 0
.3
232.
66
10.7
G7
88
1.42
- 10.
9
258.
12
6.9
19
1.29
- 29.
5
120.
97- 3
0.1
17
9.35
- 14.
5
131.
68
41.3
EU27
3 8
42.3
1
2.1
61
4.00
11
.9 1
011
.86
1.
4
937.
70- 9
.5
918.
56
6.0
36
0.20
14
.8O
ECD
tota
l
20
6.72
75
.1
3.58
46
6.2
2.
30
21.8
92
.79
12
5.3
9.
35
101.
4
98.6
9
41.6
Braz
il
1 7
49.2
9
59.4
14
.29
28
2.5
1 2
34.4
5
77.2
18
4.85
17
.5
48.9
9
191.
1
266.
71
19.5
Chin
a
43
5.64
27
.7
4.85
10
5.1
19
7.90
43
.6
39.0
0
5.3
23
.41
41
.3
170.
48
15.7
Indi
a
1 2
19.9
8
28.0
41
.12
42
.9
143.
25
27.8
47
8.13
55
.9
525.
72
8.3
31
.75
58
.1Ru
ssia
n Fe
dera
tion
15
8.68
17
.5
3.07
-
138.
26
17.2
1.
45
262.
2
1.62
5.
2
14.2
7
19.3
Sout
h A
fric
a
1.So
urce
s:En
ergy
Bal
ance
s of
OEC
D C
ount
ries
, IE
A, P
aris
, 200
8;
2.En
ergy
Bal
ance
s of
Non
-OEC
D C
ount
ries
, IE
A, P
aris
, 200
8.
3. -N
il or
neg
ligib
le.
+G
row
th o
f mor
e th
an 5
00%
27
12
htt
p://
dx.d
oi.o
rg/1
0.17
87/4
6747
5620
526
Thes
e fig
ures
are
bas
ed o
n an
ass
umpt
ion
of 1
00%
eff
icie
ncy
for
hydr
o-e
lect
ric,
33%
for
nucl
ear
and
appr
oxim
atel
y 10
% fo
r ge
othe
rmal
pla
nts.
Incl
udes
hyd
ro, g
eoth
erm
al, s
olar
, win
d, c
ombu
stib
le r
enew
able
s, w
aste
and
inte
rnat
iona
l tr
ade
in e
lect
rici
ty.
Mill
ion
tonn
es o
f oil
equi
vale
nt.
G7
EU27
OEC
D t
otal
Bra
zil
Chin
a
Indi
a
Rus
sian
Fed
erat
ion
Sout
h A
fric
a
Uni
ted
Stat
es
Port
ugal
Slov
ak R
epub
lic
Spai
n
Swed
en
Switz
erla
nd
Turk
ey
Uni
ted
King
dom

28
E
ner
gy
> E
ner
gy
con
sum
pti
on
and
ele
ctri
city
gen
erat
ion
, 200
628
77
.73
17
.5
30.2
5
17.0
29
.50
13
.4
17.9
8
25.7
25
1.3
41
.7A
ustr
alia
27
.97
18
.8
9.52
28
.8
8.05
35
.3
10.4
0
1.9
60
.7
13.3
Aus
tria
43
.55
2.
1
19.7
8
12.0
9.
67
7.0
14
.10
- 11
.6
84.4
12
.3B
elgi
um
20
1.51
11
.0
78.9
2
13.9
56
.68
13
.2
65.9
1
6.0
61
2.5
6.
9C
anad
a
28
.35
5.
2
11.5
3-
14.2
6.
50
66.5
10
.32
7.
5
83.7
31
.1C
zech
Rep
ubl
ic
15
.93
1.
1
3.18
- 3.
8
5.37
15
.3
7.38
- 5.
3
45.7
- 14
.7D
enm
ark
27
.14
18
.0
13.7
1
28.7
4.
97
22.6
8.
46
2.1
82
.3
18.6
Finl
and
17
3.95
6.
9
46.8
0-
5.7
51
.23
11
.4
75.9
2
13.0
56
9.2
11
.8Fr
ance
25
3.57
2.
5
81.7
7
8.7
63
.67
- 0.
2
108.
13-
0.3
62
9.4
14
.3G
erm
any
22
.31
28
.9
5.01
7.
0
8.56
29
.3
8.74
45
.5
60.2
41
.9G
reec
e
20
.08
13
.8
5.59
4.
8
4.72
77
.0
9.77
1.
4
35.9
2.
2H
unga
ry
2.
56
38.7
1.
01
88.8
0.
48
52.3
1.
06
7.2
9.
9
93.8
Icel
and
13
.40
51
.1
3.04
22
.1
5.38
10
0.6
4.
97
34.6
27
.7
46.3
Irel
and
14
4.57
17
.1
46.4
1
7.9
44
.59
13
.4
53.5
7
30.3
30
7.7
28
.5It
aly
35
1.79
2.
5
139.
36-
2.1
91
.90
- 2.
4
120.
53
13.0
1 0
90.6
11
.1Ja
pan
14
5.08
25
.8
71.6
8
45.1
32
.87
12
.4
40.5
4
10.7
40
2.3
98
.5K
orea
4.
42
41.7
1.
04
0.1
2.
63
93.5
0.
75
3.6
3.
5+
Luxe
mbo
urg
11
3.43
20
.6
36.6
7-
2.3
51
.00
49
.3
25.7
6
15.3
24
9.7
48
.4M
exic
o
61
.25
6.
1
23.7
0
18.5
15
.68
21
.7
21.8
7-
12.0
98
.4
15.6
Net
her
lan
ds
13
.13
11
.7
4.22
- 15
.3
5.76
35
.2
3.15
25
.4
43.5
20
.0N
ew Z
eala
nd
20
.78
7.
3
8.68
10
.0
5.12
12
.7
6.98
0.
7
121.
3
16.1
No
rway
Net
herl
ands
New
Zea
lan
d
No
rway
Cze
ch R
epub
lic
Mex
ico
Fin
land
Fran
ce
Ger
man
y
Gre
ece
Hun
gary
Icel
and
Irel
and
Ital
y
Japa
n
Kore
a
Luxe
mbo
urg
Mto
e3
Aus
tral
ia
Aus
tria
Bel
giu
m
Can
ada
% C
hang
e 20
06/1
996
Den
mar
k
Fina
l ene
rgy
cons
umpt
ion
by
sect
or1
Tota
l ele
ctri
city
gen
erat
ion
Tota
lIn
dust
ryTr
ansp
ort
Oth
er
TWh2
% C
hang
e 20
06/1
996
Mto
e3%
Cha
nge
2006
/199
6 M
toe3
% C
hang
e 20
06/1
996
Mto
e3%
Cha
nge
2006
/199
6

29
64.5
1-
6.1
20
.99
- 21.
5
13.9
8
49.9
29
.54
- 9.4
16
0.8
13
.9Po
lan
d
20
.44
25
.2
7.50
11
.9
7.22
39
.1
5.72
29
.2
48.6
41
.1P
ort
uga
l
11
.43
- 0.
2
4.77
- 2.
7
2.25
74
.6
4.40
- 16
.2
31.3
22
.8Sl
ova
k R
epu
blic
10
3.93
45
.1
37.0
3
43.8
41
.17
46
.5
25.7
3
44.9
29
9.1
72
.5Sp
ain
34
.99
- 6.
6
14.3
3-
7.9
8.
77
13.5
11
.89
- 16
.1
143.
3
1.9
Swed
en
22
.24
8.
8
4.71
18
.0
7.13
11
.3
10.4
0
3.5
62
.1
10.4
Swit
zerl
and
73
.45
41
.8
28.6
0
54.7
15
.60
21
.3
29.2
6
43.0
17
6.3
85
.8Tu
rkey
15
8.73
-
41.5
2-
6.5
56
.24
14
.0
60.9
8- 6
.1
394.
5
12.9
Uni
ted
King
dom
1 5
72.1
6
9.5
44
1.72
5.
6
648.
83
15.8
48
1.61
5.
3 4
274
.3
17.1
Uni
ted
Stat
es
2 8
56.2
8
7.6
87
6.50
4.
1 1
013
.14
12
.2
966.
64
6.5
7 8
78.1
14
.9G
7
1 2
88.0
9
7.7
41
8.51
3.
1
374.
38
19.0
49
5.20
4.
1 3
323
.1
18.2
EU27
3 8
24.3
8
10.0
1 2
43.0
4
7.5
1 3
05.5
0
15.9
1 2
75.8
4
6.9
10
459.
8
20.1
OEC
D t
otal
18
0.55
32
.0
85.4
6
44.1
55
.21
21
.8
39.8
8
24.0
41
9.3
44
.0B
razi
l
1 2
01.8
5
48.1
62
5.89
59
.7
126.
48
138.
1
449.
47
22.7
2 8
64.2
16
5.2
Chi
na
37
8.49
29
.7
146.
40
45.6
39
.04
31
.9
193.
04
19.5
74
4.1
70
.4In
dia
43
1.73
2.
5
175.
20
8.8
96
.97
25
.6
159.
56-
12.7
99
3.9
17
.5R
uss
ian
Fede
rati
on
64
.08
17
.9
25.4
2
0.7
16
.27
28
.6
22.3
9
35.9
25
1.9
26
.3So
uth
Afr
ica
1.So
urce
s:2.
Ener
gy B
alan
ces
of O
ECD
Co
untr
ies,
IEA
, Par
is, 2
008;
3.En
ergy
Bal
ance
s o
f No
n-O
ECD
Cou
ntri
es,
IEA
, Par
is, 2
008.
-N
il o
r ne
glig
ible
.
+G
row
th o
f m
ore
than
500
%
29
12
htt
p:/
/dx.
doi.o
rg/1
0.17
87/4
6748
0256
804
Incl
udin
g no
n-en
ergy
use
.Te
raw
att
hour
s, e
xclu
ding
out
put
fro
m p
umpe
d st
ora
ge p
lant
s.M
illio
n to
nnes
of o
il eq
uiv
alen
t.
G7
EU27
OEC
D t
ota
l
Bra
zil
Chi
na
Indi
a
Rus
sian
Fed
erat
ion
Sout
h A
fric
a
Uni
ted
Stat
es
Pola
nd
Port
ugal
Slo
vak
Rep
ublic
Spai
n
Swed
en
Swit
zerl
and
Turk
ey
Uni
ted
Kin
gdo
m

30
La
bour
> E
mpl
oym
ent
30
10
765
17
.3
69.4
64
.9 1
0 19
0
22.2
3.
5
5.0
21
.4
22.4
75
.1
72.6
25
.7
25.2
Aus
tral
ia
4 1
24
6.6
67
.3
61.5
3 9
18
6.5
5.
5
7.3
28
.2
32.7
66
.2
60.0
16
.2
12.5
Aus
tria
4 6
47
7.4
59
.9
56.9
4 2
64
14.1
2.
0
2.4
24
.7
25.9
73
.4
71.8
12
.3
9.6
Belg
ium
17
654
18
.3
73.2
67
.5 1
6 48
4
22.8
2.
6
4.0
22
.0
21.8
75
.4
74.2
21
.2
19.2
Cana
da
5 1
99
0.5
63
.0
64.4
4 8
11- 2
.1
3.8
6.
2
40.1
42
.0
56.1
51
.8
1.9
..Cz
ech
Repu
blic
2 9
04
2.9
77
.0
74.1
2 7
59
6.4
3.
0
4.0
23
.6
27.0
73
.4
69.0
6.
0
4.3
Den
mar
k
2 6
70
5.9
73
.8
70.3
2 4
34
14.9
4.
7
7.5
25
.8
27.3
69
.6
65.2
3.
1
1.5
Finl
and
27
575
7.
7
64.2
61
.0 2
4 71
7
12.2
3.
4
4.5
22
.9
25.9
73
.8
69.7
12
.0
11.9
Fran
ce
41
521
5.
0
69.1
61
.9 3
6 97
8
3.8
2.
3
3.0
29
.8
35.4
67
.9
61.6
14
.9-1
11
.9+3
Ger
man
y
4 8
80
13.1
53
.8
46.5
4 4
53
15.1
12
.0
20.3
22
.0
22.9
65
.9
56.8
8.
3
4.8
Gre
ece
4 2
47
4.9
55
.2
49.6
3 8
87
9.3
4.
9
8.5
32
.7
33.5
62
.4
58.0
1.
7..
Hun
gary
17
5
18.4
81
.1
80.2
17
0
19.7
6.
3
9.5
21
.4
24.3
72
.3
66.2
....
Icel
and
2 1
14
40.2
62
.1
49.7
2 0
15
52.8
5.
6
10.7
27
.6
27.8
66
.8
61.4
13
.9
6.5
Irel
and
24
662
7.
4
51.2
43
.5 2
2 73
8
14.0
4.
3
6.4
30
.5
33.5
65
.2
60.0
8.
6
0.5
Ital
y
66
570
- 0.8
66
.2
62.6
63
820
- 1.6
4.
3
5.5
28
.0
33.3
67
.7
61.2
0.
3
0.1
Japa
n*
23
978
12
.6
58.8
54
.2 2
3 15
1
11.0
7.
7
11.1
26
.3
32.6
66
.0
56.2
1.
3
0.4
Kore
a*
33
0
45.4
89
.3
60.2
31
9
44.3
1.
3
2.0
20
.8
26.6
77
.9
71.4
44
.6
38.9
Luxe
mbo
urg
43
216
22
.3
46.7
41
.6 4
1 84
9
25.0
14
.1
21.8
27
.4
22.7
58
.5
55.5
0.
4-6
..M
exic
o
8 5
97
14.4
71
.0
60.1
8 2
61
18.3
3.
0
3.9
19
.2
22.4
77
.8
73.8
11
.0
8.3
Net
herl
ands
2 2
09
17.8
71
.6
68.1
2 1
17
20.8
7.
1
9.5
22
.3
24.7
70
.5
65.8
23
.8
19.9
+5N
ew Z
eala
nd
Fran
ce
Gre
ece
Hun
gary
Icel
and
Irel
and
Ital
y
Japa
n*
Kore
a*
Luxe
mbo
urg
Mex
ico
Net
herl
ands
New
Zea
land
Ger
man
y
Finl
and
Tota
l, th
ousa
nds
% c
hang
eA
gric
ultu
re, f
ores
try
and
fishi
ng
Den
mar
k
Cana
da
Czec
h Re
publ
ic
Bel
gium
Aus
tral
ia
Aus
tria
Tota
l lab
our
forc
e*Co
mpo
sitio
n
2006
1996
2006
1996
2006
200
6/96
2006
1996
Fem
ale
part
icip
atio
n ra
te*
Thou
sand
s,
2006
% c
hang
e,
2006
/96
Indu
stry
Serv
ices
Fore
ign-
born
labo
ur fo
rce
2006
1996
2006
1996
Civi
lian
empl
oym
ent*
% o
f tot
al la
bour
forc
e

31
2
446
9.
2
76.1
73
.9 2
345
11
.5
3.3
5.
1
20.9
23
.2
75.8
71
.7
7.8
4.
6-1
Nor
way
16
992
- 1.2
56
.5
60.5
14
594
- 2.5
15
.8
22.1
30
.0
31.7
54
.2
46.2
0.
3..
Pola
nd
5 5
87
16.7
72
.3
62.1
5 1
30
16.4
11
.8
12.4
30
.7
31.4
57
.5
56.2
7.
9
5.0
Port
ugal
2 6
55
5.8
60
.9
62.4
2 3
01
3.4
4.
4
8.9
38
.8
39.5
56
.8
51.6
0.
7..
Slov
ak R
epub
lic
21
585
29
.5
60.4
47
.1 1
9 66
0
53.4
4.
8
8.4
29
.7
29.8
65
.5
61.8
15
.1
2.7
Spai
n
4 6
71
6.1
76
.1
75.8
4 3
41
9.5
2.
0
2.9
22
.0
26.1
76
.0
71.0
13
.5
8.5
Swed
en
4 4
77
9.1
79
.8
73.8
4 3
04
9.0
3.
8
4.7
23
.8
27.4
72
.5
67.9
25
.4..
Switz
erla
nd
25
276
9.
0
27.3
33
.1 2
2 33
0
5.4
27
.3
43.7
25
.4
22.6
47
.3
33.7
....
Turk
ey
29
942
6.
4
69.0
66
.6 2
8 20
3
9.6
1.
3
2.0
22
.0
27.3
76
.7
70.8
11
.2
7.4
Uni
ted
King
dom
152
672
12
.9
69.9
69
.9 1
44 4
27
14.0
1.
5
2.8
19
.8
23.8
78
.7
73.3
15
.6
11.6
Uni
ted
Stat
es
360
596
8.
1
67.3
64
.2 3
37 3
67
9.4
2.
5
3.7
23
.7
28.1
73
.8
68.1
....
G7
185
808
9.
8
64.3
57
.8 1
70 1
89
14.2
3.
6
5.0
26
.3
29.9
70
.1
65.1
....
EU15
564
339
10
.1
62.1
59
.3 5
26 9
68
11.8
5.
5
8.3
24
.8
27.8
69
.7
63.9
....
OEC
D t
otal
*A
dditi
onal
info
rmat
ion,
incl
udin
g fo
otno
tes,
are
ava
ilabl
e vi
a th
e St
atLi
nk U
RL
Sour
ces:
Labo
ur F
orce
Sta
tist
ics:
198
6-20
06,
OEC
D, P
aris
, 200
7;..
Not
ava
ilabl
e or
not
app
licab
le.
Inte
rnat
iona
l Mi g
ratio
n O
utlo
ok: S
OPE
MI,
200
8 Ed
itio
n, O
ECD
, Par
is, 2
008.
-n
31
12
htt
p://
dx.d
oi.o
rg/1
0.17
87/4
6750
8228
555
Dat
a in
this
cel
l are
from
n y
ears
ear
lier
(late
r, if
+n)
than
the
ref
eren
ce y
ear.
E.g
. if t
he c
olum
n re
fers
to
2007
, a d
ata
poin
t w
ith '-
1' a
ttac
hed
refe
rs to
200
6.
OEC
D to
tal
Pola
nd
Port
ugal
Slov
ak R
epub
lic
Spai
n
Swed
en
Swit
zerl
and
Turk
ey
Uni
ted
King
dom
Uni
ted
Stat
es
G7
EU15
Nor
way

32
La
bo
ur >
Par
t-ti
me
and
sel
f-em
plo
ymen
t32
24
.1
24.2
+4
38.5
39
.5+4
12
.4
11.9
+4
71.6
72
.7+4
12
.9
15.1
Aus
tral
ia*
17
.2
10.8
31
.5
21.3
5.
2
2.6
83
.5
86.3
13
.6
14.0
Aus
tria
18
.3
15.0
32
.9
30.5
6.
3
4.4
81
.2
82.5
15
.1
18.8
Bel
gium
18
.2
19.1
26
.1
29.4
11
.0
10.5
68
.0
69.9
9.
1
11.1
Can
ada
3.
5
3.4
5.
9
5.5
1.
7
1.9
72
.3
69.1
16
.2
12.3
Czec
h R
epub
lic
17
.7
17.2
23
.9
24.5
12
.4
11.1
62
.8
64.6
8.
9
9.5
Den
mar
k
11
.7
9.3
15
.5
12.5
8.
2
6.4
63
.7
63.7
12
.9
15.3
Finl
and
13
.4
14.8
23
.1
25.8
5.
0
5.9
80
.3
77.9
9.
0
11.3
Fran
ce
22
.2
15.8
39
.2
31.4
7.
9
4.1
80
.7
85.1
12
.2
10.8
Ger
man
y
7.
8
8.3
13
.6
14.2
4.
1
4.9
67
.9
62.6
36
.3
45.7
Gre
ece
2.
8
2.9
4.
2
4.7
1.
6
1.5
68
.6
71.3
12
.8
18.1
Hun
gary
15
.9
22.4
25
.4
36.8
8.
0
10.1
72
.7
75.8
14
.8
18.2
Icel
and
20
.3
15.0
35
.6
27.6
7.
6
6.9
79
.6
71.8
16
.3
20.9
Irel
and
15
.1
11.3
29
.9
22.2
5.
4
5.1
78
.5
71.0
26
.7
29.3
Ital
y
18
.9
17.7
+5
32.6
30
.9+5
9.
2
8.6
+5
71.5
71
.3+5
13
.8
17.7
Japa
n*
8.
9
5.0
12
.5
7.7
6.
3
3.2
58
.9
62.9
32
.8
36.7
Kore
a*
13
.1
11.0
28
.8
26.2
1.
6
2.0
93
.1
88.8
6.
3
8.3
Luxe
mbo
urg
15
.1-3
15
.5
27.6
-3
29.3
8.
1-3
8.
5
65.1
-3
64.0
34
.5
40.1
Mex
ico
36
.1
29.1
60
.0
54.9
16
.2
11.1
75
.4
77.6
12
.9
12.5
Net
her
land
s
22
.0
22.3
34
.7
37.0
11
.2
10.4
72
.6
74.3
17
.7
20.9
New
Zea
land
New
Zea
lan
d
Net
her
land
s
Fran
ce
Ger
man
y
Gre
ece
Hun
gary
Icel
and
Irel
and
Ital
y
Japa
n*
Kore
a*
Luxe
mbo
urg
Mex
ico
Finl
and
Tota
lW
omen
Men
% o
f tot
al p
art-
tim
e em
plo
ymen
t
Aus
tria
Bel
gium
Can
ada
Czec
h R
epub
lic
Den
mar
k
% o
f civ
ilian
em
plo
ymen
t
Aus
tral
ia*
Par
t-ti
me
empl
oym
ent*
% o
f to
tal e
mpl
oym
ent
Fem
ale
part
-tim
e em
plo
ymen
tSe
lf-e
mpl
oym
ent*
2006
1996
2007
1997
2007
1997
2007
1997
2007
1997
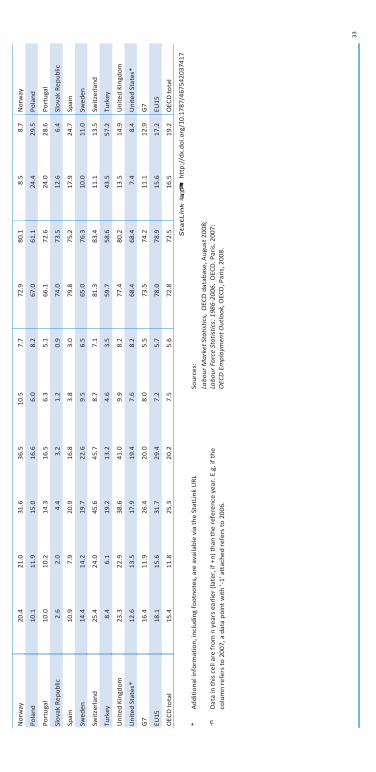
33
20.4
21
.0
31.6
36
.5
10.5
7.
7
72.9
80
.1
8.5
8.
7N
orw
ay
10
.1
11.9
15
.0
16.6
6.
0
8.2
67
.0
61.1
24
.4
29.5
Pola
nd
10
.0
10.2
14
.3
16.5
6.
3
5.1
66
.1
72.6
24
.0
28.6
Port
ugal
2.
6
2.0
4.
4
3.2
1.
2
0.9
74
.0
73.5
12
.6
6.4
Slo
vak
Rep
ublic
10
.9
7.9
20
.9
16.8
3.
8
3.0
79
.8
75.2
17
.9
24.7
Spai
n
14
.4
14.2
19
.7
22.6
9.
5
6.5
65
.0
76.3
10
.0
11.0
Swed
en
25
.4
24.0
45
.6
45.7
8.
7
7.1
81
.3
83.4
11
.1
13.5
Swit
zerl
and
8.
4
6.1
19
.2
13.2
4.
6
3.5
59
.7
58.6
43
.5
57.2
Turk
ey
23
.3
22.9
38
.6
41.0
9.
9
8.2
77
.4
80.2
13
.5
14.9
Uni
ted
King
dom
12
.6
13.5
17
.9
19.4
7.
6
8.2
68
.4
68.4
7.
4
8.4
Uni
ted
Stat
es*
16
.4
11.9
26
.4
20.0
8.
0
5.5
73
.5
74.2
11
.1
12.9
G7
18
.1
15.6
31
.7
29.4
7.
2
5.7
78
.0
78.9
15
.6
17.2
EU15
15
.4
11.8
25
.3
20.2
7.
5
5.6
72
.8
72.5
16
.5
19.2
OEC
D t
ota
l
*A
ddi
tio
nal i
nfor
mat
ion,
incl
udin
g fo
otn
ote
s, a
re a
vaila
ble
via
the
Stat
Link
UR
L So
urce
s:
Labo
ur M
arke
t St
atis
tics
, O
ECD
dat
abas
e, A
ugus
t 20
08;
-nLa
bour
For
ce S
tati
stic
s: 1
986-
2006
, O
ECD
, Par
is, 2
007;
OEC
D E
mpl
oym
ent
Out
look
,OEC
D, P
aris
, 200
8.
33
Dat
a in
thi
s ce
ll ar
e fr
om n
yea
rs e
arlie
r (la
ter,
if +
n) t
han
the
refe
renc
e ye
ar. E
.g. i
f th
e co
lum
n re
fers
to
200
7, a
dat
a p
oint
wit
h '-
1' a
ttac
hed
refe
rs t
o 2
006.
EU15
OEC
D t
ota
l
12
htt
p://
dx.d
oi.o
rg/1
0.17
87/4
6754
2037
417
G7
Turk
ey
Uni
ted
King
dom
Nor
way
Pola
nd
Port
uga
l
Slo
vak
Rep
ublic
Uni
ted
Stat
es*
Spai
n
Swed
en
Swit
zerl
and

34
La
bour
> Un
empl
oym
ent
34
4.9
8.5
5.0
8.2
4.8
8.8
15.
5 3
1.2
9.4
16.
1 9
.3 1
4.7
9.4
17.
3Au
stra
lia
4.8
4.2
5.2
4.5
4.3
4.0
26.
8 2
7.5
8.7
6.3
9.1
7.1
8.3
5.6
Aust
ria
8.2
12.
7 9
.3 1
6.5
7.4
9.7
50.
0 6
0.5
19.
2 2
1.3
22.
6 2
5.7
16.
2 1
7.6
Belgi
um
6.3
9.6
6.1
9.3
6.5
9.9
7.5
16.
1 1
1.2
16.
2 1
0.0
15.
2 1
2.3
17.
1Ca
nada
7.2
3.9
8.8
4.7
5.8
3.4
53.
4 3
0.5
10.
7 8
.6 1
1.0
10.
3 1
0.6
7.5
Czec
h Re
publ
ic
4.1
7.0
4.7
8.3
3.5
5.9
18.
2 2
7.2
7.2
8.1
6.8
9.9
7.5
6.6
Denm
ark
7.7
14.
6 8
.1 1
4.8
7.4
14.
4 2
3.0
29.
8 1
5.7
23.
3 1
6.8
25.
0 1
4.8
22.
0Fin
land
9.1
12.
2 9
.9 1
4.0
8.5
10.
7 4
0.4
41.
4 1
8.7
28.
1 1
9.6
32.
8 1
8.0
24.
5Fr
ance
10.
4 9
.0 1
0.2
9.6
10.
5 8
.4 5
6.6
50.
1 1
1.7
10.
2 1
1.1
9.6
12.
2 1
0.7
Germ
any
8.8
10.
3 1
3.4
16.
6 5
.6 6
.3 5
0.3
55.
7 2
2.0
31.
0 3
2.1
40.
6 1
4.1
22.
2Gr
eece
7.5
10.
1 7
.9 8
.9 7
.3 1
1.1
47.
5 5
1.3
18.
0 1
5.9
18.
6 1
4.5
17.
6 1
6.9
Hung
ary
2.9
3.7
3.1
4.1
2.7
3.4
8.0
16.
3 7
.2 7
.7 6
.3 7
.1 8
.0 8
.3Ice
land
4.4
11.
9 4
.1 1
1.9
4.6
12.
0 3
0.3
57.
0 8
.7 1
6.1
7.9
15.
2 9
.3 1
6.9
Irelan
d
6.9
11.
7 8
.8 1
6.1
5.5
9.1
49.
9 6
6.3
20.
3 3
2.1
23.
3 3
9.6
18.
2 2
6.7
Italy
Hung
ary
Icelan
d
Irela
nd
Italy
Czec
h Re
publ
ic
Denm
ark
Finla
nd
Fran
ce
Germ
any
Gree
ce
Wom
enM
en
Aust
ralia
Aust
ria
Belgi
um
Cana
da
Tota
lW
omen
Men
(12 m
onth
s or m
ore)
% o
f to
tal u
nem
ploy
men
tTo
tal
2007
1997
2007
1997
Unem
ploy
men
t rat
es*
Long
-term
un
empl
oym
ent
Yout
h un
empl
oym
ent r
ates
% of
civil
ian la
bour
forc
e(u
nder
25)
% o
f you
th la
bour
forc
e
1997
2007
1997
2006
1996
2006
1996
2006
1996
2007

35
4
.1 3
.4
3.9
3.3
4.3
3.4
32.
0 2
1.8
7.
7 6
.6 7
.1 6
.3 8
.3
6.9
Japa
n
3.5
2.0
2.
9 1
.6 3
.8 2
.4 0
.6 2
.6
8.8
7.6
7.1
6.5
11.
4
9.2
Kore
a
3.1
2.5
3.
4 3
.0 2
.9 2
.2 3
3.5
34.
6
14.9
7.3
9.9
9.2
17.
5
5.6
Luxe
mbo
urg
3.2
5.2
3.
5 6
.9 3
.0 4
.4 2
.7 1
.8
6.7
7.4
7.5
10.
5 6
.2
5.6
Mex
ico
3.9
6.5
4.
4 8
.4 3
.5 5
.3 4
1.7
49.
1
7.3
9.3
8.1
9.8
6.5
8.
8Ne
ther
land
s
3.8
6.1
4.
0 6
.1 3
.5 6
.1 5
.7 1
9.3
9.
7 1
3.0
9.8
13.
0 9
.6
13.1
New
Zeal
and
3.5
4.9
3.
4 4
.9 3
.5 4
.9 8
.5 1
2.4
7.
5 1
0.6
6.7
11.
1 8
.2
10.2
Norw
ay
13.
8 1
2.4
14
.9 1
3.9
12.
9 1
1.0
45.
9 3
8.0
21
.7 2
4.7
23.
8 2
8.0
20.
0
22.0
Pola
nd
7.7
7.2
9.
0 8
.2 6
.6 6
.4 4
7.3
55.
616
..6 1
4.6
20.
3 1
8.5
13.
5
11.3
Portu
gal
13.
3 1
1.3
14
.7 1
2.7
12.
2 1
0.2
70.
8 5
1.6
20
.1 2
2.6
19.
9 2
2.6
20.
3
22.7
Slov
ak R
epub
lic
8.5
22.
1
11.6
29.
6 6
.3 1
7.5
27.
6 5
5.7
18
.2 3
7.2
21.
9 4
6.0
15.
2
30.4
Spai
n
7.1
10.
0
7.2
9.4
7.0
10.
5 1
3.0
33.
4
18.9
21.
1 1
9.5
20.
4 1
8.4
21
.7Sw
eden
3.9
3.7
4.
6 4
.1 3
.3 3
.5 4
0.8
28.
2
7.1
5.9
7.4
3.8
6.8
7.
9Sw
itzer
land
9.9
6.6
10
.3 5
.9 9
.7 6
.9 3
0.4
41.
6
19.6
14.
3 2
0.0
15.
0 1
9.4
14
.0Tu
rkey
5.4
8.1
4.
9 6
.3 5
.8 9
.7 2
4.7
38.
6
14.4
13.
4 1
2.7
11.
1 1
6.0
15
.6Un
ited
King
dom
4.6
5.4
4.
6 5
.4 4
.6 5
.4 1
0.0
8.7
10
.5 1
1.3
9.4
10.
7 1
1.6
11
.8Un
ited
Stat
es
5.8
6.8
5.
9 7
.1 5
.8 6
.5 2
8.7
32.
2
11.6
12.
9 1
0.8
12.
6 1
2.4
13
.1G7
7.8
10.
9
8.6
12.
5 7
.2 9
.8 4
2.0
50.
2
14.9
20.
0 1
5.4
22.
0 1
4.4
18
.3EU
15
6.1
7.3
6.
4 8
.0 5
.9 6
.8 2
9.1
35.
0
11.9
13.
4 1
1.6
14.
1 1
2.1
12
.9OE
CD to
tal
*Ad
ditio
nal in
form
atio
n, in
cludi
ng fo
otno
tes,
are
avai
labl
e via
the
Stat
Link
URL
Sour
ces:
Labo
ur M
arke
t Sta
tistic
s, OE
CD d
atab
ase,
Au g
ust 2
008;
Labo
ur F
orce
Stat
istics
: 198
6-20
06, O
ECD,
Par
is, 2
007;
OECD
Em
ploy
men
t Out
look
,OEC
D, P
aris,
200
8.35
12
http
://dx
.doi
.org
/10.
1787
/467
5736
0648
6
Portu
gal
Slov
ak R
epub
lic
Spai
n
Swed
en
Switz
erla
nd
Turk
ey
Unite
d Ki
ngdo
m
Unite
d St
ates
G7 EU15
OECD
tota
l
Pola
nd
Japa
n
Kore
a
Luxe
mbo
urg
Mex
ico
Neth
erla
nds
New
Zeal
and
Norw
ay

36
La
bour
> S
ervi
ces:
em
ploy
men
t*36
24
.7-1
25
.4
6.4
-1
6.5
3.
6-1
3.
9
12.1
-1
9.5
5.
8-1
6.
2
22.4
-1
20.4
Aust
ralia
*
21
.9
21.1
6.
9
7.2
3.
1
3.2
9.
6
6.3
6.
8
7.2
20
.3
18.1
Aust
ria
17
.2
18.0
+1
6.9
7.
1+1
3.
3
3.7
+1
15.6
11
.7+1
9.
9
9.6
+1
22.6
21
.0+1
Belg
ium
24
.0
23.3
6.
8
7.3
5.
2
5.4
11
.6
8.2
5.
2
6.1
21
.5
22.2
Cana
da
18
.0
17.3
+1
7.3
7.
3+1
1.
5
1.6
+1
9.8
7.
3+1
6.
4
5.8
+1
14.9
13
.7+1
Czec
h Re
publ
ic
19
.0
17.9
6.
5
6.6
3.
0
3.0
11
.2
7.9
6.
0
7.1
29
.2
28.5
Den
mar
k
15
.8
14.8
+1
7.2
7.
7+1
1.
6
2.3
+1
10.3
7.
4+1
7.
3
7.6
+1
26.4
24
.7+1
Finl
and
16
.9
16.0
6.
3
6.1
3.
1
3.2
14
.8
11.7
8.
6
9.5
22
.7
21.5
Fran
ce
19
.8
18.8
5.
4
6.0
3.
2
3.4
13
.0
8.0
7.
0
8.1
21
.2
18.0
Ger
man
y
20
.5
19.3
+1
6.5
6.
6+1
2.
6
2.3
+1
6.8
4.
9+1
7.
8
7.4
+1
17.1
14
.7+1
Gre
ece
17
.8
15.9
+1
7.7
8.
9+1
2.
1
2.3
+1
6.9
3.
6+1
7.
8
7.3
+1
19.4
20
.3+1
Hun
gary
16
.6-1
16
.4
6.2
-1
7.4
3.
9-1
3.
9
9.1
-1
5.5
5.
2-1
12
.6
30.1
-1
17.0
Icel
and*
20
.2
19.4
+1
6.1
5.
1+1
4.
5
3.8
+1
8.5
6.
0+1
5.
0
5.6
+1
21.6
20
.4+1
Irel
and
20
.4
20.2
6.
4
6.3
2.
4
2.7
11
.1
7.3
5.
7
6.6
16
.7
16.4
Italy
18
.0-1
17
.1-1
5.
8
5.9
+2
2.7
3.
1+2
1.
5
1.5
+2
3.3
3.
3+2
27
.8-1
23
.4-1
Japa
n*
26
.3
26.8
6.
2
5.2
3.
4
3.5
8.
7
4.2
3.
4
3.2
16
.0
9.9
Kore
a
18
.5
21.1
+1
7.5
7.
0+1
11
.0
10.3
+1
17.1
9.
9+1
5.
4
5.4
+1
15.3
14
.6+1
Luxe
mbo
urg
19
.3-1
26
.3+1
6.
0-1
5.
1+1
0.
5-1
1.
1+1
3.
5-1
2.
6+1
4.
6-1
4.
4+1
..
8.1
+1M
exic
o*M
exic
o*
Finl
and
Fran
ce
Ger
man
y
Gre
ece
Hun
gary
Icel
and*
Irel
and
Ital
y
Japa
n*
Kore
a
Luxe
mbo
urg
Den
mar
k
III
IIIIV
2005
1995
2005
1995
2005
1995
Aus
tral
ia*
Aus
tria
Belg
ium
Cana
da
Czec
h R
epub
lic
VVI
Cont
ribut
ion
to to
tal e
mpl
oym
ent
% o
f tot
al c
ivili
an e
mpl
oym
ent
Who
lesa
le a
nd re
tail
trad
e,
rest
aura
nts
and
hote
lsTr
ansp
ort,
stor
age
and
com
mun
icat
ion
Fina
nce
and
insu
ranc
eRe
al e
stat
e, r
entin
g an
d bu
sine
ss s
ervi
ces
Publ
ic a
dmin
istr
atio
n an
d fin
ance
Educ
atio
n, h
ealt
h, s
ocia
l wor
k an
d ot
her s
ervi
ces
2005
1995
2005
1995
2005
1995

37
19.0
20
.0-1
6.
3
5.8
-1
3.8
3.
5-1
15
.9
11.5
-1
7.3
7.
0-1
22
.4
25.1
-1N
ethe
rlan
ds
26
.4
26.3
6.
2
6.0
3.
0
3.8
12
.3
9.3
3.
3
4.5
25
.7
23.6
New
Zea
land
16
.4-1
16
.5
9.0
-1
10.0
2.
3-1
2.
7
10.3
-1
6.6
7.
4-1
9.
0
28.5
-1
26.1
Nor
way
17
.4-1
14
.2
5.7
-1
5.9
2.
1-1
1.
7
7.5
-1
3.2
6.
6-1
2.
6
16.0
-1
14.7
Pola
nd
22
.0-2
19
.3-1
3.
8-2
3.
5-1
1.
8-2
2.
6-1
5.
7-2
5.
7-1
7.
2-2
8.
0-1
14
.7-2
17
.2-1
Port
ugal
20
.2
12.1
7.
0
7.9
1.
7
1.2
7.
4
3.9
6.
9
6.1
18
.1
18.4
Slo
vak
Rep
ublic
22
.4
20.9
-1
5.7
5.
9-1
2.
1
2.7
-1
8.5
5.
7-1
7.
6
8.8
-1
15.2
19
.0-1
Spai
n
15
.4-1
15
.5
6.6
-1
6.9
2.
1-1
2.
1
11.7
-1
8.3
6.
2-1
7.
9
32.8
-1
32.4
Swed
en
21
.3
22.4
6.
6
6.4
5.
7
5.4
10
.3
7.8
3.
9
3.5
19
.0
16.3
Swit
zerl
and*
19
.2-1
13
.0-1
5.
0-1
5.
0-1
1.
1-1
..
2.5
-1..
5.
7-1
..
9.4
-1..
Turk
ey*
24
.2
23.1
5.
9
5.8
4.
1
4.4
15
.4
12.4
6.
4
7.1
23
.8-1
23
.8-1
Uni
ted
King
dom
21
.4
24.1
4.
8
5.0
4.
5
4.7
15
.0
10.6
8.
4
9.1
24
.7
21.0
Uni
ted
Stat
es*
*A
ddit
iona
l inf
orm
atio
n, in
clud
ing
foot
note
s, a
re a
vaila
ble
via
the
Stat
Link
URL
So
urce
s:N
atio
nal A
ccou
nts
of O
ECD
Cou
ntri
es,
OEC
D, P
aris
, 200
6;
..N
ot a
vaila
ble
or n
ot a
pplic
able
.ST
AN
: OEC
D S
truc
tura
l Ana
lysi
s St
atis
tics,
200
5, O
ECD
;
-nLa
bour
For
ce S
tati
stic
s: 1
985-
2005
, O
ECD
, Par
is, 2
006.
37
Dat
a in
thi
s ce
ll ar
e fr
om n
yea
rs e
arlie
r (la
ter,
if +
n) th
an t
he r
efer
ence
yea
r. E
.g. i
f the
co
lum
n re
fers
to 2
007,
a d
ata
poin
t with
'-1'
att
ache
d re
fers
to
2006
.
12
htt
p://
dx.d
oi.o
rg/1
0.17
87/4
6762
5887
171
Uni
ted
Stat
es*
Net
herl
ands
New
Zea
land
Nor
way
Pola
nd
Port
ugal
Slo
vak
Rep
ublic
Spai
n
Swed
en
Swit
zerl
and*
Turk
ey*
Uni
ted
King
dom

38
Sc
ienc
e an
d te
chno
logy
> R
esea
rch
and
deve
lopm
ent
(I), 2
006*
38
1.
78-2
40
.51
-2
52.9
7-2
57
8-2
54
.1-2
1.
43-2
4.
3-1
93
.4-1
0.
52
6.5
Aus
tral
ia*
2.
45
36.5
8
46.3
5
875
67
.8
2.50
6.
4-2
67
.2-2
0.
68
0.0
Aus
tria
*
1.
83
24.6
5-1
59
.68
-1
614
67
.9
2.01
6.
5
82.5
0.
61-1
0.
3-1
Bel
gium
1.
94
32.6
8
47.9
7
714
54
.7
1.60
2.
7
81.6
0.
57-1
3.
6-1
Can
ada*
1.
54
38.9
7
56.9
1
340
66
.2
1.40
13
.6
83.7
0.
61
2.8
-1C
zech
Rep
ublic
2.
43
27.5
8-1
59
.53
-1
856
66
.6
2.84
2.
4-1
86
.0-1
0.
79
0.6
Den
mar
k
3.
45
25.1
1
66.5
6 1
129
71
.3
4.01
3.
7
89.9
0.
98
2.4
Finl
and
2.
11
38.3
9-1
52
.24
-1
656
63
.3
2.33
10
.1-1
80
.8-1
0.
77
22.4
-1Fr
ance
2.
53
28.3
8-1
67
.57
-1
810
69
.9
2.80
4.
5
92.0
0.
76
6.4
-1G
erm
any
0.
57
46.8
2-1
31
.06
-1
156
30
.0
0.28
5.
6-1
85
.7-1
0.
29
0.5
-1G
reec
e
1.
00
44.7
7
43.3
0
182
48
.3
0.76
8.
4
75.6
0.
37-2
0.
1-2
Hu
ngar
y
2.
78-1
40
.50
-1
48.0
0-1
99
0-1
51
.5-1
2.
50-1
2.
8-1
84
.9-1
0.
88
0.0
Icel
and
1.
32
30.1
3
59.2
6
539
67
.5
1.35
3.
9
86.5
0.
53
0.0
Irel
and
1.
09-1
50
.68
-1
39.6
6-1
30
4-1
50
.4-1
0.
85
9.7
79
.2
0.61
-1
1.4
-1It
aly
3.
39
16.1
8
77.0
7 1
086
77
.2
3.80
1.
0
98.5
0.
68
5.1
-1Ja
pan*
3.
23
23.0
7
75.4
5
743
77
.3
3.64
4.
7
94.8
0.
91
16.6
Kore
a
1.
47
16.6
1-1
79
.72
-1 1
147
84
.9
1.81
5.
2-1
91
.7-1
0.
39
0.0
Luxe
mbo
urg
0.
50
45.3
4
46.4
9
57
49.5
-1
0.36
-1
5.7
-1
92.6
-1
0.21
-1
0.0
-1M
exic
o
1.
67
36.2
3-3
51
.06
-3
609
57
.6
1.52
3.
4-3
81
.6-3
0.
71
2.0
Net
herl
ands
1.
16-1
42
.98
-1
41.2
5-1
29
0-1
41
.8-1
0.
71
11.3
-1
80.7
-1
0.53
0.
0N
ew Z
eala
nd
Mex
ico
Net
herl
ands
New
Zea
land
Aus
tral
ia*
Aus
tria
*
Bel
gium
Cana
da*
Luxe
mbo
urg
Den
mar
k
Finl
and
Fran
ce
Ger
man
y
Gre
ece
Hun
gary
Icel
and
Irel
and
Ital
y
Japa
n*
Kore
a
Czec
h R
epub
lic
Gro
ss d
omes
tic
expe
ndit
ure
on
R&
D (G
ERD
)B
usin
ess
ente
rpri
se e
xpen
ditu
re o
n R
&D
(B
ERD
)G
ove
rnm
ent
bud
get
appr
opr
iati
ons
fo
r R
&D
, 200
7
% fi
nanc
ed b
y%
fina
nced
by
% o
f GD
PPe
r ca
pita
at
curr
ent
USD
, PP
Ps%
of
GER
D%
of
valu
e ad
ded
in
indu
stry
% o
f G
DP
Gov
ernm
ent
Indu
stry
Indu
stry
Gov
ernm
ent
% o
f w
hich
de
fenc
e R
&D

39
1.52
43
.99
-1
46.4
1-1
79
1
54.2
1.
21
10.5
80
.7
0.70
5.
6N
orw
ay
0.
56
57.4
5
33.0
5
82
31.5
0.
25
12.3
80
.9
0.32
-1
0.9
-1Po
land
0.
83
55.2
0-1
36
.27
-1
174
41
.7
0.59
4.
2-1
91
.4-1
0.
76
0.7
-1Po
rtug
al
0.
49
55.5
6
34.9
6
87
43.1
0.
30
20.8
68
.2
0.28
2.
2-1
Slov
ak R
epub
lic
1.
20
42.4
9
47.0
7
354
55
.5
1.02
14
.4
79.0
1.
00-1
16
.6-1
Spai
n
3.
73
23.5
0-1
65
.70
-1 1
301
74
.9
4.68
4.
2-1
87
.1-1
0.
85-1
16
.8-1
Swed
en
2.
90-2
22
.71
-2
69.7
3-2
1 0
03-2
73
.7-2
3.
24-2
1.
5-2
90
.9-2
0.
69-1
0.
6-1
Swit
zerl
and
0.
76-1
48
.63
-1
46.0
5-1
67
-1
37.0
0.
35
8.7
90
.0..
..Tu
rkey
1.
78
31.8
7
45.2
0
588
61
.7
1.69
7.
6
69.4
0.
74-1
28
.3-1
Uni
ted
King
dom
2.
62
29.3
4
64.8
9 1
146
70
.3
2.98
9.
3
90.7
1.
02
58.3
Uni
ted
Stat
es*
2.
50
27.8
3
64.6
7
921
69
.7
2.76
6.
8
90.6
0.
89-1
38
.2-1
G7
1.
88
33.9
6-1
54
.77
-1
557
63
.8
1.92
7.
1-1
82
.2-1
0.
78-1
13
.4-1
EU15
*
1.
76
34.7
2-1
54
.14
-1
492
63
.0
1.75
7.
3-1
82
.1-1
0.
73-1
12
.8-1
EU27
*
2.
26
29.4
6-1
62
.71
-1
694
68
.8
2.43
6.
8-1
89
.6-1
0.
81-1
32
.7-1
OEC
D t
otal
*
1.
02
57.8
8-2
39
.38
-1
92
47.9
..
0.8
-2
99.2
-2
0.53
-3
1.2
-3B
razi
l
1.
42
24.7
1
69.0
5
66
71.1
..
4.5
91
.2..
..C
hina
*
0.
71-2
80
.81
-4
16.1
1-4
13
-2
19.8
+2..
....
....
Indi
a*
1.
08
61.1
0
28.8
1
141
66
.7
1.01
52
.0
35.7
0.
36-1
52
.1-5
Ru
ssia
n Fe
dera
tio
n
0.
92-1
38
.19
-1
43.8
7-1
78
-1
58.3
-1
0.81
-1
16.2
-1
68.3
-1..
..So
uth
Afr
ica
*A
ddit
iona
l inf
orm
atio
n, in
clud
ing
foot
note
s, a
re a
vaila
ble
via
the
Stat
Link
UR
L So
urce
s:M
ain
Scie
nce
and
Tech
nolo
gy In
dica
tors
, O
ECD
, Par
is, 2
008.
..N
ot a
vaila
ble
or n
ot a
pplic
able
.N
atio
nal s
our
ces:
-nB
razi
l: M
inis
try
of S
cien
ce a
nd T
echn
olo
gy (M
CT);
Indi
a: N
atio
nal S
cien
ce &
Tec
hnol
ogy
Man
agem
ent
Info
rmat
ion
Syst
em, D
epar
tmen
t o
f Sci
ence
& T
echn
olo
gy.
39
Dat
a in
thi
s ce
ll ar
e fr
om n
yea
rs e
arlie
r (la
ter,
if +
n) t
han
the
refe
renc
e ye
ar. E
.g. i
f the
co
lum
n re
fers
to
2007
, a d
ata
poin
t w
ith
'-1'
att
ache
d re
fers
to
2006
.
Chin
a*
Indi
a*
Rus
sian
Fed
erat
ion
Sout
h A
fric
a
12
htt
p://
dx.d
oi.o
rg/1
0.17
87/4
6763
8774
024
Uni
ted
Stat
es*
G7
EU15
*
EU27
*
OEC
D t
otal
*
Bra
zil
Uni
ted
King
dom
No
rway
Pola
nd
Port
ugal
Slo
vak
Rep
ublic
Spai
n
Swed
en
Swit
zerl
and
Turk
ey

40
S
cien
ce a
nd
tech
nolo
gy
> R
esea
rch
and
dev
elop
men
t (I
I), 2
006
*40
10
.0-1
11
.7-1
16
.9-1
39
.7-1
81
384
-2
8.4
-2
26.8
-2
0.48
-2A
ustr
alia
31
.0-2
27
.8-2
12
.9-2
27
.4-2
30
452
7.
8
26.7
0.
65A
ustr
ia
41
.2
23.7
15
.7
17.0
33
924
7.
9
22.3
0.
41Be
lgiu
m
32
.4
9.1
11
.0
41.9
125
330
-2
7.7
-2
35.5
0.
69Ca
nada
22
.3
35.6
8.
7
31.8
26
267
5.
2
15.9
0.
25Cz
ech
Rep
ublic
39
.4-1
16
.2-1
8.
5-1
35
.0-1
28
653
10
.2
26.1
0.
63D
enm
ark
63
.8
13.5
12
.1
8.2
40
411
16
.6
18.7
0.
65Fi
nlan
d
44
.6-2
29
.9-2
11
.5-2
8.
4-2
204
484
-1
8.2
-1
18.2
0.
38Fr
ance
29
.6
52.2
8.
3
9.4
282
063
7.
2
16.3
0.
41G
erm
any
21
.8-1
13
.8-1
17
.2-1
44
.9-1
19
907
4.
3
47.8
0.
27G
reec
e
53
.7
16.0
6.
6
21.4
17
547
4.
5
24.4
0.
24H
ung
ary
25
.0-1
6.
9-1
5.
7-1
59
.7-1
2 1
55-1
13
.4-1
22
.0-1
0.
61-1
Icel
and
48
.0-1
9.
0-1
9.
3-1
33
.6-1
12
167
6.
0
26.0
0.
34Ir
elan
d
33
.1
29.1
8.
0
26.8
82
489
-1
3.4
-1
30.2
-1
0.33
-1It
aly
44
.7
40.4
2.
9
10.4
709
691
11
.1
12.7
0.
43Ja
pan
53
.8
27.9
8.
3
7.1
199
990
8.
7
10.0
0.
32Ko
rea*
....
..
55.6
-1 2
346
7.
4
2.4
0.
04Lu
xem
bou
rg
9.
7-1
21
.8-1
35
.1-1
32
.6-1
48
401
-1
1.2
-1
27.4
-1
0.14
-1M
exic
o
40
.9-1
27
.8-1
8.
5-1
17
.4-1
45
852
5.
5
28.1
-3
0.49
-3N
ethe
rlan
dsN
ethe
rlan
ds
Can
ada
Cze
ch R
epub
lic
Mex
ico
Fin
land
Fran
ce
Ger
man
y
Gre
ece
Hun
gary
Icel
and
Irel
and
Ital
y
Japa
n
Kor
ea*
Luxe
mb
ourg
Den
mar
k
Hig
her
educ
atio
n ex
pend
itur
e on
R&
D
(HER
D)
% o
f GER
D%
of G
DP
Full-
tim
e eq
uiva
lent
Per
1 0
00 to
tal
empl
oym
ent
Aus
tral
ia
Aus
tria
Bel
gium
Res
earc
hers
% o
f bu
sine
ss e
xpen
ditu
re o
n R&
D (
BER
D) p
erfo
rmed
in(n
atio
nal t
ota
ls)
Med
ium
low
-tec
h an
d lo
w-t
ech
indu
stri
es*
Serv
ice
ind
ustr
ies
Hig
h-te
ch
indu
stri
es*
Med
ium
hig
h-te
ch
indu
stri
es*

41
..
....
41
.1-1
17
235
-1
10.5
-1
32.5
-1
0.38
-1N
ew Z
eala
nd
12
.6
16.3
12
.6
50.3
21
653
-1
9.2
-1
30.2
0.
46N
orw
ay
13
.9
23.7
9.
1
50.6
59
573
4.
4
31.0
0.
17Po
land
17
.6-1
17
.6-1
10
.9-1
44
.0-1
21
126
-1
4.1
-1
35.4
-1
0.29
-1Po
rtug
al
....
..
51.7
11
776
5.
5
24.1
0.
12Sl
ovak
Rep
ubl
ic
20
.5-1
18
.8-1
15
.1-1
41
.8-1
115
798
5.
8
27.6
0.
33Sp
ain
38
.7-1
29
.8-1
5.
2-1
24
.8-1
55
729
12
.6
20.4
0.
76Sw
eden
....
..
19.6
-2 2
5 40
0-2
6.
1-2
22
.9-2
0.
66-2
Swit
zerl
and
16
.3
42.0
14
.5
25.8
42
663
1.
9
51.3
0.
39Tu
rkey
49
.0
18.8
7.
6
23.2
183
535
5.
8
26.1
0.
47U
nite
d K
ingd
om*
40
.3-3
16
.6-3
6.
4-3
36
.1-3
1 3
87 8
82-1
9.
6-1
14
.3
0.37
Uni
ted
Stat
es*
39
.2-3
26
.5-3
8.
2-3
24
.8-3
2 9
72 7
84-1
8.
6-1
16
.2
0.41
G7*
38
.7-3
34
.9-3
9.
2-3
15
.0-3
1 1
33 4
69-1
6.
4-1
22
.1
0.42
EU15
*
....
....
1 3
32 3
97
6.0
22
.1
0.39
EU27
*
....
....
3 8
79 3
94-1
7.
3-1
17
.1
0.39
OEC
D t
otal
*
....
....
84
979
-2
1.0
-2
38.4
-2
0.32
-2Br
azil
....
....
1 2
23 7
56
1.6
9.
2
0.13
Chin
a*
....
....
92
500
-4
0.2
-4
4.9
-2
0.03
-2In
dia*
7.
7-1
5.
1-1
3.
4-1
78
.6-1
464
357
6.
8
6.1
0.
07Ru
ssia
n F
eder
atio
n
....
..
36.4
-1 1
7 30
3-1
1.
5-1
19
.3-1
0.
18-1
Sout
h A
fric
a
*A
ddit
iona
l inf
orm
atio
n, in
clu
din
g fo
otn
otes
, are
ava
ilabl
e vi
a th
e St
atLi
nk U
RL
Sour
ces:
Mai
n Sc
ien
ce a
nd T
ech
nolo
gy In
dica
tors
, O
ECD
, Par
is, 2
008;
..N
ot
avai
labl
e or
not
ap
plic
able
.R
esea
rch
and
Dev
elop
men
t Ex
pen
ditu
re in
Indu
stry
, 200
6.-n
Nat
ion
al s
ourc
es:
Bra
zil:
Min
istr
y o
f Sci
ence
and
Tec
hnol
ogy
(MCT
);In
dia:
Nat
iona
l Sci
ence
& T
echn
olo
gy M
anag
emen
t In
form
atio
n S
yste
m, D
epar
tmen
t of
Sci
ence
& T
echn
olo
gy.
41
12
htt
p://
dx.
doi.o
rg/1
0.17
87/4
6765
5873
016
Dat
a in
thi
s ce
ll ar
e fr
om n
yea
rs e
arlie
r th
an t
he r
efer
ence
yea
r. E
.g. i
f the
co
lum
n re
fers
to 2
007,
a d
ata
poin
t w
ith
'-1' a
ttac
hed
refe
rs to
200
6.
G7*
EU15
*
EU27
*
OEC
D to
tal*
Bra
zil
Chi
na*
Indi
a*
Rus
sian
Fed
erat
ion
Sout
h A
fric
a
Uni
ted
Sta
tes*
New
Zea
lan
d
Nor
way
Pol
and
Por
tuga
l
Slo
vak
Rep
ublic
Spai
n
Swed
en
Swit
zerl
and
Turk
ey
Uni
ted
Kin
gdom
*

42
Sc
ienc
e an
d te
chno
logy
> P
aten
ts a
nd t
rade
in te
chno
logy
42
2 5
17.4
2 4
34.5
82
.8
385
2 0
52
13.3
56
4
155
23
21
0.
9
0.4
Aus
tral
ia
2 4
29.7
-6 2
425
.8-6
3.
9-6
32
7 1
131
24
.9
306
39
88
11
5
1.8
1.
0A
ustr
ia
7 5
79.6
5 9
56.3
1 6
23.3
36
1
974
43
.2
213
76
10
0
115
5.
0
3.7
Bel
gium
2 0
72.2
-2 1
180
.6-2
89
1.6
-2
777
2 6
66
26.5
1 0
66
231
63
82
4.
2
2.2
Cana
da
1 2
82.1
1 5
90.5
- 30
8.4
16
12
0
38.6
28
5
89
12
9
1.4
1.
0Cz
ech
Rep
ublic
1 6
57.3
-7 1
055
.3-7
60
2.0
-7
229
1 1
27
17.0
24
1
109
10
6
85
1.1
1.
0D
enm
ark
3 3
33.2
2 6
08.1
72
5.1
27
8 1
420
15
.7
872
39
12
3
103
1.
1
1.0
Finl
and
5 1
88.3
-3 3
233
.5-3
1 9
54.8
-3 2
472
6 0
67
19.9
2 0
22
223
10
6
110
6.
7
6.6
Fran
ce
34
315.
1 3
1 94
1.7
2 3
73.5
6 2
98 1
6 24
5
15.8
3 8
90
508
10
5
200
15
.9
12.9
Ger
man
y
....
..
11
98
24.1
20
5
23
20
0.
3
0.1
Gre
ece
1 5
95.6
2 3
65.9
- 77
0.2
41
18
0
28.8
41
5
12
1
114
1.
0
1.3
Hun
gary
....
..
6
37
42.0
13
3
39
6
--
Icel
and
23
123.
9 2
6 55
4.9
-3 4
31.0
62
28
8
33.0
10
8
15
194
19
0
1.5
3.
1Ir
elan
d
4 9
68.0
3 9
89.9
97
8.0
72
2 2
813
13
.2
503
89
69
12
3
6.0
2.
5It
aly
20
448.
8 6
065
.3 1
4 38
3.5
14
976
22
740
3.
1 9
405
1 2
21
133
36
7
9.1
9.
3Ja
pan
81
6.4
-3 3
237
.3-3
-2 4
20.9
-3 2
811
5 1
52
4.6
2 3
08
158
16
8
163
4.
8
6.5
Kore
a
1 1
41.6
1 0
17.4
12
4.2
23
38
58
.5
8
0
55
55
0.2
0.
1Lu
xem
bour
g
18
0.4
-1 2
093
.5-1
-1 9
13.1
-1
17
172
22
.1
20
6
99
97
3.1
3.
7M
exic
o
Kore
a
Luxe
mbo
urg
Mex
ico
Japa
n
Cana
da
Czec
h R
epub
lic
Den
mar
k
Finl
and
Fran
ce
Ger
man
y
Gre
ece
Hun
gary
Icel
and
Irel
and
Ital
y
Aus
tral
ia
Aus
tria
Belg
ium
Bal
ance
2005
Rec
eipt
sPa
ymen
ts
Tech
nolo
gy b
alan
ce o
f pay
men
tsPa
tent
ing
acti
vity
Trad
e co
vera
ge r
atio
sEx
port
mar
ket
shar
es
Pate
nt a
pplic
atio
ns f
iled
unde
r th
e PC
T*Ex
port
s as
% o
f im
port
s%
of t
otal
OEC
D
Mill
ion
USD
, 200
6*Tr
iadi
c pa
tent
fa
mili
es*
2006
All
man
u-
fact
urin
g in
dust
ries
2006
Hig
h-te
ch m
fg
indu
stri
es*
2006
Hig
h-te
ch
indu
stri
es*
2006
Med
ium
hig
h-te
ch
indu
stri
es*
2005
ICT
2005
Bio
-te
chno
logy
2005
Tota
l
2005
% o
f whi
ch
fore
ign
co-
inve
ntor
s

43
..
....
1 0
92 3
087
18
.2 1
369
16
8
105
12
3
4.9
6.
1N
ethe
rlan
ds
7.
9-7
3.
7-7
4.
2-7
63
34
4
17.6
60
30
26
28
0.
3
0.1
New
Zea
land
4 3
66.7
2 5
88.7
1 7
78.0
11
8
623
17
.2
167
21
46
37
0.
6
0.3
No
rway
1 2
90.3
2 9
84.7
-1 6
94.4
13
10
4
37.9
18
5
44
95
1.
5
0.5
Pola
nd
73
7.0
90
9.6
- 17
2.6
11
85
20
.4
24
7
46
65
0.6
0.
3Po
rtug
al
34
8.9
57
3.0
- 22
4.1
3
36
45
.8
4
0
75
110
0.
6
0.4
Slov
ak R
epub
lic
17
5.4
-1 1
334
.4-1
-1 1
59.0
-1
197
1 1
41
18.1
19
0
77
44
77
2.9
1.
3Sp
ain
11
556.
0 1
0 83
9.3
..
732
2 4
41
17.7
86
9
96
134
12
2
2.0
1.
8Sw
eden
8 8
39.4
12
416.
5-3
577
.1
807
1 9
76
43.4
41
5
94
177
11
9
2.1
3.
8Sw
itze
rlan
d
....
..
26
233
12
.3
19
1
23
19
0.6
0.
1Tu
rkey
30
405.
5 1
5 42
4.5
14
981.
0 1
651
5 7
12
23.8
1 9
39
328
11
4
82
5.9
9.
4U
nite
d Ki
ngdo
m
75
380.
0 3
5 47
9.0
39
901.
0 1
5 77
4 4
6 54
2
10.3
17
667
2 9
13
81
69
13.9
19
.5U
nite
d St
ates
....
..
58
339
18
.2
41
15
44
98
1.6
0.
6B
razi
l
....
..
356
3 7
74
13.0
2 0
99
90
116
91
14
.1
20.5
Chin
a
....
..
113
97
8
24.8
20
9
50
26
61
1.7
0.
4In
dia
52
8.5
1 1
37.9
- 60
9.4
63
71
5
23.2
19
8
31
17
37
1.8
0.
2R
ussi
an F
eder
atio
n
45
.6 1
278
.7-1
233
.1
30
372
8.
5
59
10
15
63
0.6
0.
1So
uth
Afr
ica
*A
ddit
iona
l inf
orm
atio
n, in
clud
ing
foo
tnot
es, a
re a
vaila
ble
via
the
Stat
Link
UR
L So
urce
s:M
ain
Scie
nce
and
Tech
nolo
gy In
dica
tors
, O
ECD
, Par
is, 2
008;
..N
ot a
vaila
ble
or n
ot a
pplic
able
.O
ECD
, STA
N In
dica
tors
Dat
abas
e 20
08 (f
orth
com
ing)
;-
Nil
or
negl
igib
le.
OEC
D, P
aten
ts d
atab
ase,
Jun
e 20
08;
-nO
ECD
, Int
erna
tio
nal T
rade
by
Com
mod
ity
Stat
isti
cs; U
nite
d N
atio
ns, C
OM
TRA
DE
Dat
abas
e, 2
008.
43
Dat
a in
thi
s ce
ll ar
e fr
om
n y
ears
ear
lier
than
the
ref
eren
ce y
ear.
E.g
. if
the
colu
mn
refe
rs t
o
2007
, a d
ata
poin
t w
ith
'-1'
att
ache
d re
fers
to
2006
.
Russ
ian
Fede
rati
on
Sout
h A
fric
a1
2 h
ttp:
//dx
.do
i.org
/10.
1787
/467
7100
4347
2
Turk
ey
Uni
ted
King
dom
Uni
ted
Stat
es
Braz
il
Chin
a
Indi
a
Swit
zerl
and
Net
herl
ands
New
Zea
land
No
rway
Pola
nd
Port
ugal
Slov
ak R
epub
lic
Spai
n
Swed
en

44
E
nvi
ronm
ent
> R
esou
rces
, lat
est
avai
labl
e ye
ar*
44
7 7
41
13.0
0.
2
0.01
21
0.
6
24
13
5
0.2
..A
ustr
alia
*
84
28
.0
3.2
0.
10
47
0.7
22
28
5
-
89A
ustr
ia
31
3.
3
10.6
0.
69
22
0.9
36
25
32
-
55Be
lgiu
m
9 9
85
6.7
2.
5
0.06
34
0.
4
20
10
2
1.2
72
Cana
da
79
15
.8
6.8
0.
10
34
0.7
20
50
12
-
74Cz
ech
Rep
ublic
43
2.
0
7.4
0.
11
12
0.7
22
16
4
1.
0
88D
enm
ark*
33
8
8.2
7.
0
0.07
74
0.
7
11
13
2
0.1
81
Fin
land
55
2
11.8
7.
5
0.28
28
0.
6
19
19
18
0.6
80
Fran
ce
35
7
55.7
10
.5
0.17
32
0.
5
38
27
19
0.3
93
Ger
man
y
13
2
2.8
2.
7
0.12
29
0.
6
38
2
12
0.1
56
Gre
ece
93
8.
9
5.8
0.
17
22
0.5
38
15
5
-
60H
unga
ry
10
3
5.6
0.
6
0.00
--
-
44-
1.
7
57Ic
elan
d
70
0.
5
8.1
0.
05
10
0.7
2
5
2
0.
3
70Ir
elan
d
30
1
12.5
4.
2
0.52
34
0.
5
41
18
44
0.3
69
Ital
y
37
8
8.0
9.
2
1.28
68
0.
4
23
13
20
4.5
69
Japa
n
99
3.
8
18.8
1.
23
63
0.1
11
6
40
1.
8
83Ko
rea
3
17
.0-
0.
33
34
0.5
52
23
3
-
95Lu
xem
bour
g
1 9
64
8.6
1.
1
0.04
33
0.
2
32
16
16
1.4
36
Mex
ico
Irel
and
Ital
y
Japa
n
Kore
a
Luxe
mbo
urg
Mex
ico
Icel
and
Aus
tral
ia*
Aus
tria
Bel
gium
Can
ada
Cze
ch R
epub
lic
Den
mar
k*
Finl
and
Fran
ce
Ger
man
y
Gre
ece
Hun
gary
% o
f po
pula
tion
conn
ecte
d
Pub
lic w
aste
w
ater
pla
nts
Land
Fore
stTh
reat
ened
sp
ecie
sW
ater
% o
f gr
oss
an
nual
av
aila
bilit
y
Wat
er
with
draw
al
% o
f w
orld
ca
tche
s
Tota
l fis
h ca
tche
s
% o
f kn
own
spec
ies
Mam
mal
s
% o
f kno
wn
sp
ecie
s
Bird
s
% o
f lan
d ar
ea
Woo
ded
are
a
Thou
sand
km
²
Tota
l are
a
% o
f te
rrit
oria
l ar
ea
Maj
or
pro
tect
ed
area
s*
Har
vest
/
annu
al g
row
th
Use
of f
ore
st
reso
urce
s
t / k
m²
of
agri
cult
ural
la
nd
Nitr
ogen
ous
fe
rtili
sers
use
t /
km²
of
agric
ultu
ral
land
Pest
icid
es u
se

45
42
15.6
13
.4
0.41
11
0.
6
19
22
12
0.5
99
Net
herl
ands
26
8
19.5
1.
8
0.02
31
..
18
21
1
0.6
80
New
Zea
land
32
4
4.6
10
.0
0.08
31
0.
5
14
16
1
2.6
77
No
rway
*
31
3
28.1
6.
3
0.07
30
0.
6
14
8
18
0.2
61
Pola
nd
92
4.
9
2.3
0.
42
41
0.8
26
38
12
0.
2
65Po
rtu
gal
49
25
.2
4.6
0.
21
40
0.5
22
14
1
-
56Sl
ova
k R
epub
lic
50
5
7.7
3.
3
0.14
36
0.
5
13
27
34
0.9
92
Spai
n
45
0
9.2
5.
1
0.05
67
0.
7
18
17
1
0.3
86
Swed
en
41
28
.7
3.6
0.
10
31
0.8
33
36
5
-
97Sw
itze
rlan
d
78
4
3.9
3.
3
0.06
13
0.
5
14
4
19
0.5
42
Turk
ey
24
4
18.3
5.
9
0.19
12
0.
6
16
16
18
0.7
97
Uni
ted
Kin
gdom
*
9 6
32
19.5
2.
6
0.08
33
0.
6
17
12
19
5.2
71
Uni
ted
Sta
tes
21
448
13
.1
3.3
0.
12
34
0.5
....
12
12
.9
76G
7
3 2
43
14.3
6.
0
0.23
39
0.
6..
..
19
5.5
84
EU15
35
096
12
.4
2.2
0.
07
31
0.6
....
11
25
.3
71O
ECD
tot
al*
*A
ddi
tion
al in
form
atio
n, i
ncl
udi
ng f
oo
tno
tes,
are
ava
ilab
le v
ia t
he
Stat
Lin
k U
RL
Sour
ces:
OEC
D E
nvi
ronm
enta
l Da
ta C
ompe
ndiu
m 2
008,
OEC
D, P
aris
, 200
8;..
No
t av
aila
ble
or
not
app
licab
le.
OEC
D K
ey E
nvi
ronm
enta
l Ind
ica
tors
200
8, O
ECD
, Par
is, 2
008.
-N
il o
r ne
glig
ible
.
45
12
htt
p:/
/dx.
do
i.org
/10.
1787
/467
8445
1270
2
Spai
n
Swed
en
Swit
zerl
and
Turk
ey
Uni
ted
Kin
gdo
m*
Uni
ted
Sta
tes
G7
EU15
OEC
D t
ota
l*
Slo
vak
Rep
ubl
ic
Net
herl
and
s
New
Zea
land
No
rway
*
Pola
nd
Port
ugal

46
E
nvi
ron
men
t >
Em
issi
on
s an
d p
ollu
tio
n, l
ates
t av
aila
ble
yea
r*46
12
3
58
78
2
5
20
690
-
4.2
Au
stra
lia*
3
- 6
4
27
7..
59
0-
1.
9A
ust
ria*
21
- 8
8
27-
63
50
47
0
2.0
2.
3B
elgi
um
64
- 3
4
74-
1..
42
0
6.2
4.
4C
anad
a*
14
- 6
0
26-
26
30
30
0
1.7
2.
9C
zech
Rep
ub
lic
4
- 8
8
34-
32
10
74
0-
1.
7D
enm
ark
16
- 6
6
37-
35
11
0
490
1
.9
1.8
Fin
lan
d
8
- 6
5
20-
34
50
52
0
4.2
2.
7Fr
ance
7
- 9
0
17-
50
20
57
0
1.2
3.
4G
erm
any
48
1
4
28
13
..
440
-
4.0
Gre
ece
13
- 8
7
20-
15
30
47
0
1.7
9.
7H
un
gary
28
1
2
94
1
10
530
-
0.4
Icel
and
17
- 6
2
28-
5
40
800
-
0.9
Ire
lan
d
7
- 7
7
19-
43
20
55
0-
2.
7It
aly
6
- 2
4
15-
6
40
410
1
.5
0.8
Jap
an*
8
- 5
0
27
50
40
37
0
3.2
4.
5K
ore
a
6
- 8
0
30-
39
30
70
0-
..Lu
xem
bo
urg
26
- 3
14
1
4..
34
0
0.1
1.
0M
exic
o
4
- 6
7
21-
38
40
62
0
0.1
1.
2N
eth
erl
and
s
Ital
y
Jap
an*
Ko
rea
Luxe
mb
ou
rg
Mex
ico
Net
her
lan
ds
Irel
and
Au
stri
a*
Bel
giu
m
Can
ada*
Cze
ch R
epu
blic
De
nm
ark
Finl
and
Fran
ce
Ger
man
y
Gre
ece
Hu
nga
ry
Icel
and
Au
stra
lia*
Air
Was
te
Sulp
hu
r o
xid
es
Nit
oge
n o
xid
esQ
uan
tity
ge
ner
ated
kg /
cap
ita
% c
han
ge s
ince
1
990
kg /
cap
ita
% c
han
ge s
ince
1
990
Envi
ron
men
t R
&D
b
udge
t*
t /
Mto
e
Nuc
lear
was
te p
er
un
it o
f e
ner
gy*
t /
mill
ion
USD
Ind
ust
rial
was
te p
er
uni
t o
f G
DP
*
kg /
cap
ita
Mu
nic
ipal
was
teas
% o
f to
tal
gove
rnm
ent
R&
D
bud
get

47
20
54
39
5
8
10
400
-..
Ne
w Z
eal
and
*
5
- 5
4
43-
7
20
800
-
2.1
No
rway
33
- 6
1
21-
49
12
0
260
-
2.4
Po
lan
d
21
- 3
1
25
4
50
470
-
3.5
Po
rtu
gal
17
- 8
4
18-
55
13
0
280
3
.0
1.0
Slo
vak
Rep
ub
lic
29
- 4
2
35
22
30
60
0
1.2
3.
0Sp
ain
4
- 6
3
23-
35
11
0
500
4
.1
2.2
Swed
en
2
- 5
9
12-
47
-
700
1
.9
0.1
Swit
zerl
and
*
27
2
8
15
66
30
43
0-
..Tu
rke
y
12
- 8
1
27-
45
30
59
0
1.0
1.
8U
nit
ed
Kin
gdo
m
45
- 3
7
57-
26
..
760
1
.0
0.4
Un
ite
d S
tate
s*
25
- 5
1
37-
28
50
63
0
1.6
..G
7
12
- 7
2
23-
33
40
56
0
1.5
..EU
15
26
- 4
5
32-
22
50
56
0
1.5
..O
ECD
to
tal
*A
dd
itio
nal
info
rmat
ion
, in
clud
ing
foo
tno
tes,
are
ava
ilab
le v
ia t
he
Sta
tLin
k U
RL
Sou
rce
s:O
ECD
En
viro
nm
enta
l Da
ta C
om
pen
diu
m 2
008
, OEC
D, P
aris
, 20
08;
..N
ot
avai
lab
le o
r n
ot
app
licab
le.
OEC
D K
ey E
nvir
onm
enta
l Ind
ica
tors
20
08,
OEC
D, P
aris
, 200
8.
-N
il o
r ne
glig
ible
.
47
EU15
OEC
D t
ota
l
12
htt
p:/
/dx.
do
i.org
/10
.17
87/4
6801
307
425
7
Swe
den
Swit
zerl
and
*
Turk
ey
Un
ited
Kin
gdo
m
Un
ited
Sta
tes*
G7
Spai
n
New
Zea
lan
d*
No
rway
Po
lan
d
Po
rtu
gal
Slo
vak
Re
pub
lic

48
E
nvir
onm
ent
> C
O2 e
mis
sion
s, 2
006
48
39
4.4
51
.8
226.
6
112.
3
55.1
0.
5
231.
4
48.3
78
.0
7.6
29
.2
0.82
19
.02
Aus
tral
ia
72
.8
28.8
15
.4
38.0
17
.2
2.3
17
.0
14.6
20
.7
8.4
12
.2
0.34
8.
80A
ustr
ia
11
7.2
6.
3
17.7
54
.9
34.1
10
.5
24.4
35
.2
25.2
18
.2
14.1
0.
45
11.1
2B
elgi
um
53
8.8
24
.7
107.
3
263.
6
167.
4
0.5
11
4.6
99
.2
159.
6
37.7
12
7.8
0.
64
16.5
2Ca
nada
12
1.0
- 22.
0
78.1
24
.7
17.4
0.
7
63.3
23
.1
17.5
8.
8
8.3
1.
67
11.7
8Cz
ech
Repu
blic
55
.2
9.5
21
.6
22.0
10
.6
1.0
27
.9
5.3
13
.3
3.3
5.
4
0.31
10
.15
Den
mar
k
66
.8
22.9
30
.7
26.7
9.
0
0.4
33
.3
12.8
13
.2
2.1
5.
5
0.46
12
.69
Finl
and
37
7.5
7.
2
50.4
23
3.0
90
.1
4.0
52
.3
72.1
13
1.5
63
.5
58.2
0.
26
5.97
Fran
ce
82
3.5
- 13.
4
339.
3
297.
7
182.
2
4.3
34
4.7
11
8.0
15
3.8
12
5.1
81
.8
0.41
10
.00
Ger
man
y
94
.0
34.0
34
.6
53.1
6.
3
0.0
44
.1
9.7
22
.2
9.4
8.
6
0.57
8.
43G
reec
e
56
.4- 1
7.7
12
.4
17.8
25
.8
0.3
18
.2
8.2
12
.9
9.8
7.
2
0.92
5.
60H
unga
ry
2.
2
16.1
0.
3
1.9
0.
0
0.0
0.
0
0.7
0.
9
0.0
0.
6
0.20
7.
18Ic
elan
d
44
.9
46.7
9.
7
26.0
9.
2
0.0
14
.8
5.6
13
.6
7.2
3.
8
0.34
10
.56
Irel
and
44
8.0
12
.6
62.4
22
2.3
15
9.8
3.
5
147.
6
79.0
12
0.3
55
.3
45.8
0.
39
7.61
Ital
y
1 2
12.7
13
.2
431.
4
586.
8
190.
0
4.5
45
9.1
29
2.1
24
5.4
63
.4
152.
6
0.24
9.
49Ja
pan
47
6.1
10
7.6
20
4.8
19
5.7
68
.2
7.3
21
1.2
94
.6
86.1
33
.7
50.5
0.
71
9.86
Kore
a
11
.2
6.8
0.
4
7.8
2.
9
0.1
1.
4
1.7
6.
7
1.3
0.
1
0.43
23
.64
Luxe
mbo
urg
41
6.3
42
.1
35.7
25
7.7
12
2.9
0.
0
135.
1
60.5
13
9.8
22
.2
58.7
0.
63
3.97
Mex
ico
17
8.3
13
.9
28.9
67
.8
78.5
3.
1
54.3
36
.6
35.2
17
.5
34.7
0.
42
10.9
1N
ethe
rlan
ds
36
.8
72.2
11
.3
18.1
7.
5
0.0
13
.5
5.0
14
.5
0.6
3.
2
0.58
8.
88N
ew Z
eala
nd
Irel
and
Ital
y
Japa
n
Kore
a
Luxe
mbo
urg
Mex
ico
Net
herl
ands
New
Zea
land
CO2
per
capi
taTo
tal,
mill
ion
tonn
es o
f CO
2
% c
hang
e 20
06/1
990
t/ca
pita
Icel
and
Aus
tral
ia
Aus
tria
Bel
gium
Can
ada
Cze
ch R
epub
lic
Den
mar
k
Finl
and
Fran
ce
Ger
man
y
Gre
ece
Hun
gary
CO
2 em
issi
ons
from
fuel
com
bust
ion1
By
type
of f
uel
By
sect
or
Oth
erkg
/200
0 U
SDTr
ansp
ort
Res
iden
tial
Elec
tric
ity
and
heat
Indu
stry
Gas
Oth
ers2
Coal
and
pe
atO
il
Mill
ion
tonn
es o
f CO
2M
illio
n to
nnes
of C
O2
CO2
per
unit
o
f GD
P

49
36.8
29
.5
2.6
22
.4
11.3
0.
5
0.9
7.
0
13.8
0.
7
14.5
0.
19
7.91
Nor
way
30
6.0
- 11.
0
215.
9
60.2
27
.0
2.8
16
8.3
38
.9
38.2
32
.5
28.1
1.
45
8.02
Pola
nd
56
.3
43.4
13
.0
34.6
8.
3
0.5
21
.8
8.9
19
.0
2.2
4.
4
0.47
5.
32Po
rtug
al
37
.5- 3
4.0
16
.2
9.1
12
.0
0.2
9.
9
9.6
6.
1
3.2
8.
6
1.35
6.
95Sl
ovak
Rep
ublic
32
7.6
59
.2
66.6
19
0.3
70
.0
0.8
10
4.6
63
.3
112.
3
18.8
28
.6
0.46
7.
44Sp
ain
48
.3- 8
.5
9.0
35
.0
2.0
2.
4
9.3
11
.0
22.4
0.
9
4.7
0.
17
5.32
Swed
en
44
.1
8.2
0.
6
33.8
6.
3
3.4
1.
7
6.5
16
.5
11.6
7.
7
0.16
5.
83Sw
itze
rlan
d
23
9.7
88
.9
101.
7
77.3
60
.5
0.1
82
.1
62.7
42
.2
29.8
22
.9
0.92
3.
29Tu
rkey
53
6.5
- 3.0
15
7.6
18
9.6
18
6.7
2.
5
207.
0
63.9
13
0.6
76
.9
58.1
0.
32
8.86
Uni
ted
King
dom
5 6
96.8
17
.1 2
090
.0 2
410
.9 1
169
.4
26.5
2 4
21.0
63
2.7
1 8
09.3
30
9.3
52
4.4
0.
51
19.0
0U
nite
d St
ates
9 6
33.8
11
.8 3
238
.4 4
203
.9 2
145
.7
45.8
3 7
46.3
1 3
56.9
2 7
50.3
73
1.4
1 0
48.7
0.
41
13.2
8G
7
3 9
83.0
- 2.0
1 2
62.5
1 6
81.7
99
8.7
40
.1 1
460
.6
655.
8
952.
0
476.
1
438.
6
0.42
8.
07EU
27
12
873.
7
16.2
4 3
92.1
5 5
91.0
2 8
07.8
82
.8 5
034
.8 1
926
.7 3
520
.7
981.
4 1
410
.1
0.44
10
.93
OEC
D t
otal
33
2.4
72
.5
47.0
24
5.5
39
.9
0.0
34
.3
98.2
14
0.8
15
.6
43.6
0.
43
1.76
Bra
zil
5 6
06.5
15
3.6
4 6
41.0
86
4.4
10
1.2
0.
0 2
795
.8 1
764
.0
366.
8
246.
5
433.
6
2.68
4.
27Ch
ina
1 2
49.7
11
2.1
84
4.4
33
8.7
66
.7
0.0
70
2.4
28
3.8
10
1.2
72
.3
90.0
1.
78
1.13
Indi
a
1 5
87.2
- 27.
2
444.
6
321.
0
804.
5
17.1
91
3.4
22
2.2
22
7.2
12
2.8
10
1.6
4.
25
11.1
4R
ussi
an F
eder
atio
n
34
2.0
34
.3
280.
5
61.4
0.
1
0.0
21
8.9
47
.9
44.4
14
.8
15.9
2.
03
7.22
Sout
h A
fric
a
1.So
urce
s:CO
2 E
mis
sion
s fr
om F
uel C
ombu
stio
n, IE
A, P
aris
, 200
8;En
ergy
Bal
ance
s of
OEC
D C
ount
ries
, IE
A, P
aris
, 200
8;En
ergy
Bal
ance
s of
Non
-OEC
D C
ount
ries
, IE
A, P
aris
, 200
8;M
ain
Econ
omic
Indi
cato
rs,
OEC
D, P
aris
, 200
8.2.
49
Rus
sian
Fed
erat
ion
Sout
h A
fric
a1
2 h
ttp:
//dx
.do
i.org
/10.
1787
/468
0383
6854
4Ca
lcul
ated
usi
ng t
he IE
A e
nerg
y ba
lanc
es, t
he In
terg
ove
rnm
enta
l Pan
el o
n Cl
imat
e Ch
ange
Sec
tora
l A
ppro
ach
and
the
defa
ult
emis
sio
ns fa
ctor
s fr
om t
he R
evis
ed 1
996
IPC
C G
uide
lines
for
Nat
iona
l G
reen
hous
e G
as In
vent
ori
es. T
hey
may
diff
er fr
om N
atio
nal C
om
mun
icat
ions
sub
mit
ted
to t
he U
N
Fram
ewo
rk C
onve
ntio
n on
Clim
ate
Chan
ge.
Incl
udes
indu
stri
al w
aste
and
non
-ren
ewab
le m
unic
ipal
was
te.
Indi
a
Spai
n
Swed
en
Swit
zerl
and
Turk
ey
Uni
ted
King
dom
Uni
ted
Stat
es
G7
EU27
OEC
D t
otal
Bra
zil
Chi
na
Slov
ak R
epub
lic
Nor
way
Pola
nd
Port
ugal

50
Ed
ucat
ion
> Ex
pend
itur
e, 2
005*
50
5.
81
4.27
11
3
1.53
5 9
92 8
408
14
579
10
9
111
43
289
53
Aus
tral
ia
5.
51
5.16
10
5
0.35
8 2
59 9
751
14
775
10
4
137
39
424
69
Aus
tria
*
6.
03
5.78
10
7
0.25
6 6
48 7
731
11
960
96
96
....
Belg
ium
*
6.
20-1
4.
68-1
10
6-1
1.
52-1
.. 7
837
-1..
11
5-1
.. 2
4 34
0
40Ca
nada
*
4.
65
4.07
13
0
0.57
2 8
12 4
847
6 6
49
139
11
1 3
9 89
8
136
Czec
h Re
publ
ic
7.
38
6.81
11
4
0.57
8 5
13 9
407
14
959
11
0
114
43
058
..D
enm
ark*
5.
98
5.86
12
0
0.12
5 5
57 7
324
12
285
11
7
110
38
269
78
Finl
and*
6.
01
5.56
10
2
0.45
5 3
65 8
927
10
995
10
3
102
33
846
55
Fran
ce
5.
10
4.18
10
3
0.92
5 0
14 7
636
12
446
10
2
98 5
1 43
5
78G
erm
any
4.
21
3.95
14
7
0.25
5 1
46 8
423
6 1
30
129
15
9 3
2 03
0
67G
reec
e*
5.
61
5.12
14
7
0.49
4 4
38 3
806
6 2
44
158
83
14
976
32
Hun
gary
*
7.
96
7.23
16
0
0.73
9 2
54 8
411
9 4
74
133
12
0 2
8 09
7
61Ic
elan
d*
4.
58
4.29
13
9
0.29
5 7
32 7
500
10
468
14
7
85 4
8 65
3
66Ir
elan
d
Hun
gary
*
Icel
and*
Irel
and
Czec
h Re
publ
ic
Den
mar
k*
Finl
and*
Fran
ce
Ger
man
y
Gre
ece*
USD
usi
ng P
PPs*
USD
usi
ng P
PPs*
Aus
tral
ia
Aus
tria
*
Belg
ium
*
Cana
da*
Sala
ry p
er
stat
utor
y te
achi
ng
hour
2000
= 1
00A
nnua
l sta
tuto
ry
sala
ryTe
rtia
ry
educ
atio
n20
00 =
100
Prim
ary
educ
atio
nSe
cond
ary
educ
atio
n20
00 =
100
% o
f GD
P
Inde
x of
cha
nge
in a
nnua
l ex
pend
iture
per
stu
dent
Teac
hers
' sal
arie
s in
pub
lic lo
wer
-se
cond
ary
educ
atio
n af
ter
15 y
ears
of
exp
erie
nce,
200
6
Publ
icTe
rtia
ry
educ
atio
n
Prim
ary,
se
cond
ary
and
post
-se
cond
ary
non -
tert
iary
ed
ucat
ion
Priv
ate
% o
f GD
P
Publ
ic a
nd
priv
ate
% o
f GD
P
Expe
nditu
re o
n ed
ucat
iona
l ins
titut
ions
Ann
ual e
xpen
ditu
re p
er s
tude
nt

51
4.71
4.
26
101
0.
44 6
835
7 6
48 8
026
10
5
100
31
890
55
Ital
y*
4.
92
3.38
10
0
1.54
6 7
44 7
908
12
326
11
0
105
49
097
..Ja
pan*
7.
19
4.32
14
0
2.87
4 6
91 6
645
7 6
06
152
12
2 5
2 54
3
95Ko
rea
....
....
14
079
18
845
....
.. 9
0 58
2
141
Luxe
mbo
urg*
6.
54
5.32
12
2
1.22
1 9
13 2
180
6 4
02
118
11
3 2
3 16
1..
Mex
ico
5.
02
4.63
11
9
0.39
6 2
66 7
741
13
883
11
6
94 4
6 41
7
83N
ethe
rland
s
6.
68
5.24
11
0
1.44
4 7
80 6
278
10
262
....
36
602
39
New
Zea
land
*
..
5.67
12
4..
9 0
01 1
0 99
5 1
5 55
2
106
10
3 3
4 91
7
72N
orw
ay*
5.
93
5.38
12
6
0.55
3 3
12 3
055
5 5
93
128
13
9..
..Po
land
*
5.
72
5.30
10
3
0.42
4 8
71 6
473
8 7
87
113
12
8 3
2 86
6
48Po
rtug
al*
4.
44
3.73
11
9
0.71
2 8
06 2
716
5 7
83
147
10
6 4
7 05
0
53Sl
ovak
Rep
ublic
*
4.
63
4.12
11
6
0.51
5 5
02 7
211
10
089
11
5
123
....
Spai
n
6.
38
6.19
11
5
0.19
7 5
32 8
198
15
946
11
2
95 4
3 17
1
64Sw
eden
..
5.62
11
3..
8 4
69 1
2 86
1 2
1 73
4
108
10
5 3
1 56
5..
Swit
zerla
nd*
....
....
....
....
.. 5
9 78
1..
Turk
ey
6.
25
5.00
12
8
1.25
6 3
61 7
167
13
506
12
9
126
..
25U
nite
d Ki
ngdo
m*
7.
13
4.80
11
2
2.33
9 1
56 1
0 39
0 2
4 37
0
105
10
4 4
2 77
5..
Uni
ted
Stat
es
5.
80
5.00
11
9
0.84
6 2
52 7
804
11
512
11
9
111
40
682
68
OEC
D a
vera
ge
..
4.35
13
5..
1 4
25 1
186
9 9
94
139
83
....
Braz
il*
..
3.77
17
4..
.. 1
754
3 4
21..
....
..Ru
ssia
n Fe
dera
tion*
*A
ddit
iona
l inf
orm
atio
n, in
clud
ing
foot
note
s, a
re a
vaila
ble
via
the
Stat
Link
URL
So
urce
s:Ed
ucat
ion
at a
Gla
nce
2008
: O
ECD
indi
cato
rs, O
ECD
, Par
is,
2008
or
revi
sed
data
. ww
w.o
ecd.
org/
edu/
eag2
008.
..N
ot a
vaila
ble
or n
ot a
pplic
able
.-n
51
Dat
a in
this
cel
l are
from
n y
ears
ear
lier
than
the
ref
eren
ce y
ear.
E.g
. if t
he c
olum
n re
fers
to 2
007,
a
data
poi
nt w
ith '-
1' a
ttac
hed
refe
rs to
200
6.
12
htt
p://
dx.d
oi.o
rg/1
0.17
87/4
6806
4465
655
Port
ugal
*
Slov
ak R
epub
lic*
Spai
n
Swed
en
Switz
erla
nd*
Turk
ey
Uni
ted
King
dom
*
Uni
ted
Stat
es
OEC
D a
vera
ge
Braz
il*
Russ
ian
Fede
ratio
n*
Pola
nd*
Ital
y*
Japa
n*
Kore
a
Luxe
mbo
urg*
Mex
ico
Net
herla
nds
New
Zea
land
*
Nor
way
*

52
Ed
ucat
ion
> P
erfo
rman
ce, 2
006*
52
51
2.9
51
9.9
52
6.9
66
.7..
23
.8
59.1
15
6-1
14
3-1
2.
4
2.0
Aus
tral
ia
49
0.2
50
5.5
51
0.8
80
.3..
10
.1
21.5
16
6
181
4.
1
2.1
Aus
tria
50
0.9
52
0.3
51
0.4
66
.9..
14
.1..
15
1-1
15
5-1
4.
5
3.5
Bel
gium
52
7.0
52
7.0
53
4.5
85
.6..
24
.0
34.7
17
4-1
16
6-1
3.
9
3.7
Can
ada
48
2.7
50
9.9
51
2.9
90
.3
89.7
13
.5
29.0
16
7
197
2.
4
2.1
Czec
h Re
pub
lic*
49
4.5
51
3.0
49
5.9
81
.6
86.5
27
.1
44.6
12
8-2
14
1-2
3.
5
2.7
Den
mar
k
54
6.9
54
8.4
56
3.3
79
.6
95.4
19
.2
47.5
16
5-2
18
0-2
3.
9
2.8
Finl
and
48
7.7
49
5.5
49
5.2
67
.4..
15
.6..
15
7
176
5.
7
5.5
Fran
ce
49
4.9
50
3.8
51
5.6
83
.2
102.
7
15.1
21
.2
168
17
3
5.1
4.
4G
erm
any
45
9.7
45
9.2
47
3.4
58
.7
100.
1
15.1
20
.4..
..
7.2
4.
2G
reec
e
48
2.4
49
0.9
50
3.9
78
.1
85.4
17
.4
30.3
18
9
260
2.
2
2.2
Hun
gary
48
4.4
50
5.5
49
0.8
63
.3
90.4
25
.6
62.8
....
....
Icel
and
51
7.3
50
1.5
50
8.3
66
.2
86.5
19
.9
39.1
18
7-2
19
2-2
1.
7
2.2
Irel
and
46
8.5
46
1.7
47
5.4
51
.3
85.5
12
.4
39.4
13
4-2
18
3-2
5.
9
3.8
Ital
y
49
8.0
52
3.1
53
1.4
..
92.6
23
.0
38.6
....
2.
5
2.7
Japa
n
55
6.0
54
7.5
52
2.1
76
.7
93.0
23
.5..
20
1-3
13
8-3
2.
3
2.7
Kore
a
47
9.4
49
0.0
48
6.3
65
.5
71.6
16
.4..
14
5-4
17
0-4
4.
2
2.4
Luxe
mbo
urg
41
0.5
40
5.7
40
9.7
32
.4
42.0
14
.4..
....
3.
2
2.9
Mex
ico
Irel
and
Ital
y
Japa
n
Kore
a
Luxe
mbo
urg
Mex
ico
Icel
and
Aus
tral
ia
Aus
tria
Bel
gium
Cana
da
Czec
h R
epub
lic*
Den
mar
k
Finl
and
Fran
ce
Ger
man
y
Gre
ece
Hun
gary
Stud
ent
per
form
ance
on
the
com
bine
d re
adin
g, s
cien
tifi
c an
d m
athe
mat
ical
lite
racy
sc
ales
, mea
n sc
ore
, 200
6*
Inde
x o
f ea
rnin
g di
ffer
enti
als,
te
rtia
ry-t
ype
A t
o u
pper
-se
cond
ary
(25-
to-6
4-ye
ar-
old
s)*
% u
nem
plo
ymen
t ra
tio
at
tert
iary
-typ
e A
att
ain
men
t le
vel (
25-t
o-6
4-ye
ar-o
lds)
*U
pper
se
cond
ary
or
high
er, 2
5-to
-64
-yea
r-o
lds
Curr
ent
uppe
r se
cond
ary
grad
uati
on
rate
Tert
iary
-typ
e A
at
tain
men
t, 2
5-to
-64-
year
-old
s
Firs
t-ti
me
tert
iary
-typ
e A
gr
adua
tio
n ra
teM
en
% e
duca
tio
nal a
ttai
nmen
t o
f ad
ult
popu
lati
on
and
curr
ent
grad
uati
on
rate
s
Men
Wo
men
Wo
men
Scie
nce
Rea
ding
Mat
hs

53
506.
7
530.
7
524.
9
72.4
..
28.4
43
.0
155
-4
143
-4
2.3
2.
3N
ethe
rlan
ds
52
1.0
52
2.0
53
0.4
69
.4
73.7
23
.0
51.9
14
0
132
2.
7
2.1
New
Zea
land
48
4.3
48
9.8
48
6.5
78
.9
91.4
30
.5
42.6
13
4-1
13
4-1
1.
5
2.1
Nor
way
50
7.6
49
5.4
49
7.8
52
.7
80.1
17
.9
47.3
16
8
197
5.
3
4.7
Pola
nd*
47
2.3
46
6.2
47
4.3
27
.6..
13
.5
32.9
17
3-1
18
3-1
6.
0
4.5
Port
uga
l*
46
6.3
49
2.1
48
8.4
86
.5
82.4
13
.3
34.6
....
3.
3
2.0
Slo
vak
Rep
ublic
46
0.8
48
0.0
48
8.4
49
.8
72.0
19
.8
32.9
15
6-2
14
4-2
6.
5
4.1
Spai
n
50
7.3
50
2.4
50
3.3
84
.1
75.7
21
.7
40.6
13
2-1
14
5-1
3.
9
4.3
Swed
en
49
9.3
52
9.7
51
1.5
85
.0
89.5
19
.9
29.8
14
1
121
3.
6
2.2
Swit
zerl
and
44
7.1
42
3.9
42
3.8
28
.3
51.2
10
.4
15.2
16
2-1
16
2-1
9.
0
5.9
Turk
ey*
49
5.1
49
5.4
51
4.8
69
.1
88.3
21
.7
39.0
19
4
159
2.
1
2.3
Uni
ted
Kin
gdo
m
..
474.
4
488.
9
87.8
77
.2
34.5
35
.5
177
19
2
2.2
2.
6U
nite
d S
tate
s
49
1.8
49
7.7
50
0.0
68
.5
82.6
19
.5
37.3
....
3.
9
3.1
OEC
D a
vera
ge
39
2.9
36
9.5
39
0.3
29
.5-2
..
7.8
-2..
....
....
Bra
zil*
43
9.9
47
5.7
47
9.5
88
.0-4
..
20.8
-4..
....
....
Rus
sian
Fed
erat
ion
*A
ddit
iona
l inf
orm
atio
n, i
nclu
ding
foo
tno
tes,
are
ava
ilabl
e vi
a th
e St
atLi
nk U
RL
Sour
ces:
Educ
atio
n at
a G
lanc
e 20
08 :
OEC
D in
dica
tors
, OEC
D, P
aris
, 200
8. w
ww
.oec
d.o
rg/e
du/e
ag20
08;
..N
ot a
vaila
ble
or
not
appl
icab
le.
PISA
200
6: S
cien
ce C
ompe
tenc
ies
for
Tom
orro
w's
Wor
ld,
OEC
D, P
aris
. ww
w.p
isa.
oec
d.or
g.-n
53
Dat
a in
thi
s ce
ll ar
e fr
om
n y
ears
ear
lier
than
the
ref
eren
ce y
ear.
E.g
. if
the
colu
mn
refe
rs t
o
2007
, a d
ata
poin
t w
ith
'-1' a
ttac
hed
refe
rs t
o 2
006.
12
htt
p://
dx.d
oi.o
rg/1
0.17
87/4
6806
8587
416
Spai
n
Swed
en
Swit
zerl
and
Turk
ey*
Un
ited
Kin
gdo
m
Un
ited
Sta
tes
OEC
D a
vera
ge
Bra
zil*
Rus
sian
Fed
erat
ion
Slo
vak
Rep
ublic
Net
herl
ands
New
Zea
land
No
rway
Pola
nd*
Port
ugal
*

54
Pu
blic
fina
nce
> Ag
ricul
ture
: sup
port
est
imat
es, 2
007
54
6
1.7
1.
5- 2
- 0.2
- 0.2
0.
3Au
stra
lia
18
7.0
7.
2- 1
1- 2
.8- 3
.9
0.7
Cana
da
61
0.2
0.
2- 3
6 0
.0- 0
.1
1.2
Icel
and
45
35.
2
39.2
- 40
- 39.
4- 4
6.3
1.
0Ja
pan
60
25.
4
25.3
- 57
- 31.
4- 3
0.3
3.
0Ko
rea
14
6.0
6.
1- 5
- 2.4
- 2.4
0.
8M
exico
1
0.1
0.
1- 2
0.0
- 0.1
0.
2Ne
w Z
eala
nd
53
2.8
3.
0- 3
3- 1
.1- 1
.5
0.8
Norw
ay
50
4.2
4.
9- 3
0- 2
.0- 3
.0
1.1
Switz
erla
nd
21
13.
4
10.8
- 12
- 6.4
- 6.1
2.
8Tu
rkey
10
32.
7
30.9
5
13.0
19.
0
0.7
Unite
d St
ates
Kore
a
Mex
ico
New
Zea
land
Norw
ay
Switz
erla
nd
Turk
ey
Unite
d St
ates
Japa
n
% o
f GDP
Prod
ucer
supp
ort e
stim
ate*
Cons
umer
supp
ort e
stim
ate*
Tota
l in
billi
on U
SDTo
tal i
n bi
llion
USD
Tota
l sup
port
estim
ate*
2007
2006
2006
2007
% o
f val
ue o
f tot
al
gros
s far
m re
ceip
ts
% o
f val
ue o
f co
nsum
ptio
n ex
pend
iture
on
com
mod
ities
do
mes
tical
ly p
rodu
ced
Aust
ralia
Cana
da
Icel
and

55
26
134.
3
130.
6- 1
0- 4
5.8
- 49.
6
0.9
EU27
*
23
25
8.2
25
7.3
- 12
- 115
.9- 1
24.0
0.
9O
ECD
tota
l
6
-2
4.4
-2
2.3
-2- 3
-2- 1
.4-2
- 0.6
-2
0.8
-2Br
azil
8
-2
35.6
-2
26.1
-2- 4
-2- 1
5.7
-2- 7
.3-2
2.
3-2
Chin
a
15
-2
6.9
-2
8.4
-2- 8
-2- 5
.0-2
- 6.0
-2
1.0
-2Ru
ssia
n Fe
dera
tion
9
-2
1.0
-2
0.9
-2- 8
-2- 0
.9-2
- 0.7
-2
0.7
-2So
uth
Afric
a
*Ad
ditio
nal i
nfor
mat
ion,
incl
udin
g fo
otno
tes,
are
avai
labl
e vi
a th
e St
atLi
nk U
RL
Sour
ces:
Agric
ultu
ral P
olic
ies i
n O
ECD
Coun
trie
s: M
onito
ring
and
Eval
uatio
n, 2
007
Editi
on, O
ECD,
Par
is, 2
007.
-n
55
Data
in th
is ce
ll ar
e fr
om n
yea
rs e
arlie
r tha
n th
e re
fere
nce
year
. E.g
. if t
he c
olum
n re
fers
to 2
007,
a d
ata
poin
t with
'-1'
att
ache
d re
fers
to 2
006.
Sout
h Af
rica
12
htt
p://
dx.d
oi.o
rg/1
0.17
87/4
6813
6168
664
Russ
ian
Fede
ratio
n
EU27
*
OEC
D to
tal
Braz
il
Chin
a

56
Pu
blic
fina
nce
> G
over
nmen
t sec
tor,
200
756
35
.8-1
34
.9-1
18
.3-1
7.
9-1
2.
1-1
0.
9-1
Aust
ralia
47
.9
48.5
18
.2
17.7
1.
0- 0
.7Au
stria
48
.6
48.8
22
.4
15.6
0.
3- 0
.2Be
lgiu
m
40
.4-1
39
.3-1
19
.3-1
9.
9-1
2.
2-1
1.
0-1
Cana
da
41
.0-1
43
.6-1
21
.2-1
12
.6-1
- 0.6
-1- 2
.6-1
Czec
h Re
publ
ic
55
.6
50.8
25
.9
14.9
4.
6
4.8
Den
mar
k
52
.6
47.3
21
.2
15.1
5.
7
5.3
Finl
and
49
.7
52.4
23
.1
17.4
- 1.4
- 2.7
Fran
ce
43
.9
43.9
18
.0
17.3
0.
7
0.0
Ger
man
y
40
.2
43.3
16
.6
17.3
- 3.9
- 3.1
Gre
ece
44
.6
50.1
21
.2
15.2
- 3.7
- 5.5
Hun
gary
48
.3
43.1
24
.6
5.9
8.
6
5.2
Icel
and
37
.2-1
34
.2-1
16
.0-1
9.
3-1
5.
7-1
3.
0-1
Irela
nd
46
.6
48.5
19
.8
17.3
0.
5- 1
.9Ita
ly
34
.6-1
36
.0-1
17
.7-1
11
.4-1
- 3.0
-1- 1
.4-1
Japa
n
33
.8-1
30
.2-1
14
.8-1
3.
2-1
8.
3-1
3.
6-1
Kore
a
Irela
nd
Italy
Japa
n
Kore
a
Icel
and
Aust
ralia
Aust
ria
Belg
ium
Cana
da
Czec
h Re
publ
ic
Den
mar
k
Finl
and
Fran
ce
Ger
man
y
Gre
ece
Hun
gary
% o
f GD
P
Net
lend
ing
of g
ener
al
gove
rnm
ent
% o
f GD
P
Gen
eral
gov
ernm
ent f
inal
co
nsum
ptio
n ex
pend
iture
% o
f GD
P
Soci
al se
curit
y tr
ansf
ers
% o
f GD
P
Tota
l gen
eral
gov
ernm
ent
reve
nue
% o
f GD
P
Tota
l gen
eral
gov
ernm
ent
expe
nditu
re
% o
f GDP
Net
savi
ng o
f gen
eral
go
vern
men
t

57
41.0
38
.0
15.2
13
.2
6.4
3.
0Lu
xem
bour
g
21
.7-3
21
.1-3
11
.9-3
1.
9-3
2.
7-3
0.
6-3
Mex
ico
46
.3
45.9
25
.3
10.6
1.
3
0.4
Neth
erla
nds
44
.4-2
39
.9-2
18
.3-2
9.
4-2
6.
4-2
4.
4-2
New
Zea
land
58
.3
40.9
19
.7
12.2
18
.6
17.4
Norw
ay
40
.5
42.6
18
.1
14.4
0.
6- 2
.0Po
land
43
.1
45.8
20
.3
15.2
- 1.9
- 2.7
Port
ugal
34
.0-1
37
.7-1
19
.5-1
12
.0-1
- 3.4
-1- 3
.7-1
Slov
ak R
epub
lic
41
.0
38.7
18
.4
11.6
5.
2
2.2
Spai
n
56
.0
52.6
25
.9
15.3
4.
5
3.4
Swed
en
34
.7-2
35
.4-2
11
.6-2
11
.9-2
0.
3-2
- 0.7
-2Sw
itzer
land
....
12
.2..
....
Turk
ey
41
.8
44.6
21
.6
12.8
- 1.3
- 2.9
Unite
d Ki
ngdo
m
34
.2-1
36
.6-1
16
.0-1
12
.1-1
- 1.5
-1- 2
.5-1
Unite
d St
ates
Sour
ces:
..No
t ava
ilabl
e or
not
app
licab
le.
Natio
nal A
ccou
nts o
f OEC
D Co
untr
ies,
OEC
D, P
aris,
200
8.
-n
57
12
htt
p://
dx.d
oi.o
rg/1
0.17
87/4
6815
5324
423
Data
in th
is ce
ll ar
e fro
m n
yea
rs e
arlie
r tha
n th
e re
fere
nce
year
. E.g
. if
the
colu
mn
refe
rs to
200
7, a
dat
a po
int w
ith '-
1' a
ttac
hed
refe
rs to
20
06.
Spai
n
Swed
en
Switz
erla
nd
Turk
ey
Unite
d Ki
ngdo
m
Unite
d St
ates
Slov
ak R
epub
lic
Luxe
mbo
urg
Mex
ico
Neth
erla
nds
New
Zea
land
Norw
ay
Pola
nd
Port
ugal

58
P
ub
lic fi
nan
ce >
Tax
atio
n, 2
005
58
30
.9
39.8
19
.3
0.0
0.
0
27.8
13
.2
48.5
30
.0
76.0
89
.1A
ustr
alia
42
.1
22.1
5.
4
14.0
16
.2
28.4
14
.0
42.7
25
.0
67.2
81
.8A
ustr
ia
45
.4
30.5
7.
7
9.4
18
.5
25.3
8.
6
45.1
34
.0
58.0
77
.9B
elgi
um
33
.4
35.6
10
.5
6.0
8.
4
25.4
14
.1
46.4
36
.1
76.1
87
.7C
anad
a
37
.8
12.2
12
.0
9.7
27
.4
31.3
7.
5
28.0
26
.0
75.9
98
.3C
zech
Rep
ublic
50
.3
48.7
7.
6
2.1
0.
1
32.2
9.
3
55.0
28
.0
59.2
71
.2D
enm
ark
44
.0
30.7
7.
6
5.0
20
.4
31.3
4.
9
49.9
26
.0
68.7
76
.4Fi
nlan
d
44
.1
17.3
6.
2
9.2
25
.0
25.3
16
.9
36.5
35
.0
71.1
83
.1Fr
ance
34
.8
23.3
4.
9
17.4
19
.2
29.0
6.
1
44.3
38
.9
56.7
76
.2G
erm
any
27
.3
14.8
10
.3
14.1
16
.0
34.6
10
.2
33.6
32
.0
76.2
74
.5G
reec
e
37
.2
18.0
5.
7
6.3
24
.6
39.7
5.
8
56.0
16
.0
66.3
80
.4H
unga
ry
41
.4
34.8
5.
6
0.2
7.
8
40.4
11
.3
38.2
18
.0
74.4
93
.9Ic
elan
d
30
.6
27.3
11
.2
4.6
9.
3
37.8
9.
9
42.0
12
.5
84.7
10
4.4
Irel
and
41
.0
25.5
6.
8
5.5
21
.4
26.4
14
.4
44.1
33
.0
72.7
89
.2It
aly
27
.4
18.3
15
.5
15.9
16
.7
19.4
14
.1
47.1
39
.5
81.5
85
.8Ja
pan
25
.5
13.3
16
.0
12.1
8.
9
34.3
15
.4
35.6
27
.5
90.1
91
.3Ko
rea
38
.6
19.0
15
.5
12.3
12
.2
28.8
12
.3
33.9
30
.4
72.7
99
.2Lu
xem
bour
g
19
.9
24.1
..
15.7
..
56.7
3.
5
22.5
30
.0
95.4
95
.4M
exic
o*
Icel
and
Irel
and
Ital
y
Japa
n
Kore
a
Luxe
mb
our
g
Mex
ico
*
Hun
gary
Mar
ried
wit
h
two
chi
ldre
n*
Au
stra
lia
Au
stri
a
Bel
giu
m
Can
ada
Cze
ch R
epub
lic
Pers
ona
l in
com
e ta
xEm
plo
yers
Empl
oye
es
Den
mar
k
Finl
and
Fran
ce
Ger
man
y
Gre
ece
Tota
l tax
re
ceip
ts
% o
f to
tal t
ax r
ecei
pts
Hig
hest
rat
es o
f in
com
e ta
xes*
% o
f gr
oss
pay
*
Soci
al s
ecur
ity
cont
ribu
tio
ns
% o
f G
DP
Pers
ona
l in
com
e ta
xC
orp
ora
te
inco
me
tax
Taxe
s o
n go
od
s an
d se
rvic
es
Tax
stru
ctur
esD
ispo
sabl
e in
com
e o
f av
erag
e w
ork
er*
Oth
er t
axes
Sing
le p
erso
n%
Co
rpo
rate
in
com
e ta
x%

59
39.1
18
.0
9.8
16
.5
10.7
31
.7
13.3
52
.0
31.5
67
.7
78.0
Net
herl
ands
37
.8
41.1
16
.8
0.0
0.
0
32.1
10
.1
39.0
33
.0
79.6
85
.6N
ew Z
eala
nd
43
.7
22.1
27
.0
6.9
12
.3
27.9
3.
7
43.5
28
.0
71.0
79
.7N
orw
ay
34
.3
12.6
6.
1
39.7
..
36.7
4.
9
26.2
19
.0
68.2
70
.1Po
lan
d*
34
.8
15.7
8.
8
10.2
20
.9
39.3
5.
2
35.6
27
.5
77.6
89
.5Po
rtug
al
31
.6
8.4
8.
7
9.6
22
.4
39.7
11
.2
14.4
19
.0
77.9
97
.0Sl
ova
k R
epub
lic
35
.8
18.0
10
.8
5.3
23
.6
28.0
14
.2
45.0
35
.0
79.8
87
.2Sp
ain
50
.7
31.6
7.
5
5.5
21
.0
26.1
8.
3
51.6
28
.0
68.8
76
.0Sw
eden
29
.7
35.7
8.
9
11.2
10
.8
23.6
9.
9
37.8
21
.3
78.3
90
.5Sw
itze
rlan
d
32
.3
14.7
7.
1
7.7
10
.2
49.3
10
.9
35.6
30
.0
69.5
69
.5Tu
rkey
36
.5
28.6
9.
3
7.8
10
.4
30.3
13
.1
40.0
30
.0
73.1
79
.7U
nite
d K
ingd
om
27
.3
35.1
11
.4
10.8
12
.6
17.4
12
.7
41.3
39
.3
75.7
89
.1U
nite
d S
tate
s
39
.7
24.7
8.
6
9.3
16
.3
30.3
10
.7
43.4
29
.8
70.3
82
.9EU
ave
rage
36
.2
24.6
10
.3
8.4
14
.5
31.9
9.
0
40.4
28
.6
73.7
84
.9O
ECD
ave
rage
*A
ddi
tion
al in
form
atio
n, in
clud
ing
foo
tnot
es, a
re a
vaila
ble
via
the
Stat
Link
URL
So
urce
s:R
even
ue S
tati
stic
s, 1
965-
2006
, OEC
D, P
aris
, 200
7;
..N
ot a
vaila
ble
or
not a
pplic
able
.Ta
Wag
es, 2
006-
2007
, OEC
D, P
aris
, 200
7.
59
Un
ited
Stat
es
EU a
vera
ge
OEC
D a
vera
ge
12
htt
p://
dx.d
oi.o
rg/1
0.17
87/4
6817
8478
114
Slo
vak
Rep
ublic
Spai
n
Swed
en
Swit
zerl
and
Turk
ey
Un
ited
King
dom
Por
tuga
l
Net
herl
and
s
New
Zea
land
No
rway
Pol
and
*

60
Pu
blic
fina
nce
> D
evel
opm
ent a
id60
2 4
71
0.30
2.
4
6.3
99
.8
15.4
0.
09
0.06
Aust
ralia
1 7
98
0.49
1.
7 1
2.8
10
0.0
27
.1
0.04
0.
08Au
stria
1 9
53
0.43
1.
9
5.2
99
.4
31.4
0.
06
0.18
Belg
ium
3 9
22
0.28
3.
8
5.7
10
0.0
31
.3
0.09
0.
10Ca
nada
2 5
63
0.81
2.
5- 1
.7
100.
0
34.5
0.
03
0.31
Denm
ark
97
3
0.40
0.
9
7.6
10
0.0
45
.5
0.01
0.
14Fi
nlan
d
9 9
40
0.39
9.
6
6.3
94
.7
25.3
..
0.12
Fran
ce
12
291
0.
37
11.8
7.
9
95.6
32
.6
0.05
0.
09Ge
rman
y
50
1
0.16
0.
5
2.9
10
0.0
55
.4
0.00
0.
04Gr
eece
1 1
90
0.54
1.
1 1
4.8
10
0.0
38
.1
0.18
0.
28Ire
land
3 9
29
0.19
3.
8
3.5
10
0.0
45
.0
0.01
0.
04Ita
ly
7 6
91
0.17
7.
4- 0
.1
89.6
34
.6
0.01
0.
07Ja
pan
36
5
0.90
0.
4
5.7
10
0.0
29
.5
0.02
0.
35Lu
xem
bour
g
6 2
15
0.81
6.
0
2.7
10
0.0
21
.5
0.04
0.
21Ne
ther
land
s
Finl
and
Fran
ce
Germ
any
Gree
ce
Irela
nd
Italy
Japa
n
Luxe
mbo
urg
Neth
erla
nds
Offi
cial
Dev
elop
men
t Ass
istan
ce (O
DA)
Aust
ralia
Aust
ria
Belg
ium
Cana
da
Annu
al a
vera
ge %
ch
ange
in v
olum
e
2007
Mill
ion
USD
2007
% o
f GNI
Denm
ark
2006
% o
f GNI
Gran
ts b
y NG
Os*
2006
% o
f GNI
ODA
to LD
Cs*
2006
% o
f ODA
co
mm
itmen
ts
Gran
t ele
men
t
2006
% o
f ODA
Mul
tilat
eral
aid
2007
Shar
e in
tota
l DAC
OD
A*
2001
-02/
2006
-07

61
315
0.
27
0.3
6.
8
100.
0
21.6
0.
05
0.08
New
Zea
land
3 7
27
0.95
3.
6
4.6
10
0.0
25
.6..
0.
34N
orw
ay
47
1
0.22
0.
5- 2
.3
100.
0
46.7
0.
00
0.13
Port
ugal
5 1
34
0.37
5.
0
8.2
94
.5
45.1
..
0.06
Spai
n
4 3
34
0.93
4.
2
8.1
10
0.0
27
.9
0.00
0.
30Sw
eden
1 6
80
0.37
1.
6
5.5
10
0.0
23
.8
0.10
0.
11Sw
itzer
land
9 9
21
0.36
9.
6
9.7
10
0.0
30
.0
0.02
0.
16U
nite
d Ki
ngdo
m
21
753
0.
16
21.0
9.
9
100.
0
10.1
0.
07
0.05
Uni
ted
Stat
es
69
446
0.
23
66.9
6.
8
96.7
25
.0
0.04
0.
07G
7
61
577
0.
40
59.7
6.
6
97.9
31
.4
0.02
0.
12EU
15
103
136
0.
28
100.
0
6.4
97
.5
26.3
0.
04
0.09
DAC
tota
l*
*Ad
ditio
nal i
nfor
mat
ion,
incl
udin
g fo
otno
tes,
are
ava
ilabl
e vi
a th
e St
atLi
nk U
RL
Sour
ces:
2007
dat
a ar
e pr
elim
inar
yO
ECD
/DAC
Sta
tistic
s, w
ww
.oec
d.or
g/da
c/st
ats.
..N
ot a
vaila
ble
or n
ot a
pplic
able
.
61
12
htt
p://
dx.d
oi.o
rg/1
0.17
87/4
6823
4666
275
Spai
n
Swed
en
Switz
erla
nd
Uni
ted
King
dom
Uni
ted
Stat
es
G7
EU15
DAC
tota
l*
Port
ugal
New
Zea
land
Nor
way

62
In
tern
atio
nal
tra
de
and
inve
stm
ent
> D
irec
t in
vest
men
t62
2.
5
1.8
23
.6
7.6
2.
7
1.5
25
.7
6.4
31
5.1
10
1.1
28
0.7
72
.0A
ust
ralia
8.
2
1.3
30
.7
2.7
8.
4
1.0
31
.4
2.0
12
6.9
19
.5
126.
7
14.0
Au
stri
a
31
.4
6.2
15
7.9
16
.5
46.5
2.
9
233.
7
7.9
....
....
Bel
giu
m-L
uxe
mb
our
g*
7.
5
1.8
10
7.4
11
.5
3.5
3.
6
49.5
23
.1
506.
9
135.
9
520.
7
153.
0C
anad
a
5.
2
2.3
9.
1
1.3
0.
8..
1.
3..
10
1.1
9.
2
7.0
0.
5C
zech
Rep
ublic
3.
6
1.6
11
.2
2.8
5.
5
2.5
17
.0
4.2
15
4.2
22
.3
180.
0
28.1
Den
mar
k
3.
5
1.7
8.
5
2.1
3.
5
4.3
8.
6
5.3
85
.2
9.5
11
3.0
20
.3Fi
nla
nd
6.
1
1.6
15
8.0
23
.2
8.7
2.
5
224.
6
35.6
1 0
26.6
19
5.9
1 3
82.2
23
7.2
Fran
ce
1.
5
0.6
50
.912
.2.
5.
0
1.9
16
7.5
41
.8
855.
8
190.
7 1
217
.7
296.
3G
erm
any
0.
6
0.7
1.
9
1.1
1.
7
0.0
5.
3..
52
.8
13.1
30
.8
27.9
Gre
ece*
4.
0
8.9
5.
6
4.2
3.
0
1.0
4.
1
0.5
97
.4
18.0
18
.3
0.6
Hu
ngar
y
19
.2
2.0
3.
8
0.1
62
.4
0.8
12
.5
0.1
12
.1
0.3
27
.4
0.3
Icel
and
10
.2
3.3
25
.9
2.7
8.
7
1.2
22
.1
1.0
15
6.6
62
.5
123.
3
20.3
Irel
and*
1.
9
0.4
40
.2
5.0
4.
3
1.0
90
.8
12.2
36
4.8
85
.4
520.
1
139.
4It
aly
0.
5
0.1
22
.5
3.2
1.
7
0.6
73
.5
26.0
13
2.9
27
.1
542.
6
271.
9Ja
pan
0.
2
0.6
1.
6
2.8
1.
6
0.9
15
.3
4.4
..
119.
1..
49
.2K
ore
a*
....
....
....
....
66
.7
17.3
33
.4
5.0
Luxe
mb
our
g*
2.
6
3.5
23
.2
14.2
0.
9
0.0
8.
3..
23
6.2
55
.8
30.8
..M
exic
o*
13
.0
2.9
99
.5
11.1
4.
1
6.3
31
.2
24.5
67
3.4
12
2.2
85
1.3
19
8.5
Net
her
lan
ds
2.
2
2.9
2.
9
1.9
2.
1-
2.3
2.
8-
1.6
71
.5
31.4
14
.1
5.6
New
Zea
lan
d
0.
2
2.5
0.
6
4.0
2.
9
3.3
11
.2
5.3
99
.5
20.7
11
9.5
27
.5N
orw
ay*
Net
herl
ands
New
Zea
lan
d
No
rway
*
Mex
ico
*
Finl
and
Fran
ce
Ger
man
y
Gre
ece*
Hun
gary
Icel
and
Irel
and
*
Ital
y
Japa
n
Kore
a*
Luxe
mbo
urg*
Den
mar
k
% o
f G
DP
Bill
ion
USD
% o
f G
DP
Bill
ion
USD
2007
1997
2007
1997
2007
1997
Aus
tral
ia
Aus
tria
Bel
gium
-Lux
embo
urg
*
Can
ada
Cze
ch R
epu
blic
Bill
ion
USD
Bill
ion
USD
Dir
ect
inve
stm
ent
flo
ws
Dir
ect
inve
stm
ent
posi
tio
ns
Infl
ow
sO
utf
low
sIn
war
dO
utw
ard
2007
1997
2007
1997
2007
1997

63
4.2
3.
1
17.6
4.
9
0.8
0.
0
3.2
..
105.
3
180.
5
115.
4
8.4
Po
lan
d*
2.
5
2.1
5.
6
2.4
2.
8
1.9
6.
2
2.1
11
4.2
22
.4
69.2
5.
7P
ort
uga
l
3.
9
1.1
2.
9
0.2
0.
3
0.4
0.
2
0.1
45
.3
2.1
1.
5
0.2
Slo
vak
Rep
ubl
ic
3.
7
1.1
53
.4
6.4
8.
3
2.2
11
9.6
12
.5
568.
8
105.
3
681.
7
53.0
Spai
n
4.
1
4.4
18
.8
11.0
8.
1
5.1
36
.7
12.6
25
4.4
41
.5
308.
7
78.2
Swed
en
9.
5
2.5
40
.46.
6.
12.0
6.
8
51.0
17
.7
278.
2
59.5
60
3.6
16
5.4
Swit
zerl
and
3.
3
0.4
22
.0
0.8
0.
3
0.1
2.
1
0.3
88
.3..
12
.2..
Turk
ey*
6.
7
2.5
18
6.0
33
.2
8.3
4.
6
229.
9
61.6
1 2
88.2
25
3.0
1 7
06.8
36
0.8
Uni
ted
Kin
gdo
m
1.
7
1.3
23
7.5
10
5.6
2.
4
1.3
33
3.3
10
4.8
2 4
22.8
82
4.1
3 3
32.8
1 0
68.1
Uni
ted
Stat
es
3.
4
1.3
1 3
69.1
30
1.5
4.
5
1.7
1 8
18.6
41
0.6
10
301.
2 2
745
.4 1
2 97
1.7
3 3
07.6
OEC
D t
ota
l
..
2.3
34
.6
19.7
..
0.1
7.
1
1.0
....
....
Bra
zil
..
4.3
..
44.2
..
0.3
..
2.6
....
....
Ch
ina
..
0.9
..
3.6
....
..
0.1
....
....
Ind
ia
..
1.8
52
.5
4.9
..
1.2
45
.7
3.2
....
....
Rus
sian
Fed
erat
ion
..
2.8
5.
7
3.8
..
1.7
3.
2
2.3
....
....
Sou
th A
fric
a
*A
ddi
tio
nal
info
rmat
ion,
incl
udi
ng
foo
tno
tes,
are
ava
ilab
le v
ia t
he S
tatL
ink
UR
L So
urce
s:In
tern
ati
ona
l Dir
ect
Inve
stm
ent
Dat
abas
e, O
ECD
, Par
is, 2
008.
..N
ot
avai
labl
e o
r no
t ap
plic
able
.
63
12
htt
p:/
/dx.
doi.o
rg/1
0.17
87/4
6831
1355
862
OEC
D t
ota
l
Bra
zil
Ch
ina
Indi
a
Rus
sian
Fed
erat
ion
Sout
h A
fric
a
Un
ited
Sta
tes
Pola
nd*
Port
uga
l
Slo
vak
Rep
ublic
Spai
n
Swed
en
Swit
zerl
and
Turk
ey*
Un
ited
Kin
gdo
m

64
In
tern
atio
nal
tra
de
and
inve
stm
ent
> T
rad
e, 2
006
64
17
1.6
8.
9
162.
5
3.9
13
2.7
11
.5
77.5
- 4.
7
123.
3
16.3
32
.4-
1.8
92
.9A
ust
ralia
16
6.8
5.
1
182.
8
7.5
13
4.2
11
.8
76.4
- 1.
9
134.
1
13.9
85
.8-
1.0
99
.9A
ust
ria
33
5.6
2.
7
348.
3
2.6
35
3.7
10
.5
75.3
- 2.
0
369.
1
10.5
81
.8-
1.3
10
4.4
Bel
gium
42
9.9
5.
0
462.
6
0.7
34
9.9
11
.3
81.5
- 0.
6
388.
1
7.7
64
.7-
0.8
11
0.9
Can
ada
10
4.0
14
.2
109.
0
15.8
93
.4
22.1
83
.4-
2.3
95
.1
21.6
91
.5
0.8
10
1.8
Cze
ch R
epub
lic
13
5.5
14
.1
143.
1
9.0
84
.5
12.7
80
.1
0.5
90
.1
8.2
68
.8-
1.2
10
6.6
Den
mar
k
84
.3
7.8
94
.7
11.8
69
.4
18.6
70
.3-
4.1
77
.3
18.6
86
.7-
0.8
11
1.4
Finl
and
63
6.4
6.
1
607.
9
5.4
52
9.9
11
.3
75.4
- 1.
4
479.
0
10.3
83
.1-
0.2
90
.4Fr
ance
1 1
54.3
11
.2 1
312
.8
12.5
92
2.2
18
.3
77.8
- 0.
6 1
122
.0
14.8
91
.3-
0.4
12
1.7
Ger
man
y
92
.5
8.7
58
.8
5.1
63
.7
16.0
68
.0-
1.0
20
.9
19.4
62
.2-
1.1
32
.8G
reec
e
87
.4
14.7
88
.0
19.0
77
.0
16.8
87
.3
3.4
74
.1
18.9
90
.4
0.6
96
.2H
unga
ry
8.
3
10.2
5.
3-
5.0
6.
0
20.0
78
.3-
2.1
3.
5
12.9
28
.6-
11.5
58
.3Ic
elan
d
15
1.8
4.
4
175.
3
4.4
76
.6
9.0
82
.2-
1.7
10
8.8
- 1.
1
88.2
- 2.
0
142.
0Ir
elan
d
53
2.1
5.
9
516.
7
6.2
44
2.6
15
.0
74.7
0.
3
417.
2
11.9
88
.7-
0.3
94
.3It
aly
64
8.4
4.
2
703.
0
9.5
57
9.1
12
.3
56.0
- 2.
8
646.
7
8.7
97
.0-
0.3
11
1.7
Jap
an
37
3.8
11
.3
382.
0
11.8
30
9.4
18
.5
61.2
- 3.
8
325.
5
14.5
91
.2-
1.4
10
5.2
Kore
a
57
.9
7.2
70
.5
9.6
19
.6
11.4
73
.5-
1.2
14
.2
11.8
91
.5-
3.2
72
.4Lu
xem
bour
g
Cze
ch R
epu
blic
Fin
land
Fran
ce
Ger
man
y
Gre
ece
Hu
ngar
y
Icel
and
Irel
and
Ital
y
Jap
an
Kore
a
Luxe
mbo
urg
Den
mar
k
Expo
rts
(fob
)*
Tota
lM
anu
fact
urin
g, s
har
e of
to
tal t
rade
Tota
lM
anu
fact
urin
g, s
har
e of
to
tal t
rade
Au
stri
a
Bel
gium
Can
ada
Co
vera
ge
rati
o
Go
ods
and
ser
vice
s1Tr
ade
by c
om
mo
diti
es2
Imp
orts
Expo
rts
Impo
rts
(cif
)*
% o
f to
tal
trad
e%
cha
nge
20
06/2
005
Bill
ion
USD
% c
han
ge
2006
/200
5%
of
tota
l tr
ade
% c
hang
e 20
06/2
005
2006
/200
5B
illio
n U
SD%
ch
ange
20
06/2
005
Bill
ion
USD
At
curr
ent
pri
ces
and
ex
chan
ge
rate
s
Au
stra
lia
% v
olu
me
chan
ge
Bill
ion
USD
At
curr
ent
pri
ces
and
ex
chan
ge
rate
s
2006
/200
5
% v
olu
me
chan
ge

65
278.
9
12.2
26
7.9
11
.1
256.
1
15.5
86
.1- 0
.1
250.
0
16.7
77
.2- 1
.5
97.6
Mex
ico
44
1.1
8.
1
490.
9
7.0
33
1.5
17
.1
69.5
- 1.7
37
0.2
15
.7
68.1
- 1.9
11
1.7
Net
her
land
s*
32
.8- 1
.7
31.3
3.
1
26.4
0.
8
75.0
- 4.1
22
.4
3.2
40
.2
8.9
84
.8N
ew Z
eala
nd
95
.4
8.1
15
6.8
0.
4
64.3
15
.9
81.3
- 0.1
12
2.2
17
.7
26.2
0.
8
190.
0N
orw
ay
14
2.6
17
.4
137.
9
14.6
12
5.6
23
.7
81.0
1.
6
109.
6
22.6
83
.9
0.0
87
.3Po
land
76
.5
4.8
60
.9
9.3
66
.7
9.0
71
.5- 1
.0
43.4
13
.9
82.9
- 1.3
65
.1Po
rtug
al
49
.8
17.8
47
.2
20.7
44
.4
29.8
77
.9
0.5
41
.7
30.7
88
.7
1.0
93
.9Sl
ova
k Re
pub
lic
39
5.9
8.
3
320.
3
5.1
33
0.0
14
.0
71.9
- 1.8
21
4.1
11
.1
79.9
0.
6
64.9
Spai
n
16
9.8
8.
2
202.
1
8.9
12
7.1
14
.1
77.0
- 1.0
14
7.4
13
.1
84.8
- 1.4
11
6.0
Swed
en
17
3.8
6.
5
203.
6
9.9
14
1.4
11
.7
84.2
- 1.2
14
7.9
13
.0
93.3
- 0.7
10
4.6
Swit
zerla
nd
14
6.4
6.
9
120.
4
6.6
13
9.6
19
.5
85.9
15
.6
85.5
16
.3
91.2
8.
1
61.2
Turk
ey
76
7.9
9.
8
682.
2
10.7
59
8.4
16
.0
80.7
- 0.3
44
8.4
16
.7
83.9
0.
1
74.9
Uni
ted
King
dom
2 2
29.6
5.
9 1
467
.6
8.4
1 9
19.0
10
.8
75.8
- 1.0
1 0
37.0
14
.7
85.1
- 0.9
54
.0U
nite
d St
ates
6 3
98.5
6.
9 5
752
.7
8.6
5 3
41.1
13
.2
74.8
- 0.8
4 5
38.4
12
.7
86.6
- 0.5
85
.0G
7
....
....
1 9
51.8
15
.6
71.1
- 2.1
1 8
09.7
9.
0
88.3
- 1.6
92
.7EU
15*
10
171.
2
7.6
9 6
12.3
8.
5 8
414
.4
13.9
75
.2- 0
.8 7
528
.8
13.2
83
.0- 0
.6
89.5
OEC
D t
otal
....
....
91
.3
24.1
73
.2- 1
.4
137.
8
16.3
54
.4- 3
.7
150.
9Br
azil
....
....
79
1.5
19
.9
76.3
- 1.7
96
8.9
27
.2
94.5
1.
0
122.
4Ch
ina
....
....
18
5.4
23
.9
49.0
- 3.9
12
6.1
22
.0
69.8
- 3.7
68
.0In
dia
....
....
13
7.7
39
.5
81.3
3.
4
301.
6
24.9
31
.8- 1
.6
219.
0Ru
ssia
n Fe
der
atio
n
....
....
69
.2
25.8
74
.4- 5
.2
53.2
13
.2
73.3
1.
4
76.9
Sout
h A
fric
a
*A
ddit
iona
l inf
orm
atio
n, i
nclu
ding
foot
note
s, a
re a
vaila
ble
via
the
Stat
Link
URL
So
urce
s:1.
Nat
iona
l Acc
ount
s of
OEC
D C
ount
ries
, O
ECD
, Par
is, 2
008;
Inte
rnat
iona
l Tra
de b
y Co
mm
odit
y St
atis
tics
, O
ECD
, Par
is, 2
008.
2. ..N
ot a
vaila
ble
or
not
appl
icab
le.
65
Nat
iona
l acc
oun
ts b
asis
acc
ordi
ng t
o th
e 19
93 S
yste
m o
f Nat
iona
l Acc
ount
s (S
NA
).
Cust
oms
basi
s.
Bra
zil
Chi
na
Rus
sian
Fed
erat
ion
Sout
h A
fric
a1
2 h
ttp
://d
x.do
i.org
/10.
1787
/468
3134
2513
0
Ind
ia
Uni
ted
Stat
es
Net
herl
ands
*
New
Zea
lan
d
No
rway
Pola
nd
Port
ugal
Slo
vak
Repu
blic
Spai
n
Swed
en
Switz
erla
nd
Turk
ey
Uni
ted
Kin
gdom
G7
EU15
*
OEC
D t
otal
Mex
ico

66
In
tern
atio
nal t
rade
and
inve
stm
ent >
Tra
de in
ser
vice
s, 2
006*
66
32
.2
5.5
35
.2
36.2
3.
5
6.8
18
.2
33.0
6.
4
19.2
54
.0
3.9
1.
8
21.0
Aus
tral
ia
32
.5- 2
8.2
29
.9
28.6
4.
9
4.1
32
.5
46.4
- 8.0
22
.2
35.8
3.
9
1.2
36
.9A
ustr
ia
53
.0
3.5
24
.6
29.1
7.
5
2.0
36
.8
59.4
5.
8
26.3
17
.2
7.6
2.
6
46.3
Belg
ium
72
.6
11.2
23
.3
28.3
10
.6
10.1
27
.7
59.3
7.
2
18.0
24
.7
9.0
5.
5
42.7
Cana
da
11
.8
14.8
23
.3
22.6
11
.3
4.5
38
.3
13.3
12
.9
28.1
37
.7
3.0
0.
2
31.0
Czec
h Re
publ
ic
46
.0
22.1
51
.9
16.1
1.
9
2.9
27
.2
52.5
19
.2
63.2
10
.6
0.9
3.
2
22.0
Den
mar
k
15
.6
2.4
28
.5
22.0
2.
3
8.3
38
.8
16.1
- 5.4
17
.1
14.8
0.
9
6.6
60
.6Fi
nlan
d
10
7.8
2.
1
27.3
28
.9
5.6
3.
1
35.1
11
8.2
- 0.6
22
.2
39.2
1.
8
5.3
31
.5Fr
ance
21
9.5
5.
7
23.7
33
.7
3.5
3.
6
35.5
17
4.5
10
.5
23.8
18
.8
6.6
3.
4
47.4
Ger
man
y
16
.3
10.8
53
.7
18.3
6.
6
2.5
19
.0
35.6
3.
8
50.5
40
.0
1.0
0.
2
8.2
Gre
ece
11
.7
1.6
20
.7
18.3
3.
9
9.0
48
.1
13.3
3.
9
18.0
32
.1
1.3
4.
7
43.9
Hun
gary
2.
5
0.0
30
.0
42.3
2.
4
0.2
25
.3
1.8
- 10.
1
45.3
24
.2
0.6
0.
0
30.0
Icel
and
78
.4
9.6
3.
2
8.7
17
.5
26.5
44
.1
69.1
15
.2
4.2
7.
7
27.2
1.
5
59.3
Irel
and
10
0.2
11
.3
22.4
23
.0
3.8
1.
8
49.0
98
.4
10.0
15
.7
38.7
3.
7
1.1
40
.8It
aly
13
5.6
1.
0
31.6
19
.8
5.6
11
.4
31.6
11
7.3
6.
4
32.1
7.
2
6.6
17
.1
37.0
Japa
n
70
.6
20.2
33
.1
25.8
2.
2
6.4
32
.5
51.9
14
.9
49.8
10
.3
5.6
3.
9
30.4
Kore
a
30
.2
22.5
4.
0
10.4
62
.4
0.5
22
.7
50.9
24
.6
5.3
7.
1
70.3
0.
7
16.6
Luxe
mbo
urg
22
.8
6.5
11
.8
35.5
42
.3
2.2
8.
3
16.4
1.
6
11.7
74
.3
7.7
1.
0
5.3
Mex
ico*
90
.9
7.6
19
.1
18.7
3.
1
9.5
49
.6
94.1
2.
3
21.8
12
.0
2.1
11
.6
52.4
Net
herl
ands
7.
8- 5
.2
33.3
32
.4
3.7
6.
2
24.3
8.
1- 6
.0
20.6
58
.9
1.3
1.
5
17.6
New
Zea
land
Net
herl
ands
New
Zea
land
Mex
ico*
Finl
and
Fran
ce
Ger
man
y
Gre
ece
Hun
gary
Icel
and
Irel
and
Ital
y
Japa
n
Kore
a
Luxe
mbo
urg
Aus
tral
ia
Aus
tria
Bel
gium
Cana
da
Czec
h Re
publ
ic
Den
mar
k
Impo
rts
Expo
rts
Tota
l%
of t
otal
Tota
l%
of t
otal
Roy
alti
es
and
licen
se
fees
Oth
er
serv
ices
*Tr
avel
Fina
nce
and
insu
ranc
e%
cha
nge
2006
/200
5Tr
ansp
ort
Oth
er
serv
ices
*B
illio
n U
SDFi
nanc
e an
d in
sura
nce
Roya
ltie
s an
d lic
ense
fe
esTr
ansp
ort
Trav
elB
illio
n U
SD%
cha
nge
2006
/200
5

67
31.4
6.
3
29.8
36
.7
4.2
1.
8
27.6
32
.9
12.2
46
.3
10.9
3.
3
2.3
37
.2N
orw
ay
18
.3
27.8
23
.1
31.4
4.
2
7.2
34
.1
20.5
26
.0
34.0
35
.2
1.5
0.
2
29.2
Pola
nd
11
.6
10.8
30
.7
28.4
4.
3
3.0
33
.7
17.7
16
.4
22.5
47
.0
2.1
0.
5
28.0
Port
ugal
4.
7
16.1
27
.0
22.2
9.
6
2.2
38
.9
5.4
22
.7
35.2
28
.0
2.9
1.
7
32.3
Slov
ak R
epub
lic*
78
.2
16.4
26
.2
21.3
7.
8
3.2
41
.5
106.
0
11.7
17
.1
48.2
4.
4
0.9
29
.4Sp
ain
36
.4
11.8
14
.2
26.3
3.
7
4.6
51
.2
49.4
15
.1
19.5
17
.1
5.4
8.
1
49.9
Swed
en
25
.5
4.0
12
.2
38.8
5.
9
34.8
8.
4
51.9
10
.0
9.0
20
.5
32.6
14
.8
23.1
Switz
erla
nd*
11
.2- 1
.6
38.5
24
.5
12.3
4.
7
19.9
24
.6- 7
.9
17.2
68
.6
2.1
..
12.1
Turk
ey*
17
5.5
6.
6
20.4
35
.9
7.1
5.
7
30.9
22
9.2
9.
5
13.4
14
.7
25.6
5.
9
40.3
Uni
ted
King
dom
34
2.8
8.
6
27.1
22
.5
14.0
7.
7
28.8
41
8.8
8.
9
16.4
25
.5
12.4
14
.9
30.8
Uni
ted
Stat
es
1 1
54.1
6.
5
25.3
27
.3
8.1
6.
3
32.9
1 2
15.7
8.
0
19.0
23
.1
11.6
9.
3
37.0
G7
....
....
....
....
....
....
....
EU-2
5 ex
tra*
....
....
....
....
....
....
....
EU-2
5*
1 8
93.6
7.
3
24.9
25
.8
8.7
7.
0
33.6
2 0
86.0
8.
4
21.3
24
.3
11.5
7.
0
35.8
OEC
D to
tal*
29
.1
20.1
22
.5
19.8
5.
5
5.7
46
.4
19.5
20
.9
17.7
22
.2
5.5
0.
8
53.9
Braz
il
10
0.8
20
.3
34.1
24
.1
9.6
6.
6
25.6
92
.0
23.6
22
.8
36.9
0.
8
0.2
39
.3Ch
ina
49
.4
2.9
25
.2
14.9
5.
2
1.9
52
.8
75.4
35
.0
10.1
11
.9
4.2
0.
1
73.6
Indi
a
44
.7
15.1
15
.0
40.8
3.
6
4.5
36
.1
30.9
23
.9
32.6
24
.7
3.1
1.
0
38.7
Russ
ian
Fede
ratio
n
14
.3
17.6
46
.4
23.7
5.
4
9.0
15
.6
12.0
7.
8
12.4
65
.5
7.2
0.
4
14.5
Sout
h A
fric
a
*Ad
ditio
nal i
nfor
mat
ion,
incl
udin
g fo
otno
tes,
are
ava
ilabl
e vi
a th
e St
atLi
nk U
RL
Sour
ces:
OEC
D S
tatis
tics
on In
tern
atio
nal T
rade
in S
ervi
ces,
Vol
ume
1, 1
997-
2006
, OEC
D/E
uros
tat,
Par
is, 2
008.
..N
ot a
vaila
ble
or n
ot a
pplic
able
.Fo
r Br
azil,
Chi
na, R
ussi
an F
eder
atio
n an
d So
uth
Afri
ca: I
MF
67
Indi
a
Russ
ian
Fede
ratio
n
Sout
h A
fric
a
12
htt
p://
dx.d
oi.o
rg/1
0.17
87/4
6831
4482
240
G7
EU-2
5 ex
tra*
EU-2
5*
OEC
D to
tal*
Braz
il
Chin
a
Uni
ted
Stat
es
Nor
way
Pola
nd
Port
ugal
Slov
ak R
epub
lic*
Spai
n
Swed
en
Swit
zerla
nd*
Turk
ey*
Uni
ted
King
dom

68
P
rice
s an
d fi
nan
ce >
Pri
ces
and
inte
rest
rat
es68
12
8.2
4
.5
137.
8
8.7
16
3.4
- 16
.5
7.81
6
.59
Aus
tral
ia*
11
9.1
3
.9
130.
5
11.9
32
4.9
- 17
.4..
4
.74
Aus
tria
12
1.3
5
.8
125.
9
8.6
13
9.4
- 21
.4..
4
.84
Be
lgiu
m
12
1.0
3
.1
115.
2
5.4
15
0.6
4.
0
3.16
3
.74
Can
ada
12
5.9
6
.7
119.
0
4.2
28
8.2
- 14
.0
4.21
5
.13
Cze
ch R
epub
lic
11
8.8
3
.8
121.
9
6.0
16
7.3
- 13
.3
5.03
4
.82
Den
mar
k
11
5.3
4
.4
112.
7
6.7
60
.8-
20.7
..
4.7
8Fi
nla
nd
11
7.5
3
.6
111.
9
2.4
83
.2-
22.7
..
4.7
3Fr
ance
11
5.4
3
.3
118.
2
4.9
82
.8-
22.1
..
4.5
2G
erm
any
13
1.9
4
.9
142.
2
12.5
80
.8-
29.0
..
5.1
7G
reec
e
15
9.4
6
.7
117.
2
3.1
24
4.0
- 21
.6
8.98
8
.50
Hun
gary
15
4.5
12
.8..
..
259.
0-
46.9
1
9.00
10
.24
Icel
and*
13
6.1
5
.0
87.5
- 2.
8
104.
5-
41.3
..
4.9
6Ir
elan
d
12
1.5
3
.8
130.
5
8.2
75
.8-
27.7
..
5.1
1It
aly
10
0.0
2
.0
106.
8
5.2
89
.3-
21.9
0.
73
1.6
0Ja
pan
13
0.1
5
.5
131.
5
15.2
24
0.1
0.
2
5.36
5
.89
Kore
a
12
2.9
4
.3
149.
1
7.4
14
1.1
8.
8..
..Lu
xem
bo
urg
*
14
2.8
5
.3
161.
0
10.4
45
5.2
- 4.
3
7.79
7
.89
Me
xico
11
9.4
2
.6
135.
8
12.0
75
.2-
15.6
..
4.7
3N
eth
erla
nds
12
4.0
4
.0
126.
0
8.9
11
6.6
- 28
.6
8.68
6
.42
New
Zea
lan
d*
Net
her
lan
ds
New
Zea
land
*
Mex
ico
Fin
lan
d
Fran
ce
Ger
man
y
Gre
ece
Hu
ngar
y
Icel
and
*
Ire
land
Ital
y
Jap
an
Ko
rea
Luxe
mb
ou
rg*
Inte
rest
rat
es
Jun
e 20
08
% c
han
ge J
une
20
08 /
Jun
e 2
007
% c
han
ge J
une
200
8 /
Jun
e 20
07%
ch
ange
Ju
ne
200
8 /
Jun
e 20
07
Sho
rt-t
erm
, %*
Long
-ter
m, %
2000
= 1
00
Jun
e 2
008
200
0 =
100
June
200
8Ju
ne
2008
Den
mar
k
Co
nsu
mer
pri
ces
Pro
du
cer
pri
ces
Shar
e p
rice
s
200
0 =
100
Au
stra
lia*
Au
stri
a
Bel
gium
Can
ada
Cze
ch R
epu
blic

69
115.
8
3.4
14
0.0
7.
4
292.
0-
2.1
6.
41
4.9
4N
orw
ay
12
4.1
4.
5
113.
2
1.6
22
9.9
- 32
.7
6.65
6.
42
Po
land
*
12
8.2
3.
4
128.
6
8.7
11
6.2
- 22
.3..
4.
96
Po
rtug
al
14
8.9
4.
6
121.
5
3.0
53
5.3
10
.0
4.06
4.
94
Slo
vak
Rep
ubl
ic
13
1.4
5.
0
133.
3
9.0
13
5.9
- 17
.1..
4.
79
Spai
n
11
6.0
4.
3
116.
4
2.3
88
.5-
26.7
4.
17
4.4
3Sw
eden
10
9.8
2.
9
111.
7
4.4
97
.3-
21.5
2.
79
3.2
9Sw
itze
rlan
d
42
0.5
1
0.6
49
8.5
17
.0
249.
8-
25.5
16
.65
16
.47
Turk
ey*
11
7.1
3.
8
123.
7
10.0
90
.7-
12.4
5.
90
5.2
1U
nite
d K
ingd
om
12
7.1
5.
0
136.
3
11.2
13
2.2
- 9.
1
2.76
4.
10
Uni
ted
Sta
tes
12
0.1
4.
1
125.
4
8.5
....
....
G7
12
1.2
4.
0
123.
4
6.9
80
.3-
21.5
4.
94
4.8
1Eu
ro a
rea*
12
3.6
4.
3
126.
0
7.8
....
....
EU27
*
12
6.3
4.
4
131.
5
8.7
....
....
OEC
D t
ota
l*
12
2.0
4.
3
127.
0
8.5
....
....
exc
l. h
igh
infl
.*
17
3.0
6.
1
239.
9
17.9
40
5.9
19
.5..
..B
razi
l
..
7.1
..
8.2
14
4.2
- 28
.4
4.20
..C
hin
a*
14
6.5
7.
7
154.
8
11.5
32
5.1
4.
6..
..In
dia
27
3.6
1
5.2
35
8.8
24
.7
879.
0
10.8
8.
00..
Ru
ssia
n F
eder
atio
n**
16
0.5
1
2.2
18
6.0
17
.7
372.
0
11.1
11
.42
9.
51
Sou
th A
fric
a*
*A
ddi
tio
nal i
nfo
rmat
ion
, in
clu
ding
fo
otn
ote
s, a
re a
vaila
ble
via
the
Sta
tLin
k U
RL
Sou
rces
:M
ain
Eco
no
mic
Ind
ica
tors
, A
ugu
st –
Vo
lum
e 2
008
issu
e 8,
OEC
D.
..N
ot
avai
lab
le o
r n
ot
app
licab
le.
69
Uni
ted
Kin
gdo
m
Sou
th A
fric
a*
12
htt
p:/
/dx.
do
i.org
/10.
178
7/46
8324
4661
42
OEC
D t
ota
l*
exc
l. h
igh
infl
.*
Ch
ina*
Ind
ia
Ru
ssia
n F
ed
era
tio
n**
Bra
zil
Slo
vak
Rep
ubl
ic
Spai
n
Swe
de
n
Swit
zerl
and
Turk
ey*
No
rway
Po
land
*
Po
rtug
al
G7
Euro
are
a*
EU27
*
Uni
ted
Sta
tes

70
P
rice
s an
d fi
nanc
e >
Insu
ranc
e an
d pe
nsio
ns70
5.
8
7.1
29
571.
5 2
1 72
2.6
216
952
.3 1
58 9
49.3
10
5.4
920
668
.4 2
68 1
80.6
11
.7
3.9
Aus
tral
ia
5.
5
5.8
8 8
73.0
12
392.
3..
45
065.
6
4.7
17
653.
8 5
673
.2
0.3
0.
2A
ustr
ia
9.
2
5.3
26
043.
6 1
1 09
2.9
....
4.
0 1
8 15
1.7
12
771.
0
0.2
0.
2B
elgi
um
7.
7
4.3
43
857.
2 6
5 67
8.3
419
783
.0..
55
.3 7
88 5
24.5
351
615
.3
1.9
2.
2Ca
nada
3.
8
2.4
2 0
91.4
3 3
15.8
10
811.
1 3
157
.4
4.7
8 2
40.7
1 4
04.1
1.
0
0.3
Czec
h R
epub
lic
....
....
....
32
.4-1
89
569.
5-1
43
639.
4
0.5
-1
0.5
-1D
enm
ark
3.
6
3.8
3 6
87.1
4 1
19.5
53
853.
8 1
6 70
0.0
71
.1 1
73 9
72.6
61
951.
7
10.7
8.
7Fi
nlan
d
12
.4
8.8
180
292
.5 1
12 2
55.4
1 6
78 2
21.3
618
008
.4
1.1
-1 2
5 09
4.1
-1..
....
Fran
ce
7.
2
6.2
92
920.
3 1
84 6
77.6
1 2
84 3
61.7
723
375
.8
4.1
136
455
.9 6
5 12
5.3
0.
5
0.1
Ger
man
y
2.
2
1.5
2 8
78.9
3 1
23.1
....
....
....
..G
reec
e
3.
4
2.2
1 9
61.4
1 9
27.5
....
10
.9 1
5 06
7.5
2 0
71.4
1.
1
0.2
Hun
gary
2.
8
2.8
40
.8
425.
6..
..
134.
0 2
6 74
8.8
6 6
36.0
11
.4
3.6
Icel
and
20
.7
8.9
36
729.
0 9
103
.8 1
77 1
49.5
23
250.
7
46.7
118
633
.2 4
5 79
1.2
....
Irel
and
7.
5
3.5
96
417.
8 5
1 03
0.0
599
404
.0 1
51 9
40.9
3.
3 6
8 68
5.6
19
575.
0
0.4
0.
2It
aly
7.
0
8.0
238
635
.4 8
3 13
3.5
1 8
84 7
65.1
1 9
88 1
85.4
23
.4-1
1 0
20 8
07.0
-1 5
80 5
19.4
0.
4-2
0.
2-2
Japa
n
11
.4
11.2
69
819.
1 3
5 34
9.3
265
916
.3 1
08 7
87.2
2.
9-1
26
264.
2-1
..
1.7
-1
0.6
-1Ko
rea
34
.5
17.1
13
420.
4 1
272
.0 6
7 92
1.2
7 8
48.4
1.
1-1
44
4.5
-1..
0.
1-1
0.
1-1
Luxe
mbo
urg
1.
8
1.2
6 7
91.5
8 4
44.0
27
651.
9..
12
.1 1
08 1
07.3
26
600.
0
0.9
0.
2M
exic
o
8.
5
8.4
32
196.
6 2
5 14
4.4
298
183
.7 2
15 0
84.4
13
2.2
928
169
.0 4
23 4
53.0
4.
2
3.6
Net
herl
ands
Czec
h R
epub
lic
Den
mar
k
Net
herl
ands
Fran
ce
Ger
man
y
Gre
ece
Hun
gary
Icel
and
Irel
and
Ital
y
Japa
n
Kore
a
Luxe
mbo
urg
Mex
ico
Finl
and
2006
1996
Fina
ncia
l ass
ets
% o
f GD
PM
illio
ns o
f U
SDM
illio
ns o
f USD
Mill
ions
of U
SD
Aus
tria
Bel
gium
Cana
da
2007
% o
f G
DP
2001
2007
% o
f GD
P
2007
% o
f GD
P
2007
Aus
tral
ia
2006
1996
Life
No
n-lif
e
Bene
fits
paid
by
pen
sion
fu
nds
Insu
ranc
ePe
nsio
n*
Dir
ect
gros
s pr
emiu
ms
2006
pre
miu
ms
Fina
ncia
l ass
ets*
Cont
ribu
tion
s to
pe
nsio
n fu
nds
Tota
l in
vest
men
t of
pe
nsio
n fu
nds

71
..
....
2 9
03.8
....
11
.1 1
4 53
4.7
7 6
86.9
1.
4
1.3
New
Zea
land
4.
8
4.3
8 5
35.1
7 7
01.1
117
862
.3 4
9 55
6.5
6.
8-1
22
875.
1-1
9 3
89.0
0.
5-1
0.
2-1
Nor
way
3.
5
1.9
6 8
01.6
5 2
92.4
23
244.
6 2
388
.3
12.2
51
115.
3 4
624
.0
1.5
..Po
land
8.
2
4.6
10
785.
0 5
414
.0 5
6 88
9.1
13
518.
1
13.7
28
050.
2 1
3 66
4.8
0.
6
0.7
Port
ugal
3.
3..
85
4.9
95
2.8
3 0
14.2
..
4.2
3 1
14.0
-1
0.0
....
Slov
ak R
epub
lic
5.
4
4.5
31
906.
6 4
0 35
9.0
224
576
.4..
7.
5 9
9 29
1.4
36
093.
8
0.7
0.
3Sp
ain
7.
2
5.2
16
389.
9 1
3 72
7.6
280
796
.4 1
58 2
73.2
9.
5-1
36
395.
3-1
18
254.
3..
..Sw
eden
10
.2
10.9
22
400.
4 1
9 51
9.0
268
713
.8..
12
3.0
-1 4
65 4
25.3
-1 2
61 3
56.6
7.
9-1
5.
3-1
Swit
zerl
and
1.
4
0.9
96
8.4
4 9
41.0
2 1
07.4
1 4
82.4
1.
2 7
920
.2..
..
0.0
Turk
ey
14
.9
11.7
256
634
.6 1
22 3
38.1
.. 8
85 3
48.3
83
.4-1
2 0
02 0
58.9
-1 1
040
471
.9
3.1
-1
3.1
-1U
nite
d Ki
ngdo
m
10
.7
9.4
527
483
.1 8
63 8
94.7
5 3
06 5
65.4
2 5
32 5
22.0
74
.3 1
0 23
8 12
7.3
7 2
07 8
78.3
....
Uni
ted
Stat
es
*A
dditi
onal
info
rmat
ion,
incl
udin
g fo
otno
tes,
are
ava
ilabl
e vi
a th
e St
atLi
nk U
RL
Sour
ces:
OEC
D, G
loba
l Pen
sion
Sta
tisti
cs;
..N
ot a
vaila
ble
or n
ot a
pplic
able
.O
ECD
, Ins
uran
ce S
tatis
tics
.-n
71
Dat
a in
thi
s ce
ll ar
e fr
om n
yea
rs e
arlie
r th
an th
e re
fere
nce
year
. E.g
. if t
he c
olum
n re
fers
to
2007
, a
data
poi
nt w
ith '-
1' a
ttac
hed
refe
rs t
o 20
06.
Swed
en
Swit
zerl
and
Turk
ey
Uni
ted
King
dom
Uni
ted
Stat
es
12
htt
p://
dx.d
oi.o
rg/1
0.17
87/4
6836
5445
102
New
Zea
land
Nor
way
Pola
nd
Port
ugal
Slov
ak R
epub
lic
Spai
n

72
P
rice
s an
d fi
nan
ce >
Fin
anci
al b
alan
ce s
heet
s an
d in
stit
utio
nal i
nve
stm
ent
72
37
1.90
18
3.52
26
.02
28
.66
33
.85
34
.14
88
.93
42
.01
20
.07
10
.20
Aus
tral
ia
25
1.89
87
.39
27
.40
64
.97
36
.66
23
.50
4.
72
1.20
54
.87
17
.41
Aus
tria
46
1.81
85
.57
14
.59
91
.75
66
.85
20
.77
4.
39
3.43
36
.39
11
.10
Bel
gium
45
4.87
13
1.93
50
.81
94
.46
33
.51
28
.34
52
.90
41
.75
38
.02
23
.57
Can
ada
16
0.62
70
.89
44
.41
34
.58
10
.25
-1
9.35
+6
4.05
-1
2.73
+6
7.52
-1
9.76
Cze
ch R
epub
lic
55
9.97
30
7.56
33
.24
35
.97
70
.51
49
.35
49
.63
35
.13
56
.34
5.
24D
enm
ark
24
7.86
10
6.89
11
1.54
44
.97
27
.96
15
.04
3.
15
3.69
+4
38.0
9
2.00
Finl
and
30
1.50
87
.78
32
.94
70
.85
90
.82
46
.56
....
83
.29
38
.01
Fran
ce
30
3.18
10
4.83
20
.55
69
.26
62
.13
37
.78
11
.21
6.
77
45.7
3
18.8
4G
erm
any*
21
7.85
71
.13
29
.39
10
5.96
4.
95
3.29
0.
55
0.09
11
.10
11
.98
Gre
ece
16
3.84
51
.58
20
.20
71
.96
8.
86
3.95
9.
10
0.33
10
.29
2.
83+1
Hun
gary
....
....
13
.75
9.
53+5
12
7.37
82
.96
+5
38.8
7
13.0
3+5
Icel
and
37
6.63
21
5.47
27
.50
29
.20
....
....
....
Irel
and
35
3.12
59
.35
26
.25
11
8.42
36
.93
24
.95
+3
1.95
1.
06+3
21
.64
8.
13It
aly
53
2.30
-1
135.
68-1
10
9.76
-1
190.
77-1
52
.08
-1
41.5
9
23.4
2-1
14
.17
69
.05
-1
38.7
0Ja
pan
32
3.18
15
2.61
68
.67
29
.19
41
.13
33
.60
+6
3.52
3.
30+6
34
.88
30
.67
+6Ko
rea
....
....
14
9.59
-1
54.8
5..
....
..Lu
xem
bour
g
14
3.47
-2
8.27
-2
3.23
-1
33.4
2-1
....
7.
89-1
0.
19+1
7.
66-1
4.
01+3
Mex
ico
63
2.51
24
7.76
22
.81
54
.72
63
.74
52
.64
12
4.57
86
.65
16
.95
14
.22
Net
herl
ands
25
7.39
20
4.13
19
9.82
59
.35
33
.59
30
.77
7.
00
6.37
17
.87
6.
44N
orw
ay*
Net
herl
ands
No
rway
*
Mex
ico
Finl
and
Fran
ce
Ger
man
y*
Gre
ece
Hun
gary
Icel
and
Irel
and
Ital
y
Japa
n
Kore
a
Luxe
mbo
urg
Aus
tral
ia
Aus
tria
Bel
gium
Cana
da
Czec
h R
epub
lic
Den
mar
k
Insu
ran
ce c
ompa
nies
*Pe
nsio
n fu
nds*
Inve
stm
ent
com
pani
es*
Fina
ncia
l bal
ance
she
ets
Fina
ncia
l ass
ets
of in
stit
utio
nal i
nves
tors
Ho
useh
olds
and
NPI
SHG
ener
al g
ove
rnm
ent
% o
f GD
P
% o
f dis
posa
ble
inco
me
% o
f GD
P
2006
1996
2006
1996
2006
2006
Tota
l ass
ets
2006
Tota
l lia
bilit
ies
1996
2006
Tota
l ass
ets
2006
Tota
l lia
bilit
ies

73
96.7
1
32.5
1
35.4
8
55.8
5
9.42
1.
51
11.1
2
0.34
+3
9.
58
0.32
Pola
nd
30
7.82
-1
142.
49-1
28
.87
71
.47
31
.73
12
.45
12
.52
8.
75
20.1
7
23.2
4+2
Port
ugal
82
.37
53
.37
31
.11
35
.15
7.
80
5.71
+5
1.
74..
6.
68
0.57
+4Sl
ovak
Rep
ublic
30
2.87
14
3.50
21
.85
46
.72
25
.13
-1
15.5
6
8.21
-1
3.68
29
.26
24
.46
Spai
n
35
4.57
14
3.54
68
.63
52
.51
94
.50
58
.32
2.
29
2.63
+5
49
.80
34
.63
+5Sw
eden
*
62
6.20
-1
207.
14-1
39
.74
-1
56.4
5-1
89
.25
-1
78.8
9+
3
108.
48-1
95
.68
+3
55
.59
-1
32.3
0+3
Swit
zerla
nd*
....
....
0.
82
0.60
....
3.
00
0.64
Turk
ey
48
3.38
17
7.20
25
.04
55
.04
96
.95
78
.25
76
.06
-1
68.4
1
34.3
4-1
23
.92
Uni
ted
King
dom
45
8.37
14
4.01
18
.20
62
.46
45
.80
38
.86
73
.97
68
.79
76
.89
43
.49
Uni
ted
Stat
es
*A
ddit
iona
l inf
orm
atio
n, in
clud
ing
foot
note
s, a
re a
vaila
ble
via
the
Stat
Link
UR
L So
urce
s:In
stit
utio
nal I
nves
tors
dat
abas
e (t
able
7IA
), O
ECD
, Par
is, 2
007;
..N
ot a
vaila
ble
or n
ot a
pplic
able
.Fi
nanc
ial B
alan
ce S
heet
s, O
ECD
, Par
is, 2
007.
-n
73
Dat
a in
this
cel
l are
fro
m n
yea
rs e
arlie
r (la
ter,
if +
n) t
han
the
refe
renc
e ye
ar. E
.g. i
f the
co
lum
n re
fers
to
2007
, a d
ata
poin
t w
ith '-
1' a
ttac
hed
refe
rs t
o 20
06.
Swed
en*
Swit
zerla
nd*
Turk
ey
Uni
ted
King
dom
Uni
ted
Stat
es
12
htt
p://
dx.d
oi.o
rg/1
0.17
87/4
6837
1325
244
Pola
nd
Port
ugal
Slov
ak R
epub
lic
Spai
n

74
P
rice
s an
d fi
nan
ce >
Dom
esti
c an
d fo
reig
n fi
nanc
e74
Aus
tral
ian
dolla
r
1.05
1.
70 1
9 75
7
201.
6
15.8
5.
4
0.0
....
..A
ustr
alia
Euro
....
7 0
91..
..
52.3
5.
4
0.81
0.
23
0.58
Aus
tria
*
Euro
....
6 2
85..
..
78.5
8.
0
0.49
- 0.0
3
0.52
Bel
gium
*
Cana
dian
dol
lar
1.
02
1.65
26
787
16
4.2
9.
8
24.2
0.
9
1.21
0.
12
1.09
Cana
da*
Czec
h ko
runa
15
.62
24
.62
23
134
18
1.0
7.
3
24.0
1.
1..
....
Czec
h R
epub
lic
Dan
ish
kron
e
4.80
7.
72 1
9 93
1
207.
6
17.3
27
.8
0.0
1.
16
0.03
1.
13D
enm
ark*
Euro
....
4 4
26..
..
30.1
1.
2
0.91
- 0.0
1
0.92
Finl
and
Euro
....
30
961
....
49
.3
3.6
0.
49
0.01
0.
48Fr
ance
Euro
....
33
073
....
38
.3
1.2
0.
96
0.26
0.
70G
erm
any
Euro
....
35
7..
..
97.1
7.
5
1.68
0.
58
1.10
Gre
ece
fori
nt
156.
00
245.
18 1
6 69
8
260.
4
10.7
55
.3
6.1
2.
61
0.23
2.
38H
unga
ry
Icel
andi
c kr
óna
79
.13
13
1.11
1 5
37
475.
3
43.0
21
.4
2.3
....
..Ic
elan
d
Euro
....
48
2..
..
18.7
1.
5
0.31
0.
02
0.29
Irel
and*
Euro
....
22
720
....
83
.9
12.0
1.
17
0.28
0.
89It
aly*
yen
10
6.93
17
3.27
599
937
11
7.7
0.
7
144.
8-1
16
.5-1
....
..Ja
pan
won
1 0
30.5
0 1
697
.44
159
284
20
2.8
13
.5
31.1
1.
0
1.96
0.
50
1.46
Kore
a*
Euro
....
....
..
0.0
1.
5
0.65
0.
07
0.59
Luxe
mbo
urg*
Mex
ican
pes
o
10.3
3
16.7
8 5
7 52
5
261.
7
12.3
22
.3
1.8
....
..M
exic
o
Luxe
mbo
urg*
Mex
ico
Kore
a*
Cze
ch R
epub
lic
Den
mar
k*
Finl
and
Fran
ce
Ger
man
y
Gre
ece
Hun
gary
Icel
and
Irel
and*
Ital
y*
Japa
n
Inco
me
befo
re
tax*
Aus
tral
ia
Aus
tria
*
Bel
gium
*
Mar
keta
ble
Can
ada*
Curr
ency
Per
USD
Per
SDR
*%
cha
nge
June
20
08 /
Jun
e 20
07
Exch
ange
rat
esM
onet
ary
aggr
egat
e
Fore
ign
fina
nce
Dom
esti
c fin
ance
No
n-m
arke
tabl
e
Net
inco
me
befo
re
prov
isio
ns*
June
200
8
2000
= 1
00
June
200
8
Mill
ion
SDR
*N
et p
rovi
sion
s
Cent
ral g
over
nmen
t de
btCo
mm
erci
al b
anks
Cur
renc
y un
its,
Jun
e 20
08R
eser
ve a
sset
sB
road
mon
ey%
of
GD
P, 2
007
% o
f ba
lanc
e sh
eet,
ann
ual a
vera
ges
2005

75
Eu
ro..
.. 7
494
....
38
.1
0.3
0.
74
0.06
0.
68N
ethe
rland
s*
N. Z
eala
nd d
olla
r
1.31
2.
15 1
1 18
8
204.
6
6.2
16
.1
4.8
1.
69
0.08
1.
61N
ew Z
eala
nd*
Nor
weg
ian
kron
e
5.14
8.
26 3
0 89
8
200.
3
9.0
10
.1
1.5
1.
22- 0
.10
1.
32N
orw
ay*
Złot
y
2.17
3.
47 4
8 74
7
214.
2
15.9
40
.1
3.1
....
..Po
land
*
Euro
....
1 4
12..
..
54.1
15
.1
1.23
0.
57
0.66
Port
ugal
Slov
ak k
orun
a
19.5
0
31.3
6 1
1 65
6
205.
8
6.1
26
.2
2.0
0.
76- 0
.33
1.
09Sl
ovak
Rep
ublic
*
Euro
....
7 4
10..
..
29.0
1.
1
1.18
0.
27
0.90
Spai
n
Swed
ish
kron
a
6.03
9.
76 1
6 48
6
182.
5
14.1
35
.2
2.0
0.
71- 0
.20
0.
91Sw
eden
Swis
s fr
anc
1.
04
1.66
30
045
13
2.8
2.
2
20.6
3.
2
1.30
0.
18
1.13
Switz
erla
nd
Turk
ish
new
lira
1.
23
2.00
46
529
73
3.0
18
.5
35.1
3.
9
4.35
1.
89
2.46
Turk
ey*
Poun
d st
erlin
g
0.51
0.
82 3
0 04
1
206.
4
10.6
37
.6
5.9
1.
12
0.24
0.
88U
nite
d Ki
ngdo
m*
US
dolla
r..
1.
63 4
8 75
7
160.
6
6.1
31
.7
4.4
2.
20
0.29
1.
91U
nite
d St
ates
..
0.64
1.
03 1
52 7
99
187.
9
10.5
....
....
..Eu
ro a
rea
....
....
17
6.3
8.
0..
....
....
OEC
D to
tal
....
....
17
0.1
7.
8..
....
....
exc
l. hi
gh in
fl.*
Real
1.
62..
122
356
34
1.0
18
.4..
....
....
Braz
il
Yuan
6.
90..
1 0
83 7
80
348.
1
17.4
....
....
..Ch
ina*
Rupe
e
42.8
2..
185
803
34
6.1
21
.6..
....
....
Indi
a
Rubl
e
23.6
4..
339
952
1 2
39.0
30
.9..
....
....
Russ
ian
Fede
ratio
n
Rand
7.
92..
19
179
37
2.0
20
.4..
....
....
Sout
h A
fric
a
*Ad
ditio
nal i
nfor
mat
ion,
incl
udin
g fo
otno
tes,
are
ava
ilabl
e vi
a th
e St
atLi
nk U
RL
Sour
ces:
Mai
n Ec
onom
ic In
dica
tors
, V
olum
e 20
08/8
- A
ugus
t, O
ECD
..N
ot a
vaila
ble
or n
ot a
pplic
able
.In
tern
atio
nal F
inan
cial
Sta
tist
ics ,
IM
F;-n
Cent
ral G
over
nmen
t D
ebt ,
OEC
D, P
aris
, 200
8;B
anki
ng S
tati
stic
s, d
atab
ase,
OEC
D, P
aris
, 200
7.
75
12
htt
p://
dx.d
oi.o
rg/1
0.17
87/4
6838
1718
540
Dat
a in
thi
s ce
ll ar
e fr
om n
yea
rs e
arlie
r th
an th
e re
fere
nce
year
. E.g
. if t
he c
olum
n re
fers
to
2007
, a
data
poi
nt w
ith '-
1' a
ttac
hed
refe
rs t
o 20
06.
Uni
ted
King
dom
*
Uni
ted
Stat
es
Euro
are
a
OEC
D to
tal
exc
l. hi
gh in
fl.*
Bra
zil
Chin
a*
Indi
a
Rus
sian
Fed
erat
ion
Sout
h Af
rica
Turk
ey*
Net
herl
ands
*
New
Zea
land
*
Nor
way
*
Pola
nd*
Port
ugal
Slov
ak R
epub
lic*
Spai
n
Swed
en
Switz
erla
nd

Not
e: F
or d
etai
ls o
n O
ECD
enla
rgem
ent a
nd e
nhan
ced
enga
gem
ent,
as w
ell a
s co
-ope
ratio
n pr
ogra
mm
es w
ith o
ther
cou
ntri
es,
plea
se v
isit
“Abo
ut O
ECD
” at
ww
w.o
ecd.
org.
OEC
D m
embe
r cou
ntri
es (s
ee p
age
4)
Enha
nced
eng
agem
ent c
ount
ries
Braz
ilCh
ina
Indi
aIn
done
sia
Sout
h Af
rica
Cand
idat
es fo
r acc
essi
onCh
ileEs
toni
aIs
rael
Rus
sian
Fed
erat
ion
Slov
enia
FOR
A BE
TTER
WO
RLD
ECO
NO
MY
Org
anis
atio
n fo
r Eco
nom
ic C
o-op
erat
ion
and
Dev
elop
men
t
MAP_essai Epson.indd 1MAP_essai Epson.indd 1 21-Oct-2008 10:47:50 AM21-Oct-2008 10:47:50 AM
1
2008OECD in graphs
GDP growth
GDP per capita
Upwardly mobile
Inflation
Population growth
Migration
Public debt
Female employment rates
Health spending
Road fatalities
Aid for the environment
Climate change
Trading partners

2
12 http://dx.doi.org/10.1787/466782815551
78
Economic growth in the OECD area grew by an average of 2.8% per year in the 20 years to 2007, slightly faster than in the previous 20 years. The fastest period was 1987-91, when growth exceeded 3%, driven mostly by EU activity. The fastest annual growth over two decades was recorded by Ireland and Korea, at over 6% per year, followed by Luxembourg with 5.2%. Average growth reached over 4% in two other countries, but four countries posted growth of below 2%. Slovak Republic, Poland and Hungary–three countries that have moved to market economies from central planning since the 1980s–delivered strong growth, though the Czech Republic grew more slowly. Canada and the US were the only G7 economies to grow faster than the OECD average over the past two decades, whereas one G7 country, Italy, tied with Switzerland as the most sluggish average performers, at 1.7%
GDP growthAverage annual, constant PPPs, %, 1988-2007
1.7
1.7
1.8
2.0
2.0
2.1
2.2
2.3
2.3
2.3
2.5
2.6
2.6
2.6
2.7
2.7
2.8
2.8
2.9
3.6
3.0
3.0
3.1
3.1
3.3
3.3
3.9
4.2
4.5
5.2
6.1
6.5
0.0 1.0 2.0 3.0 4.0 5.0 6.0 7.0
ItalySwitzerland
Czech RepublicDenmark
JapanGermany
FranceSwedenBelgium
Euro areaUnited Kingdom
AustriaNew Zealand
FinlandPortugal
OECD totalCanada
NetherlandsIcelandNorway
HungaryUnited States
GreeceMexico
SpainAustralia
PolandTurkey
Slovak RepublicLuxembourg
KoreaIreland

3
12 http://dx.doi.org/10.1787/466805477535
79
Luxembourg, which had the highest GDP per head in the OECD in 1987 at $22,459 per year, was still in the top slot in 2007 with over $80,000 per head, a rise of 265%. The profile of the top 10 has not changed much in two decades, with the US, Norway, Iceland, Canada and Switzerland still in the leading group. Denmark and Sweden have slipped back, replaced by the Netherlands and Ireland. Korea’s GDP per head jumped 321%, and Ireland’s GDP per capita grew by 342%, the fastest in the OECD area. It was one of four countries, with Luxembourg, Norway and the US, to ease above $40,000. The average for the OECD was $32,300, compared with $13,932 in 1987. Italy is below the OECD average, whereas in 1987 it was above it. Poland, Mexico and Turkey had the lowest GDP per head in 2007, at below $16,000.
GDP per capita USD, using current PPPs
0 20,000 40,000 60,000 80,000
TurkeyMexicoPoland
HungarySlovak Republic
PortugalCzech Republic
KoreaNew Zealand
GreeceItaly
SpainOECD total
Euro areaFranceJapan
GermanyUnited Kingdom
BelgiumFinland
AustraliaDenmark
SwedenIcelandAustriaCanada
NetherlandsSwitzerland
IrelandUnited States
NorwayLuxembourg
1987
2007

4
80
Information and communications technology has leapt forward since the 1990s, accelerating globalisation and economic activity along the way. Take the mobile phone business, which was spurred by competition and technological progress, as well as popular uses such as SMS text messaging. Also, many developing countries have embraced mobile phones as a way of leapfrogging heavy landline investments. The numbers speak for themselves: from just over 750,000 subscriptions worldwide in 1985 to 2.5 million in 1987, total mobile phone subscriptions shot past 11 million in 1990, and over 1 billion in 2002. The growth rate inevitably slowed from a higher base, but nevertheless surpassed 3.3 billion subscriptions in 2007. Indeed, penetration is so widespread that there are now more mobile phones in Africa than in Japan, an International Telecoms Union report says.
0
0.5
1
1.5
2
2.5
3
3.5
1986 1989 1992 1995 1998 2001 2004 2007
Billi
ons
Upwardly mobileWorld mobile phone subscribers

5
12 http://dx.doi.org/10.1787/466835403855
81
The consumer price index for energy tracked alongside prices for non-energy and non-food for most of the last two decades, but rose to a steeper trend from 2003. The energy price index for fuel, electricity and petrol jumped by 68% from mid-2003 to mid-2008, compared with 32% in the five years to end-1992 and 24% in 1998-2002. Overall consumer price inflation has been modest in the OECD area as a whole. Average monthly price rises eased down from their high of about 0.5% per month in 1987-92 to 0.3% in 1998-2003 and to 0.2% in the period to 2006. Indeed, since 2000 there have been 20 months when prices barely rose at all. But overall price rises have accelerated to 0.4% a month in the last two years, and to 0.6% in spring 2008.
InflationConsumer price indices, 2000 = 100
50
75
100
125
150
175
200
Jan-1988 Jan-1993 Jan-1998 Jan-2003 Jan-2008
Consumer price (non-food non-energy)Consumer price (energy)

6
12 http://dx.doi.org/10.1787/466846776715
82
The OECD area’s population represented nearly 18% of the world’s population in 2006, over a percentage point less than in 1987. Still, every OECD country bar two saw their populations rise in the last 20 years. Czech Republic and Hungary were the exceptions, reflecting emigration in the aftermath of the Soviet bloc’s collapse. The sharpest rise in population was Turkey’s 39% increase, from 53 million to 73 million. Germany’s rapid 35% increase reflects unification in 1990, when the 63 million population in 1990 leapt by 17 million in 1991with the absorption of the eastern Länder. The US population has risen sharply (24%), while major countries with population growth of less than 10% include the UK, Japan and Italy, with smaller countries such as Sweden, Portugal and Belgium also lagging.
Population growth%, 1987-2006
-8 -3 3 8 13 18 23 28 33 38
HungaryCzech Republic
PolandItaly
Slovak RepublicJapan
DenmarkPortugal
United KingdomFinland
BelgiumSwedenAustriaFrance
NorwayNetherlands
GreeceSpain
SwitzerlandKorea
G7OECD total
IrelandCanada
United StatesIceland
LuxembourgNew Zealand
AustraliaMexico
GermanyTurkey

7
12 http://dx.doi.org/10.1787/466860034151
83
In the OECD area where fertility rates tend to be low, net migration has played a key role in driving population and employment growth. Indeed, inward migration has exceeded outward migration since 1987 in the area, with the effect on population growth being particularly marked in former “emigration” countries, such as Spain, Portugal, Ireland and Italy. Other countries to experience strongly positive net migration include Australia, Canada and Switzerland. A new phenomenon, according to the OECD International Migration Outlook 2008, is the return of temporary migration, and in particular, circular migration, as between a fifth and a half of long-term immigrants leave the host country within five years.
0
0.1
0.2
0.3
0.4
0.5
0.6
0.7
0.8
1986 1991 1996 2001
MigrationTrend of net migration
as % of total resident population, OECD countries

8
12 http://dx.doi.org/10.1787/466861461214
Public debt (or general government debt) has risen quite sharply in the OECD as a whole since 1987, from 59% of GDP to 75% in 2007. Japan’s rose from below 60% to 170% of GDP. The figure of 60% of GDP was one of a handful of targets European governments set to prepare for economic and monetary union, and eventually the euro. But in 2007 euro area public debt stood at 71%, though this represents a decline from over 80% in 1998. The figures for France and Germany have risen, and Italy’s debt now exceeds 100% of GDP. US public debt stood slightly higher than 20 years ago, and Canada’s slightly lower. Other countries to reduce their public debt/GDP ratios include Australia, Belgium, Denmark, Ireland, Netherlands, New Zealand and Spain. General government debt covers central and local governments.
84 Public debtAs % of GDP
0 25 50 75 100 125 150 175
BelgiumGreece
ItalyNetherlands
JapanCanada
PortugalDenmark
New ZealandIreland
United StatesHungary
Euro areaAustria
OECD totalSwedenPoland
SpainUnited Kingdom
FranceSlovak Republic
GermanyCzech Republic
NorwayIceland
SwitzerlandAustralia
FinlandKorea
Luxembourg
1988
2007

9
12 http://dx.doi.org/10.1787/466885478204
The female employment rate rose in all OECD countries in our graph between 1987 and 2006, except in Finland and Sweden. (Some of the Swedish decline reflects changes in labour force survey methods in 1992-93.) The OECD average employment rate stood at 58% in 2006, up 6 percentage points since 1987. However, while women participate less in the work force than men in all OECD countries, the Nordic rate is higher than in other OECD countries. Interestingly, the countries with the highest female employment rates also report the highest birth rates. OECD believes raising female participation would boost economic performance, and this demands reforms, to provide more accessible and affordable childcare and suitable workplace arrangements for a better work-life balance. See Babies and Bosses at www.oecd.org.
85Female employment ratesEmploment/Population Ratio, 15-64
0 20 40 60 80 100
Spain
Ireland
Italy
Greece
Belgium
Netherlands
France
OECD countries
Canada
Finland
Norway
Denmark
Sweden
1987
2006

10
12 http://dx.doi.org/10.1787/467002635603
86
Health spending has risen as a percentage of GDP in every OECD country in the last two decades. It accounted for below 7% of GDP on average across OECD countries in 1987 but nearly 9% in 2006. Spending exceeded 10% of GDP in seven countries in 2006: the US, Switzerland, France, Germany, Belgium, Portugal and Austria, compared with only the US in 1987. About three quarters of health spending on average is publicly funded in the OECD area. The public share of health spending has fallen in some countries, but has risen in others, even in the US, from 40% to about 45% in 1990–2005; in fact, despite the private sector’s dominance, US public spending per capita in health is still higher than in most other OECD countries. See OECD Health Data at www.oecd.org/health
Health spending Total as % of GDP
0 5 10 15
TurkeyPolandKorea
MexicoCzech RepublicSlovak Republic
LuxembourgIrelandFinland
JapanHungary
SpainUnited Kingdom
NorwayAustralia
ItalyGreeceIceland
SwedenNetherlands
New ZealandDenmark
CanadaAustria
PortugalBelgium
GermanyFrance
SwitzerlandUnited States
1987
2006

11
12 http://dx.doi.org/10.1787/467072418213
87
Road fatalities have declined in OECD countries, thanks to a mix of better technology and design, and stricter enforcement of rules against drink driving and speeding. Greece reported the highest road fatality rate in the OECD in 2006, followed by the US, with the Netherlands and Sweden the lowest. Traffic crashes remain the single biggest killer of 15-24 year-olds in all OECD countries, particularly for young men. The World Health Organisation ranks road deaths as the main cause of global mortality by injury, far ahead of the likes of suicide, drowning, fires or war. The problem imposes great social and economic costs on individuals, families and societies; the US government has put the cost of crashes involving 15-20 year-old drivers into tens of billions of dollars. See www.internationaltransportforum.org and www.who.int
Road fatalitiesKilled per 100 000 population
0 5 10 15 20 25 30
Portugal
Hungary
Korea
New Zealand
Belgium
Poland
United States
Luxembourg
France
Spain
Austria
Greece
Canada
Switzerland
Ireland
Australia
Finland
Germany
Czech Republic
Italy
Denmark
United Kingdom
Iceland
Netherlands
Japan
Sweden
Norway
1990
2006

12
12 http://dx.doi.org/10.1787/467106846317
88
Ever since the first Earth Summit in Rio de Janeiro in 1992, the environment has been at the top of the global policy agenda. But since 1996 development aid for the environment has declined in relation to total aid. By 2005, environmentally-related aid was about $12 billion, up on its level of $10 billion in 1997. However, its share of total official development assistance (ODA) nearly halved over the same period, from 19.6% to 10.2%. Changes in aid structure explain some of the decline, while such as conservation, waste management and similar “core” programmes fell as more ODA went to debt relief and emergencies. As for water, aid remains above 40% of total environmental aid on broad definitions related to access and resource management, but ODA to water supply and sanitation declined from about 11% of total sector-allocable ODA in 1997 to about 8% in 2006.
0
5
10
15
20
25
1990 1993 1996 1999 2002 2005
Other environment related support
Water supply and sanitation
Water resources management
"Core" environment sector
Aid for the environmentODA to the environment sector as % of total ODA, 1990-2006

13
12 http://dx.doi.org/10.1787/467110781177
89
Twenty years ago global warming was a sideshow debate, but has since been recognised as mankind’s main long-term challenge. As carbon dioxide (CO2) generated by homes, businesses,
transport and other economic activities plays a role, then economic tools such as taxes and carbon markets must be in the solution. Most carbon emissions come from the OECD area: the US and EU together generated nearly 10 billion tonnes of CO2 emissions in 2006. However, emissions from
developing countries are rising, with China now around the same level as the US. And given its low emissions per capita, China has room to grow much further. Meanwhile, Luxembourg is the highest emitter per head in the world, while Russia emits more CO2 per head than Germany or Japan. See
www.oecd.org/environment
Climate changeEmissions from fuel combustion, total and per capita, 2006
0 1 000 2 000 3 000 4 000 5 000 6 000
0 5 10 15 20 25 30
IndiaBrazil
TurkeyMexico
ChinaPortugalSwedenHungary
SwitzerlandFrance
Slovak RepublicIceland
South AfricaSpain
ItalyNorwayPoland
EU27GreeceAustria
United KingdomNew Zealand
JapanKorea
GermanyDenmark
IrelandNetherlands
BelgiumRussian Federation
Czech RepublicFinlandCanada
United StatesAustralia
Luxembourg
Million tonnes, upper scale
tonnes/capita, lower scale

14
12 http://dx.doi.org/10.1787/467213443808
Globalisation has led to a shift in trade patterns over the last 20 years. China’s economic emergence is one reason: in 1988 China supplied just over 1% of total OECD imports in goods, but by 2006 this had risen to some 10%. There has also been a steady decline in the share of OECD trade among OECD countries: OECD imports from other OECD countries slid 15 percentage points, from 80% to 65% of the total. More interaction with India and China, largely because of outsourcing, helps explain this trend. A US-owned computer bought from a subcontractor in China counts as an import from China. On the other hand, OECD merchandise exports to China have risen moderately, by 4% in 2006 compared with 1% in 1988.
90 Trading partners% of merchandise trade (imports + exports)
Difference between 1988 and 2006
0.7
1.6
2.3
2.8
6.0
7.7
10.8
-10.7
-3.4
-3.3
-2.7
-2.0
-1.9
-1.8
-1.3
-0.2
-0.1
-15% -10% -5% 0% 5% 10% 15%
OECD
United States
Germany
France
United Kingdom
Netherlands
Italy
Belgium, Luxembourg
Japan
Africa
Middle East
Non-OECD America
Mexico
Canada
China
Non-OECD Asia
Non-OECD

15
General notes
Cut-off dateCut-off date for the data: August 2008.
StatLink
Totals and averages
Notes and abbreviations.. Not available or not applicable.
- Nil or negligible.
+ Growth of more than 500%
••
••
Data are for the year specified or for the latest available year. In the latter case, the data are followed by a number, corresponding to the number of years of difference from the indicated year. For instance, -1 means that the data are one year older than the other figures in the column.
91
The OECD’s award-winning StatLink delivers Excel spreadsheets of the data underlying the tables in this book. Beside each StatLink logo you will find a link or code to the corresponding spreadsheet. The OECD’s StatLink uses Digital Object Identifiers (DOIs). To download a spreadsheet, either simply go to the OECD in Figures online and click the appropriate link, or type it into your Internet browser. For instance, for background data on GDP, use StatLink: http://dx.doi.org/10.1787/864662528136. For more information, visit www.oecd.org/statistics/statlink.The online version of OECD in Figures contains additional information, including footnotes for some items.
OECD total refers to the OECD countries as a whole. OECD average is the unweighted, arithmetic average of OECD countries shown in the table. EU refers to EU27, unless otherwise specified. EU15 refers to the 15 EU member countries prior to May 2004.
Data from earlier years
For further informationPlease consult the source publication specified at the bottom of each table. Sources of graphs are available on the online edition. All OECD publications are available at www.sourceOECD.org, the OECD online library. All OECD books can be purchased on www.oecdbookshop.org.

16
Glossary of terms used in OECD in Figures
TWh Terawatt hours.
GDP Gross domestic product. The standard measure of the incomes generated from productive activity in a country.
GNI Gross national income. GNI = GDP + net receipts of wages, salaries and property income from abroad.
ISCED International standard classification of education. A system designed by UNESCO to ensure comparability of education statistics. ISCED classifies various education programmes by their level of education (primary, secondary, tertiary...) and field of education (general programmes, humanities and arts, science...).
PPP Purchasing power parities (PPPs) are the currency conversion which eliminates the differences in price levels between countries. They are used to compare the volume of GDP in different countries. PPPs are obtained by evaluating the costs of a basket of goods and services between countries for all components of GDP; PPPs are given in national currency units per US dollar (in euro per US dollar for euro area countries).
93
PCT Patent Cooperation Treaty. An international patent law treaty which provides a single procedure for filing patent applications in each of its contracting states (139 countries).
DAC OECD Development Assistance Committee.
PCT Patent Cooperation Treatry.
92
SNA The Systems of National Accounts includes definitions that ensure international comparability of national accounts aggregates such as GDP.
Mtoe Million of tonnes of oil equivalent. This is defined as 1013 kilocalories. This quantity of energy is, within a few per cent, equivalent to the net heat content of 1 million tonnes of crude oil.
NGO Non-governmental organisation.
ODA Official development assistance. Government aid to developing countries designed to promote economic development and welfare. ODA can be bilateral (from one country to another) or multilateral (via agencies such as the UN or the World Bank).
ICT Information and communication technologies.
LDC Least developed countries, group of 50 countries established by the United Nations. To be classified as an LDC, countries must fall below thresholds established for income, economic diversification and social development.

FREE OECD OBSERVER CLAIM FORMOBSP2008
To claim a year’s free subscription to OECD Observer complete the following details:
Personal Details (use CAPITAL letters)
First Name
Family Name
Address
Post/Zip Code
City
Country
Telephone
Fax
Customer ProfileTick the category corresponding to your current status❏ Academia ❏ Corporate ❏ Government ❏ IGO❏ Media ❏ NGO ❏ Student ❏ Other
Language edition Tick the version you wish to receive ❏ English ❏ French
If you do not wish to be kept informed about the latest OECD publications and events, please tick this box ❏
Return the completed form to:Customers in North AmericaTurpin DistributionThe Bleachery, 143 West StreetNew Milford, CT 06776United StatesToll free: +1 (800) 456 6323Fax: +1 (860) 350 0039E-mail: [email protected]
All other CustomersTurpin Distribution Services LimitedStratton Business Park, Pegasus DriveBiggleswade, Bedfordshire SG18 8QBUnited KingdomTel.: +44 (0) 1767 604960Fax: +44 (0) 1767 601640E-mail: [email protected]

This book has...
StatLinks2
A service that delivers Excel® fi les from the printed page!
Look for the StatLinks at the bottom right-hand corner of the tables or graphs in this book. To download the matching Excel® spreadsheet, just type the link into your Internet browser, starting with the http://dx.doi.org prefi x. If you’re reading the PDF e-book edition and your PC is connected to the Internet, simply click on the link. You’ll fi nd StatLinks appearing in more OECD books.
We’d like to hear what you think about our publications and services like StatLinks: e-mail us at [email protected]
StatLinks2: another innovation from OECD Publishing.
Learn more at www.oecd.org/statistics/statlink
Use OECD StatLinks to download
the Excel®
spreadsheets!

Ordering OECD PublicationsSend your order to the appropriate address below, via your usual vendor, or order securely online from the OECD Online Bookshop www.oecd.org/bookshop
CUSTOMERS IN NORTH AMERICA
Turpin DistributionThe Bleachery, 143 West StreetNew Milford, CT 06776United StatesToll free: +1 (800) 456 6323Fax: +1 (860) 350 0039E-mail: [email protected]
ALL OTHER CUSTOMERS
Turpin Distribution Services LimitedStratton Business Park, Pegasus DriveBiggleswade, Bedfordshire SG18 8QBUnited KingdomTel.: +44 (0) 1767 604960Fax: +44 (0) 1767 601640E-mail: [email protected]

OECD PUBLICATIONS, 2, rue André-Pascal 75775 PARIS CEDEX 16PRINTED IN FRANCE
(01 2008 06 1 P) ISBN 978-92-64-05563-6 – No. 56241 2008

20th ANNIVERSARY OFFER
FREE FOR 1 YEAR( S e e p .9 3 fo r d e t a i l s )
OECD WorldwideOECD Paris Centre
2, rue André-Pascal75775 Paris Cedex 16Tel.: 33 (0) 1 45 24 81 67 Fax: 33 (0) 1 45 24 99 30E-mail: [email protected] ordering: www.oecd.org/bookshop
OECD Berlin Centre
Schumannstrasse 10D-10117 BerlinTel.: 49 30 288 8353Fax: 49 30 288 83545E-mail: [email protected]: www.oecd.org/deutschland
OECD Washington Center
2001 L Street, NW, Suite 650 Washington DC 20036-4922Tel.: 1 202 785 6323Fax: 1 202 785 0350E-mail: [email protected]: www.oecdwash.org
OECD Tokyo Centre
3rd Floor, Nippon Press Center Building2-2-1 Uchisaiwaicho Chiyoda-ku, Tokyo 100-0011Tel.: 81 3 5532 0021 Fax: 81 3 5532 0035E-mail: [email protected]: www.oecdtokyo.org
OECD Mexico Centre
Av. Presidente Mazaryk 526Colonia: Polanco, C.P. 11560 Mexico, D.F.Tel.: 5255 9138 6233 Fax: 5255 5280 0480E-mail: [email protected]: www.oecd.org/centrodemexico
Australia
Austria
Belgium
Canada
Czech Republic
Denmark
Finland
France
Germany
Greece
Hungary
Iceland
Ireland
Italy
Japan
Korea
Luxembourg
Mexico
Netherlands
New Zealand
Norway
Poland
Portugal
Slovak Republic
Spain
Sweden
Switzerland
Turkey
United Kingdom
United States
ISBN 978-92-64-05563-601 2008 06 1 P -:HSTCQE=UZZ[X[:
2008
/Su
pp
leme
nt 1
OE
CD
in Fig
ures 20
08 O
EC
D O
bse
rver
OECD in Figures2008
Demography and health
Economy
Prices and finance
Energy
Labour
Science and technology
Environment
Education
Public finance
International trade and investment
�����������������������