Embed Size (px)
DESCRIPTION
International Gluten Workshop, 11th; Beijing (China); 12-15 Aug 2012
Citation preview

New possibilities in micro-scale wheat
quality characterisation: micro-gluten
determination and starch isolation
11th International Gluten Workshop
August 12-15, 2012
Beijing, China
S. TÖMÖSKÖZI1, SZ. SZENDI1, A. BAGDI1, A. HARASZTOS1,
G. BALÁZS1, D. DIEPEVEEN2, R. APPELS3 and F. BÉKÉS4
1 Budapest University of Technology and Economics (BUTE),
Department of Applied Biotechnology and Food Science,
Budapest, Hungary; 2Department of Agriculture and Food Western Australia
3 Centre for Comparative Genomics, Murdoch University,
Western Australia, Australia; 4 FBFD PTY LTD, Beecroft, NSW, Australia
Earlier quality-based selection of wheat lines
Studying the roles of protein
subunits in modified wheat varieties
Investigation of the effects of
different types of additives
(protein subunits, carbohydrates,
lipoproteins, etc.) on the quality
parameters.
Application in routine analytical work. However,
the causes of the differences between standard
and small-scale procedures have to be identified.
Why micro-tests?
Where the amount of sample is limited…
New possibilities in micro-scale wheat quality characterisation

Instrumental and methodological background of
micro-scale research
New possibilities in micro-scale wheat quality characterisation

Available micro-scale tools today
(most frequently used examples)
New possibilities in micro-scale wheat quality characterisation
Successful longterm ongoing Hungarian-Australian
collaboration with CSIRO Plant Industry, Newport
Scientific Ltd (Australia), Metefém Ltd and Labintern
Ltd, Hungary
New possibilities in micro-scale wheat quality characterisation

Tradition 1: Supporting the birth of wheat chemistry with Hungarian
micro-mill in Australia from 1870s
Hungarian Ganz-type
micro-mill
New possibilities in micro-scale wheat quality characterisation
F.B. Gurthi drafted the philosophy of
the wheat quality measurement and
research, namely: We have to mimic
the industrial processes in the
laboratory.

Continuation of our tradition: Sample preparation with micro
mill and sieve
Technical parameters
Optimal moisture content :
durum wheat 16 %
aestivum wheat 15 %
Milling yields : 51-70 %
Weight : 17.5 kg
Dimensions : 270×210×350 mm
Sample size : > 3 g
New possibilities in micro-scale wheat quality characterisation

50 55 60 65 70 75 80Milling Yield on Traditional Test Mills
50
55
60
65
70
75
80
Mill
ing
Yie
ld o
n M
icro
Mill
Correlation between milling
yields measured with micro-
mill vs. Quadromat-Junior
type labmill
Summary:
- Milling yields are slightly lower in
case of micro-mill.
- The mixing curves are similar and the
calculated parameters are in good
correlation.
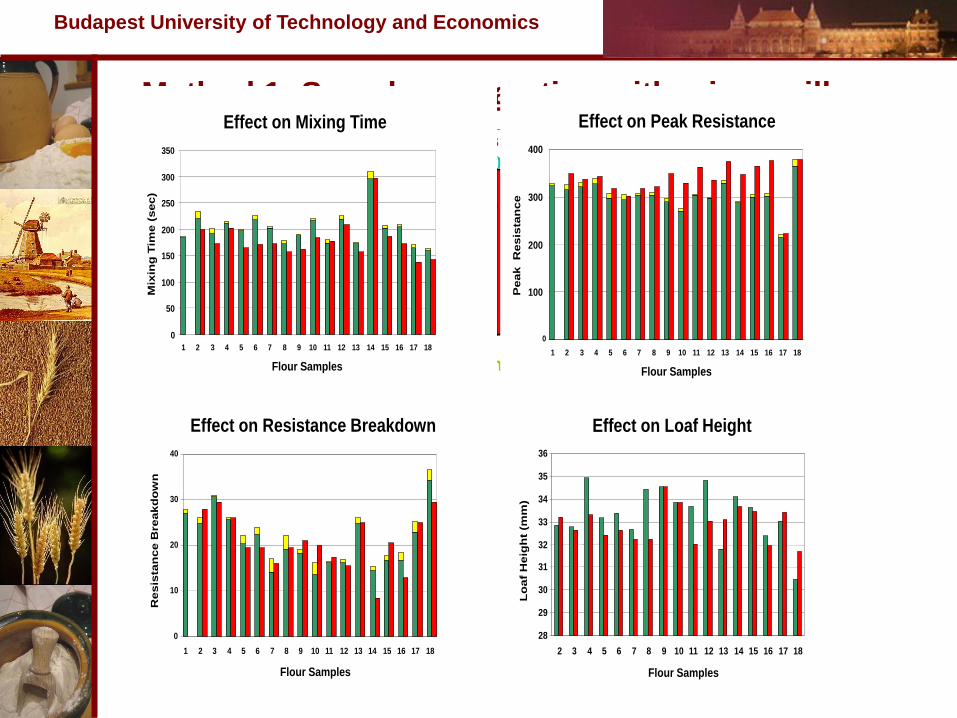
Continuation of our tradition: Comparison with standard
laboratory milling procedures
Effect on Mixing Time
0
50
100
150
200
250
300
350
1 2 3 4 5 6 7 8 9 10 11 12 13 14 15 16 17 18
Flour Samples
Mix
ing
Tim
e (
sec)
28
29
30
31
32
33
34
35
36
2 3 4 5 6 7 8 9 10 11 12 13 14 15 16 17 18
Flour Samples
Lo
af
He
igh
t (m
m)
Effect on Loaf Height
Comparison studies of
dough properties
with
BUHLER and
FQC-2000 flours
New possibilities in micro-scale wheat quality characterisation

Jenő Hankóczy
(1869 – 1939)
Hungarian inventor
of the Farinograph
and Extensograph
The prototype of the Farinograph
(1912- 1928)
Tradition 2: Development of routine tests for determination of
wheat qulaity
New possibilities in micro-scale wheat quality characterisation

Continuation of our tradition: development the prototype of
micro-scale Z-arm mixer in cooperation with CSIRO and
Newport Scientific, Australia
Macro Valorigraph
Magvas
Micro Z-arm Mixer
Magvas
New possibilities in micro-scale wheat quality characterisation

Applications: Comparison of mixing properties
Summary:
- Characteristics of curves registered with micro- and macro methods are
similar.
- The correlations between macro and micro parameters are highly
significant.
- Some alterations can be identified – for example in case of dough
development time. We have to learn more about the causes of identified
differences.
New possibilities in micro-scale wheat quality characterisation

Applications in research activities (examples)
0
50
100
150
200
250
Z-arm mixer 2g Mixograph
0
50
100
150
200
250
1 , - ,5+10
1 , 17+18, -
- , - , -
- , 17+18,5+10
- , - ,5+10
1 , 17+18,5+10
- , 17+18, -
1 , - , -
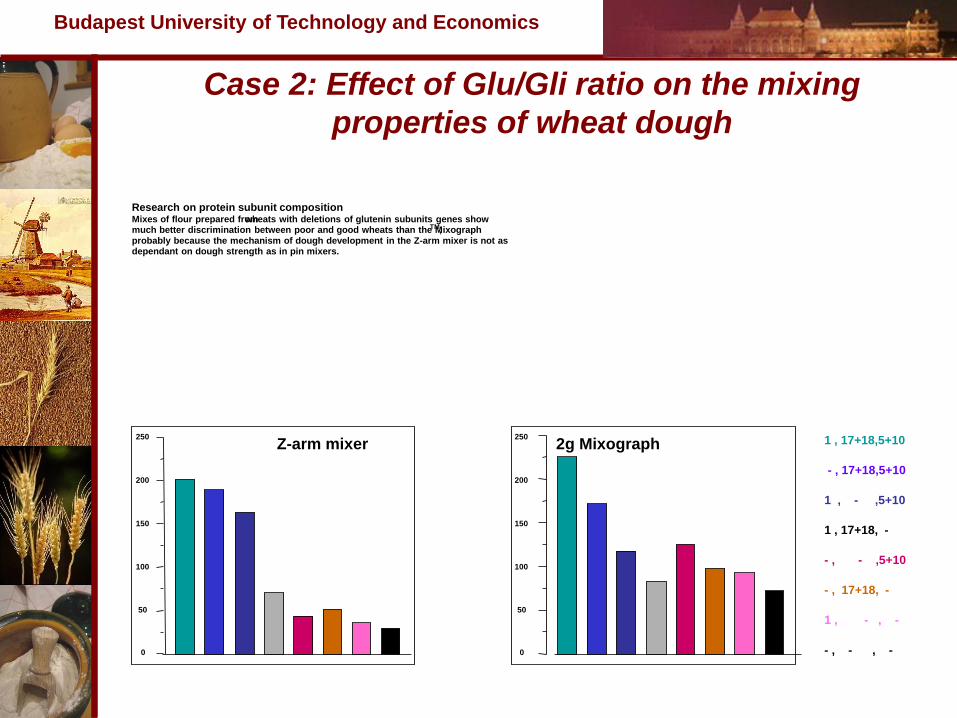
Research on protein
subunit composition
(Békés et al)
Research on glutenin
subunit incorporation into
rice dough
(Oszvald et al)
New possibilities in micro-scale wheat quality characterisation
D
D
T Mixes of flour prepared from wheat with deletions of glutenin subunits
genes show much better discrimination between poor and good wheats
than the Mixograph probably because the mechanism of dough
development in the Z-arm mixer is not as dependant on dough strength as
in pin mixers.
Please visit our poster, also: Balázs, G. et
al: Complex quality characterisation…
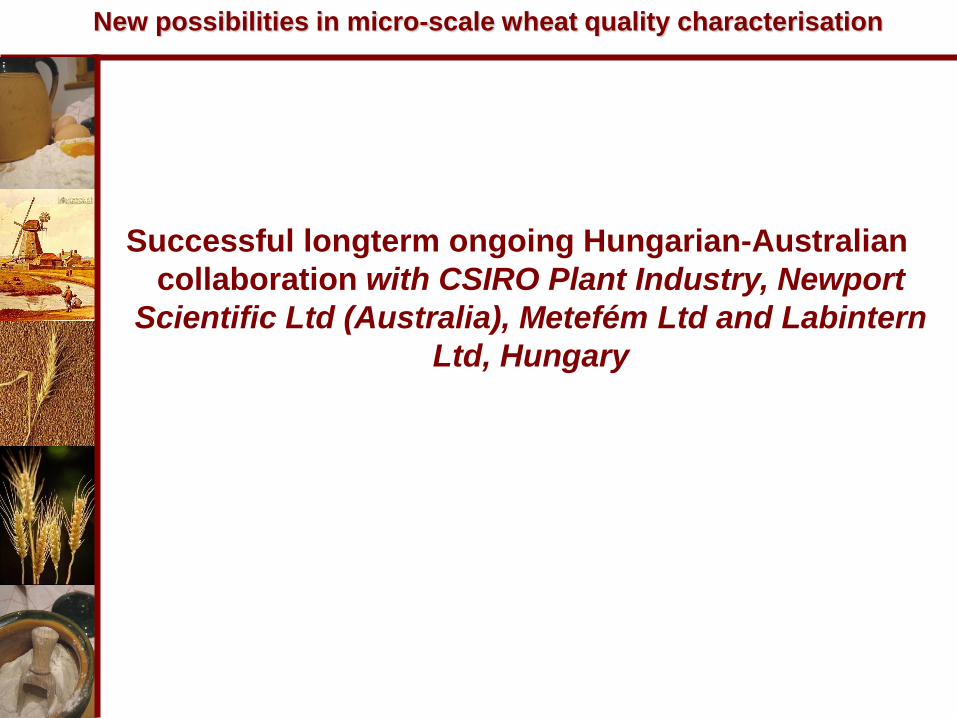
Application in routine analysis – Micro-doughLab by Perten
Instuments
Features and benefits
- Small (4 gram) Sample Size
- Correlates with Standard Tests
- Programmable Mixing Speed (Source: www.perten.com. 01 08 2012)
New possibilities in micro-scale wheat quality characterisation
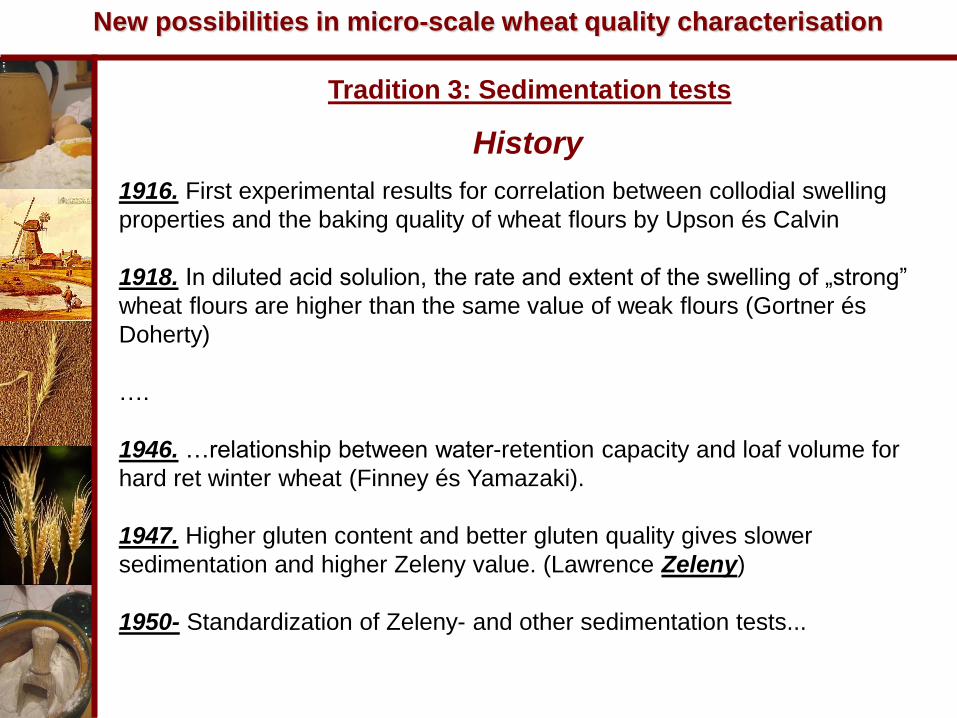
History
1916. First experimental results for correlation between collodial swelling
properties and the baking quality of wheat flours by Upson és Calvin
1918. In diluted acid solulion, the rate and extent of the swelling of „strong”
wheat flours are higher than the same value of weak flours (Gortner és
Doherty)
….
1946. …relationship between water-retention capacity and loaf volume for
hard ret winter wheat (Finney és Yamazaki).
1947. Higher gluten content and better gluten quality gives slower
sedimentation and higher Zeleny value. (Lawrence Zeleny)
1950- Standardization of Zeleny- and other sedimentation tests...
Tradition 3: Sedimentation tests
New possibilities in micro-scale wheat quality characterisation

Principle and interpretation of sedimentation tests
The Zeleny value means the degree of sedimentation of suspended
flour in lactic acid in a given time. The method is characterising the
swelling properties of wheat proteins and insoluble components.
First experiments Corr. between prot. cont. and
sedimentation value
Corr. between loaf valume and
sedimentation value
Zeleny, L, november, 1947
New possibilities in micro-scale wheat quality characterisation
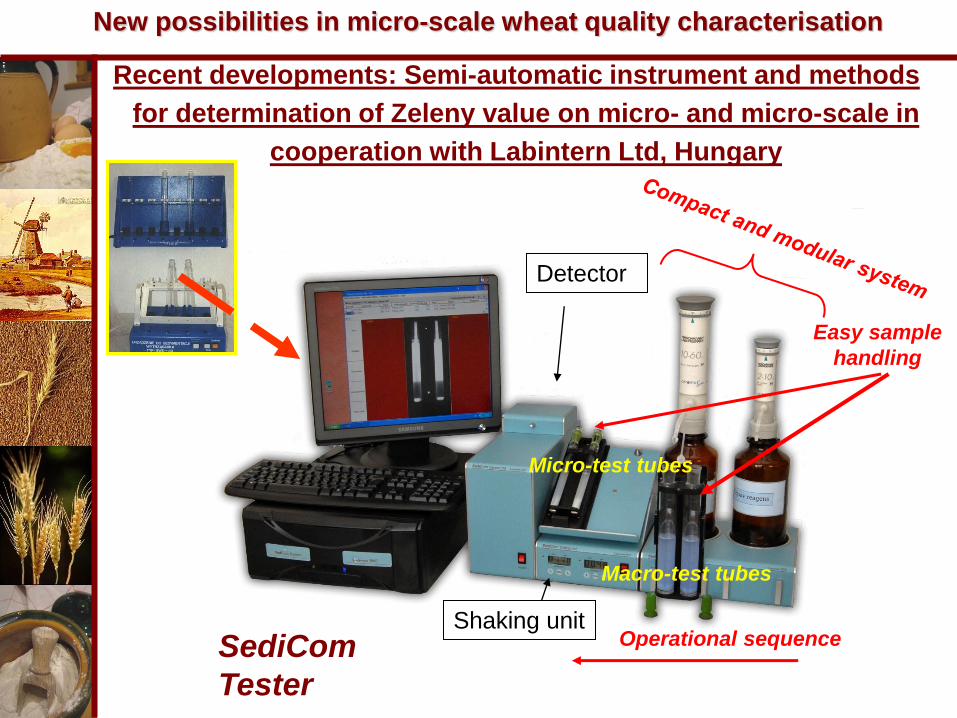
Detector
Shaking unit
Easy sample
handling
Operational sequence
Micro-test tubes
Macro-test tubes
SediCom
Tester
Recent developments: Semi-automatic instrument and methods
for determination of Zeleny value on micro- and micro-scale in
cooperation with Labintern Ltd, Hungary
New possibilities in micro-scale wheat quality characterisation
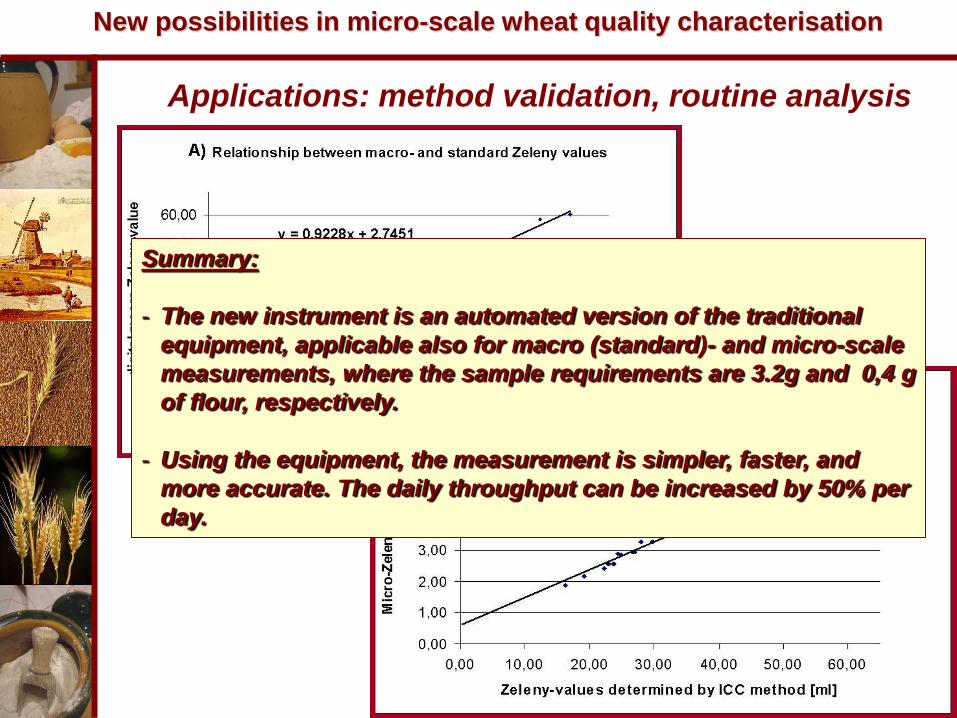
Applications: method validation, routine analysis
Summary:
- The new instrument is an automated version of the traditional
equipment, applicable also for macro (standard)- and micro-scale
measurements, where the sample requirements are 3.2g and 0,4 g
of flour, respectively.
- Using the equipment, the measurement is simpler, faster, and
more accurate. The daily throughput can be increased by 50% per
day.
New possibilities in micro-scale wheat quality characterisation

Application in research activities: QTL mapping for Zeleny values
Experimental design followed, consisting of blocking for individual days
and day order recorded. Population: Chara (Aus) x Glenlea (Can), 180
DH lines. Field and milling effects were also included in the QTL model.
Replication at the zeleny testing consisted of double replicates for each
genotype (Cavanagh, C. et al)
• Most significant QTL for Zeleny value
were detected on chromosomes not
harbouring HMW Glutenin loci
• Chrom 6A -LOD 6.1 (possibly Gliadin)
• Chrom 5A -LOD 4.5 (protein gene?)
• Chrom 3B –LOD 3.5
Glu3B
1B Rmax
EXT
New possibilities in micro-scale wheat quality characterisation
Functional data and their relationships to allelic composition indicated that
while dough strength and partly extensibility are depend on the presence of
HMW glutenin alleles, the allelic composition of LMW glutenins are mostly
responsible for the variation of Zeleny indeces of the wheats, investigated.
Among glutenin loci, significant QTLs were found in the regions of both type of
gliadin loci on chromosome 1 and 6.
.
Please visit our poster, also:
Balázs, G. et al: Complex quality
characterisation…

New member of the small-scale family: Development of GluStar
system and methods for determination of gluten content and
separation of wheat starch (in collaboration with Labintern Ltd,
Hungary and CSIRO Plant Industry, Australia)
Vacuum
system Filters for separation
of starch (soluble
carbohydrate
polimers)
The novelty is the capability for
the determination of wet gluten
content and for the separation
of the starch from flour
samples, in same time. The
modularity of the measuring
system ensures the utilization
of basic modules, separately.
The combined measuring system is
available with standard (10 g) and
micro-scale (5g) bowls.
New possibilities in micro-scale wheat quality characterisation
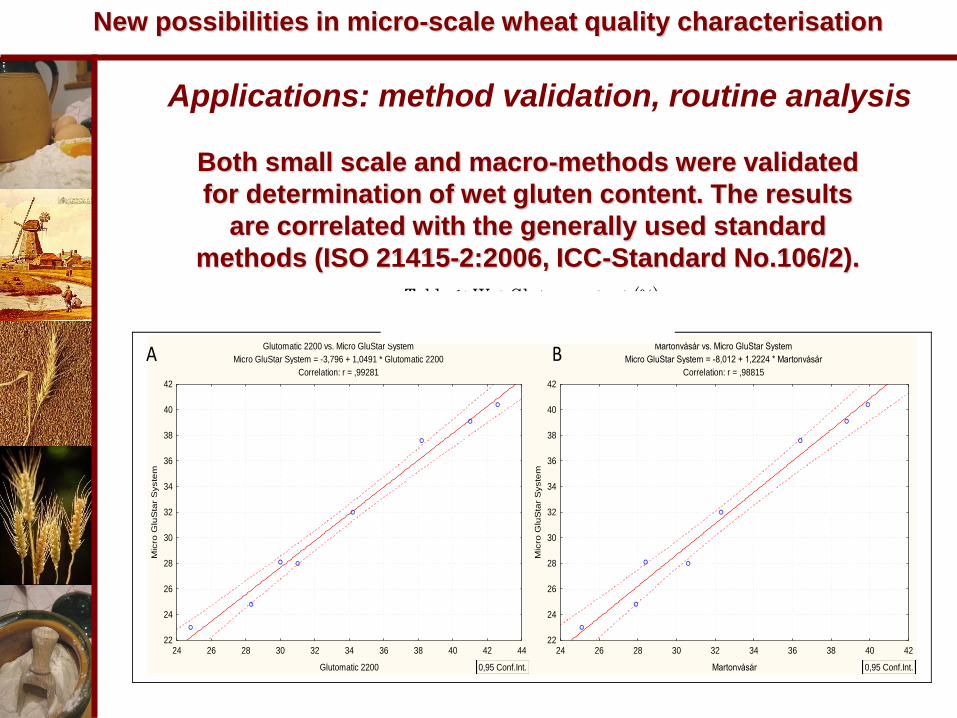
Applications: method validation, routine analysis
Table 1: Wet Gluten content (%)
Glutomatic 2200 vs. Micro GluStar System
Micro GluStar System = -3,796 + 1,0491 * Glutomatic 2200
Correlation: r = ,99281
24 26 28 30 32 34 36 38 40 42 44
Glutomatic 2200
22
24
26
28
30
32
34
36
38
40
42
Mic
ro G
luS
tar
Syste
m
0,95 Conf.Int.
Martonvásár vs. Micro GluStar System
Micro GluStar System = -8,012 + 1,2224 * Martonvásár
Correlation: r = ,98815
24 26 28 30 32 34 36 38 40 42
Martonvásár
22
24
26
28
30
32
34
36
38
40
42
Mic
ro G
luS
tar
Syste
m
0,95 Conf.Int.
A B
Both small scale and macro-methods were validated
for determination of wet gluten content. The results
are correlated with the generally used standard
methods (ISO 21415-2:2006, ICC-Standard No.106/2).
New possibilities in micro-scale wheat quality characterisation

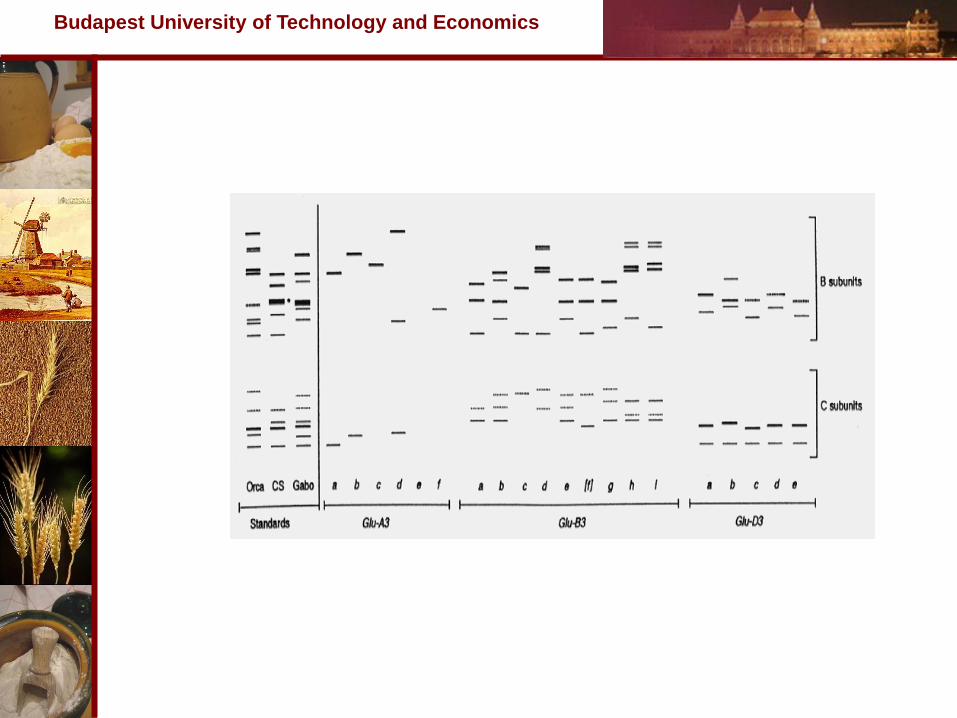
Application in research activities: An example for
investigation of gluten proteins
New possibilities in micro-scale wheat quality characterisation
Rudi Appels et al: Proteome bioinformatics and genetics for
associating proteins with grain phenotype
•A total of 740 flour samples from lines in a MAGIC population (4-way cross)
established in CSIRO Plant Industry were analysed using the GluStar equipment.
•Based on control samples (from cv Carnamah) analysed every 10 samples, the
%wet gluten ranged from 1.295 - 1.405 g/4.5g flour and hence the reproducibility
of the measurement for these 74 control samples was good.
•The genetic variation assayed by GluStar for the set of samples from the
structured MAGIC population, ranged from 0.95 g wet gluten/4.5g flour to 2.8g
wet gluten/4.5 g flour and within this analysis the reproducibility was consistent
with that defined by the control Carnamah samples.
•A particularly useful aspect of the small scale analyses, in addition to the % wet
gluten measurement, was the fast qualitative assessment of the dough formed
by the flour samples.

Application in research activities: Investigation of the effect
of amylose content on the rheological properties
Comparison of viscosity (RVA) profiles of the
flours and separated starch
Comparison of viscosity (RVA) profiles of
starches separated from different wheat
varieties
Comparison of amilosy content measured
in flour blends and from their isolates
New possibilities in micro-scale wheat quality characterisation
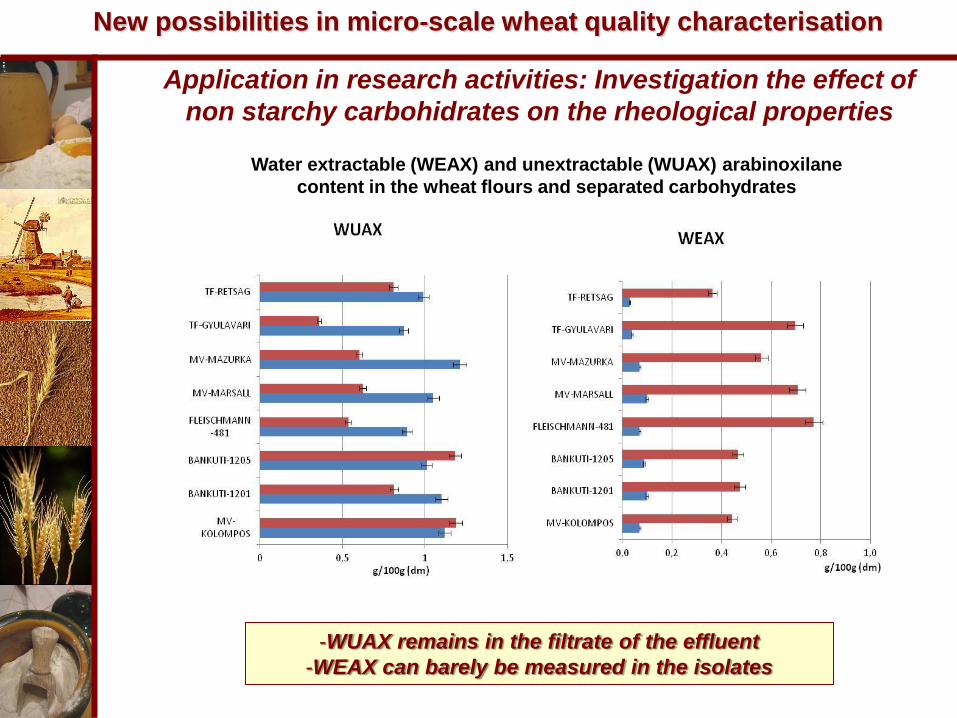
Application in research activities: Investigation the effect of
non starchy carbohidrates on the rheological properties
Water extractable (WEAX) and unextractable (WUAX) arabinoxilane
content in the wheat flours and separated carbohydrates
New possibilities in micro-scale wheat quality characterisation
-WUAX remains in the filtrate of the effluent
-WEAX can barely be measured in the isolates
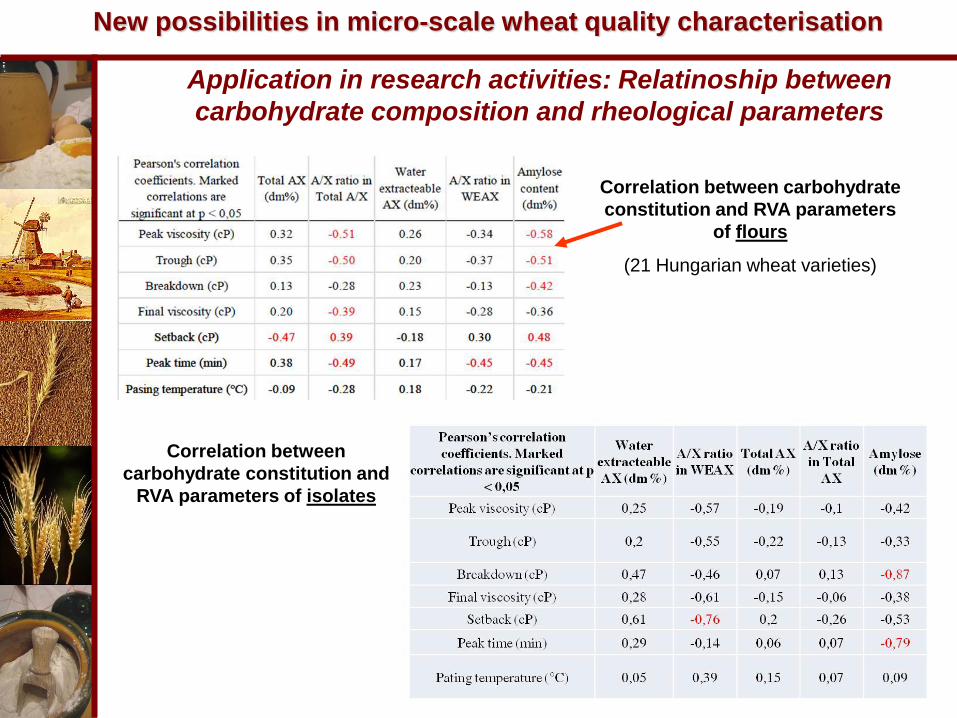
Application in research activities: Relatinoship between
carbohydrate composition and rheological parameters
Correlation between carbohydrate
constitution and RVA parameters
of flours
(21 Hungarian wheat varieties)
Correlation between
carbohydrate constitution and
RVA parameters of isolates
New possibilities in micro-scale wheat quality characterisation
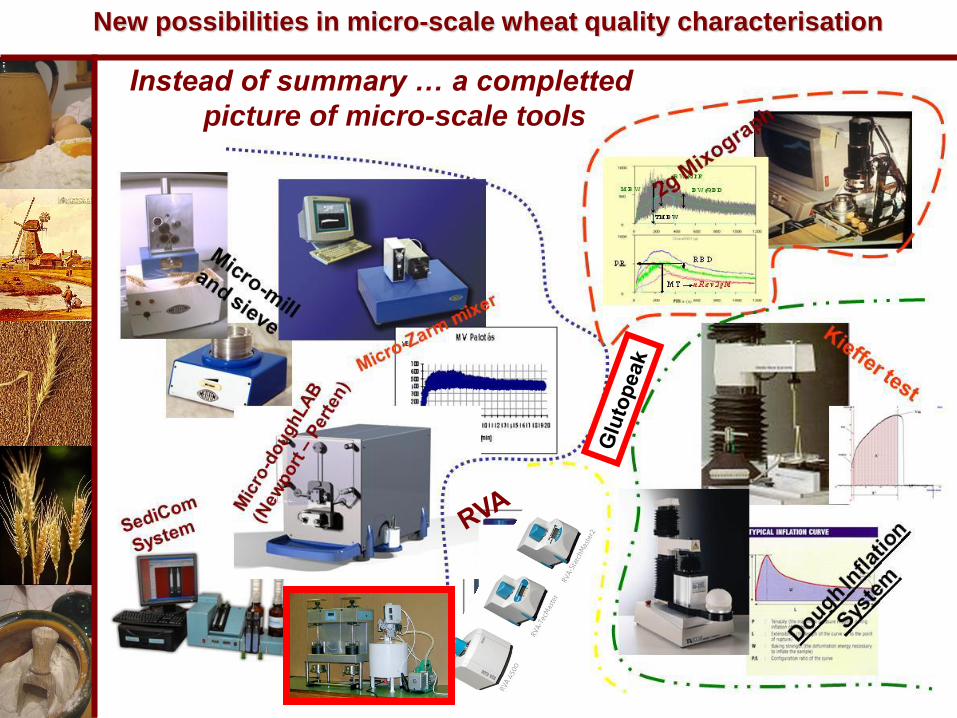
Instead of summary … a completted
picture of micro-scale tools
New possibilities in micro-scale wheat quality characterisation

Acknowledgement Many thanks all of our mentioned and non-mentioned colleagues,
students, technicians who took part in the mentioned projects.
This work was and is supported by
- Hungarian Scientific Research Found
(OTKA, Projects No.: 80292 and 80334 )
- Hungarian National Project titled ‘Development of breeding,
agricultural production and food industrial processing system of
Pannon wheat varieties , (NTP, PojectTECH-09-A3-2009-0221)
- National Research and Development Programs
(NKFP, Project No: 04/35/2001)
- Hungarian Economic Competitiveness Operative Programme
(GAK, Project No.: ALAP1-00126/2004).
- Hungarian Gábor Baross Innocsek Programme
(KM-CSEKK-2005-000044)
- CIMMYT
New possibilities in micro-scale wheat quality characterisation

Thank you for your kind
attention!

Instead of summary…
New possibilities in micro-scale wheat quality characterisation
The whole picture of wheat characterisation

Applications in research activities: measured relationships
among Zeleny values and different functional parameters
New possibilities in micro-scale wheat quality characterisation

Budapest University of Technology and Economics
Invitation to the next MoniQA Conference….
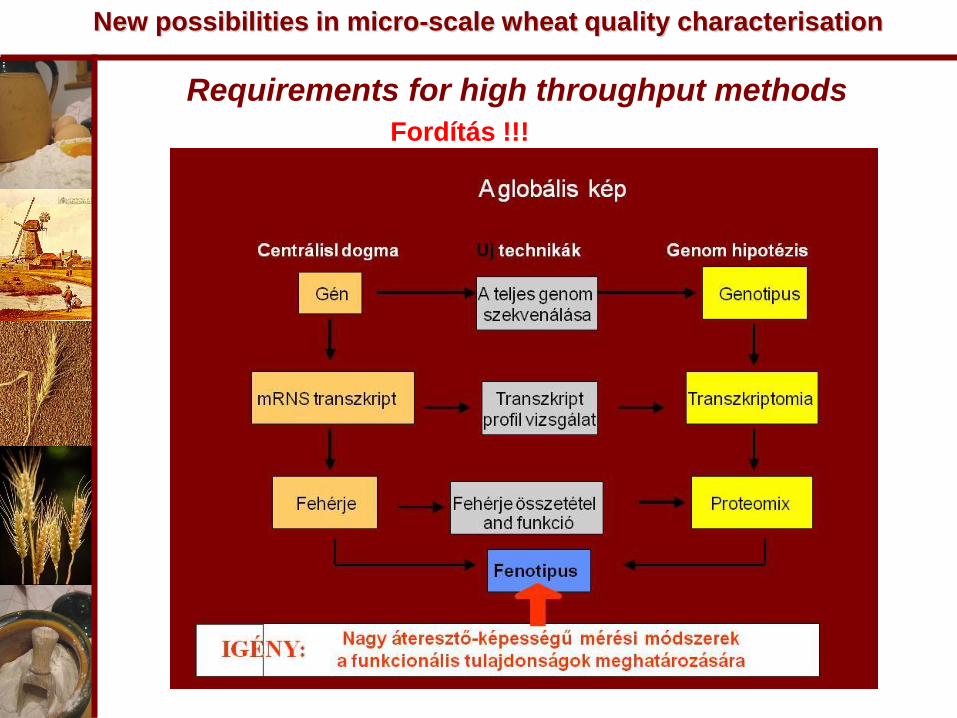
Requirements for high throughput methods
Fordítás !!!
New possibilities in micro-scale wheat quality characterisation
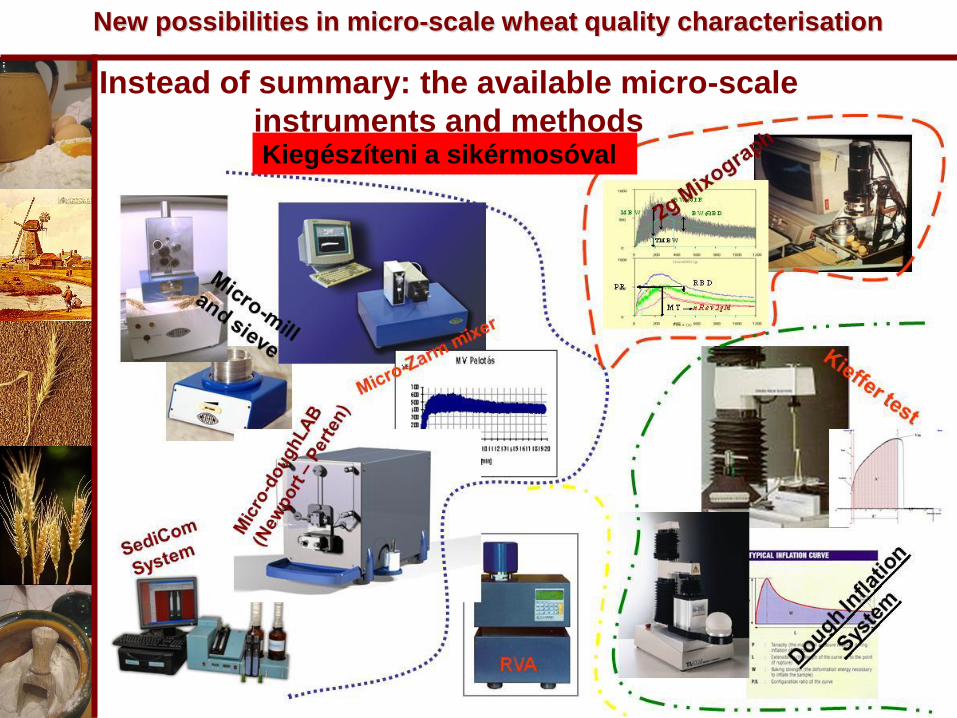
Instead of summary: the available micro-scale
instruments and methods Kiegészíteni a sikérmosóval
New possibilities in micro-scale wheat quality characterisation

Summary:
Improved repeability for
the determination of
glutenin subunit
composition with LOC
Case 2: Sample preparation with micro-mill for
micro-analytical methods
New possibilities in micro-scale wheat quality characterisation

Bekes, F. and Gras, P.W. Demonstration of the 2 g Mixograph
as a research tool. Cereal Chemistry 69 (1992) 229–230.
2 g mixograph
(National/TMCO,USA)
New possibilities in micro-scale wheat quality characterisation

Dobraszczyk, B.J. and Roberts C.A. Strain hardening and
dough gas cell-wall failure in biaxial extension. J. Cereal Sci.
20:265, 1994.
Dough rheological properties were measured in biaxial extension using a modified
Chopin Alveograph under conditions close to those of baking expansion. The resulting
stress-strain curves showed power-law strain hardening, indicating an increase in
stiffness with increasing inflation. This strain hardening was shown to be critical in
determining the limit of bubble expansion, both in the Alveograph and in baking. A
criterion for gas cell-wall instability and failure has been derived, which takes into
account the strain and strain-rate hardening properties of dough during large
extensional deformation. Differences in bubble stability were observed between
different wheat cultivars at low rates of inflation close to those of baking expansion,
but these differences disappeared at the higher rates normally associated with
rheological testing.
TA.XTplus Texture Analyser
Stable Micro System, UK
New possibilities in micro-scale wheat quality characterisation

For the characterization of wheat quality, micro-extension tests for dough and
gluten and a micro-baking test were developed using comparable dough
compositions, the same mixing temperature and cultivar-specific mixing times. By
means of these methods, the flours of 26 wheat samples were studied for dough
development time, maximum resistance and extensibility of dough and gluten and
loaf volume of the baked products. Standard methods (rapid-mix-test, gluten index
determination) were used for comparison. The results indicated that the
rheological properties of dough and gluten as well as the gluten index are
correlated higher with the optimised micro-baking test than with the standard
baking test. If flour protein or wet gluten content is included in the correlations,
the extension test of gluten, which can be performed easily and reproducibly,
allows a reliable prediction of the loaf volume obtained by the micro-baking test.
R. Kieffer, H. Wieser, M.H. Henderson, A. Graveland:
Correlations of the Breadmaking Performance of Wheat Flour
with Rheological Measurements on a Micro-scale(1998)
Cereal Sci 27:53:60
TA.XTplus Texture Analyser
Stable Micro System, UK
New possibilities in micro-scale wheat quality characterisation
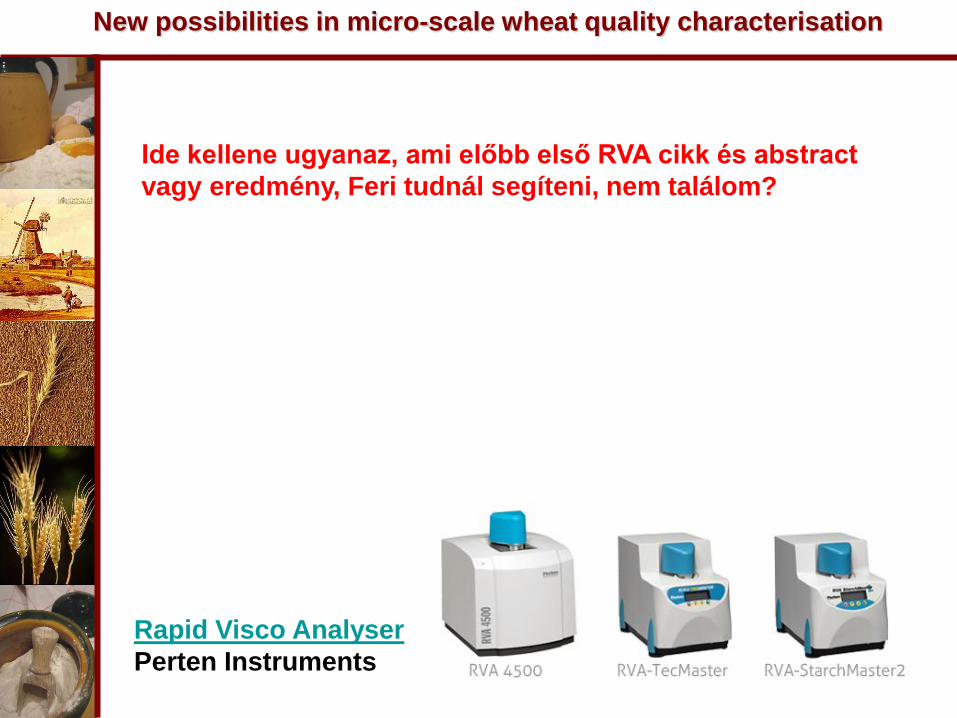
Ide kellene ugyanaz, ami előbb első RVA cikk és abstract
vagy eredmény, Feri tudnál segíteni, nem találom?
Rapid Visco Analyser
Perten Instruments
New possibilities in micro-scale wheat quality characterisation
Summary…
Budapest University of Technology and Economics
-Functional data and their relationships to allelic composition
indicated that while dough strength and partly extensibility
are depend on the presence of HMW glutenin alleles, the
allelic composition of LMW glutenins are mostly responsible
for the variation of Zeleny indeces of the wheats,
investigated. Among glutenin loci, significant QTLs were
found in the regions of both type of gliadin loci on
chromosome 1 and 6.
-Infrared spectroscopy can be a useful tool for prediction the
sedimentation values, but the results are highly depend on
the calibration procedure
- The Sedicom System® can be a valuable tool both for basic
and applied research and also quality evaluation in the whole
wheat verticum, including breeding, grain handling, milling
and baking.
Budapest University of Technology and Economics

Budapest University of Technology and Economics
Result 3: Relationship between different functional
properties
Marked correlations are significant at p<0,05 level, n=23
Summary:
- Strong relationships can be identified in numerous cases between different
quality parameters using our database.
- However, the validity of these relationships cannot be generalized, mainly
because the different sensitivity of alternative methodologies/parameters on
different types of wheat.

Budapest University of Technology and Economics
0
10
20
30
40
50
60
70
80
1 2 3 4 5 6 7 8 9
Zele
ny v
alu
e (
ml)
Location
Comparison of location and agricultural treatment
1.treatment
2.treatment
3.treatment
4.treatment
5.treatment
But… Effects of location and treatment
0
10
20
30
40
50
60
70
80
1 2 3 4 5
Ze
len
y v
alu
e (
ml)
Agriculture treatment
Comparison of agricultural treatment and location
1.location
2. location
3. location
4.location
5.location
6. location
7. location
8. location
9. location
Which value belongs to a given variety
for evaluation of compositional background?

But… Effects of treatment
(Pannon-wheat quality program)
• Complex qualification for
Hungarian varieties
•2 varieties (MV Suba and
GK Kalász), 9 agricultural
areas, 5 agrotechnological
treatment
Location Treatments
Állampuszta
Pécs-
Reménypuszta
Balatonkeresztúr 100 +*100 kg N/ha
Balatonkenese 100 + *50 kg N/ha
Egyházashetye 100 kg N/ha
Csorvás 50 kg N/ha
Törökszentmiklós 0 kg N/ha
Jászboldogháza
Szentistván

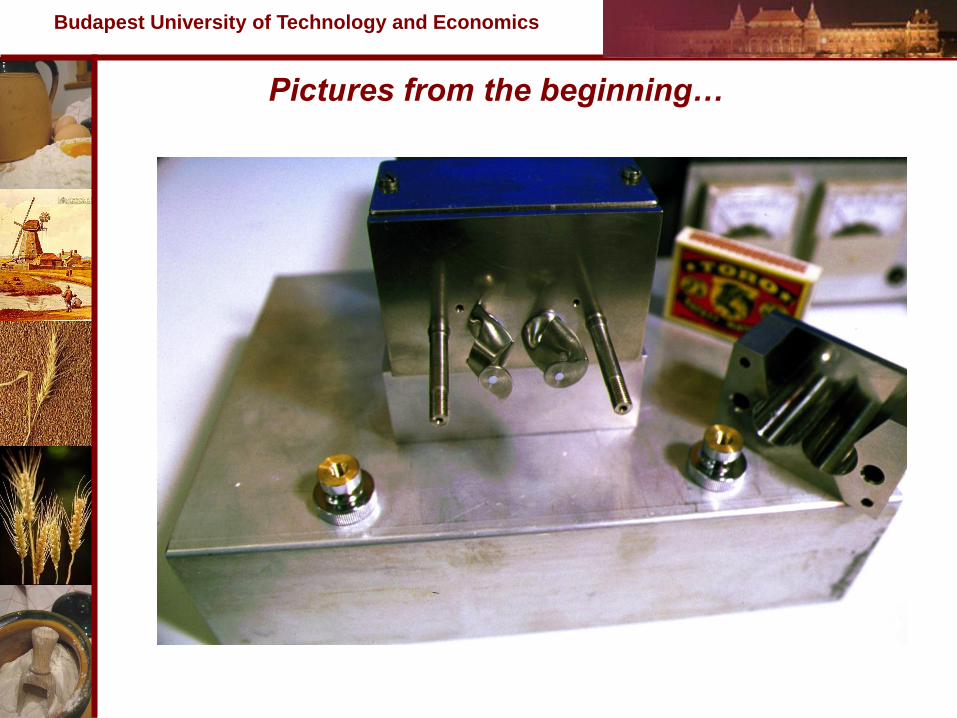
Pictures from the beginning…
Budapest University of Technology and Economics
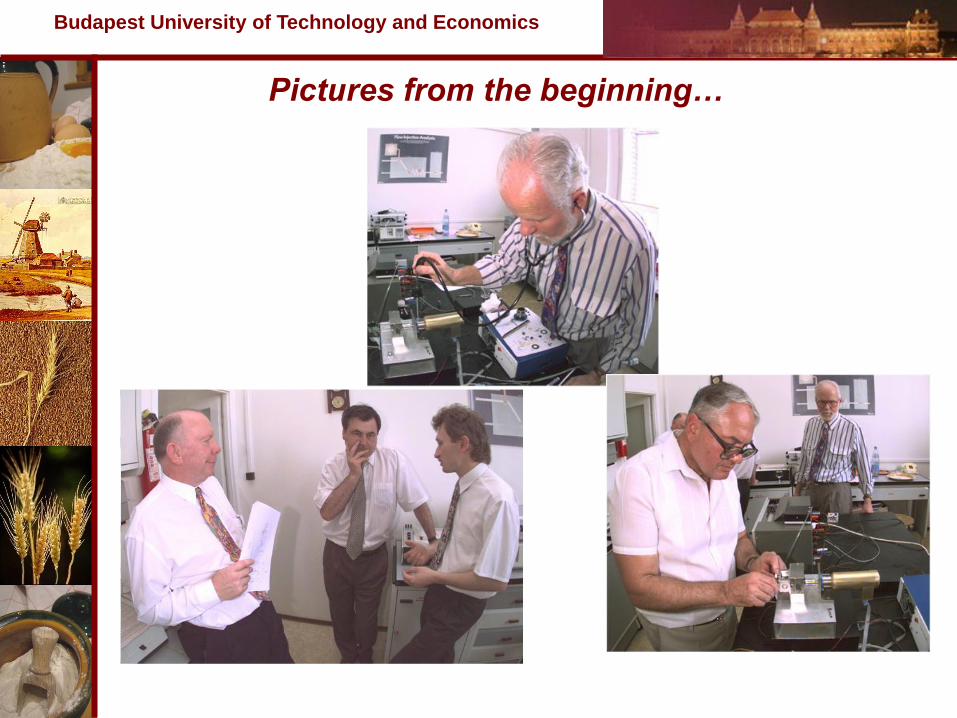
Pictures from the beginning…
Budapest University of Technology and Economics

Pictures from the beginning…
Budapest University of Technology and Economics
Comparison of Farinograms and
micro-Valorigrams
Pictures from the beginning…
Budapest University of Technology and Economics

Application fields and results of micro tests
Budapest University of Technology and Economics
Budapest University of Technology and Economics
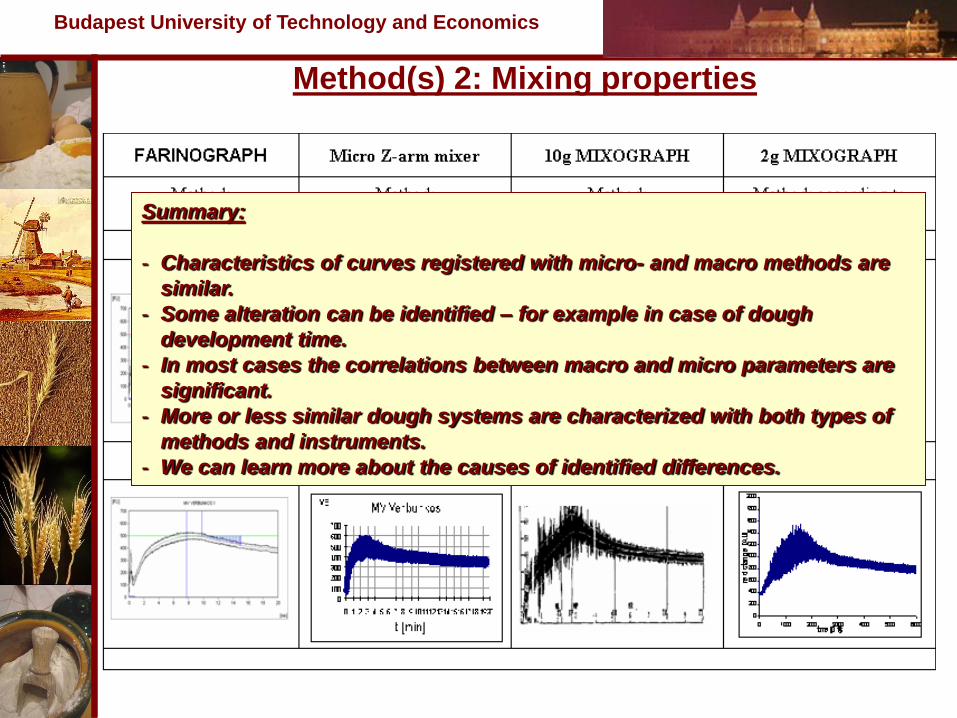
Summary:
- Characteristics of curves registered with micro- and macro methods are
similar.
- Some alteration can be identified – for example in case of dough
development time.
- In most cases the correlations between macro and micro parameters are
significant.
- More or less similar dough systems are characterized with both types of
methods and instruments.
- We can learn more about the causes of identified differences.
Method(s) 2: Mixing properties

Budapest University of Technology and Economics
Method(s) 2: Mixing properties
Budapest University of Technology and Economics
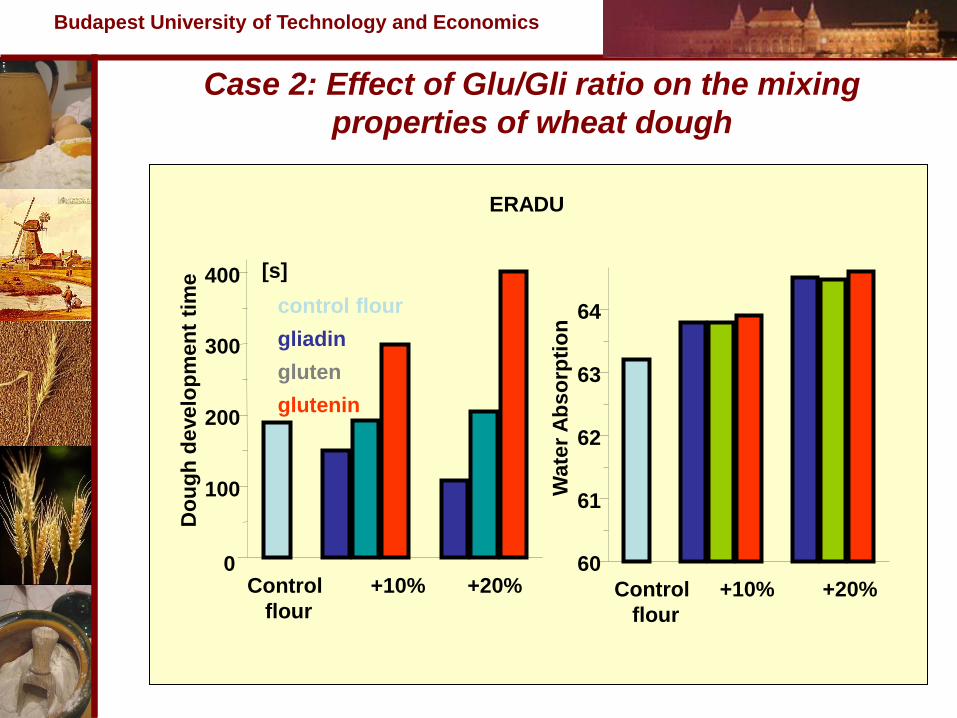
Control +10% +20%
flour
control flour
gliadin
glutenin
gluten
0
100
200
300
400 [s]
ERADU
Control +10% +20%
flour
60
61
62
63
64
Wate
r A
bso
rpti
on
Do
ug
h d
evelo
pm
en
t ti
me
Case 2: Effect of Glu/Gli ratio on the mixing
properties of wheat dough
Budapest University of Technology and Economics
Case 2: Effect of Glu/Gli ratio on the mixing
properties of wheat dough
Research on protein subunit composition Mixes of flour prepared from wheats with deletions of glutenin subunits genes show much better discrimination between poor and good wheats than the Mixograph TM , probably because the mechanism of dough development in the Z-arm mixer is not as dependant on dough strength as in pin mixers.
0
50
100
150
200
250
Z-arm mixer 2g Mixograph
0
50
100
150
200
250
1 , - ,5+10
1 , 17+18, -
- , - , -
- , 17+18,5+10
- , - ,5+10
1 , 17+18,5+10
- , 17+18, -
1 , - , -

Budapest University of Technology and Economics
Case 3: Effect of protein subunit incorporation on
the mixing properties of rice dough
Summary:
• Application of micro Z-arm mixer is suitable for investigation of
rice functionality
• Incorporated glutenin subunits are able to alter dough mixing
properties of rice flour (WA, DDT, stability).
• Carefully controlled reduction/oxidation procedure can be
applied on protein functionality studies in reconstituted rice
dough.

Budapest University of Technology and Economics
Method 1: Sample preparation with micro mill
Budapest University of Technology and Economics
Method 1: Sample preparation with micro mill
1 2 3 4 5 6 7 8 9 10 11 12 13 14 15 16
17 18
Comparison of milling yields:
BUHLER test and FQC-2000
0
25
50
75
100
sample number
Effect on Mixing Time
0
50
100
150
200
250
300
350
1 2 3 4 5 6 7 8 9 10 11 12 13 14 15 16 17 18
Flour Samples
Mix
ing
Tim
e (
sec
)
0
100
200
300
400
1 2 3 4 5 6 7 8 9 10 11 12 13 14 15 16 17 18
Flour Samples
Pe
ak
R
esis
tan
ce
Effect on Peak Resistance
0
10
20
30
40
1 2 3 4 5 6 7 8 9 10 11 12 13 14 15 16 17 18
Flour Samples
Re
sis
tan
ce
Bre
ak
do
wn
Effect on Resistance Breakdown
28
29
30
31
32
33
34
35
36
2 3 4 5 6 7 8 9 10 11 12 13 14 15 16 17 18
Flour Samples
Lo
af
He
igh
t (m
m)
Effect on Loaf Height
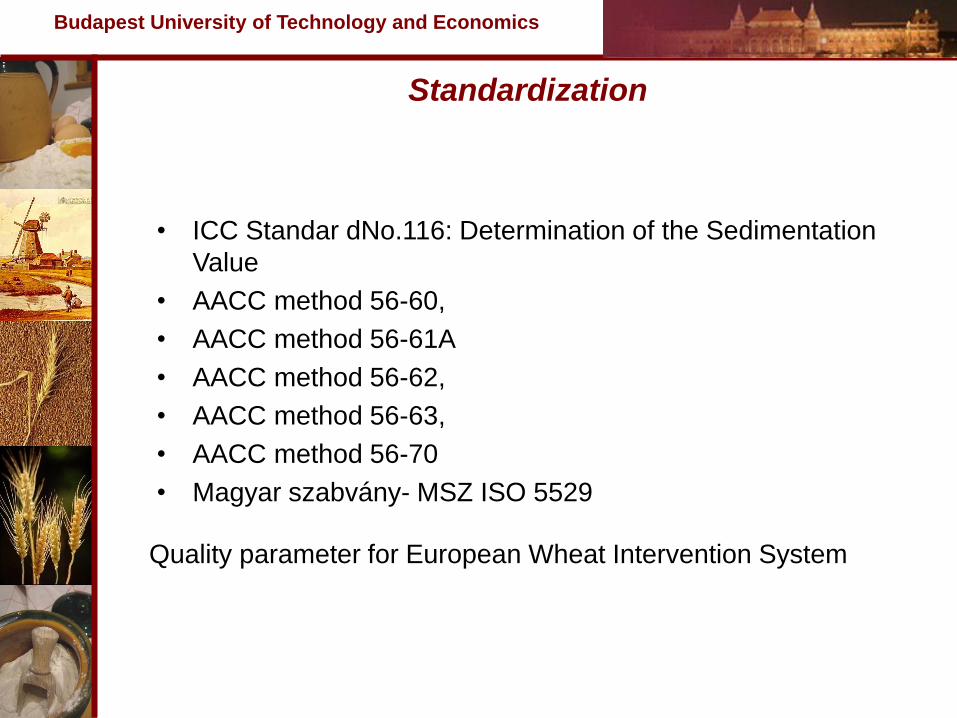
Standardization
Budapest University of Technology and Economics
• ICC Standar dNo.116: Determination of the Sedimentation
Value
• AACC method 56-60,
• AACC method 56-61A
• AACC method 56-62,
• AACC method 56-63,
• AACC method 56-70
• Magyar szabvány- MSZ ISO 5529
Quality parameter for European Wheat Intervention System

Budapest University of Technology and Economics
Measured relationships among Zeleny values and
different functional parameters
Budapest University of Technology and Economics
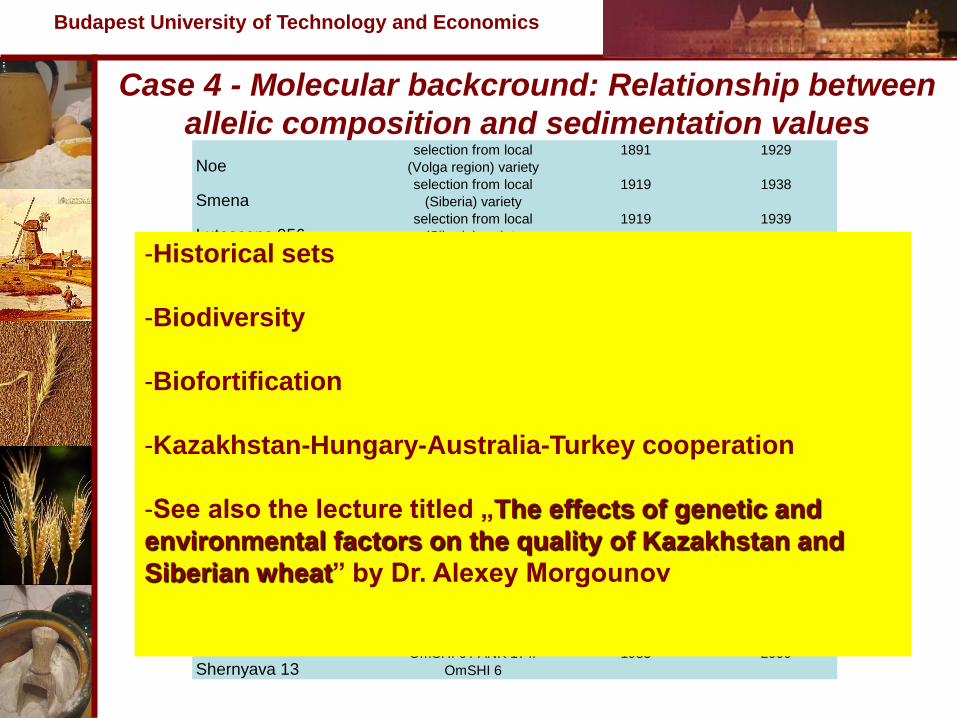
Case 4 - Molecular backcround: Relationship between
allelic composition and sedimentation values
Noe selection from local
(Volga region) variety
1891 1929
Smenaselection from local
(Siberia) variety
1919 1938
Lutescens 956selection from local
(Siberia) variety
1919 1939
Irtyshanka 10 Skala/Saratovskaya 36 1964 1981
Omskaya 12Lade (Norway) / FKN-25
(USA)
1970 1984
Omskaya 21
Spontaneous hybrid
(Canada)/Novosibirskaya
22
1986 ----
Omskaya 26Novosibirskaya 22 /
W.W.16151 (Sweden)
1986 1998
Pamyaty AzyevaSaratovskaya 29 /
Lutescens 99-80-1
1987 2000
Omskaya 32Lutescens 162-84-1 /
Chris (USA)
1989 2001
Kazanskaya yubileynaya
Omsraya 20 / Lutescens
204-80-1//Lutescens 3-86-
6
1992 2004
Tulunskaya 12Biryusinka / Bezostaya 1 1970 * 1989
Altayskaya 92Novosibirskaya 67 /
Lutescens 4029
1981 * 1995
RosinkaPhysical mutant from
Sibakovskaya 3,
1979 1997
SelengaBuryatscaya 34 /
Buryatscaya 79
1978 * 1994
Shernyava 13OmSHI 6 / ANK 17 //
OmSHI 6
1985 2000
-Historical sets
-Biodiversity
-Biofortification
-Kazakhstan-Hungary-Australia-Turkey cooperation
-See also the lecture titled „The effects of genetic and
environmental factors on the quality of Kazakhstan and
Siberian wheat” by Dr. Alexey Morgounov

Budapest University of Technology and Economics
Case 4 - Kazakh wheat varieties 2007.05.11
Input file: all.csv Glu1-A Glu1-B Glu1-D Glu3-A Glu3-B Glu3-D RMAX H L HH LL HL EXT H L HH LL HL
Aktobe 32 B-001 c g a b c d 247 51,35 25,10 0,77 2,32 20,46 15 17,15 61,05 1,74 6,10 13,95
Stepnaya 1 B-004 b c a c g a 349 67,32 7,13 18,43 2,95 4,18 18 32,08 32,08 4,87 9,51 21,46
GVK 1369-2 B-007 b c a e j b 368 62,84 7,80 17,20 0,00 12,16 19 29,53 35,64 4,48 1,83 28,51
Lutescens 53-95B-010 b c d c b b 434 79,30 0,22 14,54 2,20 3,74 19 27,43 31,13 3,31 4,28 33,85
Astana B-013 b c a e g b 385 64,47 4,71 17,65 0,47 12,71 23 21,17 37,23 3,21 5,99 32,41
Shortandinskaya 95B-016 b c a e g b 385 64,47 4,71 17,65 0,47 12,71 23 21,17 37,23 3,21 5,99 32,41
Chelyaba B-019 a d a c j a 381 46,46 3,94 24,93 0,00 24,67 14 60,18 19,17 12,09 3,24 5,31
Lutescens 148-97-16B-022 b c a e j b 368 62,84 7,80 17,20 0,00 12,16 19 29,53 35,64 4,48 1,83 28,51
Fora B-025 b c d c g a 447 76,43 6,16 14,01 2,55 0,85 16 35,25 36,25 4,25 10,75 13,50
GolubkovskayaB-026 b c a c g c 400 66,50 10,19 18,20 1,46 3,64 18 32,58 32,58 4,94 7,64 22,25
Iren B-029 b u a c ? b 247 72,67 10,81 12,31 2,10 2,10 17 32,39 20,80 5,44 2,60 38,77
Eritrospermum 78B-032 a c d e b a 819 37,00 6,59 19,90 11,60 24,91 22 31,39 35,33 3,15 2,37 27,76
Akmola 2 D-001 b c a e g e 448 61,16 7,81 16,74 0,45 13,84 22 23,69 37,25 3,59 6,37 29,08
Lutescens 25/93-3-5 D-002 b c d c g a 447 76,43 6,16 14,01 2,55 0,85 16 35,25 36,25 4,25 10,75 13,50
Contribution % Contribution %
RMAX H L HH LL HL
247 51,35 25,10 0,77 2,32 20,46
349 67,32 7,13 18,43 2,95 4,18
368 62,84 7,80 17,20 0,00 12,16
434 79,30 0,22 14,54 2,20 3,74
385 64,47 4,71 17,65 0,47 12,71
385 64,47 4,71 17,65 0,47 12,71
381 46,46 3,94 24,93 0,00 24,67
368 62,84 7,80 17,20 0,00 12,16
447 76,43 6,16 14,01 2,55 0,85
400 66,50 10,19 18,20 1,46 3,64
Contribution %
EXT H L HH LL HL
15 17,15 61,05 1,74 6,10 13,95
18 32,08 32,08 4,87 9,51 21,46
19 29,53 35,64 4,48 1,83 28,51
19 27,43 31,13 3,31 4,28 33,85
23 21,17 37,23 3,21 5,99 32,41
23 21,17 37,23 3,21 5,99 32,41
14 60,18 19,17 12,09 3,24 5,31
19 29,53 35,64 4,48 1,83 28,51
16 35,25 36,25 4,25 10,75 13,50
18 32,58 32,58 4,94 7,64 22,25
Contribution %
*Rmax and Ext was predicted with PQI

Budapest University of Technology and Economics
Kazakh wheat varieties – Micro-Zeleny values

Budapest University of Technology and Economics
Histogram of zeleny phenotype
05
1015202530354045
3.4
3.9
4.5 5
5.6
Zeleny units
Fre
qu
en
cy
Frequency
Case 5 - Preliminary QTL analysis
• Most significant QTL for zeleny
were detected on chromosomes not
harbouring HMW Glutenin loci
• Chrom 6A -LOD 6.1 (possibly
Gliadin)
• Chrom 5A -LOD 4.5 (protein gene?)
• Chrom 3B –LOD 3.5

Budapest University of Technology and Economics
Case 5 - Preliminary QTL analysis
Glu3B
Zeleny szedimentációs teszt:
szignifikáns QTL a LMW glutenin alegységek
génjeinek környezetében

Budapest University of Technology and Economics
Case 5 - Preliminary QTL analysis
1B Rmax
EXT
A tészta-jellemzők (erősség, nyújthatóság) szignifikáns
QTL-lel rendelkeznek a HMW glutenin alegységek
génjeinek környezetében

Budapest University of Technology and Economics
Case 6 - NIR-prediction for Zeleny based on Kazakh
wheat varieties
Correlation between Zeleny values obtained with micro-
methods and NIR prediction using roboust calibration
NIR values
Mic
ro-Z
ele
ny v
alu
es
Low correlation
coefficient…
Reasons?

Budapest University of Technology and Economics
Scatterplot (Spreadsheet - AE_1+2 +.stw 15v*352c)
WH371523 WH612196 0011 (HUN) 2221 (HUN) 0011 (KAZ) 2221 (KAZ)
referencia:WH371523: r2 = 0,2495; r = 0,4995; p = 0,0010; y = 31,9414 + 0,4517*x
referencia:WH612196: r2 = 0,1445; r = 0,3801; p = 0,0155; y = 39,533 + 0,2166*x
referencia:0011 (HUN): r2 = 0,0790; r = 0,2810; p = 0,0790; y = 56,3925 + 0,1952*x
referencia:2221 (HUN): r2 = 0,2189; r = 0,4678; p = 0,0023; y = 49,4463 + 0,3765*x
referencia:0011 (KAZ): r2 = 0,5867; r = 0,7660; p = 0,000000008; y = 16,8756 + 0,6746*x
referencia:2221 (KAZ): r2 = 0,8157; r = 0,9031; p = 0,0000; y = 9,0905 + 0,8157*x
10 20 30 40 50 60 70 80 90 100
referencia
10
20
30
40
50
60
70
80
90
100
Comparison of calibrations based on
North European (), Hungarian () and Kazah () samples #1
Scatterplot (Spreadsheet - AE_1+2 +.stw 15v*352c)
2221 (KAZ) = 9,0905+0,8157*x; 0,95 Conf.Int.
referencia:2221 (KAZ): r2 = 0,8157; r = 0,9031; p = 0,0000; y = 9,0905 + 0,8157*x
10 20 30 40 50 60 70 80 90
referencia
10
20
30
40
50
60
70
80
90
222
1 (
KA
Z)
Reference values are based on Kazakh variation
r2 = 0,8157
Case 6 - NIR-prediction for Zeleny based on Kazakh
wheat varieties
Budapest University of Technology and Economics
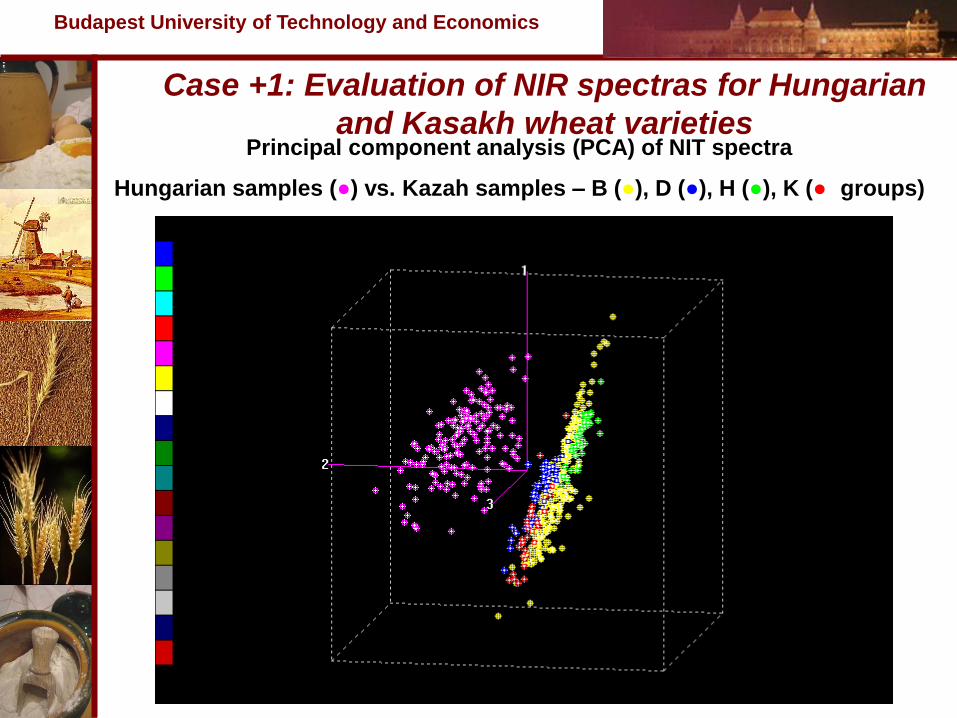
Case +1: Evaluation of NIR spectras for Hungarian
and Kasakh wheat varieties Principal component analysis (PCA) of NIT spectra
Hungarian samples (●) vs. Kazah samples – B (●), D (●), H (●), K (●) groups)