Embed Size (px)
Citation preview

The impact of water content and mixing time on the linearand non-linear rheology of wheat flour doughMeerts, M.; Cardinaels, R.M.; Oosterlinck, F.; Courtin, C.; Moldenaers, P.
Published in:Food Biophysics
DOI:10.1007/s11483-017-9472-9
Published: 01/06/2017
Document VersionAccepted manuscript including changes made at the peer-review stage
Please check the document version of this publication:
• A submitted manuscript is the author's version of the article upon submission and before peer-review. There can be important differencesbetween the submitted version and the official published version of record. People interested in the research are advised to contact theauthor for the final version of the publication, or visit the DOI to the publisher's website.• The final author version and the galley proof are versions of the publication after peer review.• The final published version features the final layout of the paper including the volume, issue and page numbers.
Link to publication
Citation for published version (APA):Meerts, M., Cardinaels, R. M., Oosterlinck, F., Courtin, C., & Moldenaers, P. (2017). The impact of water contentand mixing time on the linear and non-linear rheology of wheat flour dough. Food Biophysics, 12(2), 151-163.DOI: 10.1007/s11483-017-9472-9
General rightsCopyright and moral rights for the publications made accessible in the public portal are retained by the authors and/or other copyright ownersand it is a condition of accessing publications that users recognise and abide by the legal requirements associated with these rights.
• Users may download and print one copy of any publication from the public portal for the purpose of private study or research. • You may not further distribute the material or use it for any profit-making activity or commercial gain • You may freely distribute the URL identifying the publication in the public portal ?
Take down policyIf you believe that this document breaches copyright please contact us providing details, and we will remove access to the work immediatelyand investigate your claim.
Download date: 16. Sep. 2018

Food Biophysics manuscript No.(will be inserted by the editor)
The impact of water content and mixing time on the linear and non-linear
rheology of wheat flour dough
Mathieu Meerts · Ruth Cardinaels · Filip Oosterlinck ·
Christophe M. Courtin · Paula Moldenaers
Received: date / Accepted: date
Abstract The viscoelastic properties of wheat flour dough are known to be very sensitive to small changes in
water content and mixing time. In this study the simple scaling law originally proposed by Hibberd (1970) [Rheol.
Acta 9, 497-500] to capture the water dependency of the dynamic moduli in small amplitude oscillatory shear, was
also applied to creep-recovery shear tests and extensional tests. The scaling law turns out to be valid not only in the
linear region, but to a certain extent also in the non-linear region. At sufficiently high water levels, a ‘free’ water
phase exists in dough, which attenuates the starch-starch and gluten-starch interactions. Dough characterisation
after different mixing times shows that overmixing may cause a disaggregation or even depolymerisation of the
gluten network. The network breakdown, as well as the subsequent (partial) recovery, are clearly reflected in the
value of the strain-hardening index, for which a maximum is reached at a mixing time close to the optimum as
M. Meerts · R. Cardinaels · F. Oosterlinck · P. Moldenaers
Soft Matter Rheology and Technology, Department of Chemical Engineering, KU Leuven, Celestijnenlaan 200F, Box 2424, BE 3001 Leuven,
Belgium
Tel.: +32 16 32 17 02 Fax: not available E-mail: [email protected]
R. Cardinaels
Polymer Technology, Department of Mechanical Engineering, TU Eindhoven, Box 513, 5600 MB Eindhoven, The Netherlands
F. Oosterlinck
Materials Science Center, DSM Ahead B.V., Urmonderbaan 22, 6167 RD Geleen, The Netherlands
C. M. Courtin
Laboratory of Food Chemistry and Biochemistry & Leuven Food Science and Nutrition Research Centre (LFoRCe), Department of Microbial
and Molecular Systems, KU Leuven, Kasteelpark Arenberg 22, Box 2463, BE 3001 Leuven, Belgium

2 Meerts et al.
determined with the Mixograph. Finally, the gluten proteins turn out to be much less susceptible to overmixing in
an oxygen-lean environment, which demonstrates the significant role of oxygen in the degradation process.
Keywords Dough rheology ·Water scaling law · Dough overmixing · Strain-hardening · Creep-recovery · Shear
softening
Introduction
The importance of the water component in wheat flour dough can hardly be overestimated. At low hydration
levels the water forms a one-phase system with the flour. This ‘bound’ water plays an important structural role
as it hydrates the proteins and is absorbed by the starch granules [1, 2]. It interacts with the dough constituents
through hydrogen bonds [3]. When the total water fraction in dough reaches a value of ca. 0.23 - 0.35, a separate,
continuous aqueous phase starts to appear [4, 5]. This ‘free’ water phase serves as the medium for the chemical
reactions occurring during dough development and fermentation. Moreover, this liquid phase is also likely to be
the medium in which the air bubbles are trapped during mixing, and subsequently expand during fermentation
[4, 5, 6]. For the water fractions commonly used in dough preparation (0.38 - 0.44, Ablett et al. [7]), both ‘bound’
and ‘free’ water are likely to be present in the dough system.
Small changes in water content may considerably alter the viscoelastic properties of dough. For example, the
substantial decrease of the storage modulus G′ and the loss modulus G′′ with increasing water content was first
noted by Hibberd and Wallace [8], and has since been reported by several other research groups [2, 9, 10, 11, 12,
13, 14, 15, 16, 17]. Hibberd and Wallace [8] observed that changes in water content do not affect the value of the
phase angle δ as the water has similar effects on G′ and G′′. This observation suggests that the presence of the
‘free’ water phase does not induce fundamental changes in the dough’s microstructure [13, 18]. In a follow-up
publication, Hibberd [19] tried to capture the dependency of the dynamic moduli on the water fraction W in a
function Qs(W −W0):
G′(ω,W ) = G′(ω,W0) ·Qs(W −W0) (1)
G′′(ω,W ) = G′′(ω,W0) ·Qs(W −W0) (2)
with G′(ω,W0) and G′′(ω,W0) the moduli at a reference water fraction W0 [-] and angular frequency ω [rad/s].
Thereby, he established the water content-frequency superposition principle, which is similar to the time-temperature

Dough rheology 3
superposition principle that is very common for polymers. Hibberd [19] showed that the function Qs(W −W0) has
to be identical for G′, G′′ and the complex modulus G∗. Furthermore, he also suggested that Qs(W −W0) might
well be independent of wheat variety. This would imply that differences in the dynamic moduli among flour types
could be compensated for by an appropriate choice of water contents (the water content-moduli correspondence
principle). Whereas Hibberd [19] did not propose any specific expression for the function Qs(W −W0), Ng [20]
suggested an exponential relationship:
Qs(W −W0) = exp(−(W −W0)
A
)(3)
with A being a constant, and W0 the reference water fraction. In addition, Ng [20] established that Hibberd’s scal-
ing law also holds for linear stress-relaxation and start-up extensional tests. In fact, as Hibberd’s scaling law holds
for linear oscillatory tests, this scaling law should work for other flow types as well, at least in the linear region,
because all linear material functions are interrelated [21].
Besides water content, the mixing time is also known to have an important impact on dough microstructure
and properties [22]. In the mixing step, dough is developed into a three-dimensional viscoelastic structure with
gas-retaining properties. In addition, air is included and forms the nuclei for the gas cells that grow during fer-
mentation. At the early stages of dough development, the gluten proteins are present in the form of lumps, with
little to no interconnectivity. As mixing proceeds, these protein masses become extended and tend to form a con-
tinuous network of sheets, encapsulating to some extent the starch granules. At this point the dough is optimally
developed. Upon prolonged mixing, the gluten protein sheets get dispersed, and partial disaggregation or even
depolymerisation may occur [22, 23, 24, 25, 26, 27]. Microstructural studies have indeed established that during
mixing the gluten proteins undergo significant morphological changes [28, 29, 30, 31]. Whereas disaggregation
would only require the breakage of non-covalent bonds (e.g. hydrogen bonds, hydrophobic interactions) [23], a
depolymerisation of the gluten proteins would also involve the scission of covalent SS cross-links [24], which have
indeed proven to be much more sensitive to chain scission than isopeptide bonds [32]. There is, however, no con-
sensus yet on the exact mechanism by which the SS cross-links are broken during overmixing. Tanaka and Bushuk
[24] suggested that SH/SS interchange reactions might be involved, whereas Graveland et al. [25] attributed the
cleavage of SS bonds to a radical mechanism involving O2 (see further). For more details regarding the chemical
composition of gluten and hypotheses on its network structure, the reader is referred to Wieser [33], MacRitchie

4 Meerts et al.
[34], Belton [35], van Vliet and Hamer [36], and Kontogiorgos [37].
Previous studies on the effect of mixing time on dough rheology have yielded contradictory results. Some
studies have reported an increase in the dynamic moduli with mixing time, which has been attributed either to an
increase in surface area between the dough matrix and the gas phase following the entrapment of an increasing
amount of air [38], or to an increase in gluten-starch and gluten-gluten interactions resulting from a more evenly
and finely distributed gluten network [39]. The latter leads to an increased interaction area as well as enhanced
relative motions of the different gluten regions. Compared to strong flours, the mixing time was found to have
a similar but much smaller effect on the dynamic moduli of weak flours [38, 39]. Larsson et al. [40] also ob-
served an increase in the dynamic moduli with mixing time, but at the same time found the stress peak in start-up
of shear flow to follow the opposite trend. They suggested that due to the development of thinner gluten films,
the mechanical response of the hydrated starch granules might gain importance, resulting in increased dynamic
moduli. The weakening of the gluten network as a consequence of overmixing will be more apparent in non-
linear tests, which may explain the decreasing stress peak observed in start-up of shear flow. Finally, Dreese et
al. [10] and Letang et al. [18] observed a significant decrease in G′ with increasing mixing time, similarly to the
effect of water content. Dreese et al. [10] suggested that overmixing might lower the water-binding capacity of
the gluten network, such that some water will be released and a behaviour similar to that of dough prepared with
an excess amount of water will be observed. Kim et al. [41] and Schiedt et al. [42] have signalled the importance
of time effects occurring during the rest period preceding the rheological measurements. They attributed the con-
tradictory nature of the reports on the effect of mixing time to the use of different rest times in the different studies.
A first objective of the present work is to systematically investigate the applicability of Hibberd’s water scaling
law for several types of deformation (including both shear and extension), in the linear and non-linear regions. In
addition to the effect of water content, we will also try to elucidate the effect of mixing time on the behaviour
of wheat flour dough. Besides linear oscillatory tests, our rheological toolbox comprises extensional tests and
creep-recovery tests, which enables us to study dough behaviour in both the linear and non-linear regimes, thereby
relying on fundamental techniques rather than empirical ones. Rather than the more commonly used Kieffer ex-
tensibility rig, the Extensional Viscosity Fixture was used here for extensional tests as this setup allows to obtain
a truly uniaxial extensional flow field [43]. Our aim is to understand how under- and overmixing affect the inter-

Dough rheology 5
play between the two major flour constituents (gluten and starch). Moreover, we will investigate if and to what
extent dough has the ability to recover from the damage caused by overmixing. In addition to rheologists, re-
searchers from many other disciplines have already investigated how the dough structure is affected by changes
in water content and by the mixing action, and have proposed numerous hypotheses about the underlying mech-
anisms. Following an integrated approach, we will use our rheological data in combination with the findings of
these earlier studies to shed light on the impact of water addition and mixing on the dough structure and behaviour.
Materials and methods
Dough preparation
The two wheat flours used in this study (Bilux flour and Bison flour) were obtained from Dossche Mills (Deinze,
Belgium). The strong Bilux flour had a higher protein content as compared to the weak Bison flour (15.1 % vs.
12.4 %, on a dry matter basis). The protein content (N x 5.7) of the flours was measured with an automated Du-
mas protein analysis system (EAS, VarioMax N/CN, Elt, Gouda, The Netherlands) following an adaptation of the
AOAC method 990.03 [44]. The moisture content of the flours was found to be 13.4 % and 12.7 % for Bilux and
Bison, respectively, according to AACCI method 44-19.01 [45]. For both flours the optimal baking absorption and
mixing time were determined with Farinograph (Brabender, Duisburg, Germany) and Mixograph (National Man-
ufacturing, Lincoln, NE, USA) analyses in accordance with AACCI Methods 54-40.02 and 54-21.02, respectively
[45]. All measurements were carried out in triplicate.
Dough was prepared with the following ingredients: 10 g flour (on 14 % moisture base), 1.5 % (w/w) sodium
chloride, 6 % (w/w) sucrose, and the optimal water contents of 5.8 ml and 5.4 ml for Bilux and Bison, respectively
(AACCI method 10-10.03). Throughout this paper, the water contents of the dough samples will be expressed as
total water fractions (relative to the total dough weight). For Bilux and Bison, the optimal water fractions (W0)
are thus 0.454 and 0.436, respectively. To elucidate the effect of changes in water content on dough rheology,
other water fractions (W ) were used as well, with W −W0 ranging from -0.015 to 0.028. At these water fractions
a separate aqueous phase is expected to be present [4, 5]. Ingredients were mixed in a 10 g pin bowl mixer
(National Manufacturing). The optimal mixing time for both flours was determined to be 3 min 30 s (for the
corresponding optimal water contents). The same mixing time was used for all the other water contents as well.

6 Meerts et al.
Whereas Mixograph studies have indicated that doughs with higher water contents require slightly longer mixing
times to reach the optimal dough development stage [14], our rheological data suggest that the effects of water
content and mixing time are not directly interrelated (see further). Therefore only one parameter was changed at a
time (i.e. changing the water content while keeping the mixing time constant, and vice versa). To study the impact
of both under- and overmixing, the mixing time was varied from 1 min to 15 min. Finally, in order to assess the
role of oxygen in the dough development process, an oxygen-lean environment was created by having nitrogen
flow over the mixer under a glass case. After mixing, the dough samples were shaped with a pasta machine to
obtain a sample thickness of ca. 4 mm and a sample diameter larger than 40 mm.
Rheological methods
The small amplitude oscillatory shear (SAOS) tests were performed at 25 ◦C on a stress-controlled MCR501
rheometer (Anton Paar, Graz, Austria) with a 40 mm parallel plate geometry. A solvent trap combined with wet
cotton wool was used to prevent dehydration of the dough samples. Slip effects were eliminated by coating both
top and bottom plates with sand paper. All dynamic measurements were performed at least in duplicate on sep-
arately prepared batches of Bilux and Bison dough, and good reproducibility was obtained (relative standard
deviation less than 10 %). To allow the stresses developed in the dough during mixing, shaping and loading in the
rheometer to relax, a resting period of 30 min was applied twice, once before and once after loading the sample in
the rheometer. Only after these resting periods, the frequency and strain sweeps were performed.
Creep-recovery experiments in shear deformation mode were performed on Bilux dough with the same setup
as that used for the dynamic measurements. Two stress levels were applied (σ = 5 Pa and σ = 500 Pa) to access
both the linear and the non-linear region [43]. The shear stress σ was applied for 30 min, after which the dough
sample was allowed to recover for an additional 60 min. The compliance J(t) [Pa-1] was determined as the ratio
of the observed strain γ(t) to the applied shear stress σ . Creep-recovery measurements were performed at least
in duplicate and the relative standard deviation was less than 21 % for all cases. As with the oscillatory tests, a
resting period of 30 min was applied before and after loading the sample in the rheometer.
Dough behaviour in extension was studied at ambient temperature by means of the Extensional Viscosity
Fixture (EVF) add-on mounted on a strain-controlled ARES-G2 rheometer (TA Instruments, New Castle, DE).

Dough rheology 7
The EVF setup consists of two drums to which the dough strand can be attached. Extension at a constant rate
ε [s-1] is obtained as one drum remains stationary and the other moves in a circular orbit around it whilst also
rotating around its own axis. The dough strands could only be stretched to a Hencky strain ε of ca. 2.7, as the
sample ends often met each other well before the rotating drum had completed one full turn. Consequently, in
most cases the dough samples could not be extended until their point of failure. At large strains the dough samples
experienced strain hardening, i.e. the transient extensional viscosity η+e (ε) [Pa s] was found to increase more than
proportionally with increasing strain. The degree of strain-hardening can be quantified by means of the strain-
hardening index (SHI):
SHI =η+
e (εmax)
η+e0(εmax)
(4)
in which η+e (εmax) represents the actual value of the transient extensional viscosity at the maximum strain (2.7),
and η+e0(εmax) is the value of the linear viscosity extrapolated to the maximum strain [43]. The extensional viscosity
curves shown in this study are the average of 10-15 measurements on at least 3 separately prepared batches. As
these measurements only result from 3 different batches, they are not all independent, and consequently the pooled
standard deviation sp has been used to determine the data variability [46]:
sp =
√(n1−1) · s2
1 +(n2−1) · s22 +(n3−1) · s2
3n1 +n2 +n3−3
(5)
In this expression, s1, s2 and s3 represent the standard deviations for the measurements of batch 1, 2 and 3,
respectively. The number of measurements in each batch are denoted by n1, n2 and n3. The pooled relative standard
deviation typically varied from 9 to 17 %. The dough was allowed to relax for 30 min before loading in the ARES-
G2 rheometer. Additional information about the rheological setups and methodology can be found in Meerts et al.
[43].
Results and discussion
Water content
Oscillatory tests
In Fig. 1a the storage modulus G′ of strong Bilux dough is plotted for four different water levels around the op-
timal value, together with the phase angle δ . Whereas the water content has a strong impact on the values of G′
(and G′′), the phase angle δ turns out to be essentially independent of the water content. Consequently, for the

8 Meerts et al.
strong Bilux dough the water dependency of the dynamic moduli can indeed be captured in a simple scaling law as
originally proposed by Hibberd [19]. Fig. 2 displays the function Qs(W −W0) as obtained for the Bilux dough. As
suggested by Ng [20], the water-dependency function Qs(W−W0) can be approximated by an exponential relation
(Eq. 3). The value of A for the strong Bilux dough turns out to be 0.046, which is in the same range as the value
obtained by Ng [20] for his dough system (A = 0.028). For the weak Bison dough, however, the simple scaling law
is not as readily applicable as for the strong Bilux dough, since the values of δ corresponding to different water
contents do not fully superimpose at the lower end of the frequency range, as opposed to those of Bilux dough
(Fig. 1b). Navickis et al. [9] equally found Hibberd’s scaling law to be more applicable to strong than to weak
dough systems. The possibility of the phase angle δ showing deviant behaviour at lower frequencies was also
noted by Masi et al. [13]. This important observation indicates that the ‘free’ water phase does not affect the slow
and fast relaxation mechanisms in the same way [47]. At high frequencies, the values of G′ and G′′ are affected
by the water content to (nearly) the same extent, but at low frequencies the storage modulus G′ turns out to be less
sensitive to the water content than the loss modulus G′′ (since at these low frequencies the phase angle δ decreases
with water content). Consequently, the water content - frequency superposition principle can only be trusted to
hold for short to moderate time scales (i.e. high to medium frequencies), which happen to be the time scales that
can be probed adequately with oscillatory tests. However, for weak flour doughs the long-term relaxation effects
are more likely to become apparent in oscillatory tests. After all, for a weak dough system, the transition point
from solid-like to liquid-like behaviour will be situated at a higher frequency [43]. The water content-frequency
superposition is no longer obtained in case the transition point shifts into or approaches the frequency region that
can be probed adequately with oscillatory tests. Therefore, we can conclude that not all wheat flour types obey the
water content-frequency superposition principle to the same extent.
Additionally, within the appropriate frequency range, the functions Qs(W −W0) for Bilux and Bison dough
are not identical. Instead, if we assume the function Qs(W −W0) to be of an exponential form (Eq. 3), the pa-
rameter A has a lower value for Bison dough (0.036) as compared to Bilux dough (0.046), which means that the
weak Bison dough is more sensitive to changes in water content. Likewise, Hibberd [48] observed that for gluten-
starch mixtures the loss tangent remains independent of water content, but at the same time depends weakly on
the gluten-starch ratio. The function Qs(W −W0) used to capture the water dependency of the dynamic moduli
for dough, will therefore also be a weak function of gluten content. The water content-moduli correspondence
Dough rheology 9
principle thus appears to be valid only for flours of similar protein content, which of course severely limits its
practical use.
The limited applicability of both Hibberd’s principles stems from the difference in water sensitivity between
the gluten proteins and the starch granules, combined with the fact that linear oscillatory measurements are not
really suited to detect changes in the gluten network. The response of the gluten network is most apparent at the
lowest frequencies, which, however, cannot be accessed easily in (linear) dynamic measurements. Consequently,
these measurements will mostly probe the short-range interactions (i.e. the gluten-starch and starch-starch interac-
tions), which might be similar for all wheat flour dough systems [19]. Given the low gluten-starch ratio, differences
in gluten quantity and quality can indeed become partially masked, and will not clearly be reflected in the linear
behaviour of dough [42, 43]. Furthermore, the starch-starch interactions are much more sensitive to changes in
water content than the gluten-gluten interactions. Hibberd [48] and Smith et al. [49] both studied gluten-starch
mixtures with widely differing gluten-starch ratios and water levels, and found the water dependency of the dy-
namic moduli to decrease with increasing gluten content.
Extensional tests
Further evidence of the enhanced sensitivity of the starch-starch interactions to water content as compared to the
gluten-gluten interactions, is also provided by our extensional tests. Fig. 3 gives the extensional viscosity after
start-up of flow for Bilux dough prepared with different water levels. Changes in water content mainly result in
a vertical shift of the viscosity curves at small to moderate strains, which can again be related to the short-range
gluten-starch and starch-starch interactions. Indeed, at these strains the gluten-starch and starch-starch interactions
are believed to dominate the dough response [42, 43, 50]. However, upon increasing the strain these short-range
interactions will start to break down, and eventually only the longer-range gluten-gluten interactions will remain to
provide structural integrity to the material. As the viscosity values at large strains appear to be much less affected
by changes in water content, it can indeed be concluded that the water content does not have a very strong impact
on the gluten-gluten interactions in dough, at least as soon as the gluten proteins have become fully hydrated. The
difference in water sensitivity, as observed in extensional tests, between the gluten-gluten interactions on the one
hand, and the gluten-starch/starch-starch interactions on the other hand, is the reason why the water content affects

10 Meerts et al.
the slow and fast relaxation mechanisms, which are (partially) probed in oscillatory tests, differently. Indeed, at
low frequencies the storage modulus G′ tends to be less sensitive to water content than at high frequencies, as the
long relaxation times are dominated by the gluten network.
As Hibberd’s scaling law holds for linear oscillatory tests, we can anticipate that for small strains, in the linear
region, the water dependency of the extensional viscosity η+e (t) can also be captured by a simple scaling law
Qe(W −W0) (see also Ng [20]):
η+e (t,W ) = η
+e (t,W0) ·Qe(W −W0) (6)
Fig. 2 gives the scaling function Qe(W −W0) for Bilux dough. The function Qe(W −W0) turns out to be very
similar to the function Qs(W −W0) originally proposed by Hibberd [19] for oscillatory tests: for ε = 0.1 s-1 the
function Qe(W −W0) is given by equation 3 with A = 0.040 for Bilux dough and A = 0.034 for Bison dough. We
established that this relationship holds quite well for a wide range of extension rates (0.01 s-1 - 1 s-1). Surpris-
ingly, regardless of the extension rate, the relationship proved to be valid not only for small strains but also up to
moderate strain values, despite the highly non-linear nature of dough behaviour as observed in Meerts et al. [43].
However, at large strains (i.e. in the strain-hardening region) the relative difference between the viscosity curves
corresponding to different water contents becomes much smaller than the difference predicted by the scaling law.
The latter is attributed to the fact that the dough response is now dominated by the gluten proteins.
The inset in Fig. 3 shows how the SHI evolves with water content for both Bilux and Bison dough at a fixed
extension rate of 0.1 s-1. As the water content increases, so does the value of the SHI. van Vliet [51] already sig-
nalled the potential of the SHI as a reliable predictor of breadmaking performance, and in previous work [43] we
indeed observed the SHI value for the weak Bison dough to be consistently smaller than that for the strong Bilux
dough. Since the addition of more water typically results in a better loaf quality [52], the SHI again turns out to
correlate well with the flour’s breadmaking performance. Although the higher water sensitivity of the weak Bison
dough in linear oscillatory tests is reflected in a more pronounced shifting of the viscosity curves at small strains,
we do not observe a higher water dependency of the SHI for Bison dough as compared to Bilux dough, because
the Bison gluten network itself is also more susceptible to the water content (results not shown). It is furthermore
clear that by simply changing the water content, the weak Bison dough cannot be upgraded to fully emulate the
behaviour of the strong Bilux dough. The use of even higher water levels than those depicted in the inset of Fig. 3

Dough rheology 11
would inevitably result in the complete disintegration of the Bison sample.
Creep-recovery tests
Hibberd’s scaling principle can also be applied to creep data in shear. For creep stresses σ of 10 Pa or less, the
dough response is linear [43], and for this case the creep-recovery curves corresponding to different water levels
can all be derived from the creep-recovery curves measured at a reference water fraction W0:
J(t,W ) = J(t,W0) ·Qc(W −W0)−1 (7)
The scaling function Qc(W −W0) for Bilux dough is also included in Fig. 2, and was found to be very similar
to the scaling functions for oscillatory shear and start-up of extensional flow (parameter A = 0.049 and 0.041 for
Bilux and Bison dough respectively). It is important to note that the function Qc(W −W0) is valid for both the
creep and the recovery phase. The linear oscillatory tests indicated that at low frequencies the phase angle δ might
exhibit a slight dependency on water content, especially for weak flour doughs, as the ‘free’ water phase tends
to affect the slow and fast relaxation mechanisms in different ways. Yet, the compliance curves did not show any
significant deviations from Hibberd’s principle over the entire course of the creep and recovery phases for both the
strong Bilux dough and the weak Bison dough. It is important to note, however, that even with creep tests, probing
the longest time scales in dough is not straightforward, because of aging effects that will continuously change the
physicochemical and viscoelastic properties of the material [53]. We already mentioned [43] that a creep time of
30 min is not sufficient to reach the steady-state flow regime. In fact, in the linear region a steady-state deforma-
tion rate was not observed even after four hours of creep time. Consequently, the creep-recovery curves probably
do not represent all of the relaxation mechanisms taking place in dough, and therefore might not be probing the
long-term relaxation effects of the ‘free’ water phase adequately.
In the non-linear region (i.e. at high stresses) the creep-recovery curves corresponding to different water levels
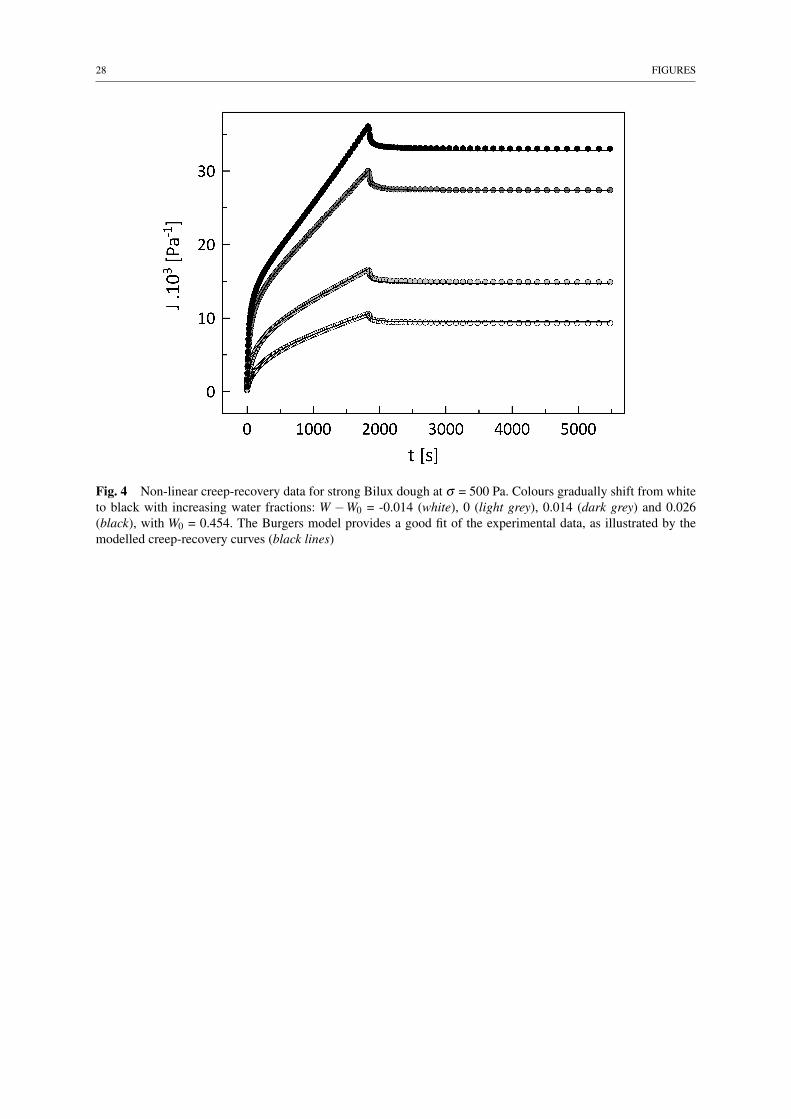
no longer obey the scaling law, as the dough response is now dominated by the gluten network. Fig. 4 gives
the non-linear creep and recovery data for Bilux dough obtained at σ = 500 Pa for different water contents. It
is evident that with increasing water content the dough flows more readily. Several other researchers equally
observed a substantial increase in creep compliance with increasing water content [2, 15, 16]. To study the elastic
and viscous components of the dough response in more detail, the compliance curves can be modeled with the

12 Meerts et al.
Burgers model. In the two-modes Burgers model, the creep compliance Jc(t) is given as [54]:
Jc(t) = J0 + J1
(1− exp
(−tr1
))+ J2
(1− exp
(−tr2
))+
tη
(8)
with J0 being the instantaneous compliance, J1 and J2 the retarded elastic compliances, r1 and r2 the corresponding
retardation times [s], and η the steady-state viscosity [Pa s]. The value of Jc(t) at the end of the creep phase is
denoted by Jmaxc , the maximum creep compliance. The recovery compliance Jr(t) can be modeled with a similar
expression, now only containing the elastic terms [54]:
Jr(t) = J0 + J1
(1− exp
(−tr1
))+ J2
(1− exp
(−tr2
))(9)
The sum of J0, J1 and J2 gives the total recovery compliance Jmaxr . Fig. 4 contains the creep and recovery curves as
fitted with the Burgers model for Bilux dough prepared with different amounts of water. The Burgers model was
found to fit our data very well, even though only two retardation times were taken into account. The values of Jmaxc ,
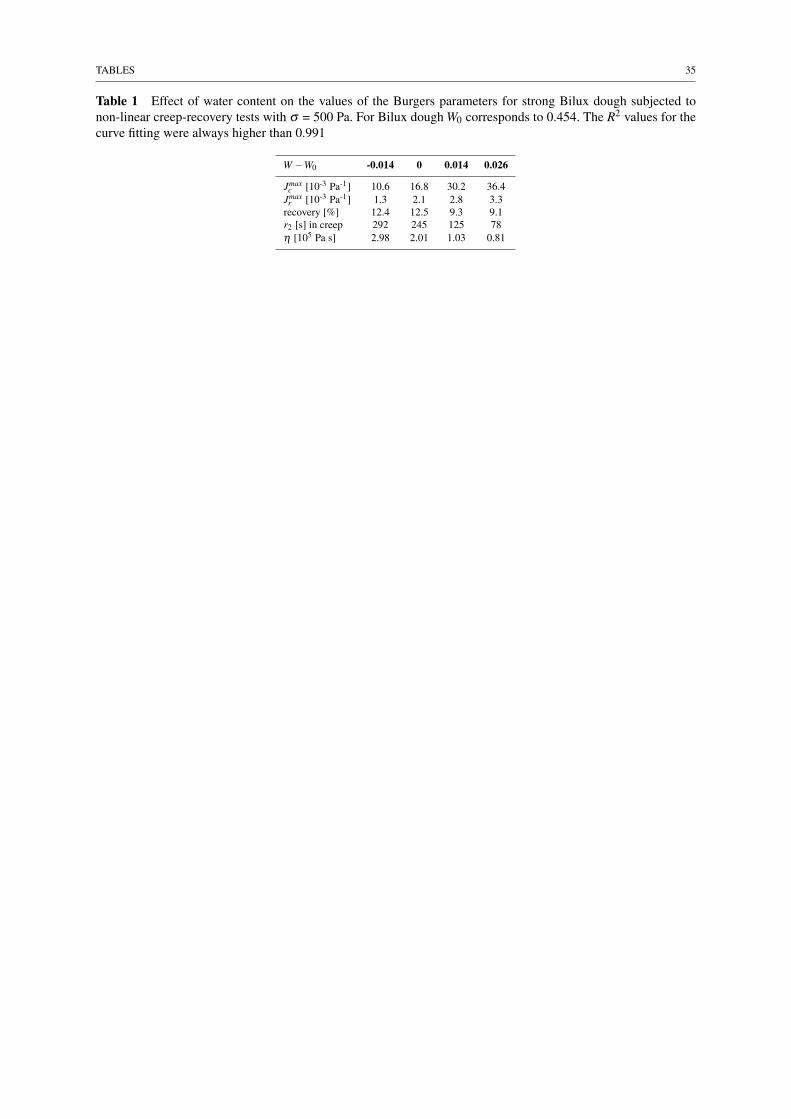
Jmaxr , r2 in creep (r2 being the longest of the two retardation times), and η are given in Table 1 for Bilux dough.
With increasing water content the dough indeed deforms more readily, as Jmaxc shows a substantial increase. At
the same time, the relative amount of deformation that can be recovered tends to go down, as the increase in Jmaxr
is less than the increase in Jmaxc . From the retardation times we learn that the elastic deformation recovers much
faster at higher water levels: the longest retardation time r2 in creep decreases by almost 75 % over the range of
water levels investigated. Not only will the dough attain the steady-state flow regime much faster, the dough will
also exhibit more viscous deformation as the viscosity drops significantly (again by almost 75 %) as the water
content is increased. We can thus conclude that the addition of more water leads to a severe weakening of the
elastic restoring forces, and makes the dough flow more readily as both the retardation times and the viscosity
decrease substantially.
The previous discussion shows that under certain conditions Hibberd’s scaling law, which was originally de-
rived for linear oscillatory tests, can also be applied to extensional and creep-recovery tests. Prerequisites are that
the applied deformations are not too large (ensuring that the deformations are still within, or close to the linear vis-
coelastic region), and the probed material time scales not too long. When these two conditions are met, the dough
response will mostly be determined by the starch-starch and gluten-starch interactions. Several microstructural
studies indicate that in case the dough is sufficiently hydrated, the ‘free’ water phase tends to form a continuous
film around the starch granules, thereby reducing their visibility in Environmental Scanning Electron Microscopy

Dough rheology 13
(ESEM) or Confocal Laser Scanning Microscopy (CLSM) images [15, 18]. A further increase in water content
might thus result in an attenuation of the starch-starch and/or gluten-starch interactions, and the concomitant
changes in rheological response can then be captured adequately with scaling laws. However, if one or both of the
above mentioned conditions is violated, the contribution of the gluten proteins themselves to the overall dough
response will no longer be negligible, and consequently the scaling laws will no longer hold as the ‘free’ water
phase affects the gluten-gluten interactions to a different extent as compared to the gluten-starch and/or starch-
starch interactions.
Rheological theory dictates that the linear material functions are interrelated, implying that if the water scaling
law would hold for one specific linear test, it should hold for all linear deformation modes (including both shear
and extension). We established that the water shift factors are indeed also valid in linear start-up extensional flows
and linear creep-recovery tests. Surprisingly, the scaling law turned out to also hold for larger, non-linear strains, at
least to some extent. To determine more precisely the upper strain limit for which the scaling law is still valid, the
effect of water content on the strain-softening behaviour of dough was studied. Hibberd and Parker [55] suggested
that a strain-softening function ψ(γ0) could be defined, which would be independent not only of frequency, but
also of water content:
G′(ω,γ0,W ) = G′(ω,γlin,W0) ·ψ(γ0) ·Qs(W −W0) (10)
G′′(ω,γ0,W ) = G′′(ω,γlin,W0) ·ψ(γ0) ·Qs(W −W0) (11)
In these expressions γlin is an arbitrary strain amplitude within the linear region, and ψ(γ0) is the strain-softening
function, which is assumed to be independent of frequency and water content. This assumption implies that the
water sensitivity of the dynamic moduli is captured entirely in the function Qs(W −W0), both within and outside
of the linear region. In Fig. 5 the dynamic moduli G′(γ0,W ) and G′′(γ0,W ) of Bilux dough have been normalised
at fixed frequency (ω = 1 rad/s) using their corresponding linear values G′(γlin,W ) and G′′(γlin,W ). Contrary to
Hibberd’s belief, Tanner et al. [56] showed that the strain-softening function does depend on frequency, and our
findings further confirmed that ψ(γ0) is indeed a function of frequency (especially for G′′; results not shown).
Nevertheless, we also observed that for a fixed frequency, ψ(γ0) can definitely be regarded as being independent
of water content. Despite the use of different water levels, the normalised dynamic moduli in Fig. 5 all more or less
superimpose. We found this surprising result to hold for the weak Bison dough as well; only for the highest water
level is there a slight tendency to increased softening as the Bison sample starts to disintegrate (results not shown).

14 Meerts et al.
It thus appears that at the onset of non-linear behaviour, the water content does not strongly affect the fundamental
mechanisms behind the gradual breakdown of the dough structure. Clearly, the dilution effect of the ‘free’ water
phase not only prevails for small but also for moderate deformations in oscillatory shear, up to strain amplitudes γ0
of 100 % (ignoring any non-linear effects in the determination of the dynamic moduli, see also the section on rest
time). This finding can be extrapolated to other modes of deformation as well. When considering the stretch of
the material exerted by a shear deformation, a shear strain of ca. 100 % will correspond to an extensional Hencky
strain ε of approximately 0.5 along the extensional axis of the shear flow [57]:
ε =12
ln
(1+
γ2
2+ γ
√1+
γ2
4
)(12)
We found this value to correspond well to the upper limit of Hencky strain for which the scaling law Qe(W −W0)
is valid in extension. Likewise, the effect of water content in linear creep tests (for which γ < 2 %) can be mod-
eled accurately with the function Qc(W −W0), whereas for non-linear creep tests (with γ >> 100 %), this scaling
function was found to no longer hold.
Mixing time
To study the effect of mixing time on the rheological properties of dough, Bilux and Bison dough samples were
prepared at four different mixing times (1 min, 3.5 min, 7 min, and 15 min, with 3.5 min being the optimal mixing
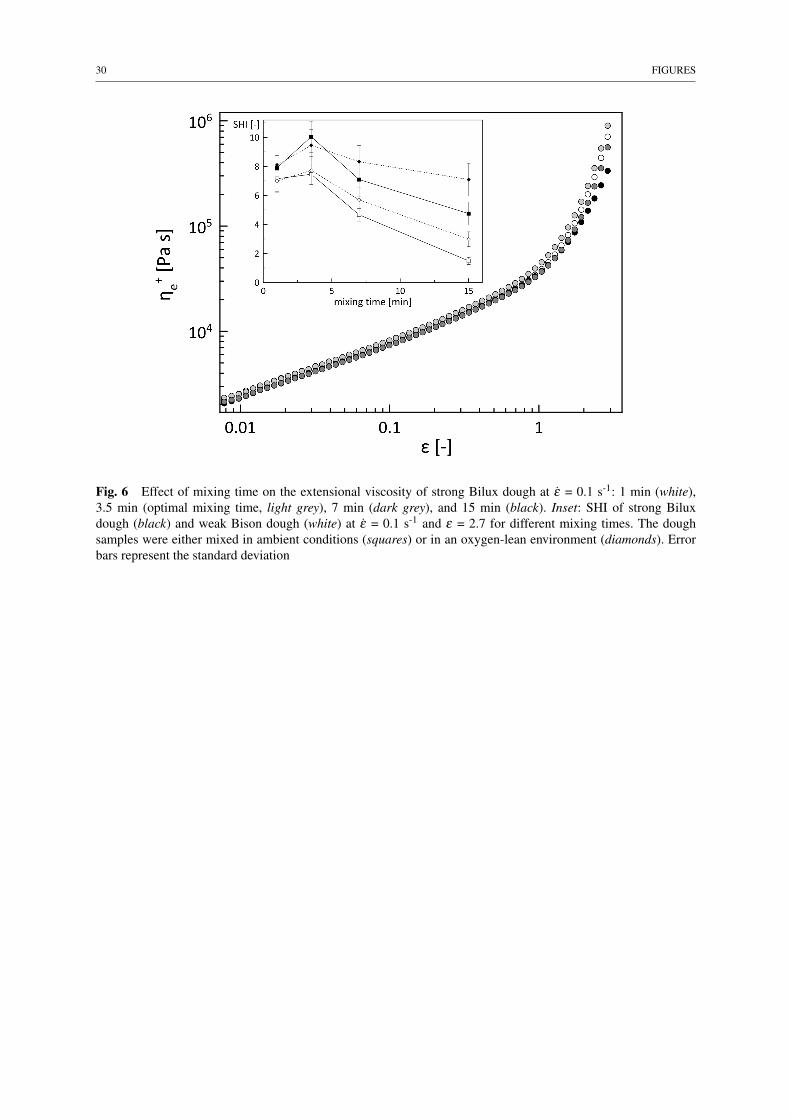
time for both flour types as determined with the Mixograph). Fig. 6 gives the results of the extensional experiments
on Bilux dough. It is clear that the mixing time has a substantially different impact on the dough structure than the
water content (see Fig. 3). For small strains the viscosity curves in Fig. 6 are barely affected by the mixing time.
Instead, the effect of mixing time is seen most clearly in the final part of the viscosity curves, i.e. at large strains.
Since the dough behaviour at large strains is determined primarily by the gluten network [39, 42, 43, 50], this
observation indicates that the gluten network is much more affected by the mixing time than the (interactions be-
tween the) starch granules. This can also explain why we found the effect of mixing time on the G′ and G′′ curves
to be very limited: linear rheological tests are not very sensitive to differences in the gluten network [43]. Indeed,
for both Bilux and Bison dough the values of the dynamic moduli were found to decrease only very slightly with
increasing mixing time (results not shown).

Dough rheology 15
Other researchers observed that differences in linear oscillatory response for dough samples differing in de-
velopment status tend to become larger as the duration of the rest period preceding the measurement is decreased
[41, 42]. Yet the two dough systems used in our study showed only very limited time effects in oscillatory tests,
even when given no rest time at all (results not shown). To explain the time-dependent oscillatory response of
the under- and overdeveloped dough samples, Kim et al. [41] suggested that during resting the flour constituents
in undermixed dough undergo a continued hydration, whereas the damaged gluten network in overmixed dough
most likely experiences a repolymerisation, eventually resulting in very similar dynamic moduli for dough samples
differing in development status. However, non-linear rheological tests, such as extensional tests, are much more
suited to probe the gluten network, and as Fig. 6 indicates, these tests clearly signal substantial differences between
dough samples mixed for different times, regardless of the length of the preceding resting period. Moreover, the ex-
tensional behaviour of the undermixed dough does not correspond to that of a less hydrated dough (Fig. 3), which
suggests that while undermixed dough might (initially) suffer from insufficient hydration, the discontinuity of the
underdeveloped gluten network also has a detrimental (and lasting) effect on the dough performance. By contrast,
as will be shown below, the extensional tests do confirm that the gluten network in overmixed dough might ex-
perience a repolymerisation. Dreese et al. [10] hypothesised that overmixing might also restrict the water-binding
capacity of the gluten network, resulting in the release of a substantial amount of water. Yet our extensional data do
not support this hypothesis, as the overmixed dough does not exhibit the characteristics of a dough prepared with
an excess amount of water (compare Fig. 6 with Fig. 3). This observation is further substantiated by several mi-
crostructural studies that found the amount of ‘free’ water to remain relatively constant in overmixed doughs [5, 7].
Despite the apparent lack of consistency in the rheological studies published on the effect of mixing time (cf.
Introduction), it is widely acknowledged that under- and overmixing are both detrimental to loaf quality [1, 58],
and this trend is also clearly reflected in the SHI. The inset in Fig. 6 gives the SHI values of Bilux and Bison
dough obtained for different mixing times in ambient atmosphere. The SHI values of both flours show a maxi-
mum at or at least nearby the so-called optimal mixing time that was determined with the Mixograph. In Kieffer
rig experiments, Peighambardoust et al. [29] also observed a decrease in the dough strength and the extent of
strain-hardening with increasing mixing time. The weak Bison dough is clearly more sensitive to overmixing than
the strong Bilux dough. After 15 min of mixing, the SHI of Bison dough has dropped from 7.5 to less than 1.5 (a
decrease of more than 80 %), whereas the SHI of Bilux dough retains almost half of its original value (4.75 versus

16 Meerts et al.
10.1 at optimal mixing time). It can be concluded that the gluten network in the weak Bison dough is more prone
to degradation, but at the same time the build-up of that network also appears to occur faster when compared to
the strong Bilux dough. After only 1 min of mixing, the SHI of Bison dough already attains 95 % of the SHI
value corresponding to the optimal mixing time (compared to 75 % for Bilux dough). Hence, the findings of our
extensional experiments are consistent with earlier Mixograph analyses on the effects of under- and overmixing on
strong and weak flour doughs (see for instance MacRitchie [1]), and highlight thus once again the great potential
of the SHI as a quality predictive tool.
As mentioned in the introduction, there is still considerable debate in literature concerning the molecular and/or
structural changes taking place in the gluten network during overmixing. In extraction experiments, Graveland et
al. [25] observed that the gluten proteins do not experience any significant breakdown if the dough is mixed in a
nitrogen atmosphere. They proposed that the SS bonds are cleaved and turn into thiyl radicals in the presence of
O –2 . To evaluate this interesting hypothesis and to assess its rheological significance, we performed extensional
measurements on Bilux as well as Bison doughs prepared with different mixing times in an oxygen-lean envi-
ronment. This oxygen-lean environment was created by having nitrogen flow over the dough mixer, which was
put under a glass case. After 15 min of mixing, the dough samples were much less sticky as compared to dough
samples overmixed in ambient atmosphere. The SHI values also clearly indicate that the effect of overmixing is
considerably less pronounced in an oxygen-lean environment (see inset in Fig. 6). After 15 min of mixing, Bilux
and Bison dough now retain SHI values of 7.1 and 3.0, which are considerably higher than the corresponding SHI
values obtained in ambient conditions. Our findings thus confirm that oxygen plays an important role in the gluten
breakdown occurring during overmixing, and our extensional rheology data thus substantiate the analytical results
of Graveland et al. [25]. We assume that the remaining attenuation of the strain-hardening phenomenon observed
after 15 min of mixing in the oxygen-lean environment results from the presence of traces of O2, or otherwise
reflects the disaggregation of the gluten proteins and the corresponding loss of non-covalent interactions. In a
previous publication [43] we already stressed the relative importance of the contribution of non-covalent bonds to
the gluten structure in comparison with that of the SS covalent cross-links.
As with the linear oscillatory tests, the linear creep tests fail to perceive any substantial differences between
doughs mixed for different mixing times (results not shown). The effect of mixing time only becomes apparent in

Dough rheology 17
non-linear creep tests, as only these tests (besides the non-linear extensional tests, of course) adequately probe the
response of the gluten network. Fig. 7 shows the non-linear creep-recovery curves for strong Bilux dough prepared
with different mixing times, together with the fits obtained with the Burgers model. The corresponding Burgers
parameter values are summarised in Table 2. Compared to the extensional tests, the effect of overmixing is less
pronounced in the non-linear creep-recovery tests. In fact, the overmixed dough still exhibits a fairly strong elastic
character, as evidenced by the large values of Jmaxr and r2, and an equally high viscosity. By contrast, the insuf-
ficient build-up of the gluten network as a consequence of undermixing is readily apparent in the creep-recovery
response. The undermixed Bilux sample flows much more easily than the longer mixed samples, and the lack of
an elastic structure is clearly reflected in the very small values of Jmaxr and the relative amount of recovery (see
again Table 2).
Rest time
In the previous section it was shown that overmixing may lead to the disaggregation or even depolymerisation
of the gluten network, with the effects thereof being apparent in the non-linear dough behaviour. However, this
loss of network integrity is, to some extent at least, reversible. Extraction experiments indicated that during the
resting period after mixing, the amount of glutenin macropolymer steadily increased, yet even after 1.5 - 2 hours,
the recovery was found to be still far from complete [22, 27]. As with the breakdown of the gluten network, the
mechanisms by which the network is reformed during subsequent rest are still under debate. The gluten proteins
might tend to reaggregate through the reformation of non-covalent bonds, or might undergo a repolymerisation by
means of SH/SS interchange reactions. Graveland et al. [25] suggested that the cleaved SS bonds are reformed by
the oxidising power of manganese ions present in dough.
To study the recovery of the gluten network from a mechanical rather than a chemical point of view, the exten-
sional viscosity was characterised for different resting times after mixing. The self-healing ability of dough turns
out to be clearly reflected in its extensional behaviour. Fig. 8 shows how the SHI values of strong Bilux dough and
weak Bison dough evolve with resting time, after mixing for either 3.5 or 15 minutes. The dough samples that are
‘optimally’ developed (i.e. mixed for 3.5 min) do not exhibit any time dependence in their extensional behaviour.
By contrast, the overmixed dough samples show clear signs of recovery. Immediately after 15 min of mixing, the

18 Meerts et al.
SHI value of Bilux dough is only 2.4, but this value increases substantially if the dough is allowed some resting.
After 30 min of resting the SHI value seems to have reached a plateau (4.8 - 5.0), that is, however, still well below
the SHI value (10.1) corresponding to the optimal mixing time of 3.5 min. Likewise, the SHI value for overmixed
Bison dough increases to twice its initial value over the course of 60 min (from 0.9 to 1.9), but in the end also fails
to reach the SHI value (7.5) corresponding with the optimal mixing time. With extensional tests it is thus possi-
ble to track the reformation of the gluten network, but in line with the compositional data of Don et al. [22] and
Weegels et al. [27], we also observe that in the end this recovery cannot undo all the damage caused by overmixing.
The ability of the dough structure to recover (albeit not entirely) from large deformations, can also be quan-
tified by a specific deformation protocol in the rheometer. In this protocol the dough is first subjected to large
amplitude oscillatory shear (LAOS), followed by a small amplitude oscillatory time sweep in the linear region,
during which the dough structure will partially build up again (Fig. 9). Care has to be taken, however, as at these
large strain amplitudes, the stress response is no longer sinusoidal and the obtained G′ and G′′ are no longer the
true dynamic moduli, but rather represent only the first harmonics. Despite the very small linearity limit (γc ≈ 0.1
%), Berland and Launay [59] found the output stress signal in oscillatory tests to remain more or less sinusoidal
up to strain amplitudes of 10 % - 20 %. In other words, the dough response seemed to remain quasi-linear up to
relatively large strains. Conversely, Phan-Thien et al. [60] already observed substantial non-linearities for strain
amplitudes not far above the linearity limit (γ0 > 1 %). LAOS experiments conducted here confirm that the stress
response signal tends to deviate strongly from a sinusoidal shape for γ0 = 10 % (results not shown). Consequently,
we have to keep in mind that under large strain amplitudes the dynamic moduli G′ and G′′ will only capture part
of the material response. Fig. 9 shows that at these large strain amplitudes the values of the dynamic moduli G′
and G′′ for Bilux dough are strongly reduced, and at the same time G′′ becomes equal to, or even larger than G′.
Clearly, the elastic structure in dough undergoes significant damage under these deformations. The dough struc-
ture nevertheless shows immediate signs of recovery as soon as the strain amplitude γ0 is shifted back to 0.06 %,
a value within the linear region. For initial strain amplitudes smaller than 5 %, this recovery is complete within
60 minutes, whereas for larger strain amplitudes the recovery is only partial. As the slopes of the G′ curves deter-
mined after different (large) strain amplitudes are all practically the same after 60 minutes of recovery, it is evident
that the deformation history will have a lasting effect on the dough structure. Compared to the strong Bilux dough,
the self-healing ability of the weak Bison dough is somewhat less: following an oscillatory shear deformation with

Dough rheology 19
γ0 = 50 %, the Bilux sample is able to recover ca. 70 % of its initial G′ value, compared to ca. 60 % for the Bison
sample. Similar small differences could be perceived between Bilux dough samples that were mixed for 1 min,
3.5 min or 15 min and subjected to γ0 = 50 %.
LAOS tests on wheat flour dough have also been performed by other researchers. Hibberd and Wallace [8]
attributed the strain-softening and subsequent recovery effect to a temporary loss of adhesion between the gluten
proteins and the starch granules, thereby emphasising the importance of the non-covalent bonds for the build-up of
the dough structure. Smith et al. [49] observed that starch samples were able to recover more quickly than dough
samples under similar conditions. They suggested that the thixotropic behaviour of dough could also partially
result from the breakdown and reformation of starch aggregates, with the gluten proteins in dough reducing the
rate at which the starch aggregates can be reformed (again by means of non-covalent bonds). Berland and Launay
[59] found the strain-softening effects to become completely irreversible beyond a shear strain amplitude of ca. 20
%, and considered this value to be a transition point: for strain amplitudes above 20 %, not only gluten-starch but
also gluten-gluten interactions are disrupted, and the damage becomes entirely permanent. Berland and Launay
[59] did not specify whether they considered the disrupted gluten-gluten interactions to include both the covalent
and non-covalent interactions, or only the latter. However, Fig. 9 shows that following the destruction step, the
elastic structure in dough always shows signs of recovery, no matter how large the initial strain amplitude (note
that γ0 varies from 5 % to 100 %). We observed no transition point between two types of destruction regimes.
In addition, the compositional data of Don et al. [22] and Weegels et al. [27], together with our extensional tests,
indicate that while the gluten network is indeed liable to disaggregation and most likely even depolymerisation,
the damage is always partially reversible. We therefore conclude that depending on the strain amplitude, the LAOS
tests might disrupt the starch aggregates, the linkages between the starch component and the gluten proteins, as
well as the gluten network itself. As all three destruction modes appear to be (partially) reversible, it is difficult to
identify different types of destruction regimes on the sole basis of rheological data.
Conclusions
In this work, the effects of water content and mixing time on dough rheology have been studied systematically.
Thereto, a rheological toolbox consisting of linear and non-linear tests in shear and extension has been used. The
results of this study indicate that the effect of water content on the dough behaviour can be captured by a simple
20 Meerts et al.
scaling law. This scaling law was observed to be valid not only in the linear region, but to a certain extent also in the
non-linear region. The scaling law also turned out to hold in various flow protocols. Other studies have indicated
that at relevant water concentrations, variations in water content affect the amount of ‘free’ water. The broad appli-
cability of the water shift factors suggests that the rheological impact of these variations is mainly a dilution effect.
The mixing time was observed to have a profound impact mainly on the extensional behaviour of dough. Over-
mixing results in a substantial attenuation of the strain-hardening behaviour, as quantified by the strain-hardening
index. In literature there is still no consensus about the molecular mechanisms by which the gluten network is dis-
rupted during overmixing, but our study puts forward that oxygen plays a pivotal role in the degradation process.
The adverse effects of overmixing were significantly less pronounced when the mixing action was performed in
an oxygen-lean environment. If allowed some rest time, the overmixed dough shows signs of recovery. The re-
covery is, however, rather slow, and depending on the inflicted amount of damage it may not be complete either.
Overall, the strain-hardening index constitutes a promising tool to track the rheological impact of compositional
and structural changes in the gluten network.
Acknowledgements MM and RC are indebted to the Research Foundation - Flanders (FWO) for a doctoral and postdoctoral fellowship at
KU Leuven, respectively. The Research Fund KU Leuven (IDO/12/011) is also gratefully acknowledged for its financial support. Finally, the
authors wish to thank Nore Struyf and Mohammad Naser Rezaei for determining the flour characteristics (protein content, moisture content,
optimal mixing time and water absorption).
References
1. F. MacRitchie, in Chemistry and Physics of Baking: Materials, Processes and Products, ed. By J.M.V. Blan-
shard, P.J. Frazier, T. Galliard (Royal Society of Chemistry, London, 1988)
2. M. Mastromatteo, M. Guida, A. Danza, J. Laverse, P. Frisullo, V. Lampignano, M.A. Del Nobile, Food Res.
Int. 51, 458-466 (2013)
3. R. Tkachuk, I. Hlynka, Cereal Chem. 45, 80-87 (1968)
4. N.W.R. Daniels, in Water Relations of Foods, ed. By R.B. Duckworth (Academic Press, London, 1975)
5. F. MacRitchie, Cereal Chem. 53, 318-326 (1976)
6. R. Upadhyay, D. Ghosal, A. Mehra, J. Food Eng. 109, 104-113 (2012)

Dough rheology 21
7. S. Ablett, G.E. Attenburrow, P.J. Lillford, in Chemistry and Physics of Baking: Materials, Processes and Prod-
ucts, ed. By J.M.V. Blanshard, P.J. Frazier, T. Galliard (Royal Society of Chemistry, London, 1988)
8. G.E. Hibberd, W.J. Wallace, Rheol. Acta 5, 193-198 (1966)
9. L.L. Navickis, R.A. Anderson, E.B. Bagley, B.K. Jasberg, J. of Texture Stud. 13, 249-264 (1982)
10. P.C. Dreese, J.M. Faubion, R.C. Hoseney, Cereal Chem. 65, 354-359 (1988)
11. K. Mani, C. Tragardh, A.-C. Eliasson, L. Lindahl, J. of Food Sci. 57, 1198-1209 (1992)
12. S. Berland, B. Launay, Cereal Chem. 72, 48-52 (1995)
13. P. Masi, S. Cavella, M. Sepe, Cereal Chem. 75, 428-432 (1998)
14. N. Phan-Thien, M. Safari-Ardi, J. Non-Newton. Fluid Mech. 74, 137-150 (1998)
15. M. Jekle, T. Becker, Food Res. Int. 44, 984-991 (2011)
16. N.A. Hardt, R.M. Boom, A.J. van der Goot, Food Res. Int. 66, 478-484 (2014)
17. J. Ahmed, J. Food Eng. 152, 85-94 (2015)
18. C. Letang, M. Piau, C. Verdier, J. Food Eng. 41, 121-132 (1999)
19. G.E. Hibberd, Rheol. Acta 9, 497-500 (1970)
20. T.S.K. Ng, Linear to Nonlinear Rheology of Bread Dough and its Constituents (Massachusetts Institute of
Technology Ph.D. thesis, Cambridge, 2007)
21. C.W. Macosko, Rheology: Principles, Measurements and Applications (Wiley-VCH, New York, 1994)
22. C. Don, W.J. Lichtendonk, J.J. Plijter, T. van Vliet, R.J. Hamer, J. Cereal Sci. 41, 69-83 (2005)
23. C.C. Tsen, Cereal Chem. 44, 308-317 (1967)
24. K. Tanaka, W. Bushuk, Cereal Chem. 50, 605-612 (1973)
25. A. Graveland, P. Bosveld, W.J. Lichtendonk, J.H.E. Moonen, Biochem. Biophys. Res. Communications 93,
1189-1195 (1980)
26. A.H. Bloksma, Cereal Foods World 35, 237-244 (1990)
27. P.L. Weegels, R.J. Hamer, J.D. Schofield, J. Cereal Sci. 25, 155-163 (1997)
28. A.D. Tlapale-Valdivia, J. Chanona-Perez, R. Mora-Escobedo, R.R. Farrera-Rebollo, G.F. Gutierrez-Lopez, G.
Calderon-Domınguez, Int. J. Food Sci. Technol. 45, 530-539 (2010)
29. S.H. Peighambardoust, A.J. van der Goot, T. van Vliet, R.J. Hamer, R.M. Boom, J. Cereal Sci. 43, 183-197
(2006)
30. S.H. Peighambardoust, M.R. Dadpour, M. Dokouhaki, J. Cereal Sci. 51, 21-27 (2010)

22 Meerts et al.
31. M. Kokawa, K. Fujita, J. Sugiyama, M. Tsuta, M. Shibata, T. Araki, H. Nabetani, J. Cereal Sci. 55, 15-21
(2012)
32. F. MacRitchie, J. Polym. Sci.: Polym. Symp. 49, 85-90 (1975)
33. H. Wieser, Food Microbiol. 24, 115-119 (2007)
34. F. MacRitchie, J. Cereal Sci. 46, 96-97 (2007)
35. P. Belton, J. Cereal Sci. 46, 97-98 (2007)
36. T. van Vliet, R.J. Hamer, J. Cereal Sci. 46, 98-99 (2007)
37. V. Kontogiorgos, Food Res. Int. 44, 2582-2586 (2011)
38. L. Bohlin, T.L.-G. Carlson, Cereal Chem. 57, 174-177 (1980)
39. J.I. Amemiya, J.A. Menjivar, J. Food Eng. 16, 91-108 (1992)
40. H. Larsson, A.-C. Eliasson, E. Johansson, G. Svensson, Cereal Chem. 77, 633-639 (2000)
41. Y.-R. Kim, P. Cornillon, O.H. Campanella, R.L. Stroshine, S. Lee, J.-Y. Shim, J. Food Sci. 73, E1-E8
42. B. Schiedt, A. Baumann, B. Conde-Petit, T.A. Vilgis, J. Text. Stud. 44, 317-332
43. M. Meerts, R. Cardinaels, F. Oosterlinck, C.M. Courtin, P. Moldenaers, Food Bioprocess Technol. (2016)
doi:10.1007/s11947-016-1810-2
44. AOAC International, Official Methods of Analysis of AOAC International, 16th edn. (AOAC International,
Washington, DC, 1995)
45. AACC International, Approved Methods of Analysis, 11th edn. (AACC International, St. Paul, 2000)
46. A.D. McNaught, A. Wilkinson, Compendium of Chemical Terminology, 2nd edn. (Blackwell Scientific Pub-
lications, Oxford, 1997)
47. J. Lefebvre, N. Mahmoudi, J. Cereal Sci. 45, 49-58 (2007)
48. G.E. Hibberd, Rheol. Acta 9, 501-505 (1970)
49. J.R. Smith, T.L. Smith, N.W. Tschoegl, Rheol. Acta 9, 239-252 (1970)
50. K.M. Tronsmo, E.M. Magnus, P. Baardseth, J.D. Schofield, A. Aamodt, E.M. Færgestad, Cereal Chem. 80,
587-595 (2003)
51. T. van Vliet, J. Cereal Sci. 48, 1-9 (2008)
52. J.E. Bock, S. Damodaran, Food Hydrocolloids 31, 146-155 (2013)
53. V. Kontogiorgos, P. Shah, P. Bills, Rheol. Acta 55, 187-195 (2016)
54. F. Van Bockstaele, I. De Leyn, M. Eeckhout, K. Dewettinck, J. Food Eng. 107, 50-59

Dough rheology 23
55. G.E. Hibberd, N.S. Parker, Rheol. Acta 14, 151-157 (1975)
56. R.I. Tanner, F. Qi, S.C. Dai, J. Non-Newton. Fluid Mech. 148, 33-40 (2008)
57. V. Kitoko, M. Keentok, R.I. Tanner, Korea-Aust. Rheol. J. 15, 63-73 (2003)
58. E.B. Bagley, F.R. Dintzis, S. Chakrabarti, Rheol. Acta 37, 556-565 (1998)
59. S. Berland, B. Launay, Rheol. Acta 34, 622-625 (1995)
60. N. Phan-Thien, M. Newberry, R.I. Tanner, J. of Non-Newt. Fluid Mech. 92, 67-80 (2000)

24 Meerts et al.
List of Figures
1 Storage modulus G′ (squares) and phase angle δ (circles) for strong Bilux dough (a) and for weakBison dough (b) versus angular frequency ω . Dough samples were prepared with different waterlevels: W −W0 = -0.014 and -0.015 (white), 0 (light grey), 0.014 and 0.015(dark grey), 0.026 and0.028 (black) for Bilux dough (W0 = 0.454) and Bison dough (W0 = 0.436), respectively. A linearstrain amplitude γ0 of 0.06 % was applied . . . . . . . . . . . . . . . . . . . . . . . . . . . . . . 25
2 Exponential scaling functions Qs(W −W0), Qe(W −W0) and Qc(W −W0) for strong Bilux doughin linear oscillatory shear tests, extensional tests and linear creep tests. For Bilux dough W0 corre-sponds to 0.454 . . . . . . . . . . . . . . . . . . . . . . . . . . . . . . . . . . . . . . . . . . . . 26
3 Extensional viscosity after start-up of flow for strong Bilux dough at ε = 0.1 s-1 for different waterlevels: W −W0 = -0.014 (white), 0 (light grey), 0.014 (dark grey) and 0.026 (black), with W0 =0.454. Inset: SHI for strong Bilux dough (black) and weak Bison dough (white) at ε = 0.1 s-1
and ε = 2.7 for different water contents. For Bison dough, W0 = 0.436. Error bars represent thestandard deviation . . . . . . . . . . . . . . . . . . . . . . . . . . . . . . . . . . . . . . . . . . 27
4 Non-linear creep-recovery data for strong Bilux dough at σ = 500 Pa. Colours gradually shiftfrom white to black with increasing water fractions: W −W0 = -0.014 (white), 0 (light grey), 0.014(dark grey) and 0.026 (black), with W0 = 0.454. The Burgers model provides a good fit of theexperimental data, as illustrated by the modelled creep-recovery curves (black lines) . . . . . . . 28
5 Dynamic strain sweeps for strong Bilux dough with different water fractions: W −W0 = -0.014(white), 0 (light grey), 0.014 (dark grey) and 0.026 (black), with W0 = 0.454. The dynamic mod-uli have been normalised using their corresponding linear values at γ0 = 0.01 %. The angularfrequency ω was kept constant at 1 rad/s . . . . . . . . . . . . . . . . . . . . . . . . . . . . . . 29
6 Effect of mixing time on the extensional viscosity of strong Bilux dough at ε = 0.1 s-1: 1 min(white), 3.5 min (optimal mixing time, light grey), 7 min (dark grey), and 15 min (black). Inset:SHI of strong Bilux dough (black) and weak Bison dough (white) at ε = 0.1 s-1 and ε = 2.7 fordifferent mixing times. The dough samples were either mixed in ambient conditions (squares) orin an oxygen-lean environment (diamonds). Error bars represent the standard deviation . . . . . . 30
7 Non-linear creep-recovery curves of strong Bilux dough at σ = 500 Pa for different mixing times.The dough samples were all mixed in ambient conditions for either 1 min (white), 3.5 min (lightgrey; optimal mixing time), 7 min (dark grey) or 15 min (black). As indicated by the black lines,the Burgers model fits the experimental data very well . . . . . . . . . . . . . . . . . . . . . . . 31
8 Values of the SHI as a function of rest time for strong Bilux dough (black) and weak Bison dough(white) mixed for either 3.5 min (squares) or 15 min (diamonds). An extension rate ε of 0.1 s-1
was applied. The SHI was evaluated at ε = 2.7. Error bars represent the standard deviation . . . . 329 Evolution of the dynamic moduli G′ (squares) and G′′ (diamonds) for strong Bilux dough samples
that were first subjected to large strain amplitudes and subsequently allowed to recover. Initialstrain amplitudes γ0 = 5 % (black), 10 % (dark grey), 25 % (medium grey), 50 % (light grey) and100 % (white), with angular frequency ω = 1 rad/s. The horizontal dashed lines give an indicationof the values of G′ and G′′ for undamaged Bilux dough . . . . . . . . . . . . . . . . . . . . . . . 33

FIGURES 25
(a)
(b)
Fig. 1 Storage modulus G′ (squares) and phase angle δ (circles) for strong Bilux dough (a) and for weak Bisondough (b) versus angular frequency ω . Dough samples were prepared with different water levels: W −W0 = -0.014and -0.015 (white), 0 (light grey), 0.014 and 0.015(dark grey), 0.026 and 0.028 (black) for Bilux dough (W0 =0.454) and Bison dough (W0 = 0.436), respectively. A linear strain amplitude γ0 of 0.06 % was applied

26 FIGURES
Fig. 2 Exponential scaling functions Qs(W −W0), Qe(W −W0) and Qc(W −W0) for strong Bilux dough in linearoscillatory shear tests, extensional tests and linear creep tests. For Bilux dough W0 corresponds to 0.454

FIGURES 27
Fig. 3 Extensional viscosity after start-up of flow for strong Bilux dough at ε = 0.1 s-1 for different water levels:W −W0 = -0.014 (white), 0 (light grey), 0.014 (dark grey) and 0.026 (black), with W0 = 0.454. Inset: SHI forstrong Bilux dough (black) and weak Bison dough (white) at ε = 0.1 s-1 and ε = 2.7 for different water contents.For Bison dough, W0 = 0.436. Error bars represent the standard deviation
28 FIGURES
Fig. 4 Non-linear creep-recovery data for strong Bilux dough at σ = 500 Pa. Colours gradually shift from whiteto black with increasing water fractions: W −W0 = -0.014 (white), 0 (light grey), 0.014 (dark grey) and 0.026(black), with W0 = 0.454. The Burgers model provides a good fit of the experimental data, as illustrated by themodelled creep-recovery curves (black lines)

FIGURES 29
Fig. 5 Dynamic strain sweeps for strong Bilux dough with different water fractions: W −W0 = -0.014 (white),0 (light grey), 0.014 (dark grey) and 0.026 (black), with W0 = 0.454. The dynamic moduli have been normalisedusing their corresponding linear values at γ0 = 0.01 %. The angular frequency ω was kept constant at 1 rad/s
30 FIGURES
Fig. 6 Effect of mixing time on the extensional viscosity of strong Bilux dough at ε = 0.1 s-1: 1 min (white),3.5 min (optimal mixing time, light grey), 7 min (dark grey), and 15 min (black). Inset: SHI of strong Biluxdough (black) and weak Bison dough (white) at ε = 0.1 s-1 and ε = 2.7 for different mixing times. The doughsamples were either mixed in ambient conditions (squares) or in an oxygen-lean environment (diamonds). Errorbars represent the standard deviation

FIGURES 31
Fig. 7 Non-linear creep-recovery curves of strong Bilux dough at σ = 500 Pa for different mixing times. Thedough samples were all mixed in ambient conditions for either 1 min (white), 3.5 min (light grey; optimal mixingtime), 7 min (dark grey) or 15 min (black). As indicated by the black lines, the Burgers model fits the experimentaldata very well

32 FIGURES
Fig. 8 Values of the SHI as a function of rest time for strong Bilux dough (black) and weak Bison dough (white)mixed for either 3.5 min (squares) or 15 min (diamonds). An extension rate ε of 0.1 s-1 was applied. The SHI wasevaluated at ε = 2.7. Error bars represent the standard deviation

FIGURES 33
Fig. 9 Evolution of the dynamic moduli G′ (squares) and G′′ (diamonds) for strong Bilux dough samples thatwere first subjected to large strain amplitudes and subsequently allowed to recover. Initial strain amplitudes γ0 = 5% (black), 10 % (dark grey), 25 % (medium grey), 50 % (light grey) and 100 % (white), with angular frequency ω
= 1 rad/s. The horizontal dashed lines give an indication of the values of G′ and G′′ for undamaged Bilux dough

34 FIGURES
List of Tables
1 Effect of water content on the values of the Burgers parameters for strong Bilux dough subjectedto non-linear creep-recovery tests with σ = 500 Pa. For Bilux dough W0 corresponds to 0.454. TheR2 values for the curve fitting were always higher than 0.991 . . . . . . . . . . . . . . . . . . . . 35
2 Effect of mixing time on the values of the Burgers parameters for strong Bilux dough subjectedto non-linear creep-recovery tests with σ = 500 Pa. The R2 values for curve fitting were alwayshigher than 0.992 . . . . . . . . . . . . . . . . . . . . . . . . . . . . . . . . . . . . . . . . . . . 36
TABLES 35
Table 1 Effect of water content on the values of the Burgers parameters for strong Bilux dough subjected tonon-linear creep-recovery tests with σ = 500 Pa. For Bilux dough W0 corresponds to 0.454. The R2 values for thecurve fitting were always higher than 0.991
W −W0 -0.014 0 0.014 0.026
Jmaxc [10-3 Pa-1] 10.6 16.8 30.2 36.4
Jmaxr [10-3 Pa-1] 1.3 2.1 2.8 3.3
recovery [%] 12.4 12.5 9.3 9.1r2 [s] in creep 292 245 125 78η [105 Pa s] 2.98 2.01 1.03 0.81

36 TABLES
Table 2 Effect of mixing time on the values of the Burgers parameters for strong Bilux dough subjected tonon-linear creep-recovery tests with σ = 500 Pa. The R2 values for curve fitting were always higher than 0.992
mixing time 1 min 3.5 min 7 min 15 min
Jmaxc [10-3 Pa-1] 31.5 16.8 13.1 11.0
Jmaxr [10-3 Pa-1] 1.9 2.1 2.2 1.9
recovery [%] 5.9 12.5 16.8 17.6r2 [s] in creep 126 245 267 292η [105 Pa s] 0.76 2.01 3.77 4.23