Embed Size (px)
Citation preview

Growth on Tap:Smartphones and Tablets dominate visit, basket growthDemandware powers over 1,000
sites for some of the largest and most
recognizable retail brands in the world.
Analyzing anonymous data across these
sites, Demandware is able to identify
trends and opportunities to optimize
shopper experiences. This community
insight, combined with Demandware’s
Cloud Commerce solutions, empowers
brands to continuously innovate and
move faster.
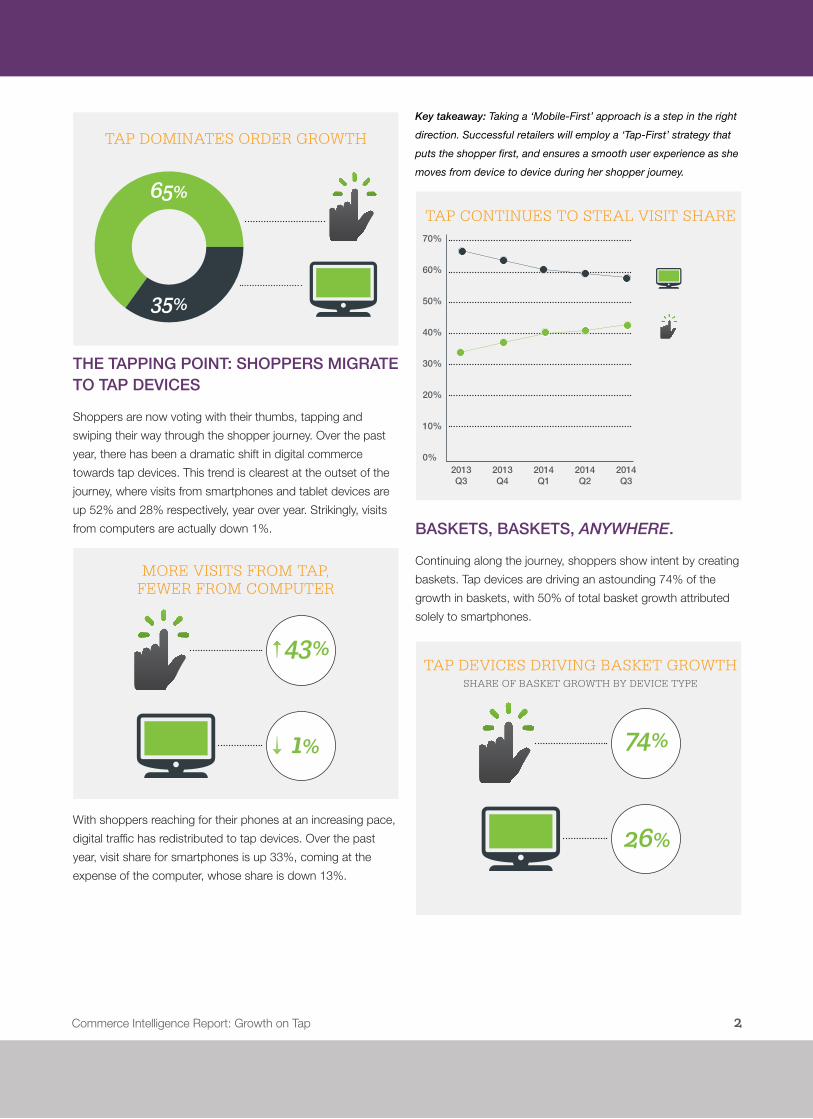
Retailers take note: the era of ‘click shopping’ has
evolved. Tap devices – i.e. Smartphones and Tablets –
now drive more digital commerce revenue growth than
computers. Together, Tap devices account for 65%
of the increase in orders, with 55% of that growth
directly driven by smartphones. Growth is on Tap.
Tap Devices include smartphones and tablets, and replace the often ambiguous term ‘mobile.’
2Commerce Intelligence Report: Growth on Tap
THE TAPPING POINT: SHOPPERS MIGRATE TO TAP DEVICES
Shoppers are now voting with their thumbs, tapping and
swiping their way through the shopper journey. Over the past
year, there has been a dramatic shift in digital commerce
towards tap devices. This trend is clearest at the outset of the
journey, where visits from smartphones and tablet devices are
up 52% and 28% respectively, year over year. Strikingly, visits
from computers are actually down 1%.
With shoppers reaching for their phones at an increasing pace,
digital traffi c has redistributed to tap devices. Over the past
year, visit share for smartphones is up 33%, coming at the
expense of the computer, whose share is down 13%.
Key takeaway: Taking a ‘Mobile-First’ approach is a step in the right
direction. Successful retailers will employ a ‘Tap-First’ strategy that
puts the shopper fi rst, and ensures a smooth user experience as she
moves from device to device during her shopper journey.
BASKETS, BASKETS, ANYWHERE.
Continuing along the journey, shoppers show intent by creating
baskets. Tap devices are driving an astounding 74% of the
growth in baskets, with 50% of total basket growth attributed
solely to smartphones.
TAP DEVICES DRIVING BASKET GROWTHSHARE OF BASKET GROWTH BY DEVICE TYPE
MORE VISITS FROM TAP,FEWER FROM COMPUTER
TAP DOMINATES ORDER GROWTH
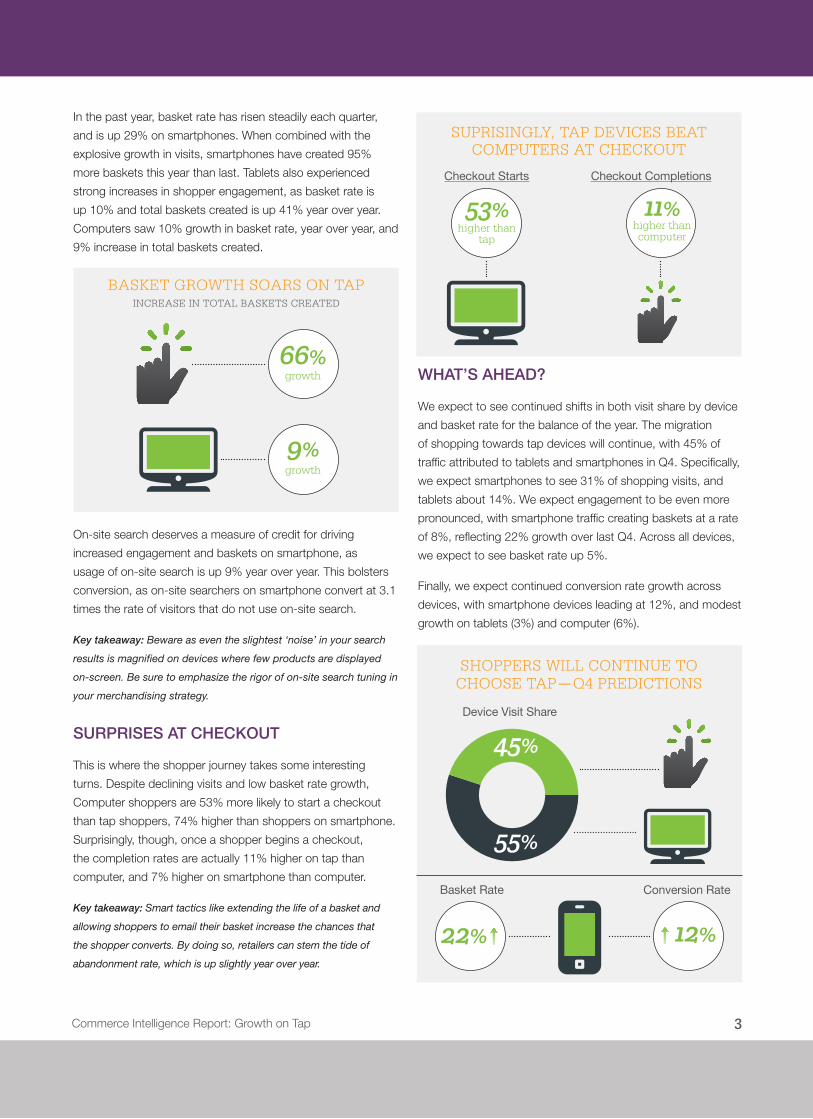
In the past year, basket rate has risen steadily each quarter,
and is up 29% on smartphones. When combined with the
explosive growth in visits, smartphones have created 95%
more baskets this year than last. Tablets also experienced
strong increases in shopper engagement, as basket rate is
up 10% and total baskets created is up 41% year over year.
Computers saw 10% growth in basket rate, year over year, and
9% increase in total baskets created.
On-site search deserves a measure of credit for driving
increased engagement and baskets on smartphone, as
usage of on-site search is up 9% year over year. This bolsters
conversion, as on-site searchers on smartphone convert at 3.1
times the rate of visitors that do not use on-site search.
Key takeaway: Beware as even the slightest ‘noise’ in your search
results is magnifi ed on devices where few products are displayed
on-screen. Be sure to emphasize the rigor of on-site search tuning in
your merchandising strategy.
SURPRISES AT CHECKOUT
This is where the shopper journey takes some interesting
turns. Despite declining visits and low basket rate growth,
Computer shoppers are 53% more likely to start a checkout
than tap shoppers, 74% higher than shoppers on smartphone.
Surprisingly, though, once a shopper begins a checkout,
the completion rates are actually 11% higher on tap than
computer, and 7% higher on smartphone than computer.
Key takeaway: Smart tactics like extending the life of a basket and
allowing shoppers to email their basket increase the chances that
the shopper converts. By doing so, retailers can stem the tide of
abandonment rate, which is up slightly year over year.
WHAT’S AHEAD?
We expect to see continued shifts in both visit share by device
and basket rate for the balance of the year. The migration
of shopping towards tap devices will continue, with 45% of
traffi c attributed to tablets and smartphones in Q4. Specifi cally,
we expect smartphones to see 31% of shopping visits, and
tablets about 14%. We expect engagement to be even more
pronounced, with smartphone traffi c creating baskets at a rate
of 8%, refl ecting 22% growth over last Q4. Across all devices,
we expect to see basket rate up 5%.
Finally, we expect continued conversion rate growth across
devices, with smartphone devices leading at 12%, and modest
growth on tablets (3%) and computer (6%).
Commerce Intelligence Report: Growth on Tap
SHOPPERS WILL CONTINUE TOCHOOSE TAP—Q4 PREDICTIONS
SUPRISINGLY, TAP DEVICES BEAT COMPUTERS AT CHECKOUT
Checkout Starts Checkout Completions
3

Demandware, Inc. 5 Wall Street Burlington, MA 01803 +1 (781) 425 1400 demandware.com [email protected]
© 2014 Demandware, Inc. This document contains archival information which should not be considered current and may no longer be accurate. Approved for unlimited distribution.
ABOUT THIS REPORT
This snapshot of today’s digital shopper provides insight into shopping behavior, specifically, how it varies by device. We provide these findings as directional guidance to understand today’s shopper journey, and to allow you, the retailer, to direct shopping experiences on your sites to meet the expectations of your shopper.
Demandware sourced data for this report from digital commerce sites transacting on the Demandware Commerce Cloud. The universe for this analysis is over 600 sites, which serve shoppers across the globe, and across different retail industry verticals. Sites included in the report were live as of Q2 2013 and remained live through Q3 2014. The comparisons noted in this report are Q3 2014 compared to Q3 2013, unless otherwise indicated.