Embed Size (px)
Citation preview

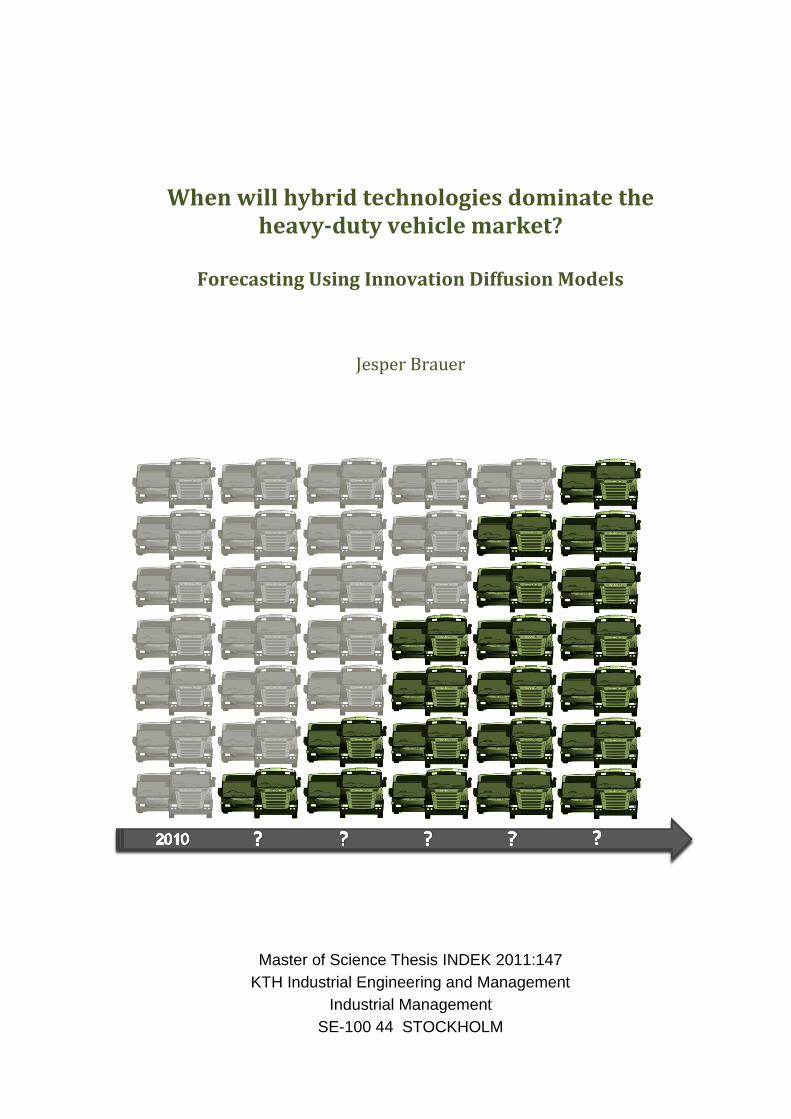
When will hybrid technologies dominate the heavy-duty vehicle market?
Forecasting Using Innovation Diffusion Models
JESPER BRAUER
Master of Science Thesis
Stockholm, Sweden 2011
When will hybrid technologies dominate the heavy-duty vehicle market?
Forecasting Using Innovation Diffusion Models
Jesper Brauer
Master of Science Thesis INDEK 2011:147
KTH Industrial Engineering and Management
Industrial Management
SE-100 44 STOCKHOLM
Master of Science Thesis INDEK 2011:147
When will hybrid technologies dominate the heavy-duty vehicle market?
Forecasting Using Innovation Diffusion Models
Jesper Brauer
Approved
2011-11-30
Examiner
Thomas Sandberg
Supervisor
Thomas Sandberg
Commissioner
Scania CV
Abstract
Hybrid-electric technologies have recently been introduced into the market for heavy-duty vehicles (HDVs). However, challenging an established technology with a new and untried technology is difficult, also under the best conditions. Forecasting is a vital tool in product portfolio management, since it provides guidance on how much resources a firm should allocate on new innovative projects and products and when and where to enter the market.
Therefore, this thesis forecasts the market penetration of hybrid HDVs in Europe by usage of innovation diffusion models – based on three different market scenarios assuming no, some and considerable incentives or legislative CO2 for HDVs. Hybrid-electric, hydraulic hybrid and flywheel hybrid vehicles are considered and an analogical approach is used based on sales data for radial tyres, disc brakes and anti-lock braking systems.
The result from a non-linear regression analysis indicated that innovation diffusion models of mixed influence are capable of predicting future market demand, not only of hybrid HDVs, but also of other HDVs with new innovative technologies or solutions. Therefore, it was suggested that innovation diffusion modeling should be a standard tool in the strategic planning of a HDV firm’s all new innovative products.
All market scenarios resulted in a rather low diffusion speed of hybrid HDVs during the first ten years, but the speed increased then rapidly during the next ten years such that 40-50 percent of the HDV market was penetrated in 2030. In the most hybrid-friendly scenario, the market was nearly fully penetrated after 50 years since the first introduction in 2010, while in the least hybrid-friendly scenario additional ten years was needed to fully penetrate the HDV market. The forecasts may be affected by possible pre-diffusion, the emergence of a dominant design or the diffusion acceleration effect.
One of the major challenges of using innovation diffusion models for sales forecasting of hybrid HDVs, was to find appropriate and sufficient analogous sales data. Therefore, Thomas (1985) analogous approach was further developed to be more focused on finding analogous sales data from internal, external or public sources. Key-words: Hybrid vehicle, Heavy-duty vehicle, Market penetration, Product portfolio management, Forecast, Innovation, Diffusion, Bass model, Analogous product

Acknowledgements
I would like to thank my supervisor, Professor Thomas Sandberg at Department of Industrial Economics and Management, who has supported me throughout my thesis work and contributed with important ideas and comments. I would also like to thank Dr. Nils-Gunnar Vågstedt, Head of Hybrid Systems Development at Scania CV, for valuable feedback and suggestions.
Table of Contents
1 Introduction .......................................................................................................................................... 1
2 HDV industry and market ..................................................................................................................... 3
2.1 Vehicle manufactures ................................................................................................................... 4
2.2 HDV market ................................................................................................................................... 5
2.3 Customers ..................................................................................................................................... 7
2.4 Emission regulations ..................................................................................................................... 9
3 Hybrid vehicles ................................................................................................................................... 12
3.1 Hybrid-electric vehicles ............................................................................................................... 12
3.1.1 Vehicle architecture ............................................................................................................. 14
3.1.2 Plug-in hybrids ..................................................................................................................... 16
3.1.3 Batteries ............................................................................................................................... 16
3.1.4 Power management ............................................................................................................ 16
3.2 Hydraulic hybrid vehicles ............................................................................................................ 16
3.3 Flywheel hybrid vehicles ............................................................................................................. 17
3.4 Hybrid technology payback period ............................................................................................. 18
4 Diffusion of innovations ..................................................................................................................... 19
4.1 Origins of research on diffusion .................................................................................................. 19
4.2 Factors influencing diffusion ....................................................................................................... 20
4.3 Types of innovation diffusion models ......................................................................................... 21
4.4 Aggregate diffusion models ........................................................................................................ 24
4.4.1 Segments ............................................................................................................................. 25
4.4.2 Diffusion models of external influence ................................................................................ 27
4.4.3 Diffusion models of internal influence ................................................................................ 28
4.4.4 Diffusion models of mixed influence ................................................................................... 30
4.4.5 Assumptions behind diffusion models of mixed influence ................................................. 31
4.4.6 Multiple adoptions .............................................................................................................. 31
5 Hybrid HDV market forecast .............................................................................................................. 33
5.1 Estimation of the market potential ............................................................................................. 33
5.2 Identification of similar products ................................................................................................ 35
5.3 Estimation of customer values .................................................................................................... 37
5.4 Estimation of diffusion parameters for similar products ............................................................ 37

5.5 Estimation of sales ...................................................................................................................... 40
5.6 Discussion .................................................................................................................................... 41
6 Conclusions ......................................................................................................................................... 42
References ............................................................................................................................................. 45
1
1 Introduction
Hybrid vehicle technologies offer significantly reduced fuel consumption and greenhouse-gas (GHG)
emissions, but are associated with increased vehicle complexity, weight and purchase cost (NAS,
2010). Hybrid-electric technologies have been available for cars for several years and recently these
technologies have been introduced into the market also for heavy-duty vehicles (HDVs) by market
entry of hybridized refuse collectors and city buses. However, challenging an established technology
with a new and untried technology is difficult, also under the best conditions (Weiss and Dale, 1998).
In addition, there are other competing technologies that also reduce fuel consumption and GHG
emissions, such as (pure) electric vehicle technologies, low rolling resistance tyres and lightweight
materials (AEA, 2011). Therefore, it can be unfavourable for a firm in the HDV industry to allocate too
much resources, too early, on hybrid projects and products. Especially, since late market entrants
might develop superior skills for the market being developed, at considerable expense, by the first-
movers (Tidd, 2010).
On the other hand, the consequences for entering the hybrid HDV market late can be significant,
since first-movers often outsell late-movers (Shankar et al., 1998). Advantages that might accrue
early entrants include the acquisition of market knowledge (which enables fine-tuning and second-
generation products to be introduced before competitors), the freedom to charge a premium until
competitive products are launched, the possibility to create greater barriers to entry for potential
competitive offerings and enhanced market image due to being the technological leader (Tidd, 2010).
It is obvious that there is an urgent need for guidance on how much resources a firm in the HDV
industry should allocate on hybrid projects and products and when it might be as most advantageous
to launch hybrid HDVs. Market forecasts provide such guidance, but forecasting demand for new
technologies is difficult (Mohr et al., 2010). Therefore, it is not surprising that the forecasted market
penetrations of hybrid HDVs in AEA (2011) and Murphy (2011) differ considerably. Both these
forecasts seem to be based on a combination of judgmental techniques and simple time series
analyses, such as trend line analysis.
Generally, there are five categories of new product forecasting techniques (Kahn, 2006): i)
judgmental techniques; ii) customer/market research techniques; iii) time series analyses; iv)
regression analyses; v) other quantitative techniques. Innovation diffusion models, such as the Bass
(1969) model, belong to the third category and are particularly well suited to forecast the long-term
sales patterns of new technologies and products (Lilien and Rangaswamy, 2003). Some of the largest
U.S. corporations have used the Bass model, including IBM, Sears and AT&T (Rogers, 2003). Several
authors have used diffusion models for forecasting the sales of alternative powertrain technologies
in the automobile market, e.g. McManus and Senter (2009; plug-in hybrid-electric vehicles),
Muraleedharakurup et al. (2010; hybrid-electric vehicles) and Park et al. (2011; hydrogen fuel cell
vehicles).
The purpose of this thesis is to forecast the market penetration of hybrid HDVs by usage of
innovation diffusion models. Two main research questions are addressed:

2
1. How capable are innovation diffusion models of representing the diffusion of new innovative
products in the HDV market?
2. When will hybrid technologies dominate the heavy-duty vehicle market in Europe?
Hybrid-electric, hydraulic hybrid and flywheel hybrid vehicles will be considered and Thomas (1985)
analogical approach will be used, since basically no sales data are available yet.
The thesis is structured as follows. First, characteristics of the HDV industry and market are
presented and thereafter different hybrid technologies are described. Then, the theoretic framework
used by the author is explained and the essential mathematical diffusion models are derived. This is
followed by an estimation of the market potentials for hybrid HDVs for three different market
scenarios and identification of analogous products. Then, customer values and diffusion parameters
are estimated and three different market penetrations (one for each market scenario) of hybrid
HDVs are calculated. These results are then analyzed and discussed. Finally, an extended method for
estimating market growth for new products is presented followed by a discussion of opportunities
for future research.
3
2 HDV industry and market
The European Automobile Manufacturers Association (ACEA), represents the interests of the sixteen
European car, truck and bus manufacturers at EU level. ACEA uses the following weight categories for
heavy-duty vehicles (AEA, 2011):
1. Commercial vehicles: 3.5 ton – 16 ton Gross Vehicle Weight (GVW, the actual weight of the
fully loaded vehicle or trailer, including all cargo, passengers and optional equipment).
2. Commercial vehicles: Buses and coaches 3.5 ton – 16 ton GVW.
3. Heavy commercial vehicles: Heavy vehicles >16 ton GVW.
4. Heavy buses and coaches: Buses and coaches >16 ton GVW.
This thesis will focus on heavy-duty vehicles over 16 ton GVW, i.e. vehicles in the categories 3 and 4.
Furthermore, AEA (2011) divides HDVs into eight different mission categories (or segments):
1. Service/Delivery (3.5 ton – 7.5 ton). Urban operation including frequent stop start.
2. Urban delivery/Collection. Distribution in cities or suburban areas including frequent stop
start driving.
3. Municipal utility. Typical duty cycle is low speed urban operation with frequent stop starts.
Typical vehicle is a refuse truck.
4. Regional delivery/Collection. Regional delivery of consumer goods from a central
warehouse. Includes periods of constant high speed and urban operation (also mountain
road goods collection, etc).
5. Long haulage. Long periods of constant high speed travel with very few periods of urban
operation (e.g. delivery to international sites, more than one day trip).
6. Construction. Vehicles operating on and off-site (e.g. concrete mixers and tipper trucks).
7. Bus. Low speed travel with frequent stop starts in cities or suburban areas. Also interurban
travel.
8. Coach. Long periods of constant high speed travel with periods of urban operation.
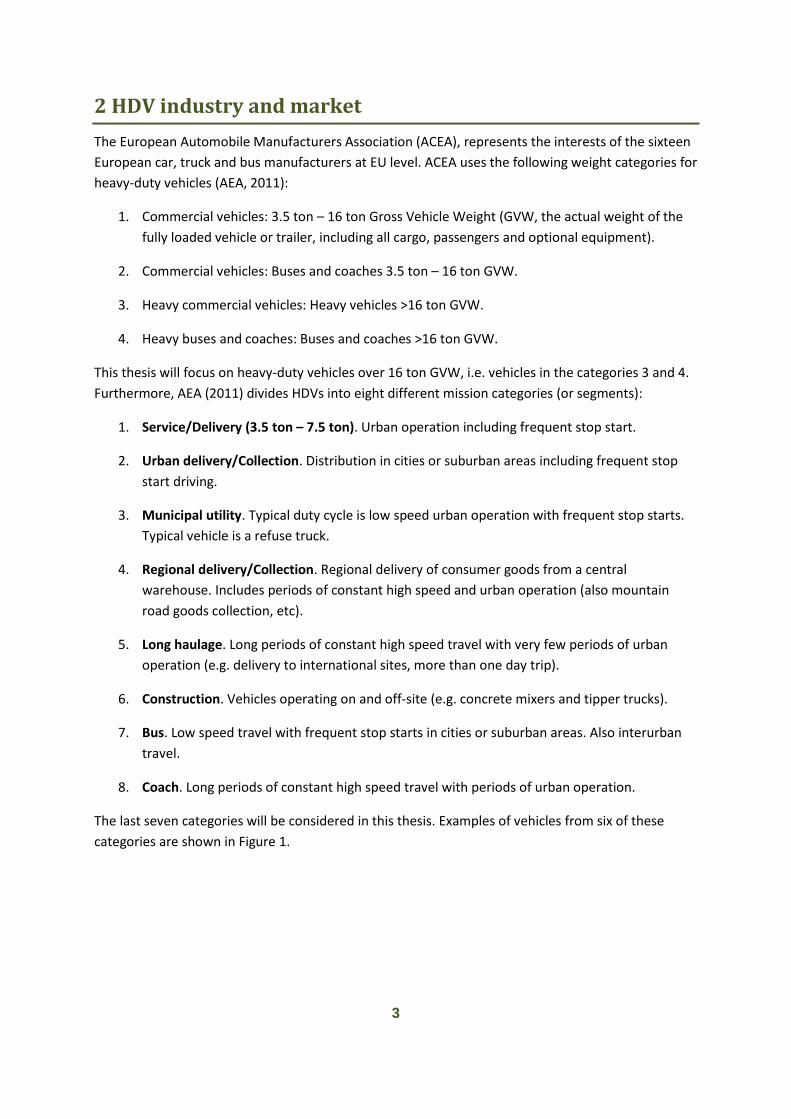
The last seven categories will be considered in this thesis. Examples of vehicles from six of these
categories are shown in Figure 1.
4
Figure 1. Examples of vehicles from the vehicle categories (from www.scania.com).
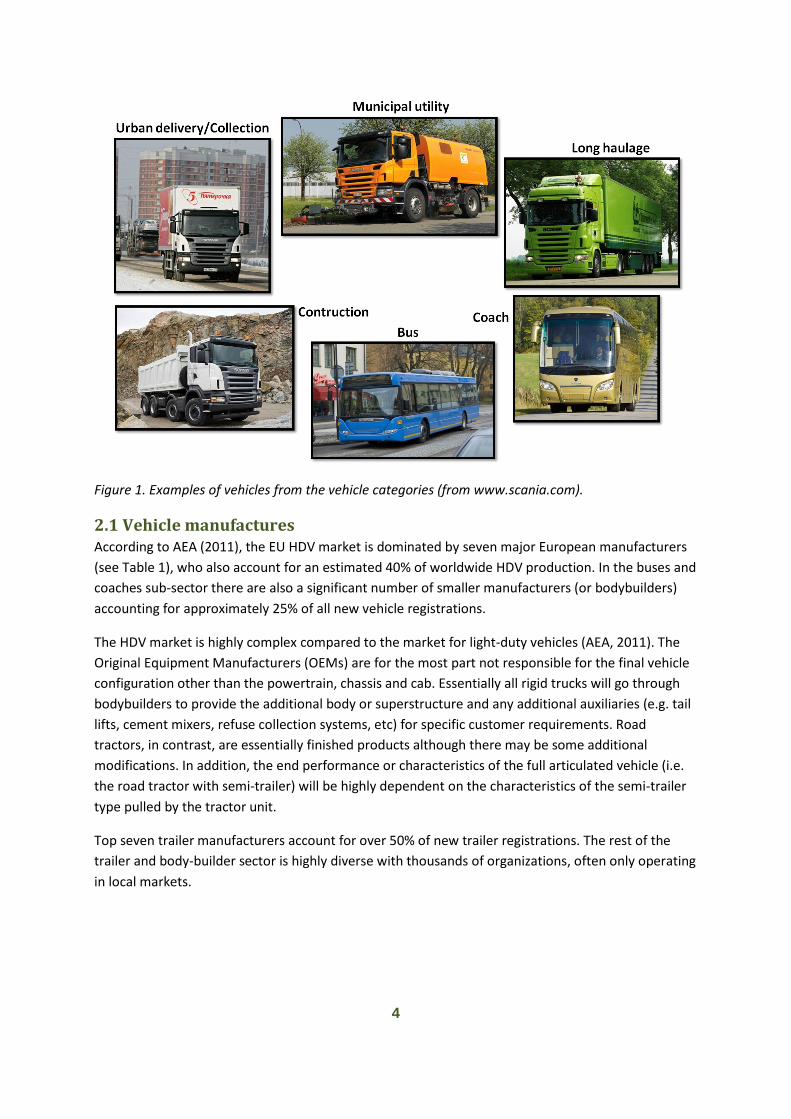
2.1 Vehicle manufactures According to AEA (2011), the EU HDV market is dominated by seven major European manufacturers
(see Table 1), who also account for an estimated 40% of worldwide HDV production. In the buses and
coaches sub-sector there are also a significant number of smaller manufacturers (or bodybuilders)
accounting for approximately 25% of all new vehicle registrations.
The HDV market is highly complex compared to the market for light-duty vehicles (AEA, 2011). The
Original Equipment Manufacturers (OEMs) are for the most part not responsible for the final vehicle
configuration other than the powertrain, chassis and cab. Essentially all rigid trucks will go through
bodybuilders to provide the additional body or superstructure and any additional auxiliaries (e.g. tail
lifts, cement mixers, refuse collection systems, etc) for specific customer requirements. Road
tractors, in contrast, are essentially finished products although there may be some additional
modifications. In addition, the end performance or characteristics of the full articulated vehicle (i.e.
the road tractor with semi-trailer) will be highly dependent on the characteristics of the semi-trailer
type pulled by the tractor unit.
Top seven trailer manufacturers account for over 50% of new trailer registrations. The rest of the
trailer and body-builder sector is highly diverse with thousands of organizations, often only operating
in local markets.
5
Table 1. Summary of the major European heavy-duty vehicle manufacturers and bus builders. Major
manufacturer groups accounting for over 93% EU HDV registrations highlighted in bold. The major
manufacturers also supply engines and chassis to the vehicle builders like VDL. From AEA (2011).
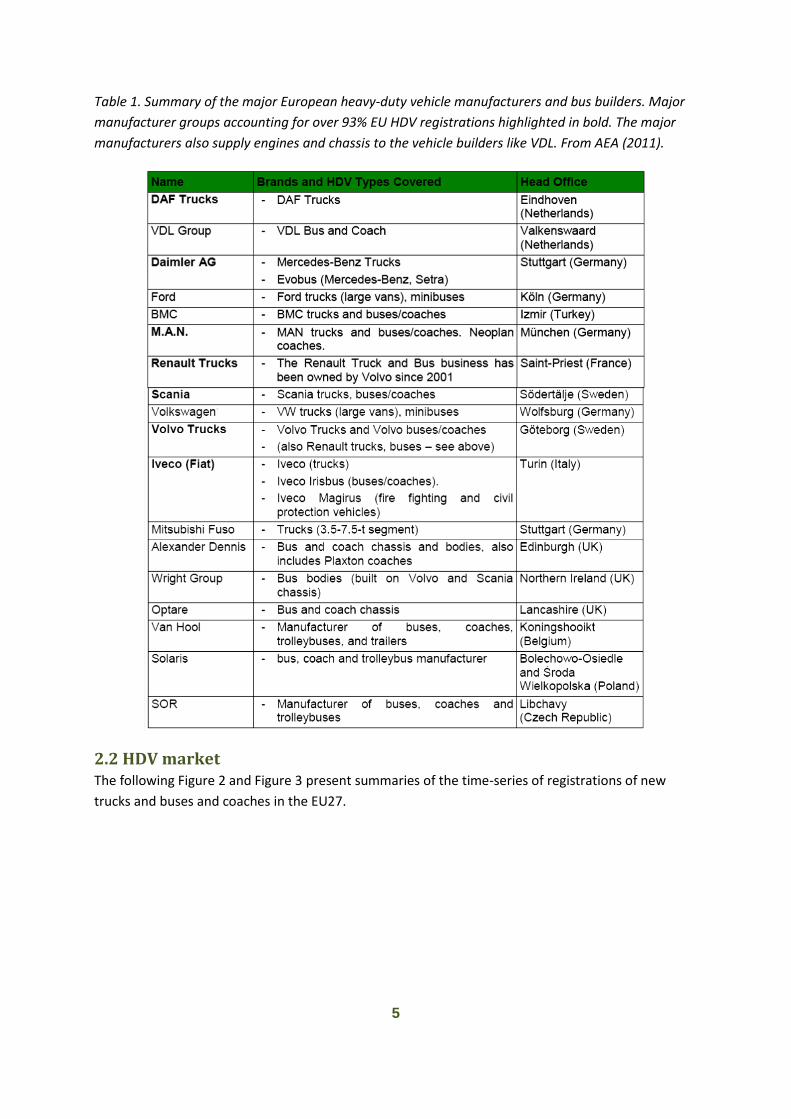
2.2 HDV market The following Figure 2 and Figure 3 present summaries of the time-series of registrations of new
trucks and buses and coaches in the EU27.
6
Figure 2. EU27 New registrations of rigid trucks and road tractors (an articulated vehicle consists of a
road tractor coupled to a semi-trailer). From AEA (2011).
Figure 3. EU27 New registrations of buses and coaches. From AEA (2011).
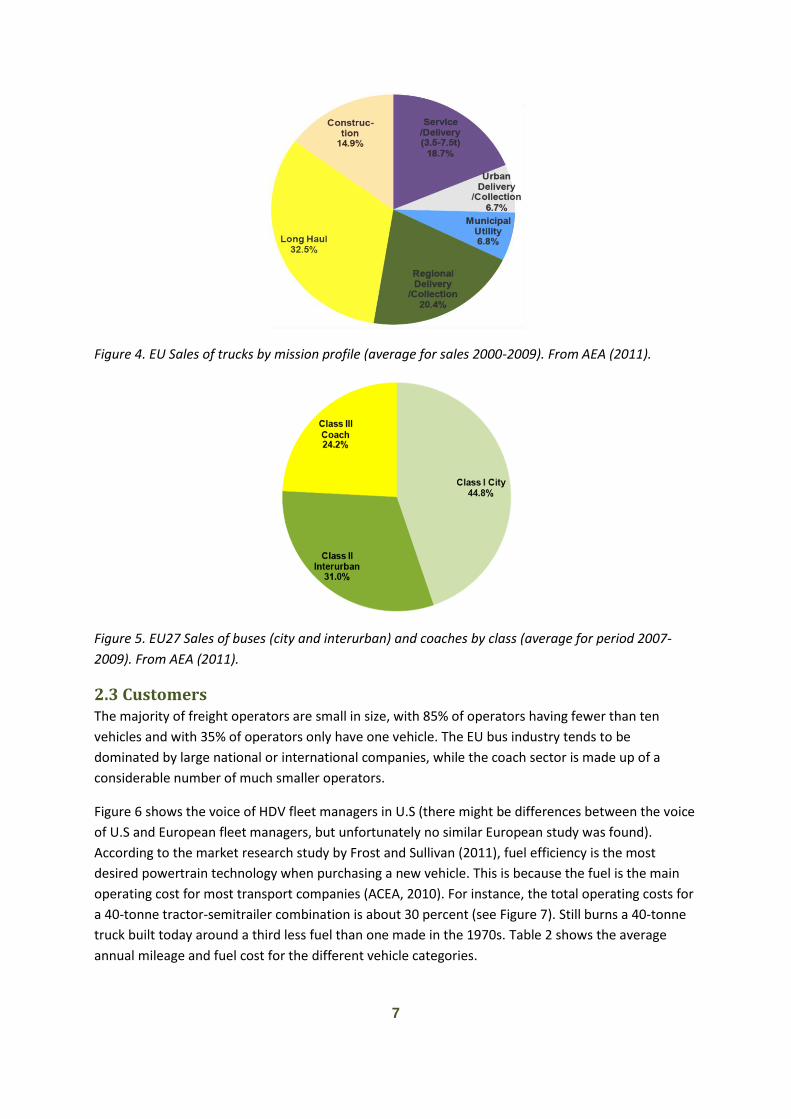
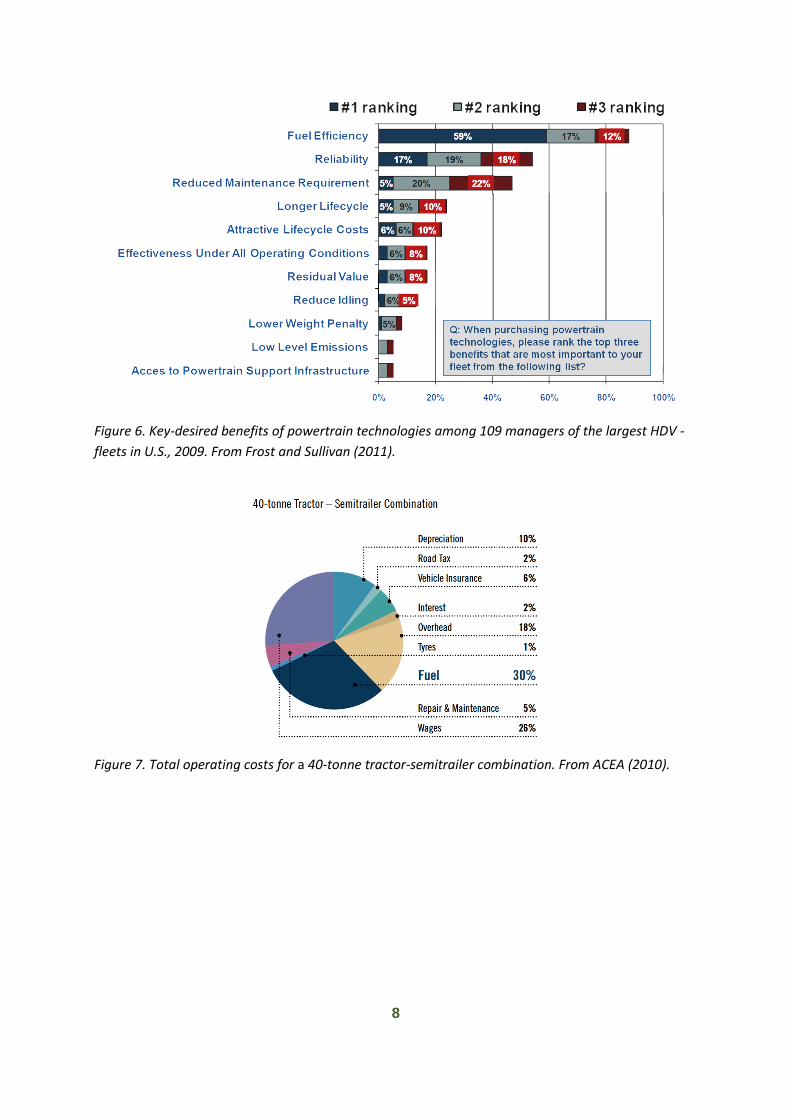
In Figure 4 and Figure 5, sales have been allocated to the vehicle categories that were presented in
the beginning of section 4.
7
Figure 4. EU Sales of trucks by mission profile (average for sales 2000-2009). From AEA (2011).
Figure 5. EU27 Sales of buses (city and interurban) and coaches by class (average for period 2007-
2009). From AEA (2011).
2.3 Customers The majority of freight operators are small in size, with 85% of operators having fewer than ten
vehicles and with 35% of operators only have one vehicle. The EU bus industry tends to be
dominated by large national or international companies, while the coach sector is made up of a
considerable number of much smaller operators.
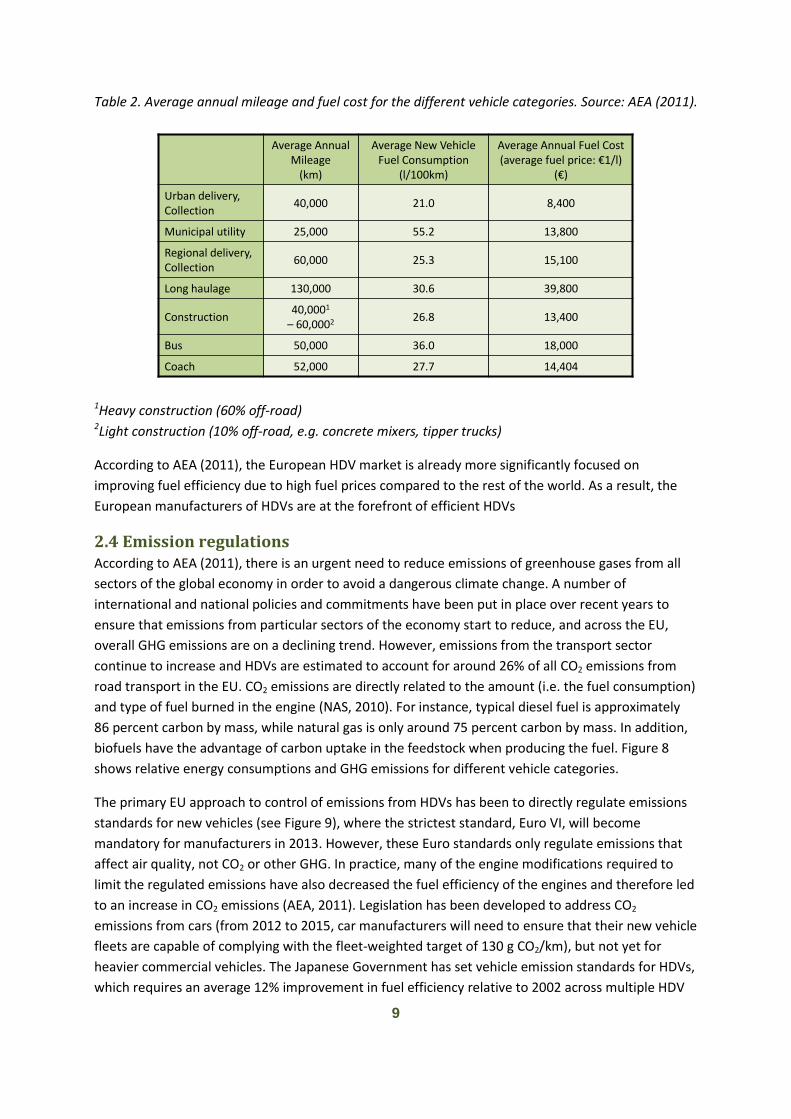
Figure 6 shows the voice of HDV fleet managers in U.S (there might be differences between the voice
of U.S and European fleet managers, but unfortunately no similar European study was found).
According to the market research study by Frost and Sullivan (2011), fuel efficiency is the most
desired powertrain technology when purchasing a new vehicle. This is because the fuel is the main
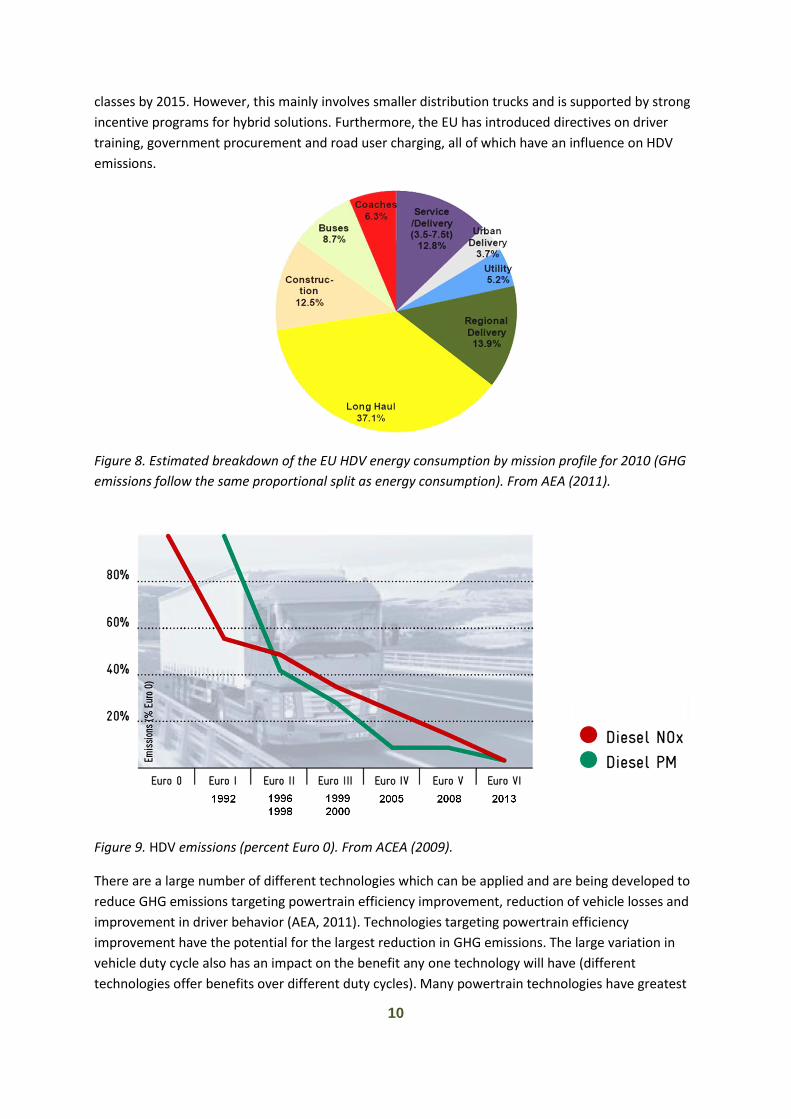
operating cost for most transport companies (ACEA, 2010). For instance, the total operating costs for
a 40-tonne tractor-semitrailer combination is about 30 percent (see Figure 7). Still burns a 40-tonne
truck built today around a third less fuel than one made in the 1970s. Table 2 shows the average
annual mileage and fuel cost for the different vehicle categories.
8
Figure 6. Key-desired benefits of powertrain technologies among 109 managers of the largest HDV -
fleets in U.S., 2009. From Frost and Sullivan (2011).
Figure 7. Total operating costs for a 40-tonne tractor-semitrailer combination. From ACEA (2010).
9
Table 2. Average annual mileage and fuel cost for the different vehicle categories. Source: AEA (2011).
1Heavy construction (60% off-road) 2Light construction (10% off-road, e.g. concrete mixers, tipper trucks)
According to AEA (2011), the European HDV market is already more significantly focused on
improving fuel efficiency due to high fuel prices compared to the rest of the world. As a result, the
European manufacturers of HDVs are at the forefront of efficient HDVs
2.4 Emission regulations According to AEA (2011), there is an urgent need to reduce emissions of greenhouse gases from all
sectors of the global economy in order to avoid a dangerous climate change. A number of
international and national policies and commitments have been put in place over recent years to
ensure that emissions from particular sectors of the economy start to reduce, and across the EU,
overall GHG emissions are on a declining trend. However, emissions from the transport sector
continue to increase and HDVs are estimated to account for around 26% of all CO2 emissions from
road transport in the EU. CO2 emissions are directly related to the amount (i.e. the fuel consumption)
and type of fuel burned in the engine (NAS, 2010). For instance, typical diesel fuel is approximately
86 percent carbon by mass, while natural gas is only around 75 percent carbon by mass. In addition,
biofuels have the advantage of carbon uptake in the feedstock when producing the fuel. Figure 8
shows relative energy consumptions and GHG emissions for different vehicle categories.
The primary EU approach to control of emissions from HDVs has been to directly regulate emissions
standards for new vehicles (see Figure 9), where the strictest standard, Euro VI, will become
mandatory for manufacturers in 2013. However, these Euro standards only regulate emissions that
affect air quality, not CO2 or other GHG. In practice, many of the engine modifications required to
limit the regulated emissions have also decreased the fuel efficiency of the engines and therefore led
to an increase in CO2 emissions (AEA, 2011). Legislation has been developed to address CO2
emissions from cars (from 2012 to 2015, car manufacturers will need to ensure that their new vehicle
fleets are capable of complying with the fleet-weighted target of 130 g CO2/km), but not yet for
heavier commercial vehicles. The Japanese Government has set vehicle emission standards for HDVs,
which requires an average 12% improvement in fuel efficiency relative to 2002 across multiple HDV
Average AnnualMileage
(km)
Average New Vehicle Fuel Consumption
(l/100km)
Average Annual Fuel Cost (average fuel price: €1/l)
(€)
Urban delivery, Collection
40,000 21.0 8,400
Municipal utility 25,000 55.2 13,800
Regional delivery, Collection
60,000 25.3 15,100
Long haulage 130,000 30.6 39,800
Construction40,0001
– 60,0002 26.8 13,400
Bus 50,000 36.0 18,000
Coach 52,000 27.7 14,404
10
classes by 2015. However, this mainly involves smaller distribution trucks and is supported by strong
incentive programs for hybrid solutions. Furthermore, the EU has introduced directives on driver
training, government procurement and road user charging, all of which have an influence on HDV
emissions.
Figure 8. Estimated breakdown of the EU HDV energy consumption by mission profile for 2010 (GHG
emissions follow the same proportional split as energy consumption). From AEA (2011).
Figure 9. HDV emissions (percent Euro 0). From ACEA (2009).
There are a large number of different technologies which can be applied and are being developed to
reduce GHG emissions targeting powertrain efficiency improvement, reduction of vehicle losses and
improvement in driver behavior (AEA, 2011). Technologies targeting powertrain efficiency
improvement have the potential for the largest reduction in GHG emissions. The large variation in
vehicle duty cycle also has an impact on the benefit any one technology will have (different
technologies offer benefits over different duty cycles). Many powertrain technologies have greatest

11
benefit over urban cycles with a high degree of stop start operation. Technologies aimed at reducing
vehicle drag losses, on the other side, give greatest benefit to those operating over long distances at
constant high speeds.
Alternative fuel powertrains are not significantly used in heavy trucks, except in a few countries (AEA,
2011). However, there is more widespread use of alternatively powered buses across a number of
countries. According to Murphy (2011), hybrid-electric buses and light-duty trucks have been
available for some years and are now gathering market momentum, but remain a long way short of
the market penetration seen by hybrid cars, which was estimated at around 0.7% of the global new
light vehicle market in 2010. The consulting company Frost and Sullivan (2011) estimated that the
global hybrid commercial (medium and heavy commercial vehicles) production was 6,300 units in
2009. Furthermore, electric trucks and buses are entering the market, as are hybrid-hydraulic trucks
(Murphy, 2011).
12
3 Hybrid vehicles
According to a report by NAS in 2010, a hybrid vehicle can be defined as a vehicle that combines at
least two power sources, such as internal combustion engines (ICEs), electric drives, and hydraulic
drives. The ultimate goal of the hybrid vehicle is to provide the equivalent power, range, and safety
as a conventional vehicle while reducing fuel consumption and harmful emissions. This thesis will
consider three types of hybrids: hybrid-electric vehicles , hydraulic hybrid vehicles and flywheel
hybrid vehicles.
3.1 Hybrid-electric vehicles A hybrid-electric vehicle (HEV) combines electric and mechanical power devices (see Figure 10). The
main components of an HEV that differentiate it from a standard ICE vehicle are the electric machine
(motor and generator), energy storage (e.g., battery or supercapacitors), and power electronics (NAS,
2010). The electric machine absorbs braking energy, stores it in the energy storage system, and uses
it to meet acceleration and peak power demands.
Figure 10. A series hybrid-electric bus (from www.scania.com).
HEVs have the potential to realize several advantages, including the following (NAS, 2010):
Regenerative braking (see Figure 11). A regenerative brake is a system that reduces vehicle
speed by converting some of its kinetic energy into a storable form for future use instead of
dissipating it as heat as with a conventional brake. Approximately 60 percent of the total
energy spent in the U.S. Federal Urban Driving Schedule is used to overcome the effect of
inertia and that, theoretically, up to 50 percent of this energy could be recovered. In
13
addition, regenerative braking can reduce brake wear and the resulting fine particulate dust.
Figure 11. The main functions of a parallel hybrid-electric system (from www.volvo.com).
Higher electric machine efficiency (for instance, the moving parts of an electrical machine
consist primarily of the armature or rotor and bearings).
Reduced emissions through smoothening of transients and idle elimination (operate at best
efficiency).
Engine shutoff is possible and thereby, fuel consumption, emissions and noise vibration and
harshness can be reduced. In the case of utility vehicles, the power take-off can be
electrified.
Accessory electrification allows parasitic loads to run on an as-needed basis. In addition,
electrified accessories are often more efficient than belt-driven ones.
Better drivability, since an electric machine reacts faster to a throttle input than an ICE.
Furthermore, torque from the ICE and the electric drive train can be combined whenever
needed in certain configurations.
HEV disadvantages include the following (NAS, 2010):
14
Increased power train and electronic complexity and thereby overall system reliability can be
lower.
Increased vehicle mass due to addition of components.
Increased cost due to additional components and complexity of the power management.
If not optimized for the appropriate drive cycle, benefits may not be fully realized (or fuel
consumption may even increase).
3.1.1 Vehicle architecture
A number of different system architectures are being considered to meet different applications. They
are broadly classified as series, parallel, and power split. The selection of system architecture
depends mainly on the application.
Series hybrid-electric architecture
In a series HEV, as illustrated in Figure 12, an electric generator, coupled to an ICE, supplies electricity
to the electric machine to propel the truck and to the energy storage system when it needs to be
recharged.
Figure 12. A series hybrid-electric architecture (the grey square represents a differential gear).
The series hybrid-electric architecture is characterized by (NAS, 2010):
An engine that can run at its optimum performance (and thereby greatly reducing fuel
consumption), since the ICE and vehicle speeds are decoupled and only the electric machine
is connected to the wheels.
Large energy storage system pack, electric machine and engine (and thereby added weight),
since the electric machine is the only one connected to the wheels.
Flexible vehicle layout due to the elimination of the mechanical driveshaft. For instance, the
elimination of the mechanical driveshaft makes it possible to lower the bus floor for
improved wheelchair access in city buses.
Parallel hybrid-electric architecture
Parallel hybrids have mechanical connections to the wheels from both the electric machine and the
engine, as illustrated in Figure 13. The electric machine can be located anywhere between the output
15
engine shaft and the wheels. These vehicles do not need a dedicated generator, since the electric
machine can be used as a generator to recharge the batteries.
Figure 13. A parallel hybrid-electric architecture (grey squares – mechanical transmissions).
The parallel hybrid-electric architecture is characterized by (NAS, 2010):
The possibility of downsizing both the engine and the electric machine compared to series
hybrids, since the electric machine and the engine are both coupled directly to the wheels
and as a result, they can share the power during acceleration. In addition, it is possible to
increase the hybridization degree by downsizing the engine and upsizing the electric machine
(in applications that require extended high-power operation, such as long haulage trucks,
this possibility is limited).
Different types of configurations: In a starter-alternator type, the electric machine is
connected to the engine crankshaft directly on the shaft or coupled through a belt. In a pre-
transmission type, the electric machine is located in between the clutch and the transmission
and finally in post-transmission type, the electric machine is located after the transmission
and has not the benefit of gear ratio changes.
Power split hybrid-electric architecture
Power split hybrids try to combine the best aspects of both series and parallel hybrids. As shown in
Figure 14, this system divides the engine power along two paths: one goes to the generator to
produce electricity, and one goes through a mechanical gear system to drive the wheels. In addition,
a regenerative system uses the kinetic energy of deceleration and braking to produce electricity,
which is stored in the energy storage system.
Figure 14. A power split hybrid-electric architecture (grey squares – mechanical transmissions).
16
3.1.2 Plug-in hybrids
Plug-in hybrids differ from HEVs by their ability to recharge the energy storage system through the
electric grid. All the HEV configurations described in section 3.1.1 can be used for plug-in hybrids
(NAS, 2010). The vehicles offer the possibility to be recharged, for instance at bus stops or during
loading/unloading.
3.1.3 Batteries
The battery’s contribution to the vehicle’s overall power is growing rapidly. In addition, the choice of
battery affects not only the cost, reliability, service life, packaging space and weight, but also “green”
issues of the vehicle itself. The battery system represents approximately one-third of the overall
increase in the cost of hybridization (NAS, 2010).
3.1.4 Power management
Fuel consumption reductions can be realized only after optimization of power management based on
an appropriate driving cycle. The main objective of a power management control algorithm in a
hybrid vehicle is to calculate the optimum operating point of the overall system for any amount of
power demanded from the driver. The cost criteria are often fuel economy and emissions (NAS,
2010).
3.2 Hydraulic hybrid vehicles A hydraulic hybrid vehicle combines hydraulic and mechanical components (see figure 15). The four
main components of a hydraulic hybrid power train are the working fluid, fluid reservoir, hydraulic
pump/motor (in a parallel hybrid system) or in-wheel motors and pumps (in a series hybrid system),
and an accumulator (NAS, 2010). The hydraulic accumulator stores the energy (as highly compressed
nitrogen gas) and a variable displacement pump acts as a motor while driving the wheels and as a
generator while absorbing regenerative braking energy. Such a system suits heavy-duty vehicles that
are operating with high-power and low-energy requirements, including stop-and-go driving profiles
(e.g., refuse trucks and city buses). Hydraulic hybrids have during tests demonstrated considerable
fuel savings for heavy-duty applications, where hundreds of launch/stop cycles characterize the
longest portion of the operation day (NAS, 2010).
17
Figure 15. A parallel hydraulic hybrid (from ww.boschrexroth.com).
3.3 Flywheel hybrid vehicles A flywheel hybrid has a potential of considerable fuel savings. An additional flywheel (see Figure 16)
stores and releases energy from and to the vehicle driveline. The flywheel stores energy during
braking, then releasing it to supplement or the flywheel temporarily replace the engine output. The
technology is more effective for vehicles with an urban duty cycle (AEA, 2011).
Figure 16. A flywheel hybrid (from www.optare.com).
18
3.4 Hybrid technology payback period Table 3 shows estimated energy benefit compared to a conventional diesel vehicle and the estimated
payback period for the different hybrid technologies and electric vehicles (AEA, 2011). The fuel cost
in Table 2 has been used to calculate the payback period for the different vehicle categories. Large
fleet operators usually want a two to three years payback period. Hybrid technologies falling outside
the desired payback period can have other benefits which make them attractive to operators and
therefore justifiable. In addition, the adoption of low carbon technologies may also be driven from a
business strategy rather than purely commercial aspect, since some companies may promote low
carbon technology as part of their corporate social responsibility targets.
Table 3. Estimated energy benefit and payback period.
1Was not presented in AEA (2011), therefore estimated here. 2Electricity cost related to fuel cost.
Hybrid-electricvehicles
Hydraulic hybrid vehicles
Flywheel hybrid vehicles
Electric vehicles
EB(%)
TC(€k)
PP(y)
EB(%)
TC(€k)
PP(y)
EB(%)
TC(€k)
PP(y)
EB(%)
TC(€k)
PP(y)
Urban delivery, Collection
20 24 14.3 10 13.2 15.7 15 3.5 2.8 702 108 18.4
Municipal utility
20 24 8.7 15 13.2 6.4 15 3.5 1.7 702 108 11.2
Regional delivery, Collection
10 24 15.8 N/A N/A N/A 7.5 3.5 3.1 N/A N/A N/A
Long haulage 7 24 5.6 N/A N/A N/A 5 3.5 3 N/A N/A N/A
Construction1 10 24 17.9 N/A N/A N/A 7.5 3.5 3.5 N/A N/A N/A
Bus 30 24 4.4 15 13.2 4.9 20 3.5 1 702 108 8.6
Coach 10 24 16.7 N/A N/A N/A 7.5 3.5 3.2 N/A N/A N/A
EB – Energy Benefit ( % improvement versus conventional diesel)
TC – Technology Cost, PP – Payback Period
19
4 Diffusion of innovations
According to Rogers (2005), diffusion of innovations is concerned with how innovations, defined as
ideas or practices that are perceived as new, are spread. He stated that “Diffusion is the process
through which an innovation spreads via communication channels over time among the members of
a social system. This is a social sciences definition of diffusion, one that is not to be confused with the
thermodynamic definition of diffusion. Diffusion occurs in complex systems where networks
connecting system members are overlapping, multiple and complex”.
4.1 Origins of research on diffusion Social and technological change as a field of research has its origin in the nineteenth century and one
of the pioneers, the French sociologist Tarde (1903), emphasized the important role of opinion
leaders in the “imitation” process and suggested an S-shaped diffusion curve. The early research was
to a great extent theoretical, but became more empirical after Ryan and Gross’ well known study on
the spread of hybrid corn among Iowa farmers (1943). The interest for diffusion increased, and the
total number of diffusion studies rose from 27 in 1941 to 423 in 1959 (Katz et al., 1963).The research
on diffusion has its theoretical and empirical roots in a great number of disciplines such as
anthropology, sociology, medical sociology, education, geography, politics, industrial economy,
communication and marketing (Ruiz-Conde, 2004), but around 1960 the field was divided into two
independent traditions, one sociological and one economic (Roback, 2006). The economic tradition
has primarily seen diffusion as the spread of a new product among potential buyers, while the
sociological tradition has a wider view and the objects of innovation are not always physical in
character, but could also be an idea, a procedure or a piece of news. The diffusion concept received
special attention in marketing, since firms competing in the marketplace wanted a tool to help them
face one of the most risky decisions; that of developing and introducing new products into the
marketplace (Ruiz-Conde, 2004).
The interest in innovation and diffusion as an academic field of research has exploded since Rogers in
1962 presented his work “Diffusion of Innovations”, which is the most cited work in diffusion
research (Roback, 2006). According to Rogers (2003), diffusion is a social process in which actors
create and share information through communication. Opinion leaders and change agents working
within social structures and systems have critical roles and therefore, a focus on the relative
advantage of an innovation is insufficient, since different social systems will have different values and
beliefs, which will influence the costs, benefits and compatibility of an innovation. In addition,
different social structures will determine the most appropriate channels of communication as well as
the type and influence of opinion leaders and change agents (Tidd, 2010). Rogers model of diffusion
is as a process which an innovation is communicated through certain channels over time among the
members of a social system (members of a social system may be individuals, informal groups,
organizations, and/or subsystems). Rogers defines the innovation is an idea, practice, or object
perceived as new by an individual or other unit of adoption.
20
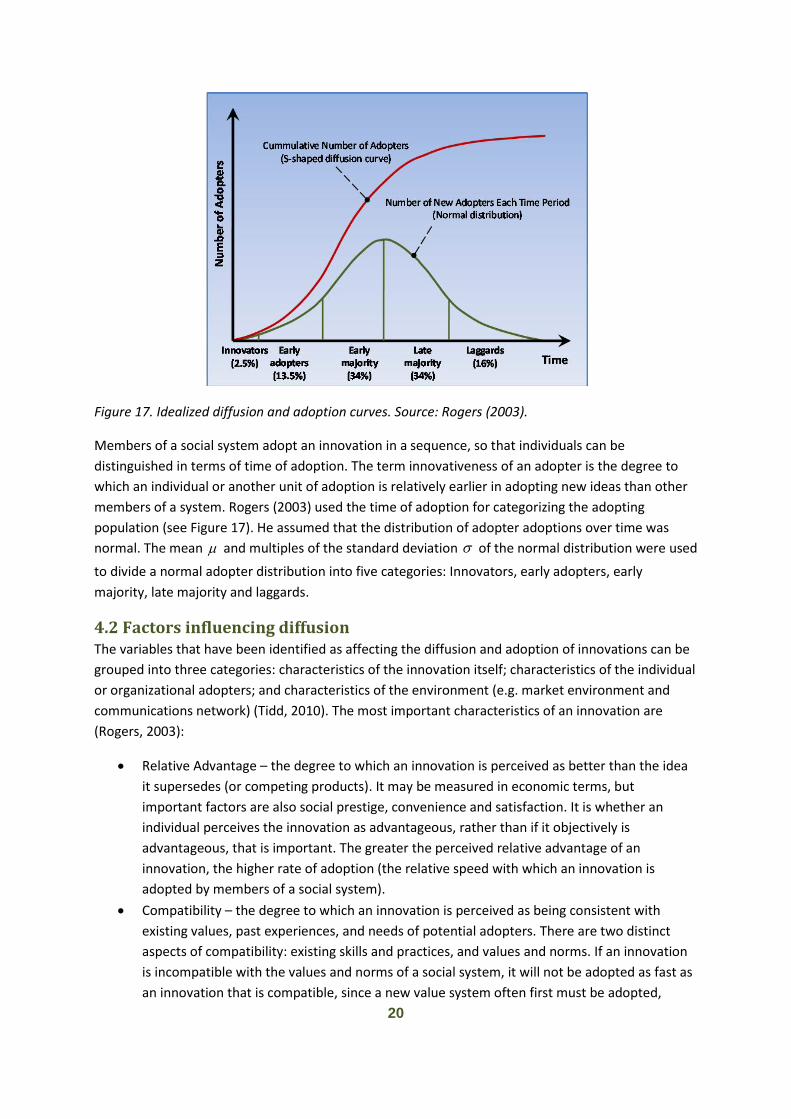
Figure 17. Idealized diffusion and adoption curves. Source: Rogers (2003).
Members of a social system adopt an innovation in a sequence, so that individuals can be
distinguished in terms of time of adoption. The term innovativeness of an adopter is the degree to
which an individual or another unit of adoption is relatively earlier in adopting new ideas than other
members of a system. Rogers (2003) used the time of adoption for categorizing the adopting
population (see Figure 17). He assumed that the distribution of adopter adoptions over time was
normal. The mean and multiples of the standard deviation of the normal distribution were used
to divide a normal adopter distribution into five categories: Innovators, early adopters, early
majority, late majority and laggards.
4.2 Factors influencing diffusion The variables that have been identified as affecting the diffusion and adoption of innovations can be
grouped into three categories: characteristics of the innovation itself; characteristics of the individual
or organizational adopters; and characteristics of the environment (e.g. market environment and
communications network) (Tidd, 2010). The most important characteristics of an innovation are
(Rogers, 2003):
Relative Advantage – the degree to which an innovation is perceived as better than the idea
it supersedes (or competing products). It may be measured in economic terms, but
important factors are also social prestige, convenience and satisfaction. It is whether an
individual perceives the innovation as advantageous, rather than if it objectively is
advantageous, that is important. The greater the perceived relative advantage of an
innovation, the higher rate of adoption (the relative speed with which an innovation is
adopted by members of a social system).
Compatibility – the degree to which an innovation is perceived as being consistent with
existing values, past experiences, and needs of potential adopters. There are two distinct
aspects of compatibility: existing skills and practices, and values and norms. If an innovation
is incompatible with the values and norms of a social system, it will not be adopted as fast as
an innovation that is compatible, since a new value system often first must be adopted,
21
which is a relatively slow process. Furthermore, network externalities can affect the adoption
process, since the cost of adoption and use (as distinct from form the cost of purchase) may
be influenced by the availability of information about the technology from other users, the
availability of trained skilled users, technical assistance and maintenance, and the availability
of complementary innovations (Tidd, 2010).
Complexity – the degree to which an innovation is perceived as difficult to understand and
use. Innovations that are simpler to understand by the members of a social system are
adopted more rapidly than complicated innovations that require the adopters to develop
new skills and understandings.
Trialability – the degree to which an innovation may be experimented with on a limited basis.
A trial allows a member of a social system to assess the innovation’s advantages and
potential risks and thereby reducing some of the uncertainty associated with the innovation.
As a result, an innovation with a high degree of trialability will generally be adopted more
quickly than an innovation with a low degree of trialability.
Observability – the degree to which the results of an innovation are visible to others. The
easier it is for the members of a social system to see the results of an innovation, the more
likely they are to adopt it.
In predicting the rate of adoption of an innovation, these five factors explain 49-87% of the variance
(Tidd, 2010).
4.3 Types of innovation diffusion models Innovation diffusion models have traditionally been used for predictive purposes, but may also be
used in the context of descriptive and normative purposes. Mahajan et al. (1990, 1993) identified
three different types of applications for diffusion models:
1. Sales forecasting (e.g. prediction of the demand of a certain innovation in the market and
hence to gaining insights into its future success or failure).
2. Hypothesis testing (e.g. testing of hypotheses about differences in the diffusion process of an
innovation in different countries).
3. Normative guidelines (e.g. development of optimal strategies for marketing variables such as
price, advertising or for the timing of product introductions).
Dosi (1991) suggested that innovation diffusion models can be categorized according to the following
characteristics:
1. Heterogeneity versus uniformity of potential adopters of innovations: Are all agents the
same and do they have similar incentives to adopt an innovation? Or, do they differ in some
structural characteristics, or in their capabilities of efficiently acquiring new products and
processes of production. Entirely homogeneous adopters correspond to an aggregate-level
diffusion model where the market-level behavior is described without any direct
microeconomic effects caused by individual adopters’ decisions (Roberts and Lattin, 2000).
On the contrary, entirely heterogeneous adopters correspond to an individual-level diffusion
model where the individual adoption process is modeled.
2. Perfect versus imperfect information: Can the adopting agents be assumed to have sufficient
information about the nature and future developments of any one technology? Or, is

22
information diffusion about the existence and attributes of a particular innovation an
essential determinant of innovation diffusion?
3. Non-increasing versus increasing returns in new technological developments: Under what
circumstances can the use or production of an innovation lead to constant or decreasing
returns? On the contrary, are there factors, which can give rise to size-related economies of
scale, various sorts of learning processes, and, generally, dynamic increasing returns?
4. Importance of history for the patterns of diffusion: Learning history, path dependency, and
long-term dynamics. This point refers to the two preceding ones. Most is going to depend on
the existence of dynamic increasing returns, on the feedback processes between the number
of adopters of the technology and the changing incentives to further adopt it. When these
circumstances occur, one is clearly in the domain of path-dependent, non-ergodic processes
and as a result, history counts for both individual patterns of behavior and in terms of the
general long-term dynamics of the system.
5. Interaction between supply and demand of innovations: When can one reasonably assume
that the innovation to be adopted is supplied once-and-for-all, and conversely, when is it
correct to assume a continuous process of improvement in its technical characteristics –
which also make adoption easier and enlarges the set of potential users? How important are
changes in supply conditions, first of all prices, for the changing pace of innovation diffusion?
6. Diffusion in demand versus diffusion in supply: Diffusion processes are often related to new
goods, whose manufacturer wants to sell to as many customers as possible. However,
another side of the diffusion process is related to the diffusion of the manufacturing capacity
of these new goods among the producers themselves. The theoretical representation of such
diffusions concerns the conditions of imitation of an innovation, i.e. technological
appropriability, possibly entry- and mobility-barriers and tacitness versus universality of
technical knowledge.
7. The forces driving diffusion: Are these forces mainly exogenous, such as general changes in
relative prices and macro demand growth? Or, can they be considered to be mainly
endogenous, such as learning in the manufacturing of the innovation, learning-by-using and
network effects?
8. Behavior and choice of individuals or individual organizations: At one extreme, decision
processes about adoption or rejection of new innovations may be represented as
optimizations of the returns on the new innovations, i.e. the agents exhibit a rational or
optimizing behavior. At the other extreme, agents may exhibit an institutionalized behavior,
i.e. a behavior that is rather routinized and influenced by specific visions and norms.
9. Equilibrium versus disequilibrium dynamics of diffusion: Equilibrium dynamics of diffusion is
characterized by micro diffusion decisions that are postulated to be reciprocally consistent
and rational micro-behavior that all turns out to be fulfilled in their objectives. Disequilibrium
dynamics of diffusion is characterized by process attractors that change themselves as a
result of the action of the agents or diffusion processes that are explicitly based on the trial-
and-error efforts of the agents.
23
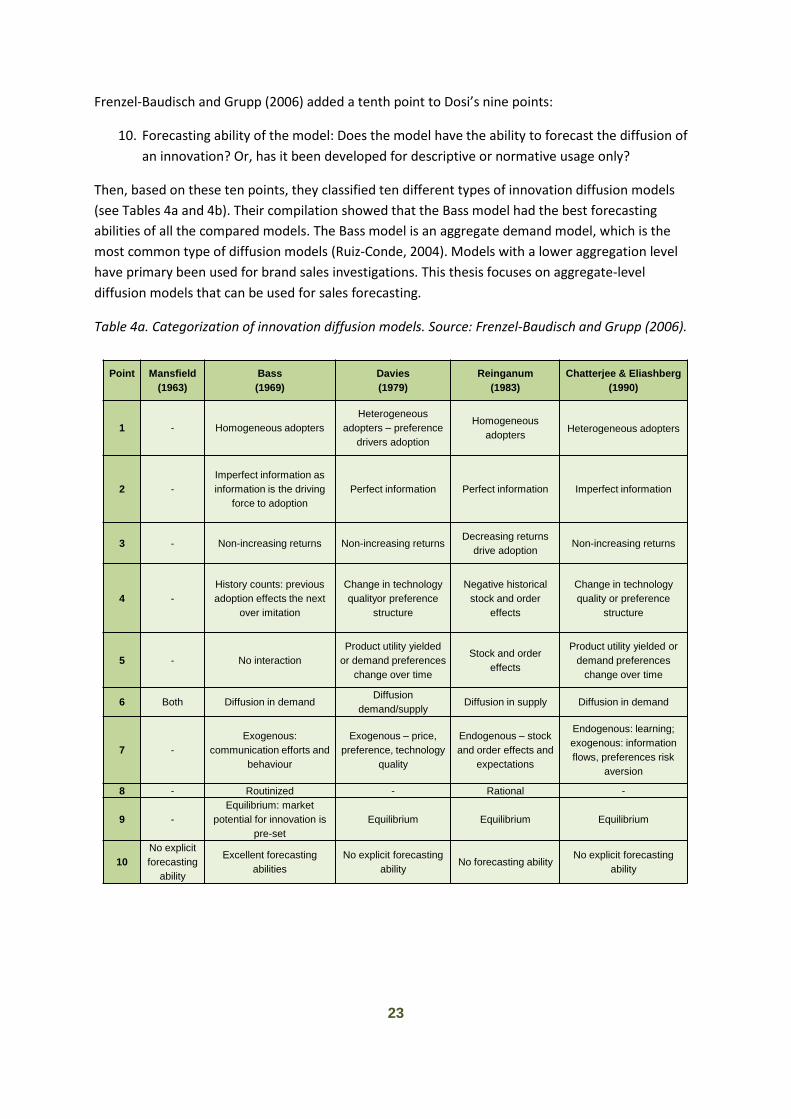
Frenzel-Baudisch and Grupp (2006) added a tenth point to Dosi’s nine points:
10. Forecasting ability of the model: Does the model have the ability to forecast the diffusion of
an innovation? Or, has it been developed for descriptive or normative usage only?
Then, based on these ten points, they classified ten different types of innovation diffusion models
(see Tables 4a and 4b). Their compilation showed that the Bass model had the best forecasting
abilities of all the compared models. The Bass model is an aggregate demand model, which is the
most common type of diffusion models (Ruiz-Conde, 2004). Models with a lower aggregation level
have primary been used for brand sales investigations. This thesis focuses on aggregate-level
diffusion models that can be used for sales forecasting.
Table 4a. Categorization of innovation diffusion models. Source: Frenzel-Baudisch and Grupp (2006).
Point Mansfield
(1963)
Bass
(1969)
Davies
(1979)
Reinganum
(1983)
Chatterjee & Eliashberg
(1990)
1 - Homogeneous adopters
Heterogeneous
adopters – preference
drivers adoption
Homogeneous
adoptersHeterogeneous adopters
2 -
Imperfect information as
information is the driving
force to adoption
Perfect information Perfect information Imperfect information
3 - Non-increasing returns Non-increasing returnsDecreasing returns
drive adoptionNon-increasing returns
4 -
History counts: previous
adoption effects the next
over imitation
Change in technology
qualityor preference
structure
Negative historical
stock and order
effects
Change in technology
quality or preference
structure
5 - No interaction
Product utility yielded
or demand preferences
change over time
Stock and order
effects
Product utility yielded or
demand preferences
change over time
6 Both Diffusion in demandDiffusion
demand/supplyDiffusion in supply Diffusion in demand
7 -
Exogenous:
communication efforts and
behaviour
Exogenous – price,
preference, technology
quality
Endogenous – stock
and order effects and
expectations
Endogenous: learning;
exogenous: information
flows, preferences risk
aversion
8 - Routinized - Rational -
9 -
Equilibrium: market
potential for innovation is
pre-set
Equilibrium Equilibrium Equilibrium
10
No explicit
forecasting
ability
Excellent forecasting
abilities
No explicit forecasting
abilityNo forecasting ability
No explicit forecasting
ability
24
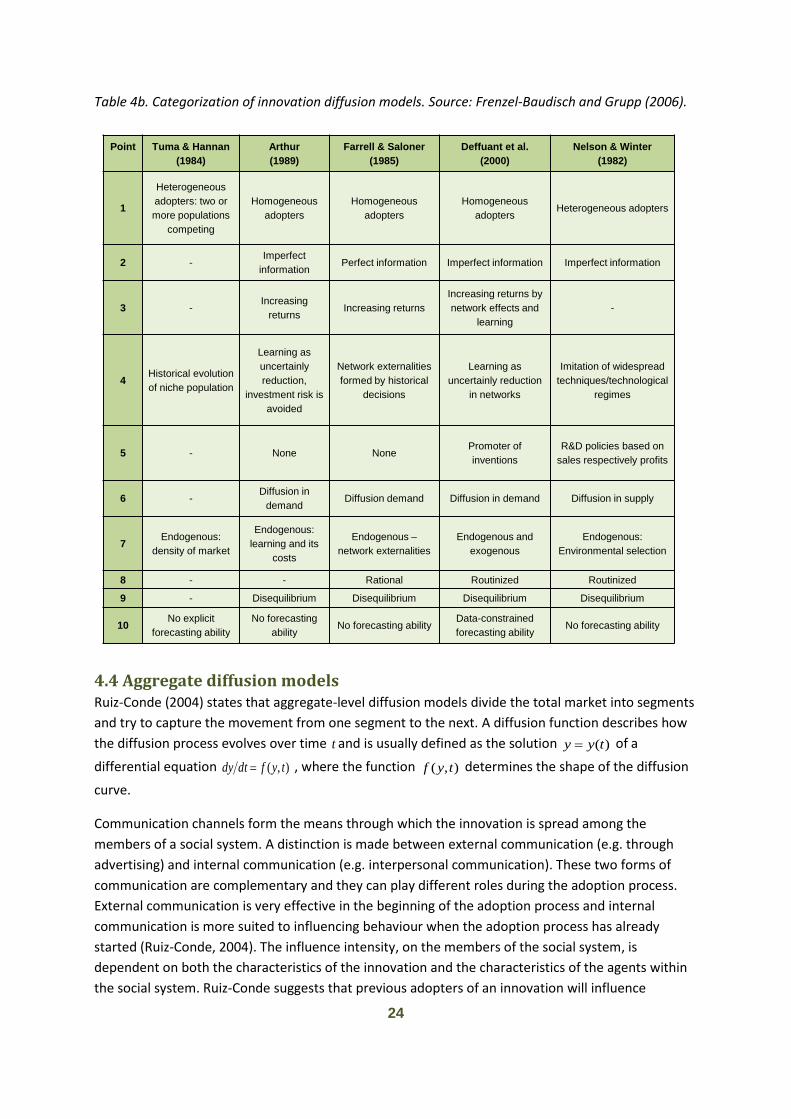
Table 4b. Categorization of innovation diffusion models. Source: Frenzel-Baudisch and Grupp (2006).
4.4 Aggregate diffusion models Ruiz-Conde (2004) states that aggregate-level diffusion models divide the total market into segments
and try to capture the movement from one segment to the next. A diffusion function describes how
the diffusion process evolves over time t and is usually defined as the solution )(tyy of a
differential equation ),( tyfdtdy , where the function ),( tyf determines the shape of the diffusion
curve.
Communication channels form the means through which the innovation is spread among the
members of a social system. A distinction is made between external communication (e.g. through
advertising) and internal communication (e.g. interpersonal communication). These two forms of
communication are complementary and they can play different roles during the adoption process.
External communication is very effective in the beginning of the adoption process and internal
communication is more suited to influencing behaviour when the adoption process has already
started (Ruiz-Conde, 2004). The influence intensity, on the members of the social system, is
dependent on both the characteristics of the innovation and the characteristics of the agents within
the social system. Ruiz-Conde suggests that previous adopters of an innovation will influence
Point Tuma & Hannan
(1984)
Arthur
(1989)
Farrell & Saloner
(1985)
Deffuant et al.
(2000)
Nelson & Winter
(1982)
1
Heterogeneous
adopters: two or
more populations
competing
Homogeneous
adopters
Homogeneous
adopters
Homogeneous
adopters Heterogeneous adopters
2 -Imperfect
information Perfect information Imperfect information Imperfect information
3 -Increasing
returns Increasing returns
Increasing returns by
network effects and
learning
-
4Historical evolution
of niche population
Learning as
uncertainly
reduction,
investment risk is
avoided
Network externalities
formed by historical
decisions
Learning as
uncertainly reduction
in networks
Imitation of widespread
techniques/technological
regimes
5 - None None Promoter of
inventions
R&D policies based on
sales respectively profits
6 -Diffusion in
demand Diffusion demand Diffusion in demand Diffusion in supply
7Endogenous:
density of market
Endogenous:
learning and its
costs
Endogenous –
network externalities
Endogenous and
exogenous
Endogenous:
Environmental selection
8 - - Rational Routinized Routinized
9 - Disequilibrium Disequilibrium Disequilibrium Disequilibrium
10No explicit
forecasting ability
No forecasting
ability No forecasting ability
Data-constrained
forecasting ability No forecasting ability
25
potential adopters to imitate them in their decision to adopt the innovation. This imitation (or
interaction) effect will accelerate the diffusion process, since the probability of a potential adopter
adopting the innovation at a certain moment of time depends on the number of previous adopters.
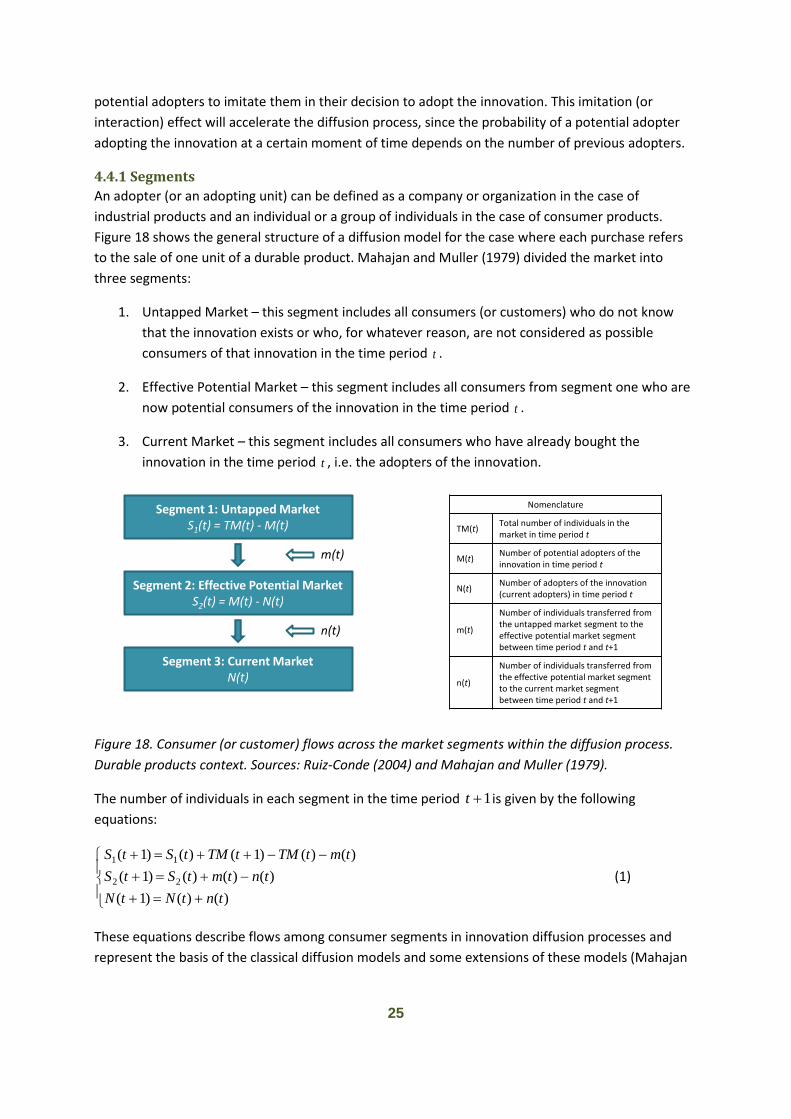
4.4.1 Segments
An adopter (or an adopting unit) can be defined as a company or organization in the case of
industrial products and an individual or a group of individuals in the case of consumer products.
Figure 18 shows the general structure of a diffusion model for the case where each purchase refers
to the sale of one unit of a durable product. Mahajan and Muller (1979) divided the market into
three segments:
1. Untapped Market – this segment includes all consumers (or customers) who do not know
that the innovation exists or who, for whatever reason, are not considered as possible
consumers of that innovation in the time period t .
2. Effective Potential Market – this segment includes all consumers from segment one who are
now potential consumers of the innovation in the time period t .
3. Current Market – this segment includes all consumers who have already bought the
innovation in the time period t , i.e. the adopters of the innovation.
Figure 18. Consumer (or customer) flows across the market segments within the diffusion process.
Durable products context. Sources: Ruiz-Conde (2004) and Mahajan and Muller (1979).
The number of individuals in each segment in the time period 1t is given by the following
equations:
)()()1(
)()()()1(
)()()1()()1(
22
11
tntNtN
tntmtStS
tmtTMtTMtStS
(1)
These equations describe flows among consumer segments in innovation diffusion processes and
represent the basis of the classical diffusion models and some extensions of these models (Mahajan
Segment 1: Untapped MarketS1(t) = TM(t) - M(t)
Segment 2: Effective Potential MarketS2(t) = M(t) - N(t)
Segment 3: Current MarketN(t)
Nomenclature
TM(t)Total number of individuals in the market in time period t
M(t)Number of potential adopters of the innovation in time period t
N(t)Number of adopters of the innovation (current adopters) in time period t
m(t)
Number of individuals transferred from the untapped market segment to the effective potential market segment between time period t and t+1
n(t)
Number of individuals transferred from the effective potential market segment to the current market segment between time period t and t+1
m(t)
n(t)
26
and Muller, 1979). According to Ruiz-Conde (2004), the flow of consumers from the second segment
to the third segment is studied in most models, i.e. the number of adopters )(tn at time t .
Figure 19 shows another example of a general structure of a diffusion model. Here each purchase
refers to the sale of one unit of a non-durable product. The market is divided into four consumer
segments (Hahn et al., 1994):
1. Non-triers – this segment includes all potential consumers who have not tried the innovation
at time t .
2. Triers – this segment includes all consumers who had not tried the innovation by the time
period 1t , but try the innovation at time t .
3. Non-repeaters – this segment includes all consumers who have tried the innovation by the
time period 1t , but are not repurchasing the product at time t .
4. Repeaters – this segment includes all consumers who have tried the innovation by the time
period 1t , and are repurchasing it at time t .
Figure 19. Consumer (or customer) flows across the market segments within the diffusion process.
Non-durable products context. Sources: Ruiz-Conde (2004) and Hahn et al. (1994).
The total number of potential consumers of the product is described by:
)()()()( 4321 tNtNtNtNN (2)
and the dynamic flows through the different segments are represented by
α(t)
Segment 1: Non-triersN1(t)
Segment 2: TriersN2(t)
Segment 3: Non-repeatersN3(t)
Segment 4: RepeatersN4(t)
1- γ1(t) γ1(t)
1- γ3(t) γ2(t)
γ3(t)
1- γ2(t)
1-α(t) Nomenclature
Ni(t)Number of consumers in segment i in the time period t, i = 1,2, 3 and 4
α(t)Fraction of non-triers in the time period t-1 who try the innovation in t
γ1(t)Fraction of triers in the time period t-1 who repurchase the innovation in t
γ2(t)Fraction of repeaters in the time period t-1 who repurchase the innovation in t
γ3(t)Fraction of non-repeaters in the time period t-1 who repurchase the innovation in t
27
)1()()1()()1()()(
)1()(1)1()(1)1()(1)(
)1()()(
)1()(1)(
3342214
3342213
12
11
tNttNttNttN
tNttNttNttN
tNttN
tNttN
(3)
Hahn et al. (1994) used these equations when he extended the classical diffusion model (designed
for durable innovations) and analyzed non-durable innovations with repeat purchases.
4.4.2 Diffusion models of external influence
In a diffusion model of external influence, the rate of diffusion is assumed to depend solely on the
number of potential adopters. Some important pioneering works on diffusion models of external
influence are those of Fourt and Woodlock (1960) that investigated the sales prediction for consumer
products and Coleman et al.(1966) that investigated the diffusion of a new medicine among a group
of doctors. A diffusion model of external influence can mathematically be described by (Ruiz-Conde,
2004):
)()(
)( tNMadt
tdNtn (4)
where )(tn is the number of adopters at time t and M is the potential market (total number of
potential adopters in the social system). )(tN is the cumulative number of adopters at time t , i.e.:
t
tdttntN
0
)()( (5)
The parameter of external influence a represents the degree of intensity of the source of external
influence (or the probability of a randomly chosen individual being reached by this source of
influence). Equation (4) shows that the constant external source of influence reaches a fixed
proportion of the population at any given moment in time. External influence comes not only from
the promotional strategies found in the market (external communication), but also from the intrinsic
tendency of an individual company or person to innovate (also called innate innovativeness).
Integration of equation (4) and the condition 00 )( NtN gives the following cumulative distribution
of adopters:
ateMtN 1)( (6)
Ruiz-Conde summarized the main assumptions that underlie diffusion models of external influence:
The population of potential adopters is limited and remains constant through time and
eventually all members of the population adopt the innovation.
The diffusion process arises from a source of constant influence (independent of the number
of adopters) and the impact is equal for all non-adopters.
28
Since a model of external influence assumes that the spread of an innovation depends exclusively on
information coming from external sources, it does not consider any diffusion resulting from
interaction between previous and potential adopters. As a consequence, Ruiz-Conde suggested that
such a model should only be appropriate for innovations that are neither socially remarkable nor
complex, since the diffusion will not be influenced by personal communication between the
members of the social system.
4.4.3 Diffusion models of internal influence
In a diffusion model of internal influence, the rate of diffusion is assumed to be proportional to both
the number of potential adopters (i.e. the distance remaining from a predetermined market
saturation level) and the level of diffusion reached. Some important pioneering works on diffusion
models of internal influence are those of Griliches (1957) who investigated diffusion of hybrid corn
among farmers from various geographical regions and Mansfield (1961), who investigated the
substitution of established technology and the diffusion of new technology and innovations among
different companies. A diffusion model of internal influence (or pure imitation) can mathematically
be described by (Ruiz-Conde, 2004):
)()()(
)( tNMtbNdt
tdNtn (7)
where the parameter of internal influence b can be considered to be an index of potential adopters’
imitation of previous adopters. The parameter shows the impact on the adoption of the innovation
of interpersonal communication and interactions among the members of a social system.
Integration of (7) and the condition 1)( 00 NtN gives the following cumulative distribution of
adopters:
0
0
01
)(ttbM
eN
NM
MtN
(8)
The main assumptions that underlie diffusion models of internal influence are according to Ruiz-
Conde:
The population of potential adopters is limited and remains constant through time and
eventually all members of the population adopt the innovation.
The population is homogenous.
All adopters are imitators and the probability of two individuals making contact is equal for
any two individuals.
The rate of adoption does depend on both the number of previous adopters and on the
maximum number of potential adopters that still have not adopted.
An internal influence model, which is an epidemiological type of model, is based on the existence of
communication between the members of the social system. This social interaction is represented in
29
the model by the product of previous and potential adopters (see equation (7)). The probability of
adoption will increase as the number of adopters increase in the social system. Ruiz-Conde stated
that “this is a logical process as the greater the number of previous adopters, the more information
there will be in the market on the characteristics, advantages and previous adopters’ experience of
the innovation, which would reduce the risk aversion of potential adopters and favour the decision to
adopt”.
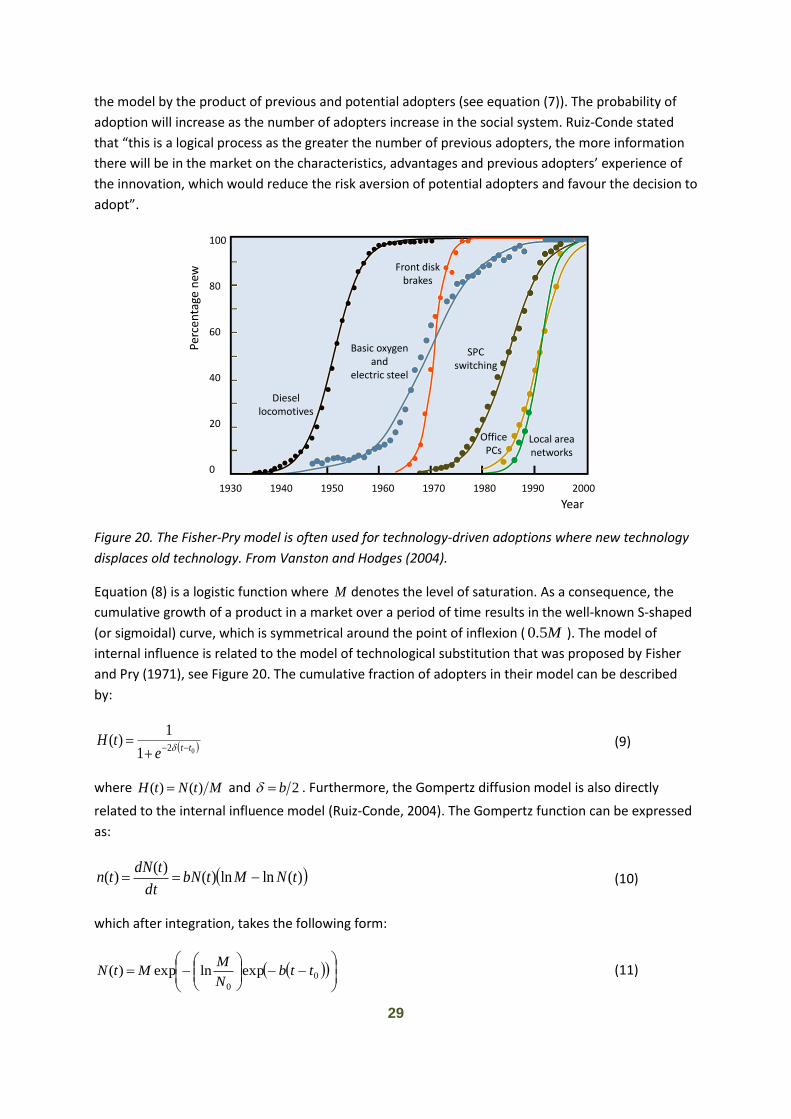
Figure 20. The Fisher-Pry model is often used for technology-driven adoptions where new technology
displaces old technology. From Vanston and Hodges (2004).
Equation (8) is a logistic function where M denotes the level of saturation. As a consequence, the
cumulative growth of a product in a market over a period of time results in the well-known S-shaped
(or sigmoidal) curve, which is symmetrical around the point of inflexion ( M5.0 ). The model of
internal influence is related to the model of technological substitution that was proposed by Fisher
and Pry (1971), see Figure 20. The cumulative fraction of adopters in their model can be described
by:
021
1)(
tte
tH
(9)
where MtNtH )()( and 2b . Furthermore, the Gompertz diffusion model is also directly
related to the internal influence model (Ruiz-Conde, 2004). The Gompertz function can be expressed
as:
)(lnln)()(
)( tNMtbNdt
tdNtn (10)
which after integration, takes the following form:
0
0
explnexp)( ttbN
MMtN (11)
1930 1940 1950 1960 1970 1980 1990 2000
100
80
60
40
20
0
Perc
enta
gen
ew
Year
Local area networks
Diesel locomotives
Basic oxygenand
electric steel
Front disk brakes
SPC switching
Office PCs
30
Even though the Gompertz model also results in an S-shaped curve, the point of inflexion is reached
at 37 percent ( Me 1 ), instead of 50 percent, which is the case with the logistic function.
4.4.4 Diffusion models of mixed influence
A diffusion model of mixed influence assumes that both types of influence are active in the decision
to adopt an innovation. By combining the diffusion models of external and internal influence, i.e.
equation (4) and (7), a diffusion model of mixed influence (or the fundamental diffusion model) is
obtained (Mahajan and Peterson, 1985):
)()()(
)( tNMtbNadt
tdNtn (12)
Integration of (12) and the condition 00 )( NtN gives the following cumulative distribution of
adopters:
0
0
0
0
0
0
exp1
exp
)(
ttbMabNa
NMb
ttbMabNa
NMaM
tN
(13)
The diffusion model of mixed influence is capable of representing both external and internal
influence and it is the most widely used diffusion model (Ruiz-Conde, 2004). If mM , mqb and
pa is substituted into equation (12), we obtain:
)()()(
)( tNmm
tNqp
dt
tdNtn
(14)
which is the Bass (1969) model. He defined p and q as the parameter of innovation and imitation,
respectively. The parameter m is the market potential. The Bass model has large acceptance in the
field of innovation diffusion (Mahajan et al., 2000). He pioneered the introduction of diffusion
models into the marketing research field by repackaging diffusion understandings in a form that were
usable by marketing scholars (Rogers, 2003). He proposed that the adoption process of a new
durable consumer product has similarities with the spread of an epidemic, i.e. people who have not
adopted the product are infected by those who have and are influenced by external sources, such as
advertising (Ruiz-Conde, 2004). Bass investigated the diffusion of consumer durables (e.g. electric
refrigerators, home freezers, room air conditioners and power lawnmowers) and predicted the sales
for these products with a very good accuracy. Ruiz-Conde claims that many other authors have used
the Bass model for sales prediction of a wide variety of products, in various countries, and also
obtained good results.
If we assume that the initial time and cumulative distribution of adopters are equal to zero, i.e.
00 t and 00 N , a solution to equation (14) can be expressed as:
)(
1
1)( tmF
ep
q
emtN
tqp
tqp
(15)

31
where
tqp
tqp
ep
q
etF
1
1)( (16)
is the cumulative distribution function (or the fraction of potential adopters that has adopted the
product by time t).
4.4.5 Assumptions behind diffusion models of mixed influence
A diffusion model of mixed influence (the fundamental diffusion model, see equations (12) and 14))
is based on several restrictive assumptions that might reduce the realistic nature of the modelled
innovation diffusion process. According to Ruiz-Conde (2004), the most central assumptions are:
1. The diffusion process is a binary process (consumers or customers have two options: to
adopt or reject the innovation) and population is homogeneous (all individuals behave
equally when deciding whether or not to adopt an innovation).
2. The population of adopters does not vary (the size of the social system is fixed, finite and
known or can be estimated).
3. The parameters of external and internal influence do not change (they are the same for all
potential adopters, regardless of their characteristics and the time of adoption).
4. Only one adoption per adopter is permitted (repeat purchases, replacements or multiple
adoptions are not allowed).
5. Geographical frontiers do not alter (an innovation is restricted to a geographical area or a
certain marketing sector).
6. The innovation is diffused in isolation (the diffusion of an innovation is independent of all
other innovations, i.e. product interactions and competition among firms do not affect the
diffusion process).
7. The essential characteristics of the innovation or its perception do not change (i.e. they do
not significantly change during the innovation’s life time).
8. There are no supply restrictions (the diffusion models are demand models).
9. The impact of marketing strategies is only implicitly captured by the model parameters (no
direct inclusion of marketing mix variables).
Ruiz-Conde reviewed more than 90 diffusion models and her overview showed that researchers have
relaxed up to five of these restrictive assumptions by improving the original diffusion model of mixed
influence.
4.4.6 Multiple adoptions
Norton and Bass (1992) relaxed the fourth assumption in section 4.4.5 by introducing the following
expression:

32
cMm (17)
where c is the average number of units bought per unit of time per user and M is the upper limit of
the number of users. Sales will approach cM as the number of users approaches M . If )(tF (see
equation (16)) represents the fraction of the market that has been penetrated by time t , the sales at
time t will be
)()( tmFtS (18)
Sales are proportional to the cumulative distribution function of the adoption rate. In section 5 this
function will be used to determine the market penetration.
33
5 Hybrid HDV market forecast
In this section the diffusion and market penetration of hybrid heavy-duty vehicles in Europe will be
estimated by a mathematical model. Three hybrid technologies will be considered: hybrid-electric
vehicles, hydraulic hybrid vehicles and flywheel hybrid vehicles. The Bass model (see section 4.4.4)
will be used and the model requires the estimation of three parameters: the coefficient of external
influence p , the coefficient of internal influence q , and the market potential m . If no or very limited
amount of historical sales data is available, parameter estimates can be obtained by using either
expert judgements or the diffusion history of analogous products (Mahajan et al, 1990). However,
analogous products must be chosen carefully. Thomas (1985) states: “Unfortunately, while the use of
analogies appears to be very useful (and some would argue, inevitable) for estimating demand, it can
also be problematic. First, the presumption that if two things are alike in some respects, they are
necessarily alike in others is itself false. Similarities need to be carefully qualified to in invoke the
assumption that existing product sales histories can be used to estimate growth of a new product.
Second, even though a product might be evaluated to be similar, there is no reason to believe that a
one-to-one mapping of a growth estimate from the existing product(s) to the new product is
defensible”. Therefore, he suggested a five-step method where the analogies and the Bass
parameters are determined in a systematic way:
1. Estimation of the market potential.
2. Identification of similar products.
3. Estimation of customer values.
4. Estimation of diffusion parameters for similar products.
5. Estimation of sales.
An analogical approach based on Thomas (1985) five-step method will be used, due to the non-
existence of historical sales data for hybrid heavy-duty vehicles. The following sections describe the
steps, one by one.
5.1 Estimation of the market potential According to Thomas (1985), the market potential m for the new product can preferably be
estimated from a primary market study, since the size of m may depend on marketing variables
(especially price) and environmental variables and the effects of these factors may be designed into
the market study. However, in this work the market potential is estimated from secondary sources of
data. Three scenarios will be considered based on the work by AEA (2011):
1. BAU – Business as Usual. The assumptions include natural development of powertrain and
vehicle based efficiency improvements. Benefits are offset to a significant degree by in-year
increases in fuel consumption of 3% following the introduction of Euro VI in 2013 and a
purely speculative Euro VII in 2018. Introduction of significant alternative fuel or powertrain
options (e.g. hybrid) is assumed to be restricted. No incentives or legislative CO2 for HDV is
are assumed.
34
2. CET – Cost Effective Technology. Includes technologies of new and emerging technology,
which have a payback period for the operator of around two to three years along with some
uptake of electric and hybrid vehicles by early adopters. The rate of natural improvement for
conventional diesel fuelled vehicles in both powertrain and vehicle efficiency remains
constant with that assumed for the BAU scenario. Some incentives or legislative CO2 for HDV
are assumed.
3. CT – Challenging Technology. The scenario proposes uptake rates for all technologies
expected to be commercialised between 2010 and 2030 by vehicle mission profile regardless
of the length of time required to achieve technology payback. Uptake rates of technology are
aggressive and represent a likely maximum benefit. The natural rate of improvement of
powertrains for conventional diesel fuelled vehicles is at an increased rate as this assumes a
greater focus on improved design such as reduction in friction, improved combustion and
increased turbocharging as fuel consumption will be the main driver rather than cost.
Incentives or legislative CO2 for HDV are assumed.
As can be seen in Figures 2 and 3, the market size for HDVs is very fluctuating and therefore, the
market penetration potential of hybrid HDVs will be used instead of the market potential of hybrid
HDVs. The market potential m in equation (18) is substituted by
HDVemm (19)
where e is the market penetration potential of hybrids of the total HDV market mHDV. We get
)()(
)( teFm
tStL
HDV
(20)
where L(t) is the market penetration of hybrid HDVs. Table 5 shows AEA´s (2011) forecasted market
penetration in 2030 for the three different market scenarios that were presented above. The share of
HDV sales have been determined by the data in Figure 4 (the category Service/Delivery was excluded
since this thesis focuses on heavy-duty vehicles over 16 ton GVW) and Figure 5. The total sales of
buses and coaches were estimated to be 10% of truck sales.
Now, it assumed that all vehicles, except electric vehicles, finally will be fitted with a hybrid system,
since hybrid technologies offer significant energy benefits for conventional vehicles solely fitted with
internal combustion engines (see Table 3). Furthermore, the interrelationships between the market
penetrations for hybrid, hydraulic hybrid, flywheel hybrid and electric vehicles (for a certain scenario)
in Table 5 are assumed not to change after 2030. Thereby, it is possible to determine the “final”
(after the hybrid HDV diffusion process) market penetrations for hybrid and electric HDVs. Table 6
shows the result of these calculations, and the market penetration potential (e) of hybrid HDVs will
be 99.1% for the BAU scenario, 98.6% for the CET scenario and 92.6% for the CT scenario.
35
Table 5. Forecasted market penetration in 2030 for different scenarios.
1Was not presented in AEA (2011), therefore estimated here.
Table 6. Estimated market penetration after the hybrid HDV diffusion process.
5.2 Identification of similar products According to Thomas (1985), a set of existing products that have characteristics “similar” to the new
product concept (or prototype) shall be identified. The products should be selected with key
attributes similar to the new product and criteria that define the analogy include such factors as
those in Figure 21.
Shareof
HDV sales
(%)
Hybrid-electricvehicles
Hydraulic hybrid vehicles
Flywheel hybrid vehicles
Electric vehicles
BAU(%)
CET(%)
CT(%)
BAU(%)
CET(%)
CT(%)
BAU(%)
CET(%)
CT(%)
BAU(%)
CET(%)
CT(%)
Urban delivery, Collection
7.5 5 10 25 N/A N/A 20 N/A 10 20 0.2 1 15
Municipal utility 7.6 5 5 30 N/A N/A 20 N/A 5 20 N/A N/A 5
Regional delivery, Collection
22.8 5 5 10 N/A N/A N/A N/A N/A 10 N/A N/A N/A
Long haulage 36.4 0.5 2 10 N/A N/A N/A N/A N/A 10 N/A N/A N/A
Construction1 16.6 5 5 10 N/A N/A N/A N/A N/A 10 N/A N/A N/A
Bus 6.9 5.5 18 40 N/A N/A 20 N/A 10 20 0.2 1 15
Coach 2.2 N/A 2 10 N/A N/A N/A N/A 5 10 N/A N/A N/A
HDV market penetration 3.3 5.1 14.7 N/A N/A 4.4 N/A 1.912.2
0.03 0.1 2.5
Hybrid-electricvehicles
Hydraulichybrid vehicles
Flywheelhybrid vehicles
Hybrid vehicles()
Electric vehicles
BAU 99.1% N/A N/A 99.1% 0.9%
CET 71.8% N/A 26.8% 98.6% 1.4%
CT 43.5% 13% 36.1% 92.6% 7.4%
36
Figure 21. Bases for comparing product/market situations and identifying candidate product
analogies.
Following a procedure similar to that illustrated in Figure 21, a set of candidate products (or
technologies) were identified as potentially similar to hybrid heavy-duty vehicles, at least on selected
characteristics. Such products included different engine, driveline and vehicle technologies such as
catalytic converter, automated transmission, low rolling resistance tyres and aerodynamic fairings
(e.g. cab deflectors and side panels). However, of the candidate-similar products, several could not
be used because of lack of adequate sales history. Sales histories for different car technologies were
found in literature, but both the market structure, buyer behavior and marketing strategy are
fundamental different for cars, which are consumer products, and HDVs, which are industrial
products (see Kotler and Keller (2006) for a comparison of characteristics of business markets and
consumer markets). As a consequence, the following products/technologies were finally chosen:
Radial tyre. Radial-ply tyres offer higher durability than conventional (cross-ply or bias-ply)
tyres and this is a very important factor in fleet operating costs (Watson, 1999). Tyre life,
excluding retreading, can be from 40-100% greater than that of conventional tyres. In
addition, radial tyre life can be extended about three times by regrooving and multiple
retreading. Radial-ply truck tyres give a reduction in fuel consumption of 6-10% through their
lower rolling resistance. The main disadvantage is that conventional tyres are more suited to
poor road conditions and overloading. Therefore, a major contributing factor to the slow
growth of the radicalization of truck tyres in developing countries has been the slow progress
in the construction of paved surfaces (asphalt, concrete or tarmac) in their road networks.
Disc brake. Disc brakes are able to work at high temperatures, without losing braking
performance, for longer periods than conventional drum brakes (Gorenc, 2006). They are 30
to 40 percent lighter in weight than drum brakes, and have approximately one-fourth the
number of parts of drum brakes. Although disc brakes have a higher purchase price, they
usually last longer than drum brakes, making them the more cost-effective alternative. The
main disadvantage is that drum brakes offer better robustness and reliability during off-road
conditions, due to their almost completely sealed housings.
Bases for comparing and
identifying candidate product
analogies
- Economic- Technological
- Political- Regulatory- Ecological
- Social
- Market potential- Sales history
- Barriers to entry- No. generic competitors
- Segmentation
- Buying situation- Decision process- Choice attributes
- Buying center- Product
- Price- Promotion
- Distribution
- Relative advantage- Compatibility
- Complexity- Divisibility
- Communicability
Environmental Situation
Market Structure
Characteristics of Innovation
Marketing Strategy
Buyer Behavior
37
Anti-lock brake system (ABS). ABS distributes the braking force evenly between the different
wheels of the vehicle and prevents any of the tyres locking during braking. An ABS system
offers maximum braking force while maintaining steerability and safety and thereby reducing
the stopping distance under most conditions including emergency braking conditions. The EU
legislation started with heavy commercial vehicles in 1991. All new heavy trucks over 16 ton
and suitable for towing trailers over 12 ton should be fitted with ABS as standard as of
October 1991 (WABCO, 2004). ABS has then been phased in progressively as a mandatory
requirement for all other commercial vehicles by 31.03.2001.
5.3 Estimation of customer values Thomas (1985) suggests an estimation of customer values (or importance weights, preferences) iv
for ki ..., ,2 ,1 new product key attributes and customer perceptions ijx about the extent (or
beliefs about the extent) to which mj ..., ,2 ,1 analogous products have attribute i . This can be
done in a primary market study, or by a combination of secondary data and expert judgment. Here
the latter alternative will be used. Knowledge about hybrid technologies (see section 3), the chosen
three analogous products/technologies (see section 5.2) and key-desired benefits of powertrain
technologies among HDV customers (see Figure 6), were used to determine the values in Table 7.
Notice that the importance weights are different for the different market scenarios.
Table 7. Key attributes, importance weights and customer perceptions about the extent the
analogous products/technologies have the key attributes.
5.4 Estimation of diffusion parameters for similar products An estimation of the diffusion model parameters (pj and qj) for each of the selected analogous
products is suggested by Thomas (1985). Standard criteria should be applied for evaluating the
stability of these parameter estimates. Figure 22 shows the diffusion curves for the chosen three
analogous products/technologies.
Non-linear regression in Matlab (R2011a) was used to determine the diffusion model parameters for
equation (16) and (20) from the sales data shown in Figure 22. Figures 22-24 and Table 8 show the
result from the curve fits. The results of these analyses were significant at a 95% confidence level and
had very high values of R2 (a value closer to 1 indicates a better curve fit).
i Key attributes
vi Radial tyres
(xi1)
Disc brakes
(xi2)
ABS
(xi3)
BAU CET CT
1Higher initial purchase price(excluding possible incentives) 0.4 0.3 0.2 0.4 0.4 0.2
2 Decreased operating costs 0.4 0.3 0.2 0.7 0.2 0.1
3 Decreased reliability 0.2 0.2 0.1 0.8 0.2 0
4Meets new critical legislative requirements
N/A 0.1 0.4 N/A N/A 1
5 Environmentally friendly 0 0.1 0.1 1 0 0
38
Figure 22. Diffusion curves for disc brakes, ABS and radial tyres in Europe (Western Europe). Disc
brakes and ABS sales data from Timoney and Timoney (2003) and radial tyre sales data from TSMG
(2008).
Figure 23. Market penetration of radial tyres in Europe (Western Europe).
1940 1950 1960 1970 1980 1990 20000
10
20
30
40
50
60
70
80
90
100
Year
Perc
en
tag
e o
f E
uro
pean
mark
et
Disc brakes
ABS
Radial tyres
0 10 20 30 40 50 600
10
20
30
40
50
60
70
80
90
100
Years since first introduction
Perc
en
tag
e o
f E
uro
pean
mark
et
Real data points
Curve fit
39
Figure 24. Market penetration of disc brakes in Europe (Western Europe).
Figure 25. Market penetration of ABS in Europe (Western Europe).
Table 8. Obtained diffusion model parameters and goodness of fit values (R2) from the non-linear
regression.
0 5 10 15 20 25 30 35 400
10
20
30
40
50
60
70
Years since first introduction
Perc
en
tag
e o
f E
uro
pean
mark
et
Real data points
Curve fit
0 5 10 15 20 25 30 350
10
20
30
40
50
60
70
80
90
100
Years since first introduction
Perc
en
tag
e o
f E
uro
pean
mark
et
Real data points
Curve fit
j Product/Technology
pj
(10-3)
qj Coefficient of multiple determination
R2
1 Radial tyres 4.92 0.164 0.9945
2 Disc brakes 0.818 0.149 0.9965
3 ABS 0.0386 0.344 0.9972
40
5.5 Estimation of sales The following equations should be used to estimate the diffusion parameters p’ and q’ for the new
innovative product (Thomas, 1985):
m
j
k
i
jiji pxvp1 1 (21)
m
j
k
i
jiji qxvq1 1 (22)
Table 9 shows the result from using these equations with the values in Tables 7 and 8. Finally, the
market penetration for hybrid HDVs in Europe (see Figure 26 and Table 10, 2010 has been assumed
to be the introduction year of hybrid HDVs) can be determined with equations (16) and (20) and the
values in Tables 6 and 9.
Table 9. Estimated diffusion model parameters for hybrid heavy-duty vehicles in Europe.
Figure 26. Market penetration of hybrid heavy-duty vehicles in Europe.
Scenariop’
(10-3)
q’
BAU 3.19 0.181
CET 3.09 0.195
CT 2.10 0.245
0 10 20 30 40 50 600
10
20
30
40
50
60
70
80
90
100
Years since first introduction
Perc
en
tag
e o
f E
uro
pean
mark
et
BAU
CET
CT
41
Table 10. Market penetration of hybrid heavy-duty vehicles in Europe, total and split into the different
hybrid technologies (the split is based on the interrelationships between the different hybrid
technologies in Table 6).
5.6 Discussion Sultan et.al. (1990) carried out a meta-analysis of 213 applications of diffusion models and they
reported average values of 0.03 and 0.38 for the coefficients of external (p) and internal influence
(q), respectively. Their findings suggest that the diffusion process is affected more by imitation
factors such as word of mouth than by innate innovativeness of the consumers (or customers). The
values in Table 8 support their findings and indicate that the innovativeness among HDV customers is
even lower.
The three diffusion curves in Figure 26 have the same characteristics and the differences between
them are relatively small. The largest difference occurs approximately after 23 years since first
introduction. In that case the difference in market penetration between the CT scenario and BAU
scenario is approximately 12 percentages. In the CT scenario, hybrid technologies will be almost fully
diffused after 50 years since first introduction, while in the BAU scenario, additional ten years are
needed to fully penetrate the market (notice that the “final” market penetration of hybrids is
different for the different scenarios due to different estimated “final” market penetration of electric
HDVs). Furthermore, all scenarios result in a rather low penetration rate of hybrid HDVs during the
first ten years. The diffusion speed increases then rapidly during the next ten years such that 40-50
percent of the HDV market is penetrated in 2030.
Table 5 shows that AEA´s (2011) forecasted market penetration for year 2030 is significantly lower
than the one presented in Table 10. The CT penetration in Table 10 for year 2030 is a factor 1.6
higher than AEA´s penetration and the BAU penetration is as high as a factor 12.1 higher than AEA´s
forecasted penetration. This indicates that the forecast presented here might be too optimistic and
that more analogous products should be used or usage of other weights or perception values in Table
7. On the other hand, in Murphy (2011), Frost and Sullivan forecast that hybrids will account for 8%
of the market for trucks over 8800 kg in 2015 and that 72% of the hybrid trucks will be hybrid-electric
and the remainder vehicles hydraulic hybrids. This is more optimistic than any of the forecasted
market penetrations in Table 10, who reach this level first in 2020.
The CT scenario results in a slightly lower market penetration during the first 11-13 years than the
two other scenarios (see Figure 26 and Table 10). This is inconsistent and should be considered as a
model error.
Hybrid vehicles
()
Hybrid-electricvehicles
Hydraulic hybrid vehicles
Flywheel hybrid vehicles
2020
(%)
2030
(%)
2040
(%)
2020
(%)
2030
(%)
2040
(%)
2020
(%)
2030
(%)
2040
(%)
2020
(%)
2030
(%)
2040
(%)
BAU 8.34 39.8 80.5 8.34 39.8 80.5 N/A N/A N/A N/A N/A N/A
CET 8.76 44.0 84.4 6.38 32.0 61.5 N/A N/A N/A 2.38 12.0 22.9
CT 7.81 50.2 86.5 3.66 23.5 40.5 1.1 7.05 12.1 3.04 19.6 33.7
42
6 Conclusions
Forecasts for the market penetration of hybrid HDVs in Europe have been determined by a diffusion
model of mixed influence. Three different market scenarios were used and resulted in three different
market penetrations of hybrid-electric, hydraulic hybrid and flywheel hybrid vehicles. The following
conclusions can be drawn:
The very high values of R2 from the non-linear regression in Matlab (see Table 8) indicate that
the diffusion of new technologies and products among HDV customers can be very well
described by a diffusion model of mixed influence such as the Bass model. As a result, such
models are capable of predicting future market demand, not only of hybrid HDVs, but also of
other HDVs with new innovative technologies or solutions. Therefore, it is suggested that
innovation diffusion modeling should be a standard tool (combined with other techniques
such as judgmental and customer/market research techniques) in the strategic planning of a
HDV firm’s all new innovative products.
One of the major challenges of using innovation diffusion models for sales forecasting of new
products or technologies, is to find appropriate and sufficient analogous sales data (or
adoption data). Therefore, Thomas (1985) analogous approach has been further developed
and is presented in Figure 27. This extended method is more focused on finding appropriate
and sufficient sales data than Thomas five-step method. Internal sources can, for instance, be
databases containing the firm’s own sales statistics, while external sources can be
commercial sources such as trade and research associations or educational institutions. If a
firm is willing to share some of its own sales data, it might even be possible to get some sales
data from its competitors or suppliers. Public sources are usually free, and include
government departments and agencies and public libraries, and so on. Another extension of
the proposed method in Figure 27, is the inclusion of various possible (or probable) market
scenarios, resulting in a more comprehensive forecast and thereby a better picture of the
future. Furthermore, new data and changed conditions require updated forecasts. As a
consequence, the forecasts should be revised continuously and be based also on real sales
data (and not only on analogous data) when such data is available.
According to Peres et al. (2010), there is a great body of evidence suggesting that the overall
temporal pattern of diffusion of innovation accelerates over time, i.e. a product launched
today diffuses faster than a similar product did in the past. Van den Bulte (2000) showed that
the average annual acceleration between 1946 and 1980 has been around 2% for consumer
electronics and household products. Although, a slower acceleration should be expected for
industrial products and products related to the heavy-duty industry, this effect should be
taken into consideration when selecting analogous products and interpreting the forecasted
sales
Researchers have found that if the market is unstable, the smooth S-curve may not start
directly after the introduction of a first new product, but first after an erratic process of
diffusion (Tidd and Bessant, 2009). This pre-diffusion phase ends when the regular S-shaped
diffusion curve begins. Tidd and Bessant state that the pre-diffusion phase is very risky, since
it can last a very long time. If the spread of hybrid HDVs among the customers will be

43
preceded by a pre-diffusion phase, a time-lag shall be added to the forecasted market
penetrations.
In this thesis it is assumed that several different hybrid technologies will co-exist rather than
converge into a single dominant design. How likely is this scenario? Factors in favour of one
design to emerge include compatibility, technological superiority, bandwagon effect,
financial strength, brand reputation, pricing strategy, timing of entry and marketing
communications (Van de Kaa et al., 2007). However, a dominant design may, in particular, be
expected in the case of network externalities (or network effects), i.e. the benefits from
using a technology or product increase with the number of other users of the same
technology or product (Vries et al., 2011). In the hybrid HDV case, indirect network effects
may arise, since bigger networks can give rise to more widely available service facilities.
Factors that foster the co-existence of multiple designs include persistency and distinct
features resulting in product niches, i.e. dominant designs can appear in product categories,
while the overall technology lacks a single dominant design (Vries et al., 2011). The authors
also state that although a majority of researchers assume that a dominant design will always
emerge, several designs may compete for decades, without one technology being locked in
as a dominant design. Whether a dominant hybrid HDV technology emerge or not, the
obtained forecasts for the total diffusion of hybrid HDVs should be relatively unaffected.
Hybrid vehicles and many of the hybrid technologies are very complex and require
considerable research and development before they reach their full potential. Factors, such
as emission regulations, fuel prices, incentives, production capacity of hybrid batteries, and
the development of a recharging infrastructure, complicate the forecasting work further.
Therefore, future work should include more (and more appropriate) analogous products and
a more advanced diffusion model with additional of the restrictive assumptions released (see
section 4.4.5). For instance, it would be interesting to investigate the effects of successive
product generations, increased fuel prices, incentives (directly included in the model) or the
impact of marketing strategies (i.e. direct inclusion of marketing mix variables). Furthermore,
it would be very interesting to analyse other markets, such as Asia and Latin America.
44
Figure 27. Extended method for estimating market growth for new products.
Estimate market potential for the new product (for each scenario)
Identify a set of existing products having characteristics analogous to the new product
Estimate customer values for key new product attributes (for each scenario)
Select diffusion model and estimate the model parameters for each analogous
product by regression analysis
Calculate sales for each scenario
Obtain sales history (or adoption data) for each analogous product
Appropriate and sufficient sales data?
YesNo
Calculate the model parameters for the new product (for each scenario)
Determine possible market scenarios for the new product
Estimate customer perceptions about the extent the analogous products
having the key new product attributes
Public sources
Externalnon-
publicsources
Internalsources
45
References
ACEA (2011), The automobile industry pocket guide, European Automobile Manufactures Association,
Brussels.
ACEA (2010), The automobile industry pocket guide, European Automobile Manufactures Association,
Brussels.
ACEA (2009), Cars, Trucks and the Environment, European Automobile Manufactures Association,
Brussels.
AEA (2011), Reduction and Testing of Greenhouse Gas (GHG) Emissions from Heavy Duty Vehicles –
Lot 1: Strategy, AEA Technology, Didcot.
Arthur, B. (1989), Competing technologies, increasing returns, and lock-in by historical events,
Economic Journal, 99, 116-131.
Bass, F. (1969), A new product growth model for consumer durable, Management Science, 15, 215
227.
Baudisch, A. and Grupp, H. (2006), Evaluating the market potential of innovations: A structured
survey of diffusion models, Working paper, Faculty for Business Studies and Economics, Friedrich-
Schiller-University Jena.
Chatterjee, R. and Eliashberg, J. (1990), The innovation diffusion process in a heterogeneous
population – A micromodeling approach, Management Science, 36, 1057-1074.
Coleman, J.S., Katz, E. and Menzel, H. (1966), Medical innovation: A diffusion study, Bobbs-Merril,
Indianapolis.
Davies, S. (1979), The diffusion of process innovations, Cambrigde University Press, Cambrigde,
Deffuant, G., Skerratt, S., Amblard, F., Ferrand,, N., Chattoe, E., Gilbert, N. and Weisbuch, G. (2000),
Agent based simulation of decision process mixing rational reasoning and influences from socio-
informational networks – Case studies of agri-environmental measures adoption by farmers, in
Proceedings of: Fifth International Conference on Social Science Methodology, 1-16.
Dosi, G. (1991), The research on innovation diffusion: An assessment, in Nakicenovic and Grübler
(eds), Diffusion of technologies and social behavior, Springer, Berlin, 179-208.
EIA (2011), Annual Energy Outlook 2011 with Projections to 2035, U.S. Energy Information
Administration (EIA), Washington.
Farrell, J. and Saloner, G. (1985), Standardization, compatibility, and innovation, RAND Journal of
Economics, 16, 70-83.
Fisher, J.C. and Pry, R.H. (1971), A simple substitution model of technological change, Technological
Forecasting and Social Change, 3, 75-88.
46
Fourt, L.A. and Woodlock, J.W. (1960), Early prediction of market success for new grocery products,
Journal of Marketing, 25, 31-38.
Frost and Sullivan (2011), Growth Outlook for Hybrid and Electric MCVs-HCVs on Both Sides of the
Atlantic, Webinar 26 July 2011, www.automotiveworld.com.
Gorenc, L.J. (2006), Disc Versus Drum Brakes, Army Logistician (Professional Bulletin of United States
Army Logistics), 38 (5), 40-41.
Griliches, Z. (1957), Hybrid corn: An exploration in the economics of technological change,
Econometrica, 25, 501-522.
Hahn, M., Park, S., Krishnamurthi, L. and Zoltners, A. (1994), Analysis of new-product diffusion using a
four-segment trial-repeat model, Marketing Science, 13, 224-247.
Katz, E., Levin, M. and Hamilton, H. (1963) Traditions of research on the diffusion of innovation,
American Sociological Review, 28(2), 237-253.
Kahn, K.B. (2006), New product forecasting – An applied approach, M.E. Sharpe, New York.
Kotler, P. and Keller, K.L. (2006), Marketing Management, 12th edition, Pearson Prentice Hall, New
Jersey.
Lilien, G.L. and Rangaswamy, A. (2003), Marketing Engineering, 2nd edition, Prentice Hall, New
Jersey.
Mahajan, V. and Muller, E. (1979), Innovation diffusion and new product growth models in
marketing, Journal of Marketing, 43, 55-68.
Mahajan, V., Muller, E. and Bass, F.M. (1990), New product diffusion models in marketing: A review
and directions for future research, Journal of Marketing, 54, 1-26.
Mahajan, V., Muller, E. and Bass, F.M (1993), New product diffusion models, in J. Eliashberg and G.L.
Lilien (eds.), Handbooks in operations research and management science, Elsevier Science Publishers,
New York, 349-408.
Mahajan, V., Muller, E. and Wind, Y. (2000), New-product diffusion models, Kluwer Academic
Publishers, Dordrecht.
Mahajan, V. and Peterson, R. (1985), Models for innovation diffusion, Sage, Beverly Hills.
Mansfield, E. (1961), Technical change and the rate of imitation, Econometrica, 29,741-766.
Mansfield, E. (1963), The speed of response of firms to new technologies, Quarterly Journal of
Economics, 77, 290-311.
McManus, W. and Senter, R. Jr. (2009), Market models for predicting PHEV adoption and diffusion – A
report for the U.S. Department of Energy, Automotive Analysis Division, University of Michigan
Transportation Research Institute, Ann Arbor, Michigan.

47
Mohr, J., Sengupta, S. and Slater, S. (2010), Marketing of high-technology products and innovations,
3rd edition, Pearson, New Jersey.
Muraleedharakurup, G., McGordon, A., Poxon, J. and Jennings, P. (2010), Building a better business
case: the use of non-linear growth models for predicting the market for hybrid vehicles in the UK,
Proceedings of the Fifth International Conference and Exhibition on Ecological Vehicles and
Renewable Energies, Monaco 2010.
Murphy, M. (2011), The electric and hybrid commercial vehicles report, 3rd edition, Automotive
World Ltd.
National Academy of Sciences (NAS) 2010, Technologies and Approaches to Reducing the Fuel
Consumption of Medium- and Heavy-Duty Vehicles, Committee to Assess Fuel Economy Technologies
for Medium- and Heavy-Duty Vehicles, National Research Council, Transportation Research Board,
The National Academic Press, Washington.
Nelson, R. and Winter, S.G. (1982), An evolutionary theory of economic change, Harvard University
Press, Harvard.
Norton, J.A. and Bass, F.M. (1992), Evolution of technological generations: The law of capture, Sloan
Management Review, 33, 66-77.
Park, S.Y., Kim, J.W. and Lee, D.H. (2011), Development of a market penetration forecasting model
for hydrogen fuel cell vehicles considering infrastructure and cost reduction effects, Energy Policy,
39, 3307-3315.
Peres, R., Muller, E. and Mahajan, V. (2010), Innovation diffusion and new product growth models: A
critical review and research directions, International Journal of Research in Marketing, 27, 91–106.
Reinganum, J.F. (1981), On the diffusion of new technology – a game theoretic approach, Review of
Economic Studies, 48, 395-405.
Roback, K. (2006), Medical device innovation: The integrated processes of invention, diffusion and
deployment, Ph.D. Thesis, Department of Health and Society, Linköping University.
Roberts, J. and Lattin, J. (2000), Disaggregate-level diffusion models, in Wind, Mahajan, and Muller
(eds), New-product diffusion models, Kluver, Boston, 207-236.
Rogers, E.M. (2003) Diffusion of innovations, 5th edition, Free press, New York.
Rogers, E.M., Medina, U., Rivera, M. and Wiley, C. (2005), Complex adaptive systems and the
diffusion of innovations, The Innovation Journal: The Public Sector Innovation Journal, 10 (3), 1-26.
Ruiz-Conde, M. (2004), Modeling innovation diffusion patterns, Ph.D. Thesis, Faculty of Economics
and Business, University of Groningen.
Ryan B. and Gross N.C. (1943), The diffusion of hybrid seed corn in two Iowa communities, Rural
Sociology, 8, 15-24.

48
Shankar, V., Carpenter, G.S. and Krishnamurthi, L. (1998), Late mover advantage: How innovative late
entrants outsell pioneers, Journal of Marketing Research, 35, 54-70.
Sultan, F., Farley, J.U and Lehmann, D.R. (1990), A meta-analysis of applications of diffusion models,
Journal of Marketing Research, 27 (1), 70-77.
Tarde, G. (1903), The laws of imitation, Holt, Rinehart and Winston Inc, New York.
Tata Strategic Management Group (TSMG) (2008), Will the MHCV Tyre Industry finally go radial?,
Downloaded from www.tsmg.com.
Thomas, R.J. (1985), Estimating Market Growth for New Products: An analogical diffusion model
approach, Journal of Product Innovation Management, 2, 45-55.
Tidd, J. and Bessant, J. (2009), Managing innovation – Integrating technological, market and
organizational change, 4th edition, John Wiley & Sons, West Sussex.
Tidd, J. (2010), Gaining momentum – Managing the diffusion of innovations, Imperial College Press,
London.
Timoney, E.P. and Timoney, S.S. (2003), A review of the development of independent suspension for
heavy vehicles, SAE Technical paper series, Vehicle Dynamics, Braking, Steering and Suspensions (SP–
1814).
Tuma, N. and Hannan, M. (1984), Social dynamics – Models and methods, Academic Press, New York.
Van den Bulte, C. (2000), New product diffusion acceleration – Measurement and Analysis,
Marketing Science, 19 (4), 366−380.
Van de Kaa, G., Vries, H.J., Van Heck, E. and Van den Ende, J. (2007), The emergence of standards: A
meta-analysis. In Proceedings of the 40th Hawaii international conference on system sciences, ed.
R.H. Sprague, Piscataway, IEEE.
Vries, H.J., Ruijter, J.P.M. and Argam, N. (2011), Dominant design or multiple designs: the flash
memory card case, Technology Analysis & Strategic Management, 23 (3), 249–262.
WABCO (2004), Truck ABS/EBS – Electronically controlled braking system, WABCO, American
Standard Companies Inc.
Watson, P.J. (1999), The radicalization or otherwise of heavy truck tyres, Tyre Tech '99 – Proceedings
of a two-day conference organized by European Rubber Journal and RAPRA Technology LTD, Prague,
Czech Republic, 27-28 September 1999.
Weiss, J.A. and Dale, B.C. (1998), Diffusion against mature technology – Issues and strategy, Industrial
Marketing Management, 27, 293-304.