Embed Size (px)
Citation preview

THE CONNECTED CONSUMER
WEBLOYALTY & CONLUMINO
MARCH 2015

Page 2
Introduction
The Connected Consumer Prepared for Webloyalty | March 2015
© 2015 Webloyalty & Conlumino [email protected] | 020 7290 1650
Webloyalty 2 Harewood Place, London W1S 1BX +44 (0)20 7290 1650 [email protected] www.webloyalty.co.uk
Conlumino 7 Carmelite Street, London EC4Y 0BS +44 (0)20 7936 6654 [email protected] www.conlumino.com
This research has been commissioned by Webloyalty to provide retailers with insight into the how connected consumers are shopping and reshaping the world of retail. About Webloyalty Webloyalty is a leading reward programme provider working with major online retailers to help them build stronger, more profitable relationships with their customers. Through our membership programmes we help our online retail partners’ customers save hundreds of pounds a year while providing the partner with an additional revenue stream. As well as incentivising customers to make repeat purchases at the partner’s site, members can also earn cashback and get great deals on everything from fashion to electronics to travel at hundreds of top online stores. Webloyalty was established in the UK in 2007 and has since expanded into France, Spain, Ireland, Brazil, the Netherlands and Turkey. About Conlumino Conlumino is a retail research agency and consulting firm. Our work focuses on all aspects of retailing and consumer behaviour, which we deliver through bespoke reports, projects and presentations. We work with many of the world’s leading retailers, property firms and those in the financial sector to help them maximize success through developing a thorough understanding of the sector and its likely future performance.
Foreword
Page 3
Introduction
The Connected Consumer Prepared for Webloyalty | March 2015
© 2015 Webloyalty & Conlumino [email protected] | 020 7290 1650
Summary
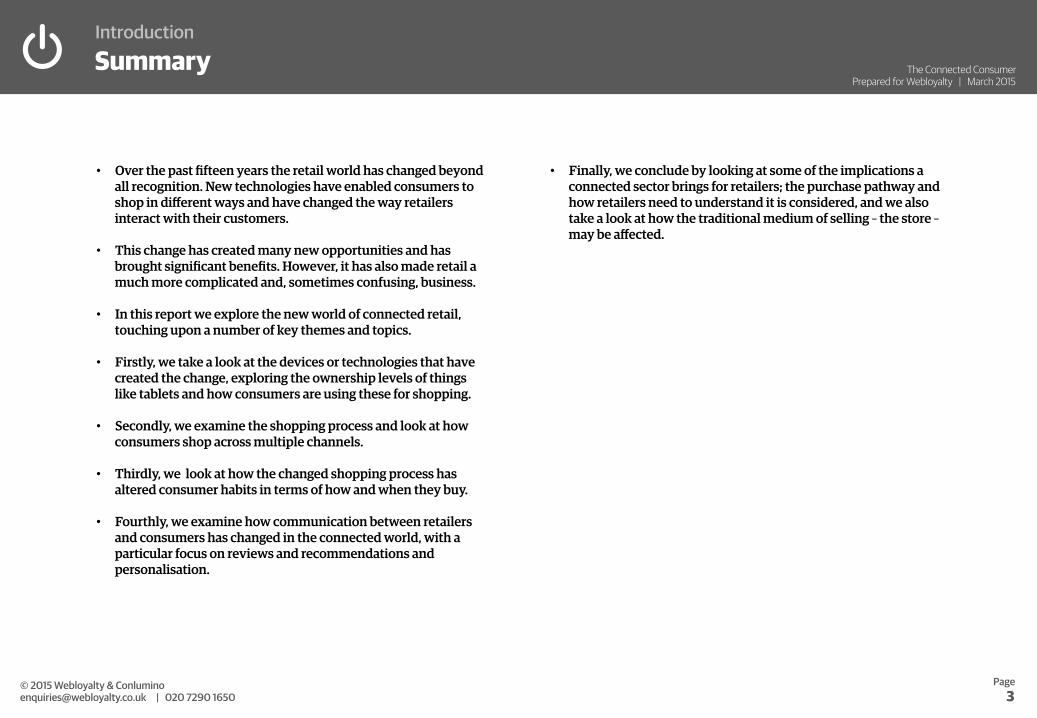
• Over the past fifteen years the retail world has changed beyond all recognition. New technologies have enabled consumers to shop in different ways and have changed the way retailers interact with their customers.
• This change has created many new opportunities and has brought significant benefits. However, it has also made retail a much more complicated and, sometimes confusing, business.
• In this report we explore the new world of connected retail, touching upon a number of key themes and topics.
• Firstly, we take a look at the devices or technologies that have created the change, exploring the ownership levels of things like tablets and how consumers are using these for shopping.
• Secondly, we examine the shopping process and look at how consumers shop across multiple channels.
• Thirdly, we look at how the changed shopping process has altered consumer habits in terms of how and when they buy.
• Fourthly, we examine how communication between retailers and consumers has changed in the connected world, with a particular focus on reviews and recommendations and personalisation.
• Finally, we conclude by looking at some of the implications a connected sector brings for retailers; the purchase pathway and how retailers need to understand it is considered, and we also take a look at how the traditional medium of selling – the store – may be affected.
The connected consumer The devices we own and how we use them

The connected consumer
Page 5
The Connected Consumer Prepared for Webloyalty | March 2015
© 2015 Webloyalty & Conlumino [email protected] | 020 7290 1650
Summary
• With the vast majority of people owning at least one device that can access the internet, today’s consumer is truly connected. Although, in the scheme of things smartphones, tablets and e-readers are all relatively new inventions, they are things that consumers have rapidly adopted and integrated into their lives.
• This integration is evidenced by the fact that we collectively
spend a huge proportion of our time using our devices to access the internet – some 60 days a year on average.
• It is interesting, however, that while gadgets do absorb a lot of our time they have also allowed us to be more effective at undertaking tasks like shopping. The portability of devices like tablets allows us to do tasks, like grocery shopping, while travelling or waiting around – time that may otherwise be underutilised.
• The rise of tablets as a shopping device is evidenced by the fact that 74% of tablet owners use the devices regularly to browse or buy products. Moreover, in terms of the time spent shopping – tablets are the most heavily used device, with those shopping via them spending an average of 72 minutes per day on the devices.

The connected consumer
Page 6
The Connected Consumer Prepared for Webloyalty | March 2015
© 2015 Webloyalty & Conlumino [email protected] | 020 7290 1650
The devices people own
What devices people own Percentage owning each device
98.8% of people own at least one connected device
Laptop 68.5%
Smartphone 61.6%
Desktop 55.6%
Tablet 45.2%
E-reader 26.9%
Smart TV 19.8%
Games console 18.6%
• The vast majority of people now own at least one connected device. While laptops are the most popular device, well over half has a smartphone and almost half has a tablet.
• E-readers are relatively less popular but ownership has grown strongly over the past five years to just shy of 27% (up from 12.6% five years ago).

The connected consumer
Page 7
The Connected Consumer Prepared for Webloyalty | March 2015
© 2015 Webloyalty & Conlumino [email protected] | 020 7290 1650
Value of connected devices
Value of all connected devices owned by an average UK household
The value of connected devices owned by an average UK household has grown by 108% in 10 years
• The average UK household owns £1,375 worth of connected devices such as smartphones, tablets, laptops, desktops, etc. This figure excludes devices which belong to businesses.
• This figure has risen by 108% over the past ten years. Not only does this show the extent of our spending on connected devices, it also underlines the fact that they are now an important household asset.
• The total value of connected devices owned by all UK households is £33.4bn.
2004 2009 2014
£661 £928
£1,375
The connected consumer
Page 8
The Connected Consumer Prepared for Webloyalty | March 2015
© 2015 Webloyalty & Conlumino [email protected] | 020 7290 1650
Length of time online
Amount of time people spend online via each of the devices
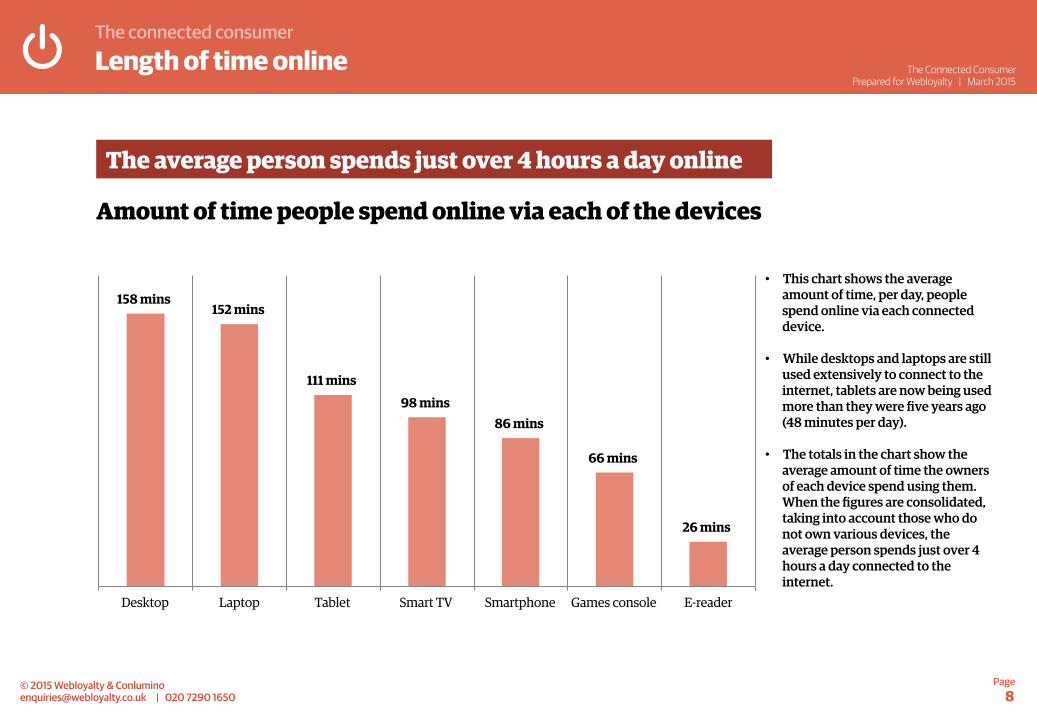
The average person spends just over 4 hours a day online
158 mins 152 mins
111 mins 98 mins
86 mins
66 mins
26 mins
Desktop Laptop Tablet Smart TV Smartphone Games console E-reader
• This chart shows the average amount of time, per day, people spend online via each connected device.
• While desktops and laptops are still used extensively to connect to the internet, tablets are now being used more than they were five years ago (48 minutes per day).
• The totals in the chart show the
average amount of time the owners of each device spend using them. When the figures are consolidated, taking into account those who do not own various devices, the average person spends just over 4 hours a day connected to the internet.

The connected consumer
Page 9
The Connected Consumer Prepared for Webloyalty | March 2015
© 2015 Webloyalty & Conlumino [email protected] | 020 7290 1650
Using devices for shopping
Percentage of people using each device for shopping and how much they use it Top figures are percentages using; bottom figures are number of minutes per day spent shopping
Almost three quarters use tablets for shopping
Laptop Tablet Desktop Smartphone Smart TV Games console E-reader
82.3% 74.1% 71.6% 42.0% 26.0% 25.1% 23.4% 61 mins 72 mins 56 mins 55 mins 66 mins 65 mins 43 mins
• The rise of tablets as a shopping device is evidenced by the fact that 74% of tablet owners use the devices regularly to browse or buy products. Moreover, in terms of the time spent shopping – tablets are the most heavily used device with those shopping via them spending an average of 72 minutes per day on the devices.
• When the results are consolidated the average person regularly uses just over 3 devices to shop.

The connected shopping process How the connected consumer shops

Connected shopping process
Page 11
© 2015 Webloyalty & Conlumino [email protected] | 020 7290 1650
The Connected Consumer Prepared for Webloyalty | March 2015
Summary
• At every stage of the shopping process (browsing, gathering ideas, checking product details and prices, and buying products), visiting online shops via a PC or laptop is the most popular approach among consumers with online access. When it comes to actually buying products, visiting online shops via a desktop PC or laptop is used by some 87% of consumers surveyed, compared to 78% visiting physical shops.
• This reflects how retailers have improved their online offers, both in terms of website capability, range depth, product presentation, and fulfilment capability, leading to increased consumer confidence for purchasing online, even for items that may need to be returned or exchanged, such as items of clothing or footwear, and for categories that have typically had lower online penetration, such as health and beauty.
• When browsing just for fun, consumers still spend the longest amount of time visiting physical shops (42.6 minutes). This indicates the importance for retailers to still have a physical presence, with elements of in-store theatre, technology, and good service likely to drive footfall and increase dwell time once in-store.
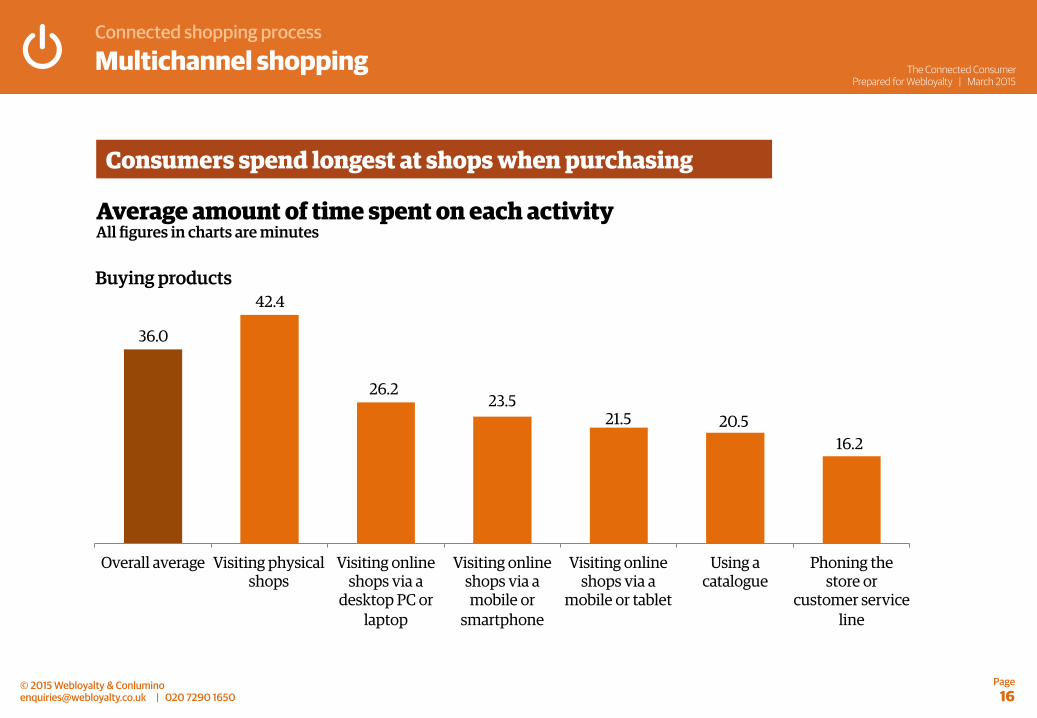
• When it come to actually buying products, consumers also still spend most time visiting physical shops (42.4 minutes), compared to some 26.2 minutes visiting online shops via a desktop PC or laptop, and 23.5 minutes visiting online shops via a mobile or smartphone. This can be interpreted in two ways; on one hand, despite improved online offers and more seamless multichannel propositions, consumers do still make a majority of purchases in-store. However, it also indicates that buying products via physical shops is time consuming and inefficient, hence average time taken is significantly higher. Consumers spend less time purchasing online as the entire process is more efficient, with no time wasted queuing or browsing large stores.
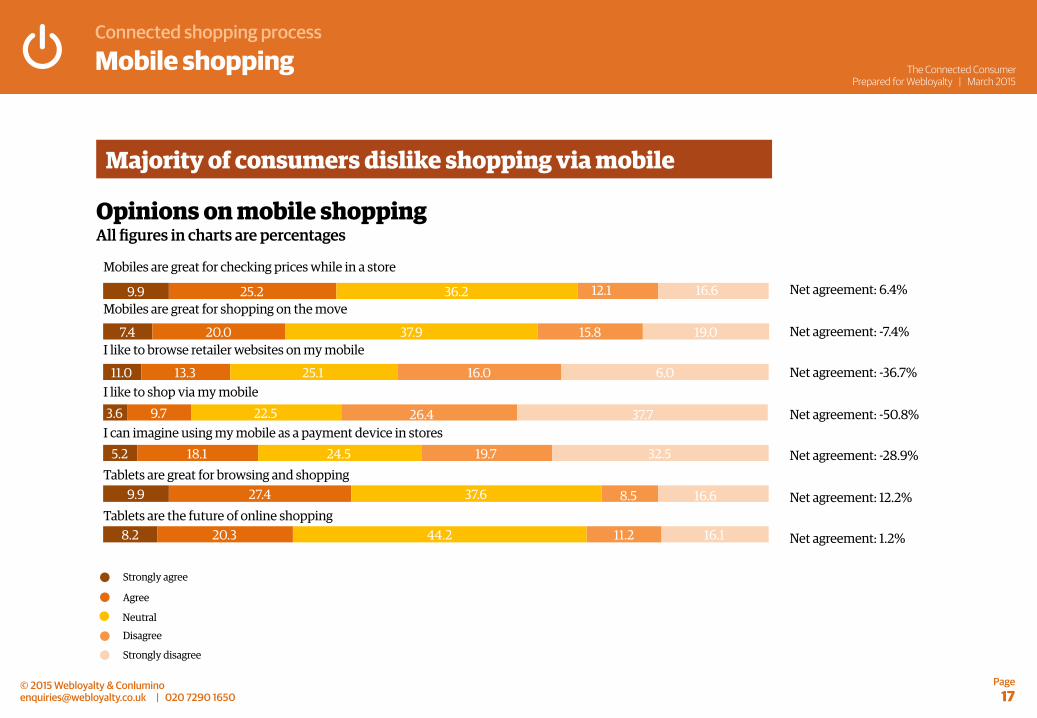
• 64.1 % of mobile shoppers disagree with the statement ‘I like to shop via my mobile’. Despite retailers working hard to offer user-friendly, mobile-optimised websites, consumers prefer to shop via other devices or channels and the majority of online spend is still made via either desktop PCs or laptops. 27% of consumers surveyed stated they almost always used a desktop PC for internet shopping purposes, rising to some 32% for laptop users. This is in stark contrast to purchase via a smartphone or tablet – 53% of consumers stated they never use their smartphones for internet shopping purposes, rising to 64% for tablets.
• Spend via mobiles is also still relatively low. Even among those using a tablet to shop, it makes up just 28.8% of their online spending. Among those using a mobile to shop it on average accounts for only 21% of their online spending. In both cases the majority of spend still goes through more traditional online channels such as PCs and laptops.
• However, mobile shoppers are more favourable about using mobiles as a part of the shopping journey rather than for purchase alone. For example, 35% of mobile shoppers agreed that mobiles are great for checking prices while in a store. Consumers are also more favourable about tablets, with 37% of tablet shoppers agreeing that they are great for browsing and shopping. These devices are often more conducive to shopping online, with larger screens aiding web browsing.
• The most successful retailers will be those which embrace this trend, offering mobile services, but empowering the final step of the journey (purchasing) to take place elsewhere. Argos, for example, offers free Wi-Fi in-store, recognising that consumers are increasingly going online whilst in-store to compare prices and look at product reviews before buying at the counter.

Connected shopping process
Page 12
© 2015 Webloyalty & Conlumino [email protected] | 020 7290 1650
The Connected Consumer Prepared for Webloyalty | March 2015
Methods used for shopping
Methods used whilst shopping All figures in charts are percentages
Shops and traditional online dominate purchasing
64.7
79.5
14.6 14.2 27.1
1.5
57.5
84.3
13.7 13.7 29.0
1.1
Browsing just for fun Gathering ideas about what to buy
Visiting physical shops
Visiting online shops via a mobile or smartphone
Visiting online shops via a mobile or tablet
Using a catalogue Visiting online shops via a desktop PC or laptop
Phoning the store or customer service line
�
�
�
�
�
�
45.9
88.1
14.1 13.9 21.5
2.1
78.3 87.0
11.1 13.1 13.1
1.9
Buying products Checking product details and prices

Connected shopping process
Page 13
© 2015 Webloyalty & Conlumino [email protected] | 020 7290 1650
The Connected Consumer Prepared for Webloyalty | March 2015
Multichannel shopping
Average amount of time spent on each activity All figures in charts are minutes
Consumers spend most time at shops when browsing
35.4
42.6
36.4
25.7 23.4
19.1
9.1
Overall average Visiting physical shops
Visiting online shops via a
desktop PC or laptop
Visiting online shops via a
mobile or tablet
Visiting online shops via a mobile or
smartphone
Using a catalogue
Phoning the store or
customer service line
Browsing just for fun
Connected shopping process
Page 14
© 2015 Webloyalty & Conlumino [email protected] | 020 7290 1650
The Connected Consumer Prepared for Webloyalty | March 2015
Multichannel shopping
Average amount of time spent on each activity All figures in charts are minutes
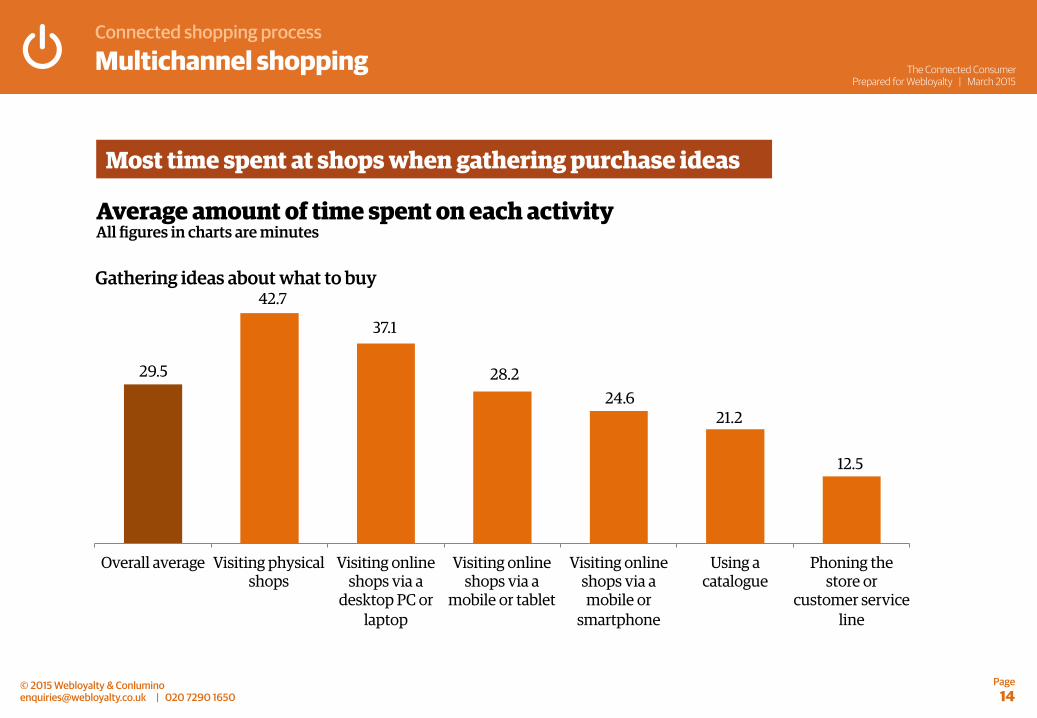
Most time spent at shops when gathering purchase ideas
29.5
42.7
37.1
28.2 24.6
21.2
12.5
Overall average Visiting physical shops
Visiting online shops via a
desktop PC or laptop
Visiting online shops via a
mobile or tablet
Visiting online shops via a mobile or
smartphone
Using a catalogue
Phoning the store or
customer service line
Gathering ideas about what to buy

Connected shopping process
Page 15
© 2015 Webloyalty & Conlumino [email protected] | 020 7290 1650
The Connected Consumer Prepared for Webloyalty | March 2015
Multichannel shopping
Average amount of time spent on each activity All figures in charts are minutes
Similar time spent at shops and online checking details
33.4 31.5 30.3
23.8 21.2
17.9 13.8
Overall average Visiting physical shops
Visiting online shops via a
desktop PC or laptop
Visiting online shops via a
mobile or tablet
Visiting online shops via a mobile or
smartphone
Using a catalogue
Phoning the store or
customer service line
Checking product details and prices
Connected shopping process
Page 16
© 2015 Webloyalty & Conlumino [email protected] | 020 7290 1650
The Connected Consumer Prepared for Webloyalty | March 2015
Multichannel shopping
Average amount of time spent on each activity All figures in charts are minutes
Consumers spend longest at shops when purchasing
36.0
42.4
26.2 23.5
21.5 20.5 16.2
Overall average Visiting physical shops
Visiting online shops via a
desktop PC or laptop
Visiting online shops via a mobile or
smartphone
Visiting online shops via a
mobile or tablet
Using a catalogue
Phoning the store or
customer service line
Buying products
Connected shopping process
Page 17
© 2015 Webloyalty & Conlumino [email protected] | 020 7290 1650
The Connected Consumer Prepared for Webloyalty | March 2015
Mobile shopping
Opinions on mobile shopping All figures in charts are percentages
Majority of consumers dislike shopping via mobile
Strongly agree
Neutral
Disagree
Strongly disagree
Net agreement: 6.4%
Net agreement: -7.4%
Net agreement: -36.7%
Net agreement: -50.8%
Net agreement: -28.9%
Net agreement: 12.2%
8.2
9.9
5.2
3.6
11.0
7.4
9.9
20.3
27.4
18.1
9.7
13.3
20.0
25.2
44.2
37.6
24.5
22.5
25.1
37.9
36.2
11.2
8.5
19.7
26.4
16.0
15.8
12.1
16.1
16.6
32.5
37.7
6.0
19.0
16.6
Agree
Mobiles are great for checking prices while in a store
Mobiles are great for shopping on the move
Tablets are the future of online shopping
Tablets are great for browsing and shopping
I can imagine using my mobile as a payment device in stores
I like to browse retailer websites on my mobile
I like to shop via my mobile
Net agreement: 1.2%
� � � � �

Connected shopping process
Page 18
© 2015 Webloyalty & Conlumino [email protected] | 020 7290 1650
The Connected Consumer Prepared for Webloyalty | March 2015
Mobile shopping
Proportion of online spend made via a mobile device All figures in pie charts are percentages
Tablet shoppers spend more through their devices
74.3
17.8
3.4 � 1-25% of spend
� 26-50% of spend
� 51-75% of spend
� 76-100% of spend
56.7 22.9
9.6
10.8
Smartphone Tablet
Average = 21.0% of spend Average = 28.8% of spend

Connected consumer habits How connected retail has changed habits

Connected consumer habits
Page 20
The Connected Consumer Prepared for Webloyalty | March 2015
© 2015 Webloyalty & Conlumino [email protected] | 020 7290 1650
Summary
• Online shopping has allowed consumers to shop smart – to browse more than they would in real stores, and to visit more retailers than they would on a physical high street. Indeed, if the amount of browsing done online was translated into a physical shopping trip, we estimate that consumers would work have to walk over 6.8 miles per week to visit the equivalent number of shops. Aggregated up to all shoppers, this comes out at a huge 198 miles per week.
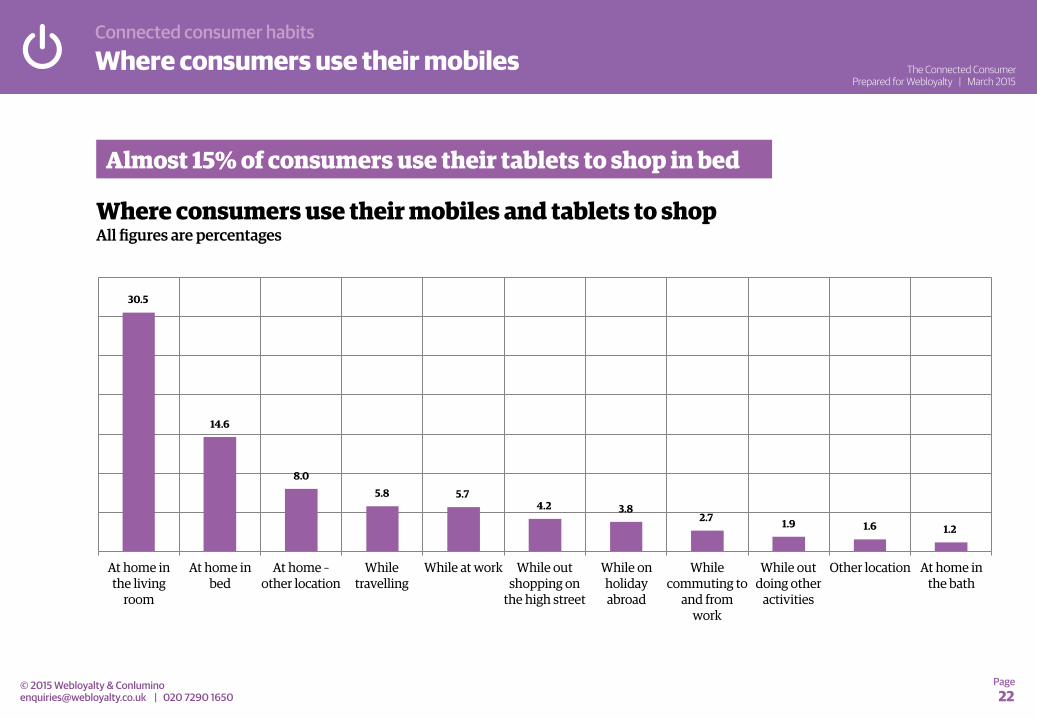
• Mobile has also enabled consumers to break free of location in terms of where they shop; they are no longer confined to stores and desktop computers. Around a third of us now shop in our living room, probably whilst watching television. Some 15% of us shop at home whilst in bed, and a smaller 2.7% shop whilst commuting to and from work.
• Part of shopping smarter means that we are using far more channels and tools across the shopping process as a whole. Indeed, the average consumer now uses just under 5 channels or tools when shopping.

Connected consumer habits
Page 21
The Connected Consumer Prepared for Webloyalty | March 2015
© 2015 Webloyalty & Conlumino [email protected] | 020 7290 1650
Shopping online
Key metrics for online shopping All figures are per week
Consumers spend 225 minutes per week shopping online
Amount of time spent browsing per week
225 minutes
Number of retail websites visited per week
16.4 sites
Digital miles – equivalent distance a physical trip would take
6.8 miles
Total digital distance for all online shoppers
198.2m miles
• On average, online consumers spend some 225 minutes per week shopping online. Across the course of a year, this adds to around 8 days spend shopping online. The average consumer visits around 16 retail websites per week, even if just to browse.
• If the shopping habits online are translated into a physical shopping trip, we estimate that consumers would work have to walk over 6.8 miles per week to visit the equivalent number of shops. Aggregated up to all shoppers, this comes out at a huge 198.2 miles per week.
Connected consumer habits
Page 22
The Connected Consumer Prepared for Webloyalty | March 2015
© 2015 Webloyalty & Conlumino [email protected] | 020 7290 1650
Where consumers use their mobiles
Where consumers use their mobiles and tablets to shop All figures are percentages
Almost 15% of consumers use their tablets to shop in bed
30.5
14.6
8.0 5.8 5.7
4.2 3.8 2.7 1.9 1.6 1.2
At home in the living
room
At home in bed
At home – other location
While travelling
While at work While out shopping on
the high street
While on holiday abroad
While commuting to
and from work
While out doing other
activities
Other location At home in the bath
Connected consumer habits
Page 23
The Connected Consumer Prepared for Webloyalty | March 2015
© 2015 Webloyalty & Conlumino [email protected] | 020 7290 1650
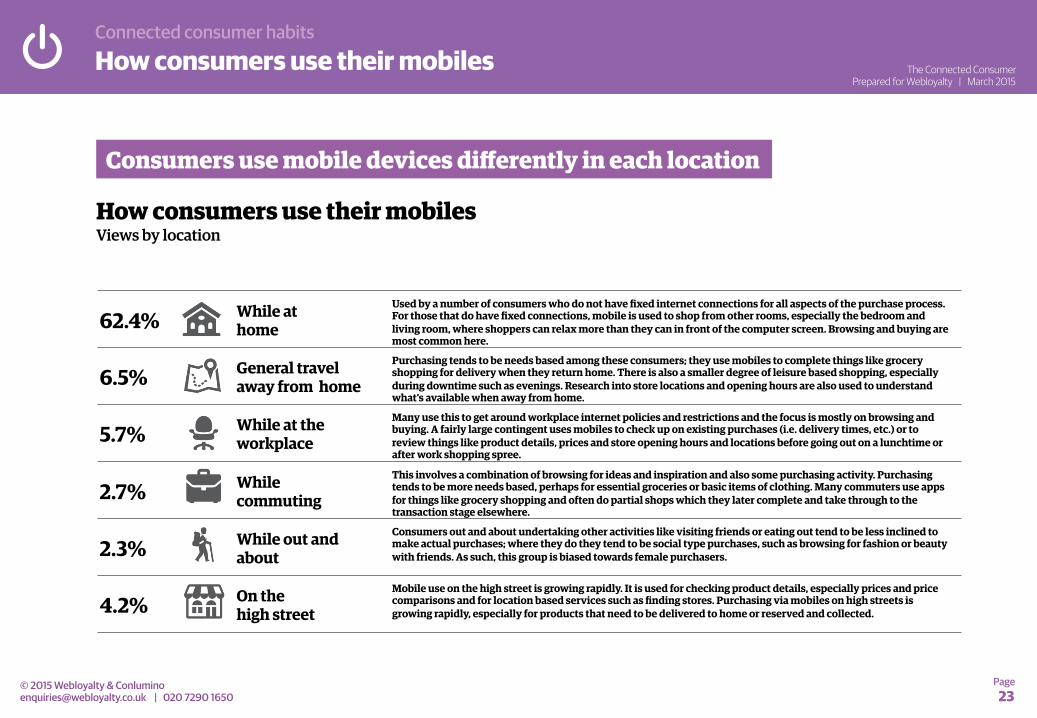
How consumers use their mobiles
How consumers use their mobiles Views by location
Consumers use mobile devices differently in each location
While at home
General travel away from home
While at the workplace
While commuting
While out and about
On the high street
Used by a number of consumers who do not have fixed internet connections for all aspects of the purchase process. For those that do have fixed connections, mobile is used to shop from other rooms, especially the bedroom and living room, where shoppers can relax more than they can in front of the computer screen. Browsing and buying are most common here.
Purchasing tends to be needs based among these consumers; they use mobiles to complete things like grocery shopping for delivery when they return home. There is also a smaller degree of leisure based shopping, especially during downtime such as evenings. Research into store locations and opening hours are also used to understand what’s available when away from home.
Many use this to get around workplace internet policies and restrictions and the focus is mostly on browsing and buying. A fairly large contingent uses mobiles to check up on existing purchases (i.e. delivery times, etc.) or to review things like product details, prices and store opening hours and locations before going out on a lunchtime or after work shopping spree.
This involves a combination of browsing for ideas and inspiration and also some purchasing activity. Purchasing tends to be more needs based, perhaps for essential groceries or basic items of clothing. Many commuters use apps for things like grocery shopping and often do partial shops which they later complete and take through to the transaction stage elsewhere.
Consumers out and about undertaking other activities like visiting friends or eating out tend to be less inclined to make actual purchases; where they do they tend to be social type purchases, such as browsing for fashion or beauty with friends. As such, this group is biased towards female purchasers.
Mobile use on the high street is growing rapidly. It is used for checking product details, especially prices and price comparisons and for location based services such as finding stores. Purchasing via mobiles on high streets is growing rapidly, especially for products that need to be delivered to home or reserved and collected.
62.4%
6.5%
5.7%
2.7%
2.3%
4.2%

Connected consumer habits
Page 24
The Connected Consumer Prepared for Webloyalty | March 2015
© 2015 Webloyalty & Conlumino [email protected] | 020 7290 1650
Tools and channels consumers use
The tools and channels consumers use to shop All figures are percentages
On average, consumers use 4.9 channels or tools to shop
Looking for inspiration and ideas in choosing products
Generally browsing products
Checking specific details of products
Comparing the prices of products across different retailers
Checking the stock of products and/or reserving items
Retail websites 57.0 60.7 61.4 40.5 62.8
Product review websites 26.1 19.1 16.6 11.3 3.5
Physical retail catalogues 22.6 20.5 12.0 5.9 2.1
Price comparison websites 20.9 18.9 8.6 44.6 4.8
Recommendations from friends and 18.8 8.5 2.8 3.1 1.4
Other websites 13.2 15.7 10.0 10.7 5.8
Physical magazines 11.3 10.3 3.4 2.9 0.7
Digital retail catalogues 11.2 10.0 7.3 3.6 3.8
Advertising in newspapers 8.0 5.7 1.4 1.8 0.6
Online advertising 6.0 4.5 2.1 1.8 1.2
Social media sites 4.0 2.9 1.2 1.2 1.1
Other 2.2 3.2 3.1 2.0 2.3
Digital magazines 2.1 2.3 1.4 1.0 0.6
Average number of channels/tools used 3.2 3.4 1.8 1.6 1.1
Table shows the percentage of consumers using various tools and channels for different stages of the shopping process.
Overall average:
4.9

Interaction and personalisation How connected consumers engage
Interaction and personalisation
Page 26
The Connected Consumer Prepared for Webloyalty | March 2015
© 2015 Webloyalty & Conlumino [email protected] | 020 7290 1650
Summary
• As well as changing the way in which people shop, a more connected retail world has changed the power balance between retailers and consumers.
• One of the main ways in which it has done this is by empowering consumers who can now actively review products they have bought or the service they have received. As this feedback is usually public, being left on retailers’ websites or on social media, it is picked up by other consumers who are researching future purchases.
• Some 31% of consumers regularly leave reviews or give feedback, with an average of 2.3 reviews written each year. Interestingly the majority of these, 56.7%, are positive, with just over a third being negative.
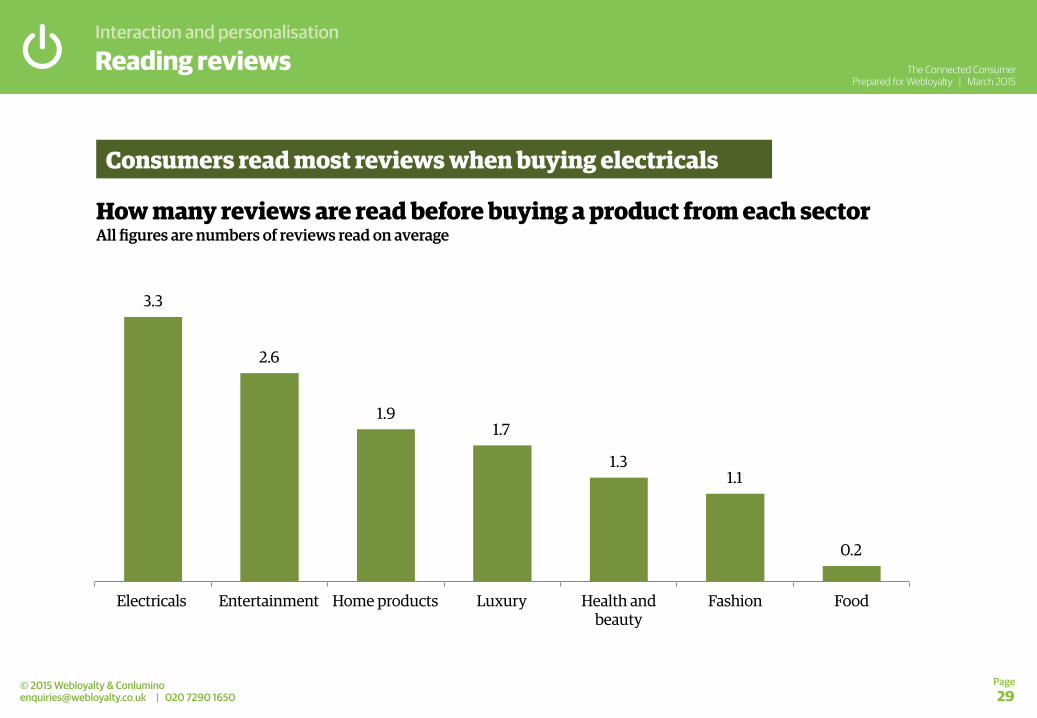
• Although for some sectors, like food, reviews are not that important to consumers when buying, for others, like electricals, reviews play a critical part in the purchase process. The average buyer of electricals reads just over 3 reviews before purchasing a product.
• Reviews are not the only way in which a more connected sector has changed consumer and retailer interaction. Using data gathered from online and mobile has allowed retailers to personalise communications and offers to shoppers. This may take the form of an email that is tailored to take account of what a particular consumer buys or it could be a discount that is focused on a product the retailer knows the shopper will like.
• Personalisation is important to retail as it can improve loyalty and stimulate spending. Some 56% of consumers say that if a retailer gave them a good personalised experience they would make an effort to use their site more. If this number is worked through it could, ultimately, deliver a 7.8% uplift in sales for an average sized retailer with a turnover of £850m (which would be around the scale of Wickes or Mothercare). In monetary terms this translates to a £66m uplift in sales across the course of a year. Obviously for larger retailers the uplift may be significantly more.
• Looking ahead, when it comes to improving the shopping experience, over 50% of consumers agree that connected technology will help to tailor the process still further; just under a third think it will make shopping more personal. Larger numbers still, 70% and 64% respectively, think it will make shopping more convenient and more efficient.
Interaction and personalisation
Page 27
The Connected Consumer Prepared for Webloyalty | March 2015
© 2015 Webloyalty & Conlumino [email protected] | 020 7290 1650
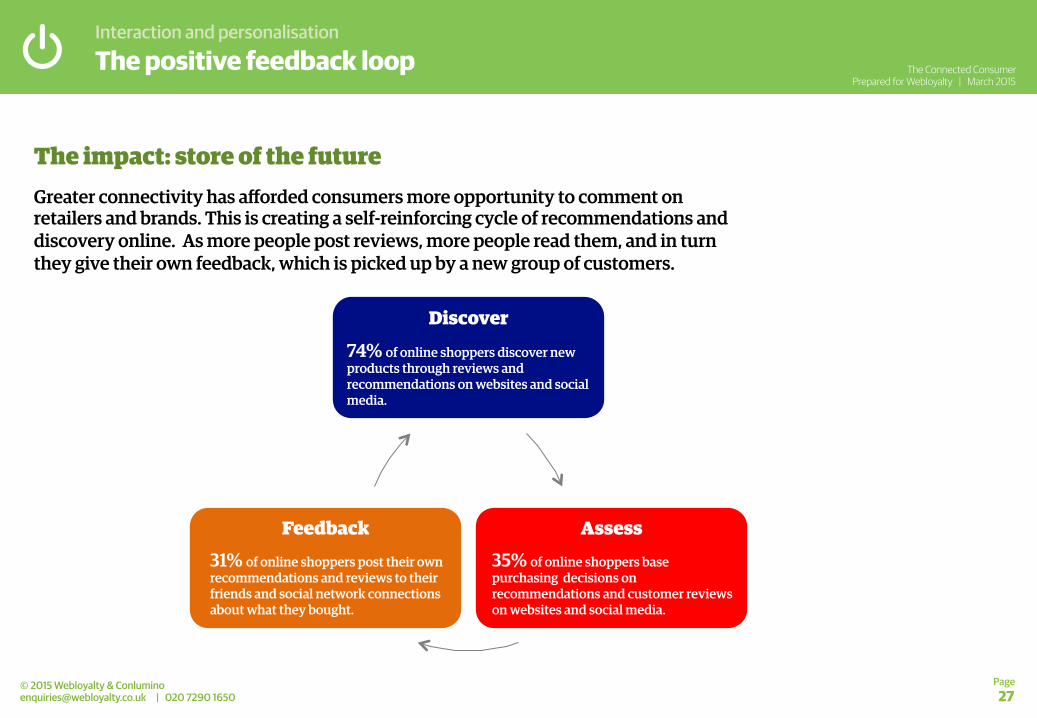
The positive feedback loop
Discover
Assess Feedback
74% of online shoppers discover new products through reviews and recommendations on websites and social media.
35% of online shoppers base purchasing decisions on recommendations and customer reviews on websites and social media.
31% of online shoppers post their own recommendations and reviews to their friends and social network connections about what they bought.
The impact: store of the future Greater connectivity has afforded consumers more opportunity to comment on retailers and brands. This is creating a self-reinforcing cycle of recommendations and discovery online. As more people post reviews, more people read them, and in turn they give their own feedback, which is picked up by a new group of customers.

Interaction and personalisation
Page 28
The Connected Consumer Prepared for Webloyalty | March 2015
© 2015 Webloyalty & Conlumino [email protected] | 020 7290 1650
The number of reviews people write and the tone of the review
Reviewers tend to be positive in what they write
Writing reviews
Number of online reviews a connected consumer writes in a year:
2.3
Reviews that are positive
56.7%
Reviews that are neutral
1.9%
Reviews that are negative
34.8%
Reviews that are mixed
6.6%
Interaction and personalisation
Page 29
The Connected Consumer Prepared for Webloyalty | March 2015
© 2015 Webloyalty & Conlumino [email protected] | 020 7290 1650
How many reviews are read before buying a product from each sector All figures are numbers of reviews read on average
Consumers read most reviews when buying electricals
Reading reviews
3.3
2.6
1.9 1.7
1.3 1.1
0.2
Electricals Entertainment Home products Luxury Health and beauty
Fashion Food
Interaction and personalisation
Page 30
The Connected Consumer Prepared for Webloyalty | March 2015
© 2015 Webloyalty & Conlumino [email protected] | 020 7290 1650
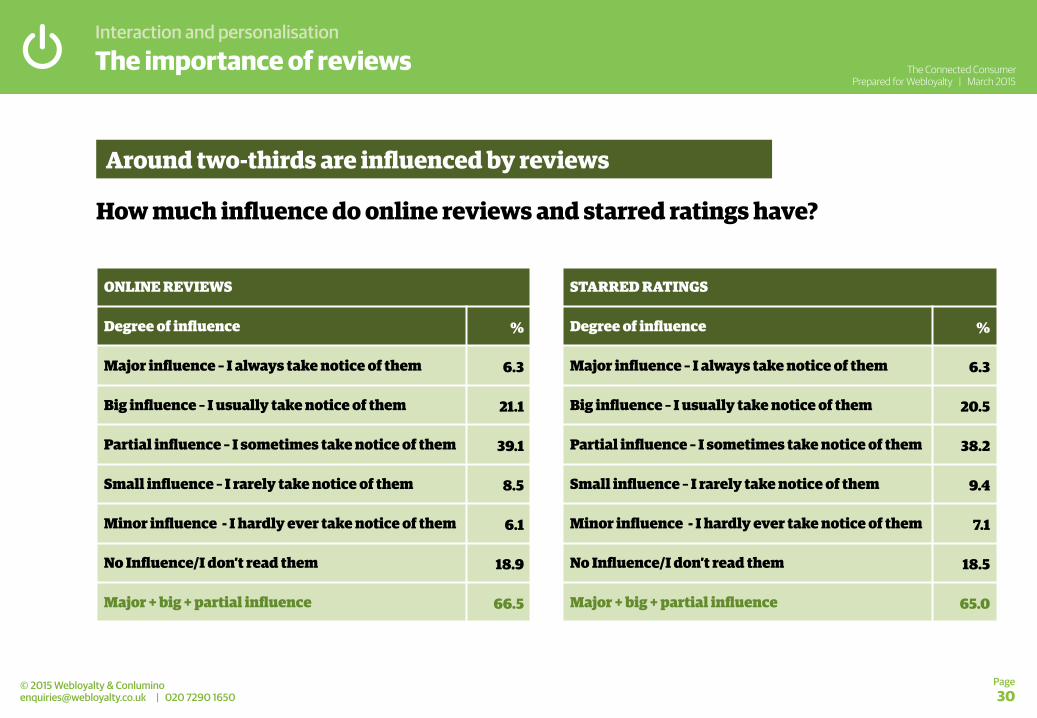
How much influence do online reviews and starred ratings have?
Around two-thirds are influenced by reviews
The importance of reviews
ONLINE REVIEWS
Degree of influence %
Major influence – I always take notice of them 6.3
Big influence – I usually take notice of them 21.1
Partial influence – I sometimes take notice of them 39.1
Small influence – I rarely take notice of them 8.5
Minor influence - I hardly ever take notice of them 6.1
No Influence/I don’t read them 18.9
Major + big + partial influence 66.5
STARRED RATINGS
Degree of influence %
Major influence – I always take notice of them 6.3
Big influence – I usually take notice of them 20.5
Partial influence – I sometimes take notice of them 38.2
Small influence – I rarely take notice of them 9.4
Minor influence - I hardly ever take notice of them 7.1
No Influence/I don’t read them 18.5
Major + big + partial influence 65.0
Interaction and personalisation
Page 31
The Connected Consumer Prepared for Webloyalty | March 2015
© 2015 Webloyalty & Conlumino [email protected] | 020 7290 1650
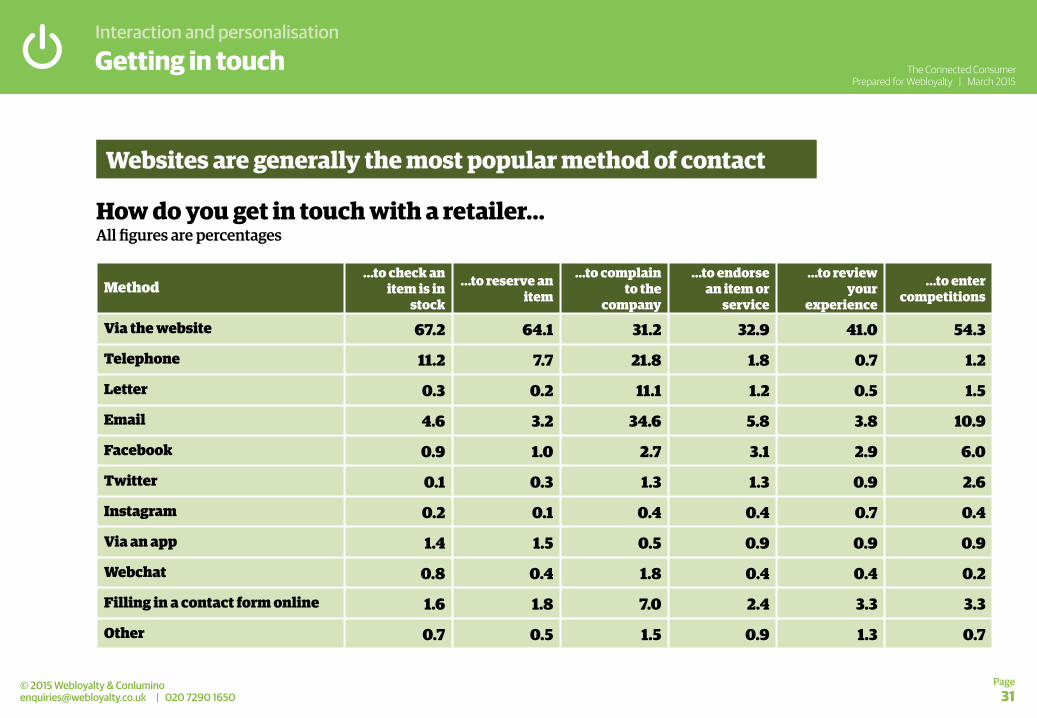
How do you get in touch with a retailer… All figures are percentages
Websites are generally the most popular method of contact
Getting in touch
Method …to check an
item is in stock
…to reserve an item
…to complain to the
company
…to endorse an item or
service
…to review your
experience
…to enter competitions
Via the website 67.2 64.1 31.2 32.9 41.0 54.3
Telephone 11.2 7.7 21.8 1.8 0.7 1.2
Letter 0.3 0.2 11.1 1.2 0.5 1.5
Email 4.6 3.2 34.6 5.8 3.8 10.9
Facebook 0.9 1.0 2.7 3.1 2.9 6.0
Twitter 0.1 0.3 1.3 1.3 0.9 2.6
Instagram 0.2 0.1 0.4 0.4 0.7 0.4
Via an app 1.4 1.5 0.5 0.9 0.9 0.9
Webchat 0.8 0.4 1.8 0.4 0.4 0.2
Filling in a contact form online 1.6 1.8 7.0 2.4 3.3 3.3
Other 0.7 0.5 1.5 0.9 1.3 0.7

Interaction and personalisation
Page 32
The Connected Consumer Prepared for Webloyalty | March 2015
© 2015 Webloyalty & Conlumino [email protected] | 020 7290 1650
Looking at in store and online personalisation (recommended products, in store technology, tailored deals and adverts according to your individual likes and needs). To what degree does personalisation influence your buying decision?
Personalisation has at least a partial influence on over a third of people
Personalisation
3.1% 7.3%
28.1%
21.1%
32.0%
8.3%
Major influence – I’m very likely to make a
purchase if it feels personal
Big influence – I usually take notice of personal
offers and they can influence my
purchasing decision
Partial influence – I sometimes take notice
of them and they sometimes influence a
purchase
Small influence – I rarely take notice of
them
No influence – My purchasing decision isn’t influenced by
personalisation
Negative influence – I would be put off
making a purchase by personalisation

Interaction and personalisation
Page 33
The Connected Consumer Prepared for Webloyalty | March 2015
© 2015 Webloyalty & Conlumino [email protected] | 020 7290 1650
In the past year, how aware have you been of online personalisation?
Over 45% have been at least partially aware of personalisation
Awareness of personalisation
4.1%
10.5%
30.9% 28.4%
26.2%
Very aware – I nearly always pay attention to personalised deals
Largely aware – I regularly pay attention to personalised deals
Partially aware – I have sometimes paid attention to
personalised deals
Aware – I notice personalised deals but don’t act on them
No awareness – I have never seen any personalised deals
Interaction and personalisation
Page 34
The Connected Consumer Prepared for Webloyalty | March 2015
© 2015 Webloyalty & Conlumino [email protected] | 020 7290 1650
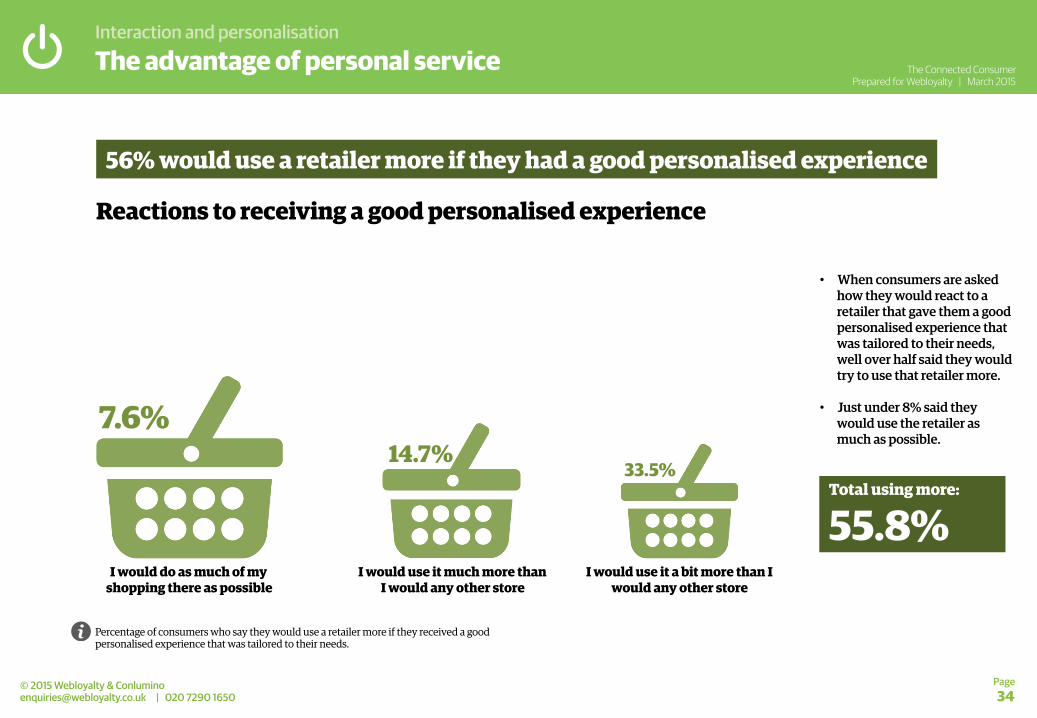
The advantage of personal service
Reactions to receiving a good personalised experience
56% would use a retailer more if they had a good personalised experience
I would do as much of my shopping there as possible
I would use it much more than I would any other store
I would use it a bit more than I would any other store
7.6% 14.7%
33.5%
Percentage of consumers who say they would use a retailer more if they received a good personalised experience that was tailored to their needs.
Total using more:
55.8%
• When consumers are asked how they would react to a retailer that gave them a good personalised experience that was tailored to their needs, well over half said they would try to use that retailer more.
• Just under 8% said they would use the retailer as much as possible.

Interaction and personalisation
Page 35
The Connected Consumer Prepared for Webloyalty | March 2015
© 2015 Webloyalty & Conlumino [email protected] | 020 7290 1650
The financial advantage of personal service
Potential uplift in sales as a result of personalisation All figures based on an ‘average’ retailer’s annual sales
Personalisation could lift sales by 7.8% for a retailer
• The financial impact of personalising the shopping experience can be assessed by looking at the effect on an ‘average’ retailer; a company the size of Wickes or Mothercare.
• The example opposite shows how the sales of a £849m turnover business might grow if the shopping experience was made more personal.
• This has been calculated by examining the proportion of customers who would respond positively to personalisation and then assessing the relative increase in their spend that this may generate. This uplift number is then added to the existing sales of the retailer.
£ £ £849.40m
£915.97m
+7.8%
Sales before personalising shopping
Sales after personalising shopping
Interaction and personalisation
Page 36
The Connected Consumer Prepared for Webloyalty | March 2015
© 2015 Webloyalty & Conlumino [email protected] | 020 7290 1650
Technology and personalisation
Agreement with various statements
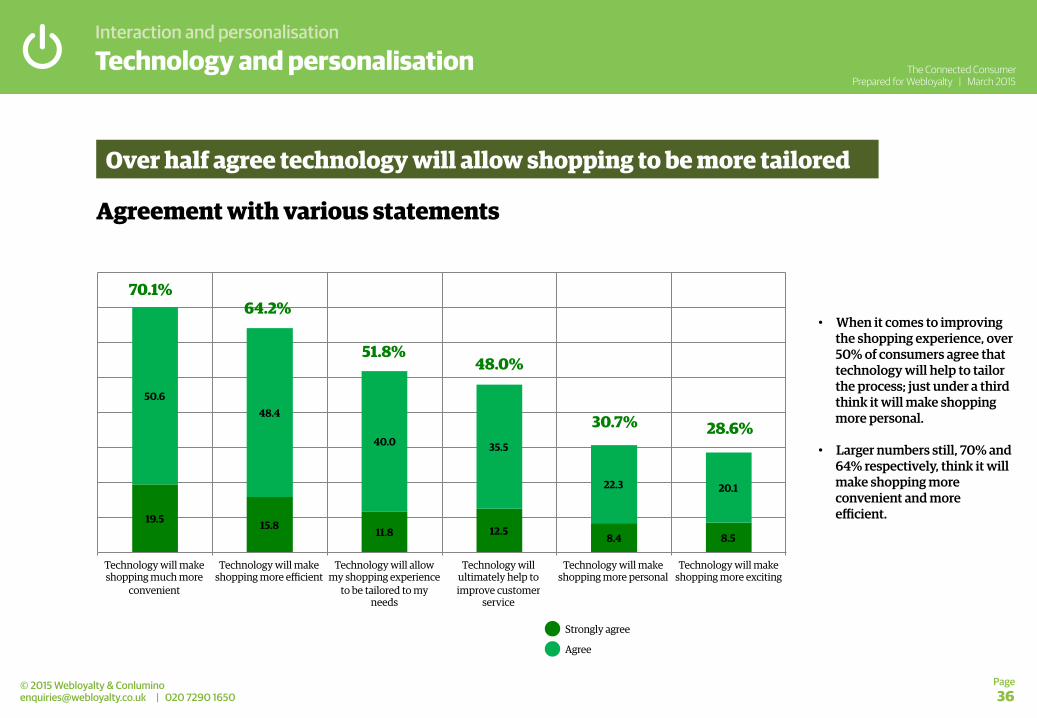
Over half agree technology will allow shopping to be more tailored
19.5 15.8 11.8 12.5 8.4 8.5
50.6 48.4
40.0 35.5
22.3 20.1
Technology will make shopping much more
convenient
Technology will make shopping more efficient
Technology will allow my shopping experience
to be tailored to my needs
Technology will ultimately help to improve customer
service
Technology will make shopping more personal
Technology will make shopping more exciting
Strongly agree
Agree
70.1% 64.2%
51.8% 48.0%
30.7% 28.6%
• When it comes to improving the shopping experience, over 50% of consumers agree that technology will help to tailor the process; just under a third think it will make shopping more personal.
• Larger numbers still, 70% and 64% respectively, think it will make shopping more convenient and more efficient.
Interaction and personalisation
Page 37
The Connected Consumer Prepared for Webloyalty | March 2015
© 2015 Webloyalty & Conlumino [email protected] | 020 7290 1650
Case studies
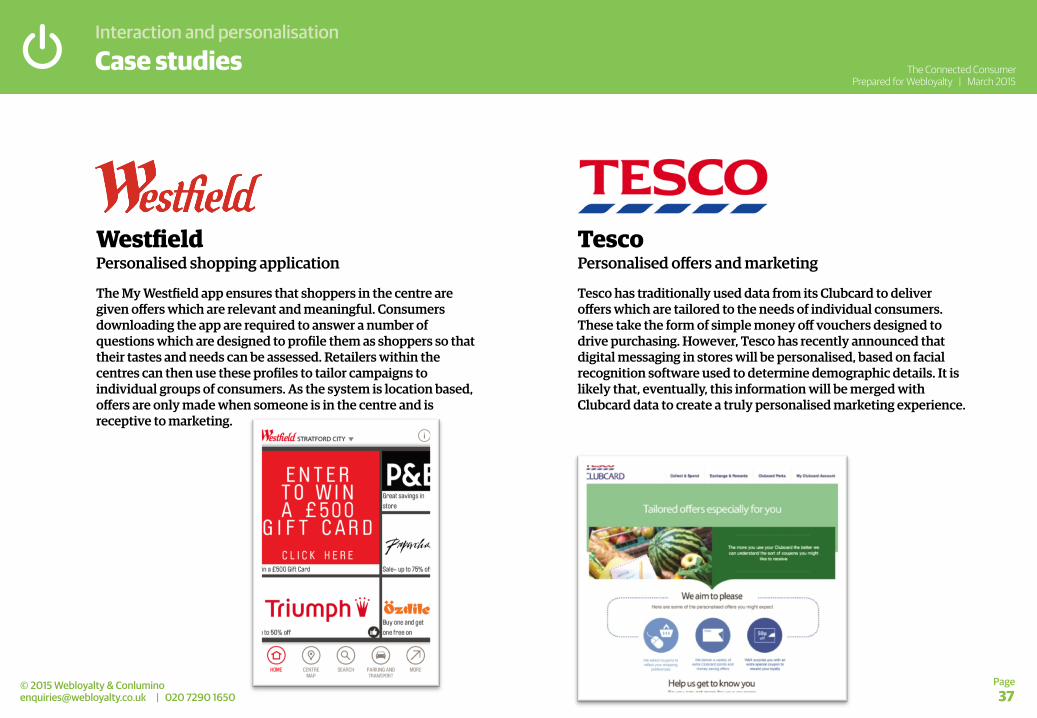
Westfield Personalised shopping application The My Westfield app ensures that shoppers in the centre are given offers which are relevant and meaningful. Consumers downloading the app are required to answer a number of questions which are designed to profile them as shoppers so that their tastes and needs can be assessed. Retailers within the centres can then use these profiles to tailor campaigns to individual groups of consumers. As the system is location based, offers are only made when someone is in the centre and is receptive to marketing.
Tesco Personalised offers and marketing Tesco has traditionally used data from its Clubcard to deliver offers which are tailored to the needs of individual consumers. These take the form of simple money off vouchers designed to drive purchasing. However, Tesco has recently announced that digital messaging in stores will be personalised, based on facial recognition software used to determine demographic details. It is likely that, eventually, this information will be merged with Clubcard data to create a truly personalised marketing experience.

Implications How connected retail is affecting the sector

Implications
Page 39
The Connected Consumer Prepared for Webloyalty | March 2015
© 2015 Webloyalty & Conlumino [email protected] | 020 7290 1650
The impact: purchase pathway
In order to understand the impact of the new connected environment and its technologies we have explored how they fit into the purchasing pathway. This is the basic process through which most consumers travel when buying goods: it involves 5 distinct phases, as shown below.
Ten or so years ago, the purchasing pathway was relatively continuous with the various stages occurring in quick succession and often using just a couple of touch-points or channels (perhaps a store and online, or a store and a catalogue). However, in recent years and thanks to new connected technologies, the pathway has become elongated in terms of timescale and involves far more touch-points and channels.
Thinking Researching Buying Receiving Returning
For the most part, thinking is about getting inspiration and gathering ideas. It is normally a fun process that is about seeing what’s out there and looking at trends. Within some sectors, like fashion, thinking is a particularly important part of the process. It may, or may not, lead onto later stages and purchasing.
Research is a more technical process than thinking. Generally it involves looking at details such as size, specification or availability. It also includes researching or comparing prices or things like delivery charges.
Buying is the actual transaction itself – it involves buying the product through whatever channel.
Receiving is how the product gets to the consumer. For many this step may well be combined with purchasing, especially when an item has been bought in a store. However, with remote purchasing becoming more common this step is increasingly divorced from purchasing.
Returning involves giving back the item to the retailer because it us unsuitable or just not wanted.
Purchase pathway

Implications
Page 40
The Connected Consumer Prepared for Webloyalty | March 2015
© 2015 Webloyalty & Conlumino [email protected] | 020 7290 1650
The impact: purchase pathway considerations
Over recent years new technologies like mobile and social media have changed the purchasing pathway. We believe that the next couple of years will see further changes as the influence of these technologies continues to grow. Some of the key lessons are…
1 Retailers will need to think more about touch-points than channels. Channels represent where something is purchased whereas touch-points are a much wider consideration encompassing all of the various technologies, places and devices that are used on the purchasing journey. Touch-points will be more influential than channels in shaping perceptions of brands and driving purchase conversion.
2 The number of touch-points used on the purchase pathway will explode over the next few years. This will make creating a coherent and consistent brand image and customer experience more of a challenge for retailers. Understanding the role the various touch-points play in the purchase pathway will be important so they can be appropriately optimised and focused.
3 More touch-points generally means that the duration of purchases, at least on average, will be elongated. This has two implications. First, there is potentially more time for consumers to change their mind about a purchase should something not be to their satisfaction. Second, consumers are likely to be exposed to far more competitors. Both things necessitate higher standards from retailers.
4 Managing a multitude of touch-points has the potential to be expensive, especially if they merely redistribute existing sales rather than generate incremental revenue. Retailers therefore need to ensure that some of the new touch-points help to create savings and also to streamline back-end operations and cut out duplication or processes across the various touch-points.
5 Not all touch-points will be appropriate for all retailers, especially so as some will be more relevant to some retail sectors than others. This essentially means that retailers should be selective about which technologies, channels and new innovations they trial. A selective approach will work better than jumping on the bandwagon and adopting each and every new idea that comes along.
Considerations
Implications
Page 41
The Connected Consumer Prepared for Webloyalty | March 2015
© 2015 Webloyalty & Conlumino [email protected] | 020 7290 1650
The impact: number of touch-points used
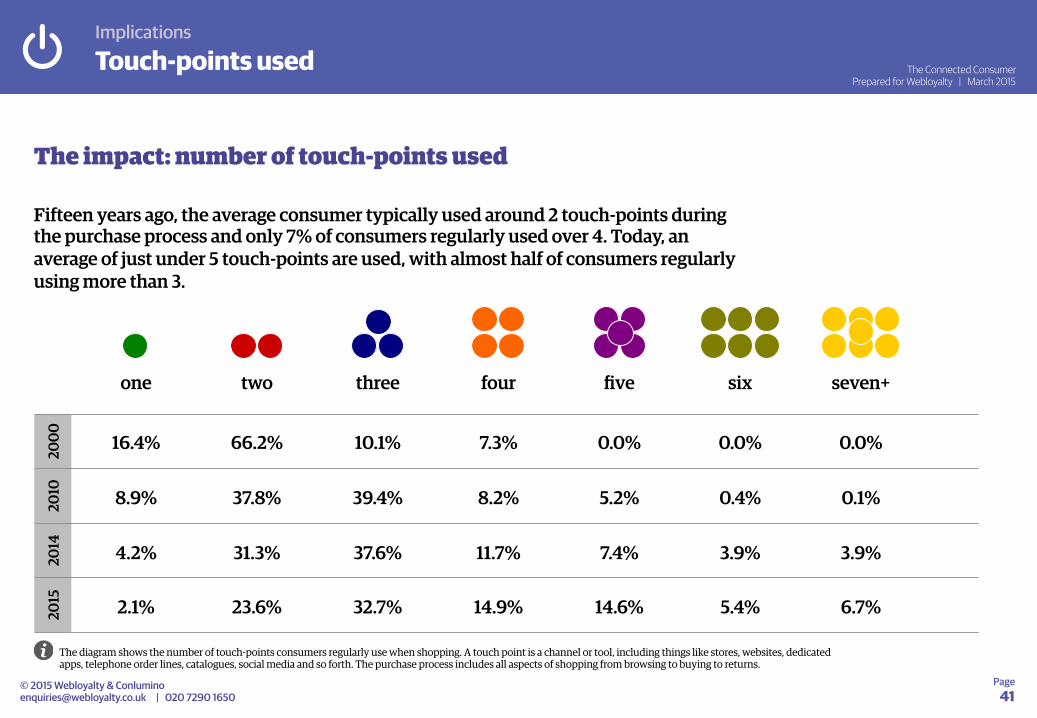
Fifteen years ago, the average consumer typically used around 2 touch-points during the purchase process and only 7% of consumers regularly used over 4. Today, an average of just under 5 touch-points are used, with almost half of consumers regularly using more than 3.
one two three four five six seven+
2000
20
10
2014
20
15
16.4% 66.2% 10.1% 7.3% 0.0% 0.0% 0.0%
8.9% 37.8% 39.4% 8.2% 5.2% 0.4% 0.1%
4.2% 31.3% 37.6% 11.7% 7.4% 3.9% 3.9%
2.1% 23.6% 32.7% 14.9% 14.6% 5.4% 6.7%
Touch-points used
The diagram shows the number of touch-points consumers regularly use when shopping. A touch point is a channel or tool, including things like stores, websites, dedicated apps, telephone order lines, catalogues, social media and so forth. The purchase process includes all aspects of shopping from browsing to buying to returns.

Implications
Page 42
The Connected Consumer Prepared for Webloyalty | March 2015
© 2015 Webloyalty & Conlumino [email protected] | 020 7290 1650
The impact: time spent on purchasing
Back in 2000 an average shopper would spend around an hour making a higher order purchase (i.e. not everyday products like food and basic clothing). In 2010, that figure was nearer to an hour and a half. And an explosion in the number of touch-points used helped to extend this time still further – today the average purchase time is almost two and quarter hours.
38 mins
18 mins
3 mins
2 mins 61 20
00
62 mins
19 mins
5 mins
3 mins 89 20
10
85 mins
36 mins
9 mins
3 mins 133 20
14
97 mins
44 mins
14 mins
6 mins 161 20
15
Thinking Researching Buying Receiving Total minutes
Time taken to shop
The diagram shows the average amount of time consumers take to make a high order purchase, such as an electrcial product or an item of furniture. Various stages are shown, such as thinking, which involves browsing and getting ideas; researching, which involves comparing product details and prices; buying, which is the transaction; and, receiving which is picking up the product or having it delivered if ordered online.
Implications
Page 43
The Connected Consumer Prepared for Webloyalty | March 2015
© 2015 Webloyalty & Conlumino [email protected] | 020 7290 1650
The impact: store of the future
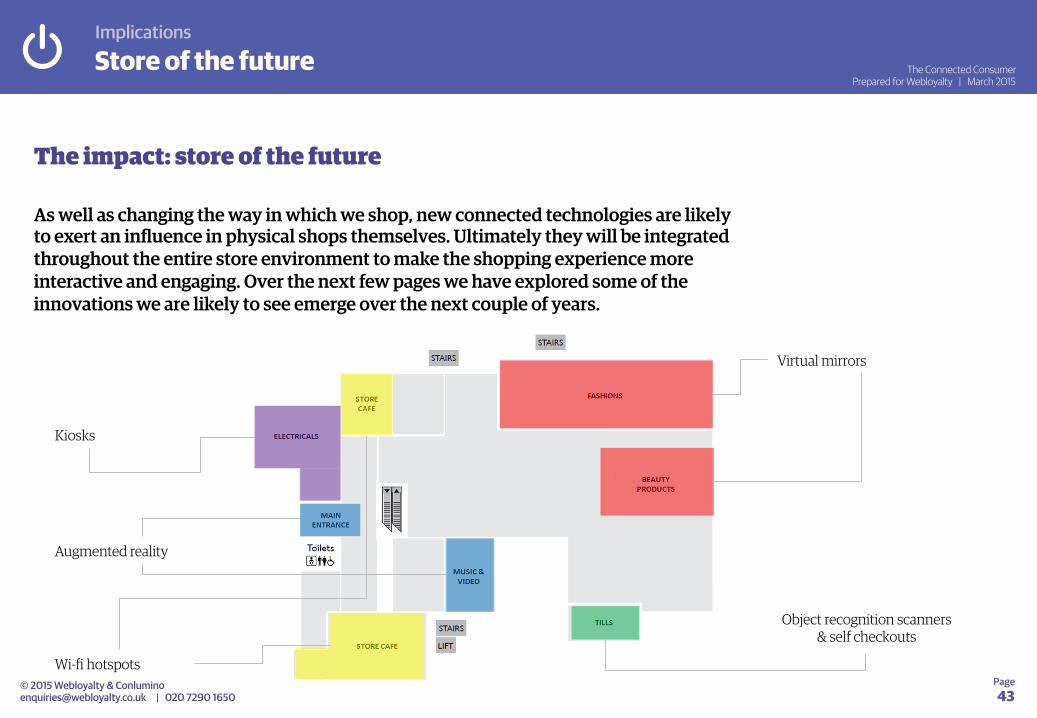
As well as changing the way in which we shop, new connected technologies are likely to exert an influence in physical shops themselves. Ultimately they will be integrated throughout the entire store environment to make the shopping experience more interactive and engaging. Over the next few pages we have explored some of the innovations we are likely to see emerge over the next couple of years.
Virtual mirrors
Augmented reality
Kiosks
Wi-fi hotspots
Object recognition scanners & self checkouts
Store of the future
Implications
Page 44
The Connected Consumer Prepared for Webloyalty | March 2015
© 2015 Webloyalty & Conlumino [email protected] | 020 7290 1650
The impact: store of the future
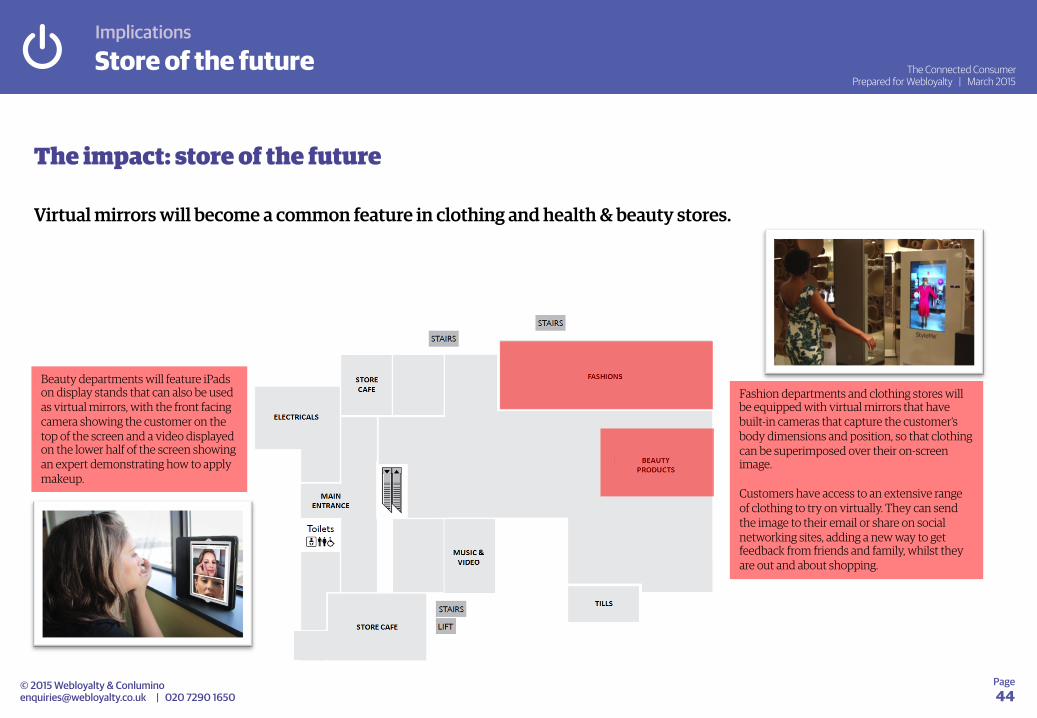
Virtual mirrors will become a common feature in clothing and health & beauty stores.
Fashion departments and clothing stores will be equipped with virtual mirrors that have built-in cameras that capture the customer’s body dimensions and position, so that clothing can be superimposed over their on-screen image.
Customers have access to an extensive range of clothing to try on virtually. They can send the image to their email or share on social networking sites, adding a new way to get feedback from friends and family, whilst they are out and about shopping.
Beauty departments will feature iPads on display stands that can also be used as virtual mirrors, with the front facing camera showing the customer on the top of the screen and a video displayed on the lower half of the screen showing an expert demonstrating how to apply makeup.
Store of the future
Implications
Page 45
The Connected Consumer Prepared for Webloyalty | March 2015
© 2015 Webloyalty & Conlumino [email protected] | 020 7290 1650
The impact: store of the future
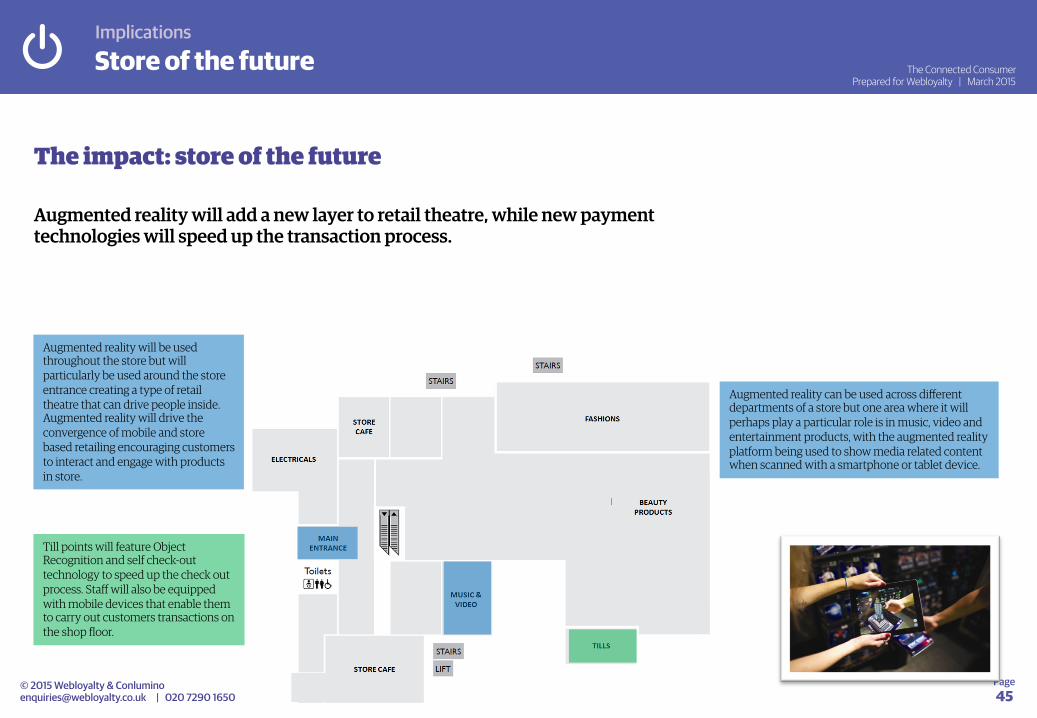
Augmented reality will add a new layer to retail theatre, while new payment technologies will speed up the transaction process.
Till points will feature Object Recognition and self check-out technology to speed up the check out process. Staff will also be equipped with mobile devices that enable them to carry out customers transactions on the shop floor.
Augmented reality will be used throughout the store but will particularly be used around the store entrance creating a type of retail theatre that can drive people inside. Augmented reality will drive the convergence of mobile and store based retailing encouraging customers to interact and engage with products in store.
Augmented reality can be used across different departments of a store but one area where it will perhaps play a particular role is in music, video and entertainment products, with the augmented reality platform being used to show media related content when scanned with a smartphone or tablet device.
Store of the future
Implications
Page 46
The Connected Consumer Prepared for Webloyalty | March 2015
© 2015 Webloyalty & Conlumino [email protected] | 020 7290 1650
The impact: store of the future
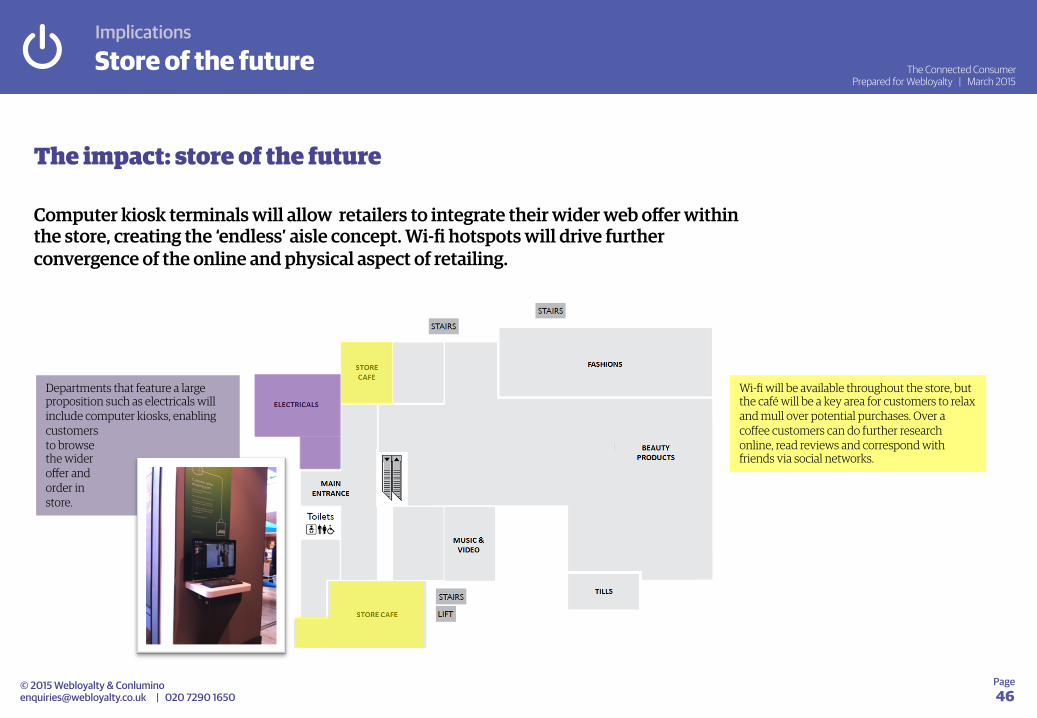
Computer kiosk terminals will allow retailers to integrate their wider web offer within the store, creating the ‘endless’ aisle concept. Wi-fi hotspots will drive further convergence of the online and physical aspect of retailing.
Wi-fi will be available throughout the store, but the café will be a key area for customers to relax and mull over potential purchases. Over a coffee customers can do further research online, read reviews and correspond with friends via social networks.
Departments that feature a large proposition such as electricals will include computer kiosks, enabling customers to browse the wider offer and order in store.
Store of the future
Methodology How connected retail is affecting the sector

Methodology
Page 48
The Connected Consumer Prepared for Webloyalty | March 2015
© 2015 Webloyalty & Conlumino [email protected] | 020 7290 1650
Our work
• A combination of consumer research, secondary research and market forecasting were used to compile this report.
• Consumer research in this report is based on a survey conducted with a UK nationally representative poll of consumers. 2,068 consumers were interviewed during January 2015 and questioned about their use of connected technologies and various aspects of shopping.
• All numbers relating to expenditure and forecast expenditure of retail are taken from Conlumino’s own retail model. This is updated on an ongoing basis with inputs from official sources (such as the BRC and ONS), retailers’ results and trading updates, other secondary sources and industry surveys, Conlumino’s ongoing programme of research into consumer spending and habits, and underlying economic drivers and trends. Conlumino analysts both model and interpret this information to provide guidance on the likely future direction of retail expenditure at an overall, sector and category level.
• Unless otherwise stated, all sources of information are derived from Conlumino’s own research and should be referenced to Conlumino/Webloyalty.

Conlumino
+44 (0)20 7936 6654 [email protected]
7 Carmelite Street, London EC4Y 0BS
Webloyalty
+44 (0)20 7290 1650 [email protected]
2 Harewood Place, London W1S 1BX