Embed Size (px)
Citation preview
Spike Choo
Country Director, Indonesia
INDONESIA DIGITAL TRANSFORMATION OUTLOOK BRIEFING 2016
ASEAN & Indonesia e-Commerce Outlook
1
2
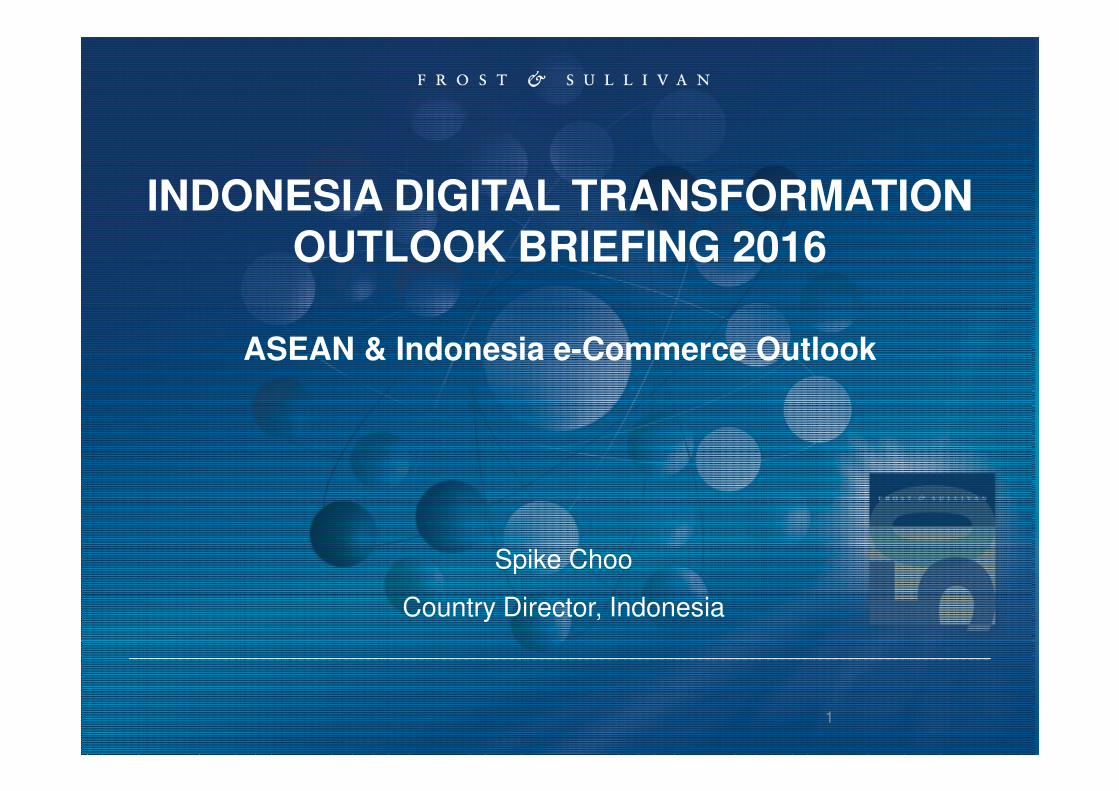
Year in Review: Global Key Highlights of 2015
• Asia E-Commerce flexes its muscle • Alibaba Singles’ Day sales reached USD 14.3Bn• India’s e-Commerce grew ~40% in 2015 to USD 7.5Bn• SEA e-Commerce to double to $15Bn by 2019 from $6.5Bn
22
• Wearables goes mainstream• Apple Watch debut; mainstream watchmakers join the fray• Activity trackers make it to top 10 X’mas shopping lists• More niche wearables (kids , elderly , etc) emerges
33
• Cross industry disruption will continue to accelerate• More disruptive services from Uber and the likes; UberCargo in
HK, GoJek’s Food Delivery, WeChat’s WePay, etc• Fintech continues to evolve, ie Crowd-finance, Digital Banking
44
• Startup investment is cooling down• Number of mega deals (100Mn & above) drop to <20• Several tech IPO perform badly despite lowering their IPO
price or shares (eg Square, Etsy, Shopify, First Data etc)
11
3
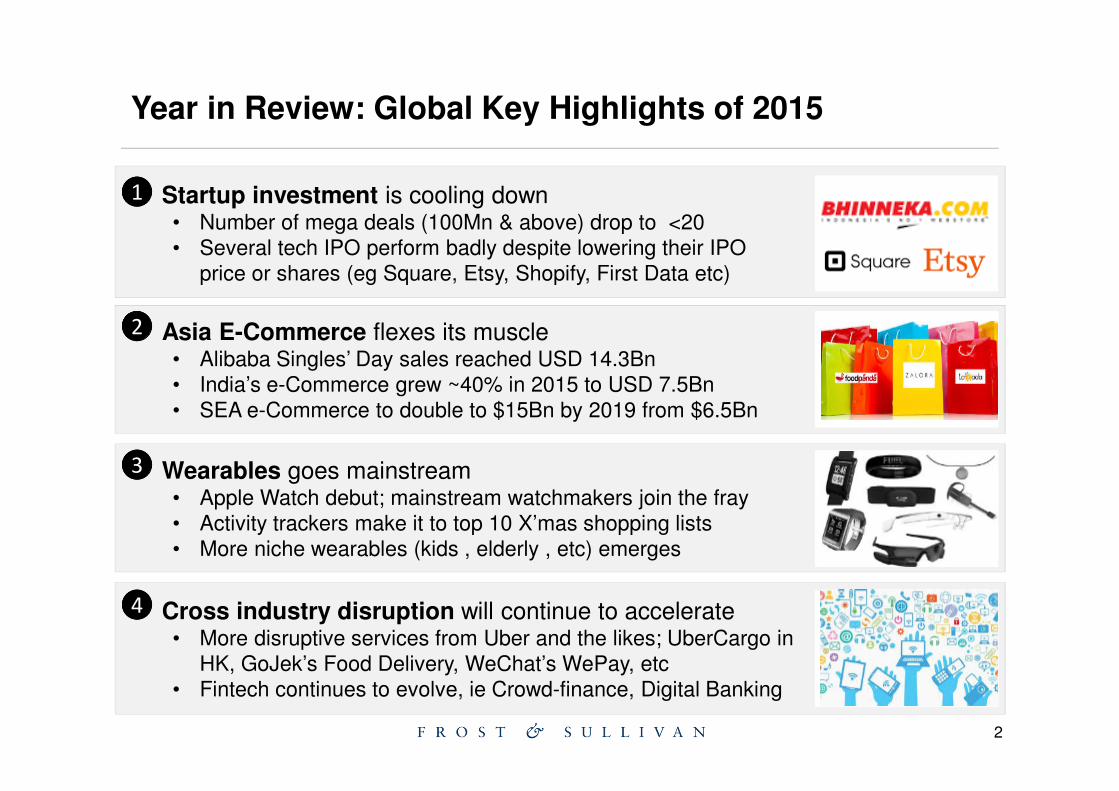
ASEAN e-Commerce Market Overview
• Robust growth (~25% YoY) but market still small compare to China and US
• Positive factors driving e-Commerce growth in APAC such as sizable and youthful population, robust economic growth from and higher domestic spending
ASEAN 6, China & US e-Commerce
Market Size, 2015-2019, USD Billions
Source: Frost Analysis ASEAN 6 refers to SG, MY, ID, TH, PH, VT
6.5
217.3277.0
14.8
411.6 430.0
ASEAN 6 China US
24.9%
24.1%
11.6%
ASEAN 6, China & US Population,
2015E, Millions
553.2
1,375.0
321.2ASEAN 6,
China,
US,
2015
2019
CAGR
4
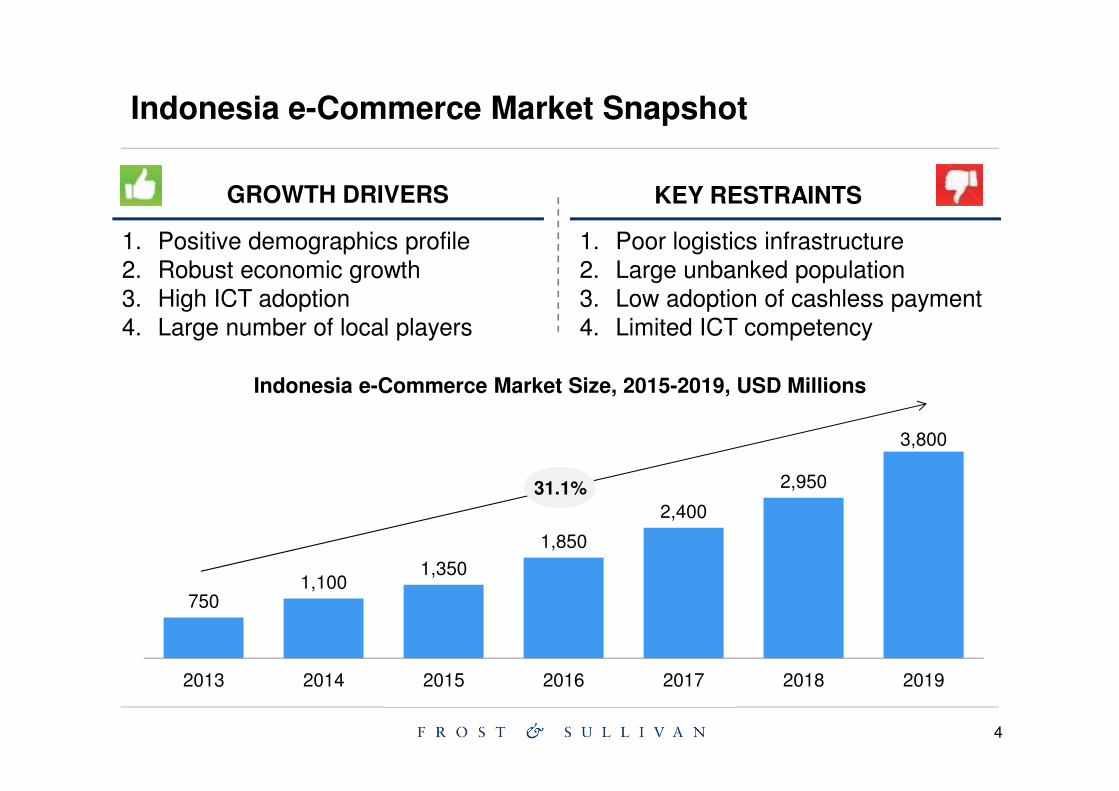
Indonesia e-Commerce Market Snapshot
7501,100
1,350
1,850
2,400
2,950
3,800
2013 2014 2015 2016 2017 2018 2019
31.1%
Indonesia e-Commerce Market Size, 2015-2019, USD Millions
1. Positive demographics profile2. Robust economic growth3. High ICT adoption4. Large number of local players
GROWTH DRIVERS KEY RESTRAINTS
1. Poor logistics infrastructure2. Large unbanked population3. Low adoption of cashless payment4. Limited ICT competency
5
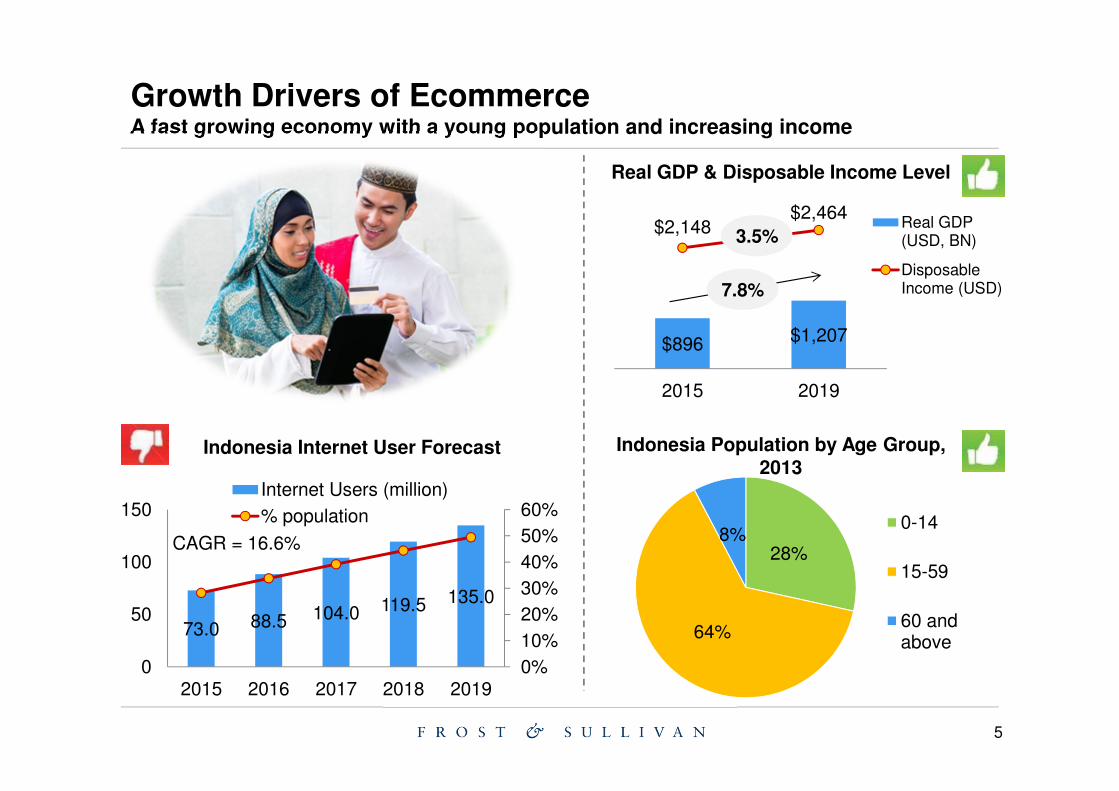
Growth Drivers of EcommerceA fast growing economy with a young population and increasing income
Real GDP & Disposable Income Level
$896 $1,207
$2,148$2,464
2015 2019
Real GDP(USD, BN)
DisposableIncome (USD)
3.5%
7.8%
28%
64%
8%0-14
15-59
60 andabove
Indonesia Population by Age Group, 2013
Indonesia Internet User Forecast
73.0 88.5 104.0 119.5 135.0
0%
10%
20%
30%
40%
50%
60%
0
50
100
150
2015 2016 2017 2018 2019
Internet Users (million)
% population
CAGR = 16.6%
6
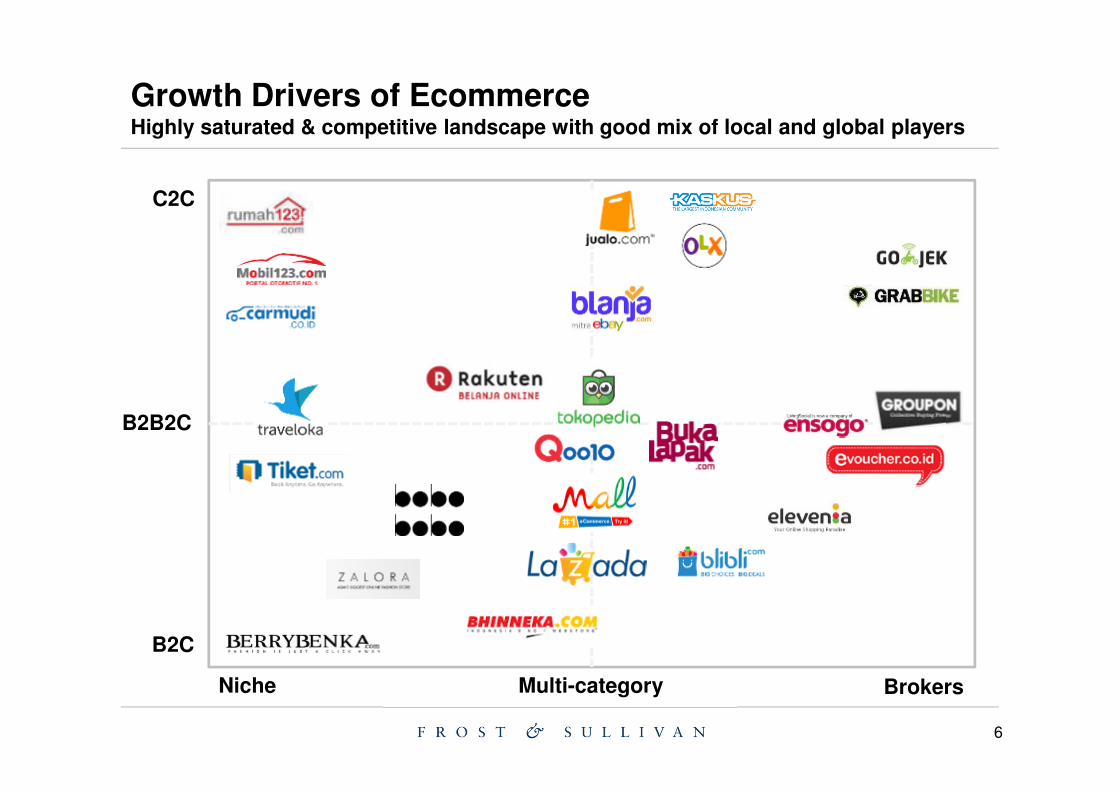
Growth Drivers of EcommerceHighly saturated & competitive landscape with good mix of local and global players
Niche
B2C
Multi-category
C2C
B2B2C
Brokers
7
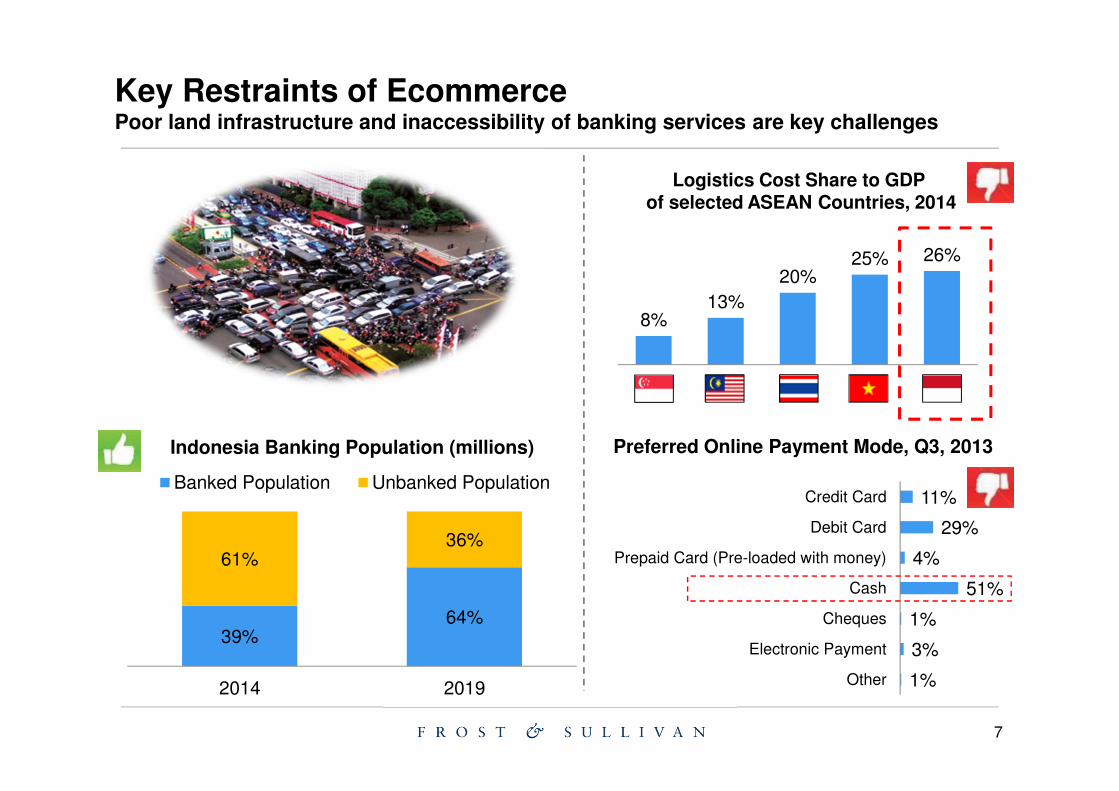
Key Restraints of EcommercePoor land infrastructure and inaccessibility of banking services are key challenges
Indonesia Banking Population (millions)
39%64%
61%36%
2014 2019
Banked Population Unbanked Population
8%13%
20%25% 26%
Logistics Cost Share to GDP of selected ASEAN Countries, 2014
1%
3%
1%
51%
4%
29%
11%
Other
Electronic Payment
Cheques
Cash
Prepaid Card (Pre-loaded with money)
Debit Card
Credit Card
Preferred Online Payment Mode, Q3, 2013
8
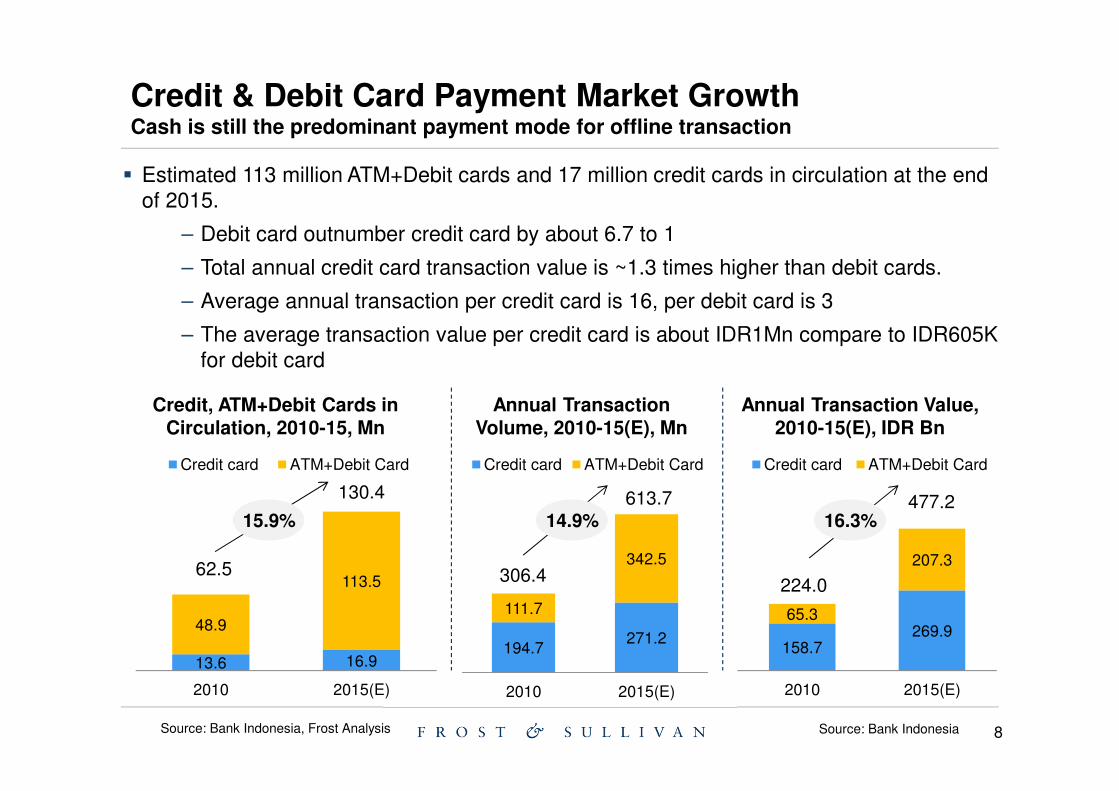
Credit & Debit Card Payment Market GrowthCash is still the predominant payment mode for offline transaction
� Estimated 113 million ATM+Debit cards and 17 million credit cards in circulation at the end of 2015.
– Debit card outnumber credit card by about 6.7 to 1
– Total annual credit card transaction value is ~1.3 times higher than debit cards.
– Average annual transaction per credit card is 16, per debit card is 3
– The average transaction value per credit card is about IDR1Mn compare to IDR605K for debit card
Source: Bank Indonesia, Frost Analysis
Annual Transaction Value, 2010-15(E), IDR Bn
Annual Transaction Volume, 2010-15(E), Mn
194.7271.2
111.7
342.5
2010 2015(E)
Credit card ATM+Debit Card
158.7269.9
65.3
207.3
2010 2015(E)
Credit card ATM+Debit Card
224.0
477.216.3%
306.4
613.714.9%
13.6 16.9
48.9
113.5
2010 2015(E)
Credit card ATM+Debit Card
Credit, ATM+Debit Cards in Circulation, 2010-15, Mn
62.5
130.4
15.9%
Source: Bank Indonesia
9
2010 2015(E)2010 2015(E)2010 2015(E)
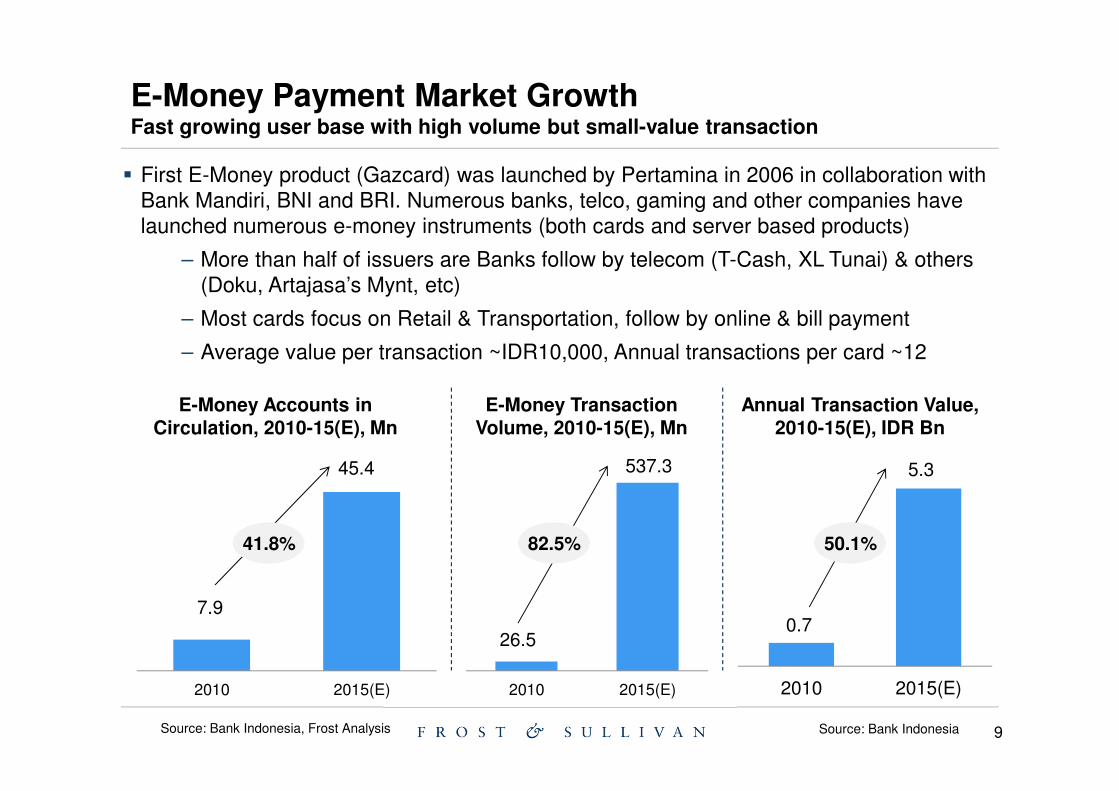
E-Money Payment Market GrowthFast growing user base with high volume but small-value transaction
� First E-Money product (Gazcard) was launched by Pertamina in 2006 in collaboration with Bank Mandiri, BNI and BRI. Numerous banks, telco, gaming and other companies have launched numerous e-money instruments (both cards and server based products)
– More than half of issuers are Banks follow by telecom (T-Cash, XL Tunai) & others (Doku, Artajasa’s Mynt, etc)
– Most cards focus on Retail & Transportation, follow by online & bill payment
– Average value per transaction ~IDR10,000, Annual transactions per card ~12
Source: Bank Indonesia, Frost Analysis
Annual Transaction Value, 2010-15(E), IDR Bn
E-Money Transaction Volume, 2010-15(E), Mn
0.7
5.3
50.1%
26.5
537.3
82.5%
E-Money Accounts in Circulation, 2010-15(E), Mn
7.9
45.4
41.8%
Source: Bank Indonesia
10
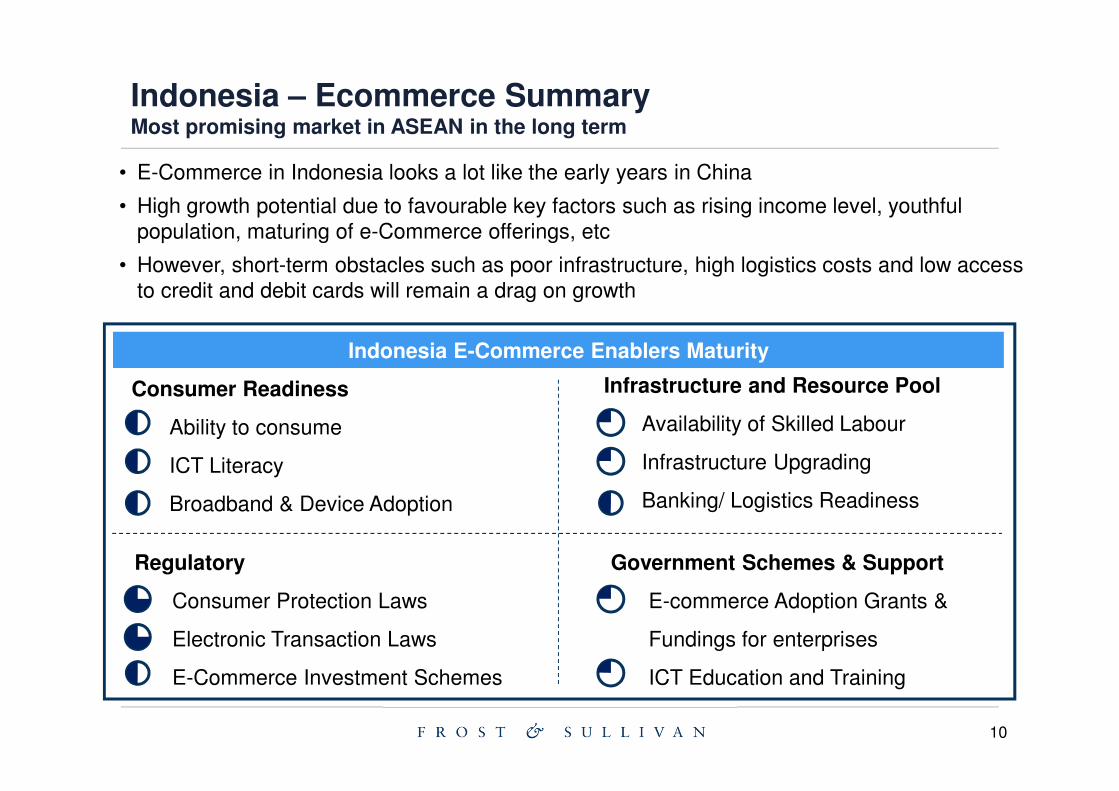
Indonesia – Ecommerce Summary Most promising market in ASEAN in the long term
• E-Commerce in Indonesia looks a lot like the early years in China
• High growth potential due to favourable key factors such as rising income level, youthful population, maturing of e-Commerce offerings, etc
• However, short-term obstacles such as poor infrastructure, high logistics costs and low access to credit and debit cards will remain a drag on growth
Indonesia E-Commerce Enablers Maturity
Infrastructure and Resource Pool
� Availability of Skilled Labour
� Infrastructure Upgrading
� Banking/ Logistics Readiness
Regulatory
� Consumer Protection Laws
� Electronic Transaction Laws
� E-Commerce Investment Schemes
Consumer Readiness
� Ability to consume
� ICT Literacy
� Broadband & Device Adoption
Government Schemes & Support
� E-commerce Adoption Grants &
Fundings for enterprises
� ICT Education and Training
11
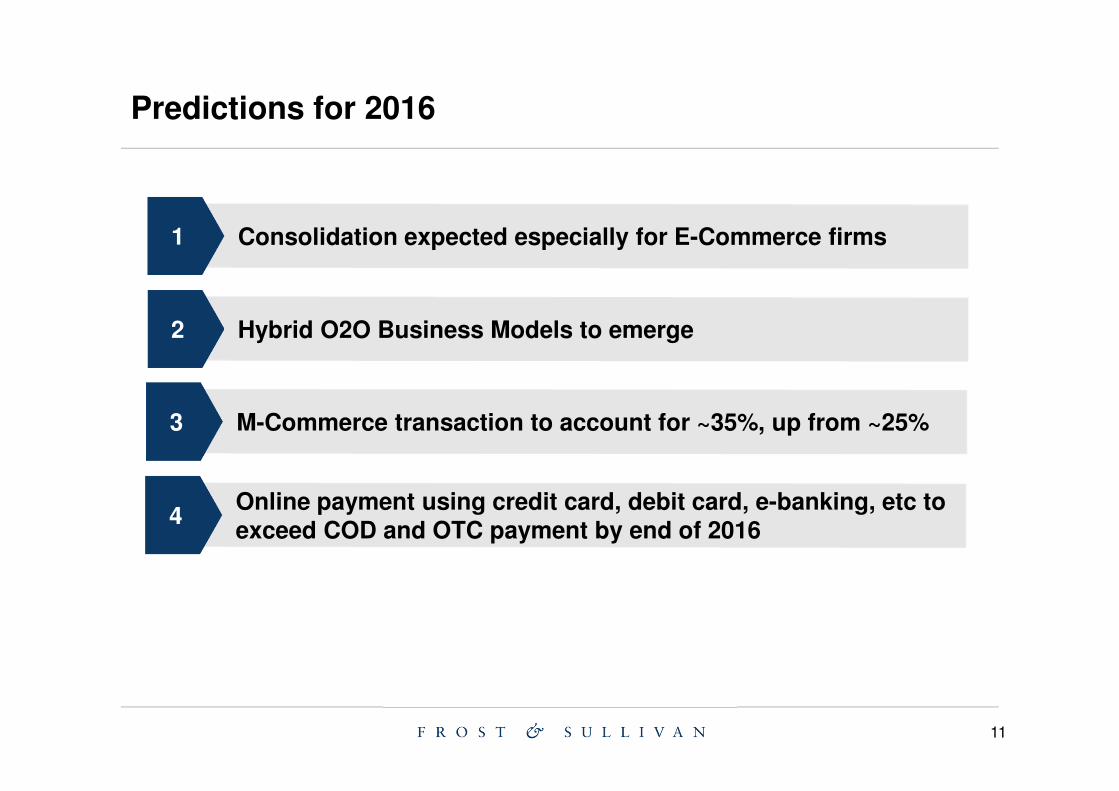
Predictions for 2016
Consolidation expected especially for E-Commerce firms1
Hybrid O2O Business Models to emerge2
M-Commerce transaction to account for ~35%, up from ~25% 3
Online payment using credit card, debit card, e-banking, etc to exceed COD and OTC payment by end of 2016
4
12
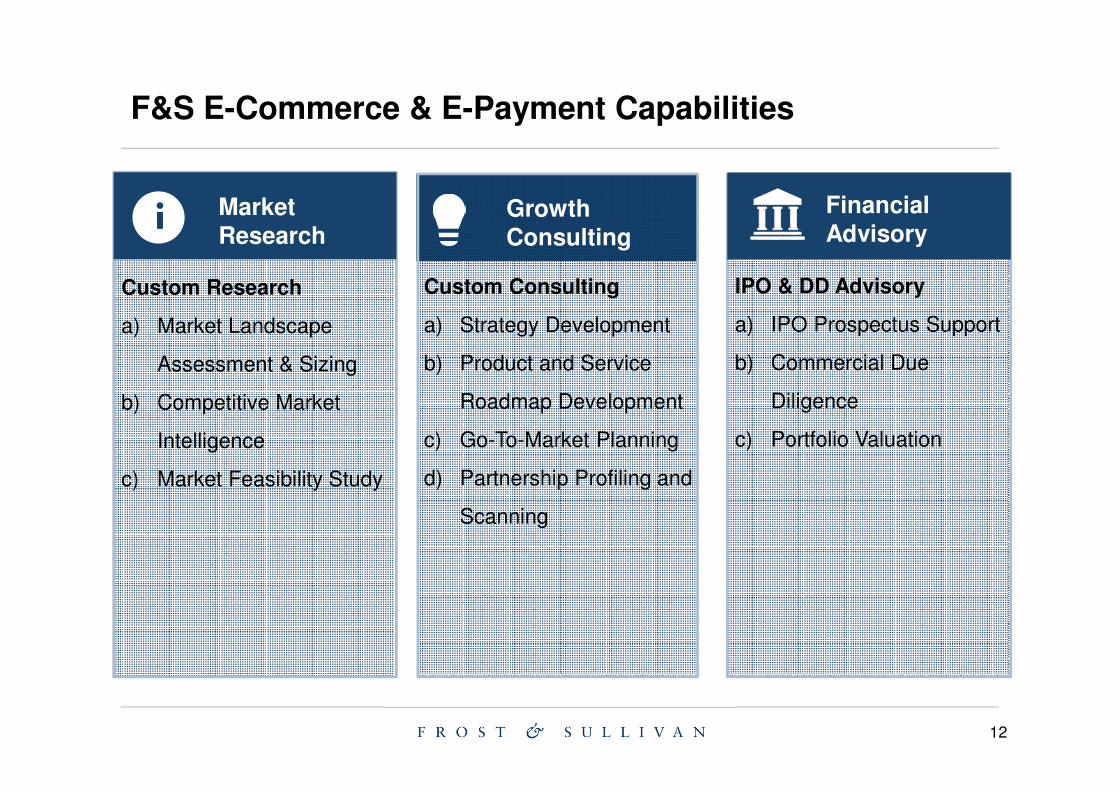
F&S E-Commerce & E-Payment Capabilities
Custom Research
a) Market Landscape
Assessment & Sizing
b) Competitive Market
Intelligence
c) Market Feasibility Study
i
IPO & DD Advisory
a) IPO Prospectus Support
b) Commercial Due
Diligence
c) Portfolio Valuation
Custom Consulting
a) Strategy Development
b) Product and Service
Roadmap Development
c) Go-To-Market Planning
d) Partnership Profiling and
Scanning
Market Research
Growth Consulting
Financial Advisory
13
Thank You
All Rights Reserved, Copyright ©