Embed Size (px)
Citation preview
Suominen Corporation as an investment24 Nov 2016European Mid Small Cap Forum, Paris
Nina Kopola, President & CEOAnu Heinonen, Vice President, Corporate Communications & IR
Our purpose is to make nonwovens continuously better for people.
Contents
• Suominen at a glance• Nonwovens markets• Strategy for 2015 – 2017 and its implementation
- Progress on mid-term financial targets• Key elements of profitability• Financial review
211/24/2016

Our purpose is to make nonwovens continuously better for people.
Suominenat a glance
311/24/2016
Our purpose is to make nonwovens continuously better for people.
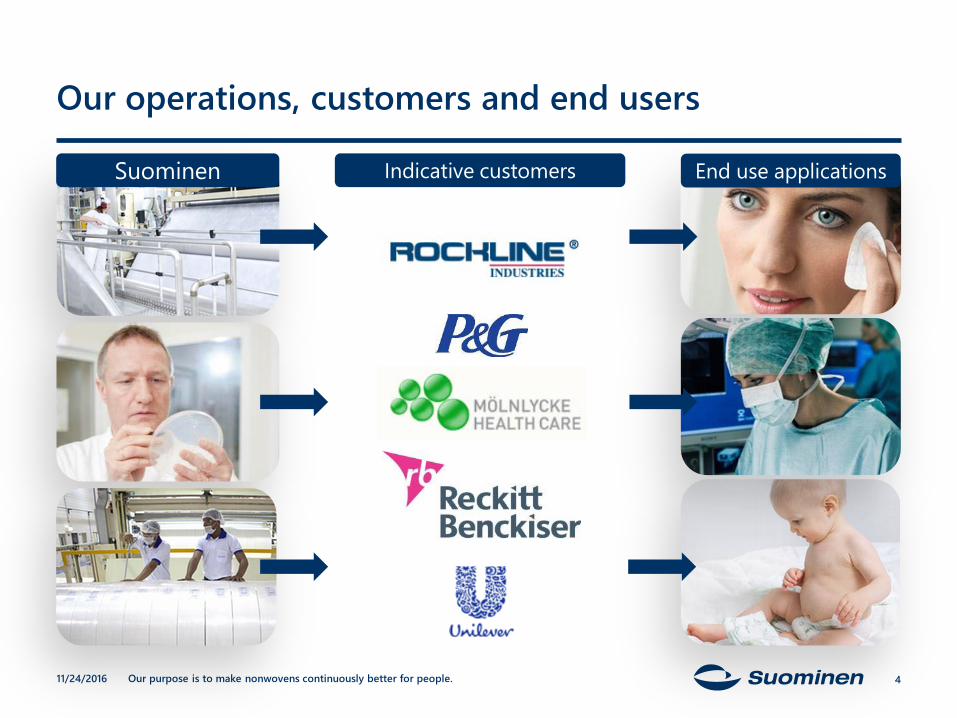
Indicative customers
Our operations, customers and end users
4
Suominen End use applications
11/24/2016
Our purpose is to make nonwovens continuously better for people.
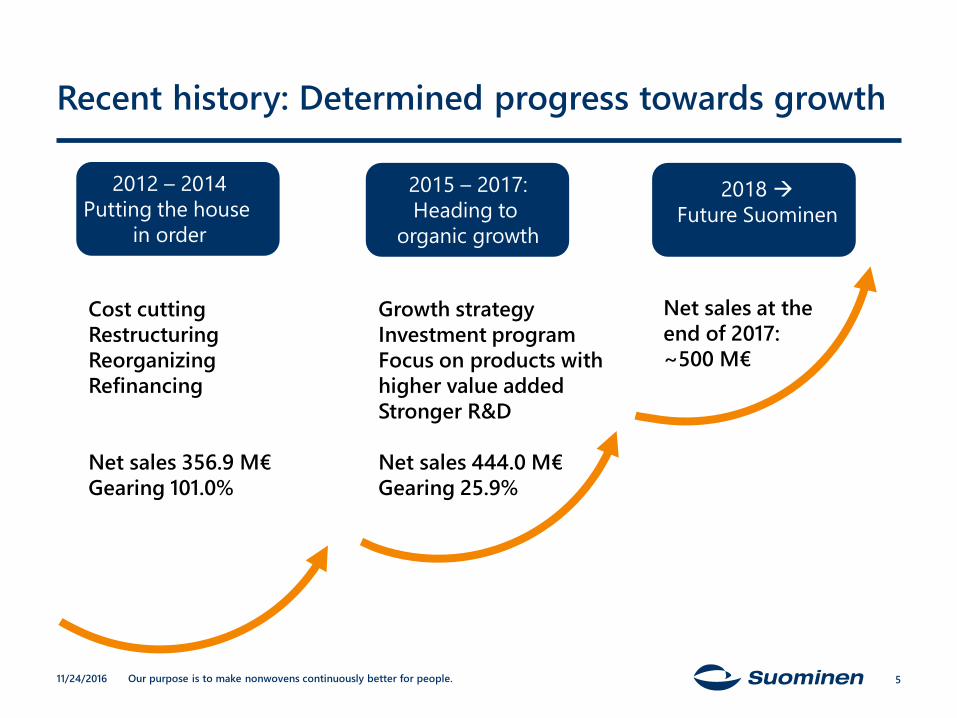
Recent history: Determined progress towards growth
5
2012 – 2014Putting the house
in order
2015 – 2017:Heading to
organic growth
2018 Future Suominen
Cost cuttingRestructuringReorganizingRefinancing
Net sales 356.9 M€Gearing 101.0%
Growth strategyInvestment programFocus on products withhigher value addedStronger R&D
Net sales 444.0 M€Gearing 25.9%
Net sales at theend of 2017: ~500 M€
11/24/2016
Our purpose is to make nonwovens continuously better for people.
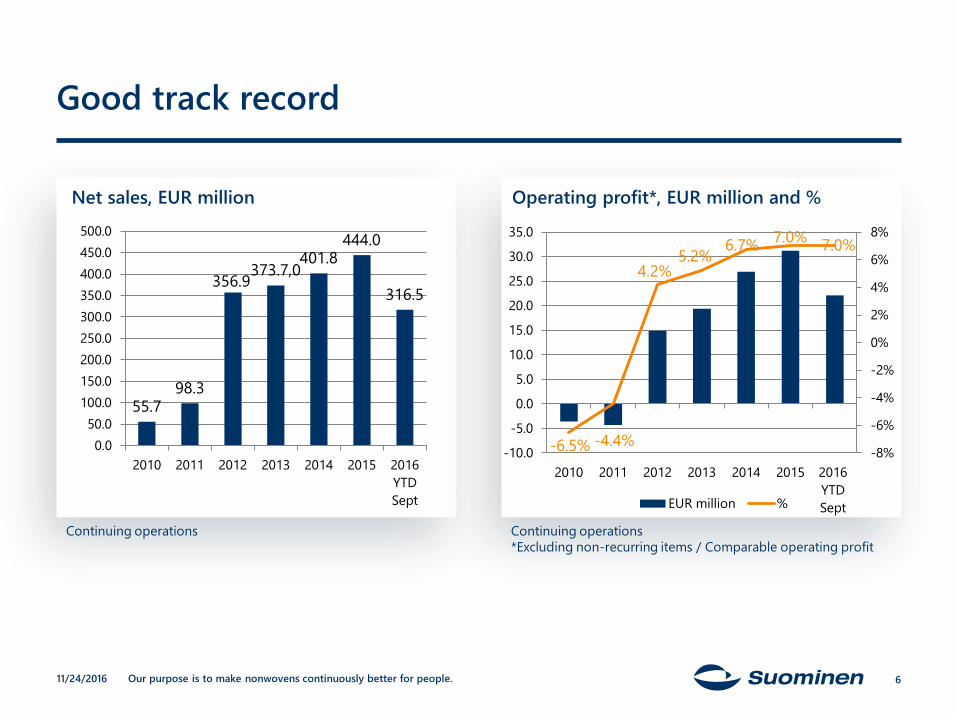
Good track record
11/24/2016 6
Net sales, EUR million
55.798.3
356.9373.7,0
401.8444.0
316.5
0.050.0
100.0150.0200.0250.0300.0350.0400.0450.0500.0
2010 2011 2012 2013 2014 2015 2016YTDSept
Continuing operations
-6.5% -4.4%
4.2%5.2% 6.7% 7.0% 7.0%
-8%
-6%
-4%
-2%
0%
2%
4%
6%
8%
-10.0
-5.0
0.0
5.0
10.0
15.0
20.0
25.0
30.0
35.0
2010 2011 2012 2013 2014 2015 2016YTDSeptEUR million %
Continuing operations*Excluding non-recurring items / Comparable operating profit
Operating profit*, EUR million and %
Our purpose is to make nonwovens continuously better for people.
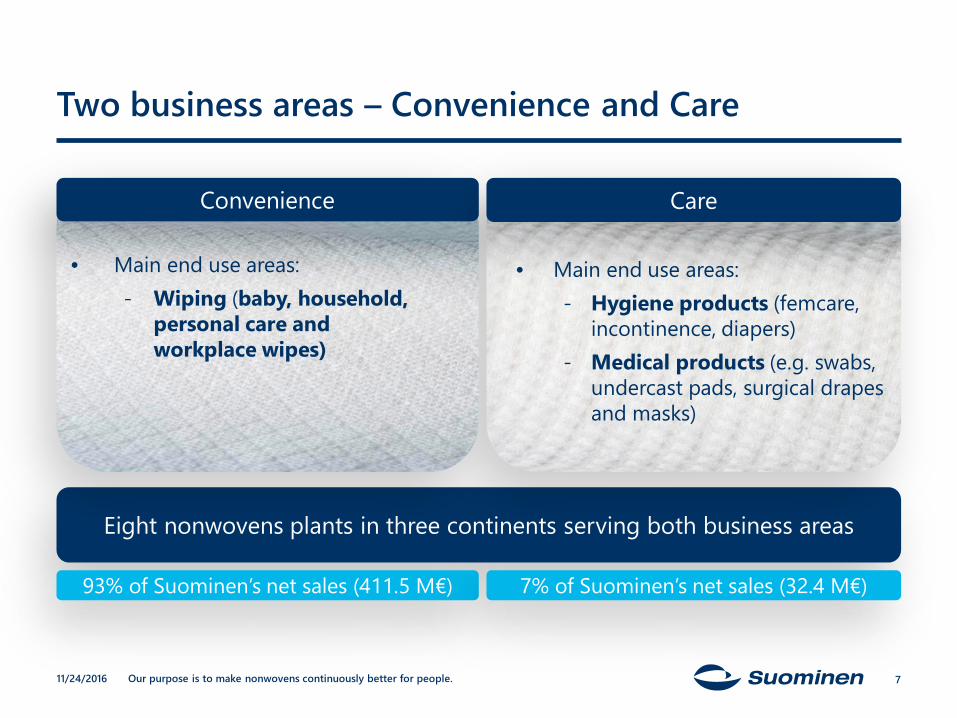
Eight nonwovens plants in three continents serving both business areas
Two business areas – Convenience and Care
7
93% of Suominen’s net sales (411.5 M€) 7% of Suominen’s net sales (32.4 M€)
• Main end use areas:- Hygiene products (femcare,
incontinence, diapers)- Medical products (e.g. swabs,
undercast pads, surgical drapes and masks)
• Main end use areas:- Wiping (baby, household,
personal care andworkplace wipes)
Convenience Care
11/24/2016
Our purpose is to make nonwovens continuously better for people.
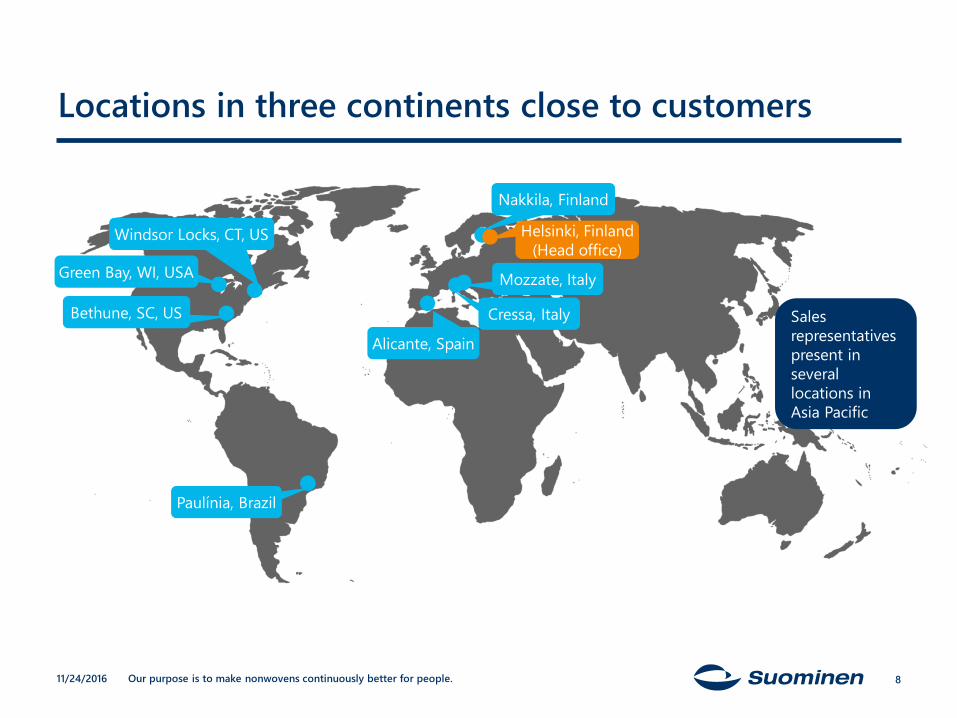
Locations in three continents close to customers
Green Bay, WI, USA
Windsor Locks, CT, US
Bethune, SC, US
Paulínia, Brazil
Alicante, Spain
Mozzate, Italy
Nakkila, Finland
Cressa, Italy
Helsinki, Finland (Head office)
Sales representatives present in several locations in Asia Pacific
811/24/2016
Our purpose is to make nonwovens continuously better for people.
Nonwovensmarkets
911/24/2016
Our purpose is to make nonwovens continuously better for people.
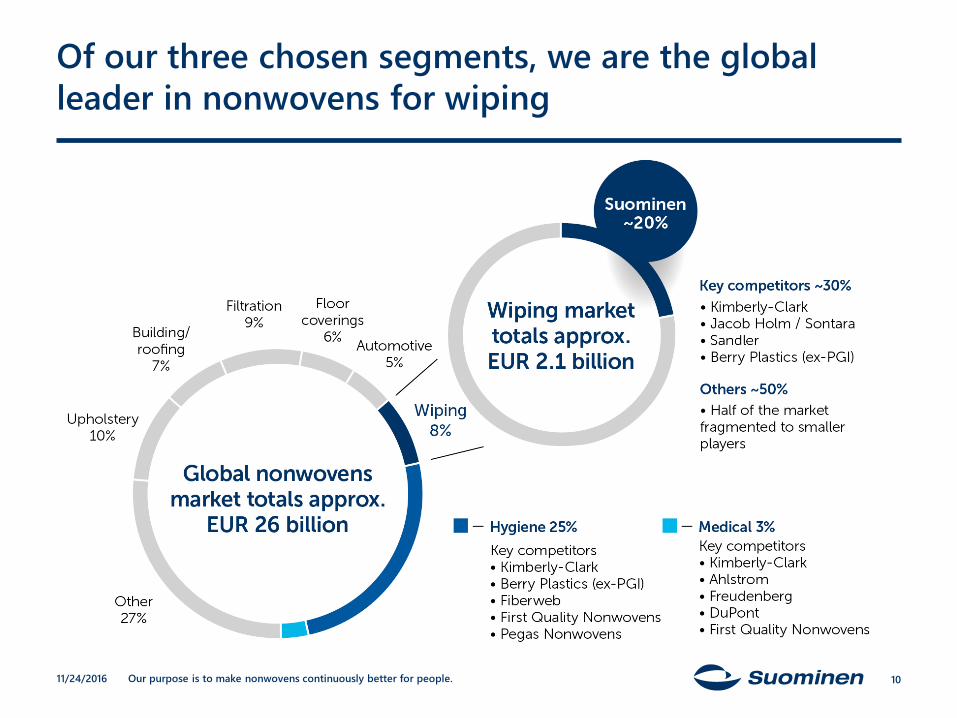
Of our three chosen segments, we are the global leader in nonwovens for wiping
11/24/2016 10
Our purpose is to make nonwovens continuously better for people.
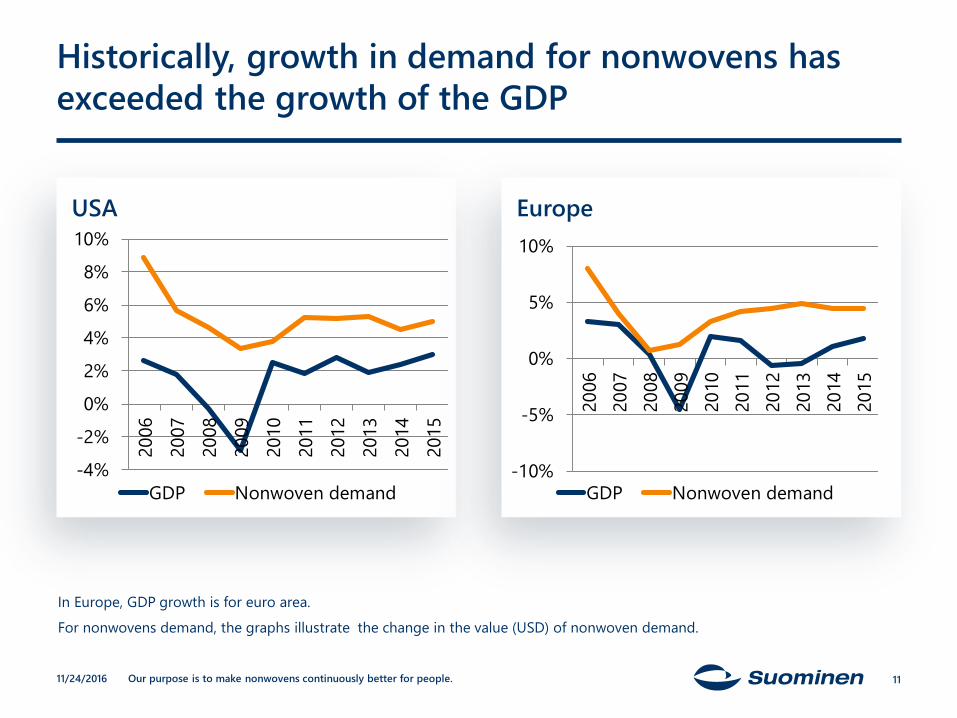
Historically, growth in demand for nonwovens has exceeded the growth of the GDP
USA Europe
-4%
-2%
0%
2%
4%
6%
8%
10%
2006
2007
2008
2009
2010
2011
2012
2013
2014
2015
GDP Nonwoven demand
In Europe, GDP growth is for euro area.For nonwovens demand, the graphs illustrate the change in the value (USD) of nonwoven demand.
-10%
-5%
0%
5%
10%
2006
2007
2008
2009
2010
2011
2012
2013
2014
2015
GDP Nonwoven demand
1111/24/2016
Our purpose is to make nonwovens continuously better for people.
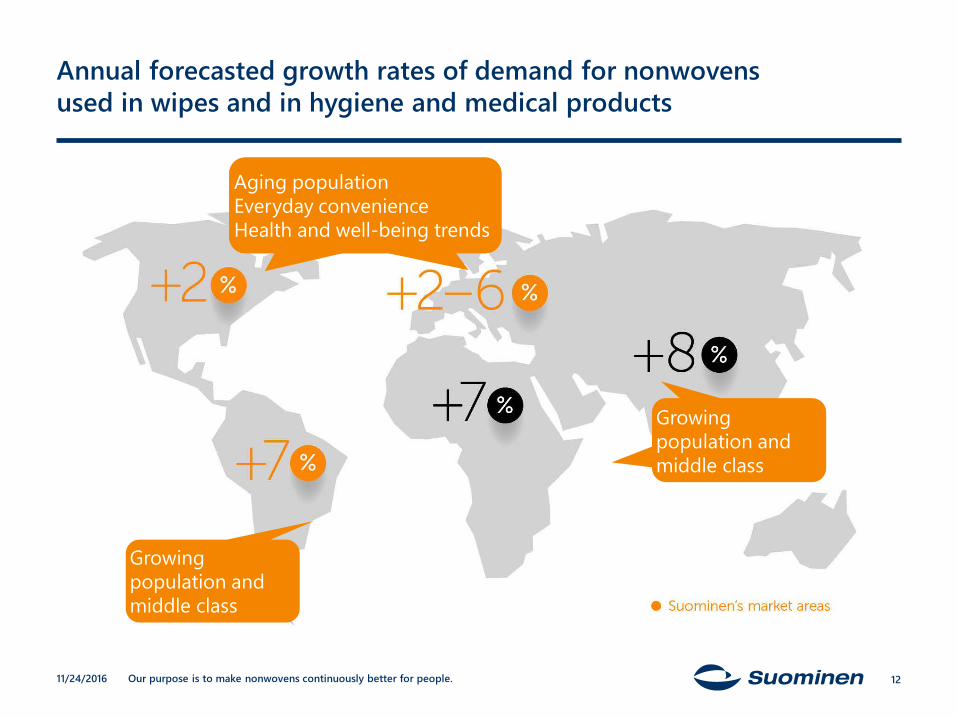
Annual forecasted growth rates of demand for nonwovens used in wipes and in hygiene and medical products
11/24/2016
Aging populationEveryday convenienceHealth and well-being trends
Growing population and middle class
Growing population and middle class
Aging populationEveryday convenienceHealth and well-being trends
Growing population and middle class
12
Our purpose is to make nonwovens continuously better for people.
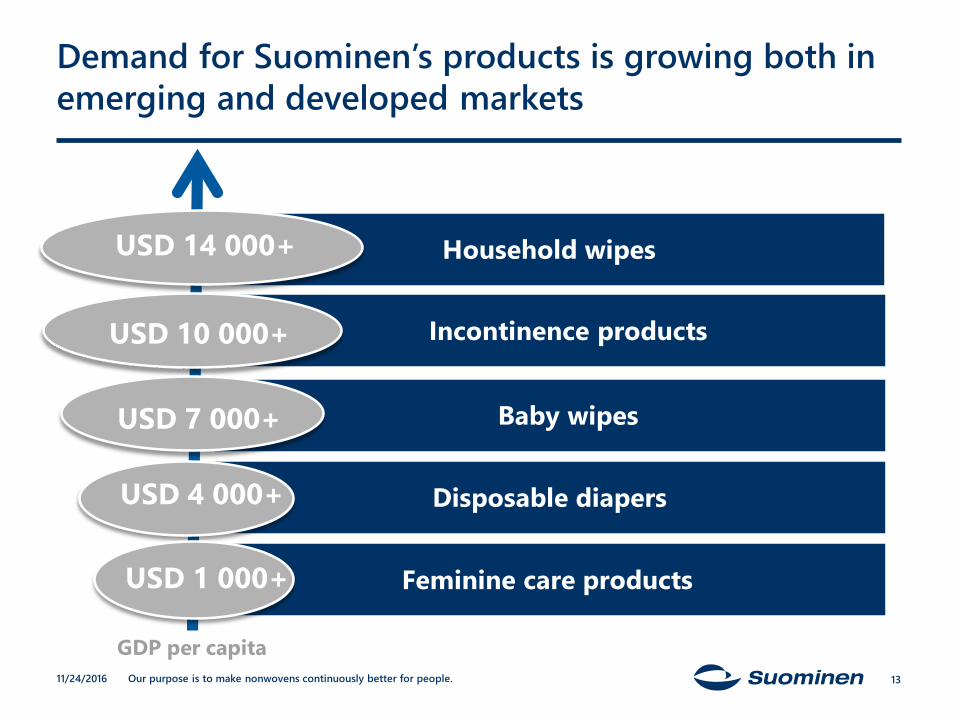
GDP per capita
Demand for Suominen’s products is growing both in emerging and developed markets
13
Household wipes
Incontinence products
Baby wipes
Disposable diapers
Feminine care products
USD 14 000+
USD 7 000+
USD 10 000+
USD 4 000+
USD 1 000+
11/24/2016
Our purpose is to make nonwovens continuously better for people.
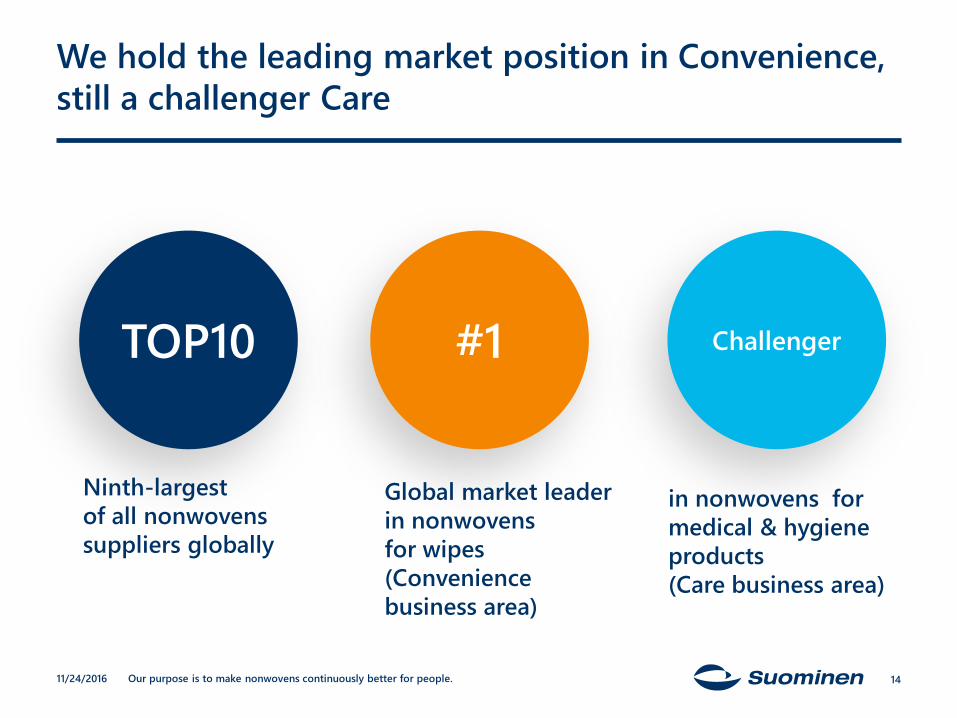
We hold the leading market position in Convenience,still a challenger Care
14
TOP10 #1 Challenger
in nonwovens for medical & hygiene products(Care business area)
Global market leaderin nonwovens for wipes(Conveniencebusiness area)
Ninth-largestof all nonwovens suppliers globally
11/24/2016
Our purpose is to make nonwovens continuously better for people.
Strategy for 2015-2017
11/24/2016 15
Our purpose is to make nonwovens continuously better for people.
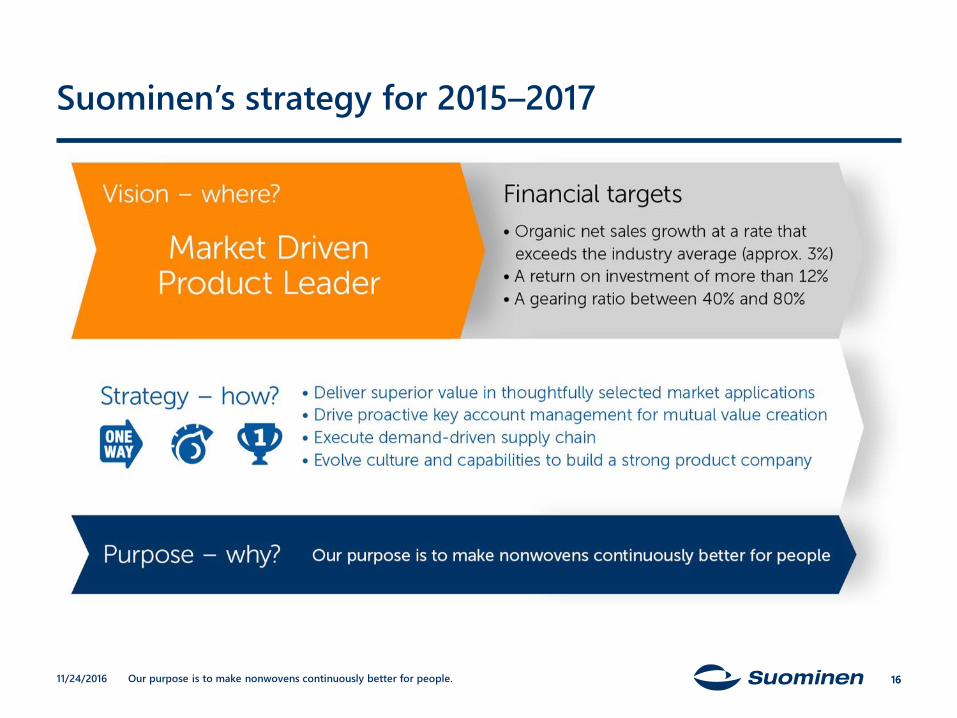
Suominen’s strategy for 2015–2017
16
1. Deliver superior value in thoughtfully selected market applications.
2. Drive proactive key account management. 3. Execute demand driven supply chain. 4. Evolve culture and capabilities to build strong product
company.
1611/24/2016
Our purpose is to make nonwovens continuously better for people.
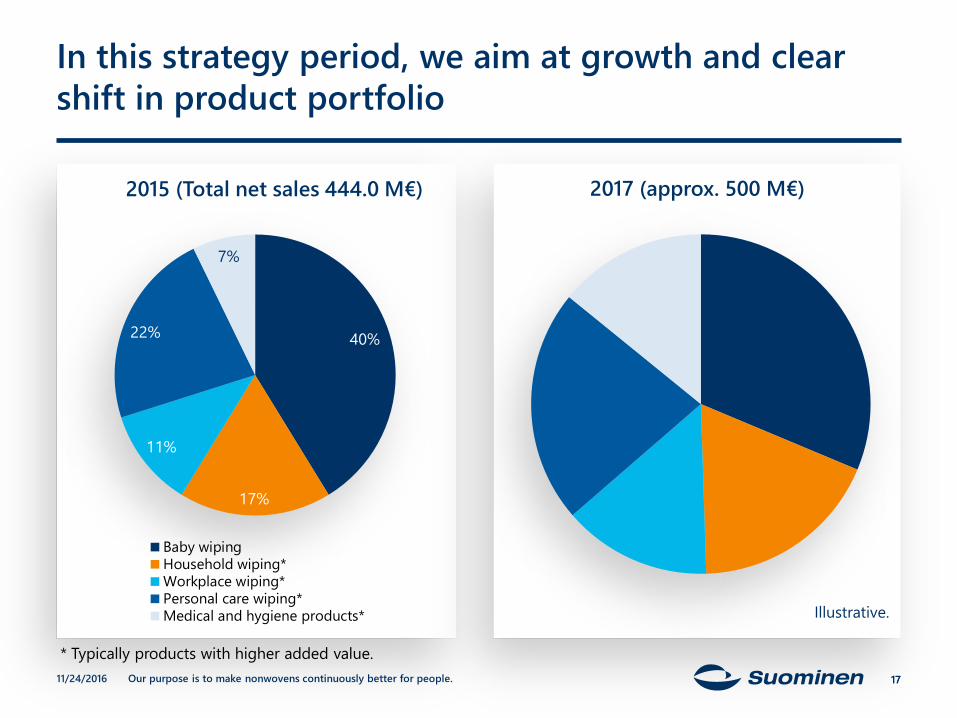
In this strategy period, we aim at growth and clear shift in product portfolio
40%
17%
11%
22%
7%
2015 (Total net sales 444.0 M€)
Baby wipingHousehold wiping*Workplace wiping*Personal care wiping*Medical and hygiene products*
2017 (approx. 500 M€)
Illustrative.
171711/24/2016
* Typically products with higher added value.
Our purpose is to make nonwovens continuously better for people.
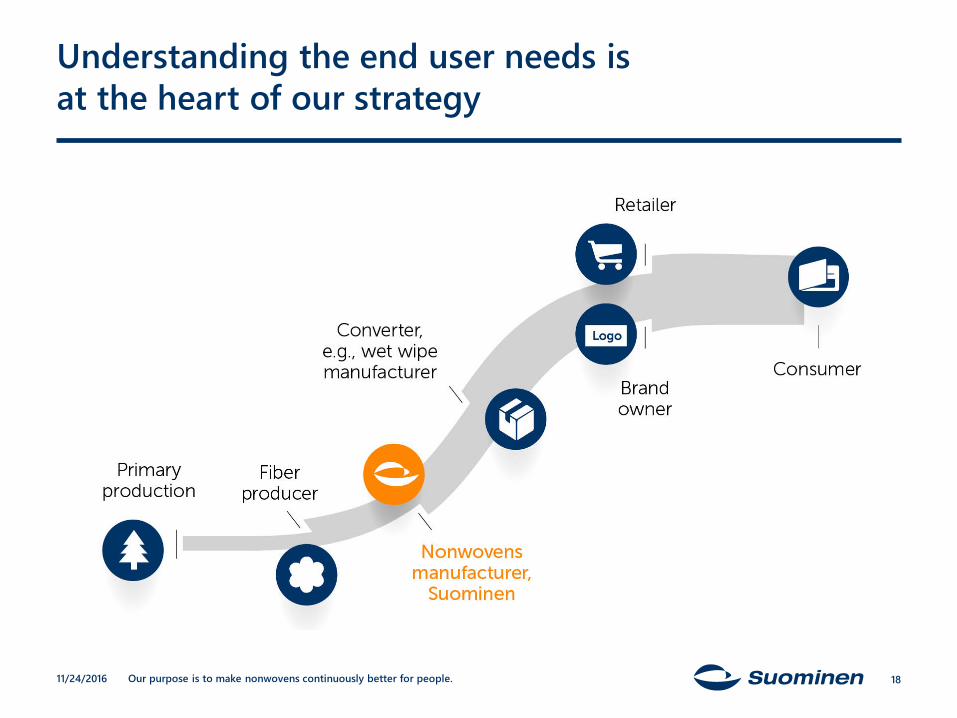
Understanding the end user needs isat the heart of our strategy
1811/24/2016
Our purpose is to make nonwovens continuously better for people.
Strategy implementation
11/24/2016 19
Our purpose is to make nonwovens continuously better for people.
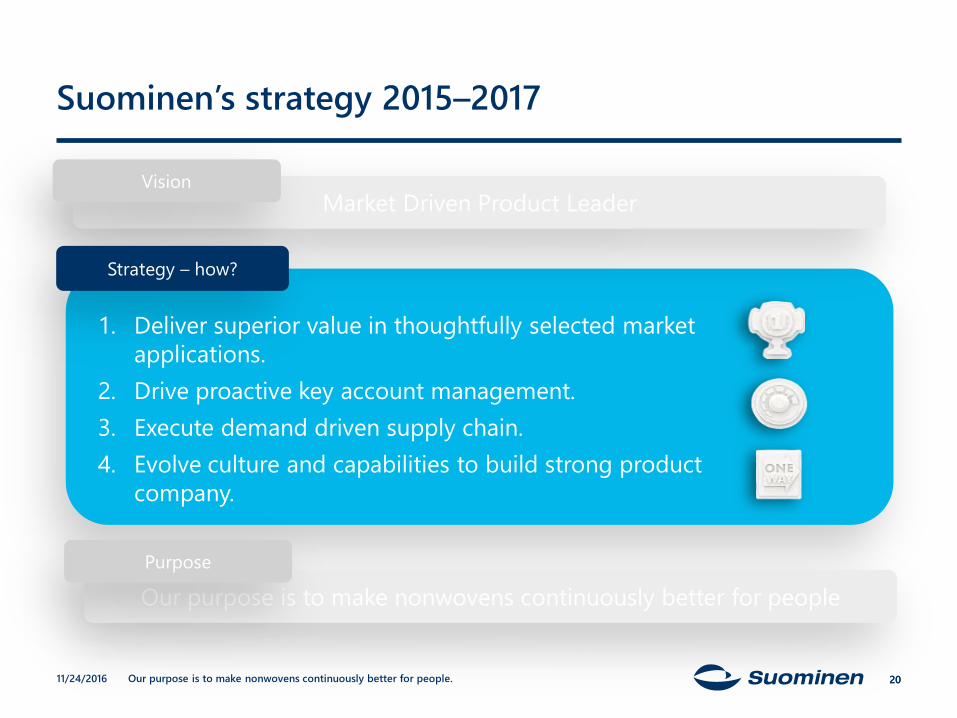
Suominen’s strategy 2015–2017
20
Market Driven Product LeaderVision
Strategy – how?
1. Deliver superior value in thoughtfully selected market applications.
2. Drive proactive key account management. 3. Execute demand driven supply chain. 4. Evolve culture and capabilities to build strong product
company.
Our purpose is to make nonwovens continuously better for peoplePurpose
2011/24/2016
Our purpose is to make nonwovens continuously better for people.
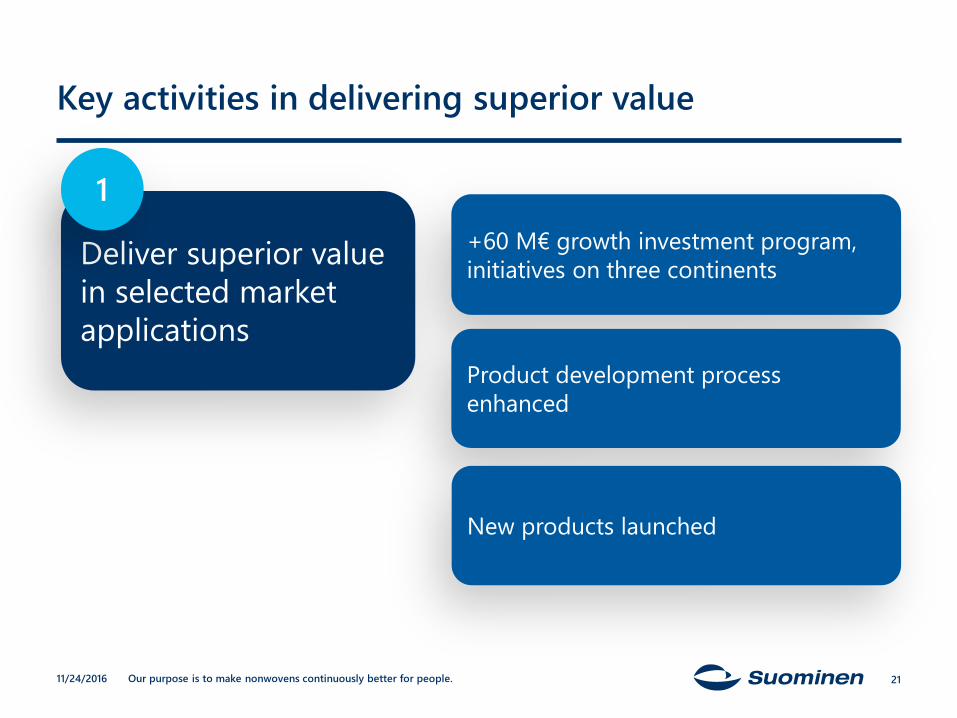
Deliver superior value in selected market applications
Key activities in delivering superior value
21
+60 M€ growth investment program, initiatives on three continents
Product development process enhanced
New products launched
1
11/24/2016
Our purpose is to make nonwovens continuously better for people.
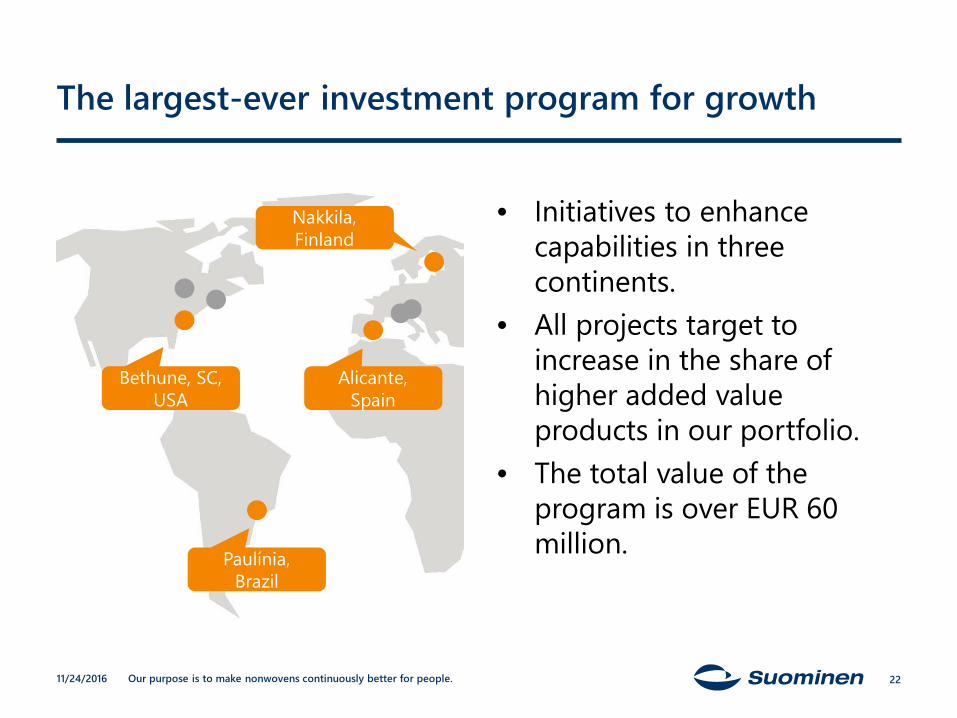
The largest-ever investment program for growth
22
Bethune, SC, USA
Paulínia, Brazil
Alicante, Spain
Nakkila, Finland
11/24/2016
• Initiatives to enhancecapabilities in threecontinents.
• All projects target to increase in the share of higher added valueproducts in our portfolio.
• The total value of theprogram is over EUR 60 million.
Our purpose is to make nonwovens continuously better for people.
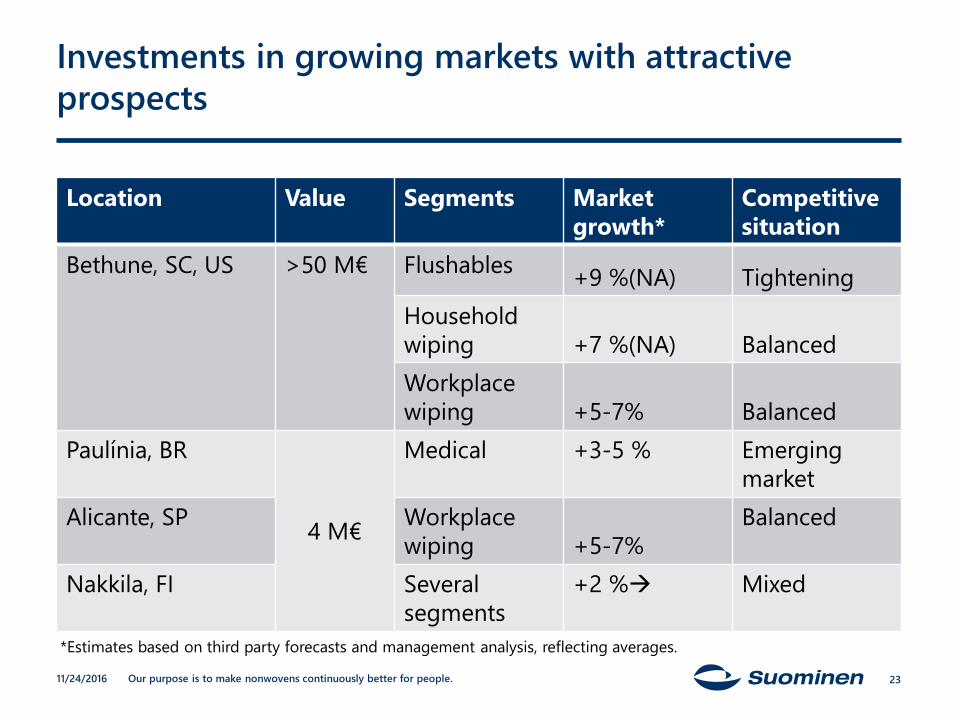
Investments in growing markets with attractiveprospects
Location Value Segments Market growth*
Competitivesituation
Bethune, SC, US >50 M€ Flushables +9 %(NA) TighteningHouseholdwiping +7 %(NA) BalancedWorkplacewiping +5-7% Balanced
Paulínia, BR
4 M€
Medical +3-5 % Emergingmarket
Alicante, SP Workplacewiping +5-7%
Balanced
Nakkila, FI Severalsegments
+2 % Mixed
11/24/2016 23
*Estimates based on third party forecasts and management analysis, reflecting averages.
Our purpose is to make nonwovens continuously better for people.
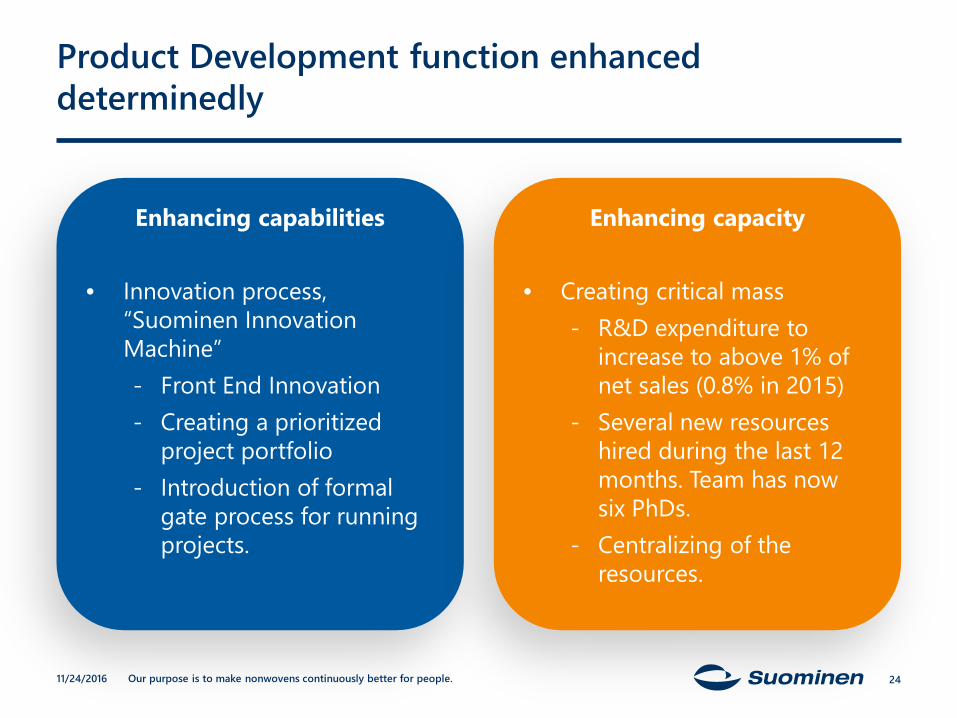
Product Development function enhanced determinedly
24
Enhancing capabilities
• Innovation process,“Suominen Innovation Machine”- Front End Innovation- Creating a prioritized
project portfolio - Introduction of formal
gate process for running projects.
Enhancing capacity
• Creating critical mass- R&D expenditure to
increase to above 1% of net sales (0.8% in 2015)
- Several new resources hired during the last 12 months. Team has now six PhDs.
- Centralizing of the resources.
11/24/2016
Our purpose is to make nonwovens continuously better for people.
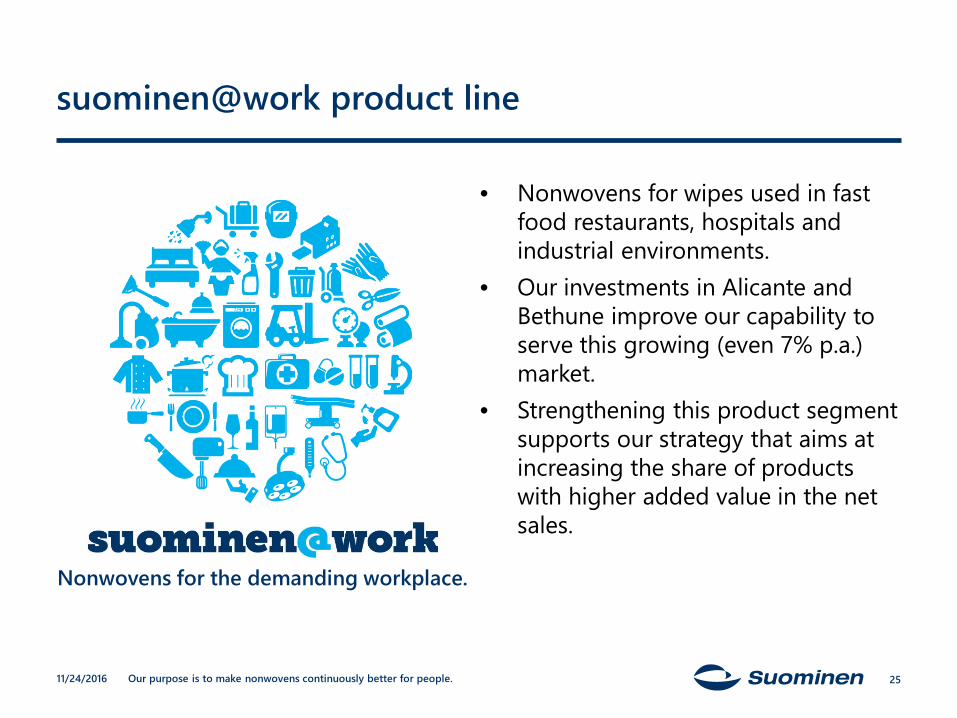
suominen@work product line
• Nonwovens for wipes used in fast food restaurants, hospitals and industrial environments.
• Our investments in Alicante and Bethune improve our capability to serve this growing (even 7% p.a.) market.
• Strengthening this product segment supports our strategy that aims at increasing the share of products with higher added value in the net sales.
11/24/2016 25
Nonwovens for the demanding workplace.
Our purpose is to make nonwovens continuously better for people.
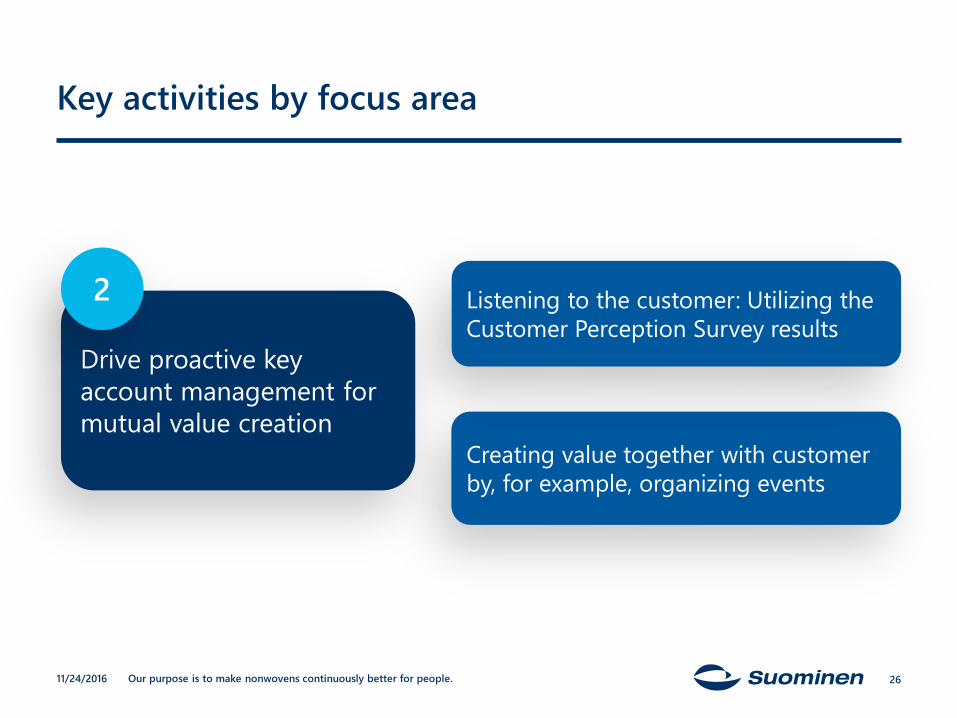
Drive proactive key account management for mutual value creation
Key activities by focus area
26
Creating value together with customer by, for example, organizing events
Listening to the customer: Utilizing the Customer Perception Survey results
2
11/24/2016
Our purpose is to make nonwovens continuously better for people.
Execute demand driven supply chain
Key activities by focus area
27
Defining and implementing standardized global processes
3
Comprehensive ICT systems renewal –aim at an efficient, global supply chain
11/24/2016
Our purpose is to make nonwovens continuously better for people.
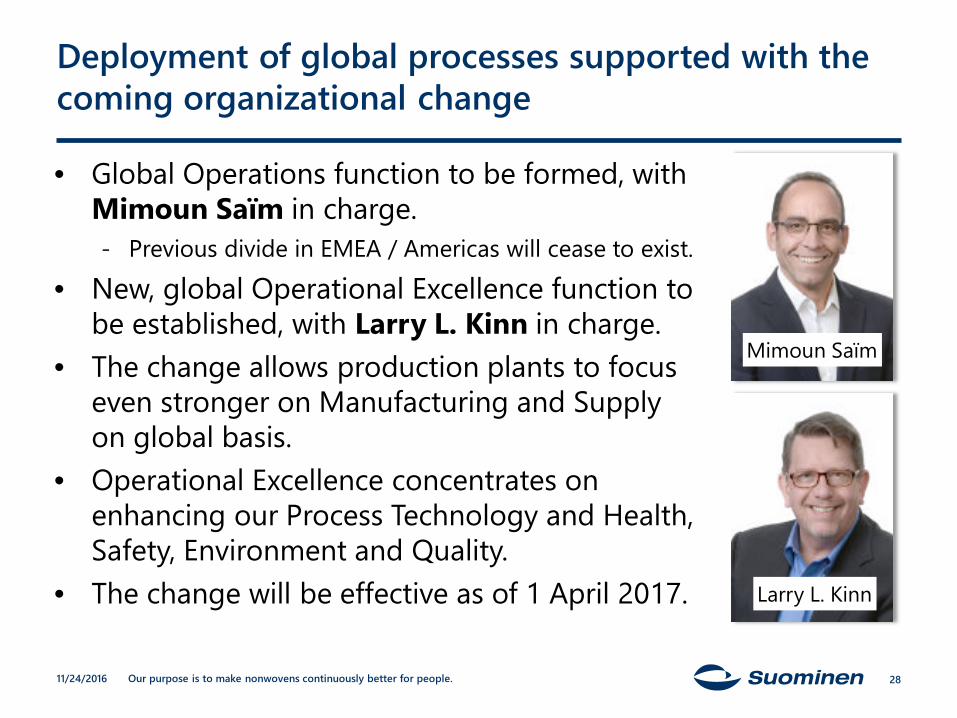
Deployment of global processes supported with the coming organizational change
• Global Operations function to be formed, with Mimoun Saïm in charge.- Previous divide in EMEA / Americas will cease to exist.
• New, global Operational Excellence function to be established, with Larry L. Kinn in charge.
• The change allows production plants to focus even stronger on Manufacturing and Supply on global basis.
• Operational Excellence concentrates on enhancing our Process Technology and Health, Safety, Environment and Quality.
• The change will be effective as of 1 April 2017.
11/24/2016 28
Mimoun Saïm
Larry L. Kinn
Our purpose is to make nonwovens continuously better for people.
Evolve culture and capabilities to build strong product company
Key activities by focus area
29
4
Pivotal recruitments building new and enhanced capabilities in several areas
Strategic sustainability initiatives in progress, e.g., blind recruiting
11/24/2016
Our purpose is to make nonwovens continuously better for people.
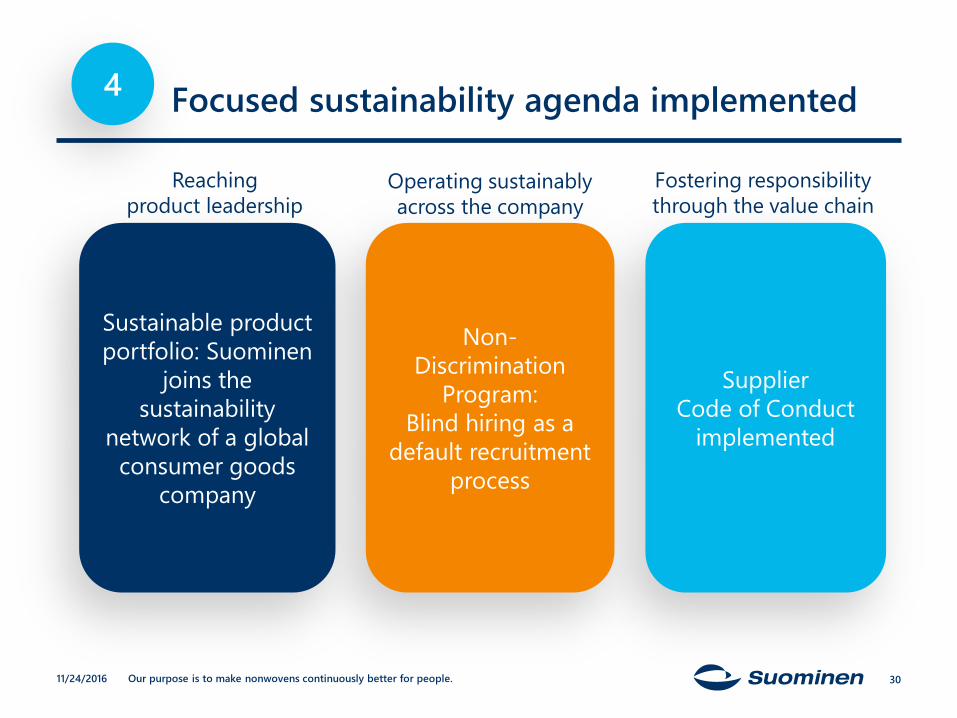
SupplierCode of Conduct
implemented
Sustainable product portfolio: Suominen
joins the sustainability
network of a global consumer goods
company
Non-Discrimination
Program:Blind hiring as a
default recruitment process
Reachingproduct leadership
Fostering responsibilitythrough the value chain
Operating sustainablyacross the company
3011/24/2016
Focused sustainability agenda implemented4
Our purpose is to make nonwovens continuously better for people.
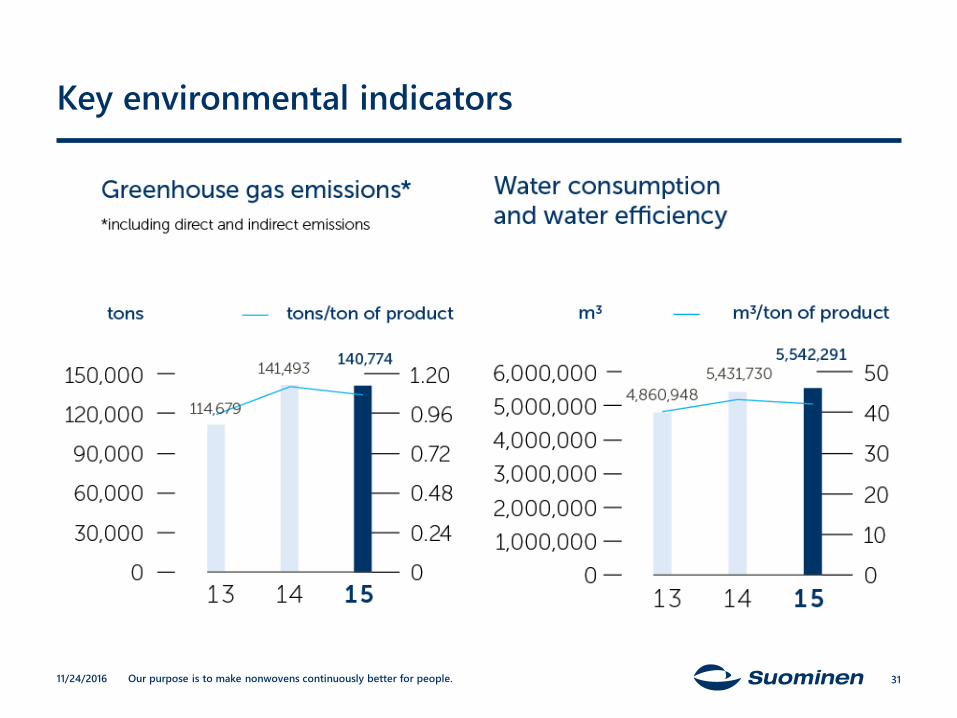
Key environmental indicators
11/24/2016 31
Our purpose is to make nonwovens continuously better for people.
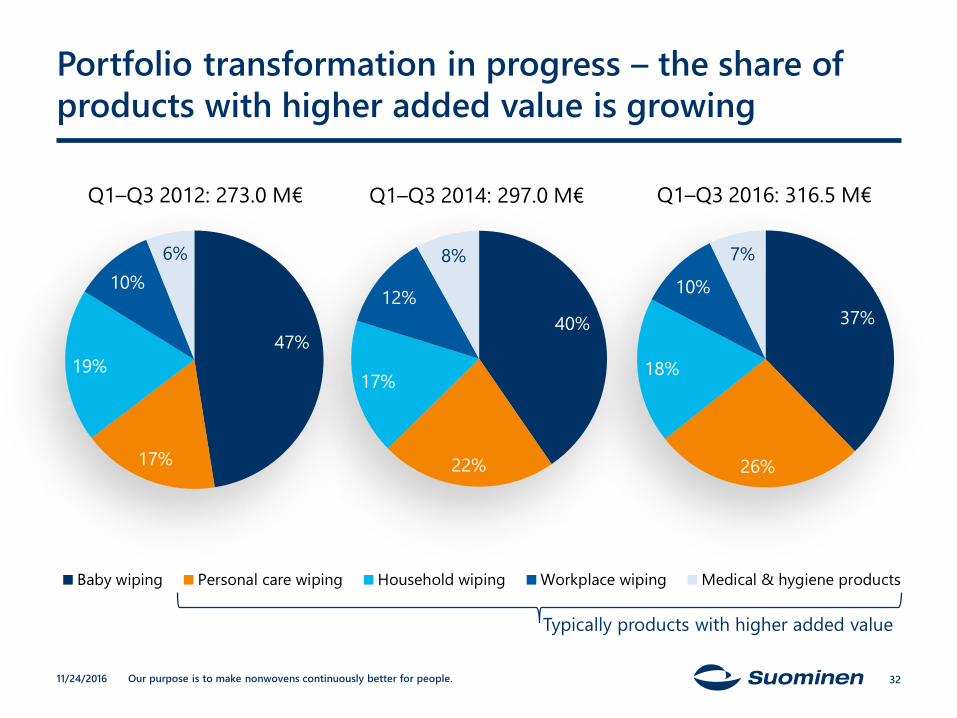
47%
17%
19%
10%6%
Baby wiping Personal care wiping Household wiping Workplace wiping Medical & hygiene products
Q1–Q3 2012: 273.0 M€
40%
22%
17%
12%
8%
Q1–Q3 2014: 297.0 M€
Portfolio transformation in progress – the share of products with higher added value is growing
11/24/2016 32
37%
26%
18%
10%
7%
Q1–Q3 2016: 316.5 M€
Typically products with higher added value
Our purpose is to make nonwovens continuously better for people.
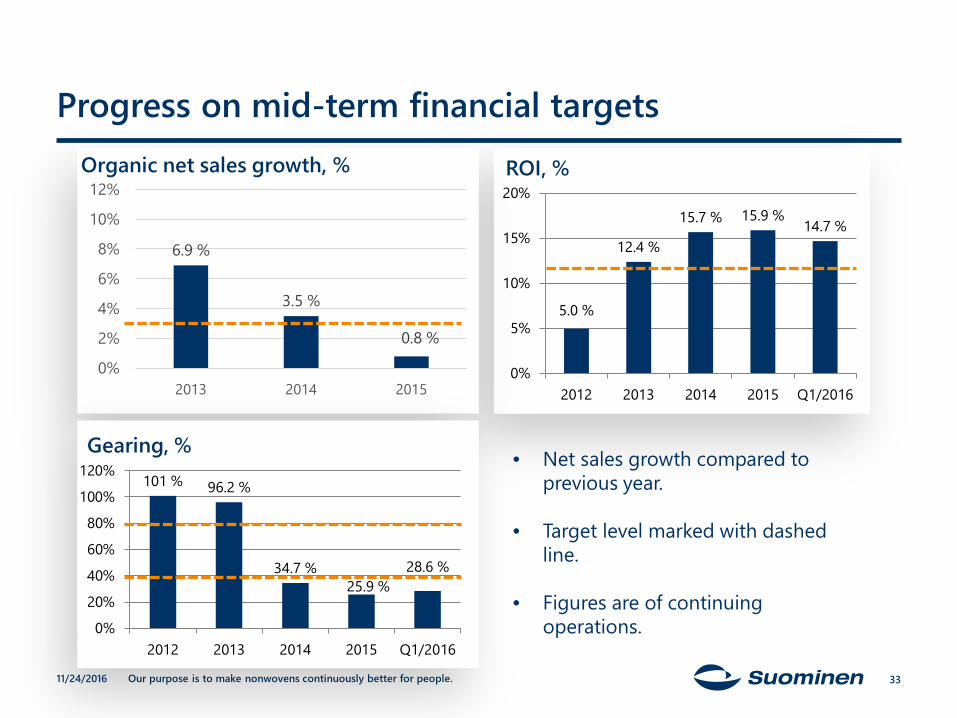
5.0 %
12.4 %
15.7 % 15.9 %14.7 %
0%
5%
10%
15%
20%
2012 2013 2014 2015 Q1/2016
ROI, %
6.9 %
3.5 %
0.8 %
0%
2%
4%
6%
8%
10%
12%
2013 2014 2015
Organic net sales growth, %
101 % 96.2 %
34.7 %25.9 %
28.6 %
0%
20%
40%
60%
80%
100%
120%
2012 2013 2014 2015 Q1/2016
Gearing, %
Progress on mid-term financial targets
• Net sales growth compared to previous year.
• Target level marked with dashed line.
• Figures are of continuing operations.
3311/24/2016
Our purpose is to make nonwovens continuously better for people.
Key elements of profitability
3411/24/2016
Our purpose is to make nonwovens continuously better for people.
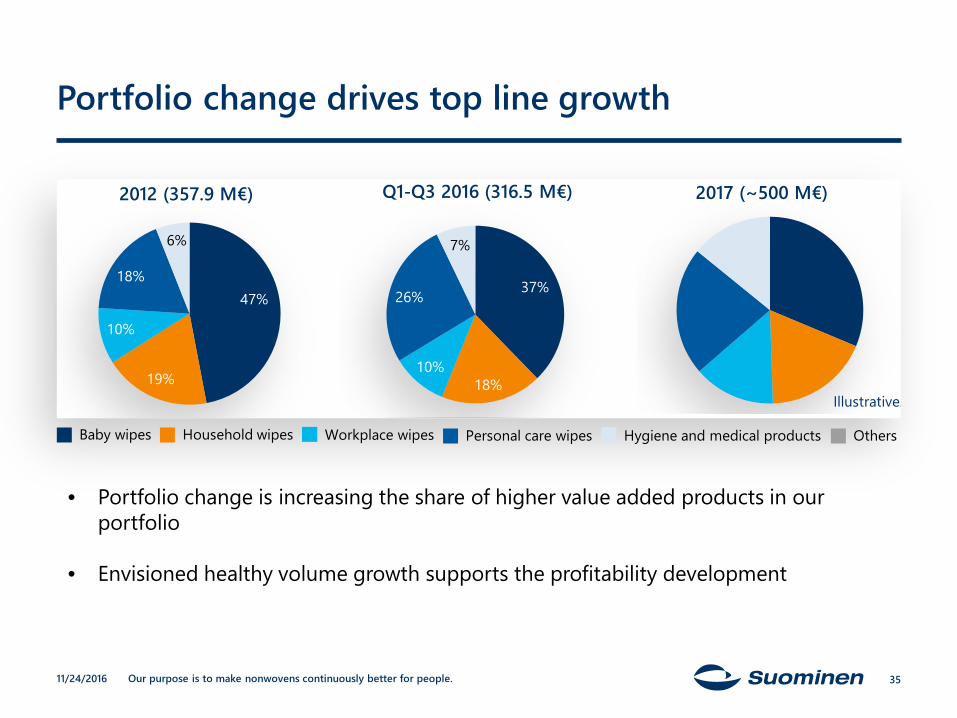
Portfolio change drives top line growth
37%
18%10%
26%
7%
Q1-Q3 2016 (316.5 M€) 2017 (~500 M€)
Illustrative.
• Portfolio change is increasing the share of higher value added products in our portfolio
• Envisioned healthy volume growth supports the profitability development
47%
19%
10%
18%
6%
2012 (357.9 M€)
Baby wipes Household wipes Workplace wipes Personal care wipes Hygiene and medical products Others
11/24/2016 35
Our purpose is to make nonwovens continuously better for people.
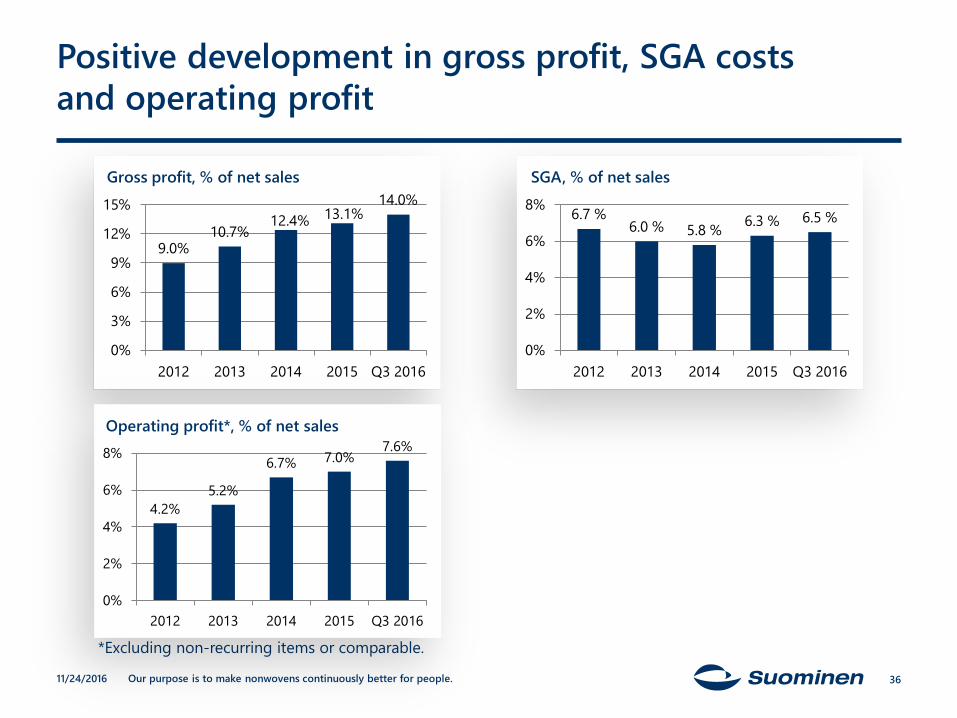
9.0%10.7%
12.4% 13.1%14.0%
0%
3%
6%
9%
12%
15%
2012 2013 2014 2015 Q3 2016
Gross profit, % of net sales
Positive development in gross profit, SGA costsand operating profit
6.7 %6.0 % 5.8 % 6.3 % 6.5 %
0%
2%
4%
6%
8%
2012 2013 2014 2015 Q3 2016
SGA, % of net sales
*Excluding non-recurring items or comparable.
4.2%5.2%
6.7% 7.0%7.6%
0%
2%
4%
6%
8%
2012 2013 2014 2015 Q3 2016
Operating profit*, % of net sales
11/24/2016 36
Our purpose is to make nonwovens continuously better for people.
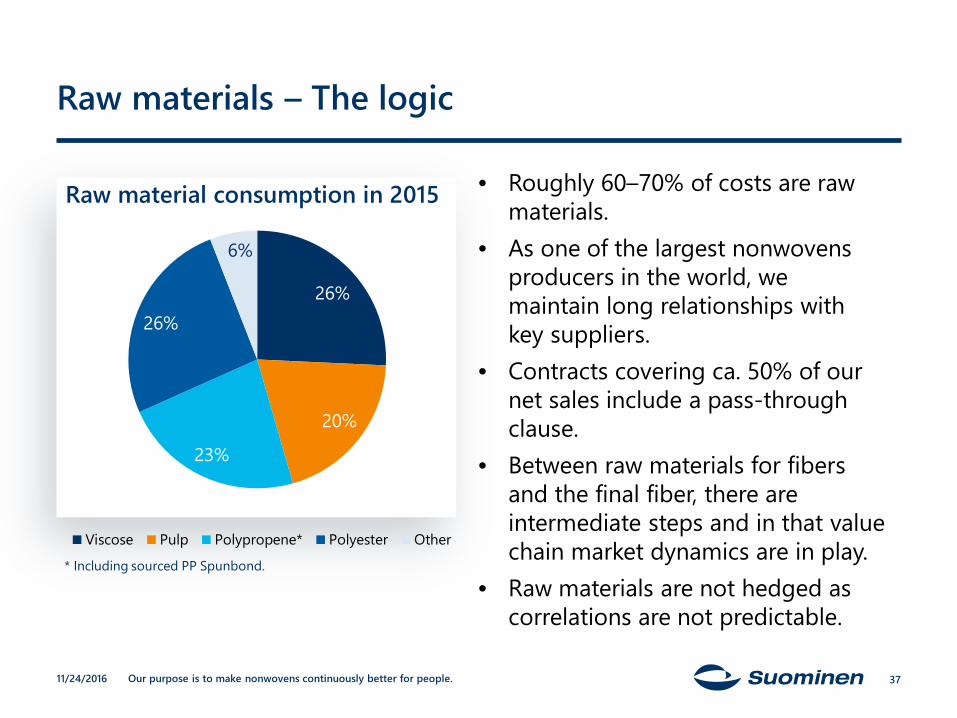
Raw materials – The logic
• Roughly 60–70% of costs are raw materials.
• As one of the largest nonwovens producers in the world, we maintain long relationships with key suppliers.
• Contracts covering ca. 50% of our net sales include a pass-through clause.
• Between raw materials for fibers and the final fiber, there are intermediate steps and in that value chain market dynamics are in play.
• Raw materials are not hedged as correlations are not predictable.
26%
20%
23%
26%
6%
Viscose Pulp Polypropene* Polyester Other
Raw material consumption in 2015
* Including sourced PP Spunbond.
11/24/2016 37
Our purpose is to make nonwovens continuously better for people.
EUR/USD – A factor to pay attention to
• We have estimated that 10% change in EUR/USD exchange rate should have, based on the current business structure, on a full year basis, approximately 2.5 MEUR effect on operating profit.
11/24/2016 38
Our purpose is to make nonwovens continuously better for people.
FinancialreviewQ3 2016
11/24/2016 39
Our purpose is to make nonwovens continuously better for people.
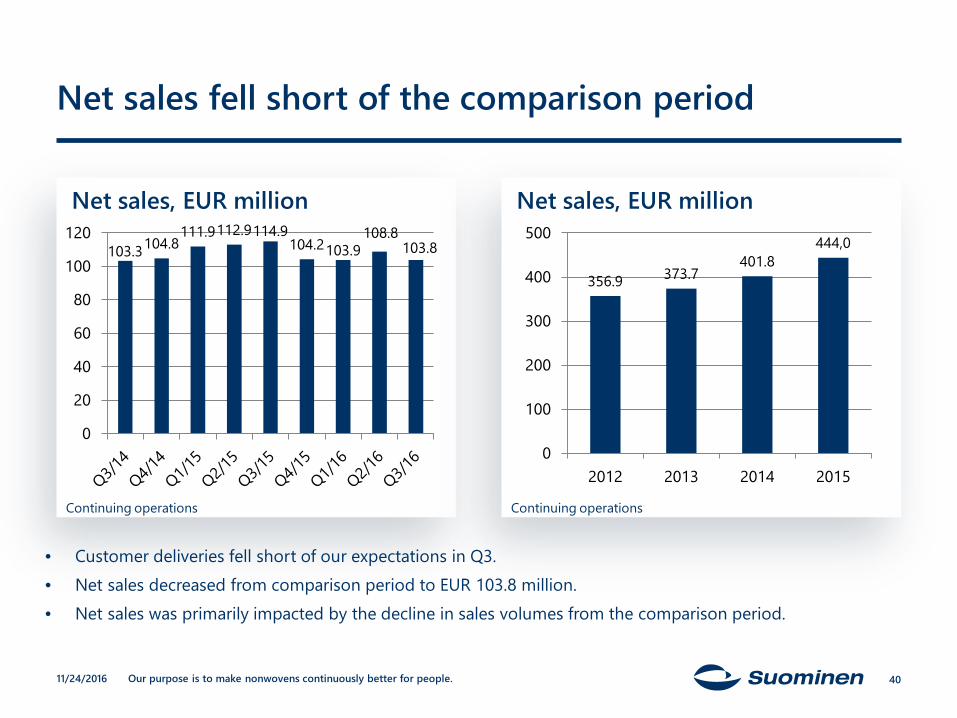
Net sales fell short of the comparison period
Net sales, EUR million Net sales, EUR million
103.3104.8111.9112.9114.9
104.2103.9108.8
103.8
0
20
40
60
80
100
120
356.9 373.7401.8
444,0
0
100
200
300
400
500
2012 2013 2014 2015
• Customer deliveries fell short of our expectations in Q3.• Net sales decreased from comparison period to EUR 103.8 million.• Net sales was primarily impacted by the decline in sales volumes from the comparison period.
Continuing operations Continuing operations
11/24/2016 40
Our purpose is to make nonwovens continuously better for people.
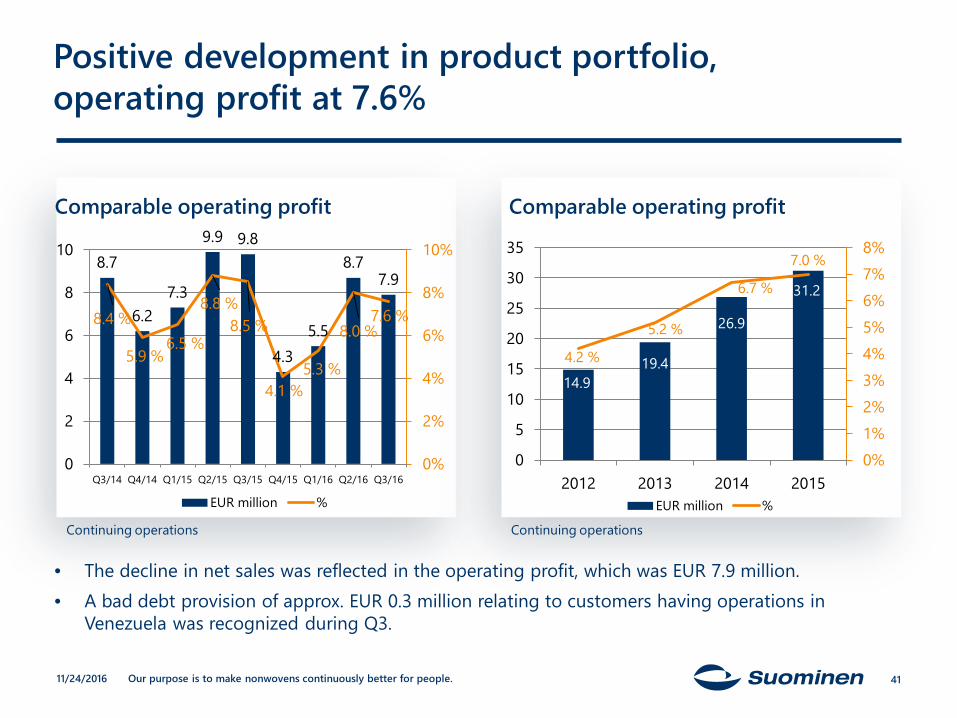
8.7
6.27.3
9.9 9.8
4.35.5
8.77.9
8.4 %
5.9 %6.5 %
8.8 %8.5 %
4.1 %5.3 %
8.0 %7.6 %
0%
2%
4%
6%
8%
10%
0
2
4
6
8
10
Q3/14 Q4/14 Q1/15 Q2/15 Q3/15 Q4/15 Q1/16 Q2/16 Q3/16
EUR million %
Positive development in product portfolio, operating profit at 7.6%
Comparable operating profit Comparable operating profit
• The decline in net sales was reflected in the operating profit, which was EUR 7.9 million.• A bad debt provision of approx. EUR 0.3 million relating to customers having operations in
Venezuela was recognized during Q3.
Continuing operations
14.919.4
26.9
31.2
4.2 %
5.2 %
6.7 %
7.0 %
0%1%2%3%4%5%6%7%8%
0
5
10
15
20
25
30
35
2012 2013 2014 2015EUR million %
Continuing operations
11/24/2016 41
Our purpose is to make nonwovens continuously better for people.
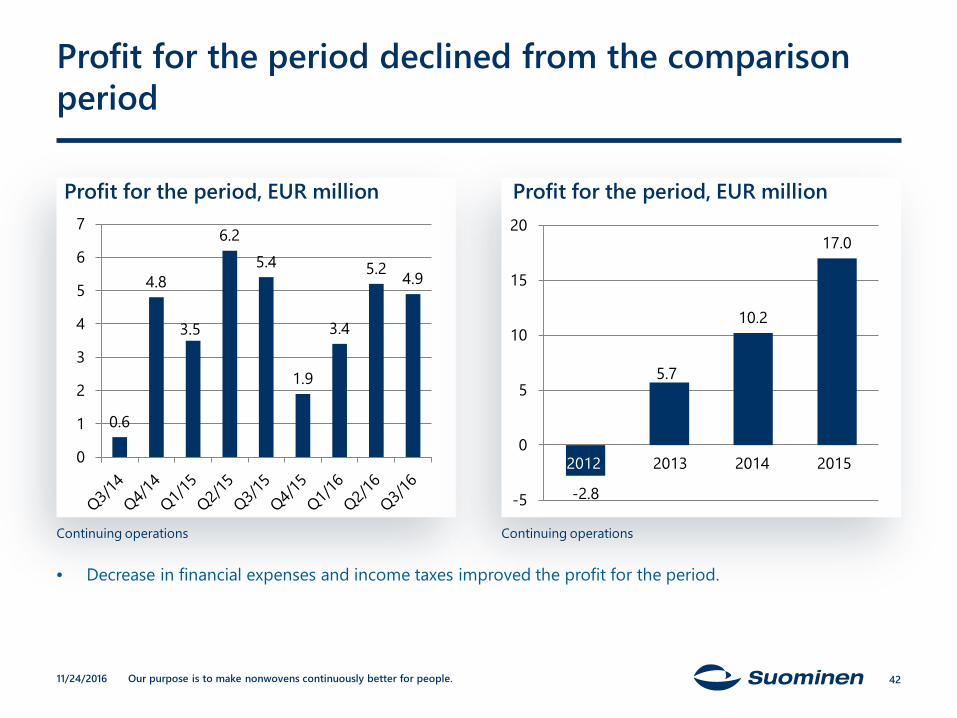
Profit for the period declined from the comparison period
Profit for the period, EUR million Profit for the period, EUR million
0.6
4.8
3.5
6.25.4
1.9
3.4
5.2 4.9
0
1
2
3
4
5
6
7
-2.8
5.7
10.2
17.0
-5
0
5
10
15
20
Continuing operations Continuing operations
11/24/2016 42
2012 2013 2014 2015
• Decrease in financial expenses and income taxes improved the profit for the period.
Our purpose is to make nonwovens continuously better for people.
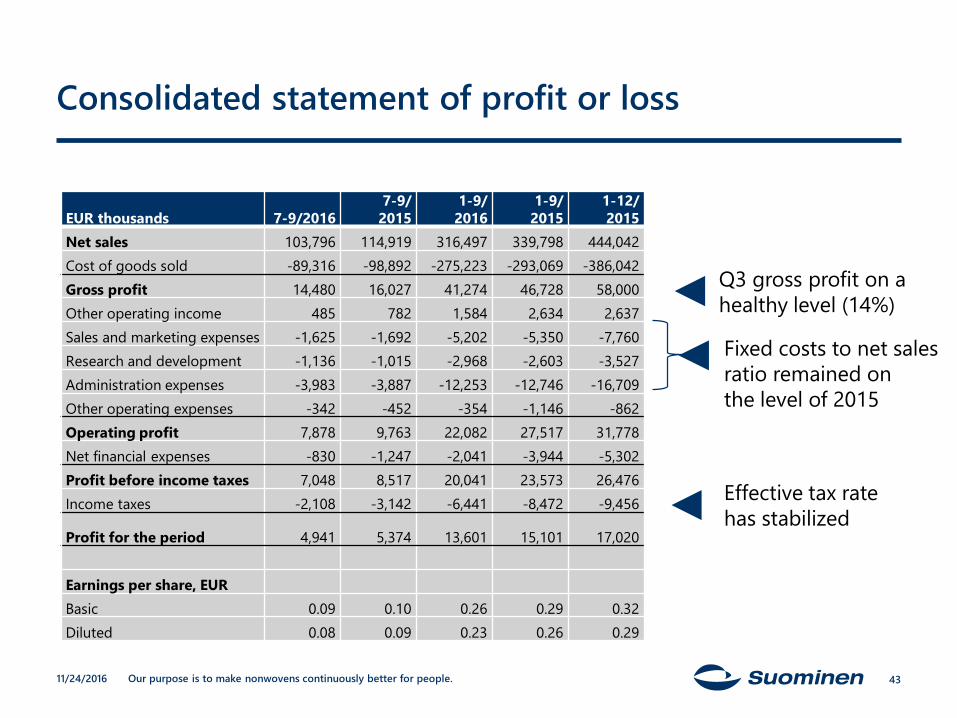
Consolidated statement of profit or loss
11/24/2016 43
EUR thousands 7-9/20167-9/
20151-9/
20161-9/
20151-12/2015
Net sales 103,796 114,919 316,497 339,798 444,042Cost of goods sold -89,316 -98,892 -275,223 -293,069 -386,042Gross profit 14,480 16,027 41,274 46,728 58,000Other operating income 485 782 1,584 2,634 2,637Sales and marketing expenses -1,625 -1,692 -5,202 -5,350 -7,760Research and development -1,136 -1,015 -2,968 -2,603 -3,527Administration expenses -3,983 -3,887 -12,253 -12,746 -16,709Other operating expenses -342 -452 -354 -1,146 -862Operating profit 7,878 9,763 22,082 27,517 31,778Net financial expenses -830 -1,247 -2,041 -3,944 -5,302Profit before income taxes 7,048 8,517 20,041 23,573 26,476Income taxes -2,108 -3,142 -6,441 -8,472 -9,456
Profit for the period 4,941 5,374 13,601 15,101 17,020
Earnings per share, EURBasic 0.09 0.10 0.26 0.29 0.32Diluted 0.08 0.09 0.23 0.26 0.29
Q3 gross profit on a healthy level (14%)
Fixed costs to net sales ratio remained onthe level of 2015
Effective tax ratehas stabilized
Our purpose is to make nonwovens continuously better for people.
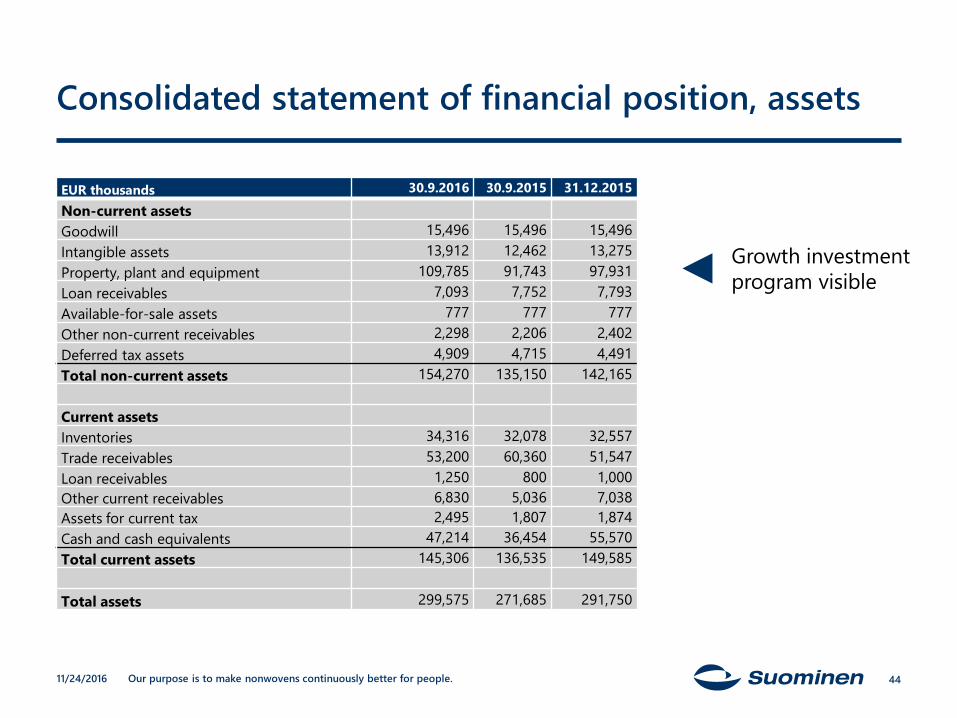
Consolidated statement of financial position, assets
EUR thousands 30.9.2016 30.9.2015 31.12.2015
Non-current assetsGoodwill 15,496 15,496 15,496Intangible assets 13,912 12,462 13,275Property, plant and equipment 109,785 91,743 97,931Loan receivables 7,093 7,752 7,793Available-for-sale assets 777 777 777Other non-current receivables 2,298 2,206 2,402Deferred tax assets 4,909 4,715 4,491Total non-current assets 154,270 135,150 142,165
Current assetsInventories 34,316 32,078 32,557Trade receivables 53,200 60,360 51,547Loan receivables 1,250 800 1,000Other current receivables 6,830 5,036 7,038Assets for current tax 2,495 1,807 1,874Cash and cash equivalents 47,214 36,454 55,570Total current assets 145,306 136,535 149,585
Total assets 299,575 271,685 291,750
11/24/2016 44
Growth investmentprogram visible
Our purpose is to make nonwovens continuously better for people.
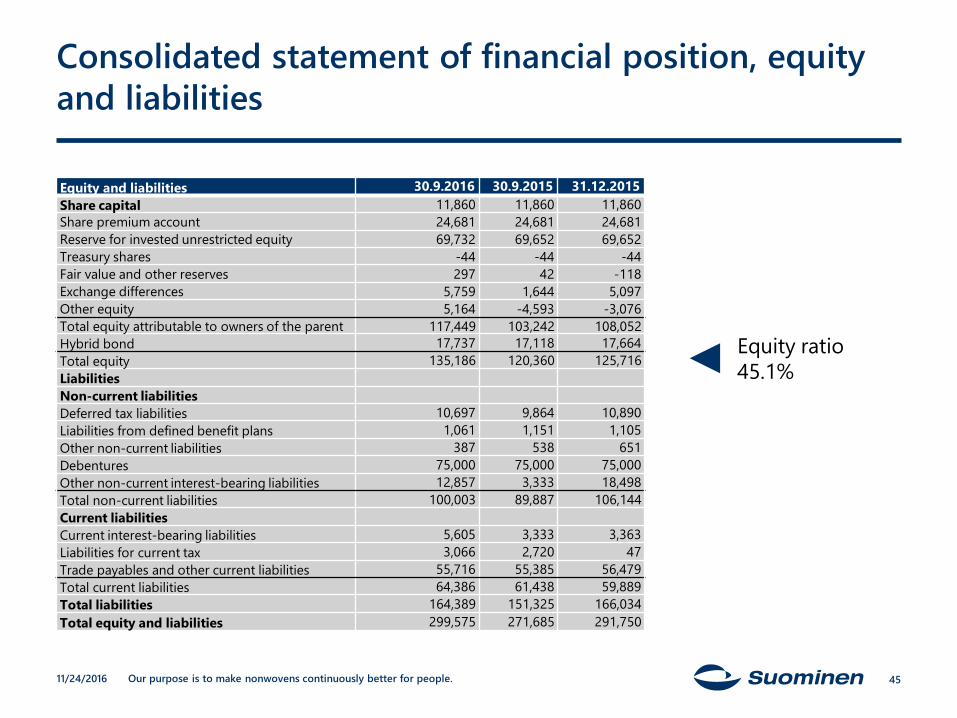
Consolidated statement of financial position, equity and liabilities
11/24/2016 45
Equity and liabilities 30.9.2016 30.9.2015 31.12.2015Share capital 11,860 11,860 11,860Share premium account 24,681 24,681 24,681Reserve for invested unrestricted equity 69,732 69,652 69,652Treasury shares -44 -44 -44Fair value and other reserves 297 42 -118Exchange differences 5,759 1,644 5,097Other equity 5,164 -4,593 -3,076Total equity attributable to owners of the parent 117,449 103,242 108,052Hybrid bond 17,737 17,118 17,664Total equity 135,186 120,360 125,716LiabilitiesNon-current liabilitiesDeferred tax liabilities 10,697 9,864 10,890Liabilities from defined benefit plans 1,061 1,151 1,105Other non-current liabilities 387 538 651Debentures 75,000 75,000 75,000Other non-current interest-bearing liabilities 12,857 3,333 18,498Total non-current liabilities 100,003 89,887 106,144Current liabilitiesCurrent interest-bearing liabilities 5,605 3,333 3,363Liabilities for current tax 3,066 2,720 47Trade payables and other current liabilities 55,716 55,385 56,479Total current liabilities 64,386 61,438 59,889Total liabilities 164,389 151,325 166,034Total equity and liabilities 299,575 271,685 291,750
Equity ratio45.1%
Our purpose is to make nonwovens continuously better for people.
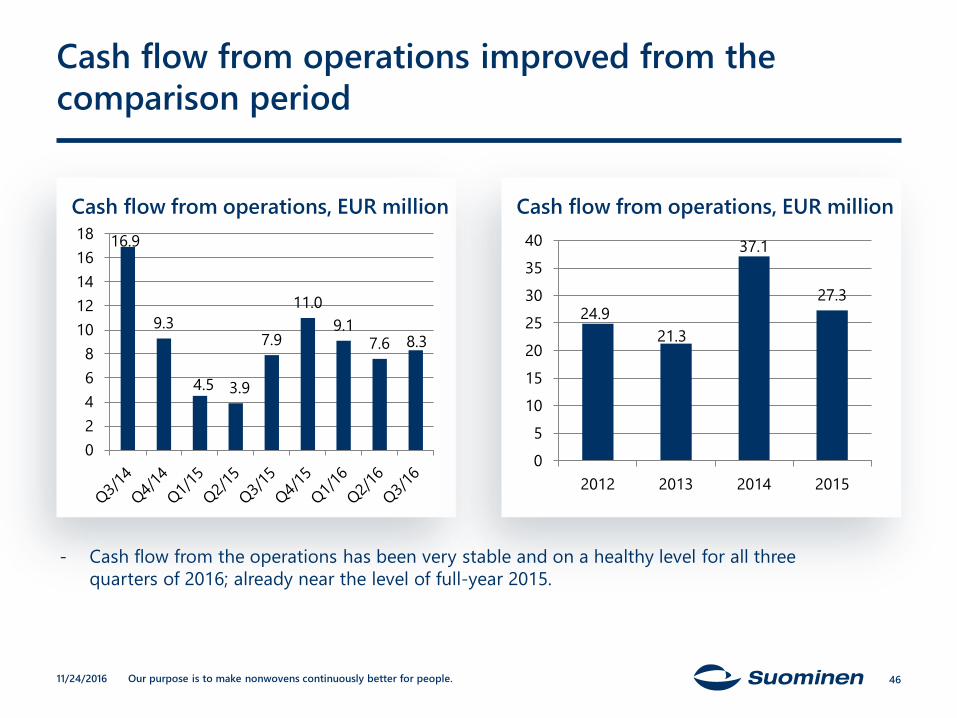
Cash flow from operations improved from the comparison period
Cash flow from operations, EUR million Cash flow from operations, EUR million16.9
9.3
4.5 3.9
7.9
11.09.1
7.6 8.3
02468
1012141618
24.921.3
37.1
27.3
05
10152025303540
2012 2013 2014 2015
- Cash flow from the operations has been very stable and on a healthy level for all three quarters of 2016; already near the level of full-year 2015.
11/24/2016 46
Our purpose is to make nonwovens continuously better for people.
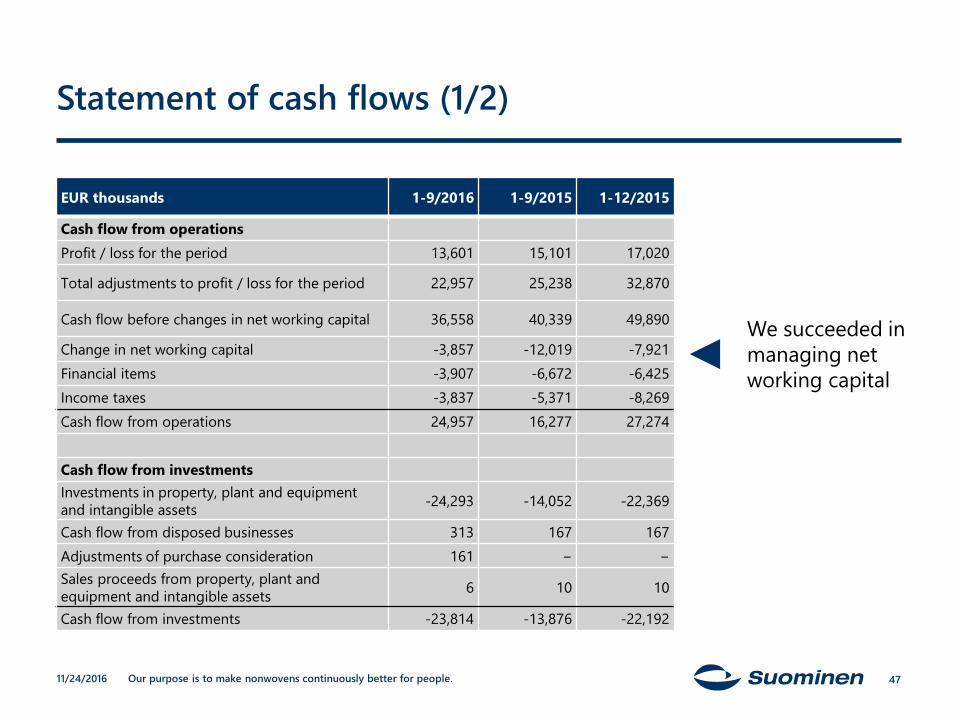
Statement of cash flows (1/2)
11/24/2016 47
EUR thousands 1-9/2016 1-9/2015 1-12/2015
Cash flow from operationsProfit / loss for the period 13,601 15,101 17,020
Total adjustments to profit / loss for the period 22,957 25,238 32,870
Cash flow before changes in net working capital 36,558 40,339 49,890
Change in net working capital -3,857 -12,019 -7,921Financial items -3,907 -6,672 -6,425Income taxes -3,837 -5,371 -8,269Cash flow from operations 24,957 16,277 27,274
Cash flow from investmentsInvestments in property, plant and equipment and intangible assets -24,293 -14,052 -22,369
Cash flow from disposed businesses 313 167 167Adjustments of purchase consideration 161 − −Sales proceeds from property, plant and equipment and intangible assets 6 10 10
Cash flow from investments -23,814 -13,876 -22,192
We succeeded inmanaging networking capital
Our purpose is to make nonwovens continuously better for people.
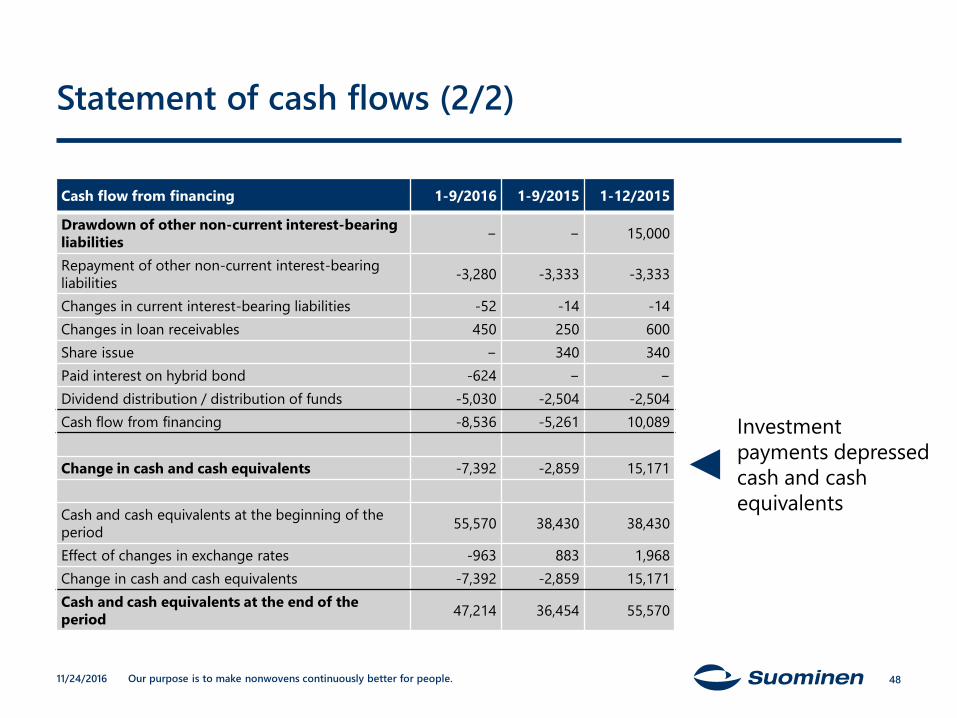
Statement of cash flows (2/2)
11/24/2016 48
Cash flow from financing 1-9/2016 1-9/2015 1-12/2015
Drawdown of other non-current interest-bearing liabilities − − 15,000
Repayment of other non-current interest-bearing liabilities -3,280 -3,333 -3,333
Changes in current interest-bearing liabilities -52 -14 -14Changes in loan receivables 450 250 600Share issue − 340 340Paid interest on hybrid bond -624 − −Dividend distribution / distribution of funds -5,030 -2,504 -2,504Cash flow from financing -8,536 -5,261 10,089
Change in cash and cash equivalents -7,392 -2,859 15,171
Cash and cash equivalents at the beginning of the period 55,570 38,430 38,430
Effect of changes in exchange rates -963 883 1,968Change in cash and cash equivalents -7,392 -2,859 15,171Cash and cash equivalents at the end of the period 47,214 36,454 55,570
Investmentpayments depressedcash and cash equivalents
Our purpose is to make nonwovens continuously better for people.
Outlook for full year 2016 updated on 20 September
• On 20 September 2016, Suominen revised its outlook and announced that it expects that for the full year 2016, its net sales and comparable operating profit will not reach the level of year 2015.
• In 2015, Suominen’s net sales amounted to EUR 444.0 million and comparable operating profit to EUR 31.2 million.
11/24/2016 49
Our purpose is to make nonwovens continuously better for people.
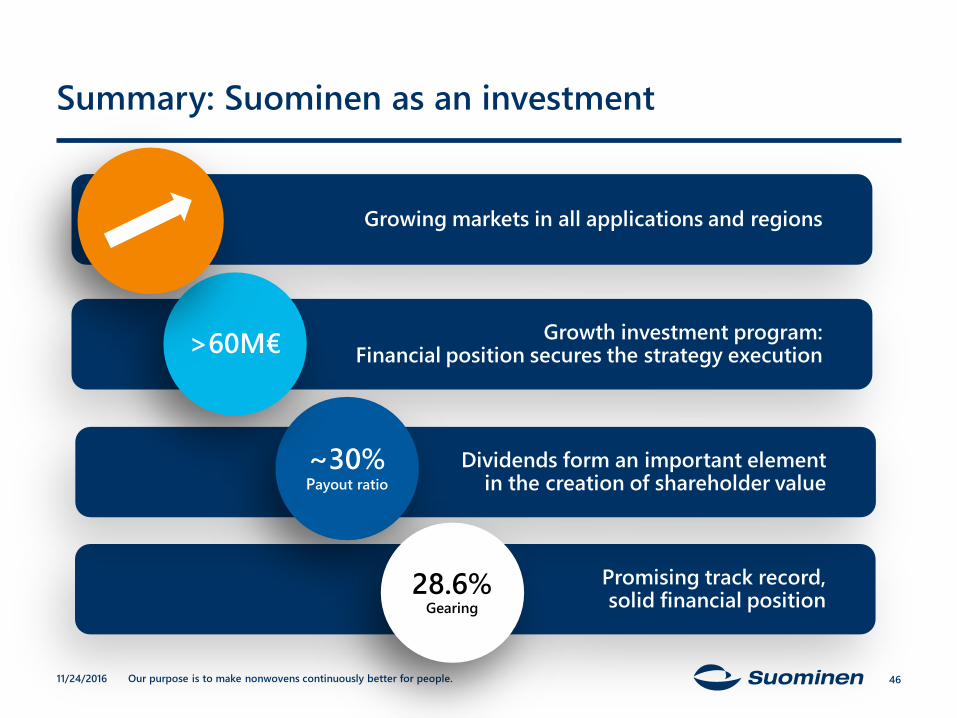
Summary: Suominen as an investment
Promising track record, solid financial position
Growing markets in all applications and regions
Growth investment program: Financial position secures the strategy execution
Dividends form an important elementin the creation of shareholder value
46
~30%Payout ratio
>60M€
28.6%Gearing
11/24/2016
Thank you!
5111/24/2016
Our purpose is to make nonwovens continuously better for people.
Appendix
11/24/2016 52
Our purpose is to make nonwovens continuously better for people.
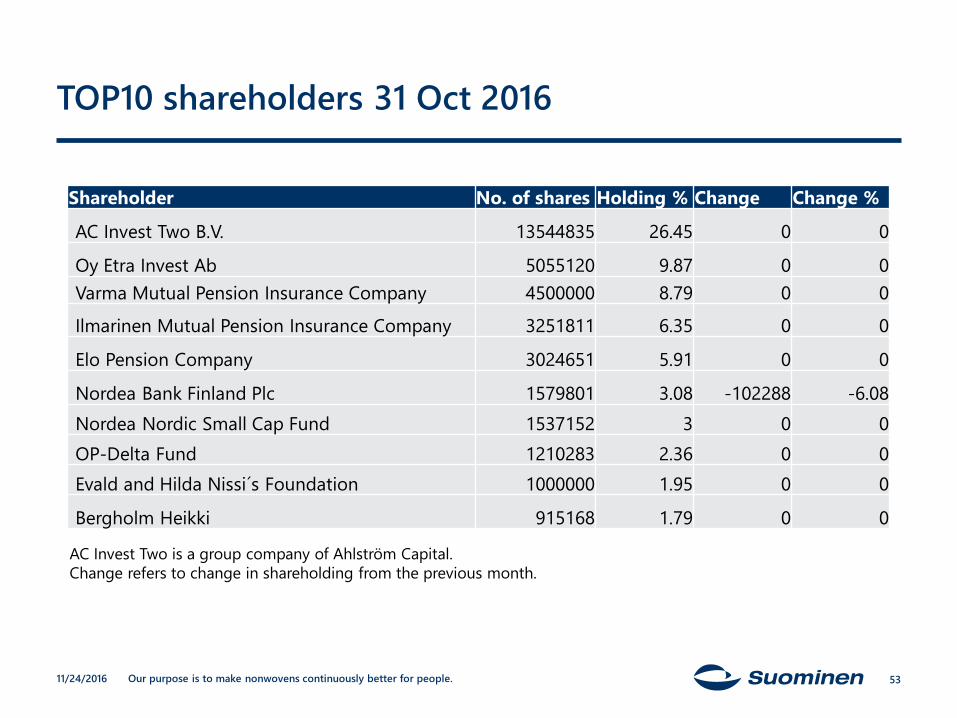
TOP10 shareholders 31 Oct 2016
11/24/2016
Shareholder No. of shares Holding % Change Change %
AC Invest Two B.V. 13544835 26.45 0 0
Oy Etra Invest Ab 5055120 9.87 0 0Varma Mutual Pension Insurance Company 4500000 8.79 0 0
Ilmarinen Mutual Pension Insurance Company 3251811 6.35 0 0
Elo Pension Company 3024651 5.91 0 0
Nordea Bank Finland Plc 1579801 3.08 -102288 -6.08Nordea Nordic Small Cap Fund 1537152 3 0 0OP-Delta Fund 1210283 2.36 0 0Evald and Hilda Nissi´s Foundation 1000000 1.95 0 0
Bergholm Heikki 915168 1.79 0 0
AC Invest Two is a group company of Ahlström Capital.Change refers to change in shareholding from the previous month.
53
Our purpose is to make nonwovens continuously better for people.
Reverse share split
• On March 21, Suominen carried out a reverse share split with a 5:1 ratio.
• The target for the reverse split was to make the share more attractive to investors, to enhance share trading conditions and to add flexibility in defining the amount of dividend.
• The arrangement was subject to the resolution of the Annual General Meeting.
• Before the reverse share split, Suominen Corporation had in total 252,425,616 shares. After the reverse share split, the total number of shares in Suominen Corporation is 51,216,232.
11/24/2016 54
Our purpose is to make nonwovens continuously better for people.
Hybrid bond
• In Feb 2014, Suominen issued a convertible hybrid bond of MEUR 17.5 to finance the acquisition of Paulínia plant in Brazil.
• The holders of the bond notes are entitled to convert the notes and the potential accrued capitalized interest related to the notes into Suominen shares. The conversion period started on 11 February 2014 and will end on 10 February 2018.
• The conversion rate is EUR 2.50. • The number of shares in Suominen may increase in total by
maximum of 7,600,320 shares on the basis of the conversion of the remaining bond notes and the potential capitalized interest, if the conversion is carried out by issuing new shares in Suominen.
11/24/2016 55
Our purpose is to make nonwovens continuously better for people.
Restored ability to pay dividends
56
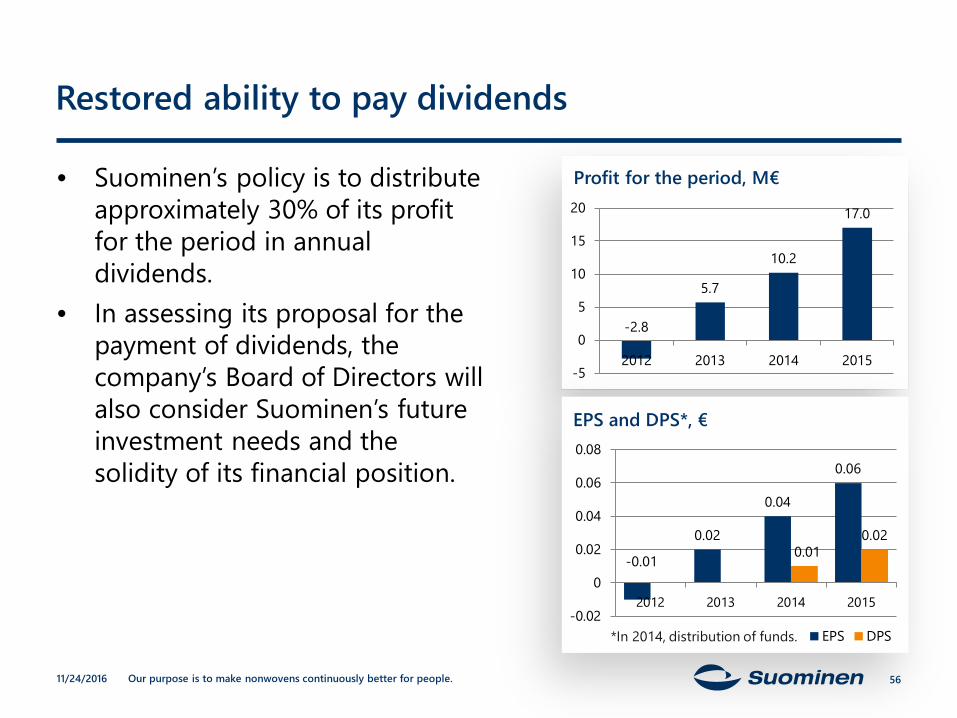
• Suominen’s policy is to distribute approximately 30% of its profit for the period in annual dividends.
• In assessing its proposal for the payment of dividends, the company’s Board of Directors will also consider Suominen’s future investment needs and the solidity of its financial position.
-2.8
5.7
10.2
17.0
-5
0
5
10
15
20
2012 2013 2014 2015
Profit for the period, M€
-0.01
0.02
0.04
0.06
0.010.02
-0.02
0
0.02
0.04
0.06
0.08
2012 2013 2014 2015
EPS DPS
EPS and DPS*, €
11/24/2016
*In 2014, distribution of funds.