Embed Size (px)
Citation preview
-
26 Oct 2015
Interim Report 1 Jan-30 Sep 2015
Suominen Corporation Interim Report 26 October 2015 at 8:30 am (EET)
Suominen Corporation’s Interim Report for January 1 - September 30, 2015:
Positive development continued, guidance regarding the growth of operating
profit specified
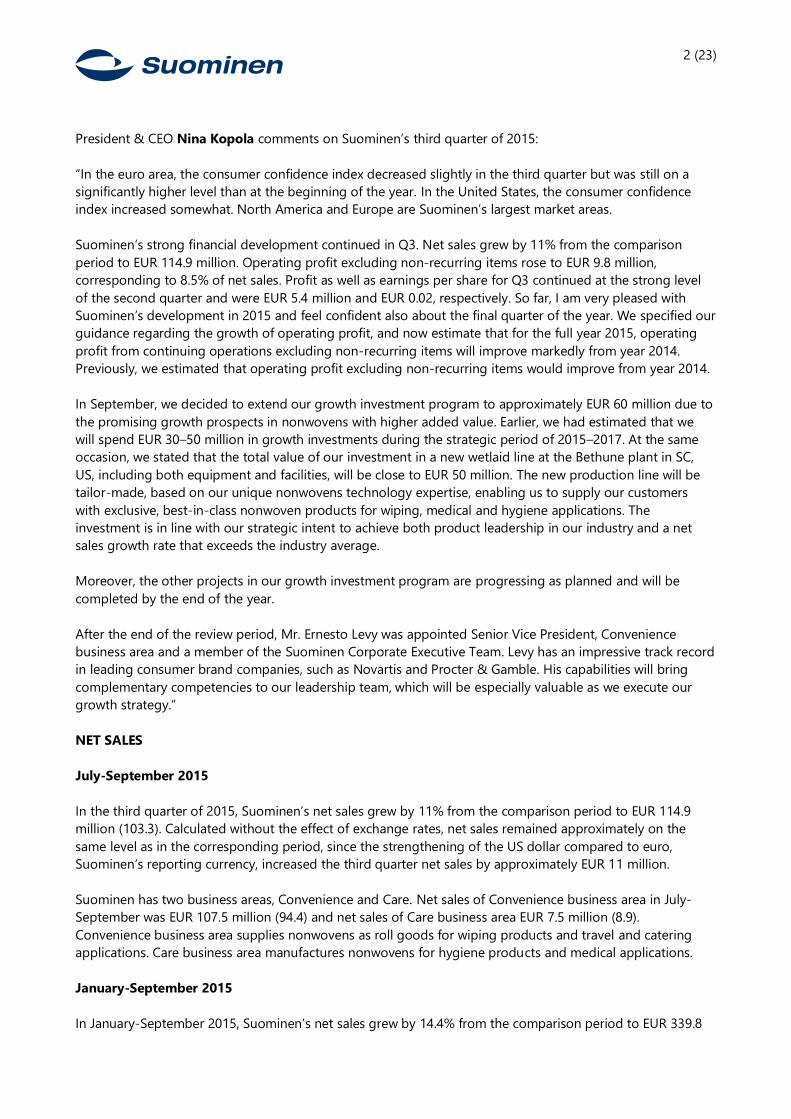
7-9/ 7-9/ 1-9/ 1-9/ 1-12/
KEY FIGURES 2015 2014 2015 2014 2014
Net sales, EUR million 114.9 103.3 339.8 297.0 401.8
Operating profit excluding non-recurring
items, EUR million 9.8 8.7 27.0 20.6 26.9
Operating profit, EUR million 9.8 8.4 27.5 19.8 25.9
Profit for the period, EUR million, continuing
operations 5.4 0.6 15.1 5.4 10.2
Profit/loss for the period, EUR million,
discontinued operations − -1.5 − -5.2 -5.2
Profit/loss for the period, EUR million, total 5.4 -0.9 15.1 0.2 5.0
Earnings per share, EUR, continuing operations 0.02 0.00 0.06 0.02 0.04
Earnings per share, EUR, discontinued
operations − -0.01 − -0.02 -0.02
Earnings per share, basic, EUR, total 0.02 0.00 0.06 0.00 0.02
Cash flow from operations per share, EUR * 0.03 0.07 0.06 0.11 0.15
Return on invested capital, rolling 12
months, % * − − 17.4 10.2 12.0
Return on invested capital, rolling 12 months,
continuing operations, % − − 17.4 13.5 15.7
Gearing, % * − − 30.5 43.3 34.7
* 2014 includes also discontinued operations.
Highlights in July-September 2015:
- Net sales increased by 11.3% and amounted to EUR 114.9 million (103.3).
- Operating profit excluding non-recurring items increased by 12.1% to EUR 9.8 million (8.7).
- Suominen’s investment in a new wetlaid line at the Bethune plant in SC, US, is progressing as planned. In
September, Suominen announced that the total value of the investment will be close to EUR 50 million.
- Suominen decided to extend its growth investment program for the strategic period of 2015–2017 to
approximately EUR 60 million due to the promising growth prospects in the high value added nonwovens.
- Suominen specifies its guidance regarding operating profit for 2015. The company expects that for the full
year 2015, operating profit from continuing operations excluding non-recurring items will improve markedly
from year 2014. Previously, Suominen estimated that for the full year 2015, its operating profit excluding
non-recurring items from continuing operations would improve from year 2014.
- For net sales, Suominen repeats its previous estimate, disclosed on 17 July 2015, that for the full year 2015
the company expects its net sales for continuing operations to improve from year 2014.
- Suominen’s net sales of the continuing operations in 2014 amounted to EUR 401.8 million and operating
profit excluding non-recurring items was EUR 26.9 million.
2 (23)
President & CEO Nina Kopola comments on Suominen’s third quarter of 2015:
“In the euro area, the consumer confidence index decreased slightly in the third quarter but was still on a
significantly higher level than at the beginning of the year. In the United States, the consumer confidence
index increased somewhat. North America and Europe are Suominen’s largest market areas.
Suominen’s strong financial development continued in Q3. Net sales grew by 11% from the comparison
period to EUR 114.9 million. Operating profit excluding non-recurring items rose to EUR 9.8 million,
corresponding to 8.5% of net sales. Profit as well as earnings per share for Q3 continued at the strong level
of the second quarter and were EUR 5.4 million and EUR 0.02, respectively. So far, I am very pleased with
Suominen’s development in 2015 and feel confident also about the final quarter of the year. We specified our
guidance regarding the growth of operating profit, and now estimate that for the full year 2015, operating
profit from continuing operations excluding non-recurring items will improve markedly from year 2014.
Previously, we estimated that operating profit excluding non-recurring items would improve from year 2014.
In September, we decided to extend our growth investment program to approximately EUR 60 million due to
the promising growth prospects in nonwovens with higher added value. Earlier, we had estimated that we
will spend EUR 30–50 million in growth investments during the strategic period of 2015–2017. At the same
occasion, we stated that the total value of our investment in a new wetlaid line at the Bethune plant in SC,
US, including both equipment and facilities, will be close to EUR 50 million. The new production line will be
tailor-made, based on our unique nonwovens technology expertise, enabling us to supply our customers
with exclusive, best-in-class nonwoven products for wiping, medical and hygiene applications. The
investment is in line with our strategic intent to achieve both product leadership in our industry and a net
sales growth rate that exceeds the industry average.
Moreover, the other projects in our growth investment program are progressing as planned and will be
completed by the end of the year.
After the end of the review period, Mr. Ernesto Levy was appointed Senior Vice President, Convenience
business area and a member of the Suominen Corporate Executive Team. Levy has an impressive track record
in leading consumer brand companies, such as Novartis and Procter & Gamble. His capabilities will bring
complementary competencies to our leadership team, which will be especially valuable as we execute our
growth strategy.”
NET SALES
July-September 2015
In the third quarter of 2015, Suominen’s net sales grew by 11% from the comparison period to EUR 114.9
million (103.3). Calculated without the effect of exchange rates, net sales remained approximately on the
same level as in the corresponding period, since the strengthening of the US dollar compared to euro,
Suominen’s reporting currency, increased the third quarter net sales by approximately EUR 11 million.
Suominen has two business areas, Convenience and Care. Net sales of Convenience business area in July-
September was EUR 107.5 million (94.4) and net sales of Care business area EUR 7.5 million (8.9).
Convenience business area supplies nonwovens as roll goods for wiping products and travel and catering
applications. Care business area manufactures nonwovens for hygiene products and medical applications.
January-September 2015
In January-September 2015, Suominen’s net sales grew by 14.4% from the comparison period to EUR 339.8
3 (23)
million (297.0). The strengthening of the US dollar compared to euro, Suominen’s reporting currency,
increased the net sales in January-September by approximately EUR 35 million.
Net sales of Convenience business area in January-September were EUR 315.2 million (272.9) and net sales of
Care business area EUR 24.7 million (24.1). The main application areas for nonwoven materials supplied by
Suominen in January-September were baby wipes (accounting for 40% of the sales), personal care wipes
(24%), household wipes (17%), industrial wipes (11%), and hygiene and medical products (7%). Changes in
the portfolio during January-September 2015 were minor compared to the corresponding period in the
previous year. All nonwovens for wiping products belong to the Convenience business area, and nonwovens
for hygiene and medical products to the Care business area.
OPERATING PROFIT AND RESULT
July-September 2015
Operating profit excluding non-recurring items increased by 12.1% and amounted to EUR 9.8 million (8.7).
Operating profit was EUR 9.8 million (8.4). There were no non-recurring items in the third quarter. Non-
recurring items reported in the third quarter of 2014 amounted to EUR -0.3 million and were attributable to
restructuring costs as well as costs related to acquisition of the Brazilian unit.
The strengthening of the US dollar compared to euro, Suominen’s reporting currency, increased the
operating profit by approximately 14%. If calculated with the average USD exchange rate of July-September
2014, operating would have been EUR 1.4 million lower.
Profit before income taxes for continuing operations in the third quarter was EUR 8.5 million (4.0) and profit
for the period for continuing operations EUR 5.4 million (0.6).
January-September 2015
Operating profit excluding non-recurring items increased by 31% and amounted to EUR 27.0 million (20.6).
Operating profit was EUR 27.5 million (19.8). Non-recurring items in the review period, EUR +0.5 million,
consisted of reversal of previously made impairment losses of the re-opened production line in Nakkila plant
in Finland. The non-recurring items reported in January-September 2014 amounted to EUR
-0.9 million, of which EUR -1.1 million were costs related to restructuring and acquisition of the Brazilian unit
and EUR +0.2 million were items related to closing down of the fiber production in Nakkila in 2012.
Profit before income taxes for continuing operations was EUR 23.6 million (12.7), and profit for the period for
continuing operations was EUR 15.1 million (5.4).
FINANCING
The Group’s net interest-bearing liabilities at the end of the review period, 30 September 2015, amounted to
EUR 36.7 million (44.7). Gearing was 30.5% (43.3%) and equity ratio 44.3% (41.0%).
In January-September, net financial expenses were EUR -3.9 million (-7.1), or 1.2% (2.4%) of net sales.
Fluctuations in exchange rates increased the financial expenses by EUR -0.9 million. Financial expenses
increased also by EUR -0.4 million as an impairment loss of shares in a real estate company, classified as
available-for-sale, was recognized. The shares of the real estate company were divested in July 2015. Net
financial expenses in the corresponding period in 2014 include a non-recurring loss totaling to EUR -0.9
million from discontinuing of interest rate hedging due to refinancing as well as transaction costs of EUR -2.0
million related to the previous syndicated loan.
4 (23)
Cash flow from operations was in the third quarter EUR 7.9 million (16.9) and in January-September EUR 16.3
million (27.8). Cash flow from operations per share in January-September was EUR 0.06 (0.11). The financial
items in the cash flow from operations, in total EUR -6.7 million (-6.0), were principally impacted by currency
forward contracts hedging equity and the interests paid during the reporting period. EUR 12 million was tied
up in working capital (2014: released 4.0). Cash flow from financing improved by EUR 0.3 million due to
repayments of loan receivables granted in connection with the divestment of the Flexibles business area in
July 2014. Cash flow from financing was decreased by repayment of loan in September by EUR 3.3 million.
CAPITAL EXPENDITURE
In January-September, the gross capital expenditure totaled EUR 13.8 million (2014: 4.4 for continuing
operations). Gross capital investments increased mainly due to the beginning of the investment in a new
wetlaid production line at the Bethune plant in SC, US. Other major investments were related to
modernization of the Alicante plant in Spain as well as to re-opening of a production line in Nakkila plant in
Finland. The other investments were mainly for maintenance.
In September, Suominen announced that it will extend its growth investment program to approximately EUR
60 million. Earlier, the company had estimated that it will spend EUR 30–50 million in growth investments
during the strategic period of 2015–2017. The total value of the investment project at the Bethune plant,
including both equipment and facilities, will be close to EUR 50 million. The new line is anticipated to be
installed during the second half of 2016.
Depreciation, amortization and impairment losses for the review period amounted to EUR 13.6 million (11.4
for continuing operations). The amount does not include the reversal of an impairment loss made at Nakkila
plant due to the re-opening of a production line. The reversal amounted to EUR 0.5 million.
BUSINESS COMBINATIONS AND DISCONTINUED OPERATIONS
Business combinations
No business combinations were reported during the review period. Suominen completed the acquisition of
the Paulínia plant in Brazil from Ahlstrom Corporation on 10 February 2014. The closing of the deal provided
Suominen’s nonwovens business a foothold in the growing South American market region.
Discontinued operations
No discontinued operations were reported during the review period. In July 2014, Suominen divested its
Flexibles business, and the result of the Flexibles segment is reported as discontinued operations in the
figures of the corresponding period in 2014.
INFORMATION ON SHARE CAPITAL AND SHARES
Share capital
The number of Suominen’s registered shares was 252,425,616 shares on 30 September 2015, equaling to a
share capital of EUR 11,860,056.00. The number of shares increased in the review period in total by 4,491,494
shares, of which 3,984,106 were attributable to the share conversions of the hybrid bond notes and accrued
interests; and 507,388 to the directed share issue subject to payment for the management, implemented in
accordance with the share-based incentive system. Both the conversion of the hybrid bond to equity and the
share issue subject to payment have been recorded into the reserve for invested unrestricted equity.
5 (23)
Share trading and price
The number of Suominen Corporation shares traded on NASDAQ Helsinki from 1 January to 30 September
2015 was 88,277,675 shares, accounting for 35.3% of the average number of shares (excluding treasury
shares). The highest price was EUR 1.22, the lowest EUR 0.75 and the volume-weighted average price EUR
0.97. The closing price at the end of review period was EUR 1.09. The market capitalization (excluding
treasury shares) was EUR 274.1 million on 30 September 2015.
Treasury shares
At the end of review period, on 30 September 2015, Suominen Corporation held 913,886 treasury shares. In
total 802,644 treasury shares were transferred during the review period to key employees of the Group in a
directed share-issue without consideration as a reward of the 2012–2014 share-based incentive plan. In
addition, in accordance with the resolution by the Annual General Meeting; 86,989 shares were transferred
on 5 June 2015 to the members of the Board of Directors as their remuneration payable in shares.
Share-based incentive plans for the management and key employees
The Board of Directors of Suominen Corporation approved on December 2014 two new share-based
incentive plans for the Group management and Group key employees and a directed share issue. Share-
based incentive plan consists of Performance Share Plan and Matching Share Plan. The share-based plans
have been described in more detail in the Interim Report for January-March 2015.
COMPOSITION OF THE NOMINATION BOARD
In accordance with the decision taken by the Annual General Meeting of Suominen Corporation, the
representatives notified by the company’s three largest shareholders have been elected to Suominen
Corporation’s permanent Nomination Board. The shareholders entitled to appoint members to the
Nomination Committee were determined on the basis of the registered holdings in the company’s
shareholders' register on 1 September 2015.
The representatives appointed to the Nomination Board are Thomas Ahlström, member of the Board of
Directors of Ahlström Capital and Managing Director of Antti Ahlström Perilliset Oy; Mikko Mursula, Chief
Investment Officer of Ilmarinen Mutual Pension Insurance Company; and Reima Rytsölä, Chief Investment
Officer of Varma Mutual Pension Insurance Company. Jorma Eloranta, Chair of Suominen’s Board of
Directors, serves as the fourth member of the Nomination Board.
The Nomination Board shall submit its proposals to the Board of Directors no later than 1 February prior to
the Annual General Meeting.
ANNUAL GENERAL MEETING
The Annual General Meeting (AGM) of Suominen Corporation was held on 19 March 2015. The AGM decided
that no dividend will be paid for the financial year 2014, but a distribution of funds from reserve for invested
unrestricted capital, EUR 0.01 per share, will be paid from the reserve for invested unrestricted equity.
The AGM adopted the financial statements and the consolidated financial statements for the financial year
2014 and discharged the members of the Board of Directors and the President & CEO from liability.
The AGM confirmed the number of members of the Board of Directors to be six (6). The AGM re-elected Mr.
Risto Anttonen, Mr. Jorma Eloranta, Mr. Hannu Kasurinen and Ms. Jaana Tuominen as members of the Board
of Directors, and elected Ms. Laura Raitio and Mr. Andreas Ahlström as new members of the Board of
6 (23)
Directors for the next term of office, expiring at the end of the first Annual General Meeting of Shareholders
following their election. The remuneration of the members of the Board of Directors was resolved to maintain
unchanged. The resolutions were in accordance with the proposals submitted by the Nomination Board of
Suominen’s shareholders.
Ernst & Young Oy, Authorized Public Accountants, was elected as auditor of Suominen Corporation, with Ms.
Kristina Sandin, Authorized Public Accountant, as the principal auditor.
Constitutive meeting and permanent committees of the Board of Directors
In its constitutive meeting on 19 March 2015, the Board of Directors elected from among its members a Chair
and Deputy Chair as well as members for the Audit Committee and Personnel and Remuneration Committee.
The Board of Directors elected Jorma Eloranta as Chair and Risto Anttonen as Deputy Chair of the Board of
Directors, in accordance with the recommendation by the Nomination Board of Suominen’s shareholders.
Hannu Kasurinen was re-elected as Chair of the Audit Committee. Andreas Ahlström and Laura Raitio were
elected as members of the Audit Committee. Jorma Eloranta was re-elected as Chair of the Personnel and
Remuneration Committee. Risto Anttonen and Jaana Tuominen were elected as members of the Personnel
and Remuneration Committee.
Authorizations of the Board of Directors
The Annual General Meeting (AGM) held on 19 March 2015 authorized the Board of Directors to repurchase
a maximum of 2,000,000 of the company’s own shares. The shares shall be repurchased to be used in
company’s share-based incentive programs, in order to disburse the remuneration of the members of the
Board of Directors, for use as consideration in acquisitions related to the company’s business, or to be held
by the company, to be conveyed by other means or to be cancelled. The company’s own shares shall be
repurchased otherwise than in proportion to the holdings of the shareholders by using the non-restricted
equity through trading on regulated market organized by NASDAQ OMX Helsinki Ltd at the market price
prevailing at the time of acquisition. The repurchase authorization is valid until 30 June 2016.
The AGM held on 26 March 2014 also authorized the Board of Directors to decide on issuing new shares
and/or conveying the company’s own shares held by the company and/or granting special rights entitling to
shares referred to in Chapter 10, Section 1 of the Finnish Companies Act. New shares may be issued and/or
company’s own shares held by the company or its group company may be conveyed at the maximum
amount of 25,000,000 shares in aggregate. The maximum number of new shares that may be subscribed and
own shares held by the company that may be conveyed by virtue of the options and other special rights
granted by the company is 25,000,000 shares in total which number is included in the maximum number
stated earlier. The authorizations are valid until 30 June 2017. By 30 September 2015, the number of shares
used based on the authorization was 1,517,869 shares. The remaining number of shares which can be issued
based on the authorization is 23,482,131 shares.
NOTIFICATIONS UNDER CHAPTER 9, SECTION 5 OF THE SECURITIES MARKET ACT
During the review period, Suominen received the following notifications referred to in Chapter 9, Section 5 of
the Securities Market Act:
On 29 January 2015, Mandatum Life Insurance Company Limited (business identity code 0641130-2) notified
that it has divested Suominen Corporation shares through a transaction made on 23 January 2015, and
consequently, its ownership in Suominen decreased below the threshold of 5%. After the transaction,
Mandatum holds in total 12,318,243 shares and votes (4.97% of all shares and votes). In its previous
7 (23)
notification, the number of shares held by Mandatum was 22,322,222, which accounted for 9.1% of all shares
and votes in Suominen.
On 29 January 2015, Mandatum Life Insurance Company Limited (business identity code 0641130-2) notified
that it had on 5 February 2014 subscribed the convertible hybrid bond issued by Suominen, which entitles
Mandatum to subscribe a maximum of 3,714,000 new Suominen shares during the conversion period of 11
February 2014 - 10 February 2018. If Mandatum decided to subscribe these shares, its shareholding in
Suominen would exceed the threshold of 5%. After the subscription, Mandatum would hold 16,032,243
shares and votes (6.37% of all shares and votes). In its previous notification, the number of Suominen shares
held by Mandatum was 12,318,243, which accounted for 4.97% of all shares and votes.
On 18 February 2015, Mandatum Life Insurance Company Limited (business identity code 0641130-2)
notified that it has divested Suominen Corporation shares through a transaction made on 17 February 2015.
Following the transaction, Mandatum’s ownership in Suominen would remain below the threshold of 5%
even if Mandatum would convert all notes of the hybrid bond it subscribed in February 2014 into Suominen
shares.
On 16 March 2015, Finnish Industry Investment Ltd (Suomen Teollisuussijoitus Oy, business identity code
1007806-3) notified that it has divested Suominen shares and thus its shareholding has fallen below the
threshold of 5% of all shares and votes in Suominen. In its previous notification, Finnish Industry Investment
Ltd stated it held 22,222,222 Suominen shares, corresponding to 9.04% of shares and votes in Suominen
Corporation. Before the transaction made on 16 March 2015, Finnish Industry Investment Ltd held 14,009,604
shares, corresponding to 5.57% of all shares and votes. After the transaction made on 16 March 2015, Finnish
Industry Investment Ltd holds in total 7,009,604 Suominen shares, corresponding to 2.78% of all shares and
votes.
On 20 March 2015, Ilmarinen Mutual Pension Insurance Company (Keskinäinen Eläkevakuutusyhtiö Ilmarinen,
business identity code 0107638-1), notified that it has on 19 March 2015 divested Suominen shares and
consequently crossed the threshold of 10% of all shares and votes in Suominen Corporation. In its previous
notification, Ilmarinen stated it held 27,111,992 Suominen shares, corresponding to 11.02% of shares and
votes in Suominen Corporation. After the transaction, Ilmarinen holds in total 18,422,103 Suominen shares,
corresponding to 7.33% of all shares and votes.
On 10 July 2015, GMT Capital Corp notified that it has on 9 July 2015 acquired Suominen shares and
consequently reached the threshold of 5% of all shares and votes in Suominen Corporation. After the
transaction, GMT Capital Corp holds in total 12,623,280 Suominen shares, corresponding to 5.00% of all
shares and votes.
CHANGES IN CORPORATE EXECUTIVE TEAM
Mr. Timo Hiekkaranta, Senior Vice President of Suominen’s Convenience business area and a member of
Suominen’s Corporate Executive Team, left Suominen at the end of August to pursue his career outside the
company.
Suominen announced on 6 October 2015 that Mr. Ernesto Levy, MBA, has been appointed Senior Vice
President, Convenience business area and a member of the Corporate Executive Team at Suominen
Corporation, effective 20 October, 2015. Ernesto Levy has an impressive track record in leading consumer
brand organizations, such as Novartis and Procter & Gamble.
BUSINESS RISKS AND UNCERTAINTIES
The estimate on the development of Suominen’s net sales is in part based on forecasts and delivery plans
8 (23)
received from customers. Changes in these forecasts and plans resulting from changes in the market
conditions or in customers’ inventory levels may affect Suominen’s net sales. Due to the continued
uncertainty in the general economic situation and the cautious consumer purchasing habits, the forecasts
include uncertainty.
Suominen’s customer base is fairly concentrated, which adds to the customer-specific risk. Long-term
contracts are preferred in the case of the largest customers. In practice, the customer relationships are long-
term and last for several years.
The continued positive development of Suominen’s business operations in the United States increases the
relevance of the exchange rate risk related to USD in the Group’s total exchange risk position. Suominen
hedges this foreign exchange position in accordance with its hedging policy.
The risks characteristic to South American market, including significant changes in business environment or
exchange rates, could have an impact on Suominen’s operations in Brazil.
Suominen purchases significant amounts of oil- and pulp-based raw materials annually. Raw materials are
the largest cost item in operations. Changes in the global market prices of raw materials affect the company’s
profitability. Extended interruptions in the supply of Suominen’s main raw materials could disrupt production
and have a negative impact on the Group’s overall business operations. As Suominen sources its raw
materials from a number of major international suppliers, significant interruptions are unlikely.
Suominen has numerous regional, national and international competitors in its different product groups.
There is currently oversupply in several product groups, particularly in Europe. If Suominen is not able to
compete through an attractive product offering, it may lose some of its market share, and the competition
may lead to increased pricing pressure on the company’s products.
The Group’s damage risks are insured in order to guarantee the continuity of operations. Suominen has valid
damage and business interruption insurances according to which it is estimated that the damages can be
covered and the financial losses caused by an interruption compensated.
The sensitivity of Suominen’s goodwill to changes in business conditions is described in the notes to the
consolidated financial statements 2014. Actual cash flows may deviate from the forecasted future discounted
cash flows, as the long economic lifetime of the company’s non-current assets, as well as changes in the
estimated product prices, production costs, and discount rates used in calculations may result in impairment
losses. The fair value based on the value in use of assets or businesses in total or in part does not necessarily
correspond to the price that a third party would pay for them.
General risks related to business operations are described in the Report of the Board of Directors 2014.
BUSINESS ENVIRONMENT
Suominen’s nonwovens are, for the most part, used in daily consumer goods, such as wet wipes as well as
hygiene and medical products. The general economic situation determines the development of consumer
demand, even though the demand for consumer goods is not very cyclical in nature. North America and
Europe are the largest market areas for Suominen. Moreover, Suominen gained a foothold in the growing
South American markets through an acquisition in February 2014.
In the euro area, the consumer confidence index decreased slightly in the third quarter but was still on a
significantly higher level than at the beginning of the year. In the United States, the consumer confidence
index increased somewhat.
9 (23)
Suominen assesses the trend in the demand for its products on the basis of both the general market
situation and, above all, on the basis of the framework agreements drawn up with its customers. Suominen
estimates that in 2015, the growth in the demand for its products will, on average, continue at the pace of
2014.
OUTLOOK FOR 2015
Suominen specifies its guidance regarding operating profit for 2015. The company expects that for the full
year 2015, operating profit from continuing operations excluding non-recurring items will improve markedly
from year 2014. Previously, Suominen estimated that for the full year 2015, its operating profit excluding
non-recurring items from continuing operations would improve from year 2014. For net sales, Suominen
repeats its previous estimate, disclosed on 17 July 2015, that for the full year 2015 the company expects its
net sales for continuing operations to improve from year 2014.
Suominen’s net sales of the continuing operations in 2014 amounted to EUR 401.8 million and operating
profit excluding non-recurring items was EUR 26.9 million.
SUOMINEN GROUP, 1 JANUARY - 30 SEPTEMBER 2015
This interim report has been prepared in accordance with the principles defined in IAS 34 Interim Financial
Reporting. The principles for preparing the interim report are the same as those used for preparing the
consolidated financial statements for 2014. Changes to published accounting standards and interpretations,
together with the new accounting standards that came into force on 1 January 2015, are presented in the
consolidated financial statements for 2014.
The figures in these interim financial statements are mainly presented in EUR thousands. As a result of
rounding differences, the figures presented in the tables do not necessarily add up to total.
This interim report has not been audited.
10 (23)
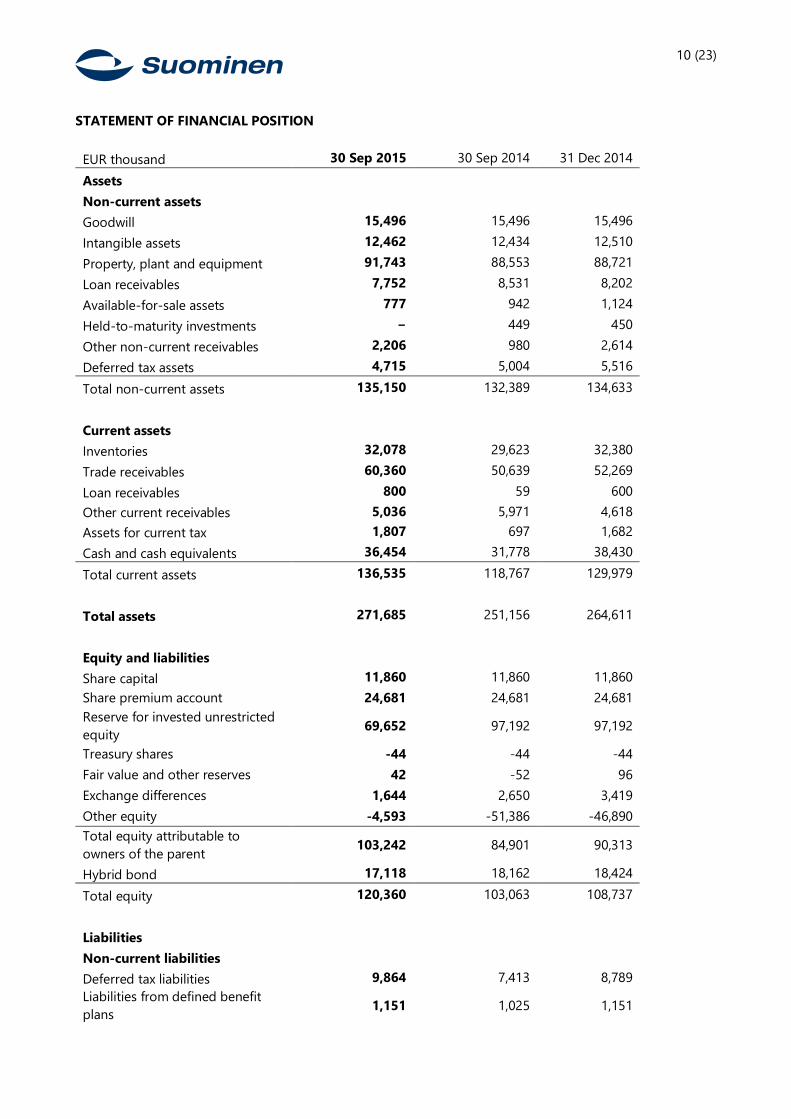
STATEMENT OF FINANCIAL POSITION
EUR thousand 30 Sep 2015 30 Sep 2014 31 Dec 2014
Assets
Non-current assets
Goodwill 15,496 15,496 15,496
Intangible assets 12,462 12,434 12,510
Property, plant and equipment 91,743 88,553 88,721
Loan receivables 7,752 8,531 8,202
Available-for-sale assets 777 942 1,124
Held-to-maturity investments − 449 450
Other non-current receivables 2,206 980 2,614
Deferred tax assets 4,715 5,004 5,516
Total non-current assets 135,150 132,389 134,633
Current assets
Inventories 32,078 29,623 32,380
Trade receivables 60,360 50,639 52,269
Loan receivables 800 59 600
Other current receivables 5,036 5,971 4,618
Assets for current tax 1,807 697 1,682
Cash and cash equivalents 36,454 31,778 38,430
Total current assets 136,535 118,767 129,979
Total assets 271,685 251,156 264,611
Equity and liabilities
Share capital 11,860 11,860 11,860
Share premium account 24,681 24,681 24,681
Reserve for invested unrestricted
equity 69,652 97,192 97,192
Treasury shares -44 -44 -44
Fair value and other reserves 42 -52 96
Exchange differences 1,644 2,650 3,419
Other equity -4,593 -51,386 -46,890
Total equity attributable to
owners of the parent 103,242 84,901 90,313
Hybrid bond 17,118 18,162 18,424
Total equity 120,360 103,063 108,737
Liabilities
Non-current liabilities
Deferred tax liabilities 9,864 7,413 8,789
Liabilities from defined benefit
plans 1,151 1,025 1,151
11 (23)
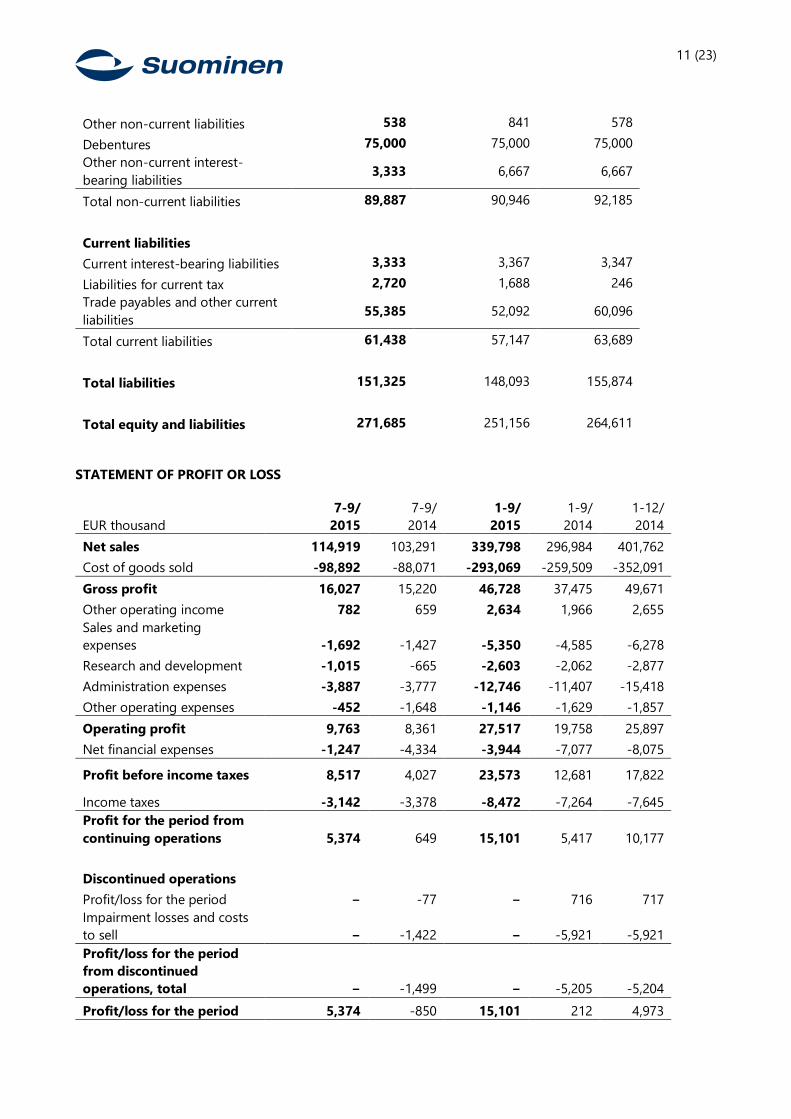
Other non-current liabilities 538 841 578
Debentures 75,000 75,000 75,000
Other non-current interest-
bearing liabilities 3,333 6,667 6,667
Total non-current liabilities 89,887 90,946 92,185
Current liabilities
Current interest-bearing liabilities 3,333 3,367 3,347
Liabilities for current tax 2,720 1,688 246
Trade payables and other current
liabilities 55,385 52,092 60,096
Total current liabilities 61,438 57,147 63,689
Total liabilities 151,325 148,093 155,874
Total equity and liabilities 271,685 251,156 264,611
STATEMENT OF PROFIT OR LOSS
EUR thousand
7-9/
2015
7-9/
2014
1-9/
2015
1-9/
2014
1-12/
2014
Net sales 114,919 103,291 339,798 296,984 401,762
Cost of goods sold -98,892 -88,071 -293,069 -259,509 -352,091
Gross profit 16,027 15,220 46,728 37,475 49,671
Other operating income 782 659 2,634 1,966 2,655
Sales and marketing
expenses -1,692 -1,427 -5,350 -4,585 -6,278
Research and development -1,015 -665 -2,603 -2,062 -2,877
Administration expenses -3,887 -3,777 -12,746 -11,407 -15,418
Other operating expenses -452 -1,648 -1,146 -1,629 -1,857
Operating profit 9,763 8,361 27,517 19,758 25,897
Net financial expenses -1,247 -4,334 -3,944 -7,077 -8,075
Profit before income taxes 8,517 4,027 23,573 12,681 17,822
Income taxes -3,142 -3,378 -8,472 -7,264 -7,645
Profit for the period from
continuing operations 5,374 649 15,101 5,417 10,177
Discontinued operations
Profit/loss for the period − -77 − 716 717
Impairment losses and costs
to sell − -1,422 − -5,921 -5,921
Profit/loss for the period
from discontinued
operations, total − -1,499 − -5,205 -5,204
Profit/loss for the period 5,374 -850 15,101 212 4,973
12 (23)
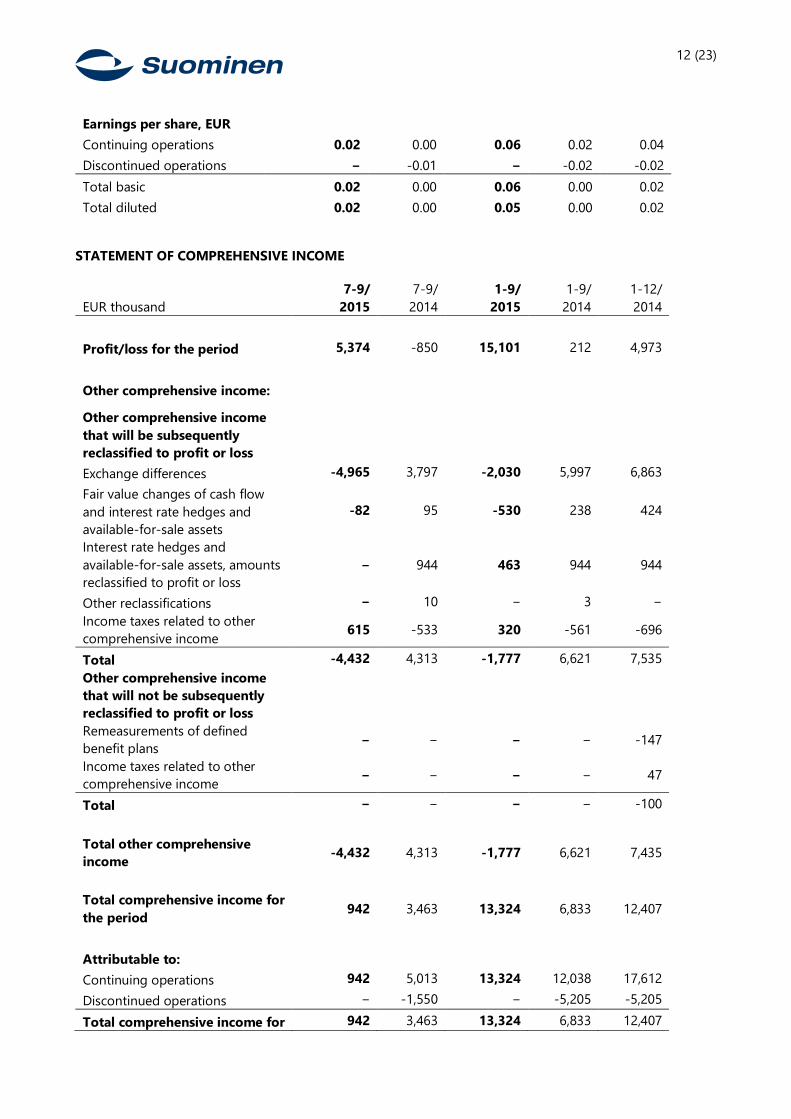
Earnings per share, EUR
Continuing operations 0.02 0.00 0.06 0.02 0.04
Discontinued operations − -0.01 − -0.02 -0.02
Total basic 0.02 0.00 0.06 0.00 0.02
Total diluted 0.02 0.00 0.05 0.00 0.02
STATEMENT OF COMPREHENSIVE INCOME
EUR thousand
7-9/
2015
7-9/
2014
1-9/
2015
1-9/
2014
1-12/
2014
Profit/loss for the period 5,374 -850 15,101 212 4,973
Other comprehensive income:
Other comprehensive income
that will be subsequently
reclassified to profit or loss
Exchange differences -4,965 3,797 -2,030 5,997 6,863
Fair value changes of cash flow
and interest rate hedges and
available-for-sale assets
-82 95 -530 238 424
Interest rate hedges and
available-for-sale assets, amounts
reclassified to profit or loss
− 944 463 944 944
Other reclassifications − 10 − 3 −
Income taxes related to other
comprehensive income 615 -533 320 -561 -696
Total -4,432 4,313 -1,777 6,621 7,535
Other comprehensive income
that will not be subsequently
reclassified to profit or loss
Remeasurements of defined
benefit plans − − − − -147
Income taxes related to other
comprehensive income − − − − 47
Total − − − − -100
Total other comprehensive
income -4,432 4,313 -1,777 6,621 7,435
Total comprehensive income for
the period 942 3,463 13,324 6,833 12,407
Attributable to:
Continuing operations 942 5,013 13,324 12,038 17,612
Discontinued operations − -1,550 − -5,205 -5,205
Total comprehensive income for 942 3,463 13,324 6,833 12,407
13 (23)
the period
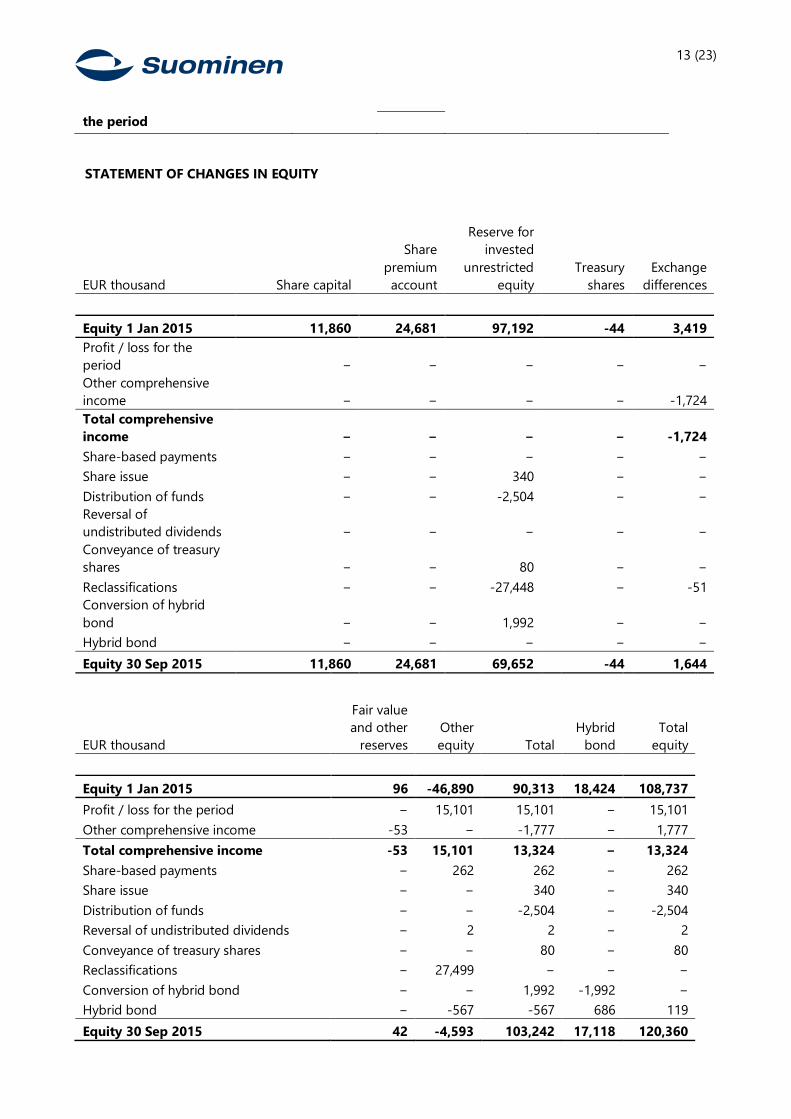
STATEMENT OF CHANGES IN EQUITY
EUR thousand Share capital
Share
premium
account
Reserve for
invested
unrestricted
equity
Treasury
shares
Exchange
differences
Equity 1 Jan 2015 11,860 24,681 97,192 -44 3,419
Profit / loss for the
period − − − − −
Other comprehensive
income − − − − -1,724
Total comprehensive
income − − − − -1,724
Share-based payments − − − − −
Share issue − − 340 − −
Distribution of funds − − -2,504 − −
Reversal of
undistributed dividends − − − − −
Conveyance of treasury
shares − − 80 − −
Reclassifications − − -27,448 − -51
Conversion of hybrid
bond − − 1,992 − −
Hybrid bond − − − − −
Equity 30 Sep 2015 11,860 24,681 69,652 -44 1,644
EUR thousand
Fair value
and other
reserves
Other
equity Total
Hybrid
bond
Total
equity
Equity 1 Jan 2015 96 -46,890 90,313 18,424 108,737
Profit / loss for the period − 15,101 15,101 − 15,101
Other comprehensive income -53 − -1,777 − 1,777
Total comprehensive income -53 15,101 13,324 − 13,324
Share-based payments − 262 262 − 262
Share issue − − 340 − 340
Distribution of funds − − -2,504 − -2,504
Reversal of undistributed dividends − 2 2 − 2
Conveyance of treasury shares − − 80 − 80
Reclassifications − 27,499 − − −
Conversion of hybrid bond − − 1,992 -1,992 −
Hybrid bond − -567 -567 686 119
Equity 30 Sep 2015 42 -4,593 103,242 17,118 120,360
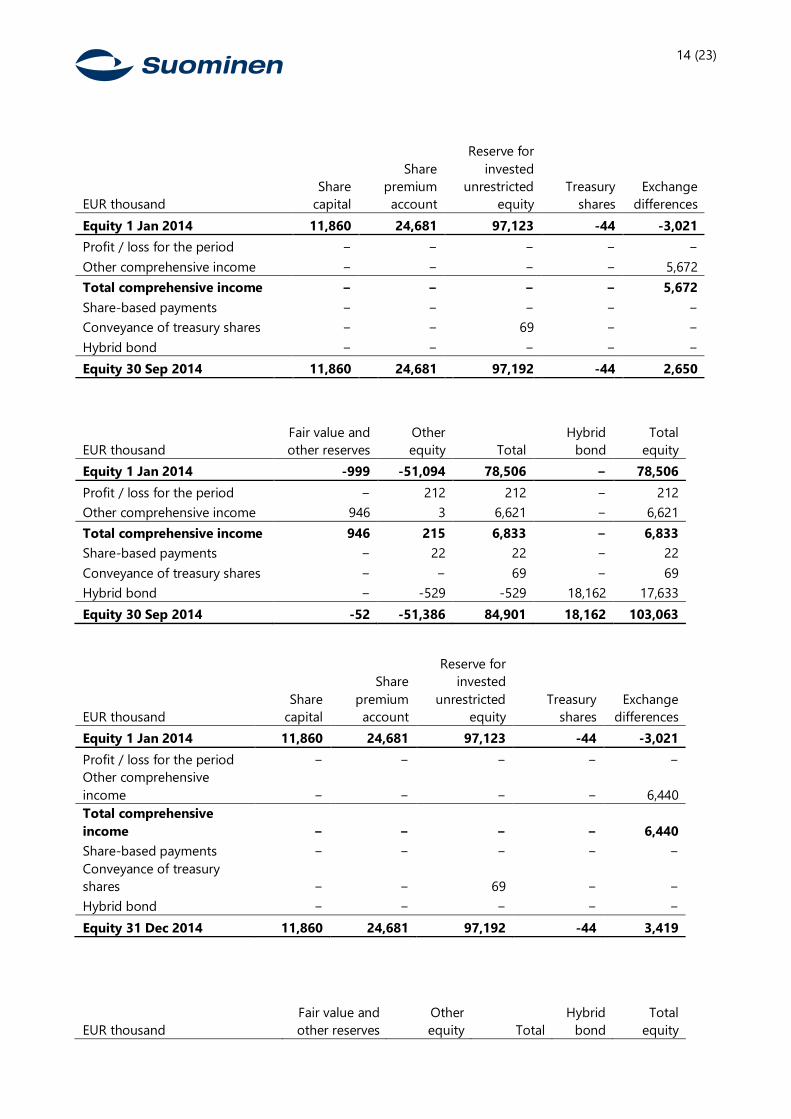
14 (23)
EUR thousand
Share
capital
Share
premium
account
Reserve for
invested
unrestricted
equity
Treasury
shares
Exchange
differences
Equity 1 Jan 2014 11,860 24,681 97,123 -44 -3,021
Profit / loss for the period − − − − −
Other comprehensive income − − − − 5,672
Total comprehensive income − − − − 5,672
Share-based payments − − − − −
Conveyance of treasury shares − − 69 − −
Hybrid bond − − − − −
Equity 30 Sep 2014 11,860 24,681 97,192 -44 2,650
EUR thousand
Fair value and
other reserves
Other
equity Total
Hybrid
bond
Total
equity
Equity 1 Jan 2014 -999 -51,094 78,506 − 78,506
Profit / loss for the period − 212 212 − 212
Other comprehensive income 946 3 6,621 − 6,621
Total comprehensive income 946 215 6,833 − 6,833
Share-based payments − 22 22 − 22
Conveyance of treasury shares − − 69 − 69
Hybrid bond − -529 -529 18,162 17,633
Equity 30 Sep 2014 -52 -51,386 84,901 18,162 103,063
EUR thousand
Share
capital
Share
premium
account
Reserve for
invested
unrestricted
equity
Treasury
shares
Exchange
differences
Equity 1 Jan 2014 11,860 24,681 97,123 -44 -3,021
Profit / loss for the period − − − − −
Other comprehensive
income − − − − 6,440
Total comprehensive
income − − − − 6,440
Share-based payments − − − − −
Conveyance of treasury
shares − − 69 − −
Hybrid bond − − − − −
Equity 31 Dec 2014 11,860 24,681 97,192 -44 3,419
EUR thousand
Fair value and
other reserves
Other
equity Total
Hybrid
bond
Total
equity
15 (23)
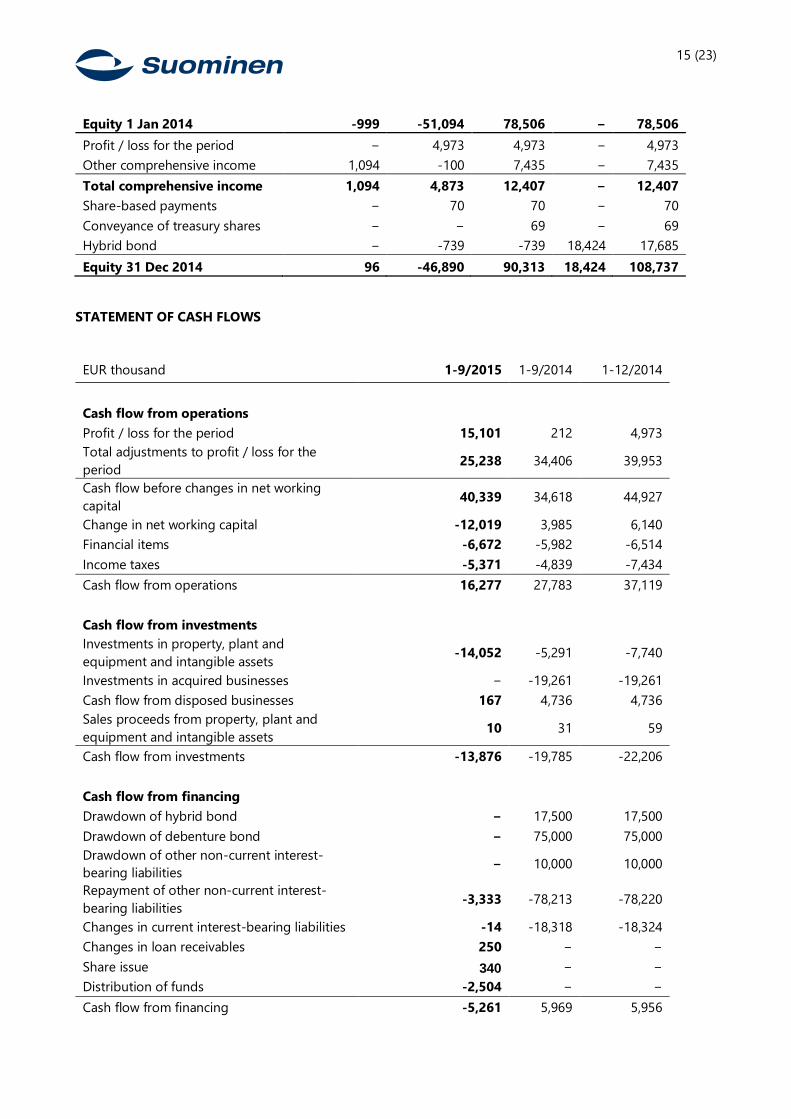
Equity 1 Jan 2014 -999 -51,094 78,506 − 78,506
Profit / loss for the period − 4,973 4,973 − 4,973
Other comprehensive income 1,094 -100 7,435 − 7,435
Total comprehensive income 1,094 4,873 12,407 − 12,407
Share-based payments − 70 70 − 70
Conveyance of treasury shares − − 69 − 69
Hybrid bond − -739 -739 18,424 17,685
Equity 31 Dec 2014 96 -46,890 90,313 18,424 108,737
STATEMENT OF CASH FLOWS
EUR thousand 1-9/2015 1-9/2014 1-12/2014
Cash flow from operations
Profit / loss for the period 15,101 212 4,973
Total adjustments to profit / loss for the
period 25,238 34,406 39,953
Cash flow before changes in net working
capital 40,339 34,618 44,927
Change in net working capital -12,019 3,985 6,140
Financial items -6,672 -5,982 -6,514
Income taxes -5,371 -4,839 -7,434
Cash flow from operations 16,277 27,783 37,119
Cash flow from investments
Investments in property, plant and
equipment and intangible assets -14,052 -5,291 -7,740
Investments in acquired businesses − -19,261 -19,261
Cash flow from disposed businesses 167 4,736 4,736
Sales proceeds from property, plant and
equipment and intangible assets 10 31 59
Cash flow from investments -13,876 -19,785 -22,206
Cash flow from financing
Drawdown of hybrid bond − 17,500 17,500
Drawdown of debenture bond − 75,000 75,000
Drawdown of other non-current interest-
bearing liabilities − 10,000 10,000
Repayment of other non-current interest-
bearing liabilities -3,333 -78,213 -78,220
Changes in current interest-bearing liabilities -14 -18,318 -18,324
Changes in loan receivables 250 − −
Share issue 340 − −
Distribution of funds -2,504 − −
Cash flow from financing -5,261 5,969 5,956
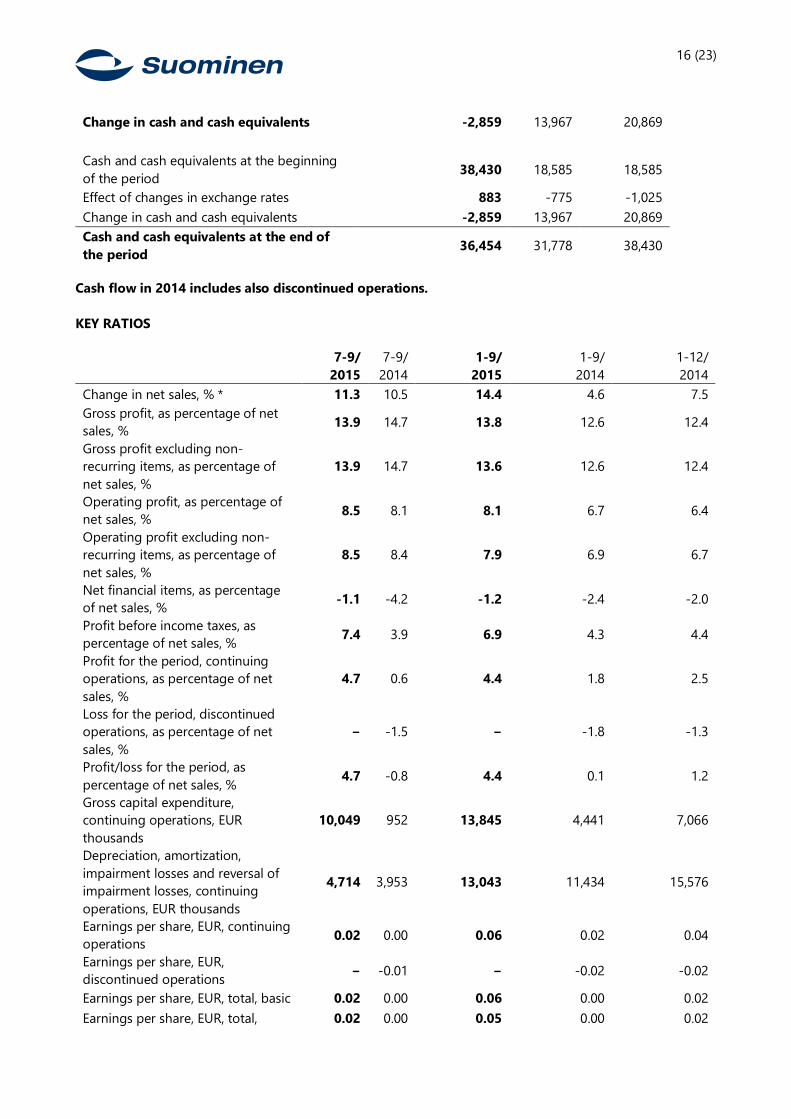
16 (23)
Change in cash and cash equivalents -2,859 13,967 20,869
Cash and cash equivalents at the beginning
of the period 38,430 18,585 18,585
Effect of changes in exchange rates 883 -775 -1,025
Change in cash and cash equivalents -2,859 13,967 20,869
Cash and cash equivalents at the end of
the period 36,454 31,778 38,430
Cash flow in 2014 includes also discontinued operations.
KEY RATIOS
7-9/
2015
7-9/
2014
1-9/
2015
1-9/
2014
1-12/
2014
Change in net sales, % * 11.3 10.5 14.4 4.6 7.5
Gross profit, as percentage of net
sales, % 13.9 14.7 13.8 12.6 12.4
Gross profit excluding non-
recurring items, as percentage of
net sales, %
13.9 14.7 13.6 12.6 12.4
Operating profit, as percentage of
net sales, % 8.5 8.1 8.1 6.7 6.4
Operating profit excluding non-
recurring items, as percentage of
net sales, %
8.5 8.4 7.9 6.9 6.7
Net financial items, as percentage
of net sales, % -1.1 -4.2 -1.2 -2.4 -2.0
Profit before income taxes, as
percentage of net sales, % 7.4 3.9 6.9 4.3 4.4
Profit for the period, continuing
operations, as percentage of net
sales, %
4.7 0.6 4.4 1.8 2.5
Loss for the period, discontinued
operations, as percentage of net
sales, %
− -1.5 − -1.8 -1.3
Profit/loss for the period, as
percentage of net sales, % 4.7 -0.8 4.4 0.1 1.2
Gross capital expenditure,
continuing operations, EUR
thousands
10,049 952 13,845 4,441 7,066
Depreciation, amortization,
impairment losses and reversal of
impairment losses, continuing
operations, EUR thousands
4,714 3,953 13,043 11,434 15,576
Earnings per share, EUR, continuing
operations 0.02 0.00 0.06 0.02 0.04
Earnings per share, EUR,
discontinued operations − -0.01 − -0.02 -0.02
Earnings per share, EUR, total, basic 0.02 0.00 0.06 0.00 0.02
Earnings per share, EUR, total, 0.02 0.00 0.05 0.00 0.02
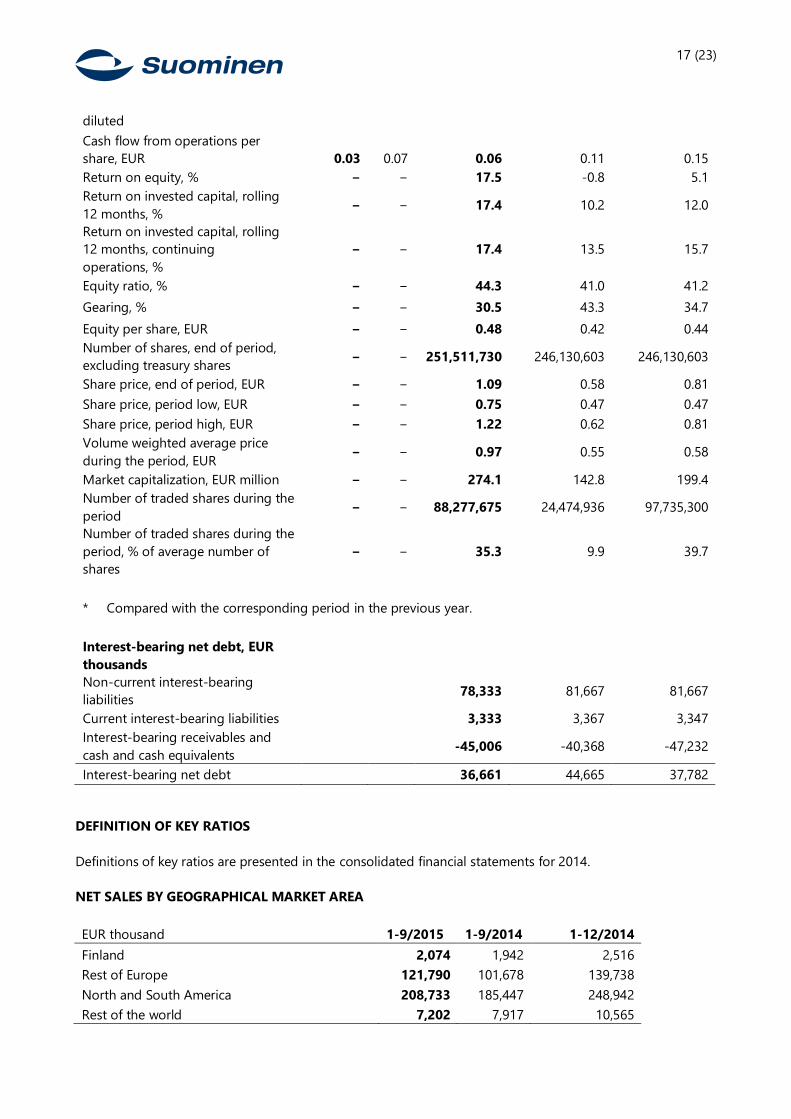
17 (23)
diluted
Cash flow from operations per
share, EUR 0.03 0.07 0.06 0.11 0.15
Return on equity, % − − 17.5 -0.8 5.1
Return on invested capital, rolling
12 months, % − − 17.4 10.2 12.0
Return on invested capital, rolling
12 months, continuing
operations, %
− − 17.4 13.5 15.7
Equity ratio, % − − 44.3 41.0 41.2
Gearing, % − − 30.5 43.3 34.7
Equity per share, EUR − − 0.48 0.42 0.44
Number of shares, end of period,
excluding treasury shares − − 251,511,730 246,130,603 246,130,603
Share price, end of period, EUR − − 1.09 0.58 0.81
Share price, period low, EUR − − 0.75 0.47 0.47
Share price, period high, EUR − − 1.22 0.62 0.81
Volume weighted average price
during the period, EUR − − 0.97 0.55 0.58
Market capitalization, EUR million − − 274.1 142.8 199.4
Number of traded shares during the
period − − 88,277,675 24,474,936 97,735,300
Number of traded shares during the
period, % of average number of
shares
− − 35.3 9.9 39.7
* Compared with the corresponding period in the previous year.
Interest-bearing net debt, EUR
thousands
Non-current interest-bearing
liabilities 78,333 81,667 81,667
Current interest-bearing liabilities
3,333 3,367 3,347
Interest-bearing receivables and
cash and cash equivalents -45,006 -40,368 -47,232
Interest-bearing net debt 36,661 44,665 37,782
DEFINITION OF KEY RATIOS
Definitions of key ratios are presented in the consolidated financial statements for 2014.
NET SALES BY GEOGRAPHICAL MARKET AREA
EUR thousand 1-9/2015 1-9/2014 1-12/2014
Finland 2,074 1,942 2,516
Rest of Europe 121,790 101,678 139,738
North and South America 208,733 185,447 248,942
Rest of the world 7,202 7,917 10,565
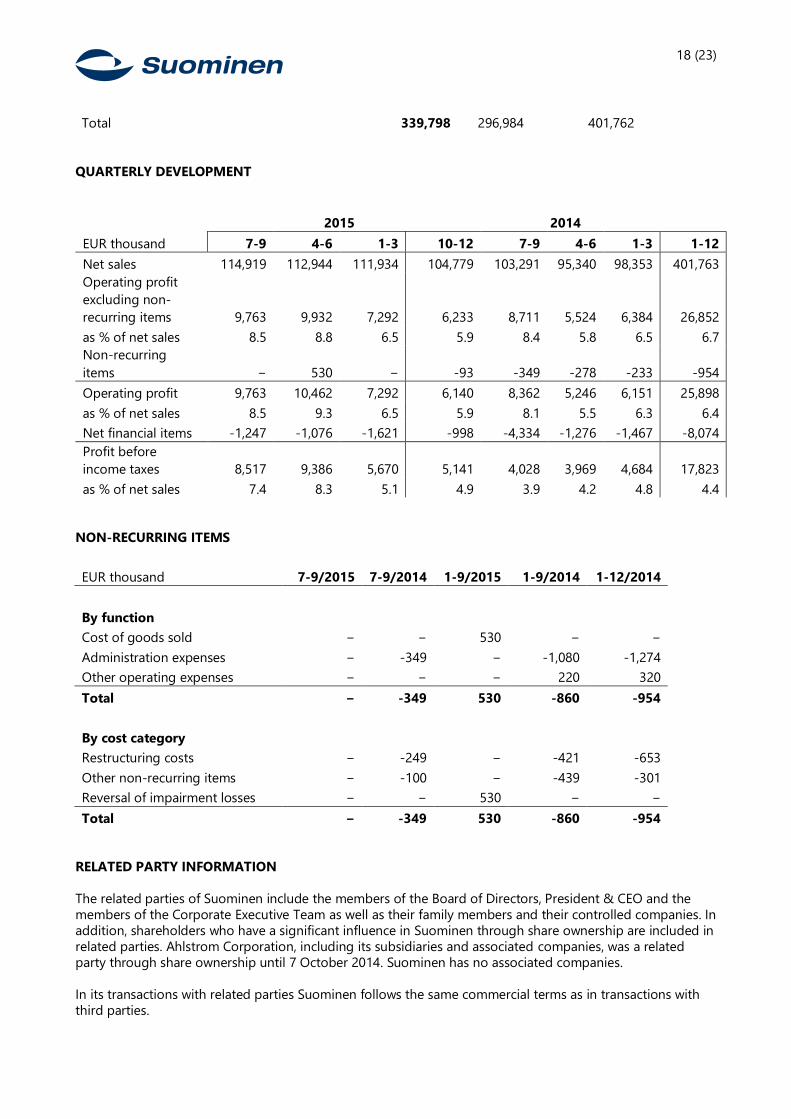
18 (23)
Total 339,798 296,984 401,762
QUARTERLY DEVELOPMENT
2015 2014
EUR thousand 7-9 4-6 1-3 10-12 7-9 4-6 1-3 1-12
Net sales 114,919 112,944 111,934 104,779 103,291 95,340 98,353 401,763
Operating profit
excluding non-
recurring items 9,763 9,932 7,292 6,233 8,711 5,524 6,384 26,852
as % of net sales 8.5 8.8 6.5 5.9 8.4 5.8 6.5 6.7
Non-recurring
items − 530 − -93 -349 -278 -233 -954
Operating profit 9,763 10,462 7,292 6,140 8,362 5,246 6,151 25,898
as % of net sales 8.5 9.3 6.5 5.9 8.1 5.5 6.3 6.4
Net financial items -1,247 -1,076 -1,621 -998 -4,334 -1,276 -1,467 -8,074
Profit before
income taxes 8,517 9,386 5,670 5,141 4,028 3,969 4,684 17,823
as % of net sales 7.4 8.3 5.1 4.9 3.9 4.2 4.8 4.4
NON-RECURRING ITEMS
EUR thousand 7-9/2015 7-9/2014 1-9/2015 1-9/2014 1-12/2014
By function
Cost of goods sold − − 530 − −
Administration expenses − -349 − -1,080 -1,274
Other operating expenses − − − 220 320
Total − -349 530 -860 -954
By cost category
Restructuring costs − -249 − -421 -653
Other non-recurring items − -100 − -439 -301
Reversal of impairment losses − − 530 − −
Total − -349 530 -860 -954
RELATED PARTY INFORMATION
The related parties of Suominen include the members of the Board of Directors, President & CEO and the
members of the Corporate Executive Team as well as their family members and their controlled companies. In
addition, shareholders who have a significant influence in Suominen through share ownership are included in
related parties. Ahlstrom Corporation, including its subsidiaries and associated companies, was a related
party through share ownership until 7 October 2014. Suominen has no associated companies.
In its transactions with related parties Suominen follows the same commercial terms as in transactions with
third parties.
19 (23)
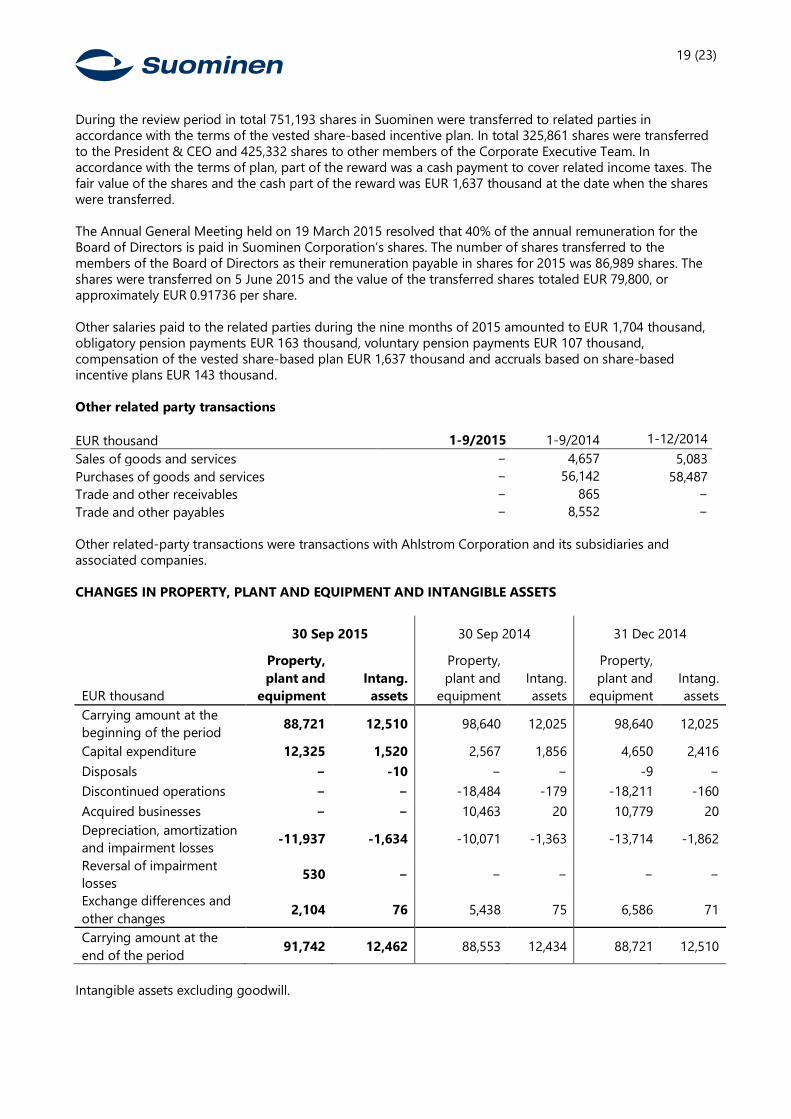
During the review period in total 751,193 shares in Suominen were transferred to related parties in
accordance with the terms of the vested share-based incentive plan. In total 325,861 shares were transferred
to the President & CEO and 425,332 shares to other members of the Corporate Executive Team. In
accordance with the terms of plan, part of the reward was a cash payment to cover related income taxes. The
fair value of the shares and the cash part of the reward was EUR 1,637 thousand at the date when the shares
were transferred.
The Annual General Meeting held on 19 March 2015 resolved that 40% of the annual remuneration for the
Board of Directors is paid in Suominen Corporation’s shares. The number of shares transferred to the
members of the Board of Directors as their remuneration payable in shares for 2015 was 86,989 shares. The
shares were transferred on 5 June 2015 and the value of the transferred shares totaled EUR 79,800, or
approximately EUR 0.91736 per share.
Other salaries paid to the related parties during the nine months of 2015 amounted to EUR 1,704 thousand,
obligatory pension payments EUR 163 thousand, voluntary pension payments EUR 107 thousand,
compensation of the vested share-based plan EUR 1,637 thousand and accruals based on share-based
incentive plans EUR 143 thousand.
Other related party transactions
EUR thousand 1-9/2015 1-9/2014 1-12/2014
Sales of goods and services − 4,657 5,083
Purchases of goods and services − 56,142 58,487
Trade and other receivables − 865 −
Trade and other payables − 8,552 −
Other related-party transactions were transactions with Ahlstrom Corporation and its subsidiaries and
associated companies.
CHANGES IN PROPERTY, PLANT AND EQUIPMENT AND INTANGIBLE ASSETS
30 Sep 2015 30 Sep 2014 31 Dec 2014
EUR thousand
Property,
plant and
equipment
Intang.
assets
Property,
plant and
equipment
Intang.
assets
Property,
plant and
equipment
Intang.
assets
Carrying amount at the
beginning of the period 88,721 12,510 98,640 12,025 98,640 12,025
Capital expenditure 12,325 1,520 2,567 1,856 4,650 2,416
Disposals − -10 − − -9 −
Discontinued operations − − -18,484 -179 -18,211 -160
Acquired businesses − − 10,463 20 10,779 20
Depreciation, amortization
and impairment losses -11,937 -1,634 -10,071 -1,363 -13,714 -1,862
Reversal of impairment
losses 530 − − − − −
Exchange differences and
other changes 2,104 76 5,438 75 6,586 71
Carrying amount at the
end of the period 91,742 12,462 88,553 12,434 88,721 12,510
Intangible assets excluding goodwill.
20 (23)
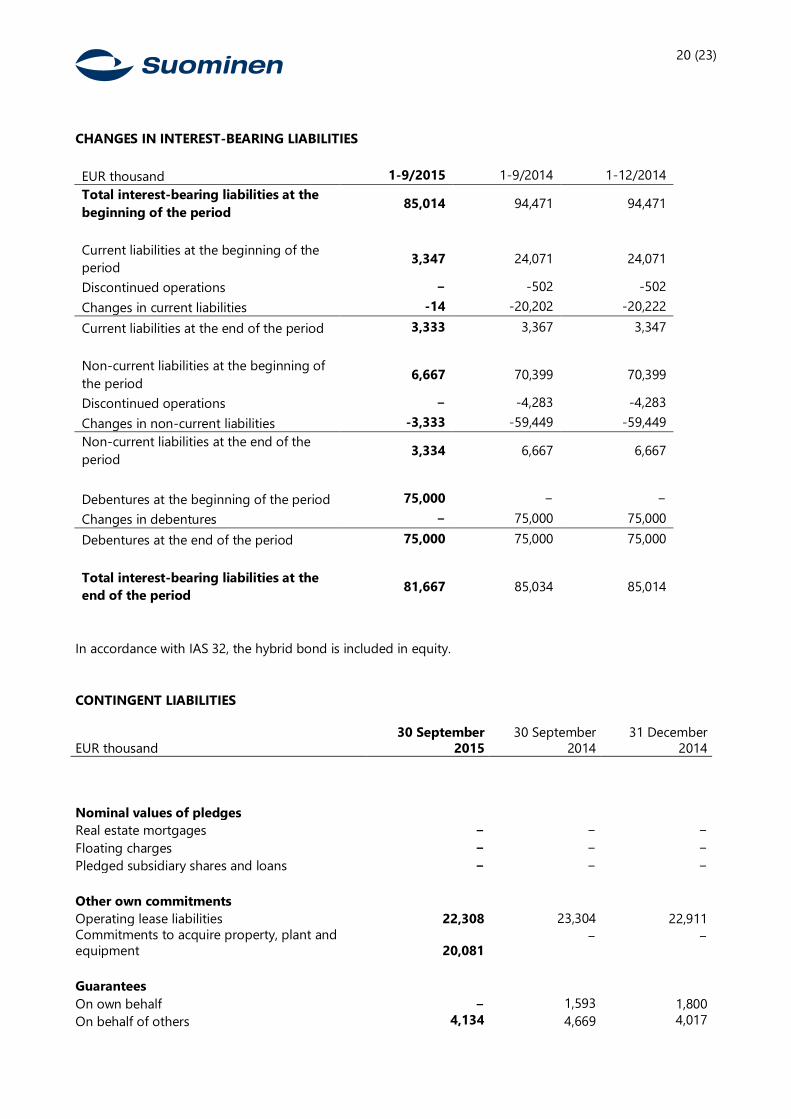
CHANGES IN INTEREST-BEARING LIABILITIES
EUR thousand 1-9/2015 1-9/2014 1-12/2014
Total interest-bearing liabilities at the
beginning of the period 85,014 94,471 94,471
Current liabilities at the beginning of the
period 3,347 24,071 24,071
Discontinued operations − -502 -502
Changes in current liabilities -14 -20,202 -20,222
Current liabilities at the end of the period 3,333 3,367 3,347
Non-current liabilities at the beginning of
the period 6,667 70,399 70,399
Discontinued operations − -4,283 -4,283
Changes in non-current liabilities -3,333 -59,449 -59,449
Non-current liabilities at the end of the
period 3,334 6,667 6,667
Debentures at the beginning of the period 75,000 − −
Changes in debentures − 75,000 75,000
Debentures at the end of the period 75,000 75,000 75,000
Total interest-bearing liabilities at the
end of the period 81,667 85,034 85,014
In accordance with IAS 32, the hybrid bond is included in equity.
CONTINGENT LIABILITIES
EUR thousand
30 September
2015
30 September
2014
31 December
2014
Nominal values of pledges
Real estate mortgages − − −
Floating charges − − −
Pledged subsidiary shares and loans − − −
Other own commitments
Operating lease liabilities 22,308 23,304 22,911
Commitments to acquire property, plant and
equipment 20,081 − −
Guarantees
On own behalf − 1,593 1,800
On behalf of others 4,134 4,669 4,017
21 (23)
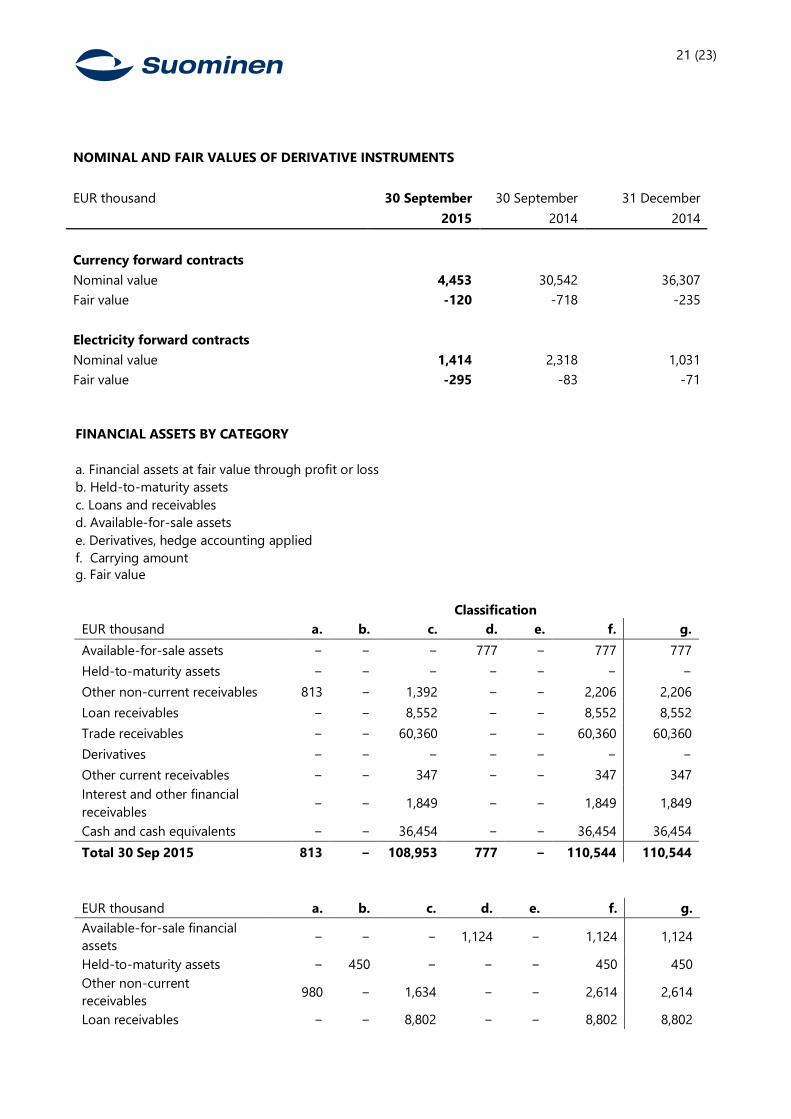
NOMINAL AND FAIR VALUES OF DERIVATIVE INSTRUMENTS
EUR thousand 30 September 30 September 31 December
2015 2014 2014
Currency forward contracts
Nominal value 4,453 30,542 36,307
Fair value -120 -718 -235
Electricity forward contracts
Nominal value 1,414 2,318 1,031
Fair value -295 -83 -71
FINANCIAL ASSETS BY CATEGORY
a. Financial assets at fair value through profit or loss
b. Held-to-maturity assets
c. Loans and receivables
d. Available-for-sale assets
e. Derivatives, hedge accounting applied
f. Carrying amount
g. Fair value
Classification
EUR thousand a. b. c. d. e. f. g.
Available-for-sale assets − − − 777 − 777 777
Held-to-maturity assets − − − − − − −
Other non-current receivables 813 − 1,392 − − 2,206 2,206
Loan receivables − − 8,552 − − 8,552 8,552
Trade receivables − − 60,360 − − 60,360 60,360
Derivatives − − − − − − −
Other current receivables − − 347 − − 347 347
Interest and other financial
receivables − − 1,849 − − 1,849 1,849
Cash and cash equivalents − − 36,454 − − 36,454 36,454
Total 30 Sep 2015 813 − 108,953 777 − 110,544 110,544
EUR thousand a. b. c. d. e. f. g.
Available-for-sale financial
assets − − − 1,124 − 1,124 1,124
Held-to-maturity assets − 450 − − − 450 450
Other non-current
receivables 980 − 1,634 − − 2,614 2,614
Loan receivables − − 8,802 − − 8,802 8,802
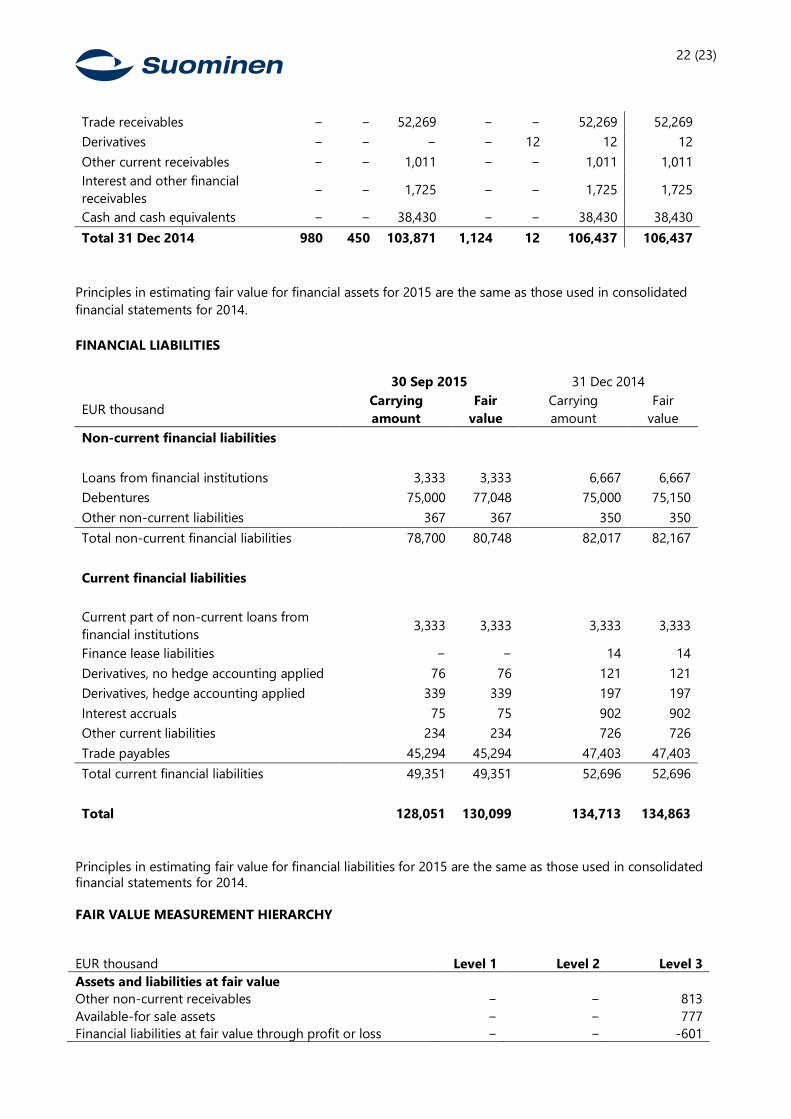
22 (23)
Trade receivables − − 52,269 − − 52,269 52,269
Derivatives − − − − 12 12 12
Other current receivables − − 1,011 − − 1,011 1,011
Interest and other financial
receivables − − 1,725 − − 1,725 1,725
Cash and cash equivalents − − 38,430 − − 38,430 38,430
Total 31 Dec 2014 980 450 103,871 1,124 12 106,437 106,437
Principles in estimating fair value for financial assets for 2015 are the same as those used in consolidated
financial statements for 2014.
FINANCIAL LIABILITIES
30 Sep 2015 31 Dec 2014
EUR thousand Carrying
amount
Fair
value
Carrying
amount
Fair
value
Non-current financial liabilities
Loans from financial institutions 3,333 3,333 6,667 6,667
Debentures 75,000 77,048 75,000 75,150
Other non-current liabilities 367 367 350 350
Total non-current financial liabilities 78,700 80,748 82,017 82,167
Current financial liabilities
Current part of non-current loans from
financial institutions 3,333 3,333 3,333 3,333
Finance lease liabilities − − 14 14
Derivatives, no hedge accounting applied 76 76 121 121
Derivatives, hedge accounting applied 339 339 197 197
Interest accruals 75 75 902 902
Other current liabilities 234 234 726 726
Trade payables 45,294 45,294 47,403 47,403
Total current financial liabilities 49,351 49,351 52,696 52,696
Total 128,051 130,099 134,713 134,863
Principles in estimating fair value for financial liabilities for 2015 are the same as those used in consolidated
financial statements for 2014.
FAIR VALUE MEASUREMENT HIERARCHY
EUR thousand Level 1 Level 2 Level 3
Assets and liabilities at fair value
Other non-current receivables − − 813
Available-for sale assets − − 777
Financial liabilities at fair value through profit or loss − − -601
23 (23)
Total − − 989
Derivatives at fair value
Currency forwards − -120 −
Electricity forwards − -295 −
Total − -415 −
Principles in estimating fair values in 2015 are the same as those used in consolidated financial statements
for 2014.
ANALYST AND PRESS CONFERENCE
Nina Kopola, President & CEO, and Tapio Engström, CFO, will present the Q3 financial result in Finnish at an
analyst and press conference in Helsinki today on 26 October at 12:00 noon (EEST). The conference will take
place at Event House Bank, Unioninkatu 20, Helsinki. The presentation material will be available after the
analyst and press conference at www.suominen.fi.
A teleconference and a webcast on the Q3 financial result will be held today on 26 October at 16:00 (EET).
The conference can be attended by phone at +44 (0)20 3059 8125 (United Kingdom and all other locations),
0800 588 9300 (Germany) or 020 012 5877 (Sweden). Please use the password "Suominen". The conference
can be accessed also at www.suominen.fi/webcast.
The conference call will be held in English. A replay of the conference can be accessed at
www.suominen.fi/webcast or by phone at 1 844 2308 058 (United States) or +44 121 260 4861 (United
Kingdom and all other locations), using access code 1930055#.
NEXT INTERIM REPORT
Suominen Corporation will publish its Financial Statement Release 2015 on Friday, 29 January 2016.
SUOMINEN CORPORATION
Board of Directors
For additional information, please contact:
Nina Kopola, President & CEO, tel. +358 (0)10 214 300
Tapio Engström, Senior Vice President and CFO, tel. +358 (0)10 214 300
Distribution:
NASDAQ OMX Helsinki Ltd
Key media
www.suominen.fi
Suominen in brief
Suominen manufactures nonwovens as roll goods for wipes as well as for medical and hygiene products. The
end products made of Suominen’s nonwovens – wet wipes, feminine care products and swabs, for instance -
bring added value to the daily life of consumers worldwide. Suominen is the global market leader in
nonwovens for wipes and employs approximately 600 people in Europe and in the Americas. Suominen’s net
sales in 2014 amounted to MEUR 401.8 and operating profit excluding non-recurring items to MEUR 26.9
(continuing operations). The Suominen share (SUY1V) is listed in NASDAQ OMX Helsinki Stock Exchange.
Read more at www.suominen.fi.