Embed Size (px)
Citation preview
INVESTMENTS AND TARGETS CHANGING THE GAME
Francesco GoriChief Operating Officer

2

AGENDA
INVESTMENT ALLOCATION
TYRE MARKET VALUE
PLAN ORGANIZATION: A TIGHT MATRIX
PIRELLI BY REGION
TYRE MARKET VOLUME AND INDUSTRY INVESTMENTS
STRATEGY IMPLEMENTATION
PIRELLI TARGETS BY MATRIX
“WHAT IF” CONTINGENCY PLANS
3

WORLD TYRE MARKET TREND
Source: Tire Business reports for 2000-2009
+9%+9%
-10.0%-10.0%
2000 2001 2002 2003 2004 2005 2006 2007 2008 2009
70 6972
8093
103112
128
140
126
4
CAGR
$/bln

Michelin
Bridgestone
Goodyear
WORLD MARKET SHARE TREND
Source: Tire Business reports for 2000-2009
70 69 7280
93
112
128
140
126
-
20
40
60
80
100
120
140
2000 2001 2002 2003 2004 2005 2006 2007 2008 20090%
5%
10%
15%
20%
25%
Market Share %
5
$/bln
Total Market
-5.8
-3.4
-3.4
Continental -0.7
Pirelli +0.7

WORLD TYRE MARKET: 5-YEAR FORECAST
Source: 2010-2015 Global Insight, Pirelli Estimates
>190
10%10%
+7%+7%
2009 2010 2011 2012 2013 2014 2015
126140 ~150
6
$/bln
Total Market
CAGR
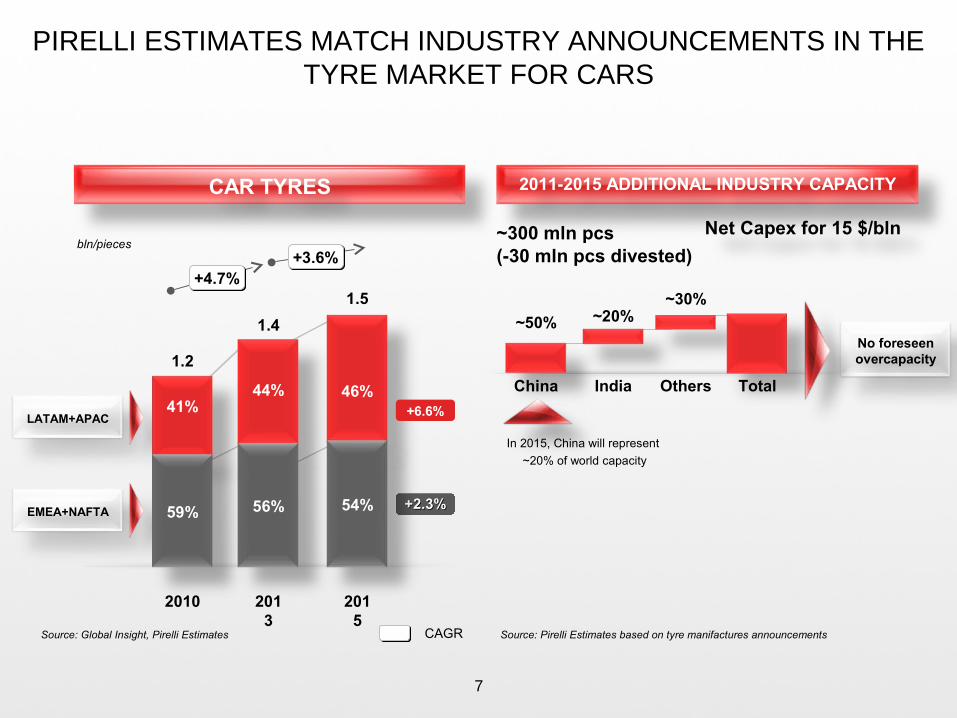
PIRELLI ESTIMATES MATCH INDUSTRY ANNOUNCEMENTS IN THE TYRE MARKET FOR CARS
7
~50% ~20%~30%
In 2015, China will represent
~20% of world capacity
2011-2015 ADDITIONAL INDUSTRY CAPACITY
CAGR
1.5
+3.6%+3.6%+4.7%+4.7%
CAR TYRES
LATAM+APAC
EMEA+NAFTA
bln/pieces
1.2
1.4
46%44%
2010 2013
2015
Source: Global Insight, Pirelli Estimates
+6.6%
+2.3%+2.3%
No foreseen overcapacity
China India Others Total
56% 54%
41%
59%
~300 mln pcs Net Capex for 15 $/bln
(-30 mln pcs divested)
Source: Pirelli Estimates based on tyre manifactures announcements

AND FOR TRUCKS
8
~40%~40%
~20%
~40 mln pcs Net Capex for 10 $/bln
(-2 mln pcs divested)
China India Others Total
No foreseen overcapacity
+5.3%+5.3%
+6.2%+6.2%
mln/pieces (All Steel)
2010 2013 2015+7.5%
+2.1%+2.1%
124
70%
148
164
2011-2015 ADDITIONAL INDUSTRY CAPACITYTRUCK TYRES
LATAM+APAC
EMEA+NAFTA
In 2015, China will represent
~50% of world capacity
30%
67%
73%
27%33%
CAGRSource: Global Insight, Pirelli Estimates Source: Pirelli Estimates based on tyre manifactures announcements
2010 2013
2015

PIRELLI MANAGED THROUGH A TIGHT MATRIX
Strategic deployment
Value proposition
Best practices
Digital innovation
9
EMEA NAFTA LATAM APAC
Product & Process proprietary technology
Breakthrough design
Time-to-market
Day-to-day delivery
Cost optimization
Regional adaptation
People developmentRevenues size indication
CONSUMER
INDUSTRIAL
R&D
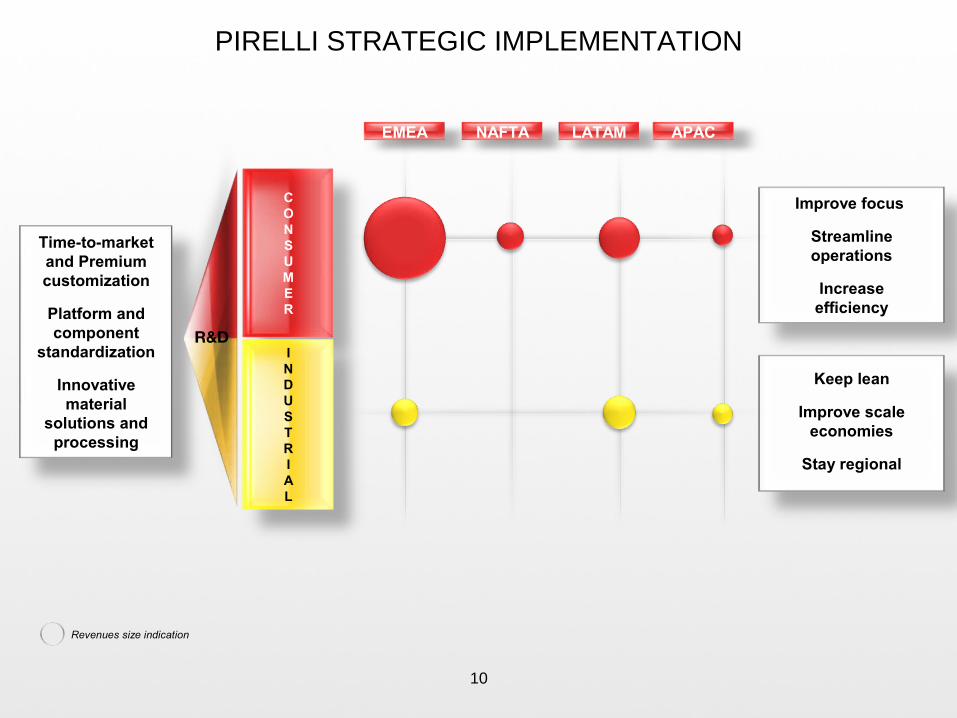
PIRELLI STRATEGIC IMPLEMENTATION
10
EMEA NAFTA LATAM APAC
Improve focus
Streamline operations
Increase efficiency
Keep lean
Improve scale economies
Stay regional
Time-to-market and Premium customization
Platform and component
standardization
Innovative material
solutions and processing
Revenues size indication
CONSUMER
INDUSTRIAL
R&D

KEY LEVER WILL BE THE INCREASE IN PIRELLI INVESTMENT RATE
1.2 0.7
15 11
1.35
1.4(net)
11
Capex (€/bln)
Additional capacity (mln pieces)
2011-13 2014-152006-10
INVESTMENT ALLOCATIONINVESTMENTS
Consumer
Industrial
14% 56%
3% 27%
MatureLATAM &
RDE

EMEA MARKET GROWTH AND PIRELLI STRATEGY
12
EBIT margin:
from mid-single digit to double digit by 2013
80%
464 484 501
81%
452
2.1%2.1%
Consumer Tyre Market (Car)
mln/pieces
OE
Repl.
2011 2013 20152010
19% 20%
80% 80%
87% 83%
29 30 3335
3.7%3.7%
83%87%
Industrial Tyre Market (Truck)
mln/pieces
OE
Repl.
2011 2013 20152010
13% 17%
Focus on premium fast growing segments
Consolidate leadershipin the Motorbike segment
Russia production focused on Winter
Selective approach to OEM
Low cost/premium capacity increase
Further cost efficiencies
Source: Global Insight, Pirelli Estimates
Pirelli Revenue Growth
MEA
EU
+6%+6%
2,5002,800
21%2,35020%
€/mln
2011E 2013E2010E
2,10019%
2009A
20%
13% 17%
20% 20%
79%81% 80% 80%

EMEA EBIT INDEX BRIDGE 2010-2013
Depreciation/ others
EfficienciesPrice/mix Raw materials
& cost of inputs
Volume EBIT 2013EBIT 2010
index “200”(30)
100
90
index “100”50
(110)
13
Index”100” = EBIT EMEA 2010

Focus on Premium Consumer segments
Focus on specialized dealer channel
Volume and Premium mix growth supported by new plant in Mexico
M/H Truck tyre sales restricted to Mexico
Selective approach to European OEM transplants
Strong brand appreciation from end-users as shown by 2010 JD Power study with Pirelli best OE tyre in the performance/sport segment
NAFTA MARKET GROWTH AND PIRELLI STRATEGY
14
EBIT margin:from single digit to
double digit by 2013
2.6%2.6%
22 23 2421
83% 80% 79%84%
Industrial Tyre Market (Truck)
2011 2013 20152010
OE
Repl.
mln/pieces
16% 17% 20% 21%
81% 81% 81%82%
3.0%3.0%
334 354 370318
Consumer Tyre Market (Car)
2011 2013 20152010
OE
Repl.
mln/pieces
18% 19% 19% 19%
Source: Global Insight, Pirelli Estimates
410 440
Pirelli Revenue Growth
2011E 2013E2010E
335
2009A
+8%(+10% in
USD)
+8%(+10% in
USD)520
€/mln
€/$ 1.33 in 2010; 1.40 in 2011/13

YUCATAN
CHIAPAS
TABASCOCAMPECHE
AGS.
SONORACHIHUAHUA
BA
JA C
ALIFO
RN
IA N
OR
TE
BA
JA C
ALIFO
RN
IA SU
R
SIN
ALO
A
DURANGO
NAYARIT
ZACATECAS TAMPS.
VERACRUZ
COLIMA
GUERREROOAXACA
JALISCO
COAHUILA
Nuevo
Leon
MEXICO CITY
BUILDING A PLATFORM FOR GROWTH IN NAFTA
Estabilishment of a new plant in Mexico with a yearly production capacity of ~5 mln car tyres by 2015
100% Premium tyres Dedicated to serve NAFTA countries, in
particular the USA
Key benefits
Better service and lower delivery times to NAFTA clients
Competitive manufacturing costs Lower logistic costs and no import duties
Key Investment returns Initial investment: 210 mln USD Value accretive already < 2013
15
NAFTA corridor

LATAM MARKET GROWTH AND PIRELLI STRATEGY
16
Regional Profitability:
no significant change (mid two-digit)
76%76%
10
77%77%
1112
14
6.8%6.8%
2011 2013 20152010
Industrial Tyre Market (Truck)
mln/pieces
OE
Repl.
23% 23% 24% 24%
6.5%6.5%
7889 98
72
73% 74% 74%73%
2011 2013 20152010
Consumer Tyre Market (Car)
mln/pieces
OE
Repl.
27% 27% 26% 26%
Consolidate Regional leadership
Keep expanding Pirelli exclusive tyre dealer network in best locations
Exploit growing Premium OEM fitments’ pull-through on after market sales
Increase local-for-local content
Source: Global Insight, Pirelli Estimates
>1.7
>2.2>1.8
2011E 2013E2010E
Pirelli Revenue Growth
1.33
2090A
€/$ 1.33 in 2010; 1.40 in 2011/13
+10%(+11% in
USD)
+10%(+11% in
USD)
€/bln
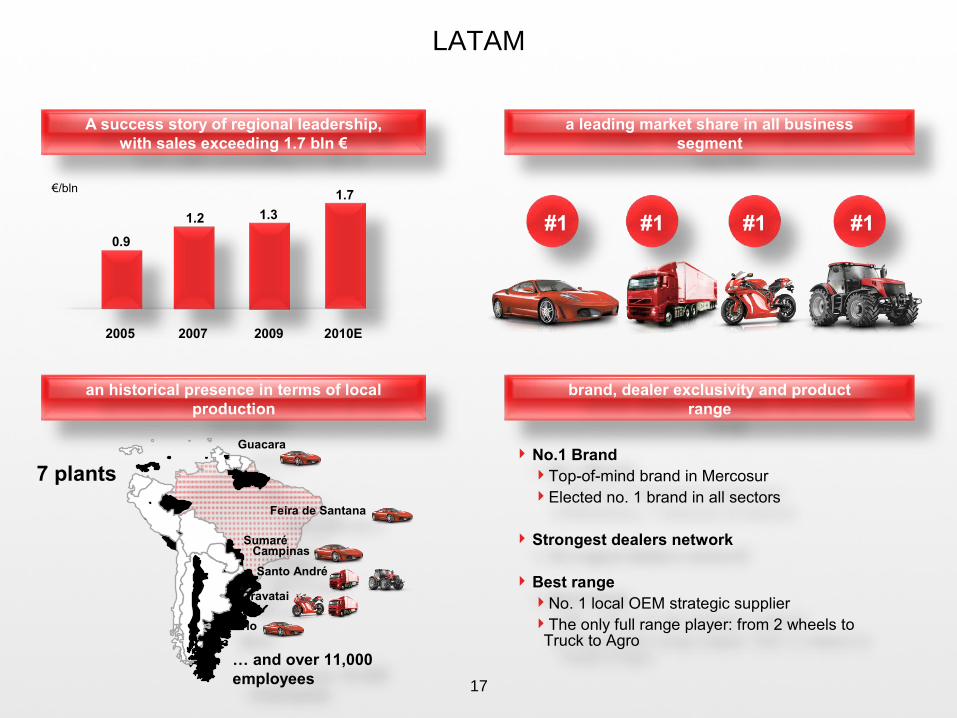
brand, dealer exclusivity and product range
an historical presence in terms of local production
a leading market share in all business segment
LATAM
0.9
2005 2007 2009
1.2 1.3
2010E
1.7
… and over 11,000 employees
Campinas
7 plants
Santo André
Gravatai
Sumaré
No.1 BrandTop-of-mind brand in MercosurElected no. 1 brand in all sectors
Strongest dealers network
Best rangeNo. 1 local OEM strategic supplierThe only full range player: from 2 wheels to
Truck to Agro
17
A success story of regional leadership, with sales exceeding 1.7 bln €
#1 #1 #1 #1
Feira de Santana
Merlo
Guacara
€/bln
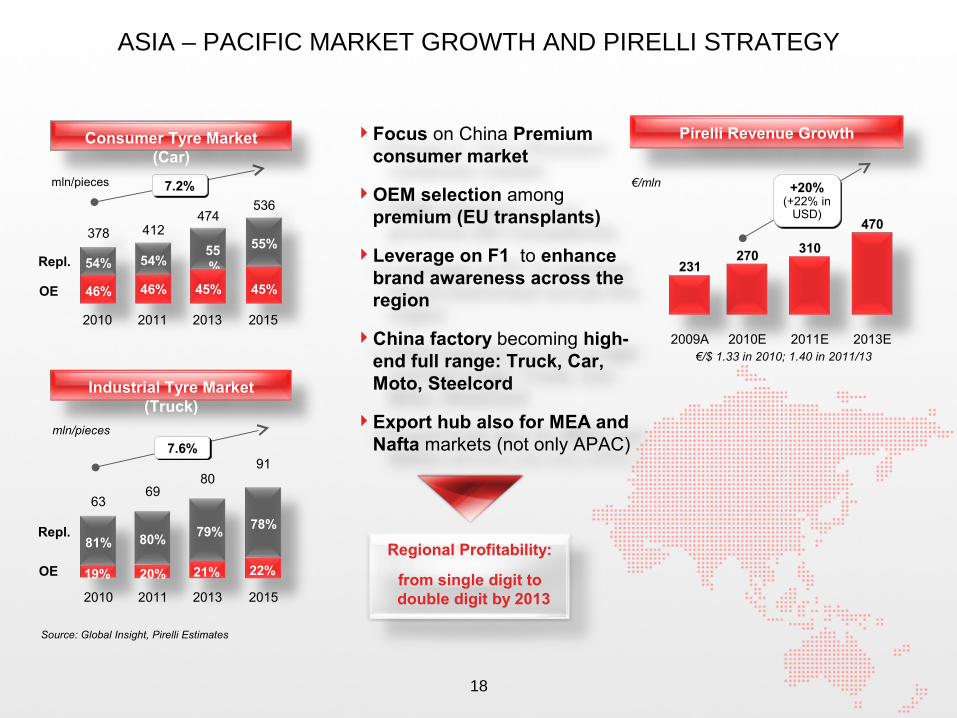
ASIA – PACIFIC MARKET GROWTH AND PIRELLI STRATEGY
Focus on China Premium consumer market
OEM selection among premium (EU transplants)
Leverage on F1 to enhance brand awareness across the region
China factory becoming high-end full range: Truck, Car, Moto, Steelcord
Export hub also for MEA and Nafta markets (not only APAC)
Regional Profitability:
from single digit to double digit by 2013
18
OE
Repl.
mln/pieces
55%
55%
7.2%7.2%
412474
536
378
2011 2013 20152010
54%54%
Consumer Tyre Market (Car)
46% 46% 45% 45%
mln/pieces
OE
Repl.80%
79%78%
63
81%
8091
69
7.6%7.6%
2011 2013 20152010
Industrial Tyre Market (Truck)
19% 20% 21% 22%
Source: Global Insight, Pirelli Estimates
€/mln
2011E 2013E2010E
270
470
310
Pirelli Revenue Growth
2009A
231
+20%(+22% in
USD)
+20%(+22% in
USD)
€/$ 1.33 in 2010; 1.40 in 2011/13

DEVELOPING PIRELLI PRESENCE IN THE CHINESE MARKET
Planned investments will raise Pirelli capacity to serve the fast
growing Chinese mkt
Truck tyres Car tyres
+40%
+100%
19
Optimal location: half way between seaside and metropolitan areas
Competitive labor cost
Competitive energy cost
Additional capacity by 2013
Largest and best located industrial compound among tyre peers

STRATEGIC SOURCING: FOUR KEY DIRECTIONS
Source: SICOM, oilnergy.com
20
GETTING CLOSER TO NATURAL RUBBER PLANTATIONS
OPEN INNOVATION WITH KEY SYNTHETIC RUBBER PLAYERS
DEVELOPING NEW BIOMATERIALS REPLACING NON-GREEN ONES
INCREASING STEEL CORD PRODUCTION TO MAINTAIN VERTICALIZATION
Brazil
Turkey
Cina
Romania
BrazilBrazil
Brazil
Italy
Germany
Russia Cina
Japan
Liberia
Vietnam
Indonesia

'2007 QI/08 QII/08 QIII/08 QIV/08 QI/09 QII/09 QIII/09 QIV/09 QI/10 QII/10 QIII/10 QIV/10
RAW MATERIAL TREND ASSUMPTION
NATURAL RUBBER
SYNTHETIC RUBBER
21
Avg 2007 = 100
SBR
2,060 $/ton
'2007 QI/08 QII/08 QIII/08 QIV/08 QI/09 QII/09 QIII/09 QIV/09 QI/10 QII/10 QIII/10 QIV/10
Avg 2007 = 100
TSR 20
2,153 $/ton
-200 -300
2011 2011-2013
Input costs headwind
Efficiencies vs 2010 ~+200+80
* *
* Raw materials cost variance vs 2010
Source: SICOM, CMAI
€/mln

PIRELLI PROFITABILITY TARGETS BY REGION
>40%>30%
>20%>30%
Rebalanced profitability between Regions
RDE (Except LATAM)
LATAM
MATURE
2010E 2013E 2015E
22
>50%
<20%
<30% <40% >30%

PIRELLI TARGETS BY SEGMENTS
€/Bln
> 6.0
> 4.7> 5.1
Ind.
Cons.
8%8%
32%32%
31%
2013E2010E 2011E 2013E2010E 2011E
>8.5%
9÷10%
11÷12%
30%
31%
33%Ind.
Cons.
Volumes +4% +5%
Price/Mix +4% +3%
23
PBIT (Post Restr.)Revenues
4.0
29%
2009A 2009A
7.7%
33%
2011 vs 2010
CAGR2010-2013
71% 69%68%
68%
67% 67%69%
70%
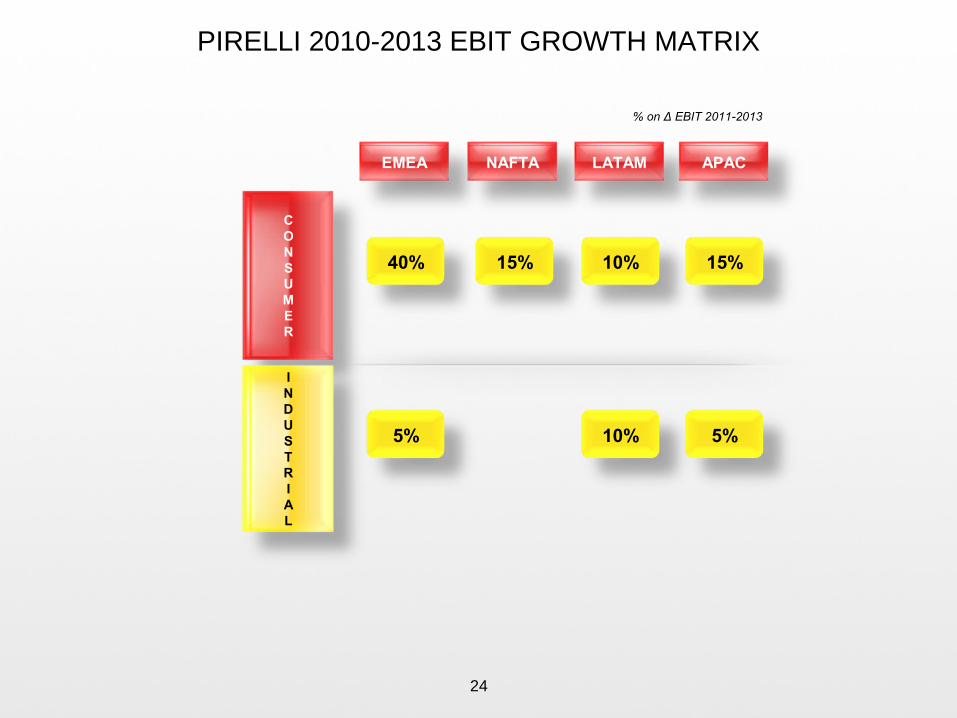
PIRELLI 2010-2013 EBIT GROWTH MATRIX
40% 15% 10% 15%
5% 10% 5%
24
% on Δ EBIT 2011-2013
EMEA NAFTA LATAM APAC
CONSUMER
INDUSTRIAL

TYRE EBIT INDEX BRIDGE 2010-2013
25
Index”100” = EBIT 2010
Depreciation/ others
Raw materials
& cost of inputs
EfficienciesPrice/mixVolume EBIT 2013EBIT 2010
Index “160”
Index “100”
40 (20)
60
70 (90)70
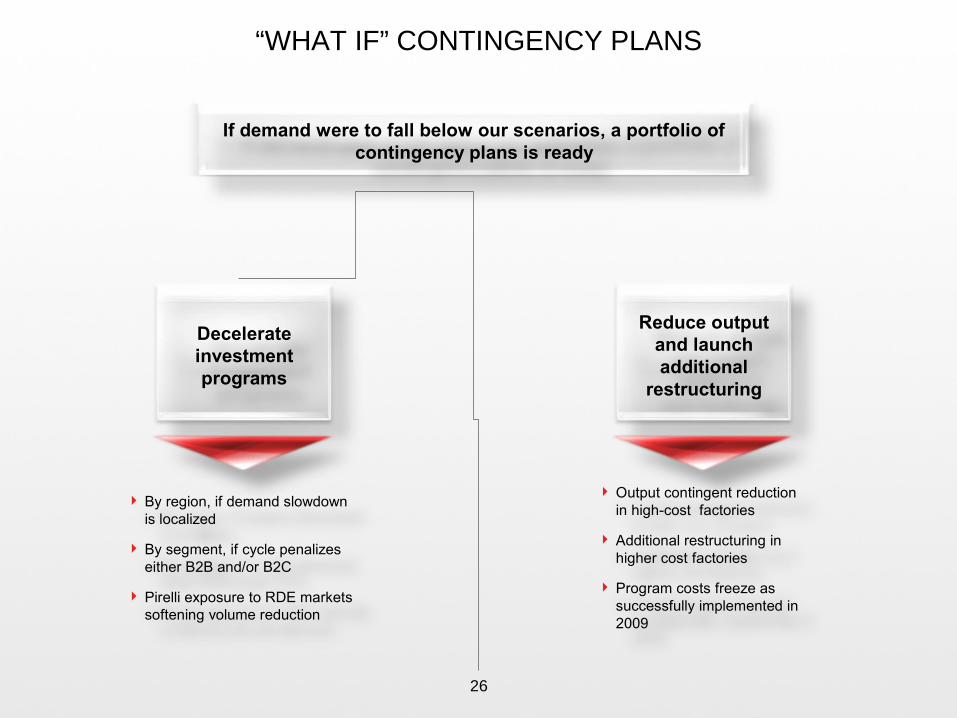
“WHAT IF” CONTINGENCY PLANS
If demand were to fall below our scenarios, a portfolio of contingency plans is ready
Decelerate investment programs
Reduce output and launch additional
restructuring
26
By region, if demand slowdown is localized
By segment, if cycle penalizes either B2B and/or B2C
Pirelli exposure to RDE markets softening volume reduction
Output contingent reduction in high-cost factories
Additional restructuring in higher cost factories
Program costs freeze as successfully implemented in 2009

THIS AFTERNOON
27
Leading Edge
Technology
CONSUMER
R&D
INDUSTRIAL
MOTO 2 Wheels Ahead
CARPremium and Efficiency
AGROLeverage on Growth
TRUCK & STEEL CORD
Regional and Lean

DISCLAIMER
28
This presentation contains statements that constitute forward-looking statements based on Pirelli & C SpA’s current expectations and projections about future events and does not constitute an offer or solicitation for the sale, purchase or acquisition of securities of any of the companies mentioned and is directed to professionals of the financial community. These statements appear in a number of places in this presentation and include statements regarding the intent, belief or current expectations of the customer base, estimates regarding future growth in the different business lines and the global business, market share, financial results and other aspects of the activities and situation relating to the Company. Such forward looking statements are not guarantees of future performance and involve risks and uncertainties, and actual results may differ materially from those expressed in or implied by these forward looking statements as a result of various factors, many of which are beyond the ability of Pirelli & C SpA to control or estimate precisely. Consequently it is recommended that they be viewed as indicative only. Analysts are cautioned not to place undue reliance on those forward looking statements, which speak only as of the date of this presentation. Pirelli & C. SpA undertakes no obligation to release publicly the results of any revisions to these forward looking statements which may be made to reflect events and circumstances after the date of this presentation, including, without limitation, changes in Pirelli & C. SpA business or acquisition strategy or to reflect the occurrence of unanticipated events. The Manager mandated to draft corporate accounting documents of Pirelli & C. SpA. Francesco Tanzi, attests – as per art.154-bis. comma 2 of the Testo Unico della Finanza (D.Lgs. 58/1998) – that all the accounting information contained in this presentation correspond to the documented results, books and accounting of the Company.