Embed Size (px)
Citation preview
Long-Term Strategy
for Mobilising Investments
in the ENERGY RENOVATION OF
BUILDINGS
October 2015
2
Table of contents
Summary .................................................................................................................................................................. 10
1 Introduction .................................................................................................................................................... 13
2 Overview of the building stock and the potentials for renovation ............................................................. 14
2.1 Definition of energy renovation ........................................................................................................... 16
2.2 Housing sector ..................................................................................................................................... 17
2.2.1 Status of building stock ................................................................................................................... 17
2.2.2 Renovation potential ....................................................................................................................... 19
2.3 Public and other service sector ............................................................................................................. 21
2.3.1 Status of building stock ................................................................................................................... 22
2.3.2 Renovation potential ....................................................................................................................... 24
2.4 Buildings owned and occupied by central government ........................................................................ 25
1. Establishment of a list of buildings owned and occupied by central government ........................... 26
2. Determination of the conditions for renovation .............................................................................. 26
3. Financing of projects from the new financial perspective under the OP EKP 2014–2020.............. 27
4. Pilot or demonstration projects ........................................................................................................ 27
5. Monitoring of the targets (OP EKP 2014–2020) ............................................................................. 27
2.5 Buildings owned and occupied by the wider public sector .................................................................. 28
2.5.1 The strategy for the energy renovation of buildings owned and occupied by the wider public
sector will be accomplished by means of the following activities: ................................................. 28
1. Determination of the conditions for renovation .............................................................................. 28
2. Financing of projects from the new financial perspective under the OP EKP 2014–2020.............. 29
3. Implementation of pilot or demonstration projects ......................................................................... 29
3 Obstacles and opportunities in the monitoring of measures to increase energy performance – SWOT
analysis ............................................................................................................................................................ 30
3.1 Housing sector ..................................................................................................................................... 30
3.2 Buildings owned and occupied by central government ........................................................................ 32
3.3 Public and private service sector .......................................................................................................... 34
4 Cost-effective approaches to building renovation ....................................................................................... 37
4.1 Premises ............................................................................................................................................... 37
4.2 Technical potential for the implementation of cost-effective measures ............................................... 39
4.3 Characteristics of building construction, broken down by period ........................................................ 44
4.4 Technical/economic aspect of the energy renovation of a building ..................................................... 46
4.4.1 Establishment of reference buildings .............................................................................................. 46
4.4.2 Definition of measures and scenarios .............................................................................................. 49
4.5 Calculation of primary energy use ....................................................................................................... 54
4.6 Cost-effective renovation ..................................................................................................................... 54
4.7 Details of energy renovations carried out ............................................................................................ 59
5 Policies and measures to promote energy renovation ................................................................................. 66
5.1 Framework of the Strategy – legal and strategic foundations for the formulation of targets ............... 66
5.2 Vision, targets and timetable of the Long-Term Strategy for Mobilising Investments in the
Renovation of Buildings ...................................................................................................................... 68
3
5.3 Measures .............................................................................................................................................. 70
5.3.1 5.3.1. Overview of measures in existing implementing documents ................................................ 71
5.4 Summary and upgrading of the strategic guidelines for mobilising investments in the renovation of
buildings ............................................................................................................................................... 79
5.4.1 Development measures ................................................................................................................... 79
5.4.2 Horizontal measures ........................................................................................................................ 82
5.4.3 Public sector .................................................................................................................................... 83
5.4.4 Residential buildings ....................................................................................................................... 87
5.4.5 Buildings in the private service sector............................................................................................. 87
5.4.6 Complementary policies .................................................................................................................. 87
5.5 Measurability of targets – linking targets with an assessment of the effects and with measures to
monitor the effects ............................................................................................................................... 88
6 Future-oriented perspectives for guiding investment decisions ................................................................. 89
6.1 Estimate of the investment volumes required ...................................................................................... 89
6.2 Funding sources ................................................................................................................................... 90
6.2.1 Housing sector ................................................................................................................................. 91
6.2.2 Public sector .................................................................................................................................... 92
6.2.3 Private service sector ....................................................................................................................... 93
7 Estimate of savings and wider benefits ........................................................................................................ 94
7.1 Economic benefits ................................................................................................................................ 94
7.1.1 Energy savings ................................................................................................................................ 94
7.2 Social benefits ...................................................................................................................................... 97
7.3 Environmental benefits ........................................................................................................................ 98
7.4 Benefits for the energy system ............................................................................................................. 99
8 ASSUMPTIONS AND METHODOLOGY ............................................................................................... 100
8.1 Renovation rate .................................................................................................................................. 100
8.2 Estimated value of investments .......................................................................................................... 103
Annex A Premises for formulating the Strategy’s targets (Annex to Section 5.1) ..................................... 108
Annex B .................................................................................................................................................................. 120
Calculation of energy indicators for different variants of measures for the energy renovation of buildings 120

4
List of figures
Figure 1: Total floor area of buildings by sector, 2012 (m2
millions, share) (Source: SURS, IJS CEU) .................. 15
Figure 2: Total floor area of new-builds (left) and of building stock as a whole (right), 1999 to the present
(Source: IJS-CEU, data: SURS, REN) ...................................................................................................................... 15
Figure 3: Structure of residential building stock by year of construction (Source: GI ZRMK, data: REN, 2014) ... 18
Figure 4: Distribution of single-family houses with energy performance certificates by year of construction and
energy class (situation as at 19 April 2015, number of energy performance certificates = 3 296) (Source: GI
ZRMK, data: Register of Energy Performance Certificates) .................................................................................... 19
Figure 5: Distribution of number of multi-apartment buildings with energy performance certificates by year of
construction and energy performance class (situation as at 19 April 2015, number of energy performance
certificates = 4 982) (Source: GI ZRMK, data: Register of Energy Performance Certificates) ................................ 19
Figure 6: Weighted level for renovation within the period for single-family and multi-apartment buildings in the
reference (REF) and intensive (INT) strategy (Source: IJS-CEU) ............................................................................ 20
Figure 7: Schematic presentation of the building stock renovation model (Source: AN sNES). .............................. 21
Figure 8: Proportion of floor area of buildings of various non-residential building categories (total floor area in
1 000 m2, share, Source: IJS-CEU) ........................................................................................................................... 23
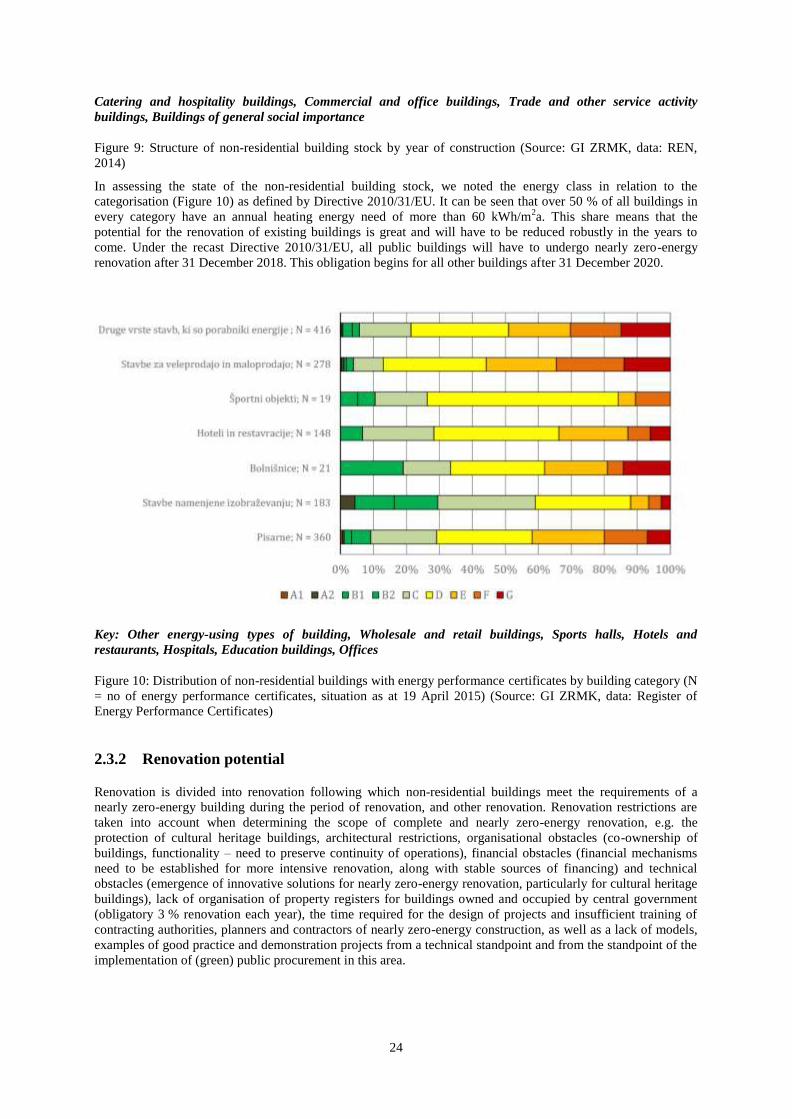
Figure 9: Structure of non-residential building stock by year of construction (Source: GI ZRMK, data: REN,
2014) ......................................................................................................................................................................... 24
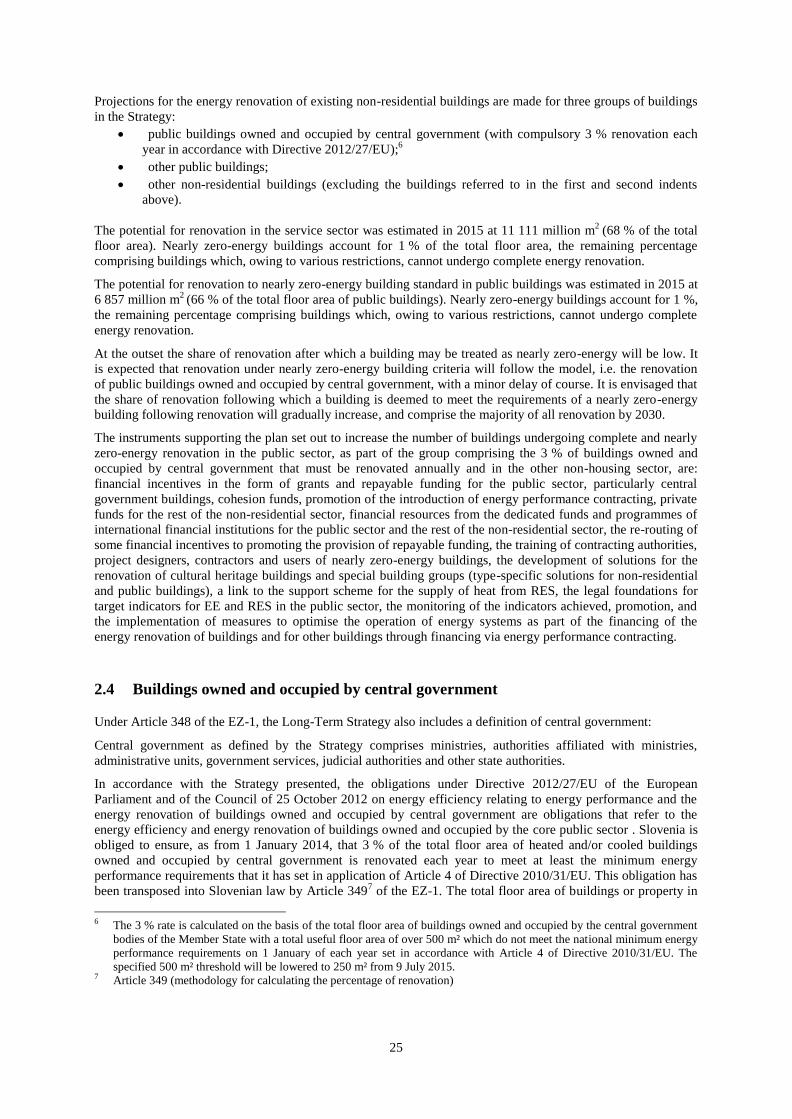
Figure 10: Distribution of non-residential buildings with energy performance certificates by building category (N
= no of energy performance certificates, situation as at 19 April 2015) (Source: GI ZRMK, data: Register of
Energy Performance Certificates) ............................................................................................................................. 24
Figure 11: Schematic presentation of cost-effective and cost-optimal energy renovation (Source: EC, GI ZRMK) 38
Figure 12: Determination of the cost-optimal level of energy design of a building undergoing energy renovation:
reference multi-apartment building with the energy characteristics of 1960, VSS1 (left) and the characteristics of
1980, VSS2 (right). ................................................................................................................................................... 38
Figure 13: Baseline technical potential for the implementation of the complete energy renovation of building
envelopes relative to the total useful floor area of a specific group of buildings (Source: GI ZRMK, data: REN,
2014) ......................................................................................................................................................................... 40
Figure 14: Total floor area of buildings, cumulative potential for complete energy renovation and the renovation
of the facade (with reference to the age of the building) in the baseline year 2014, based on information from
REN 2014, for single-family houses (left) and multi-apartment buildings (right) (Source: GI ZRMK). ................. 41
Figure 15: Total floor area of buildings, cumulative potential for complete energy renovation and the renovation
of the facade (with reference to the age of the building) in the baseline year 2014, based on information from
REN 2014, for public buildings (excluding buildings owned and occupied by central government, left) and other
non-residential buildings (right) (Source: GI ZRMK). ............................................................................................. 42
Figure 16: Example of the annual growth of technical potential for renovation of the facades of single-family
houses, broken down according to the age of building stock that meets the age condition for renovation (Source:
GI ZRMK). ............................................................................................................................................................... 42
Figure 17: Example of the annual growth of technical potential for renovation of the facades of multi-apartment
buildings, broken down according to the age of building stock that meets the age condition for renovation
(Source: GI ZRMK). ................................................................................................................................................. 43
Figure 18: Example of the annual growth of technical potential for renovation of the facades of public buildings
(excluding buildings owned and occupied by central government), broken down according to the age of building
stock that meets the age condition for renovation (Source: GI ZRMK).................................................................... 43
Figure 19: Example of the annual growth of technical potential for renovation of the facades of other non-
residential buildings, broken down according to the age of building stock that meets the age condition for
renovation (Source: GI ZRMK). ............................................................................................................................... 44
Figure 20: Annual temperature deficit (left) and population density (right) in Slovenia (Source: ARSO, SURS) ... 50
Figure 21: Different variants and the position of the cost-optimal range (Source: Guideline) ................................. 55
5
Figure 22: Investment costs in relation to primary energy use: single-family house ESS1 – major renovation
(1960) (financial analysis, discount rate 3 %, high energy price) (Source: GI ZRMK). ........................................... 56
Figure 23: Investment costs in relation to primary energy use: multi-apartment building VSS1 – major
renovation (1960) (financial analysis, discount rate 3 %, high energy price) (Source: GI ZRMK). ......................... 57
Figure 24: Investment costs in relation to primary energy use: non-residential building JSS1 – major renovation
(1960) (financial analysis, discount rate 3 %, high energy price) (Source: GI ZRMK). ........................................... 58
Figure 25: Number of incentives disbursed: Total EE measures .............................................................................. 59
Figure 26: Number of incentives disbursed Total RES measures ............................................................................. 60
Figure 27: Number of contracts signed under individual tenders and the level of funds allocated for these projects60
Figure 28: Total annual energy savings under individual tenders and the floor area of buildings undergoing
energy renovation ...................................................................................................................................................... 61
Figure 29: Overview of energy renovation measures carried out on building envelopes under LS1 ........................ 61
Figure 30: Use of energy-efficient heating, cooling and ventilation systems (lower) and use of RES technologies
and cogeneration (upper) .......................................................................................................................................... 62
Figure 31: Average heat transfer of a facade wall following a measure carried out under LS1 with both
borderline cases (left) and an analysis of the cost-optimal level of individual measures on a facade wall (right)
(Source: GI ZRMK). ................................................................................................................................................. 63
Figure 32: Average heat transfer of windows following a measure carried out under LS1 with both borderline
cases (left) and an analysis of the cost-optimal level of individual measures of window replacement (right)
(Source: GI ZRMK). ................................................................................................................................................. 63
Figure 33: Average heat transfer of a roof following a measure carried out under LS1 with both borderline cases
(left) and an analysis of the cost-optimal level of individual measures on a roof (right) (Source: GI ZRMK)......... 64
Figure 34: Analysis of cost-optimal level of the building envelope (F – facade, R – roof, W – windows, with the
appurtenant heat transfer value) (Source: GI ZRMK). .............................................................................................. 65
Figure 35: Projection of primary energy savings resulting from the implementation of measures for the energy
renovation of existing buildings up to 2050 (Source: IJS-CEU) ............................................................................... 95
Figure 36: Trend in GHG emissions from the use of fuels in existing buildings and the projection for the period
leading up to 2030 (Source: IJS-CEU) ...................................................................................................................... 99
Figure 37: Floor area of renovated buildings in the residential and the public and private service sectors in the
2016–2030 period (equivalent complete energy renovations of buildings are shown for the housing sector)
(Source: IJS-CEU) .................................................................................................................................................. 102
Figure 38: Floor area of renovated buildings in the residential and the public and private service sectors in the
2016–2050 period (the total floor area undergoing partial or complete energy renovation is shown; floor areas
partly renovated can be renovated several times) (Source: IJS-CEU) .................................................................... 103
Figure 39: Projected structure of building stock in single-family houses and multi-apartment buildings in relation
to the energy performance of buildings (with regard to the specific consumption of useful energy for heating,
expressed in kWh/year) for existing buildings (Source: IJS-CEU) ......................................................................... 104
Figure 40: Projected structure of newly purchased boilers within the heating systems of existing residential
buildings in relation to energy source and type of device (single-family houses and multi-apartment buildings
together) (Source: IJS-CEU) ................................................................................................................................... 105
Figure 41: Projected improvement in energy-use intensity in service activities 2012–2030 (Source: IJS-CEU) ... 106
6
List of tables
Table 1: Useful floor area by individual group of the single classification of buildings (CC-SI) in Slovenia, 2012
(Source: IJS-CEU, data from GURS, SURS, IJS-CEU) ........................................................................................... 14
Table 2: Useful floor area of residential buildings by individual group under the single classification of buildings
(CC-SI) in Slovenia, 2012 (Source: IJS-CEU, data: GURS, SURS, IJS-CEU) ........................................................ 17
Table 3: Non-residential building categories (Source: IJS-CEU, data: GURS, SURS, IJS-CEU) ............................ 22
Table 4: Matrix of strengths, weaknesses, opportunities and threats (SWOT) for investments in the increased
energy performance of residential buildings ............................................................................................................. 31
Table 5: Matrix of strengths, weaknesses, opportunities and threats (SWOT) for investments in the increased
energy performance of buildings owned and occupied by central government ........................................................ 32
Table 6: Matrix of strengths, weaknesses, opportunities and threats (SWOT) for investments in the increased
energy performance of buildings in the public and private service sector ................................................................ 34
Table 7: Characteristics of individual age groups of buildings and the recommended cost-effective measures ....... 44
Table 8: Overview of the maximum permitted heat transfer of building envelope elements [W/(m2K)] ................. 46
Table 9: Reference single-family house for existing buildings (1960, major renovation) ........................................ 48
Table 10: Reference multi-apartment building for existing buildings (1960, major renovation) .............................. 48
Table 11: Reference building for existing public and other non-residential buildings (1960, major renovation) ..... 49
Table 12: List of measures/variants (P1–P17, major renovation, 1960) ................................................................... 51
Table 13: List of measures/variants (P19–P74, major renovation, 1960, 1980) ....................................................... 52
Table 14: Overview of indicators and achievement of the targets set in OP TGP 2020 (Source: IJS-CEU) ............ 70
Table 15: Overview of measures adopted in implementing documents (horizontal for all buildings) ...................... 71
Table 16: Overview of measures adopted in implementing documents for residential buildings ............................. 75
Table 17: Overview of measures adopted in implementing documents (horizontal public sector buildings) ........... 77
Table 18: Total volume of investments in the energy renovation of buildings, by sector (value excl. VAT)
(Source: IJS-CEU) .................................................................................................................................................... 90
Table 19: Total volume of investments in the energy renovation of residential buildings and total funding sources
2015–2023................................................................................................................................................................. 91
Table 20: Total volume of investments in the energy renovation of public sector buildings and possible funding
sources 2016–2023 .................................................................................................................................................... 92
Table 21: Floor area of renovated buildings in the housing sector 2016–2030 – summary (Source: IJS-CEU) ..... 101
Table 22: Floor area of renovated buildings in the public and private service sector 2016–2030 .......................... 102
Table A 1: Summary of the operational national targets deriving from international obligations and important for
the housing sector.................................................................................................................................................... 109
Table A 2: Summary of indicative building-related targets in the adopted national documents and documents
under preparation .................................................................................................................................................... 110
Table A 3: Intermediate targets for new nearly zero-energy buildings under the AN sNES .................................. 112
Table A 4: Intermediate targets for the nearly zero-energy renovation of buildings in the residential and non-
residential sectors, including the public sector, under the AN sNES ...................................................................... 112
Table A 5: Share of emissions of particles from general consumption in 2011 (Source: ARSO environmental
indicators) ............................................................................................................................................................... 113
Table A 6: Required reduction in GHG emissions by sector from the Roadmap for Moving to a Competitive
Low-Carbon Economy in 2050 ............................................................................................................................... 114
Table A 7: Indicators in relation to buildings from the OP TGP 2020 and the target values in 2020 ..................... 116
Table A 8: Result indicators for individual programmes by specific objective (for the ERDF and Cohesion Fund)
for the ‘Sustainable Use and Production of Energy, and Intelligent Networks’ priority axis (Source: OP EKP
2014–2020) ............................................................................................................................................................. 118

7
Table A 9: Indicators of Priority Axis 4 (‘Sustainable Use and Production of Energy, and Intelligent Networks’)
relevant to buildings (Source: OP EKP 2014–2020) ............................................................................................... 118
Table A 10: Indicators of Priority Axis 3 (‘Dynamic and competitive businesses for green economic growth’) of
importance for the area of buildings (Source: OP EKP 2014–2020) ...................................................................... 118
Table A 11: Estimated shares of renewable energy sources in buildings (Source: AN OVE 2010−2020) ............. 119
Table B 1: Primary energy use in single-family house – major renovation (1960)................................................. 120
Table B 2: Primary energy use in multi-apartment building VSS1 – major renovation (1960) .............................. 122
Table B 3: Primary energy use in public building JSS1 – major renovation (1960) ............................................... 124

8
List of abbreviations
(AN sNES) Action Plan for Nearly Zero-Energy Buildings
AN OVE 2010−2020 Renewable Energy Action Plan 2010–2020
AN URE 2020 National Energy Efficiency Action Plan 2014–2020
ARSO Slovenian Environment Agency
GDP Gross domestic product
BORZEN Public utility service for electricity market organisation
CC-SI Classification of building types (Decree on the Classification of Building Types and
Buildings of National Importance, UL RS, No 109/11)
CC-SI Uniform classification of building types
COSME 2020 Framework Competitiveness Programme for Small and Medium-Sized Enterprises
2014–2020
DB 2030 Long-Term Energy Balance of Slovenia up to 2030
Directive 2009/28/EC Directive 2009/28/EC of the European Parliament and of the Council of 23 April
2009 on the promotion of the use of energy from renewable sources and amending
and subsequently repealing Directives 2001/77/EC and 2003/30/EC
Directive 2010/31/EU Directive 2010/31/EU of the European Parliament and of the Council of 19 May
2010 on the energy performance of buildings (recast)
Directive 2012/27/EU Directive 2012/27/EU of the European Parliament and of the Council of 25 October
2012 on energy efficiency, amending Directives 2009/125/EC and 2010/30/EU and
repealing Directives 2004/8/EC and 2006/32/EC
EED Energy Efficiency Directive (Directive 2012/27/EU)
EEIF Energy Efficiency Industry Forum
EFSI European Fund for Strategic Investments
EIB European Investment Bank
EPC Energy performance contracting
EPB Energy performance of buildings (nearly zero-energy buildings)
ESCO Energy service company
ERDF European Regional Development Fund
ESF European Social Fund
EU European Union
EUR Euro
EUROPE 2020 EU growth strategy for the coming decade
EZ-1 Energy Act
GEF Global Environment Facility
GI ZRMK Gradbeni inštitut ZRMK d.o.o.
GURS Surveying and Mapping Authority of the Republic of Slovenia
IJS-CEU Centre for Energy Efficiency (CEU) – Institut Jožef Stefan
INOP Operational programme implementation plan
IPCC Intergovernmental Panel on Climate Change
JSS Non-residential building
JUS.U.J5.600 Technical conditions for the design and construction of buildings
PPP Public-private partnership
CF Cohesion Fund
LCA Life-cycle assessment
LCC Life-cycle costing
LS1 Public tender for the co-financing of operations for the energy renovation of
buildings owned by local communities
LS2 Public tender for the co-financing of operations for the energy renovation of
primary schools, nursery schools, health centres and libraries owned by local
communities
MGRT Ministry of Economic Development and Technology

9
MOP Ministry of the Environment and Spatial Planning
SME Small and medium-sized enterprises
MzI Ministry of Infrastructure
Horizon 2020 EU Framework Programme for Research and Innovation 2014–2020
Decision 2009/406/EC Decision No 406/2009/EC of the European Parliament and of the Council of 23
April 2009 on the effort of Member States to reduce their greenhouse gas emissions
to meet the Community’s greenhouse gas emission reduction commitments up to
2020
OP EKP 2014–2020 Operational Programme for the Implementation of European Cohesion Policy 2014–
2020
OP PM10 Operational Programme for the Protection of Ambient Air Against Pollution Caused
by PM10
OP TGP 2020 Operational Programme for Reducing Greenhouse Gas Emissions by 2020 with the
Outlook to 2030
RES Renewable energy sources
PM Particulate matter (PM) is the expression used for dust particles present in the air
over a specific period
PTZURES Rules on Thermal Insulation and Efficient Energy Use in Buildings
PURES 2010 Rules on the Efficient Use of Energy in Buildings 2010
REN Real estate register
REUS Energy Efficiency Research Slovenia
REUS Energy Efficiency Research Slovenia
SID Slovenska izvozna in razvojna banka, d.d.
sNES Nearly zero-energy buildings
CHP Cogeneration of heat and power
SURS Statistical Office of the Republic of Slovenia
GHG Greenhouse gases
HT Heat transfer
UNFCCC United Nations Framework Convention on Climate Change
EE Energy efficiency
VSS Multi-apartment building
10
Summary The existing building stock is the sector providing the greatest potential for achieving energy savings, as
buildings account for just over one third of all energy consumed. Buildings are also key to achieving the target of
an 80–95 % reduction in greenhouse gas emissions by 2050. The Energy Efficiency Directive therefore lays
down that Member States should establish a long-term strategy for mobilising investments in the renovation of
the national building stock in order to increase the rate of building renovation.
The strategic objective of this document is to achieve carbon-neutral energy use in buildings by 2050. This will
be achieved by making considerable improvements in energy performance and by increasing the use of
renewable energy sources in buildings. This will, in turn, significantly reduce emissions of other harmful
substances into the atmosphere. A further objective is for Slovenia to become recognised for its activities in the
field of sustainable construction.
Some 70 % of the total floor area of residential buildings and 60 % of the total floor area of non-residential
buildings was constructed prior to 1985. This presents a very considerable potential for renovation.
The Strategy’s basic scenario envisages a rate of complete energy renovation of residential buildings of 2 % (up
to 2030 approx. 1.75 % of single-family houses and 2.5 % of multi-apartment buildings) and for buildings in the
public sector 3 %.
The intermediate targets set out in the Long-Term Strategy for Mobilising Investments in the Renovation of
Buildings up to 2030 are as follows:
to reduce end-use energy consumption in buildings by 15 % by 2020 and 30 % by 2030 relative to
2005;
to have at least two-thirds of energy in buildings produced from renewable energy sources;
to reduce greenhouse gas emissions in buildings by 60 % by 2020 and at least 70 % by 2030 relative to
2005;
to carry out energy renovation on at least 26 million m2 of building floor area, or 1.3–1.7 million m
2
annually, with just over one third of this total renovated to nearly zero-energy building standard (AN
sNES).
The Strategy’s operational targets up to 2020 or 2030 are as follows:
the renovation of 3 % of public buildings owned or occupied by central government each year
(between 15 000 and 25 000 m2);
the renovation of 1.8 million m2 of the floor area of buildings in the wider public sector between 2014
and 2023 (OP EKP);
an improvement in the ratio between public funds invested and investment incentives in the public
sector to 1: 3 (OP TGP 2020);
the implementation of five energy renovation demonstration projects for different building types (OP
EKP).
Investments in building renovation of approx. EUR 6.7 billion will be required to achieve these targets in the
period leading up to 2030: three-quarters in the housing sector, 10 % in the public sector and 15 % in the private
service sector. This means annual investments of between EUR 350 and 450 million: approx. EUR 300 million
in the housing sector and EUR 100 million in the service sector (EUR 40 million in the public sector and EUR
60 million in the private sector).
In order to maximise the long-term benefits in terms of creating jobs, ensuring stable inflows into the public
sector budget and contributing to economic growth, it is essential that these investments be spread as evenly as
possible, without concentrating investment activities in individual years or over shorter periods.
The Energy Efficiency Directive establishes a number of measures, with the public sector playing a leading role.
Buildings owned by public authorities account for around 10 % of the total building stock. After 2018 public
sector organisations will only be able to purchase nearly zero-energy buildings when purchasing new buildings.

11
Three per cent of the floor area of buildings owned and occupied by central government which do not meet the
minimum energy performance requirements from 1 January each year from 2014 onwards will have to be
renovated annually.
Investments in the energy renovation of public sector buildings will average approx. EUR 40 million per year –
on condition, however, that these investments are made in accordance with the energy performance contracting
model, i.e. by including the private capital of enterprises that provide energy services. In order to meet the
obligations that follow from the receipt of cohesion funds, i.e. the renovation of 1.8 million m2 by 2023, the
public sector will also have to provide a portion of the funds for financing of the investments, in tandem with
grants.
Investments in the energy performance of buildings provide society with significant savings and with wider
economic, social and environmental benefits.
ECONOMIC BENEFITS
Energy savings
It is estimated that the energy renovation of existing buildings will lead to savings of 10 % in the energy used for
heating and hot water up to 2020 (25 % up to 2030). This means that without such measures, energy
consumption in buildings will be over 10 % higher in 2020 and almost 25 % higher in 2030. The greatest energy
savings will be seen within the structure of investments in the housing sector (85 % of all savings achieved by
measures for the energy renovation of buildings).
The energy savings achieved as a result of the implementation of this Strategy will make a considerable
contribution to achieving Slovenia’s targets in the area of increasing energy efficiency; indeed, they will
contribute over half of the indicative 2030 target (27 % increase in energy efficiency).
Energy efficiency measures and the replacement of fossil fuels with renewable energy sources will reduce
dependence on imports. Slovenia is currently 100 % dependent on imports for its petroleum derivatives. The
measures mean that there will be a halving in the consumption of fossil fuels in existing buildings by 2020, while
by 2030 consumption will be a mere 20 % of the current level. This will lead to a significant reduction in
Slovenia’s imports of petroleum derivatives: a fall of 7 % in 2020 and 10 % in 2030 in comparison with the
import levels that would be seen were the building-related measures not to be implemented. This constitutes an
annual reduction of between EUR 100 and 200 million in imports of petroleum derivatives.
The impact will also be felt in electricity consumption, which will increase with the promotion of heat pumps.
Demand for electricity will increase in the winter months. It would therefore be wise to promote the high-
efficiency cogeneration of heat and power within district heating systems.
SOCIAL BENEFITS
Job creation
The increased volume of investment in energy efficiency also means increased demand in sectors whose
products and services lead to improvements in the energy performance of buildings. This will have a direct
impact on employment by increasing the numbers of people employed in those sectors that directly supply
products and services for the energy renovation of buildings, e.g. construction, the manufacture of building
fittings and heating systems, and the provision of energy services. There will also be an indirect impact from
increased economic activity in these sectors.
Owing to the relatively high labour intensity of work connected with the energy renovation of buildings,
investments in energy performance are, in comparison with many other sectors of the economy, a strong and
important lever for the creation of new jobs.
We estimate, using the general equilibrium model, that additional investments in energy renovation will increase
employment in Slovenia by between 0.36 and 0.58 % annually (between 3 000 and 4 600 new direct jobs
created). We estimate that activities following on from the planned average annual volume of investments will
create a total of around 7 000 jobs (indirect and direct). This will also have positive effects on economic growth
and public revenues.

12
Reduction in fuel poverty
Fuel poverty occurs when a household is unable to secure sufficient warmth in its place of residence. High-
quality energy renovation improves living comfort in buildings; this leads to greater productivity on the part of
the people working there, reduces absence from work and lowers the number of incidences of allergic reaction.
ENVIRONMENTAL BENEFITS
Greenhouse gas emissions
By 2030 emissions of greenhouse gases and particulates from energy use in buildings will be half the current
levels.
13
1 Introduction Pursuant to Article 348 of the Energy Act (EZ-1), the Long-Term Strategy for Mobilising Investments in the
Renovation of the National Building Stock of Public and Private Residential and Commercial Buildings has been
compiled in accordance with the structure required by the Energy Efficiency Directive1 (hereinafter: Directive
2012/27/EU).
Particular emphasis is placed on buildings owned and occupied by central government, as Directive 2012/27/EU
also requires the state, as from 1 January 2014, to renovate 3 % of the total useful floor area of heated and/or
cooled buildings owned and occupied by central government each year in order that at least the minimum energy
performance requirements under the Directive on the energy performance of buildings2 (hereinafter: Directive
2010/31/EU) are met. The 3 % rate is calculated on the basis of the total floor area of buildings owned and
occupied by central government and of administrative departments with a total useful floor area of over 500 m²
or, from 9 July 2015, over 250 m² which do not meet the national minimum energy performance requirements on
1 January of each year set in accordance with Article 4 of Directive 2010/31/EU. Article 4 of Directive
2012/27/EU requires Member States to establish a long-term strategy for mobilising investment in the renovation
of the national stock of residential and commercial buildings, both public and private. The Strategy contains:
an overview of the national building stock based on statistical sampling;
the identification of cost-effective approaches to renovation relevant to building type, location and
climatic zone;
policies and measures to stimulate the cost-effective renovation of buildings;
perspectives to guide investment decisions of individuals, the construction industry and financial
institutions;
an estimate of the expected energy savings and wider benefits.
Under Article 348 of the Energy Act, the Long-Term Strategy for Mobilising Investments in the Renovation of
the National Building Stock of Public and Private Residential and Commercial Buildings shall include:
determining those central government and wider public sector entities subject to renovation
requirements, and determining the floor area of buildings owned and occupied by public sector entities;
determining the share of renovation of the total floor area of buildings owned and occupied by central
government;
an overview of the national building stock;
the identification of cost-effective approaches to renovation for different building types;
measures to stimulate the cost-effective deep renovation of buildings;
measures to guide the investment decisions of individuals, the construction industry and financial
institutions.
Buildings protected in accordance with cultural heritage protection regulations are dealt with separately in the
Strategy. Guidelines for the energy renovation of cultural heritage buildings are being compiled by the ministry
responsible for energy and are likely to be completed by the end of November 2015. The guidelines will unify
the professional standards that help project designers and cultural heritage protection organisations to determine
the appropriate energy renovation measures to take in order to preserve protected elements of value. The
Strategy takes account of all relevant programmes and action plans connected with the field. The Strategy shall
be updated every three years.
Buildings are to be treated as whole units, i.e. including the building envelope, fittings, operation and
maintenance, when major building renovation measures are being implemented. Where feasible in terms of cost
and technology, priority in renovation must be given to buildings with the lowest energy performance. Buildings
used for the following purposes are exempt from these measures:
national defence, where such buildings do not contain individual residential or business units;
worship or religious activities.
1 Directive 2012/27/EU of the European Parliament and of the Council of 25 October 2012 on energy efficiency, amending
Directives 2009/125/EC and 2010/30/EU and repealing Directives 2004/8/EC and 2006/32/EC. 2 Directive 2010/31/EU of the European Parliament and of the Council of 19 May 2010 on the energy performance of
buildings (recast).
14
Through the long-term building renovation strategy, Slovenia is setting itself the objective of achieving
substantial improvements in the energy performance of building stock. The Strategy also constitutes the expert
basis for implementation of the Operational Programme for the Implementation of European Cohesion Policy
2014–2020 (OP EKP 2014–2020). The objectives are set out for the key years 2020/2023 (final year of
implementation) and 2030, with an evaluation of the expected energy savings and the public funds and jobs
required. For 2050 only the estimated energy savings have been calculated.
Methodological note
The Long-Term Strategy for Mobilising Investments in the Renovation of Buildings has also arisen on the basis
of:
national strategy documents (AN OVE 2010−2020, AN URE 2020, AN sNES, OP TGP 2020, OP
EKP 2014−2020);
national legislation (Energy Act EZ-1 and implementing regulations);
European legislation (Directive 2010/31/EU recast, Directive 2012/27/EU);
models of practice from other EU Member States.
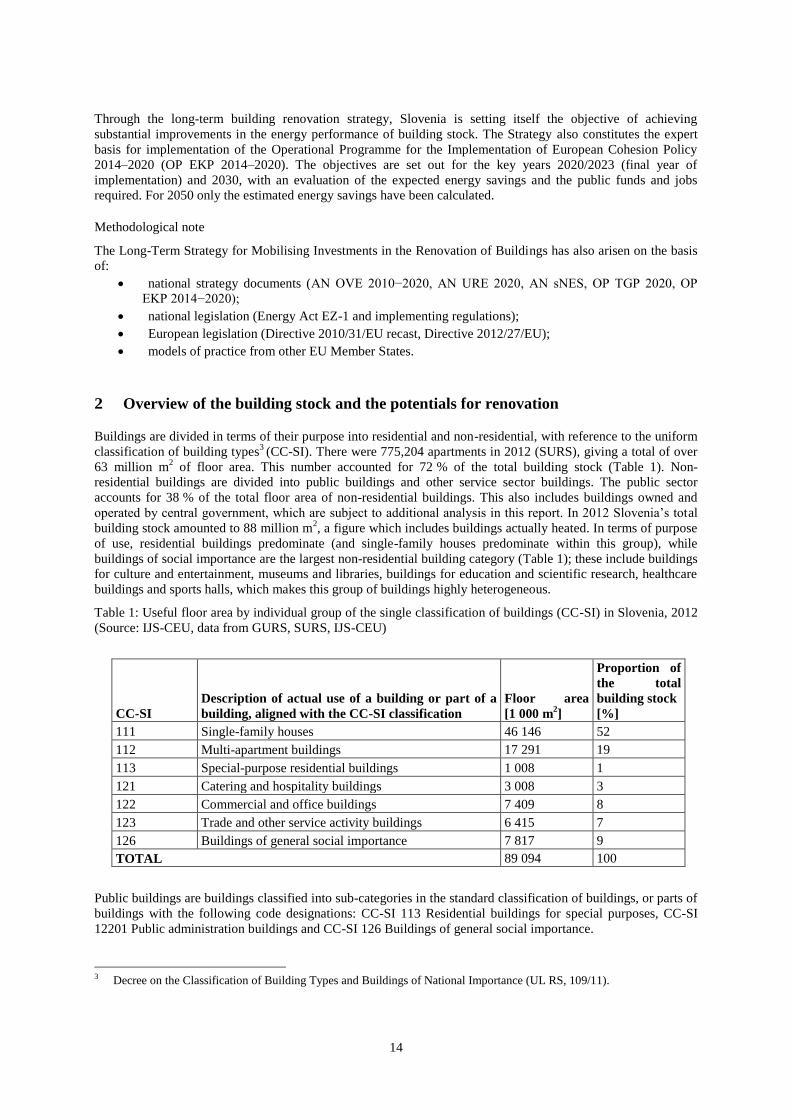
2 Overview of the building stock and the potentials for renovation Buildings are divided in terms of their purpose into residential and non-residential, with reference to the uniform
classification of building types3
(CC-SI). There were 775,204 apartments in 2012 (SURS), giving a total of over
63 million m2 of floor area. This number accounted for 72 % of the total building stock (Table 1). Non-
residential buildings are divided into public buildings and other service sector buildings. The public sector
accounts for 38 % of the total floor area of non-residential buildings. This also includes buildings owned and
operated by central government, which are subject to additional analysis in this report. In 2012 Slovenia’s total
building stock amounted to 88 million m2, a figure which includes buildings actually heated. In terms of purpose
of use, residential buildings predominate (and single-family houses predominate within this group), while
buildings of social importance are the largest non-residential building category (Table 1); these include buildings
for culture and entertainment, museums and libraries, buildings for education and scientific research, healthcare
buildings and sports halls, which makes this group of buildings highly heterogeneous.
Table 1: Useful floor area by individual group of the single classification of buildings (CC-SI) in Slovenia, 2012
(Source: IJS-CEU, data from GURS, SURS, IJS-CEU)
CC-SI
Description of actual use of a building or part of a
building, aligned with the CC-SI classification
Floor area
[1 000 m2]
Proportion of
the total
building stock
[%]
111 Single-family houses 46 146 52
112 Multi-apartment buildings 17 291 19
113 Special-purpose residential buildings 1 008 1
121 Catering and hospitality buildings 3 008 3
122 Commercial and office buildings 7 409 8
123 Trade and other service activity buildings 6 415 7
126 Buildings of general social importance 7 817 9
TOTAL 89 094 100
Public buildings are buildings classified into sub-categories in the standard classification of buildings, or parts of
buildings with the following code designations: CC-SI 113 Residential buildings for special purposes, CC-SI
12201 Public administration buildings and CC-SI 126 Buildings of general social importance.
3 Decree on the Classification of Building Types and Buildings of National Importance (UL RS, 109/11).
15
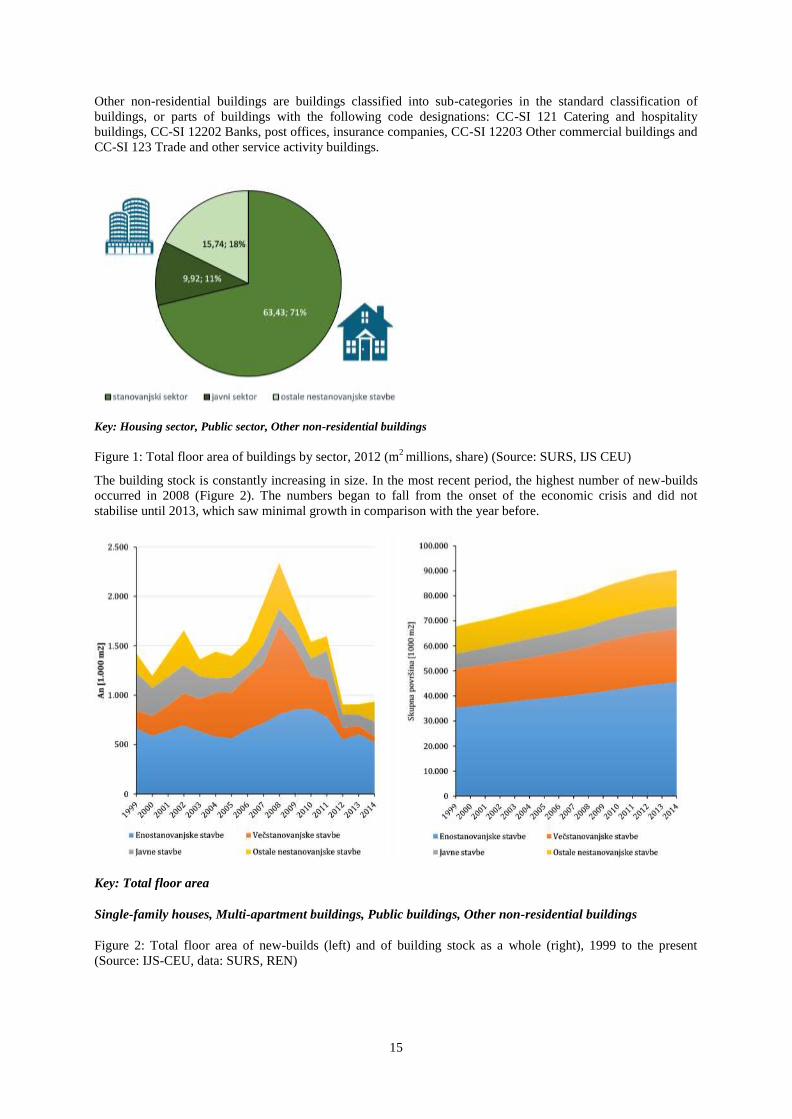
Other non-residential buildings are buildings classified into sub-categories in the standard classification of
buildings, or parts of buildings with the following code designations: CC-SI 121 Catering and hospitality
buildings, CC-SI 12202 Banks, post offices, insurance companies, CC-SI 12203 Other commercial buildings and
CC-SI 123 Trade and other service activity buildings.
Key: Housing sector, Public sector, Other non-residential buildings
Figure 1: Total floor area of buildings by sector, 2012 (m2
millions, share) (Source: SURS, IJS CEU)
The building stock is constantly increasing in size. In the most recent period, the highest number of new-builds
occurred in 2008 (Figure 2). The numbers began to fall from the onset of the economic crisis and did not
stabilise until 2013, which saw minimal growth in comparison with the year before.
Key: Total floor area
Single-family houses, Multi-apartment buildings, Public buildings, Other non-residential buildings
Figure 2: Total floor area of new-builds (left) and of building stock as a whole (right), 1999 to the present
(Source: IJS-CEU, data: SURS, REN)

16
2.1 Definition of energy renovation Energy renovation encompasses measures in buildings as a whole, thus including all building elements that
affect energy use and building operation.
The energy renovation rate is defined, in relation to the expected primary energy savings, as renovation under an
individual measure, partial renovation and complete energy renovation. The prescribed legislation on the
minimum energy performance requirements of buildings also contains the category of ‘nearly zero-energy
renovation of a building’. The term ‘complete energy renovation’ denotes the coordinated implementation of
energy efficiency measures on the building envelope (e.g. facade, roof, floor) and the building’s technical
systems (e.g. heating, ventilation, air-conditioning, hot water) in a way that exploits, as far as is technically
possible, the entire economically justified potential for energy renovation. The main advantage of the complete
approach is the possibility it provides for mutual optimisation of individual measures within a single, more
extensive operation. Energy savings are therefore optimised – something which is not possible with partial
energy renovation or the uncoordinated implementation of individual groups of measures. Gradual energy
renovation is renovation in which the measures necessary to achieve total energy renovation are carried out in a
phased manner. In general, the thermal envelope of a building is renovated first, followed by the technical
systems within the building.
When projects are being selected, gradual complete and complete energy renovation are regarded as equal in
terms of the due diligence applied and the cost-effectiveness of the energy efficiency measures already carried
out. An energy audit confirms (or otherwise) whether an individual energy performance of buildings measure
has been carried out successfully.
All energy renovation measures that would change, to an unacceptable degree, the character or appearance of a
building which has distinctive structural elements, or which is protected as cultural heritage, are excluded from
any complete energy renovation carried out on that building. The scope of complete energy renovation therefore
also depends on the architectural and historical importance of a building, to which due regard must be paid.
Where an individual measure referred to in an expanded energy audit cannot be carried out (is infeasible) or can
be carried out only partly (is infeasible) because of the requirement to protect cultural heritage (therefore, that the
measure cannot be carried out, or can be carried out only partly), under the Guidelines for the Energy
Renovation of Cultural Heritage Buildings the measure shall be deemed to have been carried out and any energy
renovation deemed to be complete energy renovation.
The measures most commonly taken in the course of the energy renovation of residential and non-residential
buildings are as follows:
Building envelope measures
Thermal insulation and renovation of the facade
Replacement of existing and the installation of new energy-efficient windows/doors
Thermal insulation of the ceiling abutting onto an unheated area
Thermal insulation of the roof and renovation of the roof covering
Thermal insulation of the cellar or floor and renovation of the floor
Remediation of thermal bridges
Heating system measures
Installation of efficient wood biomass heating appliances
Installation of heat pumps for domestic hot water and/or central heating
Installation of heating sub-stations or stations for connection to the district heating hot water system
Installation of equipment for the high-efficiency cogeneration of heat and power
Installation of a gas-fired condensing boiler
Hydraulic balancing of the heating system
Central regulation of the heating system
Local regulation
Thermal protection of the pipe system
Replacement of worn-out heaters
17
Improvements to ventilators and pumps
Installation of frequency regulation
Ventilation and air-conditioning system measures
Mechanical ventilation with heat recovery – central
Mechanical ventilation with heat recovery – local
Installation of equipment for transferring heat recovered from waste air
Installation of a cooling generator and the upgrading of cooling systems
Regulation of air-conditioning and ventilation
Domestic hot water measures
Installation of heat pumps for domestic hot water and/or central heating
Installation of heating sub-stations or stations for connection to the district heating hot water system
Installation of a gas-fired condensing boiler
Installation of efficient wood biomass heating appliances
Electricity use measures
Energy-saving lighting
Energy-saving electrical appliances
Installation of equipment or construction of facilities for obtaining electricity from the sun, water or
wind
Installation of equipment for the high-efficiency cogeneration of heat and power
Electricity generation measures
Installation of equipment or construction of facilities for obtaining electricity from the sun, water or
wind
Installation of equipment for the high-efficiency cogeneration of heat and power
2.2 Housing sector
2.2.1 Status of building stock In accordance with the classification of building types, residential buildings are divided into single-family houses
(e.g. detached houses, villas, cottages, holiday homes, terraced houses or twin houses containing a single
apartment unit), two-family houses (detached and terraced houses containing two apartment units), and multi-
apartment buildings (other residential buildings containing three or more apartment units, e.g. apartment blocks
and towers) (Table 2). In terms of useful floor area, the predominant building type is the single-family house
(67 %). Residential buildings are categorised below into single-apartment single-family (SF), which includes
single-and two-family buildings, and multi-apartment (MA) buildings. In 2012 there were 469 911 single-
apartment single-family houses and 305 293 apartment units in multi-apartment buildings. Single apartment
single-family houses account for a significantly higher share of total useful floor area (73 %).
Table 2: Useful floor area of residential buildings by individual group under the single classification of buildings
(CC-SI) in Slovenia, 2012 (Source: IJS-CEU, data: GURS, SURS, IJS-CEU)
CC-SI
Description of actual use of a building or part of a
building, aligned with the CC-SI classification
Floor area
[1 000 m2]
Proportion
[%]
111 Single-family houses 46 146 72.7
112
Multi-apartment buildings (with two, three or more
apartment units) 17 291 27.3
TOTAL 64 445 100
18
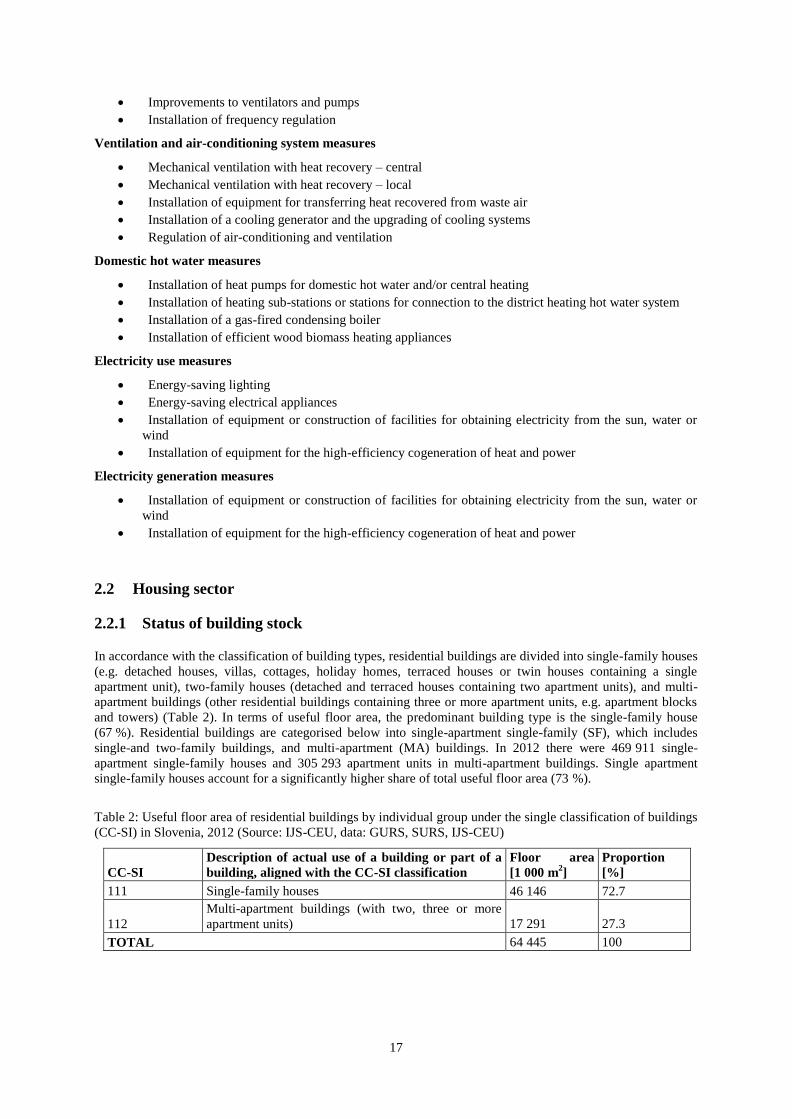
The life-cycle of an individual structural building element (facade, roof, windows) is approx. 30 years. This
period is shorter for heating and other systems within a building. Around 71 % of the total floor area of
residential buildings was constructed prior to 1985. This provides a very considerable potential for renovation.
Figure 3 shows the total floor area of all categories of residential building by period of construction. Some of
these buildings have already been renovated.
Key: Floor area
Year of construction
Single-family houses, Multi-apartment buildings
Figure 3: Structure of residential building stock by year of construction (Source: GI ZRMK, data: REN, 2014)
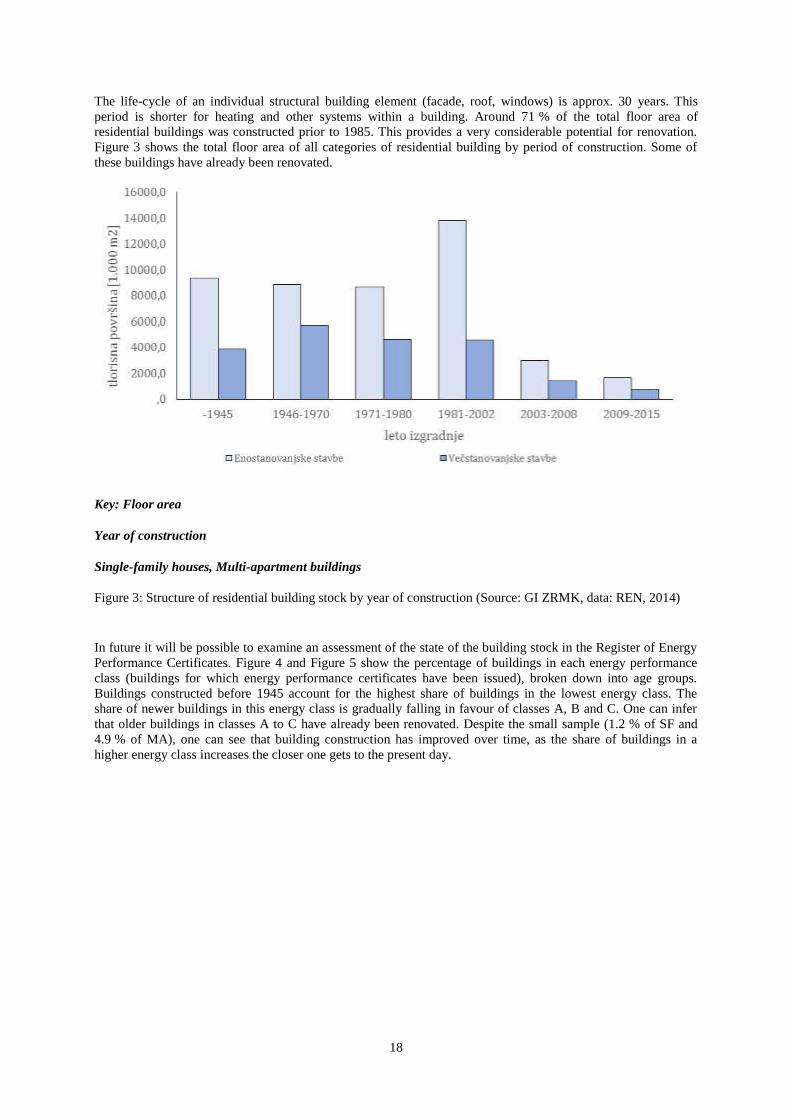
In future it will be possible to examine an assessment of the state of the building stock in the Register of Energy
Performance Certificates. Figure 4 and Figure 5 show the percentage of buildings in each energy performance
class (buildings for which energy performance certificates have been issued), broken down into age groups.
Buildings constructed before 1945 account for the highest share of buildings in the lowest energy class. The
share of newer buildings in this energy class is gradually falling in favour of classes A, B and C. One can infer
that older buildings in classes A to C have already been renovated. Despite the small sample (1.2 % of SF and
4.9 % of MA), one can see that building construction has improved over time, as the share of buildings in a
higher energy class increases the closer one gets to the present day.
19
Figure 4: Distribution of single-family houses with energy performance certificates by year of construction and
energy class (situation as at 19 April 2015, number of energy performance certificates = 3 296) (Source: GI
ZRMK, data: Register of Energy Performance Certificates)
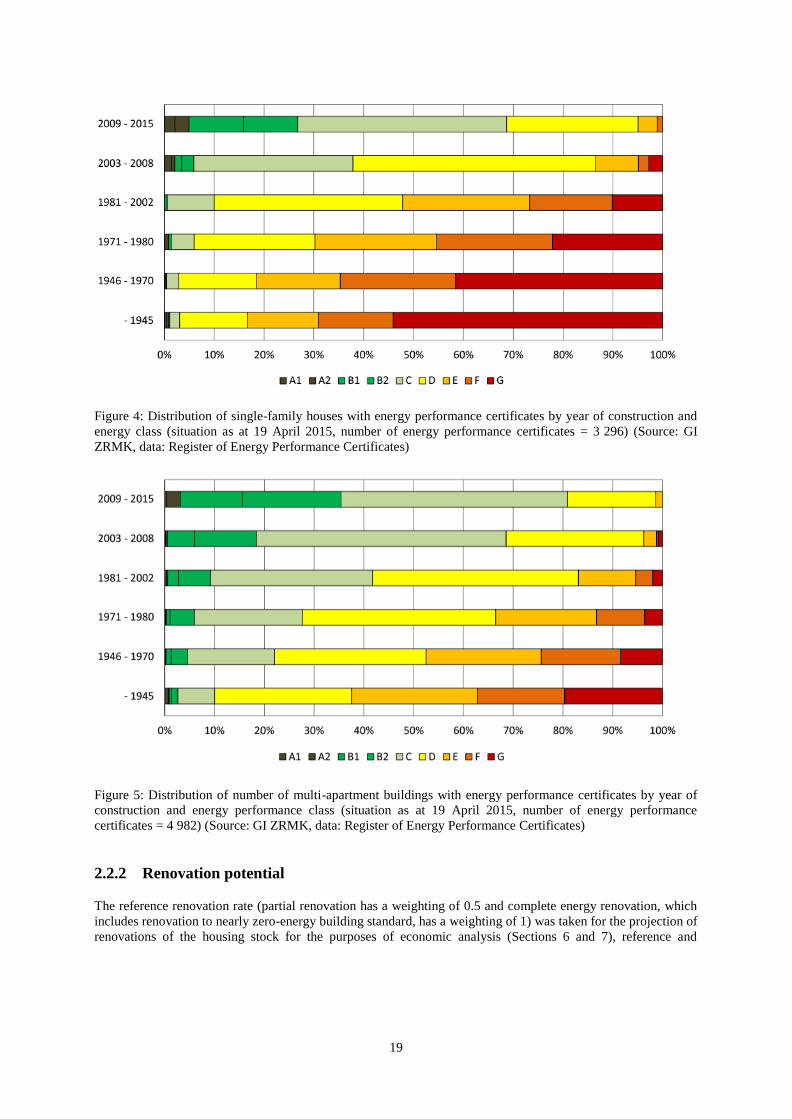
Figure 5: Distribution of number of multi-apartment buildings with energy performance certificates by year of
construction and energy performance class (situation as at 19 April 2015, number of energy performance
certificates = 4 982) (Source: GI ZRMK, data: Register of Energy Performance Certificates)
2.2.2 Renovation potential The reference renovation rate (partial renovation has a weighting of 0.5 and complete energy renovation, which
includes renovation to nearly zero-energy building standard, has a weighting of 1) was taken for the projection of
renovations of the housing stock for the purposes of economic analysis (Sections 6 and 7), reference and
20
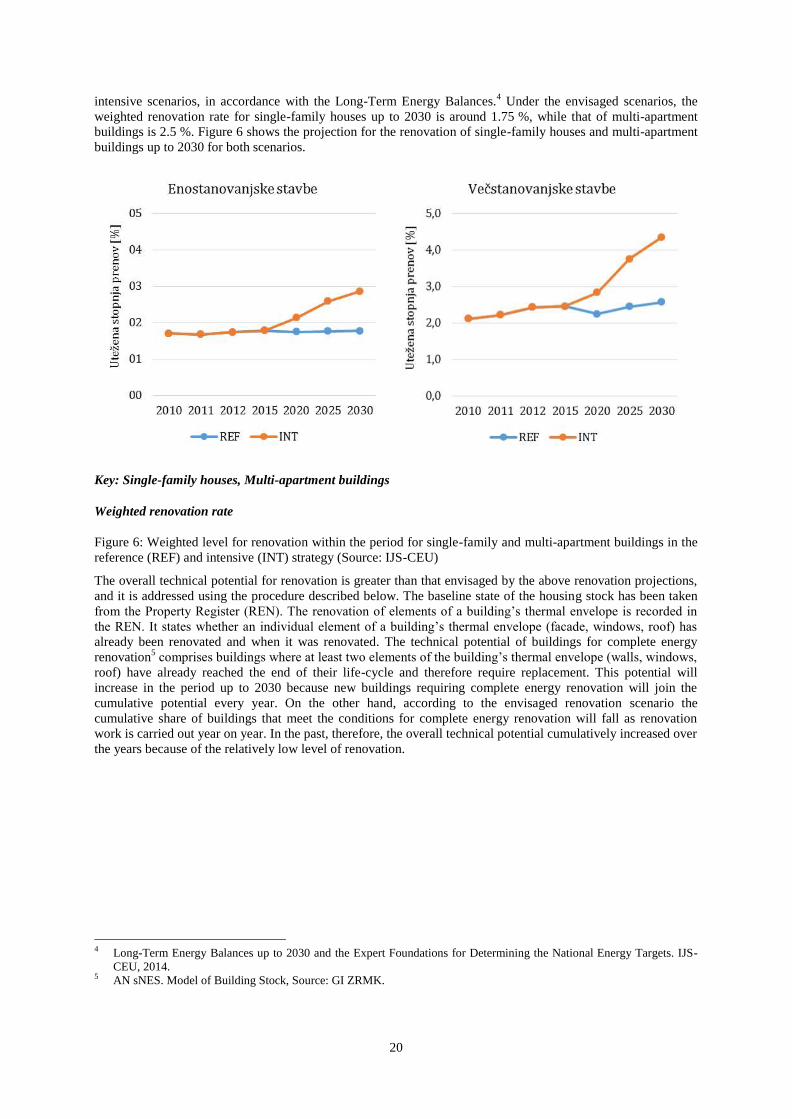
intensive scenarios, in accordance with the Long-Term Energy Balances.4 Under the envisaged scenarios, the
weighted renovation rate for single-family houses up to 2030 is around 1.75 %, while that of multi-apartment
buildings is 2.5 %. Figure 6 shows the projection for the renovation of single-family houses and multi-apartment
buildings up to 2030 for both scenarios.
Key: Single-family houses, Multi-apartment buildings
Weighted renovation rate
Figure 6: Weighted level for renovation within the period for single-family and multi-apartment buildings in the
reference (REF) and intensive (INT) strategy (Source: IJS-CEU)
The overall technical potential for renovation is greater than that envisaged by the above renovation projections,
and it is addressed using the procedure described below. The baseline state of the housing stock has been taken
from the Property Register (REN). The renovation of elements of a building’s thermal envelope is recorded in
the REN. It states whether an individual element of a building’s thermal envelope (facade, windows, roof) has
already been renovated and when it was renovated. The technical potential of buildings for complete energy
renovation5 comprises buildings where at least two elements of the building’s thermal envelope (walls, windows,
roof) have already reached the end of their life-cycle and therefore require replacement. This potential will
increase in the period up to 2030 because new buildings requiring complete energy renovation will join the
cumulative potential every year. On the other hand, according to the envisaged renovation scenario the
cumulative share of buildings that meet the conditions for complete energy renovation will fall as renovation
work is carried out year on year. In the past, therefore, the overall technical potential cumulatively increased over
the years because of the relatively low level of renovation.
4 Long-Term Energy Balances up to 2030 and the Expert Foundations for Determining the National Energy Targets. IJS-
CEU, 2014. 5 AN sNES. Model of Building Stock, Source: GI ZRMK.
21
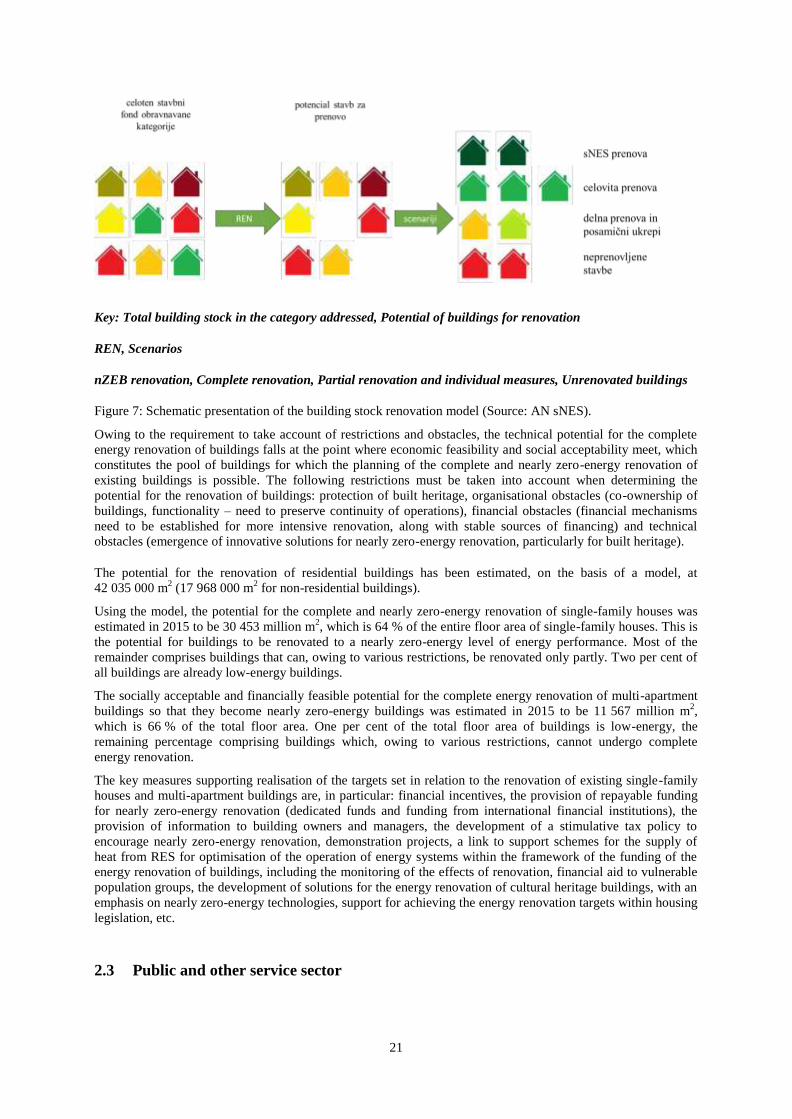
Key: Total building stock in the category addressed, Potential of buildings for renovation
REN, Scenarios
nZEB renovation, Complete renovation, Partial renovation and individual measures, Unrenovated buildings
Figure 7: Schematic presentation of the building stock renovation model (Source: AN sNES).
Owing to the requirement to take account of restrictions and obstacles, the technical potential for the complete
energy renovation of buildings falls at the point where economic feasibility and social acceptability meet, which
constitutes the pool of buildings for which the planning of the complete and nearly zero-energy renovation of
existing buildings is possible. The following restrictions must be taken into account when determining the
potential for the renovation of buildings: protection of built heritage, organisational obstacles (co-ownership of
buildings, functionality – need to preserve continuity of operations), financial obstacles (financial mechanisms
need to be established for more intensive renovation, along with stable sources of financing) and technical
obstacles (emergence of innovative solutions for nearly zero-energy renovation, particularly for built heritage).
The potential for the renovation of residential buildings has been estimated, on the basis of a model, at
42 035 000 m2 (17 968 000 m
2 for non-residential buildings).
Using the model, the potential for the complete and nearly zero-energy renovation of single-family houses was
estimated in 2015 to be 30 453 million m2, which is 64 % of the entire floor area of single-family houses. This is
the potential for buildings to be renovated to a nearly zero-energy level of energy performance. Most of the
remainder comprises buildings that can, owing to various restrictions, be renovated only partly. Two per cent of
all buildings are already low-energy buildings.
The socially acceptable and financially feasible potential for the complete energy renovation of multi-apartment
buildings so that they become nearly zero-energy buildings was estimated in 2015 to be 11 567 million m2,
which is 66 % of the total floor area. One per cent of the total floor area of buildings is low-energy, the
remaining percentage comprising buildings which, owing to various restrictions, cannot undergo complete
energy renovation.
The key measures supporting realisation of the targets set in relation to the renovation of existing single-family
houses and multi-apartment buildings are, in particular: financial incentives, the provision of repayable funding
for nearly zero-energy renovation (dedicated funds and funding from international financial institutions), the
provision of information to building owners and managers, the development of a stimulative tax policy to
encourage nearly zero-energy renovation, demonstration projects, a link to support schemes for the supply of
heat from RES for optimisation of the operation of energy systems within the framework of the funding of the
energy renovation of buildings, including the monitoring of the effects of renovation, financial aid to vulnerable
population groups, the development of solutions for the energy renovation of cultural heritage buildings, with an
emphasis on nearly zero-energy technologies, support for achieving the energy renovation targets within housing
legislation, etc.
2.3 Public and other service sector
22
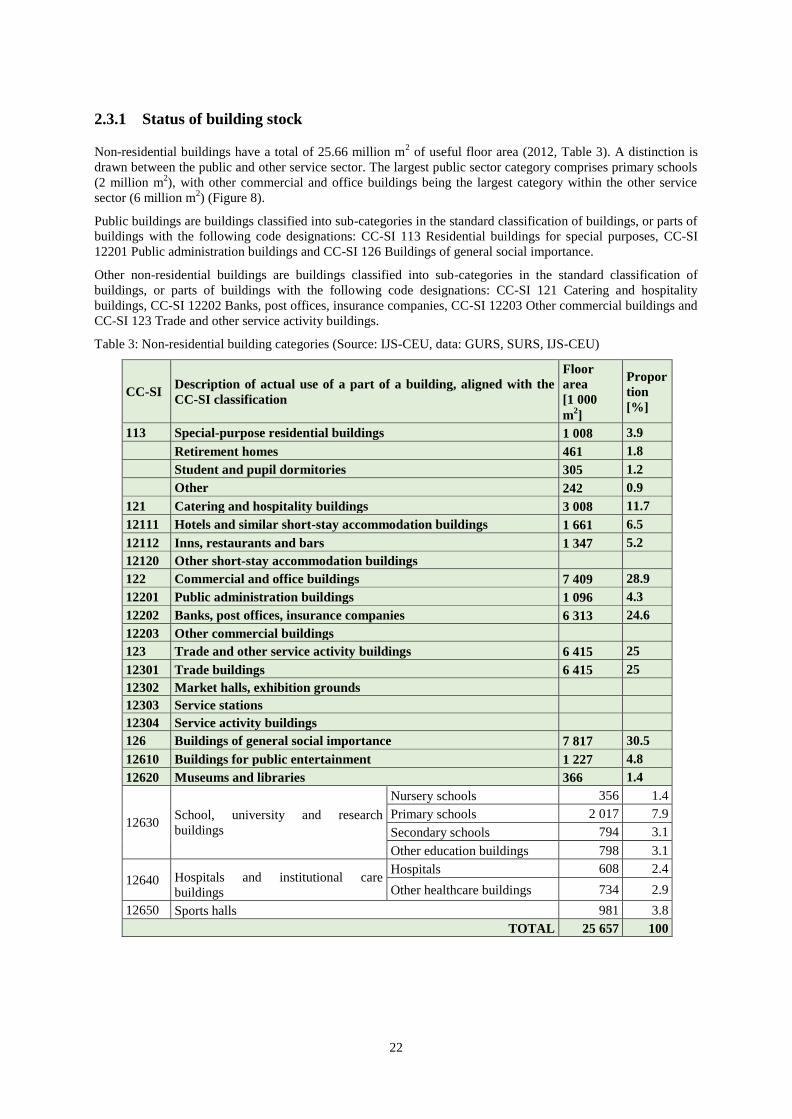
2.3.1 Status of building stock Non-residential buildings have a total of 25.66 million m
2 of useful floor area (2012, Table 3). A distinction is
drawn between the public and other service sector. The largest public sector category comprises primary schools
(2 million m2), with other commercial and office buildings being the largest category within the other service
sector (6 million m2) (Figure 8).
Public buildings are buildings classified into sub-categories in the standard classification of buildings, or parts of
buildings with the following code designations: CC-SI 113 Residential buildings for special purposes, CC-SI
12201 Public administration buildings and CC-SI 126 Buildings of general social importance.
Other non-residential buildings are buildings classified into sub-categories in the standard classification of
buildings, or parts of buildings with the following code designations: CC-SI 121 Catering and hospitality
buildings, CC-SI 12202 Banks, post offices, insurance companies, CC-SI 12203 Other commercial buildings and
CC-SI 123 Trade and other service activity buildings.
Table 3: Non-residential building categories (Source: IJS-CEU, data: GURS, SURS, IJS-CEU)
CC-SI Description of actual use of a part of a building, aligned with the
CC-SI classification
Floor
area
[1 000
m2]
Propor
tion
[%]
113 Special-purpose residential buildings 1 008 3.9
Retirement homes 461 1.8
Student and pupil dormitories 305 1.2
Other 242 0.9
121 Catering and hospitality buildings 3 008 11.7
12111 Hotels and similar short-stay accommodation buildings 1 661 6.5
12112 Inns, restaurants and bars 1 347 5.2
12120 Other short-stay accommodation buildings
122 Commercial and office buildings 7 409 28.9
12201 Public administration buildings 1 096 4.3
12202 Banks, post offices, insurance companies 6 313 24.6
12203 Other commercial buildings
123 Trade and other service activity buildings 6 415 25
12301 Trade buildings 6 415 25
12302 Market halls, exhibition grounds
12303 Service stations
12304 Service activity buildings
126 Buildings of general social importance 7 817 30.5
12610 Buildings for public entertainment 1 227 4.8
12620 Museums and libraries 366 1.4
12630 School, university and research
buildings
Nursery schools 356 1.4
Primary schools 2 017 7.9
Secondary schools 794 3.1
Other education buildings 798 3.1
12640 Hospitals and institutional care
buildings
Hospitals 608 2.4
Other healthcare buildings 734 2.9
12650 Sports halls 981 3.8
TOTAL 25 657 100
23
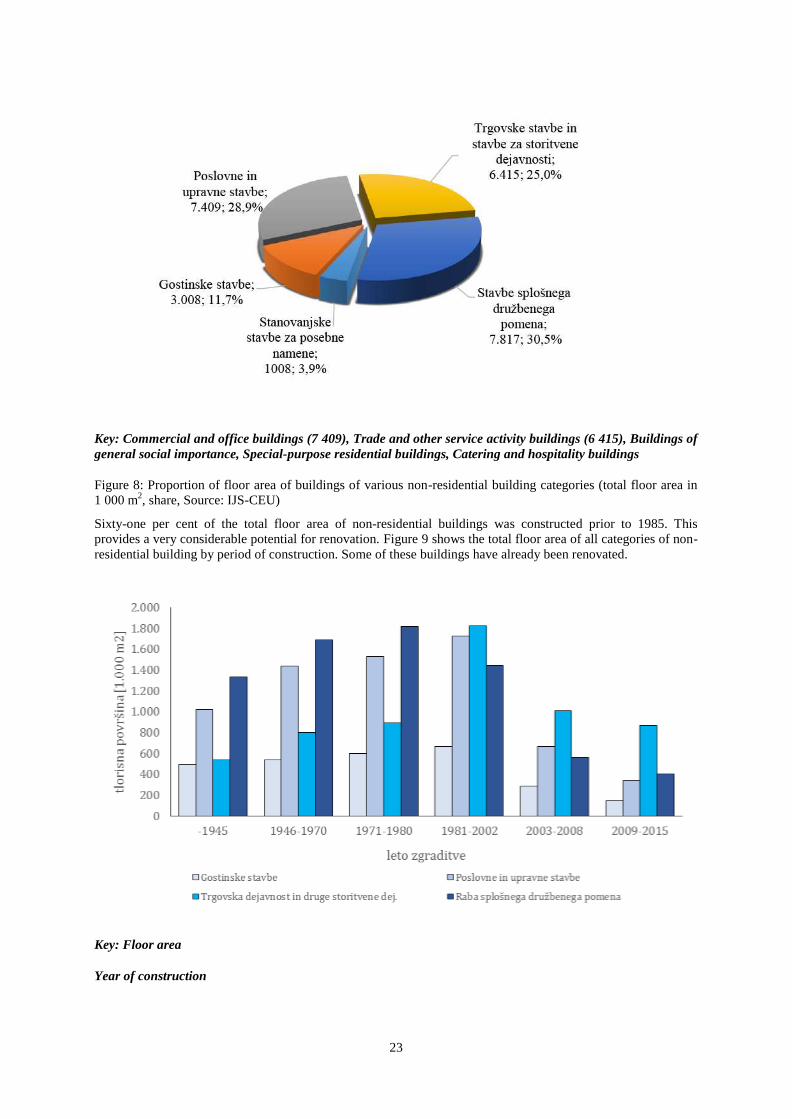
Key: Commercial and office buildings (7 409), Trade and other service activity buildings (6 415), Buildings of
general social importance, Special-purpose residential buildings, Catering and hospitality buildings
Figure 8: Proportion of floor area of buildings of various non-residential building categories (total floor area in
1 000 m2, share, Source: IJS-CEU)
Sixty-one per cent of the total floor area of non-residential buildings was constructed prior to 1985. This
provides a very considerable potential for renovation. Figure 9 shows the total floor area of all categories of non-
residential building by period of construction. Some of these buildings have already been renovated.
Key: Floor area
Year of construction
24
Catering and hospitality buildings, Commercial and office buildings, Trade and other service activity
buildings, Buildings of general social importance
Figure 9: Structure of non-residential building stock by year of construction (Source: GI ZRMK, data: REN,
2014)
In assessing the state of the non-residential building stock, we noted the energy class in relation to the
categorisation (Figure 10) as defined by Directive 2010/31/EU. It can be seen that over 50 % of all buildings in
every category have an annual heating energy need of more than 60 kWh/m2a. This share means that the
potential for the renovation of existing buildings is great and will have to be reduced robustly in the years to
come. Under the recast Directive 2010/31/EU, all public buildings will have to undergo nearly zero-energy
renovation after 31 December 2018. This obligation begins for all other buildings after 31 December 2020.
Key: Other energy-using types of building, Wholesale and retail buildings, Sports halls, Hotels and
restaurants, Hospitals, Education buildings, Offices
Figure 10: Distribution of non-residential buildings with energy performance certificates by building category (N
= no of energy performance certificates, situation as at 19 April 2015) (Source: GI ZRMK, data: Register of
Energy Performance Certificates)
2.3.2 Renovation potential Renovation is divided into renovation following which non-residential buildings meet the requirements of a
nearly zero-energy building during the period of renovation, and other renovation. Renovation restrictions are
taken into account when determining the scope of complete and nearly zero-energy renovation, e.g. the
protection of cultural heritage buildings, architectural restrictions, organisational obstacles (co-ownership of
buildings, functionality – need to preserve continuity of operations), financial obstacles (financial mechanisms
need to be established for more intensive renovation, along with stable sources of financing) and technical
obstacles (emergence of innovative solutions for nearly zero-energy renovation, particularly for cultural heritage
buildings), lack of organisation of property registers for buildings owned and occupied by central government
(obligatory 3 % renovation each year), the time required for the design of projects and insufficient training of
contracting authorities, planners and contractors of nearly zero-energy construction, as well as a lack of models,
examples of good practice and demonstration projects from a technical standpoint and from the standpoint of the
implementation of (green) public procurement in this area.
25
Projections for the energy renovation of existing non-residential buildings are made for three groups of buildings
in the Strategy:
public buildings owned and occupied by central government (with compulsory 3 % renovation each
year in accordance with Directive 2012/27/EU);6
other public buildings;
other non-residential buildings (excluding the buildings referred to in the first and second indents
above).
The potential for renovation in the service sector was estimated in 2015 at 11 111 million m2
(68 % of the total
floor area). Nearly zero-energy buildings account for 1 % of the total floor area, the remaining percentage
comprising buildings which, owing to various restrictions, cannot undergo complete energy renovation.
The potential for renovation to nearly zero-energy building standard in public buildings was estimated in 2015 at
6 857 million m2
(66 % of the total floor area of public buildings). Nearly zero-energy buildings account for 1 %,
the remaining percentage comprising buildings which, owing to various restrictions, cannot undergo complete
energy renovation.
At the outset the share of renovation after which a building may be treated as nearly zero-energy will be low. It
is expected that renovation under nearly zero-energy building criteria will follow the model, i.e. the renovation
of public buildings owned and occupied by central government, with a minor delay of course. It is envisaged that
the share of renovation following which a building is deemed to meet the requirements of a nearly zero-energy
building following renovation will gradually increase, and comprise the majority of all renovation by 2030.
The instruments supporting the plan set out to increase the number of buildings undergoing complete and nearly
zero-energy renovation in the public sector, as part of the group comprising the 3 % of buildings owned and
occupied by central government that must be renovated annually and in the other non-housing sector, are:
financial incentives in the form of grants and repayable funding for the public sector, particularly central
government buildings, cohesion funds, promotion of the introduction of energy performance contracting, private
funds for the rest of the non-residential sector, financial resources from the dedicated funds and programmes of
international financial institutions for the public sector and the rest of the non-residential sector, the re-routing of
some financial incentives to promoting the provision of repayable funding, the training of contracting authorities,
project designers, contractors and users of nearly zero-energy buildings, the development of solutions for the
renovation of cultural heritage buildings and special building groups (type-specific solutions for non-residential
and public buildings), a link to the support scheme for the supply of heat from RES, the legal foundations for
target indicators for EE and RES in the public sector, the monitoring of the indicators achieved, promotion, and
the implementation of measures to optimise the operation of energy systems as part of the financing of the
energy renovation of buildings and for other buildings through financing via energy performance contracting.
2.4 Buildings owned and occupied by central government Under Article 348 of the EZ-1, the Long-Term Strategy also includes a definition of central government:
Central government as defined by the Strategy comprises ministries, authorities affiliated with ministries,
administrative units, government services, judicial authorities and other state authorities.
In accordance with the Strategy presented, the obligations under Directive 2012/27/EU of the European
Parliament and of the Council of 25 October 2012 on energy efficiency relating to energy performance and the
energy renovation of buildings owned and occupied by central government are obligations that refer to the
energy efficiency and energy renovation of buildings owned and occupied by the core public sector . Slovenia is
obliged to ensure, as from 1 January 2014, that 3 % of the total floor area of heated and/or cooled buildings
owned and occupied by central government is renovated each year to meet at least the minimum energy
performance requirements that it has set in application of Article 4 of Directive 2010/31/EU. This obligation has
been transposed into Slovenian law by Article 3497 of the EZ-1. The total floor area of buildings or property in
6 The 3 % rate is calculated on the basis of the total floor area of buildings owned and occupied by the central government
bodies of the Member State with a total useful floor area of over 500 m² which do not meet the national minimum energy
performance requirements on 1 January of each year set in accordance with Article 4 of Directive 2010/31/EU. The
specified 500 m² threshold will be lowered to 250 m² from 9 July 2015. 7 Article 349 (methodology for calculating the percentage of renovation)

26
the current Register of State-Owned Buildings Occupied by Central Government assumed not to meet the energy
performance requirements stands at 708 296 m2 (figure as at 18 April 2014). The current register will be updated,
as outlined below.
The strategy for the energy renovation of buildings owned and occupied by central government will be
accomplished by means of the following activities:
1. The establishment of a list of buildings owned and occupied by central government which do not meet
the minimum energy performance requirements from 1 January each year from 2014 onwards.
2. Determination of the conditions for renovation
3. Financing of projects from the new financial perspective under the OP EKP 2014–2020
4. Implementation of pilot or demonstration projects
5. Monitoring of the targets (OP EKP 2014–2020 and more widely)
Slovenia has not yet decided whether to take an alternative approach as provided for by Article 5(6) of Directive
2012/27/EU, which allows the obligation to renovate a certain amount of floor area of state buildings to be
replaced by other measures that would achieve the same energy savings in these buildings.
1. Establishment of a list of buildings owned and occupied by central government
By the end of the year, the ministry responsible for energy will compile a list of central government buildings, to
include all data from the existing records (e-land register, GURS, CEN and other records maintained in
accordance with the legislation). It will include buildings that do not meet the minimum energy performance
requirements. The list will be updated on 1 January each year. This will enable renovation or new construction to
be monitored continuously, a calculation to be made of the annual renovation rate for central government
buildings and an annual calculation to be made of the total floor area of central government buildings, including
any changes that affect the list. The list will be published on the website of the ministry responsible for energy.
2. Determination of the conditions for renovation
The conditions upon which the move towards the complete energy renovation of all central government
buildings is based are:
Ownership by the state (if the building is not wholly owned by the state, a full agreement on co-
financing reached with the other owners is required).
Settled issue of management: Where there are two or more managers, an agreement must be
concluded on which of them will conduct the energy renovation, along with a financing plan.
Determination of the energy performance indicators: A comprehensive energy audit of the building
and an energy performance certificate, which must take sufficient account of the conditions relating to
the location, the cultural protection conditions and any other relevant conditions.
Investment documentation that specifies the upper limit on the return on investments made by a private
partner.
Test of suitability for PPP: Implementation of a preliminary procedure (Article 31 of the Public-
Private Partnership Act) – a test is conducted to establish whether a building is suitable for public-
private partnership (PPP) (implementation of a preliminary procedure under the Public-Private
Partnership Act).
(1) For the purpose of calculating the percentage of renovation specified by the long-term strategy referred to in the
preceding Article, the useful floor area of buildings exceeding 250 m2 shall be taken into account when calculating
the total floor area of buildings owned by the public sector.
(2) If the annual target for the renovation of the total floor area laid down by the long-term strategy referred to in the
preceding Article is exceeded, the excess may be counted towards the targets for the following years. New buildings
occupied and owned as replacements for specific central government buildings demolished in any of the two
previous years, or buildings that have been sold, demolished or taken out of use in any of the two previous years due
to the more intensive use of other buildings, may count towards the annual renovation rate of central government
buildings.
(3) The ministry responsible for energy, in collaboration with the ministry responsible for the real estate management
system shall compile an inventory of buildings owned and occupied by central government that includes details on
the useful floor area and the energy performance indicators.
27
Specified proposal for the complete energy renovation of a building: Set of measures for complete
energy renovation in accordance with point 2.1.
The following premises must be taken into consideration after a decision is reached to move towards the energy
renovation of a building:
Energy renovation project: Project design documentation must be compiled before energy
renovation is carried out. In the case of PPP, the project design documentation must be compiled by the
private partner.
Implementation of other measures to improve the state of the building: Other suitable measures to
improve the state of buildings are also carried out alongside energy renovation, in accordance with the
principles of due diligence.
Compliance of renovation with the principles of sustainable construction: Pursuant to the
sustainable construction guidelines being compiled by the ministry responsible for construction, which
are likely to be completed by the end of 2017.
3. Financing of projects from the new financial perspective under the OP EKP 2014–2020
Financing of the OP EKP 2014–2020 is defined more precisely in the Decree on the Implementation of
Procedures for the Use of European Cohesion Funds in the Republic of Slovenia in the 2014–2020 Programming
Period for the ‘Investments for Growth and Employment’ Objective (UL RS, No 29/15) and in the associated
managing authority instructions. Funds will be allocated under the direct approval process for projects for the
energy renovation of central government buildings.
A priority list of buildings is expected to be compiled in December 2015 on the basis of the criteria for selecting
and financing projects for the energy renovation of buildings, which are being drawn up by the ministry
responsible for energy (criteria slated for completion by the end of November 2015). This list must be adhered to
when the energy renovation of buildings is being undertaken. During the lifetime of the project, the criteria will
be supplemented in response to the results of the energy renovation projects carried out. The priority list of
buildings will be updated annually in response to the documentation produced and delivered (energy
performance certificate, comprehensive energy audit, investment documentation).
4. Pilot or demonstration projects
Prior to the compiling of the list referred to in point 1 and to the commencement of implementation of energy
renovation projects under point 3, pilot or demonstration projects may be commenced that involve the
introduction of new knowledge and procedures for the implementation of renovation projects. The following
assumptions must be followed during the selection of pilot projects, chiefly the state of readiness of the project,
the location (temperature deficit), the feasibility of the nearly zero-energy building project, the compiling of the
project in accordance with the model of ensuring energy savings, the group of projects, sustainable construction
and pilot application of sustainable construction criteria, accessibility of the building, achievement of several
targets from the OP with regard to urbanisation, substitute buildings and employment. Since achievement of the
targets of the Strategy is based on private sector involvement, a pilot project involving the implementation of
energy renovation in accordance with the model of contractual provision of energy savings must be carried out
as a matter of priority, with priority given to the complete energy renovation of a group of buildings.
5. Monitoring of the targets (OP EKP 2014–2020)
The OP EKP 2014–2020 sets the targets that must be met, i.e. end-use energy savings in public sector buildings
and the energy renovation of buildings owned and occupied by central government. The total floor area
renovated in m2, which is also the unit under which we will report to the EU regarding the 3 % renovation
obligation, will form the basis for the monitoring of the achievement of the target. The list of buildings referred
to in under point 1 will enable this monitoring to take place. Significantly, point 4 of Article 5 of Directive
2012/27/EU states that new buildings occupied and owned as replacements for specific central government
buildings demolished in any of the two previous years, or buildings that have been sold, demolished or taken out
28
of use in any of the two previous years due to the more intensive use of other buildings, may count towards the
annual renovation rate of central government buildings.
The method used to monitor the results of end-use energy saving measures will be set out in the Decree on the
Energy Management System, which is being compiled and will be adopted in autumn 2015.
2.5 Buildings owned and occupied by the wider public sector Under Article 348 of the EZ-1, the Long-Term Strategy also includes a definition of the wider public sector.
The wider public sector as defined by the proposed strategy comprises public institutes, public commercial
institutes, public funds, public agencies and institutions founded by the state or by self-governing local
authorities, and public institutes, public commercial institutes, public funds, public agencies and institutions
founded by a municipality.
2.5.1 The strategy for the energy renovation of buildings owned and occupied by the
wider public sector will be accomplished by means of the following activities: 1. Determination of the conditions for renovation
2. Financing of projects from the new financial perspective under the OP EKP 2014–2020
3. Implementation of pilot or demonstration projects
1. Determination of the conditions for renovation
The conditions upon which the move towards the complete energy renovation of all buildings of the wider public
sector are:
Ownership by a wider public sector entity (if the building is not wholly owned by a wider public sector
entity, a full agreement on co-financing reached with the other owners is required).
Settled issue of management: Where there are two or more managers, an agreement must be concluded
on which of them will conduct the energy renovation, along with a financing plan.
Determination of the energy performance indicators: A comprehensive energy audit of the building
and an energy performance certificate, which must take sufficient account of the conditions relating to
the location, the cultural protection conditions and any other relevant conditions.
Investment documentation that specifies the upper limit on the return on investments made by a private
partner.
Test of suitability for PPP: Implementation of a preliminary procedure (Article 31 of the Public-Private
Partnership Act) – a test is conducted to establish whether a building is suitable for public-private
partnership (PPP) (implementation of a preliminary procedure under the Public-Private Partnership
Act).
Specified proposal for the complete energy renovation of a building: Set of measures for complete
energy renovation in accordance with point 2.1.
The following premises must be taken into consideration after a decision is reached to move towards the energy
renovation of a building:
Energy renovation project: project design documentation for the energy renovation of a building must
be compiled before energy renovation is carried out. In the case of PPP, the project design
documentation must be compiled by the private partner.
Implementation of other building improvement measures: other suitable measures to improve the state
of a building are also carried out alongside energy renovation, in accordance with the principles of due
diligence.
Compliance of renovation with the principles of sustainable construction: Pursuant to the sustainable
construction guidelines being compiled by the ministry responsible for construction, which are likely to
be completed by the end of 2017.
29
2. Financing of projects from the new financial perspective under the OP EKP 2014–2020
Financing of the OP EKP 2014–2020 is defined more precisely in the Decree on the Implementation of
Procedures for the Use of European Cohesion Funds in the Republic of Slovenia in the 2014–2020 Programming
Period for the ‘Investments for Growth and Employment’ Objective (UL RS, No 29/15) and in the associated
managing authority instructions. Funds will be allocated directly to wider public sector buildings (for buildings
founded by the state) and via public tenders (for buildings founded by a municipality).
Wider public sector entities founded by the state: Calls to provide a list of energy renovation projects for
buildings owned and occupied by wider public sector bodies founded by the state will be published every year in
line with the funds available. Selection of the buildings and the level of approved funds will be drawn up on the
basis of criteria for selecting and financing projects for the energy renovation of buildings, which are being
compiled by the ministry responsible for energy (criteria slated for completion by the end of November 2015).
The criteria will be supplemented in response to the results of the energy renovation projects carried out.
Wider public sector bodies founded by a municipality: The intermediate body will, annually and in line with
the funds available, publish public tenders to which wider public sector bodies founded by a municipality may
apply. Selection of the buildings and the level of approved funds will be determined on the basis of criteria for
selecting and financing projects for the energy renovation of buildings, which are being compiled by the ministry
responsible for energy (criteria slated for completion by the end of November 2015). During the lifetime of the
project, the criteria will be supplemented in response to the results of the energy renovation projects carried out.
3. Implementation of pilot or demonstration projects
Prior to the implementation of energy renovation projects under point 3, pilot or demonstration projects may be
commenced for wider public sector bodies that involve the introduction of new knowledge and procedures for
the implementation of renovation projects. The assumptions referred to in point 4 of Section 2.4. must be
followed in the procedure of selecting pilot projects.

30
3 Obstacles and opportunities in the monitoring of measures to increase energy
performance – SWOT analysis
3.1 Housing sector Technologies exist and are available on the market that increase energy performance and, consequently, lower
energy use in residential buildings. With due regard to the costs and benefits throughout the entire life-cycle,
investments in a large portion of the new technologies for improving energy performance are shown to be
justifiable from an economic standpoint as well. Progress in increasing the energy performance of the housing
sector is nevertheless relatively slow, with the main obstacles being:
A poor level of awareness, which is the result of information asymmetry and a lack of information.
There is a lack of awareness of the (financial and environmental) advantages of energy performance
measures and a lack of availability of properly collated information on the technical and financial
options to assist households. Information on energy performance is also asymmetrical, with a tendency
towards the ad hoc use of material by those in possession of it. As a consequence, information on
energy performance is relatively expensive, experts distribute it in limited quantities, and consumers
frequently do not trust it because of their previous negative experiences with new technologies
(OECD/IEA, 2007).
Two further major obstacles in achieving greater energy performance in the housing sector are the
availability of financial resources to support these types of project and assessments of the return on
investments in energy efficiency projects which do not take account of future savings. As a result of the
privatisation that took place in Slovenia in 1991, there is a high percentage of home ownership (90 %
according to the 2011 census). The way in which housing was privatised (sale of formerly socially
owned apartments at 10–30 % of their market value) led to an increase in ownership by the less well-off
and, consequently, to the problem of low-income owners in the housing sector. Owing to their low
incomes, they are unable to make an adequate contribution to maintenance and renovation, and
therefore to improving the energy performance of residential buildings.
The complexity of decision-making in multi-apartment buildings (owners with a range of very
different interests and investment potentials within the same building, difficulty in achieving consensus
among owners in the same residential building, percentage required for consent).
Inertia in consumer habits, as major changes in consumer behaviour require a period in excess of ten
years, while the time it typically takes for a new technology to penetrate is between three and four years
(OECD/IEA, 2007).
There is a principal-agent problem in the rented sector, where the owner of the apartment (who bears
the costs of energy renovation) and the user of the apartment (who bears the costs of the energy
consumed in the apartment, and therefore benefits from increased energy performance) are two different
people. Consequently, the motivation to improve energy performance is very low. This applies equally
to the private and non-profit rented sectors.
The main stakeholders in the energy renovation process are the owners of building stock, tenants, managers of
multi-apartment buildings, building contractors, manufacturers and providers of EE products, equipment and
services, project designers, energy suppliers, financial institutions, investors in the property market, energy
advice network advisers, the state, municipalities and the Eco Fund.

31
Table 4: Matrix of strengths, weaknesses, opportunities and threats (SWOT) for investments in the increased
energy performance of residential buildings
Positive Negative
Inte
rnal
STRENGTHS WEAKNESSES
Spread of awareness of the
advantages of increased energy
performance of residential buildings
Energy advice network for citizens
Possibility of obtaining repayable
funding and grants from the Eco Fund
Provision of information and
incentives for increased energy
performance by energy suppliers
Examples of good practice provide
attractive models
With the introduction of individual
metering, residents of multi-apartment
buildings have an overview and control of
their energy consumption
Reserve funds established in multi-
apartment buildings
Reduction in levels of energy poverty
among the population
Improvements to residents’ living
conditions
Lower energy costs
Relatively poor level of awareness still
present (chiefly of the organisational and
implementational aspects of renovation)
Difficulties in reaching agreement in multi-
apartment buildings
Lack of confidence in the managers of
multi-apartment buildings
Lack of confidence in energy renovation
providers
Problem of low-income owners
Lack of interest in energy renovation on the
part of owners of rented flats
Too many partial rather than complete
energy renovations
Implementation of the complete energy
renovation of building envelopes without taking
into account the changes to the requirement for
users to behave in a certain way (e.g.
deterioration in air quality in the absence of a
ventilation system or no change in habits
following the introduction of a recovery system)
Difficulties in acquiring funds for the
renovation of multi-apartment buildings (no
adequate loan instruments or the provision of
loan instruments inhibited by legislation)
Ex
tern
al
OPPORTUNITIES THREATS
Rapid technological development
Use of European funds by owners of
non-profit rented stock
Greater emphasis given to energy
performance at the European level
(incentives, tightening of requirements)
Establishment of a state guarantee
scheme
Introduction of the possibility of
dividing the benefits of energy efficiency
measures between apartment owners and
tenants
Inadequate training of energy renovation
providers
Extended period of relatively low fuel prices
Uncertainty regarding future energy prices
Instability of legislation
Inadequate conditions for the introduction of
innovative energy performance services/energy
performance contracting in the housing sector
(contractual provision of energy supply and
contractual provision of energy savings)

32
3.2 Buildings owned and occupied by central government The public sector has a particularly important role to play in efforts to improve the energy performance of
buildings, serving as a model for the renovation of building stock that improves energy performance. The
following factors most frequently hinder the public sector from fulfilling this role:
Lack of funds and economic motivation to improve the energy performance of public buildings.
These types of investment are usually funded from budget funds allocated to a user annually. Alongside
the austerity measures in place and the often restricted borrowing opportunities, this limits the
possibility of undertaking the complete energy renovation of buildings, which requires considerable
investment funds. As a result of this, renovations are often merely partial in nature. Moreover, managers
in the public sector do not have an economic motive for improving the energy performance of their
buildings. Investments in energy performance are usually low down the list of investment priorities.
The most common critical organisational obstacle is the lack of skills, information and reliable
sources of data in relation to the energy performance of buildings.
Complex and cumbersome public procurement procedures for measures to improve the energy
performance of buildings.
Projects to improve energy performance also differ from traditional projects in terms of the method
used to evaluate the return on investment, nor is the traditional cost-benefit analysis straightforward to
use in these cases, chiefly because of difficulty in evaluating the positive side effects, such as improved
feelings of well-being, healthier living conditions and so on. Investments in improving energy
performance can also be understood as a form of insurance against the risks of unfavourable
fluctuations in fuel prices, which from a strictly economic standpoint would also require the
application of a lower discount rate when estimating the return on investment of a project.
There are restrictions on and a lack of a support environment for the use of non-budget funds.
Lack of knowledge of and confidence in energy performance contracting as a non-budget source for the
funding of energy renovation. The public sector often lacks the skills necessary to implement and manage such
projects. The main stakeholders in the energy renovation of buildings owned and occupied by central
government are the state as the joint owner of buildings, the state as legislator, the state as the administrator of
public funds (EU funds, etc.), co-owners of buildings (with the state), state administration employees, building
managers, building contractors, energy performance contracting providers (energy service enterprises or ESCO
enterprises, etc.), energy suppliers, financial institutions and the EU.
Table 5: Matrix of strengths, weaknesses, opportunities and threats (SWOT) for investments in the increased
energy performance of buildings owned and occupied by central government
Positive Negative
Inte
rnal
STRENGTHS WEAKNESSES
Mandatory energy performance
certificate showing the possible scale of
savings
Legally stipulated obligation to
introduce energy management systems
As a reliable payer, the state is a
relatively low-risk client and is therefore
attractive for energy performance
contracting models
Promotion of energy accounting
within energy management systems
Improved levels of information and
awareness of the cost-effective options for
saving energy in buildings
Improvements to the quality of the
working environment
Lack of economic motivation to improve the
energy performance of buildings
Lack of awareness of the scale of energy use
in buildings (also the consequence of a lack of
data on energy supply and use) and the
possibilities for reducing energy use
Lack of funds
The protracted period of tight fiscal
frameworks resulting from unstable
macroeconomic conditions and the deficit and
debt reduction procedure, which will make the
use of state funds for investments in the energy
performance of buildings more difficult
Lack of information, human and
organisational resources specialised in
implementing the energy renovation of buildings

33
Examples of good practice provide
attractive models
Lower energy expenditure in the long
term
and measures relating to energy efficiency in
buildings
Delays in introducing energy management
systems in the public sector.
Fragmentary nature of knowledge,
experience and skills
Reaching agreement and gaining consent for
the renovation of buildings not 100 % owned by
the state
High discount rate for public investments
(7 %)
Investments often limited to those with a
relatively quick return
Limited borrowing opportunities
Lack of knowledge, understanding and
confidence regarding the concept of energy
performance contracting
Lack of skills in the commissioning of
energy performance contracting projects
Legal complications regarding the
implementation of energy performance
contracting
Lack of a support environment for the
implementation of energy performance
contracting projects
Partial energy renovation instead of
complete renovation
Implementation of the complete energy
renovation of building envelopes without taking
into account the changes to the requirement for
users to behave in a certain way (e.g.
deterioration in air quality in the absence of a
ventilation system or no change in habits
following the introduction of a recovery system)
High proportion of protected buildings that
require special treatment, absence of guidelines
Ex
tern
al
OPPORTUNITIES THREATS
The EU requirement for the
mandatory renovation of 3 % of the total
floor area of buildings owned and
occupied by central government each year
Rapid technological development
Energy performance contracting
possibilities
Use of European funds for technical
support and the funding of the renovation
of buildings owned and occupied by
central government.
Greater emphasis given to energy
performance at the European level
(incentives, tightening of requirements)
The planned overhaul of the
methodology for implementing energy
audits in buildings in order to support the
preparation of tenders for energy
Too little emphasis placed on government
support for energy-efficient investments in the
public sector
Limited range of financial instruments for
financing the energy renovation of public
buildings
The problem in acquiring financial resources
faced by enterprises that provide energy
performance contracting services limits the
potential scope of provision of these services
Inadequate training of energy renovation
providers
Low number of energy performance
contracting providers and the limited number of
promoters of energy performance contracting
projects
Extended period of relatively low fuel prices
Uncertainty regarding future energy prices
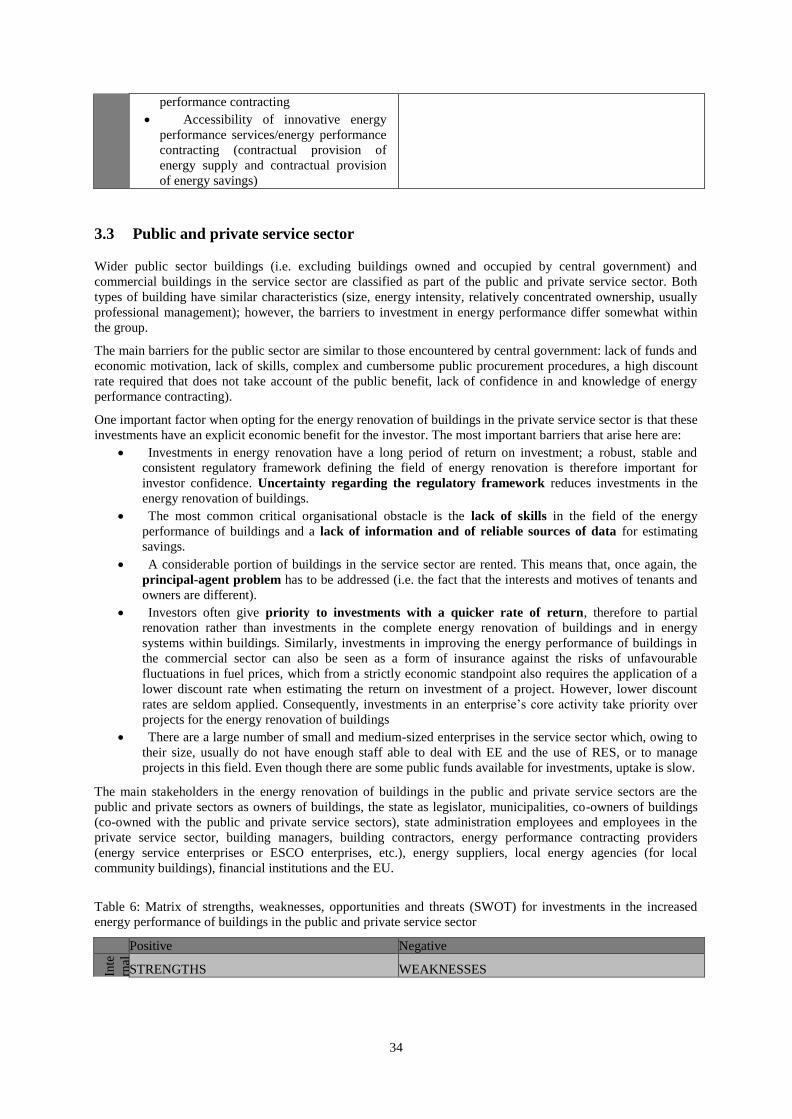
34
performance contracting
Accessibility of innovative energy
performance services/energy performance
contracting (contractual provision of
energy supply and contractual provision
of energy savings)
3.3 Public and private service sector Wider public sector buildings (i.e. excluding buildings owned and occupied by central government) and
commercial buildings in the service sector are classified as part of the public and private service sector. Both
types of building have similar characteristics (size, energy intensity, relatively concentrated ownership, usually
professional management); however, the barriers to investment in energy performance differ somewhat within
the group.
The main barriers for the public sector are similar to those encountered by central government: lack of funds and
economic motivation, lack of skills, complex and cumbersome public procurement procedures, a high discount
rate required that does not take account of the public benefit, lack of confidence in and knowledge of energy
performance contracting).
One important factor when opting for the energy renovation of buildings in the private service sector is that these
investments have an explicit economic benefit for the investor. The most important barriers that arise here are:
Investments in energy renovation have a long period of return on investment; a robust, stable and
consistent regulatory framework defining the field of energy renovation is therefore important for
investor confidence. Uncertainty regarding the regulatory framework reduces investments in the
energy renovation of buildings.
The most common critical organisational obstacle is the lack of skills in the field of the energy
performance of buildings and a lack of information and of reliable sources of data for estimating
savings.
A considerable portion of buildings in the service sector are rented. This means that, once again, the
principal-agent problem has to be addressed (i.e. the fact that the interests and motives of tenants and
owners are different).
Investors often give priority to investments with a quicker rate of return, therefore to partial
renovation rather than investments in the complete energy renovation of buildings and in energy
systems within buildings. Similarly, investments in improving the energy performance of buildings in
the commercial sector can also be seen as a form of insurance against the risks of unfavourable
fluctuations in fuel prices, which from a strictly economic standpoint also requires the application of a
lower discount rate when estimating the return on investment of a project. However, lower discount
rates are seldom applied. Consequently, investments in an enterprise’s core activity take priority over
projects for the energy renovation of buildings
There are a large number of small and medium-sized enterprises in the service sector which, owing to
their size, usually do not have enough staff able to deal with EE and the use of RES, or to manage
projects in this field. Even though there are some public funds available for investments, uptake is slow.
The main stakeholders in the energy renovation of buildings in the public and private service sectors are the
public and private sectors as owners of buildings, the state as legislator, municipalities, co-owners of buildings
(co-owned with the public and private service sectors), state administration employees and employees in the
private service sector, building managers, building contractors, energy performance contracting providers
(energy service enterprises or ESCO enterprises, etc.), energy suppliers, local energy agencies (for local
community buildings), financial institutions and the EU.
Table 6: Matrix of strengths, weaknesses, opportunities and threats (SWOT) for investments in the increased
energy performance of buildings in the public and private service sector
Positive Negative
Inte
rnal
STRENGTHS WEAKNESSES

35
Mandatory energy performance
certificate for buildings under a long-term
lease showing the possible scale of
savings8
Mandatory local sustainable energy
action plan that also includes measures for
the energy renovation of buildings
As a reliable payer, the state is a
relatively low-risk client and is therefore
Lack of economic motivation to improve the
energy performance of public buildings
Lack of awareness of the scale of energy use
in buildings (also the consequence of a lack of
data on energy supply and use) and the
possibilities for reducing energy use
Lack of funds
attractive for energy performance
contracting models
Energy audits improve awareness of
the cost-effective options for saving
energy in buildings
Improved levels of information and
awareness of the cost-effective options for
saving energy in buildings
Promotion of energy accounting
Improvements to the quality of the
working environment
Lower energy expenditure in the long
term
Lack of information, human and
organisational resources specialised in
implementing the energy renovation of buildings
and measures relating to energy efficiency in
buildings
The protracted period of tight fiscal
frameworks resulting from unstable
macroeconomic conditions and the deficit and
debt reduction procedure, which will make the
use of state funds for investments in the energy
performance of public sector buildings more
difficult
Lack of interest in energy renovation on the
part of tenants
Reaching agreement and gaining consent for
the renovation of buildings not 100 % owned by
one owner
High discount rate for public investments
(7 %)
Limited opportunities for borrowing by the
public sector and weak lending activities on the
part of banks in providing loans to the private
sector
Lack of knowledge, understanding and
confidence regarding the concept of energy
performance contracting
Lack of a support environment for the
implementation of energy performance
contracting projects
Legal complications regarding the
implementation of energy performance
contracting
Poorly developed local energy agencies in
some places
Partial instead of complete energy
renovation – Investments in the private sector
often limited to those with a relatively quick
return
Implementation of the complete energy
renovation of building envelopes without taking
into account the changes to the requirement for
users to behave in a certain way (e.g.
deterioration in air quality in the absence of a
ventilation system or no change in habits
8 Mandatory for all buildings with a total useful floor area of over 250 m2 owned or occupied by the public sector, and for
buildings in the private service sector when sold or placed under a long-term lease.

36
following the introduction of a recovery system) E
xte
rnal
OPPORTUNITIES THREATS
Rapid technological development
Energy performance contracting
possibilities
Financial incentive grants for
technical support and the financing of
building renovation
Greater emphasis given to energy
performance at the European level
(incentives, tightening of requirements)
The planned overhaul of the
methodology for implementing energy
audits in buildings in order to support the
preparation of tenders for energy
performance contracting
Standardisation of energy
performance contracting procedures
Too little emphasis placed on government
support for energy-efficient investments in the
public sector
Limited range of financial instruments for
financing the energy renovation of public
buildings
The problem in acquiring financial resources
faced by enterprises that provide energy
performance contracting services limits the
potential scope of provision of these services
Inadequate training of energy renovation
providers
Too few providers of energy performance
contracting
Extended period of relatively low fuel prices
Uncertainty regarding future energy prices
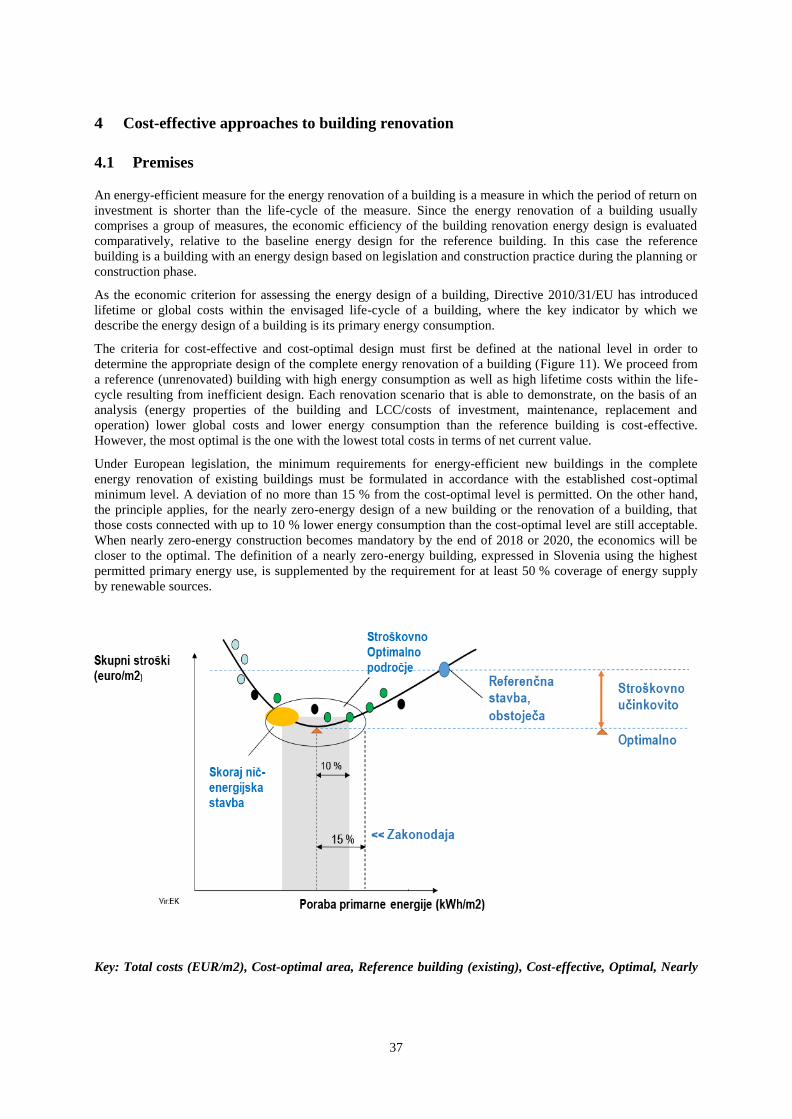
37
4 Cost-effective approaches to building renovation
4.1 Premises An energy-efficient measure for the energy renovation of a building is a measure in which the period of return on
investment is shorter than the life-cycle of the measure. Since the energy renovation of a building usually
comprises a group of measures, the economic efficiency of the building renovation energy design is evaluated
comparatively, relative to the baseline energy design for the reference building. In this case the reference
building is a building with an energy design based on legislation and construction practice during the planning or
construction phase.
As the economic criterion for assessing the energy design of a building, Directive 2010/31/EU has introduced
lifetime or global costs within the envisaged life-cycle of a building, where the key indicator by which we
describe the energy design of a building is its primary energy consumption.
The criteria for cost-effective and cost-optimal design must first be defined at the national level in order to
determine the appropriate design of the complete energy renovation of a building (Figure 11). We proceed from
a reference (unrenovated) building with high energy consumption as well as high lifetime costs within the life-
cycle resulting from inefficient design. Each renovation scenario that is able to demonstrate, on the basis of an
analysis (energy properties of the building and LCC/costs of investment, maintenance, replacement and
operation) lower global costs and lower energy consumption than the reference building is cost-effective.
However, the most optimal is the one with the lowest total costs in terms of net current value.
Under European legislation, the minimum requirements for energy-efficient new buildings in the complete
energy renovation of existing buildings must be formulated in accordance with the established cost-optimal
minimum level. A deviation of no more than 15 % from the cost-optimal level is permitted. On the other hand,
the principle applies, for the nearly zero-energy design of a new building or the renovation of a building, that
those costs connected with up to 10 % lower energy consumption than the cost-optimal level are still acceptable.
When nearly zero-energy construction becomes mandatory by the end of 2018 or 2020, the economics will be
closer to the optimal. The definition of a nearly zero-energy building, expressed in Slovenia using the highest
permitted primary energy use, is supplemented by the requirement for at least 50 % coverage of energy supply
by renewable sources.
Key: Total costs (EUR/m2), Cost-optimal area, Reference building (existing), Cost-effective, Optimal, Nearly
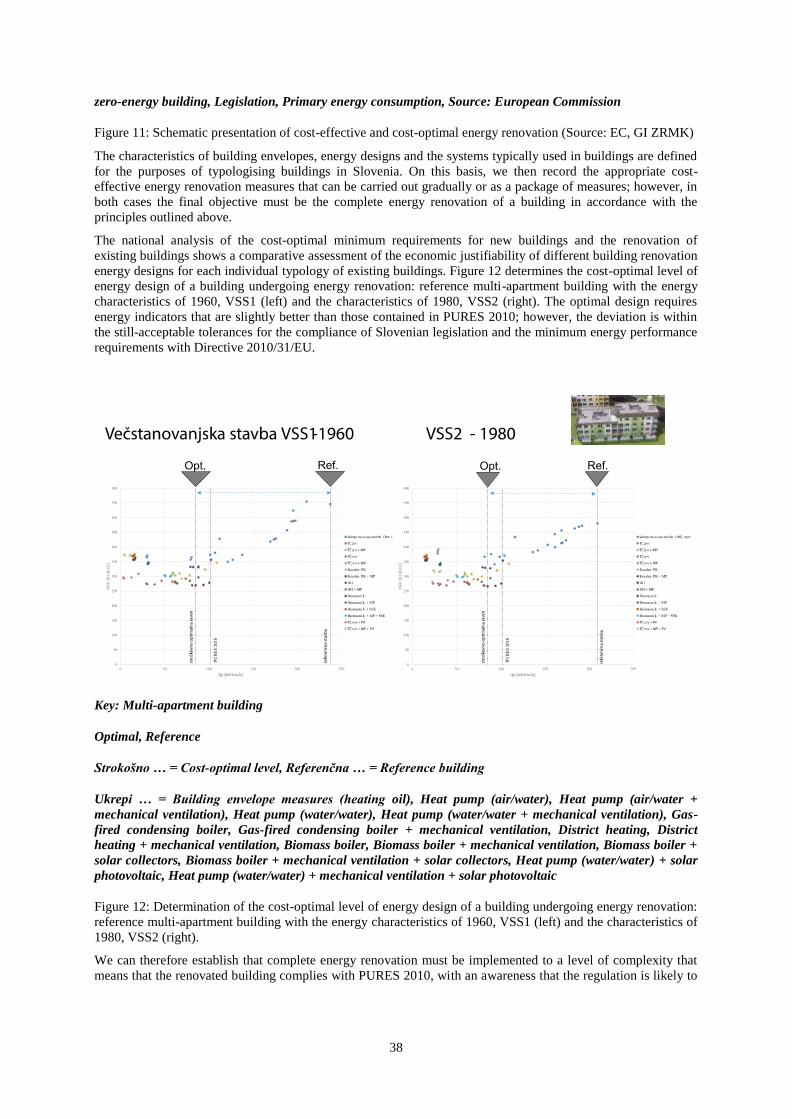
38
zero-energy building, Legislation, Primary energy consumption, Source: European Commission
Figure 11: Schematic presentation of cost-effective and cost-optimal energy renovation (Source: EC, GI ZRMK)
The characteristics of building envelopes, energy designs and the systems typically used in buildings are defined
for the purposes of typologising buildings in Slovenia. On this basis, we then record the appropriate cost-
effective energy renovation measures that can be carried out gradually or as a package of measures; however, in
both cases the final objective must be the complete energy renovation of a building in accordance with the
principles outlined above.
The national analysis of the cost-optimal minimum requirements for new buildings and the renovation of
existing buildings shows a comparative assessment of the economic justifiability of different building renovation
energy designs for each individual typology of existing buildings. Figure 12 determines the cost-optimal level of
energy design of a building undergoing energy renovation: reference multi-apartment building with the energy
characteristics of 1960, VSS1 (left) and the characteristics of 1980, VSS2 (right). The optimal design requires
energy indicators that are slightly better than those contained in PURES 2010; however, the deviation is within
the still-acceptable tolerances for the compliance of Slovenian legislation and the minimum energy performance
requirements with Directive 2010/31/EU.
Key: Multi-apartment building
Optimal, Reference
Strokošno … = Cost-optimal level, Referenčna … = Reference building
Ukrepi … = Building envelope measures (heating oil), Heat pump (air/water), Heat pump (air/water +
mechanical ventilation), Heat pump (water/water), Heat pump (water/water + mechanical ventilation), Gas-
fired condensing boiler, Gas-fired condensing boiler + mechanical ventilation, District heating, District
heating + mechanical ventilation, Biomass boiler, Biomass boiler + mechanical ventilation, Biomass boiler +
solar collectors, Biomass boiler + mechanical ventilation + solar collectors, Heat pump (water/water) + solar
photovoltaic, Heat pump (water/water) + mechanical ventilation + solar photovoltaic
Figure 12: Determination of the cost-optimal level of energy design of a building undergoing energy renovation:
reference multi-apartment building with the energy characteristics of 1960, VSS1 (left) and the characteristics of
1980, VSS2 (right).
We can therefore establish that complete energy renovation must be implemented to a level of complexity that
means that the renovated building complies with PURES 2010, with an awareness that the regulation is likely to
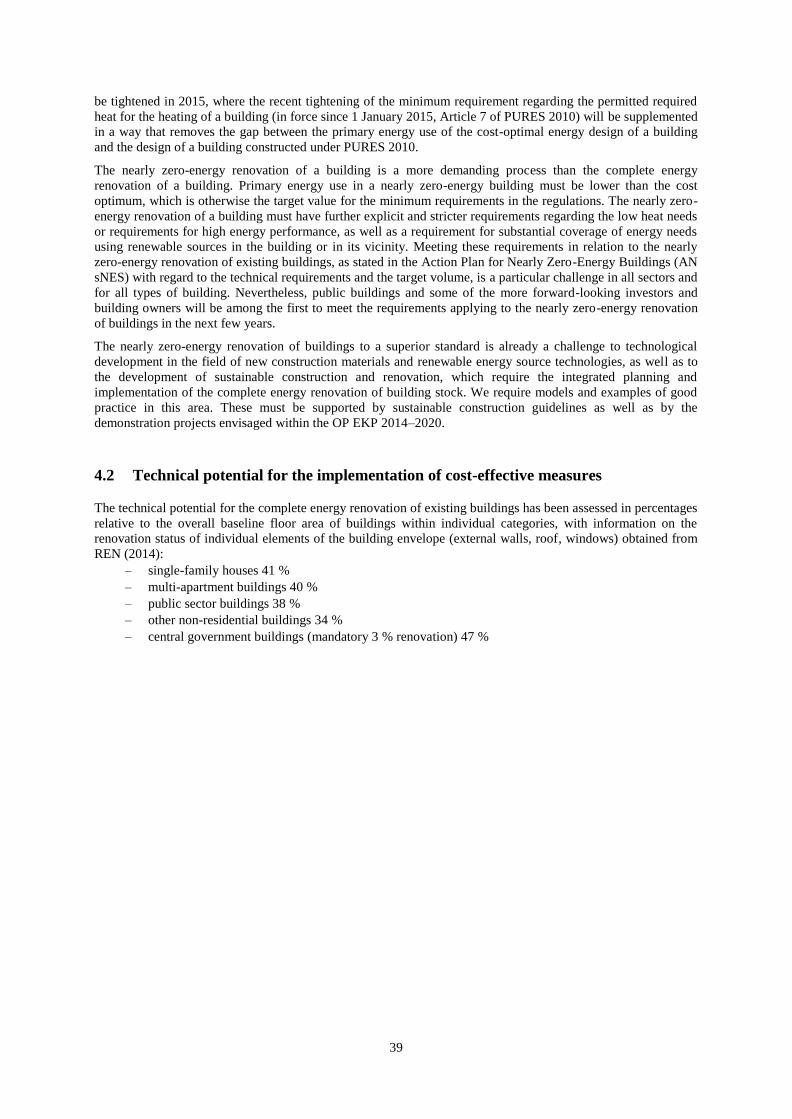
39
be tightened in 2015, where the recent tightening of the minimum requirement regarding the permitted required
heat for the heating of a building (in force since 1 January 2015, Article 7 of PURES 2010) will be supplemented
in a way that removes the gap between the primary energy use of the cost-optimal energy design of a building
and the design of a building constructed under PURES 2010.
The nearly zero-energy renovation of a building is a more demanding process than the complete energy
renovation of a building. Primary energy use in a nearly zero-energy building must be lower than the cost
optimum, which is otherwise the target value for the minimum requirements in the regulations. The nearly zero-
energy renovation of a building must have further explicit and stricter requirements regarding the low heat needs
or requirements for high energy performance, as well as a requirement for substantial coverage of energy needs
using renewable sources in the building or in its vicinity. Meeting these requirements in relation to the nearly
zero-energy renovation of existing buildings, as stated in the Action Plan for Nearly Zero-Energy Buildings (AN
sNES) with regard to the technical requirements and the target volume, is a particular challenge in all sectors and
for all types of building. Nevertheless, public buildings and some of the more forward-looking investors and
building owners will be among the first to meet the requirements applying to the nearly zero-energy renovation
of buildings in the next few years.
The nearly zero-energy renovation of buildings to a superior standard is already a challenge to technological
development in the field of new construction materials and renewable energy source technologies, as well as to
the development of sustainable construction and renovation, which require the integrated planning and
implementation of the complete energy renovation of building stock. We require models and examples of good
practice in this area. These must be supported by sustainable construction guidelines as well as by the
demonstration projects envisaged within the OP EKP 2014–2020.
4.2 Technical potential for the implementation of cost-effective measures The technical potential for the complete energy renovation of existing buildings has been assessed in percentages
relative to the overall baseline floor area of buildings within individual categories, with information on the
renovation status of individual elements of the building envelope (external walls, roof, windows) obtained from
REN (2014):
– single-family houses 41 %
– multi-apartment buildings 40 %
– public sector buildings 38 %
– other non-residential buildings 34 %
– central government buildings (mandatory 3 % renovation) 47 %
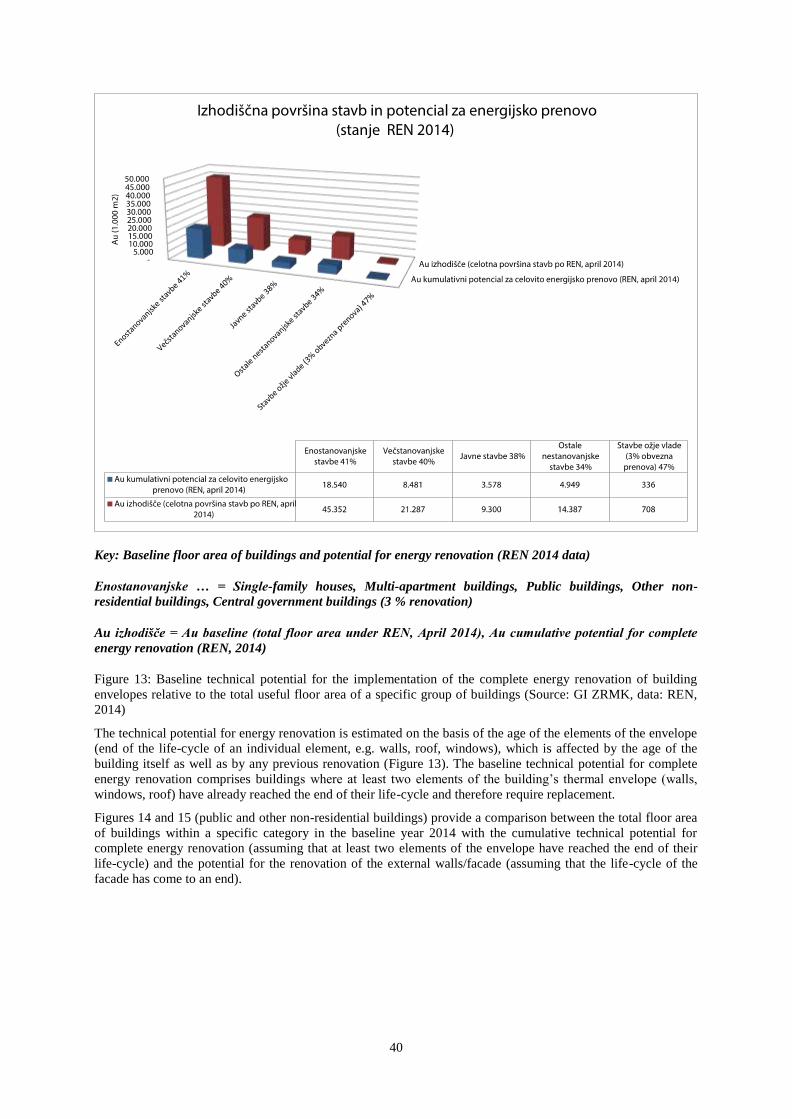
40
Key: Baseline floor area of buildings and potential for energy renovation (REN 2014 data)
Enostanovanjske … = Single-family houses, Multi-apartment buildings, Public buildings, Other non-
residential buildings, Central government buildings (3 % renovation)
Au izhodišče = Au baseline (total floor area under REN, April 2014), Au cumulative potential for complete
energy renovation (REN, 2014)
Figure 13: Baseline technical potential for the implementation of the complete energy renovation of building
envelopes relative to the total useful floor area of a specific group of buildings (Source: GI ZRMK, data: REN,
2014)
The technical potential for energy renovation is estimated on the basis of the age of the elements of the envelope
(end of the life-cycle of an individual element, e.g. walls, roof, windows), which is affected by the age of the
building itself as well as by any previous renovation (Figure 13). The baseline technical potential for complete
energy renovation comprises buildings where at least two elements of the building’s thermal envelope (walls,
windows, roof) have already reached the end of their life-cycle and therefore require replacement.
Figures 14 and 15 (public and other non-residential buildings) provide a comparison between the total floor area
of buildings within a specific category in the baseline year 2014 with the cumulative technical potential for
complete energy renovation (assuming that at least two elements of the envelope have reached the end of their
life-cycle) and the potential for the renovation of the external walls/facade (assuming that the life-cycle of the
facade has come to an end).
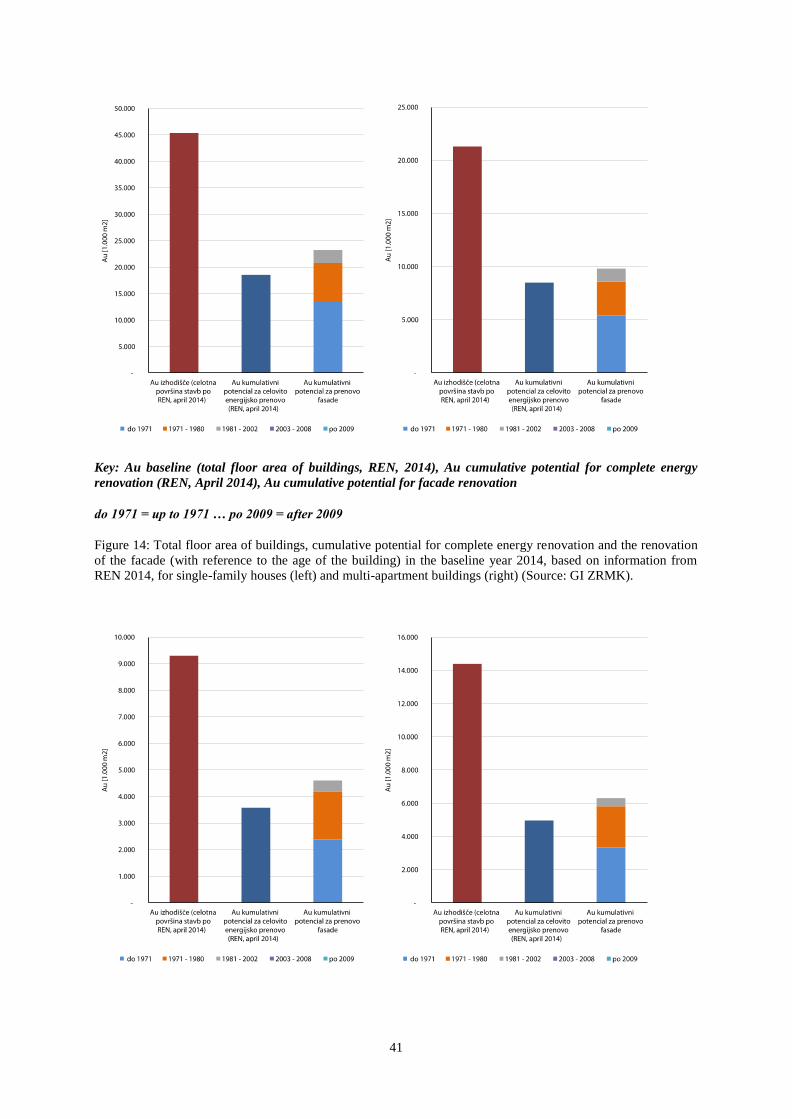
41
Key: Au baseline (total floor area of buildings, REN, 2014), Au cumulative potential for complete energy
renovation (REN, April 2014), Au cumulative potential for facade renovation
do 1971 = up to 1971 … po 2009 = after 2009
Figure 14: Total floor area of buildings, cumulative potential for complete energy renovation and the renovation
of the facade (with reference to the age of the building) in the baseline year 2014, based on information from
REN 2014, for single-family houses (left) and multi-apartment buildings (right) (Source: GI ZRMK).
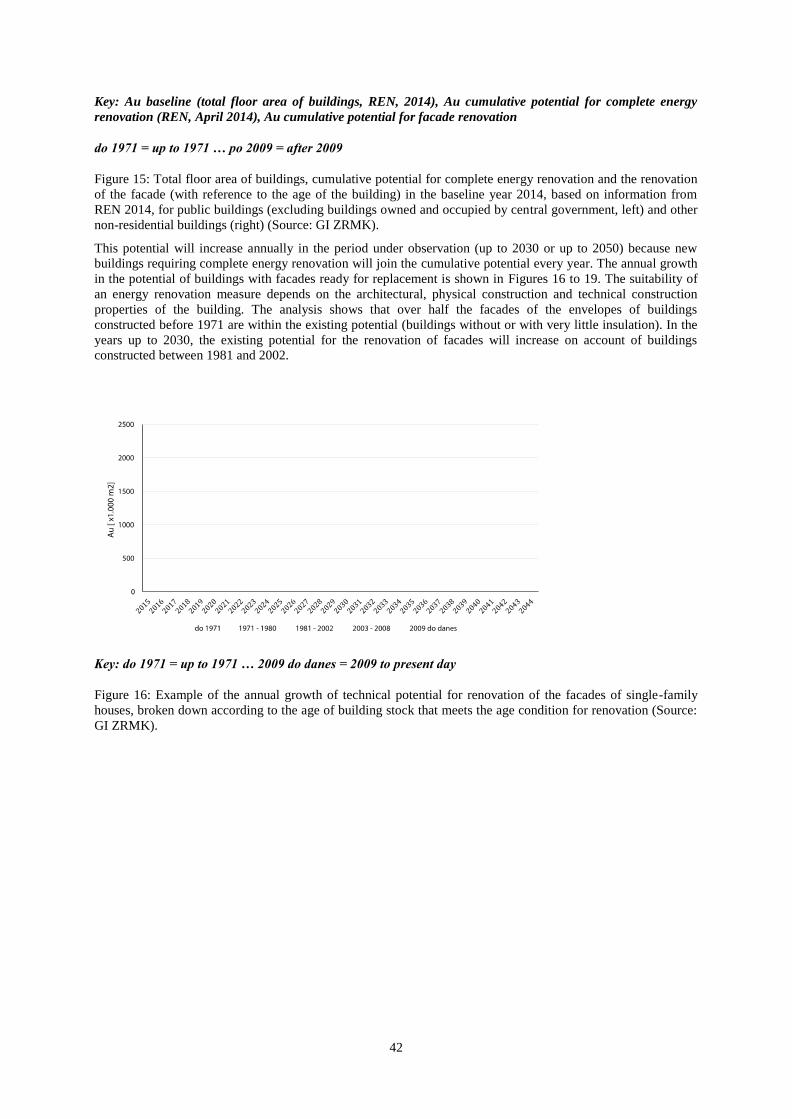
42
Key: Au baseline (total floor area of buildings, REN, 2014), Au cumulative potential for complete energy
renovation (REN, April 2014), Au cumulative potential for facade renovation
do 1971 = up to 1971 … po 2009 = after 2009
Figure 15: Total floor area of buildings, cumulative potential for complete energy renovation and the renovation
of the facade (with reference to the age of the building) in the baseline year 2014, based on information from
REN 2014, for public buildings (excluding buildings owned and occupied by central government, left) and other
non-residential buildings (right) (Source: GI ZRMK).
This potential will increase annually in the period under observation (up to 2030 or up to 2050) because new
buildings requiring complete energy renovation will join the cumulative potential every year. The annual growth
in the potential of buildings with facades ready for replacement is shown in Figures 16 to 19. The suitability of
an energy renovation measure depends on the architectural, physical construction and technical construction
properties of the building. The analysis shows that over half the facades of the envelopes of buildings
constructed before 1971 are within the existing potential (buildings without or with very little insulation). In the
years up to 2030, the existing potential for the renovation of facades will increase on account of buildings
constructed between 1981 and 2002.
Key: do 1971 = up to 1971 … 2009 do danes = 2009 to present day
Figure 16: Example of the annual growth of technical potential for renovation of the facades of single-family
houses, broken down according to the age of building stock that meets the age condition for renovation (Source:
GI ZRMK).
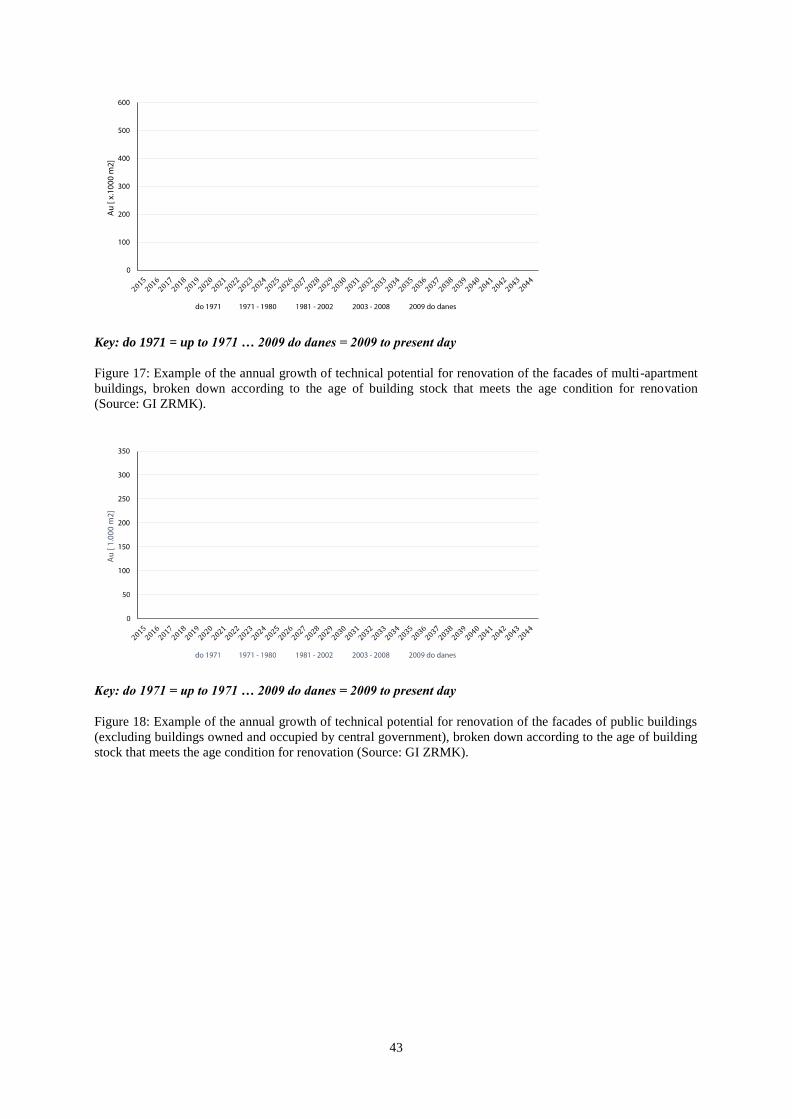
43
Key: do 1971 = up to 1971 … 2009 do danes = 2009 to present day
Figure 17: Example of the annual growth of technical potential for renovation of the facades of multi-apartment
buildings, broken down according to the age of building stock that meets the age condition for renovation
(Source: GI ZRMK).
Key: do 1971 = up to 1971 … 2009 do danes = 2009 to present day
Figure 18: Example of the annual growth of technical potential for renovation of the facades of public buildings
(excluding buildings owned and occupied by central government), broken down according to the age of building
stock that meets the age condition for renovation (Source: GI ZRMK).

44
Key: do 1971 = up to 1971 … 2009 do danes = 2009 to present day
Figure 19: Example of the annual growth of technical potential for renovation of the facades of other non-
residential buildings, broken down according to the age of building stock that meets the age condition for
renovation (Source: GI ZRMK).
4.3 Characteristics of building construction, broken down by period Despite the ostensible diversity of buildings, it is possible to define common characteristics and to classify them
by period (Table 7). An overview of the physical construction properties of the existing building stock by period
tells us which measures would be possible and worthwhile on individual buildings as part of the complete energy
renovation of residential and non-residential buildings.
Table 7: Characteristics of individual age groups of buildings and the recommended cost-effective measures
Residential and non-
residential buildings
Up to 1945 – period prior to the Second World War
Status Residential and non-residential buildings from the pre-war period (up to 1945) are
of solid construction. The external walls are of above-average thickness and made of
brick, the ceilings are generally of wood (beam construction), and the cellars are
vaulted and made of stone. The roofs and loft spaces are not insulated unless
architectural and energy renovation work has already been carried out on them.
If the loft spaces are occupied and used, the roofs have mostly already been
renovated and insulated (the insulation is generally too thin for today’s heating
requirements) and the covering has been replaced.
The windows are small and made of wood. Buildings are in general poorly
maintained and, because of their age, require complete energy renovation,
encompassing architectural and construction renovation in addition to energy
renovation. Buildings may also be subject to monument protection regulations. This
means that all the measures planned must be examined and approved in advance by
those required to give their consent.
1946 – 1971 – 1980
The quality of construction of housing and non-residential building stock built
between the initial post-war period and the mid-1970s is poorer, or at best equal to
45
the quality of construction of buildings erected prior to 1945. This is largely the
result of the lack of building material at the time, or the need to save on building
material. The walls were reduced in thickness to 30 cm because of the introduction of
modular brick construction. Insulation materials did not exist at that time. The
majority of residential buildings were constructed using modular brick. Concrete tiles
(insufficient heat insulation), bricks from slag and electrofilter ash were subsequently
also used. The buildings are generally in need of deep energy and construction
renovation, with the replacement of windows and other maintenance measures.
The building stock requiring most critical renovation is from this period, led by
single-family houses (mostly self-builds) and followed by multi-apartment buildings
and, lastly, apartment blocks of all types. Renovation is also required on almost all
non-residential building stock.
1981–2002
A period of intensive construction of larger housing complexes began in the 1980s.
The first somewhat stricter regulations (JUS.U.J5.600) required greater supervision
of the construction of multi-storey apartment buildings (particularly towers).
Construction was either solid, with an additional layer of thermal insulation, or
skeleton-framed (filled in with masonry facades). The predominant material used in
the construction of multi-storey buildings was concrete, including tiles, in all
panelling systems. Private apartment stock was built in an uncontrolled manner,
chiefly of brick, houses had larger floor areas and were of masonry, some without
thermal insulation, others already with thermal insulation and some with inadequate
‘thermal insulation’ for which siporex, porolite and air were used. Problems and
inconsistencies in execution (joints, seals, leaks) have arisen as a result of new
materials and self-builds. During this period windows were large, aluminium- or
wood-framed and generally energy-inefficient (single-glazing used in places and
windows most frequently with inefficient insulated glazing (Thermopane). Non-
residential building stock saw a similar intensity of construction and similar
construction.
Energy renovation chiefly includes the replacement of inadequate building fixtures
and work on the building envelope, which must be based on additional thermal
insulation, chiefly the roof and ceilings, and the remediation of major thermal
bridges.
In the 1990s construction became very diverse, with a fall in the intensity of growth
in the construction of concrete housing complexes. Light prefabricated construction,
particularly for single-family houses, appeared alongside brick-based construction.
There were fewer concrete-based structures and exposed thermal bridges, while the
proportion of brick-based construction featuring the thermal insulation of all
structural elements increased. On average, houses from this period have better
thermal insulation than those from the 1980s, and the windows installed in these
houses are of wood, aluminium and PVC. Double-glazing (Thermopan) is
predominant everywhere.
The 1990s was also marked by the preparation of new legislation; in the meantime,
the rules of the profession in force at the time were applied to energy design.
In the second half of the 1990s, the first opportunities arose for obtaining grants for
energy improvements to building envelopes (loft insulation, installation of gas-filled
low-emission glazing, installation of oil-fired boilers).
2003–2008
We believe that buildings constructed between 2002 and 2008 already have better
thermal insulation; it therefore makes sense to insulate them further only when
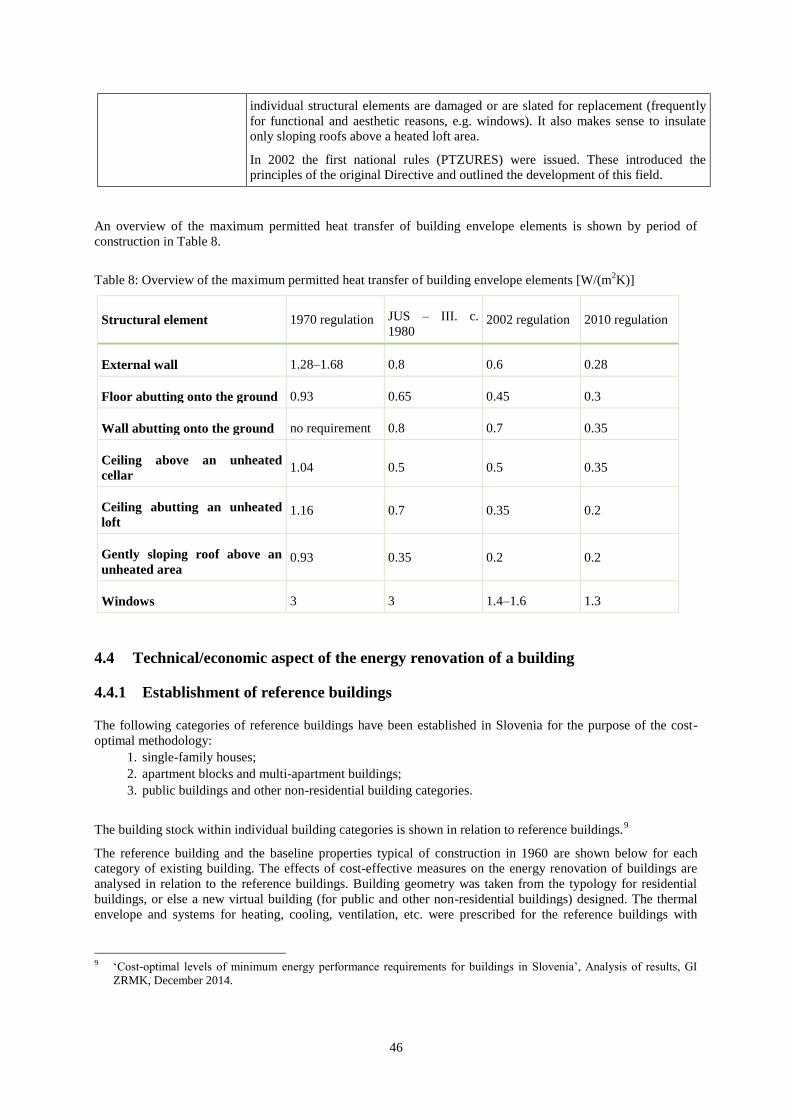
46
individual structural elements are damaged or are slated for replacement (frequently
for functional and aesthetic reasons, e.g. windows). It also makes sense to insulate
only sloping roofs above a heated loft area.
In 2002 the first national rules (PTZURES) were issued. These introduced the
principles of the original Directive and outlined the development of this field.
An overview of the maximum permitted heat transfer of building envelope elements is shown by period of
construction in Table 8.
Table 8: Overview of the maximum permitted heat transfer of building envelope elements [W/(m2K)]
Structural element 1970 regulation JUS – III. c.
1980 2002 regulation 2010 regulation
External wall 1.28–1.68 0.8 0.6 0.28
Floor abutting onto the ground 0.93 0.65 0.45 0.3
Wall abutting onto the ground no requirement 0.8 0.7 0.35
Ceiling above an unheated
cellar 1.04 0.5 0.5 0.35
Ceiling abutting an unheated
loft 1.16 0.7 0.35 0.2
Gently sloping roof above an
unheated area 0.93 0.35 0.2 0.2
Windows 3 3 1.4–1.6 1.3
4.4 Technical/economic aspect of the energy renovation of a building
4.4.1 Establishment of reference buildings The following categories of reference buildings have been established in Slovenia for the purpose of the cost-
optimal methodology:
1. single-family houses;
2. apartment blocks and multi-apartment buildings;
3. public buildings and other non-residential building categories.
The building stock within individual building categories is shown in relation to reference buildings.9
The reference building and the baseline properties typical of construction in 1960 are shown below for each
category of existing building. The effects of cost-effective measures on the energy renovation of buildings are
analysed in relation to the reference buildings. Building geometry was taken from the typology for residential
buildings, or else a new virtual building (for public and other non-residential buildings) designed. The thermal
envelope and systems for heating, cooling, ventilation, etc. were prescribed for the reference buildings with
9 ‘Cost-optimal levels of minimum energy performance requirements for buildings in Slovenia’, Analysis of results, GI
ZRMK, December 2014.

47
regard to statistical data (SURS,10
REUS11
). Individual measures and groups of measures that form various
energy renovation scenarios are analysed below in relation to three reference buildings.
Measures were defined and primary energy use and global costs in terms of net present value were calculated for
the energy renovation design examples addressed.
10 Statistical Office of the Republic of Slovenia (figures for 2010–2014). 11 Energy Efficiency Research Slovenia (REUS).
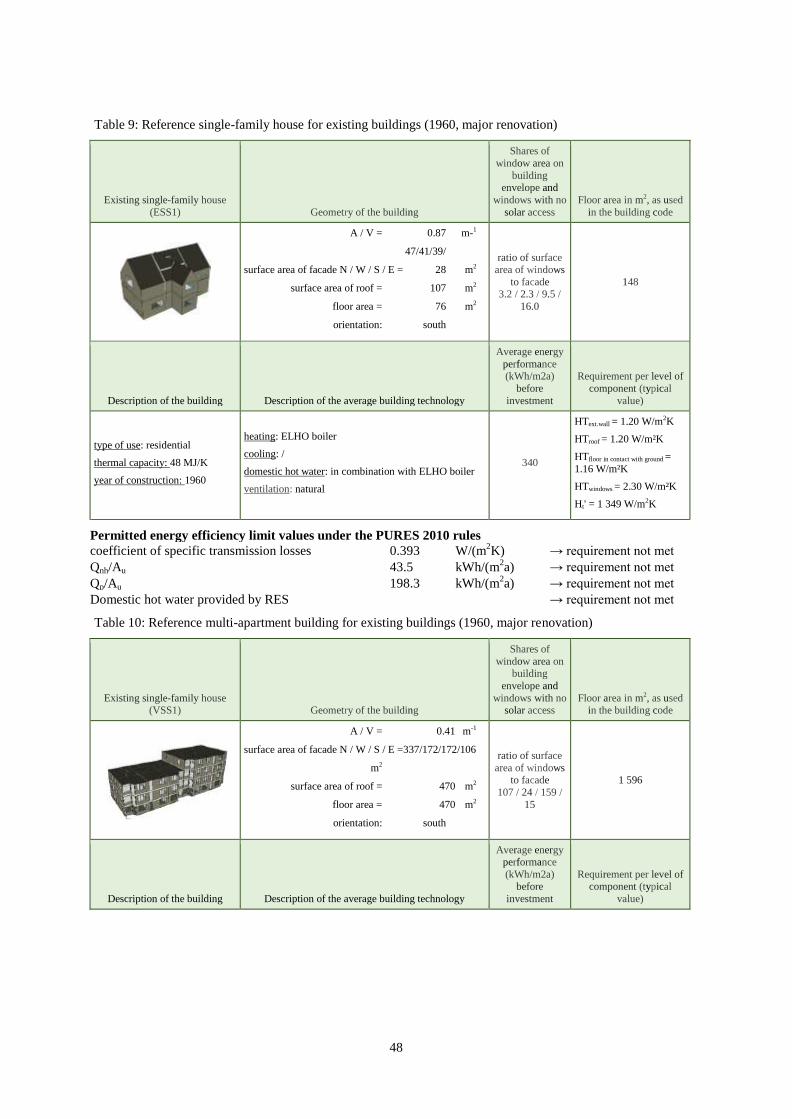
48
Table 9: Reference single-family house for existing buildings (1960, major renovation)
Existing single-family house
(ESS1) Geometry of the building
Shares of
window area on
building envelope and
windows with no
solar access
Floor area in m2, as used
in the building code
A / V = 0.87 m-1
47/41/39/
surface area of facade N / W / S / E = 28 m2
surface area of roof = 107 m2
floor area = 76 m2
orientation: south
ratio of surface area of windows
to facade 3.2 / 2.3 / 9.5 /
16.0
148
Description of the building Description of the average building technology
Average energy
performance (kWh/m2a)
before
investment
Requirement per level of
component (typical
value)
type of use: residential
thermal capacity: 48 MJ/K
year of construction: 1960
heating: ELHO boiler
cooling: /
domestic hot water: in combination with ELHO boiler
ventilation: natural
340
HText.wall = 1.20 W/m2K
HTroof = 1.20 W/m²K
HTfloor in contact with ground =
1.16 W/m²K
HTwindows = 2.30 W/m²K
Ht' = 1 349 W/m2K
Permitted energy efficiency limit values under the PURES 2010 rules
coefficient of specific transmission losses 0.393 W/(m2K) → requirement not met
Qnh/Au 43.5 kWh/(m2a) → requirement not met
Qp/Au 198.3 kWh/(m2a) → requirement not met
Domestic hot water provided by RES → requirement not met
Table 10: Reference multi-apartment building for existing buildings (1960, major renovation)
Existing single-family house (VSS1) Geometry of the building
Shares of
window area on building
envelope and
windows with no solar access
Floor area in m2, as used in the building code
A / V = 0.41 m-1
surface area of facade N / W / S / E =337/172/172/106
m2
surface area of roof = 470 m2
floor area = 470 m2
orientation: south
ratio of surface
area of windows to facade
107 / 24 / 159 /
15
1 596
Description of the building Description of the average building technology
Average energy performance
(kWh/m2a) before
investment
Requirement per level of component (typical
value)
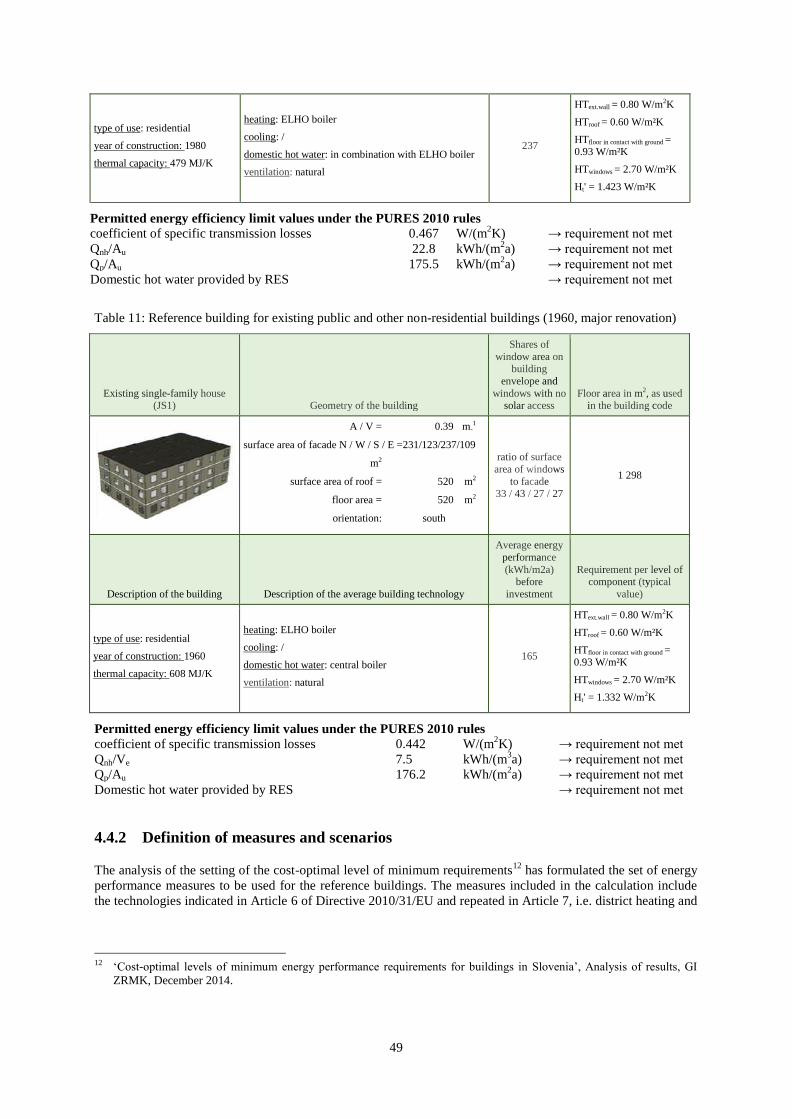
49
type of use: residential
year of construction: 1980
thermal capacity: 479 MJ/K
heating: ELHO boiler
cooling: /
domestic hot water: in combination with ELHO boiler
ventilation: natural
237
HText.wall = 0.80 W/m2K
HTroof = 0.60 W/m²K
HTfloor in contact with ground = 0.93 W/m²K
HTwindows = 2.70 W/m²K
Ht' = 1.423 W/m²K
Permitted energy efficiency limit values under the PURES 2010 rules
coefficient of specific transmission losses 0.467 W/(m2K) → requirement not met
Qnh/Au 22.8 kWh/(m2a) → requirement not met
Qp/Au 175.5 kWh/(m2a) → requirement not met
Domestic hot water provided by RES → requirement not met
Table 11: Reference building for existing public and other non-residential buildings (1960, major renovation)
Existing single-family house (JS1) Geometry of the building
Shares of
window area on building
envelope and
windows with no solar access
Floor area in m2, as used in the building code
A / V = 0.39 m-1
surface area of facade N / W / S / E =231/123/237/109
m2
surface area of roof = 520 m2
floor area = 520 m2
orientation: south
ratio of surface
area of windows
to facade 33 / 43 / 27 / 27
1 298
Description of the building Description of the average building technology
Average energy
performance
(kWh/m2a) before
investment
Requirement per level of component (typical
value)
type of use: residential
year of construction: 1960
thermal capacity: 608 MJ/K
heating: ELHO boiler
cooling: /
domestic hot water: central boiler
ventilation: natural
165
HText.wall = 0.80 W/m2K
HTroof = 0.60 W/m²K
HTfloor in contact with ground = 0.93 W/m²K
HTwindows = 2.70 W/m²K
Ht' = 1.332 W/m2K
Permitted energy efficiency limit values under the PURES 2010 rules
coefficient of specific transmission losses 0.442 W/(m2K) → requirement not met
Qnh/Ve 7.5 kWh/(m3a) → requirement not met
Qp/Au 176.2 kWh/(m2a) → requirement not met
Domestic hot water provided by RES → requirement not met
4.4.2 Definition of measures and scenarios The analysis of the setting of the cost-optimal level of minimum requirements
12 has formulated the set of energy
performance measures to be used for the reference buildings. The measures included in the calculation include
the technologies indicated in Article 6 of Directive 2010/31/EU and repeated in Article 7, i.e. district heating and
12 ‘Cost-optimal levels of minimum energy performance requirements for buildings in Slovenia’, Analysis of results, GI
ZRMK, December 2014.

50
cooling, heat pumps, etc. In accordance with the third paragraph of Annex I(2) to the Regulation,13
Slovenia also
included measures based on renewable energy sources in the calculation.
Due regard was paid to the fact that measures implemented in one system can affect the energy performance of
another system, e.g. the level of insulation of the envelope affects the capacity and dimension of building
systems. This interaction between different measures is taken into account when defining the variants. The
measures are in compliance with the levels of air quality and internal comfort under the CEN 15251 standard on
air quality in closed premises.
The purpose of the cost-optimal methodology is to facilitate various technologies, where this is not limited to a
calculation of the global costs of established and proven variants. The selected technologies and fuels for heating
and domestic hot water systems represent the basic range of options which an investor can find on the market
before the introduction of an energy performance improvement measure.
Table 12 first sets out the individual measures for improving the energy performance of buildings (their gradual
implementation leads to complete energy renovation), followed by the variants of the complete energy
renovation measures. Individual measures are determined for all the components of the thermal envelope (four
measures for external walls, three measures for the roof structure and two measures for windows) for different
heat transfer values. Combinations of complete energy renovations that include measures involving building
systems are presented in Table 13.
Most buildings in Slovenia are constructed within a temperature deficit range of 2 800–3 600 K/day. Less than
10 % of the population lives in south-west Slovenia, where the temperature deficit is between 2 100 and 2 800
K/day. Work on the building stock is therefore focused on the other, cooler parts of Slovenia.
Key: DEGREE DAYS
od = from, do = to, nad = over
Population density, municipalities, Slovenia, 1 July 2012
Population per km2, ali manj = or fewer, ali več = or more
Sources: Statistical Office of the Republic of Slovenia, Surveying and Mapping Authority of the Republic of
Slovenia
Figure 20: Annual temperature deficit (left) and population density (right) in Slovenia (Source: ARSO, SURS)
13 Commission Delegated Regulation (EU) No 244/2012 supplementing Directive 2010/31/EU.
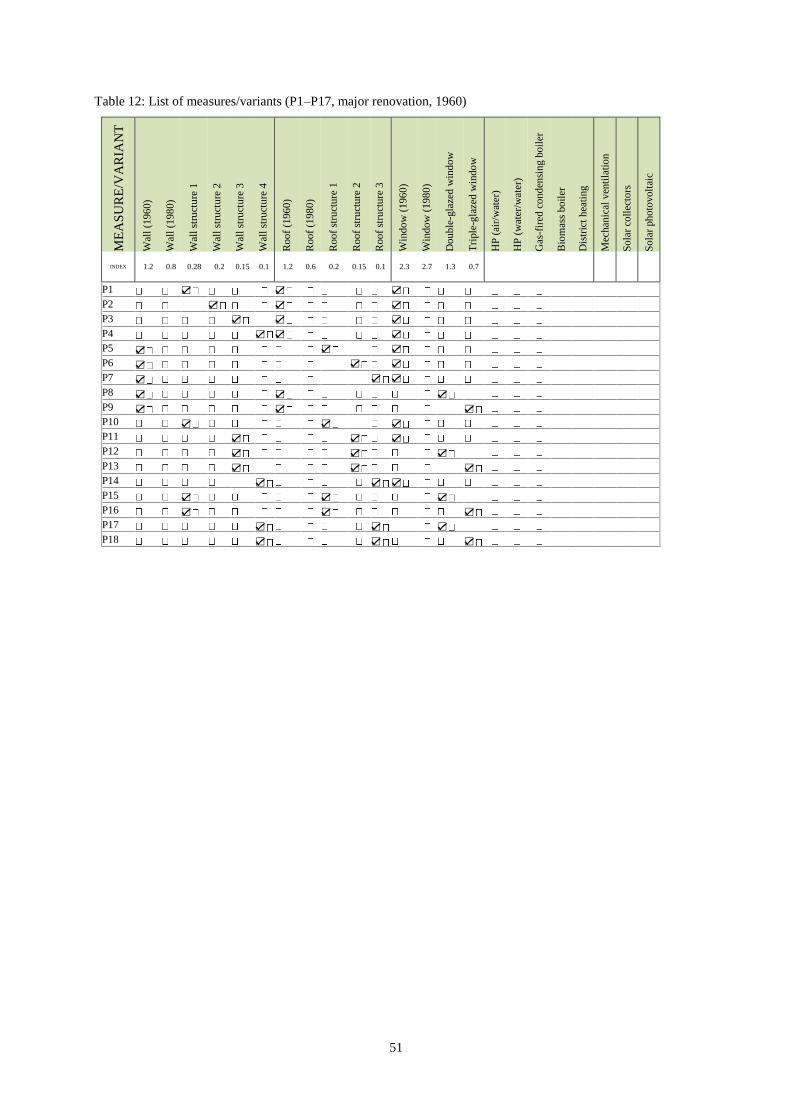
51
Table 12: List of measures/variants (P1–P17, major renovation, 1960)
ME
AS
UR
E/V
AR
IAN
T
Wal
l (1
96
0)
Wal
l (1
98
0)
Wal
l st
ruct
ure
1
Wal
l st
ruct
ure
2
Wal
l st
ruct
ure
3
Wal
l st
ruct
ure
4
Roo
f (1
96
0)
Roo
f (1
98
0)
Roo
f st
ruct
ure
1
Roo
f st
ruct
ure
2
Roo
f st
ruct
ure
3
Win
do
w (
196
0)
Win
do
w (
198
0)
Do
ub
le-g
laze
d w
ind
ow
Tri
ple
-gla
zed
win
do
w
HP
(ai
r/w
ater
)
HP
(w
ater
/wat
er)
Gas
-fir
ed c
ond
ensi
ng
bo
iler
Bio
mas
s bo
iler
Dis
tric
t h
eati
ng
Mec
han
ical
ven
tila
tio
n
So
lar
coll
ecto
rs
So
lar
pho
tovolt
aic
INDEX 1.2 0.8 0.28 0.2 0.15 0.1 1.2 0.6 0.2 0.15 0.1 2.3 2.7 1.3 0.7
P1 ☑ ☑ ☑ P2 ☑ ☑ ☑ P3 ☑ ☑ ☑ P4 ☑ ☑ ☑ P5 ☑ ☑ ☑ P6 ☑ ☑ ☑ P7 ☑ ☑ ☑ P8 ☑ ☑ ☑ P9 ☑ ☑ ☑ P10 ☑ ☑ ☑ P11 ☑ ☑ ☑ P12 ☑ ☑ ☑ P13 ☑ ☑ ☑ P14 ☑ ☑ ☑ P15 ☑ ☑ ☑ P16 ☑ ☑ ☑ P17 ☑ ☑ ☑ P18 ☑ ☑ ☑
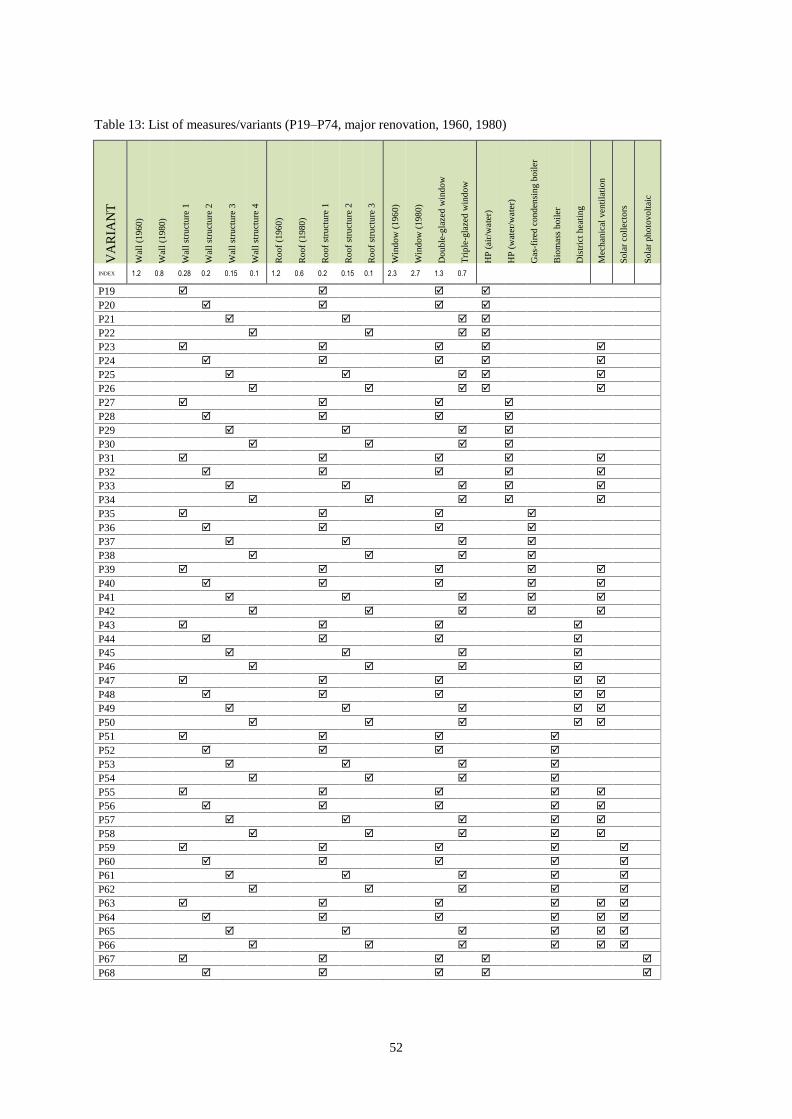
52
Table 13: List of measures/variants (P19–P74, major renovation, 1960, 1980) V
AR
IAN
T
Wal
l (1
960)
Wal
l (1
980)
Wal
l st
ruct
ure
1
Wal
l st
ruct
ure
2
Wal
l st
ruct
ure
3
Wal
l st
ruct
ure
4
Roof
(1960
)
Roof
(1980
)
Roof
stru
cture
1
Roof
stru
cture
2
Roof
stru
cture
3
Win
dow
(196
0)
Win
dow
(198
0)
Double
-gla
zed w
indow
Tri
ple
-gla
zed w
ind
ow
HP
(ai
r/w
ate
r)
HP
(w
ater
/wate
r)
Gas
-fir
ed c
onden
sin
g b
oil
er
Bio
mas
s boil
er
Dis
tric
t hea
ting
Mec
han
ical
ven
tila
tion
Sola
r co
llec
tors
Sola
r photo
volt
aic
INDEX 1.2 0.8 0.28 0.2 0.15 0.1 1.2 0.6 0.2 0.15 0.1 2.3 2.7 1.3 0.7
P19 P20 P21 P22 P23 P24 P25 P26 P27 P28 P29 P30 P31 P32 P33 P34 P35 P36 P37 P38 P39 P40 P41 P42 P43 P44 P45 P46 P47 P48 P49 P50 P51 P52 P53 P54 P55 P56 P57 P58 P59
P60
P61
P62
P63 P64 P65 P66 P67
P68

53
P69
P70
P71
P72
P73
P74

54
4.5 Calculation of primary energy use In accordance with the EN ISO 13790 standard and with regard to CEN standards and the requirements of the
calculation of the cost-optimal level, an accurate hourly dynamic method was chosen for the primary energy
calculation. A comprehensive approach was chosen for the reciprocal effects of the building and its systems,
where in the calculation of energy for heating and cooling the effect of all heat gains connected with the building
and its technical systems was taken into account. The heat needed to heat and cool a building has been calculated
using the monthly quasi-stationary method, in accordance with PURES 2010 and the technical guideline TSG-1-
004:2010 Efficient Use of Energy.
In accordance with the Guideline, the calculated primary energy includes energy used for heating, cooling,
ventilation, hot water and lighting. The main reference for this is Annex I to Directive 2010/31/EU, which is also
applied in full for the cost-optimal framework methodology. The tables show the value of total input energy for
the operation of the building offset by the total renewable portion of energy that is consumed in the building.
Since in some cases heat pumps are taken as a monovalent system, in places the energy consumption for DHW is
equal to zero. This means that this portion was fully covered via energy produced from, for example, ambient
heat.
Annex B presents calculations of heating or cooling need, energy use by structure and resource, primary energy
use and primary energy savings relative to the baseline status of the reference buildings for the measures and
variants described.
4.6 Cost-effective renovation On the basis of the primary energy use and global cost calculations connected to the different variants defined
for the reference buildings, graphs have been drawn for selected cases which show primary energy use and
global costs in terms of net present value. The calculation of the global costs takes account of the initial
investments, the total annual costs for each year, the final value and, where appropriate, the costs of removal,
where the values are compared with the initial year. The result of the global cost calculations is the net present
value of costs incurred in the specific period of the calculation, taking into account residual values of equipment
with a longer life-cycle. Forecasts of energy costs and interest rates are limited to the period of the calculation.
The combination of measures or variants with the lowest costs is the lowest point of the curve (Variant 3 in
Figure 21). Its position on the X axis represents the cost-optimal level of the minimum energy performance
requirements. Annex I(6)(2) to the Directive provides that if packages are linked to the same or very similar
costs, the definition of the cost-optimal level should, if possible, be based on the variant with the lower use of
primary energy (the left-hand side of the cost-optimal range).
Key: Economic optimum, Cost-optimal range

55
Figure 21: Different variants and the position of the cost-optimal range14
(Source: Guideline)
Primary energy use and lifetime costs (investment, maintenance, replacement and operation, including energy
costs) are shown for the reference buildings in terms of the net current value, assuming a 30-year lifetime, with a
financial calculation containing a 3 % discount rate and with due regard to increases in energy prices.
14 Boermans, Bettgenhäuser et al., 2011: Cost-optimal building performance requirements – Calculation methodology for
reporting on national energy performance requirements on the basis of cost optimality. Under the Directive on the Energy
Performance of Buildings, ECEEE (Cost-optimal building performance requirements – Calculation methodology for
reporting on national energy performance requirements on the basis of cost optimality within the framework of the
EPBD, ECEEE).
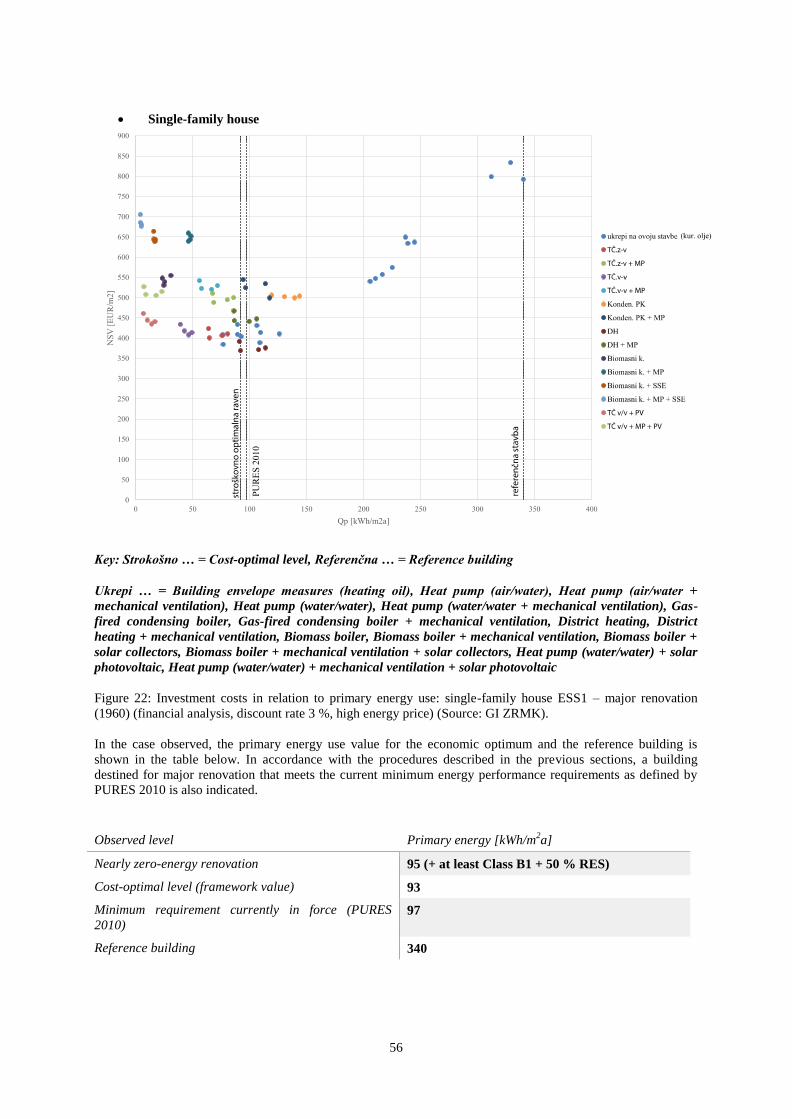
56
Single-family house
Key: Strokošno … = Cost-optimal level, Referenčna … = Reference building
Ukrepi … = Building envelope measures (heating oil), Heat pump (air/water), Heat pump (air/water +
mechanical ventilation), Heat pump (water/water), Heat pump (water/water + mechanical ventilation), Gas-
fired condensing boiler, Gas-fired condensing boiler + mechanical ventilation, District heating, District
heating + mechanical ventilation, Biomass boiler, Biomass boiler + mechanical ventilation, Biomass boiler +
solar collectors, Biomass boiler + mechanical ventilation + solar collectors, Heat pump (water/water) + solar
photovoltaic, Heat pump (water/water) + mechanical ventilation + solar photovoltaic
Figure 22: Investment costs in relation to primary energy use: single-family house ESS1 – major renovation
(1960) (financial analysis, discount rate 3 %, high energy price) (Source: GI ZRMK).
In the case observed, the primary energy use value for the economic optimum and the reference building is
shown in the table below. In accordance with the procedures described in the previous sections, a building
destined for major renovation that meets the current minimum energy performance requirements as defined by
PURES 2010 is also indicated.
Observed level Primary energy [kWh/m2a]
Nearly zero-energy renovation 95 (+ at least Class B1 + 50 % RES)
Cost-optimal level (framework value) 93
Minimum requirement currently in force (PURES
2010) 97
Reference building 340
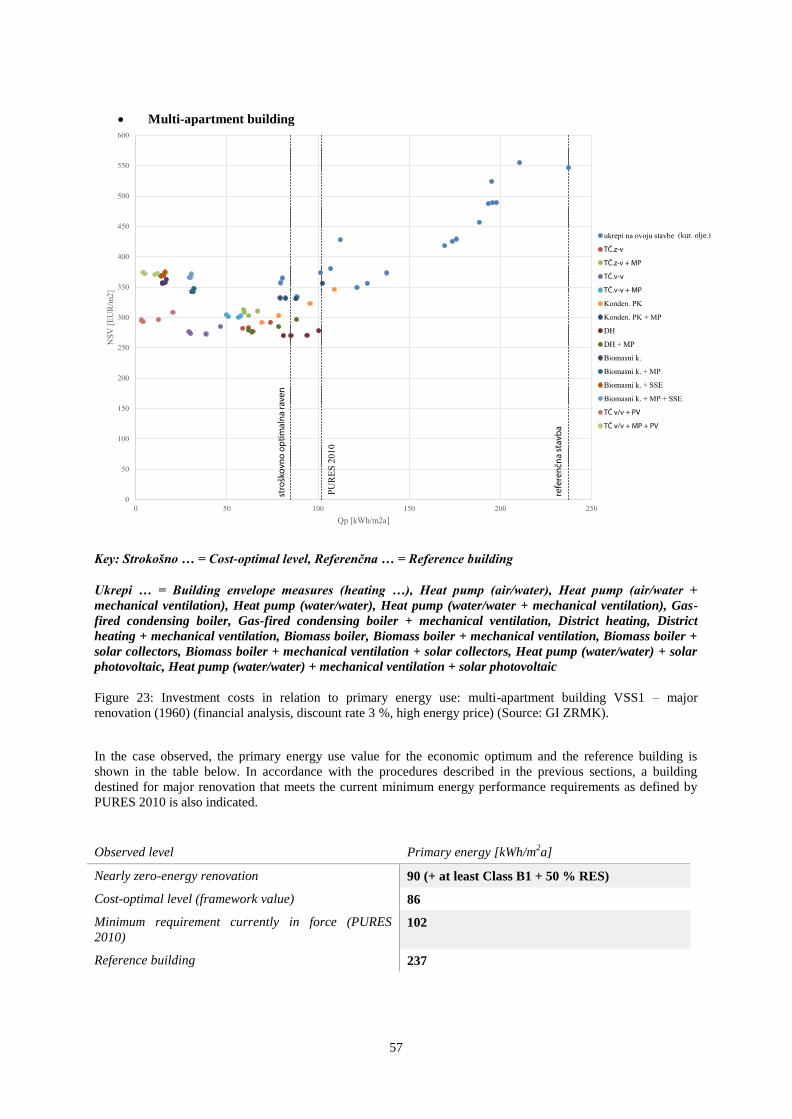
57
Multi-apartment building
Key: Strokošno … = Cost-optimal level, Referenčna … = Reference building
Ukrepi … = Building envelope measures (heating …), Heat pump (air/water), Heat pump (air/water +
mechanical ventilation), Heat pump (water/water), Heat pump (water/water + mechanical ventilation), Gas-
fired condensing boiler, Gas-fired condensing boiler + mechanical ventilation, District heating, District
heating + mechanical ventilation, Biomass boiler, Biomass boiler + mechanical ventilation, Biomass boiler +
solar collectors, Biomass boiler + mechanical ventilation + solar collectors, Heat pump (water/water) + solar
photovoltaic, Heat pump (water/water) + mechanical ventilation + solar photovoltaic
Figure 23: Investment costs in relation to primary energy use: multi-apartment building VSS1 – major
renovation (1960) (financial analysis, discount rate 3 %, high energy price) (Source: GI ZRMK).
In the case observed, the primary energy use value for the economic optimum and the reference building is
shown in the table below. In accordance with the procedures described in the previous sections, a building
destined for major renovation that meets the current minimum energy performance requirements as defined by
PURES 2010 is also indicated.
Observed level Primary energy [kWh/m2a]
Nearly zero-energy renovation 90 (+ at least Class B1 + 50 % RES)
Cost-optimal level (framework value) 86
Minimum requirement currently in force (PURES
2010) 102
Reference building 237
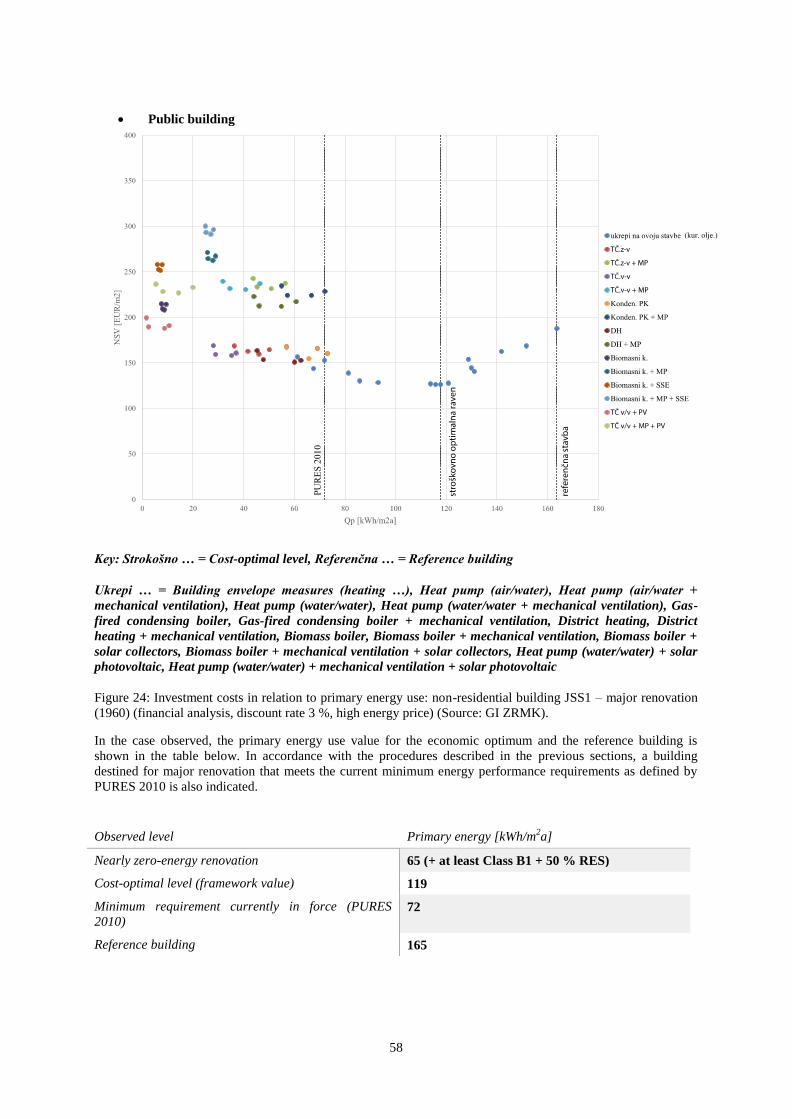
58
Public building
Key: Strokošno … = Cost-optimal level, Referenčna … = Reference building
Ukrepi … = Building envelope measures (heating …), Heat pump (air/water), Heat pump (air/water +
mechanical ventilation), Heat pump (water/water), Heat pump (water/water + mechanical ventilation), Gas-
fired condensing boiler, Gas-fired condensing boiler + mechanical ventilation, District heating, District
heating + mechanical ventilation, Biomass boiler, Biomass boiler + mechanical ventilation, Biomass boiler +
solar collectors, Biomass boiler + mechanical ventilation + solar collectors, Heat pump (water/water) + solar
photovoltaic, Heat pump (water/water) + mechanical ventilation + solar photovoltaic
Figure 24: Investment costs in relation to primary energy use: non-residential building JSS1 – major renovation
(1960) (financial analysis, discount rate 3 %, high energy price) (Source: GI ZRMK).
In the case observed, the primary energy use value for the economic optimum and the reference building is
shown in the table below. In accordance with the procedures described in the previous sections, a building
destined for major renovation that meets the current minimum energy performance requirements as defined by
PURES 2010 is also indicated.
Observed level Primary energy [kWh/m2a]
Nearly zero-energy renovation 65 (+ at least Class B1 + 50 % RES)
Cost-optimal level (framework value) 119
Minimum requirement currently in force (PURES
2010) 72
Reference building 165
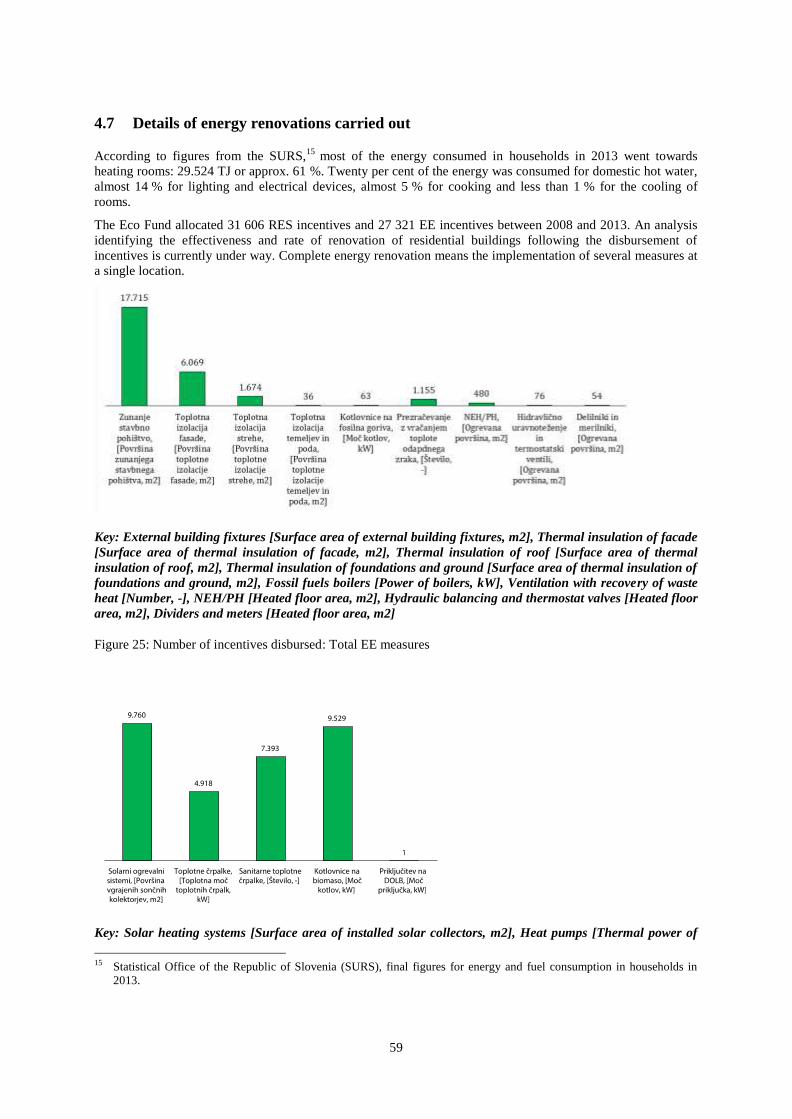
59
4.7 Details of energy renovations carried out According to figures from the SURS,
15 most of the energy consumed in households in 2013 went towards
heating rooms: 29.524 TJ or approx. 61 %. Twenty per cent of the energy was consumed for domestic hot water,
almost 14 % for lighting and electrical devices, almost 5 % for cooking and less than 1 % for the cooling of
rooms.
The Eco Fund allocated 31 606 RES incentives and 27 321 EE incentives between 2008 and 2013. An analysis
identifying the effectiveness and rate of renovation of residential buildings following the disbursement of
incentives is currently under way. Complete energy renovation means the implementation of several measures at
a single location.
Key: External building fixtures [Surface area of external building fixtures, m2], Thermal insulation of facade
[Surface area of thermal insulation of facade, m2], Thermal insulation of roof [Surface area of thermal
insulation of roof, m2], Thermal insulation of foundations and ground [Surface area of thermal insulation of
foundations and ground, m2], Fossil fuels boilers [Power of boilers, kW], Ventilation with recovery of waste
heat [Number, -], NEH/PH [Heated floor area, m2], Hydraulic balancing and thermostat valves [Heated floor
area, m2], Dividers and meters [Heated floor area, m2]
Figure 25: Number of incentives disbursed: Total EE measures
Key: Solar heating systems [Surface area of installed solar collectors, m2], Heat pumps [Thermal power of
15 Statistical Office of the Republic of Slovenia (SURS), final figures for energy and fuel consumption in households in
2013.
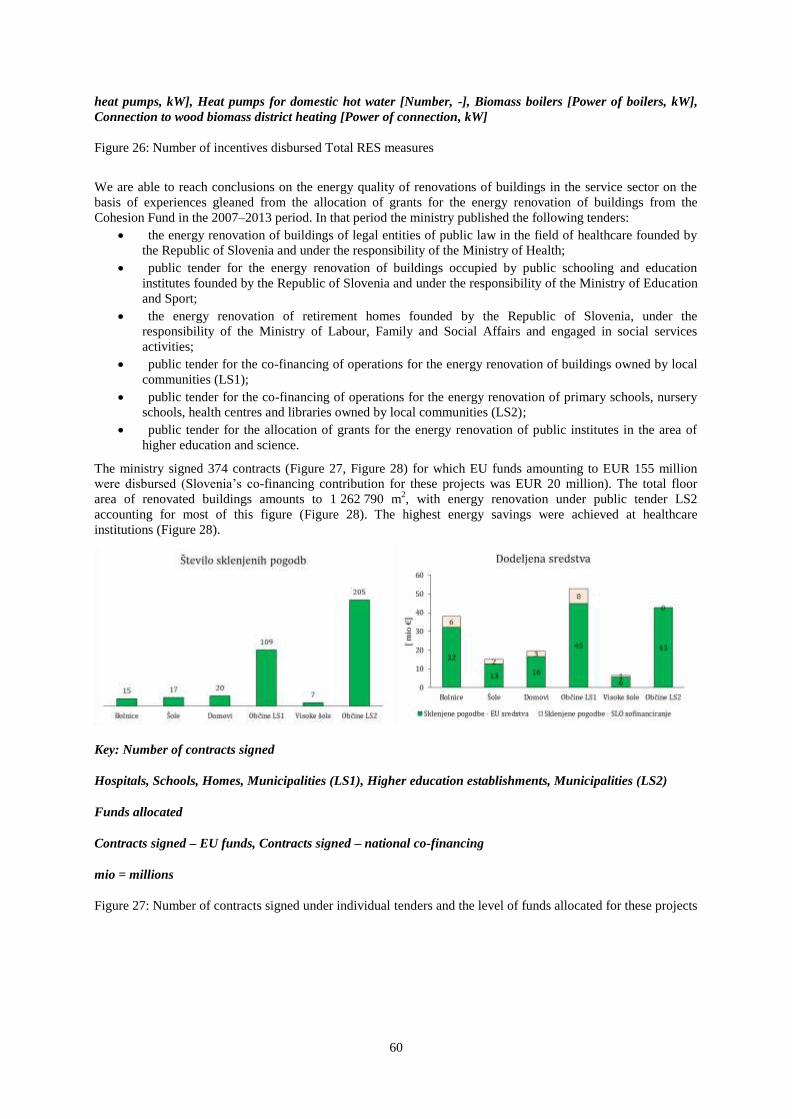
60
heat pumps, kW], Heat pumps for domestic hot water [Number, -], Biomass boilers [Power of boilers, kW],
Connection to wood biomass district heating [Power of connection, kW]
Figure 26: Number of incentives disbursed Total RES measures
We are able to reach conclusions on the energy quality of renovations of buildings in the service sector on the
basis of experiences gleaned from the allocation of grants for the energy renovation of buildings from the
Cohesion Fund in the 2007–2013 period. In that period the ministry published the following tenders:
the energy renovation of buildings of legal entities of public law in the field of healthcare founded by
the Republic of Slovenia and under the responsibility of the Ministry of Health;
public tender for the energy renovation of buildings occupied by public schooling and education
institutes founded by the Republic of Slovenia and under the responsibility of the Ministry of Education
and Sport;
the energy renovation of retirement homes founded by the Republic of Slovenia, under the
responsibility of the Ministry of Labour, Family and Social Affairs and engaged in social services
activities;
public tender for the co-financing of operations for the energy renovation of buildings owned by local
communities (LS1);
public tender for the co-financing of operations for the energy renovation of primary schools, nursery
schools, health centres and libraries owned by local communities (LS2);
public tender for the allocation of grants for the energy renovation of public institutes in the area of
higher education and science.
The ministry signed 374 contracts (Figure 27, Figure 28) for which EU funds amounting to EUR 155 million
were disbursed (Slovenia’s co-financing contribution for these projects was EUR 20 million). The total floor
area of renovated buildings amounts to 1 262 790 m2, with energy renovation under public tender LS2
accounting for most of this figure (Figure 28). The highest energy savings were achieved at healthcare
institutions (Figure 28).
Key: Number of contracts signed
Hospitals, Schools, Homes, Municipalities (LS1), Higher education establishments, Municipalities (LS2)
Funds allocated
Contracts signed – EU funds, Contracts signed – national co-financing
mio = millions
Figure 27: Number of contracts signed under individual tenders and the level of funds allocated for these projects
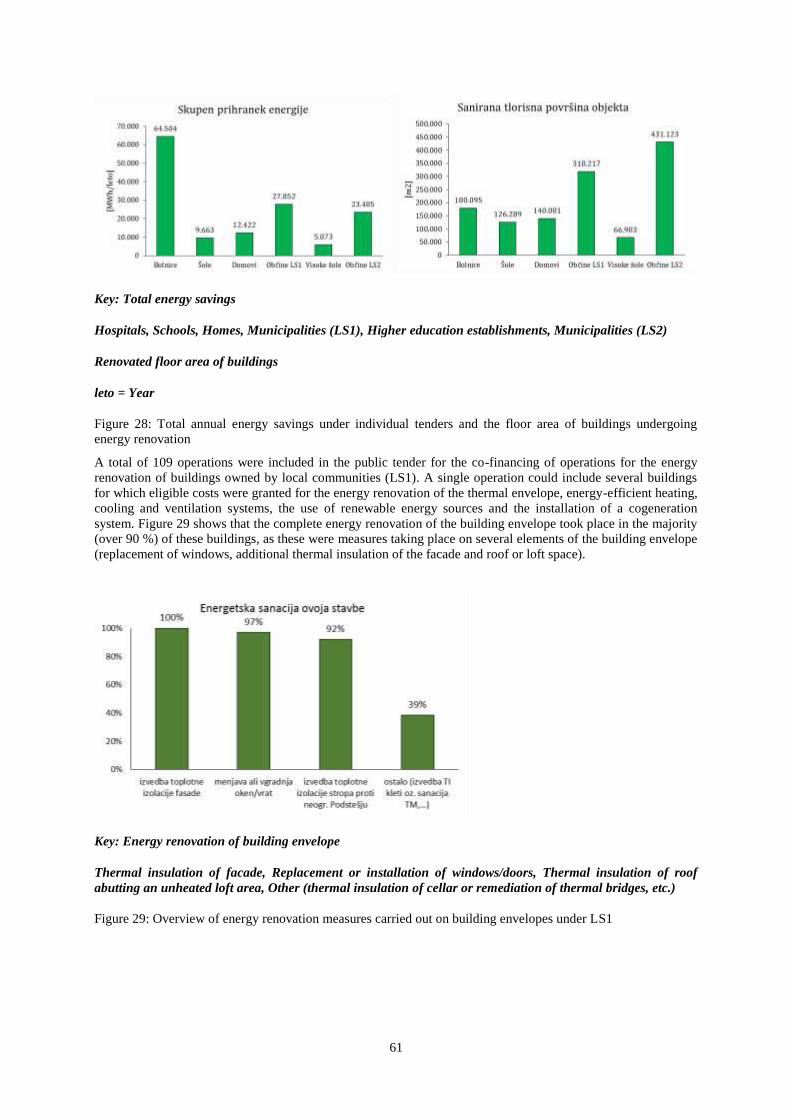
61
Key: Total energy savings
Hospitals, Schools, Homes, Municipalities (LS1), Higher education establishments, Municipalities (LS2)
Renovated floor area of buildings
leto = Year
Figure 28: Total annual energy savings under individual tenders and the floor area of buildings undergoing
energy renovation
A total of 109 operations were included in the public tender for the co-financing of operations for the energy
renovation of buildings owned by local communities (LS1). A single operation could include several buildings
for which eligible costs were granted for the energy renovation of the thermal envelope, energy-efficient heating,
cooling and ventilation systems, the use of renewable energy sources and the installation of a cogeneration
system. Figure 29 shows that the complete energy renovation of the building envelope took place in the majority
(over 90 %) of these buildings, as these were measures taking place on several elements of the building envelope
(replacement of windows, additional thermal insulation of the facade and roof or loft space).
Key: Energy renovation of building envelope
Thermal insulation of facade, Replacement or installation of windows/doors, Thermal insulation of roof
abutting an unheated loft area, Other (thermal insulation of cellar or remediation of thermal bridges, etc.)
Figure 29: Overview of energy renovation measures carried out on building envelopes under LS1
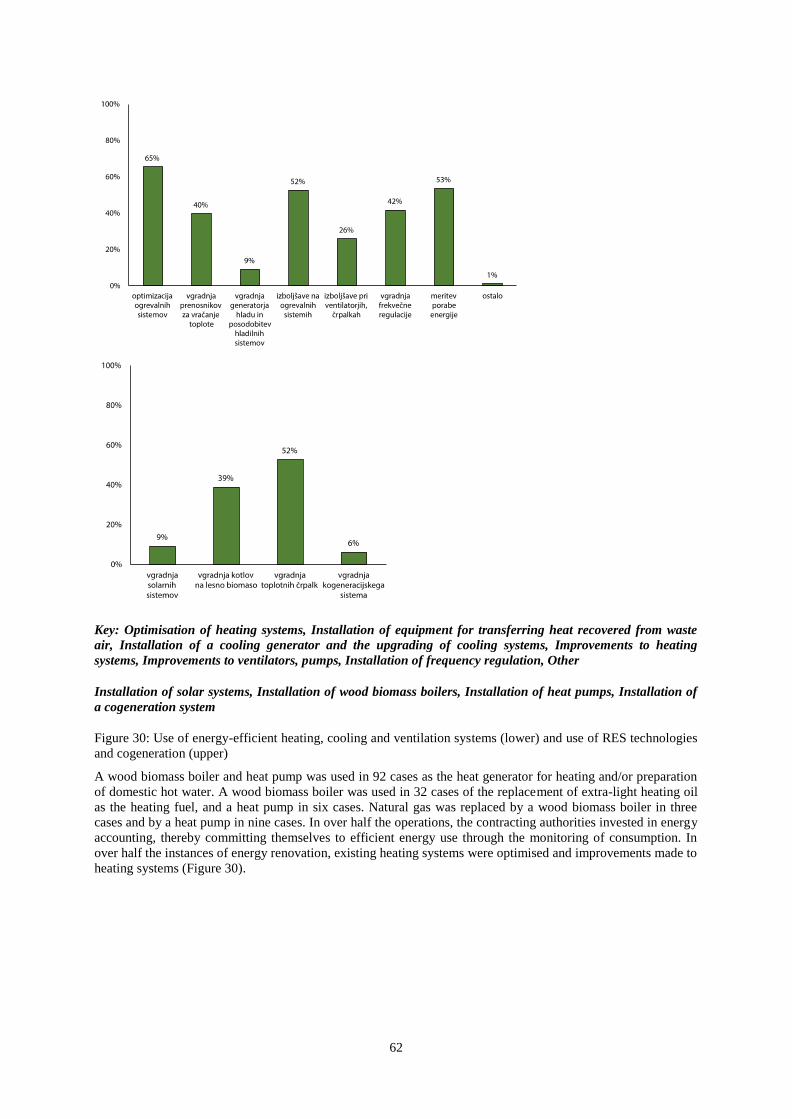
62
Key: Optimisation of heating systems, Installation of equipment for transferring heat recovered from waste
air, Installation of a cooling generator and the upgrading of cooling systems, Improvements to heating
systems, Improvements to ventilators, pumps, Installation of frequency regulation, Other
Installation of solar systems, Installation of wood biomass boilers, Installation of heat pumps, Installation of
a cogeneration system
Figure 30: Use of energy-efficient heating, cooling and ventilation systems (lower) and use of RES technologies
and cogeneration (upper)
A wood biomass boiler and heat pump was used in 92 cases as the heat generator for heating and/or preparation
of domestic hot water. A wood biomass boiler was used in 32 cases of the replacement of extra-light heating oil
as the heating fuel, and a heat pump in six cases. Natural gas was replaced by a wood biomass boiler in three
cases and by a heat pump in nine cases. In over half the operations, the contracting authorities invested in energy
accounting, thereby committing themselves to efficient energy use through the monitoring of consumption. In
over half the instances of energy renovation, existing heating systems were optimised and improvements made to
heating systems (Figure 30).
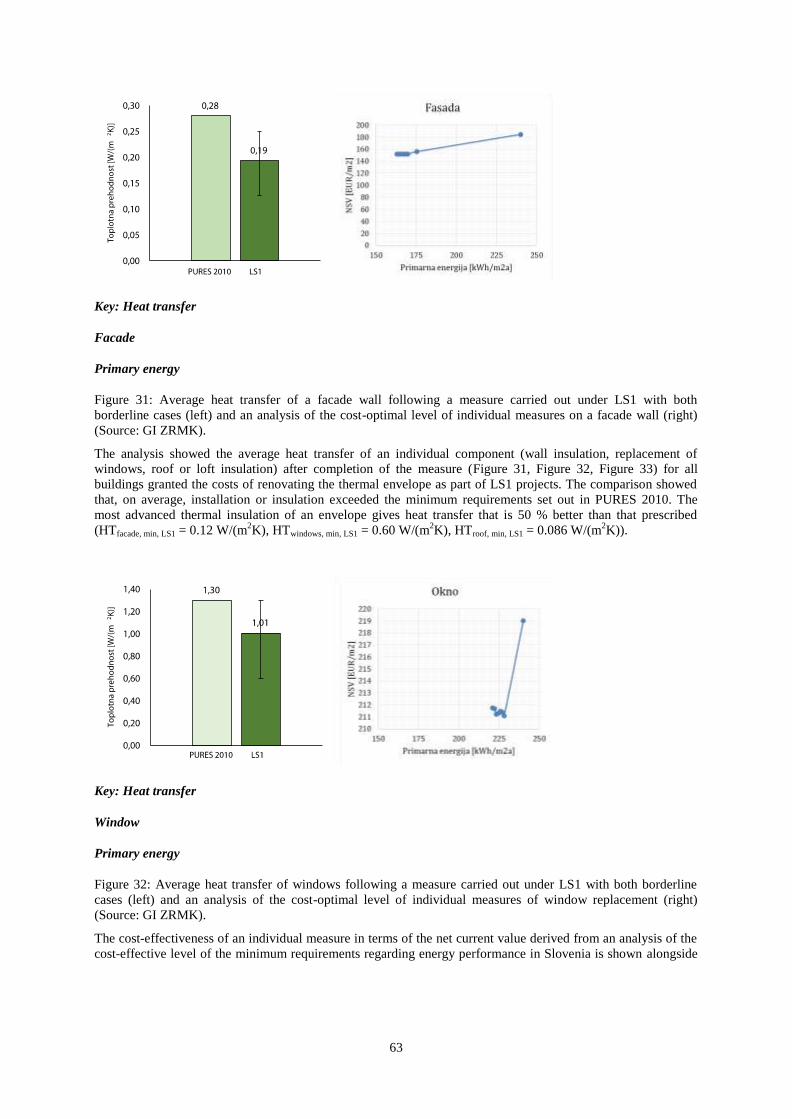
63
Key: Heat transfer
Facade
Primary energy
Figure 31: Average heat transfer of a facade wall following a measure carried out under LS1 with both
borderline cases (left) and an analysis of the cost-optimal level of individual measures on a facade wall (right)
(Source: GI ZRMK).
The analysis showed the average heat transfer of an individual component (wall insulation, replacement of
windows, roof or loft insulation) after completion of the measure (Figure 31, Figure 32, Figure 33) for all
buildings granted the costs of renovating the thermal envelope as part of LS1 projects. The comparison showed
that, on average, installation or insulation exceeded the minimum requirements set out in PURES 2010. The
most advanced thermal insulation of an envelope gives heat transfer that is 50 % better than that prescribed
(HTfacade, min, LS1 = 0.12 W/(m2K), HTwindows, min, LS1 = 0.60 W/(m
2K), HTroof, min, LS1 = 0.086 W/(m
2K)).
Key: Heat transfer
Window
Primary energy
Figure 32: Average heat transfer of windows following a measure carried out under LS1 with both borderline
cases (left) and an analysis of the cost-optimal level of individual measures of window replacement (right)
(Source: GI ZRMK).
The cost-effectiveness of an individual measure in terms of the net current value derived from an analysis of the
cost-effective level of the minimum requirements regarding energy performance in Slovenia is shown alongside
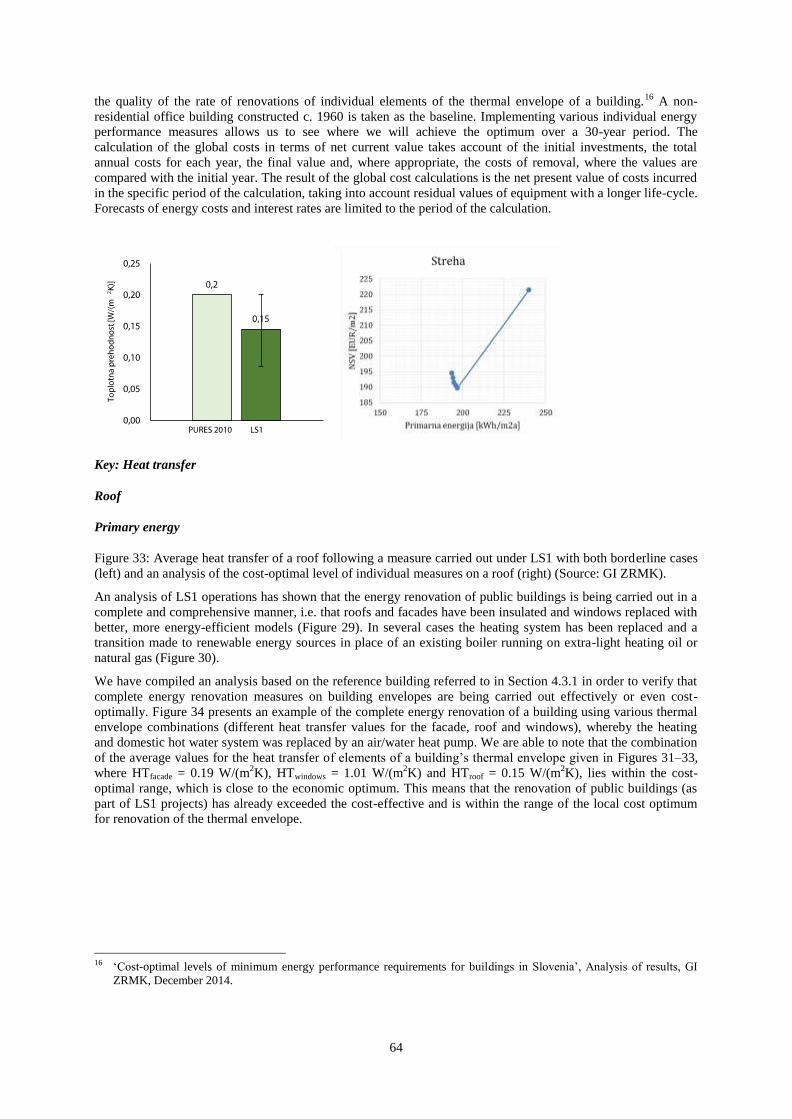
64
the quality of the rate of renovations of individual elements of the thermal envelope of a building.16
A non-
residential office building constructed c. 1960 is taken as the baseline. Implementing various individual energy
performance measures allows us to see where we will achieve the optimum over a 30-year period. The
calculation of the global costs in terms of net current value takes account of the initial investments, the total
annual costs for each year, the final value and, where appropriate, the costs of removal, where the values are
compared with the initial year. The result of the global cost calculations is the net present value of costs incurred
in the specific period of the calculation, taking into account residual values of equipment with a longer life-cycle.
Forecasts of energy costs and interest rates are limited to the period of the calculation.
Key: Heat transfer
Roof
Primary energy
Figure 33: Average heat transfer of a roof following a measure carried out under LS1 with both borderline cases
(left) and an analysis of the cost-optimal level of individual measures on a roof (right) (Source: GI ZRMK).
An analysis of LS1 operations has shown that the energy renovation of public buildings is being carried out in a
complete and comprehensive manner, i.e. that roofs and facades have been insulated and windows replaced with
better, more energy-efficient models (Figure 29). In several cases the heating system has been replaced and a
transition made to renewable energy sources in place of an existing boiler running on extra-light heating oil or
natural gas (Figure 30).
We have compiled an analysis based on the reference building referred to in Section 4.3.1 in order to verify that
complete energy renovation measures on building envelopes are being carried out effectively or even cost-
optimally. Figure 34 presents an example of the complete energy renovation of a building using various thermal
envelope combinations (different heat transfer values for the facade, roof and windows), whereby the heating
and domestic hot water system was replaced by an air/water heat pump. We are able to note that the combination
of the average values for the heat transfer of elements of a building’s thermal envelope given in Figures 31–33,
where HTfacade = 0.19 W/(m2K), HTwindows = 1.01 W/(m
2K) and HTroof = 0.15 W/(m
2K), lies within the cost-
optimal range, which is close to the economic optimum. This means that the renovation of public buildings (as
part of LS1 projects) has already exceeded the cost-effective and is within the range of the local cost optimum
for renovation of the thermal envelope.
16 ‘Cost-optimal levels of minimum energy performance requirements for buildings in Slovenia’, Analysis of results, GI
ZRMK, December 2014.
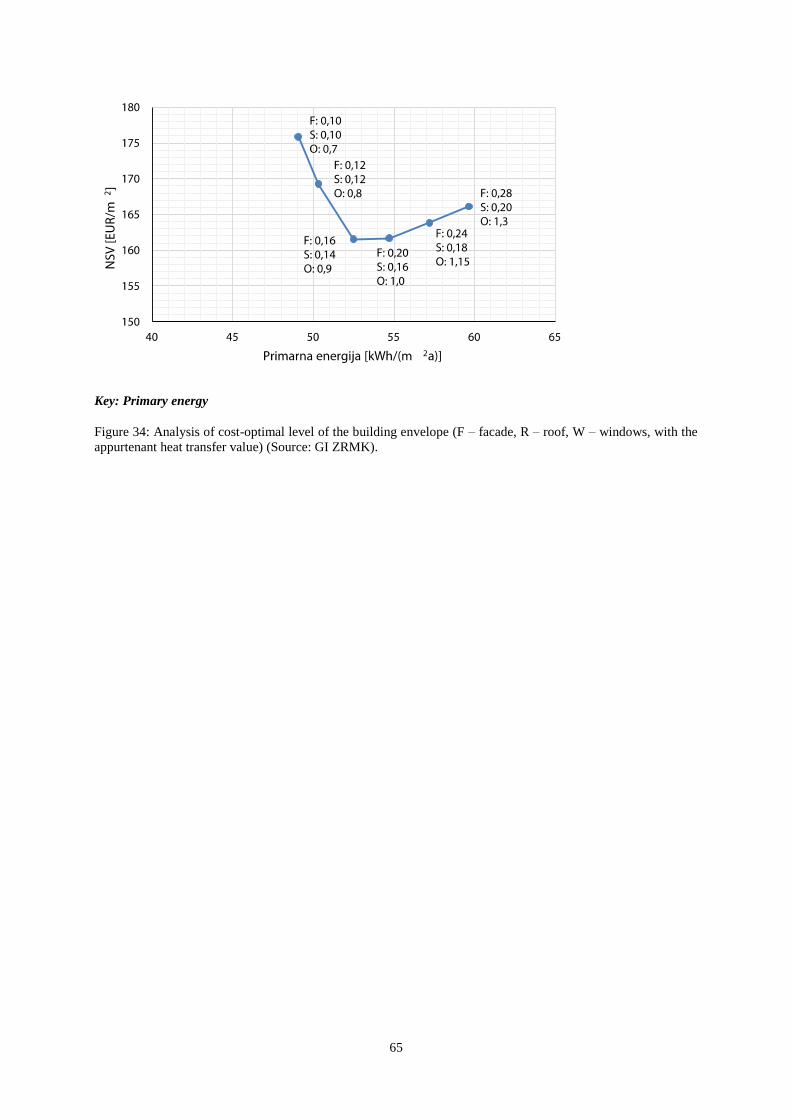
65
Key: Primary energy
Figure 34: Analysis of cost-optimal level of the building envelope (F – facade, R – roof, W – windows, with the
appurtenant heat transfer value) (Source: GI ZRMK).
66
5 Policies and measures to promote energy renovation
5.1 Framework of the Strategy – legal and strategic foundations for the formulation of
targets Slovenia has undertaken to realise the objectives of sustainable growth set out in numerous documents and
decision-making processes at the EU level, particularly the Europe 2020 strategy. ‘Europe 2020:17
A Strategy for
Smart, Sustainable and Inclusive Growth’ sets out a vision of Europe’s social market economy for the 21st
century and contains three mutually reinforcing priorities:
Smart growth: developing an economy based on knowledge and innovation.
Sustainable growth: promoting a more competitive, resource-efficient, greener low-carbon economy.
Inclusive growth: fostering a high-employment economy that strengthens social and territorial
cohesion.
The Strategy supports a move to an economy that uses all resources efficiently, separates economic growth
completely from the use of resources and energy, and from their environmental impacts, reduces GHG
emissions, improves competitiveness through efficiency and innovation, and promotes greater security of energy
supply. Slovenia will realise the vision set out in the Europe 2020 strategy in its national policies. Sustainable
energy use has been classified as one of the priority axes of the Operational Programme for the Implementation
of European Cohesion Policy 2014–2020 (OP EKP 2014–2020), with most of the funds under this programme
going to the building sector.
Climate and energy policy and targets for the post-2020 period are still being formulated at the EU level.
Slovenia actively supports the common vision of preventing the adverse effects of climate change and keeping
the rise in global temperatures below 2 °C, and its implementation through EU-wide climate-change policy, the
agreements reached at the UNFCCC (from Copenhagen and Cancun), and national climate-change policies and
measures. A political decision to reduce GHG emissions by 80–95 % by 2050 relative to 1990 was taken by the
European Council back in March 2010. According to the findings of the Intergovernmental Panel on Climate
Change, this is the reduction required in developed countries if the target is to be reached. Discussions on EU-
level sectoral targets up to 2050 are taking place as part of the EU plan for a competitive low-carbon economy
by 2050.18
The EU Council resolutions of 23–24 October 2014 define the intermediate medium-term climate-
change and energy targets of the EU as a whole up to 2030. The EU-level intermediate targets for the period up
to 2040 and the national targets up to 2030 are still in the process of being formulated. The following political
decisions (EU Council resolutions) have been reached for 2030. It is envisaged that they will be transferred into
EU law in 2015:
a 40 % reduction in total GHG emissions at the EU level relative to 1990. Member States’
contributions to achieving this target will be legally binding. They will be determined in a balanced way
in terms of justice and solidarity (based on relative per-capita GDP). All Member States will contribute
to jointly reducing the EU’s emissions up to 2030. Their targets will range from 0 to -40 % relative to
2005;
the share of energy from renewable energy sources to be consumed in the EU in 2030 should be at
least 27 %. This target will be binding at the EU level;
an EU-level indicative target of at least 27 % has been set on the basis of the applicable criteria to
improve energy efficiency in 2030 in comparison with the forecast consumption of energy in the future.
Member States shall determine their own national targets.
Guidelines on the EU sectoral targets up to 2050 and the necessary intermediate targets have been defined as part
of the EU plan for a competitive low-carbon economy by 2050.19
It has been determined that GHG emissions
must be reduced in the household and service sectors (in relation to buildings) by between 88 and 91
% of emissions relative to 1990.
The key document defining the premises of Slovenia’s energy policy is the Energy Act (EZ-1).20
Both the
Strategy and EZ-1 also include the drafting of other strategic documents: Analysis of the Financing Models for
17 COM(2010) 2020 final. 18 Roadmap for Moving to a Competitive Low-Carbon Economy in 2050, COM (2011) 112. 19 Roadmap for Moving to a Competitive Low-Carbon Economy in 2050, COM (2011) 112.

67
the Renovation of Public Buildings, with an Emphasis on Mobilising Private Sector Investments, the Criteria for
Allocating Grants and Repayable Funding for the Inclusion of Private Capital, Expert Foundations and Technical
Guidelines for the Energy Renovation of Public Buildings, supplements to the Guidelines for the Implementation
of Energy Performance Contracting in the Public Sector, Manual of Eligible Costs in the Energy Renovation of
Buildings, and Technical Guidelines for the Energy Renovation of Cultural Heritage Buildings.
The above strategic documents will be compiled by the ministry responsible for energy. The ministry responsible
for energy will also, on the basis of the strategic documents and, it is expected, by the end of 2015, compile and
make public the instructions for the work of intermediate and implementing bodies. The bases of Slovenia’s
sustainable energy policy are determined by the targets that Slovenia has adopted and to which it is committed
by its international obligations, and by a number of operational programmes aimed at implementing the adopted
international obligations, in addition to the EZ-1.
Slovenia has adopted several international obligations for the period leading up to 2020. The most important of
these in relation to buildings are:
Directive 2012/27/EU on energy efficiency;21
Directive 2010/31/EU on the energy performance of buildings;22
Directive 2009/28/EC on the promotion of the use of energy from renewable sources;23
Decision No 2009/406/EC on the effort of Member States to reduce their greenhouse gas emissions;24
Revised Gothenburg Protocol to Abate Acidification, Eutrophication and Ground-level Ozone.25
The national targets derived from the above-mentioned documents and to which the building-related measures
will make a significant contribution are:26
improvements in energy efficiency by 2020;
the mandatory percentage of buildings owned and occupied by central government that are to undergo
renovation;
obligations regarding nearly zero-energy buildings;
a mandatory 25 % share of RES in gross end-use energy consumption in 2020;
GHG emission targets (GHG emissions must be below the target trajectory in the period leading up to
2020);
air protection targets, the most important of which, for the building sector, are the national targets for
reducing particle emissions.
Implementing programmes The series of implementing plans and plans under preparation and listed above,
which define in more detail the contributions to be made by individual areas to meeting the national targets by
setting the indicative targets27
for sectors or areas are also essential to the formulation of the Strategy. The
implementing programmes of importance to the building sector are:
Energy Efficiency Action Plan 2014–2020 (AN URE 2014−2020);
Renewable Energy Action Plan 2010−2020 (AN OVE 2010−2020), revision under preparation;
Operational Programme for the Implementation of European Cohesion Policy 2014–2020 (OP EKP
2014–2020);28
20 Energy Act (UL RS, No 17/14). 21 Directive 2012/27/EU of the European Parliament and of the Council of 25 October 2012 on energy efficiency, amending
Directives 2009/125/EC and 2010/30/EU and repealing Directives 2004/8/EC and 2006/32/EC. 22 Directive 2010/31/EU of the European Parliament and of the Council of 19 May 2010 on the energy performance of
buildings (recast). 23 Directive 2009/28/EC of the European Parliament and of the Council of 23 April 2009 on the promotion of the use of
energy from renewable sources and amending and subsequently repealing Directives 2001/77/EC and 2003/30/EC. 24 Decision No 406/2009/EC of the European Parliament and of the Council of 23 April 2009 on the effort of Member
States to reduce their greenhouse gas emissions to meet the Community’s greenhouse gas emission reduction
commitments up to 2020. 25 www.unece.org/env/lrtap/multi_h1.html 26 These targets are presented in more detail in Annex B and summarised in Table 2, where the international acts that lay
down these obligations are specified and a detailed definition of these targets given: target years, target values and the
targets defined in the national implementing documents. 27 The indicative targets from the operational programmes and action plans relevant to the building sector are presented in
more detail in Annex B and summarised in Table 3. 28 Government of the Republic of Slovenia, November 2014.
68
Operational Programme for Reducing Greenhouse Gas Emissions by 202029
(OP TGP 202030
);
Operational Programme for the Protection of Ambient Air Against Pollution Caused by PM10 (OP
PM10) and ordinances on air-quality plans.
The climate and energy package targets (energy efficiency, renewable energy sources and greenhouse gases) are
not presented separately and in detail here. The specific national targets relating solely to the building sector and
described in the sub-sections of Annex A (‘Targets for nearly zero-energy buildings’, ‘Obligation for buildings
owned and occupied by central government’) are also set in two energy efficiency directives (2010/31/EU and
2012/27/EU). Since they are less well-known, the air-protection targets are set out in a separate section (‘Air
protection’).
5.2 Vision, targets and timetable of the Long-Term Strategy for Mobilising
Investments in the Renovation of Buildings
The Long-Term Strategy for Mobilising Investments in the Renovation of Buildings incorporates and
supplements the vision set out for the sector up to 2050, the indicative targets up to 2030 and the operational
targets up to 2020 of importance for the building sector and compliant with the guidelines contained in the
decisions already taken at national and EU level.
Vision up to 2050
2050 This vision up to 2050 is for almost carbon-neutral energy use in the building sector, to be achieved by
making considerable improvements in energy performance and increasing the use of renewable energy
sources in buildings. This will, in turn, significantly reduce emissions of other harmful substances into
the atmosphere.
A further objective is for Slovenia to become recognised for its activities in the field of sustainable
construction.
The vision refers to an increase in the direct and indirect use of renewable energy sources in buildings, including
via efficient district heating systems.
Indicative and operational targets of the Strategy
The indicative targets for 2030 and the operational targets for 2020 have been put forward on the basis of the
targets set in documents that have already been adopted and documents under preparation. An assessment will
also be made in the second phase of the project of how the building sector is to contribute to achieving the
legally binding national targets in accordance with the obligations and the decisions already taken.
2030 The indicative targets that provide the framework for the Long-Term Strategy for Mobilising
Investments in the Energy Renovation of Buildings up to 2030 are:
to reduce end-use energy consumption in buildings by 30 % relative to 2005;
to have at least two-thirds of energy in buildings produced by renewable energy sources;31
to reduce GHG emissions in buildings by at least 70 % relative to 2005;
to reduce particle emissions from energy use in buildings by 50 % in the 2015–2030 period.
29 Government of the Republic of Slovenia, November 2014. 30 Report on the Assessment of the Monitoring of the Implementation and Effectiveness of OP TGP 2020 Measures, final
project report, IJS-DP-11681, 2014. 31 Share of use of RES in end-use energy excluding electricity and district heating.
69
Anticipated results of the programme:
the renovation of 9 million m2 of residential buildings and 3.5 million m
2 of buildings in the
service sector to the nearly zero-energy building standard (AN sNES);
use of energy for heating and domestic hot water at a level of less than 27 PJ in residential
buildings and less than 7.5 PJ in the public and service sectors.
2020 The operational targets set out in the Long-Term Strategy for Mobilising Investments in the Energy
Renovation of Buildings up to 2020 are as follows:
a reduction of at least 16 % in end-use energy consumption in buildings relative to 2005;
at least 60 % of energy use in buildings produced from RES;32
a 58 % reduction in GHG emissions relative to 2005;
a 20 % reduction in particle emissions from energy use in buildings in the 2015–2020 period;
the renovation of 3 % of the total floor area of buildings owned and occupied by central
government that do not meet the minimum energy performance requirements from 1 January
each year.32
Anticipated results of the programme:
the renovation of 2.9 million m2 of residential buildings by 2020 and 333 000 m
2 of buildings
in the service sector by 2018 to nearly zero-energy building standard (AN sNES);
use of energy for heating and domestic hot water at a level of less than 34.5 PJ in residential
buildings and less than 9 PJ in the public and service sectors;
the renovation of 1.8 m2 of floor area in buildings in the wider public sector between 2014 and
2023 (OP EKP 2014–2020);
an improvement in the ratio between public funds invested and investment incentives in the
public sector to 1: 3 (OP TGP 2020);
primary energy savings of 1.6 TWh/year in 2020 in existing buildings;
the implementation of five pilot/demonstration projects for the energy renovation of different
building types.
32 The target value will change from year to year; therefore, it is not expressed in m2
of the floor area of renovated
buildings. More detailed monitoring of the achievement of the target using this method is also envisaged as part of the
monitoring of the implementation of the DSEPS.
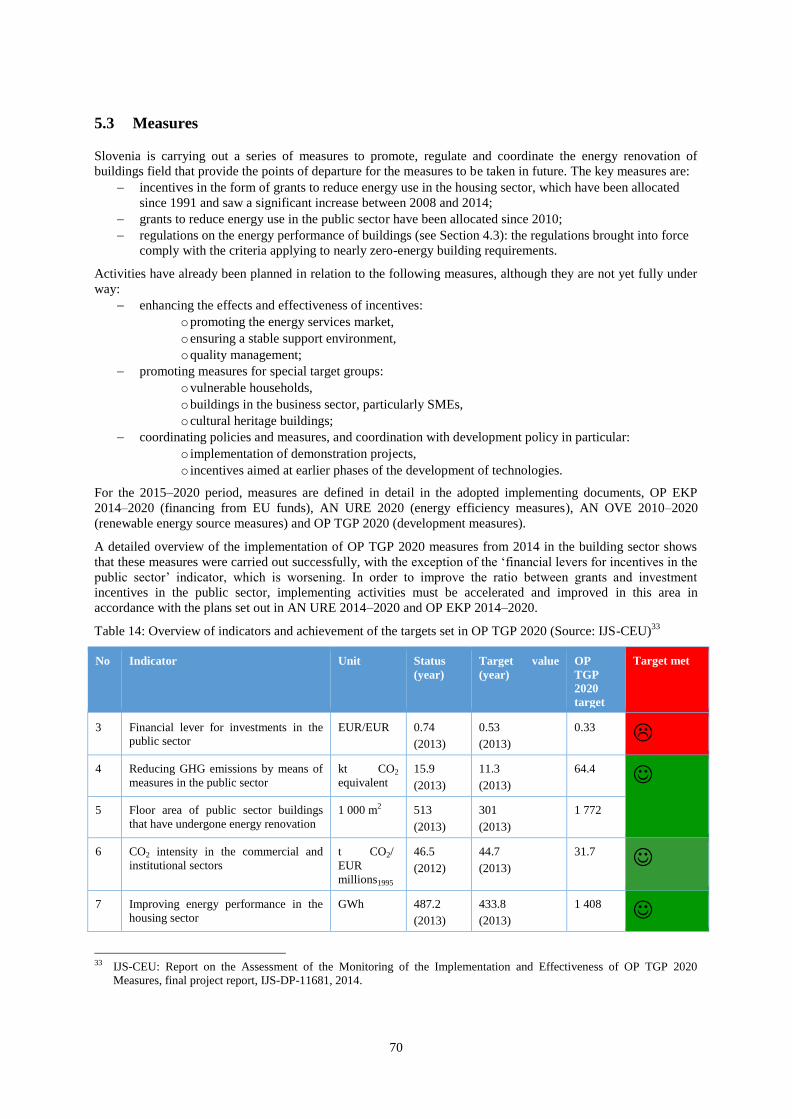
70
5.3 Measures Slovenia is carrying out a series of measures to promote, regulate and coordinate the energy renovation of
buildings field that provide the points of departure for the measures to be taken in future. The key measures are:
incentives in the form of grants to reduce energy use in the housing sector, which have been allocated
since 1991 and saw a significant increase between 2008 and 2014;
grants to reduce energy use in the public sector have been allocated since 2010;
regulations on the energy performance of buildings (see Section 4.3): the regulations brought into force
comply with the criteria applying to nearly zero-energy building requirements.
Activities have already been planned in relation to the following measures, although they are not yet fully under
way:
enhancing the effects and effectiveness of incentives:
o promoting the energy services market,
o ensuring a stable support environment,
o quality management;
promoting measures for special target groups:
o vulnerable households,
o buildings in the business sector, particularly SMEs,
o cultural heritage buildings;
coordinating policies and measures, and coordination with development policy in particular:
o implementation of demonstration projects,
o incentives aimed at earlier phases of the development of technologies.
For the 2015–2020 period, measures are defined in detail in the adopted implementing documents, OP EKP
2014–2020 (financing from EU funds), AN URE 2020 (energy efficiency measures), AN OVE 2010–2020
(renewable energy source measures) and OP TGP 2020 (development measures).
A detailed overview of the implementation of OP TGP 2020 measures from 2014 in the building sector shows
that these measures were carried out successfully, with the exception of the ‘financial levers for incentives in the
public sector’ indicator, which is worsening. In order to improve the ratio between grants and investment
incentives in the public sector, implementing activities must be accelerated and improved in this area in
accordance with the plans set out in AN URE 2014–2020 and OP EKP 2014–2020.
Table 14: Overview of indicators and achievement of the targets set in OP TGP 2020 (Source: IJS-CEU)33
No Indicator Unit Status
(year)
Target value
(year)
OP
TGP
2020
target
Target met
3 Financial lever for investments in the
public sector
EUR/EUR 0.74
(2013)
0.53
(2013)
0.33
4 Reducing GHG emissions by means of
measures in the public sector
kt CO2
equivalent
15.9
(2013)
11.3
(2013)
64.4
5 Floor area of public sector buildings
that have undergone energy renovation
1 000 m2 513
(2013)
301
(2013)
1 772
6 CO2 intensity in the commercial and
institutional sectors
t CO2/
EUR
millions1995
46.5
(2012)
44.7
(2013)
31.7
7 Improving energy performance in the
housing sector
GWh 487.2
(2013)
433.8
(2013)
1 408
33 IJS-CEU: Report on the Assessment of the Monitoring of the Implementation and Effectiveness of OP TGP 2020
Measures, final project report, IJS-DP-11681, 2014.
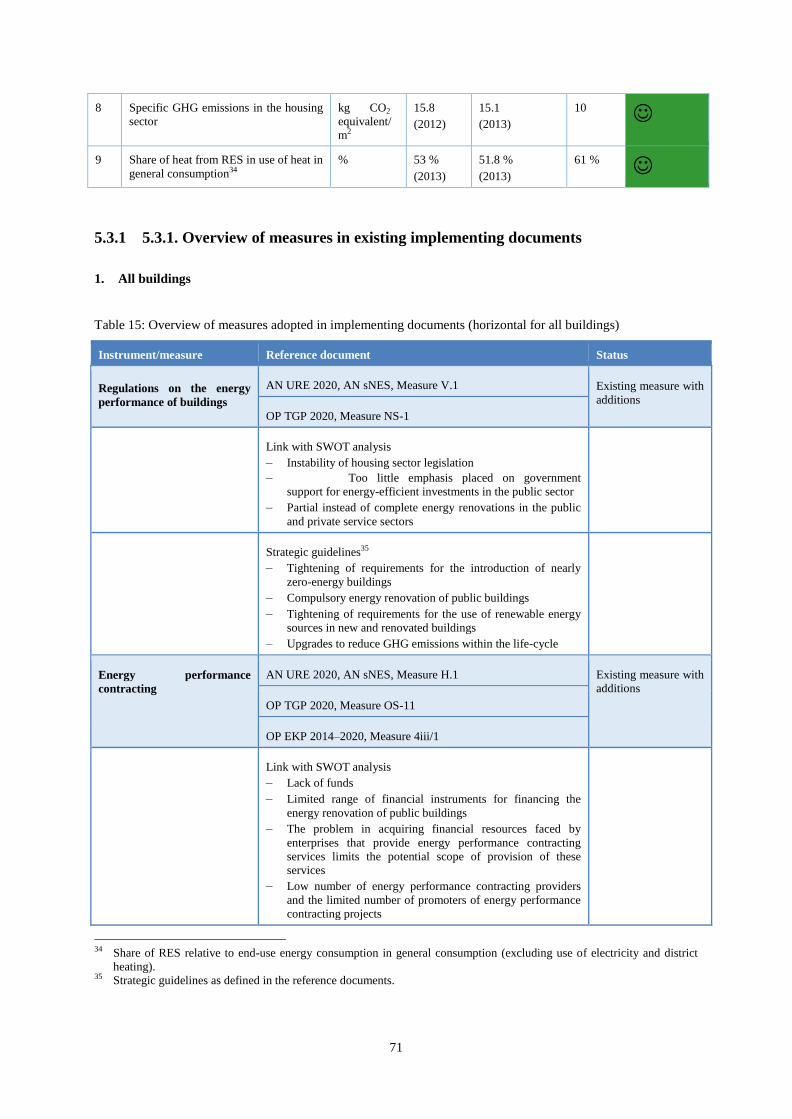
71
8 Specific GHG emissions in the housing
sector
kg CO2
equivalent/
m2
15.8
(2012)
15.1
(2013)
10
9 Share of heat from RES in use of heat in
general consumption34
% 53 %
(2013)
51.8 %
(2013)
61 %
5.3.1 5.3.1. Overview of measures in existing implementing documents
1. All buildings
Table 15: Overview of measures adopted in implementing documents (horizontal for all buildings)
Instrument/measure Reference document Status
Regulations on the energy
performance of buildings
AN URE 2020, AN sNES, Measure V.1 Existing measure with
additions
OP TGP 2020, Measure NS-1
Link with SWOT analysis
– Instability of housing sector legislation
– Too little emphasis placed on government
support for energy-efficient investments in the public sector
– Partial instead of complete energy renovations in the public
and private service sectors
Strategic guidelines35
– Tightening of requirements for the introduction of nearly
zero-energy buildings
– Compulsory energy renovation of public buildings
– Tightening of requirements for the use of renewable energy
sources in new and renovated buildings
– Upgrades to reduce GHG emissions within the life-cycle
Energy performance
contracting
AN URE 2020, AN sNES, Measure H.1 Existing measure with
additions
OP TGP 2020, Measure OS-11
OP EKP 2014–2020, Measure 4iii/1
Link with SWOT analysis
– Lack of funds
– Limited range of financial instruments for financing the
energy renovation of public buildings
– The problem in acquiring financial resources faced by
enterprises that provide energy performance contracting
services limits the potential scope of provision of these
services
– Low number of energy performance contracting providers
and the limited number of promoters of energy performance
contracting projects
34 Share of RES relative to end-use energy consumption in general consumption (excluding use of electricity and district
heating). 35 Strategic guidelines as defined in the reference documents.
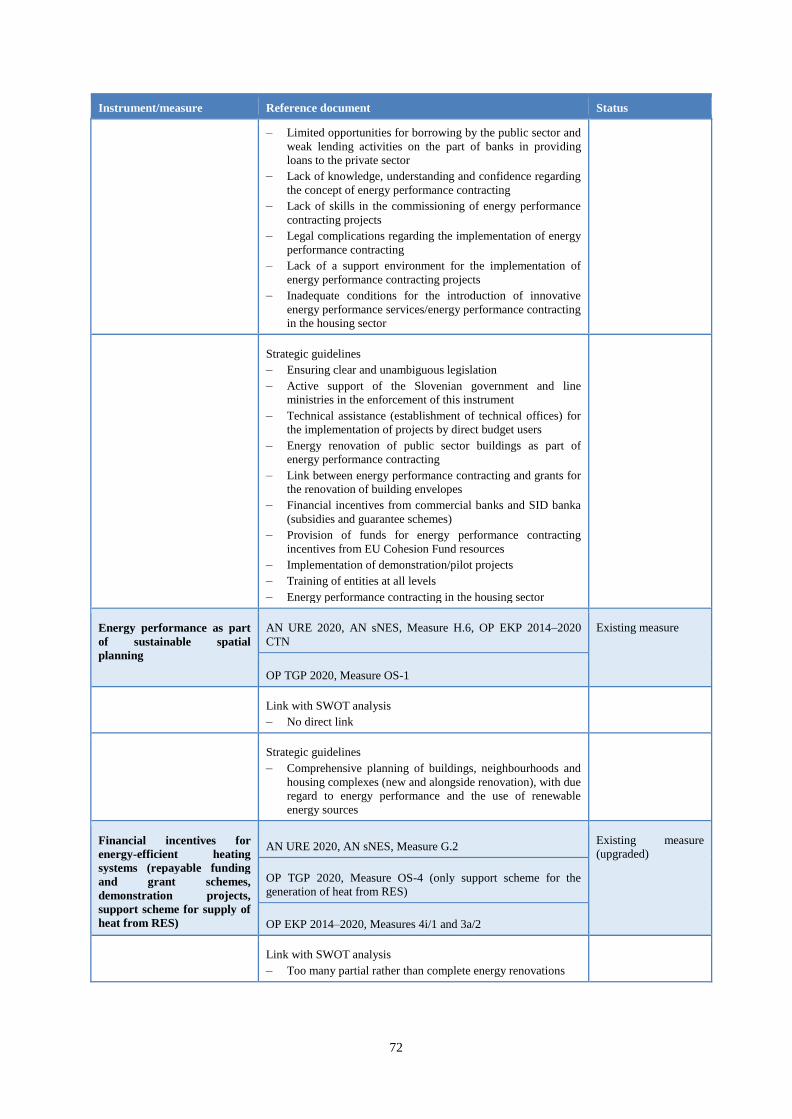
72
Instrument/measure Reference document Status
– Limited opportunities for borrowing by the public sector and
weak lending activities on the part of banks in providing
loans to the private sector
– Lack of knowledge, understanding and confidence regarding
the concept of energy performance contracting
– Lack of skills in the commissioning of energy performance
contracting projects
– Legal complications regarding the implementation of energy
performance contracting
– Lack of a support environment for the implementation of
energy performance contracting projects
– Inadequate conditions for the introduction of innovative
energy performance services/energy performance contracting
in the housing sector
Strategic guidelines
– Ensuring clear and unambiguous legislation
– Active support of the Slovenian government and line
ministries in the enforcement of this instrument
– Technical assistance (establishment of technical offices) for
the implementation of projects by direct budget users
– Energy renovation of public sector buildings as part of
energy performance contracting
– Link between energy performance contracting and grants for
the renovation of building envelopes
– Financial incentives from commercial banks and SID banka
(subsidies and guarantee schemes)
– Provision of funds for energy performance contracting
incentives from EU Cohesion Fund resources
– Implementation of demonstration/pilot projects
– Training of entities at all levels
– Energy performance contracting in the housing sector
Energy performance as part
of sustainable spatial
planning
AN URE 2020, AN sNES, Measure H.6, OP EKP 2014–2020
CTN
Existing measure
OP TGP 2020, Measure OS-1
Link with SWOT analysis
– No direct link
Strategic guidelines
– Comprehensive planning of buildings, neighbourhoods and
housing complexes (new and alongside renovation), with due
regard to energy performance and the use of renewable
energy sources
Financial incentives for
energy-efficient heating
systems (repayable funding
and grant schemes,
demonstration projects,
support scheme for supply of
heat from RES)
AN URE 2020, AN sNES, Measure G.2 Existing measure
(upgraded)
OP TGP 2020, Measure OS-4 (only support scheme for the
generation of heat from RES)
OP EKP 2014–2020, Measures 4i/1 and 3a/2
Link with SWOT analysis
– Too many partial rather than complete energy renovations
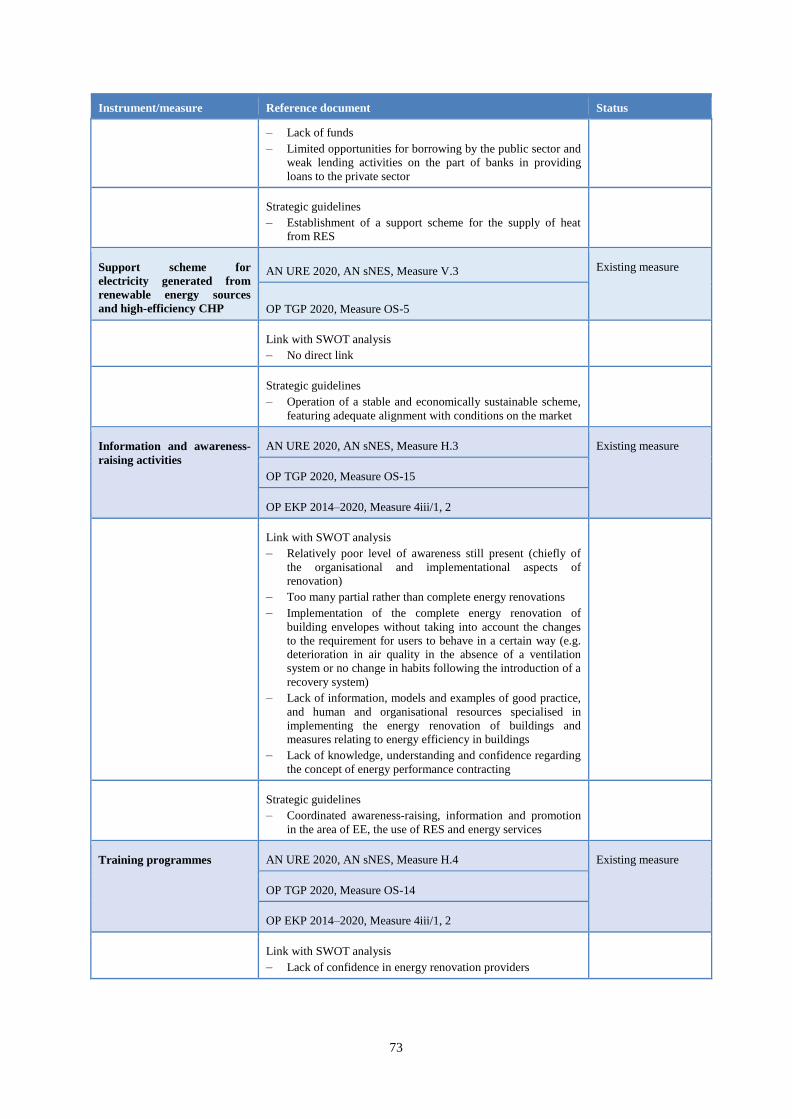
73
Instrument/measure Reference document Status
– Lack of funds
– Limited opportunities for borrowing by the public sector and
weak lending activities on the part of banks in providing
loans to the private sector
Strategic guidelines
– Establishment of a support scheme for the supply of heat
from RES
Support scheme for
electricity generated from
renewable energy sources
and high-efficiency CHP
AN URE 2020, AN sNES, Measure V.3 Existing measure
OP TGP 2020, Measure OS-5
Link with SWOT analysis
– No direct link
Strategic guidelines
– Operation of a stable and economically sustainable scheme,
featuring adequate alignment with conditions on the market
Information and awareness-
raising activities
AN URE 2020, AN sNES, Measure H.3 Existing measure
OP TGP 2020, Measure OS-15
OP EKP 2014–2020, Measure 4iii/1, 2
Link with SWOT analysis
– Relatively poor level of awareness still present (chiefly of
the organisational and implementational aspects of
renovation)
– Too many partial rather than complete energy renovations
– Implementation of the complete energy renovation of
building envelopes without taking into account the changes
to the requirement for users to behave in a certain way (e.g.
deterioration in air quality in the absence of a ventilation
system or no change in habits following the introduction of a
recovery system)
– Lack of information, models and examples of good practice,
and human and organisational resources specialised in
implementing the energy renovation of buildings and
measures relating to energy efficiency in buildings
– Lack of knowledge, understanding and confidence regarding
the concept of energy performance contracting
Strategic guidelines
– Coordinated awareness-raising, information and promotion
in the area of EE, the use of RES and energy services
Training programmes AN URE 2020, AN sNES, Measure H.4 Existing measure
OP TGP 2020, Measure OS-14
OP EKP 2014–2020, Measure 4iii/1, 2
Link with SWOT analysis
– Lack of confidence in energy renovation providers

74
Instrument/measure Reference document Status
– Inadequate training of energy renovation providers, planners
and works supervisors
– Lack of information, human and organisational resources
specialised in implementing the energy renovation of
buildings and measures relating to energy efficiency in
buildings
– Lack of skills in the commissioning of energy performance
contracting projects
– Low number of energy performance contracting providers
and the limited number of promoters of energy performance
contracting projects
Strategic guidelines
– Informal and formal education and training of energy
renovation providers
– Training of providers, project designers and supervisors of
nearly zero-energy renovation and new construction
– Training of entities at all levels of energy performance
contracting projects, particularly central government
(providing a role model for the rest of the public sector and
to the private sector)
Support scheme for the
renovation of built cultural
heritage and other special
building groups
AN URE 2020, Measure J.6 (AN sNES, buildings, new Measure-
1)
Measure not yet
implemented
OP TGP 2020, Measure NS-6
OP EKP 2014–2020, Measure 4iii/1
Link with SWOT analysis
– High proportion of protected buildings that require special
treatment, absence of guidelines
Strategic guidelines:
– Development of renovation criteria, demonstration projects,
development and introduction of technologies, financial
support scheme
Promoting EE and RES OP TGP 2020, Measure OS-2 Existing measure
Link with SWOT analysis
– Lack of economic motivation to improve the energy
performance of buildings
Strategic guidelines
– Energy performance of buildings as a criterion for possible
reliefs within the new property tax system
Excise duty on heating fuels OP TGP 2020, Measure OS-3 Existing measure
Link with SWOT analysis
– Lack of economic motivation to improve the energy
performance of buildings
Strategic guidelines
– Excise policy that will ensure the competitiveness of
biomass and biofuels over fossil fuels for heating

75
2. Residential buildings
Table 16: Overview of measures adopted in implementing documents for residential buildings
Instrument/measure Reference document Status
Financial incentives for the
energy-efficient renovation
and sustainable construction
of residential buildings
(repayable funding and grant
schemes, demonstration
projects)
AN URE 2020, AN sNES, Measure G.1 Existing measure
(upgraded) OP TGP 2020, Measures OS-7 and NS-2a
OP EKP 2014–2020, Measure 4iii/2
Link with SWOT analysis
– No direct link, e.g. lack of funds
Strategic guidelines
Green loan schemes, grants
– Demonstration projects for the energy renovation of multi-
apartment buildings in the private and public sectors (e.g.
workers’ hostels, apartments provided by housing funds,
etc.) within the context of energy-performance contracting
– Demonstration projects for the complete energy renovation
of multi-apartment buildings under nearly zero-energy
renovation criteria
– Energy renovation of buildings, with the involvement of
housing cooperatives, to be implemented as part of
integrated territorial investments (ITI) in selected urban areas
Aid scheme for energy
renovation for vulnerable
population groups
AN URE 2020, AN sNES, Measure G.3 Existing measure
(upgraded)
OP TGP 2020, Measure OS-6
OP EKP 2014–2020, Measure 4iii/2
Link with SWOT analysis
– Problem of low-income owners
Strategic guidelines
– Investments, advice and measures to change patterns of
behaviour
Compulsory division and
billing of heating costs in
multi-apartment and other
buildings according to actual
consumption
AN URE 2020, AN sNES, Measure G.4 Existing measure
OP TGP 2020, Measure OS-9
Link with SWOT analysis
– No direct link, e.g. a lack of economic motivation to increase
the energy performance of buildings
Strategic guidelines
– Prompt resolution of problems
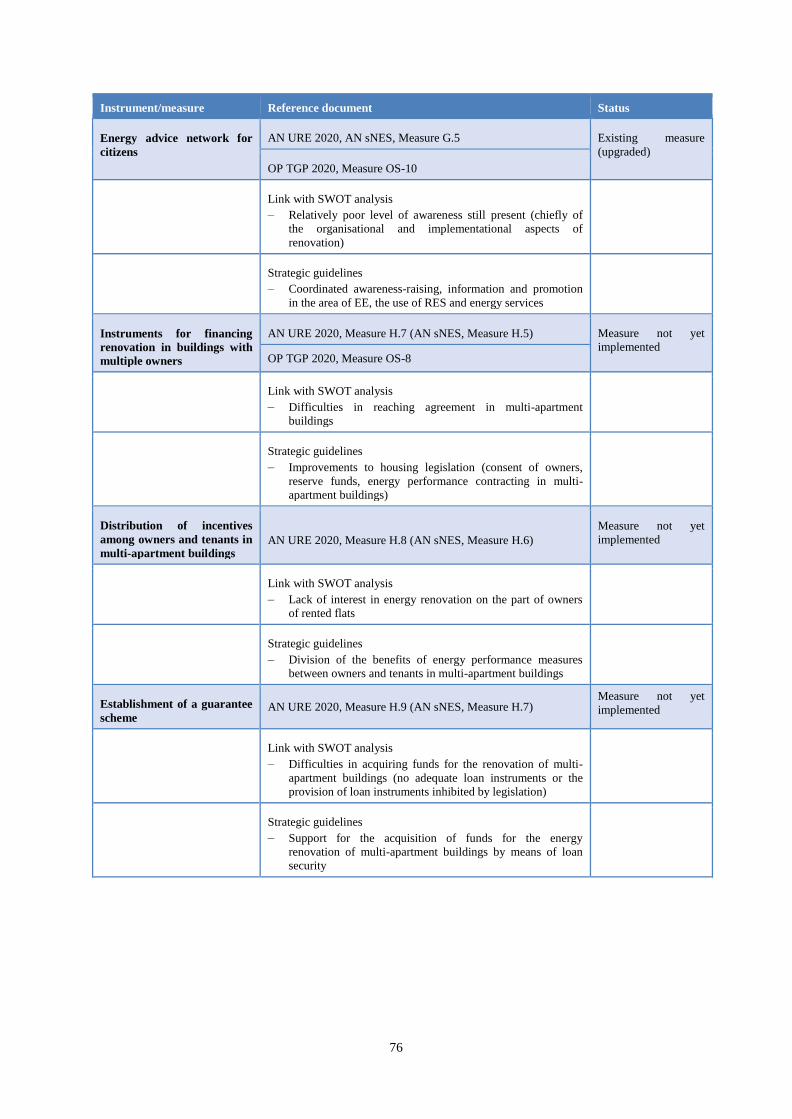
76
Instrument/measure Reference document Status
Energy advice network for
citizens
AN URE 2020, AN sNES, Measure G.5 Existing measure
(upgraded)
OP TGP 2020, Measure OS-10
Link with SWOT analysis
– Relatively poor level of awareness still present (chiefly of
the organisational and implementational aspects of
renovation)
Strategic guidelines
– Coordinated awareness-raising, information and promotion
in the area of EE, the use of RES and energy services
Instruments for financing
renovation in buildings with
multiple owners
AN URE 2020, Measure H.7 (AN sNES, Measure H.5) Measure not yet
implemented OP TGP 2020, Measure OS-8
Link with SWOT analysis
– Difficulties in reaching agreement in multi-apartment
buildings
Strategic guidelines
– Improvements to housing legislation (consent of owners,
reserve funds, energy performance contracting in multi-
apartment buildings)
Distribution of incentives
among owners and tenants in
multi-apartment buildings AN URE 2020, Measure H.8 (AN sNES, Measure H.6)
Measure not yet
implemented
Link with SWOT analysis
– Lack of interest in energy renovation on the part of owners
of rented flats
Strategic guidelines
– Division of the benefits of energy performance measures
between owners and tenants in multi-apartment buildings
Establishment of a guarantee
scheme AN URE 2020, Measure H.9 (AN sNES, Measure H.7)
Measure not yet
implemented
Link with SWOT analysis
– Difficulties in acquiring funds for the renovation of multi-
apartment buildings (no adequate loan instruments or the
provision of loan instruments inhibited by legislation)
Strategic guidelines
– Support for the acquisition of funds for the energy
renovation of multi-apartment buildings by means of loan
security

77
3. Public sector buildings
Table 17: Overview of measures adopted in implementing documents (horizontal public sector buildings)
Instrument/measure Reference document Status
Green public procurement AN URE 2020, AN sNES, Measure J.1 Existing measure
OP TGP 2020, Measure OS-13
Link with SWOT analysis
– No direct link
Strategic guidelines
Inclusion of energy efficiency and the use of
renewable energy sources as criteria in public
procurement processes
Financial incentives for the
energy-efficient renovation
and sustainable construction
of buildings in the public
sector (funding with an
emphasis on central
government buildings,
ensuring project quality,
promoting the optimisation
of operation of energy
systems, demonstration
projects)
AN URE 2020, AN sNES, Measure J.2 Existing measure
(upgraded)
OP TGP 2020, Measures NS-2b, NS-3 and NS-4
OP EKP 2014–2020, Measures 4iii/1 and 6e/1
Link with SWOT analysis
– Lack of funds
– Lack of information, human and organisational resources
specialised in implementing the energy renovation of
buildings and measures relating to energy efficiency in
buildings
– Partial energy renovation instead of complete renovation
Strategic guidelines
– The financing and promotion of complete energy renovation
that includes the use of RES and energy renovation
measures, where possible in combination with energy
performance contracting (by 2020 80 % of all financial
support for the energy renovation of public buildings will be
directed towards promoting energy performance contracting)
– Project office for the energy renovation of buildings as the
coordinating body for project implementation
– Financial incentives for the drafting of investment projects
– Promotion of the implementation of measures to optimise the
operation of energy systems
– Pilot or demonstration energy renovation projects in the
public sector as part of energy performance contracting
– Complete energy renovation pilot or demonstration projects
that take account of the following assumptions, chiefly the
state of readiness of the project, the location (temperature
deficit), the feasibility of the nearly zero-energy building

78
project, the compiling of the project in accordance with the
model of ensuring energy savings, the group of projects,
sustainable construction and the pilot application of
sustainable construction criteria, the accessibility of the
building, achievement of several targets from the OP with
regard to urbanisation, substitute buildings and employment.
Introducing an energy
management system in the
public sector
AN URE 2020, AN sNES, Measure J.3 Existing measure
OP TGP 2020, Measure OS-12
Link with SWOT analysis
– Lack of awareness of the scale of energy use in buildings
(also the consequence of a lack of data on energy supply and
use) and the possibilities for reducing energy use
– Delays in introducing energy management systems in the
public sector
Strategic guidelines
– Introduction of energy accounting and energy management
systems
– Introduction and management of collective energy
accounting at the municipal and national levels
– Upgrading of the methodology for energy audits in such a
way as to promote energy performance contracting
– Implementation of energy audits
MEASURES SPECIFIC TO BUILDINGS OWNED AND OCCUPIED BY CENTRAL GOVERNMENT
Establishment of a project
office
AN URE 2020, AN sNES, Measure J.5 Existing measure
OP EKP 2014–2020, Measure 4iii/1
Link with SWOT analysis
– Lack of information and the fragmentary nature of that
information, lack of human and organisational resources
specialised in managing projects for the energy renovation of
buildings and measures relating to energy efficiency in
buildings, and energy performance contracting projects
– Fragmentary nature of knowledge, experience and skills
Strategic guidelines
– Implementation of projects for the energy renovation of
central government buildings within the context of energy
performance contracting (where justified) or in combination
with grants, including the establishment of a record of
central government buildings for energy renovation purposes

79
4. Overview of future challenges
There are several obstacles that have not yet been addressed:
Housing sector
Lack of confidence in the managers of multi-apartment buildings
Uncertainty regarding future energy prices
Central government buildings
The protracted period of tight fiscal frameworks resulting from unstable macroeconomic
conditions and the deficit and debt reduction procedure, which will make the use of state funds
for investments in the energy performance of buildings more difficult
Reaching agreement and gaining consent for the renovation of buildings not 100 % owned by
the state
High discount rate for public investments (7 %)
Investments often limited to those with a relatively quick return
Uncertainty regarding future energy prices
Public and private service sector
The protracted period of tight fiscal frameworks resulting from unstable macroeconomic
conditions and the deficit and debt reduction procedure, which will make the use of state funds
for investments in the energy performance of buildings more difficult
Lack of interest in energy renovation on the part of tenants
Reaching agreement and gaining consent for the renovation of buildings not 100 % owned by
the state
High discount rate for public investments (7 %)
Poorly developed local energy agencies in some places
Investments in the private sector often limited to those with a relatively quick return
Uncertainty regarding future energy prices
5.4 Summary and upgrading of the strategic guidelines for mobilising investments in
the renovation of buildings
5.4.1 Development measures Mobilising investments in the renovation of buildings has great business importance and will contribute to
greater competitiveness. To allow these measures to foster the creation of new, stable and internationally
competitive green jobs with high added value, special attention must be paid to the following:
stability of the support environment;
quality management;
incentives also directed towards earlier phases of the development of green technologies, products and
services (only in this way will it be possible to exploit the benefits of investments in the renovation of
buildings to the full).
Stability and predictability of the support structure. A support environment that reduces risk and fosters the
gradual development of a range of products and services on the market is a precondition for growth and
development. Steps must be taken to ensure that financial incentives for measures for the energy renovation of
buildings do not introduce additional risks that would hinder the development of the market, e.g. by creating
pronounced fluctuations in demand for products and services. It is therefore particularly important that tenders
for financial incentives or tenders directly allocated (to the public sector) follow these guidelines:
they enable the high-quality design and implementation of projects and pay due regard to the specifics
of those individual target groups for which more time is required for project design and implementation
(sufficiently long deadlines, information provided on time, etc.);

80
they do not create peaks in demand, enable the entire construction season to be used (tenders published
in good time) and direct the volume of investments evenly or via gradual increments across a multi-
annual time period, which is essential if the objective of developing jobs is to be realised;
they indicate the instruments/models to be used, with the tenders for incentives associated with them
being published in good time;
they support the long-term nature of support institutions’ plans.
Quality management. So that investments in the energy renovation of buildings create better macroeconomic
effects and higher added value within the sector, thereby supporting more complex jobs and increasing
development and export opportunities for enterprises, a quality management model must be introduced at all
levels of the design and implementation of energy renovation projects. Key to this is the introduction of
instruments such as: the provision of public procurement quality criteria, the introduction of an energy
management system within the public and private sectors, training programmes, the enforcement of national or
international quality standards for equipment installed (for installers and assemblers as well), the development of
quality standards for services (e.g. energy performance contracting), and the introduction of certification for
providers and processes. The exemplary role of the public sector is crucial in this respect. Activities to enforce
quality standards oriented towards specific areas relating to the energy renovation of buildings (e.g. quality of
the energy renovation of schools through training activities, an analysis of the quality of projects already
completed, demonstration projects, recommendations, etc.) will also be carried out where required.
Demonstration projects in the area of the energy renovation of buildings have been implemented
individually in Slovenia and seldom in support of a more extensive implementation programme. The GEF
project, under which seven investment projects have been carried out with all the necessary support activities, is
a positive example of this practice. It has been continued with a more extensive programme to promote wood
biomass as part of 2007–2013 cohesion policy. The funds earmarked for demonstration projects under the OP
EKP 2014–2020 and intended for the following could also represent a breakthrough in this area:
the implementation of demonstration projects featuring the complete energy renovation of different
types of public sector building under nearly zero-energy building criteria, where possible (central
government and cultural heritage buildings) using the latest technologies, which have a demonstration
effect;
the implementation of demonstration projects featuring the complete energy renovation of multi-
apartment buildings under nearly zero-energy building criteria. The funds are earmarked for the use of
the latest technologies, which have a demonstration effect.
The purpose of demonstration projects is to showcase new technologies that realise the objectives of energy
efficiency and air protection, as well as other objectives linked to the energy renovation of buildings such as the
efficient management of natural resources, reducing GHG emissions within the life-cycle of buildings, protecting
cultural heritage, financing anti-earthquake renovation, etc. At the same time, demonstration projects are aimed
at showcasing the use of energy performance contracting in public buildings. Demonstration projects are also an
important instrument for upgrading the quality management system for building renovation.
Focused incentives for the development of services and products. Priority areas are defined within the
Slovenian Industrial Policy, with the development of environmental technologies (EE technologies, RES
technologies, technologies for increasing materials efficiency) ranked at the top of the priority areas for
economic development. In line with this, emphasis is placed on two support sectors: sustainable construction and
manufacturing industries (chiefly wood manufacturing, metals, electricity and electronics).
It is crucial to the development and production of new sustainable products and services that the development
incentives for SMEs are targeted, in accordance with the Slovenian Industrial Policy adopted in 2013 and the
draft Smart Specialisation Strategy of the Republic of Slovenia, at the following technological areas:
energy efficiency technologies (insulation materials, technologies for efficient energy and water
consumption);
technologies for the production of energy from renewable energy sources (solar collectors, devices for
the exploitation of energy from biomass);
technologies for the systemic management of energy from RES (diffuse sources) and the integration of
these sources into the energy system (intelligent networks), and for energy supply systems featuring
consumption management by users themselves;
technologies for energy-efficient building solutions in new construction and building renovation.

81
Slovenia has a range of development incentives that are not targeted at specific areas. Owing to major
investment activities in relation to the energy renovation of buildings in the years to come, it would make sense
at the same time to promote commercial development projects relating to energy-efficient products, production
processes and services, i.e. to provide comprehensive support to the commercial sector (industry and the service
sector) through the promotion of research, development, demonstration projects and the market penetration of
technologies, products, materials and services that affect energy use. Such activities are of key importance
because they link the implementation of the programme for the energy renovation of buildings founded on
energy policy targets to the objectives of technological development, economic growth and employment.
Irrespective of the absence of targeted and integrated incentives, in various EE segments Slovenia possesses top-
class knowledge and competitive, globally oriented enterprises that are capable of developing technologies, new
concepts, systems and services in the field of energy efficiency. Slovenia’s key opportunities and skills lie in the
development of integrated systems.
Specific activities in support of development in this field are being pursued as part of the promotion of centres of
excellence and competence centres. Other instruments intended to promote innovation and the purchase of
technological equipment, and other incentives for the development of small and medium-sized enterprises,
generally do not define priority areas, nor do they stimulate additional objectives such as those relating to the
environment. Considerable funds have also been directed towards development of the field from European
programmes (Horizon 2020, which is the EU’s framework programme for research and innovation, and COSME
2020, the framework programme for the competitiveness of SMEs). It is particularly important to provide SMEs
with support that allows them to become involved in these programmes. SMEs are an important part of the
economy as far as development of this field is concerned – as energy performance contracting providers as well.
Public innovation contracts can also be an important form of incentive.
As an incentive to establish a green innovations market, the following types of project/activity are being
supported by cohesion funds in Slovenia in the 2014–2020 period (these projects/activities will also have to be
exploited to the full for the purposes of developing the complete energy renovation of buildings):
development activities and technological investments for the production of new or substantially
improved products;
technological and non-technological innovations (e.g. design) with market potential;
the networking of enterprises with higher education, research, consulting and international institutions
for the purposes of exchanging knowledge and experiences and carrying out joint development projects;
eco-innovations and the development of new green products, services, processes and business models
that will enable Slovenia to move towards a low-carbon society that manages resources efficiently;
support for projects to commercialise products that have been developed and for the entry of new
technologies on the market in order to obtain references, e.g. through innovative public contracts (pre-
commercial procurement) and demonstration projects.
82
5.4.2 Horizontal measures Regulations relating to the energy performance of buildings will be upgraded
36 so that stricter requirements
are introduced for the energy performance of buildings in line with the results of the national study of the cost-
optimal minimum requirements. The updating of the regulation will also include, as required, the updating of the
minimum energy performance requirements for new technical building systems. These requirements will also be
applied to the replacement and upgrading of the systems where this is technically, economically and functionally
feasible. Energy performance regulations will be updated with a more detailed technical definition of the criteria
for nearly zero-energy buildings no later than by the end of 2018 (for new buildings occupied by public authorities
as owners) or the end of 2020 (for all other new buildings). The updating of energy performance regulations also
includes the upgrading of the minimum requirements for the renovation of existing buildings with a more
detailed definition of the criteria for the nearly zero-energy renovation of existing buildings. The upgrading of
the regulations will affect the energy performance of buildings and systems and achievement of the target
coverage of the energy needs of buildings with renewable energy sources or energy-efficient energy supply
systems.
The updating of regulations for reducing GHG emissions during the life-cycle of a building, e.g. the introduction
of environmental impact assessments for buildings during their life-cycle (LCA, life-cycle assessment) with the
aim of establishing the use of low-emission materials, is planned over the long term as part of the upgrading of
rules relating to energy efficiency in buildings, the updating of green public procurement regulations for the
building sector or within a special sustainable buildings regulation.
Cultural heritage buildings. The proportion of buildings protected under cultural heritage protection
regulations is very high, particularly as regards buildings owned and occupied by the state. Owing to their
contribution to national identity and their economic importance, this group of buildings requires special
attention. Because of their particular features, the renovation of cultural heritage buildings usually requires
higher levels of investment and a certain deviation from the renovation parameters required of other buildings;
they are therefore frequently unable to meet the conditions for obtaining public funds for EE and the use of RES.
36 Updating of the Rules on the Efficient Use of Energy in Buildings (PURES, UL RS, No 52/10) is planned for 2015.
OP EKP 2014–2020 measures relating to the promotion of innovations relevant to the building sector:
1. Priority Axis: ‘Promoting Investments by Enterprises in Innovation and Research, and Establishing
Links and Synergies Between Enterprises, Research and Development Centres and Higher Education’:
002 Research and innovation processes in large enterprises
003 Productive investment in large enterprises linked to the low-carbon economy
062 Technology transfer and cooperation between universities and enterprises, primarily to the
benefit of SMEs
063 Support for clusters and business networks, primarily to the benefit of SMEs
064 Research and innovative processes in SMEs (including the voucher system and process design
services and social innovations)
065 Research and innovation infrastructure, processes, technology transfer and cooperation in
enterprises, with an emphasis on a low-carbon economy
2. Priority Axis: ‘Dynamic and Competitive Businesses for Green Economic Growth’:
Promoting entrepreneurship, particularly by facilitating the commercial application of new ideas and
encouraging the establishment of new enterprises, including business incubators:
068 Energy efficiency and demonstration projects in SMEs and supporting measures
069 Support to environment-friendly production processes and resource efficiency in SMEs
071 Development and provision of incentives to enterprises specialising in services that contribute to
a low-carbon economy and resistance to climate change (including support for such services)
83
A comprehensive set of measures for this special group of buildings is under preparation and will take into
account the following guidelines:
the formulation of criteria for the architectural/design aspect of energy renovation so that measures for
the energy renovation of cultural heritage buildings do not damage or even destroy the protected
elements of cultural heritage (AN URE 2020);
the formulation of ‘positive discrimination’ criteria that will be applied in tenders for promoting the
energy renovation of buildings (‘heritage factor’) and will enable the level of the incentives to be
aligned with the method by which cultural heritage protection is promoted (AN URE 2020);
requirements for the energy performance of buildings protected under cultural heritage protection
regulations shall be aligned with the assets being protected, chiefly in terms of correction factors;
the implementation of pilot or demonstration projects for the complete energy renovation of different
types of public sector building and different forms of renovation (cultural heritage buildings among
others) by using the latest technologies (OP EKP 2014–2020); the development and introduction of
technologies;
the provision of financing sources for the renovation of cultural heritage buildings;
the training of providers.
These measures require special and timely preparation; they also require the key players and shareholders to be
properly organised if the measures are to be implemented to the requisite level of quality.
5.4.3 Public sector The following two strategic issues are of key importance to the public sector:
a level of organisation for implementation that allows buildings to be renovated on time, extensively
and in a manner that has the best possible impact on the public purse, including effects on economic
growth and employment and other wider social benefits;
the provision of a greater scope of renovation of public buildings using limited public funds and the
enforcement of energy performance contracting.
The strategic effects will depend directly on the activities performed at the start of the new financial perspective;
we are therefore also highlighting a number of implementation issues in this section.
The instruments supporting the plan set out to increase the number of buildings undergoing complete and nearly
zero-energy renovation in the public sector are: financial incentives in the form of grants and repayable funding,
promotion of the introduction of energy performance contracting, private funds for the rest of the non-residential
sector, financial resources from the dedicated funds and programmes of international financial institutions for the
public sector and the rest of the non-residential sector, the re-routing of some financial incentives to promoting
the provision of repayable funding, the training of contracting authorities, project designers, contractors and
users of nearly zero-energy buildings, the development of solutions for the renovation of cultural heritage
buildings and special building groups (type-specific solutions for non-residential and public buildings), a link to
the support scheme for the supply of heat from RES, the legal foundations for target indicators for EE and RES
in the public sector, the monitoring of the indicators achieved, promotion, and the implementation of measures to
optimise the operation of energy systems as part of the financing of the energy renovation of buildings and for
other buildings through financing via energy performance contracting.
Incentives, including grants, will be directed towards the public sector in the widest sense with reference to the
ownership as well as the purpose of use of buildings. Priority will be given to activities directed towards
achieving the obligation to renovate 3 % of the total floor area of buildings owned and occupied by central
government that do not meet the minimum energy performance requirements from 1 January each year.
Project office for the energy renovation of buildings. A coordinating body needs to be established whose aim
would be to concentrate knowledge and experience for the implementation of investments in the energy
renovation of state-owned buildings, with special emphasis on the energy performance contracting model (OP
EKP 2014–2020 and AN URE 2014–2020 measure). It will provide an expert team to assist in designing
invitations to tender, conducting public-private partnership procedures, evaluating tenders, overseeing the
implementation of measures, overseeing the implementation of the contract on the provision of energy savings,
and transferring knowledge and good practice to the entire public sector and other sectors. The project office for
the energy renovation of buildings is primarily intended to provide technical assistance for the energy renovation

84
of state-owned buildings (indirect and direct budget users). Funding of the office is partly planned under
technical assistance within the context of OP EKP 2014–2020.
Energy performance contracting. The use of energy performance contracting (EPC) increases the scale of
investments using less public funding for the complete energy renovation of public buildings. It contributes to
achieving the annual dynamics of renovation of public buildings required under the Directive on Energy
Efficiency37
(EED), as well as giving the economy a kick start, as greater demand for energy performance
contracting has contributed to the development of the market for energy services that improve energy efficiency.
37 Directive 2012/27/EU.
Project office for the energy renovation of buildings. The tasks of the office are:
to manage and ensure the systematic preparation of a set of projects to meet the targets set in relation
to the renovation of state-owned buildings;
to support the implementation of energy performance contracting projects:
o an active role in establishing an energy performance contracting model (including the
preparation of procedures and documents for the standardised implementation of projects)
and in removing administrative barriers,
o the speeding-up of the preparation of projects (speeding-up of compliance with obligations
regarding the certification of buildings, preparation of expanded energy audits and project
documentation),
o the systematic preparation of joint tenders to lower project costs (geographical criteria, links
between projects on the basis of economic parameters, etc.),
o the provision of ongoing support for the implementation of energy performance contracting
projects (assistance in the designing of tenders and the evaluation of bids, procedures,
negotiations, the organisation of appropriate support for the implementation of
investments, the organisation of supervision of the implementation of the contract on the
provision of energy savings, etc.);
to provide support for quality assurance in the field of energy efficiency in central government
buildings:
o an active role in establishing a system for assuring the quality of preparation and
implementation of projects for the energy renovation of buildings in the public sector,
o the provision of ongoing technical assistance in the preparation and implementation of
projects, and oversight of those projects,
o the introduction of an energy management system for all central government buildings,
o the preparation and introduction of a scheme for optimising the operation of energy systems
(‘re-commissioning’) with subsequent implementation for projects already carried out and
within new investment projects,
o analyses of the quality of projects already carried out;
to provide information and participate in the training of all important entities in these fields;
to transfer knowledge and experiences relating to investments in the renovation of buildings between
different segments of public administration (with entities such as local energy agencies, etc.), and
transfer international knowledge and experiences to other sectors (e.g. SMEs, housing sector);
to support the transfer of knowledge and experiences in the field of the energy renovation of cultural
heritage buildings;
to manage demonstration project records (the role of the project office will be to ensure the
demonstration effects by making the appropriate selection of projects and solutions and by
monitoring them, disseminating the results, etc.);
to retain and maintain records of central government buildings for energy renovation requirements;
to systematically monitor projects in order to optimise the process of preparing and selecting
projects, allocating funds and providing for comparative evaluation;
to concentrate and link together knowledge and experience in the public sector in relation to investments in
energy renovation and the implementation of energy performance contracting projects.

85
A number of energy performance contracting projects have already been carried out in Slovenia (the first was in
2002), particularly in the public sector, for different EE and RES measures and different investment volumes,
etc. Several projects have also been carried out as part of suppliers’ obligations to ensure energy savings by final
customers. While this is a good basis, projects are still encountering a series of obstacles and unresolved
administrative issues. It should be pointed out that energy performance contracting projects in the public sector
have so far been carried out at the local community level, while central government is only encountering these
projects in the new financial perspective.
Using a project-based approach and in order to ensure the successful enforcement of energy performance
contracting, an extensive scheme must be introduced for the renovation of public buildings as part of energy
performance contracting projects. The key strategic decision involves the financing model. It would be best to
test it out first on a smaller number of projects so that the strengths and weaknesses and the practical aspects of
implementation can be finally verified. The model must correspond and, where required, be adapted to the
availability of financial resources, above all the use of cohesion funds and possible additional funding sources
(e.g. from international sources). Use of the energy performance contracting model in the public sector is also
addressed in Section 6.2.2.

86
Development of public procurement and other decision-making or procurement procedures in the public
sector. The criterion of lowest life-cycle costs will have to be adhered to consistently in order to increase the
impact on the energy performance of buildings. This is a developmental task (the criteria will be enforced
incrementally). The aim is to enforce the principle in all segments (as this involves the use of public funds for
measures for the energy renovation of buildings), including the allocation of incentives to the private sector. As
Using a project-based approach and in order to ensure the successful enforcement of energy performance
contracting, an extensive scheme must be introduced for the renovation of public buildings as part of energy
performance contracting projects. The following tasks are of key importance here:
establishing a financing model using energy performance contracting;
ensuring the systematic preparation and selection of energy renovation projects using energy
performance contracting;
regulating the issue of the financing of the preparation of projects and, where required, acquiring
additional resources for technical assistance;
ensuring that projects are linked into joint projects to achieve better economic effects for the public
purse (lowest costs possible within the life-cycle of measures);
making improvements that provide for the unambiguous interpretation of legislation regarding issues
such as: accounting standards, borrowing by municipalities when the repayment of investments from
savings made in energy costs is involved, interpretation of the Public Procurement Act and the Public-
Private Partnership Act in relation to energy performance contracting projects, etc.;
ensuring the systematic production of support material for energy performance contracting so as to
enable projects to be designed to a higher level of quality, more swiftly and more cheaply. Support
material encompasses standard contracts, instructions relating to tender implementation procedures,
project implementation and supervision of the implementation of contracts on the provision of energy
savings (monitoring of the effects, reporting and verification of savings), the supplementing of the
methodology for conducting energy audits in the public sector so that it supports the preparation of
energy performance contracting tenders, etc.;
legally regulating the field for the introduction of new approaches such as ‘financing through an
energy account’;
testing the regulation using demonstration projects;
providing publicly accessible information in support of energy performance contracting within the
energy management system;
providing concerted and constant information and awareness-raising for target groups regarding EE
energy services (promotional campaign), including the promotion of model examples, providing
information to financial institutions on EE energy services, encouraging financial institutions to offer
favourable loans to enterprises for energy services to implement energy performance contracting
projects, and incorporating content into the single sustainable energy information portal (BORZEN);
training potential contracting authorities, particularly from the public sector, in the design and
management of energy performance contracting projects;
supporting contracting authorities, particularly in the public sector, in energy performance contracting
projects (see the ‘Project office for the energy renovation of buildings’ section) and providing support
to other segments of the public sector (e.g. local energy agencies could, in accordance with the EZ-1,
assume the role of project promoters on behalf of municipalities);
enforcing the European Code of Conduct for Energy Performance Contracting;
enforcing quality standards for energy performance contracting;
training entities at all levels;
providing ongoing support to responsible persons within institutions in relation to removing barriers;
monitoring projects systematically (labour costs and individual activities), ensuring comparative
evaluation, and optimising the processes of selecting projects and allocating funds.
87
mentioned above, quality criteria must be adhered to in public procurement and green public procurement, and
eco-innovations promoted through public procurement, in order to enhance developmental effects. AN URE
2014–2020 addresses the energy efficiency aspects of green public procurement in more detail. The development
of other decision-making or procurement procedures in the public sector is also necessary, particularly in relation
to PPP or energy performance contracting.
5.4.4 Residential buildings Targeting of subsidies towards complete energy renovation and the renovation of residential areas.
Continuation of the policy of promotion through financial investment incentives (Eco Fund incentives) is
planned. These incentives will be more targeted in future and the level of the incentives will provide greater
encouragement for the complete energy renovation of buildings (the highest level of co-financing will be given
to the measures for the complete energy renovation of buildings and the lowest to the implementation of an
individual measure). Subsidies must also be linked to verification of the quality of implementation. Instruments
for promoting the renovation of residential areas will also be studied.
The legal foundations for decision-making in multi-apartment buildings must be regulated in favour of
the energy renovation of buildings. This regulation will be based on the principle that 50 % consent is
sufficient for an energy renovation decision to be taken if a substantial improvement in energy performance is
involved, where the investment will be returned in the form of savings in energy costs.
The legal foundations must also be regulated so as to make it easier for the reserve fund or the building to
take on borrowing, also on the basis of ‘on-bill financing’.
Vulnerable population groups. The enhancement of financial assistance for vulnerable population groups is
planned within the strategic documents adopted. Special measures are defined for energy renovation in
households faced with fuel poverty. The measures will be aimed at investments, advice and measures to change
patterns of behaviour. Advice and other practical assistance will be aimed at overcoming the obstacles
encountered by this target group (access to information, skills to implement measures, etc.), and will rely to the
greatest possible extent on experiences in providing assistance to this target group in other areas. EE measures
for vulnerable population groups are addressed in AN URE 2014–2020.
Managers of non-profit housing stock must also be encouraged to engage in the complete energy
renovation of buildings through appropriate regulation of the system of non-profit rents.
5.4.5 Buildings in the private service sector Small and medium-sized enterprises. Energy efficiency and the use of renewable energy sources for SMEs
constitutes, above all, an opportunity to reduce energy and therefore operating costs. Owing to their size, these
enterprises often do not have enough staff able to deal with EE and the use of RES or to manage projects in this
field, even though there are some public funds already available for this purpose (Eco Fund, energy suppliers’
programmes). It would make sense to formulate a special programme for this target group that overcomes this
obstacle. The cooperation, above all, of the MzI and the MGRT, as well as the Eco Fund and local energy
agencies, would be required in the design and implementation of this programme. The programme should
promote the formation of a package of measures aimed at this target group.
This would also be required as support for investment incentives and other forms of financial incentive to
improve energy and materials efficiency (measures to promote EE and RES in SMEs) financed by the European
Regional Development Fund (OP EKP 2014–2020), where incentives for 1 000 projects are planned.
5.4.6 Complementary policies Efficient district heating systems. Measures and policies for district heating systems that pursue the vision set
out in this Strategy are also required if the targets are to be reached and emissions reduced. A detailed strategy
for this sector will be outlined in the Energy Concept of Slovenia.
88
Air protection. Building renovation measures also relate to the issue of air quality, whereby they considerably
reduce the global costs of achieving the targets of several policy areas at the same time. Consistent adherence to
air quality legislation and programmes is of essential importance when undertaking the energy renovation of
buildings. The Strategy is additionally oriented towards achieving air-quality targets in accordance with the
guidelines adopted in the OP TGP 2020, which are:
incentives for wood biomass heating installations for the heating of buildings or residential complexes
that are financed by public funds or promoted as part of energy suppliers’ obligations to achieve end-
use energy savings are intended solely for the best available technologies;
incentives are not given to individual heating systems if they replace heating from district heating
systems;
incentives are not given to individual heating systems in areas that have adopted an ordinance on an
air-quality plan if municipal acts or a local sustainable energy action plan have given priority to district
heating for the heating of buildings. If natural gas is given priority in heating, incentives are not given to
the replacement of heating installations using gas with new heating installations using wood biomass;
due regard is paid to the following order of precedence for energy sources for the supply of heat when
designing incentives relating to the heating of buildings and residential complexes:
o district heating systems that use RES for the cogeneration of heat and power, RES in separate
generation, natural gas in high-efficiency CHP or waste heat;
o individual supply of heat from RES;
o individual natural gas supply;
o other sources.
Total consumption of wood biomass for heating will be lower (in absolute terms) in 2030 as a result of the
measures for energy efficiency in buildings incorporated into this Strategy than they would be without these
measures; at the same time, the proportion of buildings using this fuel in modern high-efficiency installations
will be higher.
Internalisation of the external costs of environmental pollution can have an important effect on increasing
the cost-competitiveness of projects for the energy renovation of buildings and, at the same time, on public
finance revenues for achieving the climate and energy targets. New policies should help to adjust the prices of
resources which are not adequately evaluated on the market. For the building sector, these are, in particular,
water, clean air and climate. An appropriate system of environmental levies could also coordinate efforts towards
fiscal consolidation by promoting the restructuring of the economy into one that manages resources efficiently.
5.5 Measurability of targets – linking targets with an assessment of the effects and
with measures to monitor the effects
One very important aspect of target-setting is the measurability of those targets, and the quality and costs of
monitoring the implementation of the Strategy.
Under Directive 2012/27/EU, targets can be set using one or more sets of indicators:
A. energy savings, renovated floor area, emissions reduction, an increase in the share of RES, where
only building renovation and new construction promoted by means of subsidies are taken into
account;
B. energy savings, renovated floor area, emissions reduction, an increase in the share of RES, where
all building renovation and new construction are taken into account;
C. end-use energy consumption in buildings, total emissions, share of RES, use of RES, specific use
of energy in buildings;
D. primary energy use in buildings, total emissions, share of RES, specific emissions.
From the point of view of the measurability of the targets, it is very important that the decision on the framework
of the Strategy accords as closely as possible to the categorisation of sectors within the national statistics. The
Strategy covers energy use in all buildings, with the exception of buildings in manufacturing industry. This
means that all energy use in buildings from the statistical sectors of households and other use, which includes
service activities (public and commercial), and energy use at agricultural holdings (but excluding energy use for
agricultural machinery) are taken into account.

89
The useful floor area of occupied apartment units and the useful floor area of service sector buildings are taken
into account when monitoring the floor area of buildings. The obligations imposed by Article 5 of the EED are
also monitored in relation to the useful floor area of buildings.
A number of implementing documents (OP TGP 2020 and OP EKP 2014–2020) also set detailed operational
targets aimed at increasing the effectiveness of the implementation of programmes and the monitoring of the
effects of the implementation of these programmes. Systems of indicators have also been developed for the
requirements of these programmes. Some of them are specifically tailored towards the monitoring of measures in
the building sector. The indicators used to monitor the results of the OP TGP 2020 and OP EKP 2014–2020 are
presented in the tables in Annex A.
The system for the monitoring of the effects of the implementation of the Strategy will be linked as closely as
possible to the systems of indicators already approved.
Proposed main indicators for the monitoring of the achievement of the national targets:
energy use;
share of renewable energy sources;
greenhouse gas emissions from the sector;
floor area of nearly zero-energy buildings;
share of central government buildings that have been renovated.
The following indicators are proposed for the monitoring of the effects and costs of incentives:
floor area of buildings that have been renovated on the basis of incentives;
savings in energy costs;
reductions in GHG emissions, increase in the use of energy from RES, energy savings;
volume of investments;
costs for incentives;
jobs created (within the framework of the data available). Indicators are also required for assessing the
effectiveness of the measures:
the ratio between the values of incentives and investments;
the ratio between savings in energy costs and the costs of the measures;
the specific costs of incentives per unit of energy saved;
the specific costs of incentives per unit of emissions reduced.
The national statistics for energy and construction will also have to be upgraded if achievement of the targets of
the Strategy is to be monitored effectively; this particularly applies to the monitoring of the overall scale of
building renovation (including independent renovation) in the private sector. Monitoring of energy use, the
energy performance of buildings and building renovation in the public sector will be based, in particular, on
mandatory energy management and building certification systems.
6 Future-oriented perspectives for guiding investment decisions
6.1 Estimate of the investment volumes required According to projections for 2016–2023, the value of investments in the renovation of buildings will amount to
EUR 3 166 million: 72.7 % for the renovation of buildings in the housing sector, 10.7 % for buildings in the
public sector and 16.6 % for buildings in the private service sector. The value of investments in the 2024–2030
period is estimated to be EUR 3 137 million, giving a total for 2016–2030 of EUR 6 304 million: 73.6 % for the
housing sector, 10.3 % for buildings for the public sector and 16.1 % for buildings in the private service sector.
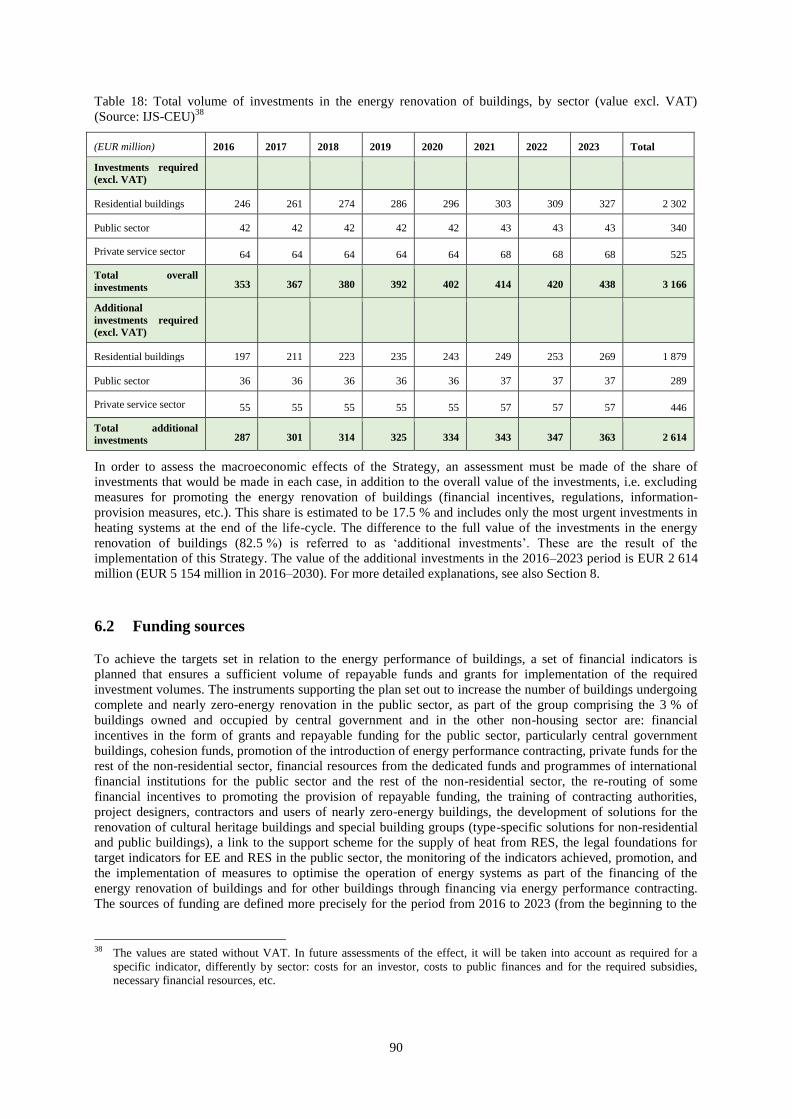
90
Table 18: Total volume of investments in the energy renovation of buildings, by sector (value excl. VAT)
(Source: IJS-CEU)38
(EUR million) 2016 2017 2018 2019 2020 2021 2022 2023 Total
Investments required
(excl. VAT)
Residential buildings 246 261 274 286 296 303 309 327 2 302
Public sector 42 42 42 42 42 43 43 43 340
Private service sector 64 64 64 64 64 68 68 68 525
Total overall
investments 353 367 380 392 402 414 420 438 3 166
Additional
investments required
(excl. VAT)
Residential buildings 197 211 223 235 243 249 253 269 1 879
Public sector 36 36 36 36 36 37 37 37 289
Private service sector 55 55 55 55 55 57 57 57 446
Total additional
investments 287 301 314 325 334 343 347 363 2 614
In order to assess the macroeconomic effects of the Strategy, an assessment must be made of the share of
investments that would be made in each case, in addition to the overall value of the investments, i.e. excluding
measures for promoting the energy renovation of buildings (financial incentives, regulations, information-
provision measures, etc.). This share is estimated to be 17.5 % and includes only the most urgent investments in
heating systems at the end of the life-cycle. The difference to the full value of the investments in the energy
renovation of buildings (82.5 %) is referred to as ‘additional investments’. These are the result of the
implementation of this Strategy. The value of the additional investments in the 2016–2023 period is EUR 2 614
million (EUR 5 154 million in 2016–2030). For more detailed explanations, see also Section 8.
6.2 Funding sources To achieve the targets set in relation to the energy performance of buildings, a set of financial indicators is
planned that ensures a sufficient volume of repayable funds and grants for implementation of the required
investment volumes. The instruments supporting the plan set out to increase the number of buildings undergoing
complete and nearly zero-energy renovation in the public sector, as part of the group comprising the 3 % of
buildings owned and occupied by central government and in the other non-housing sector are: financial
incentives in the form of grants and repayable funding for the public sector, particularly central government
buildings, cohesion funds, promotion of the introduction of energy performance contracting, private funds for the
rest of the non-residential sector, financial resources from the dedicated funds and programmes of international
financial institutions for the public sector and the rest of the non-residential sector, the re-routing of some
financial incentives to promoting the provision of repayable funding, the training of contracting authorities,
project designers, contractors and users of nearly zero-energy buildings, the development of solutions for the
renovation of cultural heritage buildings and special building groups (type-specific solutions for non-residential
and public buildings), a link to the support scheme for the supply of heat from RES, the legal foundations for
target indicators for EE and RES in the public sector, the monitoring of the indicators achieved, promotion, and
the implementation of measures to optimise the operation of energy systems as part of the financing of the
energy renovation of buildings and for other buildings through financing via energy performance contracting.
The sources of funding are defined more precisely for the period from 2016 to 2023 (from the beginning to the
38 The values are stated without VAT. In future assessments of the effect, it will be taken into account as required for a
specific indicator, differently by sector: costs for an investor, costs to public finances and for the required subsidies,
necessary financial resources, etc.
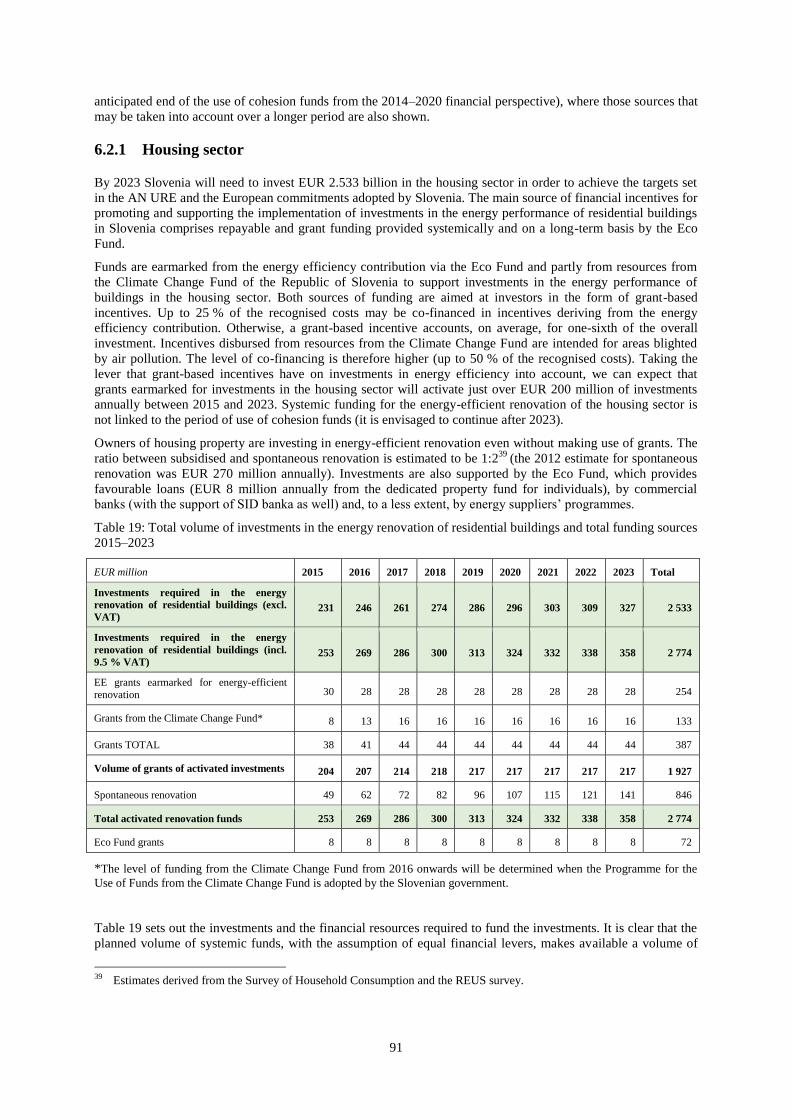
91
anticipated end of the use of cohesion funds from the 2014–2020 financial perspective), where those sources that
may be taken into account over a longer period are also shown.
6.2.1 Housing sector By 2023 Slovenia will need to invest EUR 2.533 billion in the housing sector in order to achieve the targets set
in the AN URE and the European commitments adopted by Slovenia. The main source of financial incentives for
promoting and supporting the implementation of investments in the energy performance of residential buildings
in Slovenia comprises repayable and grant funding provided systemically and on a long-term basis by the Eco
Fund.
Funds are earmarked from the energy efficiency contribution via the Eco Fund and partly from resources from
the Climate Change Fund of the Republic of Slovenia to support investments in the energy performance of
buildings in the housing sector. Both sources of funding are aimed at investors in the form of grant-based
incentives. Up to 25 % of the recognised costs may be co-financed in incentives deriving from the energy
efficiency contribution. Otherwise, a grant-based incentive accounts, on average, for one-sixth of the overall
investment. Incentives disbursed from resources from the Climate Change Fund are intended for areas blighted
by air pollution. The level of co-financing is therefore higher (up to 50 % of the recognised costs). Taking the
lever that grant-based incentives have on investments in energy efficiency into account, we can expect that
grants earmarked for investments in the housing sector will activate just over EUR 200 million of investments
annually between 2015 and 2023. Systemic funding for the energy-efficient renovation of the housing sector is
not linked to the period of use of cohesion funds (it is envisaged to continue after 2023).
Owners of housing property are investing in energy-efficient renovation even without making use of grants. The
ratio between subsidised and spontaneous renovation is estimated to be 1:239
(the 2012 estimate for spontaneous
renovation was EUR 270 million annually). Investments are also supported by the Eco Fund, which provides
favourable loans (EUR 8 million annually from the dedicated property fund for individuals), by commercial
banks (with the support of SID banka as well) and, to a less extent, by energy suppliers’ programmes.
Table 19: Total volume of investments in the energy renovation of residential buildings and total funding sources
2015–2023
EUR million 2015 2016 2017 2018 2019 2020 2021 2022 2023 Total
Investments required in the energy
renovation of residential buildings (excl.
VAT) 231 246 261 274 286 296 303 309 327 2 533
Investments required in the energy
renovation of residential buildings (incl.
9.5 % VAT) 253 269 286 300 313 324 332 338 358 2 774
EE grants earmarked for energy-efficient
renovation 30 28 28 28 28 28 28 28 28 254
Grants from the Climate Change Fund* 8 13 16 16 16 16 16 16 16 133
Grants TOTAL 38 41 44 44 44 44 44 44 44 387
Volume of grants of activated investments 204 207 214 218 217 217 217 217 217 1 927
Spontaneous renovation 49 62 72 82 96 107 115 121 141 846
Total activated renovation funds 253 269 286 300 313 324 332 338 358 2 774
Eco Fund grants 8 8 8 8 8 8 8 8 8 72
*The level of funding from the Climate Change Fund from 2016 onwards will be determined when the Programme for the
Use of Funds from the Climate Change Fund is adopted by the Slovenian government.
Table 19 sets out the investments and the financial resources required to fund the investments. It is clear that the
planned volume of systemic funds, with the assumption of equal financial levers, makes available a volume of
39 Estimates derived from the Survey of Household Consumption and the REUS survey.
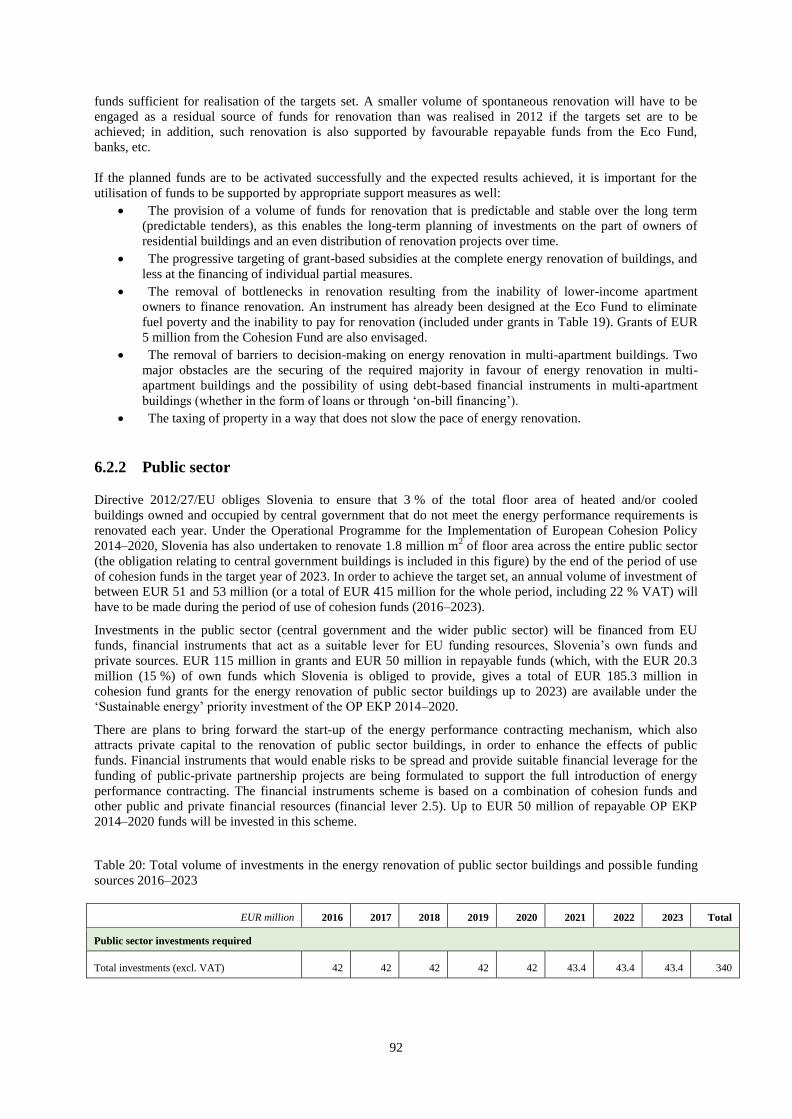
92
funds sufficient for realisation of the targets set. A smaller volume of spontaneous renovation will have to be
engaged as a residual source of funds for renovation than was realised in 2012 if the targets set are to be
achieved; in addition, such renovation is also supported by favourable repayable funds from the Eco Fund,
banks, etc.
If the planned funds are to be activated successfully and the expected results achieved, it is important for the
utilisation of funds to be supported by appropriate support measures as well:
The provision of a volume of funds for renovation that is predictable and stable over the long term
(predictable tenders), as this enables the long-term planning of investments on the part of owners of
residential buildings and an even distribution of renovation projects over time.
The progressive targeting of grant-based subsidies at the complete energy renovation of buildings, and
less at the financing of individual partial measures.
The removal of bottlenecks in renovation resulting from the inability of lower-income apartment
owners to finance renovation. An instrument has already been designed at the Eco Fund to eliminate
fuel poverty and the inability to pay for renovation (included under grants in Table 19). Grants of EUR
5 million from the Cohesion Fund are also envisaged.
The removal of barriers to decision-making on energy renovation in multi-apartment buildings. Two
major obstacles are the securing of the required majority in favour of energy renovation in multi-
apartment buildings and the possibility of using debt-based financial instruments in multi-apartment
buildings (whether in the form of loans or through ‘on-bill financing’).
The taxing of property in a way that does not slow the pace of energy renovation.
6.2.2 Public sector Directive 2012/27/EU obliges Slovenia to ensure that 3 % of the total floor area of heated and/or cooled
buildings owned and occupied by central government that do not meet the energy performance requirements is
renovated each year. Under the Operational Programme for the Implementation of European Cohesion Policy
2014–2020, Slovenia has also undertaken to renovate 1.8 million m2 of floor area across the entire public sector
(the obligation relating to central government buildings is included in this figure) by the end of the period of use
of cohesion funds in the target year of 2023. In order to achieve the target set, an annual volume of investment of
between EUR 51 and 53 million (or a total of EUR 415 million for the whole period, including 22 % VAT) will
have to be made during the period of use of cohesion funds (2016–2023).
Investments in the public sector (central government and the wider public sector) will be financed from EU
funds, financial instruments that act as a suitable lever for EU funding resources, Slovenia’s own funds and
private sources. EUR 115 million in grants and EUR 50 million in repayable funds (which, with the EUR 20.3
million (15 %) of own funds which Slovenia is obliged to provide, gives a total of EUR 185.3 million in
cohesion fund grants for the energy renovation of public sector buildings up to 2023) are available under the
‘Sustainable energy’ priority investment of the OP EKP 2014–2020.
There are plans to bring forward the start-up of the energy performance contracting mechanism, which also
attracts private capital to the renovation of public sector buildings, in order to enhance the effects of public
funds. Financial instruments that would enable risks to be spread and provide suitable financial leverage for the
funding of public-private partnership projects are being formulated to support the full introduction of energy
performance contracting. The financial instruments scheme is based on a combination of cohesion funds and
other public and private financial resources (financial lever 2.5). Up to EUR 50 million of repayable OP EKP
2014–2020 funds will be invested in this scheme.
Table 20: Total volume of investments in the energy renovation of public sector buildings and possible funding
sources 2016–2023
EUR million 2016 2017 2018 2019 2020 2021 2022 2023 Total
Public sector investments required
Total investments (excl. VAT) 42 42 42 42 42 43.4 43.4 43.4 340
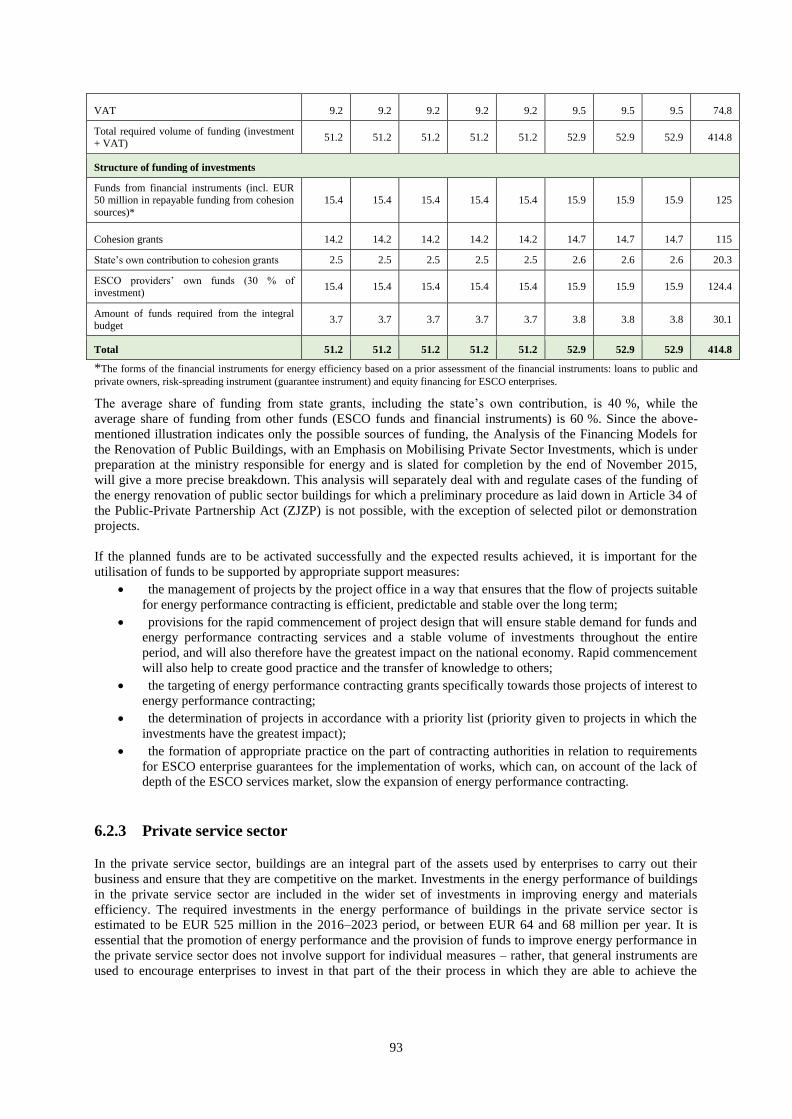
93
VAT 9.2 9.2 9.2 9.2 9.2 9.5 9.5 9.5 74.8
Total required volume of funding (investment + VAT)
51.2 51.2 51.2 51.2 51.2 52.9 52.9 52.9 414.8
Structure of funding of investments
Funds from financial instruments (incl. EUR 50 million in repayable funding from cohesion
sources)*
15.4 15.4 15.4 15.4 15.4 15.9 15.9 15.9 125
Cohesion grants 14.2 14.2 14.2 14.2 14.2 14.7 14.7 14.7 115
State’s own contribution to cohesion grants 2.5 2.5 2.5 2.5 2.5 2.6 2.6 2.6 20.3
ESCO providers’ own funds (30 % of investment)
15.4 15.4 15.4 15.4 15.4 15.9 15.9 15.9 124.4
Amount of funds required from the integral budget
3.7 3.7 3.7 3.7 3.7 3.8 3.8 3.8 30.1
Total 51.2 51.2 51.2 51.2 51.2 52.9 52.9 52.9 414.8
*The forms of the financial instruments for energy efficiency based on a prior assessment of the financial instruments: loans to public and
private owners, risk-spreading instrument (guarantee instrument) and equity financing for ESCO enterprises.
The average share of funding from state grants, including the state’s own contribution, is 40 %, while the
average share of funding from other funds (ESCO funds and financial instruments) is 60 %. Since the above-
mentioned illustration indicates only the possible sources of funding, the Analysis of the Financing Models for
the Renovation of Public Buildings, with an Emphasis on Mobilising Private Sector Investments, which is under
preparation at the ministry responsible for energy and is slated for completion by the end of November 2015,
will give a more precise breakdown. This analysis will separately deal with and regulate cases of the funding of
the energy renovation of public sector buildings for which a preliminary procedure as laid down in Article 34 of
the Public-Private Partnership Act (ZJZP) is not possible, with the exception of selected pilot or demonstration
projects.
If the planned funds are to be activated successfully and the expected results achieved, it is important for the
utilisation of funds to be supported by appropriate support measures:
the management of projects by the project office in a way that ensures that the flow of projects suitable
for energy performance contracting is efficient, predictable and stable over the long term;
provisions for the rapid commencement of project design that will ensure stable demand for funds and
energy performance contracting services and a stable volume of investments throughout the entire
period, and will also therefore have the greatest impact on the national economy. Rapid commencement
will also help to create good practice and the transfer of knowledge to others;
the targeting of energy performance contracting grants specifically towards those projects of interest to
energy performance contracting;
the determination of projects in accordance with a priority list (priority given to projects in which the
investments have the greatest impact);
the formation of appropriate practice on the part of contracting authorities in relation to requirements
for ESCO enterprise guarantees for the implementation of works, which can, on account of the lack of
depth of the ESCO services market, slow the expansion of energy performance contracting.
6.2.3 Private service sector In the private service sector, buildings are an integral part of the assets used by enterprises to carry out their
business and ensure that they are competitive on the market. Investments in the energy performance of buildings
in the private service sector are included in the wider set of investments in improving energy and materials
efficiency. The required investments in the energy performance of buildings in the private service sector is
estimated to be EUR 525 million in the 2016–2023 period, or between EUR 64 and 68 million per year. It is
essential that the promotion of energy performance and the provision of funds to improve energy performance in
the private service sector does not involve support for individual measures – rather, that general instruments are
used to encourage enterprises to invest in that part of the their process in which they are able to achieve the

94
greatest energy savings. Promoting improvements to the energy performance of buildings on their own could
have undesirable distorting effects and therefore an unfavourable impact on the competitiveness of the private
service sector.
The following dedicated funding sources are available/envisaged for increasing energy and materials efficiency,
in addition to enterprises’ own funds, in the 2016–2023 period:
• Funds disbursed under the OP EKP 2014–2020 (Priority Axis 3), which has earmarked EUR 91
million for the promotion of energy efficiency, environment-friendly measures and efficient resource
use in the 2016–2023 period.
• It is proposed that a loan fund be established that includes repayable funds and grants from the OP
EKP (Priority Axis 3) and that the risks be spread for the period of implementation of the OP EKP.
• It is expected that those liable under the Decree Ensuring Energy Savings will focus a large part of
their obligations to ensure energy savings on larger energy users in the private service sector. It is
expected that energy suppliers, taking into account the costs of achieving energy savings specific to
them and in light of their obligations, will implement incentives for investments in energy efficiency
of between EUR 5 and 15 million annually. These measures will provide incentives for further
investments of between EUR 20 and 40 million; these will mainly increase energy efficiency in
enterprises, leading in the long term to energy savings and making an important contribution to
securing the competitiveness of industry and the private service sector.
• The private service sector is also of interest to energy performance contracting, which can be an
important lever for increasing energy performance in this sector as well.
• Dedicated long-term bank financing.
7 Estimate of savings and wider benefits Investments in the energy performance of buildings provide society with significant savings and with wider
economic, social and environmental benefits, as well as benefits accruing to the energy system.
7.1 Economic benefits
7.1.1 Energy savings
As part of the task, a model for projecting energy use in buildings up to 2050 was developed and put into service
for the first time.
Savings in end-use and primary energy for heating and domestic hot water resulting from the implementation of
measures for the energy renovation of existing buildings were estimated relative to 2015. End-use energy
savings will amount to 1 509 GWh (5.4 PJ) in 2020, and will increase to 3 976 GWh (14.3 PJ) by 2030 and to
7 029 GWh (25.3 PJ) by 2050. Primary energy savings will be higher, as 1 kWh of electricity or district heating
saved means over 2 kWh or 1.3 kWh of primary energy saved. Primary energy savings will amount to 1 624
GWh (5.8 PJ) in 2020, 4 323 GWh (15.6 PJ) in 2030 and
7 852 GWh (28.3 PJ) in 2050.
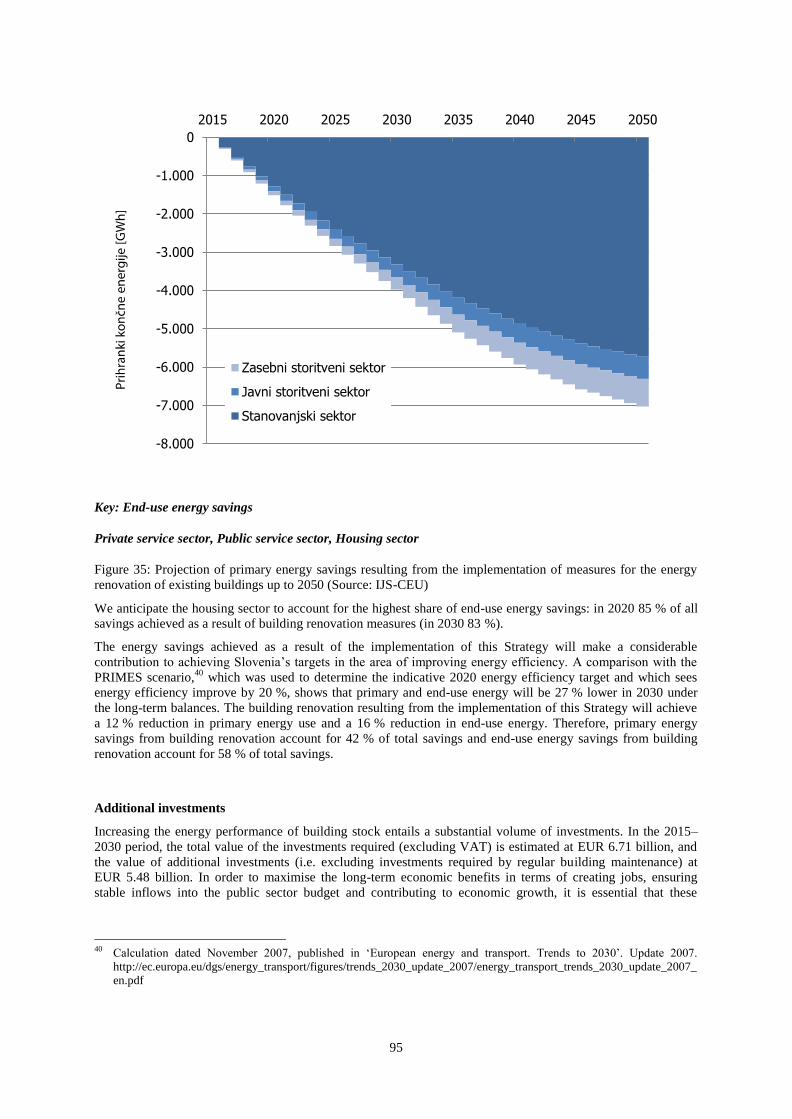
95
Key: End-use energy savings
Private service sector, Public service sector, Housing sector
Figure 35: Projection of primary energy savings resulting from the implementation of measures for the energy
renovation of existing buildings up to 2050 (Source: IJS-CEU)
We anticipate the housing sector to account for the highest share of end-use energy savings: in 2020 85 % of all
savings achieved as a result of building renovation measures (in 2030 83 %).
The energy savings achieved as a result of the implementation of this Strategy will make a considerable
contribution to achieving Slovenia’s targets in the area of improving energy efficiency. A comparison with the
PRIMES scenario,40
which was used to determine the indicative 2020 energy efficiency target and which sees
energy efficiency improve by 20 %, shows that primary and end-use energy will be 27 % lower in 2030 under
the long-term balances. The building renovation resulting from the implementation of this Strategy will achieve
a 12 % reduction in primary energy use and a 16 % reduction in end-use energy. Therefore, primary energy
savings from building renovation account for 42 % of total savings and end-use energy savings from building
renovation account for 58 % of total savings.
Additional investments
Increasing the energy performance of building stock entails a substantial volume of investments. In the 2015–
2030 period, the total value of the investments required (excluding VAT) is estimated at EUR 6.71 billion, and
the value of additional investments (i.e. excluding investments required by regular building maintenance) at
EUR 5.48 billion. In order to maximise the long-term economic benefits in terms of creating jobs, ensuring
stable inflows into the public sector budget and contributing to economic growth, it is essential that these
40 Calculation dated November 2007, published in ‘European energy and transport. Trends to 2030’. Update 2007.
http://ec.europa.eu/dgs/energy_transport/figures/trends_2030_update_2007/energy_transport_trends_2030_update_2007_
en.pdf
96
investments be made as evenly as possible, without concentrating investment activities in individual years or
over shorter periods.
The impact of the additional investments on employment, budget inflows and GDP growth has been estimated
using a SAM-based recursive-dynamic model of general equilibrium containing 25 sectors of activity and 25
commodities and services.41
Additional employment
The increased volume of investment in energy efficiency also means increased demand in sectors whose
products and services lead to improvements in the energy performance of buildings. This will have a direct
impact on employment by increasing the numbers of people employed in those sectors that directly supply
products and services for the energy renovation of buildings, e.g. construction, the manufacture of building
fittings and heating systems, and the ESCO sector. There will also be an indirect impact across the whole
economy in response to increased economic activity in the other sectors involved.
Owing to the relatively high labour intensity of work connected with the energy renovation of buildings,
investments in energy performance are a strong and important lever for the creation of new jobs in comparison
with many other sectors of the economy.
We estimate, using the general equilibrium model, that additional investments in energy renovation will give rise
to a direct growth in employment in Slovenia of between 0.36 % and 0.58 % annually (or the annual creation of
between 3 000 and 4 600 new jobs).
In its study of the period leading up to 2020, the Energy Efficiency Industry Forum (EEIF)42
estimates that
investments of EUR 1 million in the energy performance of buildings in Europe supports 19 new jobs (a job is
defined as the employment of one person for one year). This means that the planned average annual volume of
additional investments of between EUR 300 and 400 million in Slovenia would support between 5 700 and 7 700
jobs (indirect and direct).
Increased GDP
The Copenhagen Economics Report on the effects of energy-efficient building renovation emphasises that in
economic conditions of relatively high unemployment and free capacity in the national economy, investments
can also have a considerable effect on increasing GDP, as additional investments increase economic activity and
create new jobs in the sectors directly involved, as well as having a positive indirect effect on other parts of the
economy. The additional funds used for investments in the energy renovation of buildings should, given the
economic conditions without these investments, generate an increase in GDP of 0.89 % per year relative to the
baseline scenario, and an increase of 1.98 % in domestic sales and 1 % in domestic production. Private
consumption should also increase by 0.93 % and state consumption by up to 0.04 %.
Public finance benefits
Investments in improvements to the energy performance of buildings reduce state expenditure on energy and, at
the same time, bolster public finance revenues as a result of increased investment and economic activity. The
positive effects are indirect as well as direct, as healthcare expenditure and the funds required for subsidies will
fall as a result of the reduction in fuel poverty and the improvements to health brought about by improved living
conditions. Increased energy efficiency also enables the state to realise its 2020 commitments. An estimate of the
41 MAJCEN, Boris et al., Nadgradnja rekurzivnega dinamičnega modela splošnega ravnotežja slovenskega gospodarstva v
obdobju 2007–2009 (Upgrading of the recursive-dynamic model of general equilibrium of the Slovenian economy 2007–
2009). Ljubljana: Inštitut za ekonomska raziskovanja (Institute for Economic Research), 2011. 324 pp. 42 http://www.eeif.eu/the-european-energy-efficiency-industries-call-for-a-fundamental-change-in-europes-approach-
towards-energy-supply-and-use/#section-H.
http://www.google.si/url?sa=t&rct=j&q=&esrc=s&source=web&cd=1&ved=0CB4QFjAA&url=http%3A%2F%2Fwww.
e
uroace.org%2FPublicDocumentDownload.aspx%3FCommand%3DCore_Download%26EntryId%3D433&ei=w0RfVey
R KcONsAGE64DoDg&usg=AFQjCNEu_5aWmvsQqM1ydycT7EHeOs6mjQ&bvm=bv.93990622,d.bGg
97
public finance effects for Slovenia using the general equilibrium model shows a positive effect on the state
budget (the deficit should be reduced by 0.46 percentage points relative to the baseline scenario).
Increased property values
An increasing number of studies around the world show that increased energy performance has a positive effect
on property value. A British study43
indicates that property with an A/B energy class achieves values that are, on
average, 14 % higher than those achieved by property in the lowest energy class. Property research carried out in
Ireland gives similar results; there, property in energy class A sells for an 11 % premium, while the premium in
the rented market is much lower (2 %). Increased energy performance contributes to increasing the value of
commercial buildings as well. In the case of France,44
the energy performance of a building is also reflected in
the sale value of and rents for commercial, office and industrial property, where the effects are stronger in
service sector property than in industrial property.
It has become mandatory in Slovenia as well for the energy performance indicators of a building or part of a
building as indicated in the energy performance certificate to be stated when advertising the sale of a building or
a part thereof, or its renting-out for a period of one year or more. This obligation has been laid down in the
Slovenian Energy Act (EZ-1) and came into force on 22 March 2014. We can expect this to result in price
differences being more pronounced between different energy performance levels.
Incentives for research and development, industry competitiveness and export growth
Promoting the energy-efficient renovation of buildings within the national economy also has an important
incentivising effect on the development of research and development activities connected with energy-efficient
technologies. Significant emphasis is also given to this field in Slovenia under the first and third priority axes of
the OP EKP, which uses various instruments to promote and realise the target of increasing competitiveness for
green economic growth and the creation of new jobs.
7.2 Social benefits
Reduced fuel poverty
Although there is no official definition of fuel poverty, we can infer it from the energy costs borne by
households, the payment of these costs, and the ability of households to afford to heat their residence to an
adequate level of warmth. According to the Household Consumption Survey, an average of 7 % of Slovenian
household income went towards electricity, gas, other fuels and domestic hot water in 2012. The division of
households into income quintiles shows that expenditure on electricity, gas, other fuels and domestic hot water
accounted for 15.3 % of all available income in the first quintile (the 20 % of households with the lowest
income), 9.4 % in the second quintile, 7.6 % in the third quintile, 6 % in the fourth quintile and 4.5 % in the last
quintile.
According to figures from the Research into Income and Living Conditions, in Slovenia 93.6 % of households
could afford to heat their residence to an adequate level of warmth in 2012 (78 % of households in the first
income quintile), 16.9 % of households had occasional difficulty paying energy and water costs (23.8 % of
households in the first income quintile), and 31.1 % of households lived in apartments affected by leaks, damp
walls and worn-out windows or floors. The figures show that the number of households unable to afford to heat
their residence adequately is on the rise.
Effect on health, improved living comfort and higher productivity
43 https://www.gov.uk/government/uploads/system/uploads/attachment_data/file/207196/20130613_-
_Hedonic_Pricing_study_-_DECC_template 2_.pdf 44 Nappi-Choulet, I. and Décamps, A. (2013) Capitalization of energy efficiency on corporate real estate portfolio value.
Journal of Corporate Real Estate, 15(1): 35–52.
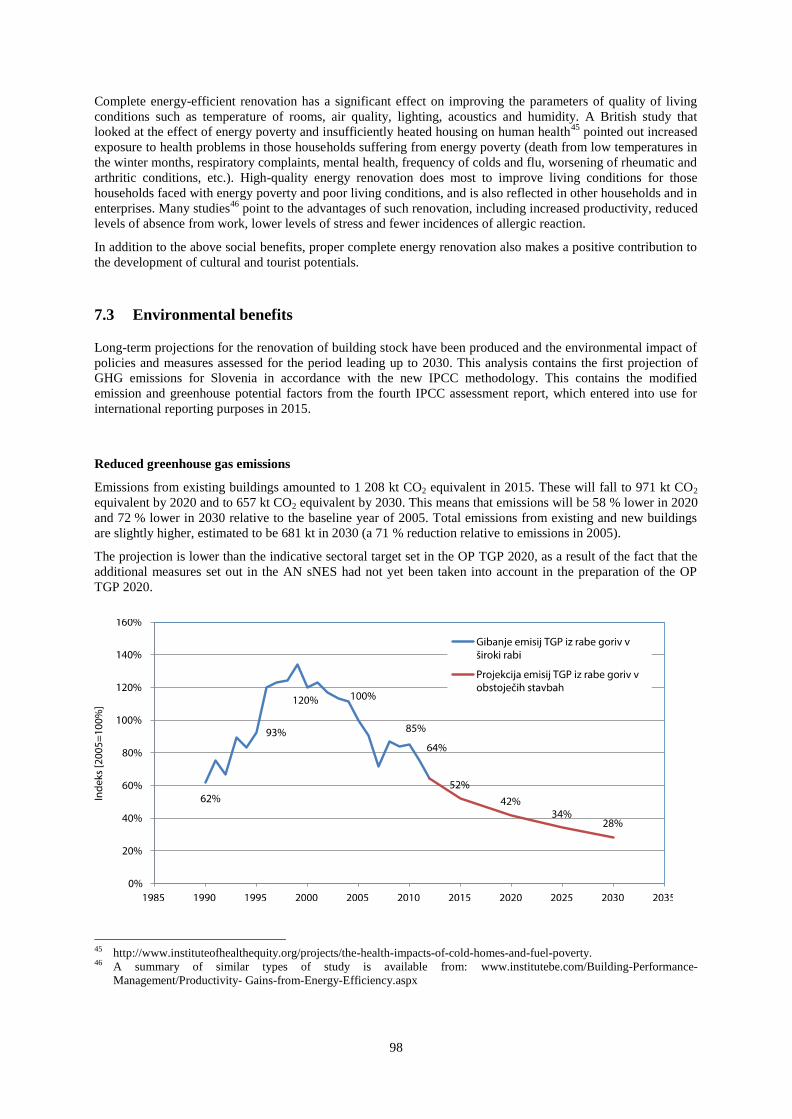
98
Complete energy-efficient renovation has a significant effect on improving the parameters of quality of living
conditions such as temperature of rooms, air quality, lighting, acoustics and humidity. A British study that
looked at the effect of energy poverty and insufficiently heated housing on human health45
pointed out increased
exposure to health problems in those households suffering from energy poverty (death from low temperatures in
the winter months, respiratory complaints, mental health, frequency of colds and flu, worsening of rheumatic and
arthritic conditions, etc.). High-quality energy renovation does most to improve living conditions for those
households faced with energy poverty and poor living conditions, and is also reflected in other households and in
enterprises. Many studies46
point to the advantages of such renovation, including increased productivity, reduced
levels of absence from work, lower levels of stress and fewer incidences of allergic reaction.
In addition to the above social benefits, proper complete energy renovation also makes a positive contribution to
the development of cultural and tourist potentials.
7.3 Environmental benefits Long-term projections for the renovation of building stock have been produced and the environmental impact of
policies and measures assessed for the period leading up to 2030. This analysis contains the first projection of
GHG emissions for Slovenia in accordance with the new IPCC methodology. This contains the modified
emission and greenhouse potential factors from the fourth IPCC assessment report, which entered into use for
international reporting purposes in 2015.
Reduced greenhouse gas emissions
Emissions from existing buildings amounted to 1 208 kt CO2 equivalent in 2015. These will fall to 971 kt CO2
equivalent by 2020 and to 657 kt CO2 equivalent by 2030. This means that emissions will be 58 % lower in 2020
and 72 % lower in 2030 relative to the baseline year of 2005. Total emissions from existing and new buildings
are slightly higher, estimated to be 681 kt in 2030 (a 71 % reduction relative to emissions in 2005).
The projection is lower than the indicative sectoral target set in the OP TGP 2020, as a result of the fact that the
additional measures set out in the AN sNES had not yet been taken into account in the preparation of the OP
TGP 2020.
45 http://www.instituteofhealthequity.org/projects/the-health-impacts-of-cold-homes-and-fuel-poverty. 46 A summary of similar types of study is available from: www.institutebe.com/Building-Performance-
Management/Productivity- Gains-from-Energy-Efficiency.aspx
99
Key: Index
Trend in GHG emissions from the use of fuels in general consumption, Projected GHG emissions from the
use of fuels in existing buildings
Figure 36: Trend in GHG emissions from the use of fuels in existing buildings and the projection for the period
leading up to 2030 (Source: IJS-CEU)
The effects of the planned measures for the energy renovation of existing buildings in the period leading up to
2030 will be considerable, with GHG emissions falling by 551 kt CO2 equivalent (46 %) relative to 2015.
Reduced air pollution
An assessment has been made of the anticipated effects of the planned measures for the energy renovation of
buildings on reducing air pollution levels in the period leading up to 2030 relative to 2015. A reduction in
emissions of the following is expected:
sulphur dioxide – reduction of 572 t (59 %);
nitrogen oxides – reduction of 1 293 t (43 %);
all particles – reduction of 5 043 t, or 53 % (reduction of 4 745 t of primary particles smaller than 2.5
µm (P2.5) and of 4 766 t of primary particles smaller than 10 µm (PM10);
volatile organic substances – reduction of 3 995 t (39 %).
7.4 Benefits for the energy system Energy efficiency measures and the replacement of fossil fuels with renewable energy sources will reduce
dependence on imports. The indicator of dependence on imports will, as a result of measures for the energy
renovation of buildings, improve by 1.3 percentage points in 2020 and by 2.9 percentage points in 2030.
Slovenia is currently 100 % dependent on imports for its petroleum derivatives. The measures mean that there
will be a 49.5 % reduction in the use of fossil fuels in existing buildings by 2020, and an 82 % reduction by
2030. This will lead to a reduction in Slovenia’s imports of petroleum derivatives: a fall of 7 % in 2020 and of
10 % in 2030 in comparison with the import levels that would be seen were the building-related measures not to
be implemented.
Impact on the electricity consumption diagram. Encouraging the installation of heat pumps will change the
need for additional electricity supply capacities and increase demand for electricity in the winter months; it
would therefore be wise to promote the high-efficiency cogeneration of heat and power in district heating
systems at the same time. There could be an additional increase in pressure on peak-time electricity consumption
during periods of very low temperatures.
If one also takes into account the development of intelligent networks, including meters, increased electricity
consumption in transport, both rail and personal transport, and the adjustment of energy systems and energy
supply this requires, we are faced with further challenges to which we will attempt to find answers within the
Energy Concept currently being drawn up.
100
8 ASSUMPTIONS AND METHODOLOGY The projected energy use, the estimate of environmental effects and energy savings, and the values of
investments are based on an analysis of the Long-Term Energy Balance of Slovenia up to 2030 (DB 2030),47
which has been updated for the purpose of compiling this Strategy: (i) a new base year of 2012 has been taken
into account, with partial calibration for 2013 as well, (ii) the assumptions regarding transitions between energy
efficiency classes have been aligned with the AN sNES analysis and (iii) the calculation period has been
extended to 2050. The reference scenario from the DB 2030, which is also the basis for the AN URE 2014–2020,
has been selected as the scenario in the Strategy. The preliminary analyses contain a detailed description of the
overall methodology used to design the projections. Additional explanations of the methodology for calculating
the renovation rate and for assessing the value of investments, as well as a number of assumptions associated
with this, are given in this section.
The task involved the following activities:
a model for projecting energy use in Slovenia in buildings up to 2050 was developed and put into
service for the first time;
the first projection was compiled of GHG emissions for Slovenia in accordance with the new IPCC
methodology. This contains the modified emission and greenhouse potential factors from the fourth
IPCC assessment report, which entered into use for international reporting in 2015.
8.1 Renovation rate The calculations that formed the basis for designing the Strategy assumed an average annual renovation rate of
1.7 % for residential buildings in the 2016–2020 period (1.8 % in 2021–2030, 2.3 % in 2013–2040 and 1.9 % in
2041–2050). This is the weighted annual renovation rate. Energy savings from transitions between energy
classes relative to the maximum reductions for an individual type of building were used for the weightings. The
maximum reduction in energy use is achieved in the course of a transition from the lowest energy class to the
low-energy level. This weighting was used for all transitions between energy classes, except for transitions to the
low-energy level. A weighting of 1 was assumed for all transitions to the low-energy level from any energy
class. Older residential buildings can move between four energy classes in the course of energy renovation,
while newer buildings can move between three.
The weighted average annual renovation rate for buildings in the wider public sector was 1.4 % in the 2016–
2020 and 2021–2030 periods, rising to 1.5 % in 2031–2040 and 2041–2050. In the service sector, the renovation
rate in the 2016–2020 period is, at 1.3 %, slightly lower than in the public sector. In the 2021–2030 period it is
the same as the public sector rate (1.4 %), rising to 1.6 % in 2031–2040, and falling back to 1.4 % again in
2041–2050.
The model places central government entities within building category 12201 (Public administration buildings).
The weighted annual renovation rate for these buildings was 2.3 % in the 2016–2020 and 2021–2030 periods,
2.6 % in 2031–2040 and a mere 0.9 % in 2041–2050 (since all buildings in this sector will have been renovated
in this period). Rates lower than 3 % are the result of the fact that for various reasons it is not possible to
renovate all buildings to a low-energy level. Because of this, they receive a weighting lower than 1 in the
calculation of the weighted rate even though the renovations comply with the requirements of the Directive. The
unweighted renovation rate in this sector is 3 % up to 2040.
A summary of the volume of renovation in the residential sector and the public and private service sectors is
given in figures and tables (Table 20, Table 21, Figure 40, Figure 41).
47 Long-Term Energy Balances up to 2030 and the Expert Foundations for Determining the National Energy Targets. IJS-
CEU, 2014. (http://www.energetika-portal.si/dokumenti/strateski-razvojni-dokumenti/dolgorocno-nacrtovanje-
energetske-politike/)
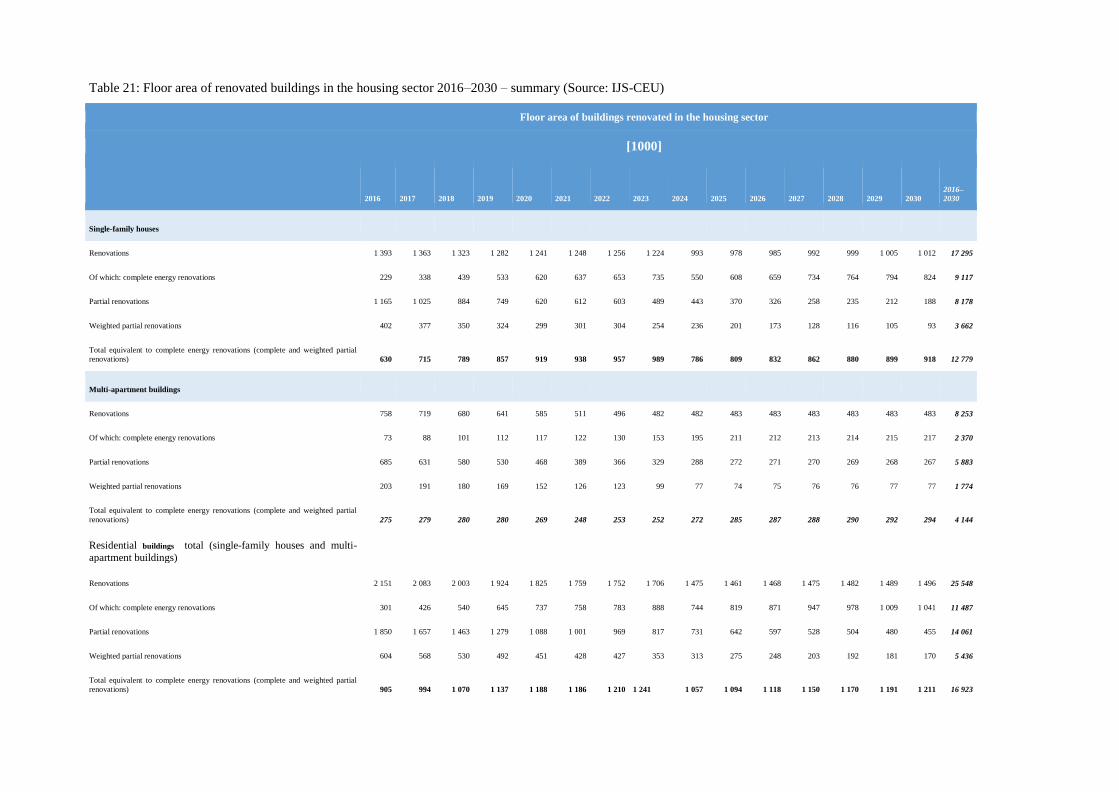
Table 21: Floor area of renovated buildings in the housing sector 2016–2030 – summary (Source: IJS-CEU)
Floor area of buildings renovated in the housing sector
[1000]
2016 2017 2018 2019 2020 2021 2022 2023 2024 2025 2026 2027 2028 2029 2030
2016–
2030
Single-family houses
Renovations 1 393 1 363 1 323 1 282 1 241 1 248 1 256 1 224 993 978 985 992 999 1 005 1 012 17 295
Of which: complete energy renovations 229 338 439 533 620 637 653 735 550 608 659 734 764 794 824 9 117
Partial renovations 1 165 1 025 884 749 620 612 603 489 443 370 326 258 235 212 188 8 178
Weighted partial renovations 402 377 350 324 299 301 304 254 236 201 173 128 116 105 93 3 662
Total equivalent to complete energy renovations (complete and weighted partial
renovations) 630 715 789 857 919 938 957 989 786 809 832 862 880 899 918 12 779
Multi-apartment buildings
Renovations 758 719 680 641 585 511 496 482 482 483 483 483 483 483 483 8 253
Of which: complete energy renovations 73 88 101 112 117 122 130 153 195 211 212 213 214 215 217 2 370
Partial renovations 685 631 580 530 468 389 366 329 288 272 271 270 269 268 267 5 883
Weighted partial renovations 203 191 180 169 152 126 123 99 77 74 75 76 76 77 77 1 774
Total equivalent to complete energy renovations (complete and weighted partial
renovations) 275 279 280 280 269 248 253 252 272 285 287 288 290 292 294 4 144
Residential buildings total (single-family houses and multi-
apartment buildings)
Renovations 2 151 2 083 2 003 1 924 1 825 1 759 1 752 1 706 1 475 1 461 1 468 1 475 1 482 1 489 1 496 25 548
Of which: complete energy renovations 301 426 540 645 737 758 783 888 744 819 871 947 978 1 009 1 041 11 487
Partial renovations 1 850 1 657 1 463 1 279 1 088 1 001 969 817 731 642 597 528 504 480 455 14 061
Weighted partial renovations 604 568 530 492 451 428 427 353 313 275 248 203 192 181 170 5 436
Total equivalent to complete energy renovations (complete and weighted partial
renovations) 905 994 1 070 1 137 1 188 1 186 1 210 1 241 1 057 1 094 1 118 1 150 1 170 1 191 1 211 16 923
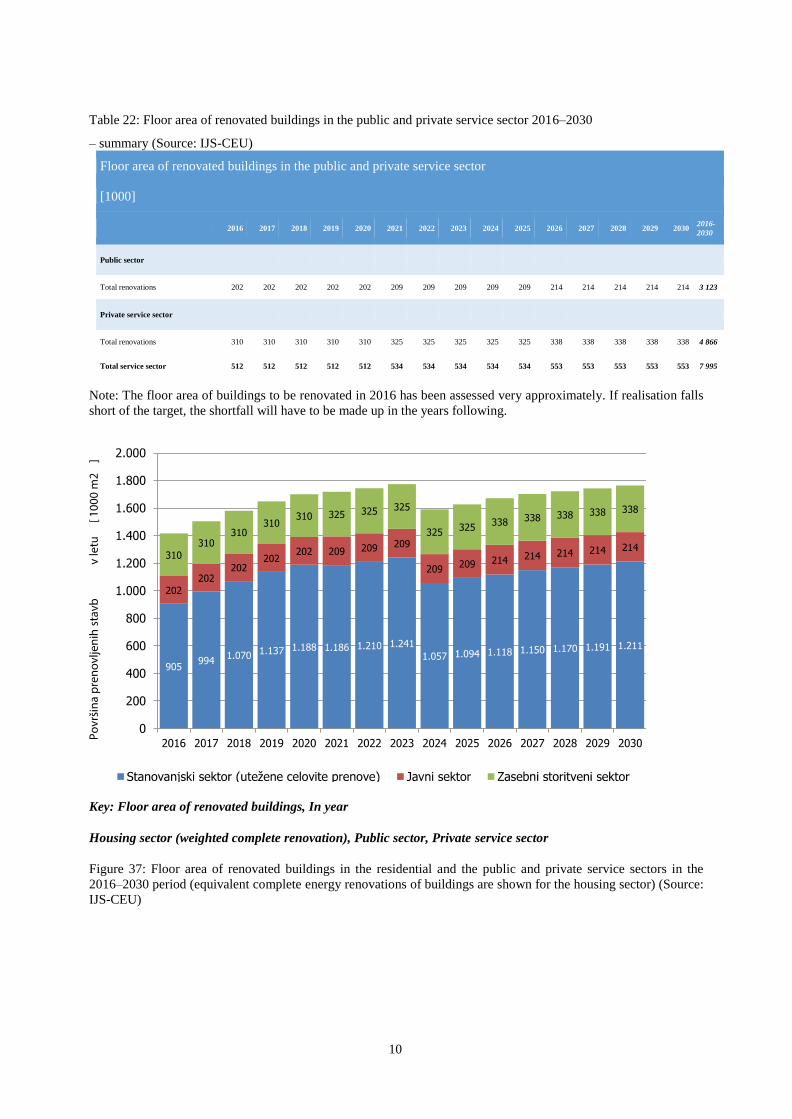
102
Table 22: Floor area of renovated buildings in the public and private service sector 2016–2030
– summary (Source: IJS-CEU)
Floor area of renovated buildings in the public and private service sector
[1000]
2016 2017 2018 2019 2020 2021 2022 2023 2024 2025 2026 2027 2028 2029 2030 2016-
2030
Public sector
Total renovations 202 202 202 202 202 209 209 209 209 209 214 214 214 214 214 3 123
Private service sector
Total renovations 310 310 310 310 310 325 325 325 325 325 338 338 338 338 338 4 866
Total service sector 512 512 512 512 512 534 534 534 534 534 553 553 553 553 553 7 995
Note: The floor area of buildings to be renovated in 2016 has been assessed very approximately. If realisation falls
short of the target, the shortfall will have to be made up in the years following.
Key: Floor area of renovated buildings, In year
Housing sector (weighted complete renovation), Public sector, Private service sector
Figure 37: Floor area of renovated buildings in the residential and the public and private service sectors in the
2016–2030 period (equivalent complete energy renovations of buildings are shown for the housing sector) (Source:
IJS-CEU)
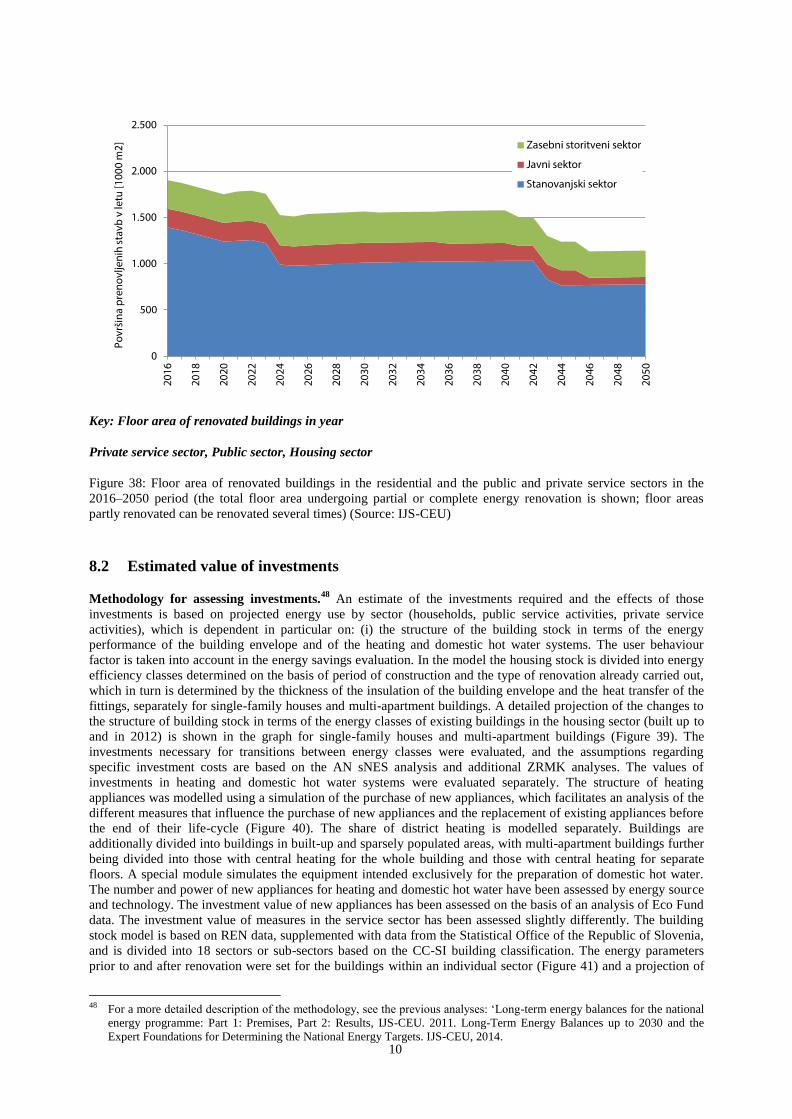
103
Key: Floor area of renovated buildings in year
Private service sector, Public sector, Housing sector
Figure 38: Floor area of renovated buildings in the residential and the public and private service sectors in the
2016–2050 period (the total floor area undergoing partial or complete energy renovation is shown; floor areas
partly renovated can be renovated several times) (Source: IJS-CEU)
8.2 Estimated value of investments Methodology for assessing investments.
48 An estimate of the investments required and the effects of those
investments is based on projected energy use by sector (households, public service activities, private service
activities), which is dependent in particular on: (i) the structure of the building stock in terms of the energy
performance of the building envelope and of the heating and domestic hot water systems. The user behaviour
factor is taken into account in the energy savings evaluation. In the model the housing stock is divided into energy
efficiency classes determined on the basis of period of construction and the type of renovation already carried out,
which in turn is determined by the thickness of the insulation of the building envelope and the heat transfer of the
fittings, separately for single-family houses and multi-apartment buildings. A detailed projection of the changes to
the structure of building stock in terms of the energy classes of existing buildings in the housing sector (built up to
and in 2012) is shown in the graph for single-family houses and multi-apartment buildings (Figure 39). The
investments necessary for transitions between energy classes were evaluated, and the assumptions regarding
specific investment costs are based on the AN sNES analysis and additional ZRMK analyses. The values of
investments in heating and domestic hot water systems were evaluated separately. The structure of heating
appliances was modelled using a simulation of the purchase of new appliances, which facilitates an analysis of the
different measures that influence the purchase of new appliances and the replacement of existing appliances before
the end of their life-cycle (Figure 40). The share of district heating is modelled separately. Buildings are
additionally divided into buildings in built-up and sparsely populated areas, with multi-apartment buildings further
being divided into those with central heating for the whole building and those with central heating for separate
floors. A special module simulates the equipment intended exclusively for the preparation of domestic hot water.
The number and power of new appliances for heating and domestic hot water have been assessed by energy source
and technology. The investment value of new appliances has been assessed on the basis of an analysis of Eco Fund
data. The investment value of measures in the service sector has been assessed slightly differently. The building
stock model is based on REN data, supplemented with data from the Statistical Office of the Republic of Slovenia,
and is divided into 18 sectors or sub-sectors based on the CC-SI building classification. The energy parameters
prior to and after renovation were set for the buildings within an individual sector (Figure 41) and a projection of
48 For a more detailed description of the methodology, see the previous analyses: ‘Long-term energy balances for the national
energy programme: Part 1: Premises, Part 2: Results, IJS-CEU. 2011. Long-Term Energy Balances up to 2030 and the
Expert Foundations for Determining the National Energy Targets. IJS-CEU, 2014.
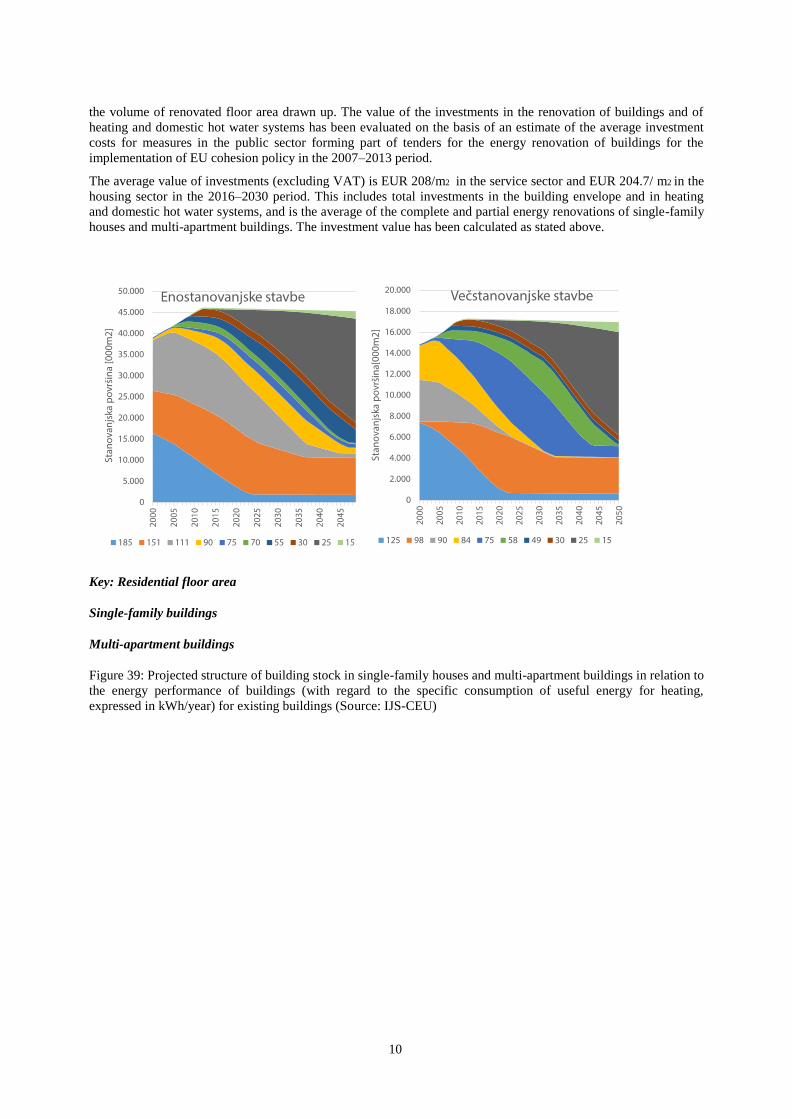
104
the volume of renovated floor area drawn up. The value of the investments in the renovation of buildings and of
heating and domestic hot water systems has been evaluated on the basis of an estimate of the average investment
costs for measures in the public sector forming part of tenders for the energy renovation of buildings for the
implementation of EU cohesion policy in the 2007–2013 period.
The average value of investments (excluding VAT) is EUR 208/m2 in the service sector and EUR 204.7/ m2 in the
housing sector in the 2016–2030 period. This includes total investments in the building envelope and in heating
and domestic hot water systems, and is the average of the complete and partial energy renovations of single-family
houses and multi-apartment buildings. The investment value has been calculated as stated above.
Key: Residential floor area
Single-family buildings
Multi-apartment buildings
Figure 39: Projected structure of building stock in single-family houses and multi-apartment buildings in relation to
the energy performance of buildings (with regard to the specific consumption of useful energy for heating,
expressed in kWh/year) for existing buildings (Source: IJS-CEU)
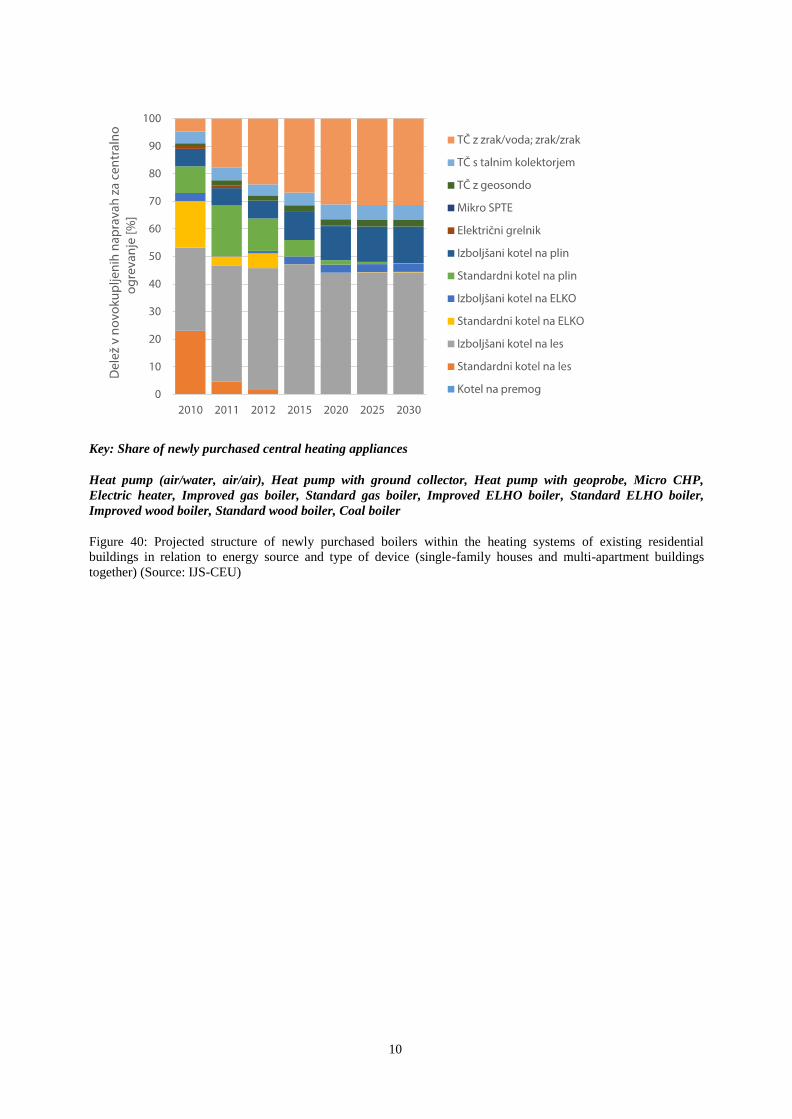
105
Key: Share of newly purchased central heating appliances
Heat pump (air/water, air/air), Heat pump with ground collector, Heat pump with geoprobe, Micro CHP,
Electric heater, Improved gas boiler, Standard gas boiler, Improved ELHO boiler, Standard ELHO boiler,
Improved wood boiler, Standard wood boiler, Coal boiler
Figure 40: Projected structure of newly purchased boilers within the heating systems of existing residential
buildings in relation to energy source and type of device (single-family houses and multi-apartment buildings
together) (Source: IJS-CEU)
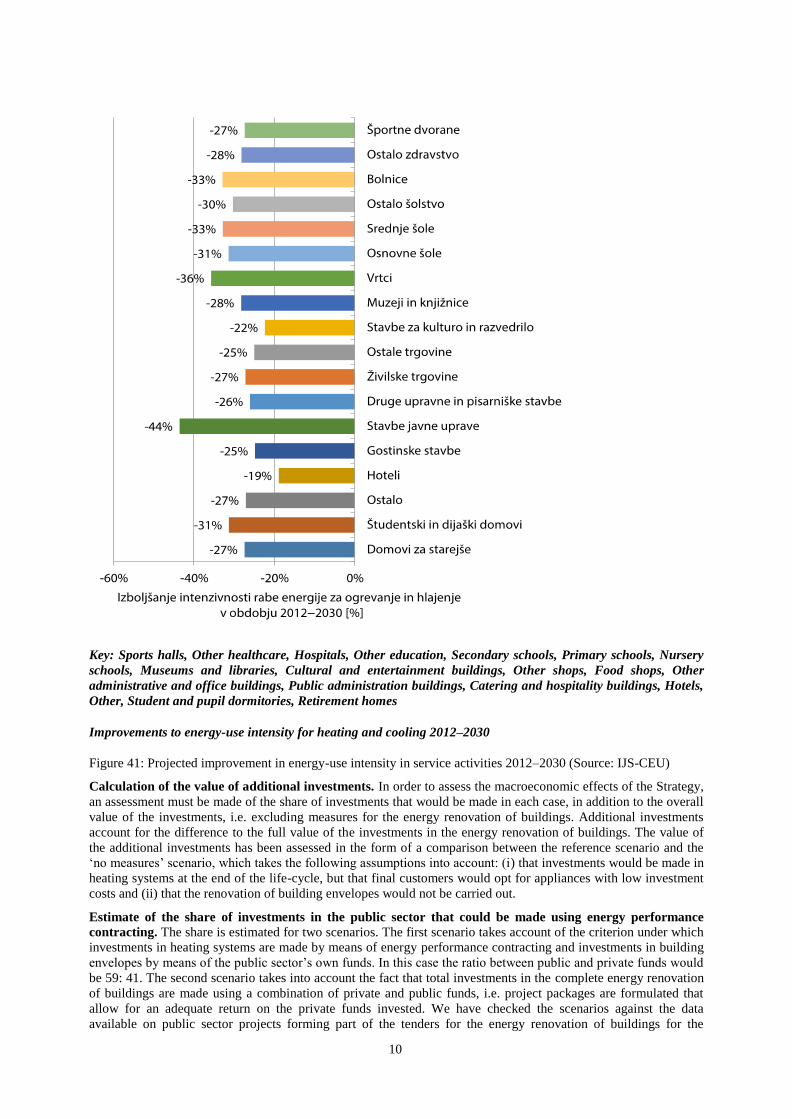
106
Key: Sports halls, Other healthcare, Hospitals, Other education, Secondary schools, Primary schools, Nursery
schools, Museums and libraries, Cultural and entertainment buildings, Other shops, Food shops, Other
administrative and office buildings, Public administration buildings, Catering and hospitality buildings, Hotels,
Other, Student and pupil dormitories, Retirement homes
Improvements to energy-use intensity for heating and cooling 2012–2030
Figure 41: Projected improvement in energy-use intensity in service activities 2012–2030 (Source: IJS-CEU)
Calculation of the value of additional investments. In order to assess the macroeconomic effects of the Strategy,
an assessment must be made of the share of investments that would be made in each case, in addition to the overall
value of the investments, i.e. excluding measures for the energy renovation of buildings. Additional investments
account for the difference to the full value of the investments in the energy renovation of buildings. The value of
the additional investments has been assessed in the form of a comparison between the reference scenario and the
‘no measures’ scenario, which takes the following assumptions into account: (i) that investments would be made in
heating systems at the end of the life-cycle, but that final customers would opt for appliances with low investment
costs and (ii) that the renovation of building envelopes would not be carried out.
Estimate of the share of investments in the public sector that could be made using energy performance
contracting. The share is estimated for two scenarios. The first scenario takes account of the criterion under which
investments in heating systems are made by means of energy performance contracting and investments in building
envelopes by means of the public sector’s own funds. In this case the ratio between public and private funds would
be 59: 41. The second scenario takes into account the fact that total investments in the complete energy renovation
of buildings are made using a combination of private and public funds, i.e. project packages are formulated that
allow for an adequate return on the private funds invested. We have checked the scenarios against the data
available on public sector projects forming part of the tenders for the energy renovation of buildings for the

107
implementation of EU cohesion policy in the 2007–2013 period. In this case, a grant funding level of 66 % would
be required and the entire savings in the energy costs ascribed to the contractual partner. With the appropriate
project selection (energy performance before renovation, value of the energy savings/energy price before
renovation, occupancy level of buildings, etc.) and the optimisation of investments, it would be possible to achieve
a ratio between public and private funds of 60:40.
SOURCES:
– Expert Foundations for the Long-Term Strategy for Mobilising Investments in the Energy Renovation of
Buildings (MzI, 2015, compiled for the MzI by GI ZRMK d.o.o. in collaboration with IJS-CEU and EF)

108
Annex A Premises for formulating the Strategy’s targets (Annex to Section 5.1)
A1.1. Summary of the national targets and the targets under preparation
The annex contains a more detailed description of the national targets already adopted and that provide the
framework for formulating the Long-Term Strategy for Mobilising Investments in the Energy Renovation of
Buildings, and provides additional explanations of the content of Section 5.1.
The national building-related targets from the international obligations previously adopted by Slovenia and to
which the building-related measures will make a significant contribution are summarised in Table A 1.
The following are given for each individual target: the international acts that lay down the obligations, the target
year or years, the indicator used to monitor the target, and the unit, target value and reference national
implementing document. The implementation plan defines in more detail the contributions made by individual
areas to meeting the national targets by setting the indicative targets for sectors or areas, with the building sector
being presented in detail in Table A 2.
The climate and energy package targets (energy efficiency, renewable energy sources and greenhouse gases) are
not presented separately and in detail here, as they are given extensive explanations in the action plans (AN URE
2014−2020, AN OVE 2010−2020, OP TGP 2020). The specific national targets relating solely to buildings are set
by two energy efficiency directives (2010/31/EU and 2012/27/EU). These targets and the above-mentioned
implementing documents are summarised in sub-sections (‘Targets for nearly zero-energy buildings’, ‘Obligation
for buildings owned and occupied by central government’). Since they are less well-known, the air-protection
targets are set out in a separate section (‘Air protection’). These are very important for the formulation of the Long-
Term Strategy for Mobilising Investments in the Energy Renovation of Buildings.
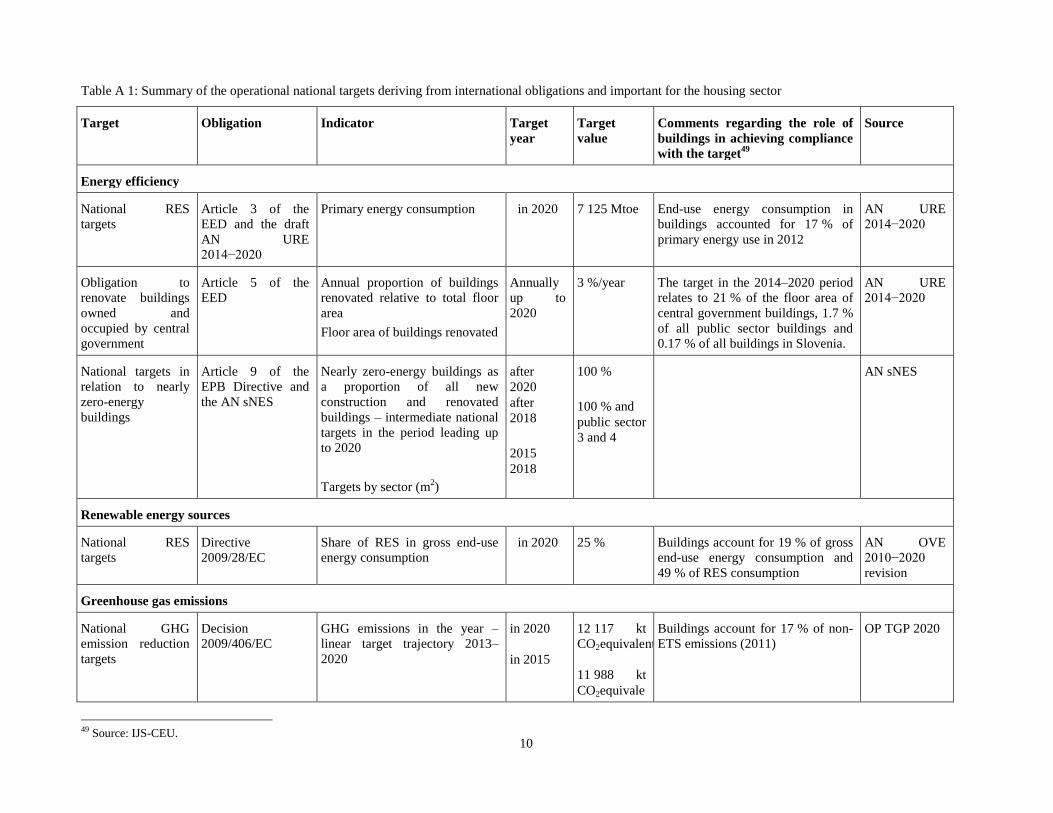
109
Table A 1: Summary of the operational national targets deriving from international obligations and important for the housing sector
Target Obligation Indicator Target
year
Target
value
Comments regarding the role of
buildings in achieving compliance
with the target49
Source
Energy efficiency
National RES
targets
Article 3 of the
EED and the draft
AN URE
2014−2020
Primary energy consumption in 2020 7 125 Mtoe End-use energy consumption in
buildings accounted for 17 % of
primary energy use in 2012
AN URE
2014−2020
Obligation to
renovate buildings
owned and
occupied by central
government
Article 5 of the
EED
Annual proportion of buildings
renovated relative to total floor
area
Floor area of buildings renovated
Annually
up to
2020
3 %/year The target in the 2014–2020 period
relates to 21 % of the floor area of
central government buildings, 1.7 %
of all public sector buildings and
0.17 % of all buildings in Slovenia.
AN URE
2014−2020
National targets in
relation to nearly
zero-energy
buildings
Article 9 of the
EPB Directive and
the AN sNES
Nearly zero-energy buildings as
a proportion of all new
construction and renovated
buildings – intermediate national
targets in the period leading up
to 2020
Targets by sector (m2)
after
2020
after
2018
2015
2018
100 %
100 % and
public sector
3 and 4
AN sNES
Renewable energy sources
National RES
targets
Directive
2009/28/EC
Share of RES in gross end-use
energy consumption
in 2020 25 % Buildings account for 19 % of gross
end-use energy consumption and
49 % of RES consumption
AN OVE
2010−2020
revision
Greenhouse gas emissions
National GHG
emission reduction
targets
Decision
2009/406/EC
GHG emissions in the year –
linear target trajectory 2013–
2020
in 2020
in 2015
12 117 kt
CO2equivalent
11 988 kt
CO2equivale
Buildings account for 17 % of non-
ETS emissions (2011)
OP TGP 2020
49 Source: IJS-CEU.
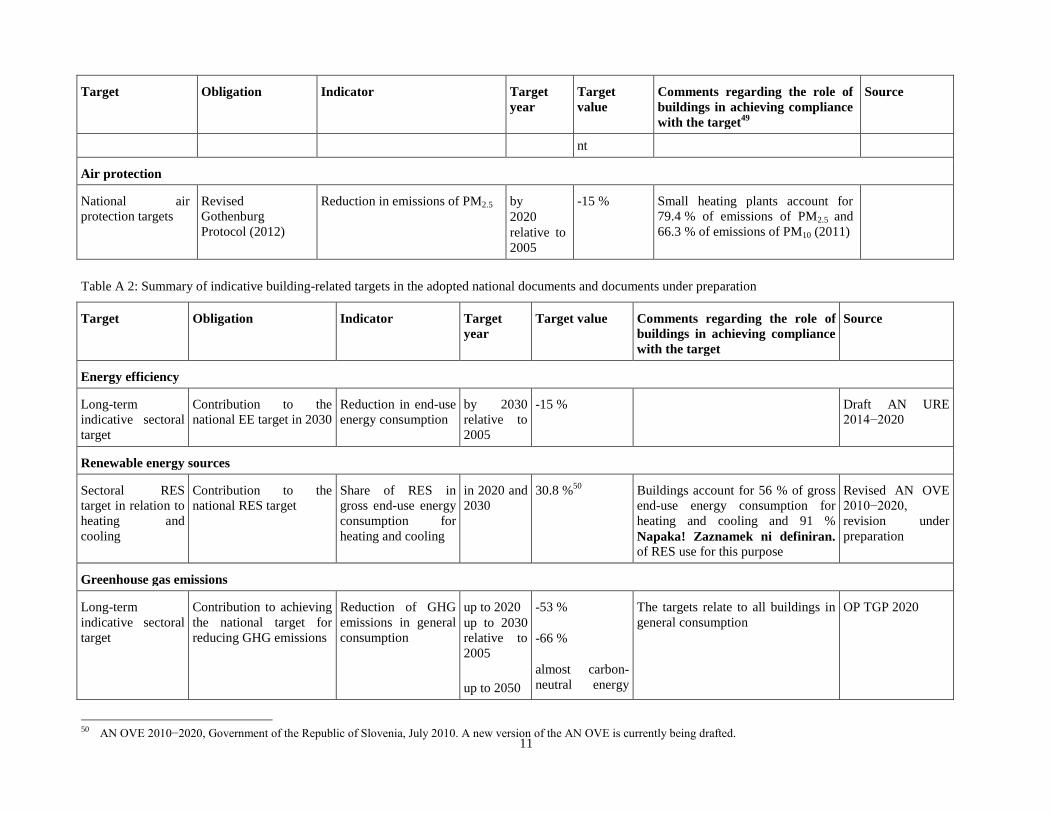
110
Target Obligation Indicator Target
year
Target
value
Comments regarding the role of
buildings in achieving compliance
with the target49
Source
nt
Air protection
National air
protection targets
Revised
Gothenburg
Protocol (2012)
Reduction in emissions of PM2.5 by
2020
relative to
2005
-15 % Small heating plants account for
79.4 % of emissions of PM2.5 and
66.3 % of emissions of PM10 (2011)
Table A 2: Summary of indicative building-related targets in the adopted national documents and documents under preparation
Target Obligation Indicator Target
year
Target value Comments regarding the role of
buildings in achieving compliance
with the target
Source
Energy efficiency
Long-term
indicative sectoral
target
Contribution to the
national EE target in 2030
Reduction in end-use
energy consumption
by 2030
relative to
2005
-15 % Draft AN URE
2014−2020
Renewable energy sources
Sectoral RES
target in relation to
heating and
cooling
Contribution to the
national RES target
Share of RES in
gross end-use energy
consumption for
heating and cooling
in 2020 and
2030
30.8 %50
Buildings account for 56 % of gross
end-use energy consumption for
heating and cooling and 91 %
Napaka! Zaznamek ni definiran.
of RES use for this purpose
Revised AN OVE
2010−2020,
revision under
preparation
Greenhouse gas emissions
Long-term
indicative sectoral
target
Contribution to achieving
the national target for
reducing GHG emissions
Reduction of GHG
emissions in general
consumption
up to 2020
up to 2030
relative to
2005
up to 2050
-53 %
-66 %
almost carbon-
neutral energy
The targets relate to all buildings in
general consumption
OP TGP 2020
50 AN OVE 2010−2020, Government of the Republic of Slovenia, July 2010. A new version of the AN OVE is currently being drafted.
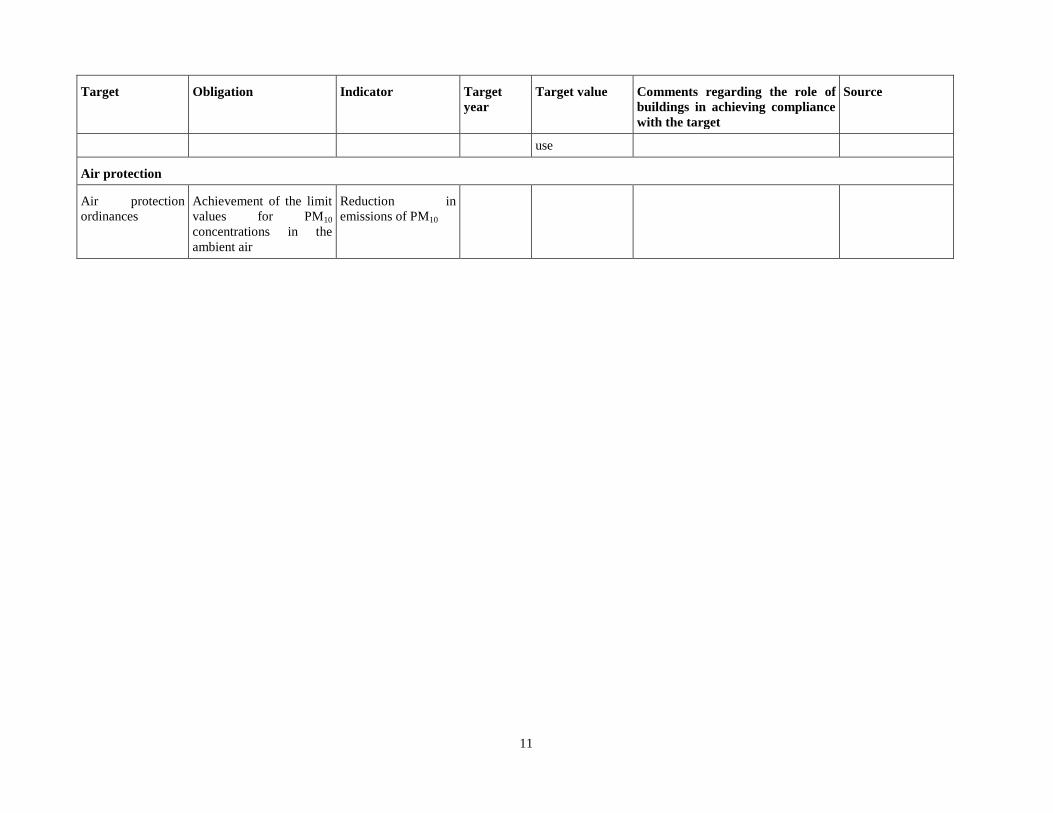
111
Target Obligation Indicator Target
year
Target value Comments regarding the role of
buildings in achieving compliance
with the target
Source
use
Air protection
Air protection
ordinances
Achievement of the limit
values for PM10
concentrations in the
ambient air
Reduction in
emissions of PM10
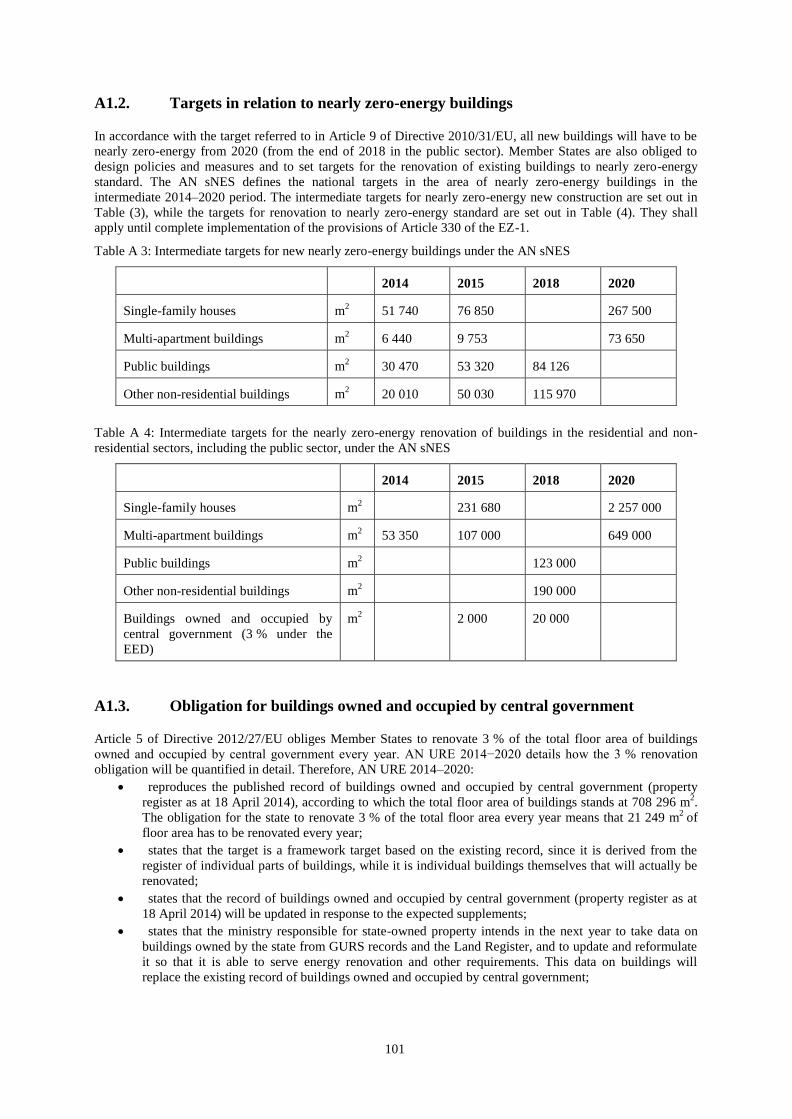
101
A1.2. Targets in relation to nearly zero-energy buildings In accordance with the target referred to in Article 9 of Directive 2010/31/EU, all new buildings will have to be
nearly zero-energy from 2020 (from the end of 2018 in the public sector). Member States are also obliged to
design policies and measures and to set targets for the renovation of existing buildings to nearly zero-energy
standard. The AN sNES defines the national targets in the area of nearly zero-energy buildings in the
intermediate 2014–2020 period. The intermediate targets for nearly zero-energy new construction are set out in
Table (3), while the targets for renovation to nearly zero-energy standard are set out in Table (4). They shall
apply until complete implementation of the provisions of Article 330 of the EZ-1.
Table A 3: Intermediate targets for new nearly zero-energy buildings under the AN sNES
2014 2015 2018 2020
Single-family houses m2
51 740 76 850 267 500
Multi-apartment buildings m2
6 440 9 753 73 650
Public buildings m2
30 470 53 320 84 126
Other non-residential buildings m2
20 010 50 030 115 970
Table A 4: Intermediate targets for the nearly zero-energy renovation of buildings in the residential and non-
residential sectors, including the public sector, under the AN sNES
2014 2015 2018 2020
Single-family houses m2
231 680 2 257 000
Multi-apartment buildings m2
53 350 107 000 649 000
Public buildings m2
123 000
Other non-residential buildings m2
190 000
Buildings owned and occupied by
central government (3 % under the
EED)
m2
2 000 20 000
A1.3. Obligation for buildings owned and occupied by central government Article 5 of Directive 2012/27/EU obliges Member States to renovate 3 % of the total floor area of buildings
owned and occupied by central government every year. AN URE 2014−2020 details how the 3 % renovation
obligation will be quantified in detail. Therefore, AN URE 2014–2020:
reproduces the published record of buildings owned and occupied by central government (property
register as at 18 April 2014), according to which the total floor area of buildings stands at 708 296 m2.
The obligation for the state to renovate 3 % of the total floor area every year means that 21 249 m2
of
floor area has to be renovated every year;
states that the target is a framework target based on the existing record, since it is derived from the
register of individual parts of buildings, while it is individual buildings themselves that will actually be
renovated;
states that the record of buildings owned and occupied by central government (property register as at
18 April 2014) will be updated in response to the expected supplements;
states that the ministry responsible for state-owned property intends in the next year to take data on
buildings owned by the state from GURS records and the Land Register, and to update and reformulate
it so that it is able to serve energy renovation and other requirements. This data on buildings will
replace the existing record of buildings owned and occupied by central government;
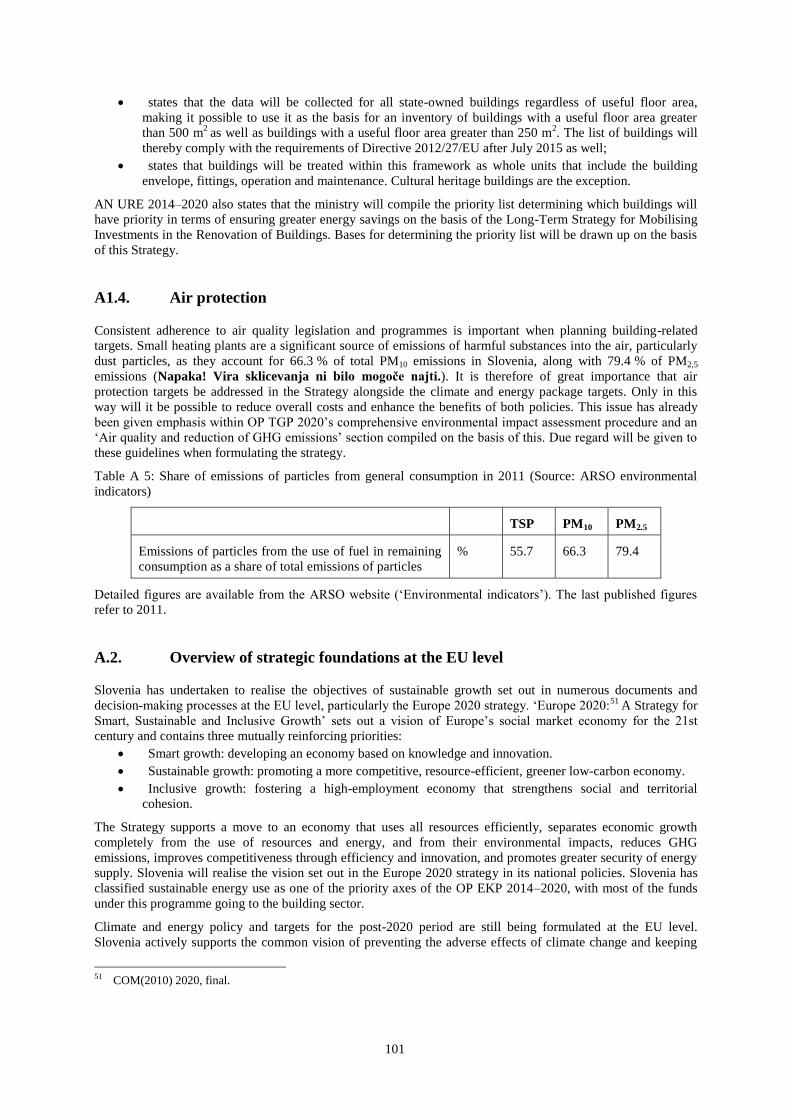
101
states that the data will be collected for all state-owned buildings regardless of useful floor area,
making it possible to use it as the basis for an inventory of buildings with a useful floor area greater
than 500 m2
as well as buildings with a useful floor area greater than 250 m2. The list of buildings will
thereby comply with the requirements of Directive 2012/27/EU after July 2015 as well;
states that buildings will be treated within this framework as whole units that include the building
envelope, fittings, operation and maintenance. Cultural heritage buildings are the exception.
AN URE 2014–2020 also states that the ministry will compile the priority list determining which buildings will
have priority in terms of ensuring greater energy savings on the basis of the Long-Term Strategy for Mobilising
Investments in the Renovation of Buildings. Bases for determining the priority list will be drawn up on the basis
of this Strategy.
A1.4. Air protection Consistent adherence to air quality legislation and programmes is important when planning building-related
targets. Small heating plants are a significant source of emissions of harmful substances into the air, particularly
dust particles, as they account for 66.3 % of total PM10 emissions in Slovenia, along with 79.4 % of PM2,5
emissions (Napaka! Vira sklicevanja ni bilo mogoče najti.). It is therefore of great importance that air
protection targets be addressed in the Strategy alongside the climate and energy package targets. Only in this
way will it be possible to reduce overall costs and enhance the benefits of both policies. This issue has already
been given emphasis within OP TGP 2020’s comprehensive environmental impact assessment procedure and an
‘Air quality and reduction of GHG emissions’ section compiled on the basis of this. Due regard will be given to
these guidelines when formulating the strategy.
Table A 5: Share of emissions of particles from general consumption in 2011 (Source: ARSO environmental
indicators)
TSP PM10 PM2.5
Emissions of particles from the use of fuel in remaining
consumption as a share of total emissions of particles
% 55.7 66.3 79.4
Detailed figures are available from the ARSO website (‘Environmental indicators’). The last published figures
refer to 2011.
A.2. Overview of strategic foundations at the EU level Slovenia has undertaken to realise the objectives of sustainable growth set out in numerous documents and
decision-making processes at the EU level, particularly the Europe 2020 strategy. ‘Europe 2020:51
A Strategy for
Smart, Sustainable and Inclusive Growth’ sets out a vision of Europe’s social market economy for the 21st
century and contains three mutually reinforcing priorities:
Smart growth: developing an economy based on knowledge and innovation.
Sustainable growth: promoting a more competitive, resource-efficient, greener low-carbon economy.
Inclusive growth: fostering a high-employment economy that strengthens social and territorial
cohesion.
The Strategy supports a move to an economy that uses all resources efficiently, separates economic growth
completely from the use of resources and energy, and from their environmental impacts, reduces GHG
emissions, improves competitiveness through efficiency and innovation, and promotes greater security of energy
supply. Slovenia will realise the vision set out in the Europe 2020 strategy in its national policies. Slovenia has
classified sustainable energy use as one of the priority axes of the OP EKP 2014–2020, with most of the funds
under this programme going to the building sector.
Climate and energy policy and targets for the post-2020 period are still being formulated at the EU level.
Slovenia actively supports the common vision of preventing the adverse effects of climate change and keeping
51 COM(2010) 2020, final.
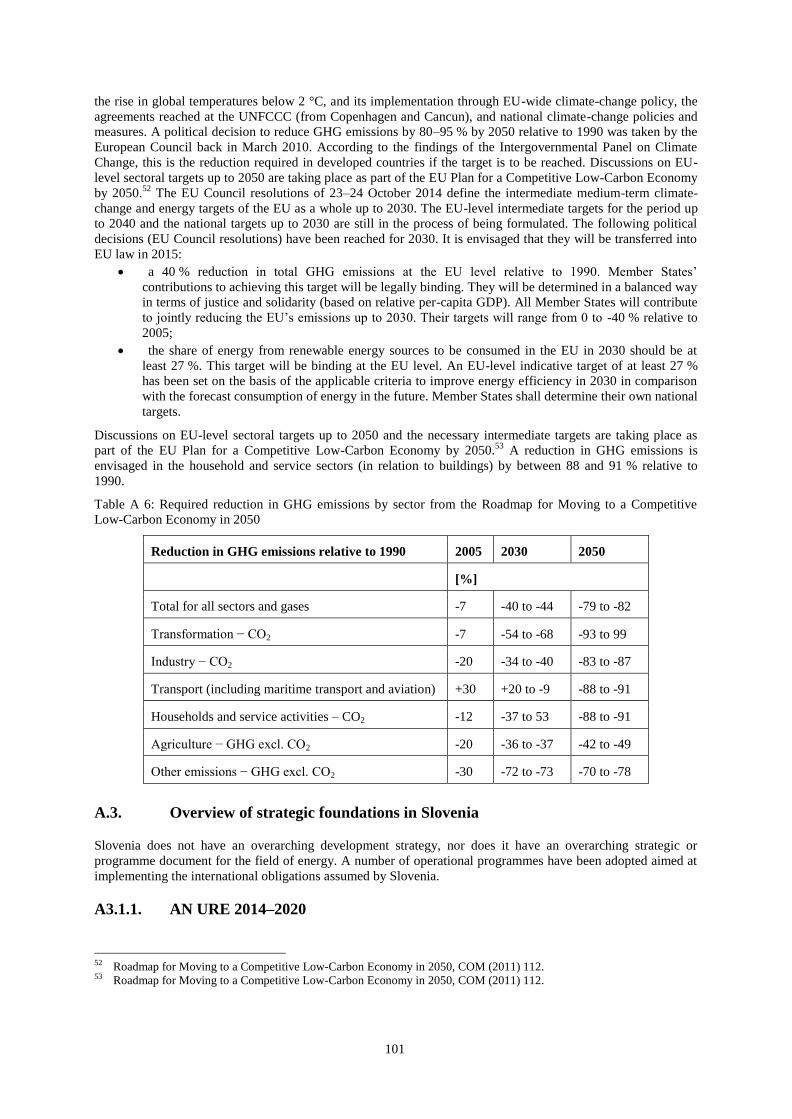
101
the rise in global temperatures below 2 °C, and its implementation through EU-wide climate-change policy, the
agreements reached at the UNFCCC (from Copenhagen and Cancun), and national climate-change policies and
measures. A political decision to reduce GHG emissions by 80–95 % by 2050 relative to 1990 was taken by the
European Council back in March 2010. According to the findings of the Intergovernmental Panel on Climate
Change, this is the reduction required in developed countries if the target is to be reached. Discussions on EU-
level sectoral targets up to 2050 are taking place as part of the EU Plan for a Competitive Low-Carbon Economy
by 2050.52
The EU Council resolutions of 23–24 October 2014 define the intermediate medium-term climate-
change and energy targets of the EU as a whole up to 2030. The EU-level intermediate targets for the period up
to 2040 and the national targets up to 2030 are still in the process of being formulated. The following political
decisions (EU Council resolutions) have been reached for 2030. It is envisaged that they will be transferred into
EU law in 2015:
a 40 % reduction in total GHG emissions at the EU level relative to 1990. Member States’
contributions to achieving this target will be legally binding. They will be determined in a balanced way
in terms of justice and solidarity (based on relative per-capita GDP). All Member States will contribute
to jointly reducing the EU’s emissions up to 2030. Their targets will range from 0 to -40 % relative to
2005;
the share of energy from renewable energy sources to be consumed in the EU in 2030 should be at
least 27 %. This target will be binding at the EU level. An EU-level indicative target of at least 27 %
has been set on the basis of the applicable criteria to improve energy efficiency in 2030 in comparison
with the forecast consumption of energy in the future. Member States shall determine their own national
targets.
Discussions on EU-level sectoral targets up to 2050 and the necessary intermediate targets are taking place as
part of the EU Plan for a Competitive Low-Carbon Economy by 2050.53
A reduction in GHG emissions is
envisaged in the household and service sectors (in relation to buildings) by between 88 and 91 % relative to
1990.
Table A 6: Required reduction in GHG emissions by sector from the Roadmap for Moving to a Competitive
Low-Carbon Economy in 2050
Reduction in GHG emissions relative to 1990 2005 2030 2050
[%]
Total for all sectors and gases -7 -40 to -44 -79 to -82
Transformation − CO2 -7 -54 to -68 -93 to 99
Industry − CO2 -20 -34 to -40 -83 to -87
Transport (including maritime transport and aviation) +30 +20 to -9 -88 to -91
Households and service activities – CO2 -12 -37 to 53 -88 to -91
Agriculture − GHG excl. CO2 -20 -36 to -37 -42 to -49
Other emissions − GHG excl. CO2 -30 -72 to -73 -70 to -78
A.3. Overview of strategic foundations in Slovenia Slovenia does not have an overarching development strategy, nor does it have an overarching strategic or
programme document for the field of energy. A number of operational programmes have been adopted aimed at
implementing the international obligations assumed by Slovenia.
A3.1.1. AN URE 2014–2020
52 Roadmap for Moving to a Competitive Low-Carbon Economy in 2050, COM (2011) 112. 53 Roadmap for Moving to a Competitive Low-Carbon Economy in 2050, COM (2011) 112.
101
The National Energy Efficiency Action Plan up to 2020 is the country’s basic implementing document for
energy efficiency. It is aimed chiefly at ensuring implementation of obligations under Directive 2012/27/EC and
is an update of a document that has already been adopted.54
AN URE 2014−2020, which was adopted by the
government on 21 May 2015, sets out the following objectives in relation to buildings:
The 2020 national energy efficiency target (target under Article 3 of Directive 2012/27/EU): ‘In
accordance with Article 3 of Directive 2012/27/EU, Slovenia has set a target for improving energy
efficiency by 2020 such that primary energy consumption will not exceed 7 125 million toe (82.86 TWh)
in 2020. The national 2020 target is derived from the long-term energy consumption projections up to
2030, which were produced in 2014. This target does not include the non-energy consumption of fuels
and has been based on national energy consumption statistics compiled using the EUROSTAT
methodology.’
The national targets in relation to nearly zero-energy buildings (target under Article 9 of the
Directive 2010/31/EU): these targets are defined in detail in the AN sNES (see Section A1.2 for more
details).
Energy renovation targets under Article 5 of Directive 2012/27/EU (see Section A1.3 for more
details).
Long-term indicative targets for reducing GHG emissions and improving the energy in performance of
buildings. AN URE 2014−2020 incorporates the premises of the Long-Term Strategy for Mobilising
Investments in the Energy Renovation of Buildings, and within it the following targets: ‘To reduce end-
use energy consumption in buildings by 15 % by 2030 and reduce greenhouse gas emissions by 53 % by
2020 relative to 2005, which will require the complete energy renovation of buildings and the continued
replacement of heating oil with low-carbon energy sources. First and foremost, this is a measure aimed
at encouraging rapid economic growth and providing a way out of the crisis. The objective is also to
improve the ratio between subsidies and the effects of investments, especially in the public sector.’
A3.1.2. AN sNES AN sNES (national targets in relation to nearly zero-energy buildings, target under Article 9 of Directive
2010/31/EU, see Section A1.2) was adopted by the government on 22 April 2015.
A3.1.3. OP TGP 2020 The Operational Programme for Reducing Greenhouse Gas Emissions by 2020 defines measures for achieving
the legally binding targets for reducing greenhouse gas emissions by 2020 in accordance with Decision No
406/2009/EC.55
It also includes the outlook up to 2030.
The OP TGP 2020 sets the following targets in relation to buildings:
Indicative sectoral targets up to 2030 and the outlook to 2050: The OP TGP 2020 sets the
indicative sectoral targets for reducing greenhouse gas emissions. These targets are also aligned with
the target of reducing greenhouse gas emissions by 2050 under the Roadmap for Moving to a
Competitive Low-Carbon Economy in 2050.56
The framework of the OP TGP 2020 is provided by
GHG emissions in sectors outside the EU-ETS. It therefore does not include the majority of emissions
from industry. The indicative sectoral targets for reducing greenhouse gas emissions of importance in
relation to buildings are: a 66 % reduction of GHG emissions in general consumption by 2030 relative
to 2005 with the aim of having a carbon-neutral building sector by 2050.
Greenhouse gas emission reduction target up to 2020 in relation to buildings: The target is to
reduce GHG emissions by 53 % by 2020 relative to 2005. This will require the complete energy
renovation of buildings and the continued replacement of heating oil with low-carbon energy sources.
54 AN URE 2008–2016 and AN URE 2010–2016 are based on Directive 2006/32/EC. New obligations have been added to
the new AN URE 2014–2020 in response to the new Directive, and the programming period has been extended to 2013. 55 Decision No 406/2009/EC of the European Parliament and of the Council of 23 April 2009 on the effort of Member
States to reduce their greenhouse gas emissions to meet the Community's greenhouse gas emission reduction commitment
up to 2020 (OJ L 140, 5.6.2009, p. 136). 56 Communication from the Commission to the European Parliament, the Council, the European Economic and Social
Committee and the Committee of the Regions: Roadmap for Moving to a Competitive Low-Carbon Economy in 2050, 8
March 2011.
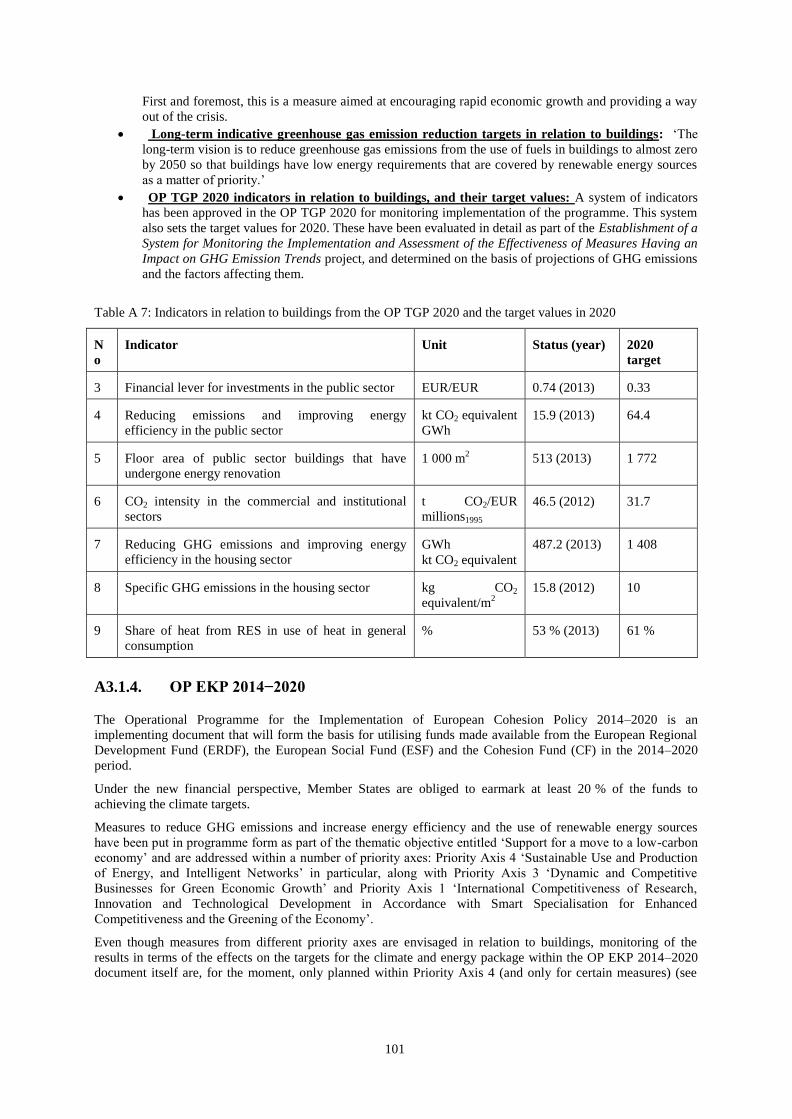
101
First and foremost, this is a measure aimed at encouraging rapid economic growth and providing a way
out of the crisis.
Long-term indicative greenhouse gas emission reduction targets in relation to buildings: ‘The
long-term vision is to reduce greenhouse gas emissions from the use of fuels in buildings to almost zero
by 2050 so that buildings have low energy requirements that are covered by renewable energy sources
as a matter of priority.’
OP TGP 2020 indicators in relation to buildings, and their target values: A system of indicators
has been approved in the OP TGP 2020 for monitoring implementation of the programme. This system
also sets the target values for 2020. These have been evaluated in detail as part of the Establishment of a
System for Monitoring the Implementation and Assessment of the Effectiveness of Measures Having an
Impact on GHG Emission Trends project, and determined on the basis of projections of GHG emissions
and the factors affecting them.
Table A 7: Indicators in relation to buildings from the OP TGP 2020 and the target values in 2020
N
o
Indicator Unit Status (year) 2020
target
3 Financial lever for investments in the public sector EUR/EUR 0.74 (2013) 0.33
4 Reducing emissions and improving energy
efficiency in the public sector
kt CO2 equivalent
GWh
15.9 (2013) 64.4
5 Floor area of public sector buildings that have
undergone energy renovation
1 000 m2
513 (2013) 1 772
6 CO2 intensity in the commercial and institutional
sectors
t CO2/EUR
millions1995
46.5 (2012) 31.7
7 Reducing GHG emissions and improving energy
efficiency in the housing sector
GWh
kt CO2 equivalent
487.2 (2013) 1 408
8 Specific GHG emissions in the housing sector kg CO2
equivalent/m2
15.8 (2012) 10
9 Share of heat from RES in use of heat in general
consumption
% 53 % (2013) 61 %
A3.1.4. OP EKP 2014−2020 The Operational Programme for the Implementation of European Cohesion Policy 2014–2020 is an
implementing document that will form the basis for utilising funds made available from the European Regional
Development Fund (ERDF), the European Social Fund (ESF) and the Cohesion Fund (CF) in the 2014–2020
period.
Under the new financial perspective, Member States are obliged to earmark at least 20 % of the funds to
achieving the climate targets.
Measures to reduce GHG emissions and increase energy efficiency and the use of renewable energy sources
have been put in programme form as part of the thematic objective entitled ‘Support for a move to a low-carbon
economy’ and are addressed within a number of priority axes: Priority Axis 4 ‘Sustainable Use and Production
of Energy, and Intelligent Networks’ in particular, along with Priority Axis 3 ‘Dynamic and Competitive
Businesses for Green Economic Growth’ and Priority Axis 1 ‘International Competitiveness of Research,
Innovation and Technological Development in Accordance with Smart Specialisation for Enhanced
Competitiveness and the Greening of the Economy’.
Even though measures from different priority axes are envisaged in relation to buildings, monitoring of the
results in terms of the effects on the targets for the climate and energy package within the OP EKP 2014–2020
document itself are, for the moment, only planned within Priority Axis 4 (and only for certain measures) (see

101
Table Napaka! Vira sklicevanja ni bilo mogoče najti.). Monitoring of the effects of the planned subsidies on
compliance with the climate and energy targets has not yet been established for the series of measures relating to
buildings.
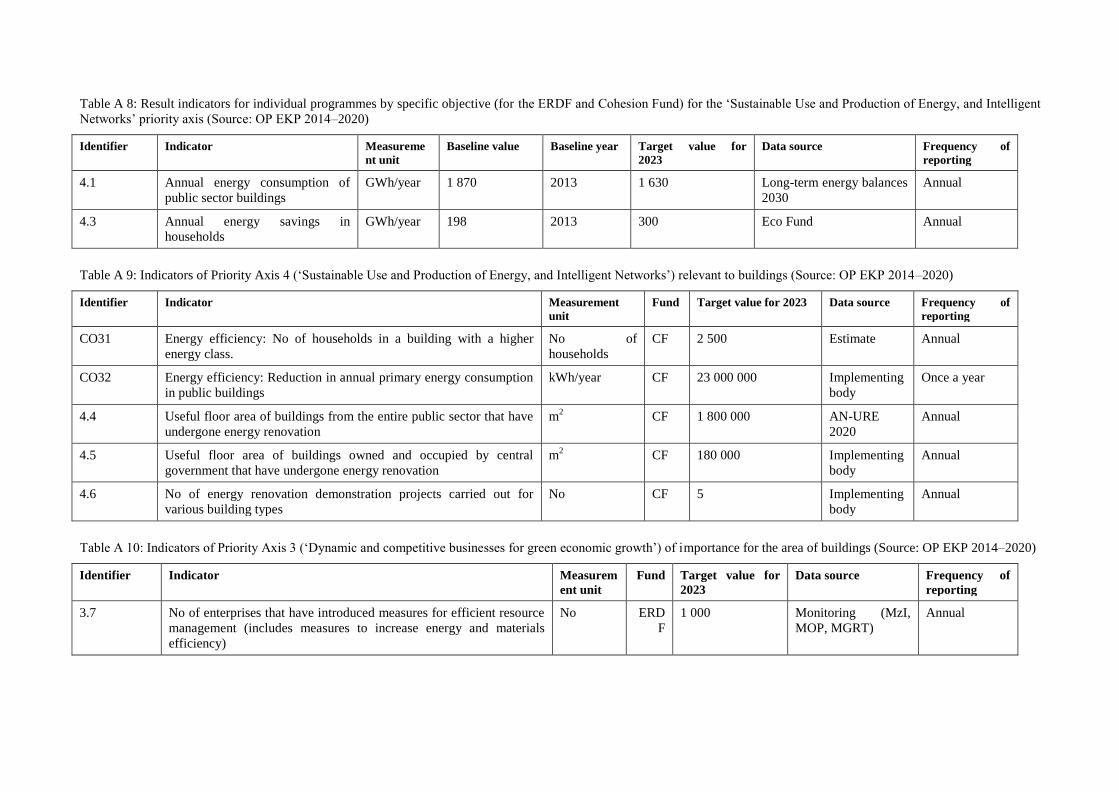
Table A 8: Result indicators for individual programmes by specific objective (for the ERDF and Cohesion Fund) for the ‘Sustainable Use and Production of Energy, and Intelligent
Networks’ priority axis (Source: OP EKP 2014–2020)
Identifier Indicator Measureme
nt unit
Baseline value Baseline year Target value for
2023
Data source Frequency of
reporting
4.1 Annual energy consumption of
public sector buildings
GWh/year 1 870 2013 1 630 Long-term energy balances
2030
Annual
4.3 Annual energy savings in
households
GWh/year 198 2013 300 Eco Fund Annual
Table A 9: Indicators of Priority Axis 4 (‘Sustainable Use and Production of Energy, and Intelligent Networks’) relevant to buildings (Source: OP EKP 2014–2020)
Identifier Indicator Measurement
unit
Fund Target value for 2023 Data source Frequency of
reporting
CO31 Energy efficiency: No of households in a building with a higher
energy class.
No of
households
CF 2 500 Estimate Annual
CO32 Energy efficiency: Reduction in annual primary energy consumption
in public buildings
kWh/year CF 23 000 000 Implementing
body
Once a year
4.4 Useful floor area of buildings from the entire public sector that have
undergone energy renovation
m2
CF 1 800 000 AN-URE
2020
Annual
4.5 Useful floor area of buildings owned and occupied by central
government that have undergone energy renovation
m2
CF 180 000 Implementing
body
Annual
4.6 No of energy renovation demonstration projects carried out for
various building types
No CF 5 Implementing
body
Annual
Table A 10: Indicators of Priority Axis 3 (‘Dynamic and competitive businesses for green economic growth’) of importance for the area of buildings (Source: OP EKP 2014–2020)
Identifier Indicator Measurem
ent unit
Fund Target value for
2023
Data source Frequency of
reporting
3.7 No of enterprises that have introduced measures for efficient resource
management (includes measures to increase energy and materials
efficiency)
No ERD
F
1 000 Monitoring (MzI,
MOP, MGRT)
Annual
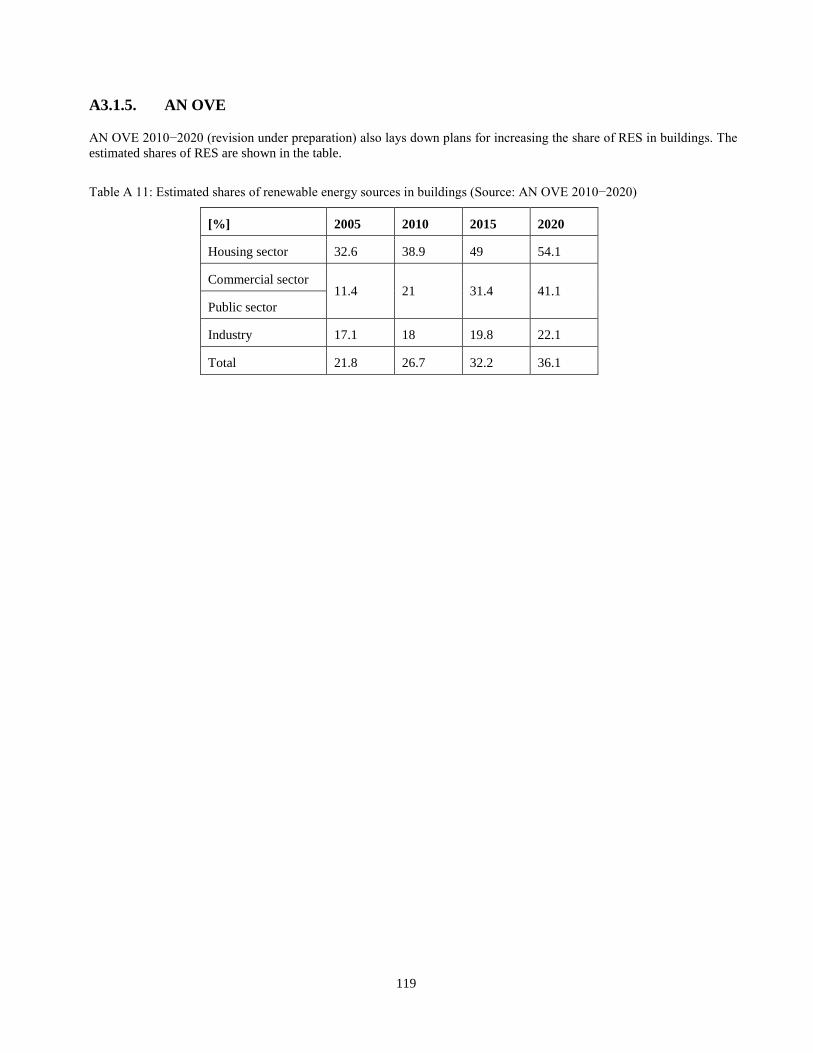
119
A3.1.5. AN OVE AN OVE 2010−2020 (revision under preparation) also lays down plans for increasing the share of RES in buildings. The
estimated shares of RES are shown in the table.
Table A 11: Estimated shares of renewable energy sources in buildings (Source: AN OVE 2010−2020)
[%] 2005 2010 2015 2020
Housing sector 32.6 38.9 49 54.1
Commercial sector 11.4 21 31.4 41.1
Public sector
Industry 17.1 18 19.8 22.1
Total 21.8 26.7 32.2 36.1
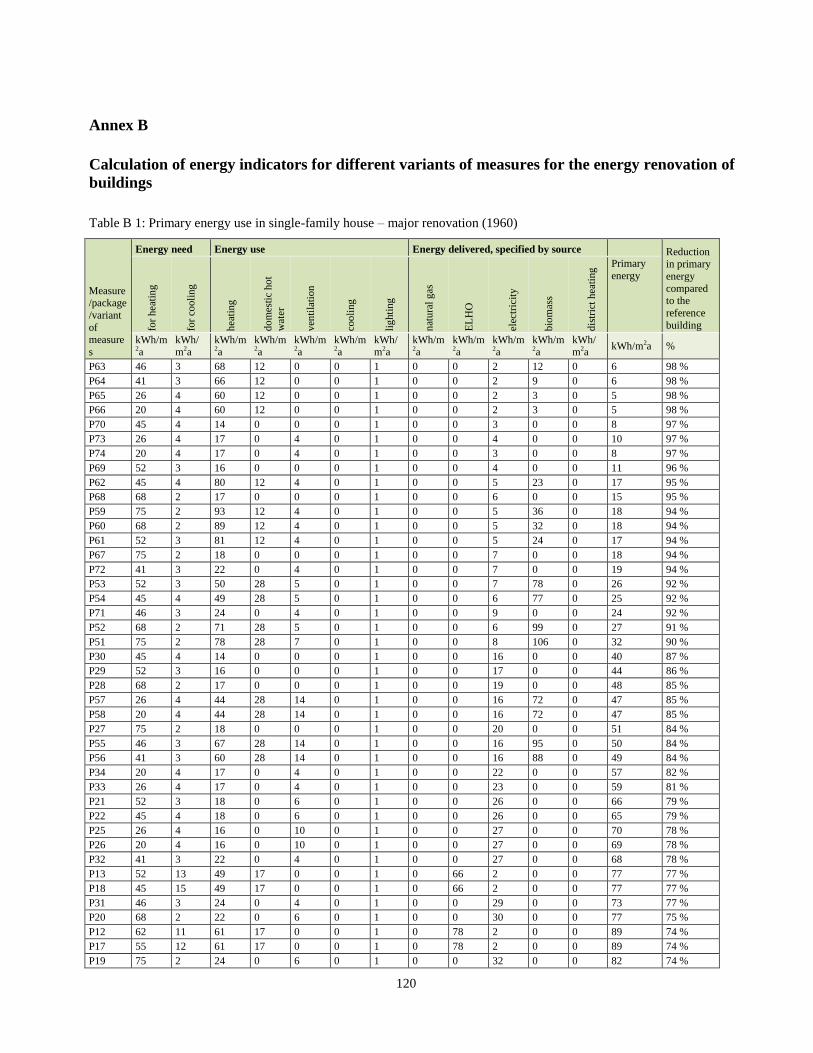
120
Annex B
Calculation of energy indicators for different variants of measures for the energy renovation of
buildings
Table B 1: Primary energy use in single-family house – major renovation (1960)
Measure/package
/variant
of measure
s
Energy need Energy use Energy delivered, specified by source Reduction in primary
energy
compared to the
reference
building for
hea
tin
g
for
cooli
ng
hea
ting
do
mes
tic
ho
t
wat
er
ven
tila
tion
coo
ling
lig
hti
ng
nat
ura
l g
as
EL
HO
elec
tric
ity
bio
mas
s
dis
tric
t h
eati
ng
Primary
energy
kWh/m2a
kWh/m2a
kWh/m2a
kWh/m2a
kWh/m2a
kWh/m2a
kWh/m2a
kWh/m2a
kWh/m2a
kWh/m2a
kWh/m2a
kWh/m2a
kWh/m2a %
P63 46 3 68 12 0 0 1 0 0 2 12 0 6 98 %
P64 41 3 66 12 0 0 1 0 0 2 9 0 6 98 %
P65 26 4 60 12 0 0 1 0 0 2 3 0 5 98 %
P66 20 4 60 12 0 0 1 0 0 2 3 0 5 98 %
P70 45 4 14 0 0 0 1 0 0 3 0 0 8 97 %
P73 26 4 17 0 4 0 1 0 0 4 0 0 10 97 %
P74 20 4 17 0 4 0 1 0 0 3 0 0 8 97 %
P69 52 3 16 0 0 0 1 0 0 4 0 0 11 96 %
P62 45 4 80 12 4 0 1 0 0 5 23 0 17 95 %
P68 68 2 17 0 0 0 1 0 0 6 0 0 15 95 %
P59 75 2 93 12 4 0 1 0 0 5 36 0 18 94 %
P60 68 2 89 12 4 0 1 0 0 5 32 0 18 94 %
P61 52 3 81 12 4 0 1 0 0 5 24 0 17 94 %
P67 75 2 18 0 0 0 1 0 0 7 0 0 18 94 %
P72 41 3 22 0 4 0 1 0 0 7 0 0 19 94 %
P53 52 3 50 28 5 0 1 0 0 7 78 0 26 92 %
P54 45 4 49 28 5 0 1 0 0 6 77 0 25 92 %
P71 46 3 24 0 4 0 1 0 0 9 0 0 24 92 %
P52 68 2 71 28 5 0 1 0 0 6 99 0 27 91 %
P51 75 2 78 28 7 0 1 0 0 8 106 0 32 90 %
P30 45 4 14 0 0 0 1 0 0 16 0 0 40 87 %
P29 52 3 16 0 0 0 1 0 0 17 0 0 44 86 %
P28 68 2 17 0 0 0 1 0 0 19 0 0 48 85 %
P57 26 4 44 28 14 0 1 0 0 16 72 0 47 85 %
P58 20 4 44 28 14 0 1 0 0 16 72 0 47 85 %
P27 75 2 18 0 0 0 1 0 0 20 0 0 51 84 %
P55 46 3 67 28 14 0 1 0 0 16 95 0 50 84 %
P56 41 3 60 28 14 0 1 0 0 16 88 0 49 84 %
P34 20 4 17 0 4 0 1 0 0 22 0 0 57 82 %
P33 26 4 17 0 4 0 1 0 0 23 0 0 59 81 %
P21 52 3 18 0 6 0 1 0 0 26 0 0 66 79 %
P22 45 4 18 0 6 0 1 0 0 26 0 0 65 79 %
P25 26 4 16 0 10 0 1 0 0 27 0 0 70 78 %
P26 20 4 16 0 10 0 1 0 0 27 0 0 69 78 %
P32 41 3 22 0 4 0 1 0 0 27 0 0 68 78 %
P13 52 13 49 17 0 0 1 0 66 2 0 0 77 77 %
P18 45 15 49 17 0 0 1 0 66 2 0 0 77 77 %
P31 46 3 24 0 4 0 1 0 0 29 0 0 73 77 %
P20 68 2 22 0 6 0 1 0 0 30 0 0 77 75 %
P12 62 11 61 17 0 0 1 0 78 2 0 0 89 74 %
P17 55 12 61 17 0 0 1 0 78 2 0 0 89 74 %
P19 75 2 24 0 6 0 1 0 0 32 0 0 82 74 %
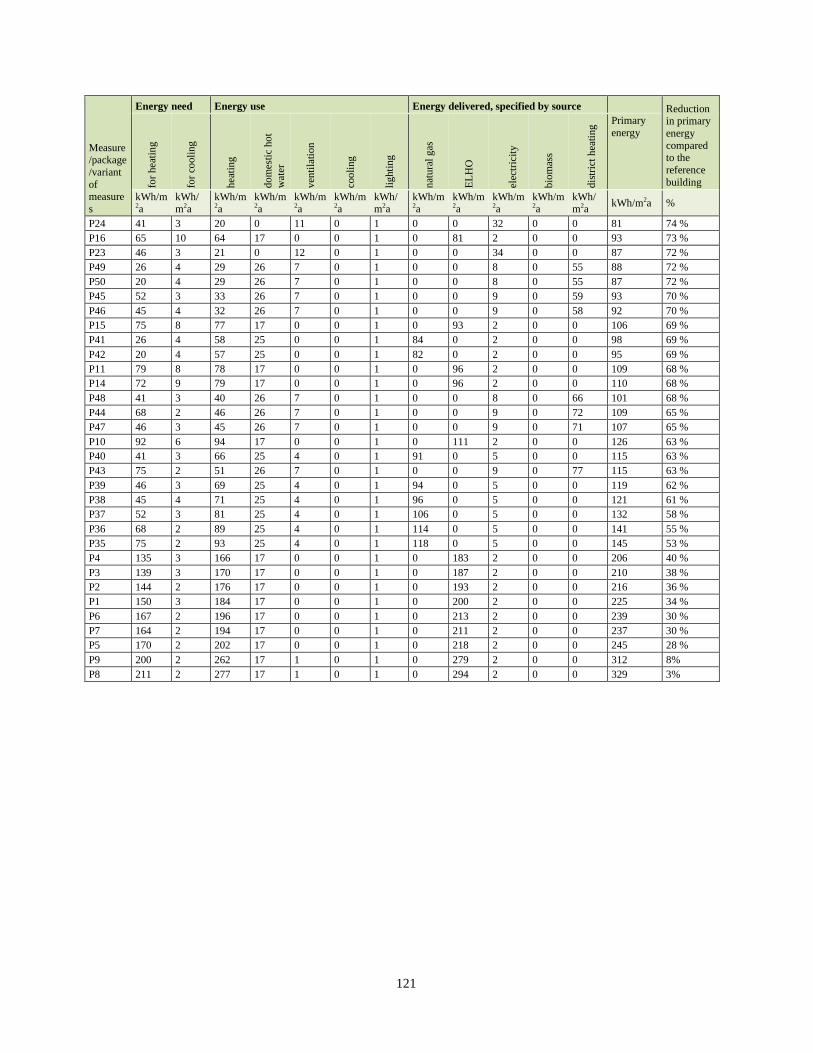
121
Measure/package
/variant
of measure
s
Energy need Energy use Energy delivered, specified by source Reduction in primary
energy
compared to the
reference
building for
hea
tin
g
for
cooli
ng
hea
ting
do
mes
tic
ho
t
wat
er
ven
tila
tion
coo
ling
lig
hti
ng
nat
ura
l g
as
EL
HO
elec
tric
ity
bio
mas
s
dis
tric
t h
eati
ng Primary
energy
kWh/m2a
kWh/m2a
kWh/m2a
kWh/m2a
kWh/m2a
kWh/m2a
kWh/m2a
kWh/m2a
kWh/m2a
kWh/m2a
kWh/m2a
kWh/m2a
kWh/m2a %
P24 41 3 20 0 11 0 1 0 0 32 0 0 81 74 %
P16 65 10 64 17 0 0 1 0 81 2 0 0 93 73 %
P23 46 3 21 0 12 0 1 0 0 34 0 0 87 72 %
P49 26 4 29 26 7 0 1 0 0 8 0 55 88 72 %
P50 20 4 29 26 7 0 1 0 0 8 0 55 87 72 %
P45 52 3 33 26 7 0 1 0 0 9 0 59 93 70 %
P46 45 4 32 26 7 0 1 0 0 9 0 58 92 70 %
P15 75 8 77 17 0 0 1 0 93 2 0 0 106 69 %
P41 26 4 58 25 0 0 1 84 0 2 0 0 98 69 %
P42 20 4 57 25 0 0 1 82 0 2 0 0 95 69 %
P11 79 8 78 17 0 0 1 0 96 2 0 0 109 68 %
P14 72 9 79 17 0 0 1 0 96 2 0 0 110 68 %
P48 41 3 40 26 7 0 1 0 0 8 0 66 101 68 %
P44 68 2 46 26 7 0 1 0 0 9 0 72 109 65 %
P47 46 3 45 26 7 0 1 0 0 9 0 71 107 65 %
P10 92 6 94 17 0 0 1 0 111 2 0 0 126 63 %
P40 41 3 66 25 4 0 1 91 0 5 0 0 115 63 %
P43 75 2 51 26 7 0 1 0 0 9 0 77 115 63 %
P39 46 3 69 25 4 0 1 94 0 5 0 0 119 62 %
P38 45 4 71 25 4 0 1 96 0 5 0 0 121 61 %
P37 52 3 81 25 4 0 1 106 0 5 0 0 132 58 %
P36 68 2 89 25 4 0 1 114 0 5 0 0 141 55 %
P35 75 2 93 25 4 0 1 118 0 5 0 0 145 53 %
P4 135 3 166 17 0 0 1 0 183 2 0 0 206 40 %
P3 139 3 170 17 0 0 1 0 187 2 0 0 210 38 %
P2 144 2 176 17 0 0 1 0 193 2 0 0 216 36 %
P1 150 3 184 17 0 0 1 0 200 2 0 0 225 34 %
P6 167 2 196 17 0 0 1 0 213 2 0 0 239 30 %
P7 164 2 194 17 0 0 1 0 211 2 0 0 237 30 %
P5 170 2 202 17 0 0 1 0 218 2 0 0 245 28 %
P9 200 2 262 17 1 0 1 0 279 2 0 0 312 8%
P8 211 2 277 17 1 0 1 0 294 2 0 0 329 3%
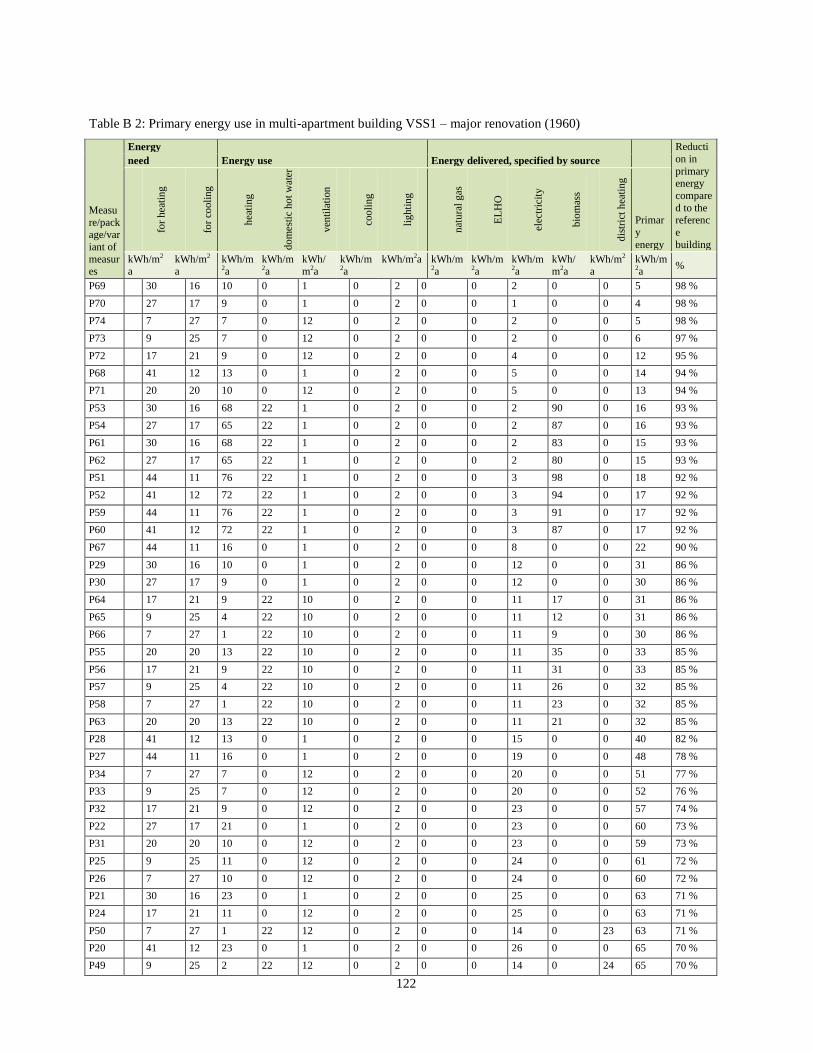
122
Table B 2: Primary energy use in multi-apartment building VSS1 – major renovation (1960)
Measu
re/package/var
iant of
measures
Energy
Energy use Energy delivered, specified by source Reducti
on in
primary energy
compare
d to the referenc
e
building
need
for
hea
tin
g
for
cooli
ng
hea
ting
do
mes
tic
ho
t w
ater
ven
tila
tion
coo
ling
lig
hti
ng
nat
ura
l g
as
EL
HO
elec
tric
ity
bio
mas
s
dis
tric
t h
eati
ng
Primar
y
energy
kWh/m2
a kWh/m2
a kWh/m2a
kWh/m2a
kWh/m2a
kWh/m2a
kWh/m2a kWh/m2a
kWh/m2a
kWh/m2a
kWh/m2a
kWh/m2
a kWh/m2a
%
P69 30 16 10 0 1 0 2 0 0 2 0 0 5 98 %
P70 27 17 9 0 1 0 2 0 0 1 0 0 4 98 %
P74 7 27 7 0 12 0 2 0 0 2 0 0 5 98 %
P73 9 25 7 0 12 0 2 0 0 2 0 0 6 97 %
P72 17 21 9 0 12 0 2 0 0 4 0 0 12 95 %
P68 41 12 13 0 1 0 2 0 0 5 0 0 14 94 %
P71 20 20 10 0 12 0 2 0 0 5 0 0 13 94 %
P53 30 16 68 22 1 0 2 0 0 2 90 0 16 93 %
P54 27 17 65 22 1 0 2 0 0 2 87 0 16 93 %
P61 30 16 68 22 1 0 2 0 0 2 83 0 15 93 %
P62 27 17 65 22 1 0 2 0 0 2 80 0 15 93 %
P51 44 11 76 22 1 0 2 0 0 3 98 0 18 92 %
P52 41 12 72 22 1 0 2 0 0 3 94 0 17 92 %
P59 44 11 76 22 1 0 2 0 0 3 91 0 17 92 %
P60 41 12 72 22 1 0 2 0 0 3 87 0 17 92 %
P67 44 11 16 0 1 0 2 0 0 8 0 0 22 90 %
P29 30 16 10 0 1 0 2 0 0 12 0 0 31 86 %
P30 27 17 9 0 1 0 2 0 0 12 0 0 30 86 %
P64 17 21 9 22 10 0 2 0 0 11 17 0 31 86 %
P65 9 25 4 22 10 0 2 0 0 11 12 0 31 86 %
P66 7 27 1 22 10 0 2 0 0 11 9 0 30 86 %
P55 20 20 13 22 10 0 2 0 0 11 35 0 33 85 %
P56 17 21 9 22 10 0 2 0 0 11 31 0 33 85 %
P57 9 25 4 22 10 0 2 0 0 11 26 0 32 85 %
P58 7 27 1 22 10 0 2 0 0 11 23 0 32 85 %
P63 20 20 13 22 10 0 2 0 0 11 21 0 32 85 %
P28 41 12 13 0 1 0 2 0 0 15 0 0 40 82 %
P27 44 11 16 0 1 0 2 0 0 19 0 0 48 78 %
P34 7 27 7 0 12 0 2 0 0 20 0 0 51 77 %
P33 9 25 7 0 12 0 2 0 0 20 0 0 52 76 %
P32 17 21 9 0 12 0 2 0 0 23 0 0 57 74 %
P22 27 17 21 0 1 0 2 0 0 23 0 0 60 73 %
P31 20 20 10 0 12 0 2 0 0 23 0 0 59 73 %
P25 9 25 11 0 12 0 2 0 0 24 0 0 61 72 %
P26 7 27 10 0 12 0 2 0 0 24 0 0 60 72 %
P21 30 16 23 0 1 0 2 0 0 25 0 0 63 71 %
P24 17 21 11 0 12 0 2 0 0 25 0 0 63 71 %
P50 7 27 1 22 12 0 2 0 0 14 0 23 63 71 %
P20 41 12 23 0 1 0 2 0 0 26 0 0 65 70 %
P49 9 25 2 22 12 0 2 0 0 14 0 24 65 70 %
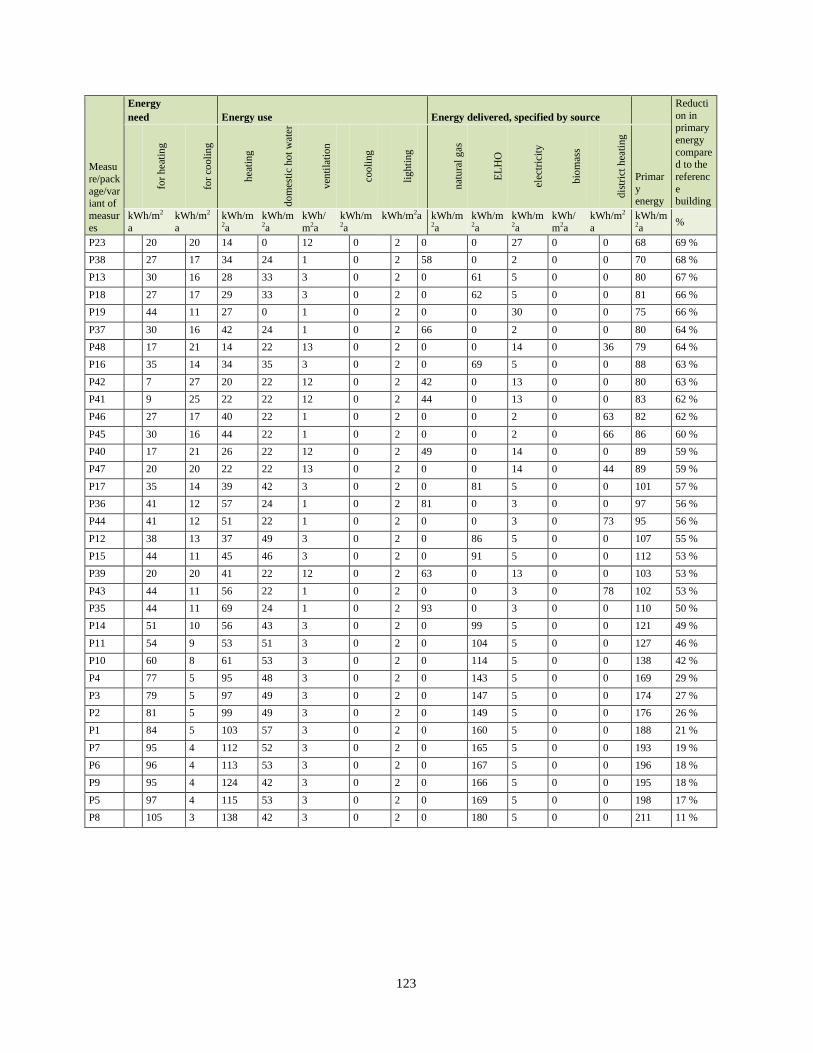
123
Measu
re/pack
age/variant of
measur
es
Energy
Energy use Energy delivered, specified by source Reducti
on in primary
energy
compared to the
referenc
e building
need
for
hea
tin
g
fo
r co
oli
ng
hea
ting
do
mes
tic
ho
t w
ater
ven
tila
tion
coo
ling
lig
hti
ng
nat
ura
l g
as
EL
HO
elec
tric
ity
bio
mas
s
dis
tric
t h
eati
ng
Primar
y energy
kWh/m2
a
kWh/m2
a
kWh/m2a
kWh/m2a
kWh/
m2a
kWh/m2a
kWh/m2a kWh/m2a
kWh/m2a
kWh/m2a
kWh/
m2a
kWh/m2
a
kWh/m2a
%
P23 20 20 14 0 12 0 2 0 0 27 0 0 68 69 %
P38 27 17 34 24 1 0 2 58 0 2 0 0 70 68 %
P13 30 16 28 33 3 0 2 0 61 5 0 0 80 67 %
P18 27 17 29 33 3 0 2 0 62 5 0 0 81 66 %
P19 44 11 27 0 1 0 2 0 0 30 0 0 75 66 %
P37 30 16 42 24 1 0 2 66 0 2 0 0 80 64 %
P48 17 21 14 22 13 0 2 0 0 14 0 36 79 64 %
P16 35 14 34 35 3 0 2 0 69 5 0 0 88 63 %
P42 7 27 20 22 12 0 2 42 0 13 0 0 80 63 %
P41 9 25 22 22 12 0 2 44 0 13 0 0 83 62 %
P46 27 17 40 22 1 0 2 0 0 2 0 63 82 62 %
P45 30 16 44 22 1 0 2 0 0 2 0 66 86 60 %
P40 17 21 26 22 12 0 2 49 0 14 0 0 89 59 %
P47 20 20 22 22 13 0 2 0 0 14 0 44 89 59 %
P17 35 14 39 42 3 0 2 0 81 5 0 0 101 57 %
P36 41 12 57 24 1 0 2 81 0 3 0 0 97 56 %
P44 41 12 51 22 1 0 2 0 0 3 0 73 95 56 %
P12 38 13 37 49 3 0 2 0 86 5 0 0 107 55 %
P15 44 11 45 46 3 0 2 0 91 5 0 0 112 53 %
P39 20 20 41 22 12 0 2 63 0 13 0 0 103 53 %
P43 44 11 56 22 1 0 2 0 0 3 0 78 102 53 %
P35 44 11 69 24 1 0 2 93 0 3 0 0 110 50 %
P14 51 10 56 43 3 0 2 0 99 5 0 0 121 49 %
P11 54 9 53 51 3 0 2 0 104 5 0 0 127 46 %
P10 60 8 61 53 3 0 2 0 114 5 0 0 138 42 %
P4 77 5 95 48 3 0 2 0 143 5 0 0 169 29 %
P3 79 5 97 49 3 0 2 0 147 5 0 0 174 27 %
P2 81 5 99 49 3 0 2 0 149 5 0 0 176 26 %
P1 84 5 103 57 3 0 2 0 160 5 0 0 188 21 %
P7 95 4 112 52 3 0 2 0 165 5 0 0 193 19 %
P6 96 4 113 53 3 0 2 0 167 5 0 0 196 18 %
P9 95 4 124 42 3 0 2 0 166 5 0 0 195 18 %
P5 97 4 115 53 3 0 2 0 169 5 0 0 198 17 %
P8 105 3 138 42 3 0 2 0 180 5 0 0 211 11 %
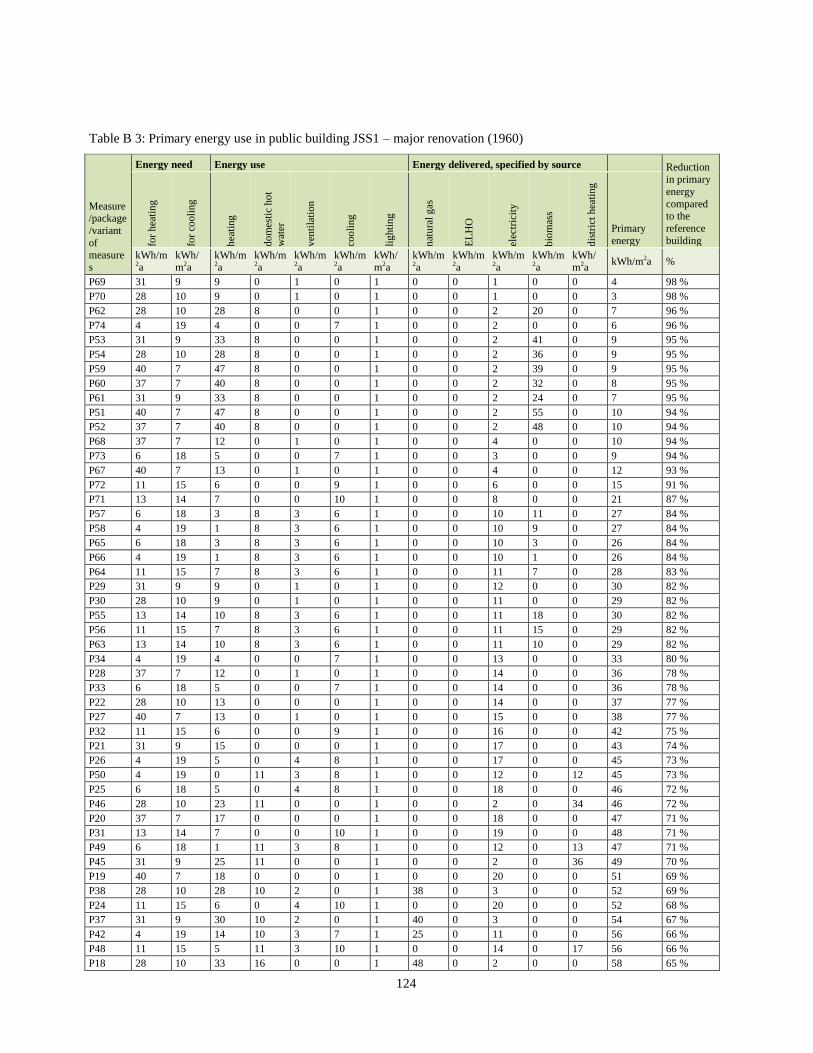
124
Table B 3: Primary energy use in public building JSS1 – major renovation (1960)
Measure/package
/variant
of measure
s
Energy need Energy use Energy delivered, specified by source Reduction
in primary
energy
compared to the
reference
building for
hea
tin
g
for
cooli
ng
hea
ting
do
mes
tic
ho
t
wat
er
ven
tila
tion
coo
ling
lig
hti
ng
nat
ura
l g
as
EL
HO
elec
tric
ity
bio
mas
s
dis
tric
t h
eati
ng
Primary
energy
kWh/m2a
kWh/m2a
kWh/m2a
kWh/m2a
kWh/m2a
kWh/m2a
kWh/m2a
kWh/m2a
kWh/m2a
kWh/m2a
kWh/m2a
kWh/m2a
kWh/m2a %
P69 31 9 9 0 1 0 1 0 0 1 0 0 4 98 %
P70 28 10 9 0 1 0 1 0 0 1 0 0 3 98 %
P62 28 10 28 8 0 0 1 0 0 2 20 0 7 96 %
P74 4 19 4 0 0 7 1 0 0 2 0 0 6 96 %
P53 31 9 33 8 0 0 1 0 0 2 41 0 9 95 %
P54 28 10 28 8 0 0 1 0 0 2 36 0 9 95 %
P59 40 7 47 8 0 0 1 0 0 2 39 0 9 95 %
P60 37 7 40 8 0 0 1 0 0 2 32 0 8 95 %
P61 31 9 33 8 0 0 1 0 0 2 24 0 7 95 %
P51 40 7 47 8 0 0 1 0 0 2 55 0 10 94 %
P52 37 7 40 8 0 0 1 0 0 2 48 0 10 94 %
P68 37 7 12 0 1 0 1 0 0 4 0 0 10 94 %
P73 6 18 5 0 0 7 1 0 0 3 0 0 9 94 %
P67 40 7 13 0 1 0 1 0 0 4 0 0 12 93 %
P72 11 15 6 0 0 9 1 0 0 6 0 0 15 91 %
P71 13 14 7 0 0 10 1 0 0 8 0 0 21 87 %
P57 6 18 3 8 3 6 1 0 0 10 11 0 27 84 %
P58 4 19 1 8 3 6 1 0 0 10 9 0 27 84 %
P65 6 18 3 8 3 6 1 0 0 10 3 0 26 84 %
P66 4 19 1 8 3 6 1 0 0 10 1 0 26 84 %
P64 11 15 7 8 3 6 1 0 0 11 7 0 28 83 %
P29 31 9 9 0 1 0 1 0 0 12 0 0 30 82 %
P30 28 10 9 0 1 0 1 0 0 11 0 0 29 82 %
P55 13 14 10 8 3 6 1 0 0 11 18 0 30 82 %
P56 11 15 7 8 3 6 1 0 0 11 15 0 29 82 %
P63 13 14 10 8 3 6 1 0 0 11 10 0 29 82 %
P34 4 19 4 0 0 7 1 0 0 13 0 0 33 80 %
P28 37 7 12 0 1 0 1 0 0 14 0 0 36 78 %
P33 6 18 5 0 0 7 1 0 0 14 0 0 36 78 %
P22 28 10 13 0 0 0 1 0 0 14 0 0 37 77 %
P27 40 7 13 0 1 0 1 0 0 15 0 0 38 77 %
P32 11 15 6 0 0 9 1 0 0 16 0 0 42 75 %
P21 31 9 15 0 0 0 1 0 0 17 0 0 43 74 %
P26 4 19 5 0 4 8 1 0 0 17 0 0 45 73 %
P50 4 19 0 11 3 8 1 0 0 12 0 12 45 73 %
P25 6 18 5 0 4 8 1 0 0 18 0 0 46 72 %
P46 28 10 23 11 0 0 1 0 0 2 0 34 46 72 %
P20 37 7 17 0 0 0 1 0 0 18 0 0 47 71 %
P31 13 14 7 0 0 10 1 0 0 19 0 0 48 71 %
P49 6 18 1 11 3 8 1 0 0 12 0 13 47 71 %
P45 31 9 25 11 0 0 1 0 0 2 0 36 49 70 %
P19 40 7 18 0 0 0 1 0 0 20 0 0 51 69 %
P38 28 10 28 10 2 0 1 38 0 3 0 0 52 69 %
P24 11 15 6 0 4 10 1 0 0 20 0 0 52 68 %
P37 31 9 30 10 2 0 1 40 0 3 0 0 54 67 %
P42 4 19 14 10 3 7 1 25 0 11 0 0 56 66 %
P48 11 15 5 11 3 10 1 0 0 14 0 17 56 66 %
P18 28 10 33 16 0 0 1 48 0 2 0 0 58 65 %
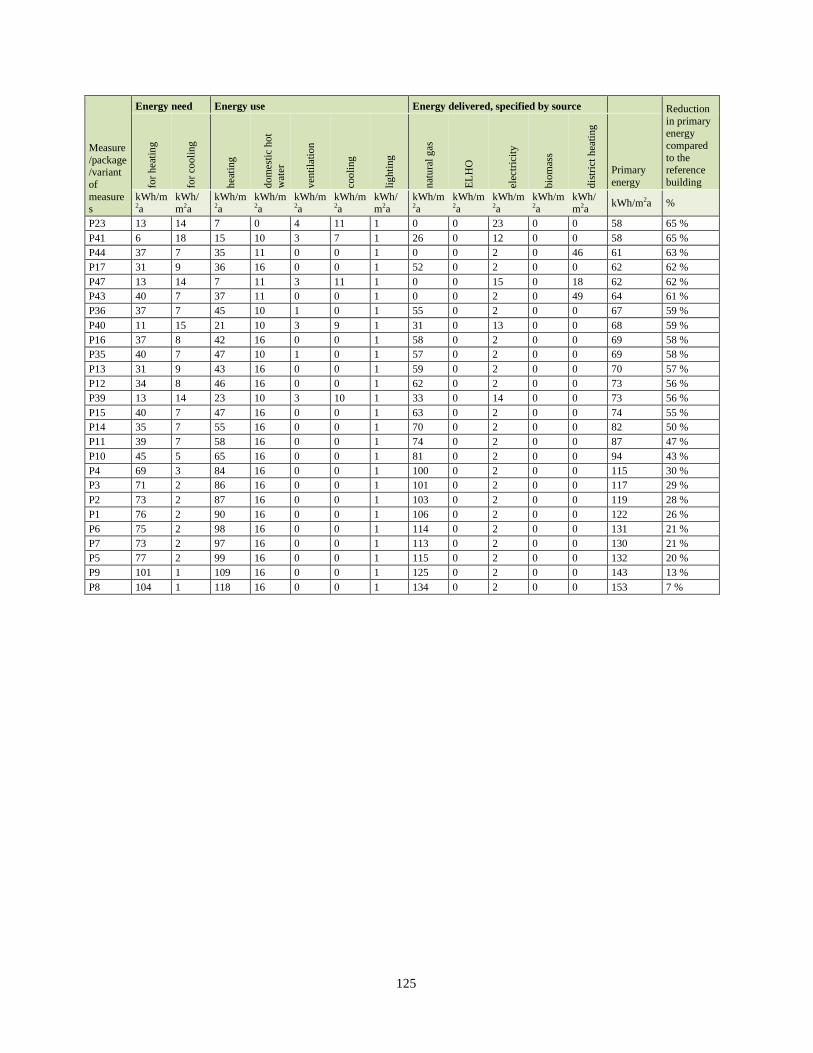
125
Measure
/package/variant
of
measures
Energy need Energy use Energy delivered, specified by source Reduction
in primary energy
compared
to the reference
building for
hea
tin
g
for
cooli
ng
hea
ting
do
mes
tic
ho
t
wat
er
ven
tila
tion
coo
ling
lig
hti
ng
nat
ura
l g
as
EL
HO
elec
tric
ity
bio
mas
s
dis
tric
t h
eati
ng
Primary
energy
kWh/m2a
kWh/m2a
kWh/m2a
kWh/m2a
kWh/m2a
kWh/m2a
kWh/m2a
kWh/m2a
kWh/m2a
kWh/m2a
kWh/m2a
kWh/m2a
kWh/m2a %
P23 13 14 7 0 4 11 1 0 0 23 0 0 58 65 %
P41 6 18 15 10 3 7 1 26 0 12 0 0 58 65 %
P44 37 7 35 11 0 0 1 0 0 2 0 46 61 63 %
P17 31 9 36 16 0 0 1 52 0 2 0 0 62 62 %
P47 13 14 7 11 3 11 1 0 0 15 0 18 62 62 %
P43 40 7 37 11 0 0 1 0 0 2 0 49 64 61 %
P36 37 7 45 10 1 0 1 55 0 2 0 0 67 59 %
P40 11 15 21 10 3 9 1 31 0 13 0 0 68 59 %
P16 37 8 42 16 0 0 1 58 0 2 0 0 69 58 %
P35 40 7 47 10 1 0 1 57 0 2 0 0 69 58 %
P13 31 9 43 16 0 0 1 59 0 2 0 0 70 57 %
P12 34 8 46 16 0 0 1 62 0 2 0 0 73 56 %
P39 13 14 23 10 3 10 1 33 0 14 0 0 73 56 %
P15 40 7 47 16 0 0 1 63 0 2 0 0 74 55 %
P14 35 7 55 16 0 0 1 70 0 2 0 0 82 50 %
P11 39 7 58 16 0 0 1 74 0 2 0 0 87 47 %
P10 45 5 65 16 0 0 1 81 0 2 0 0 94 43 %
P4 69 3 84 16 0 0 1 100 0 2 0 0 115 30 %
P3 71 2 86 16 0 0 1 101 0 2 0 0 117 29 %
P2 73 2 87 16 0 0 1 103 0 2 0 0 119 28 %
P1 76 2 90 16 0 0 1 106 0 2 0 0 122 26 %
P6 75 2 98 16 0 0 1 114 0 2 0 0 131 21 %
P7 73 2 97 16 0 0 1 113 0 2 0 0 130 21 %
P5 77 2 99 16 0 0 1 115 0 2 0 0 132 20 %
P9 101 1 109 16 0 0 1 125 0 2 0 0 143 13 %
P8 104 1 118 16 0 0 1 134 0 2 0 0 153 7 %