Embed Size (px)
Citation preview

Public Expenditure Series 8 of 8
CHILD-CENTRED
INVESTMENTS TO
ACHIEVE TARGETS
OF VISION 2024
BY DEPARTMENT
OF WD AND CW,
GOVERNMENT OF
TELANGANA
A Policy Brief
Understanding the progress of child development in the state in terms of its Vision 2024 and SDGs through child development indicators and progress of child-centred schemes implemented by the Department of Women Development and Child Welfare (WD&CW).
Telangana is the 29th and the youngest state in India, formed on 2 June 20141. The Telangana region was part of the Hyderabad state from 17 September 1948 to 01 November 1956, until it was merged with Andhra state to form the state of Andhra Pradesh. Telangana emerged as separate state as per the Andhra Pradesh Reorganization Act, 2014 (no.6 of 2014) of Parliament with the city of Hyderabad as its capital. The state reorganised its districts from 10 to 31, on 11 October 2016, and two districts were added in February 2019 to take the number of districts to 33. The state’s population is 3.50 crore2, with 1.76 crore males and 1.74 crore females; it is the twelfth largest state in terms of both area and size of population in India. The Scheduled
Caste (SC) population constitutes 15.45% of the total population, while Scheduled Tribes (ST) constitute 9.07% of the total population. Telangana’s Gross State Domestic Product (GSDP)3 was Rs 5.06 lakh crore in 2014-15 (at current prices), and it increased to Rs 9.7 lakh crore in 2019-20, exhibiting a growth rate of 12.6% over the previous year. All-India Gross Domestic Product (GDP) was Rs 124.67 lakh crore in 2014-15, and it increased to further to Rs 203.84 lakh crore in 2019-20, recording a growth of 7.5% over the previous year. The Per Capita Income (PCI) of Telangana is much higher than the all-India average over the years. The PCI of the state increased from Rs 1.24 lakh in the year 2014-15 to Rs 2.28 lakh in the year 2019-20, registering a growth rate of 11.6% over the previous year.
Introduction
Telangana envisaged a comprehensive, inclusive and complete development of its people and by way of achieving the vision of Bangaru Telangana (Golden Telangana) by 2024. Government of Telangana has taken up initiatives to accelerate the economic growth, to improve the infrastructure facilities and programmes targeting social welfare, and to facilitate inclusive growth. The government has aligned the state’s priorities with Sustainable Development Goals (SDGs) and is focusing on achieving them on time. The state has created a Centre for Sustainable Development Goals at Dr. Marri Channa Reddy Human Resource Development Institute (MCRHRDIT), a premier institute for training civil servants in the state. The government is working towards development Vision 2024, to reach the SDG goals by 2030. The state government has initiated several social development measures to help in achieving the SDGs. A few significant initiatives on this front are Aasara Pensions, Arogya Laxmi, Revamped Food Security scheme, Kalyana Lakshmi/Shaadi Mubarak, Double–Bedroom housing for poor, Mission Bhagiratha, and Mission Kakatiya.
This study looks into the goals set for Vision 2024 and the progress across different indicators that are being targeted, including the expenditure incurred, and it analyses the investment requirements for the coming years that would facilitate in realising the goals. The study also conducts a trend analysis from 2014-15 on the investments/expenditure related to nutrition and child protection aligned to SDG goals 2 and 5. This takes the annual projections for population, change in nutrition statistics, and other relevant indicators into account.
The specific objectives of the study are as follows:
Analysis of expenditures of child-centred schemes of the Department of WD&CW focusing on nutrition and child protection.
Estimation of child-centred investment to achieve nutrition and child protection targets by 2024.
The study involved the following steps:
1. Analysis of indicators of nutrition and health and child protection across districts of the state.
2. Understanding of the schemes of the Department of WD&CW with links to nutrition, health, and other social indicators.
3. Budget analysis to understand the investments by the Department of WD&CW over the years.
4. Projections of investment required for the coming years, 2021 to 2024.
1
2
31 Statistical Year Book, 2017. https://www.telangana.gov.in/PDFDocuments/Statistical-Year-Book-2017.pdf.
2 Telangana Statistical Abstract 2020.
3 Socio economic outlook 2020. https://www.telangana.gov.in/PDFDocuments/Telangana-Socio-Economic-Outlook-2020.pdf.
Indicators
Ad
ilab
ad
Niz
amab
ad
Kar
imn
agar
Med
ak
Hyd
erab
ad
Ran
ga R
edd
y
Mah
bu
bn
agar
Nal
gon
da
War
anga
l
Kh
amm
am
Women aged 20-24 years married before age 18 years (%) 29.9 24.9 13.4 36.3 12.1 23.0 41.3 40.9 27.6 32.4
Women aged 15-19 years who were already mothers or pregnant at the time of the survey (%)
12.9 8.5 4.4 7.5 6.8 8.6 15.1 15.4 13.7 16.9
Children under 5 years of age who are stunted (height-for-age) (%) 38.3 36.6 24.3 33.4 16.4 26.2 37.1 28.9 26.6 26.5
Children under 5 years of age who are wasted (weight-for-height) (%) 22.1 22.0 19.3 20.7 15.0 14.8 18.6 23.1 16.6 13.7
Maternal Mortality Ratio 152 79 74 90 71 78 98 90 78 99Households with an improved drink-ing-water source (%) 85.0 82.3 69.9 85.2 91.0 80.7 71.0 54.4 73.3 84.5
Households using improved sanitation facility (%) 30.7 42.3 53.9 53.3 72.6 51.2 32.8 50.1 46.9 50.3
Mothers who had full antenatal care (%) 30.6 35.1 32.5 30.9 60.6 43.0 36.0 29.2 60.7 45.1
Institutional births (%) 70.8 91.6 95.6 91.0 97.5 95.3 78.4 94.5 96.0 94.2Children aged 12-23 months fully immunized (BCG, measles, and 3 doses each of polio and DPT) (%)
70.0 64.2 84.3 81.4 67.9 68.1 45.0 69.0 67.0 62.4
Total children aged 6-23 months receiving an adequate diet (%) 5.4 4.8 2.9 11.9 26.1 6.3 7.6 6.9 6.5 14.4
CBPS NUTRTION INDEX VALUE 0.24 0.42 0.46 0.50 0.93 0.61 0.26 0.30 0.56 0.54RANK 10 7 6 5 1 2 9 8 3 4
Source: Centre for Budget and Policy Studies (CBPS) Nutrition Index has been created through calculations using National Family Health Survey (NFHS) 4 district wise report
Understanding of Child Development in Telangana in terms of its vision 2024 and SDG progress
Table 1. Nutrition Index: District Wise values of various indicators, index value, and rank (erstwhile 10 districts)
Child-Centred Investments to achieve targets of vision 2024 by Department of WD and CW, Government of Telangana 3

Hyderabad district ranked first with an index value of 0.93. The district stood first in 7 of the 11 indicators. Ranga Reddy came the second with the index value of 0.61, and it was followed by Warangal (0.56), Khammam (0.54) and Medak (0.50). In Adilabad district, the delivery and maternity care is very low with 70.8%t institutional births, which is lowest among the districts. It was also the lowest in sanitation apart from highest stunting percentage and Maternal Mortality Ratio (MMR). Adilabad ranked lowest among the districts with an index value of 0.24.
An analysis of the nutrition indicators of the state from the Comprehensive National Nutrition Survey (CNNS) (2016-18) was undertaken to understand the status of the state in comparison with the all-India figures. The state had performed very well in terms of mortality indicators as well as the proportion of children under five who are stunted, wasted, and underweight in comparison with all-India figures. However, the indicators of adolescent nutrition indicated that the state is lagging behind the national average. The indicators of anaemia and vitamin A deficiency among adolescent boys and girls as well as underweight adolescents were poor than the national average, while obesity among adolescents was higher than the national average.
Districts Share of BPL Estimated 1
Estimates of Population 2019-20
2019 0–6 years age group
ICDSTarget2 Beneficiaries
(6–59 months)
Actual coverage share (%)
Coverage over BPL (target)
Adilabad 35% 29,15,467 3,29,662 1,13,736 1,64,449 50% 145%
Hyderabad 6% 41,93,540 4,98,894 27,865 67,575 14% 243%
Karimnagar 12% 35,50,336 3,16,818 38,408 1,21,657 38% 317%
Khammam 17% 26,27,687 2,62,609 43,815 1,11,943 43% 255%
Mahbubnagar 30% 37,60,681 4,89,131 1,44,453 1,65,839 34% 115%
Medak 22% 35,16,969 4,17,618 93,831 1,52,676 37% 163%
Nalgonda 21% 37,10,186 3,95,323 84,830 1,21,950 31% 144%
Nizamabad 24% 27,05,050 2,99,136 72,232 1,24,517 42% 172%
Ranga Reddy 7% 61,82,363 7,44,902 48,434 1,80,941 24% 374%
Warangal 17% 40,62,784 3,92,489 68,301 1,32,103 34% 193%
State 17% 3,72,25,062 41,46,581 7,35,905 13,43,650 32% 183%
1: The Below Poverty Line (BPL) population estimates were used from multi-dimensional poverty estimation -using the data of health, education and standard of living dimensions done by Alkire et al., University of Oxford.2: The target population for ICDS estimated using BPL population proportion (assuming same for 0–6 years age group).
Review of schemes of Department of Women Development and Child WelfareThe estimates of proportion of Below Poverty Line (BPL) population calculated as a part of Multi-dimensional Poverty Index using the health, education and standard of living indicators by Alkire et al.,4 was used to understand the reach of reach of Supplementary Nutrition Programme (SNP) for the year 2019-20.
Table 2. Coverage of Integrated Child Development Services–Supplementary Nutrition Programme (ICDS–SNP) (children aged 7-59 months) against estimated target population
4 https://ophi.org.uk/wp-content/uploads/Table-5a-India-District-MPI-2018-1.xlsx
5 POSHAN-Abhiyaan-Monitoring-Report22July2020.pdf
6 Rajya Sabha reply for question no 3025 by Rajeev gowda-19-3-2020
7 https://kcrkit.telangana.gov.in/KCRKIT2.0/loginnew.htm
While the estimated share of the BPL population is 17% for the state, the coverage is 32% of the population (0–6 years age group), which is almost double the requirement. It is commendable that SNP reaches 50% of the target population in Adilabad district, and 43% of the population in Khammam district. The reach is very high when compared with the target population, such as 374% in Ranga Reddy district followed by 317% in Karimnagar, indicating that about 3.74 times and 3.17 times the target (BPL) population is covered under ICDS-SNP in Ranga Reddy and Karimnagar districts, respectively. This higher proportion also indicates the reach cutting across the social categories, which is a good sign and would yield very positive results in the near future.
Arogya Laxmi Programme involves spot feeding of ‘one full meal’ for Pregnant and Lactating (P&L) women at the Anganwadi centre along with administration of Iron & Folic Acid (IFA) tablet. The meal consists of rice and dal with leafy vegetables/sambar, for a minimum of 25 days, boiled egg/fruit and 200 ml milk for 30 days in a month. The one full meal is expected to meet 40%–45% of the daily calorie intake and 40%–45% of protein and calcium requirement per day of the P&L women. Along with the meal, IFA tablet is administered. Under this programme, a woman can claim the benefits once her pregnancy is confirmed, and this coverage continues after delivery till the infant completes six months. About 3.4 lakh P&L women across the state have availed the benefits during the year 2019-20. The cost per meal works out to Rs 23.50 with Rs 9 from SNP and the rest, Rs 14.50, from Arogya Laxmi scheme.
Telangana state received Rs 17.37 crore, Rs 85.95 crore, and Rs 70.03 crore during the years 2017-18, 2018-19, and 2019-20, respectively amounting to a total of Rs 173.36 crore under Prime Minister’s Overarching Scheme for Holistic Nutrition (or POSHAN Abhiyaan), while expenditure till March 2020 was only Rs 46.02 crore, recording a utilisation of meagre 26.5%. The progress report on POSHAN Abhiyaan5 also looked into the trends of decline in stunting, wasting, and underweight and the possibility of scaling up of interventions. The results revealed that success in selected cases, in addition to the scaling up of nutrition interventions, and important investments in social determinants, especially related to the status of girls and women, become critical. Education of girls, reducing early marriage and pregnancy, and food security are focal points for the reduction of stunting. Lessons were also available from these states in terms of how the administration facilitated the changes through multi-pronged interventions; taking along multiple partners such as civil society, community, and government systems together and using data to track the progress helped in achieving the desired results. It also stressed the need for addressing the governance challenges of National Health Mission (NHM) and ICDS.
The state has planned to provide a one stop service for the child protection in the district by housing the District Child Protection Unit (DCPU), child line, District Probation Officer, and Special Juvenile Police Unit along with National Child Labour Project (NCLP) in one building called Bal-Raksha Bhavan. The process of setting up of Child Welfare Committees (CWCs) and Juvenile Justice Boards (JJBs) in the newly formed 23 districts is in progress. A Juvenile Justice Fund has been created with a provisioning of Re 1 crore to assist organisations working with children, and two organisations have benefitted Rs 10 lakh each. There are 31 children homes in the state catering to 1,017 homeless children6.
KCR KIT: To reduce Infant Mortality Rate (IMR) and MMR in the state and to promote institutional deliveries, Government of Telangana introduced a scheme, KCR Kit, in June 20177 to cater to pregnant women who were admitted in government hospitals for delivery of the child. Under this scheme, the government provides Rs 12,000 for pregnant women who deliver their child in any government hospital in the state. If a girl is born, an additional Rs 1,000 is given under this scheme.
4 Child-Centred Investments to achieve targets of vision 2024 by Department of WD and CW, Government of Telangana Child-Centred Investments to achieve targets of vision 2024 by Department of WD and CW, Government of Telangana 5
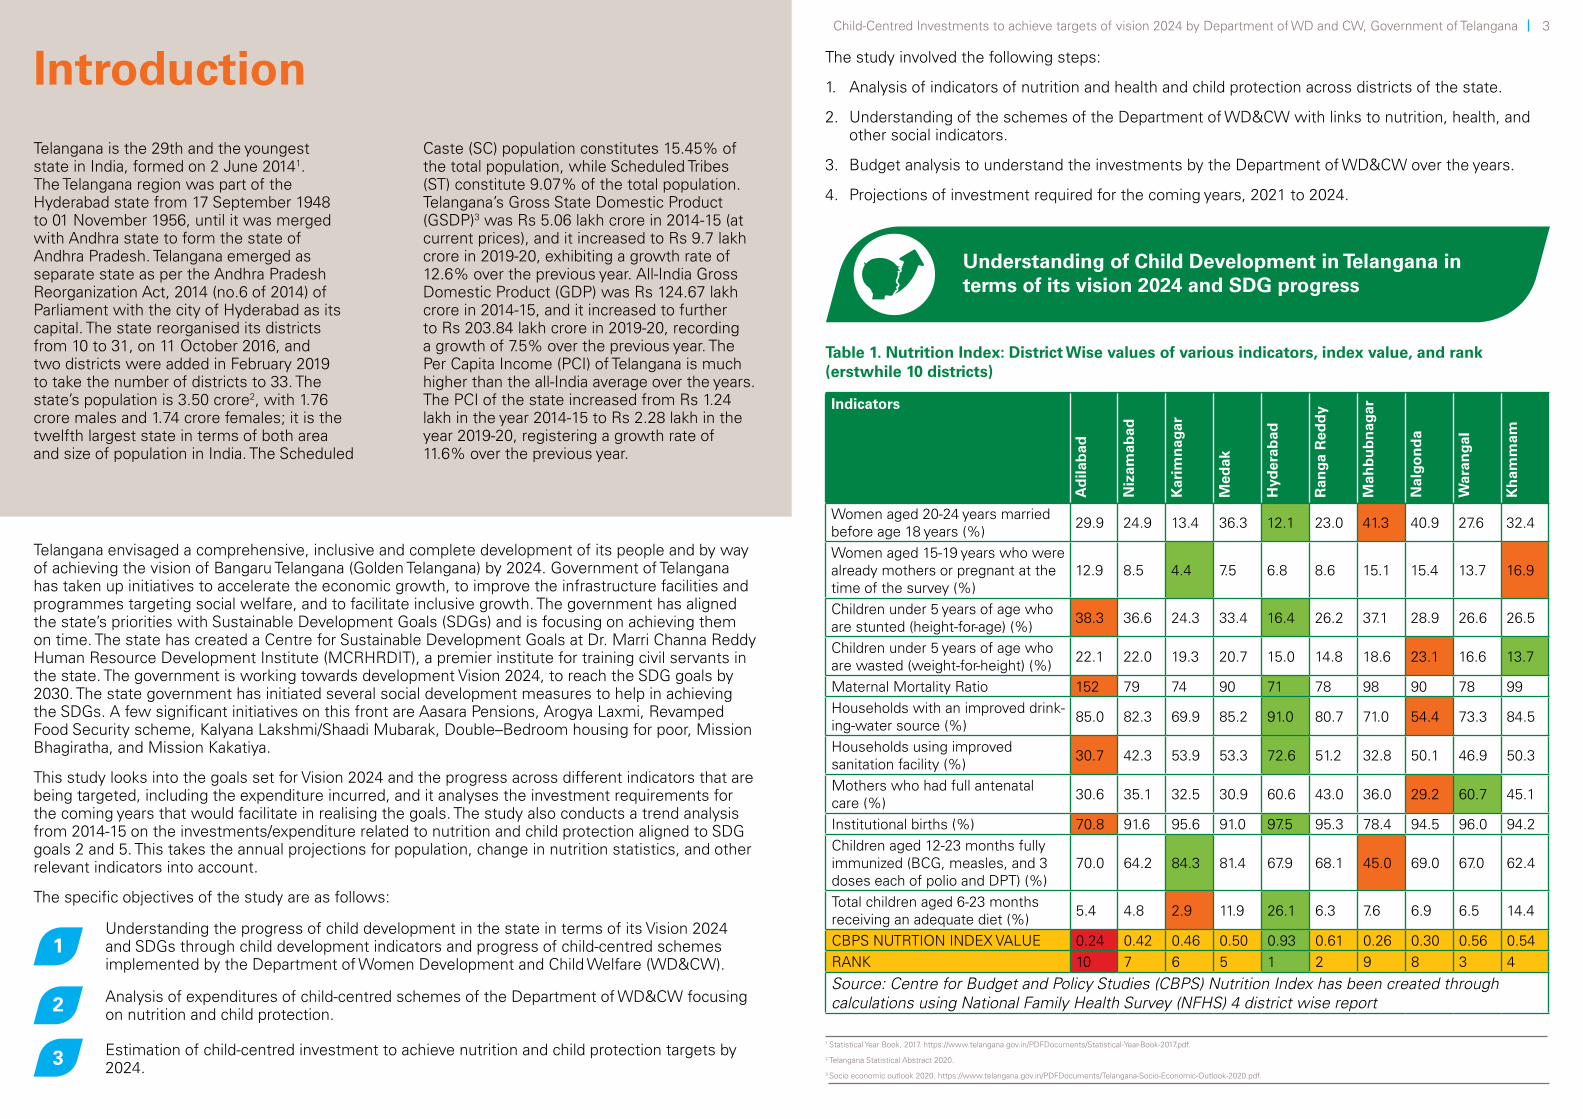
The WD&CW department8 listed the indicators that would be used to measure the progress of nutrition, health, and protection among the children for its progress over the years leading up to 2024. An assessment of the same was done using the indicators that were measured as a part of SDG and CNNS and Sample Registration Survey reports.
The state has done phenomenally well in terms of improving the proportion of children who are breastfed within one hour of birth. The proportion went up to 76.1% from 37.1%. Similarly, the state has been able to achieve significant strides in reducing anaemia among children aged 6–59 months. The achievements in reducing anaemia among pregnant women and reducing wasting among children under 5 years of age was minimal. The proportion of children under 5 years of age who are stunted and who are underweight have increased marginally and this is a matter of concern9.
The Lancet study10 on burden of child and maternal malnutrition across states of India for the period 1990 to 2017 indicated that malnutrition is a major contributor to disease burden in India. Malnutrition is a predominant risk factor accounting for 68% of deaths below five years of age and 17% total Disability Adjusted Life Years (DALY). The nutrition DALY was highest among lowest the Socio-Demographic Index11 (SDI) compared to middle SDI and higher SDI state groups. The Global Nutrition Report 2020 also indicated that India is likely to miss the global nutrition targets by 2025 with highest rates of domestic inequalities in malnutrition12.
The birth registration rates have improved significantly from 73.2% to 97.3%, which is a very positive sign, and has the potential to aid in planning of various services across different age group of beneficiaries and across districts. The percentage contribution to total crime against children in the country has reduced marginally from 2.9% to 2.8%. However, the rate of cognisable crime against children has increased from 24.1% to 37.7%, which is a cause for concern.
The non-availability of data for comparison and the surveys that do not take cognisance of the parameters that are being tracked for progress come up with nuanced indicators, which often become limited in their use. Only when there is a coherence among the indicators that are targeted through the schemes with that of the indicators that are periodically assessed and measured, there would be constructive feedback for the programme implementation.
Sl. No. Indicators for measuring the achievements by 2024 2016 20191 Children under 3 years of age breastfed within one hour of birth (%) 37.1 76.12 Children under 5 years of age who are stunted (height-for-age) (%) 28.1 29.33 Children under 5 years of age who are wasted (weight-for-height) (%) 18.0 17.94 Children under 5 years of age who are underweight (weight-for-age) (%) 28.5 30.85 Children aged 6–59 months who are anaemic (<11.0 g/dl) (%) 60.7 37.86 Pregnant women aged 15–49 years who are anaemic (%) 49.8 49.87 Birth registrations (%) 73.2 97.38 Child labour (aged 5–14 years) in lakh 3.079 Percentage contribution to total crime against children in India in 2015 (%) 2.9 2.810 Rate of total cognisable crime against children in 2015 (%) 24.1 37.7Source: National Family Health Survey (NFHS) 4 data, Sustainable Development Goals (SDG) index 2019, Comprehensive National Nutrition Survey (CNNS) 2016-18, National Crime Record Bureau (NCRB)
Table 3. Nutritional Health and Child Protection Indicators for measuring achievements
8 In the draft vision document.
9 The numbers are to be examined closely with reference to the survey time (month and year) and the analysis by Sunny Jose questions magnitude of changes since NFHS-4 period. EPW, 2019 vol LIV no 49.
10 https://www.thelancet.com/journals/lanchi/article/PIIS2352-4642(19)30273-1/fulltext
11 Socio-Demographic Index (SDI) is a comprehensive index calculated based on per capita income, mean education, and fertility among women younger than 25 years.
12 https://affairscloud.com/india-likely-to-miss-global-nutrition-targets-by-2025-whos-global-nutrition-report-2020/
Progress of the indicators of nutritional health and child protection in last 3 years
The finances of the state of Telangana were analysed to understand the growth of finances over the years along with the expenditures on social sector. The finances of the state have also been growing steadily over the years. The total receipts of the state grew from Rs 60,699 crore in 2014-15 to Rs 1,78,702 crore in 2020-21, at an Average Annual Growth Rate (AAGR) of 21.34% per annum (Figure 1).
Analysis of Expenditures of child centred schemes of the Department of WD&CW focusing on nutrition and child protection
Figure 1: Growth of Receipts of Telangana state
Own revenue
Total Receipts
GOI funds
0
20000
40000
60000
80000
100000
120000
140000
160000
180000
200000
2020-21 BE
2019-20 RE
2018-19 AC
2017-18 AC
2016-17 AC
2015-16 AC
2014-15 AC
15307
35735
60699
27252
115900
178702
Rs.
in C
rore
Social sector expenditures are critical for improvement of indicators of health and nutrition across socio-economic categories of population. Services like clean drinking water, sanitation, education, and primary health services also known as nutrition-sensitive, hold the key for improvement of health and nutrition indicators. And public provisioning becomes more critical for the poor to access these services. Social sectors also complement each other in terms of improving the health and nutrition indicators among population, in general, and women and children, in particular. The social sector expenditure (‘Social Services’ as depicted in the budget) is a good indicator of the investment in nutrition sensitive expenditure that complements the core nutrition specific expenditures.
6 Child-Centred Investments to achieve targets of vision 2024 by Department of WD and CW, Government of Telangana Child-Centred Investments to achieve targets of vision 2024 by Department of WD and CW, Government of Telangana 7

Figure 2: Share of social services expenditure over years
SSE as % of TE
SSE as % of RR
SSE as % of GSDP
0
10
20
30
40
50
60
2020-21 BE
2019-20 RE
2018-19 AC
2017-18 AC
2016-17 AC
2015-16 AC
2014-15 AC
3.9 5.6 5.8 5.3 5.3 4.4
31.633.3
28.7 28.0 28.930.2
38.5
42.8
46.445.2 44.7
38.7
6.5
39.2
50.1
The expenditures of Department of WD&CW were analysed. The KCR Kit13 and Assistance to Adolescent Girls scheme being run by Department of Health, Social Welfare and Tribal Welfare are also considered to make the expenditure analysis complete. The expenditures of the Department of WD&CW increased from Rs 797 crore in 2014-15 to Rs 1,916 crore in 2020-21, at an AAGR of 17% in nominal terms, while the growth in real terms was 16% for the period 2014-15 to 2019-20. The last two years’ Revised Estimates (RE) and Budget Estimates (BE) are likely to undergo severe changes in the wake of COVID-19. The expenditure as a proportion of GSDP increased from 0.16% in 2024-15 to 0.2% in the year 2017-18, and it again decreased to 0.17% for 2020-21. The expenditure as a proportion of TE also declined from 1.28% in 2014-15 to 1.05% in 2020-21.
Analysis of Expenditures of Department of Women Development and Child Welfare
Purnima Menon et al., (2020) looked into the nutrition costs required for Direct Nutrition Interventions (DNI) for the year 2019-2014 to be useful for benchmarking it for expenditures from 2020-21. It was estimated that an expenditure of Rs 38,571 crore was required for the DNI during 2019-20 for the country. The DNI cost estimates for Telangana state were compared with the expenditures of the Department of WD&CW for the year 2019-20. The costs included the counselling cost that is provided for P&L women. The counselling is provided both by Accredited Social Health Activist (ASHA) workers as well as Anganwadi Workers (AWW) by way of providing IFA, monitoring weight gain, ensuring the ante-natal care (ANCs), etc. The costs of micronutrients and the health interventions like immunisations, drugs, etc., is provided by the Department of Health.
Figure 3: Expenditures of Women Development &Child Welfare (WD&CW) and its share in Total Expenditure (TE), Revenue Receipts (RR), and Gross State
Domestic Product (GSDP)
797 11
59
1139 15
02
1496 18
79
1916Rs.
in C
rore
Perc
ent
2014-15 AC
2015-16 AC
2016-17 AC
2017-18 AC
2018-19 AC
2019-20 RE
2020-21 BE
0 0
0.20
0.40
0.60
0.80
1.00
1.20
1.40
1.60
1.80
500
1000
1500
2000
2500
0.16
1.281.18
0.85
1.050.95
1.32 1.34
1.69
1.481.38
1.521.56
1.69
1.05
0.20 0.17 0.17 0.19 0.170.20
WD&CW Exp WD&CW Exp as % of RR WD&CW Exp as % of TE WD&CW Exp as % of RR
13 The Indira Gandhi Matritva Sahyog Yojna (IGMSY) was under WD&CW while KCR Kit is under the Health department.
14 https://accountabilityindia.in/publication/financing-nutrition-in-india-cost-implications-of-the-nutrition-policy-landscape-2019-20/.
The Social Services Expenditures (SSE) grew from Rs 19,658 crore in 2014-15 to Rs 71,702 crore in 2020-21, at an AAGR of 27.2% in nominal terms, and it grew from Rs 16,179 crore to Rs 29,336 crore between 2014-15 to 2019-20, at an impressive AAGR of 15% in real terms. The SSE as a proportion of GSDP increased from 3.9% to 6.5% during the period 2014-15 to 2020-21 (Figure 2). The SSE as a proportion of Revenue Receipts (RR) increased from 38.5% in 2014-15 to 46.4% in 2016-17, and it again decreased to 38.7% during 2019-20. The SSE expenditure as a proportion of Total Expenditure (TE) increased in 2015-16 but again saw a downward trend up to 2019-20, indicating that the SSE has not expanded in line with the expenditure expansion in the state.
2019-20 DNI estimates Department providing services
2019-20 Expenditure of WD&CW
Counselling 34 Health, and WD&CW 34Food Supplements 465 WD&CW 477Micronutrients 93 Health NAHealth Interventions 524 Health NAMaternity benefits15 238 Health 471
Table 4. Cost of Direct Nutrition Interventions (DNI) and Expenditure of Department of Women Development &Child Welfare (WD&CW) (Rs in Crore)
The food supplement costs (exclusive of dietary charges) provided are slightly higher than the cost estimated for the state. Similarly, for maternity benefits, the expenditures are significantly higher than the estimates. This is due to the fact that maternity benefits are assumed with Pradhan Mantri Matru Vandana Yojana (PMMVY) costs (Rs 6,000 inclusive of Janani Suraksha Yojana [JSY]), while the state is providing Rs 12,000 or Rs 13,000 as maternity benefit. The comparison indicates that the nutrition expenditure incurred by the state is in line with the requirement and the state is not lagging behind in provisioning of DNI, which is a progressive measure.
8 Child-Centred Investments to achieve targets of vision 2024 by Department of WD and CW, Government of Telangana Child-Centred Investments to achieve targets of vision 2024 by Department of WD and CW, Government of Telangana 9
15 The Indira Gandhi Matritva Sahyog Yojna (IGMSY) was with department of Women Development & Child Welfare, while the KCR Kit is administered from Health department.
16 https://darpg.gov.in/sites/default/files/ICDS.pdf-
17 As the research has shown, spending on processed food (biscuits, snacks) has increased instead of milk and fruits.
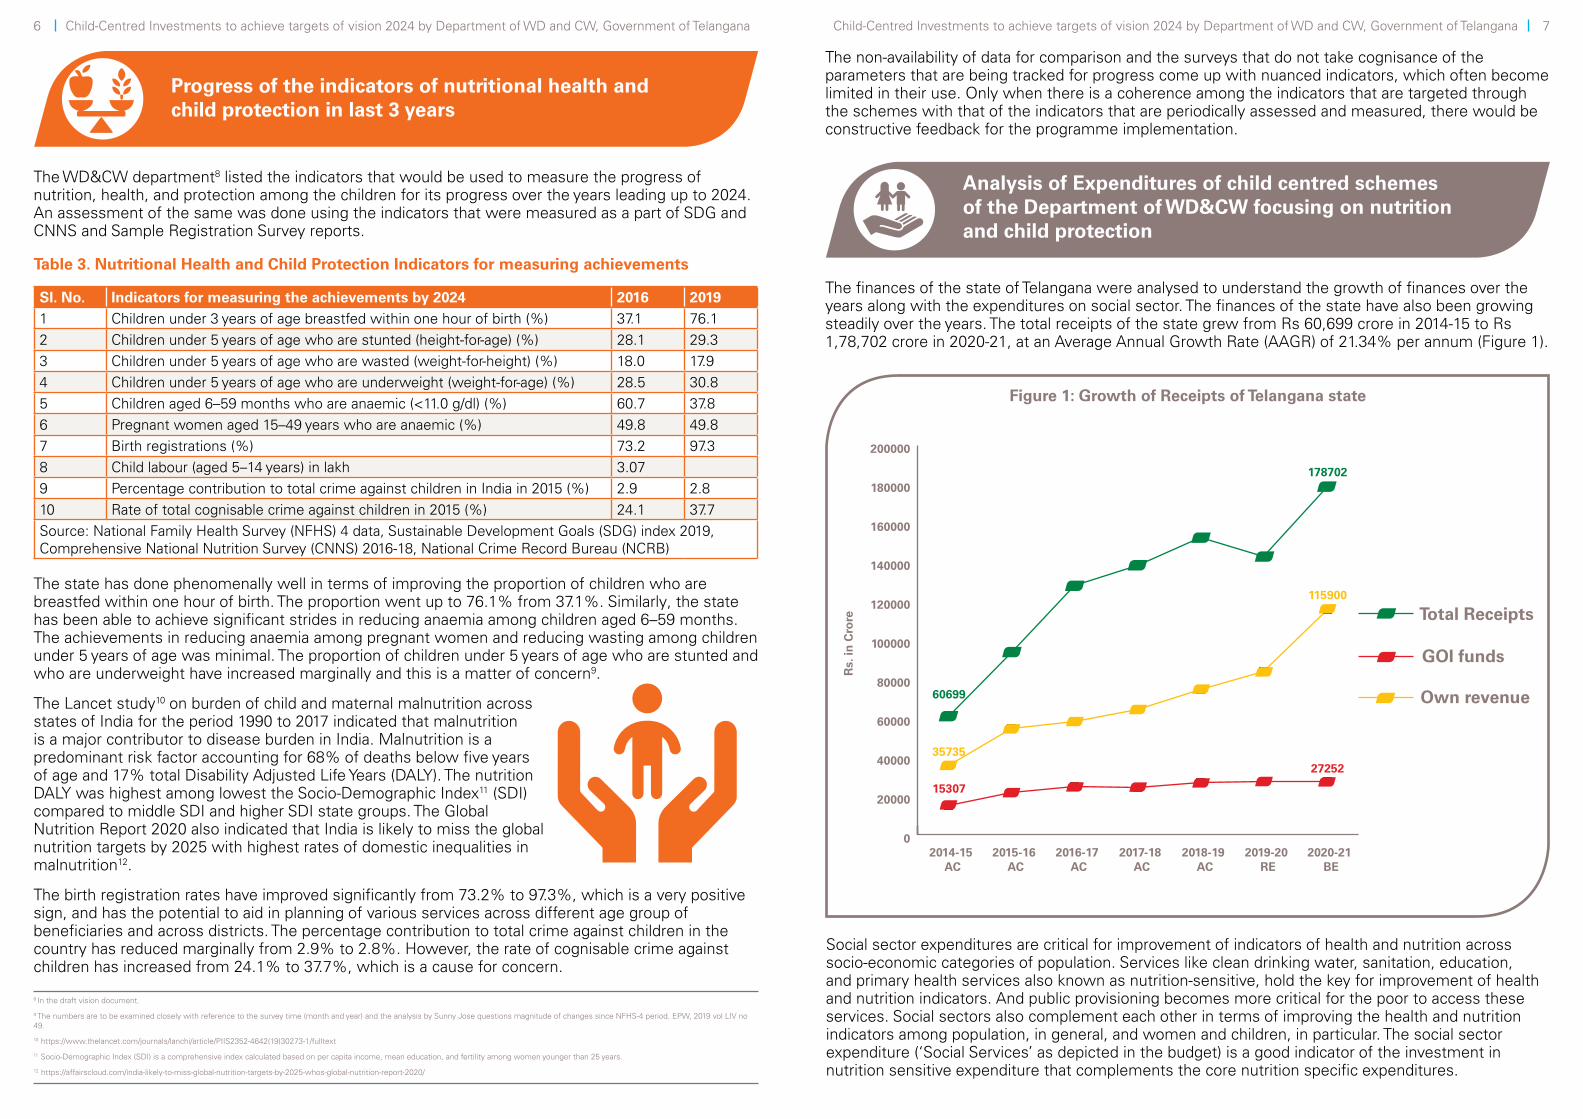
In order to estimate the investment requirements for the Department of WD&CW, three main principles have been followed:
Estimation of expenditures for reaching the nutrition targets of 2024
1. Existing expenditure: This includes existing expenditure alongside those that are planned but not executed. This meant taking note of details of the sanctioned posts, filled and vacant.
2. Existing but in need of upgradation: We found that there are many issues, especially in infrastructure, that need upgradation for better upkeep and contribution to the child’s well-being. For instance, the costs for the upgradation of the Anganwadi buildings that are run in rented and non-rented (community halls/school premises) buildings in need of upgradation were considered.
3. New expenditure: Going by the need for an additional nutritional counsellor at Anganwadi16 responsible for ensuring the counselling inputs, we have included the cost of having one for every three anganwadis. This counsellor can make people aware of low-cost nutritive local sources such as gourds, drumsticks, greens, sprouted grains; they can also popularise local low-cost nutritive recipes. The counsellor can also influence people (behavioural change communication) towards investing on food17 (for the family, on the whole, and for children, in particular) as a best investment that could fetch very high returns by way of improved productivity and fewer medical costs. The construction of Anganwadi centre and Bal-Raksha bhavans to be undertaken in the districts has been taken into account. Expenditures on the children homes, Shishu Gruhas, CWCs, and childcare institutions have been increased by 50%, which amounts to about Rs 14-15 crore per year.
Year 2011 2020 2021 2022 2023 2024 2025Population 3,50,03,944 3,74,82,948 37,72,500 3,80,18,258 3,83,13,795 3,86,11,630 3,89,11,7810-6 38,99,166 41,75,308 42,02,270 42,34,937 42,67,858 43,01,034 43,34,468ICDS Beneficiaries
- 13,75,737 13,61,536 13,72,119.6 13,82,786 13,93,535 14,04,368
Arogyalakshmi beneficiaries
- 4,00,000 4,00,000 4,00,000 4,00,000 4,00,000 4,00,000
Current Budget at 8% annual increase (Rs. in crore)
- 1,916 2,069 2,235 2,414 2,607 2,815
Additional costs (adjusted to inflation at 8%)
- - - - - - -
Capital (4 years at 413 crore each year)
413 - 413 446 482 520 562
Table 5. Projected investments estimated for the period 2021-22 to 2025-26 for the department of Women Development & Child Welfare department (Rs in crore)
The expenditures that would translate into about 1.4%–1.6% of Total Expenditure (TE) of the state or 0.2%–0.22% of GSDP or about 1.7%–1.9% of the RR of the state from 2021-22 to 2025-26 would suffice to meet the required expenditure from the Department of WD&CW. However, owing to the increase in stunting and underweight children under five years of age (as per CNNS), there is a greater need for ensuring efficacy of nutritional counselling and complementary nutrition sensitive expenditures of the state.
Revenue expenditure 195 crore
195 - 195 211 227 246 265
Bal Raksha Bhavans (33)
90 - 20 20 20 20 20
Children Homes (50)
50 - 4 4 5 5 5
Shishu Gruhas (11)
- - 1 1 1 1 1
Child Welfare Committees (33)
- - 4 4 5 5 5
Childcare institutions expenses (470)
- - 5 5 6 6 7
Total costs - - 2,711 2,916 3,147 3,398 3,668
1. Nutrition index was higher in economically forward districts despite relatively lower levels of DNI reach indicating the importance of the socio-economic development in augmenting the nutrition among women and children. The importance of wealth, followed by sanitation and education, (of girls) in improving nutrition need to be taken into cognisance while designing the solutions for malnutrition.
2. The indicators for adolescent children indicated a greater burden for the state in relation to the all-India indicators. This also indicates the need for a greater and focused intervention targeting adolescents especially through the nutritional counsellor.
3. The expenditure of Department of WD&CW has grown well. However, in relation to the state GSDP and TE of the state, the growth is relatively low.
4. The supplementary nutrition expenditures for P&L women, children aged 7–59 months, and adolescent girls are slightly higher and comparable with that of the International Food Policy Research Institute and Accountability Initiative (IFPRI and AI) estimates for year 2019-20, indicating that the state is spending as per the requirement.
5. An expenditure of 1.5 of the TE of the state or 0.22%–0.23% of GSDP would translate into the required expenditure for the Department of WD&CW for the next four years.
6. The one stop centre for child protection comprising of DCPU, child line, District Probation Officer, and Special Juvenile Police Unit along with NCLP in one building called Bal-Raksha Bhavan can prove to be a good model for convergence of child protection activities. Co-ordination with Bharosa and Sakhi centres would be very useful in protection of minor girls.
Conclusions
10 Child-Centred Investments to achieve targets of vision 2024 by Department of WD and CW, Government of Telangana Child-Centred Investments to achieve targets of vision 2024 by Department of WD and CW, Government of Telangana 11

1. Nutrition expenditures are highly correlated with social determinants relating to status of women and girls, and the socio-economic development reducing the poverty and food security is critical (nutrition sensitive investments) for improving the nutrition indicators. This is also echoed by the POSHAN Abhiyaan progress report as well.
2. Nutritional counselling and nutrition education are important components for achieving the improvement in the nutritional status of adolescent girls and women. This is critical for breaking the intergenerational malnutrition cycle. While the state efforts in providing supplementary nutrition are very significant, ensuring that the women, girls, and people, in general, take onus on themselves to prioritise nutrition holds the key.
3. The POSHAN Abhiyaan also indicated the need for addressing the governance challenges of NHM and ICDS. The POSHAN Abhiyaan expenditure for the three years is a reflection of these challenges. In this case, states can focus on treating the symptom through SNPs, while the government of India should be focusing on treating the cause (by focusing on augmenting natural resources and economic development) rather than monitoring the programmes.
4. The fully functional Bal-Raksha Bhavan and CWC can comprehensively address the child protection issues in the district. Data management needs to be strengthened to track the children through the schools so that child protection issues can be identified at early stages.
5. Use of data should become the norm than exception. The birth registrations are high, at 97%, and this should form the database for all the nutrition interventions. An ID generated at the birth should be used to assess and evaluate periodically for nutritional status achievements.
Policy Implications
Centre for Budget and Policy Studies (CBPS)
cbps.in
@CbpsBlr
@CBPSBlr
unicef.org/india
@UNICEFIndia
@unicefindia
UNICEF India
The Policy Brief has been prepared by Madhusudhan B.V. Rao with inputs from Gayathri Raghuraman and Jyotsna Jha. In addition, Sowmya J. and Vivek P Nair from CBPS were also part of the study team that conducted the analysis. Acknowledgements are due to Reeni Kurian and Khyati Tiwari from UNICEF, Hyderabad for their inputs.
Front cover photograph © UNICEF/UNI223643/VineetaMisra
12 Child-Centred Investments to achieve targets of vision 2024 by Department of WD and CW, Government of Telangana