Embed Size (px)
Citation preview
STATE OF CDN SERVICESREACHING GLOBAL SCALE AND MULTIPLE SCREENS USING CONTENT DELIVERY NETWORKS
By Tim Siglin, Contributing Editor, Streaming Media magazine, and Co-founder & Principal Analyst, Transitions, Inc.
Produced by Streaming Media magazine and Unisphere Research, a Division of Information Today, Inc. November 2014
Sponsored by
2
STATE OF CDN SERVICES—Reaching Global Scale and Multiple Screens Using Content Delivery Networks was produced by Unisphere Research and Streaming Media magazine and sponsored by Akamai. Unisphere Research is the market research unit of Unisphere Media, a division of Information Today, Inc. To review abstracts of our past reports, visit www.dbta.com/About_Us#Unisphere. Unisphere Media, 630 Central Avenue, Murray Hill, New Providence, NJ 07974; 908-795-3702.
TABLE OF CONTENTS
Introduction ��������������������������������������������������������������������������������������������������������������������������������������3
Sample Size and Respondent Particulars ����������������������������������������������������������������������������������������3
Personal Viewing Habits ������������������������������������������������������������������������������������������������������������������3
Company Profiles �����������������������������������������������������������������������������������������������������������������������������7
CDN Features and Functionality, Now and in the Future ����������������������������������������������������������������9
In Their Own Words �����������������������������������������������������������������������������������������������������������������������11
Conclusion ��������������������������������������������������������������������������������������������������������������������������������������12
About Akamai���������������������������������������������������������������������������������������������������������������������������������12
3
STATE OF CDN SERVICES—Reaching Global Scale and Multiple Screens Using Content Delivery Networks was produced by Unisphere Research and Streaming Media magazine and sponsored by Akamai. Unisphere Research is the market research unit of Unisphere Media, a division of Information Today, Inc. To review abstracts of our past reports, visit www.dbta.com/About_Us#Unisphere. Unisphere Media, 630 Central Avenue, Murray Hill, New Providence, NJ 07974; 908-795-3702.
INTRODUCTIONStreaming Media magazine and Unisphere Research, along
with a key sponsor and research partner, set about to gauge the State of CDN Services. We asked survey respondents to provide details of both their viewing habits as well as their assessment of CDN services, both in terms of expected terabytes served and CDN features.
Our research centered on industry experts, media engineers and executive management, so we asked questions that provided insight into both the actual and intended uses of CDN services.
We found three primary results: Our survey takers tend to be fragmented when it comes to primary media consumption devices, tend to work for companies that either deliver less than 1TB or more than 100TB of online content per month, and are almost equally concerned with pricing in CDN service models as with the need to maintain multi-screen delivery to existing and emerging media consumption devices.
Along the way, we also looked at several key areas where responses differ by geography, helping to paint a picture of emerging trends across distinct regions in Europe and North America.
SAMPLE SIZE AND RESPONDENT PARTICULARSThere were approximately 900 completed responses for
this 28-question survey, plus an additional 240 that completed a substantial part of the survey. This number of completed responses provided an adequate sample size from which to base our findings, although we had a lower response rate from Europe than we did from North America. We will note a dividing line where partial survey takers stopped answering, directly corresponding to several free-form questions asking about measurement and success criteria.
A full 87% of the completed surveys were from respondents that identified themselves as working for a company that delivers online video, whether in live or on-demand form. Of those, approximately 10% of respondents worked for companies that deliver live online content, and approximately one-third worked for companies that deliver on-demand online content.
When it comes to respondents’ industry segments, content providers led the way (34%), followed by technology partner/vendor companies (19%). Agencies and market research firms each made up approximately 5.5% of total respondents, followed by Pay TV operators (4%), and resellers/system integrators (2.4%).
The remaining approximately one-third of respondents used the “other” category, ranging from a high number of education and corporate trainers to government, healthcare, religious institutions, and streaming product manufacturers.
Over one-third of respondents identified themselves as executive management and another 28% worked in product management or engineering. Almost 23% of respondents used an “other” category to choose job titles such as analyst, consultant, faculty, and content producer roles.
Over 700 respondents were from North America, followed by 116 from Europe. The remaining respondents, in descending order, were from Asia-Pacific, South America, the Middle East, and the combination of Australia and New Zealand. We chose to delineate European differences where appropriate and where a significant number of responses from the EC differed from the North American responses.
PERSONAL VIEWING HABITS We had more than 1,100 respondents complete this section
of the survey, which offers a broad insight into viewing habits. Survey takers were asked to think of these as “Responder as Viewer” questions.
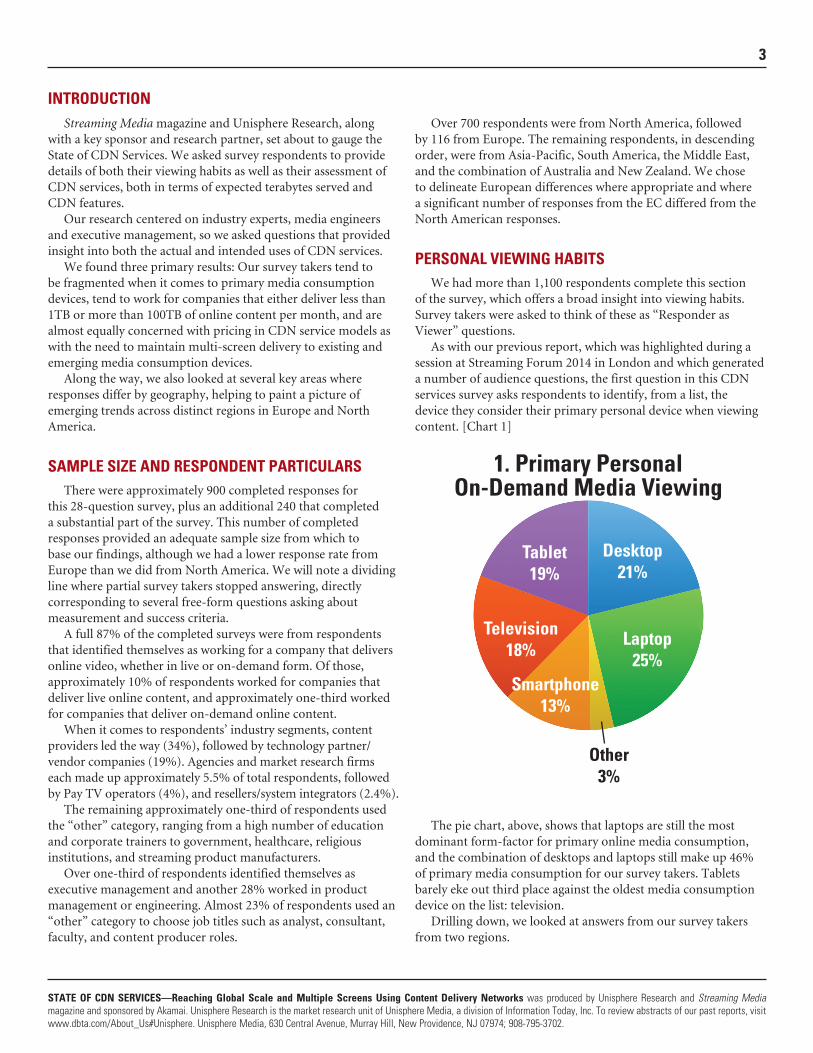
As with our previous report, which was highlighted during a session at Streaming Forum 2014 in London and which generated a number of audience questions, the first question in this CDN services survey asks respondents to identify, from a list, the device they consider their primary personal device when viewing content. [Chart 1]
The pie chart, above, shows that laptops are still the most dominant form-factor for primary online media consumption, and the combination of desktops and laptops still make up 46% of primary media consumption for our survey takers. Tablets barely eke out third place against the oldest media consumption device on the list: television.
Drilling down, we looked at answers from our survey takers from two regions.
Television 18%
1. Primary Personal On-Demand Media Viewing
Tablet 19%
Desktop 21%
Laptop 25%
Smartphone 13%
Other 3%
4
STATE OF CDN SERVICES—Reaching Global Scale and Multiple Screens Using Content Delivery Networks was produced by Unisphere Research and Streaming Media magazine and sponsored by Akamai. Unisphere Research is the market research unit of Unisphere Media, a division of Information Today, Inc. To review abstracts of our past reports, visit www.dbta.com/About_Us#Unisphere. Unisphere Media, 630 Central Avenue, Murray Hill, New Providence, NJ 07974; 908-795-3702.
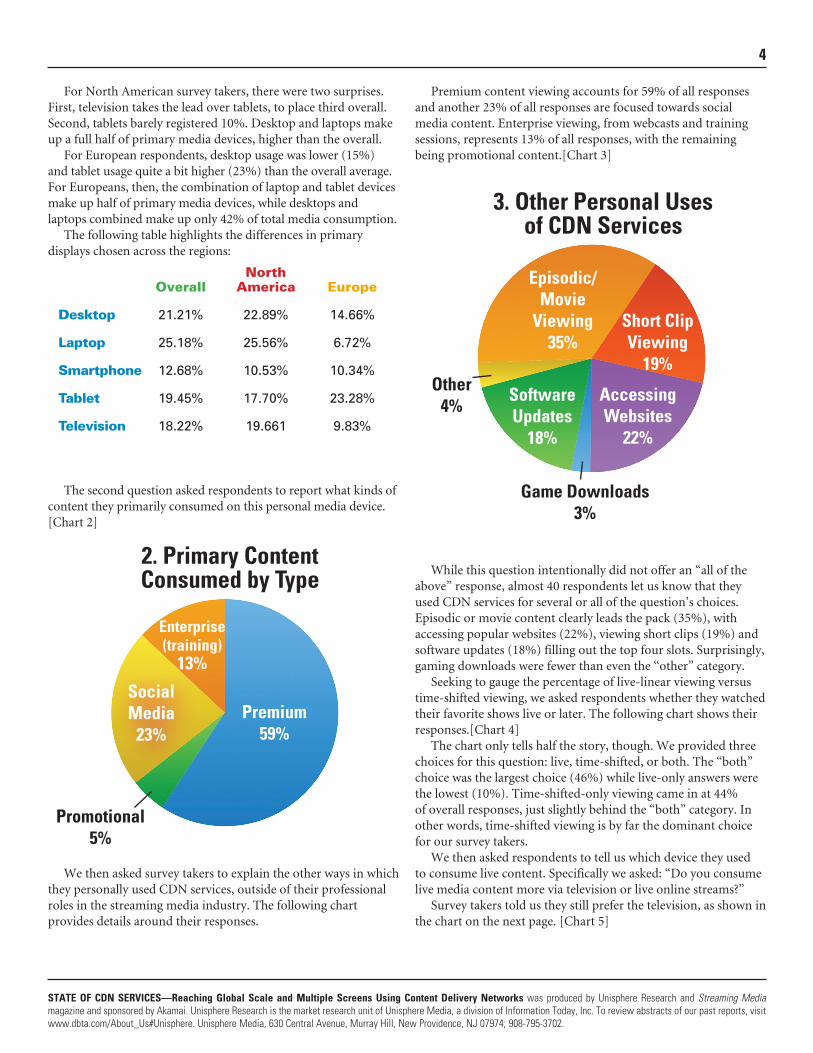
For North American survey takers, there were two surprises. First, television takes the lead over tablets, to place third overall. Second, tablets barely registered 10%. Desktop and laptops make up a full half of primary media devices, higher than the overall.
For European respondents, desktop usage was lower (15%) and tablet usage quite a bit higher (23%) than the overall average. For Europeans, then, the combination of laptop and tablet devices make up half of primary media devices, while desktops and laptops combined make up only 42% of total media consumption.
The following table highlights the differences in primary displays chosen across the regions:
The second question asked respondents to report what kinds of content they primarily consumed on this personal media device. [Chart 2]
We then asked survey takers to explain the other ways in which they personally used CDN services, outside of their professional roles in the streaming media industry. The following chart provides details around their responses.
Premium content viewing accounts for 59% of all responses and another 23% of all responses are focused towards social media content. Enterprise viewing, from webcasts and training sessions, represents 13% of all responses, with the remaining being promotional content.[Chart 3]
While this question intentionally did not offer an “all of the above” response, almost 40 respondents let us know that they used CDN services for several or all of the question’s choices. Episodic or movie content clearly leads the pack (35%), with accessing popular websites (22%), viewing short clips (19%) and software updates (18%) filling out the top four slots. Surprisingly, gaming downloads were fewer than even the “other” category.
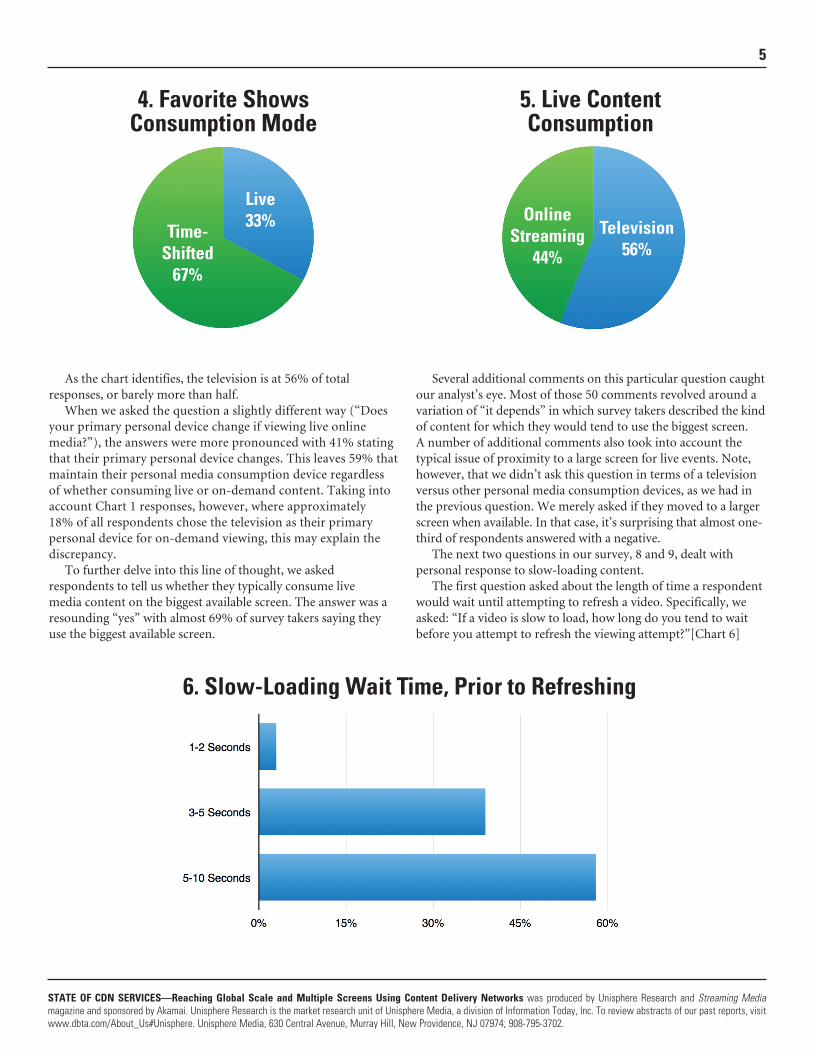
Seeking to gauge the percentage of live-linear viewing versus time-shifted viewing, we asked respondents whether they watched their favorite shows live or later. The following chart shows their responses.[Chart 4]
The chart only tells half the story, though. We provided three choices for this question: live, time-shifted, or both. The “both” choice was the largest choice (46%) while live-only answers were the lowest (10%). Time-shifted-only viewing came in at 44% of overall responses, just slightly behind the “both” category. In other words, time-shifted viewing is by far the dominant choice for our survey takers.
We then asked respondents to tell us which device they used to consume live content. Specifically we asked: “Do you consume live media content more via television or live online streams?”
Survey takers told us they still prefer the television, as shown in the chart on the next page. [Chart 5]
North Overall America Europe
Desktop 21.21% 22.89% 14.66%
Laptop 25.18% 25.56% 6.72%
Smartphone 12.68% 10.53% 10.34%
Tablet 19.45% 17.70% 23.28%
Television 18.22% 19.661 9.83%
3. Other Personal Uses of CDN Services
Accessing Websites
22%
Short Clip Viewing
19%
Episodic/ Movie
Viewing 35%
Software Updates
18%
Game Downloads 3%
Other 4%
2. Primary Content Consumed by Type
Enterprise (training)
13%
Premium 59%
Promotional 5%
Social Media
23%
5
STATE OF CDN SERVICES—Reaching Global Scale and Multiple Screens Using Content Delivery Networks was produced by Unisphere Research and Streaming Media magazine and sponsored by Akamai. Unisphere Research is the market research unit of Unisphere Media, a division of Information Today, Inc. To review abstracts of our past reports, visit www.dbta.com/About_Us#Unisphere. Unisphere Media, 630 Central Avenue, Murray Hill, New Providence, NJ 07974; 908-795-3702.
As the chart identifies, the television is at 56% of total responses, or barely more than half.
When we asked the question a slightly different way (“Does your primary personal device change if viewing live online media?”), the answers were more pronounced with 41% stating that their primary personal device changes. This leaves 59% that maintain their personal media consumption device regardless of whether consuming live or on-demand content. Taking into account Chart 1 responses, however, where approximately 18% of all respondents chose the television as their primary personal device for on-demand viewing, this may explain the discrepancy.
To further delve into this line of thought, we asked respondents to tell us whether they typically consume live media content on the biggest available screen. The answer was a resounding “yes” with almost 69% of survey takers saying they use the biggest available screen.
Several additional comments on this particular question caught our analyst’s eye. Most of those 50 comments revolved around a variation of “it depends” in which survey takers described the kind of content for which they would tend to use the biggest screen. A number of additional comments also took into account the typical issue of proximity to a large screen for live events. Note, however, that we didn’t ask this question in terms of a television versus other personal media consumption devices, as we had in the previous question. We merely asked if they moved to a larger screen when available. In that case, it’s surprising that almost one-third of respondents answered with a negative.
The next two questions in our survey, 8 and 9, dealt with personal response to slow-loading content.
The first question asked about the length of time a respondent would wait until attempting to refresh a video. Specifically, we asked: “If a video is slow to load, how long do you tend to wait before you attempt to refresh the viewing attempt?”[Chart 6]
5. Live Content Consumption
Online Streaming
44%
Television 56%
6. Slow-Loading Wait Time, Prior to Refreshing
4. Favorite Shows Consumption Mode
Time- Shifted
67%
Live 33%
6
STATE OF CDN SERVICES—Reaching Global Scale and Multiple Screens Using Content Delivery Networks was produced by Unisphere Research and Streaming Media magazine and sponsored by Akamai. Unisphere Research is the market research unit of Unisphere Media, a division of Information Today, Inc. To review abstracts of our past reports, visit www.dbta.com/About_Us#Unisphere. Unisphere Media, 630 Central Avenue, Murray Hill, New Providence, NJ 07974; 908-795-3702.
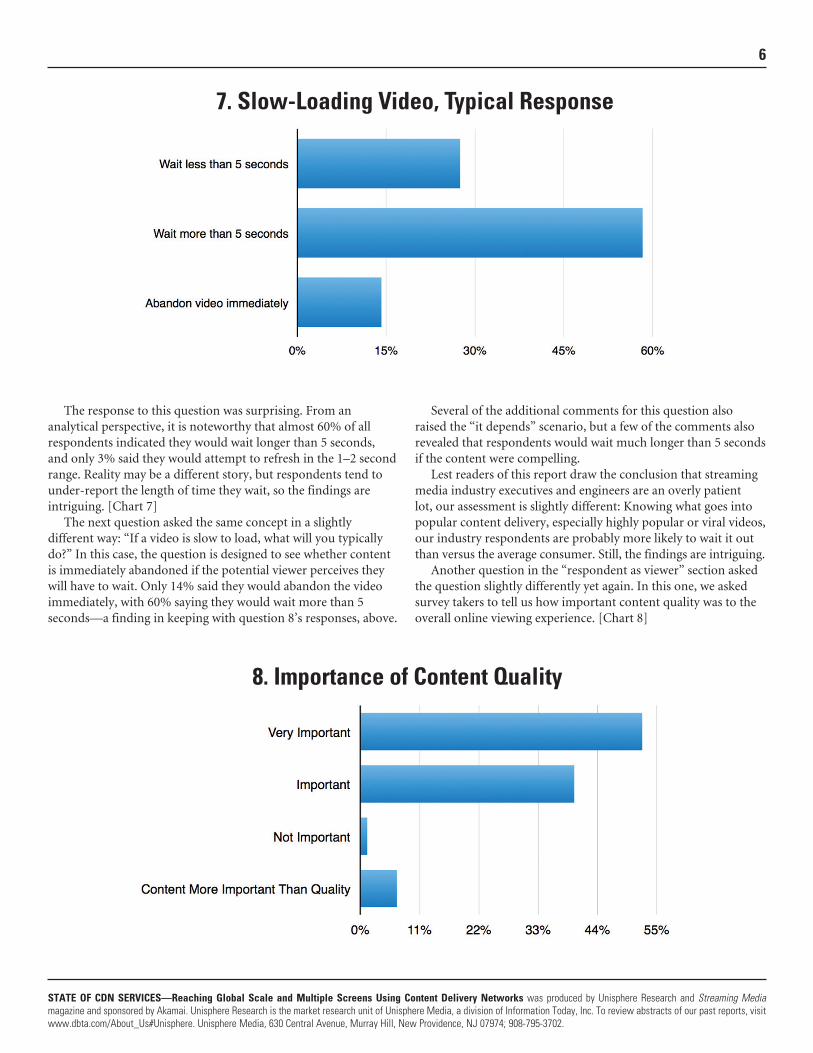
The response to this question was surprising. From an analytical perspective, it is noteworthy that almost 60% of all respondents indicated they would wait longer than 5 seconds, and only 3% said they would attempt to refresh in the 1–2 second range. Reality may be a different story, but respondents tend to under-report the length of time they wait, so the findings are intriguing. [Chart 7]
The next question asked the same concept in a slightly different way: “If a video is slow to load, what will you typically do?” In this case, the question is designed to see whether content is immediately abandoned if the potential viewer perceives they will have to wait. Only 14% said they would abandon the video immediately, with 60% saying they would wait more than 5 seconds—a finding in keeping with question 8’s responses, above.
Several of the additional comments for this question also raised the “it depends” scenario, but a few of the comments also revealed that respondents would wait much longer than 5 seconds if the content were compelling.
Lest readers of this report draw the conclusion that streaming media industry executives and engineers are an overly patient lot, our assessment is slightly different: Knowing what goes into popular content delivery, especially highly popular or viral videos, our industry respondents are probably more likely to wait it out than versus the average consumer. Still, the findings are intriguing.
Another question in the “respondent as viewer” section asked the question slightly differently yet again. In this one, we asked survey takers to tell us how important content quality was to the overall online viewing experience. [Chart 8]
7. Slow-Loading Video, Typical Response
8. Importance of Content Quality
7
STATE OF CDN SERVICES—Reaching Global Scale and Multiple Screens Using Content Delivery Networks was produced by Unisphere Research and Streaming Media magazine and sponsored by Akamai. Unisphere Research is the market research unit of Unisphere Media, a division of Information Today, Inc. To review abstracts of our past reports, visit www.dbta.com/About_Us#Unisphere. Unisphere Media, 630 Central Avenue, Murray Hill, New Providence, NJ 07974; 908-795-3702.
The response to this question was very clear: quality matters. A full 92% of respondents said that content quality is important or very important to their overall online viewing experience. Many of those who said that content itself was more important than the quality of the content (7%) added additional comments noting that some content is compelling even if that content cannot be found in a higher quality.
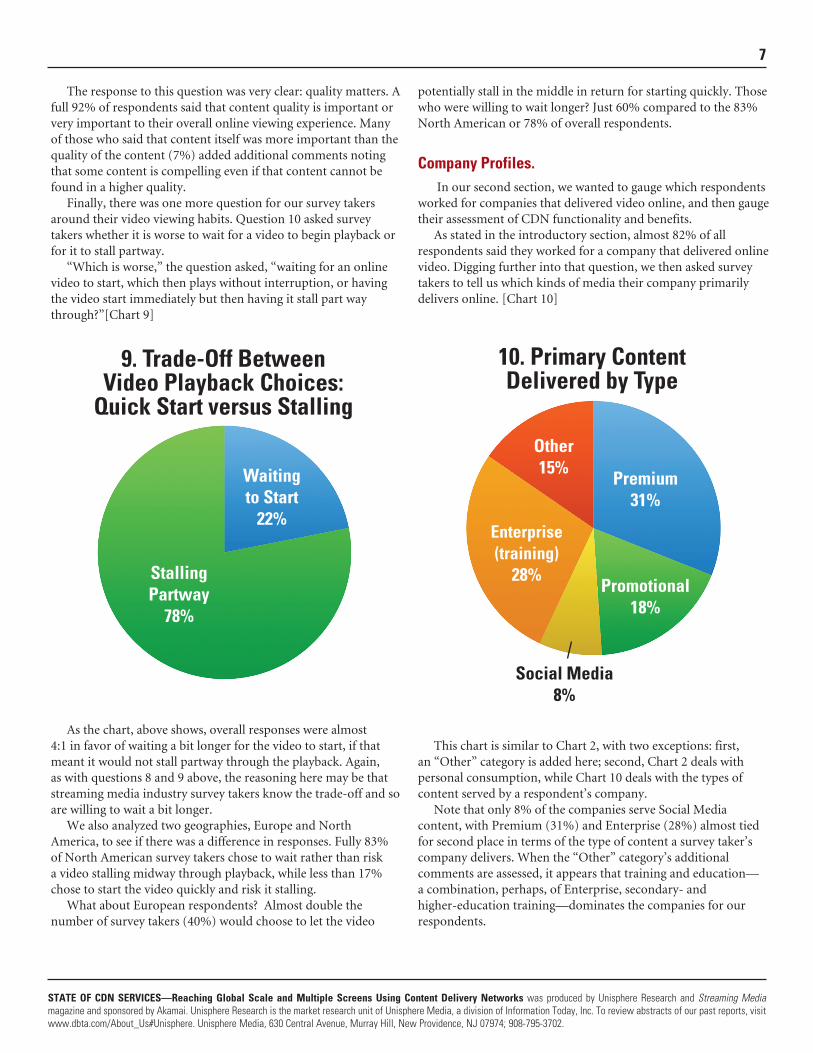
Finally, there was one more question for our survey takers around their video viewing habits. Question 10 asked survey takers whether it is worse to wait for a video to begin playback or for it to stall partway.
“Which is worse,” the question asked, “waiting for an online video to start, which then plays without interruption, or having the video start immediately but then having it stall part way through?”[Chart 9]
As the chart, above shows, overall responses were almost 4:1 in favor of waiting a bit longer for the video to start, if that meant it would not stall partway through the playback. Again, as with questions 8 and 9 above, the reasoning here may be that streaming media industry survey takers know the trade-off and so are willing to wait a bit longer.
We also analyzed two geographies, Europe and North America, to see if there was a difference in responses. Fully 83% of North American survey takers chose to wait rather than risk a video stalling midway through playback, while less than 17% chose to start the video quickly and risk it stalling.
What about European respondents? Almost double the number of survey takers (40%) would choose to let the video
potentially stall in the middle in return for starting quickly. Those who were willing to wait longer? Just 60% compared to the 83% North American or 78% of overall respondents.
Company Profiles. In our second section, we wanted to gauge which respondents
worked for companies that delivered video online, and then gauge their assessment of CDN functionality and benefits.
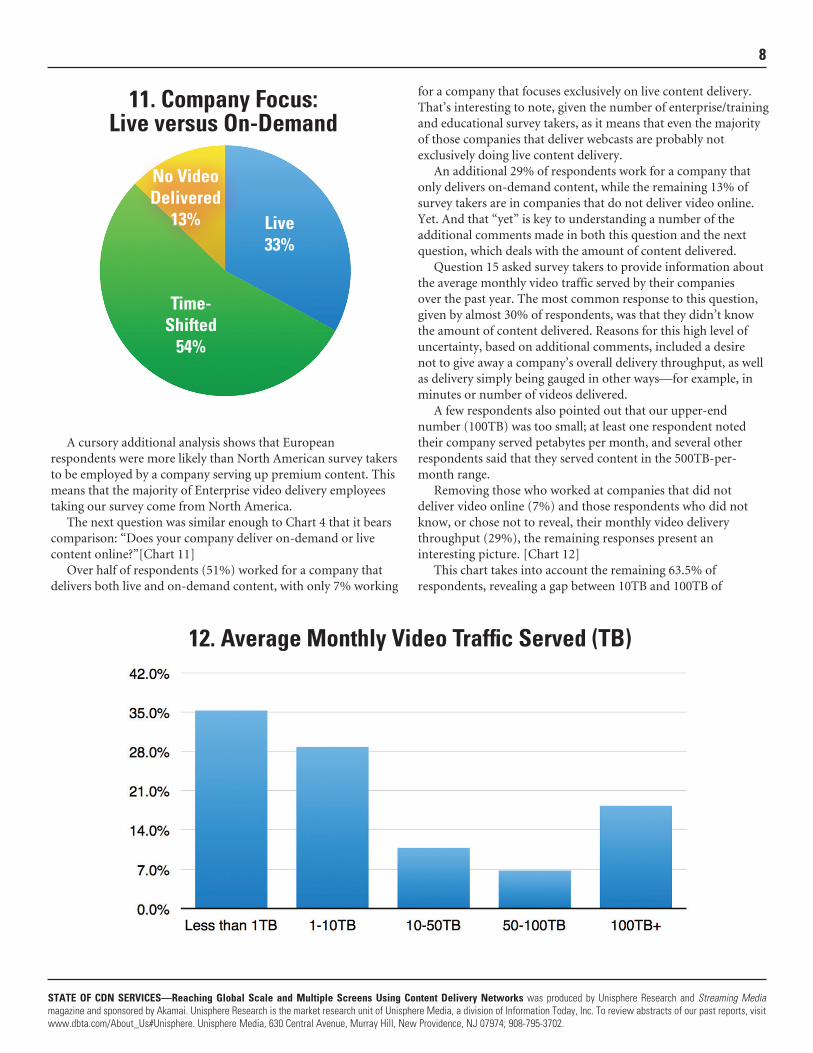
As stated in the introductory section, almost 82% of all respondents said they worked for a company that delivered online video. Digging further into that question, we then asked survey takers to tell us which kinds of media their company primarily delivers online. [Chart 10]
This chart is similar to Chart 2, with two exceptions: first, an “Other” category is added here; second, Chart 2 deals with personal consumption, while Chart 10 deals with the types of content served by a respondent’s company.
Note that only 8% of the companies serve Social Media content, with Premium (31%) and Enterprise (28%) almost tied for second place in terms of the type of content a survey taker’s company delivers. When the “Other” category’s additional comments are assessed, it appears that training and education— a combination, perhaps, of Enterprise, secondary- and higher-education training—dominates the companies for our respondents.
9. Trade-Off Between Video Playback Choices:
Quick Start versus Stalling
Stalling Partway
78%
Waiting to Start
22%
10. Primary Content Delivered by Type
Promotional 18%
Premium 31%
Other 15%
Social Media 8%
Enterprise (training)
28%
8
STATE OF CDN SERVICES—Reaching Global Scale and Multiple Screens Using Content Delivery Networks was produced by Unisphere Research and Streaming Media magazine and sponsored by Akamai. Unisphere Research is the market research unit of Unisphere Media, a division of Information Today, Inc. To review abstracts of our past reports, visit www.dbta.com/About_Us#Unisphere. Unisphere Media, 630 Central Avenue, Murray Hill, New Providence, NJ 07974; 908-795-3702.
A cursory additional analysis shows that European respondents were more likely than North American survey takers to be employed by a company serving up premium content. This means that the majority of Enterprise video delivery employees taking our survey come from North America.
The next question was similar enough to Chart 4 that it bears comparison: “Does your company deliver on-demand or live content online?”[Chart 11]
Over half of respondents (51%) worked for a company that delivers both live and on-demand content, with only 7% working
for a company that focuses exclusively on live content delivery. That’s interesting to note, given the number of enterprise/training and educational survey takers, as it means that even the majority of those companies that deliver webcasts are probably not exclusively doing live content delivery.
An additional 29% of respondents work for a company that only delivers on-demand content, while the remaining 13% of survey takers are in companies that do not deliver video online. Yet. And that “yet” is key to understanding a number of the additional comments made in both this question and the next question, which deals with the amount of content delivered.
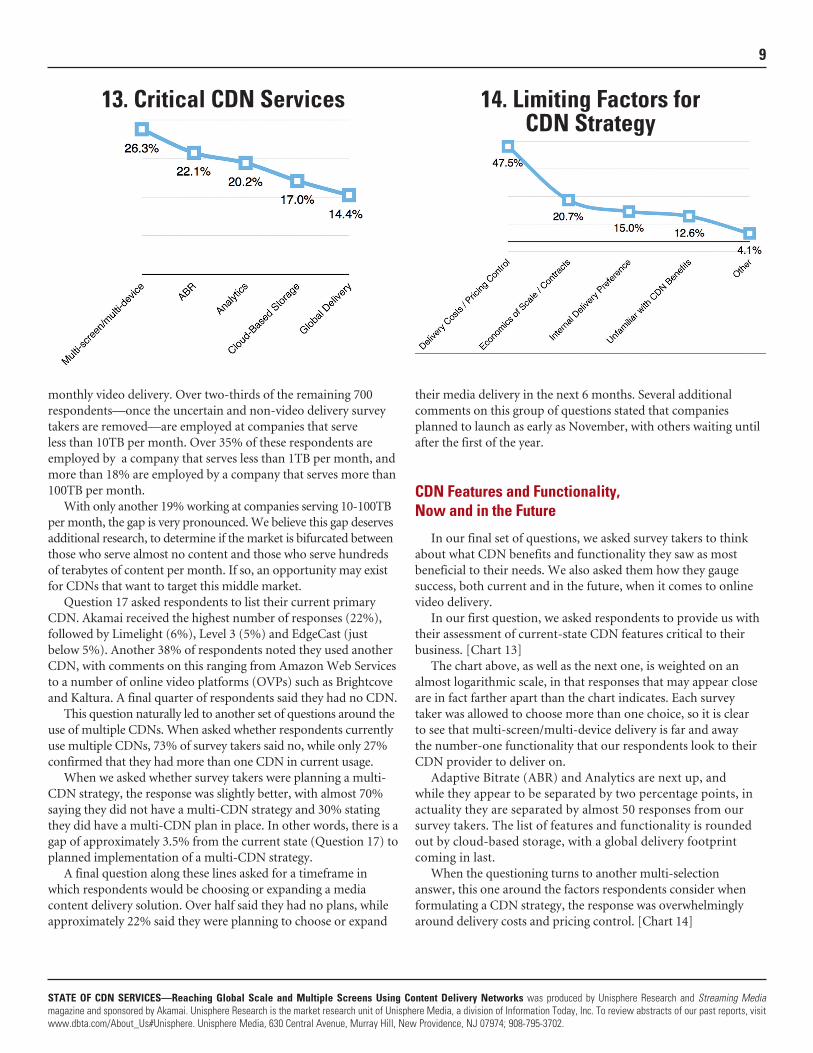
Question 15 asked survey takers to provide information about the average monthly video traffic served by their companies over the past year. The most common response to this question, given by almost 30% of respondents, was that they didn’t know the amount of content delivered. Reasons for this high level of uncertainty, based on additional comments, included a desire not to give away a company’s overall delivery throughput, as well as delivery simply being gauged in other ways—for example, in minutes or number of videos delivered.
A few respondents also pointed out that our upper-end number (100TB) was too small; at least one respondent noted their company served petabytes per month, and several other respondents said that they served content in the 500TB-per-month range.
Removing those who worked at companies that did not deliver video online (7%) and those respondents who did not know, or chose not to reveal, their monthly video delivery throughput (29%), the remaining responses present an interesting picture. [Chart 12]
This chart takes into account the remaining 63.5% of respondents, revealing a gap between 10TB and 100TB of
11. Company Focus: Live versus On-Demand
Time- Shifted
54%
Live 33%
No Video Delivered
13%
12. Average Monthly Video Traffic Served (TB)
9
STATE OF CDN SERVICES—Reaching Global Scale and Multiple Screens Using Content Delivery Networks was produced by Unisphere Research and Streaming Media magazine and sponsored by Akamai. Unisphere Research is the market research unit of Unisphere Media, a division of Information Today, Inc. To review abstracts of our past reports, visit www.dbta.com/About_Us#Unisphere. Unisphere Media, 630 Central Avenue, Murray Hill, New Providence, NJ 07974; 908-795-3702.
monthly video delivery. Over two-thirds of the remaining 700 respondents—once the uncertain and non-video delivery survey takers are removed—are employed at companies that serve less than 10TB per month. Over 35% of these respondents are employed by a company that serves less than 1TB per month, and more than 18% are employed by a company that serves more than 100TB per month.
With only another 19% working at companies serving 10-100TB per month, the gap is very pronounced. We believe this gap deserves additional research, to determine if the market is bifurcated between those who serve almost no content and those who serve hundreds of terabytes of content per month. If so, an opportunity may exist for CDNs that want to target this middle market.
Question 17 asked respondents to list their current primary CDN. Akamai received the highest number of responses (22%), followed by Limelight (6%), Level 3 (5%) and EdgeCast (just below 5%). Another 38% of respondents noted they used another CDN, with comments on this ranging from Amazon Web Services to a number of online video platforms (OVPs) such as Brightcove and Kaltura. A final quarter of respondents said they had no CDN.
This question naturally led to another set of questions around the use of multiple CDNs. When asked whether respondents currently use multiple CDNs, 73% of survey takers said no, while only 27% confirmed that they had more than one CDN in current usage.
When we asked whether survey takers were planning a multi-CDN strategy, the response was slightly better, with almost 70% saying they did not have a multi-CDN strategy and 30% stating they did have a multi-CDN plan in place. In other words, there is a gap of approximately 3.5% from the current state (Question 17) to planned implementation of a multi-CDN strategy.
A final question along these lines asked for a timeframe in which respondents would be choosing or expanding a media content delivery solution. Over half said they had no plans, while approximately 22% said they were planning to choose or expand
their media delivery in the next 6 months. Several additional comments on this group of questions stated that companies planned to launch as early as November, with others waiting until after the first of the year.
CDN Features and Functionality, Now and in the Future
In our final set of questions, we asked survey takers to think about what CDN benefits and functionality they saw as most beneficial to their needs. We also asked them how they gauge success, both current and in the future, when it comes to online video delivery.
In our first question, we asked respondents to provide us with their assessment of current-state CDN features critical to their business. [Chart 13]
The chart above, as well as the next one, is weighted on an almost logarithmic scale, in that responses that may appear close are in fact farther apart than the chart indicates. Each survey taker was allowed to choose more than one choice, so it is clear to see that multi-screen/multi-device delivery is far and away the number-one functionality that our respondents look to their CDN provider to deliver on.
Adaptive Bitrate (ABR) and Analytics are next up, and while they appear to be separated by two percentage points, in actuality they are separated by almost 50 responses from our survey takers. The list of features and functionality is rounded out by cloud-based storage, with a global delivery footprint coming in last.
When the questioning turns to another multi-selection answer, this one around the factors respondents consider when formulating a CDN strategy, the response was overwhelmingly around delivery costs and pricing control. [Chart 14]
13. Critical CDN Services 14. Limiting Factors for CDN Strategy
10
STATE OF CDN SERVICES—Reaching Global Scale and Multiple Screens Using Content Delivery Networks was produced by Unisphere Research and Streaming Media magazine and sponsored by Akamai. Unisphere Research is the market research unit of Unisphere Media, a division of Information Today, Inc. To review abstracts of our past reports, visit www.dbta.com/About_Us#Unisphere. Unisphere Media, 630 Central Avenue, Murray Hill, New Providence, NJ 07974; 908-795-3702.
Not surprisingly, the cost of delivery is more than twice that of the second-nearest limiting factor: contracts and economies of scale. About 15% of all respondents said that the desire to develop the delivery solution in-house was a limiting factor, and approximately 13% of survey takers said they or their company were so unfamiliar with CDN benefits that it became a limiting factor in rolling out a CDN strategy.
A final 5% of respondents said that other factors were in play. This question marked the point at which more than 20% of survey takers also abandoned the survey.
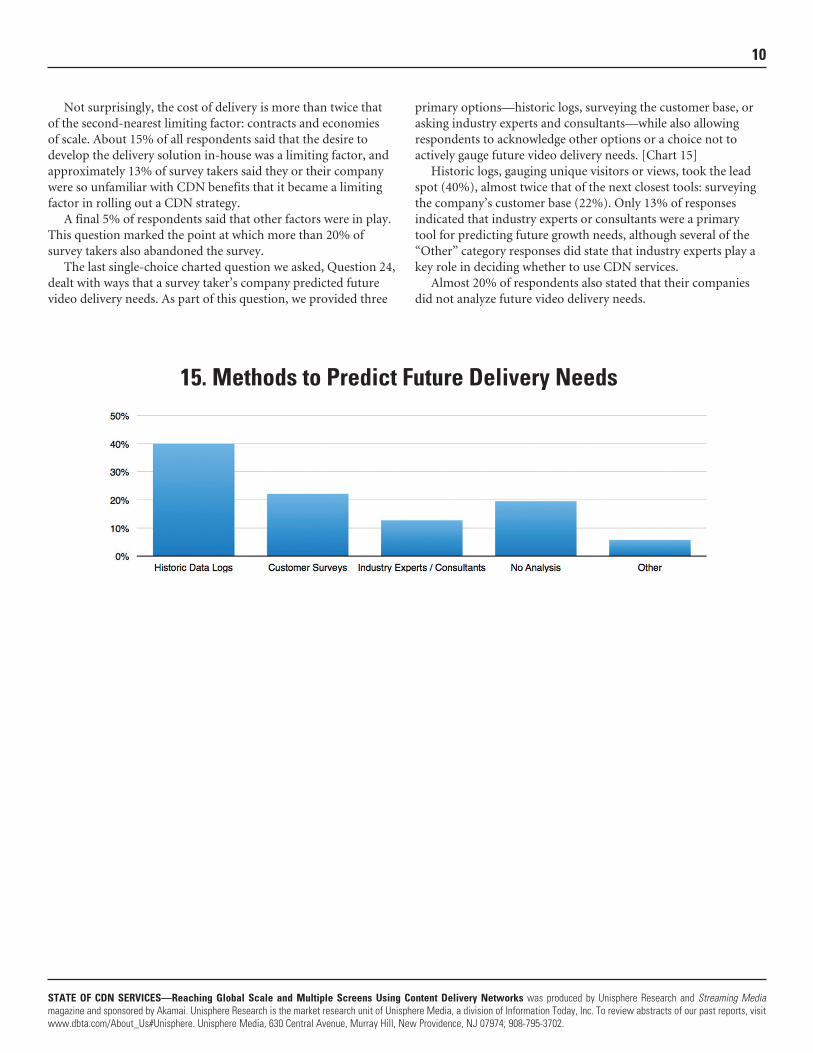
The last single-choice charted question we asked, Question 24, dealt with ways that a survey taker’s company predicted future video delivery needs. As part of this question, we provided three
primary options—historic logs, surveying the customer base, or asking industry experts and consultants—while also allowing respondents to acknowledge other options or a choice not to actively gauge future video delivery needs. [Chart 15]
Historic logs, gauging unique visitors or views, took the lead spot (40%), almost twice that of the next closest tools: surveying the company’s customer base (22%). Only 13% of responses indicated that industry experts or consultants were a primary tool for predicting future growth needs, although several of the “Other” category responses did state that industry experts play a key role in deciding whether to use CDN services.
Almost 20% of respondents also stated that their companies did not analyze future video delivery needs.
15. Methods to Predict Future Delivery Needs
11
STATE OF CDN SERVICES—Reaching Global Scale and Multiple Screens Using Content Delivery Networks was produced by Unisphere Research and Streaming Media magazine and sponsored by Akamai. Unisphere Research is the market research unit of Unisphere Media, a division of Information Today, Inc. To review abstracts of our past reports, visit www.dbta.com/About_Us#Unisphere. Unisphere Media, 630 Central Avenue, Murray Hill, New Providence, NJ 07974; 908-795-3702.
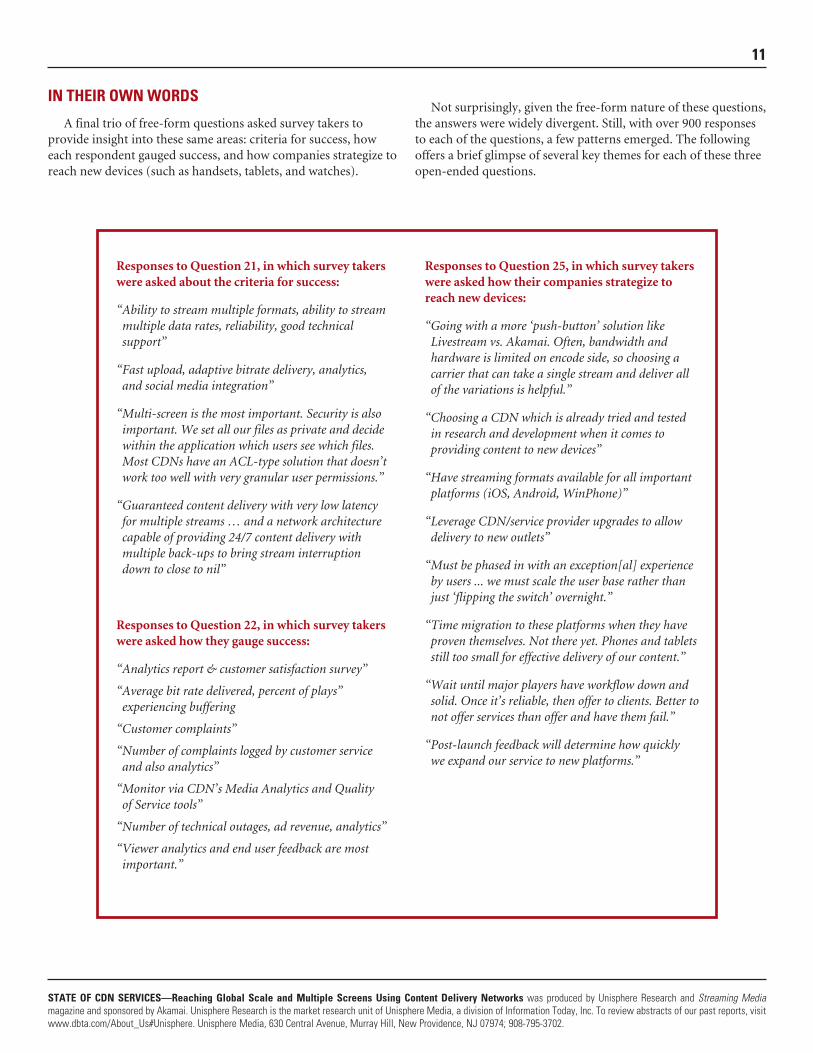
Responses to Question 21, in which survey takers were asked about the criteria for success:
“ Ability to stream multiple formats, ability to stream multiple data rates, reliability, good technical support”
“ Fast upload, adaptive bitrate delivery, analytics, and social media integration”
“ Multi-screen is the most important. Security is also important. We set all our files as private and decide within the application which users see which files. Most CDNs have an ACL-type solution that doesn’t work too well with very granular user permissions.”
“ Guaranteed content delivery with very low latency for multiple streams … and a network architecture capable of providing 24/7 content delivery with multiple back-ups to bring stream interruption down to close to nil”
Responses to Question 22, in which survey takers were asked how they gauge success:
“Analytics report & customer satisfaction survey”
“ Average bit rate delivered, percent of plays” experiencing buffering
“Customer complaints”
“ Number of complaints logged by customer service and also analytics”
“ Monitor via CDN’s Media Analytics and Quality of Service tools”
“Number of technical outages, ad revenue, analytics”
“ Viewer analytics and end user feedback are most important.”
Responses to Question 25, in which survey takers were asked how their companies strategize to reach new devices:
“ Going with a more ‘push-button’ solution like Livestream vs. Akamai. Often, bandwidth and hardware is limited on encode side, so choosing a carrier that can take a single stream and deliver all of the variations is helpful.”
“ Choosing a CDN which is already tried and tested in research and development when it comes to providing content to new devices”
“ Have streaming formats available for all important platforms (iOS, Android, WinPhone)”
“ Leverage CDN/service provider upgrades to allow delivery to new outlets”
“ Must be phased in with an exception[al] experience by users ... we must scale the user base rather than just ‘flipping the switch’ overnight.”
“ Time migration to these platforms when they have proven themselves. Not there yet. Phones and tablets still too small for effective delivery of our content.”
“ Wait until major players have workflow down and solid. Once it’s reliable, then offer to clients. Better to not offer services than offer and have them fail.”
“ Post-launch feedback will determine how quickly we expand our service to new platforms.”
IN THEIR OWN WORDS
A final trio of free-form questions asked survey takers to provide insight into these same areas: criteria for success, how each respondent gauged success, and how companies strategize to reach new devices (such as handsets, tablets, and watches).
Not surprisingly, given the free-form nature of these questions, the answers were widely divergent. Still, with over 900 responses to each of the questions, a few patterns emerged. The following offers a brief glimpse of several key themes for each of these three open-ended questions.
12
STATE OF CDN SERVICES—Reaching Global Scale and Multiple Screens Using Content Delivery Networks was produced by Unisphere Research and Streaming Media magazine and sponsored by Akamai. Unisphere Research is the market research unit of Unisphere Media, a division of Information Today, Inc. To review abstracts of our past reports, visit www.dbta.com/About_Us#Unisphere. Unisphere Media, 630 Central Avenue, Murray Hill, New Providence, NJ 07974; 908-795-3702.
CONCLUSIONAnswers to these open-ended questions reiterate our key
findings. First, on a personal level, our survey takers tend to be
fragmented when it comes to primary media consumption devices, which is indicative of the overall media consumption fragmentation landscape. We see that our European survey takers favor the tablet a bit more than their North American counterparts, but it’s also clear that smartphones aren’t quite there yet in terms of supplanting any of the other media consumption devices.
Second, we spotted an interesting trend, at least when it comes to our survey respondents: They tend to work for companies that either deliver less than 1TB or more than 100TB of online content per month, and there’s a wide gap in the 10-100TB per month
delivery range. Whether the gap is within our own survey takers or an emerging trend remains to be seen, and we suggest additional research into this seeming anomaly.
Finally, survey takers said their companies are almost equally concerned with pricing in CDN service models and the need to maintain multi-screen delivery to existing and emerging media consumption devices. Yet, when it comes to free-form responses to a question about how companies plan for these existing and emerging devices, the overwhelming response is one of uncertainty.
And that very uncertainty is what keeps savvy content owners and media broadcasters coming back to CDN, as a way to safeguard against the unknown—be it a new phone, tablet, watch, or even some other device we’ve not yet been introduced to.
ABOUT AKAMAI
Akamai® is the leading provider of cloud services for delivering, optimizing and securing online content and business applications. At the core of the Company’s solutions is the Akamai Intelligent Platform™ providing extensive reach, coupled with unmatched reliability, security, visibility and expertise.
Akamai removes the complexities of connecting the increasingly mobile world, supporting 24/7 consumer demand, and enabling enterprises to securely leverage the cloud. To learn more about how Akamai is accelerating the pace of innovation in a hyperconnected world, please visit www.akamai.com or blogs.akamai.com, and follow @Akamai on Twitter.