Embed Size (px)
DESCRIPTION
"Leaders and Laggards in the preservation of raw biomedical research data" presented at NEDCC 2010, The Tectonics of Digital Curation A Symposium on the Shifting Preservation and Access Landscape
Citation preview
Leaders and Laggardsin the preservation of
raw biomedical research data
Heather Piwowar
Department of Biomedical InformaticsUniversity of Pittsburgh
Soon‐to‐be Postdoctoral Associate with Data Observation Network for Earth (DataONE)
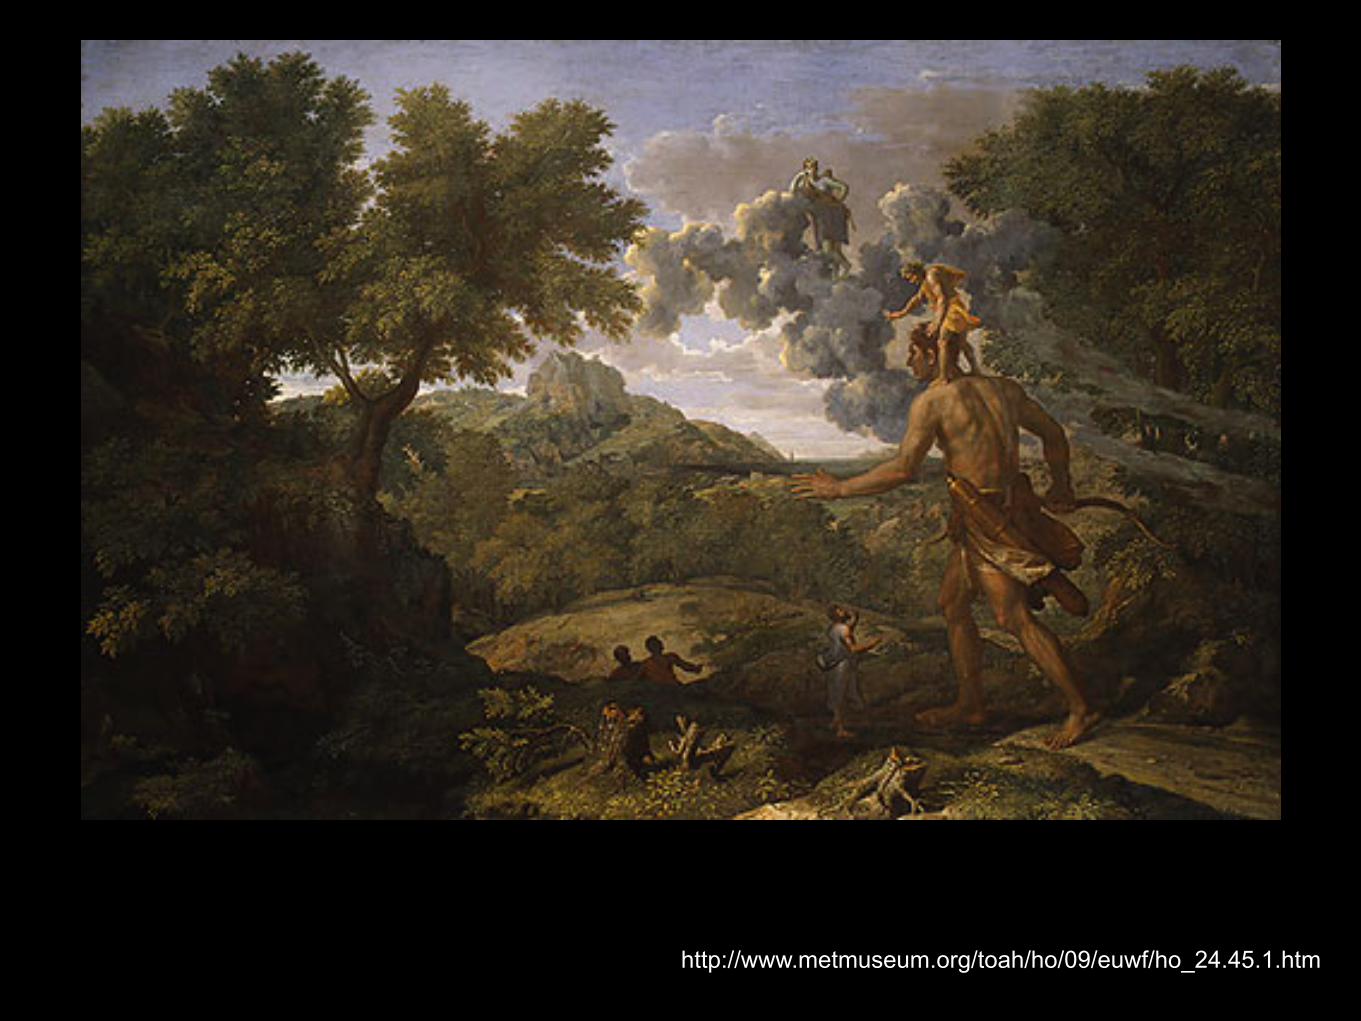
http://www.metmuseum.org/toah/ho/09/euwf/ho_24.45.1.htm
http://www.flickr.com/photos/jsmjr/62443357/
http://www.flickr.com/photos/camilleharrington/3587294608/
http://www.flickr.com/photos/rkuhnau/3318245976/
http://www.flickr.com/photos/conformpdx/1796399674/
http://www.flickr.com/photos/rkuhnau/3317418699/
http://www.flickr.com/photos/zemlinki/261617721/
http://www.flickr.com/photos/tracenmatt/3020786491/
http://www.flickr.com/photos/the-o/2078239333/
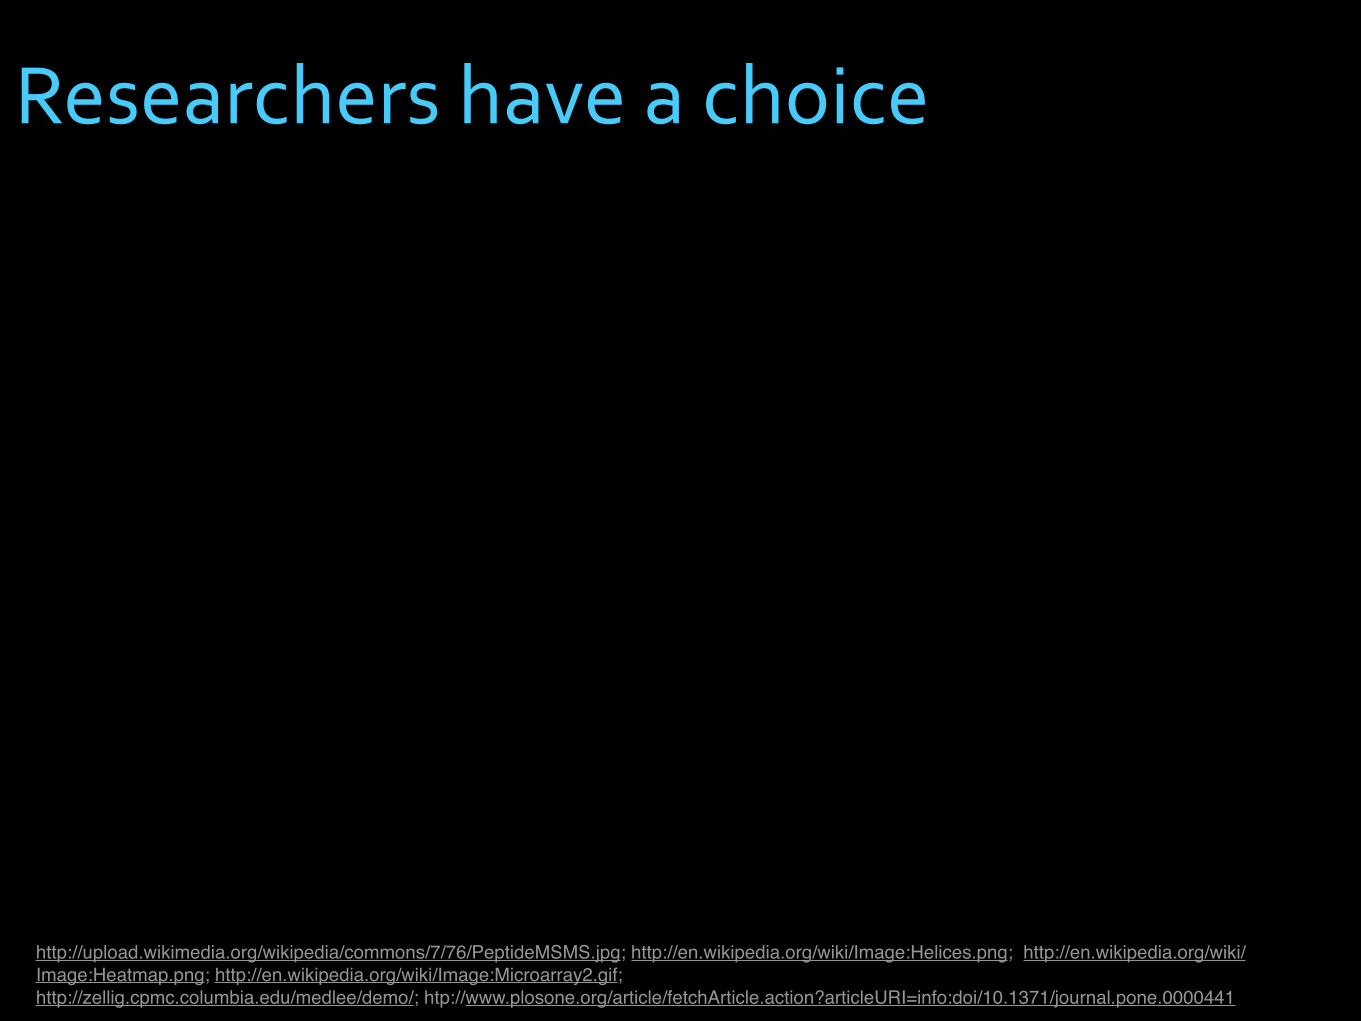
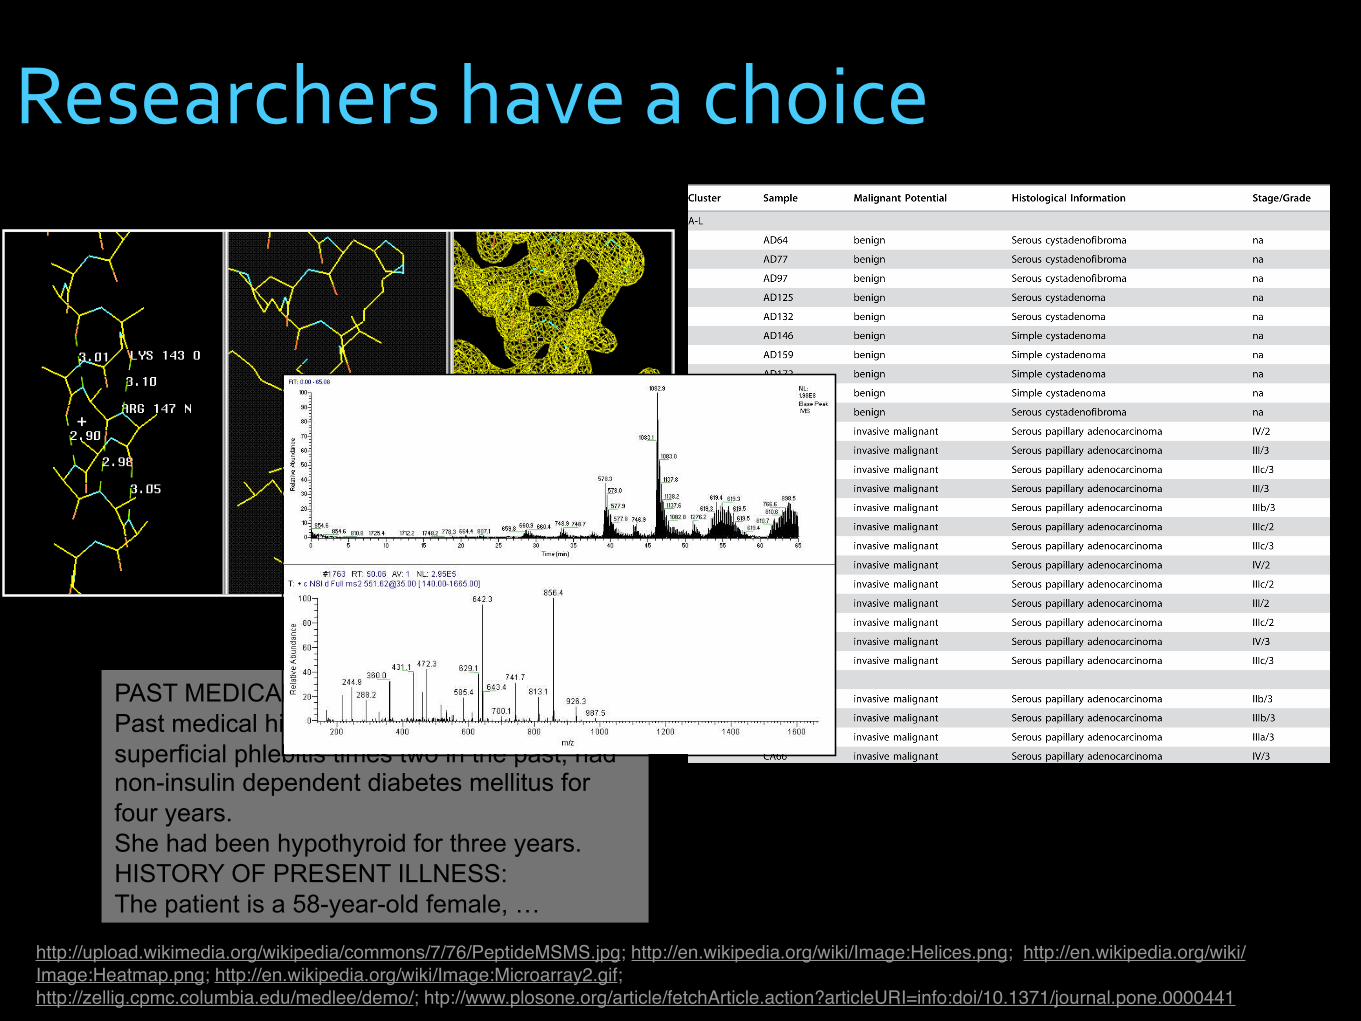
Researchers have a choice
http://upload.wikimedia.org/wikipedia/commons/7/76/PeptideMSMS.jpg; http://en.wikipedia.org/wiki/Image:Helices.png; http://en.wikipedia.org/wiki/Image:Heatmap.png; http://en.wikipedia.org/wiki/Image:Microarray2.gif; http://zellig.cpmc.columbia.edu/medlee/demo/; htp://www.plosone.org/article/fetchArticle.action?articleURI=info:doi/10.1371/journal.pone.0000441
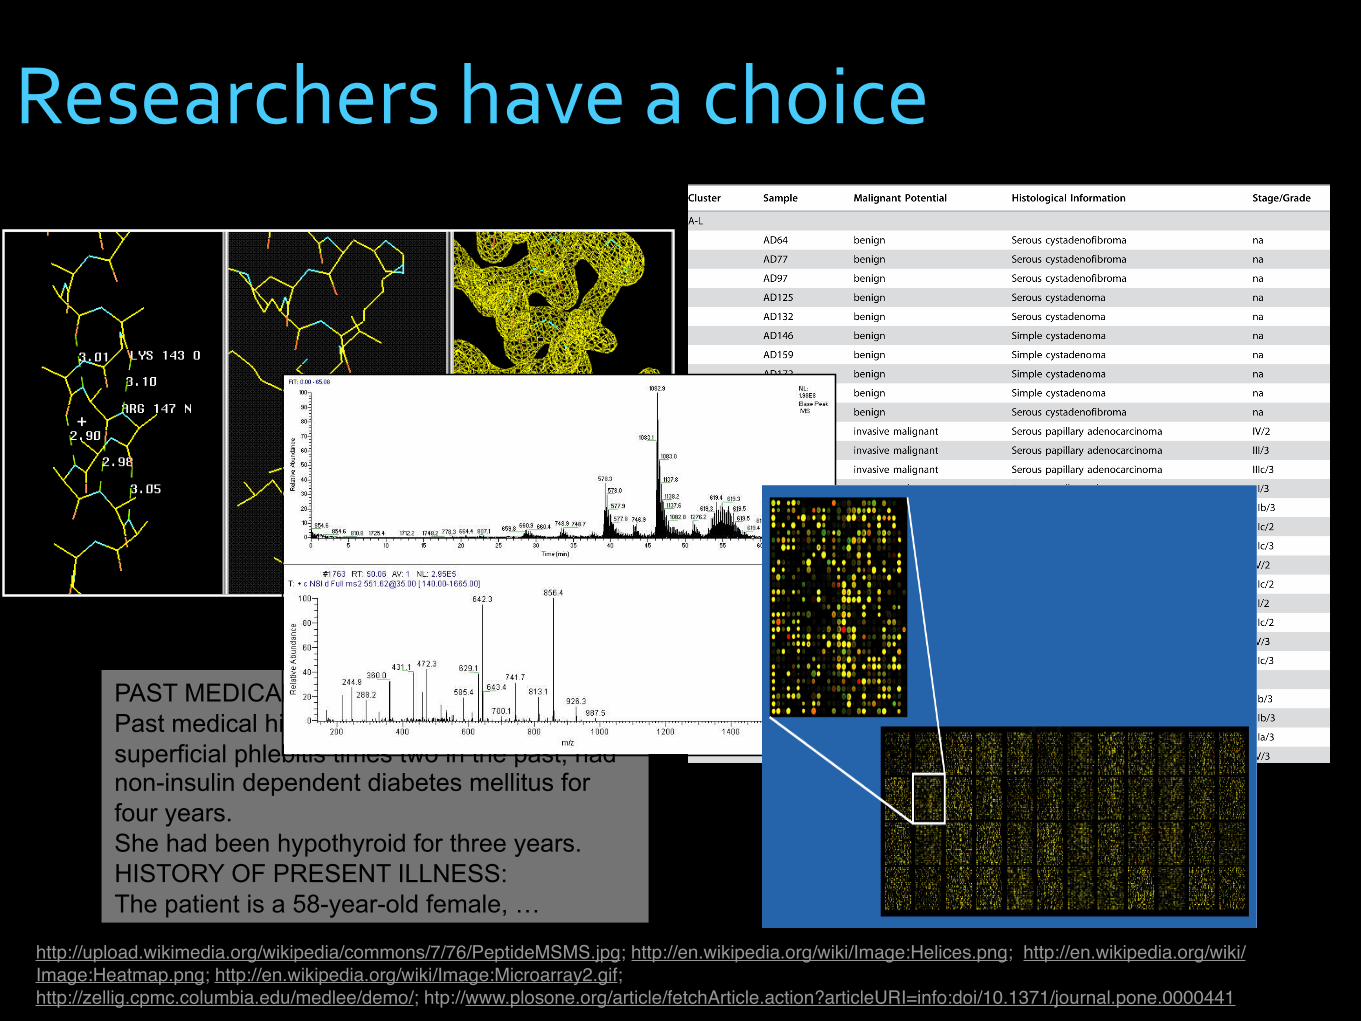
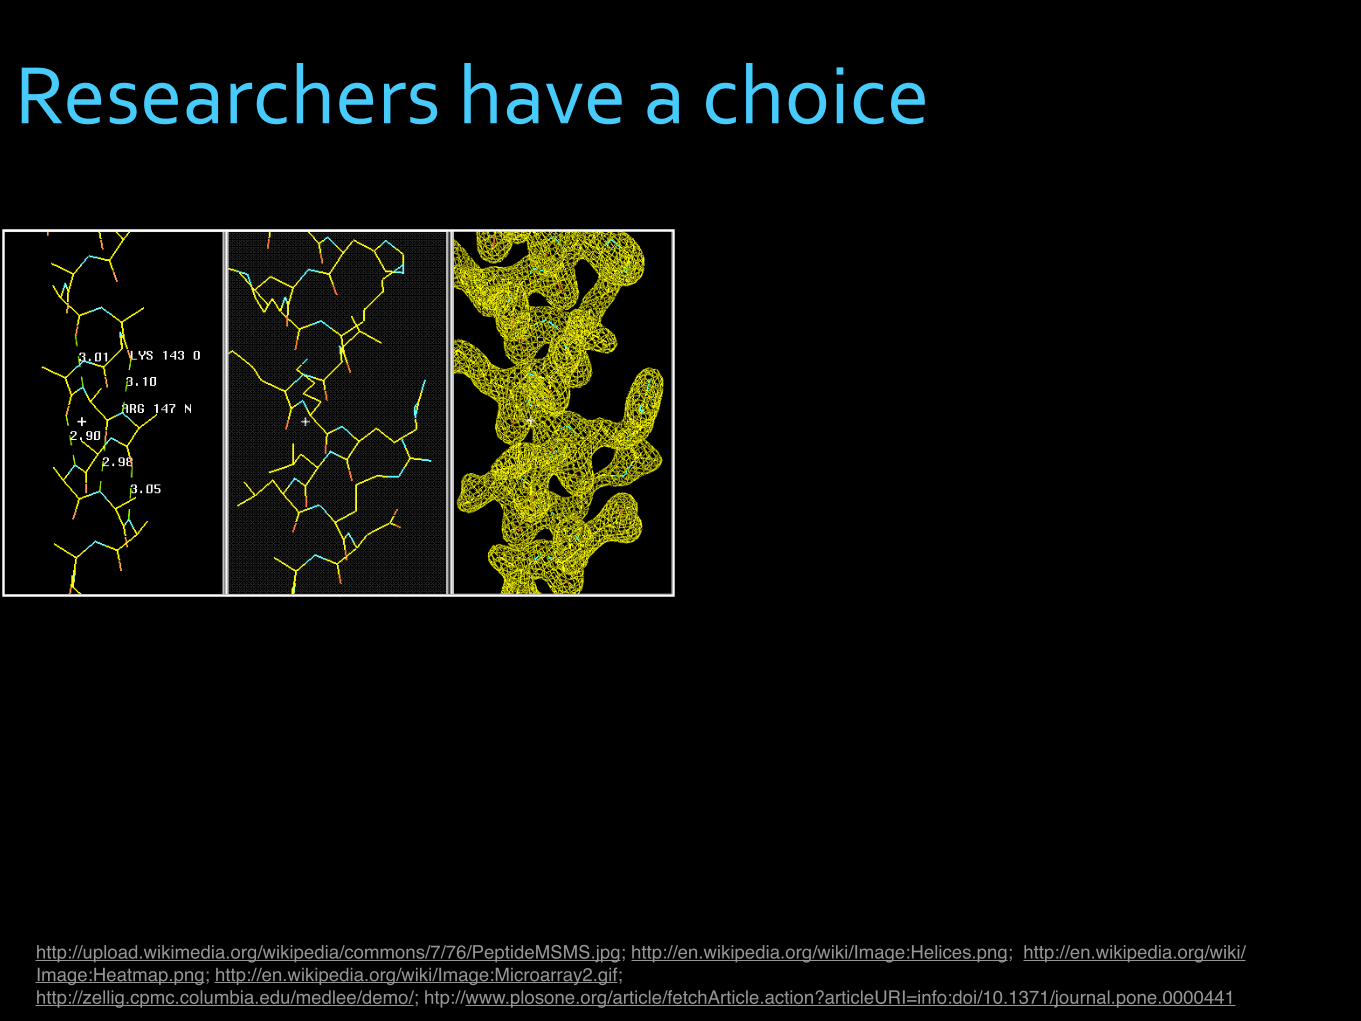
Researchers have a choice
PAST MEDICAL HISTORY:
Past medical history showed she had
superficial phlebitis times two in the past, had non-insulin dependent diabetes mellitus for
four years.
She had been hypothyroid for three years.
HISTORY OF PRESENT ILLNESS:
The patient is a 58-year-old female, …
http://upload.wikimedia.org/wikipedia/commons/7/76/PeptideMSMS.jpg; http://en.wikipedia.org/wiki/Image:Helices.png; http://en.wikipedia.org/wiki/Image:Heatmap.png; http://en.wikipedia.org/wiki/Image:Microarray2.gif; http://zellig.cpmc.columbia.edu/medlee/demo/; htp://www.plosone.org/article/fetchArticle.action?articleURI=info:doi/10.1371/journal.pone.0000441
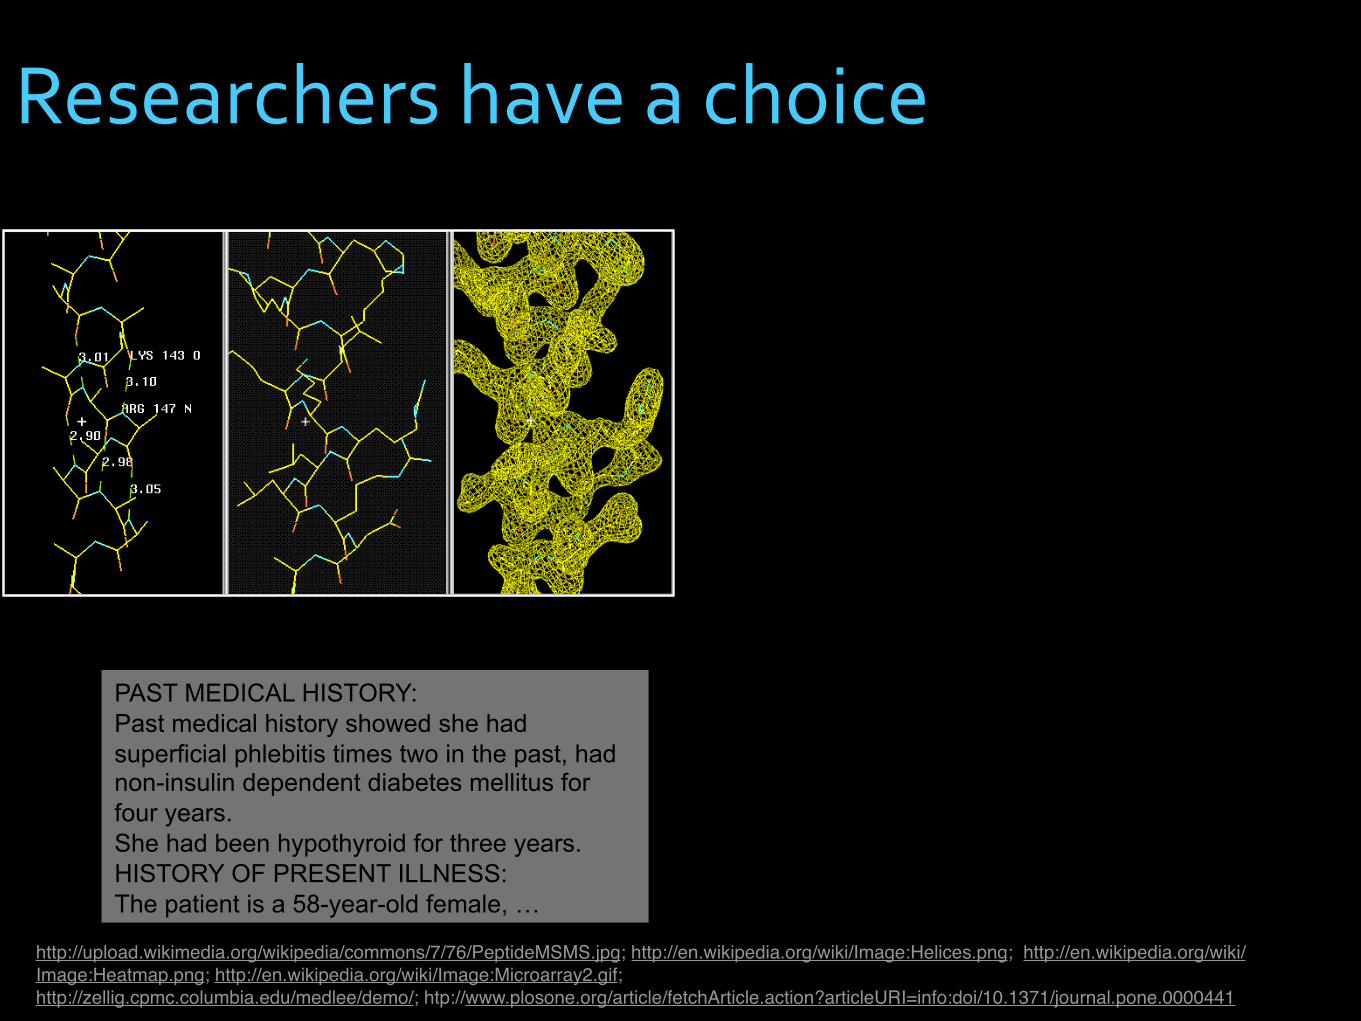
Researchers have a choice
PAST MEDICAL HISTORY:
Past medical history showed she had
superficial phlebitis times two in the past, had non-insulin dependent diabetes mellitus for
four years.
She had been hypothyroid for three years.
HISTORY OF PRESENT ILLNESS:
The patient is a 58-year-old female, …
http://upload.wikimedia.org/wikipedia/commons/7/76/PeptideMSMS.jpg; http://en.wikipedia.org/wiki/Image:Helices.png; http://en.wikipedia.org/wiki/Image:Heatmap.png; http://en.wikipedia.org/wiki/Image:Microarray2.gif; http://zellig.cpmc.columbia.edu/medlee/demo/; htp://www.plosone.org/article/fetchArticle.action?articleURI=info:doi/10.1371/journal.pone.0000441
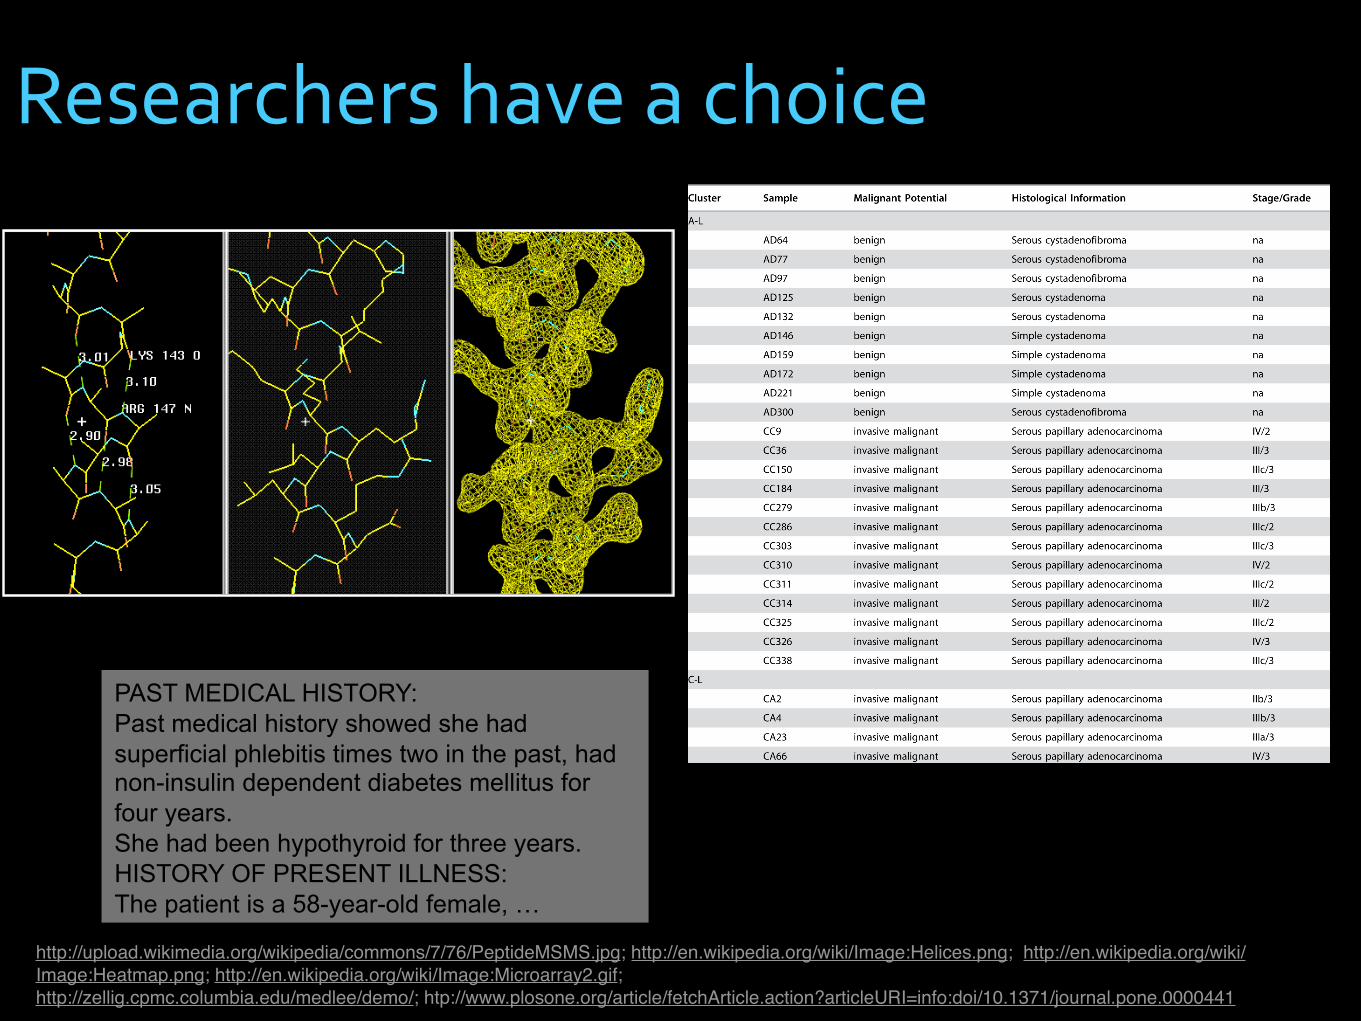
Researchers have a choice
PAST MEDICAL HISTORY:
Past medical history showed she had
superficial phlebitis times two in the past, had non-insulin dependent diabetes mellitus for
four years.
She had been hypothyroid for three years.
HISTORY OF PRESENT ILLNESS:
The patient is a 58-year-old female, …
http://upload.wikimedia.org/wikipedia/commons/7/76/PeptideMSMS.jpg; http://en.wikipedia.org/wiki/Image:Helices.png; http://en.wikipedia.org/wiki/Image:Heatmap.png; http://en.wikipedia.org/wiki/Image:Microarray2.gif; http://zellig.cpmc.columbia.edu/medlee/demo/; htp://www.plosone.org/article/fetchArticle.action?articleURI=info:doi/10.1371/journal.pone.0000441
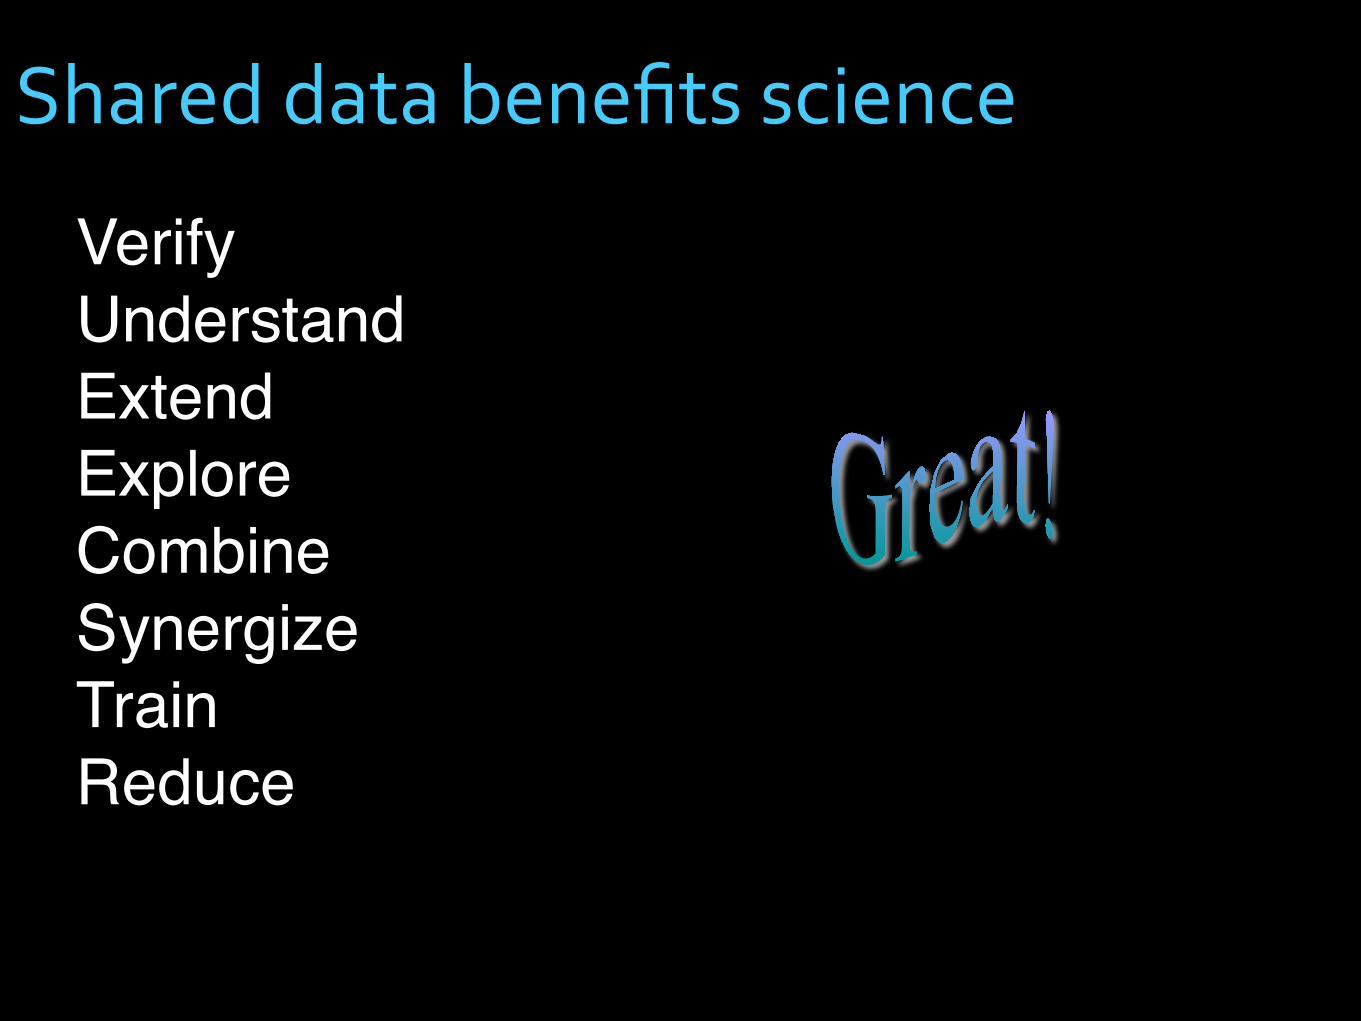
Shared data benefits science
VerifyUnderstandExtendExploreCombineSynergizeTrainReduce
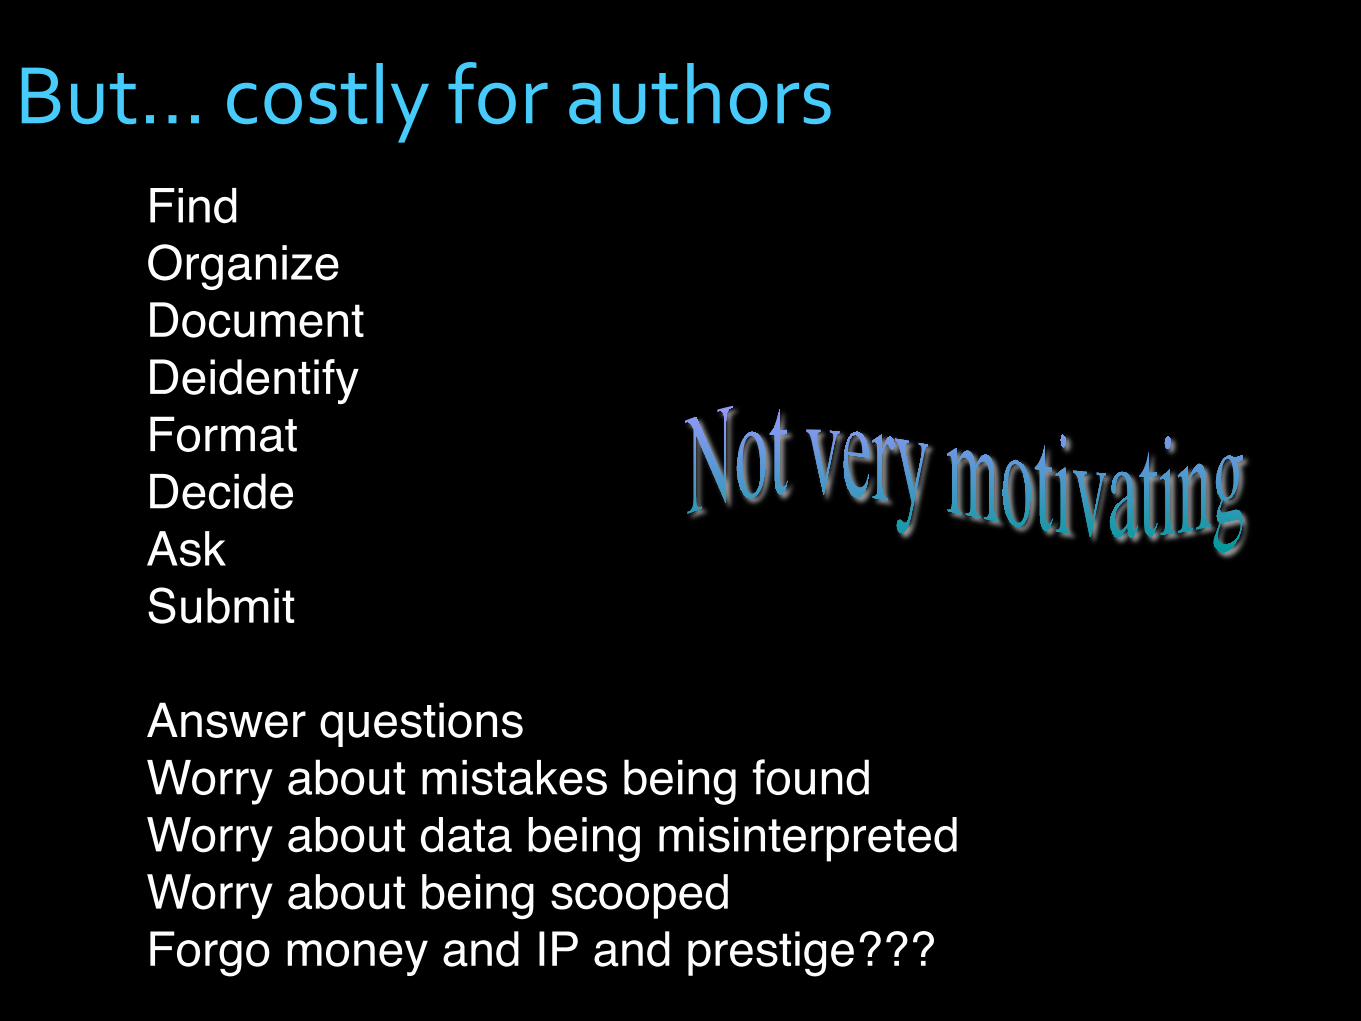
But... costly for authorsFindOrganizeDocumentDeidentifyFormatDecideAskSubmit
Answer questionsWorry about mistakes being foundWorry about data being misinterpretedWorry about being scoopedForgo money and IP and prestige???
http://www.flickr.com/photos/75166820@N00/5318468/
As a result, policy makers have spent lots of time and money ....
http://www.flickr.com/photos/tonivc/2283676770/
http://www.flickr.com/photos/johnnyvulkan/381941233/
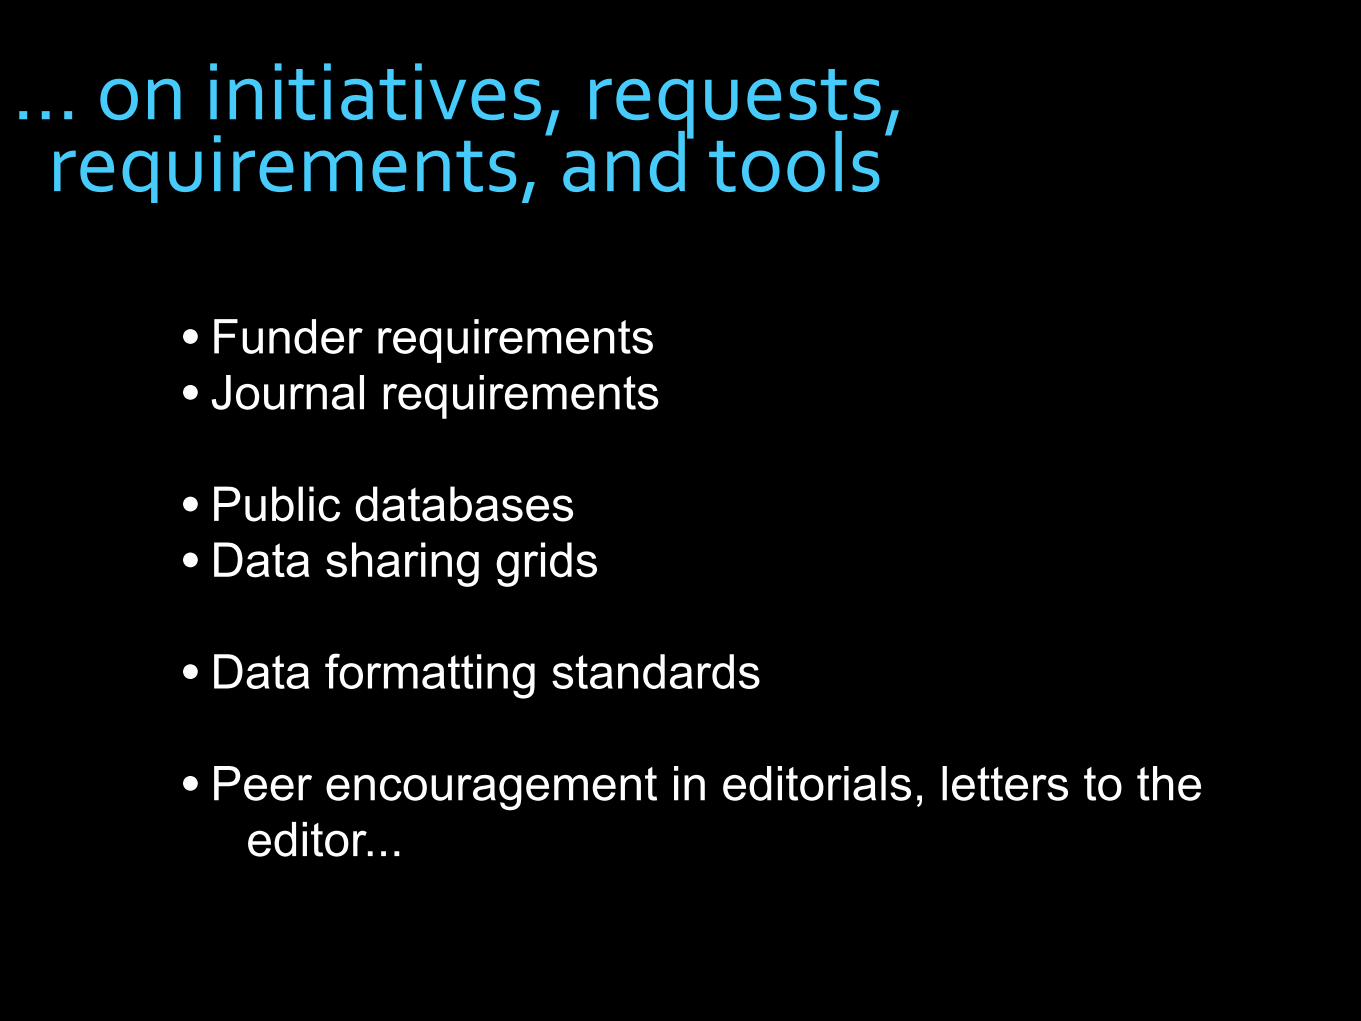
... on initiatives, requests, requirements, and tools
• Funder requirements• Journal requirements
• Public databases• Data sharing grids
• Data formatting standards
• Peer encouragement in editorials, letters to the editor...
Does it work?
http://www.flickr.com/photos/archeon/2941655917/
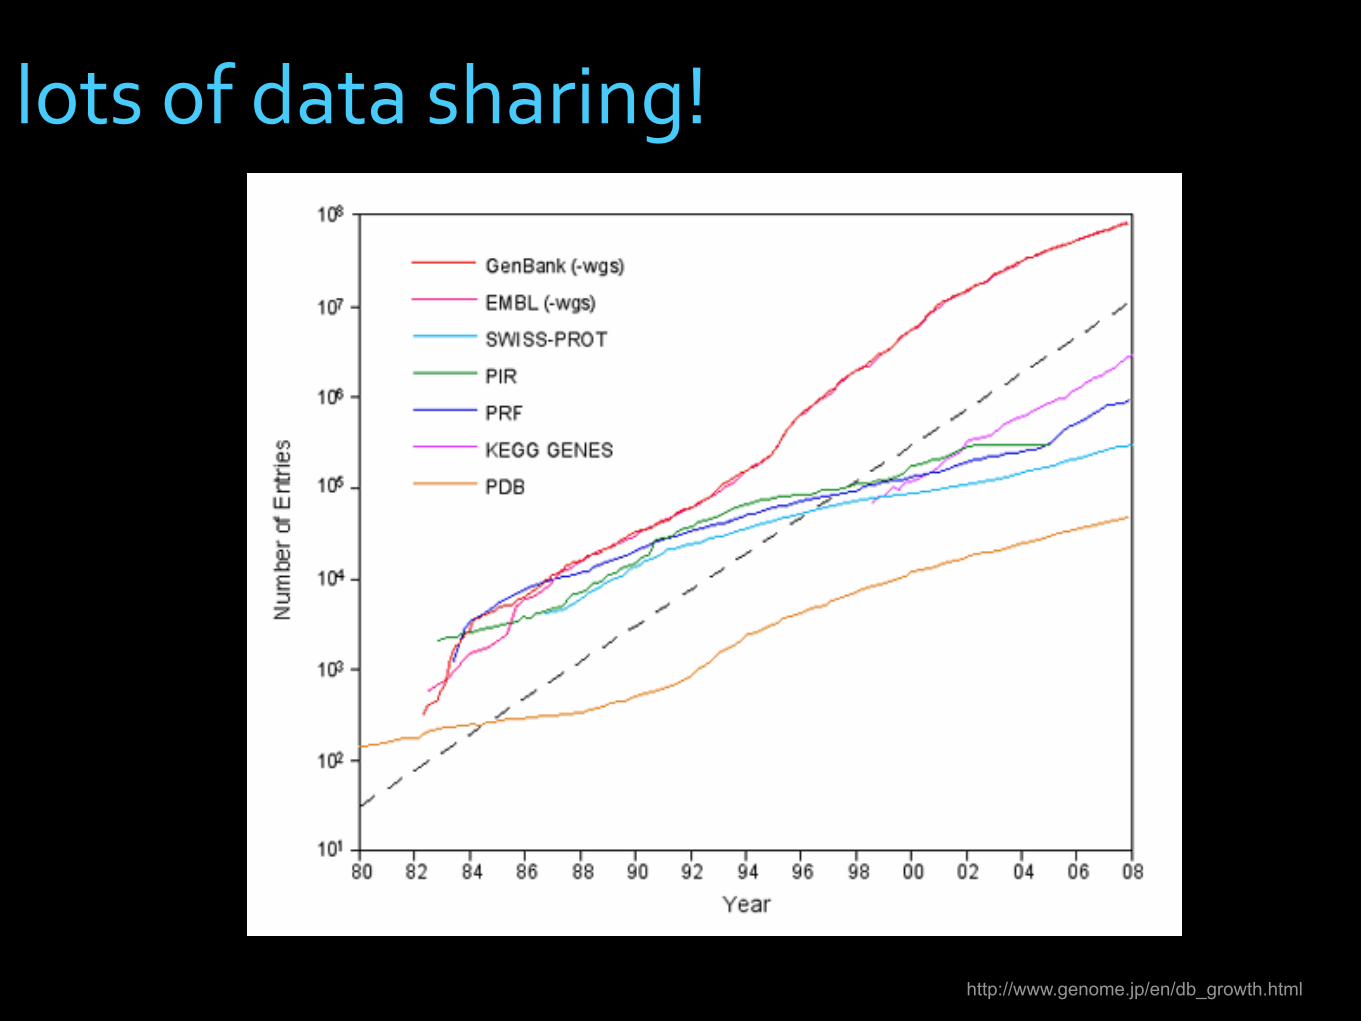
lots of data sharing!
http://www.genome.jp/en/db_growth.html
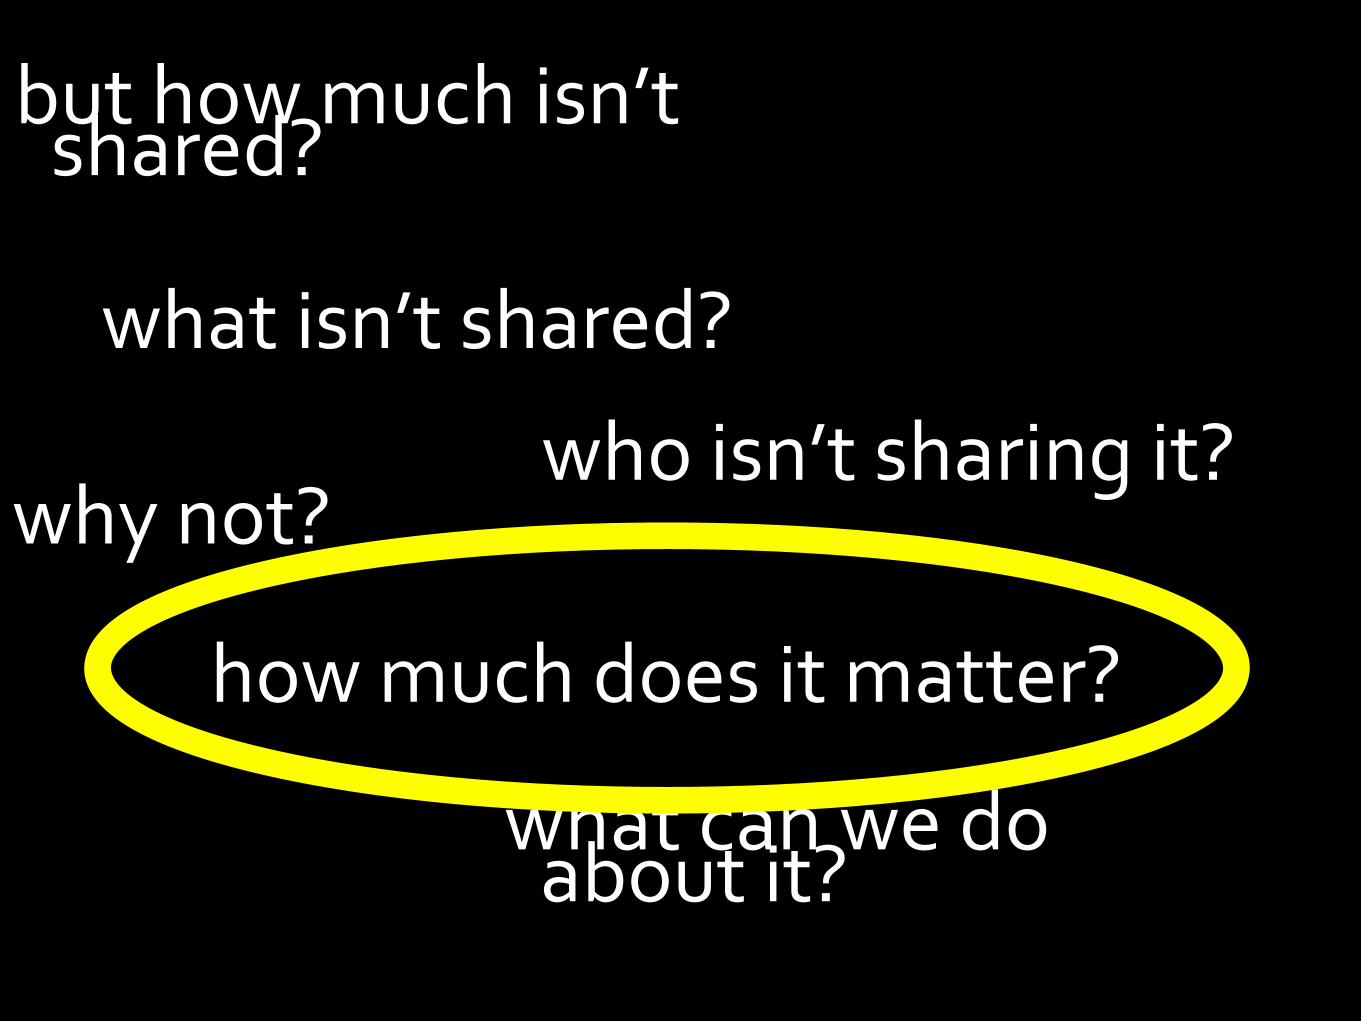
but how much isn’t shared?
what isn’t shared?
who isn’t sharing it?why not?
what can we do about it?
how much does it matter?
http://www.flickr.com/photos/paulhami/1020538523//
who
what
when
where
why
how
http://www.flickr.com/photos/ryanr/142455033/
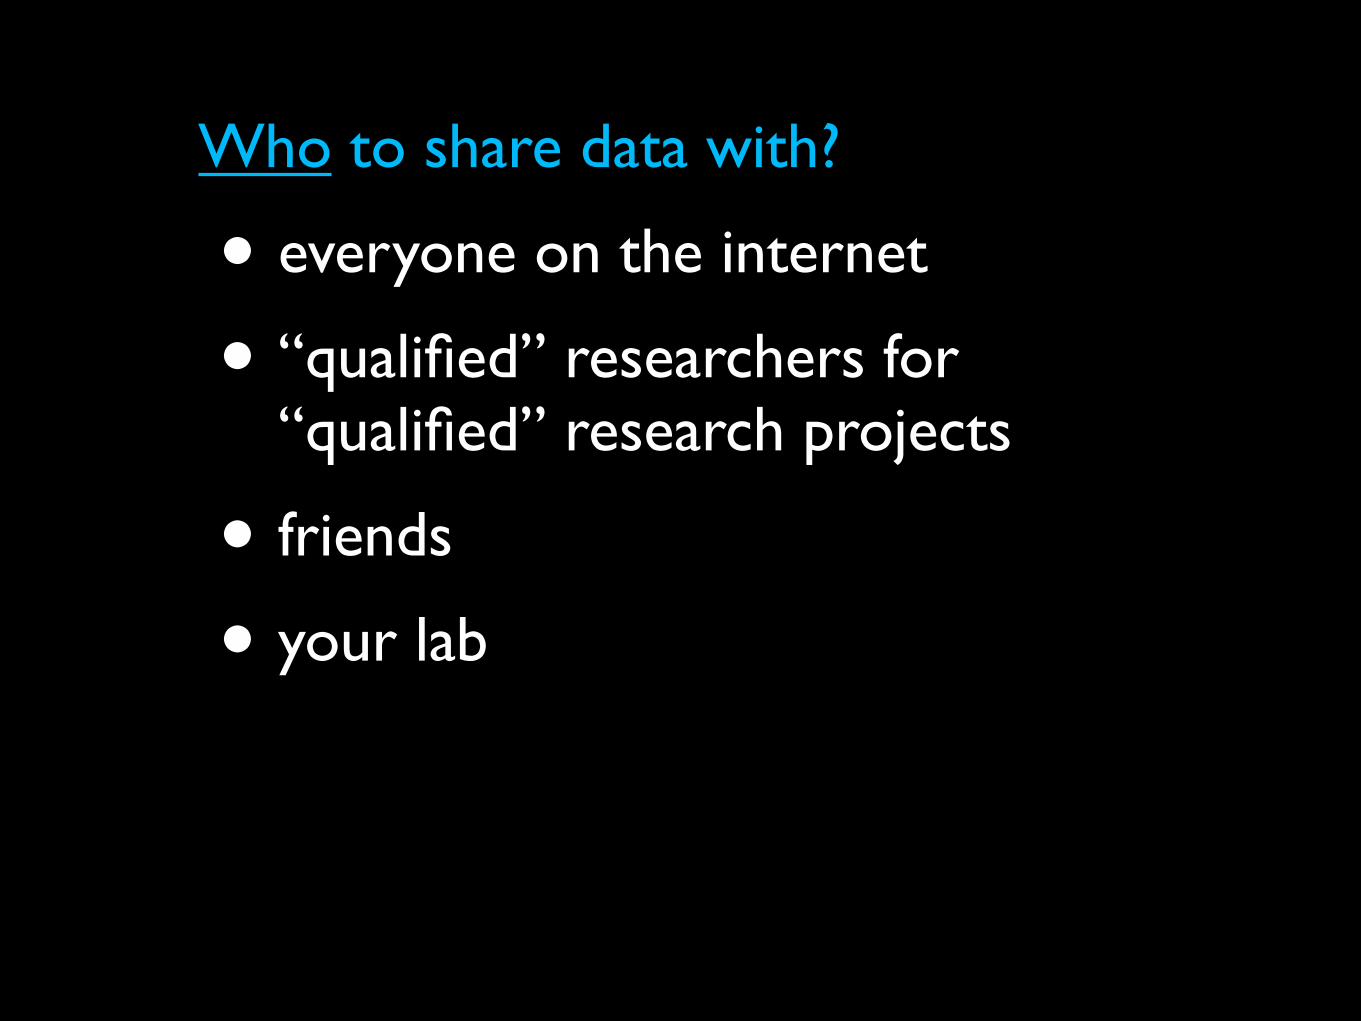
Who to share data with?
• everyone on the internet
• “qualified” researchers for “qualified” research projects
• friends
• your lab
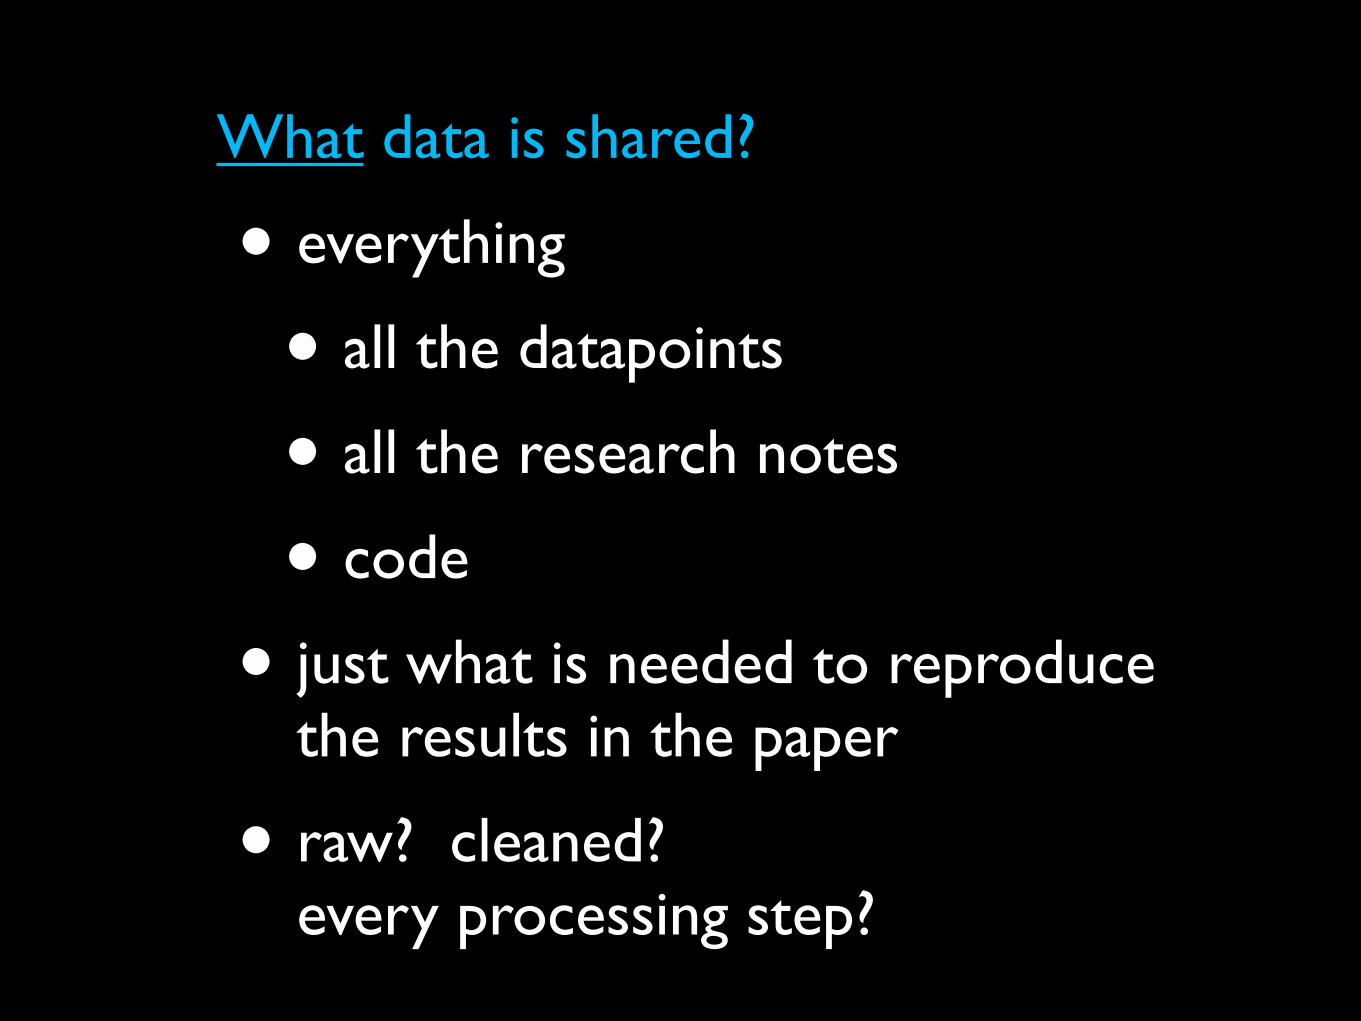
What data is shared?
• everything
• all the datapoints
• all the research notes
• code
• just what is needed to reproduce the results in the paper
• raw? cleaned? every processing step?
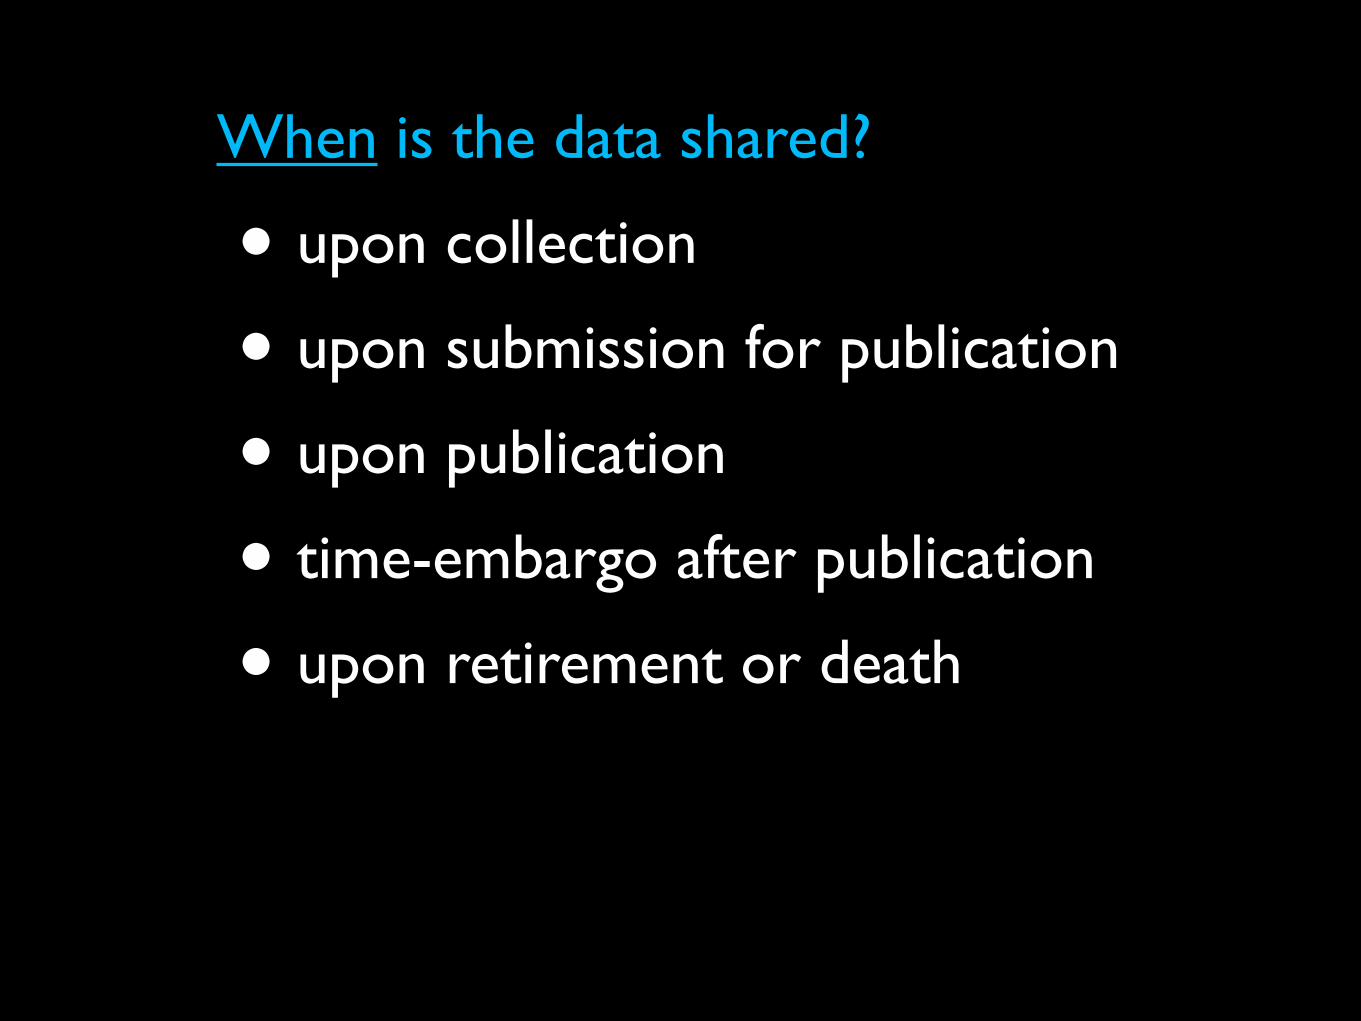
When is the data shared?
• upon collection
• upon submission for publication
• upon publication
• time-embargo after publication
• upon retirement or death
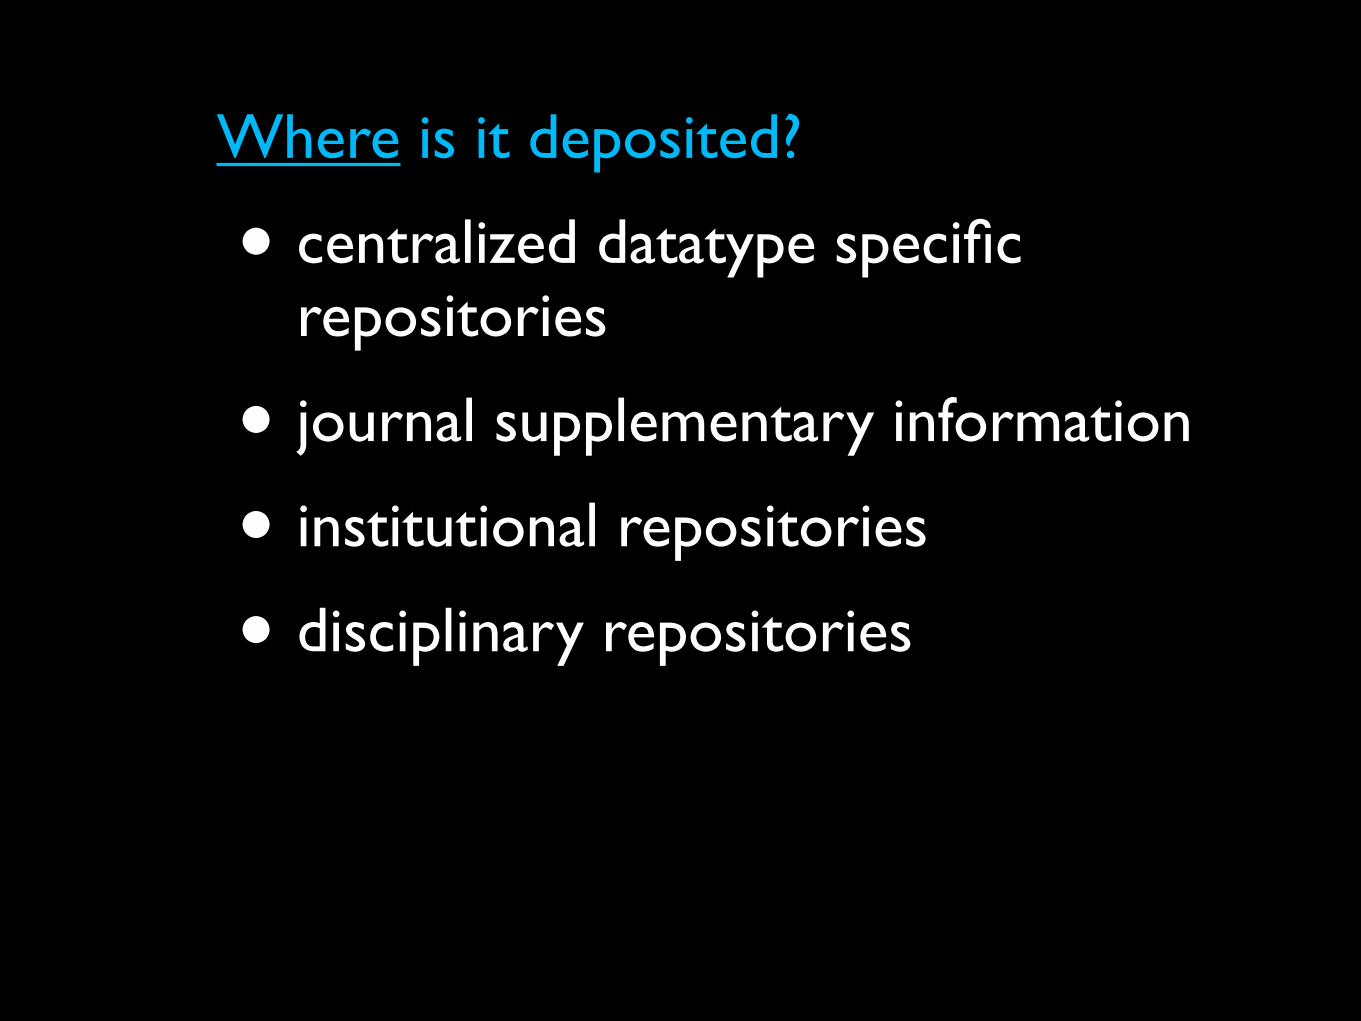
Where is it deposited?
• centralized datatype specific repositories
• journal supplementary information
• institutional repositories
• disciplinary repositories
Why share it?
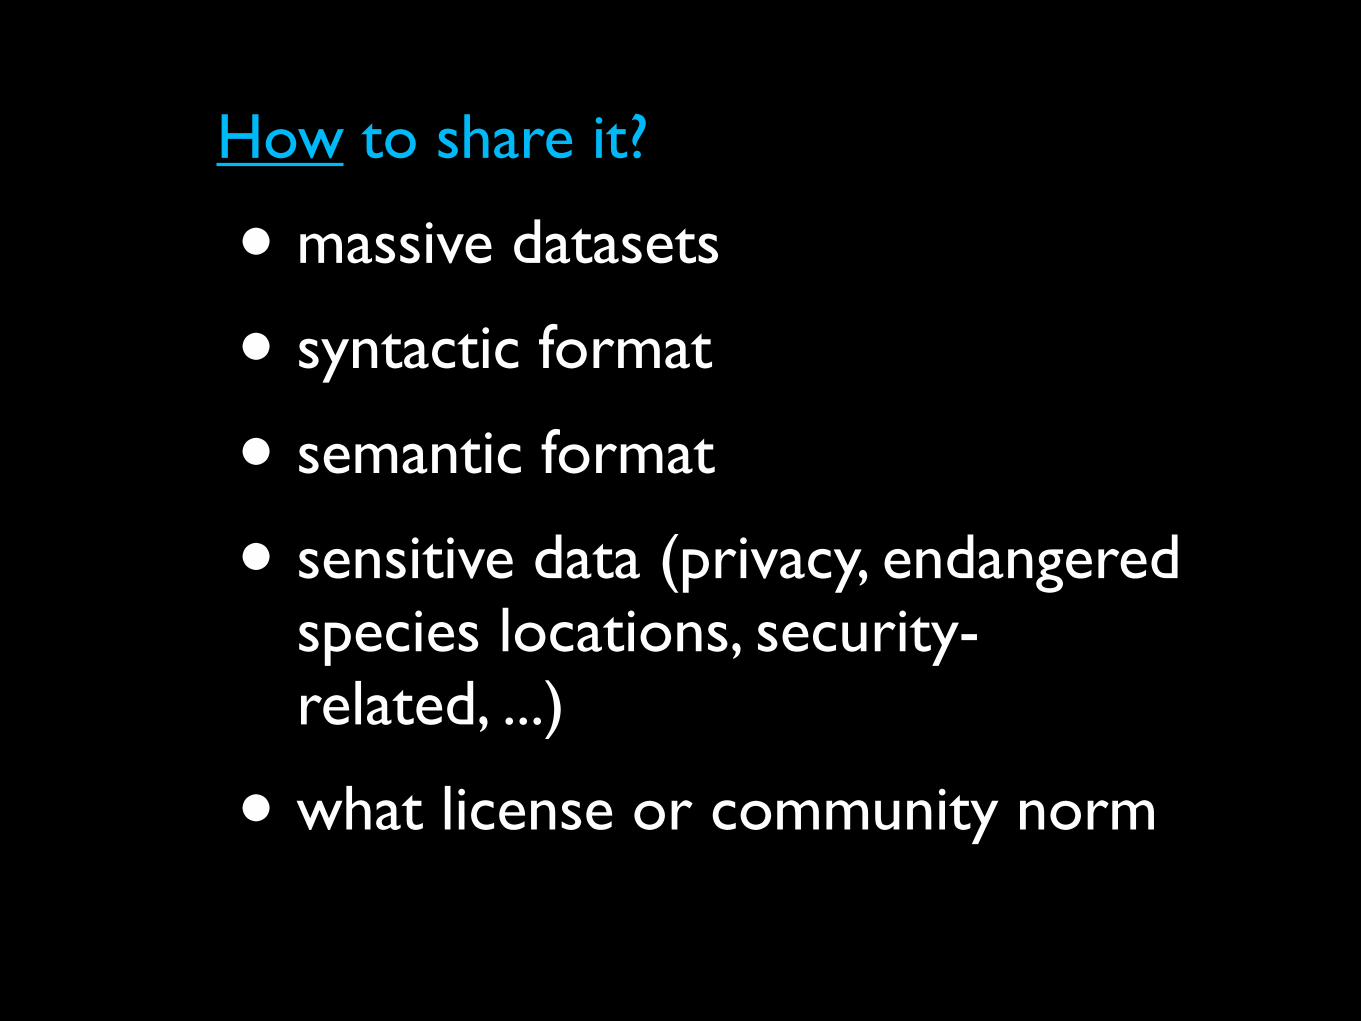
How to share it?
• massive datasets
• syntactic format
• semantic format
• sensitive data (privacy, endangered species locations, security-related, ...)
• what license or community norm

http://www.flickr.com/photos/paulhami/1020538523//
http://www.flickr.com/photos/paulhami/1020538523//
http://www.flickr.com/photos/paulhami/1020538523//
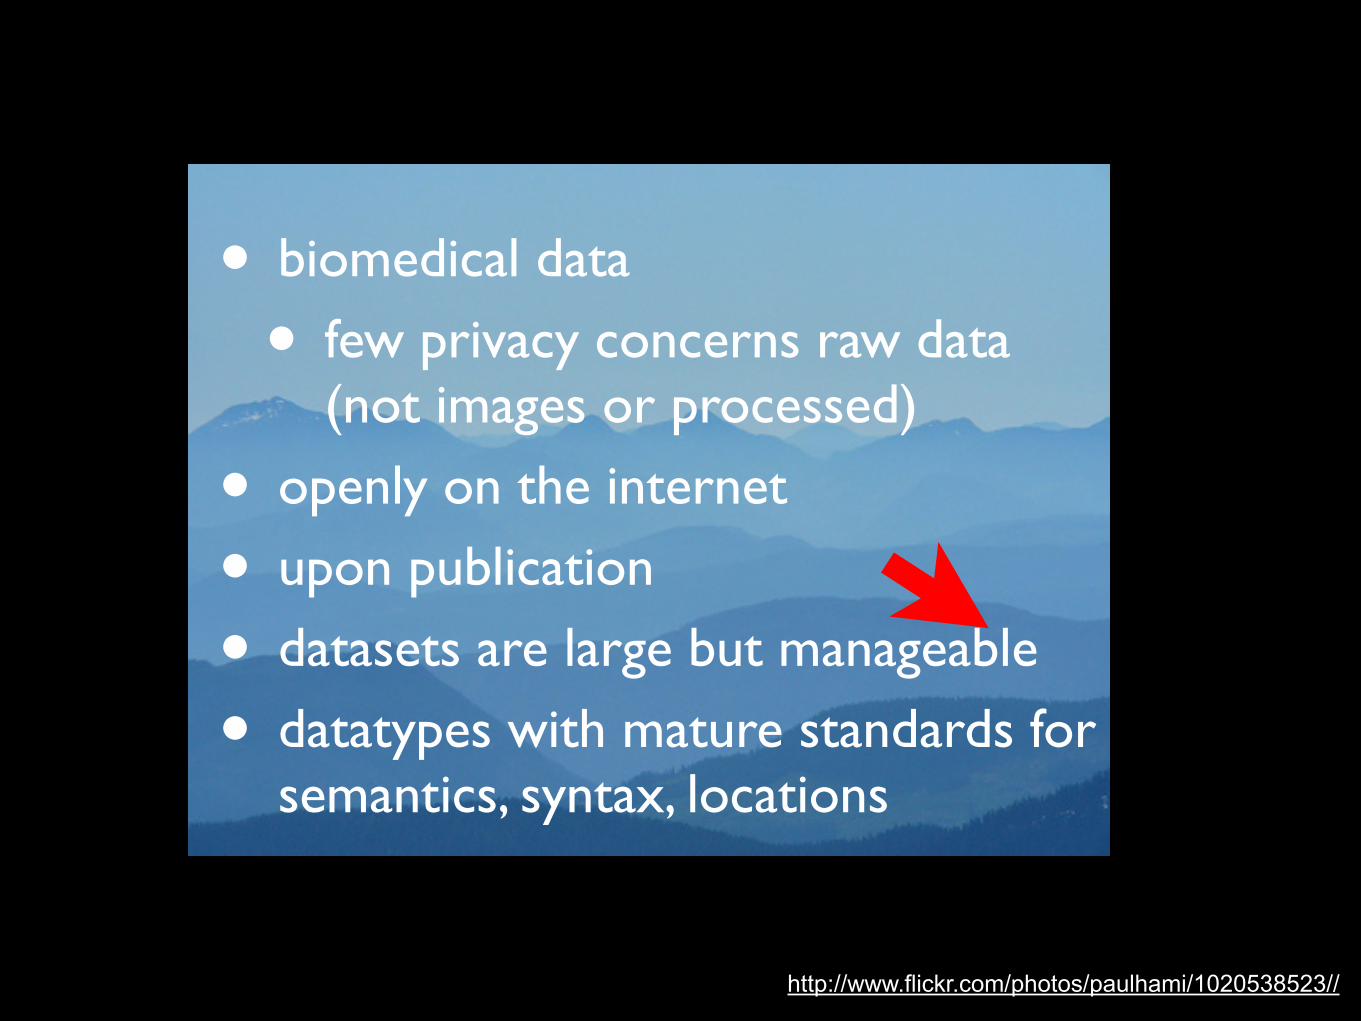
• biomedical data
• few privacy concerns raw data (not images or processed)
• openly on the internet
• upon publication
• datasets are large but manageable
• datatypes with mature standards for semantics, syntax, locations

but how much isn’t shared?
what isn’t shared?
who isn’t sharing it?why not?
what can we do about it?
how much does it matter?
but how much isn’t shared?
what isn’t shared?
who isn’t sharing it?why not?
what can we do about it?
how much does it matter?
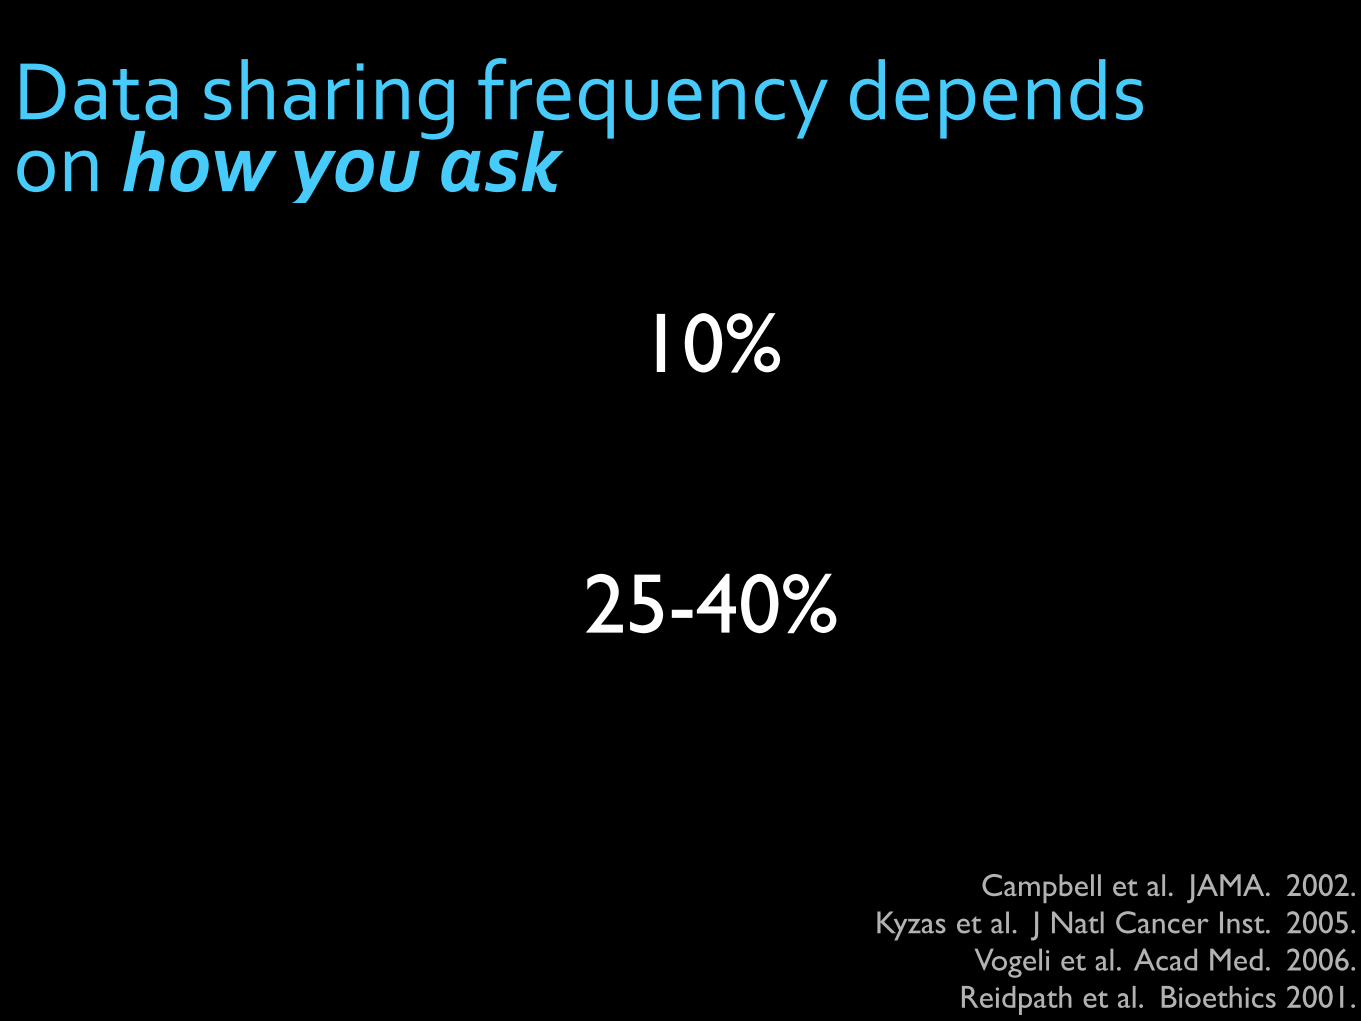
Data sharing frequency depends on how you ask
Campbell et al. JAMA. 2002.Kyzas et al. J Natl Cancer Inst. 2005.
Vogeli et al. Acad Med. 2006.Reidpath et al. Bioethics 2001.
10%
25-40%
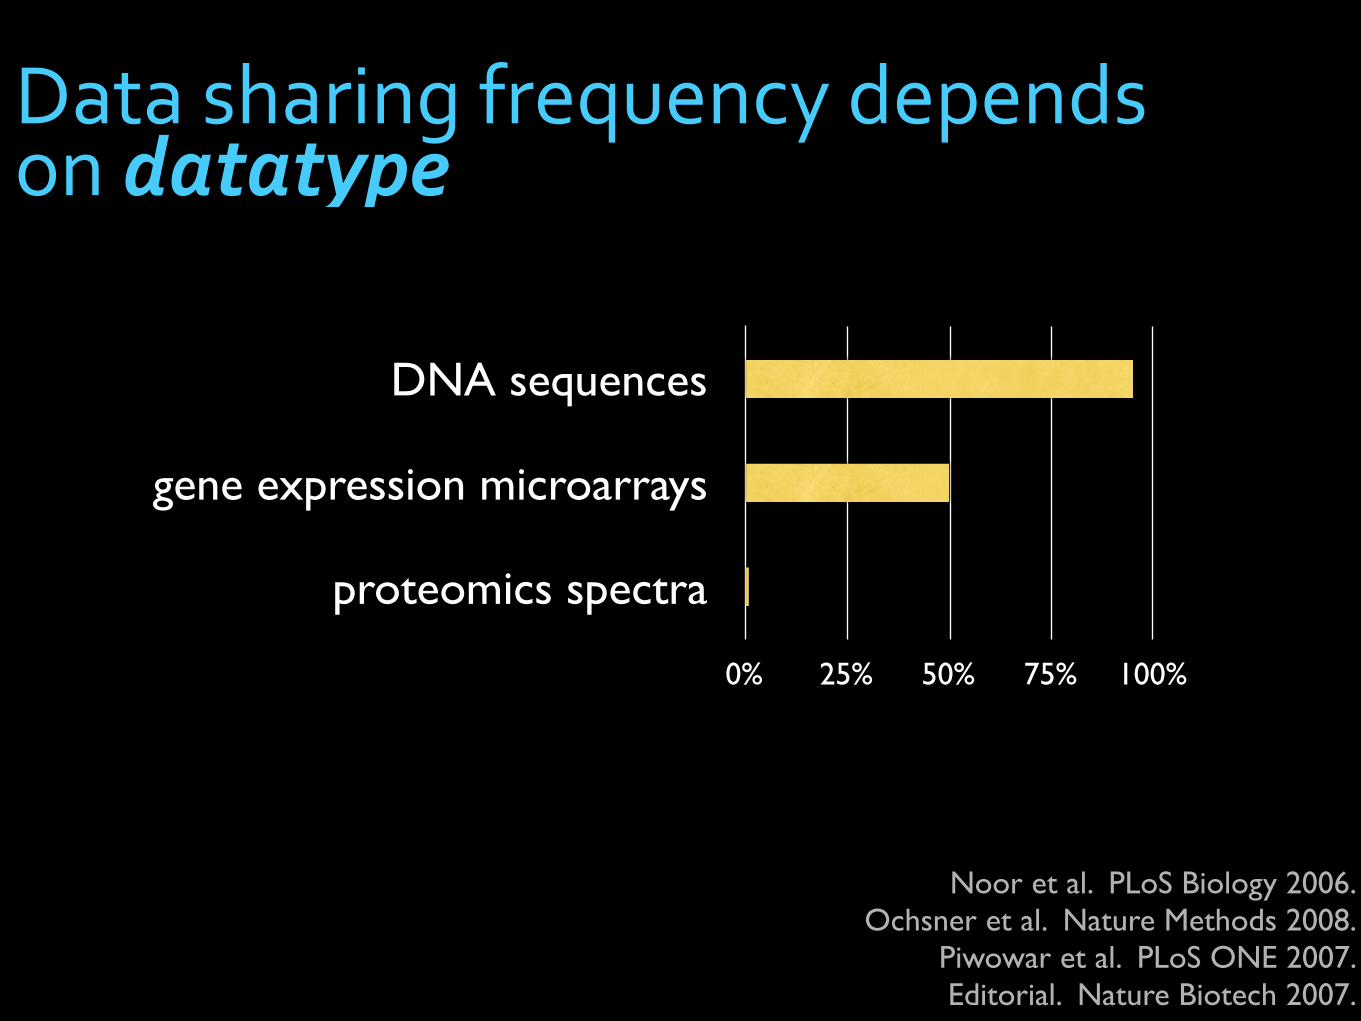
Noor et al. PLoS Biology 2006.Ochsner et al. Nature Methods 2008.
Piwowar et al. PLoS ONE 2007.Editorial. Nature Biotech 2007.
DNA sequences
gene expression microarrays
proteomics spectra
0% 25% 50% 75% 100%
Data sharing frequency depends on datatype
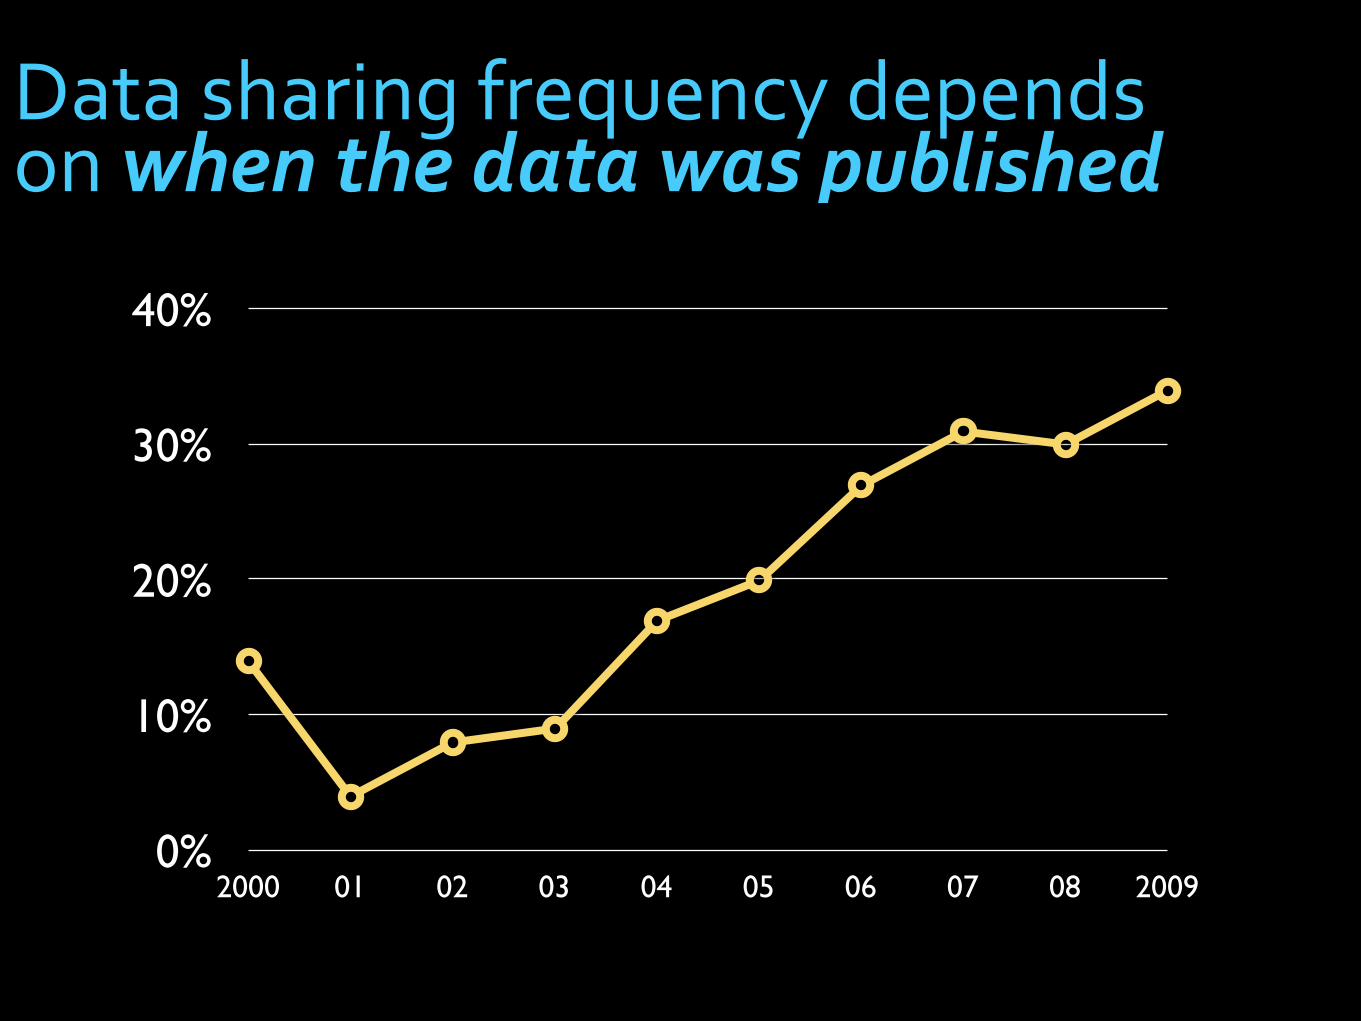
Data sharing frequency depends on when the data was published
0%
10%
20%
30%
40%
2000 01 02 03 04 05 06 07 08 2009

lots of data sharing!
http://www.genome.jp/en/db_growth.html

Data sharing frequency depends on when the data was published
0%
10%
20%
30%
40%
2000 01 02 03 04 05 06 07 08 2009
but how much isn’t shared?
what isn’t shared?
who isn’t sharing it?why not?
what can we do about it?
how much does it matter?
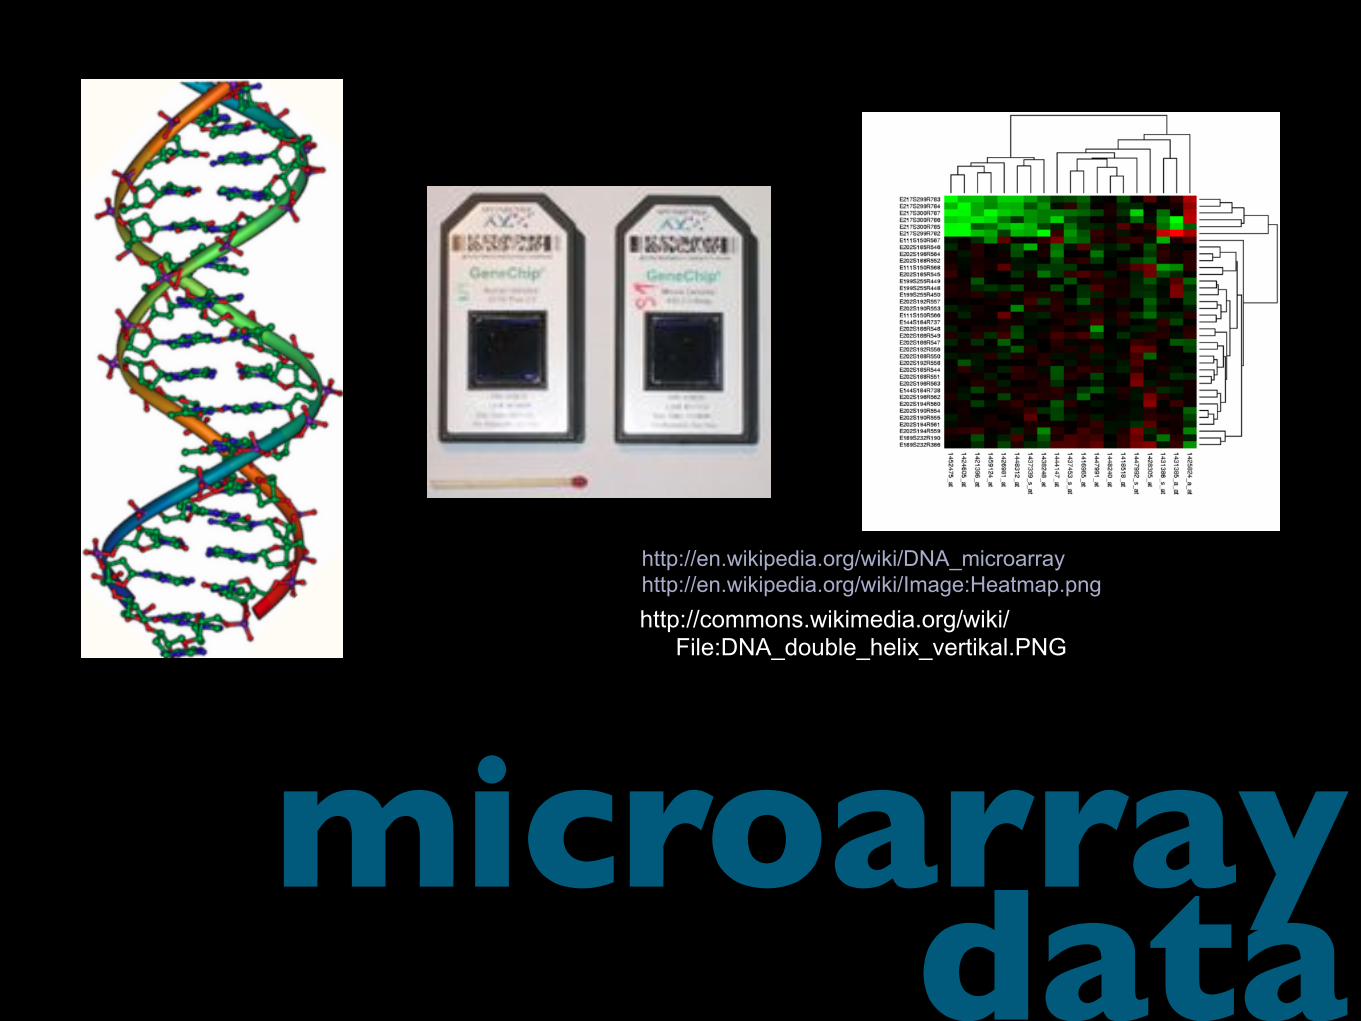
microarray data
http://en.wikipedia.org/wiki/DNA_microarray
http://en.wikipedia.org/wiki/Image:Heatmap.png
http://commons.wikimedia.org/wiki/File:DNA_double_helix_vertikal.PNG
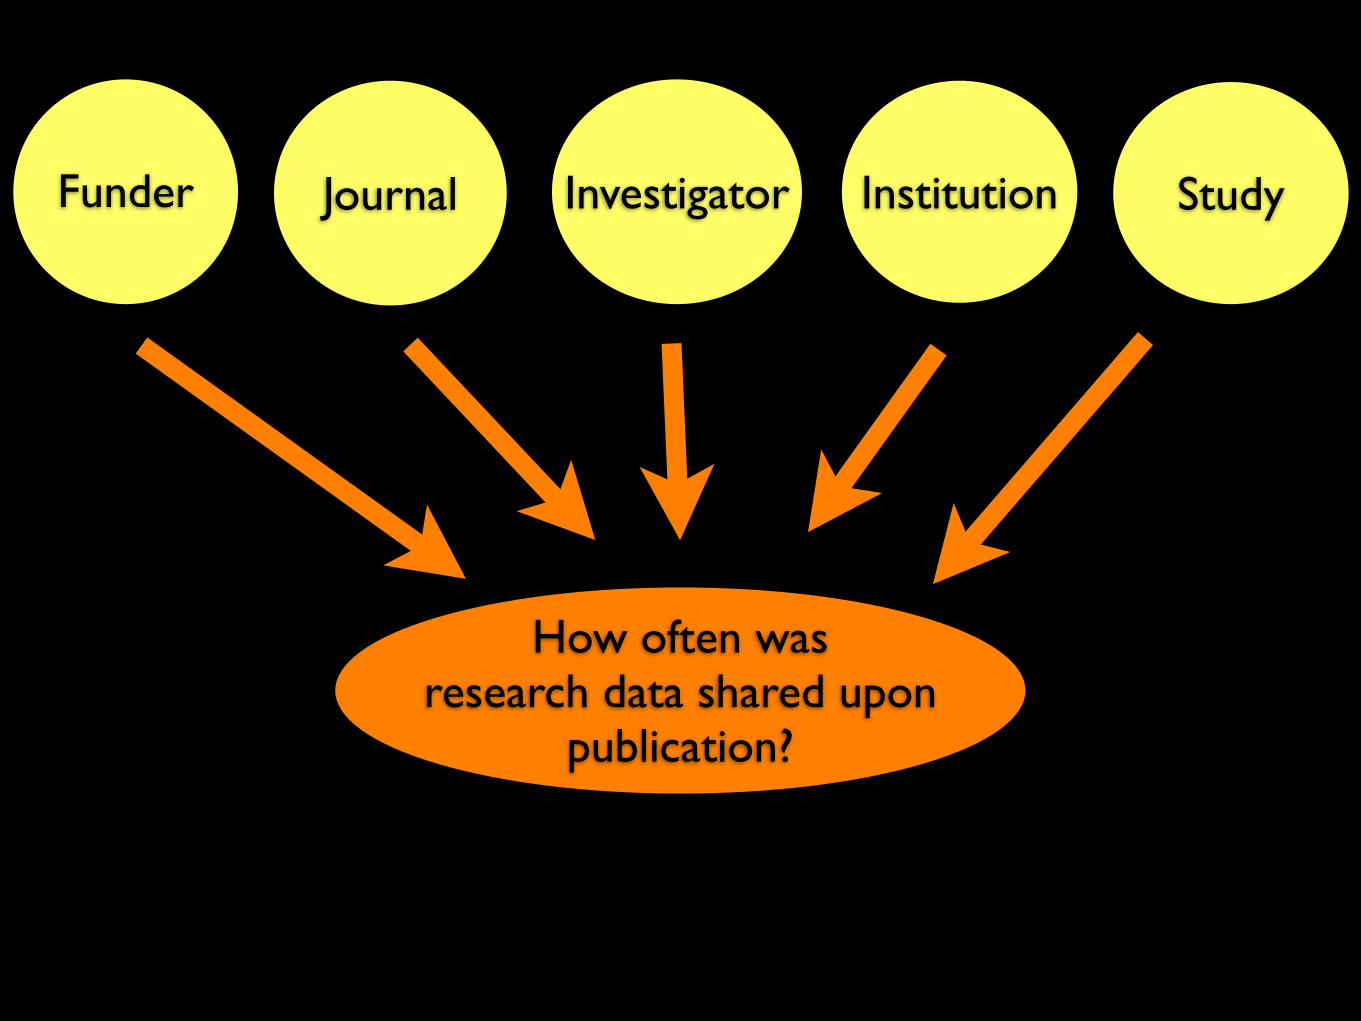
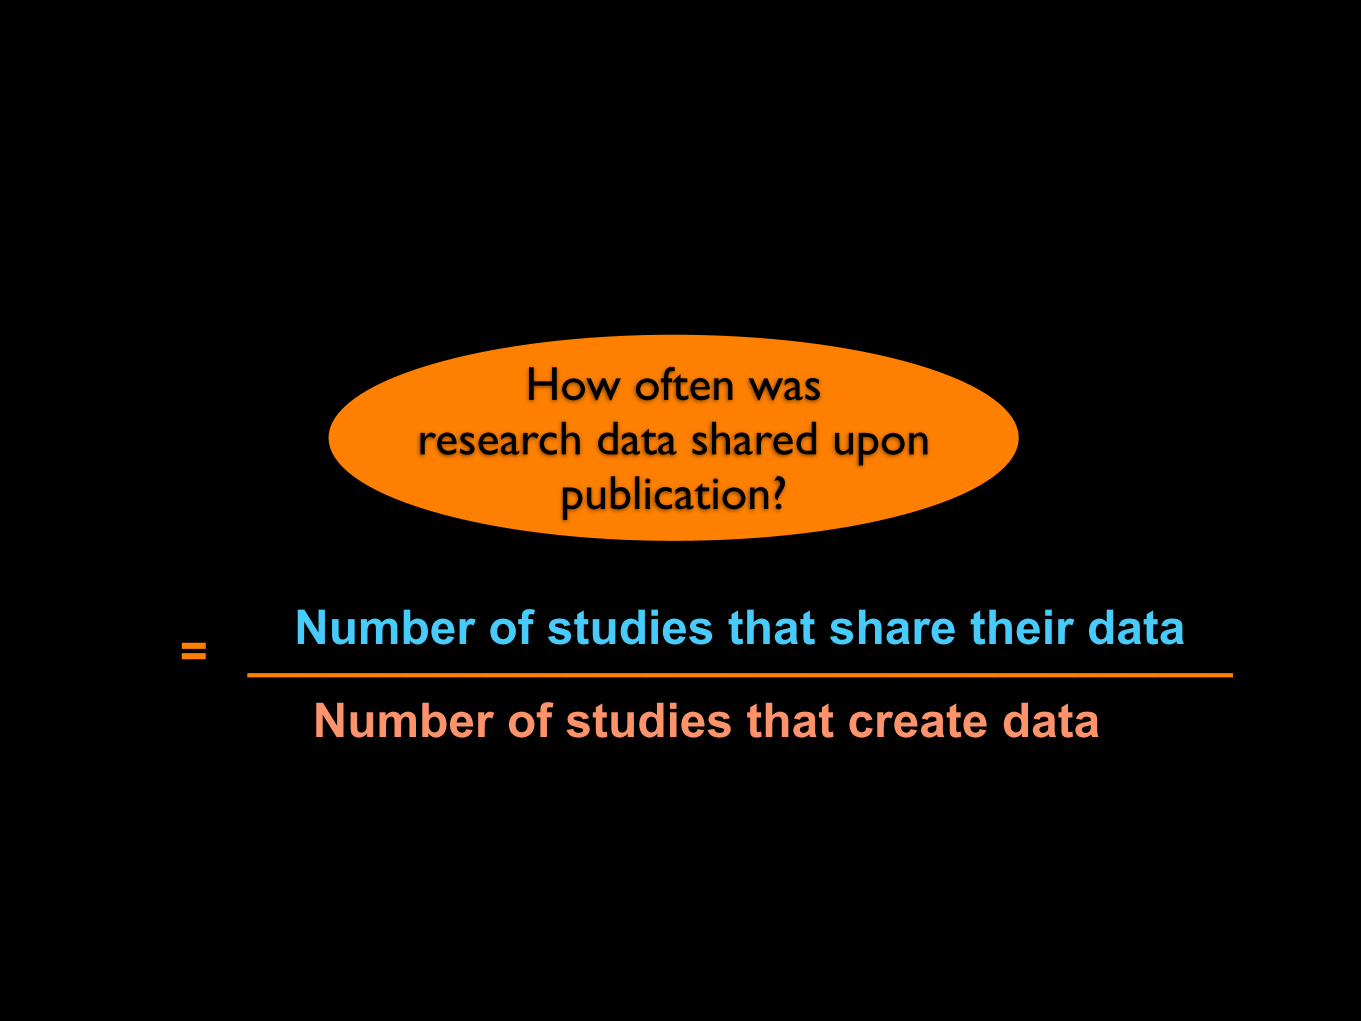
How often was research data shared upon
publication?
Funder Journal Investigator Institution Study

Number of studies that share their data= _____________________________________Number of studies that create data
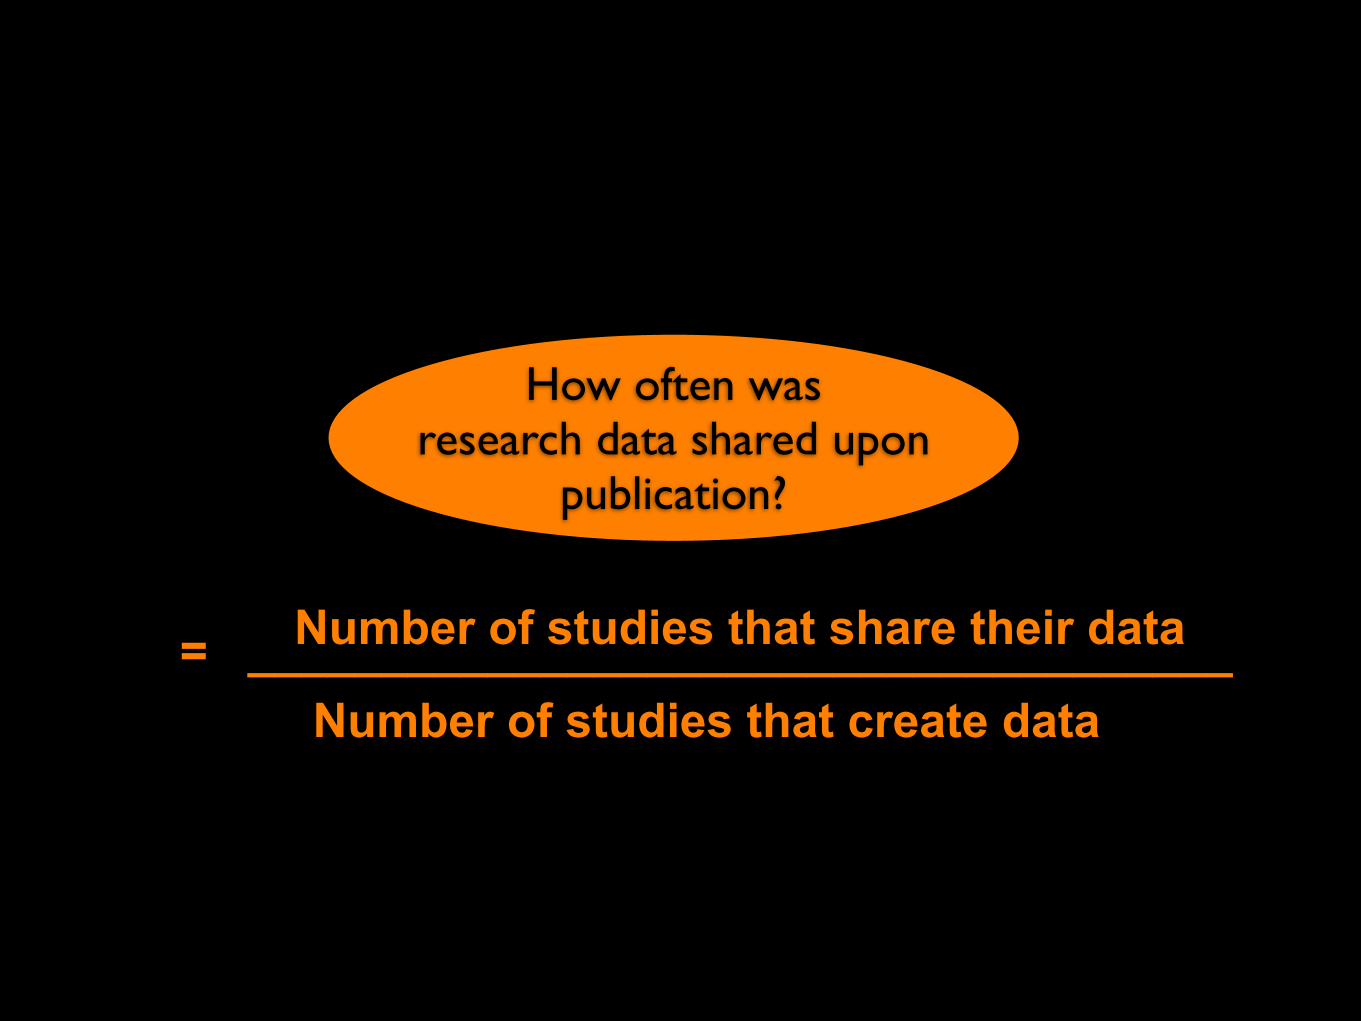
How often was research data shared upon
publication?
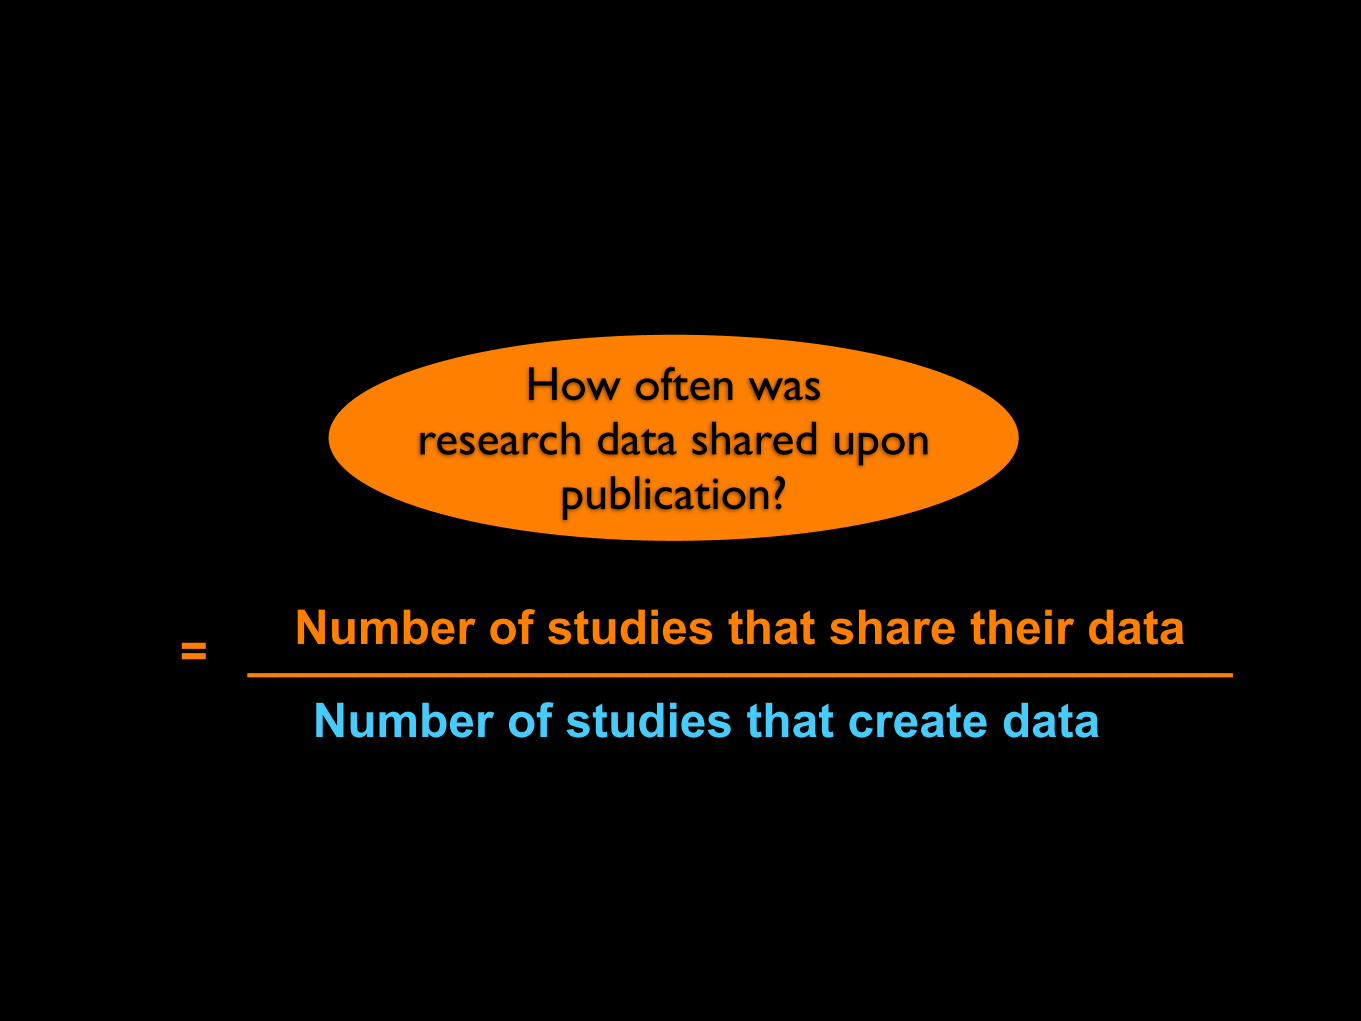
Number of studies that share their data= _____________________________________Number of studies that create data
How often was research data shared upon
publication?
http://www.flickr.com/photos/lofaesofa/248546821/
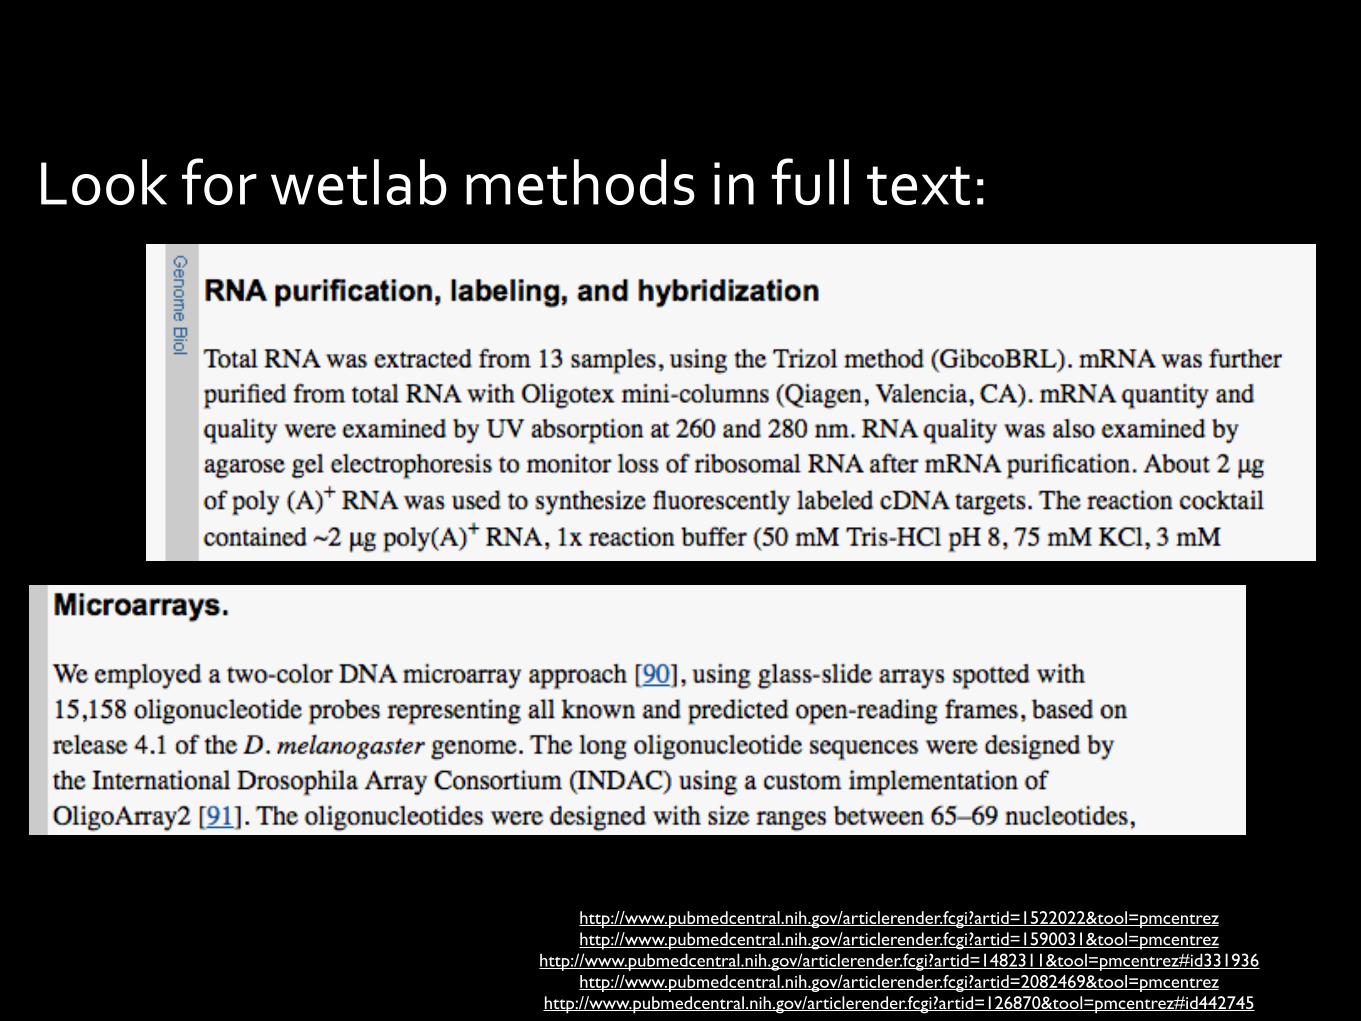
Look for wetlab methods in full text:
http://www.pubmedcentral.nih.gov/articlerender.fcgi?artid=1522022&tool=pmcentrezhttp://www.pubmedcentral.nih.gov/articlerender.fcgi?artid=1590031&tool=pmcentrez
http://www.pubmedcentral.nih.gov/articlerender.fcgi?artid=1482311&tool=pmcentrez#id331936http://www.pubmedcentral.nih.gov/articlerender.fcgi?artid=2082469&tool=pmcentrez
http://www.pubmedcentral.nih.gov/articlerender.fcgi?artid=126870&tool=pmcentrez#id442745
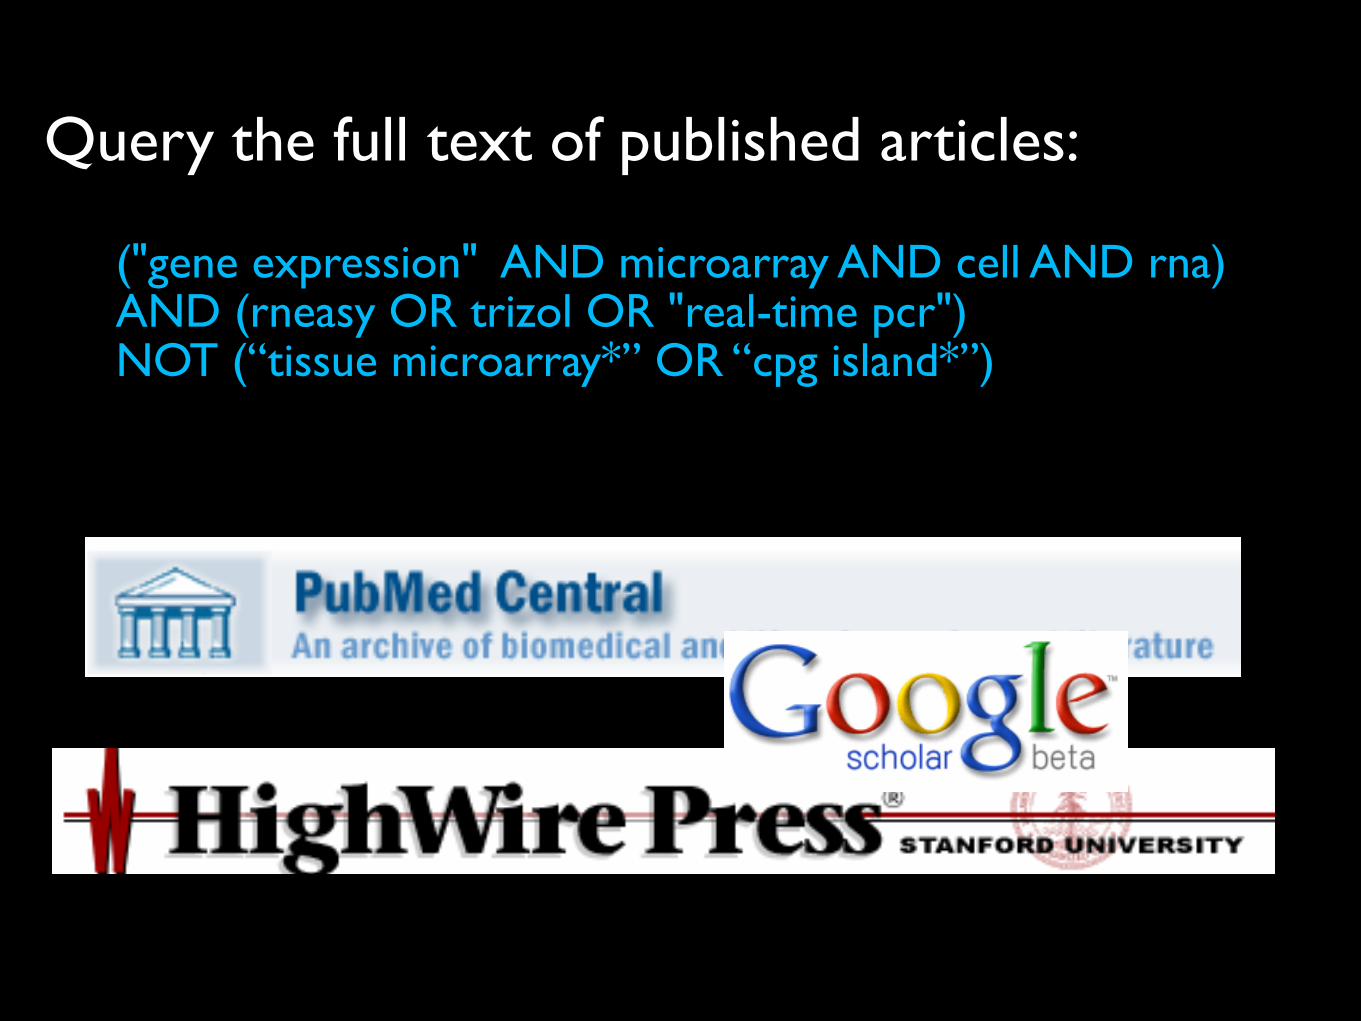
Query the full text of published articles:
("gene expression" AND microarray AND cell AND rna) AND (rneasy OR trizol OR "real-time pcr") NOT (“tissue microarray*” OR “cpg island*”)
Number of studies that share their data= _____________________________________Number of studies that create data
How often was research data shared upon
publication?

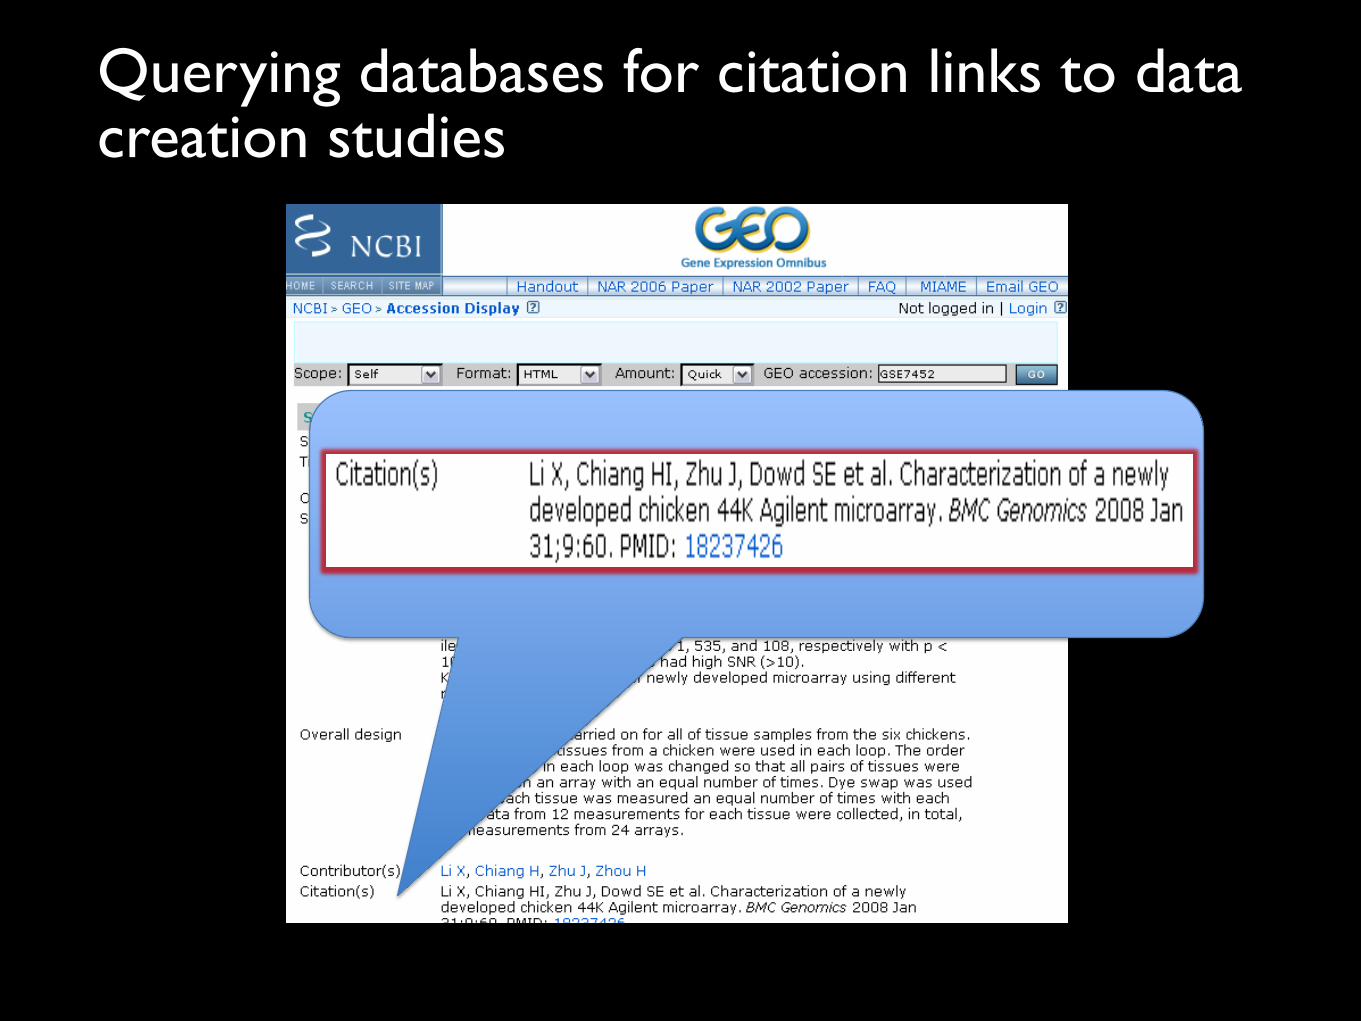
Querying databases for citation links to data creation studies
Number of studies that share their data= _____________________________________Number of studies that create data
How often was research data shared upon
publication?
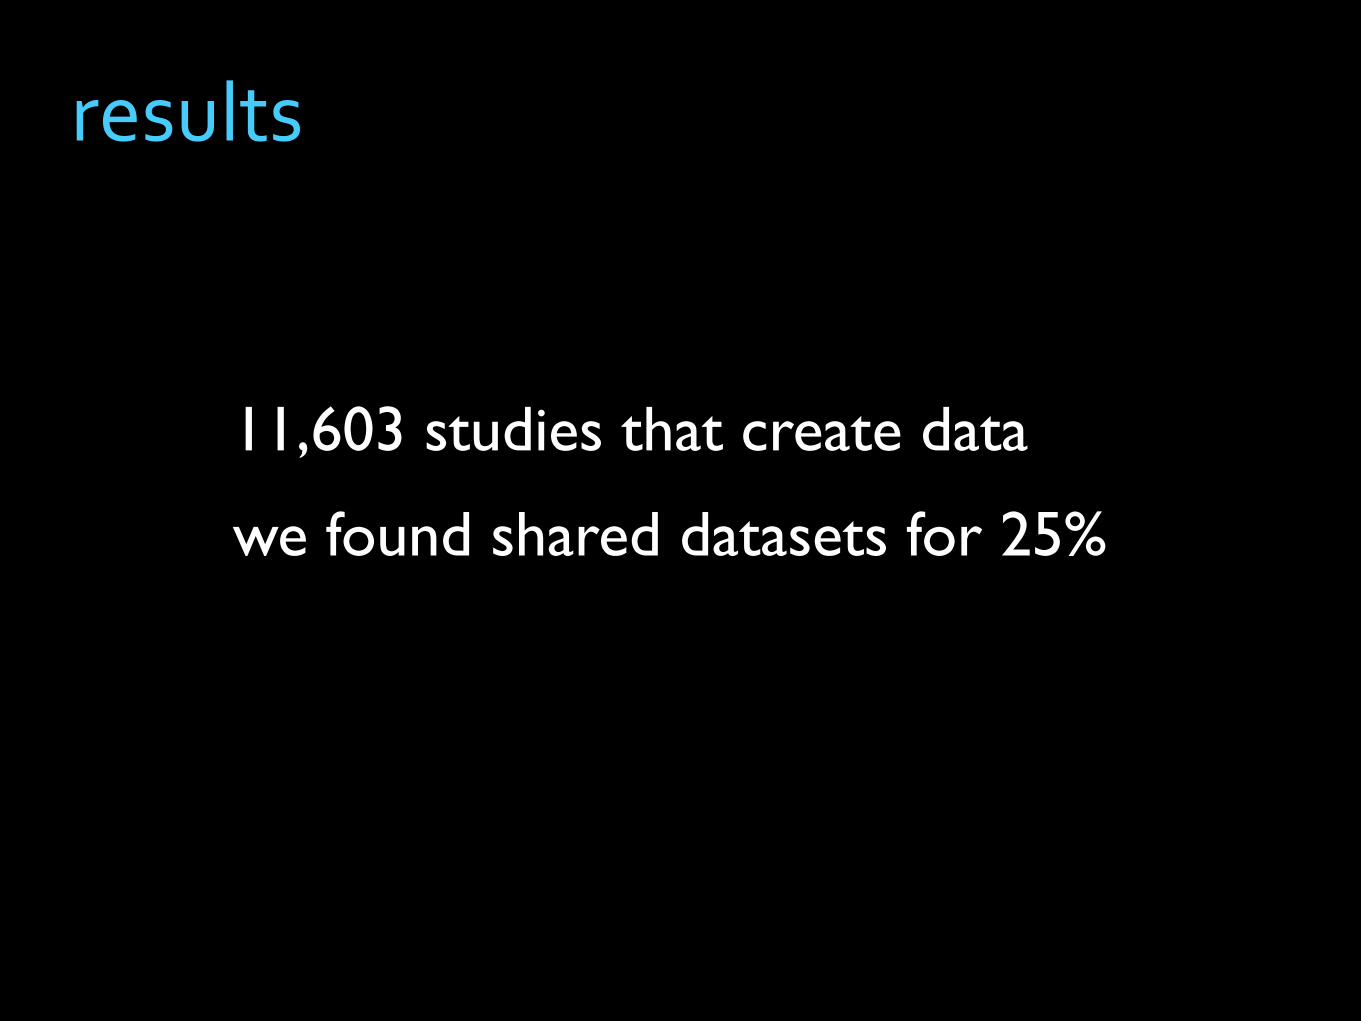
11,603 studies that create data
we found shared datasets for 25%
results

Data sharing frequency depends on when the data was published
0%
10%
20%
30%
40%
2000 01 02 03 04 05 06 07 08 2009
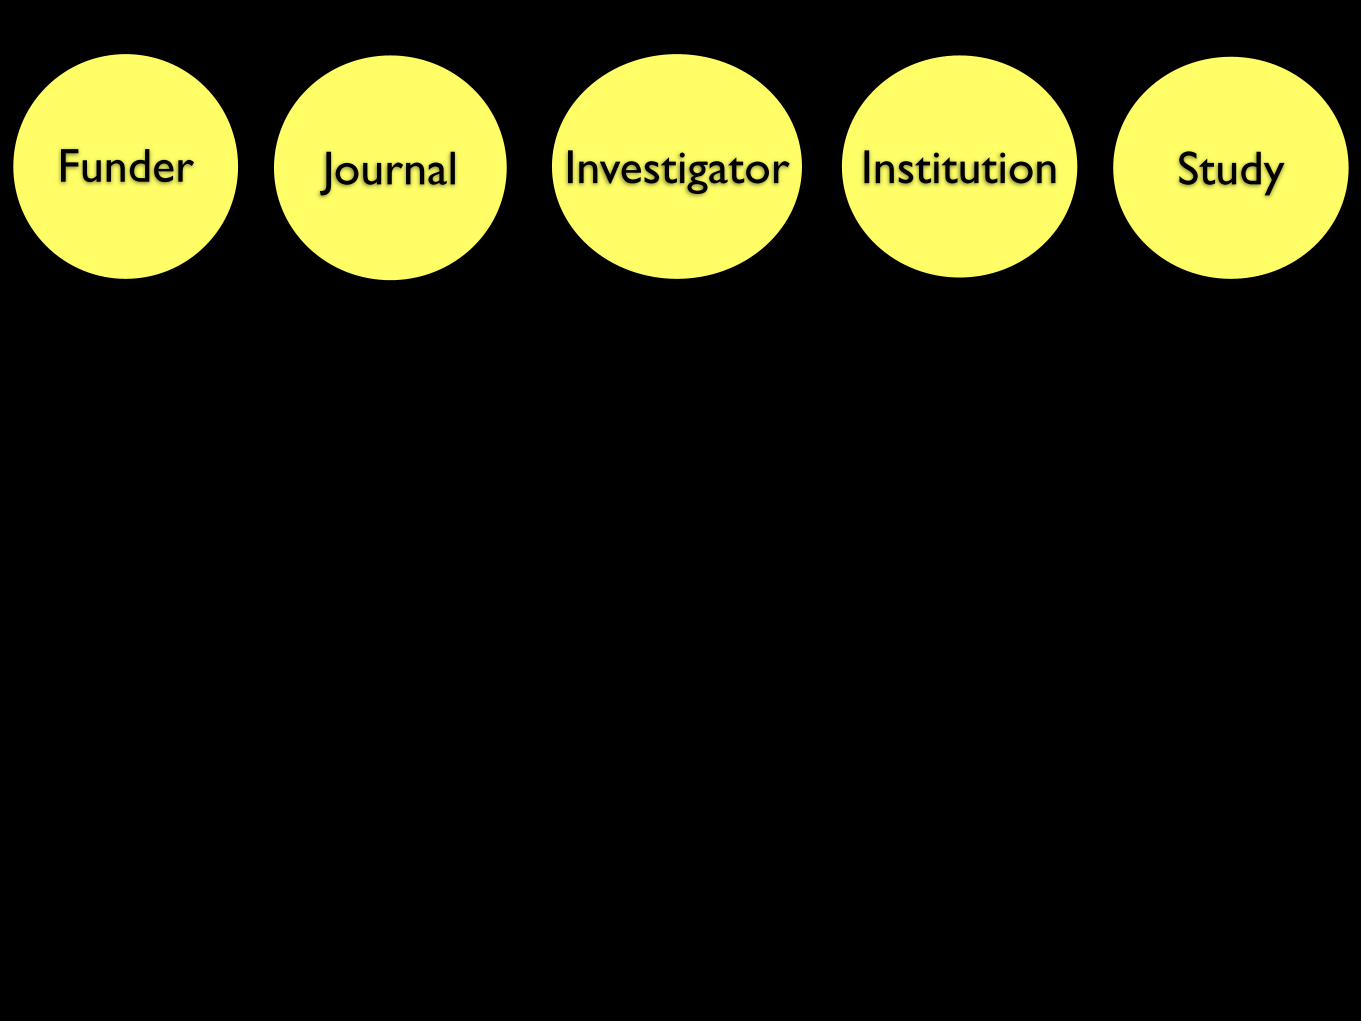
Funder Journal Investigator Institution Study
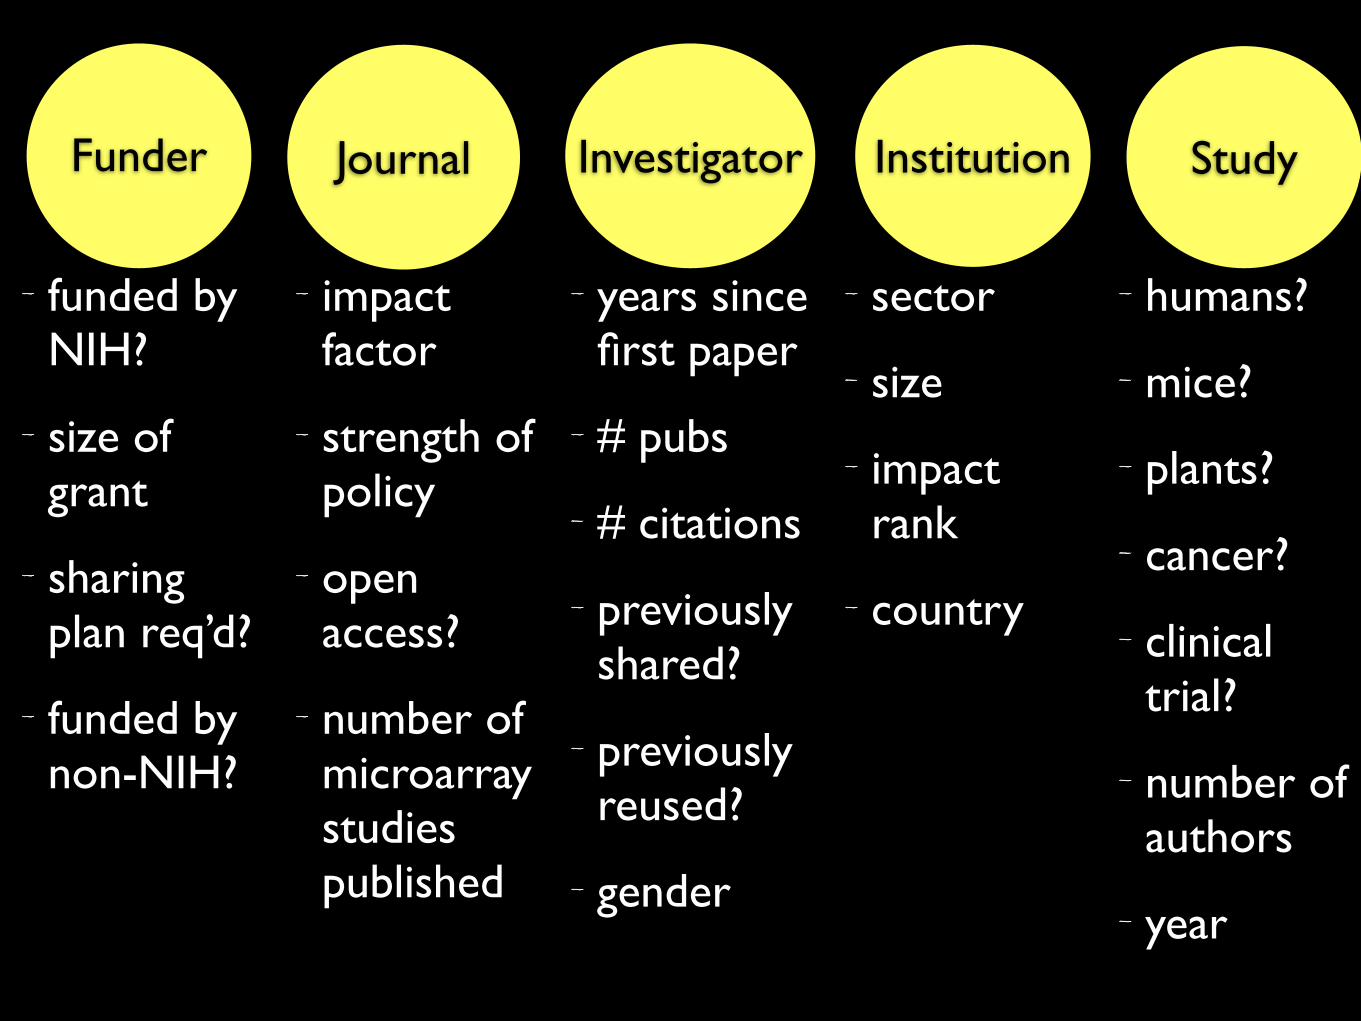
funded by NIH?
size of grant
sharing plan req’d?
funded by non-NIH?
impact factor
strength of policy
open access?
number of microarray studies published
years since first paper
# pubs
# citations
previously shared?
previously reused?
gender
sector
size
impact rank
country
humans?
mice?
plants?
cancer?
clinical trial?
number of authors
year
Funder Journal Investigator Institution Study
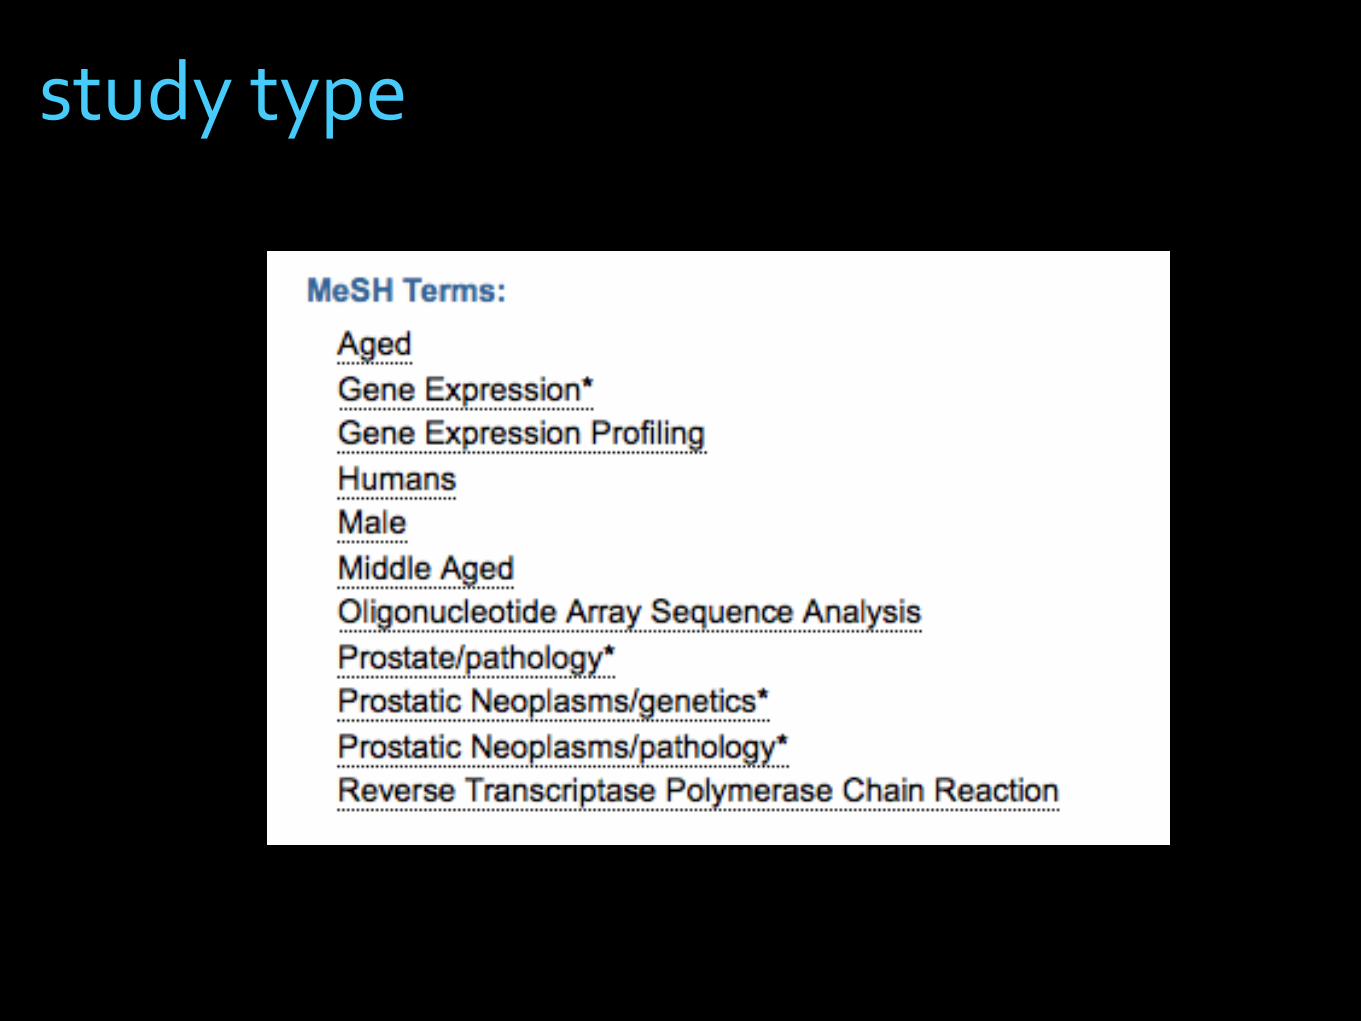
study type
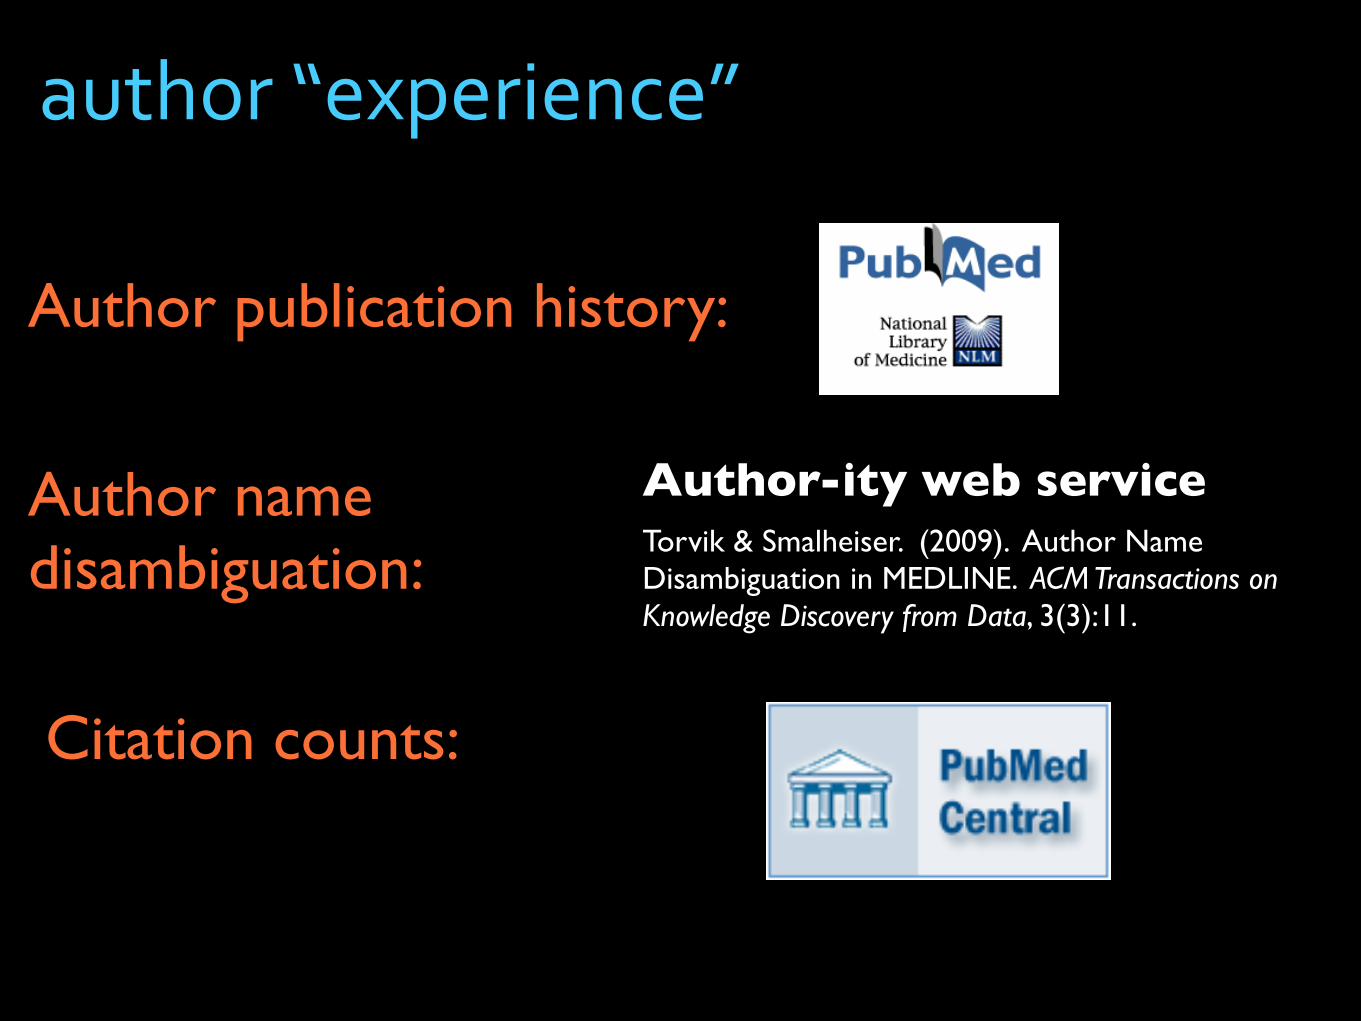
Author publication history:
Citation counts:
Author-ity web serviceTorvik & Smalheiser. (2009). Author Name Disambiguation in MEDLINE. ACM Transactions on Knowledge Discovery from Data, 3(3):11.
Author name disambiguation:
author “experience”
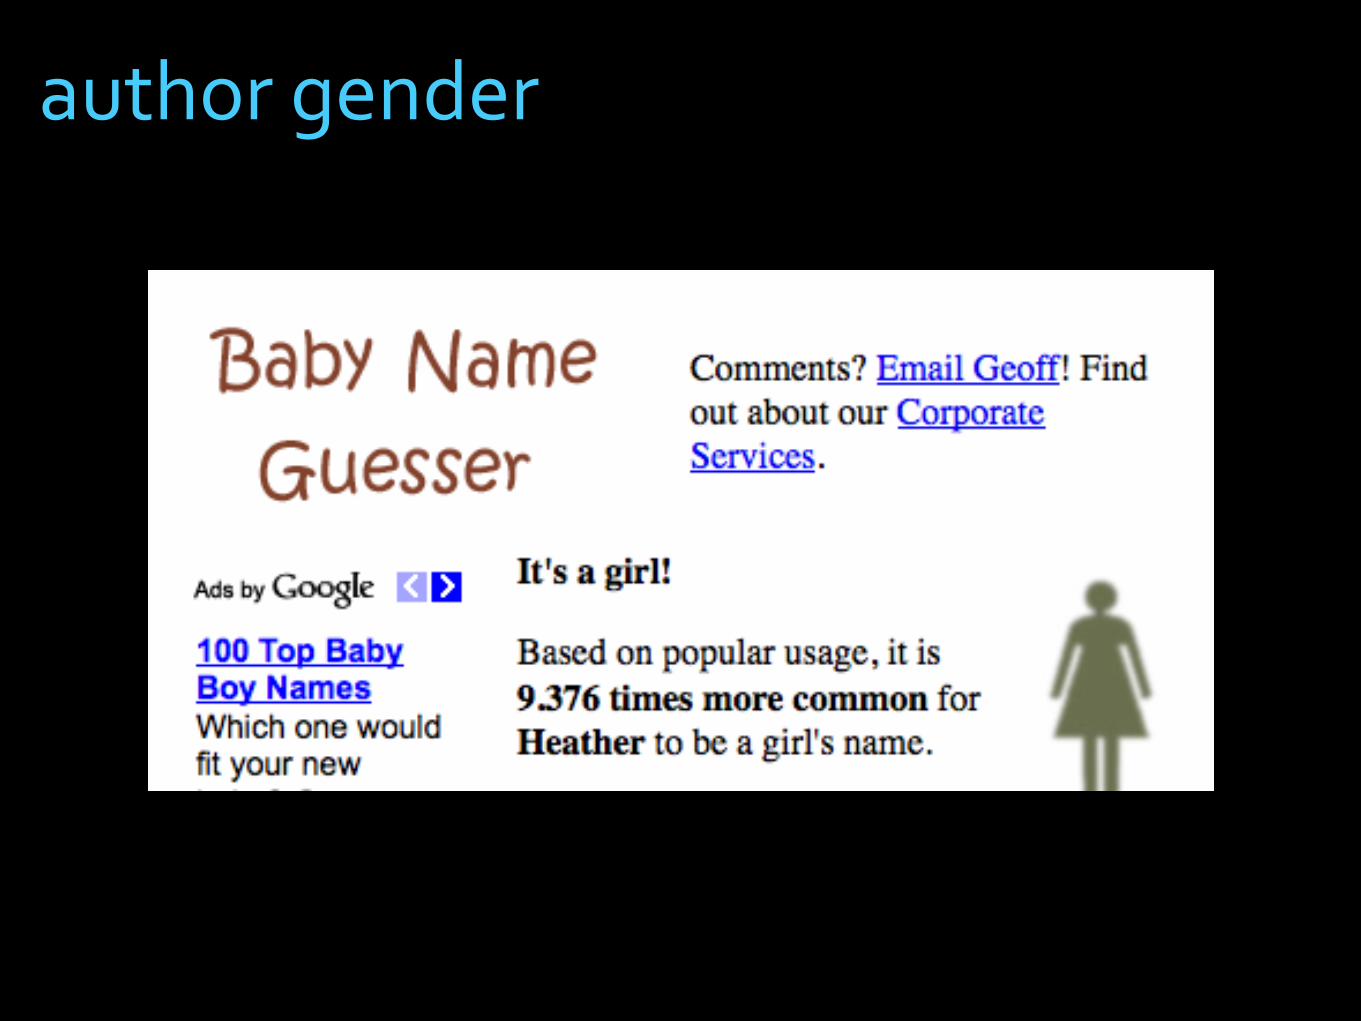
author gender
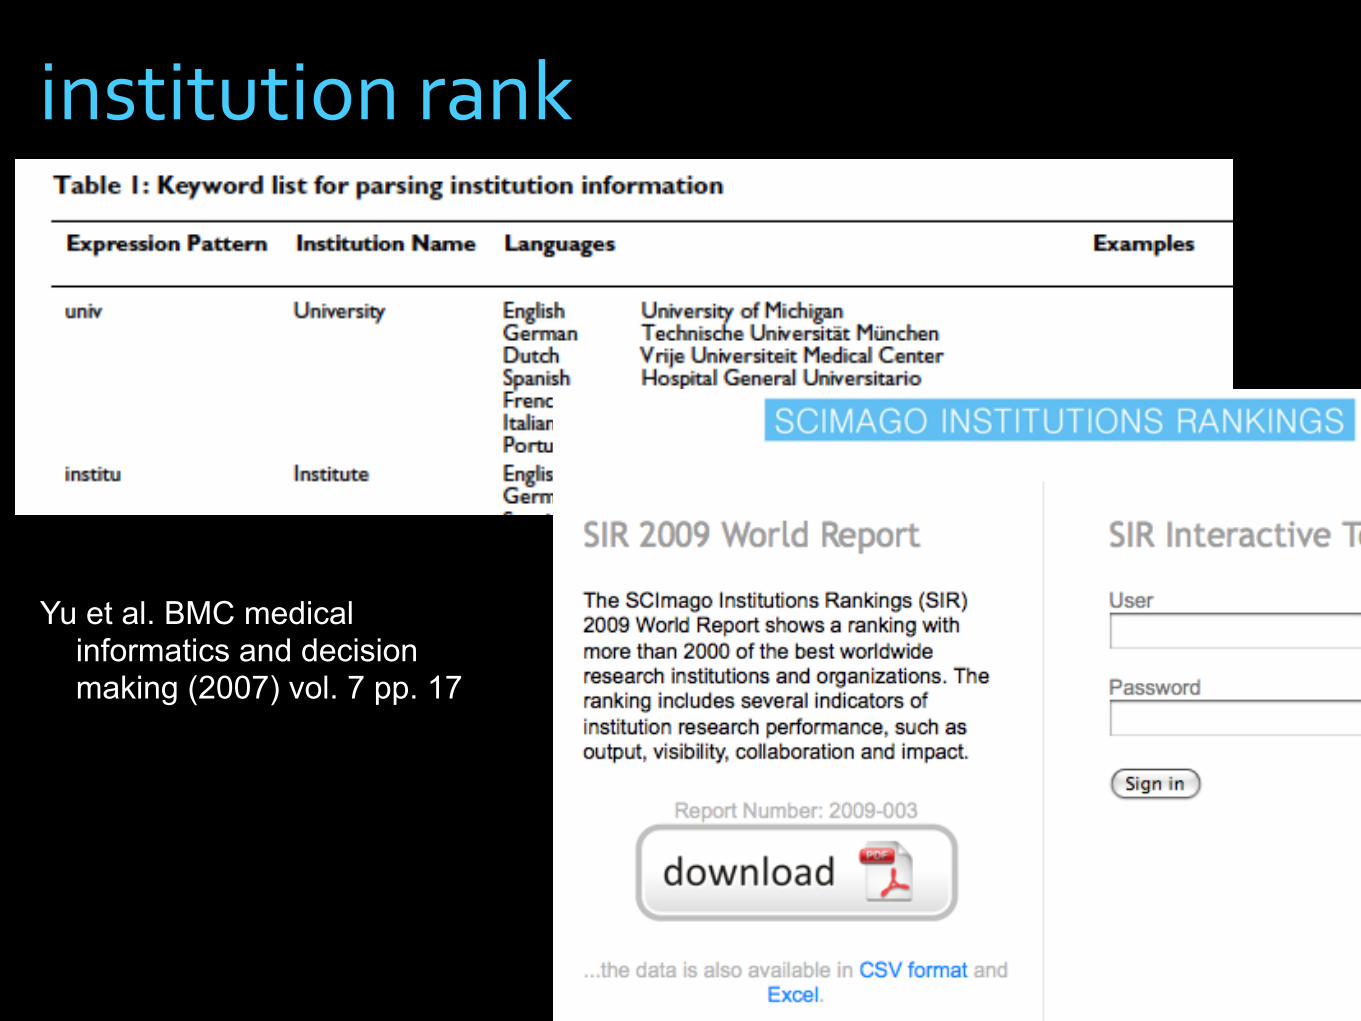
institution rank
Yu et al. BMC medical informatics and decision making (2007) vol. 7 pp. 17
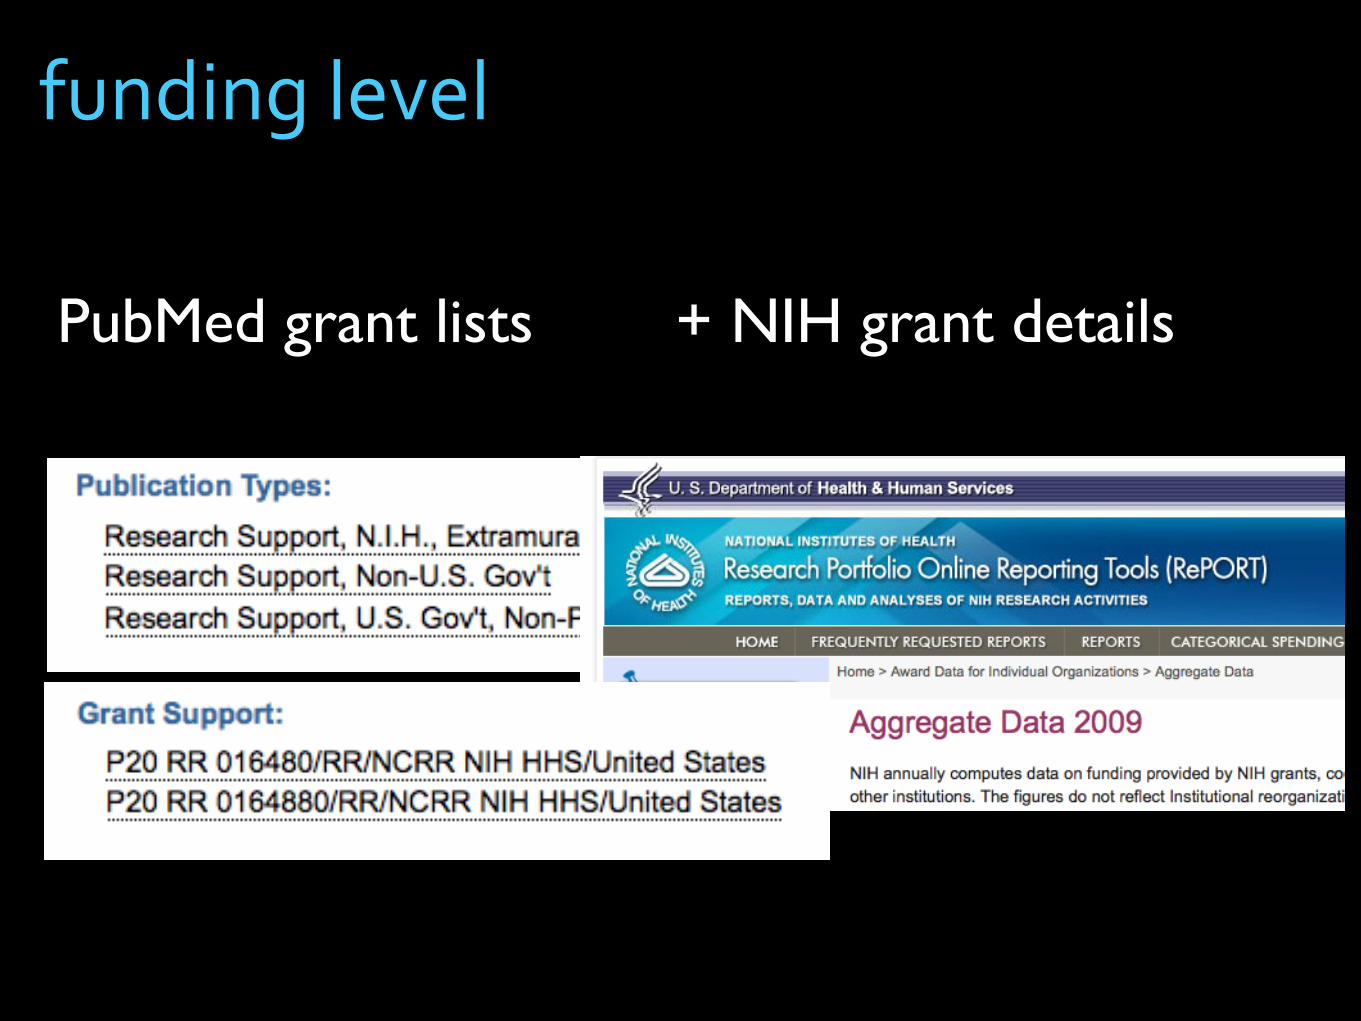
funding level
PubMed grant lists + NIH grant details
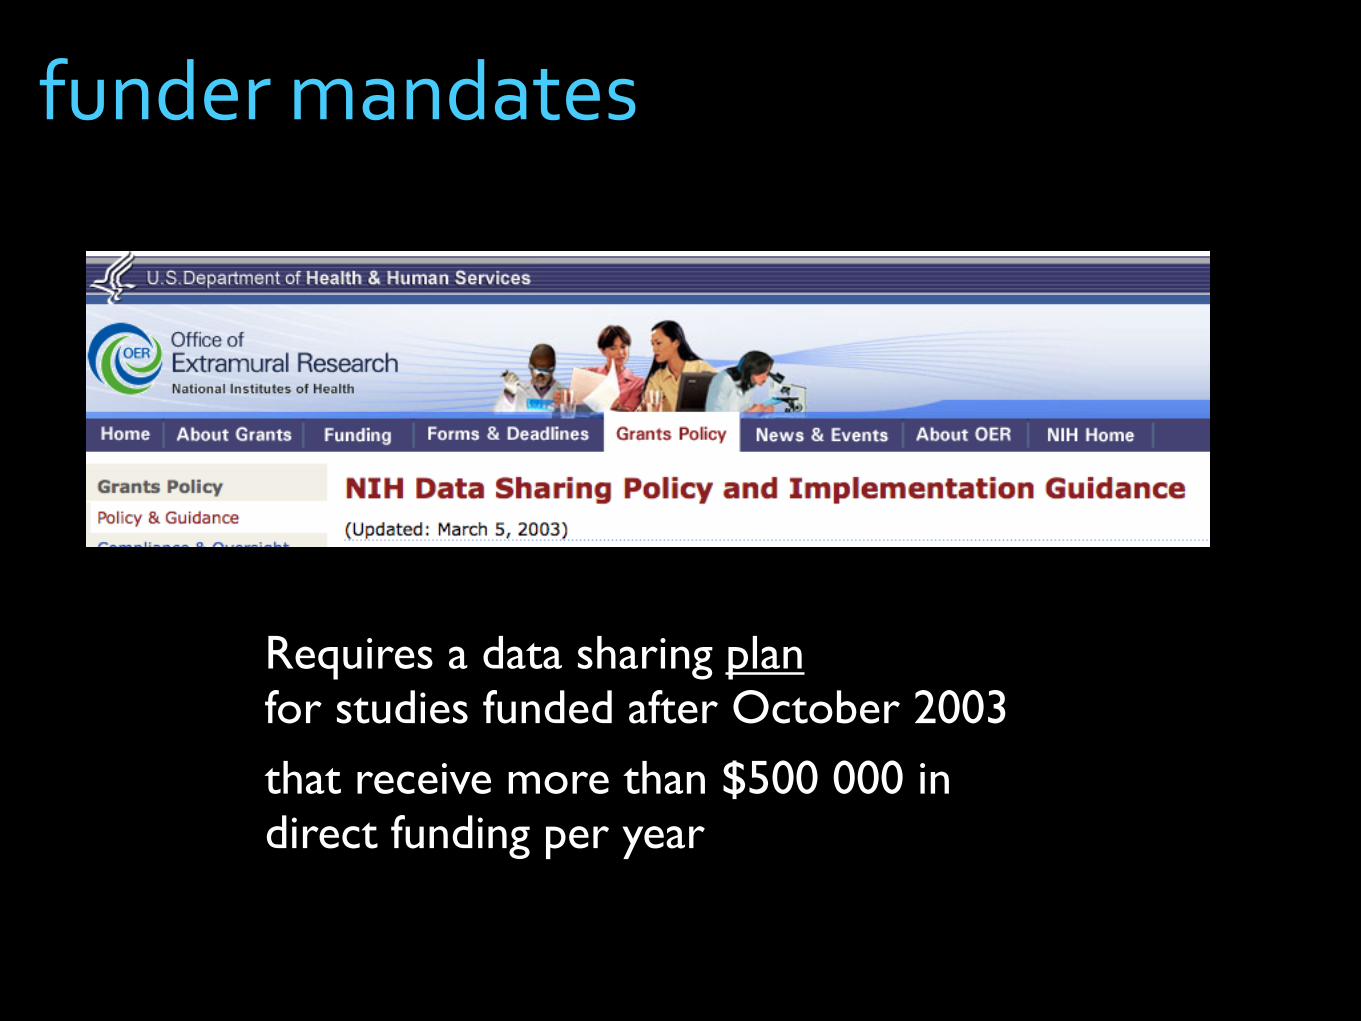
funder mandates
Requires a data sharing planfor studies funded after October 2003
that receive more than $500 000 in direct funding per year
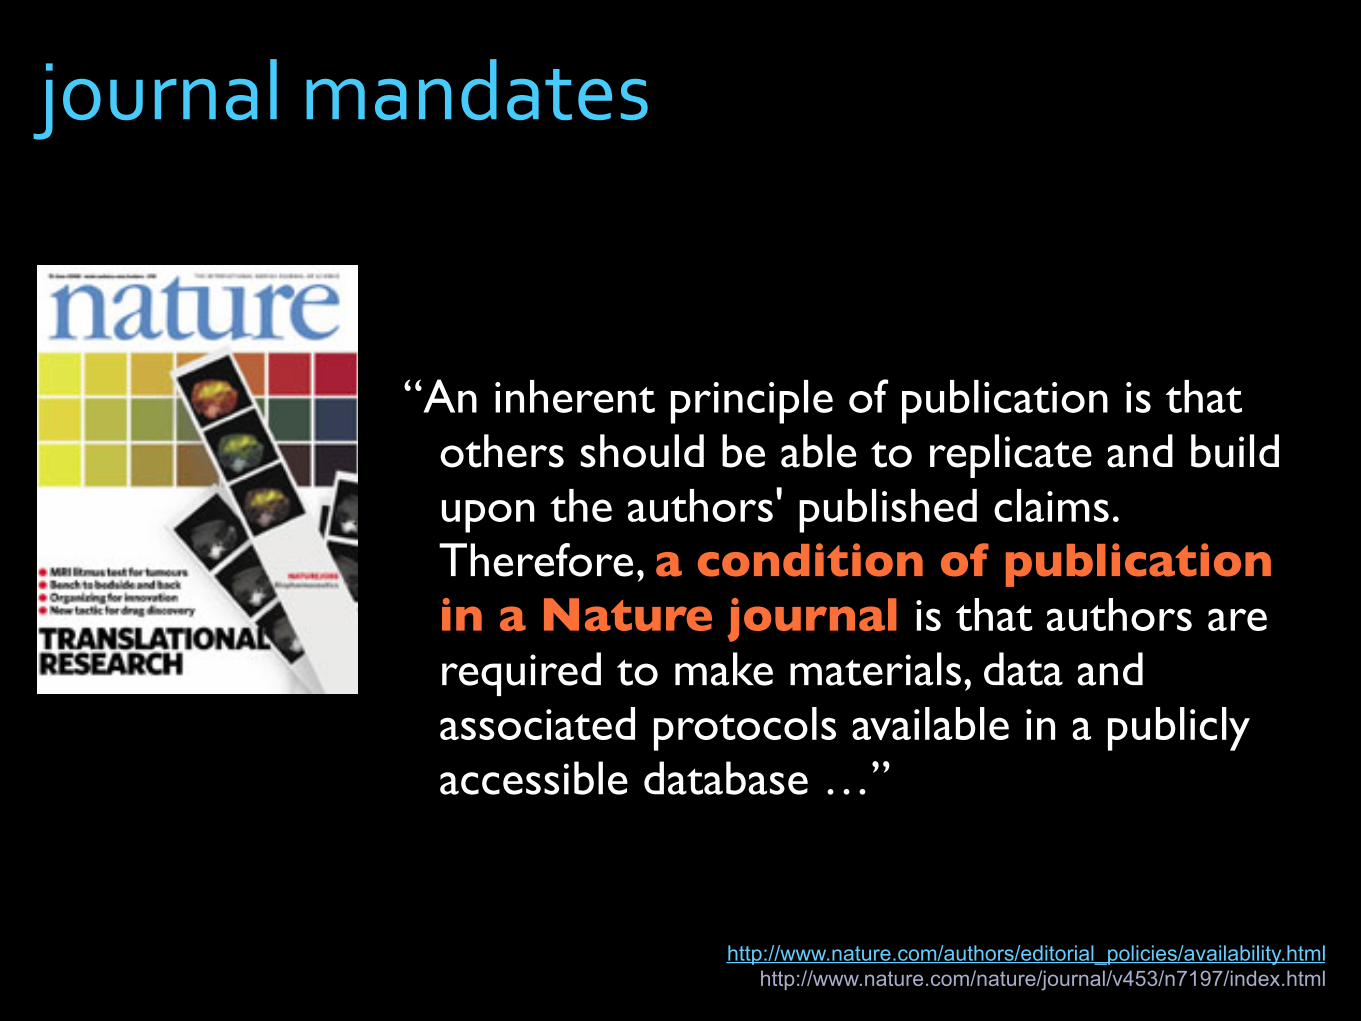
“An inherent principle of publication is that others should be able to replicate and build upon the authors' published claims. Therefore, a condition of publication in a Nature journal is that authors are required to make materials, data and associated protocols available in a publicly accessible database …”
http://www.nature.com/authors/editorial_policies/availability.html
http://www.nature.com/nature/journal/v453/n7197/index.html
journal mandates
and so on...
124 variables
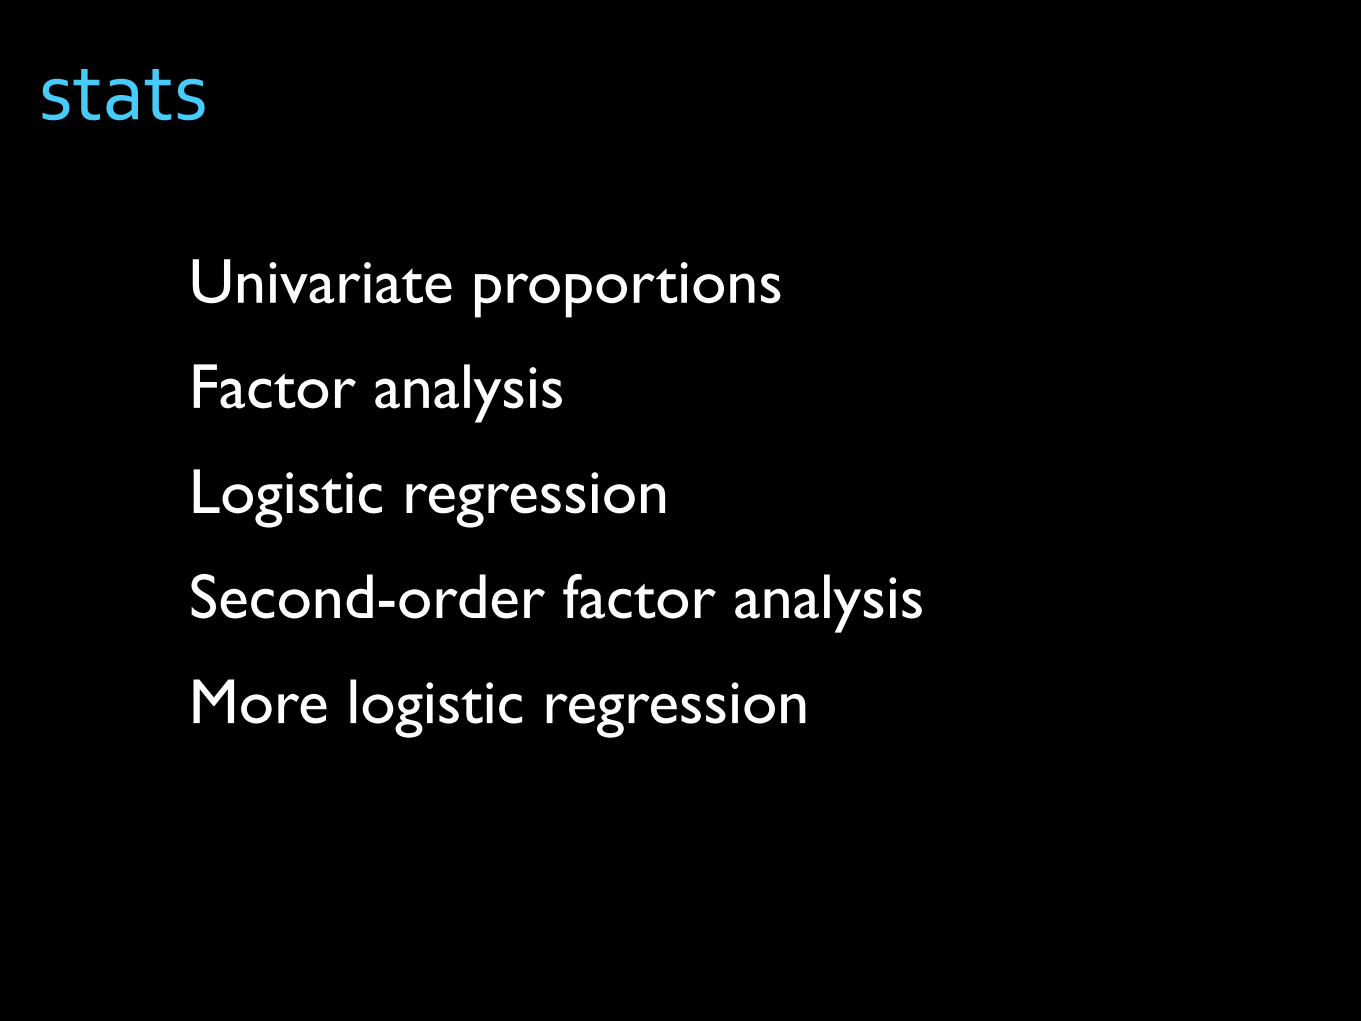
Univariate proportions
Factor analysis
Logistic regression
Second-order factor analysis
More logistic regression
stats
Ph
ysio
l G
en
om
ics
PL
oS
Ge
ne
t
Ge
no
me
Bio
l
Microbiology
PL
oS
On
e
BM
C G
en
om
ics
Pla
nt
Ce
ll
Ge
no
me
Re
s
Eu
ka
ryo
t C
ell
Ap
pl E
nviro
n M
icro
bio
lB
MC
Me
d G
en
om
ics
Hu
m M
ol G
en
et
Pro
c N
atl A
ca
d S
ci U
S A
Infe
ct
Imm
un
Am
J R
esp
ir C
ell
Mo
l B
iol
De
v B
iol
J B
acte
rio
l
Mo
l E
nd
ocrin
ol
BM
C C
an
ce
r
Pla
nt
Ph
ysio
lB
iol R
ep
rod
Blood
J I
mm
un
ol
FA
SE
B J
To
xic
ol S
ci
J E
xp
Bo
tN
ucle
ic A
cid
s R
es
Diabetes
Mo
l C
ell B
iol
Mo
l C
an
ce
r T
he
r
BM
C B
ioin
form
atics
Ste
m C
ells
FE
BS
Le
tt
J N
eu
rosci
Am
J P
ath
ol
J B
iol C
he
m
J V
iro
l
OTHER
Ca
nce
r R
es
J C
lin
En
do
crin
ol M
eta
b
Pla
nt
Mo
l B
iol
Clin
Ca
nce
r R
es
Genomics
Inve
st
Op
hth
alm
ol V
is S
ci
Mo
l H
um
Re
pro
dCarcinogenesis
Gene
Endocrinology
Oncogene
Ca
nce
r L
ett
Bio
ch
em
Bio
ph
ys R
es C
om
mu
n
Pro
port
ion o
f data
sets
share
d
0.0
0.2
0.4
0.6
0.8
1.0 Journals

Sta
nfo
rd U
niv
ers
ity
Un
ive
rsity o
f P
en
nsylv
an
ia
Un
ive
rsity o
f Illin
ois
Un
ive
rsity o
f C
alif
orn
ia,
Lo
s A
ng
ele
s
Un
ive
rsity o
f W
isco
nsin
, M
ad
iso
n
Un
ive
rsity o
f W
ash
ing
ton
Un
ive
rsity o
f C
alif
orn
ia,
Da
vis
Th
e U
niv
ers
ity o
f B
ritish
Co
lum
bia
Un
ive
rsity o
f C
alif
orn
ia,
Sa
n F
ran
cis
co
Un
ive
rsity o
f F
lorid
a
Un
ive
rsity o
f C
alif
orn
ia,
Sa
n D
ieg
o
Un
ive
rsity o
f M
inn
eso
ta,
Tw
in C
itie
s
Ba
ylo
r C
olle
ge
of
Me
dic
ine
OTHER
Ma
x P
lan
ck G
ese
llsch
aft
Ha
rva
rd U
niv
ers
ity
Du
ke
Un
ive
rsity M
ed
ica
l C
en
ter
Ya
le U
niv
ers
ity
Jo
hn
s H
op
kin
s U
niv
ers
ity
Un
ive
rsity o
f P
itts
bu
rgh
Wa
sh
ing
ton
Un
ive
rsity in
Sa
int
Lo
uis
Un
ive
rsity o
f T
oro
nto
Un
ive
rsity o
f C
alif
orn
ia,
Be
rke
ley
Un
ive
rsity o
f M
ich
iga
n,
An
n A
rbo
r
Mic
hig
an
Sta
te U
niv
ers
ity
Na
tio
na
l C
an
ce
r In
stitu
te
To
kyo
Da
iga
ku
Pro
po
rtio
n o
f d
ata
se
ts s
ha
red
0.0
0.2
0.4
0.6
0.8
1.0
Institutions
Sta
nfo
rd U
niv
ers
ity
Un
ive
rsity o
f P
en
nsylv
an
ia
Un
ive
rsity o
f Illin
ois
Un
ive
rsity o
f C
alif
orn
ia,
Lo
s A
ng
ele
s
Un
ive
rsity o
f W
isco
nsin
, M
ad
iso
n
Un
ive
rsity o
f W
ash
ing
ton
Un
ive
rsity o
f C
alif
orn
ia,
Da
vis
Th
e U
niv
ers
ity o
f B
ritish
Co
lum
bia
Un
ive
rsity o
f C
alif
orn
ia,
Sa
n F
ran
cis
co
Un
ive
rsity o
f F
lorid
a
Un
ive
rsity o
f C
alif
orn
ia,
Sa
n D
ieg
o
Un
ive
rsity o
f M
inn
eso
ta,
Tw
in C
itie
s
Ba
ylo
r C
olle
ge
of
Me
dic
ine
OTHER
Ma
x P
lan
ck G
ese
llsch
aft
Ha
rva
rd U
niv
ers
ity
Du
ke
Un
ive
rsity M
ed
ica
l C
en
ter
Ya
le U
niv
ers
ity
Jo
hn
s H
op
kin
s U
niv
ers
ity
Un
ive
rsity o
f P
itts
bu
rgh
Wa
sh
ing
ton
Un
ive
rsity in
Sa
int
Lo
uis
Un
ive
rsity o
f T
oro
nto
Un
ive
rsity o
f C
alif
orn
ia,
Be
rke
ley
Un
ive
rsity o
f M
ich
iga
n,
An
n A
rbo
r
Mic
hig
an
Sta
te U
niv
ers
ity
Na
tio
na
l C
an
ce
r In
stitu
te
To
kyo
Da
iga
ku
Pro
po
rtio
n o
f d
ata
se
ts s
ha
red
0.0
0.2
0.4
0.6
0.8
1.0
Institutions
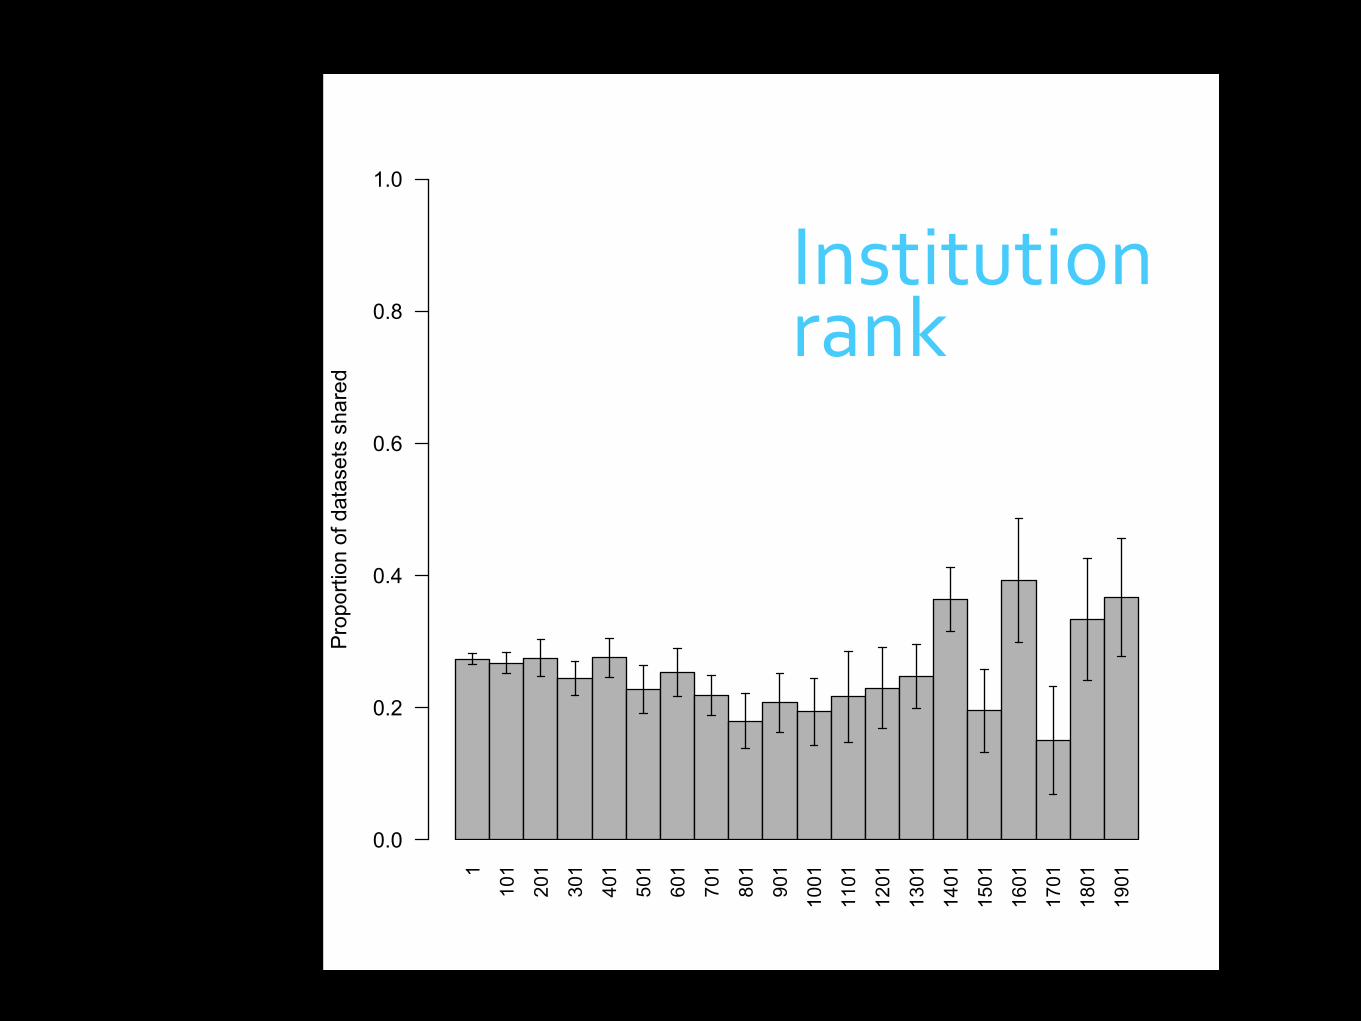
1
101
201
301
401
501
601
701
801
901
1001
1101
1201
1301
1401
1501
1601
1701
1801
1901
Pro
po
rtio
n o
f d
ata
se
ts s
ha
red
0.0
0.2
0.4
0.6
0.8
1.0
Institutionrank
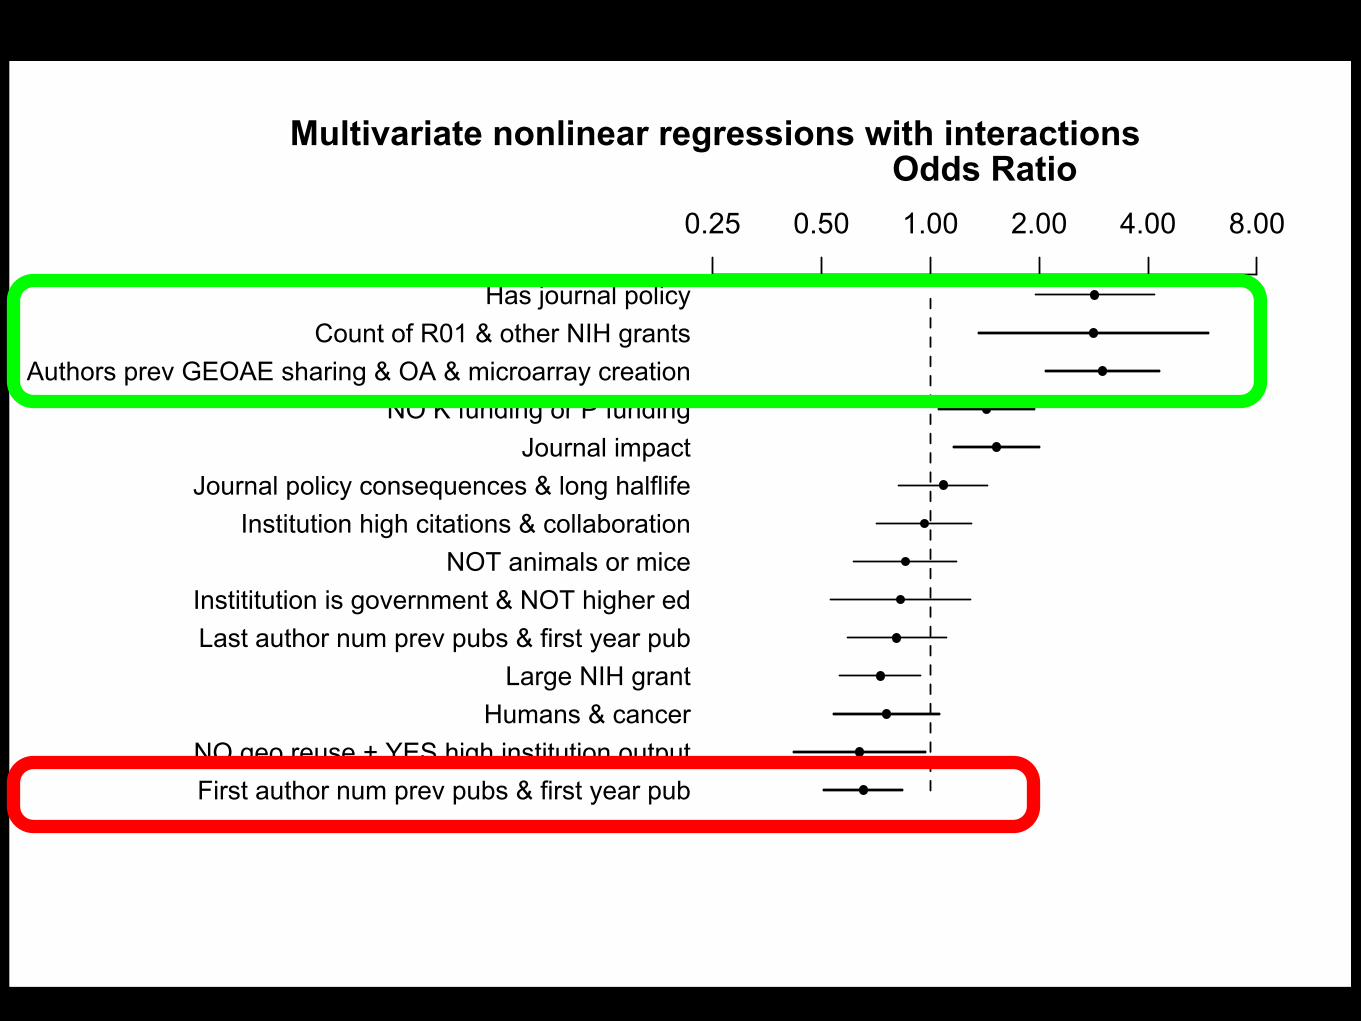
Odds Ratio
0.25 0.50 1.00 2.00 4.00 8.00
Has journal policy0.95Count of R01 & other NIH grants
Authors prev GEOAE sharing & OA & microarray creation
NO K funding or P funding
Institution high citations & collaboration
Journal impact
Journal policy consequences & long halflife
NOT animals or mice
Instititution is government & NOT higher ed
Last author num prev pubs & first year pub
Large NIH grant
Humans & cancer
NO geo reuse + YES high institution output
First author num prev pubs & first year pub
Multivariate nonlinear regressions with interactions
Odds Ratio
0.25 0.50 1.00 2.00 4.00 8.00
Has journal policy0.95Count of R01 & other NIH grants
Authors prev GEOAE sharing & OA & microarray creation
NO K funding or P funding
Journal impact
Journal policy consequences & long halflife
Institution high citations & collaboration
NOT animals or mice
Instititution is government & NOT higher ed
Last author num prev pubs & first year pub
Large NIH grant
Humans & cancer
NO geo reuse + YES high institution output
First author num prev pubs & first year pub
Multivariate nonlinear regressions with interactions
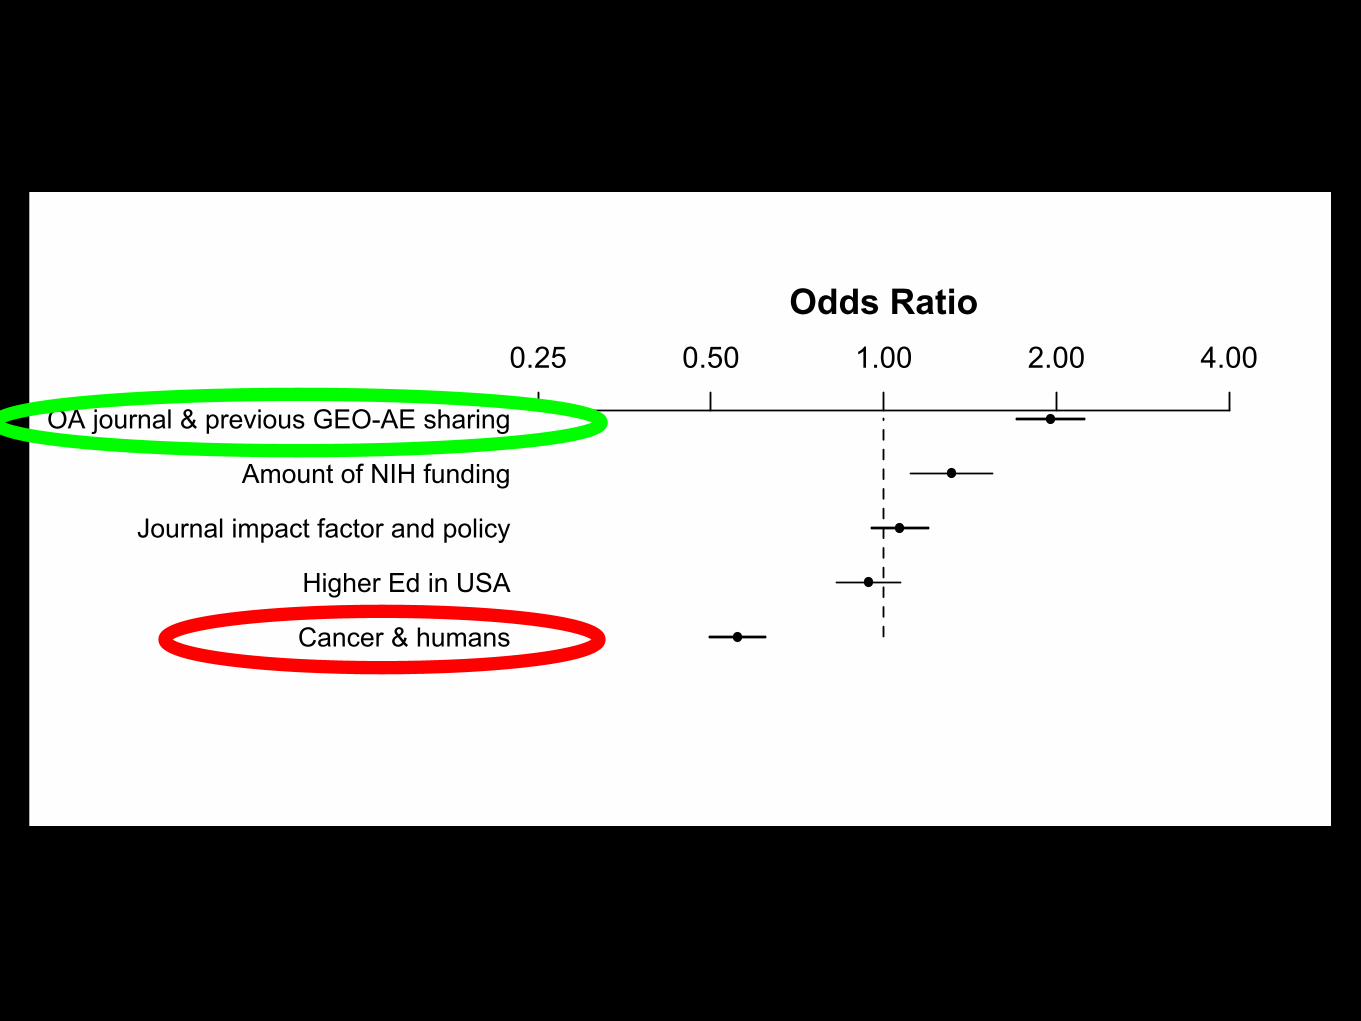
Odds Ratio
0.25 0.50 1.00 2.00 4.00
OA journal & previous GEO-AE sharing
0.95Amount of NIH funding
Journal impact factor and policy
Higher Ed in USA
Cancer & humans
����������������������� �����������������
• association not causation
• lots of assumptions
• don’t know how generalizable it is
• hypothesis-generating
http://www.flickr.com/photos/vlastula/300102949/
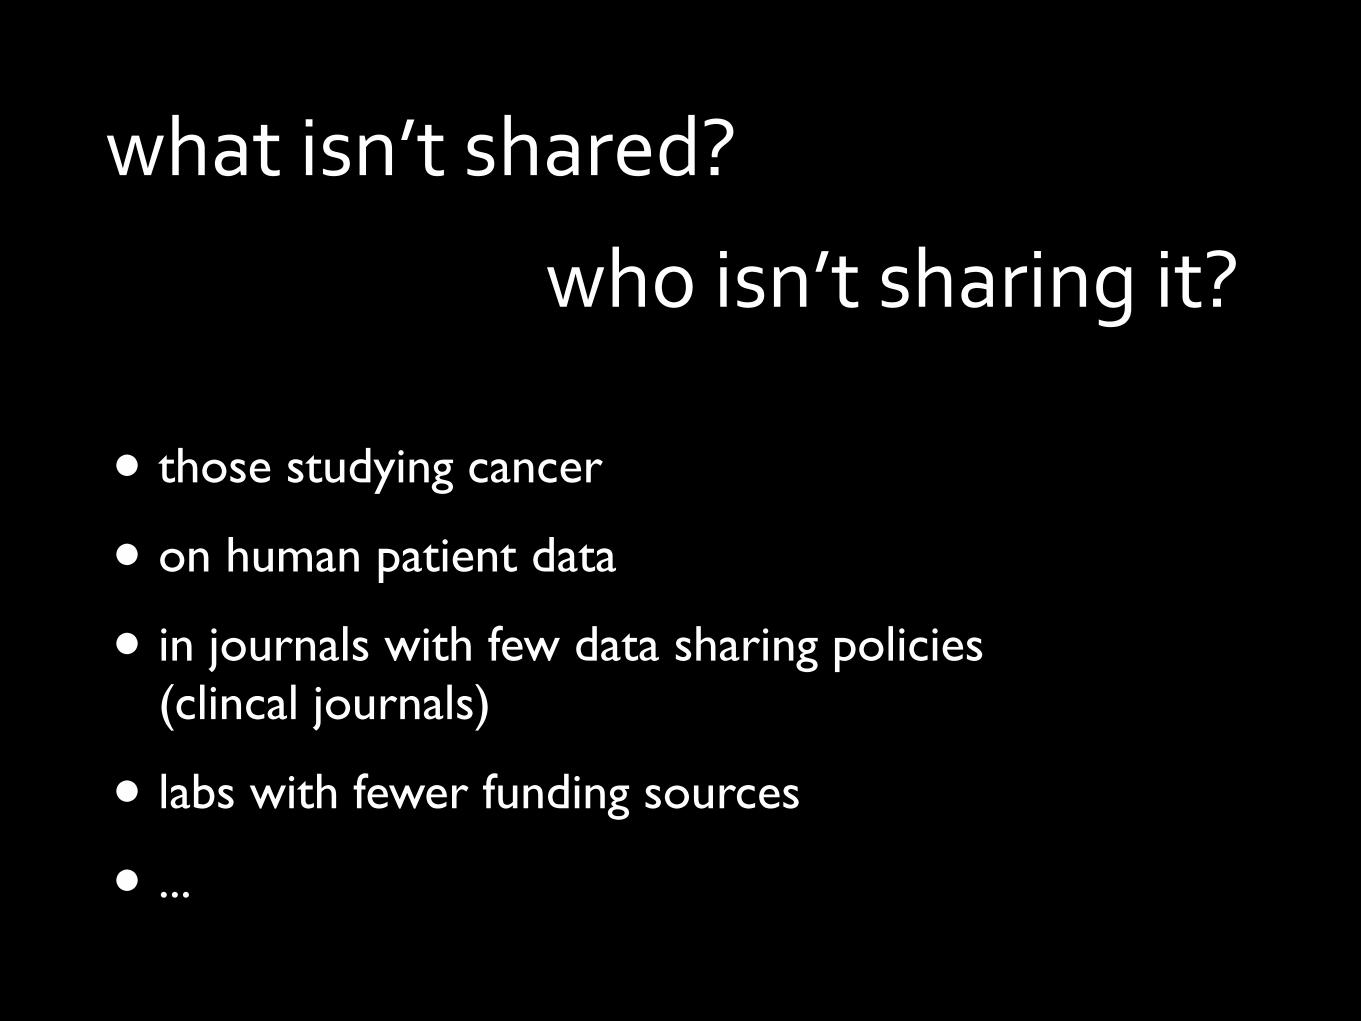
• those studying cancer
• on human patient data
• in journals with few data sharing policies (clincal journals)
• labs with fewer funding sources
• ...
what isn’t shared?
who isn’t sharing it?
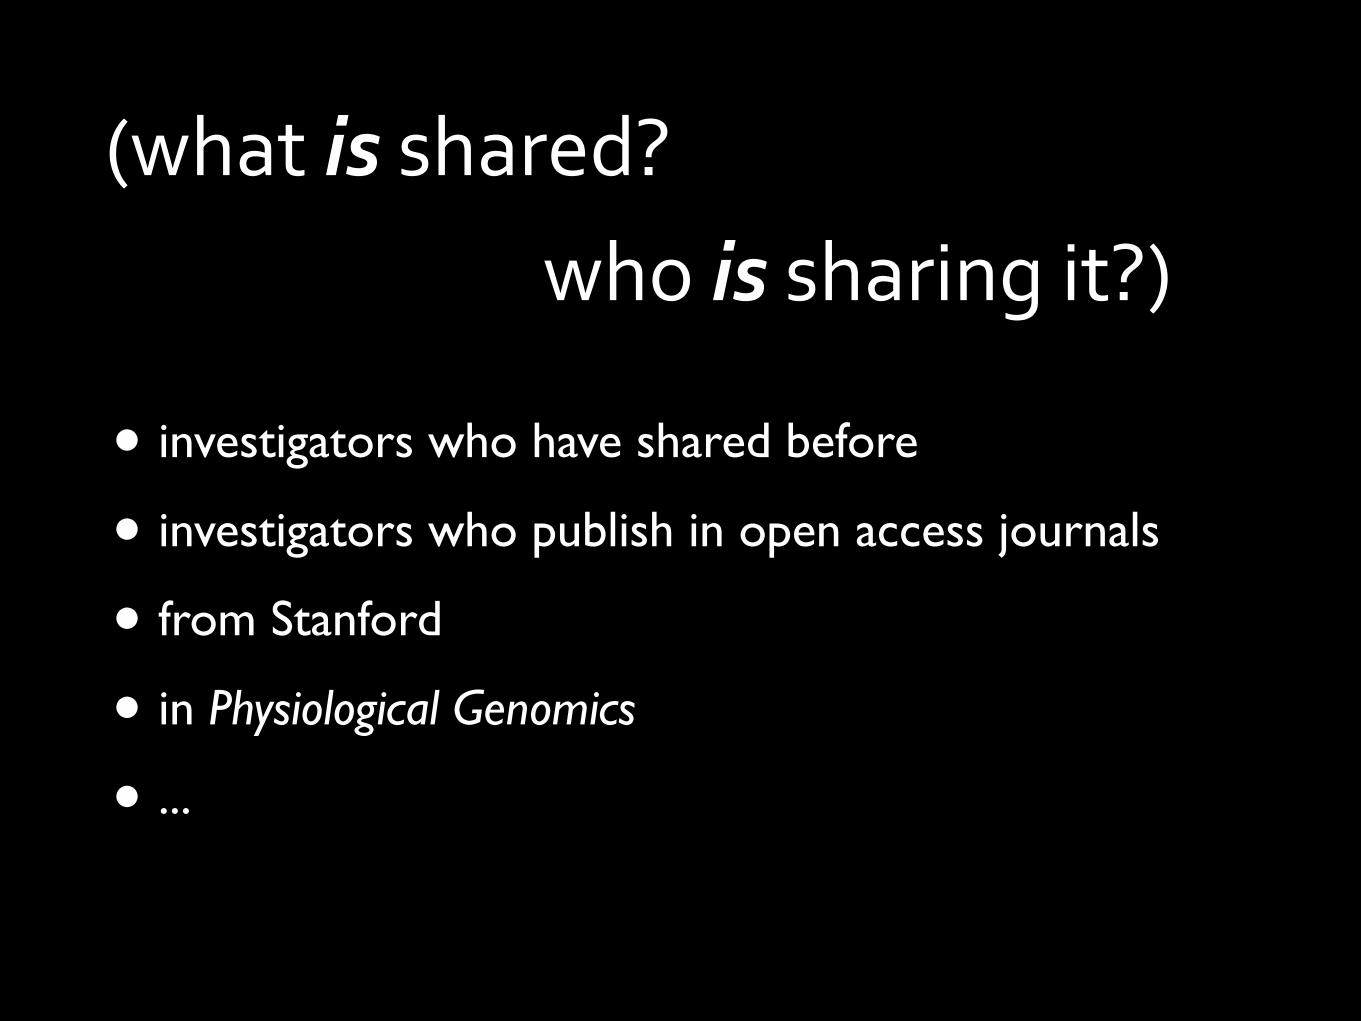
• investigators who have shared before
• investigators who publish in open access journals
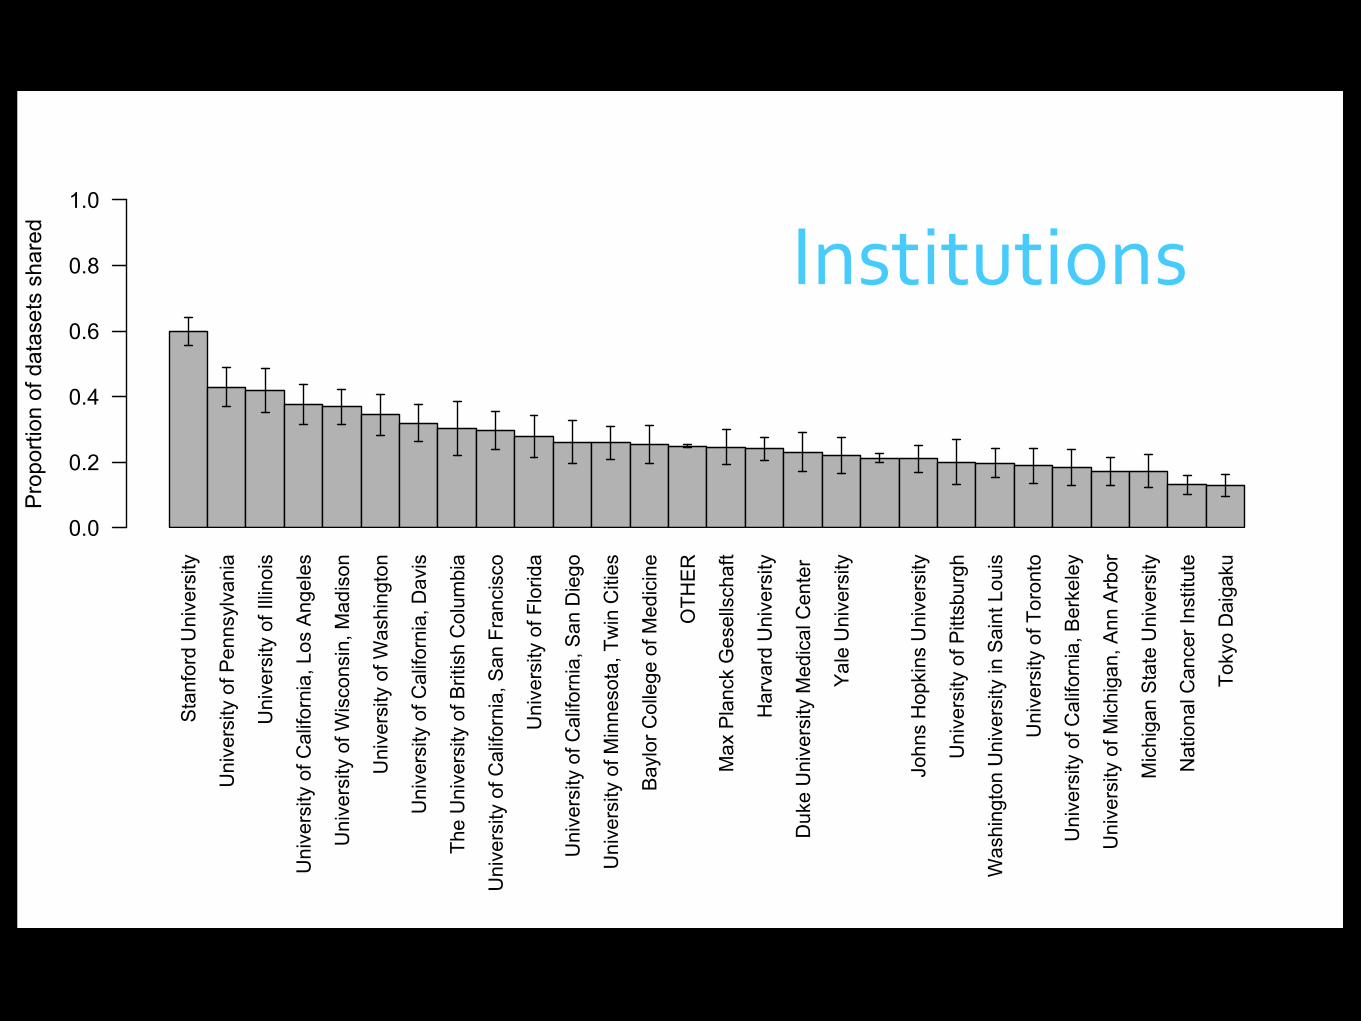
• from Stanford
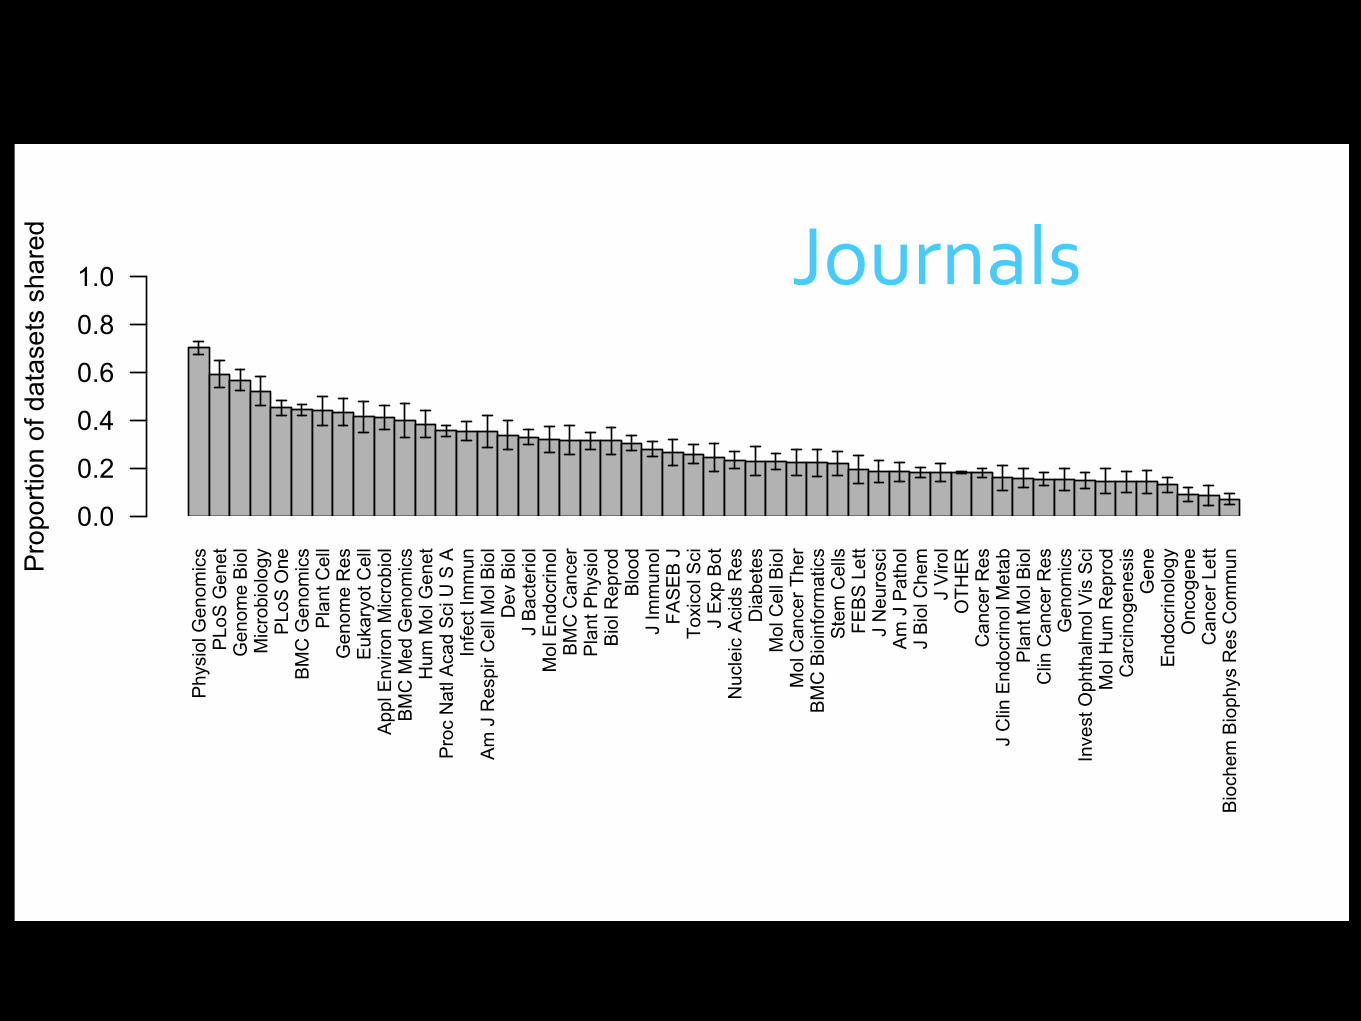
• in Physiological Genomics
• ...
(what is shared?who is sharing it?)
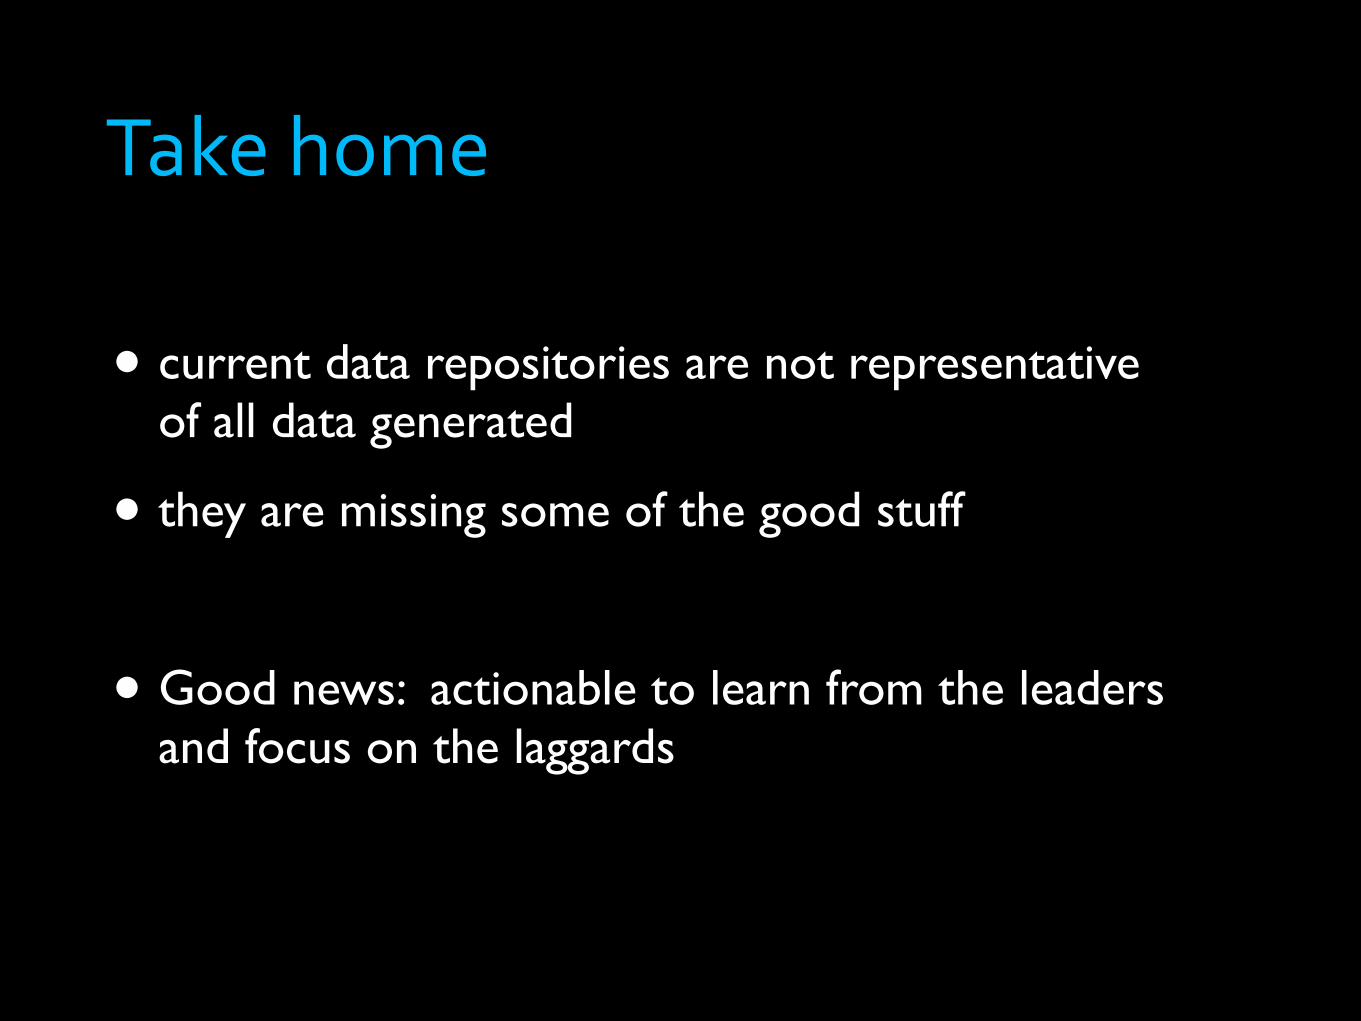
• current data repositories are not representative of all data generated
• they are missing some of the good stuff
• Good news: actionable to learn from the leaders and focus on the laggards
Take home
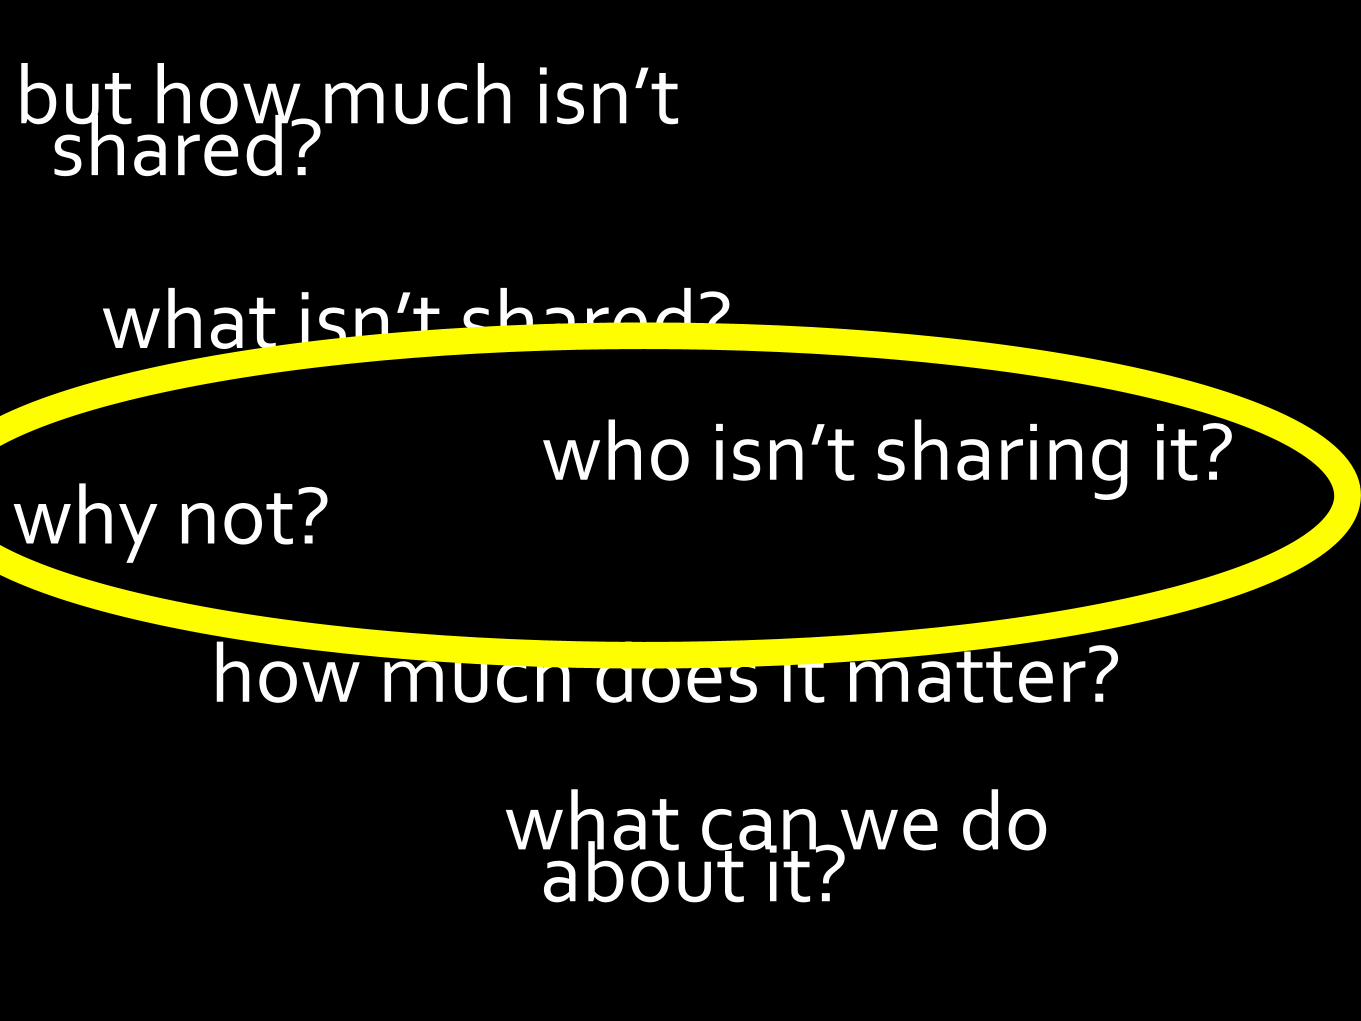
but how much isn’t shared?
what isn’t shared?
who isn’t sharing it?why not?
what can we do about it?
how much does it matter?
http://www.flickr.com/photos/jima/606588905/
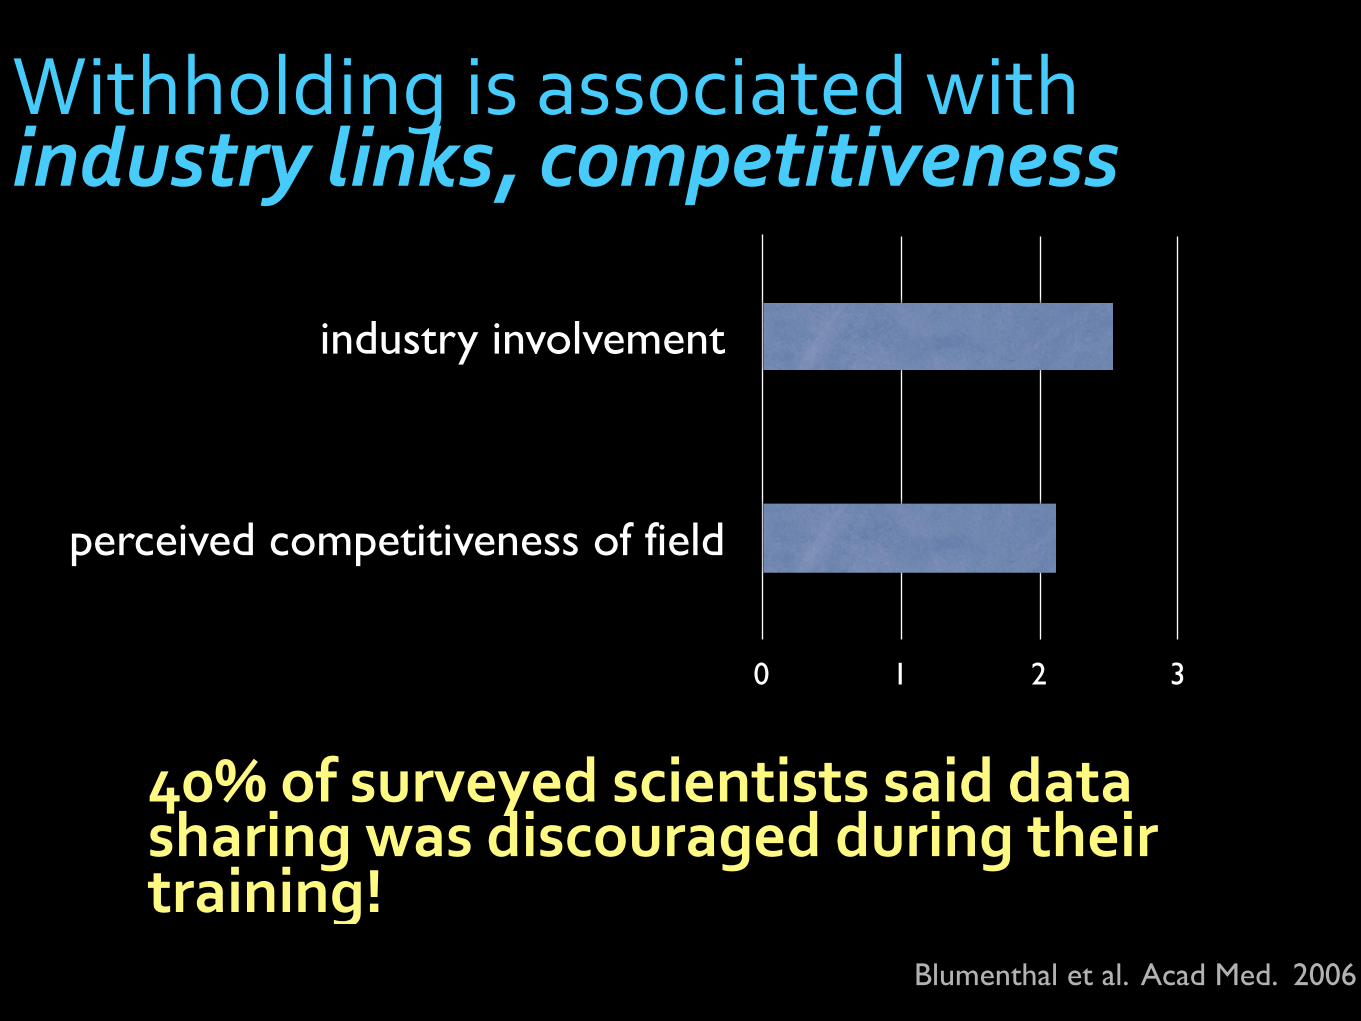
Blumenthal et al. Acad Med. 2006
industry involvement
perceived competitiveness of field
0 1 2 3
Withholding is associated with industry links, competitiveness
40% of surveyed scientists said data sharing was discouraged during their training!
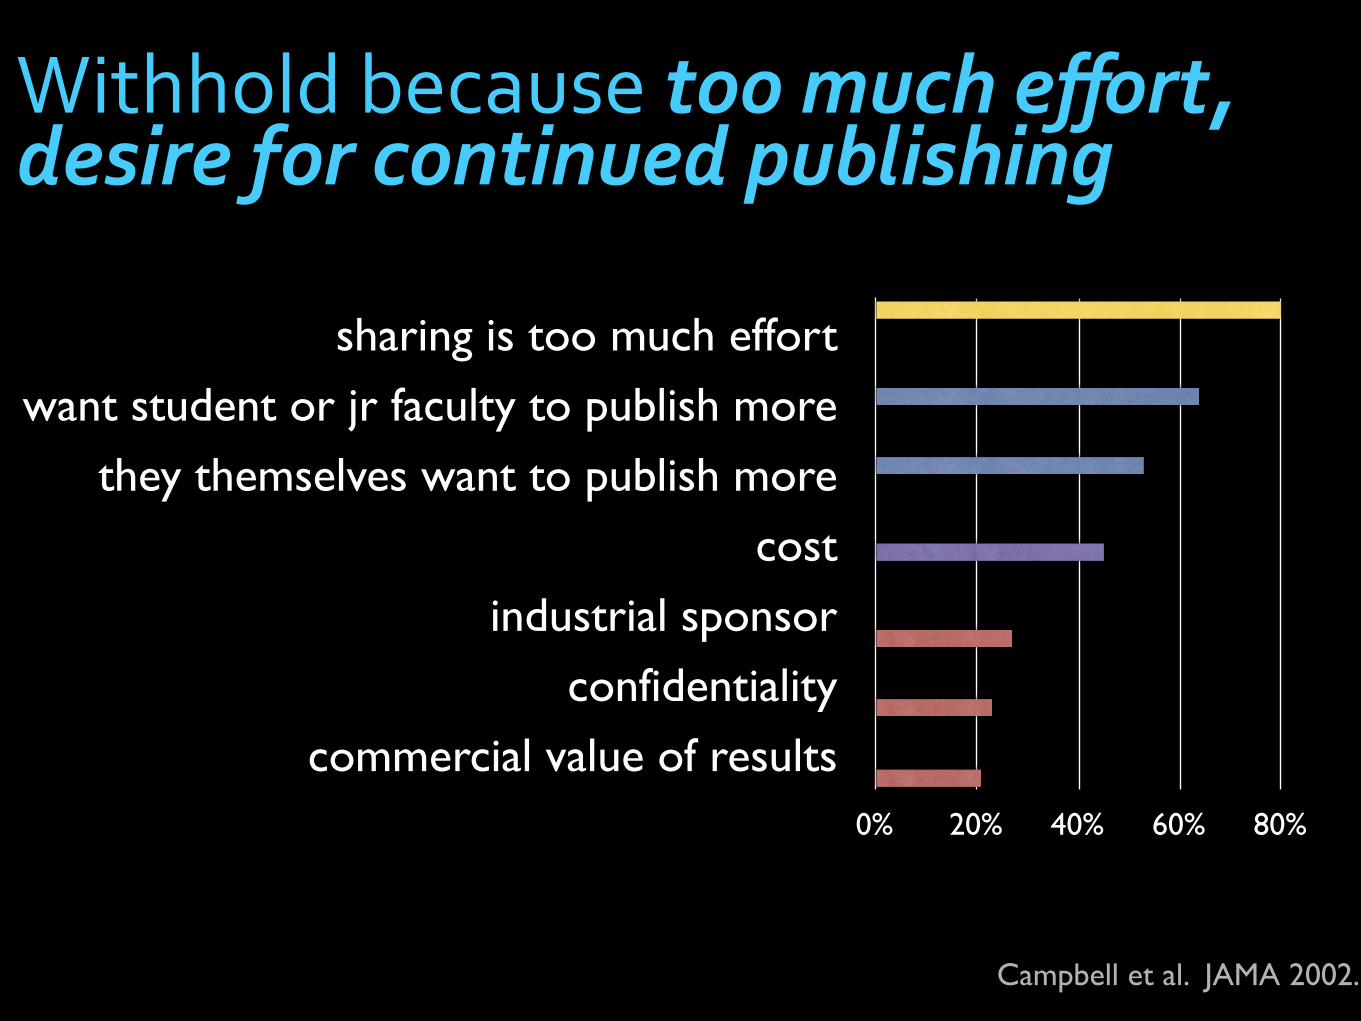
Campbell et al. JAMA 2002.
sharing is too much effort
want student or jr faculty to publish more
they themselves want to publish more
cost
industrial sponsor
confidentiality
commercial value of results0% 20% 40% 60% 80%
Withhold because too much effort, desire for continued publishing
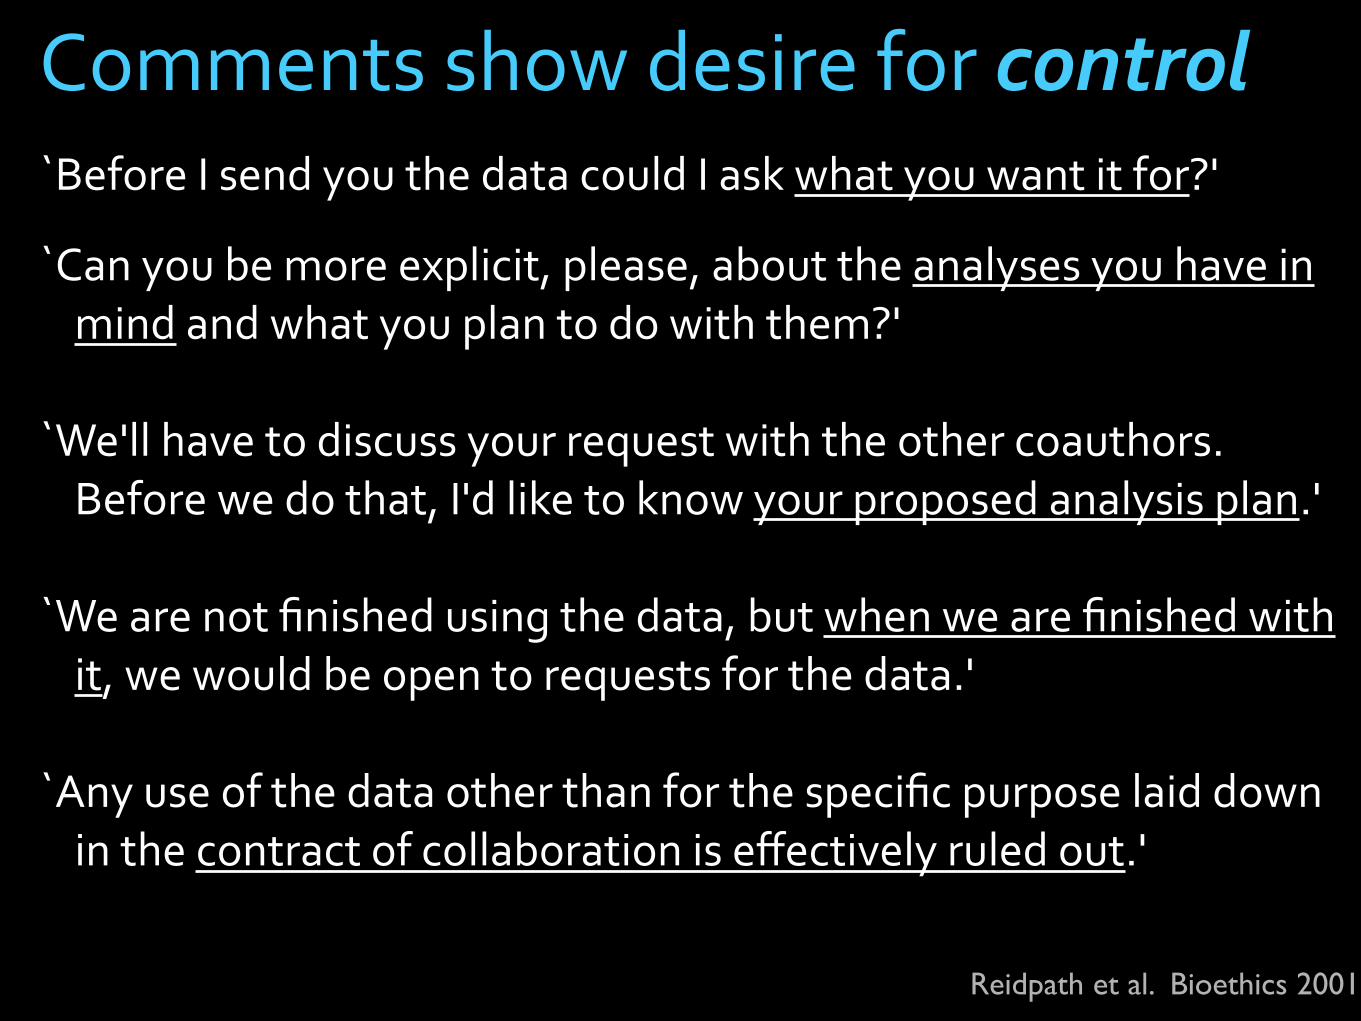
Comments show desire for control`Before I send you the data could I ask what you want it for?'
`Can you be more explicit, please, about the analyses you have in mind and what you plan to do with them?'
`We'll have to discuss your request with the other coauthors. Before we do that, I'd like to know your proposed analysis plan.'
`We are not finished using the data, but when we are finished with it, we would be open to requests for the data.'
`Any use of the data other than for the specific purpose laid down in the contract of collaboration is effectively ruled out.'
Reidpath et al. Bioethics 2001.
but how much isn’t shared?
what isn’t shared?
who isn’t sharing it?why not?
what can we do about it?
how much does it matter?
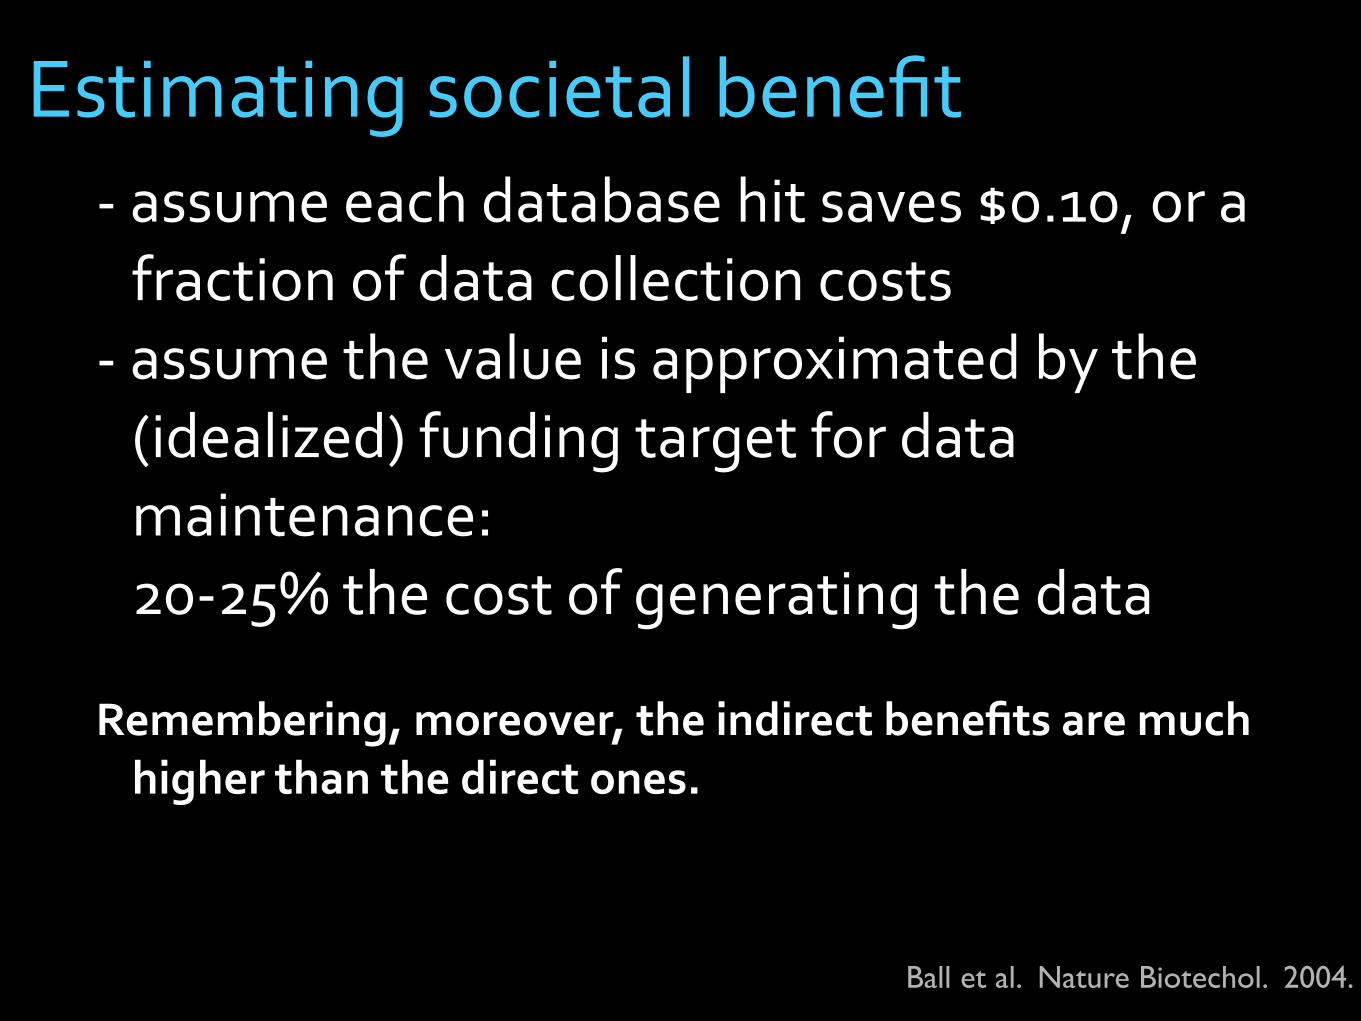
Estimating societal benefit‐ assume each database hit saves $0.10, or a fraction of data collection costs
‐ assume the value is approximated by the (idealized) funding target for data maintenance: 20‐25% the cost of generating the data
Remembering, moreover, the indirect benefits are much higher than the direct ones.
Ball et al. Nature Biotechol. 2004.
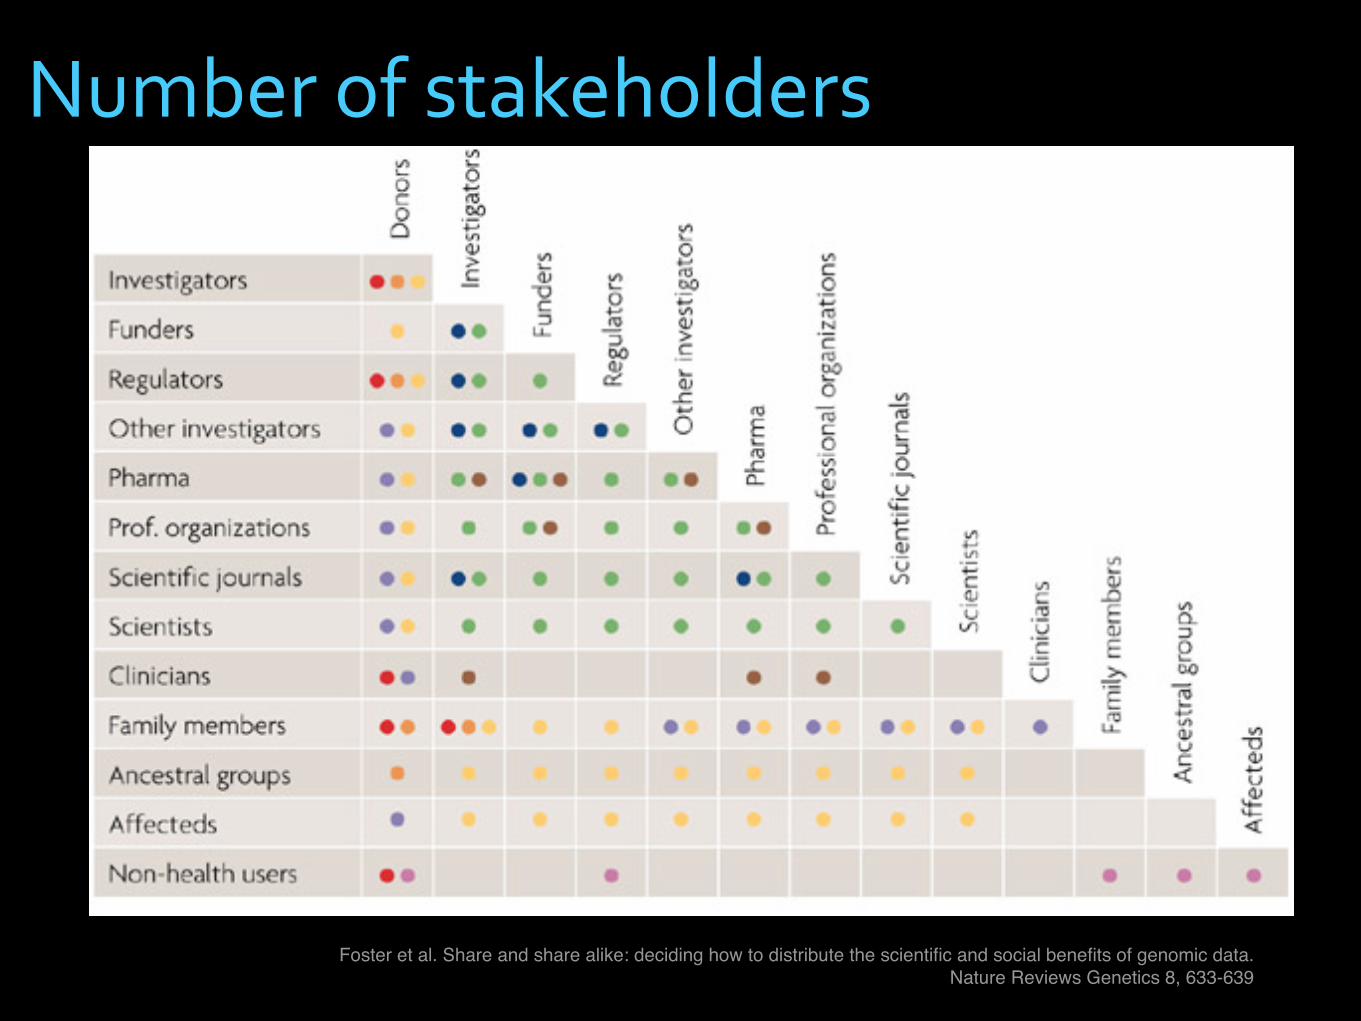
Foster et al. Share and share alike: deciding how to distribute the scientific and social benefits of genomic data.Nature Reviews Genetics 8, 633-639
Number of stakeholders
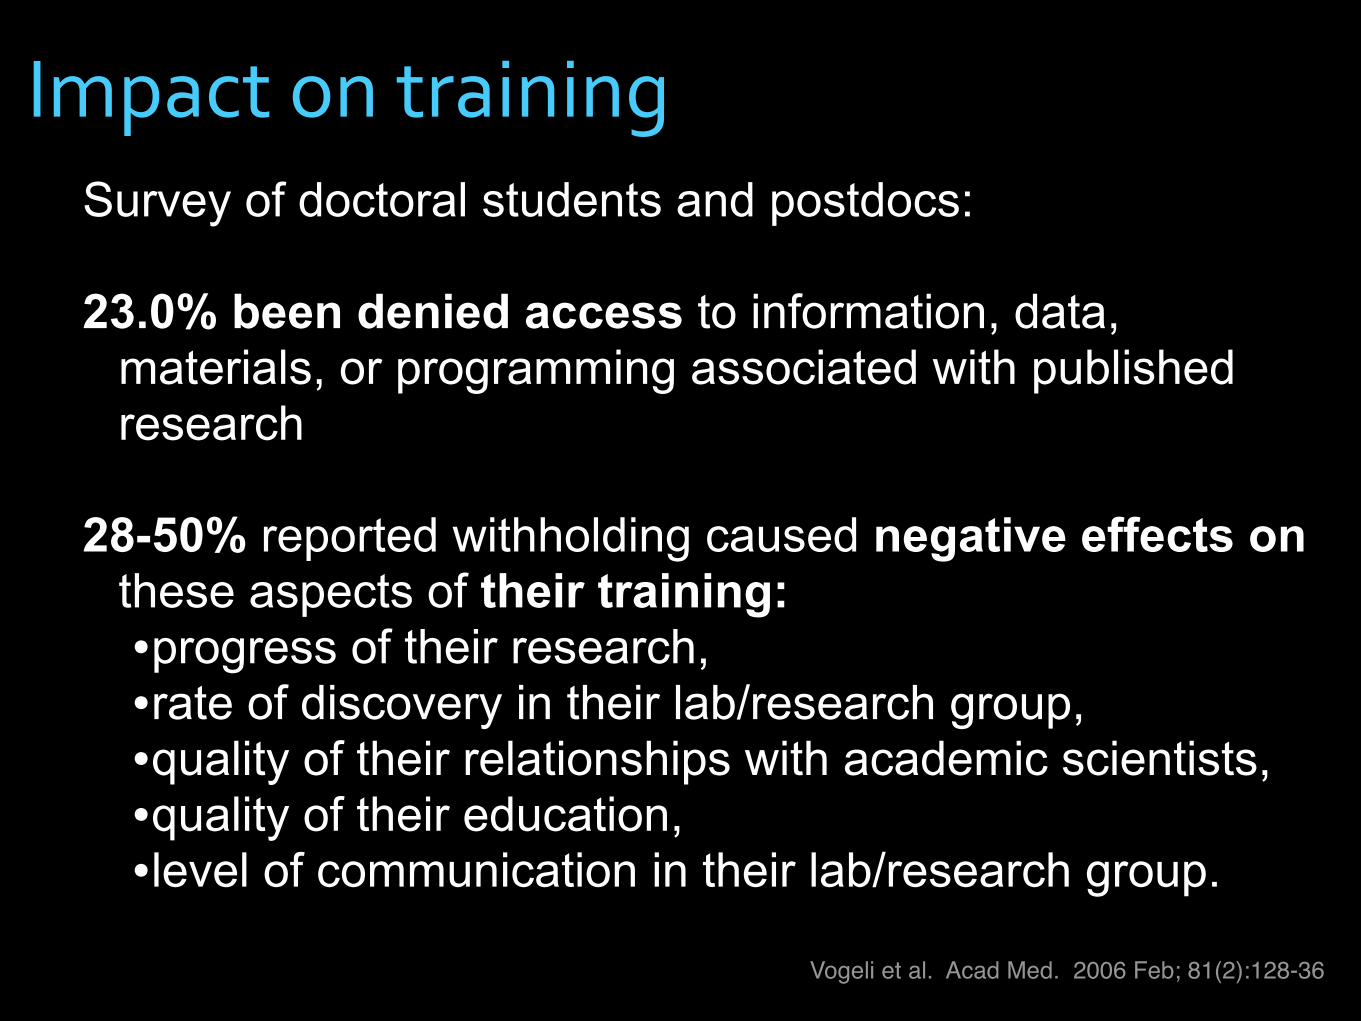
Survey of doctoral students and postdocs:
23.0% been denied access to information, data, materials, or programming associated with published research
28-50% reported withholding caused negative effects on these aspects of their training:•progress of their research, •rate of discovery in their lab/research group, •quality of their relationships with academic scientists, •quality of their education, •level of communication in their lab/research group.
Vogeli et al. Acad Med. 2006 Feb; 81(2):128-36
Impact on training
More research needs to be done!
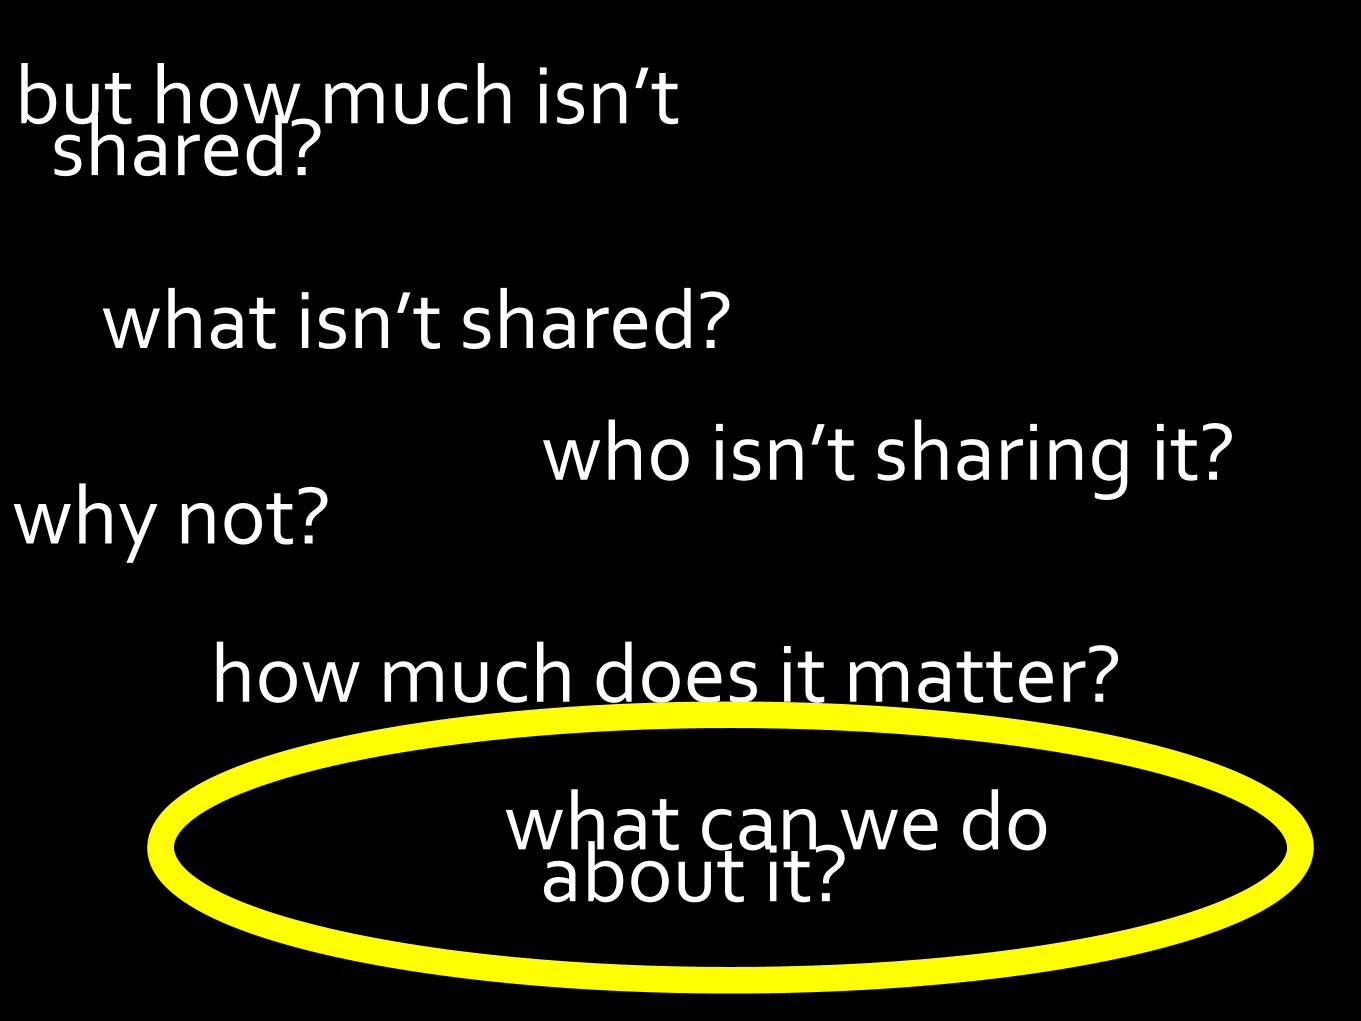
but how much isn’t shared?
what isn’t shared?
who isn’t sharing it?why not?
what can we do about it?
how much does it matter?
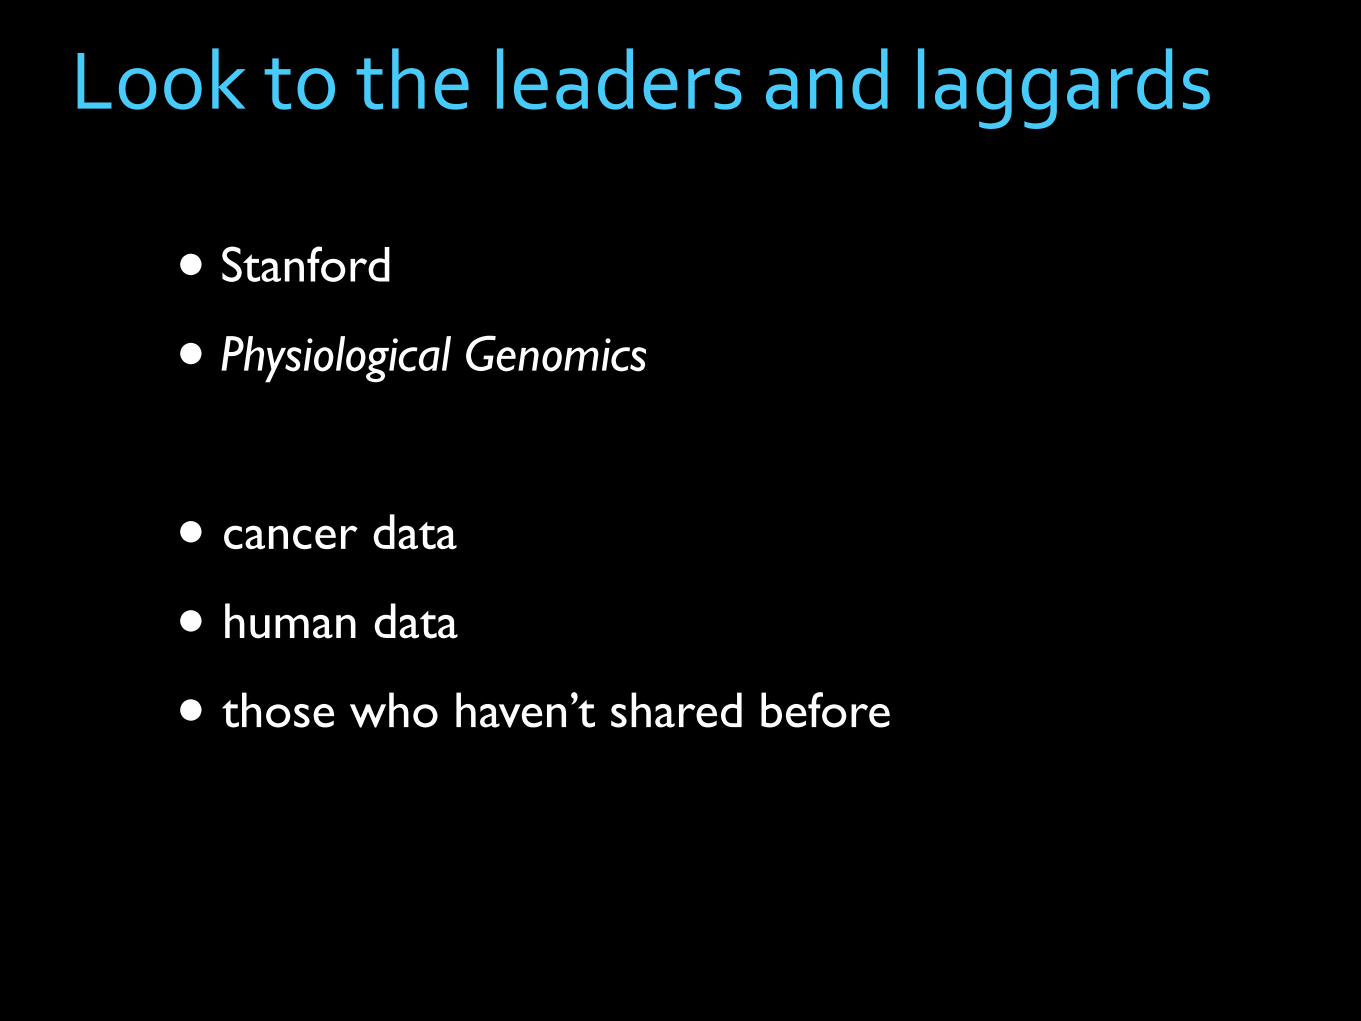
Look to the leaders and laggards
• Stanford
• Physiological Genomics
• cancer data
• human data
• those who haven’t shared before
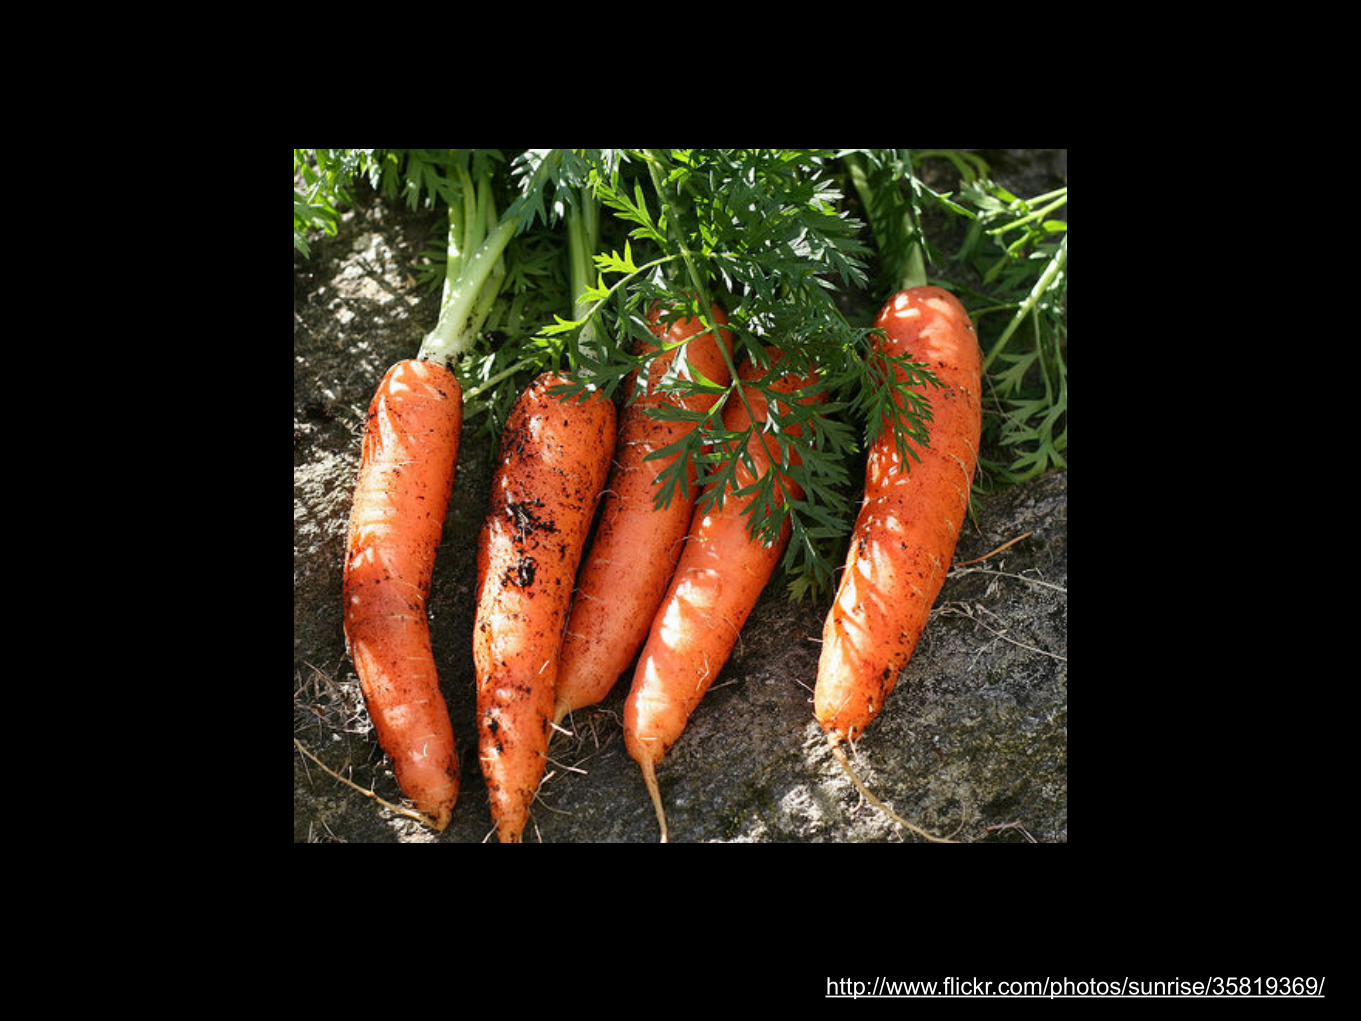
http://www.flickr.com/photos/sunrise/35819369/
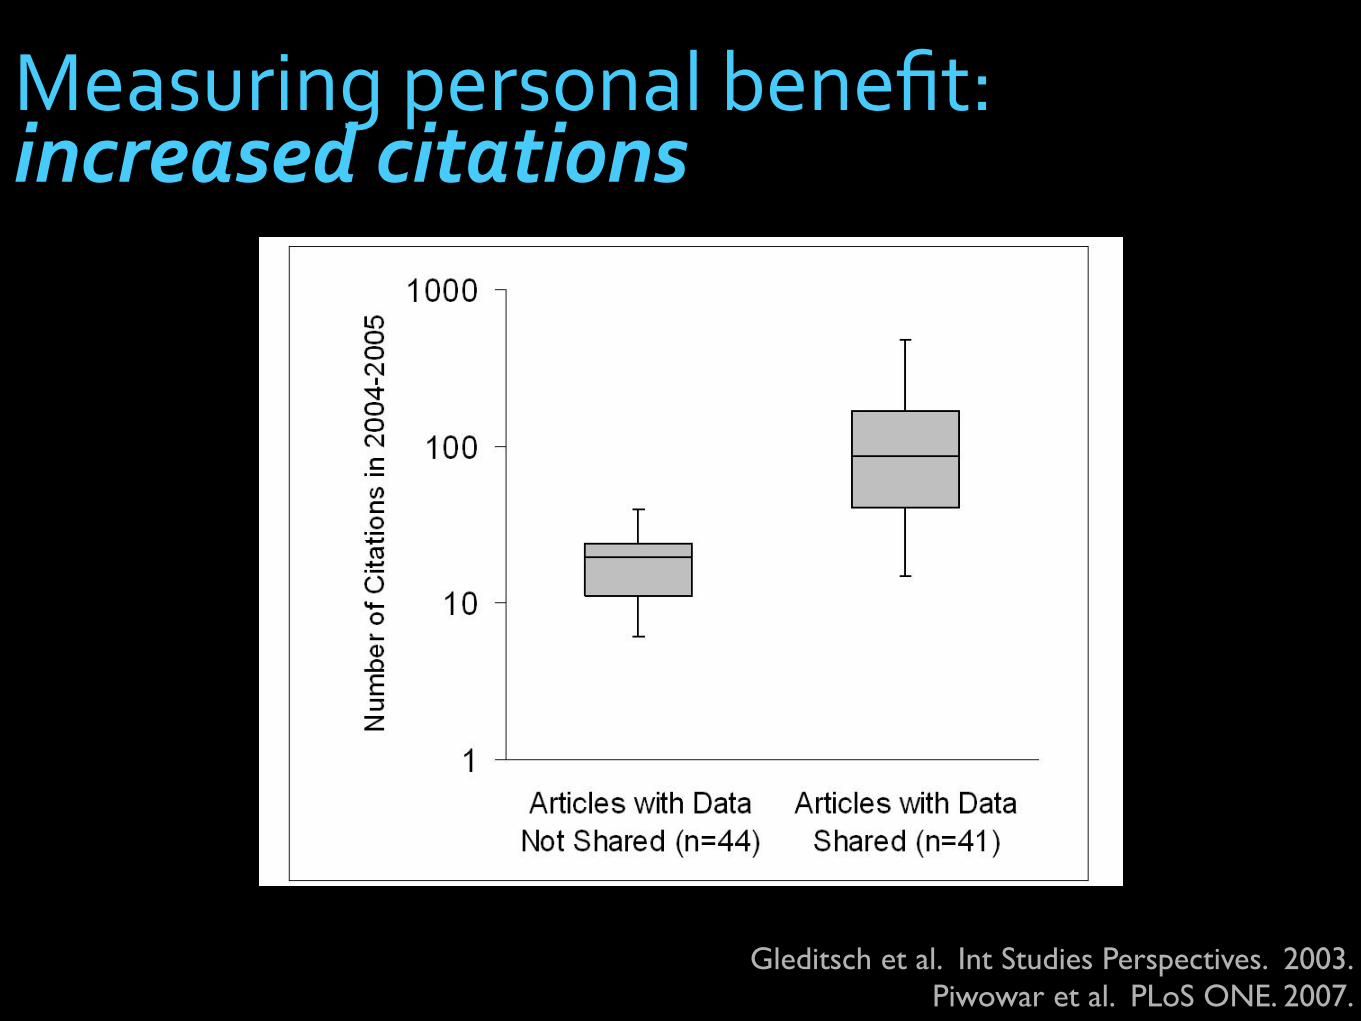
Gleditsch et al. Int Studies Perspectives. 2003.Piwowar et al. PLoS ONE. 2007.
Measuring personal benefit: increased citations
70% more citations
Piwowar et al. PLoS ONE. 2007.
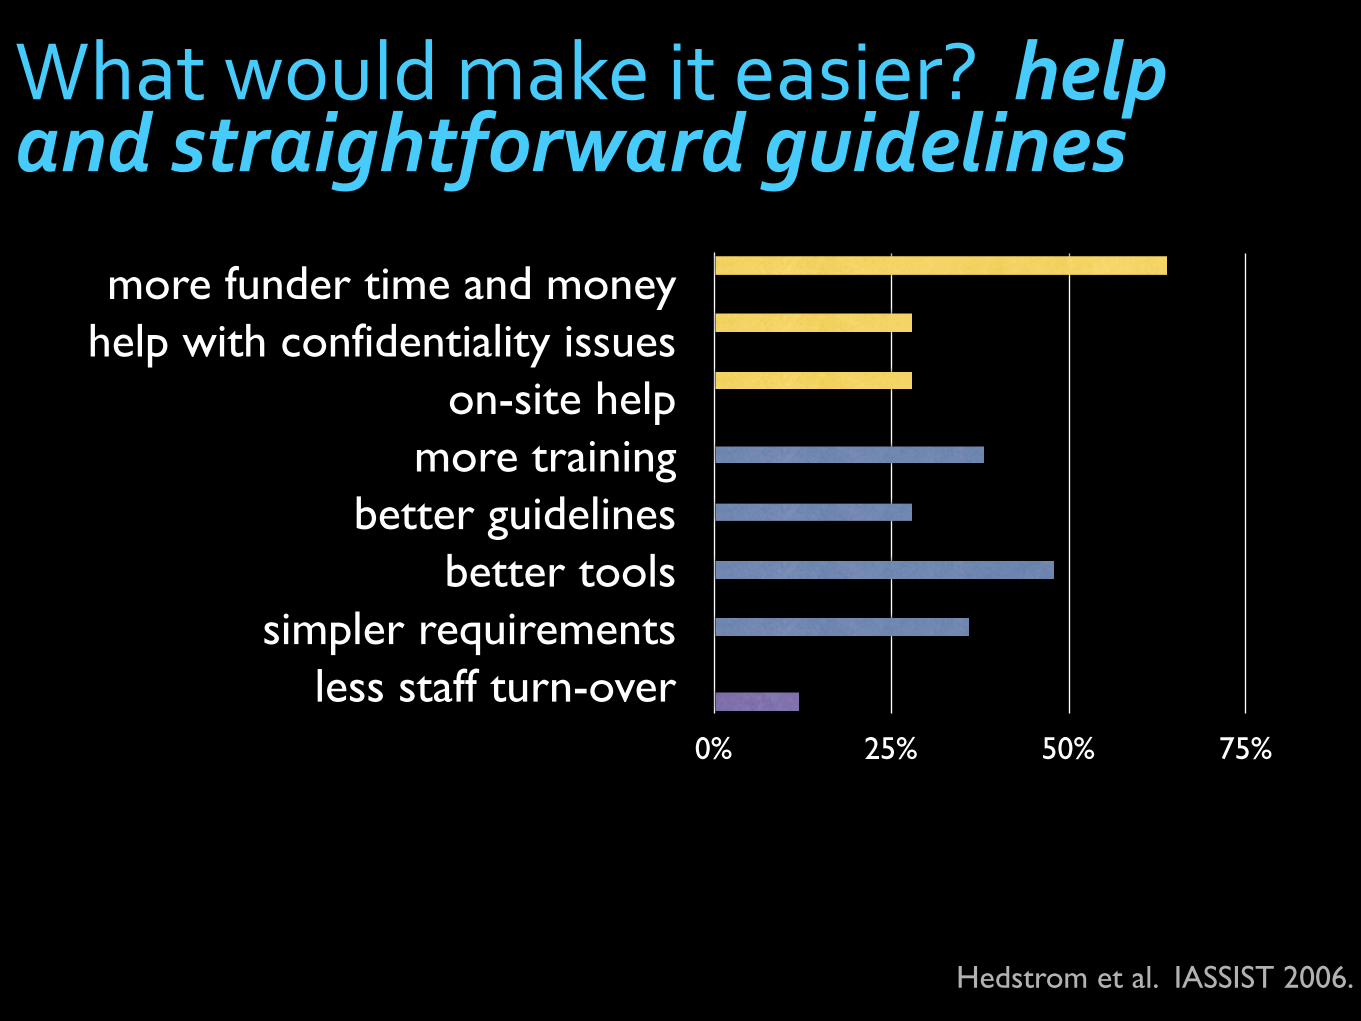
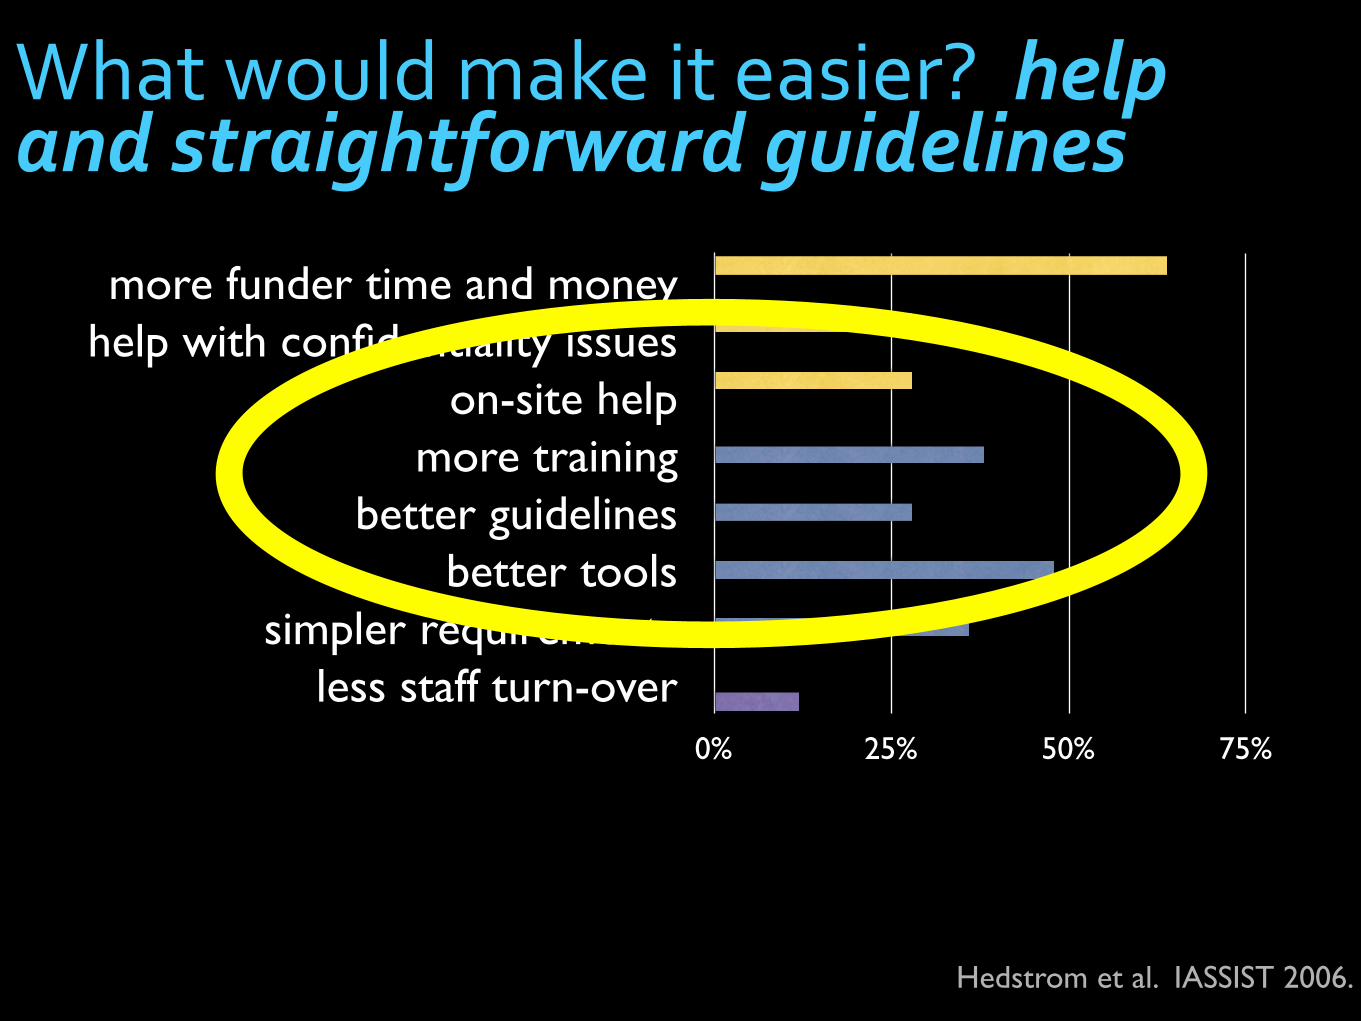
Hedstrom et al. IASSIST 2006.
What would make it easier? help and straightforward guidelines
more funder time and moneyhelp with confidentiality issues
on-site helpmore training
better guidelinesbetter tools
simpler requirementsless staff turn-over
0% 25% 50% 75%
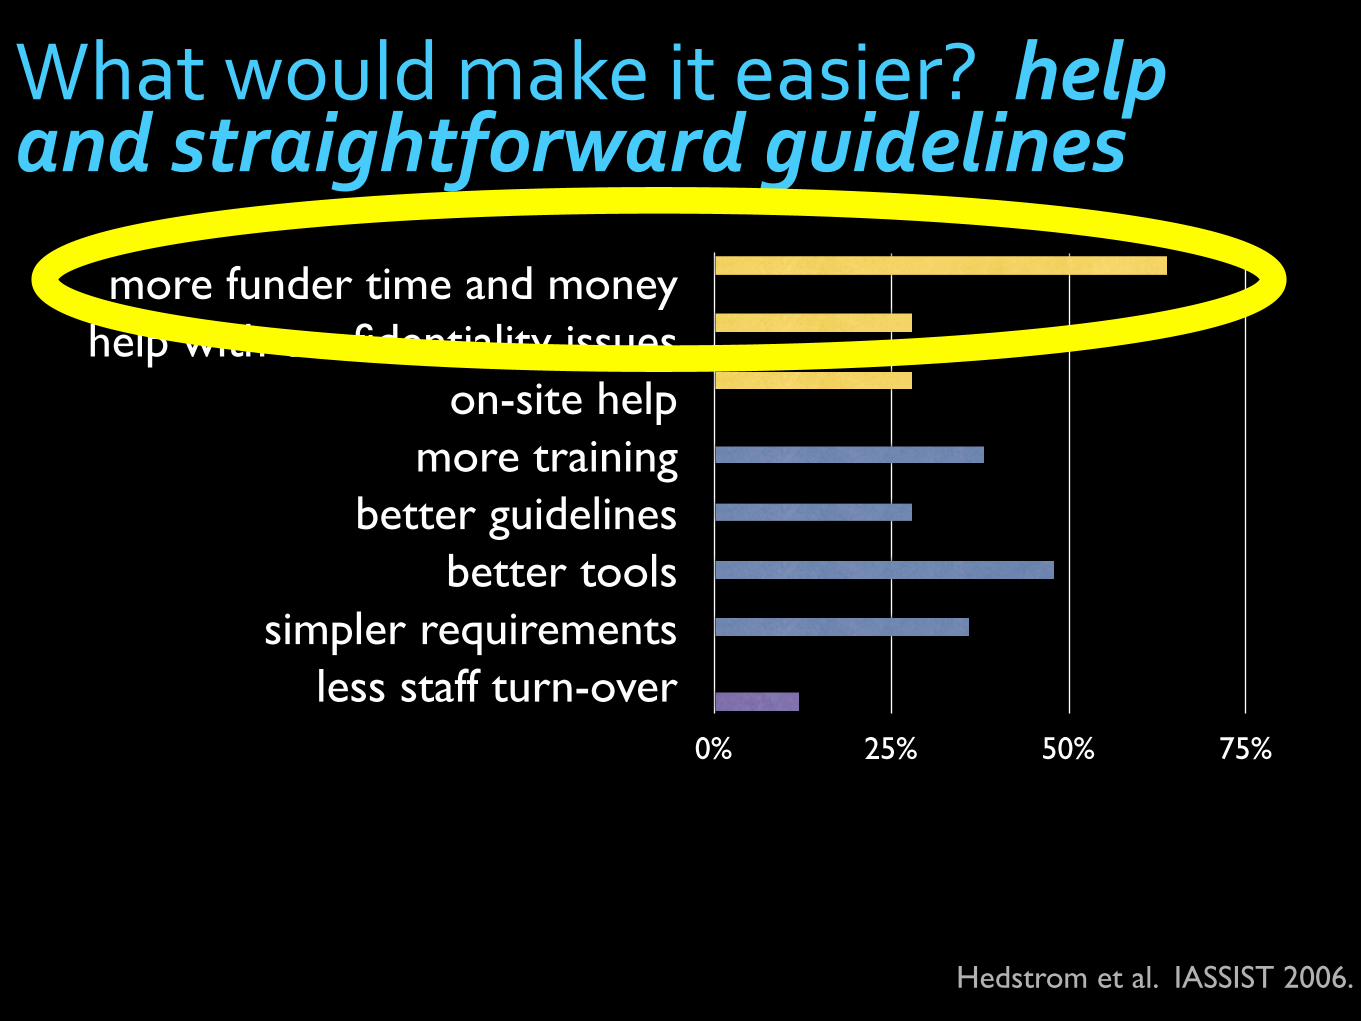
Hedstrom et al. IASSIST 2006.
What would make it easier? help and straightforward guidelines
more funder time and moneyhelp with confidentiality issues
on-site helpmore training
better guidelinesbetter tools
simpler requirementsless staff turn-over
0% 25% 50% 75%
Hedstrom et al. IASSIST 2006.
What would make it easier? help and straightforward guidelines
more funder time and moneyhelp with confidentiality issues
on-site helpmore training
better guidelinesbetter tools
simpler requirementsless staff turn-over
0% 25% 50% 75%
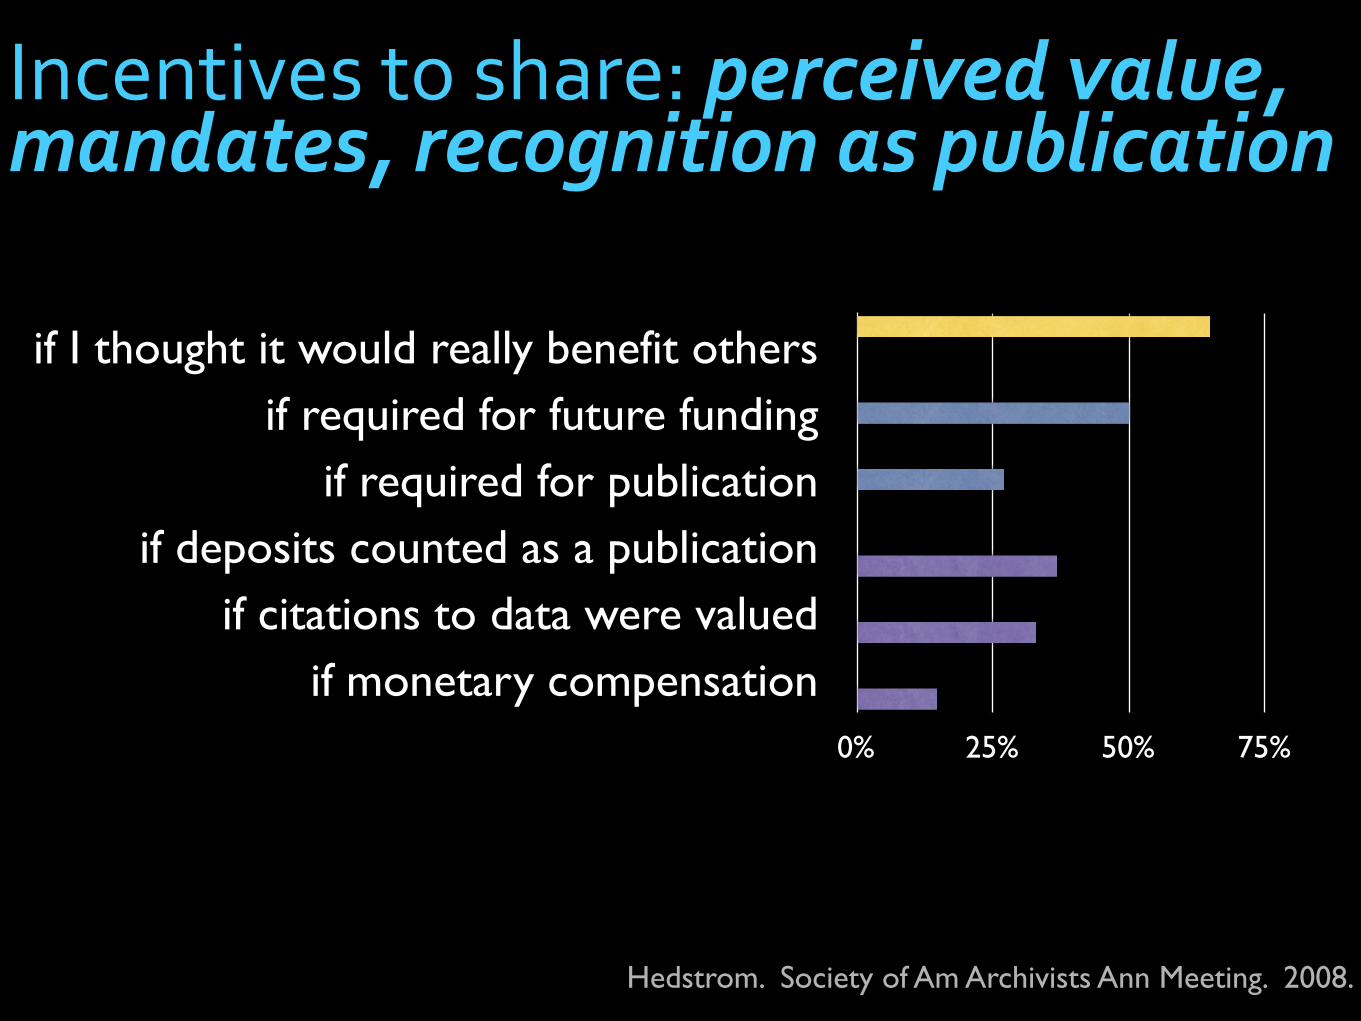
Hedstrom. Society of Am Archivists Ann Meeting. 2008.
if I thought it would really benefit othersif required for future funding
if required for publicationif deposits counted as a publication
if citations to data were valuedif monetary compensation
0% 25% 50% 75%
Incentives to share: perceived value, mandates, recognition as publication
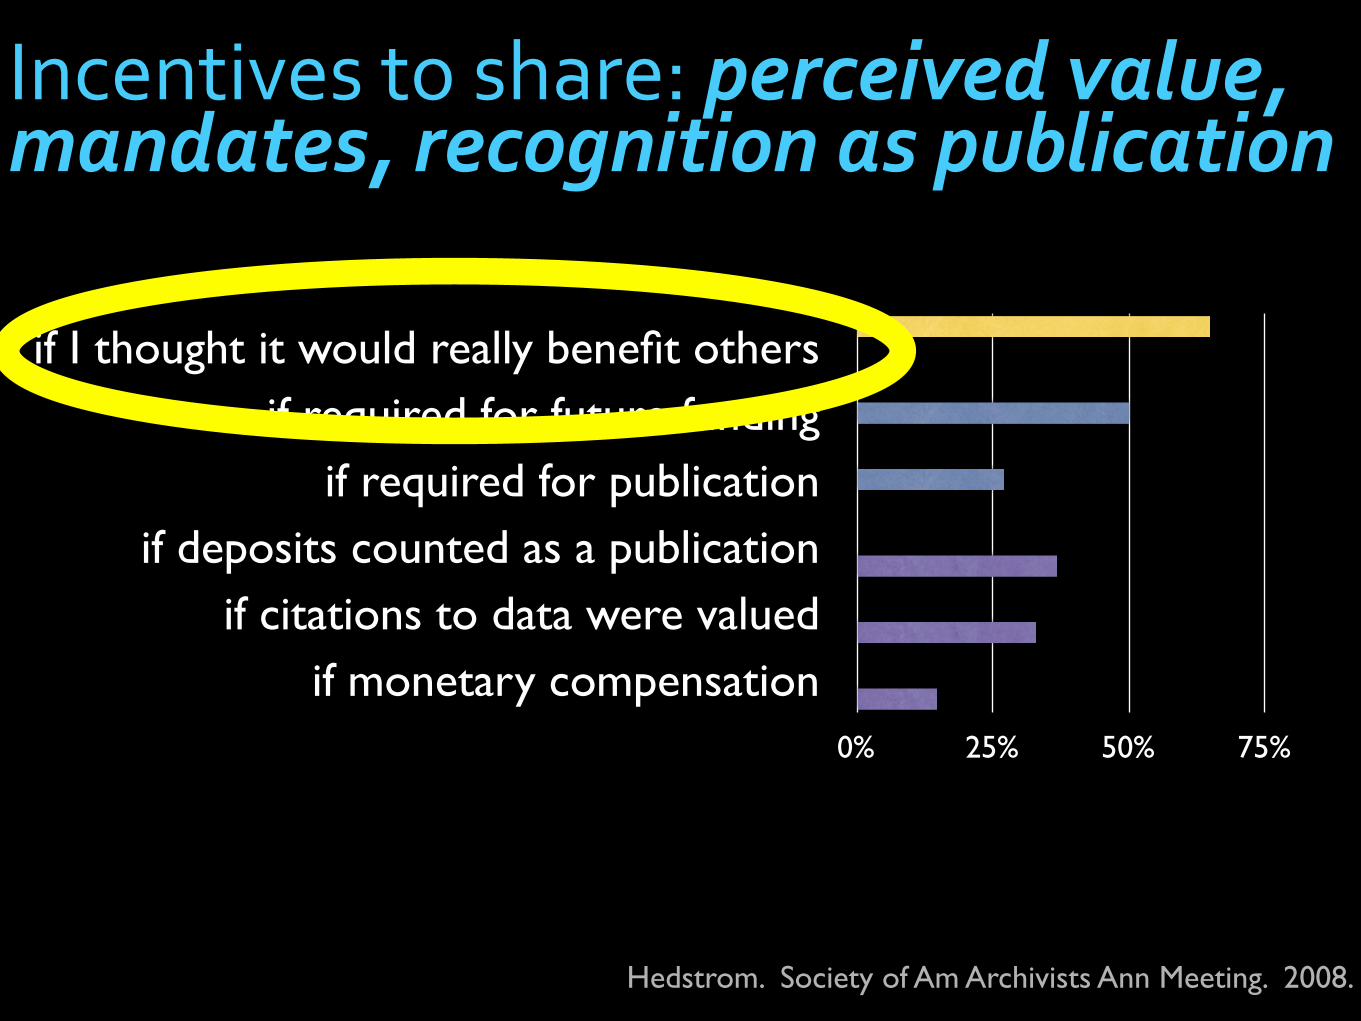
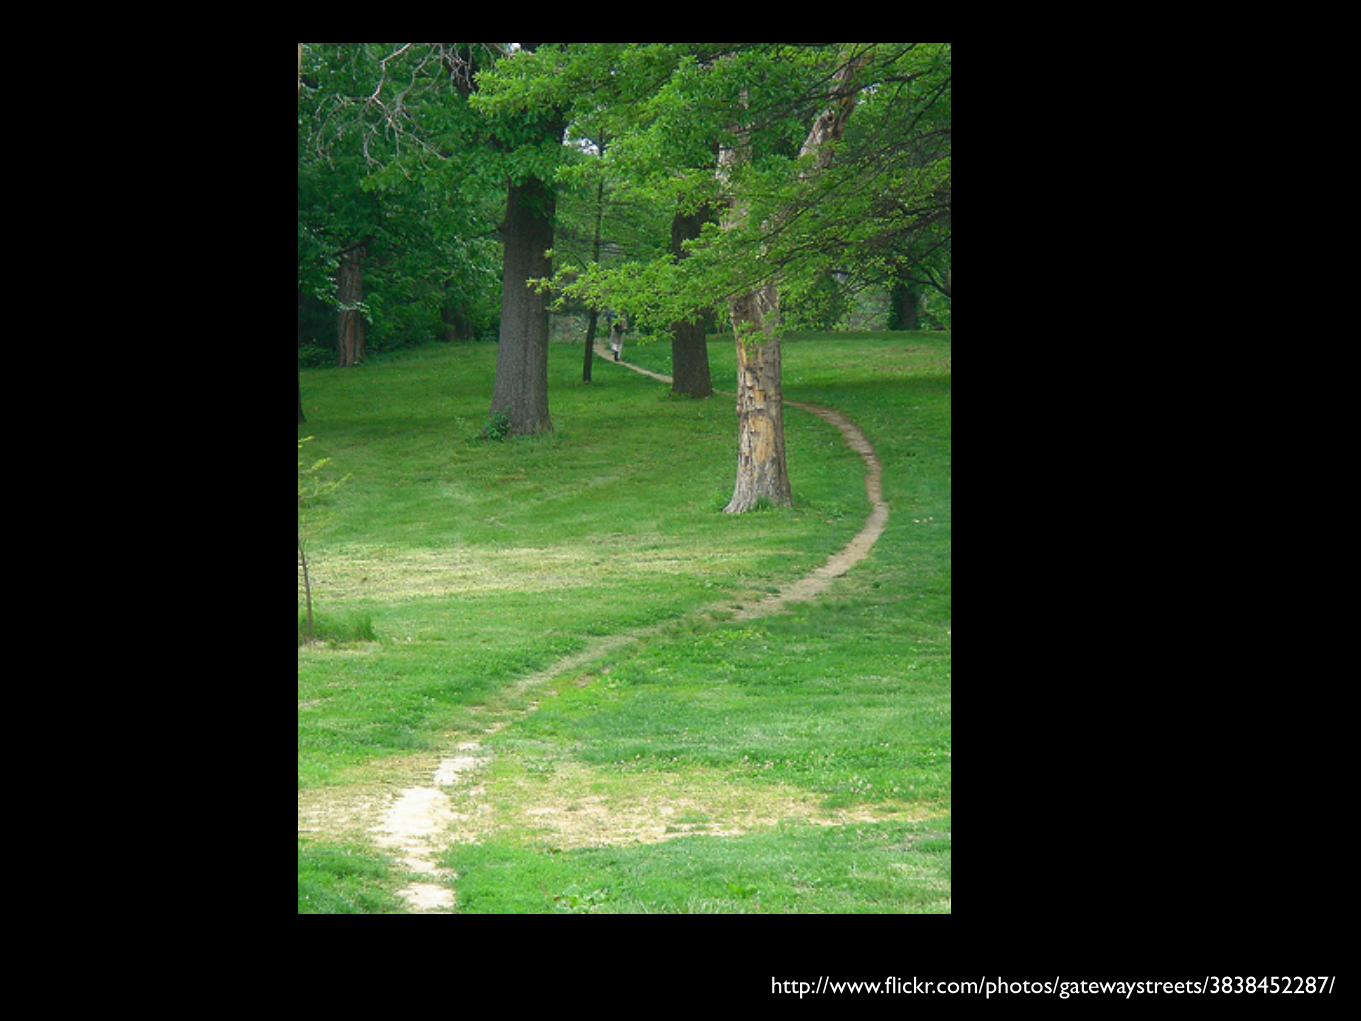
http://www.flickr.com/photos/gatewaystreets/3838452287/
• #oa.data
• Science Commons
• DataCite
• Dataverse
• MGED
• Open Notebook Science
• Friendfeed
• Nature editorials
• many others...
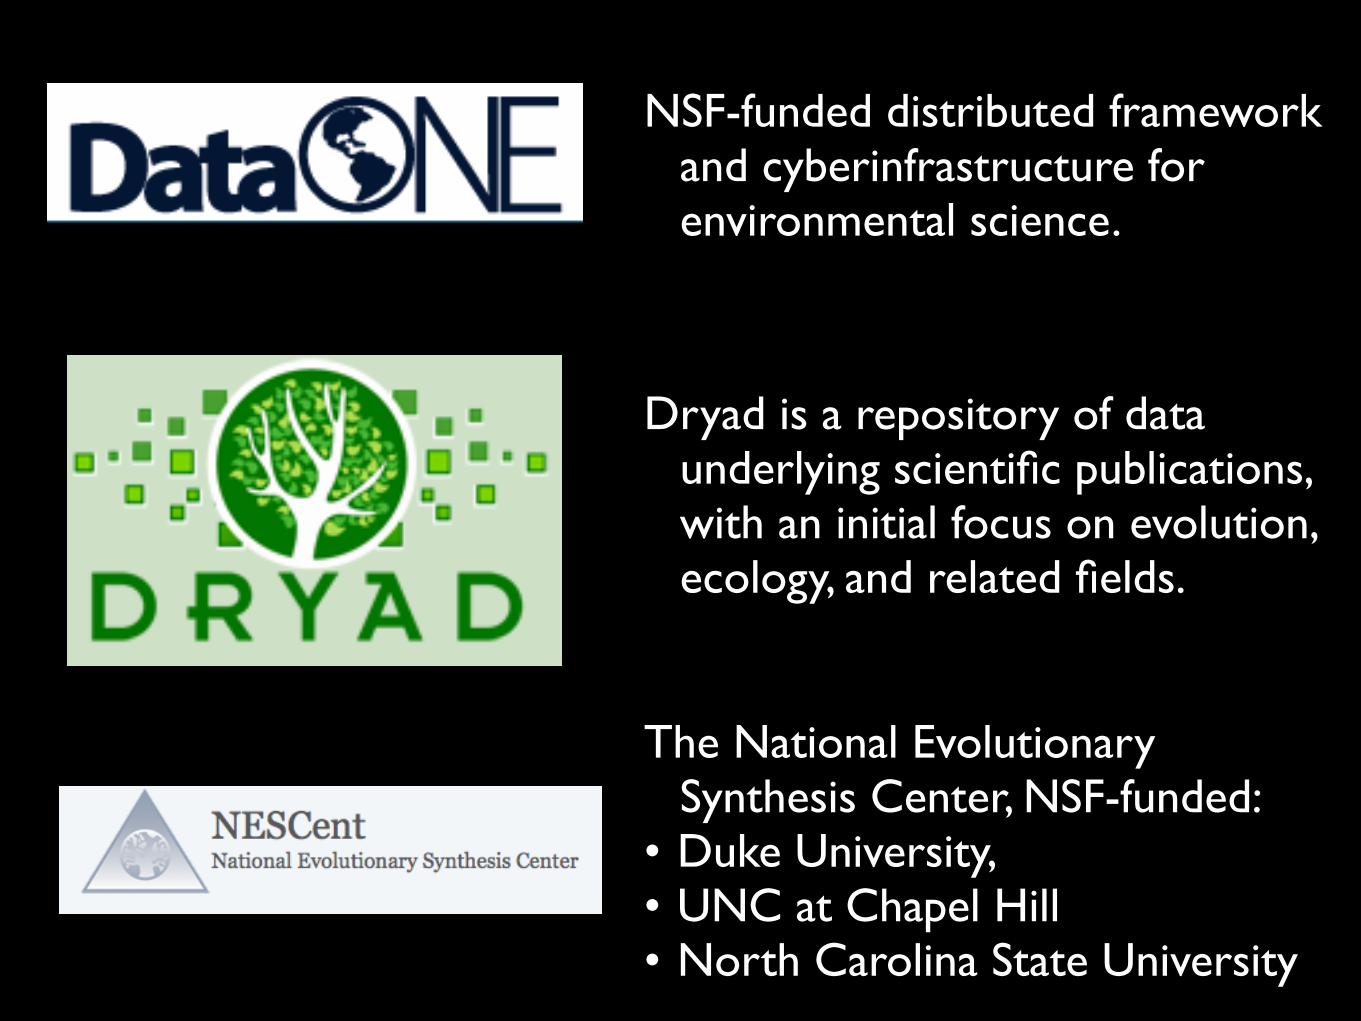
NSF-funded distributed framework and cyberinfrastructure for environmental science.
Dryad is a repository of data underlying scientific publications, with an initial focus on evolution, ecology, and related fields.
The National Evolutionary Synthesis Center, NSF-funded:
• Duke University,• UNC at Chapel Hill• North Carolina State University
http://www.flickr.com/photos/g_kat26/4255119413/
Begin to investigate reuse
http://www.flickr.com/photos/boitabulle/3668162701/
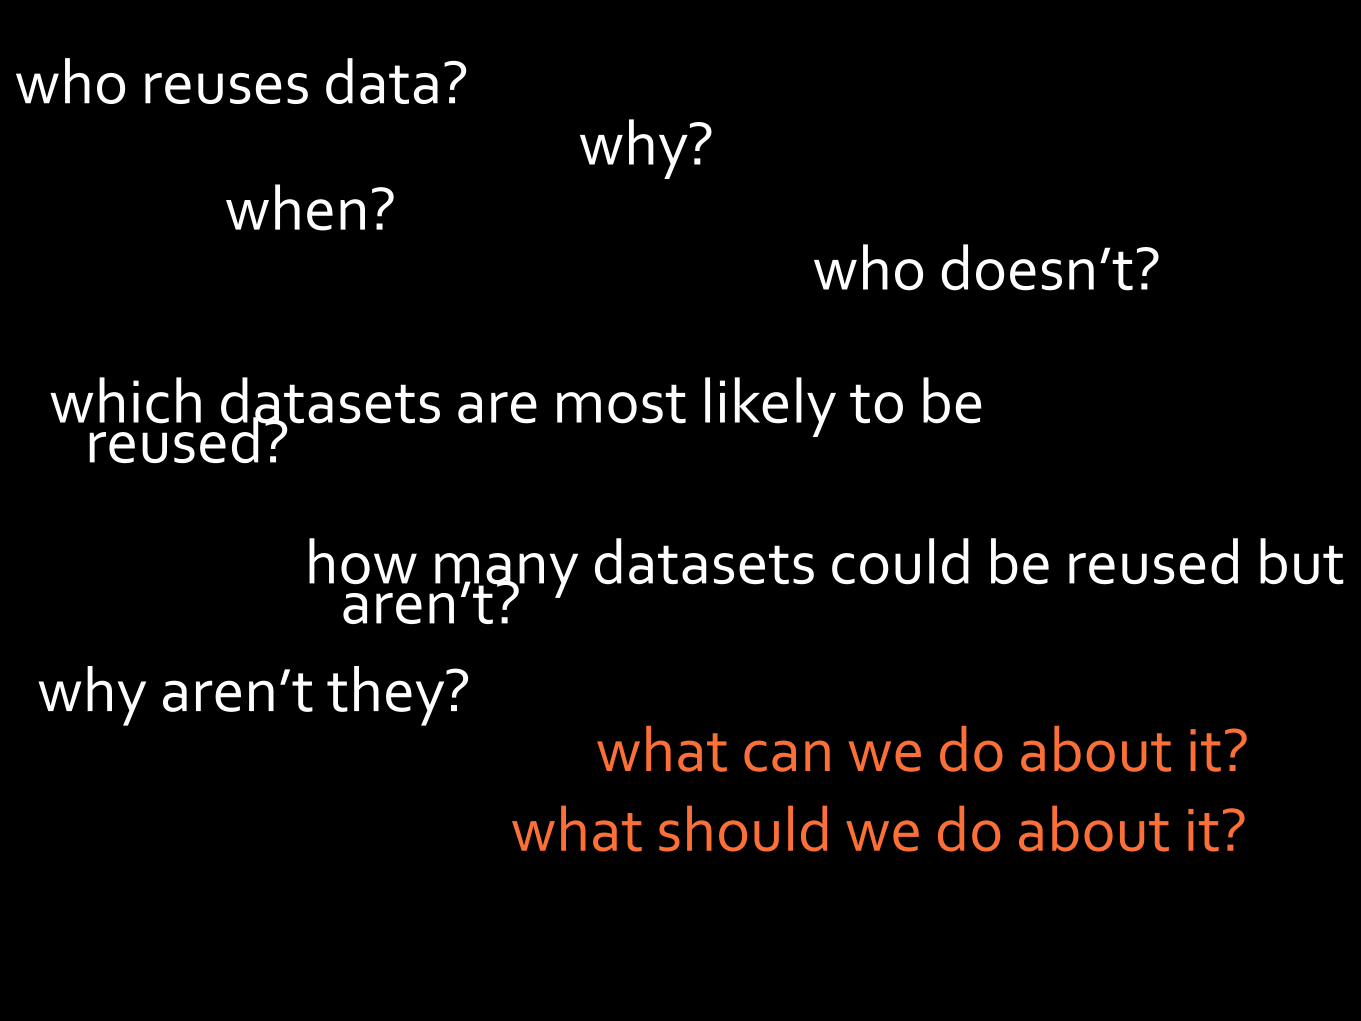
who reuses data?
when?
why aren’t they?
which datasets are most likely to be reused?
what can we do about it?
how many datasets could be reused but aren’t?
why?
who doesn’t?
what should we do about it?
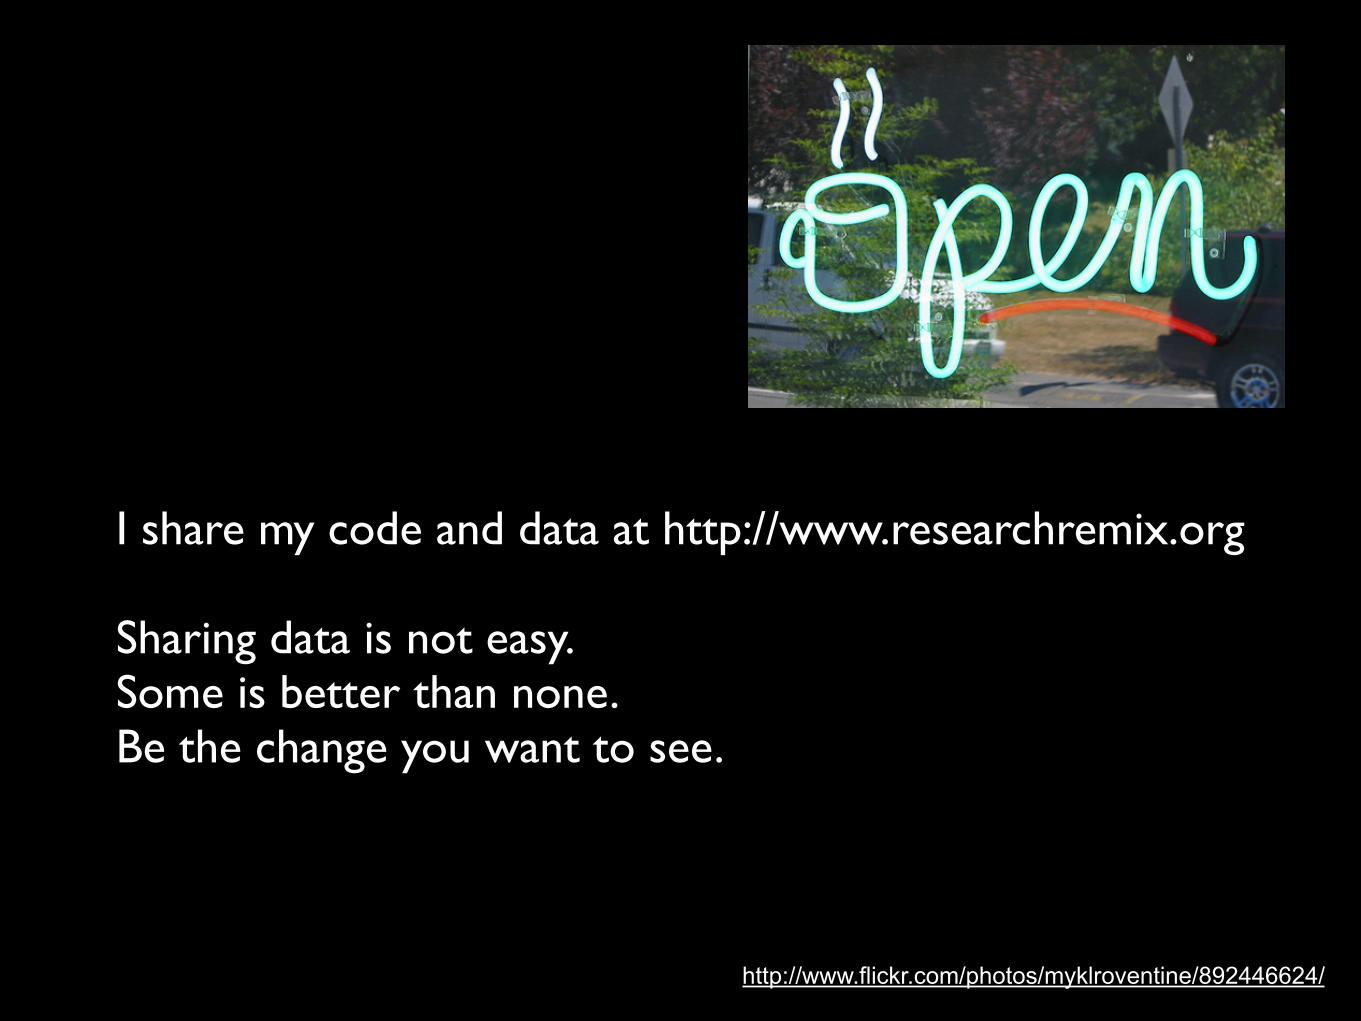
I share my code and data at http://www.researchremix.org
Sharing data is not easy.Some is better than none.Be the change you want to see.
http://www.flickr.com/photos/myklroventine/892446624/

thank you
Dept of Biomedical Informatics at U of Pittsburgh
NLM for training grant funding
Open science online community and those who release their articles, datasets and photos openly
NEDCC

Once shared, always there?
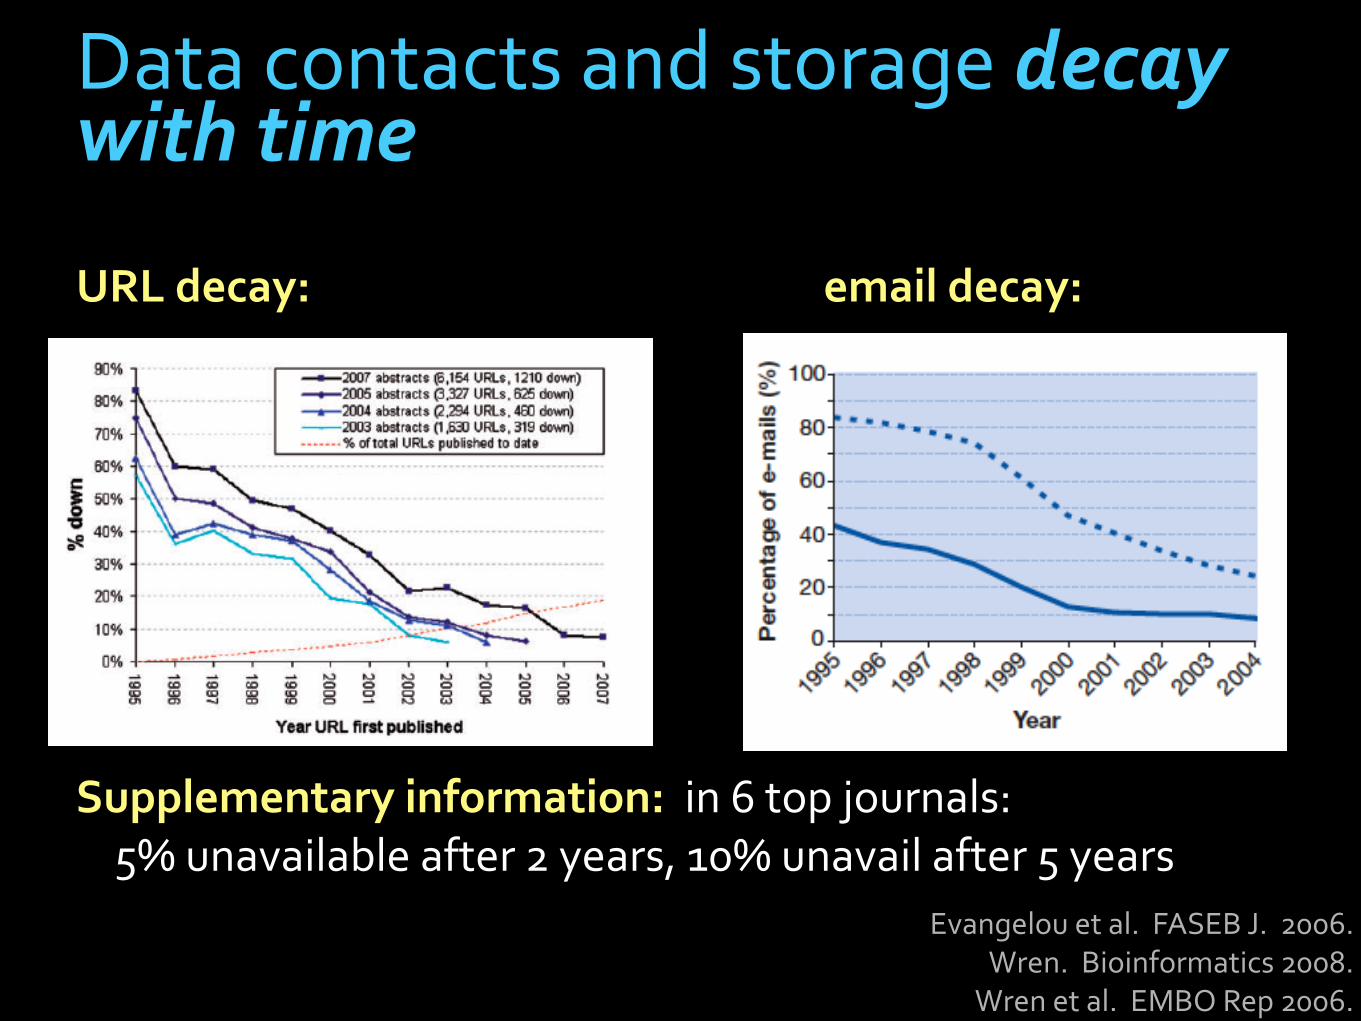
Data contacts and storage decay with time
URL decay: email decay:
Supplementary information: in 6 top journals: 5% unavailable after 2 years, 10% unavail after 5 years
Evangelou et al. FASEB J. 2006.Wren. Bioinformatics 2008.Wren et al. EMBO Rep 2006.
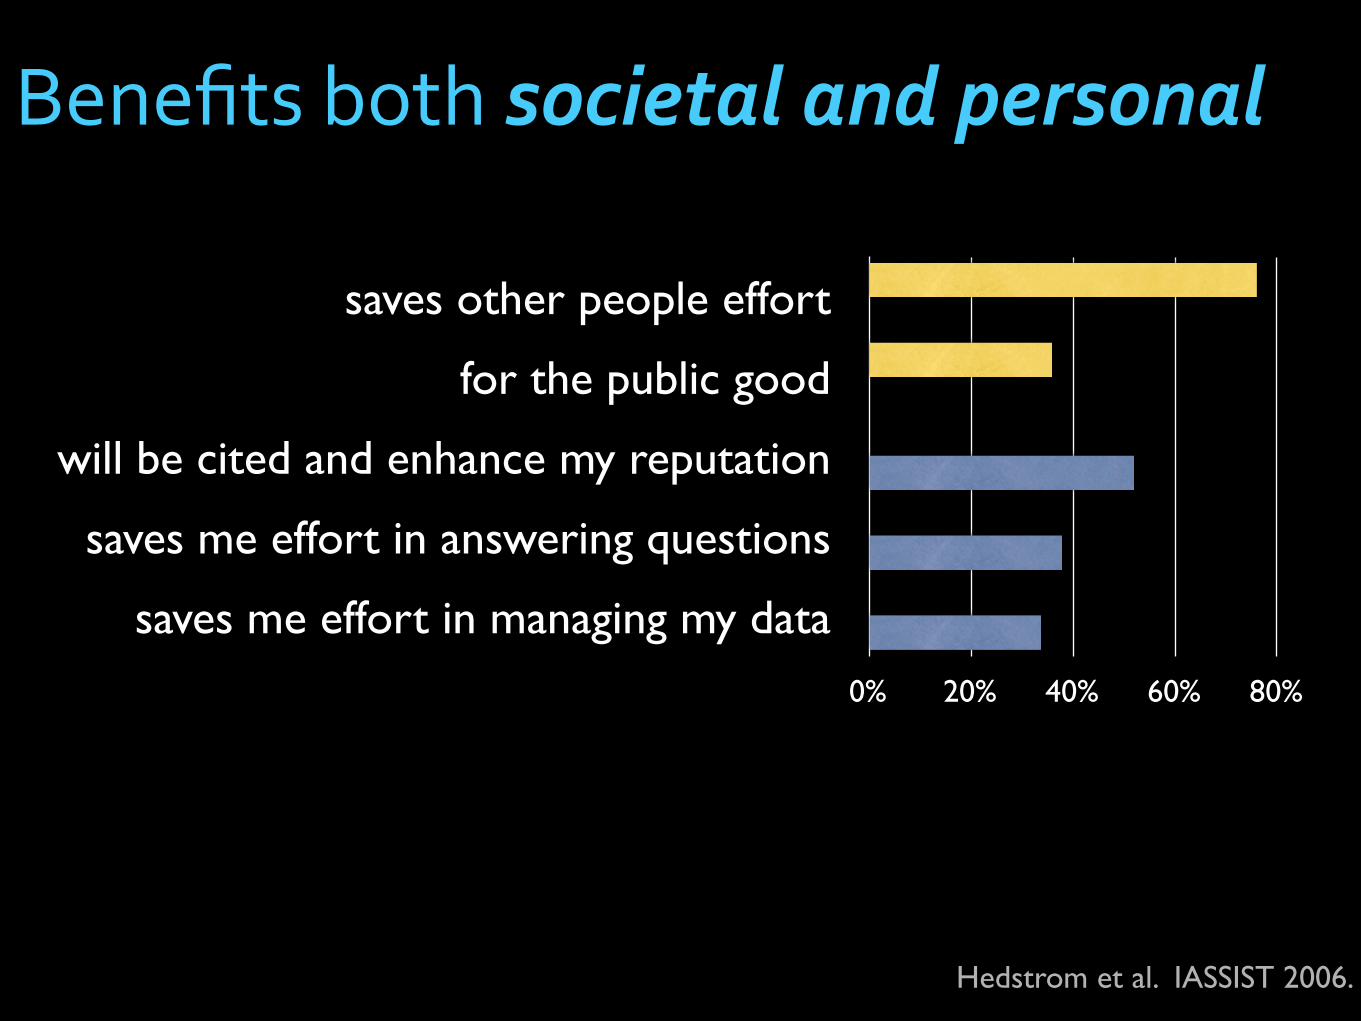
Hedstrom et al. IASSIST 2006.
saves other people effort
for the public good
will be cited and enhance my reputation
saves me effort in answering questions
saves me effort in managing my data0% 20% 40% 60% 80%
Benefits both societal and personal
http://www.flickr.com/photos/sunrise/35819369/http://www.flickr.com/photos/fboyd/2156630044/
http://www.flickr.com/photos/jep42/3017149415/in/set-72157608797298056/