Embed Size (px)
Citation preview
Offshore ‘Beta’ Trade: Laggards Hold Greatest Upside in Recovery
Darren Gacicia Managing Director
Senior Oilfield Services Analyst KLR Group, LLC 713-352-0887
For definitions and the distribution of analyst ratings, and other disclosures, please refer to pages 72 - 73 of this report
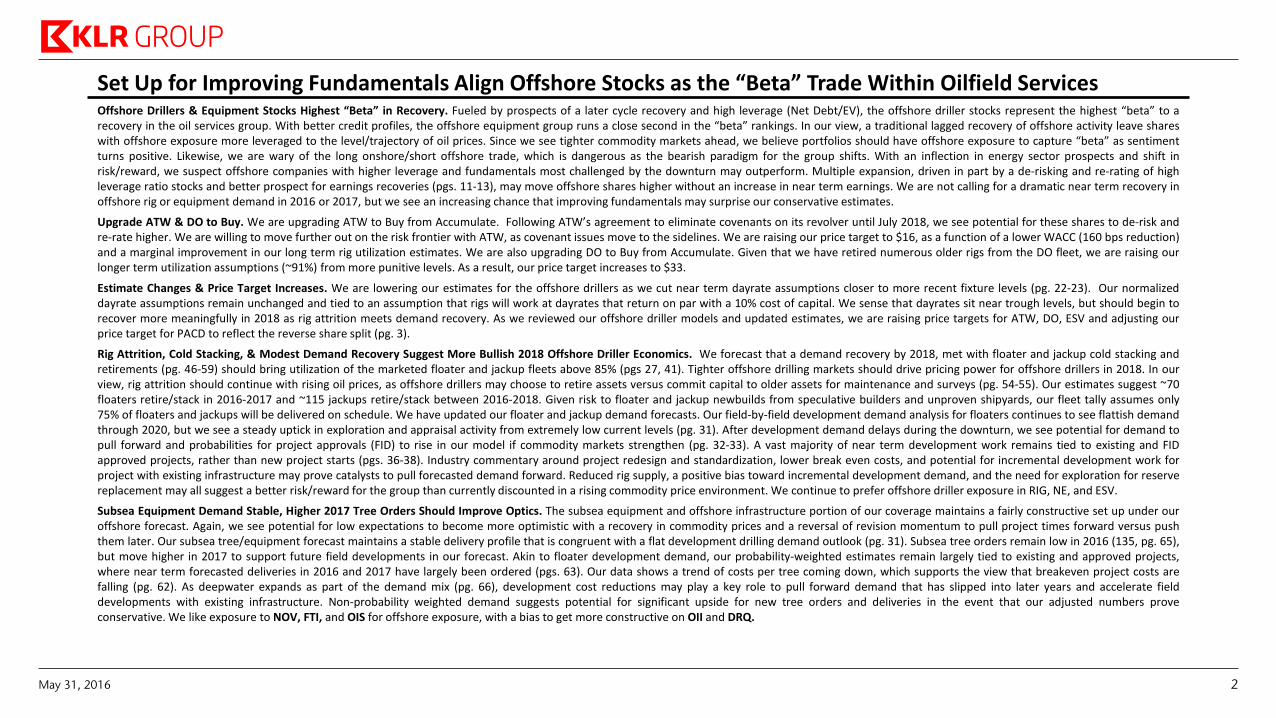
Set Up for Improving Fundamentals Align Offshore Stocks as the “Beta” Trade Within Oilfield Services Offshore Drillers & Equipment Stocks Highest “Beta” in Recovery. Fueled by prospects of a later cycle recovery and high leverage (Net Debt/EV), the offshore driller stocks represent the highest “beta” to a recovery in the oil services group. With better credit profiles, the offshore equipment group runs a close second in the “beta” rankings. In our view, a traditional lagged recovery of offshore activity leave shares with offshore exposure more leveraged to the level/trajectory of oil prices. Since we see tighter commodity markets ahead, we believe portfolios should have offshore exposure to capture “beta” as sentiment turns positive. Likewise, we are wary of the long onshore/short offshore trade, which is dangerous as the bearish paradigm for the group shifts. With an inflection in energy sector prospects and shift in risk/reward, we suspect offshore companies with higher leverage and fundamentals most challenged by the downturn may outperform. Multiple expansion, driven in part by a de-risking and re-rating of high leverage ratio stocks and better prospect for earnings recoveries (pgs. 11-13), may move offshore shares higher without an increase in near term earnings. We are not calling for a dramatic near term recovery in offshore rig or equipment demand in 2016 or 2017, but we see an increasing chance that improving fundamentals may surprise our conservative estimates.
Upgrade ATW & DO to Buy. We are upgrading ATW to Buy from Accumulate. Following ATW’s agreement to eliminate covenants on its revolver until July 2018, we see potential for these shares to de-risk and re-rate higher. We are willing to move further out on the risk frontier with ATW, as covenant issues move to the sidelines. We are raising our price target to $16, as a function of a lower WACC (160 bps reduction) and a marginal improvement in our long term rig utilization estimates. We are also upgrading DO to Buy from Accumulate. Given that we have retired numerous older rigs from the DO fleet, we are raising our longer term utilization assumptions (~91%) from more punitive levels. As a result, our price target increases to $33.
Estimate Changes & Price Target Increases. We are lowering our estimates for the offshore drillers as we cut near term dayrate assumptions closer to more recent fixture levels (pg. 22-23). Our normalized dayrate assumptions remain unchanged and tied to an assumption that rigs will work at dayrates that return on par with a 10% cost of capital. We sense that dayrates sit near trough levels, but should begin to recover more meaningfully in 2018 as rig attrition meets demand recovery. As we reviewed our offshore driller models and updated estimates, we are raising price targets for ATW, DO, ESV and adjusting our price target for PACD to reflect the reverse share split (pg. 3).
Rig Attrition, Cold Stacking, & Modest Demand Recovery Suggest More Bullish 2018 Offshore Driller Economics. We forecast that a demand recovery by 2018, met with floater and jackup cold stacking and retirements (pg. 46-59) should bring utilization of the marketed floater and jackup fleets above 85% (pgs 27, 41). Tighter offshore drilling markets should drive pricing power for offshore drillers in 2018. In our view, rig attrition should continue with rising oil prices, as offshore drillers may choose to retire assets versus commit capital to older assets for maintenance and surveys (pg. 54-55). Our estimates suggest ~70 floaters retire/stack in 2016-2017 and ~115 jackups retire/stack between 2016-2018. Given risk to floater and jackup newbuilds from speculative builders and unproven shipyards, our fleet tally assumes only 75% of floaters and jackups will be delivered on schedule. We have updated our floater and jackup demand forecasts. Our field-by-field development demand analysis for floaters continues to see flattish demand through 2020, but we see a steady uptick in exploration and appraisal activity from extremely low current levels (pg. 31). After development demand delays during the downturn, we see potential for demand to pull forward and probabilities for project approvals (FID) to rise in our model if commodity markets strengthen (pg. 32-33). A vast majority of near term development work remains tied to existing and FID approved projects, rather than new project starts (pgs. 36-38). Industry commentary around project redesign and standardization, lower break even costs, and potential for incremental development work for project with existing infrastructure may prove catalysts to pull forecasted demand forward. Reduced rig supply, a positive bias toward incremental development demand, and the need for exploration for reserve replacement may all suggest a better risk/reward for the group than currently discounted in a rising commodity price environment. We continue to prefer offshore driller exposure in RIG, NE, and ESV.
Subsea Equipment Demand Stable, Higher 2017 Tree Orders Should Improve Optics. The subsea equipment and offshore infrastructure portion of our coverage maintains a fairly constructive set up under our offshore forecast. Again, we see potential for low expectations to become more optimistic with a recovery in commodity prices and a reversal of revision momentum to pull project times forward versus push them later. Our subsea tree/equipment forecast maintains a stable delivery profile that is congruent with a flat development drilling demand outlook (pg. 31). Subsea tree orders remain low in 2016 (135, pg. 65), but move higher in 2017 to support future field developments in our forecast. Akin to floater development demand, our probability-weighted estimates remain largely tied to existing and approved projects, where near term forecasted deliveries in 2016 and 2017 have largely been ordered (pgs. 63). Our data shows a trend of costs per tree coming down, which supports the view that breakeven project costs are falling (pg. 62). As deepwater expands as part of the demand mix (pg. 66), development cost reductions may play a key role to pull forward demand that has slipped into later years and accelerate field developments with existing infrastructure. Non-probability weighted demand suggests potential for significant upside for new tree orders and deliveries in the event that our adjusted numbers prove conservative. We like exposure to NOV, FTI, and OIS for offshore exposure, with a bias to get more constructive on OII and DRQ.
May 31, 2016 2
Coverage Breakdown, Preference Ranking, & Price Target Changes
Sources: KLR Group, LLC Forecasts; Factset
Company Ticker Rating
B/S & Covenant
Risk
Market Cap.
(MM)
Last
Close
Price
Current
Price
Target
Previous
Price
Target Upside North America International Business Mix
National Oilwell Varco NOV Buy No $ 12,300 $ 32.62 $ 52.00 $ 52.00 59% Mixed Mixed Rig Equipment, Diversified Equipment, Diversified Servies, Oilfield Consumables
Nabors Industries NBR Buy No $ 2,557 $ 9.07 $ 14.00 $ 14.00 54% Mixed Mixed Land Contract Driller
Superior Energy SPN Buy No $ 2,644 $ 17.46 $ 28.00 $ 28.00 60% Majority Minority Diversified Services
Forum Energy FET Buy No $ 1,564 $ 17.15 $ 22.00 $ 22.00 28% Majority Minority Diversified Equipment
Halliburton HAL Buy No $ 36,588 $ 42.58 $ 52.00 $ 52.00 22% Majority Minority Diversified Services & Equipment
Oil States OIS Buy No $ 1,691 $ 32.92 $ 45.00 $ 45.00 37% Mixed Mixed Offshore & Onshore Services & Equipment
Core Labs CLB Buy No $ 5,364 $122.25 $ 166.00 $ 166.00 36% Mixed Mixed Reservoir Analysis, Oilfield Consumables
Transocean RIG Buy Yes $ 3,597 $ 9.85 $ 19.00 $ 19.00 93% Mixed Mixed Offshore Driller
Frank's International FI Buy No $ 2,474 $ 15.92 $ 22.00 $ 22.00 38% Mixed Mixed Offshore Services & Equipment
Schlumberger SLB Buy No $ 107,361 $ 77.17 $ 106.00 $ 106.00 37% Minority Majority Diversified Services & Equipment, Subsea Equipment (CAM)
Ensco ESV Buy No $ 2,932 $ 9.73 $ 23.00 $ 22.00 136% Mixed Mixed Offshore Driller
Noble Corp. NE Buy No $ 2,058 $ 8.46 $ 20.00 $ 20.00 136% Mixed Mixed Offshore Driller
Patterson-UTI PTEN Buy No $ 2,741 $ 18.60 $ 27.00 $ 27.00 45% Majority -- Land Contract Driller
FMC Technologies FTI Buy No $ 6,112 $ 27.00 $ 43.00 $ 43.00 59% Mixed Mixed Offshore & Onshore Equipment
Rowan Companies RDC Buy No $ 2,118 $ 16.88 $ 25.00 $ 25.00 48% Mixed Mixed Offshore Driller
Helmerich & Payne HP Buy No $ 6,546 $ 60.59 $ 83.00 $ 83.00 37% Majority Minority Land Contract Driller
Atwood Oceanics ATW Buy Yes $ 684 $ 10.56 $ 16.00 $ 12.75 52% Mixed Mixed Offshore Driller
Diamond Offshore DO Buy No $ 3,446 $ 25.12 $ 33.00 $ 28.00 31% Mixed Mixed Offshore Driller
Flotek Industries FTK Buy No $ 634 $ 11.77 $ 15.00 $ 15.00 27% Majority Minority Oilfield Consumables
Newpark Resources NR Buy Yes $ 381 $ 4.53 $ 7.00 $ 7.00 55% Mixed Mixed Offshore & Onshore Services & Equipment
Weatherford WFT Accumulate Yes $ 4,980 $ 5.56 $ 7.25 $ 7.25 30% Mixed Mixed Diversified Services & Equipment
Dril-Quip DRQ Accumulate No $ 2,334 $ 61.49 $ 70.00 $ 70.00 14% Mixed Mixed Subsea Equipment, Rig Equipment
Oceaneering Intl OII Accumulate No $ 3,286 $ 33.51 $ 40.00 $ 40.00 19% Mixed Mixed Offshore Services & Equipment
US Silica SLCA Hold No $ 1,841 $ 28.99 $ 26.00 $ 26.00 (10%) Majority -- North American Proppant
Carbo Ceramics CRR Hold Yes $ 286 $ 12.20 $ 12.75 $ 12.75 5% Majority -- North American Proppant
Fairmount Santrol FMSA Hold Yes $ 867 $ 5.37 $ 3.90 $ 3.90 (27%) Majority -- North American Proppant
Seadrill SDRL Reduce Yes $ 1,639 $ 3.27 $ 3.00 $ 3.25 (8%) Mixed Mixed Offshore Driller
C&J Energy Services CJES Hold Yes $ 60 $ 0.50 $ 0.50 $ 0.50 0% Majority -- Pressure Pumping, Oilfield Services
Pacific Drilling PACD Hold Yes $ 86 $ 4.07 $ 8.65 $ 10.10 113% Mixed Mixed Offshore Driller
Top
Tie
rM
idd
le T
ier
Bo
tto
m T
ier
May 31, 2016 3
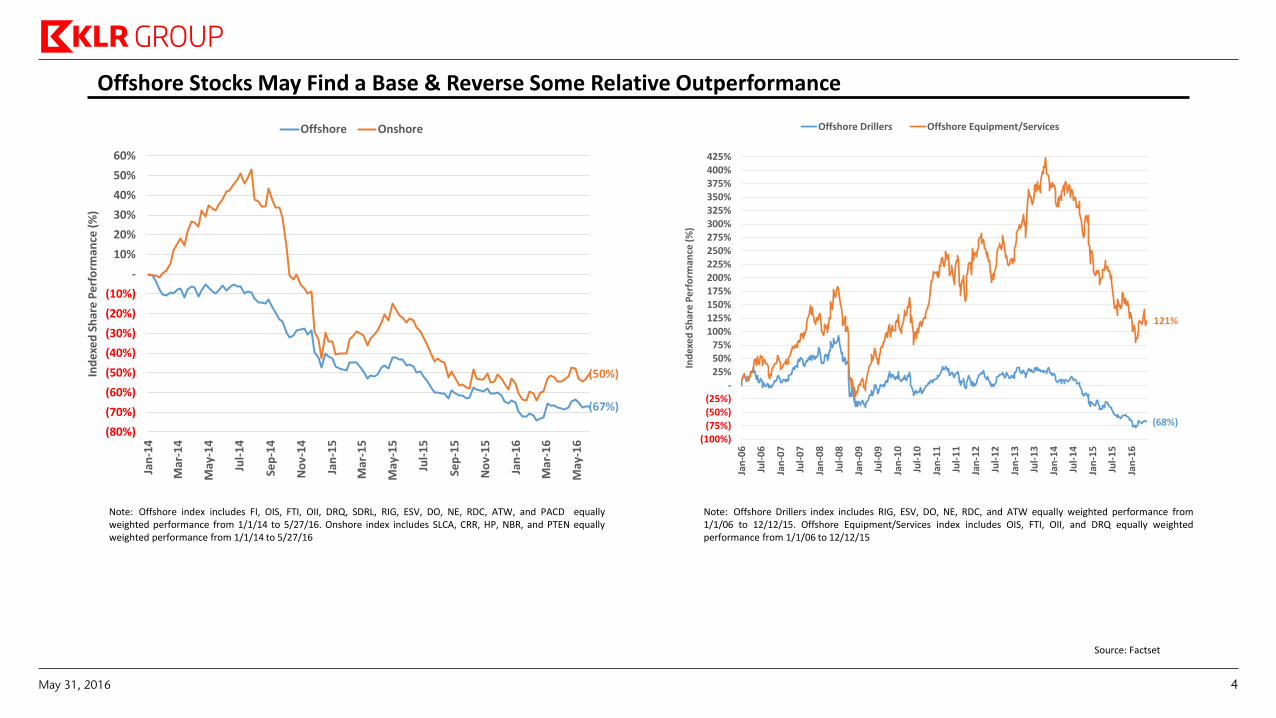
Offshore Stocks May Find a Base & Reverse Some Relative Outperformance
(68%)
121%
(100%) (75%) (50%) (25%)
-25%50%75%
100%125%150%175%200%225%250%275%300%325%350%375%400%425%
Jan
-06
Jul-
06
Jan
-07
Jul-
07
Jan
-08
Jul-
08
Jan
-09
Jul-
09
Jan
-10
Jul-
10
Jan
-11
Jul-
11
Jan
-12
Jul-
12
Jan
-13
Jul-
13
Jan
-14
Jul-
14
Jan
-15
Jul-
15
Jan
-16
Ind
exe
d S
har
e P
erf
orm
ance
(%
)
Offshore Drillers Offshore Equipment/Services
(67%)
(50%)
(80%)
(70%)
(60%)
(50%)
(40%)
(30%)
(20%)
(10%)
-
10%
20%
30%
40%
50%
60%Ja
n-1
4
Mar
-14
May
-14
Jul-
14
Sep
-14
No
v-1
4
Jan
-15
Mar
-15
May
-15
Jul-
15
Sep
-15
No
v-1
5
Jan
-16
Mar
-16
May
-16
Ind
exe
d S
har
e P
erf
orm
ance
(%
)
Offshore Onshore
Note: Offshore index includes FI, OIS, FTI, OII, DRQ, SDRL, RIG, ESV, DO, NE, RDC, ATW, and PACD equally weighted performance from 1/1/14 to 5/27/16. Onshore index includes SLCA, CRR, HP, NBR, and PTEN equally weighted performance from 1/1/14 to 5/27/16
Source: Factset
Note: Offshore Drillers index includes RIG, ESV, DO, NE, RDC, and ATW equally weighted performance from 1/1/06 to 12/12/15. Offshore Equipment/Services index includes OIS, FTI, OII, and DRQ equally weighted performance from 1/1/06 to 12/12/15
May 31, 2016 4
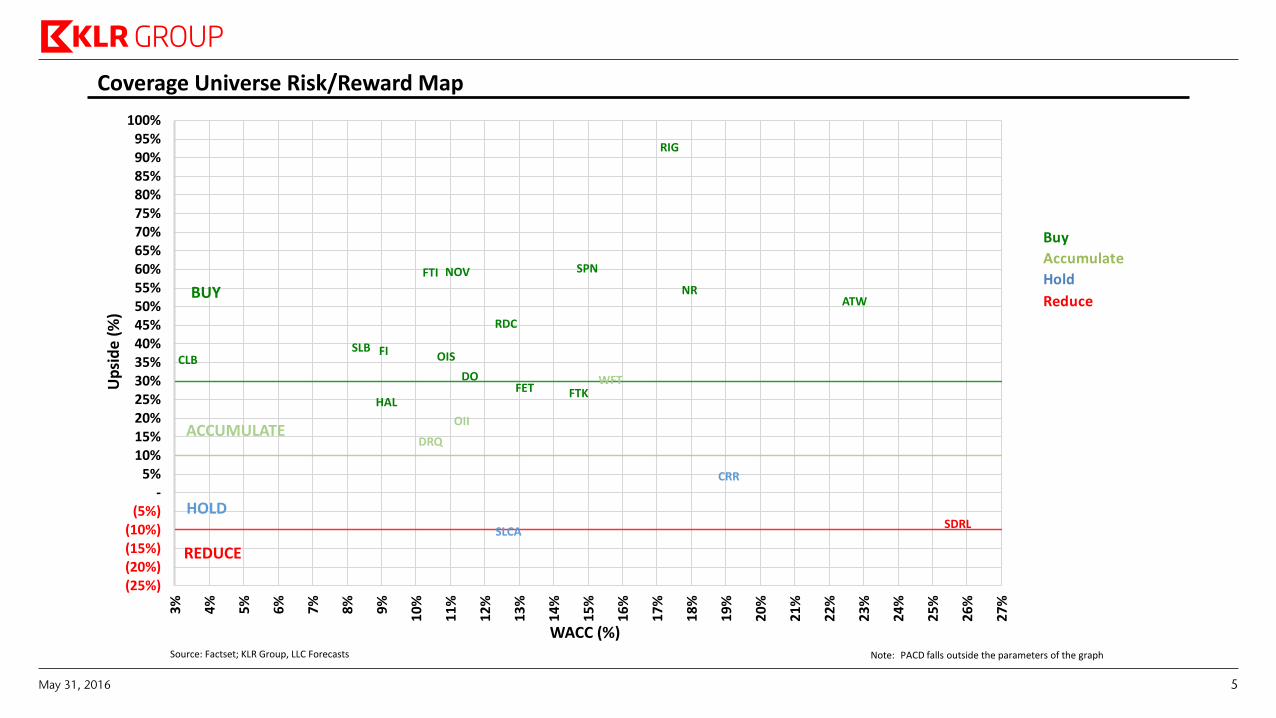
Coverage Universe Risk/Reward Map
Source: Factset; KLR Group, LLC Forecasts
Buy
Accumulate
Hold
Reduce
Note: PACD falls outside the parameters of the graph
ACCUMULATE
BUY
SLB
HAL
CLBFI
NR
OIS
FTK
NOVFTI
FET
RIG
DO
RDC
ATW
SPN
WFT
OII
DRQ
SLCA
CRR
SDRL
HOLD
REDUCE
(25%)(20%)(15%)(10%)
(5%)-
5%10%15%20%25%30%35%40%45%50%55%60%65%70%75%80%85%90%95%
100%
3%
4%
5%
6%
7%
8%
9%
10
%
11
%
12
%
13
%
14
%
15
%
16
%
17
%
18
%
19
%
20
%
21
%
22
%
23
%
24
%
25
%
26
%
27
%
Up
sid
e (
%)
WACC (%)
May 31, 2016 5
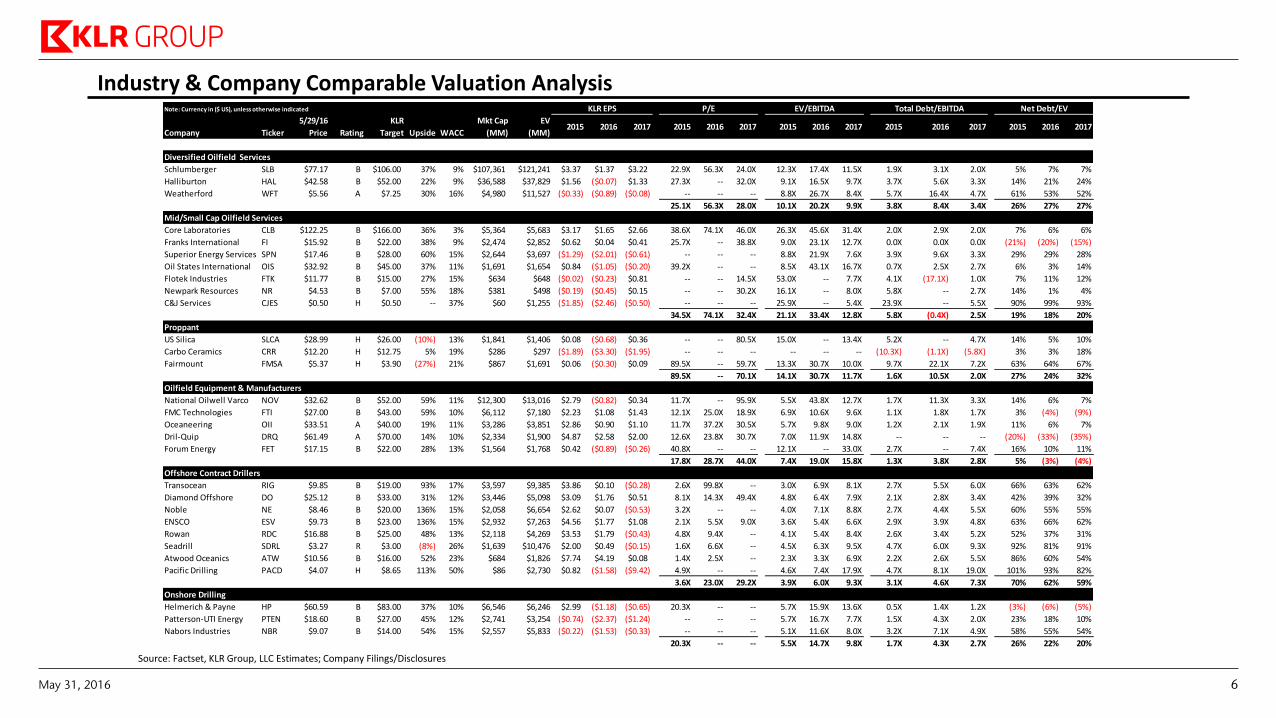
Industry & Company Comparable Valuation Analysis
Source: Factset, KLR Group, LLC Estimates; Company Filings/Disclosures
Note: Currency in ($ US), unless otherwise indicated
Company Ticker
5/29/16
Price Rating
KLR
Target Upside WACC
Mkt Cap
(MM)
EV
(MM)2015 2016 2017 2015 2016 2017 2015 2016 2017 2015 2016 2017 2015 2016 2017
Diversified Oilfield Services
Schlumberger SLB $77.17 B $106.00 37% 9% $107,361 $121,241 $3.37 $1.37 $3.22 22.9X 56.3X 24.0X 12.3X 17.4X 11.5X 1.9X 3.1X 2.0X 5% 7% 7%
Halliburton HAL $42.58 B $52.00 22% 9% $36,588 $37,829 $1.56 ($0.07) $1.33 27.3X -- 32.0X 9.1X 16.5X 9.7X 3.7X 5.6X 3.3X 14% 21% 24%
Weatherford WFT $5.56 A $7.25 30% 16% $4,980 $11,527 ($0.33) ($0.89) ($0.08) -- -- -- 8.8X 26.7X 8.4X 5.7X 16.4X 4.7X 61% 53% 52%
25.1X 56.3X 28.0X 10.1X 20.2X 9.9X 3.8X 8.4X 3.4X 26% 27% 27%
Mid/Small Cap Oilfield Services
Core Laboratories CLB $122.25 B $166.00 36% 3% $5,364 $5,683 $3.17 $1.65 $2.66 38.6X 74.1X 46.0X 26.3X 45.6X 31.4X 2.0X 2.9X 2.0X 7% 6% 6%
Franks International FI $15.92 B $22.00 38% 9% $2,474 $2,852 $0.62 $0.04 $0.41 25.7X -- 38.8X 9.0X 23.1X 12.7X 0.0X 0.0X 0.0X (21%) (20%) (15%)
Superior Energy Services SPN $17.46 B $28.00 60% 15% $2,644 $3,697 ($1.29) ($2.01) ($0.61) -- -- -- 8.8X 21.9X 7.6X 3.9X 9.6X 3.3X 29% 29% 28%
Oil States International OIS $32.92 B $45.00 37% 11% $1,691 $1,654 $0.84 ($1.05) ($0.20) 39.2X -- -- 8.5X 43.1X 16.7X 0.7X 2.5X 2.7X 6% 3% 14%
Flotek Industries FTK $11.77 B $15.00 27% 15% $634 $648 ($0.02) ($0.23) $0.81 -- -- 14.5X 53.0X -- 7.7X 4.1X (17.1X) 1.0X 7% 11% 12%
Newpark Resources NR $4.53 B $7.00 55% 18% $381 $498 ($0.19) ($0.45) $0.15 -- -- 30.2X 16.1X -- 8.0X 5.8X -- 2.7X 14% 1% 4%
C&J Services CJES $0.50 H $0.50 -- 37% $60 $1,255 ($1.85) ($2.46) ($0.50) -- -- -- 25.9X -- 5.4X 23.9X -- 5.5X 90% 99% 93%
34.5X 74.1X 32.4X 21.1X 33.4X 12.8X 5.8X (0.4X) 2.5X 19% 18% 20%
Proppant
US Silica SLCA $28.99 H $26.00 (10%) 13% $1,841 $1,406 $0.08 ($0.68) $0.36 -- -- 80.5X 15.0X -- 13.4X 5.2X -- 4.7X 14% 5% 10%
Carbo Ceramics CRR $12.20 H $12.75 5% 19% $286 $297 ($1.89) ($3.30) ($1.95) -- -- -- -- -- -- (10.3X) (1.1X) (5.8X) 3% 3% 18%
Fairmount FMSA $5.37 H $3.90 (27%) 21% $867 $1,691 $0.06 ($0.30) $0.09 89.5X -- 59.7X 13.3X 30.7X 10.0X 9.7X 22.1X 7.2X 63% 64% 67%
89.5X -- 70.1X 14.1X 30.7X 11.7X 1.6X 10.5X 2.0X 27% 24% 32%
Oilfield Equipment & Manufacturers
National Oilwell Varco NOV $32.62 B $52.00 59% 11% $12,300 $13,016 $2.79 ($0.82) $0.34 11.7X -- 95.9X 5.5X 43.8X 12.7X 1.7X 11.3X 3.3X 14% 6% 7%
FMC Technologies FTI $27.00 B $43.00 59% 10% $6,112 $7,180 $2.23 $1.08 $1.43 12.1X 25.0X 18.9X 6.9X 10.6X 9.6X 1.1X 1.8X 1.7X 3% (4%) (9%)
Oceaneering OII $33.51 A $40.00 19% 11% $3,286 $3,851 $2.86 $0.90 $1.10 11.7X 37.2X 30.5X 5.7X 9.8X 9.0X 1.2X 2.1X 1.9X 11% 6% 7%
Dril-Quip DRQ $61.49 A $70.00 14% 10% $2,334 $1,900 $4.87 $2.58 $2.00 12.6X 23.8X 30.7X 7.0X 11.9X 14.8X -- -- -- (20%) (33%) (35%)
Forum Energy FET $17.15 B $22.00 28% 13% $1,564 $1,768 $0.42 ($0.89) ($0.26) 40.8X -- -- 12.1X -- 33.0X 2.7X -- 7.4X 16% 10% 11%
17.8X 28.7X 44.0X 7.4X 19.0X 15.8X 1.3X 3.8X 2.8X 5% (3%) (4%)
Offshore Contract Drillers
Transocean RIG $9.85 B $19.00 93% 17% $3,597 $9,385 $3.86 $0.10 ($0.28) 2.6X 99.8X -- 3.0X 6.9X 8.1X 2.7X 5.5X 6.0X 66% 63% 62%
Diamond Offshore DO $25.12 B $33.00 31% 12% $3,446 $5,098 $3.09 $1.76 $0.51 8.1X 14.3X 49.4X 4.8X 6.4X 7.9X 2.1X 2.8X 3.4X 42% 39% 32%
Noble NE $8.46 B $20.00 136% 15% $2,058 $6,654 $2.62 $0.07 ($0.53) 3.2X -- -- 4.0X 7.1X 8.8X 2.7X 4.4X 5.5X 60% 55% 55%
ENSCO ESV $9.73 B $23.00 136% 15% $2,932 $7,263 $4.56 $1.77 $1.08 2.1X 5.5X 9.0X 3.6X 5.4X 6.6X 2.9X 3.9X 4.8X 63% 66% 62%
Rowan RDC $16.88 B $25.00 48% 13% $2,118 $4,269 $3.53 $1.79 ($0.43) 4.8X 9.4X -- 4.1X 5.4X 8.4X 2.6X 3.4X 5.2X 52% 37% 31%
Seadrill SDRL $3.27 R $3.00 (8%) 26% $1,639 $10,476 $2.00 $0.49 ($0.15) 1.6X 6.6X -- 4.5X 6.3X 9.5X 4.7X 6.0X 9.3X 92% 81% 91%
Atwood Oceanics ATW $10.56 B $16.00 52% 23% $684 $1,826 $7.74 $4.19 $0.08 1.4X 2.5X -- 2.3X 3.3X 6.9X 2.2X 2.6X 5.5X 86% 60% 54%
Pacific Drilling PACD $4.07 H $8.65 113% 50% $86 $2,730 $0.82 ($1.58) ($9.42) 4.9X -- -- 4.6X 7.4X 17.9X 4.7X 8.1X 19.0X 101% 93% 82%
3.6X 23.0X 29.2X 3.9X 6.0X 9.3X 3.1X 4.6X 7.3X 70% 62% 59%
Onshore Drilling
Helmerich & Payne HP $60.59 B $83.00 37% 10% $6,546 $6,246 $2.99 ($1.18) ($0.65) 20.3X -- -- 5.7X 15.9X 13.6X 0.5X 1.4X 1.2X (3%) (6%) (5%)
Patterson-UTI Energy PTEN $18.60 B $27.00 45% 12% $2,741 $3,254 ($0.74) ($2.37) ($1.24) -- -- -- 5.7X 16.7X 7.7X 1.5X 4.3X 2.0X 23% 18% 10%
Nabors Industries NBR $9.07 B $14.00 54% 15% $2,557 $5,833 ($0.22) ($1.53) ($0.33) -- -- -- 5.1X 11.6X 8.0X 3.2X 7.1X 4.9X 58% 55% 54%
20.3X -- -- 5.5X 14.7X 9.8X 1.7X 4.3X 2.7X 26% 22% 20%
KLR EPS P/E EV/EBITDA Total Debt/EBITDA Net Debt/EV
May 31, 2016 6
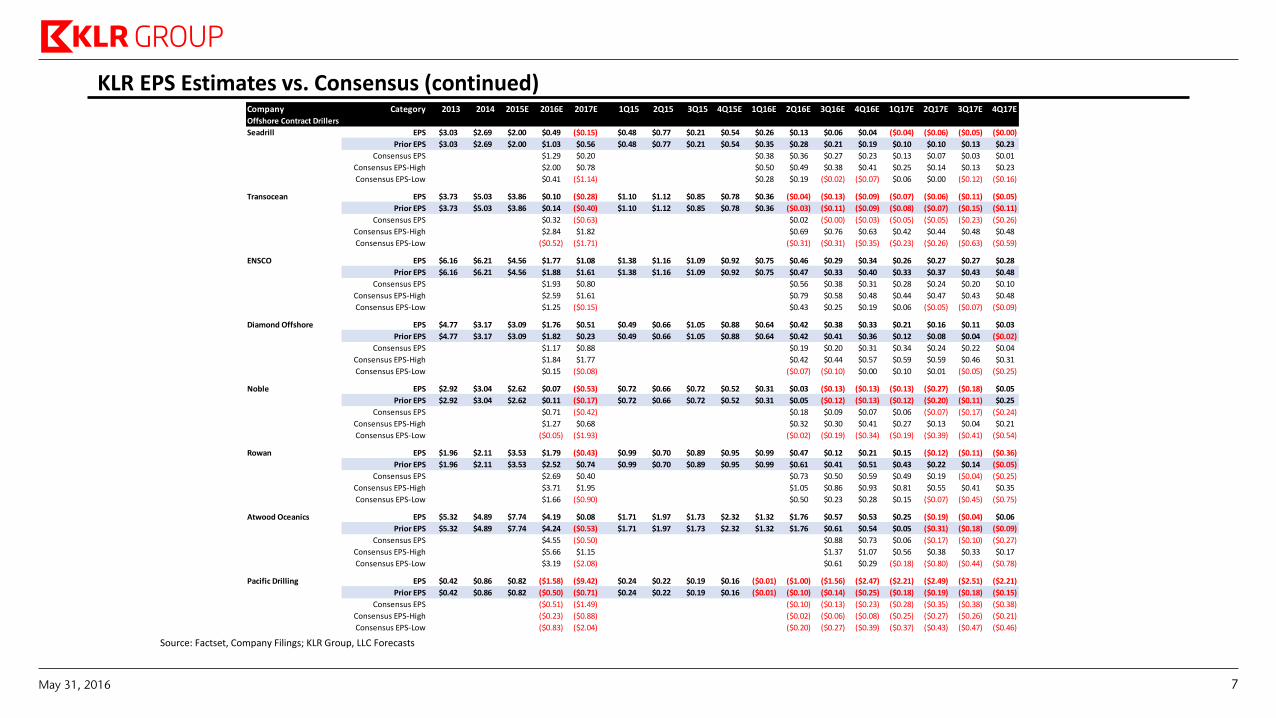
KLR EPS Estimates vs. Consensus (continued)
Source: Factset, Company Filings; KLR Group, LLC Forecasts
Company Category 2013 2014 2015E 2016E 2017E 1Q15 2Q15 3Q15 4Q15E 1Q16E 2Q16E 3Q16E 4Q16E 1Q17E 2Q17E 3Q17E 4Q17EOffshore Contract Drillers
Seadrill EPS $3.03 $2.69 $2.00 $0.49 ($0.15) $0.48 $0.77 $0.21 $0.54 $0.26 $0.13 $0.06 $0.04 ($0.04) ($0.06) ($0.05) ($0.00)
Prior EPS $3.03 $2.69 $2.00 $1.03 $0.56 $0.48 $0.77 $0.21 $0.54 $0.35 $0.28 $0.21 $0.19 $0.10 $0.10 $0.13 $0.23
Consensus EPS $1.29 $0.20 $0.38 $0.36 $0.27 $0.23 $0.13 $0.07 $0.03 $0.01
Consensus EPS-High $2.00 $0.78 $0.50 $0.49 $0.38 $0.41 $0.25 $0.14 $0.13 $0.23
Consensus EPS-Low $0.41 ($1.14) $0.28 $0.19 ($0.02) ($0.07) $0.06 $0.00 ($0.12) ($0.16)
Transocean EPS $3.73 $5.03 $3.86 $0.10 ($0.28) $1.10 $1.12 $0.85 $0.78 $0.36 ($0.04) ($0.13) ($0.09) ($0.07) ($0.06) ($0.11) ($0.05)
Prior EPS $3.73 $5.03 $3.86 $0.14 ($0.40) $1.10 $1.12 $0.85 $0.78 $0.36 ($0.03) ($0.11) ($0.09) ($0.08) ($0.07) ($0.15) ($0.11)
Consensus EPS $0.32 ($0.63) $0.02 ($0.00) ($0.03) ($0.05) ($0.05) ($0.23) ($0.26)
Consensus EPS-High $2.84 $1.82 $0.69 $0.76 $0.63 $0.42 $0.44 $0.48 $0.48
Consensus EPS-Low ($0.52) ($1.71) ($0.31) ($0.31) ($0.35) ($0.23) ($0.26) ($0.63) ($0.59)
ENSCO EPS $6.16 $6.21 $4.56 $1.77 $1.08 $1.38 $1.16 $1.09 $0.92 $0.75 $0.46 $0.29 $0.34 $0.26 $0.27 $0.27 $0.28
Prior EPS $6.16 $6.21 $4.56 $1.88 $1.61 $1.38 $1.16 $1.09 $0.92 $0.75 $0.47 $0.33 $0.40 $0.33 $0.37 $0.43 $0.48
Consensus EPS $1.93 $0.80 $0.56 $0.38 $0.31 $0.28 $0.24 $0.20 $0.10
Consensus EPS-High $2.59 $1.61 $0.79 $0.58 $0.48 $0.44 $0.47 $0.43 $0.48
Consensus EPS-Low $1.25 ($0.15) $0.43 $0.25 $0.19 $0.06 ($0.05) ($0.07) ($0.09)
Diamond Offshore EPS $4.77 $3.17 $3.09 $1.76 $0.51 $0.49 $0.66 $1.05 $0.88 $0.64 $0.42 $0.38 $0.33 $0.21 $0.16 $0.11 $0.03
Prior EPS $4.77 $3.17 $3.09 $1.82 $0.23 $0.49 $0.66 $1.05 $0.88 $0.64 $0.42 $0.41 $0.36 $0.12 $0.08 $0.04 ($0.02)
Consensus EPS $1.17 $0.88 $0.19 $0.20 $0.31 $0.34 $0.24 $0.22 $0.04
Consensus EPS-High $1.84 $1.77 $0.42 $0.44 $0.57 $0.59 $0.59 $0.46 $0.31
Consensus EPS-Low $0.15 ($0.08) ($0.07) ($0.10) $0.00 $0.10 $0.01 ($0.05) ($0.25)
Noble EPS $2.92 $3.04 $2.62 $0.07 ($0.53) $0.72 $0.66 $0.72 $0.52 $0.31 $0.03 ($0.13) ($0.13) ($0.13) ($0.27) ($0.18) $0.05
Prior EPS $2.92 $3.04 $2.62 $0.11 ($0.17) $0.72 $0.66 $0.72 $0.52 $0.31 $0.05 ($0.12) ($0.13) ($0.12) ($0.20) ($0.11) $0.25
Consensus EPS $0.71 ($0.42) $0.18 $0.09 $0.07 $0.06 ($0.07) ($0.17) ($0.24)
Consensus EPS-High $1.27 $0.68 $0.32 $0.30 $0.41 $0.27 $0.13 $0.04 $0.21
Consensus EPS-Low ($0.05) ($1.93) ($0.02) ($0.19) ($0.34) ($0.19) ($0.39) ($0.41) ($0.54)
Rowan EPS $1.96 $2.11 $3.53 $1.79 ($0.43) $0.99 $0.70 $0.89 $0.95 $0.99 $0.47 $0.12 $0.21 $0.15 ($0.12) ($0.11) ($0.36)
Prior EPS $1.96 $2.11 $3.53 $2.52 $0.74 $0.99 $0.70 $0.89 $0.95 $0.99 $0.61 $0.41 $0.51 $0.43 $0.22 $0.14 ($0.05)
Consensus EPS $2.69 $0.40 $0.73 $0.50 $0.59 $0.49 $0.19 ($0.04) ($0.25)
Consensus EPS-High $3.71 $1.95 $1.05 $0.86 $0.93 $0.81 $0.55 $0.41 $0.35
Consensus EPS-Low $1.66 ($0.90) $0.50 $0.23 $0.28 $0.15 ($0.07) ($0.45) ($0.75)
Atwood Oceanics EPS $5.32 $4.89 $7.74 $4.19 $0.08 $1.71 $1.97 $1.73 $2.32 $1.32 $1.76 $0.57 $0.53 $0.25 ($0.19) ($0.04) $0.06
Prior EPS $5.32 $4.89 $7.74 $4.24 ($0.53) $1.71 $1.97 $1.73 $2.32 $1.32 $1.76 $0.61 $0.54 $0.05 ($0.31) ($0.18) ($0.09)
Consensus EPS $4.55 ($0.50) $0.88 $0.73 $0.06 ($0.17) ($0.10) ($0.27)
Consensus EPS-High $5.66 $1.15 $1.37 $1.07 $0.56 $0.38 $0.33 $0.17
Consensus EPS-Low $3.19 ($2.08) $0.61 $0.29 ($0.18) ($0.80) ($0.44) ($0.78)
Pacific Drilling EPS $0.42 $0.86 $0.82 ($1.58) ($9.42) $0.24 $0.22 $0.19 $0.16 ($0.01) ($1.00) ($1.56) ($2.47) ($2.21) ($2.49) ($2.51) ($2.21)
Prior EPS $0.42 $0.86 $0.82 ($0.50) ($0.71) $0.24 $0.22 $0.19 $0.16 ($0.01) ($0.10) ($0.14) ($0.25) ($0.18) ($0.19) ($0.18) ($0.15)
Consensus EPS ($0.51) ($1.49) ($0.10) ($0.13) ($0.23) ($0.28) ($0.35) ($0.38) ($0.38)
Consensus EPS-High ($0.23) ($0.88) ($0.02) ($0.06) ($0.08) ($0.25) ($0.27) ($0.26) ($0.21)
Consensus EPS-Low ($0.83) ($2.04) ($0.20) ($0.27) ($0.39) ($0.37) ($0.43) ($0.47) ($0.46)
May 31, 2016 7
RIG
DO
NE
ESV
RDC
SDRL
ATW
PACD
0%
10%
20%
30%
40%
50%
60%
70%
80%
90%
100%
15% 20% 25% 30% 35% 40% 45% 50%
Net
De
bt
/ EV
Net Debt / Capital
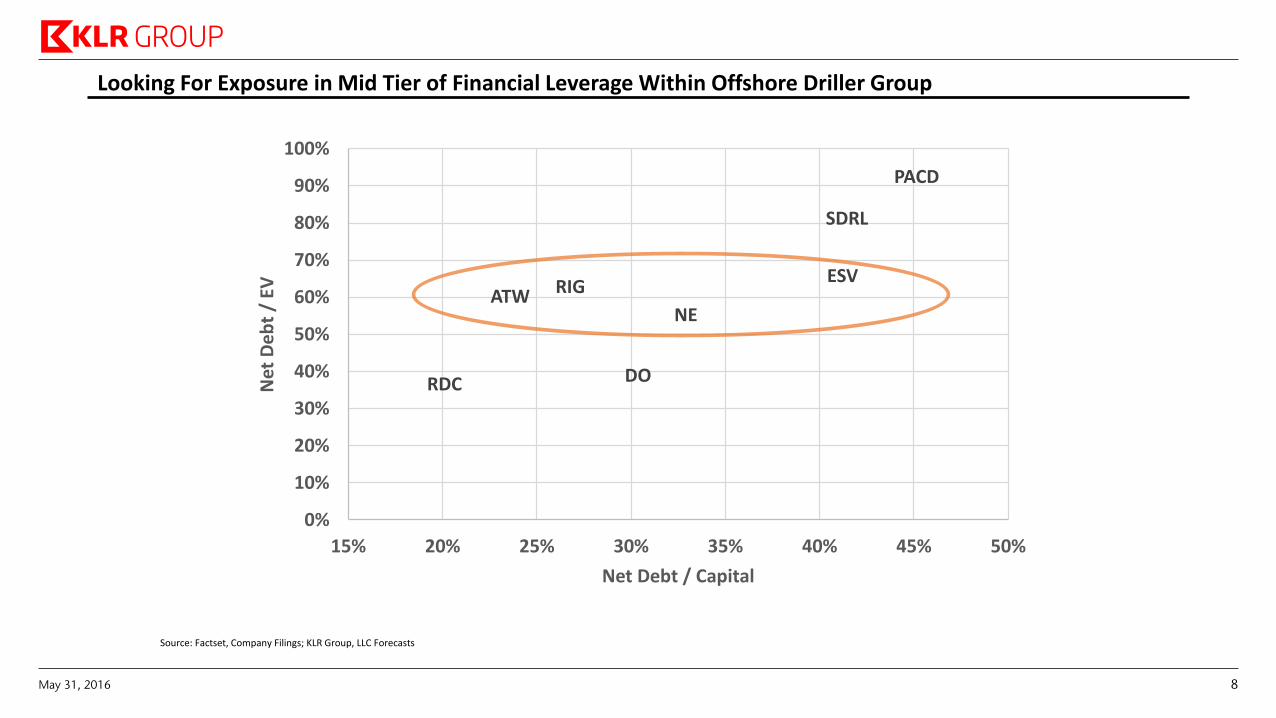
Looking For Exposure in Mid Tier of Financial Leverage Within Offshore Driller Group
Source: Factset, Company Filings; KLR Group, LLC Forecasts
May 31, 2016 8
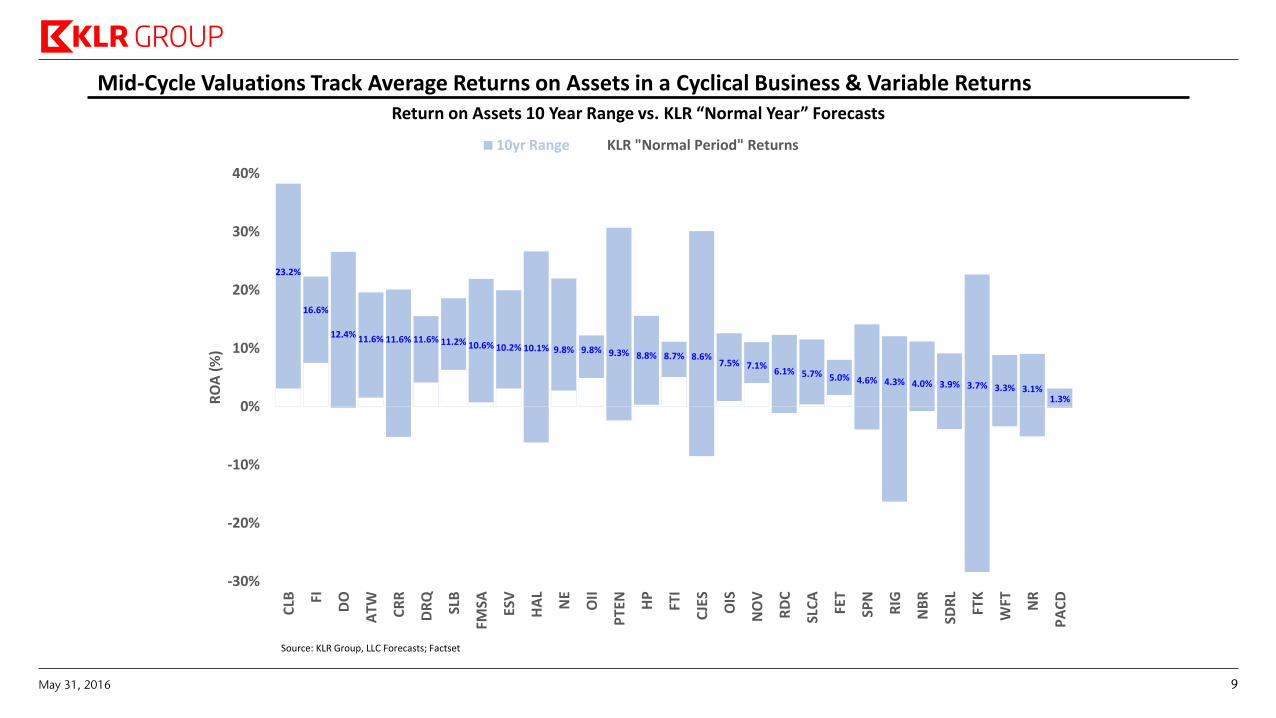
Mid-Cycle Valuations Track Average Returns on Assets in a Cyclical Business & Variable Returns
Source: KLR Group, LLC Forecasts; Factset
Return on Assets 10 Year Range vs. KLR “Normal Year” Forecasts
23.2%
16.6%
12.4% 11.6% 11.6% 11.6% 11.2% 10.6% 10.2% 10.1% 9.8% 9.8% 9.3% 8.8% 8.7% 8.6%7.5% 7.1%
6.1% 5.7% 5.0% 4.6% 4.3% 4.0% 3.9% 3.7% 3.3% 3.1%1.3%
-30%
-20%
-10%
0%
10%
20%
30%
40%
CLB FI
DO
ATW CR
R
DR
Q
SLB
FMSA ES
V
HA
L
NE
OII
PTE
N
HP
FTI
CJE
S
OIS
NO
V
RD
C
SLC
A
FET
SPN
RIG
NB
R
SDR
L
FTK
WFT NR
PA
CD
RO
A (
%)
10yr Range KLR "Normal Period" Returns
May 31, 2016 9
Potential Upside from De-Risking & Re-Rating
May 31, 2016 10
$37
$82
$57
$119
$52
$25
$193
$97
$57
$44
$31
$34
$50
$22
$32
$11
$75
$24
$33
$48
$16
$14
$32
$41
$41
$56
$29
$100
$14
$-
$1
0
$2
0
$3
0
$4
0
$5
0
$6
0
$7
0
$8
0
$9
0
$1
00
$1
10
$1
20
$1
30
$1
40
$1
50
$1
60
$1
70
$1
80
$1
90
$2
00
$2
10
SLCA
DRQ
HAL
SLB
OII
FI
CLB
HP
OIS
DO
FET
PTEN
FTI
FTK
RDC
FMSA
NOV
NBR
CRR
SPN
WFT
NR
NE
ESV
RIG
ATW
SDRL
PACD
CJES
Target Unrisked
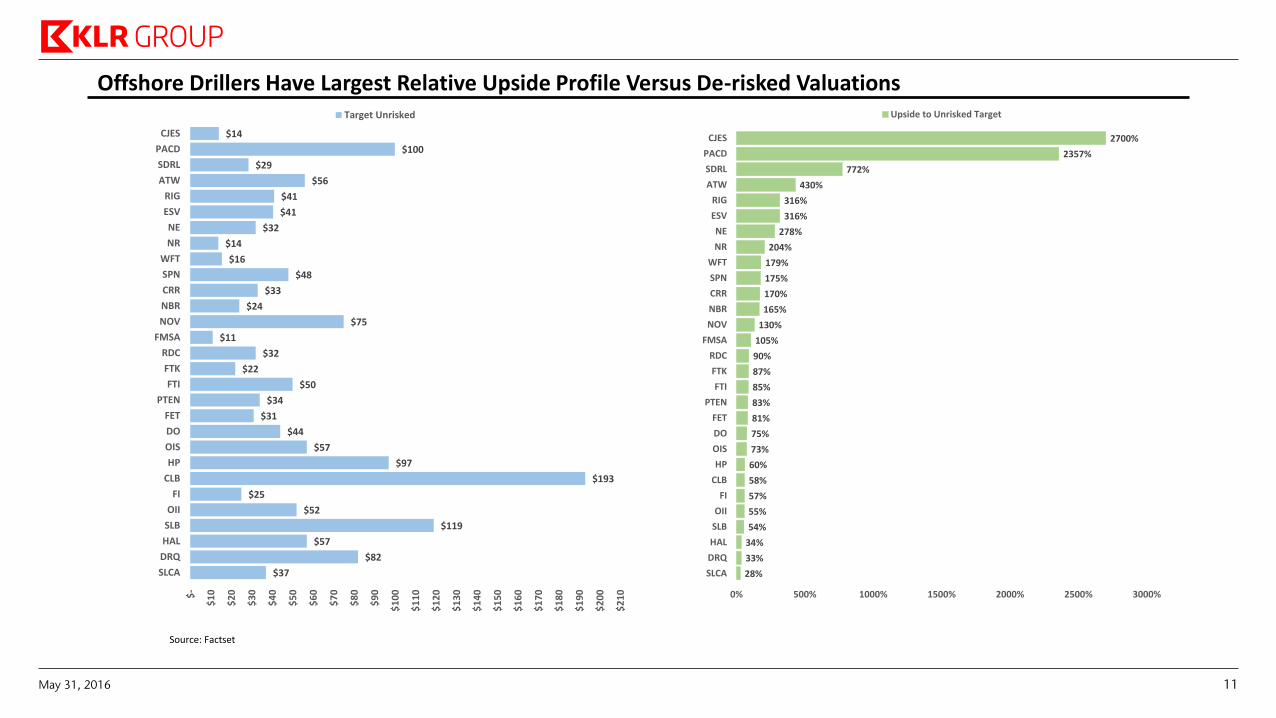
Offshore Drillers Have Largest Relative Upside Profile Versus De-risked Valuations
Source: Factset
28%
33%
34%
54%
55%
57%
58%
60%
73%
75%
81%
83%
85%
87%
90%
105%
130%
165%
170%
175%
179%
204%
278%
316%
316%
430%
772%
2357%
2700%
0% 500% 1000% 1500% 2000% 2500% 3000%
SLCA
DRQ
HAL
SLB
OII
FI
CLB
HP
OIS
DO
FET
PTEN
FTI
FTK
RDC
FMSA
NOV
NBR
CRR
SPN
WFT
NR
NE
ESV
RIG
ATW
SDRL
PACD
CJES
Upside to Unrisked Target
May 31, 2016 11
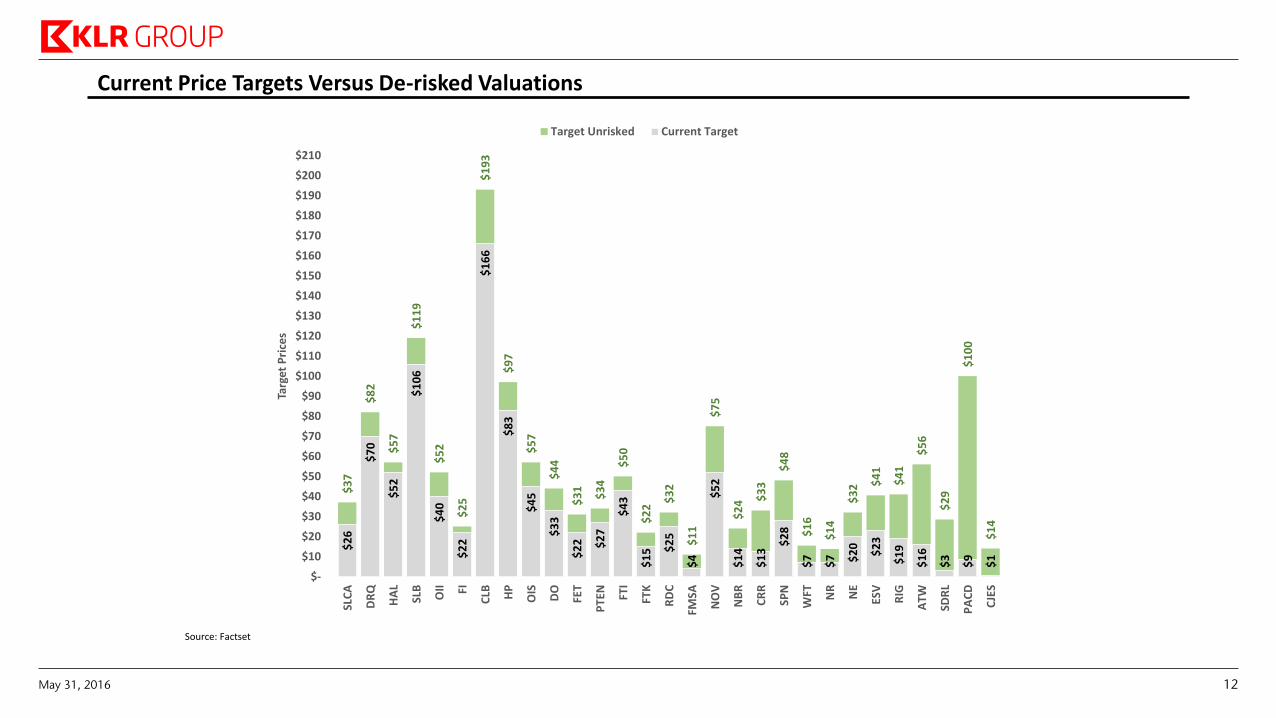
Current Price Targets Versus De-risked Valuations
Source: Factset
$3
7
$8
2
$5
7
$1
19
$5
2
$2
5
$1
93
$9
7
$5
7
$4
4
$3
1
$3
4
$5
0
$2
2 $
32
$1
1
$7
5
$2
4 $3
3
$4
8
$1
6
$1
4
$3
2 $4
1
$4
1
$5
6
$2
9
$1
00
$1
4
$2
6
$7
0
$5
2
$1
06
$4
0
$2
2
$1
66
$8
3
$4
5
$3
3
$2
2
$2
7
$4
3
$1
5 $2
5
$4
$5
2
$1
4
$1
3 $
28
$7
$7
$2
0
$2
3
$1
9
$1
6
$3
$9
$1
$-
$10
$20
$30
$40
$50
$60
$70
$80
$90
$100
$110
$120
$130
$140
$150
$160
$170
$180
$190
$200
$210
SLC
A
DR
Q
HA
L
SLB
OII FI
CLB HP
OIS
DO
FET
PTE
N
FTI
FTK
RD
C
FMSA
NO
V
NB
R
CR
R
SPN
WFT NR
NE
ESV
RIG
ATW
SDR
L
PA
CD
CJE
S
Targ
et P
rice
s
Target Unrisked Current Target
May 31, 2016 12
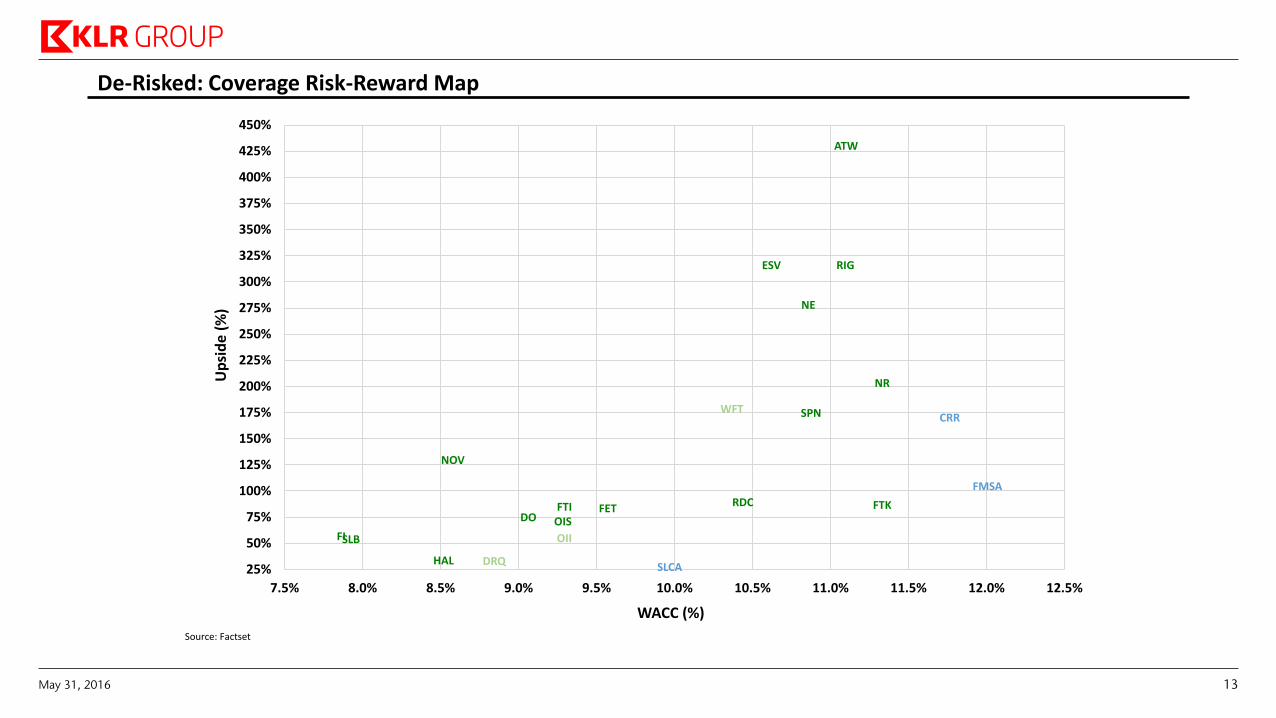
De-Risked: Coverage Risk-Reward Map
Source: Factset
HAL
SLB FI OISDO
FET FTI FTKRDC
NOV
SPN
NR
NE
ESV RIG
ATW
DRQ
OII
WFT
SLCA
FMSA
CRR
25%
50%
75%
100%
125%
150%
175%
200%
225%
250%
275%
300%
325%
350%
375%
400%
425%
450%
7.5% 8.0% 8.5% 9.0% 9.5% 10.0% 10.5% 11.0% 11.5% 12.0% 12.5%
Up
sid
e (
%)
WACC (%)
May 31, 2016 13
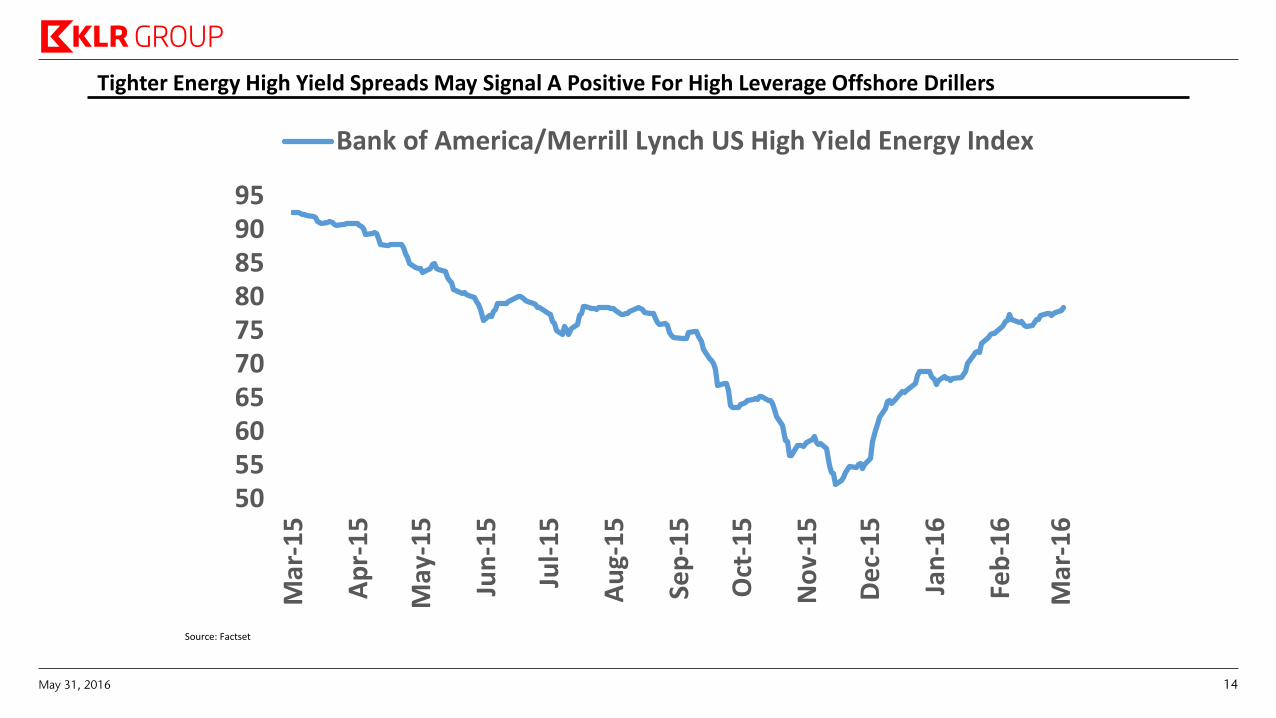
Tighter Energy High Yield Spreads May Signal A Positive For High Leverage Offshore Drillers
Source: Factset
50556065707580859095
Mar
-15
Ap
r-1
5
May
-15
Jun
-15
Jul-
15
Au
g-1
5
Sep
-15
Oct
-15
No
v-1
5
Dec
-15
Jan
-16
Feb
-16
Mar
-16
Bank of America/Merrill Lynch US High Yield Energy Index
May 31, 2016 14
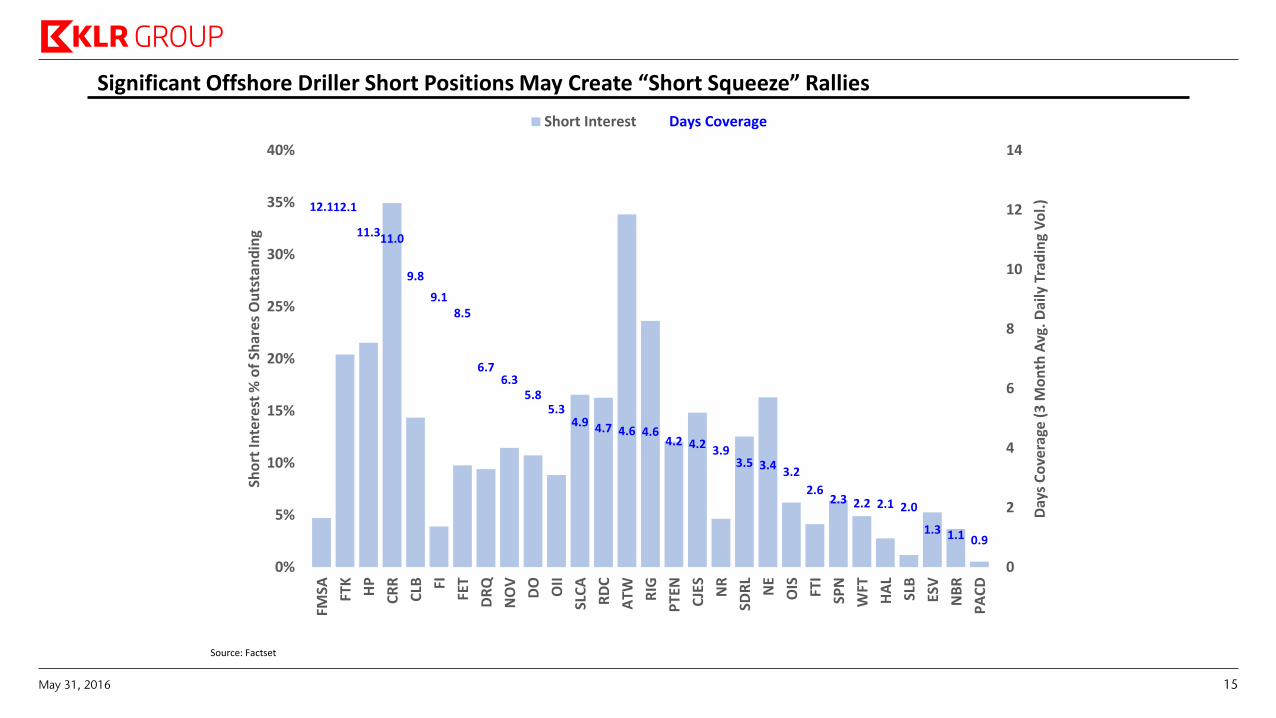
Significant Offshore Driller Short Positions May Create “Short Squeeze” Rallies
Source: Factset
12.1 12.1
11.3 11.0
9.8
9.1 8.5
6.7 6.3
5.8 5.3
4.9 4.7 4.6 4.6 4.2 4.2 3.9
3.5 3.4 3.2
2.6 2.3 2.2 2.1 2.0
1.3 1.1 0.9
0
2
4
6
8
10
12
14
0%
5%
10%
15%
20%
25%
30%
35%
40%
FMSA FT
K
HP
CR
R
CLB FI
FET
DR
Q
NO
V
DO
OII
SLC
A
RD
C
ATW R
IG
PTE
N
CJE
S
NR
SDR
L
NE
OIS FT
I
SPN
WFT
HA
L
SLB
ESV
NB
R
PA
CD
Day
s C
ove
rage
(3
Mo
nth
Avg
. Dai
ly T
rad
ing
Vo
l.)
Sho
rt In
tere
st %
of
Shar
es
Ou
tsta
nd
ing
Short Interest Days Coverage
May 31, 2016 15
Commodity & Macro Drivers
May 31, 2016 16
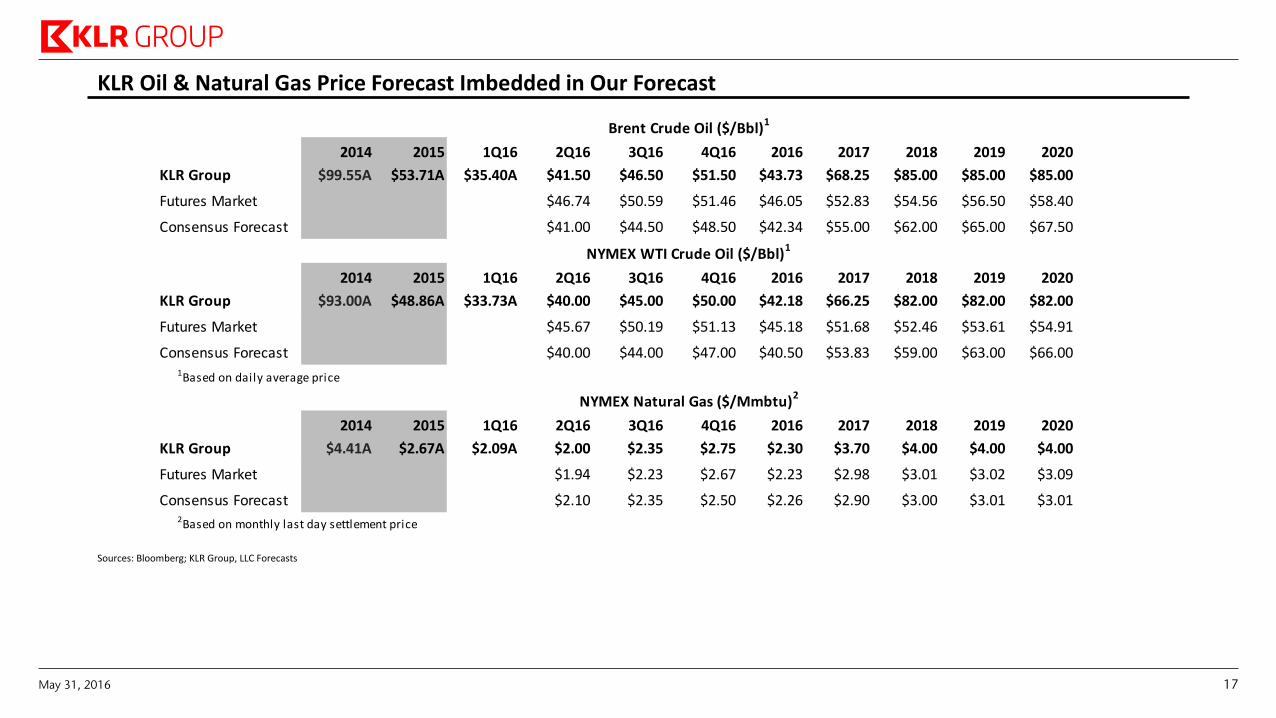
KLR Oil & Natural Gas Price Forecast Imbedded in Our Forecast
Sources: Bloomberg; KLR Group, LLC Forecasts
2014 2015 1Q16 2Q16 3Q16 4Q16 2016 2017 2018 2019 2020
KLR Group $99.55A $53.71A $35.40A $41.50 $46.50 $51.50 $43.73 $68.25 $85.00 $85.00 $85.00
Futures Market $46.74 $50.59 $51.46 $46.05 $52.83 $54.56 $56.50 $58.40
Consensus Forecast $41.00 $44.50 $48.50 $42.34 $55.00 $62.00 $65.00 $67.50
2014 2015 1Q16 2Q16 3Q16 4Q16 2016 2017 2018 2019 2020
KLR Group $93.00A $48.86A $33.73A $40.00 $45.00 $50.00 $42.18 $66.25 $82.00 $82.00 $82.00
Futures Market $45.67 $50.19 $51.13 $45.18 $51.68 $52.46 $53.61 $54.91
Consensus Forecast $40.00 $44.00 $47.00 $40.50 $53.83 $59.00 $63.00 $66.001Based on daily average price
2014 2015 1Q16 2Q16 3Q16 4Q16 2016 2017 2018 2019 2020
KLR Group $4.41A $2.67A $2.09A $2.00 $2.35 $2.75 $2.30 $3.70 $4.00 $4.00 $4.00
Futures Market $1.94 $2.23 $2.67 $2.23 $2.98 $3.01 $3.02 $3.09
Consensus Forecast $2.10 $2.35 $2.50 $2.26 $2.90 $3.00 $3.01 $3.012Based on monthly last day settlement price
NYMEX WTI Crude Oil ($/Bbl)1
Brent Crude Oil ($/Bbl)1
NYMEX Natural Gas ($/Mmbtu)2
May 31, 2016 17
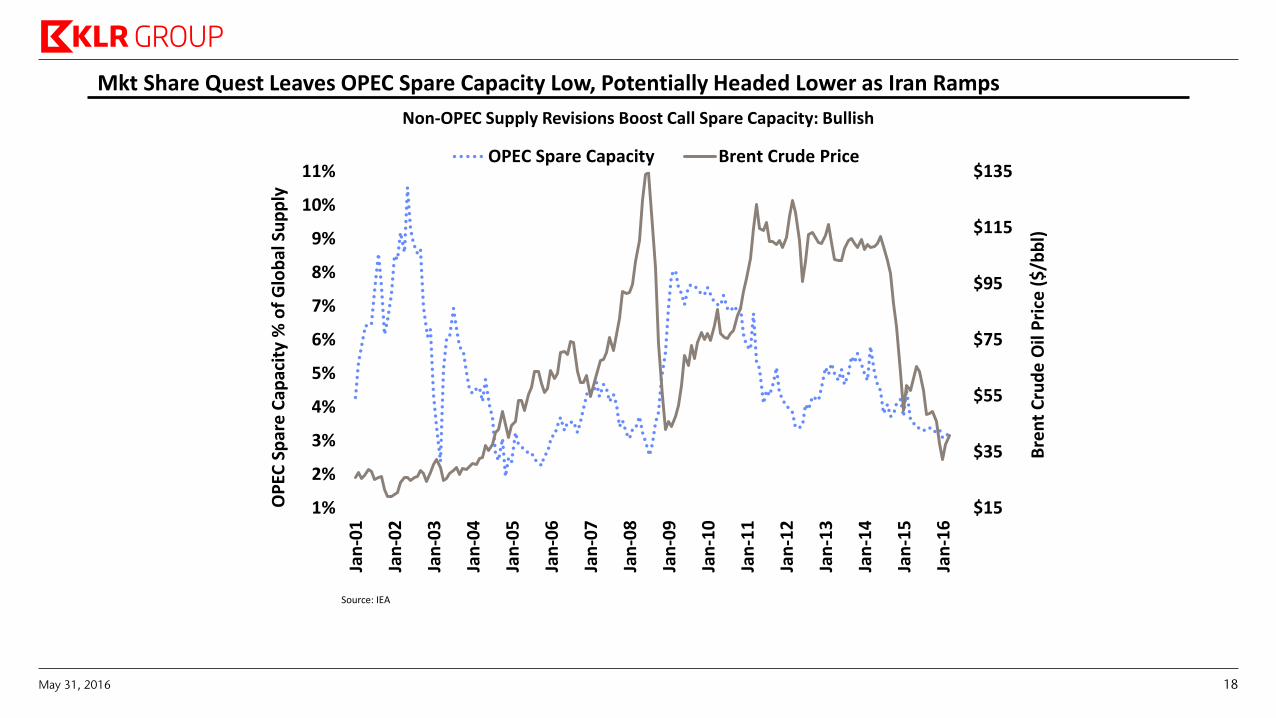
Mkt Share Quest Leaves OPEC Spare Capacity Low, Potentially Headed Lower as Iran Ramps
Source: IEA
Non-OPEC Supply Revisions Boost Call Spare Capacity: Bullish
$15
$35
$55
$75
$95
$115
$135
1%
2%
3%
4%
5%
6%
7%
8%
9%
10%
11%
Jan
-01
Jan
-02
Jan
-03
Jan
-04
Jan
-05
Jan
-06
Jan
-07
Jan
-08
Jan
-09
Jan
-10
Jan
-11
Jan
-12
Jan
-13
Jan
-14
Jan
-15
Jan
-16
Bre
nt
Cru
de
Oil
Pri
ce (
$/b
bl)
OP
EC S
par
e C
apac
ity
% o
f G
lob
al S
up
ply
OPEC Spare Capacity Brent Crude Price
May 31, 2016 18
$30
$50
$70
$90
$110
$130
$150
48
49
50
51
52
53
54
55
56
57
58
Jul-
08
Oct
-08
Jan
-09
Ap
r-0
9
Jul-
09
Oct
-09
Jan
-10
Ap
r-1
0
Jul-
10
Oct
-10
Jan
-11
Ap
r-1
1
Jul-
11
Oct
-11
Jan
-12
Ap
r-1
2
Jul-
12
Oct
-12
Jan
-13
Ap
r-1
3
Jul-
13
Oct
-13
Jan
-14
Ap
r-1
4
Jul-
14
Oct
-14
Jan
-15
Ap
r-1
5
Jul-
15
Oct
-15
Jan
-16
Ap
r-1
6
Act
ual
Bre
nt
Cru
de
Oil
Pri
ce (
$/b
bl)
An
nu
al N
on
-OP
EC S
up
ply
Fo
reca
st (
mm
b/d
)
Vintage of Forecast
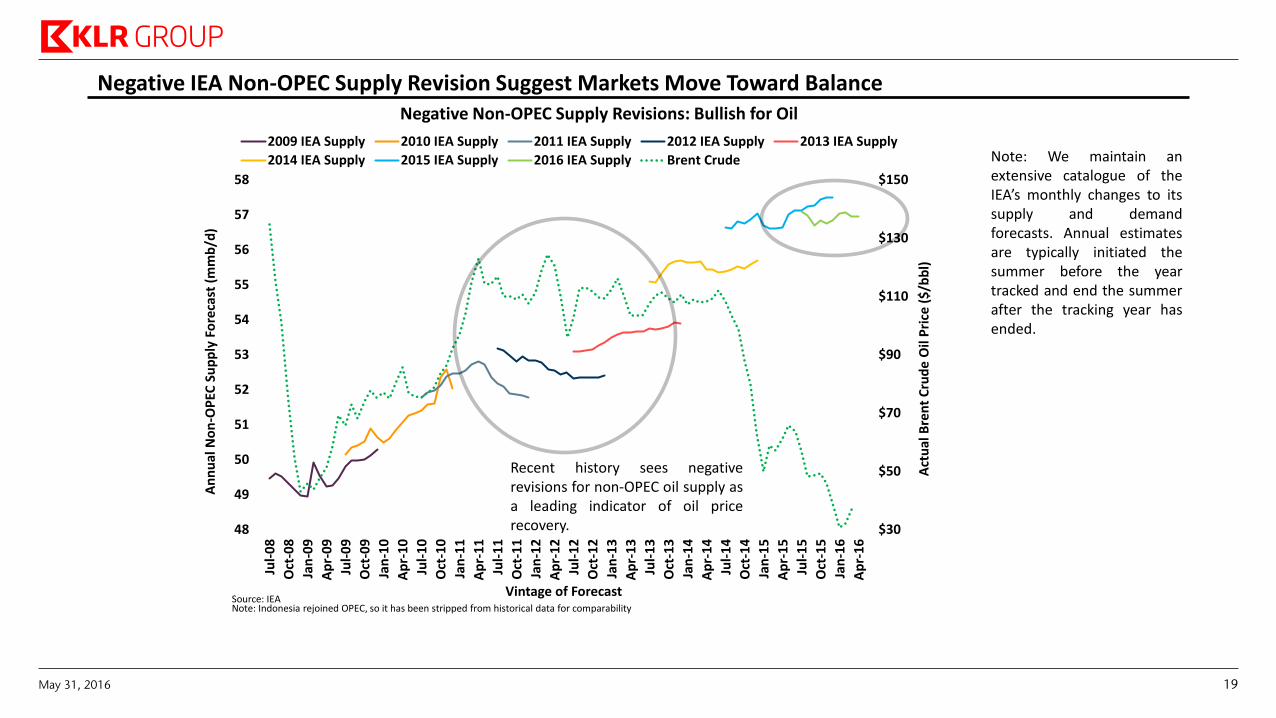
2009 IEA Supply 2010 IEA Supply 2011 IEA Supply 2012 IEA Supply 2013 IEA Supply
2014 IEA Supply 2015 IEA Supply 2016 IEA Supply Brent Crude
Negative IEA Non-OPEC Supply Revision Suggest Markets Move Toward Balance
Source: IEA
Negative Non-OPEC Supply Revisions: Bullish for Oil
Note: We maintain an extensive catalogue of the IEA’s monthly changes to its supply and demand forecasts. Annual estimates are typically initiated the summer before the year tracked and end the summer after the tracking year has ended.
Recent history sees negative revisions for non-OPEC oil supply as a leading indicator of oil price recovery.
Note: Indonesia rejoined OPEC, so it has been stripped from historical data for comparability
May 31, 2016 19
$30
$50
$70
$90
$110
$130
$150
83
84
85
86
87
88
89
90
91
92
93
94
95
96
Jul-
08
Oct
-08
Jan
-09
Ap
r-0
9
Jul-
09
Oct
-09
Jan
-10
Ap
r-1
0
Jul-
10
Oct
-10
Jan
-11
Ap
r-1
1
Jul-
11
Oct
-11
Jan
-12
Ap
r-1
2
Jul-
12
Oct
-12
Jan
-13
Ap
r-1
3
Jul-
13
Oct
-13
Jan
-14
Ap
r-1
4
Jul-
14
Oct
-14
Jan
-15
Ap
r-1
5
Jul-
15
Oct
-15
Jan
-16
Ap
r-1
6
Act
ual
Bre
nt
Cru
de
Oil
Pri
ce (
$/b
bl)
Glo
bal
De
man
d F
ore
cast
(m
mb
/d)
Vintage of Forecast
2009 IEA Demand 2010 IEA Demand 2011 IEA Demand 2012 IEA Demand 2013 IEA Demand
2014 IEA Demand 2015 IEA Demand 2016 IEA Demand Brent Crude
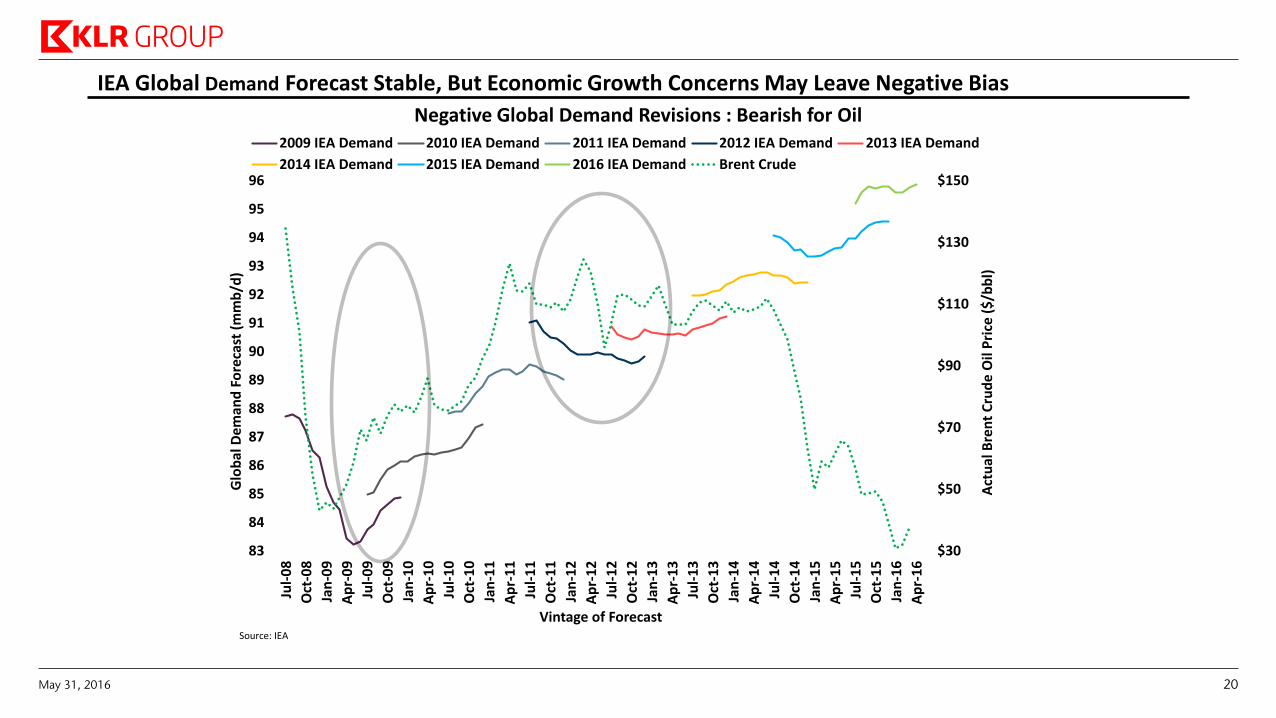
IEA Global Demand Forecast Stable, But Economic Growth Concerns May Leave Negative Bias
Source: IEA
Negative Global Demand Revisions : Bearish for Oil
May 31, 2016 20

Offshore Driller Dayrates & Fleet Breakdowns
May 31, 2016 21
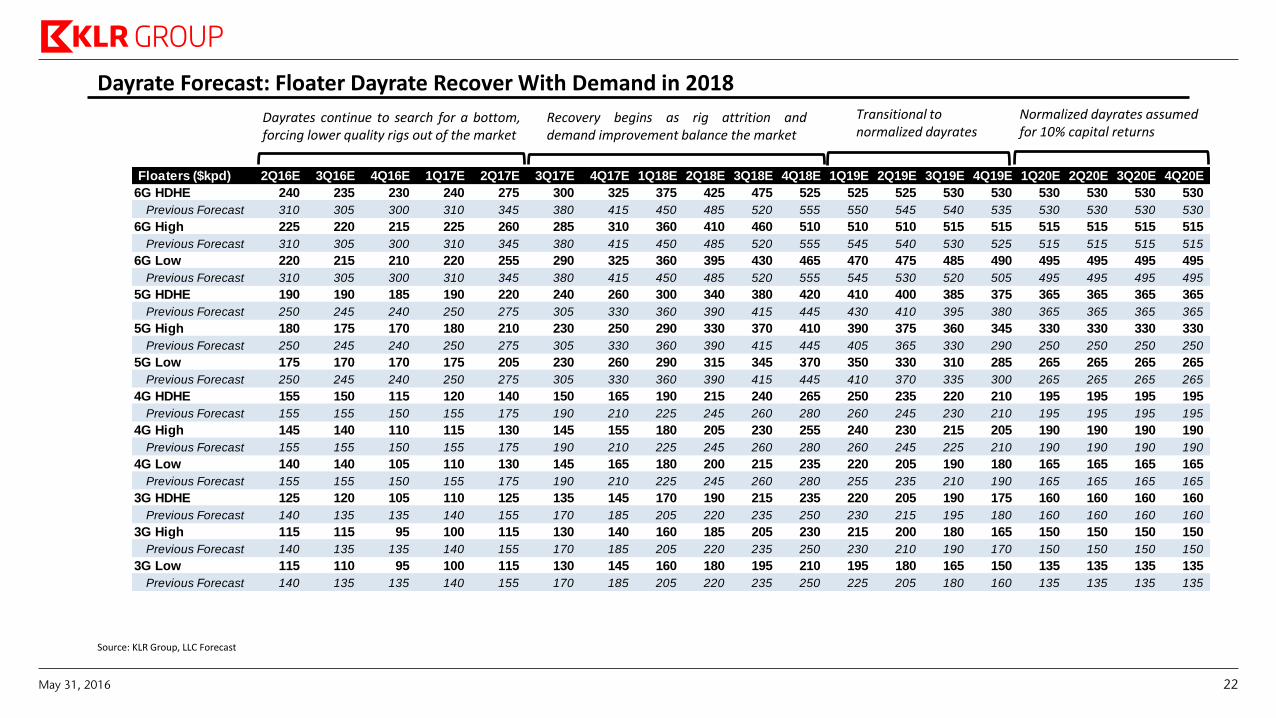
Dayrate Forecast: Floater Dayrate Recover With Demand in 2018 Normalized dayrates assumed
for 10% capital returns Transitional to normalized dayrates
Recovery begins as rig attrition and demand improvement balance the market
Dayrates continue to search for a bottom, forcing lower quality rigs out of the market
Source: KLR Group, LLC Forecast
Floaters ($kpd) 2Q16E 3Q16E 4Q16E 1Q17E 2Q17E 3Q17E 4Q17E 1Q18E 2Q18E 3Q18E 4Q18E 1Q19E 2Q19E 3Q19E 4Q19E 1Q20E 2Q20E 3Q20E 4Q20E
6G HDHE 240 235 230 240 275 300 325 375 425 475 525 525 525 530 530 530 530 530 530
Previous Forecast 310 305 300 310 345 380 415 450 485 520 555 550 545 540 535 530 530 530 530
6G High 225 220 215 225 260 285 310 360 410 460 510 510 510 515 515 515 515 515 515
Previous Forecast 310 305 300 310 345 380 415 450 485 520 555 545 540 530 525 515 515 515 515
6G Low 220 215 210 220 255 290 325 360 395 430 465 470 475 485 490 495 495 495 495
Previous Forecast 310 305 300 310 345 380 415 450 485 520 555 545 530 520 505 495 495 495 495
5G HDHE 190 190 185 190 220 240 260 300 340 380 420 410 400 385 375 365 365 365 365
Previous Forecast 250 245 240 250 275 305 330 360 390 415 445 430 410 395 380 365 365 365 365
5G High 180 175 170 180 210 230 250 290 330 370 410 390 375 360 345 330 330 330 330
Previous Forecast 250 245 240 250 275 305 330 360 390 415 445 405 365 330 290 250 250 250 250
5G Low 175 170 170 175 205 230 260 290 315 345 370 350 330 310 285 265 265 265 265
Previous Forecast 250 245 240 250 275 305 330 360 390 415 445 410 370 335 300 265 265 265 265
4G HDHE 155 150 115 120 140 150 165 190 215 240 265 250 235 220 210 195 195 195 195
Previous Forecast 155 155 150 155 175 190 210 225 245 260 280 260 245 230 210 195 195 195 195
4G High 145 140 110 115 130 145 155 180 205 230 255 240 230 215 205 190 190 190 190
Previous Forecast 155 155 150 155 175 190 210 225 245 260 280 260 245 225 210 190 190 190 190
4G Low 140 140 105 110 130 145 165 180 200 215 235 220 205 190 180 165 165 165 165
Previous Forecast 155 155 150 155 175 190 210 225 245 260 280 255 235 210 190 165 165 165 165
3G HDHE 125 120 105 110 125 135 145 170 190 215 235 220 205 190 175 160 160 160 160
Previous Forecast 140 135 135 140 155 170 185 205 220 235 250 230 215 195 180 160 160 160 160
3G High 115 115 95 100 115 130 140 160 185 205 230 215 200 180 165 150 150 150 150
Previous Forecast 140 135 135 140 155 170 185 205 220 235 250 230 210 190 170 150 150 150 150
3G Low 115 110 95 100 115 130 145 160 180 195 210 195 180 165 150 135 135 135 135
Previous Forecast 140 135 135 140 155 170 185 205 220 235 250 225 205 180 160 135 135 135 135
May 31, 2016 22
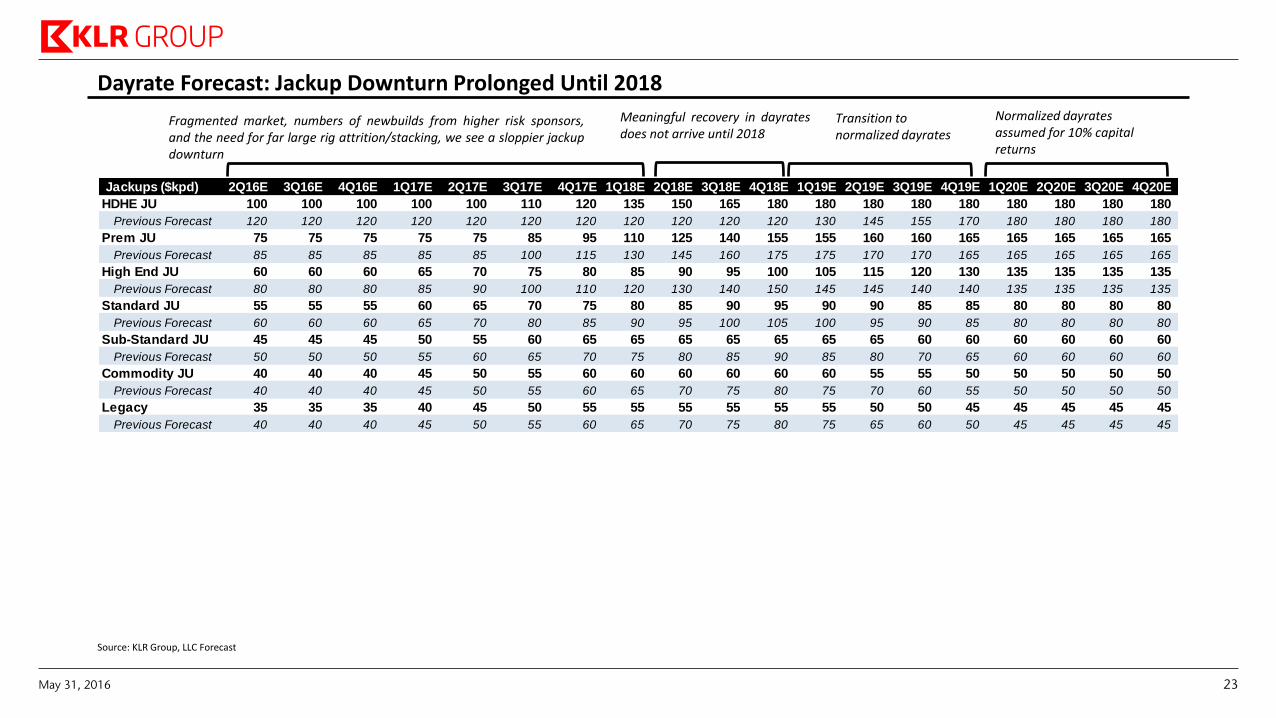
Fragmented market, numbers of newbuilds from higher risk sponsors, and the need for far large rig attrition/stacking, we see a sloppier jackup downturn
Dayrate Forecast: Jackup Downturn Prolonged Until 2018 Normalized dayrates assumed for 10% capital returns
Transition to normalized dayrates
Meaningful recovery in dayrates does not arrive until 2018
Source: KLR Group, LLC Forecast
Jackups ($kpd) 2Q16E 3Q16E 4Q16E 1Q17E 2Q17E 3Q17E 4Q17E 1Q18E 2Q18E 3Q18E 4Q18E 1Q19E 2Q19E 3Q19E 4Q19E 1Q20E 2Q20E 3Q20E 4Q20E
HDHE JU 100 100 100 100 100 110 120 135 150 165 180 180 180 180 180 180 180 180 180
Previous Forecast 120 120 120 120 120 120 120 120 120 120 120 130 145 155 170 180 180 180 180
Prem JU 75 75 75 75 75 85 95 110 125 140 155 155 160 160 165 165 165 165 165
Previous Forecast 85 85 85 85 85 100 115 130 145 160 175 175 170 170 165 165 165 165 165
High End JU 60 60 60 65 70 75 80 85 90 95 100 105 115 120 130 135 135 135 135
Previous Forecast 80 80 80 85 90 100 110 120 130 140 150 145 145 140 140 135 135 135 135
Standard JU 55 55 55 60 65 70 75 80 85 90 95 90 90 85 85 80 80 80 80
Previous Forecast 60 60 60 65 70 80 85 90 95 100 105 100 95 90 85 80 80 80 80
Sub-Standard JU 45 45 45 50 55 60 65 65 65 65 65 65 65 60 60 60 60 60 60
Previous Forecast 50 50 50 55 60 65 70 75 80 85 90 85 80 70 65 60 60 60 60
Commodity JU 40 40 40 45 50 55 60 60 60 60 60 60 55 55 50 50 50 50 50
Previous Forecast 40 40 40 45 50 55 60 65 70 75 80 75 70 60 55 50 50 50 50
Legacy 35 35 35 40 45 50 55 55 55 55 55 55 50 50 45 45 45 45 45
Previous Forecast 40 40 40 45 50 55 60 65 70 75 80 75 65 60 50 45 45 45 45
May 31, 2016 23
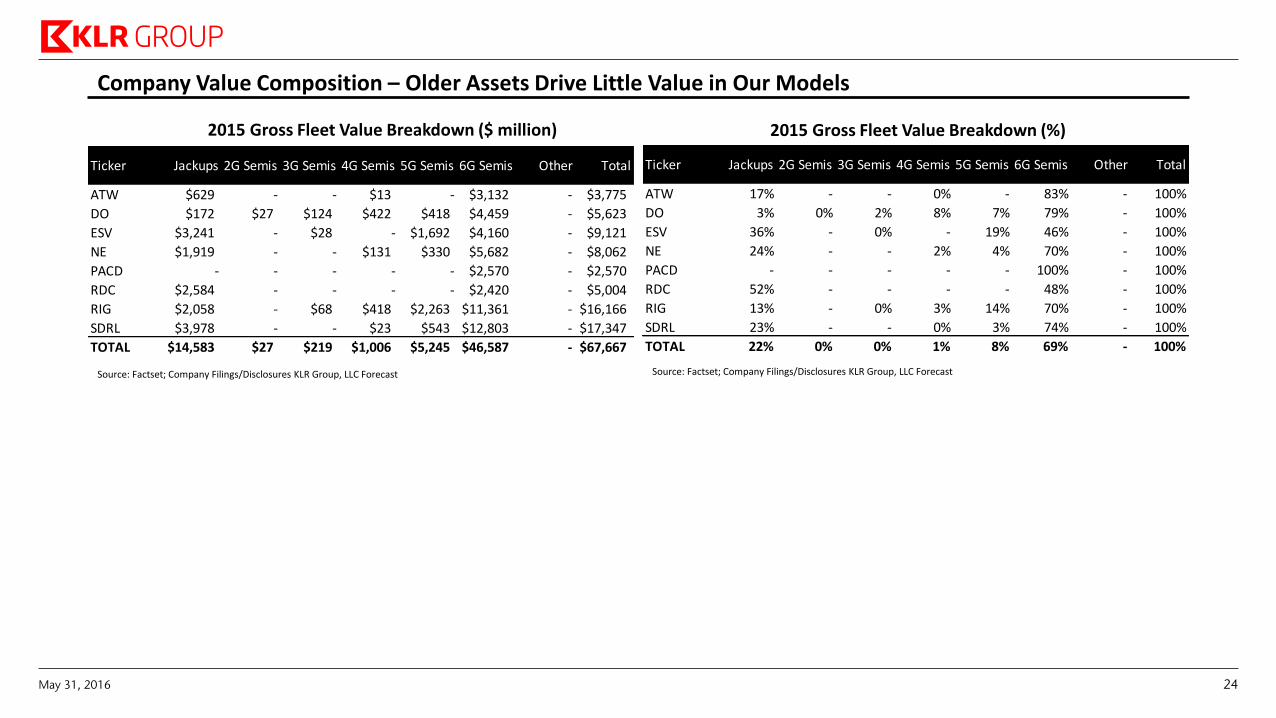
Company Value Composition – Older Assets Drive Little Value in Our Models
Source: Factset; Company Filings/Disclosures KLR Group, LLC Forecast
2015 Gross Fleet Value Breakdown ($ million) 2015 Gross Fleet Value Breakdown (%)
Source: Factset; Company Filings/Disclosures KLR Group, LLC Forecast
Ticker Jackups 2G Semis 3G Semis 4G Semis 5G Semis 6G Semis Other Total
ATW $629 - - $13 - $3,132 - $3,775
DO $172 $27 $124 $422 $418 $4,459 - $5,623
ESV $3,241 - $28 - $1,692 $4,160 - $9,121
NE $1,919 - - $131 $330 $5,682 - $8,062
PACD - - - - - $2,570 - $2,570
RDC $2,584 - - - - $2,420 - $5,004
RIG $2,058 - $68 $418 $2,263 $11,361 - $16,166
SDRL $3,978 - - $23 $543 $12,803 - $17,347
TOTAL $14,583 $27 $219 $1,006 $5,245 $46,587 - $67,667
Ticker Jackups 2G Semis 3G Semis 4G Semis 5G Semis 6G Semis Other Total
ATW 17% - - 0% - 83% - 100%
DO 3% 0% 2% 8% 7% 79% - 100%
ESV 36% - 0% - 19% 46% - 100%
NE 24% - - 2% 4% 70% - 100%
PACD - - - - - 100% - 100%
RDC 52% - - - - 48% - 100%
RIG 13% - 0% 3% 14% 70% - 100%
SDRL 23% - - 0% 3% 74% - 100%
TOTAL 22% 0% 0% 1% 8% 69% - 100%
May 31, 2016 24
0%
18%
0%
11%
22%
27%
34%
0%
30%
2%
27%
33%
46%
65%
20%
55%
55%
58%
60%
63%
88%
0% 20% 40% 60% 80% 100%
DO
ESV
ATW
RIG
SDRL
RDC
NE
2016E 2017E 2018E
29%
14%
27%
36%
17%
25%
16%
2%
38%
19%
29%
45%
46%
49%
46%
63%
49%
52%
53%
58%
61%
75%
89%
100%
0% 20% 40% 60% 80% 100%
RIG
PACD
NE
DO
ESV
SDRL
ATW
RDC
2016E 2017E 2018E
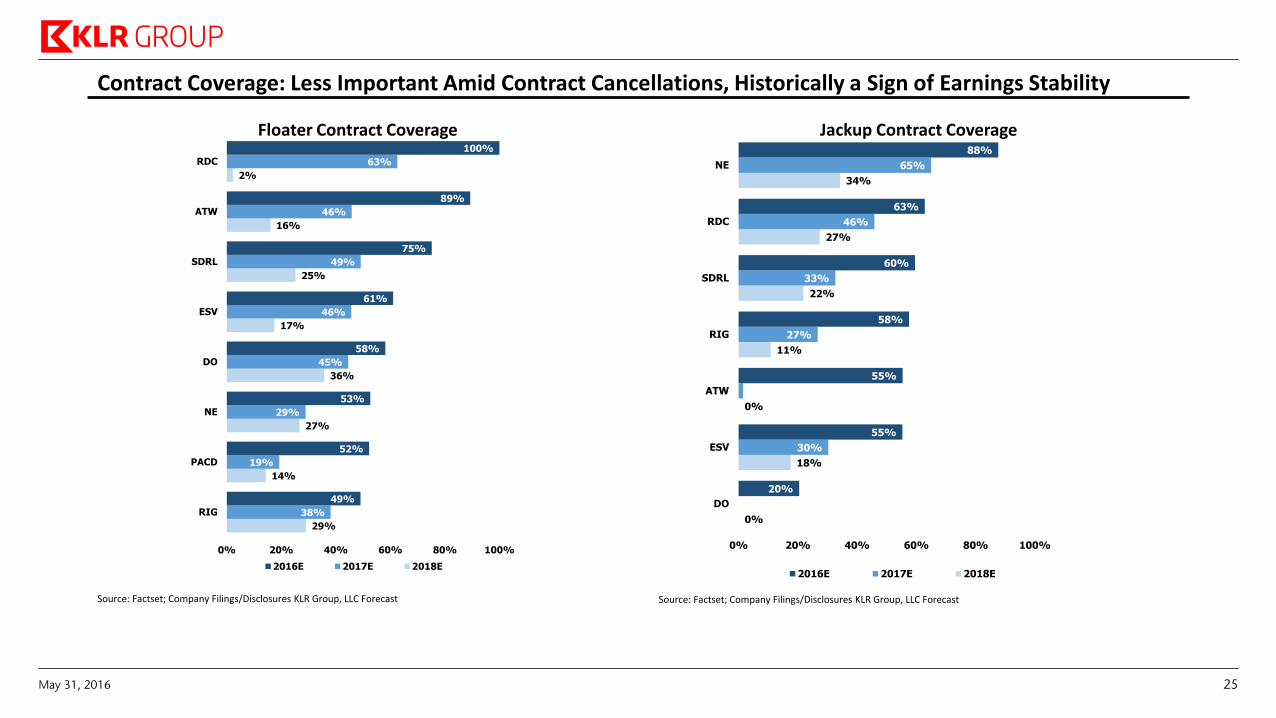
Contract Coverage: Less Important Amid Contract Cancellations, Historically a Sign of Earnings Stability
Source: Factset; Company Filings/Disclosures KLR Group, LLC Forecast
Floater Contract Coverage Jackup Contract Coverage
Source: Factset; Company Filings/Disclosures KLR Group, LLC Forecast
May 31, 2016 25
Offshore Floater Market
May 31, 2016 26
197 200 212
226
241
258
282 296
312
281
241 240 251
264 271
167 173 181
191 199
211
244
258 262
225
181 188
213 224 230
85%86% 86% 85%
83% 82%
86% 87%84%
80%
64%
78%
89% 89%87%
0%
10%
20%
30%
40%
50%
60%
70%
80%
90%
100%
-
50
100
150
200
250
300
350
2006 2007 2008 2009 2010 2011 2012 2013 2014 2015 2016E 2017E 2018E 2019E 2020E
Uti
lizat
ion
Nu
mb
er o
f R
igs
Market Supply, EOP Contracted / Demand Implied Utilization
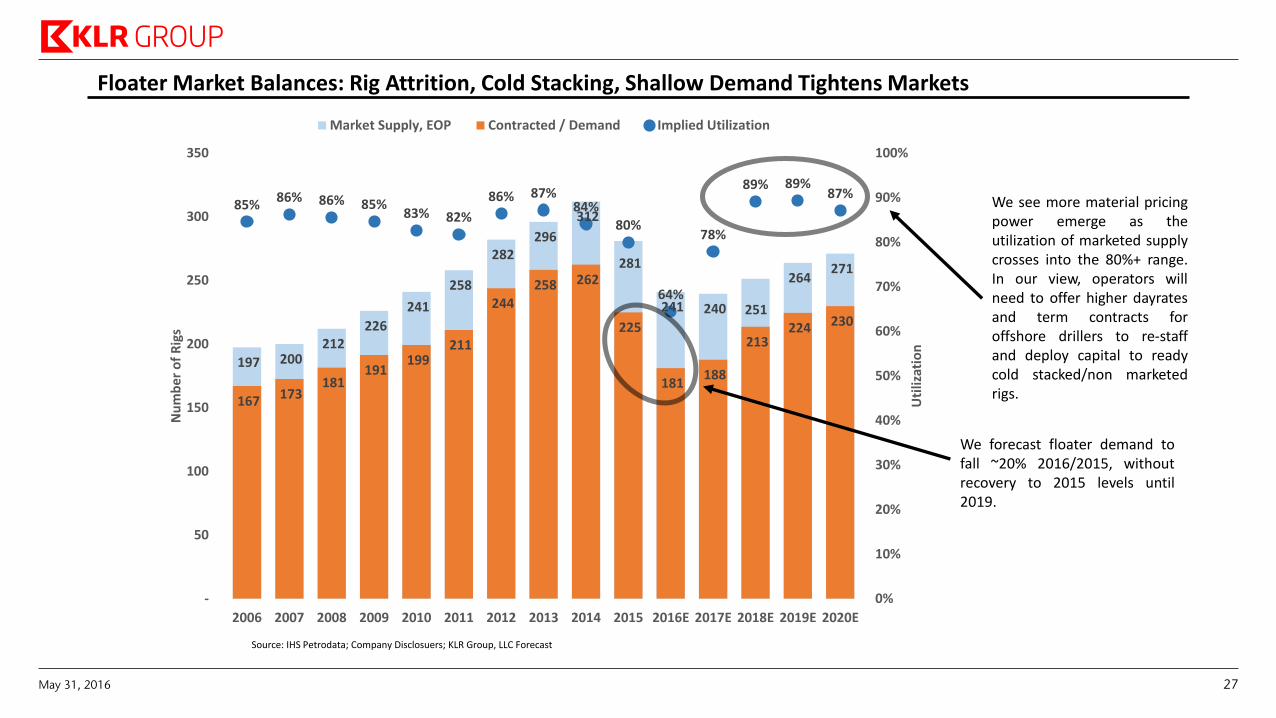
Floater Market Balances: Rig Attrition, Cold Stacking, Shallow Demand Tightens Markets
We forecast floater demand to fall ~20% 2016/2015, without recovery to 2015 levels until 2019.
We see more material pricing power emerge as the utilization of marketed supply crosses into the 80%+ range. In our view, operators will need to offer higher dayrates and term contracts for offshore drillers to re-staff and deploy capital to ready cold stacked/non marketed rigs.
Source: IHS Petrodata; Company Disclosuers; KLR Group, LLC Forecast
May 31, 2016 27
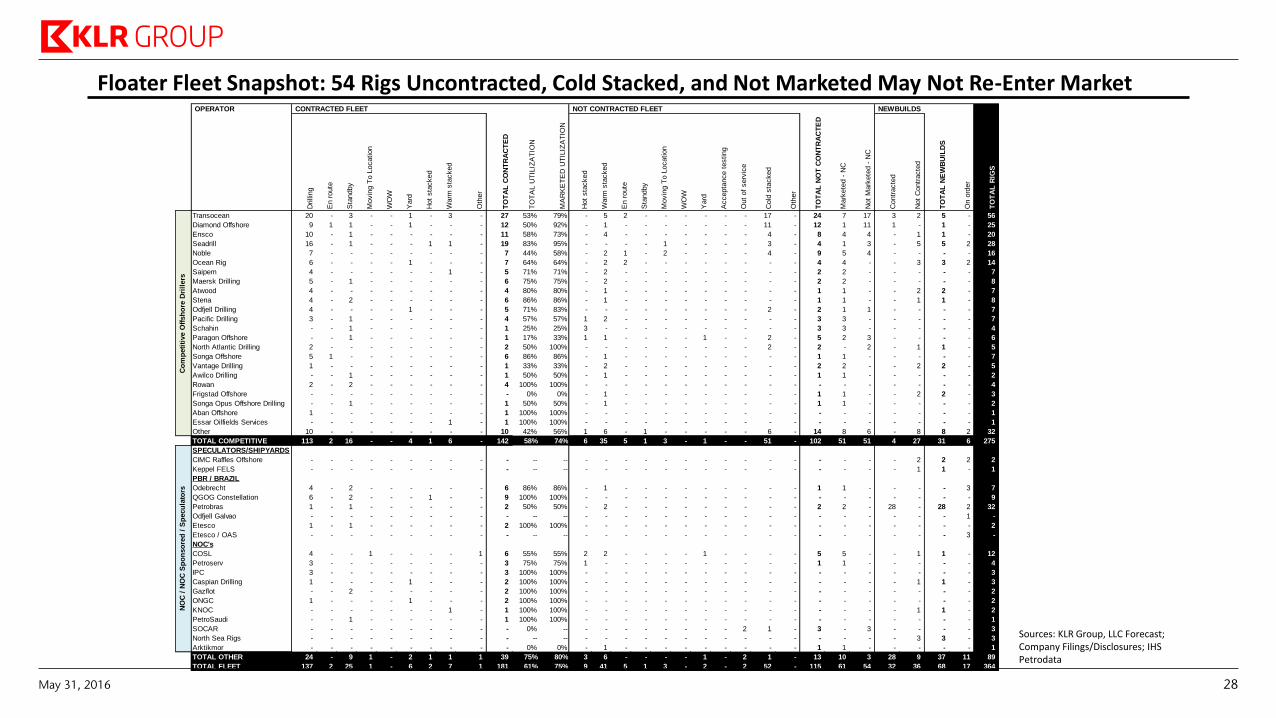
Floater Fleet Snapshot: 54 Rigs Uncontracted, Cold Stacked, and Not Marketed May Not Re-Enter Market
Sources: KLR Group, LLC Forecast; Company Filings/Disclosures; IHS Petrodata
OPERATOR CONTRACTED FLEET NOT CONTRACTED FLEET NEWBUILDS
Drilli
ng
En r
oute
Sta
ndby
Movin
g T
o L
ocation
WO
W
Yard
Hot
sta
cked
Warm
sta
cked
Oth
er
TO
TA
L C
ON
TR
AC
TE
D
TO
TA
L U
TIL
IZA
TIO
N
MA
RK
ET
ED
UT
ILIZ
AT
ION
Hot
sta
cked
Warm
sta
cked
En r
oute
Sta
ndby
Movin
g T
o L
ocation
WO
W
Yard
Accepta
nce t
esting
Out
of
serv
ice
Cold
sta
cked
Oth
er
TO
TA
L N
OT
CO
NT
RA
CT
ED
Mark
ete
d -
NC
Not
Mark
ete
d -
NC
Contr
acte
d
Not
Contr
acte
d
TO
TA
L N
EW
BU
ILD
S
On o
rder
TO
TA
L R
IGS
Transocean 20 - 3 - - 1 - 3 - 27 53% 79% - 5 2 - - - - - - 17 - 24 7 17 3 2 5 - 56
Diamond Offshore 9 1 1 - - 1 - - - 12 50% 92% - 1 - - - - - - - 11 - 12 1 11 1 - 1 - 25
Ensco 10 - 1 - - - - - - 11 58% 73% - 4 - - - - - - - 4 - 8 4 4 - 1 1 - 20
Seadrill 16 - 1 - - - 1 1 - 19 83% 95% - - - - 1 - - - - 3 - 4 1 3 - 5 5 2 28
Noble 7 - - - - - - - - 7 44% 58% - 2 1 - 2 - - - - 4 - 9 5 4 - - - - 16
Ocean Rig 6 - - - - 1 - - - 7 64% 64% - 2 2 - - - - - - - - 4 4 - - 3 3 2 14
Saipem 4 - - - - - - 1 - 5 71% 71% - 2 - - - - - - - - - 2 2 - - - - - 7
Maersk Drilling 5 - 1 - - - - - - 6 75% 75% - 2 - - - - - - - - - 2 2 - - - - - 8
Atwood 4 - - - - - - - - 4 80% 80% - 1 - - - - - - - - - 1 1 - - 2 2 - 7
Stena 4 - 2 - - - - - - 6 86% 86% - 1 - - - - - - - - - 1 1 - - 1 1 - 8
Odfjell Drilling 4 - - - - 1 - - - 5 71% 83% - - - - - - - - - 2 - 2 1 1 - - - - 7
Pacific Drilling 3 - 1 - - - - - - 4 57% 57% 1 2 - - - - - - - - - 3 3 - - - - - 7
Schahin - - 1 - - - - - - 1 25% 25% 3 - - - - - - - - - - 3 3 - - - - - 4
Paragon Offshore - - 1 - - - - - - 1 17% 33% 1 1 - - - - 1 - - 2 - 5 2 3 - - - - 6
North Atlantic Drilling 2 - - - - - - - - 2 50% 100% - - - - - - - - - 2 - 2 - 2 - 1 1 - 5
Songa Offshore 5 1 - - - - - - - 6 86% 86% - 1 - - - - - - - - - 1 1 - - - - - 7
Vantage Drilling 1 - - - - - - - - 1 33% 33% - 2 - - - - - - - - - 2 2 - - 2 2 - 5
Awilco Drilling - - 1 - - - - - - 1 50% 50% - 1 - - - - - - - - - 1 1 - - - - - 2
Rowan 2 - 2 - - - - - - 4 100% 100% - - - - - - - - - - - - - - - - - - 4
Frigstad Offshore - - - - - - - - - - 0% 0% - 1 - - - - - - - - - 1 1 - - 2 2 - 3
Songa Opus Offshore Drilling - - 1 - - - - - - 1 50% 50% - 1 - - - - - - - - - 1 1 - - - - - 2
Aban Offshore 1 - - - - - - - - 1 100% 100% - - - - - - - - - - - - - - - - - - 1
Essar Oilfields Services - - - - - - - 1 - 1 100% 100% - - - - - - - - - - - - - - - - - - 1
Other 10 - - - - - - - - 10 42% 56% 1 6 - 1 - - - - - 6 - 14 8 6 - 8 8 2 32
TOTAL COMPETITIVE 113 2 16 - - 4 1 6 - 142 58% 74% 6 35 5 1 3 - 1 - - 51 - 102 51 51 4 27 31 6 275
SPECULATORS/SHIPYARDS
CIMC Raffles Offshore - - - - - - - - - - -- -- - - - - - - - - - - - - - - - 2 2 2 2
Keppel FELS - - - - - - - - - - -- -- - - - - - - - - - - - - - - - 1 1 - 1
PBR / BRAZIL
Odebrecht 4 - 2 - - - - - - 6 86% 86% - 1 - - - - - - - - - 1 1 - - - - 3 7
QGOG Constellation 6 - 2 - - - 1 - - 9 100% 100% - - - - - - - - - - - - - - - - - - 9
Petrobras 1 - 1 - - - - - - 2 50% 50% - 2 - - - - - - - - - 2 2 - 28 - 28 2 32
Odfjell Galvao - - - - - - - - - - -- -- - - - - - - - - - - - - - - - - - 1 -
Etesco 1 - 1 - - - - - - 2 100% 100% - - - - - - - - - - - - - - - - - - 2
Etesco / OAS - - - - - - - - - - -- -- - - - - - - - - - - - - - - - - - 3 -
NOC's
COSL 4 - - 1 - - - - 1 6 55% 55% 2 2 - - - - 1 - - - - 5 5 - - 1 1 - 12
Petroserv 3 - - - - - - - - 3 75% 75% 1 - - - - - - - - - - 1 1 - - - - - 4
IPC 3 - - - - - - - - 3 100% 100% - - - - - - - - - - - - - - - - - - 3
Caspian Drilling 1 - - - - 1 - - - 2 100% 100% - - - - - - - - - - - - - - - 1 1 - 3
Gazflot - - 2 - - - - - - 2 100% 100% - - - - - - - - - - - - - - - - - - 2
ONGC 1 - - - - 1 - - - 2 100% 100% - - - - - - - - - - - - - - - - - - 2
KNOC - - - - - - - 1 - 1 100% 100% - - - - - - - - - - - - - - - 1 1 - 2
PetroSaudi - - 1 - - - - - - 1 100% 100% - - - - - - - - - - - - - - - - - - 1
SOCAR - - - - - - - - - - 0% -- - - - - - - - - 2 1 - 3 - 3 - - - - 3
North Sea Rigs - - - - - - - - - - -- -- - - - - - - - - - - - - - - - 3 3 - 3
Arktikmor - - - - - - - - - - 0% 0% - 1 - - - - - - - - - 1 1 - - - - - 1
TOTAL OTHER 24 - 9 1 - 2 1 1 1 39 75% 80% 3 6 - - - - 1 - 2 1 - 13 10 3 28 9 37 11 89
TOTAL FLEET 137 2 25 1 - 6 2 7 1 181 61% 75% 9 41 5 1 3 - 2 - 2 52 - 115 61 54 32 36 68 17 364
NO
C /
NO
C S
po
nso
red
/ S
pecu
lato
rsC
om
peti
tive O
ffsh
ore
Dri
llers
May 31, 2016 28
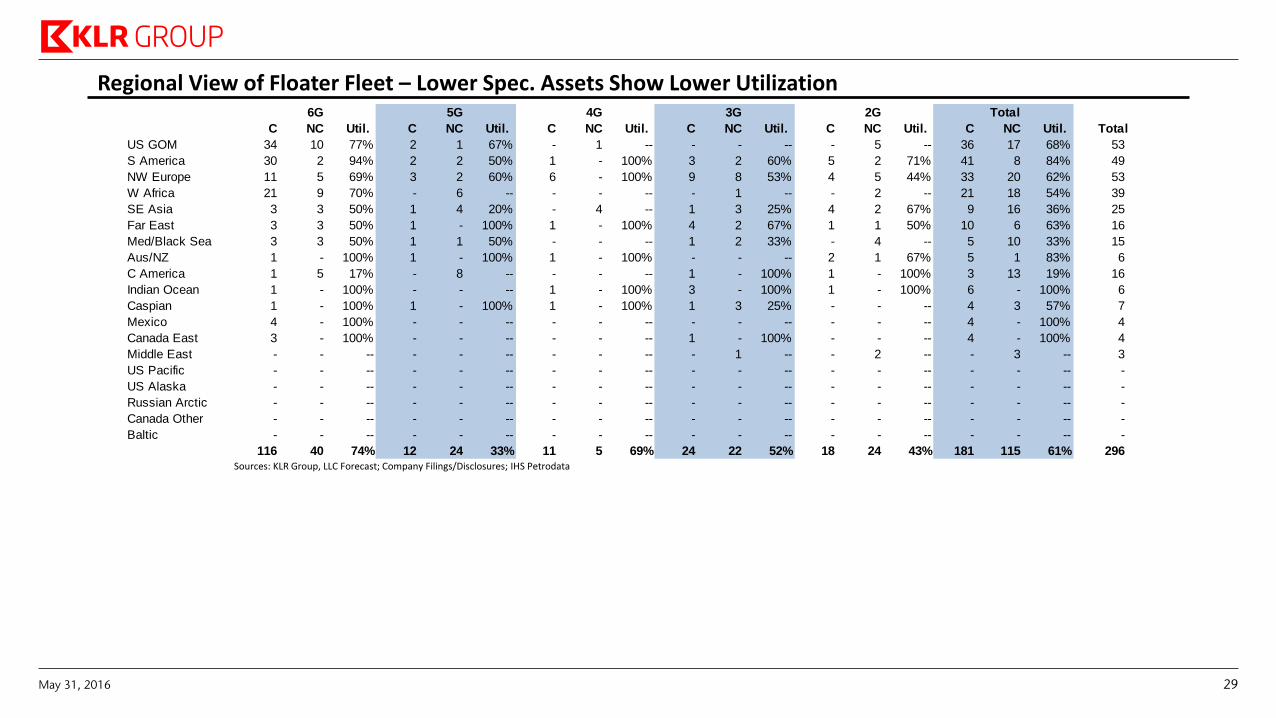
Regional View of Floater Fleet – Lower Spec. Assets Show Lower Utilization
Sources: KLR Group, LLC Forecast; Company Filings/Disclosures; IHS Petrodata
6G 5G 4G 3G 2G Total
C NC Util. C NC Util. C NC Util. C NC Util. C NC Util. C NC Util. Total
US GOM 34 10 77% 2 1 67% - 1 -- - - -- - 5 -- 36 17 68% 53
S America 30 2 94% 2 2 50% 1 - 100% 3 2 60% 5 2 71% 41 8 84% 49
NW Europe 11 5 69% 3 2 60% 6 - 100% 9 8 53% 4 5 44% 33 20 62% 53
W Africa 21 9 70% - 6 -- - - -- - 1 -- - 2 -- 21 18 54% 39
SE Asia 3 3 50% 1 4 20% - 4 -- 1 3 25% 4 2 67% 9 16 36% 25
Far East 3 3 50% 1 - 100% 1 - 100% 4 2 67% 1 1 50% 10 6 63% 16
Med/Black Sea 3 3 50% 1 1 50% - - -- 1 2 33% - 4 -- 5 10 33% 15
Aus/NZ 1 - 100% 1 - 100% 1 - 100% - - -- 2 1 67% 5 1 83% 6
C America 1 5 17% - 8 -- - - -- 1 - 100% 1 - 100% 3 13 19% 16
Indian Ocean 1 - 100% - - -- 1 - 100% 3 - 100% 1 - 100% 6 - 100% 6
Caspian 1 - 100% 1 - 100% 1 - 100% 1 3 25% - - -- 4 3 57% 7
Mexico 4 - 100% - - -- - - -- - - -- - - -- 4 - 100% 4
Canada East 3 - 100% - - -- - - -- 1 - 100% - - -- 4 - 100% 4
Middle East - - -- - - -- - - -- - 1 -- - 2 -- - 3 -- 3
US Pacific - - -- - - -- - - -- - - -- - - -- - - -- -
US Alaska - - -- - - -- - - -- - - -- - - -- - - -- -
Russian Arctic - - -- - - -- - - -- - - -- - - -- - - -- -
Canada Other - - -- - - -- - - -- - - -- - - -- - - -- -
Baltic - - -- - - -- - - -- - - -- - - -- - - -- -
116 40 74% 12 24 33% 11 5 69% 24 22 52% 18 24 43% 181 115 61% 296
May 31, 2016 29
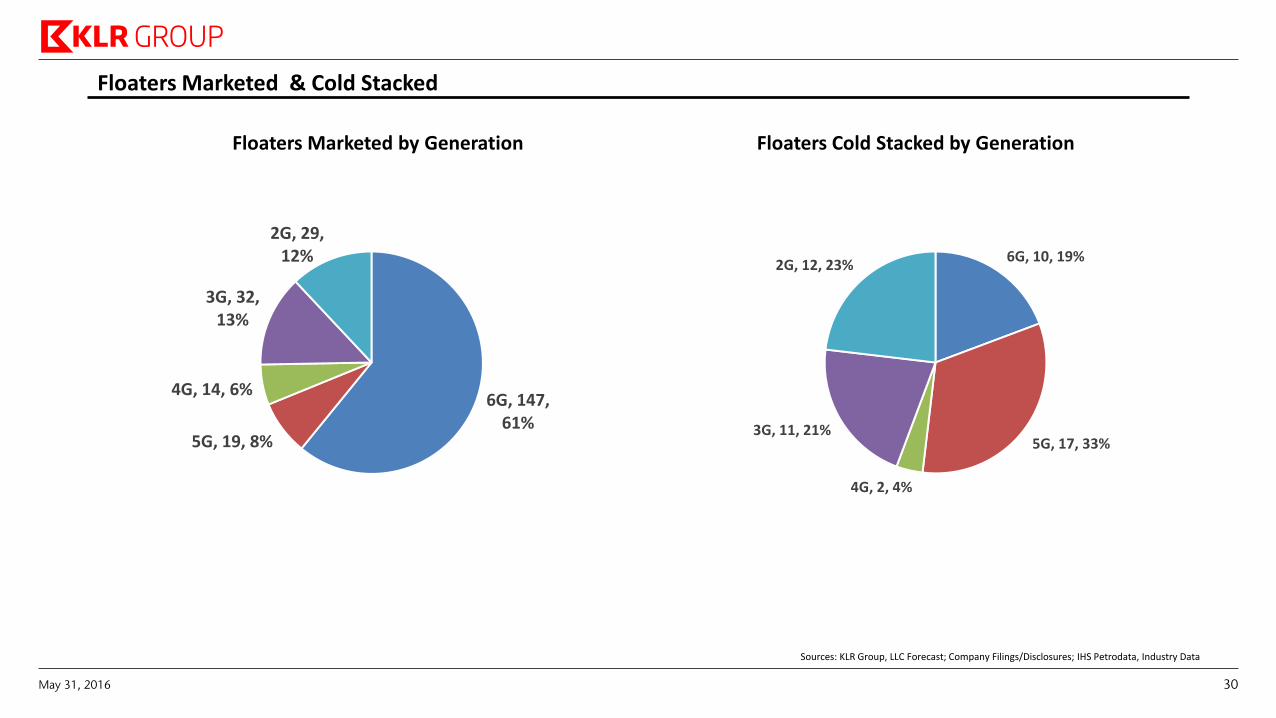
Floaters Marketed & Cold Stacked
6G, 147, 61%
5G, 19, 8%
4G, 14, 6%
3G, 32, 13%
2G, 29, 12% 6G, 10, 19%
5G, 17, 33%
4G, 2, 4%
3G, 11, 21%
2G, 12, 23%
Floaters Marketed by Generation Floaters Cold Stacked by Generation
Sources: KLR Group, LLC Forecast; Company Filings/Disclosures; IHS Petrodata, Industry Data
May 31, 2016 30
69
80 82
107 113 114
122
137
122 117
90
58
79
102
121
132
50
60
70
80
90
100
110
120
130
140
150
20
05
20
06
20
07
20
08
20
09
20
10
20
11
20
12
20
13
20
14
20
15
20
16
E
20
17
E
20
18
E
20
19
E
20
20
E
58
73 69 74
78 83
87
106
136 145
135
123
112 121
115 111
50
60
70
80
90
100
110
120
130
140
150
20
05
20
06
20
07
20
08
20
09
20
10
20
11
20
12
20
13
20
14
20
15
20
16
E
20
17
E
20
18
E
20
19
E
20
20
E
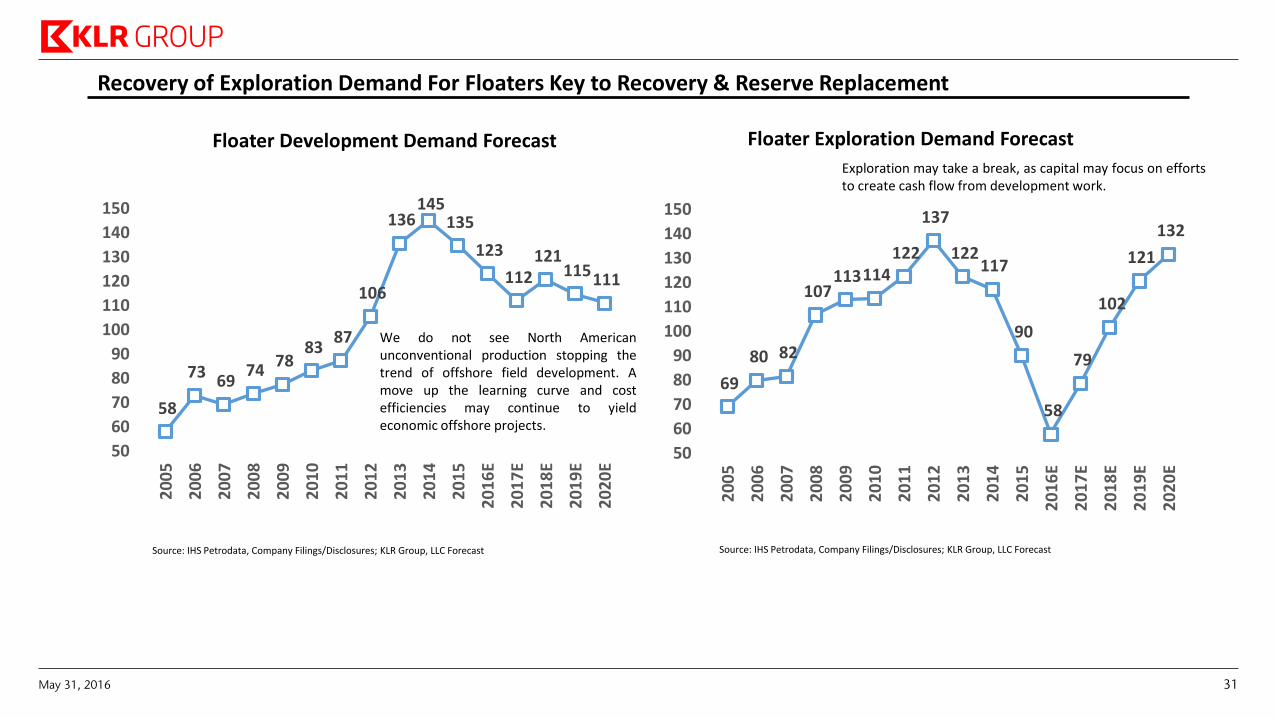
Recovery of Exploration Demand For Floaters Key to Recovery & Reserve Replacement
Floater Development Demand Forecast Floater Exploration Demand Forecast
We do not see North American unconventional production stopping the trend of offshore field development. A move up the learning curve and cost efficiencies may continue to yield economic offshore projects.
Exploration may take a break, as capital may focus on efforts to create cash flow from development work.
Source: IHS Petrodata, Company Filings/Disclosures; KLR Group, LLC Forecast Source: IHS Petrodata, Company Filings/Disclosures; KLR Group, LLC Forecast
May 31, 2016 31
165
189
225
256
274
306
240
184
158
140
181 188
213 224
230
244
210
171
151
138
100
150
200
250
300
350
2016 2017 2018 2019 2020 2021 2022 2023 2024 2025
TOTAL RAW FLOATER DEMAND TOTAL FLOATER DEMAND (KLR Forecast)
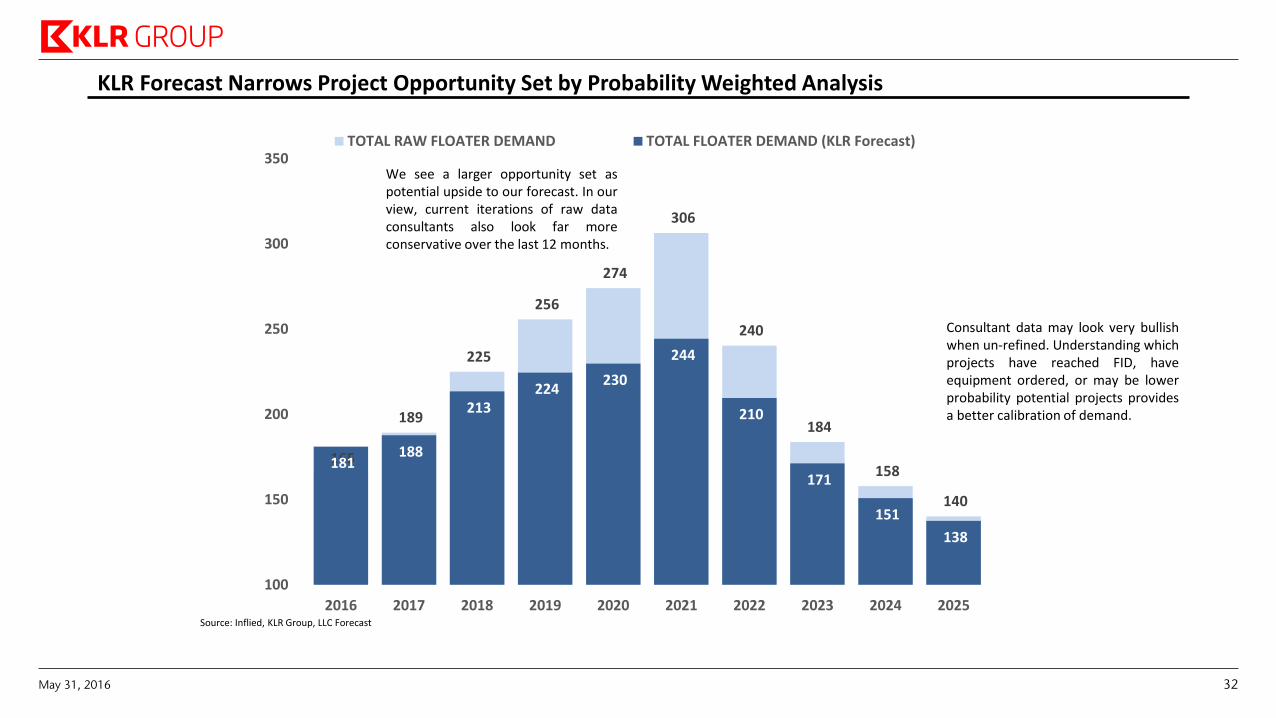
KLR Forecast Narrows Project Opportunity Set by Probability Weighted Analysis
Consultant data may look very bullish when un-refined. Understanding which projects have reached FID, have equipment ordered, or may be lower probability potential projects provides a better calibration of demand.
We see a larger opportunity set as potential upside to our forecast. In our view, current iterations of raw data consultants also look far more conservative over the last 12 months.
Source: Inflied, KLR Group, LLC Forecast
May 31, 2016 32
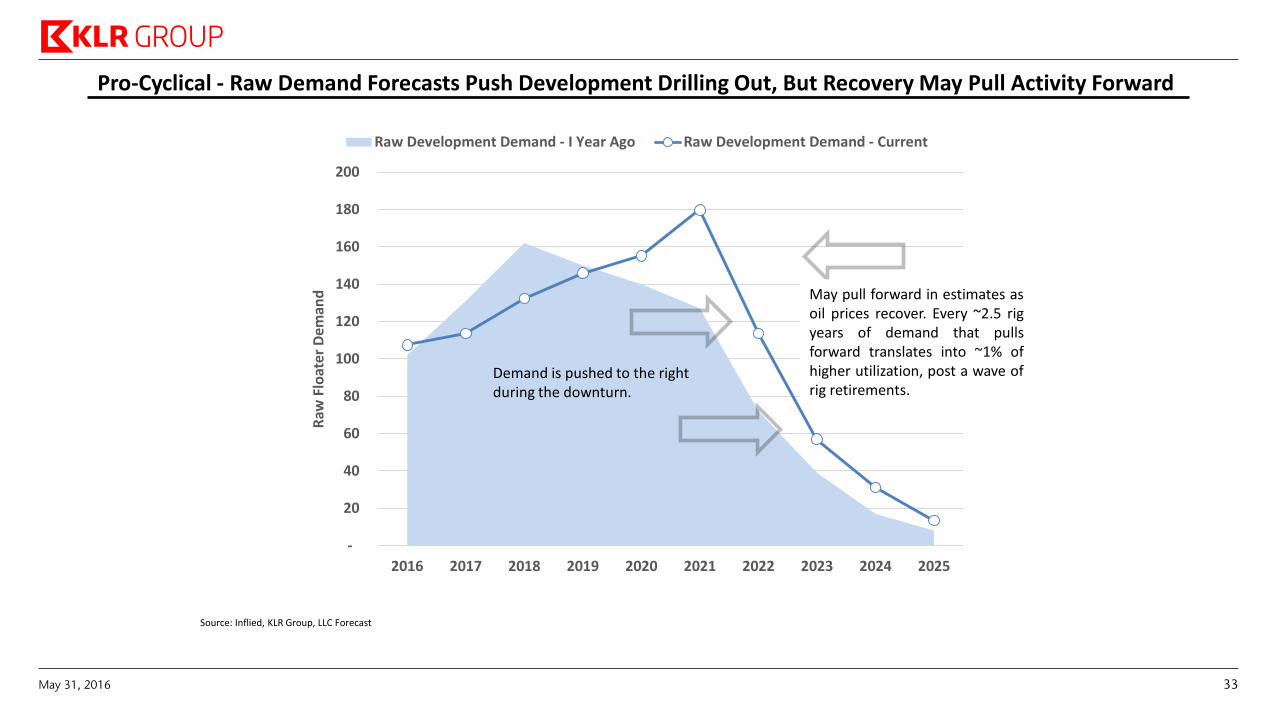
Pro-Cyclical - Raw Demand Forecasts Push Development Drilling Out, But Recovery May Pull Activity Forward
-
20
40
60
80
100
120
140
160
180
200
2016 2017 2018 2019 2020 2021 2022 2023 2024 2025
Raw
Flo
ater
Dem
and
Raw Development Demand - I Year Ago Raw Development Demand - Current
Source: Inflied, KLR Group, LLC Forecast
Demand is pushed to the right during the downturn.
May pull forward in estimates as oil prices recover. Every ~2.5 rig years of demand that pulls forward translates into ~1% of higher utilization, post a wave of rig retirements.
May 31, 2016 33
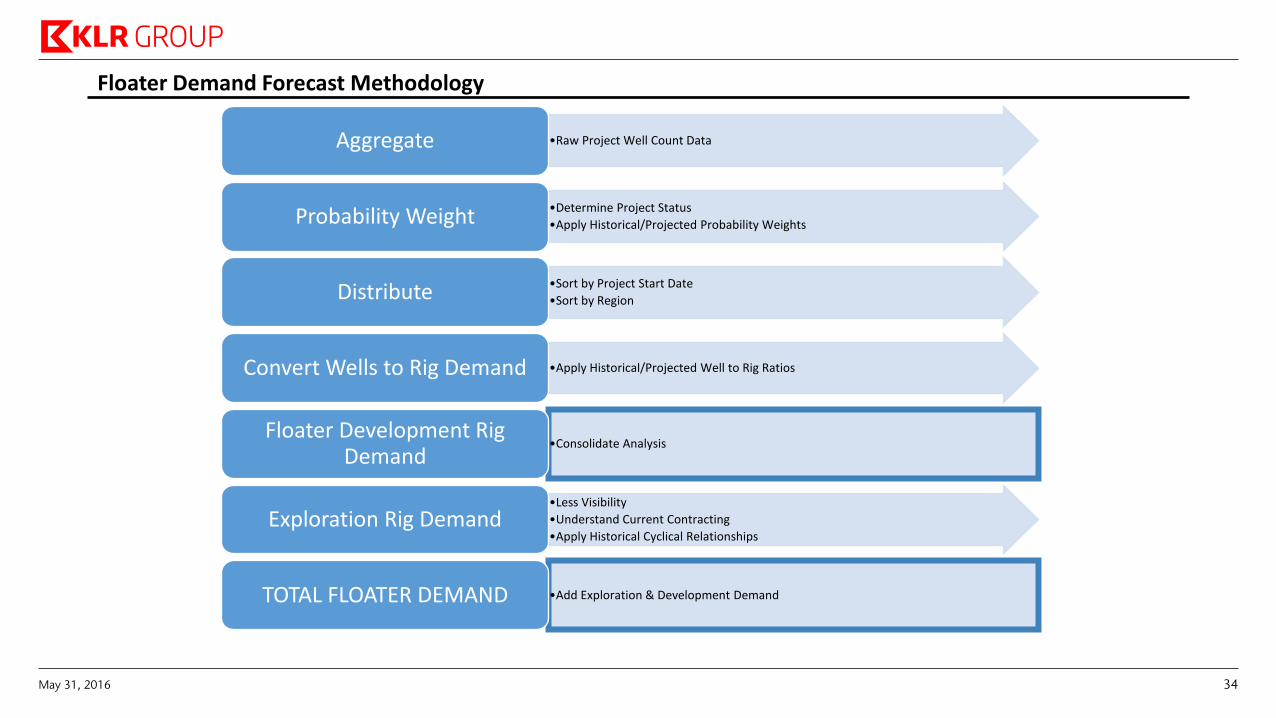
Floater Demand Forecast Methodology
•Raw Project Well Count Data Aggregate
•Determine Project Status
•Apply Historical/Projected Probability Weights Probability Weight
•Sort by Project Start Date
•Sort by Region Distribute
•Apply Historical/Projected Well to Rig Ratios Convert Wells to Rig Demand
•Consolidate Analysis Floater Development Rig
Demand
•Less Visibility
•Understand Current Contracting
•Apply Historical Cyclical Relationships Exploration Rig Demand
•Add Exploration & Development Demand TOTAL FLOATER DEMAND
May 31, 2016 34
Categories 2015 2016 2017 2018 2019 2020 2021 2022 2023 2024 2025
Ordered 100% 100% 100% 100% 100% 100% 100% 100% 100% 100% 100%
Field in Production - Not Ordered 0% 80% 90% 100% 100% 100% 100% 100% 100% 100% 100%
Field Development in Progress - Not Ordered 0% 80% 90% 100% 100% 100% 100% 100% 100% 100% 100%
Firm Plan (FID) Early Stage Development - Not Ordered 0% 70% 75% 85% 90% 90% 90% 90% 90% 90% 90%
Probable 0% 0% 10% 50% 65% 65% 65% 65% 65% 65% 65%
Possible 0% 0% 15% 40% 45% 45% 45% 45% 45% 45% 45%
Carried Inventory 0% 50% 50% 60% 60% 65% 65% 65% 65% 65% 65%
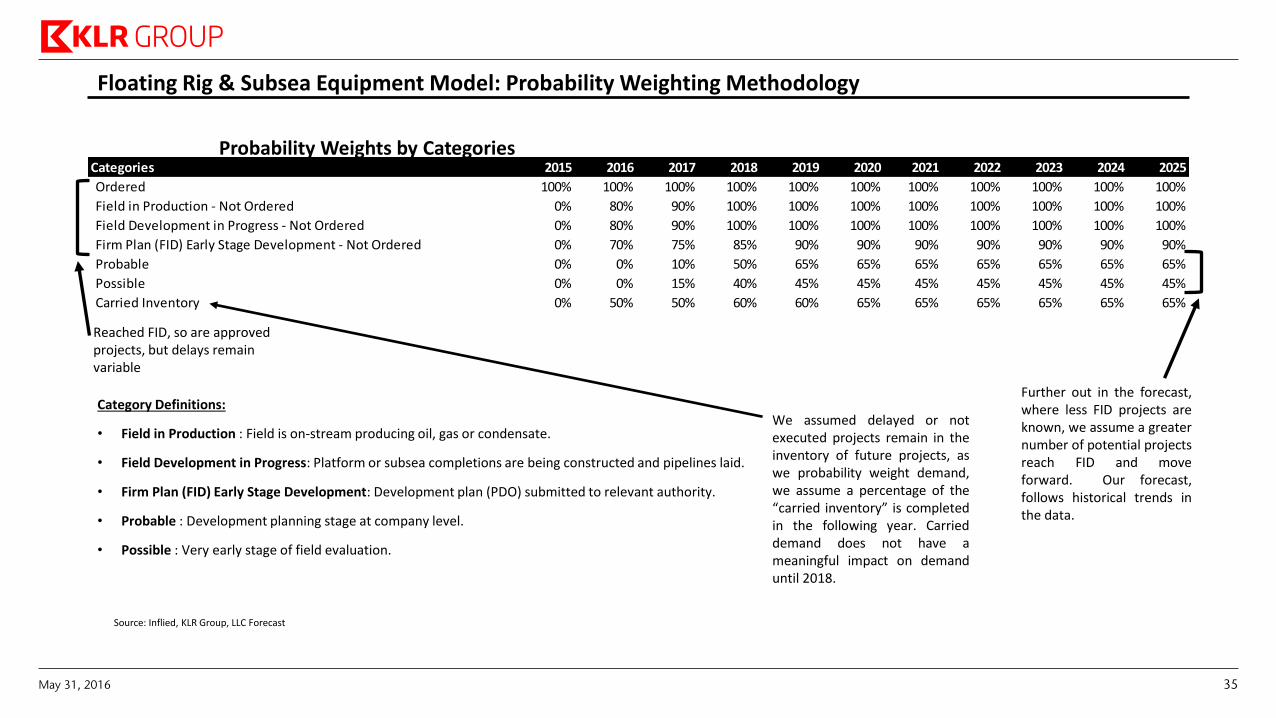
Floating Rig & Subsea Equipment Model: Probability Weighting Methodology
Category Definitions:
• Field in Production : Field is on-stream producing oil, gas or condensate.
• Field Development in Progress: Platform or subsea completions are being constructed and pipelines laid.
• Firm Plan (FID) Early Stage Development: Development plan (PDO) submitted to relevant authority.
• Probable : Development planning stage at company level.
• Possible : Very early stage of field evaluation.
Probability Weights by Categories
Reached FID, so are approved projects, but delays remain variable
We assumed delayed or not executed projects remain in the inventory of future projects, as we probability weight demand, we assume a percentage of the “carried inventory” is completed in the following year. Carried demand does not have a meaningful impact on demand until 2018.
Further out in the forecast, where less FID projects are known, we assume a greater number of potential projects reach FID and move forward. Our forecast, follows historical trends in the data.
Source: Inflied, KLR Group, LLC Forecast
May 31, 2016 35
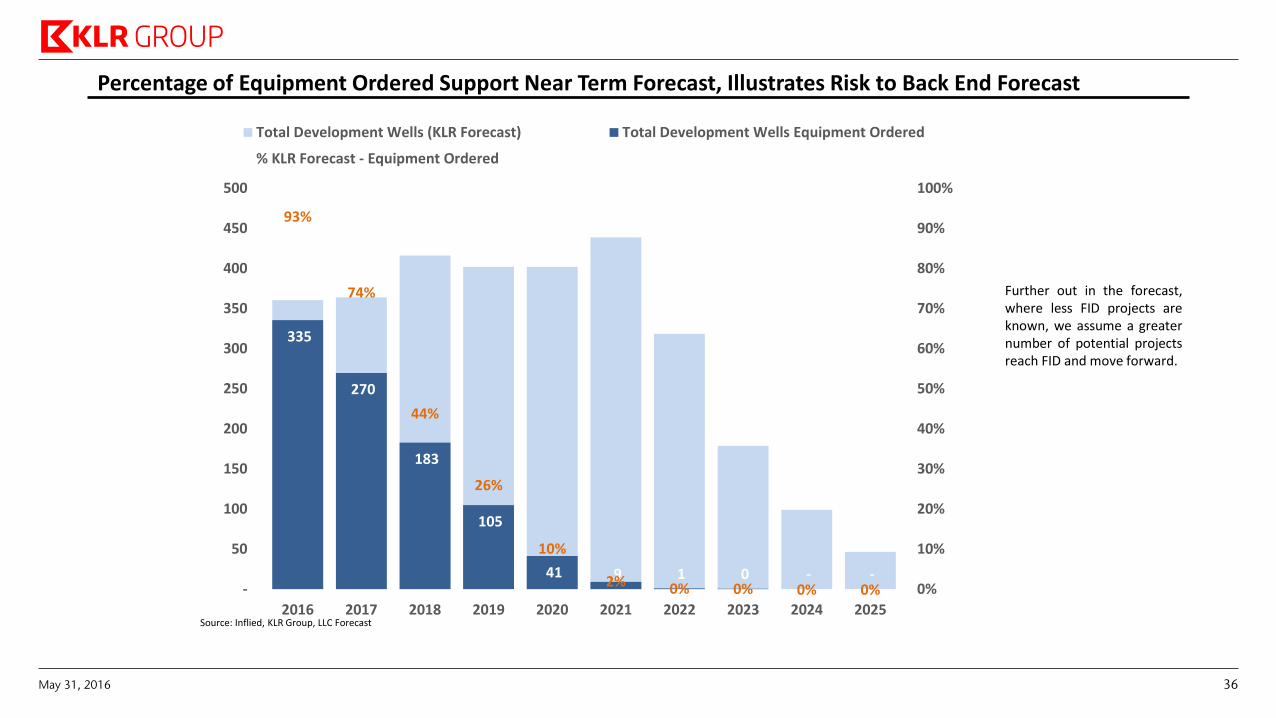
Percentage of Equipment Ordered Support Near Term Forecast, Illustrates Risk to Back End Forecast
Further out in the forecast, where less FID projects are known, we assume a greater number of potential projects reach FID and move forward.
Source: Infield, KLR Group, LLC Forecast
335
270
183
105
41 9 1 0 - -
93%
74%
44%
26%
10%
2% 0% 0% 0% 0% 0%
10%
20%
30%
40%
50%
60%
70%
80%
90%
100%
-
50
100
150
200
250
300
350
400
450
500
2016 2017 2018 2019 2020 2021 2022 2023 2024 2025
Total Development Wells (KLR Forecast) Total Development Wells Equipment Ordered
% KLR Forecast - Equipment Ordered
Source: Inflied, KLR Group, LLC Forecast
May 31, 2016 36
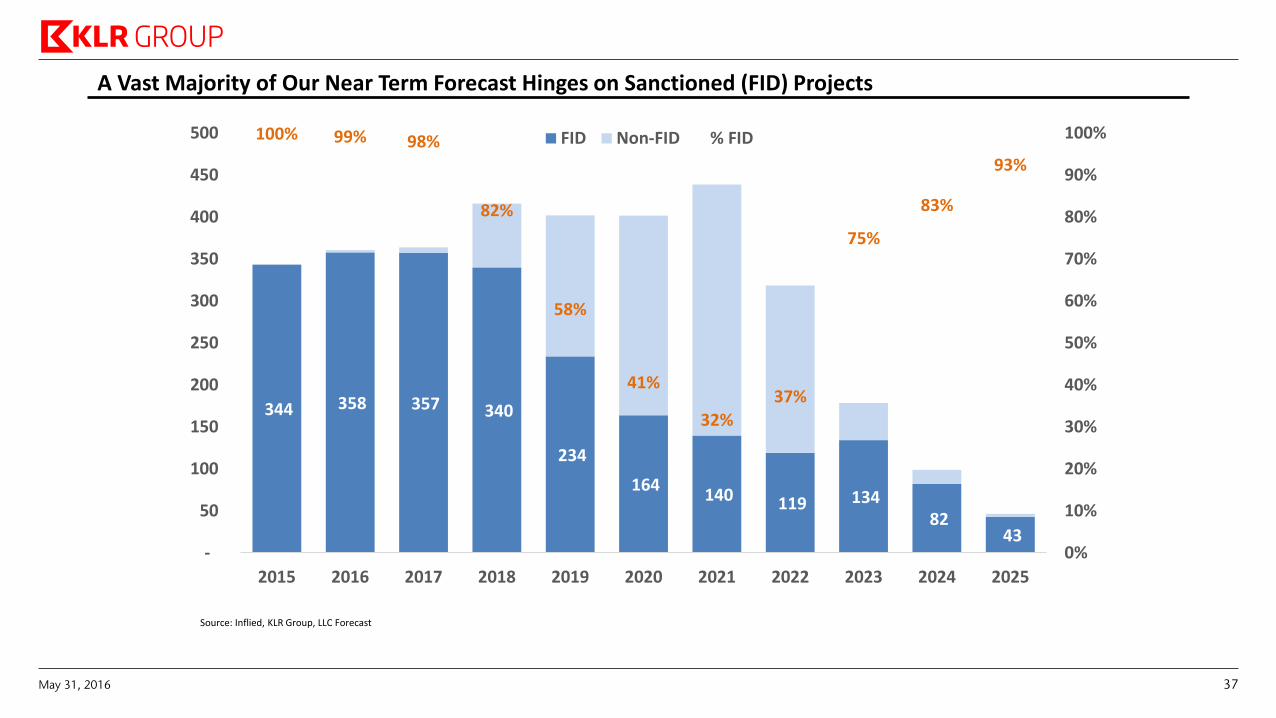
A Vast Majority of Our Near Term Forecast Hinges on Sanctioned (FID) Projects
344 358 357 340
234
164 140 119 134
82 43
100% 99% 98%
82%
58%
41%
32%
37%
75%
83%
93%
0%
10%
20%
30%
40%
50%
60%
70%
80%
90%
100%
-
50
100
150
200
250
300
350
400
450
500
2015 2016 2017 2018 2019 2020 2021 2022 2023 2024 2025
FID Non-FID % FID
Source: Inflied, KLR Group, LLC Forecast
May 31, 2016 37
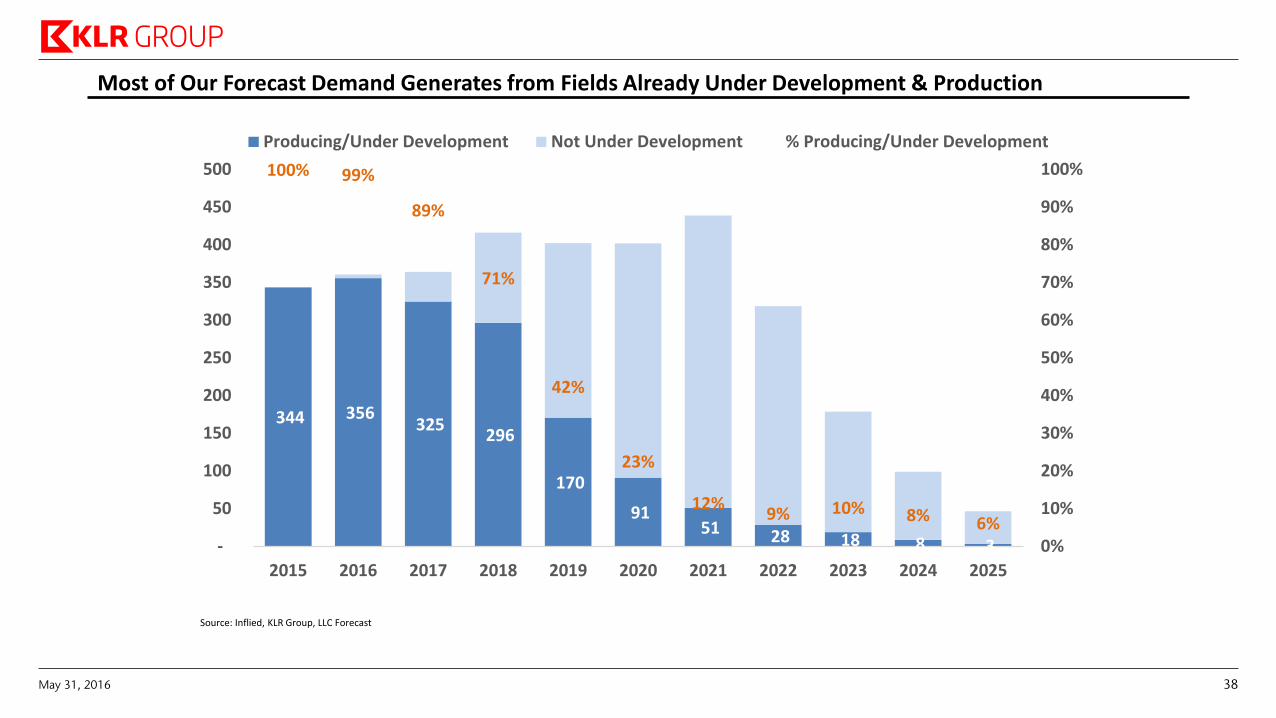
Most of Our Forecast Demand Generates from Fields Already Under Development & Production
344 356 325
296
170
91 51 28 18 8 3
100% 99%
89%
71%
42%
23%
12%9% 10% 8% 6%
0%
10%
20%
30%
40%
50%
60%
70%
80%
90%
100%
-
50
100
150
200
250
300
350
400
450
500
2015 2016 2017 2018 2019 2020 2021 2022 2023 2024 2025
Producing/Under Development Not Under Development % Producing/Under Development
Source: Inflied, KLR Group, LLC Forecast
May 31, 2016 38
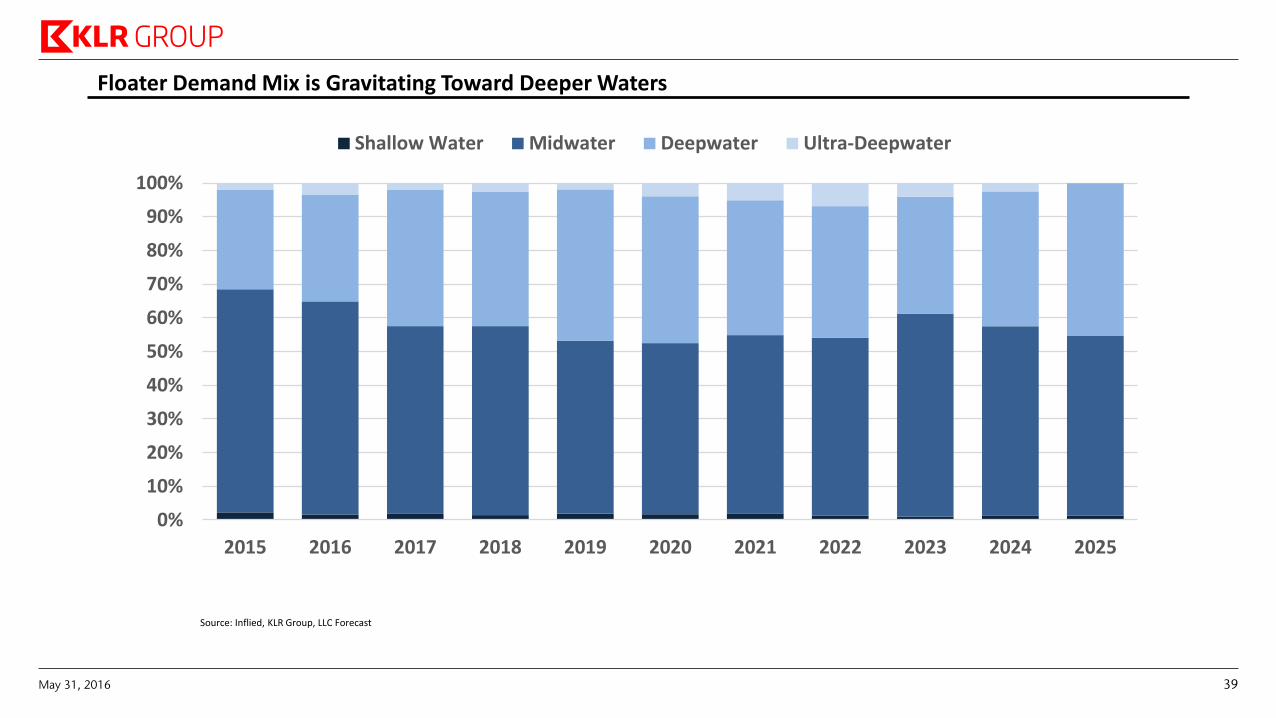
Floater Demand Mix is Gravitating Toward Deeper Waters
0%
10%
20%
30%
40%
50%
60%
70%
80%
90%
100%
2015 2016 2017 2018 2019 2020 2021 2022 2023 2024 2025
Shallow Water Midwater Deepwater Ultra-Deepwater
Source: Inflied, KLR Group, LLC Forecast
May 31, 2016 39

Offshore Jackup Market
May 31, 2016 40
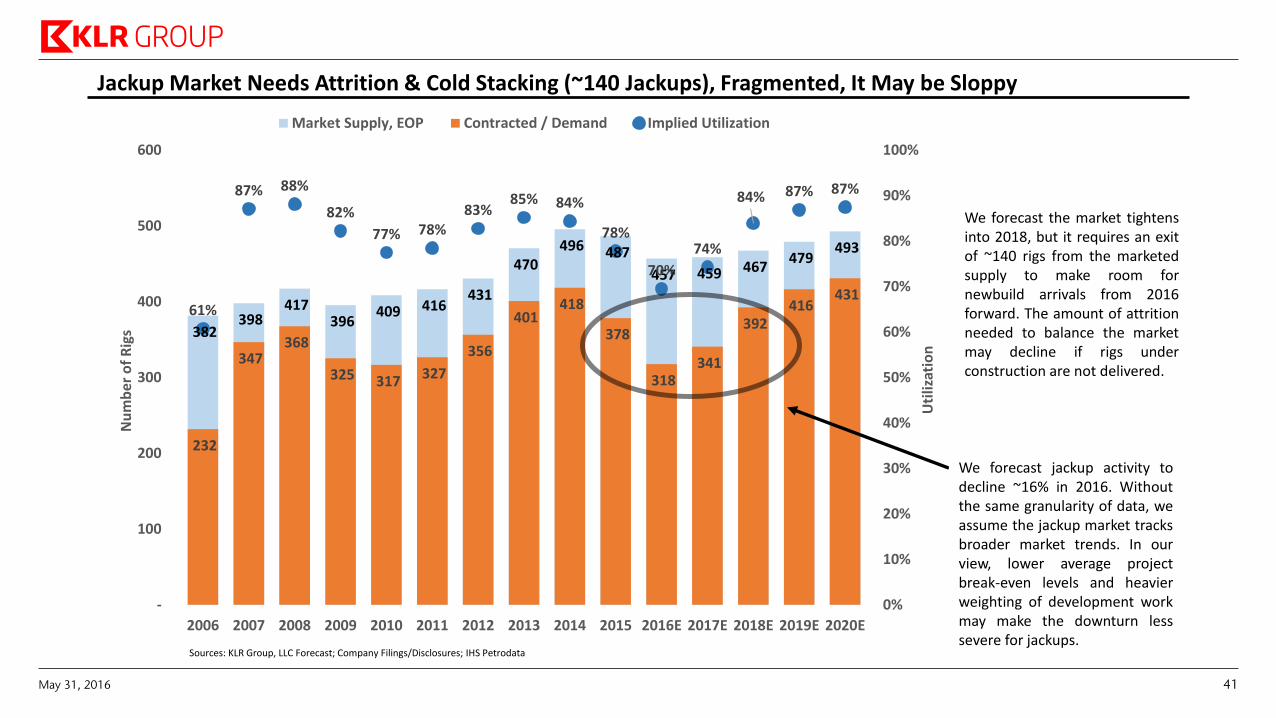
382 398
417 396
409 416 431
470 496 487
457 459 467 479
493
232
347 368
325 317 327
356
401 418
378
318 341
392 416
431 61%
87% 88%
82%
77% 78%83%
85% 84%
78%
70%
74%
84% 87% 87%
0%
10%
20%
30%
40%
50%
60%
70%
80%
90%
100%
-
100
200
300
400
500
600
2006 2007 2008 2009 2010 2011 2012 2013 2014 2015 2016E 2017E 2018E 2019E 2020E
Uti
lizat
ion
Nu
mb
er
of
Rig
sMarket Supply, EOP Contracted / Demand Implied Utilization
Jackup Market Needs Attrition & Cold Stacking (~140 Jackups), Fragmented, It May be Sloppy
We forecast jackup activity to decline ~16% in 2016. Without the same granularity of data, we assume the jackup market tracks broader market trends. In our view, lower average project break-even levels and heavier weighting of development work may make the downturn less severe for jackups.
We forecast the market tightens into 2018, but it requires an exit of ~140 rigs from the marketed supply to make room for newbuild arrivals from 2016 forward. The amount of attrition needed to balance the market may decline if rigs under construction are not delivered.
Sources: KLR Group, LLC Forecast; Company Filings/Disclosures; IHS Petrodata
May 31, 2016 41
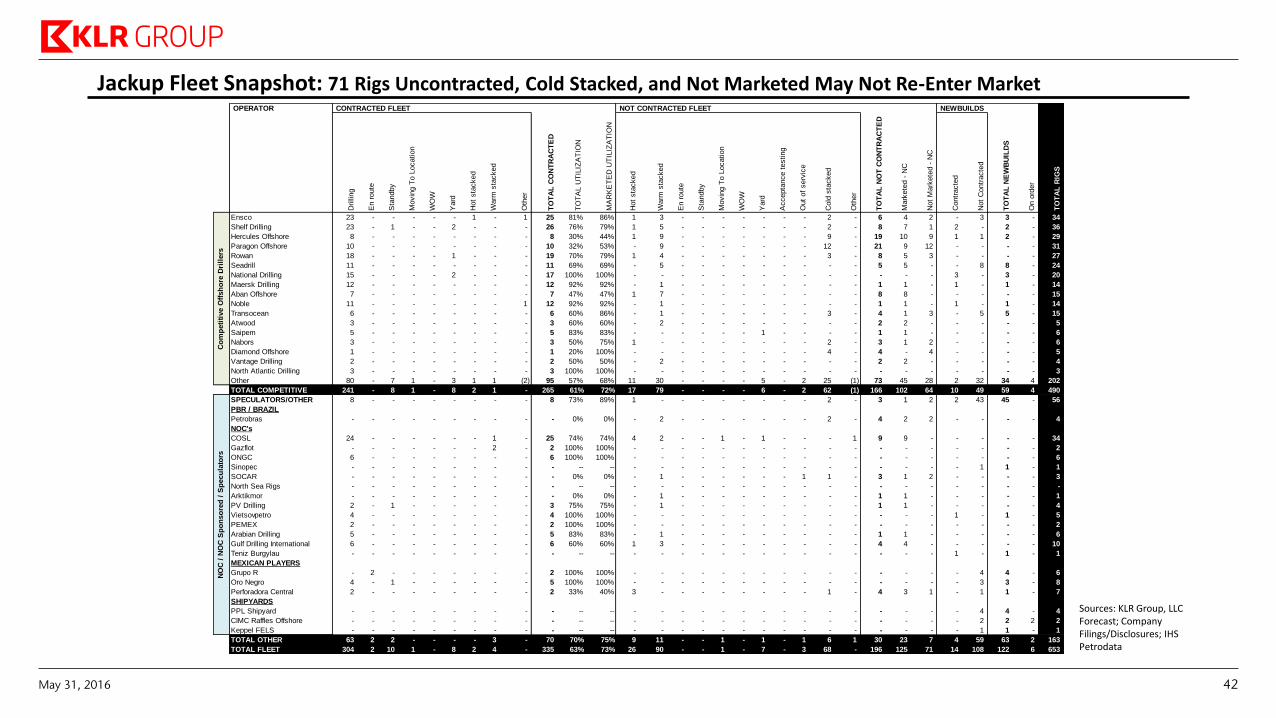
Jackup Fleet Snapshot: 71 Rigs Uncontracted, Cold Stacked, and Not Marketed May Not Re-Enter Market
Sources: KLR Group, LLC Forecast; Company Filings/Disclosures; IHS Petrodata
OPERATOR CONTRACTED FLEET NOT CONTRACTED FLEET NEWBUILDS
Drilli
ng
En r
oute
Sta
ndby
Movin
g T
o L
ocation
WO
W
Yard
Hot
sta
cked
Warm
sta
cked
Oth
er
TO
TA
L C
ON
TR
AC
TE
D
TO
TA
L U
TIL
IZA
TIO
N
MA
RK
ET
ED
UT
ILIZ
AT
ION
Hot
sta
cked
Warm
sta
cked
En r
oute
Sta
ndby
Movin
g T
o L
ocation
WO
W
Yard
Accepta
nce t
esting
Out
of
serv
ice
Cold
sta
cked
Oth
er
TO
TA
L N
OT
CO
NT
RA
CT
ED
Mark
ete
d -
NC
Not
Mark
ete
d -
NC
Contr
acte
d
Not
Contr
acte
d
TO
TA
L N
EW
BU
ILD
S
On o
rder
TO
TA
L R
IGS
Ensco 23 - - - - - 1 - 1 25 81% 86% 1 3 - - - - - - - 2 - 6 4 2 - 3 3 - 34
Shelf Drilling 23 - 1 - - 2 - - - 26 76% 79% 1 5 - - - - - - - 2 - 8 7 1 2 - 2 - 36
Hercules Offshore 8 - - - - - - - - 8 30% 44% 1 9 - - - - - - - 9 - 19 10 9 1 1 2 - 29
Paragon Offshore 10 - - - - - - - - 10 32% 53% - 9 - - - - - - - 12 - 21 9 12 - - - - 31
Rowan 18 - - - - 1 - - - 19 70% 79% 1 4 - - - - - - - 3 - 8 5 3 - - - - 27
Seadrill 11 - - - - - - - - 11 69% 69% - 5 - - - - - - - - - 5 5 - - 8 8 - 24
National Drilling 15 - - - - 2 - - - 17 100% 100% - - - - - - - - - - - - - - 3 - 3 - 20
Maersk Drilling 12 - - - - - - - - 12 92% 92% - 1 - - - - - - - - - 1 1 - 1 - 1 - 14
Aban Offshore 7 - - - - - - - - 7 47% 47% 1 7 - - - - - - - - - 8 8 - - - - - 15
Noble 11 - - - - - - - 1 12 92% 92% - 1 - - - - - - - - - 1 1 - 1 - 1 - 14
Transocean 6 - - - - - - - - 6 60% 86% - 1 - - - - - - - 3 - 4 1 3 - 5 5 - 15
Atwood 3 - - - - - - - - 3 60% 60% - 2 - - - - - - - - - 2 2 - - - - - 5
Saipem 5 - - - - - - - - 5 83% 83% - - - - - - 1 - - - - 1 1 - - - - - 6
Nabors 3 - - - - - - - - 3 50% 75% 1 - - - - - - - - 2 - 3 1 2 - - - - 6
Diamond Offshore 1 - - - - - - - - 1 20% 100% - - - - - - - - - 4 - 4 - 4 - - - - 5
Vantage Drilling 2 - - - - - - - - 2 50% 50% - 2 - - - - - - - - - 2 2 - - - - - 4
North Atlantic Drilling 3 - - - - - - - - 3 100% 100% - - - - - - - - - - - - - - - - - - 3
Other 80 - 7 1 - 3 1 1 (2) 95 57% 68% 11 30 - - - - 5 - 2 25 (1) 73 45 28 2 32 34 4 202
TOTAL COMPETITIVE 241 - 8 1 - 8 2 1 - 265 61% 72% 17 79 - - - - 6 - 2 62 (1) 166 102 64 10 49 59 4 490
SPECULATORS/OTHER 8 - - - - - - - - 8 73% 89% 1 - - - - - - - - 2 - 3 1 2 2 43 45 - 56
PBR / BRAZIL
Petrobras - - - - - - - - - - 0% 0% - 2 - - - - - - - 2 - 4 2 2 - - - - 4
NOC's
COSL 24 - - - - - - 1 - 25 74% 74% 4 2 - - 1 - 1 - - - 1 9 9 - - - - - 34
Gazflot - - - - - - - 2 - 2 100% 100% - - - - - - - - - - - - - - - - - - 2
ONGC 6 - - - - - - - - 6 100% 100% - - - - - - - - - - - - - - - - - - 6
Sinopec - - - - - - - - - - -- -- - - - - - - - - - - - - - - - 1 1 - 1
SOCAR - - - - - - - - - - 0% 0% - 1 - - - - - - 1 1 - 3 1 2 - - - - 3
North Sea Rigs - - - - - - - - - - -- -- - - - - - - - - - - - - - - - - - - -
Arktikmor - - - - - - - - - - 0% 0% - 1 - - - - - - - - - 1 1 - - - - - 1
PV Drilling 2 - 1 - - - - - - 3 75% 75% - 1 - - - - - - - - - 1 1 - - - - - 4
Vietsovpetro 4 - - - - - - - - 4 100% 100% - - - - - - - - - - - - - - 1 - 1 - 5
PEMEX 2 - - - - - - - - 2 100% 100% - - - - - - - - - - - - - - - - - - 2
Arabian Drilling 5 - - - - - - - - 5 83% 83% - 1 - - - - - - - - - 1 1 - - - - - 6
Gulf Drilling International 6 - - - - - - - - 6 60% 60% 1 3 - - - - - - - - - 4 4 - - - - - 10
Teniz Burgylau - - - - - - - - - - -- -- - - - - - - - - - - - - - - 1 - 1 - 1
MEXICAN PLAYERS
Grupo R - 2 - - - - - - - 2 100% 100% - - - - - - - - - - - - - - - 4 4 - 6
Oro Negro 4 - 1 - - - - - - 5 100% 100% - - - - - - - - - - - - - - - 3 3 - 8
Perforadora Central 2 - - - - - - - - 2 33% 40% 3 - - - - - - - - 1 - 4 3 1 - 1 1 - 7
SHIPYARDS
PPL Shipyard - - - - - - - - - - -- -- - - - - - - - - - - - - - - - 4 4 - 4
CIMC Raffles Offshore - - - - - - - - - - -- -- - - - - - - - - - - - - - - - 2 2 2 2
Keppel FELS - - - - - - - - - - -- -- - - - - - - - - - - - - - - - 1 1 - 1
TOTAL OTHER 63 2 2 - - - - 3 - 70 70% 75% 9 11 - - 1 - 1 - 1 6 1 30 23 7 4 59 63 2 163
TOTAL FLEET 304 2 10 1 - 8 2 4 - 335 63% 73% 26 90 - - 1 - 7 - 3 68 - 196 125 71 14 108 122 6 653
NO
C /
NO
C S
po
nso
red
/ S
pecu
lato
rsC
om
peti
tive O
ffsh
ore
Dri
llers
May 31, 2016 42
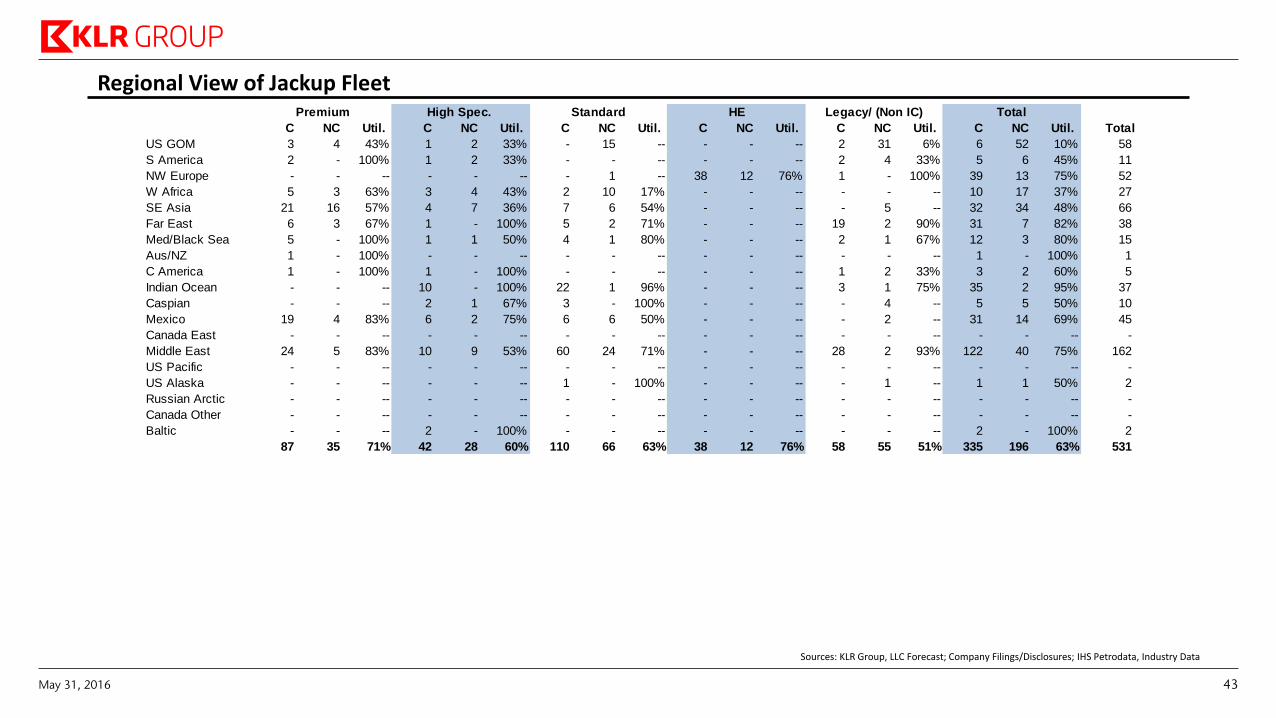
Regional View of Jackup Fleet Premium High Spec. Standard HE Legacy/ (Non IC) Total
C NC Util. C NC Util. C NC Util. C NC Util. C NC Util. C NC Util. Total
US GOM 3 4 43% 1 2 33% - 15 -- - - -- 2 31 6% 6 52 10% 58
S America 2 - 100% 1 2 33% - - -- - - -- 2 4 33% 5 6 45% 11
NW Europe - - -- - - -- - 1 -- 38 12 76% 1 - 100% 39 13 75% 52
W Africa 5 3 63% 3 4 43% 2 10 17% - - -- - - -- 10 17 37% 27
SE Asia 21 16 57% 4 7 36% 7 6 54% - - -- - 5 -- 32 34 48% 66
Far East 6 3 67% 1 - 100% 5 2 71% - - -- 19 2 90% 31 7 82% 38
Med/Black Sea 5 - 100% 1 1 50% 4 1 80% - - -- 2 1 67% 12 3 80% 15
Aus/NZ 1 - 100% - - -- - - -- - - -- - - -- 1 - 100% 1
C America 1 - 100% 1 - 100% - - -- - - -- 1 2 33% 3 2 60% 5
Indian Ocean - - -- 10 - 100% 22 1 96% - - -- 3 1 75% 35 2 95% 37
Caspian - - -- 2 1 67% 3 - 100% - - -- - 4 -- 5 5 50% 10
Mexico 19 4 83% 6 2 75% 6 6 50% - - -- - 2 -- 31 14 69% 45
Canada East - - -- - - -- - - -- - - -- - - -- - - -- -
Middle East 24 5 83% 10 9 53% 60 24 71% - - -- 28 2 93% 122 40 75% 162
US Pacific - - -- - - -- - - -- - - -- - - -- - - -- -
US Alaska - - -- - - -- 1 - 100% - - -- - 1 -- 1 1 50% 2
Russian Arctic - - -- - - -- - - -- - - -- - - -- - - -- -
Canada Other - - -- - - -- - - -- - - -- - - -- - - -- -
Baltic - - -- 2 - 100% - - -- - - -- - - -- 2 - 100% 2
87 35 71% 42 28 60% 110 66 63% 38 12 76% 58 55 51% 335 196 63% 531
Sources: KLR Group, LLC Forecast; Company Filings/Disclosures; IHS Petrodata, Industry Data
May 31, 2016 43
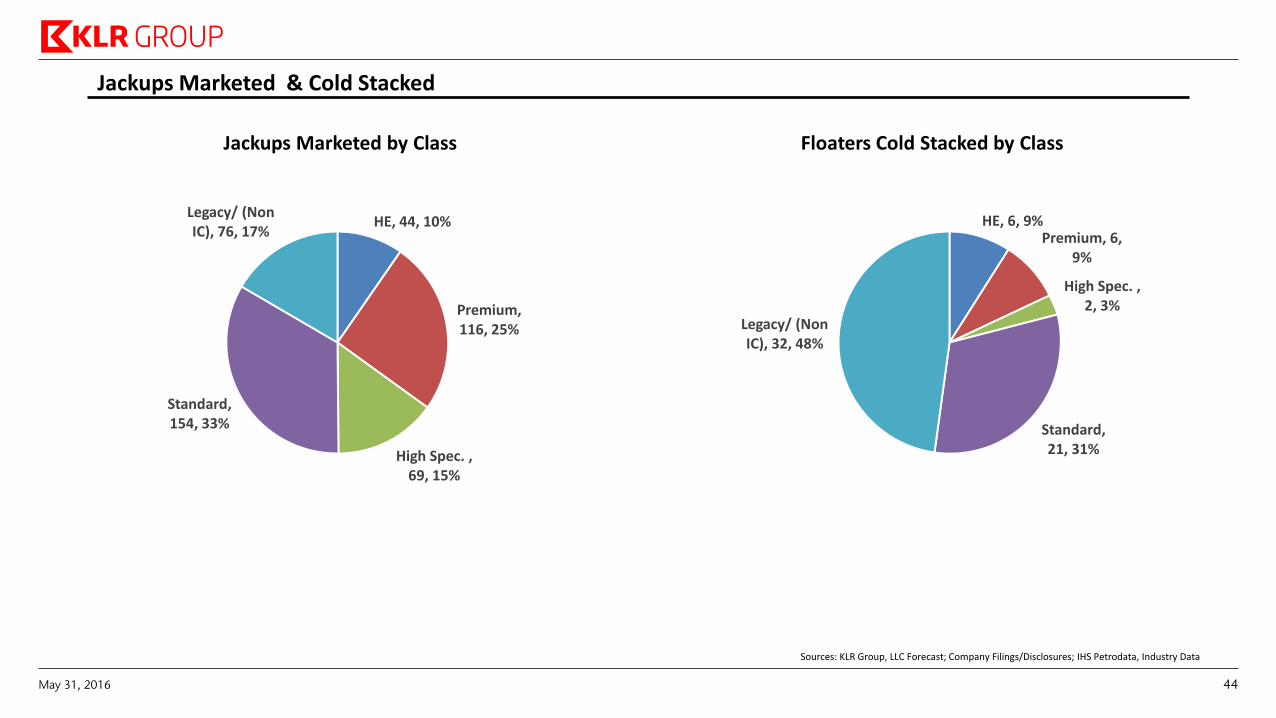
Jackups Marketed & Cold Stacked
HE, 44, 10%
Premium, 116, 25%
High Spec. , 69, 15%
Standard, 154, 33%
Legacy/ (Non IC), 76, 17%
HE, 6, 9%Premium, 6,
9%
High Spec. , 2, 3%
Standard, 21, 31%
Legacy/ (Non IC), 32, 48%
Jackups Marketed by Class Floaters Cold Stacked by Class
Sources: KLR Group, LLC Forecast; Company Filings/Disclosures; IHS Petrodata, Industry Data
May 31, 2016 44
Offshore Rig Supply & Attrition
May 31, 2016 45
Floater Supply Forecast
Jackup Supply Forecast
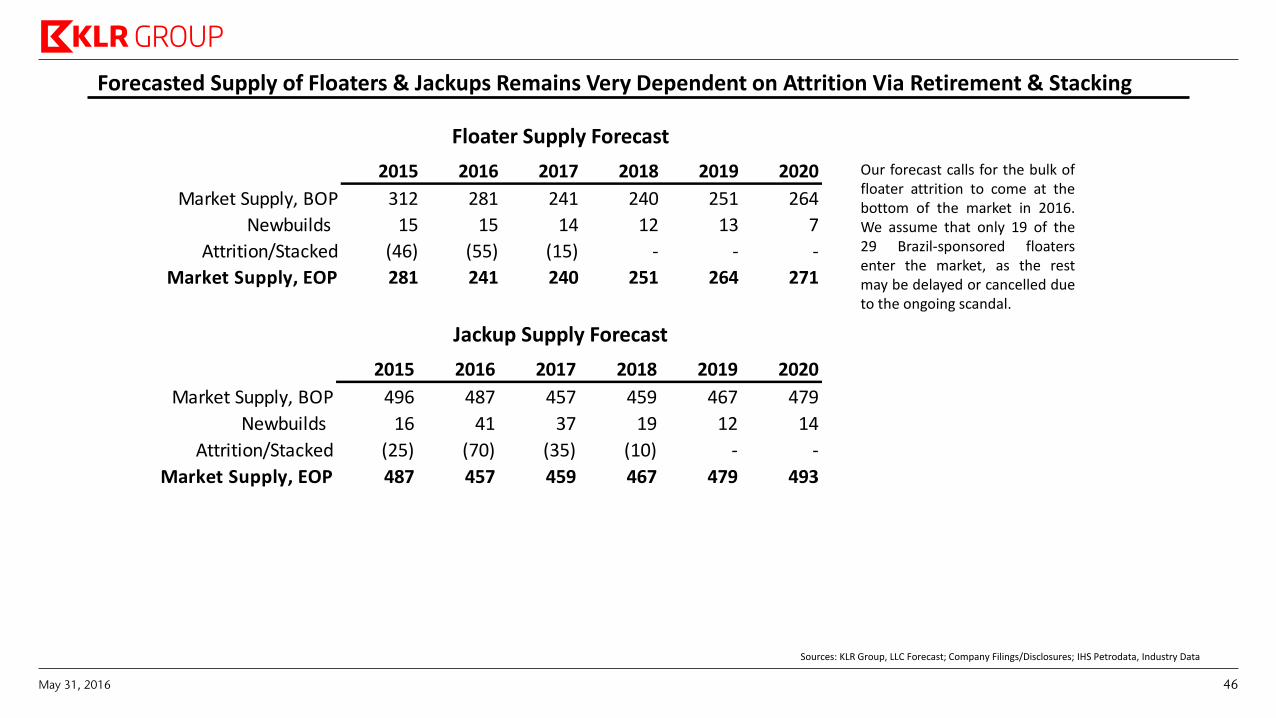
Forecasted Supply of Floaters & Jackups Remains Very Dependent on Attrition Via Retirement & Stacking
Our forecast calls for the bulk of floater attrition to come at the bottom of the market in 2016. We assume that only 19 of the 29 Brazil-sponsored floaters enter the market, as the rest may be delayed or cancelled due to the ongoing scandal.
2015 2016 2017 2018 2019 2020
Market Supply, BOP 496 487 457 459 467 479
Newbuilds 16 41 37 19 12 14
Attrition/Stacked (25) (70) (35) (10) - -
Market Supply, EOP 487 457 459 467 479 493
2015 2016 2017 2018 2019 2020
Market Supply, BOP 312 281 241 240 251 264
Newbuilds 15 15 14 12 13 7
Attrition/Stacked (46) (55) (15) - - -
Market Supply, EOP 281 241 240 251 264 271
Sources: KLR Group, LLC Forecast; Company Filings/Disclosures; IHS Petrodata, Industry Data
May 31, 2016 46
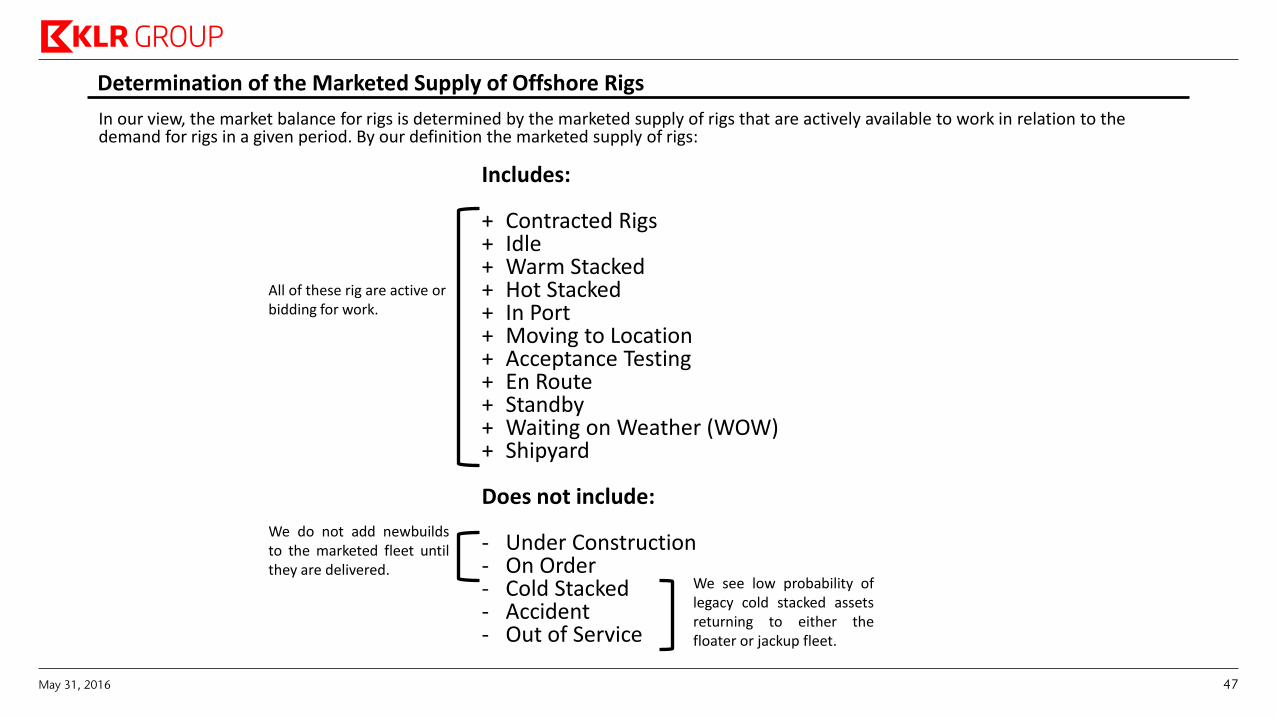
Determination of the Marketed Supply of Offshore Rigs
In our view, the market balance for rigs is determined by the marketed supply of rigs that are actively available to work in relation to the demand for rigs in a given period. By our definition the marketed supply of rigs:
Includes: + Contracted Rigs + Idle + Warm Stacked + Hot Stacked + In Port + Moving to Location + Acceptance Testing + En Route + Standby + Waiting on Weather (WOW) + Shipyard
Does not include:
- Under Construction - On Order - Cold Stacked - Accident - Out of Service
All of these rig are active or bidding for work.
We do not add newbuilds to the marketed fleet until they are delivered.
We see low probability of legacy cold stacked assets returning to either the floater or jackup fleet.
May 31, 2016 47
0 0 0
6
14 14 10
1 1 4 4
0 1
9
21 22
31
19
13
24
15 15
(4)(2) (1) (1)
0 0 0 0 (3)
(7)(4)
0 (1)
0
0
(2) (1) (2)0
(15)
(30)
(15)
(40)
(30)
(20)
(10)
-
10
20
30
40
19
95
19
96
19
97
19
98
19
99
20
00
20
01
20
02
20
03
20
04
20
05
20
06
20
07
20
08
20
09
20
10
20
11
20
12
20
13
20
14
20
15
20
16
Rig
s (R
etir
ed
) /
Ad
de
dNewbuilds Retirements
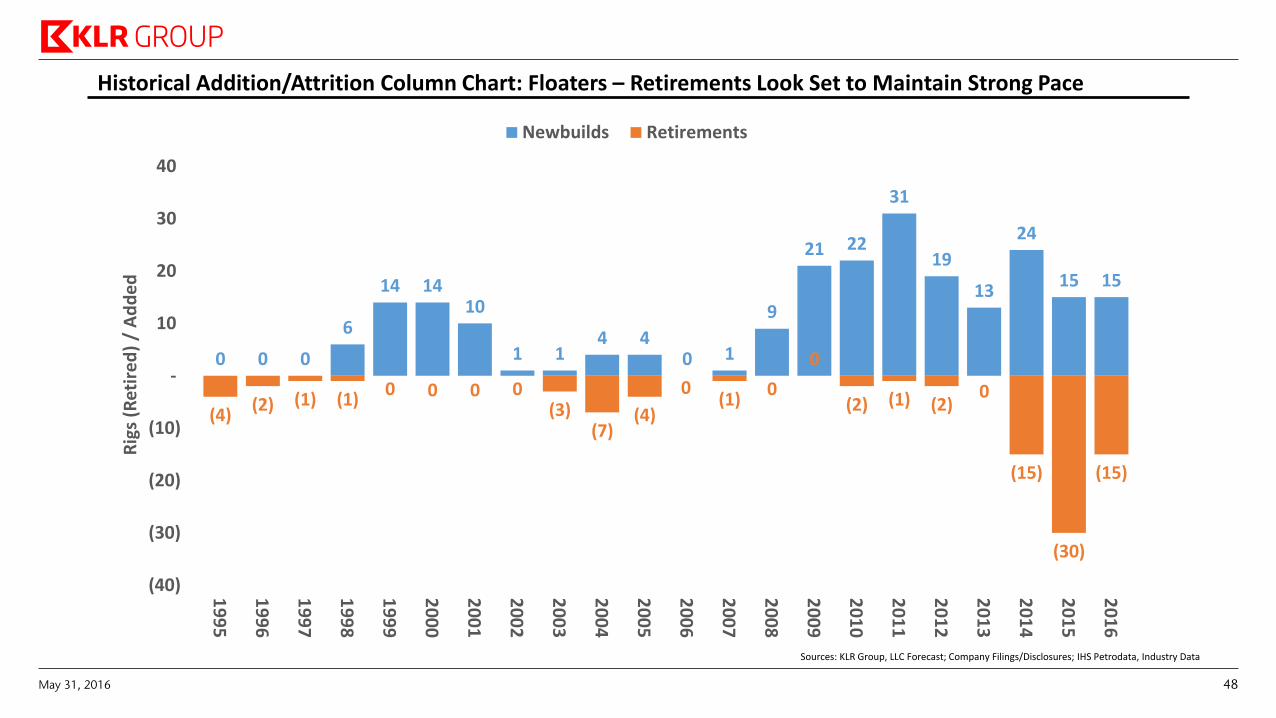
Historical Addition/Attrition Column Chart: Floaters – Retirements Look Set to Maintain Strong Pace
Sources: KLR Group, LLC Forecast; Company Filings/Disclosures; IHS Petrodata, Industry Data
May 31, 2016 48
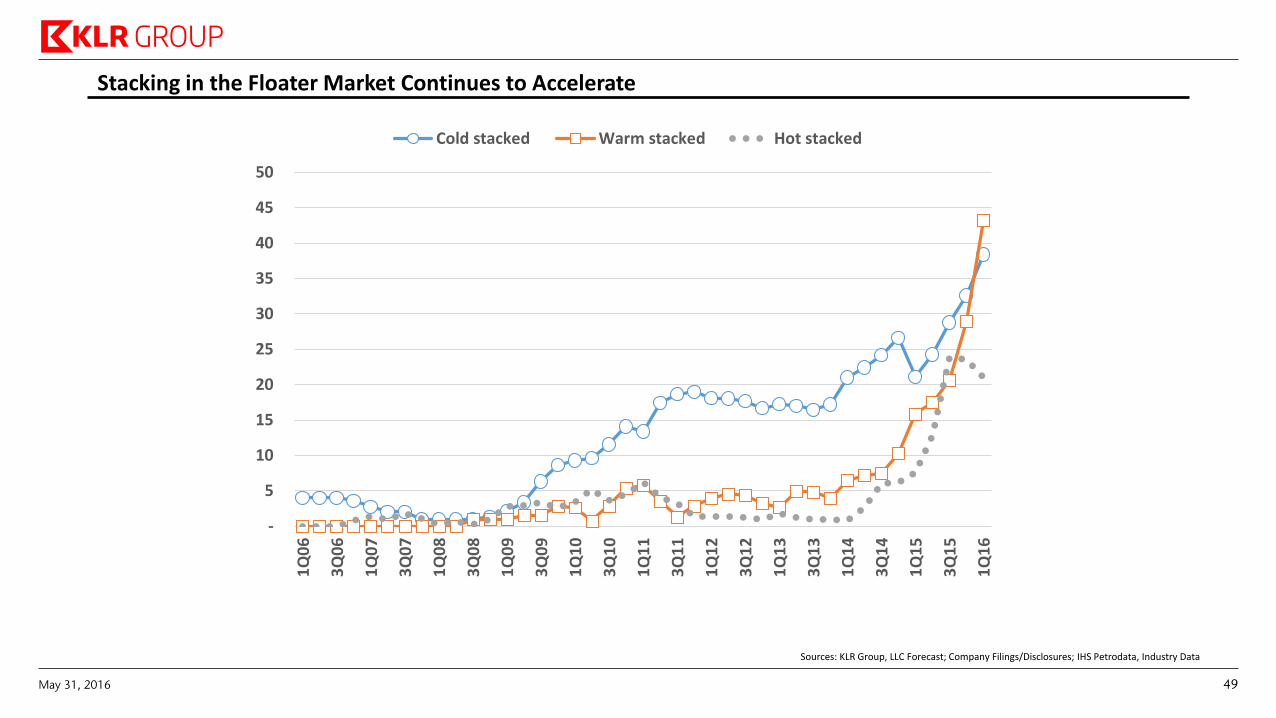
Stacking in the Floater Market Continues to Accelerate
-
5
10
15
20
25
30
35
40
45
50
1Q
06
3Q
06
1Q
07
3Q
07
1Q
08
3Q
08
1Q
09
3Q
09
1Q
10
3Q
10
1Q
11
3Q
11
1Q
12
3Q
12
1Q
13
3Q
13
1Q
14
3Q
14
1Q
15
3Q
15
1Q
16
Cold stacked Warm stacked Hot stacked
Sources: KLR Group, LLC Forecast; Company Filings/Disclosures; IHS Petrodata, Industry Data
May 31, 2016 49
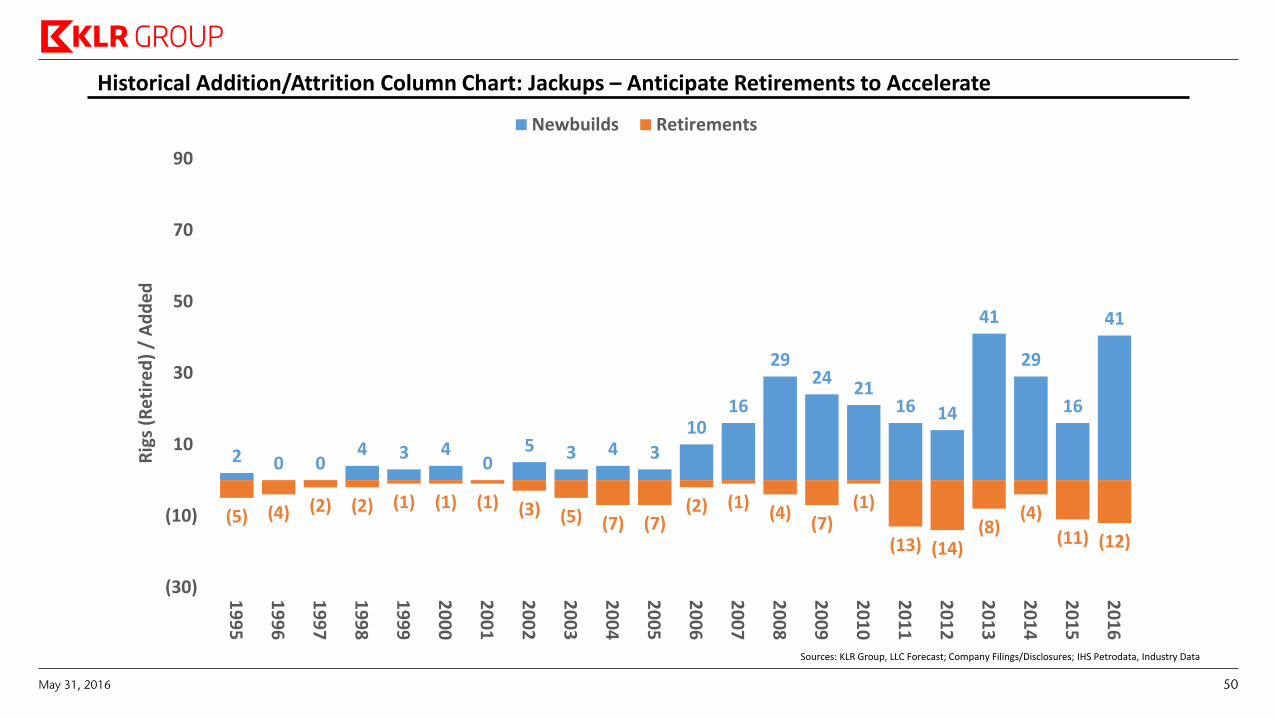
Historical Addition/Attrition Column Chart: Jackups – Anticipate Retirements to Accelerate
2 0 0 4 3 4
0 5 3 4 3
10 16
29 24
21 16 14
41
29
16
41
(5) (4) (2) (2) (1) (1) (1) (3) (5) (7) (7)(2) (1)
(4)(7)
(1)
(13) (14)(8)
(4)
(11) (12)
(30)
(10)
10
30
50
70
90
19
95
19
96
19
97
19
98
19
99
20
00
20
01
20
02
20
03
20
04
20
05
20
06
20
07
20
08
20
09
20
10
20
11
20
12
20
13
20
14
20
15
20
16
Rig
s (R
etir
ed
) /
Ad
de
dNewbuilds Retirements
Sources: KLR Group, LLC Forecast; Company Filings/Disclosures; IHS Petrodata, Industry Data
May 31, 2016 50
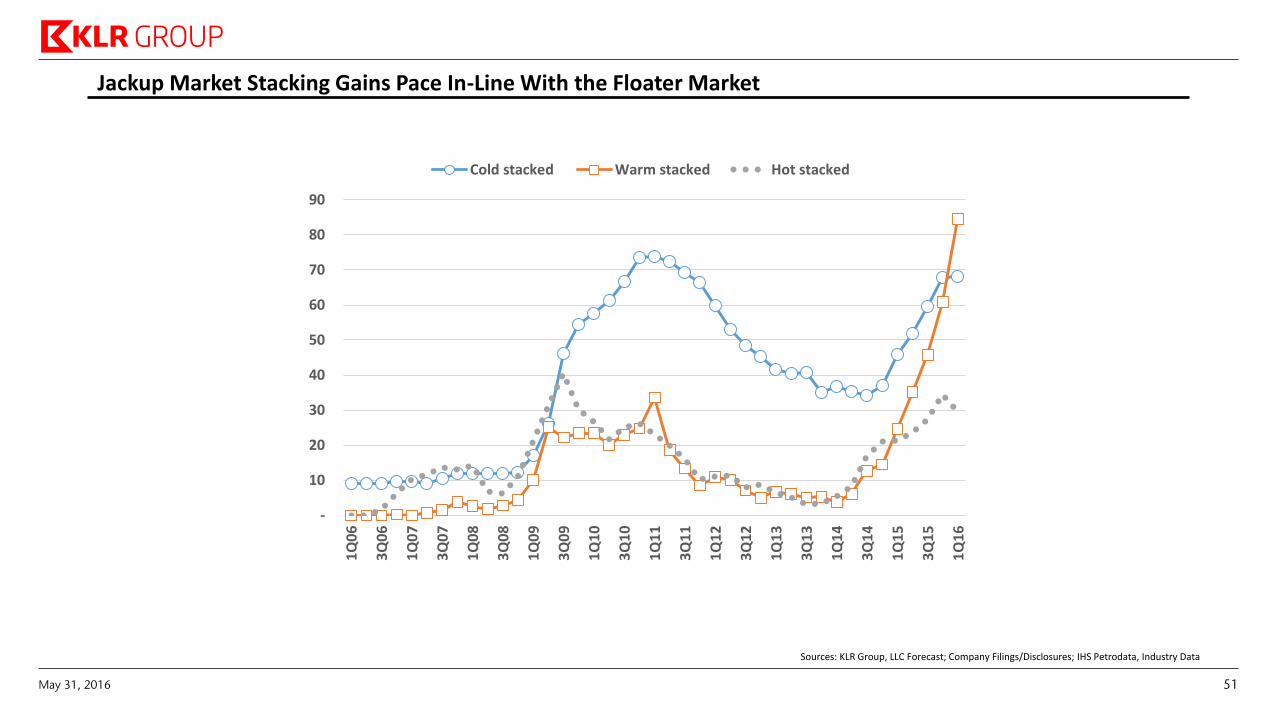
Jackup Market Stacking Gains Pace In-Line With the Floater Market
-
10
20
30
40
50
60
70
80
90
1Q
06
3Q
06
1Q
07
3Q
07
1Q
08
3Q
08
1Q
09
3Q
09
1Q
10
3Q
10
1Q
11
3Q
11
1Q
12
3Q
12
1Q
13
3Q
13
1Q
14
3Q
14
1Q
15
3Q
15
1Q
16
Cold stacked Warm stacked Hot stacked
Sources: KLR Group, LLC Forecast; Company Filings/Disclosures; IHS Petrodata, Industry Data
May 31, 2016 51
-
0.10
0.20
0.30
0.40
0.50
0.60
0.70
0.80
0.90
1.00
1.10
1.20
1.30
1.40
19
68
19
69
19
70
19
71
19
72
19
73
19
74
19
75
19
76
19
77
19
78
19
79
19
80
19
81
19
82
19
83
19
84
19
85
19
86
19
87
19
88
19
89
19
90
19
91
19
92
19
93
19
94
19
95
19
96
19
97
19
98
19
99
20
00
20
01
20
02
20
03
20
04
20
05
20
06
20
07
20
08
20
09
20
10
20
11
20
12
20
13
20
14
20
15
20
16
20
17
20
18
20
19
20
20
20
21
20
22
20
23
20
24
20
25
Rig
Fac
tor
Sco
re
Rig Delivery Year
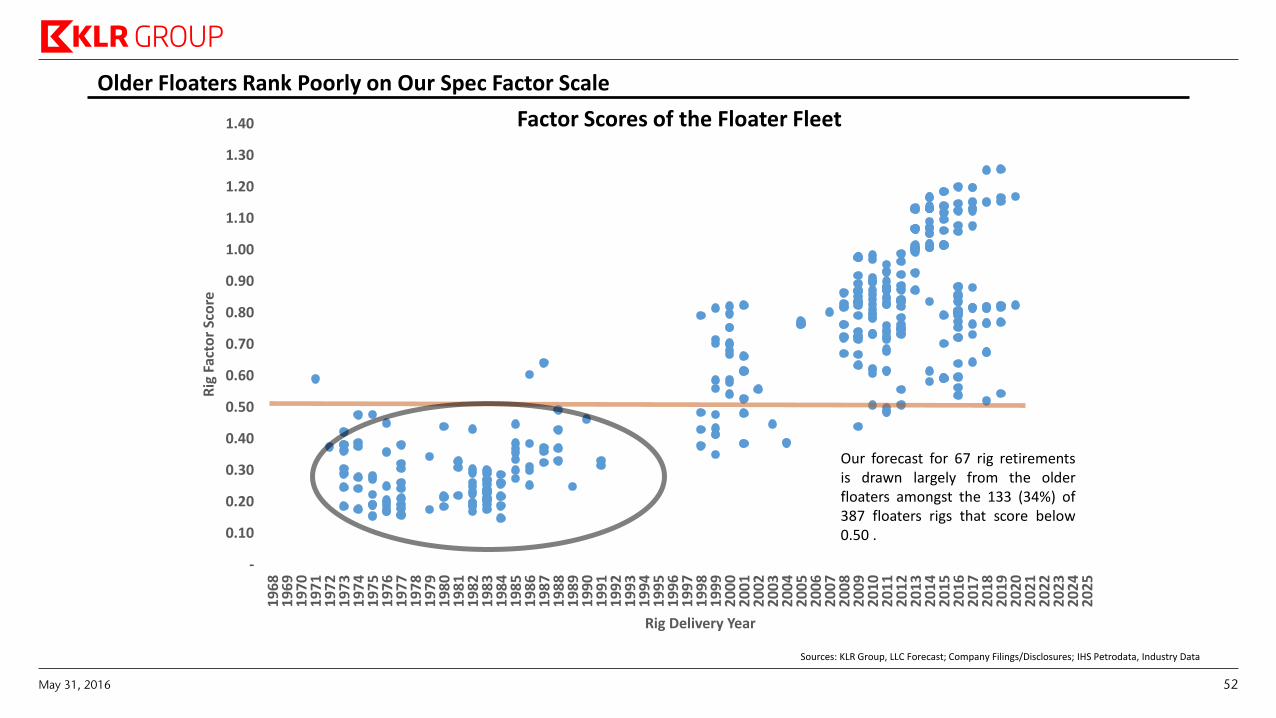
Older Floaters Rank Poorly on Our Spec Factor Scale
Our forecast for 67 rig retirements is drawn largely from the older floaters amongst the 133 (34%) of 387 floaters rigs that score below 0.50 .
Factor Scores of the Floater Fleet
Sources: KLR Group, LLC Forecast; Company Filings/Disclosures; IHS Petrodata, Industry Data
May 31, 2016 52
-
0.10
0.20
0.30
0.40
0.50
0.60
0.70
0.80
0.90
1.00
1.10
1.20
1.30
1.40
1.50
1.60
19
60
19
61
19
62
19
63
19
64
19
65
19
66
19
67
19
68
19
69
19
70
19
71
19
72
19
73
19
74
19
75
19
76
19
77
19
78
19
79
19
80
19
81
19
82
19
83
19
84
19
85
19
86
19
87
19
88
19
89
19
90
19
91
19
92
19
93
19
94
19
95
19
96
19
97
19
98
19
99
20
00
20
01
20
02
20
03
20
04
20
05
20
06
20
07
20
08
20
09
20
10
20
11
20
12
20
13
20
14
20
15
20
16
20
17
20
18
20
19
20
20
Rig
Fac
tor
Sco
re
Rig Delivery Year
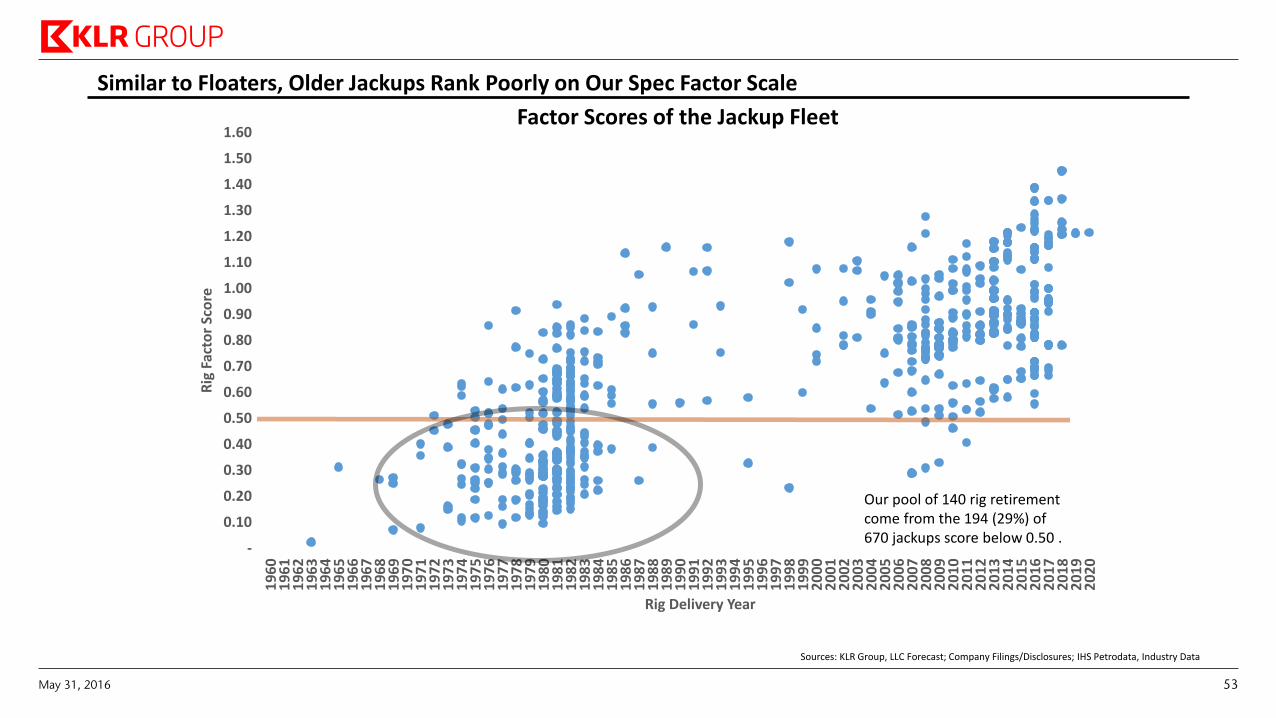
Similar to Floaters, Older Jackups Rank Poorly on Our Spec Factor Scale
Our pool of 140 rig retirement come from the 194 (29%) of 670 jackups score below 0.50 .
Factor Scores of the Jackup Fleet
Sources: KLR Group, LLC Forecast; Company Filings/Disclosures; IHS Petrodata, Industry Data
May 31, 2016 53
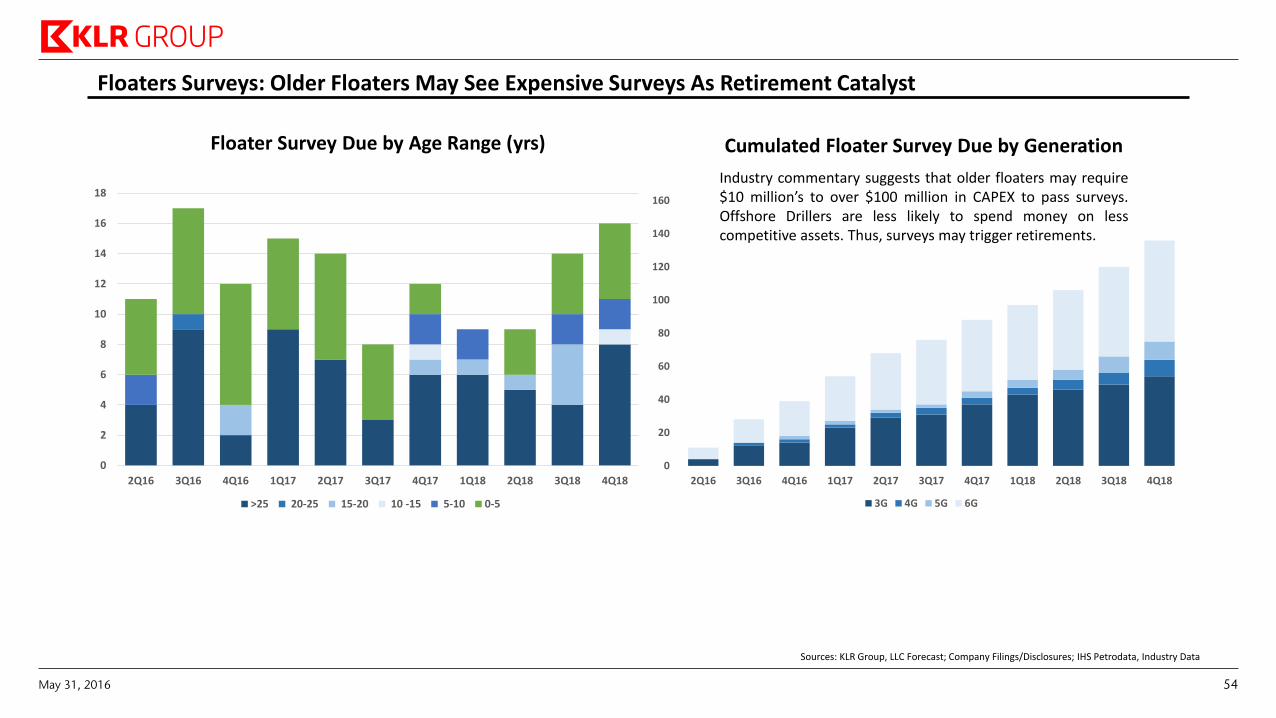
Floaters Surveys: Older Floaters May See Expensive Surveys As Retirement Catalyst
0
2
4
6
8
10
12
14
16
18
2Q16 3Q16 4Q16 1Q17 2Q17 3Q17 4Q17 1Q18 2Q18 3Q18 4Q18
>25 20-25 15-20 10 -15 5-10 0-5
0
20
40
60
80
100
120
140
160
2Q16 3Q16 4Q16 1Q17 2Q17 3Q17 4Q17 1Q18 2Q18 3Q18 4Q18
3G 4G 5G 6G
Floater Survey Due by Age Range (yrs) Cumulated Floater Survey Due by Generation
Industry commentary suggests that older floaters may require $10 million’s to over $100 million in CAPEX to pass surveys. Offshore Drillers are less likely to spend money on less competitive assets. Thus, surveys may trigger retirements.
Sources: KLR Group, LLC Forecast; Company Filings/Disclosures; IHS Petrodata, Industry Data
May 31, 2016 54
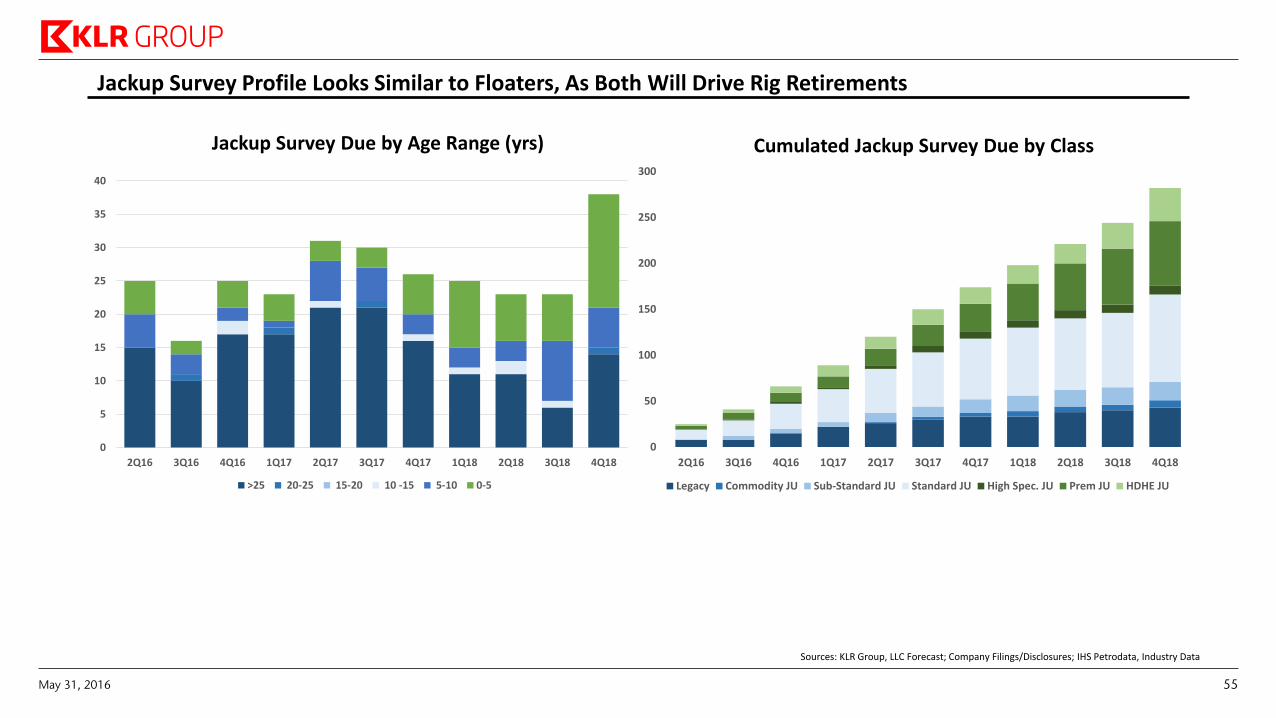
Jackup Survey Profile Looks Similar to Floaters, As Both Will Drive Rig Retirements
0
5
10
15
20
25
30
35
40
2Q16 3Q16 4Q16 1Q17 2Q17 3Q17 4Q17 1Q18 2Q18 3Q18 4Q18
>25 20-25 15-20 10 -15 5-10 0-5
0
50
100
150
200
250
300
2Q16 3Q16 4Q16 1Q17 2Q17 3Q17 4Q17 1Q18 2Q18 3Q18 4Q18
Legacy Commodity JU Sub-Standard JU Standard JU High Spec. JU Prem JU HDHE JU
Jackup Survey Due by Age Range (yrs) Cumulated Jackup Survey Due by Class
Sources: KLR Group, LLC Forecast; Company Filings/Disclosures; IHS Petrodata, Industry Data
May 31, 2016 55
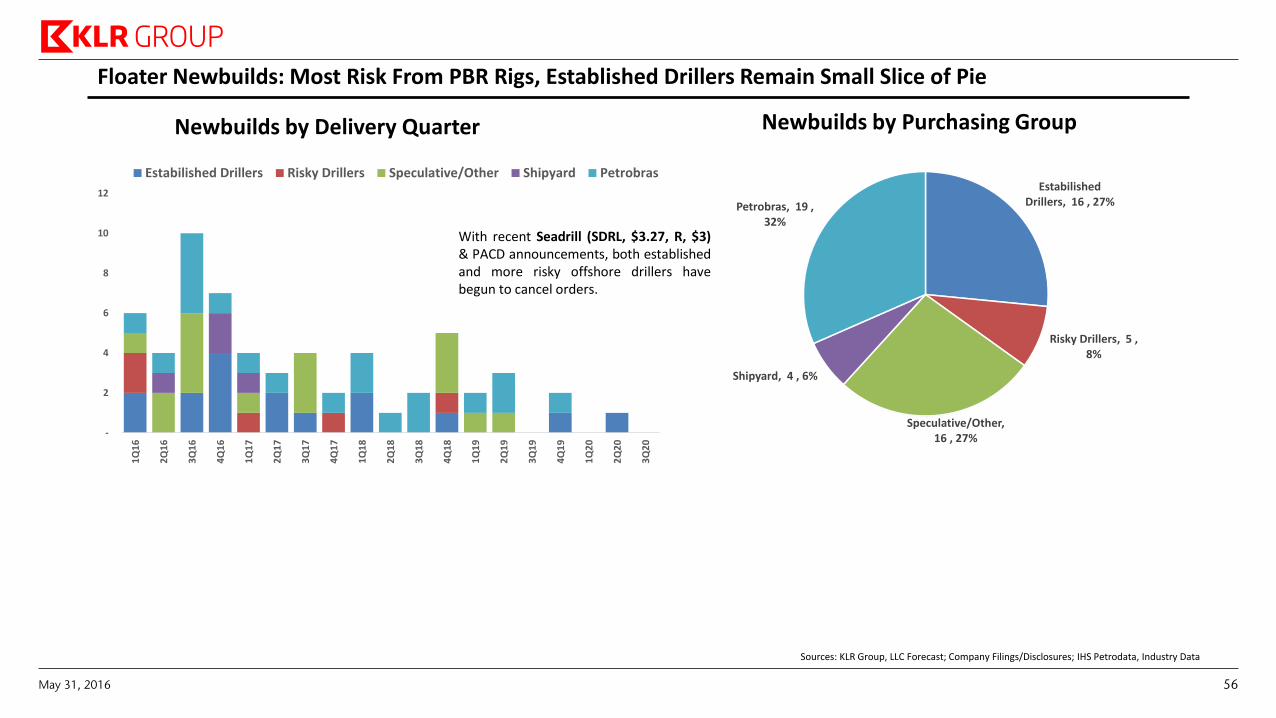
-
2
4
6
8
10
12
1Q
16
2Q
16
3Q
16
4Q
16
1Q
17
2Q
17
3Q
17
4Q
17
1Q
18
2Q
18
3Q
18
4Q
18
1Q
19
2Q
19
3Q
19
4Q
19
1Q
20
2Q
20
3Q
20
Estabilished Drillers Risky Drillers Speculative/Other Shipyard PetrobrasEstabilished
Drillers, 16 , 27%
Risky Drillers, 5 , 8%
Speculative/Other, 16 , 27%
Shipyard, 4 , 6%
Petrobras, 19 , 32%
Floater Newbuilds: Most Risk From PBR Rigs, Established Drillers Remain Small Slice of Pie
Newbuilds by Delivery Quarter Newbuilds by Purchasing Group
With recent Seadrill (SDRL, $3.27, R, $3) & PACD announcements, both established and more risky offshore drillers have begun to cancel orders.
Sources: KLR Group, LLC Forecast; Company Filings/Disclosures; IHS Petrodata, Industry Data
May 31, 2016 56
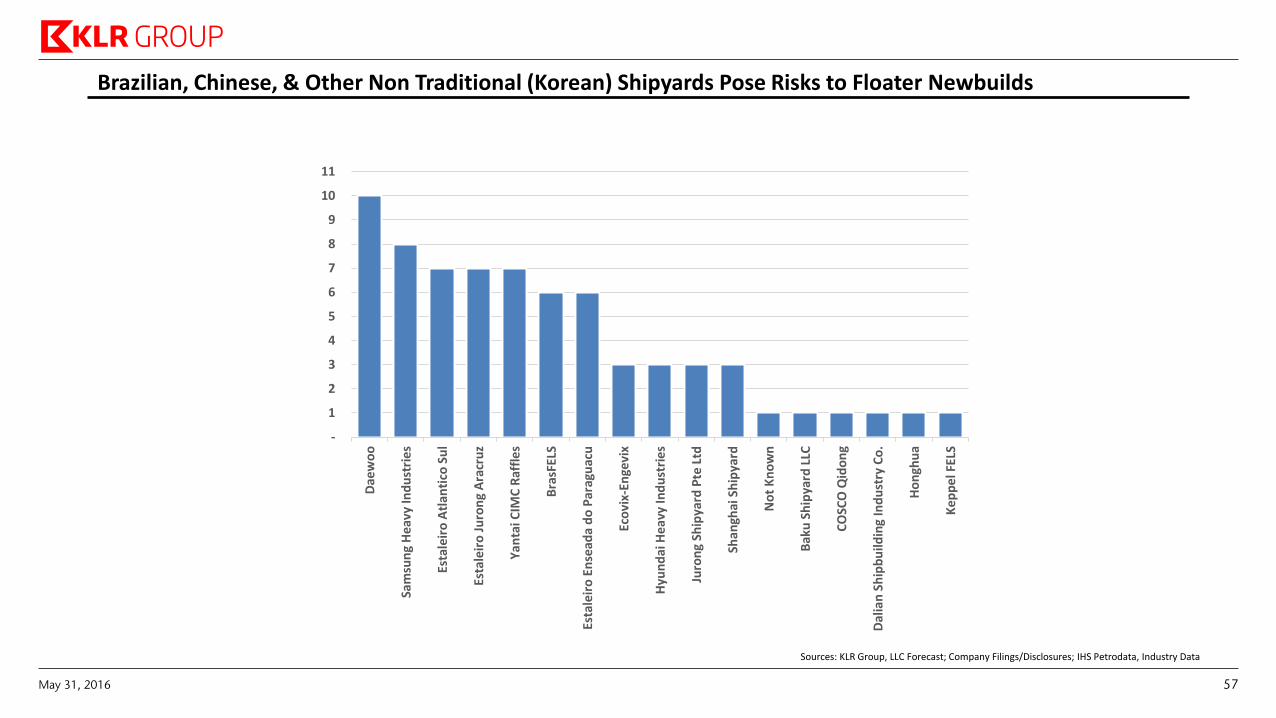
Brazilian, Chinese, & Other Non Traditional (Korean) Shipyards Pose Risks to Floater Newbuilds
-
1
2
3
4
5
6
7
8
9
10
11
Dae
wo
o
Sam
sun
g H
eavy
Ind
ust
ries
Esta
leir
o A
tlan
tico
Su
l
Esta
leir
o J
uro
ng
Ara
cru
z
Yan
tai C
IMC
Raf
fles
Bra
sFEL
S
Esta
leir
o E
nse
ada
do
Par
agu
acu
Eco
vix-
Enge
vix
Hyu
nd
ai H
eavy
Ind
ust
ries
Juro
ng
Ship
yard
Pte
Ltd
Shan
ghai
Sh
ipya
rd
No
t K
no
wn
Bak
u S
hip
yard
LLC
CO
SCO
Qid
on
g
Dal
ian
Sh
ipb
uild
ing
Ind
ust
ry C
o.
Ho
ngh
ua
Kep
pel
FEL
S
Sources: KLR Group, LLC Forecast; Company Filings/Disclosures; IHS Petrodata, Industry Data
May 31, 2016 57
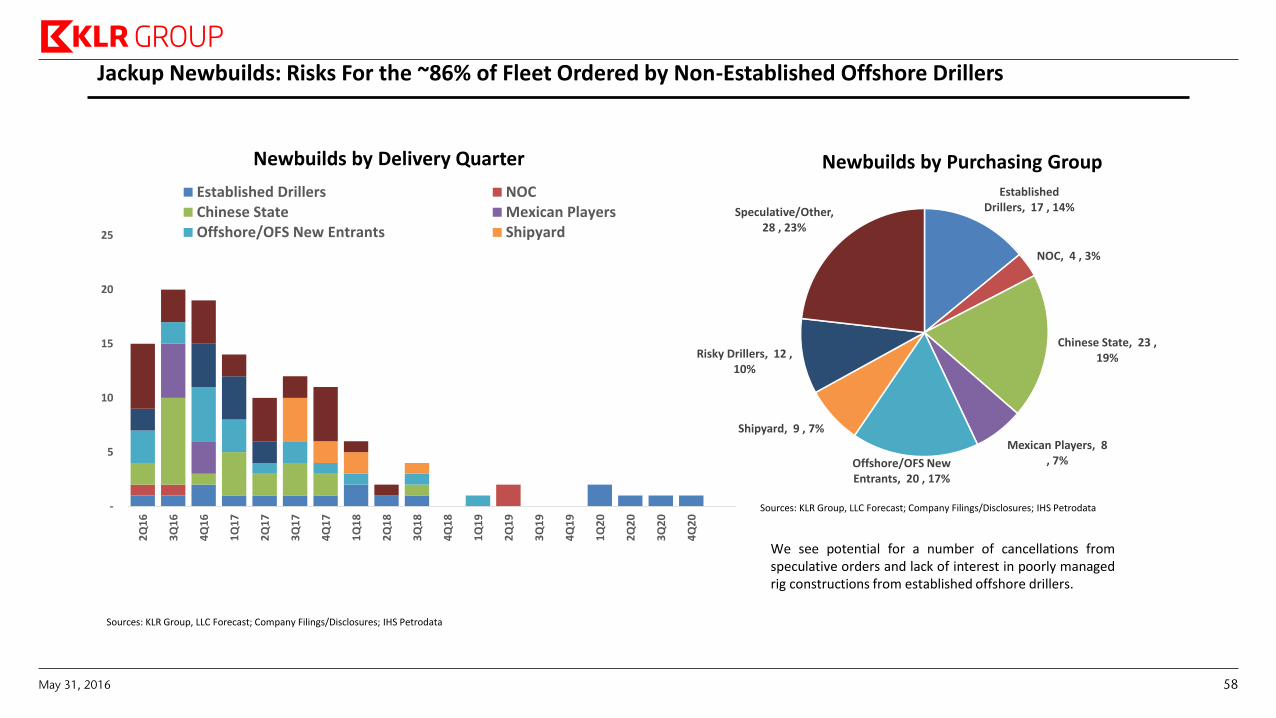
Jackup Newbuilds: Risks For the ~86% of Fleet Ordered by Non-Established Offshore Drillers
Newbuilds by Delivery Quarter Newbuilds by Purchasing Group
We see potential for a number of cancellations from speculative orders and lack of interest in poorly managed rig constructions from established offshore drillers.
Sources: KLR Group, LLC Forecast; Company Filings/Disclosures; IHS Petrodata
Sources: KLR Group, LLC Forecast; Company Filings/Disclosures; IHS Petrodata -
5
10
15
20
25
2Q
16
3Q
16
4Q
16
1Q
17
2Q
17
3Q
17
4Q
17
1Q
18
2Q
18
3Q
18
4Q
18
1Q
19
2Q
19
3Q
19
4Q
19
1Q
20
2Q
20
3Q
20
4Q
20
Established Drillers NOCChinese State Mexican PlayersOffshore/OFS New Entrants Shipyard
Established Drillers, 17 , 14%
NOC, 4 , 3%
Chinese State, 23 , 19%
Mexican Players, 8 , 7%Offshore/OFS New
Entrants, 20 , 17%
Shipyard, 9 , 7%
Risky Drillers, 12 , 10%
Speculative/Other, 28 , 23%
May 31, 2016 58
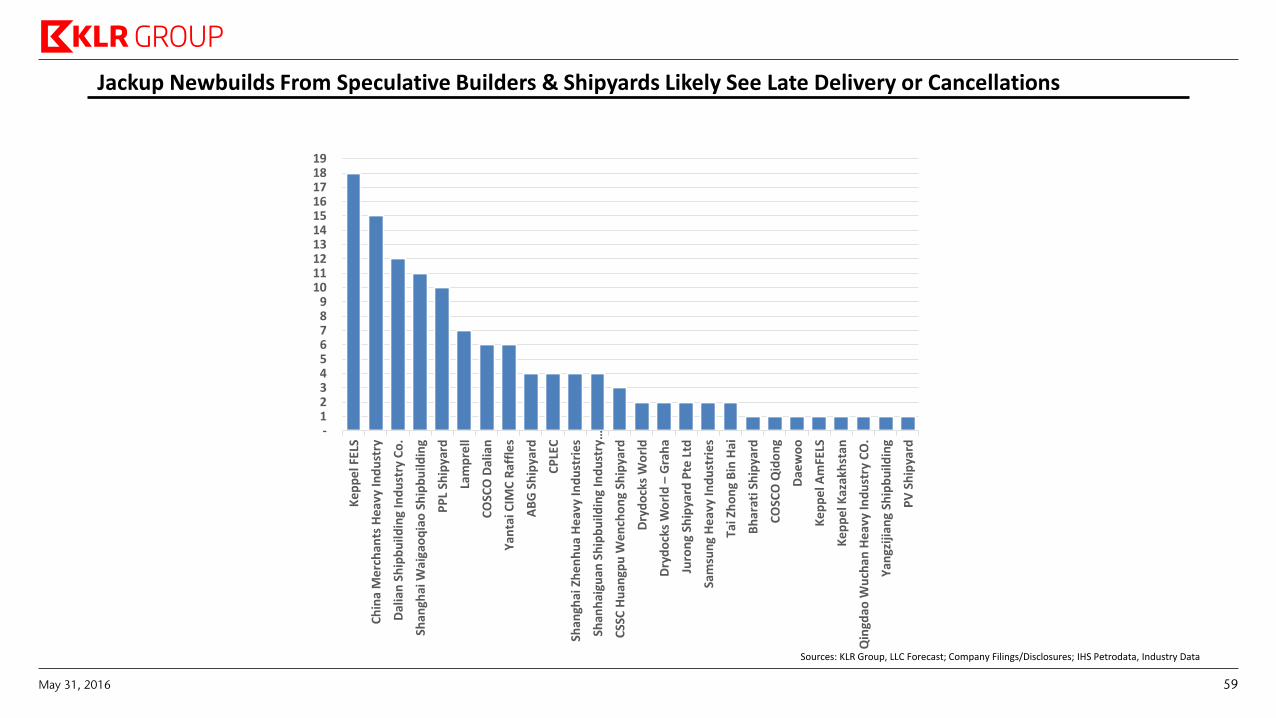
Jackup Newbuilds From Speculative Builders & Shipyards Likely See Late Delivery or Cancellations
- 1 2 3 4 5 6 7 8 9
10 11 12 13 14 15 16 17 18 19
Kep
pe
l FEL
S
Ch
ina
Me
rch
ants
Hea
vy In
du
stry
Dal
ian
Sh
ipb
uild
ing
Ind
ust
ry C
o.
Shan
ghai
Wai
gao
qia
o S
hip
bu
ildin
g
PP
L Sh
ipya
rd
Lam
pre
ll
CO
SCO
Dal
ian
Yan
tai C
IMC
Raf
fle
s
AB
G S
hip
yard
CP
LEC
Shan
ghai
Zh
enh
ua
He
avy
Ind
ust
ries
Shan
hai
guan
Sh
ipb
uild
ing
Ind
ust
ry…
CSS
C H
uan
gpu
Wen
cho
ng
Ship
yard
Dry
do
cks
Wo
rld
Dry
do
cks
Wo
rld
–G
rah
a
Juro
ng
Ship
yard
Pte
Ltd
Sam
sun
g H
eav
y In
du
stri
es
Tai
Zh
on
g B
in H
ai
Bh
arat
i Sh
ipya
rd
CO
SCO
Qid
on
g
Dae
wo
o
Kep
pe
l Am
FELS
Kep
pe
l Kaz
akh
stan
Qin
gdao
Wu
chan
He
avy
Ind
ust
ry C
O.
Yan
gzij
ian
g Sh
ipb
uild
ing
PV
Sh
ipya
rd
Sources: KLR Group, LLC Forecast; Company Filings/Disclosures; IHS Petrodata, Industry Data
May 31, 2016 59
Subsea Equipment: Potential for Upside
May 31, 2016 60
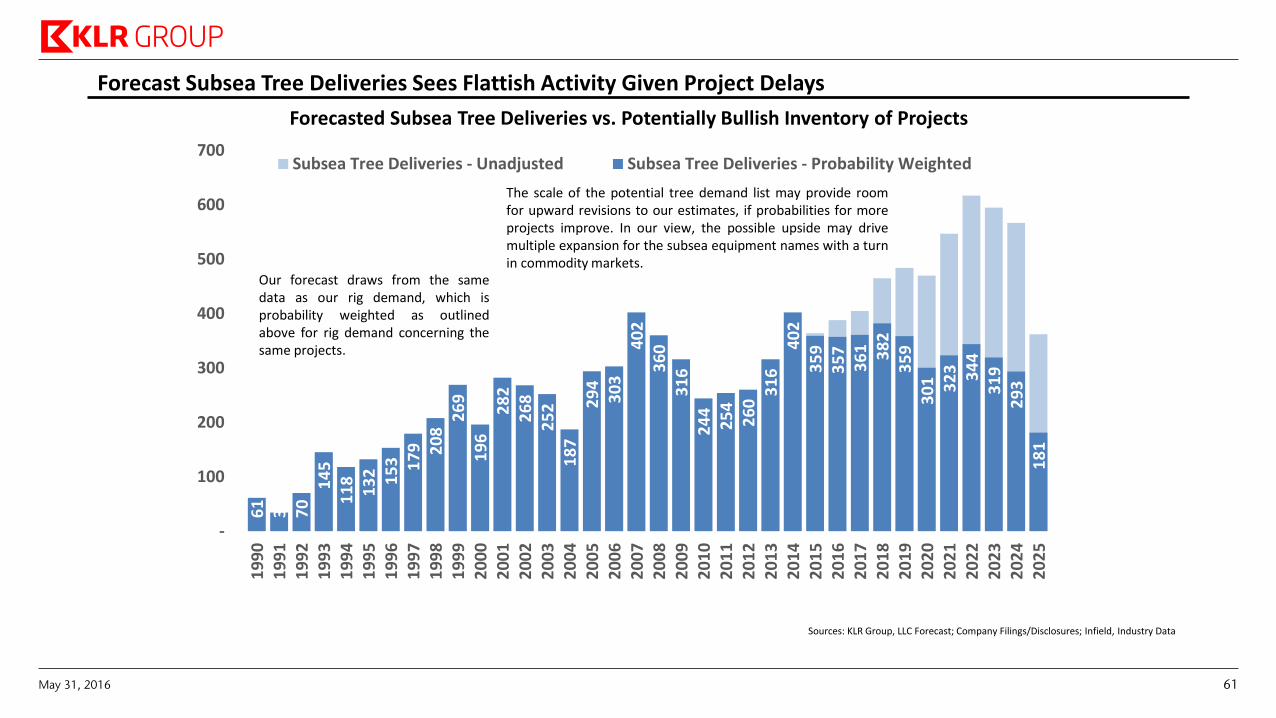
61
3
4
70
1
45
1
18
1
32
1
53
1
79
2
08
26
9
19
6
28
2
26
8
25
2
18
7
29
4
30
3
40
2
36
0
31
6
24
4
25
4
26
0 3
16
4
02
3
59
3
57
3
61
3
82
3
59
3
01
3
23
3
44
3
19
2
93
1
81
-
100
200
300
400
500
600
700
19
90
19
91
19
92
19
93
19
94
19
95
19
96
19
97
19
98
19
99
20
00
20
01
20
02
20
03
20
04
20
05
20
06
20
07
20
08
20
09
20
10
20
11
20
12
20
13
20
14
20
15
20
16
20
17
20
18
20
19
20
20
20
21
20
22
20
23
20
24
20
25
Subsea Tree Deliveries - Unadjusted Subsea Tree Deliveries - Probability Weighted
Forecast Subsea Tree Deliveries Sees Flattish Activity Given Project Delays
The scale of the potential tree demand list may provide room for upward revisions to our estimates, if probabilities for more projects improve. In our view, the possible upside may drive multiple expansion for the subsea equipment names with a turn in commodity markets.
Forecasted Subsea Tree Deliveries vs. Potentially Bullish Inventory of Projects
Our forecast draws from the same data as our rig demand, which is probability weighted as outlined above for rig demand concerning the same projects.
Sources: KLR Group, LLC Forecast; Company Filings/Disclosures; Infield, Industry Data
May 31, 2016 61
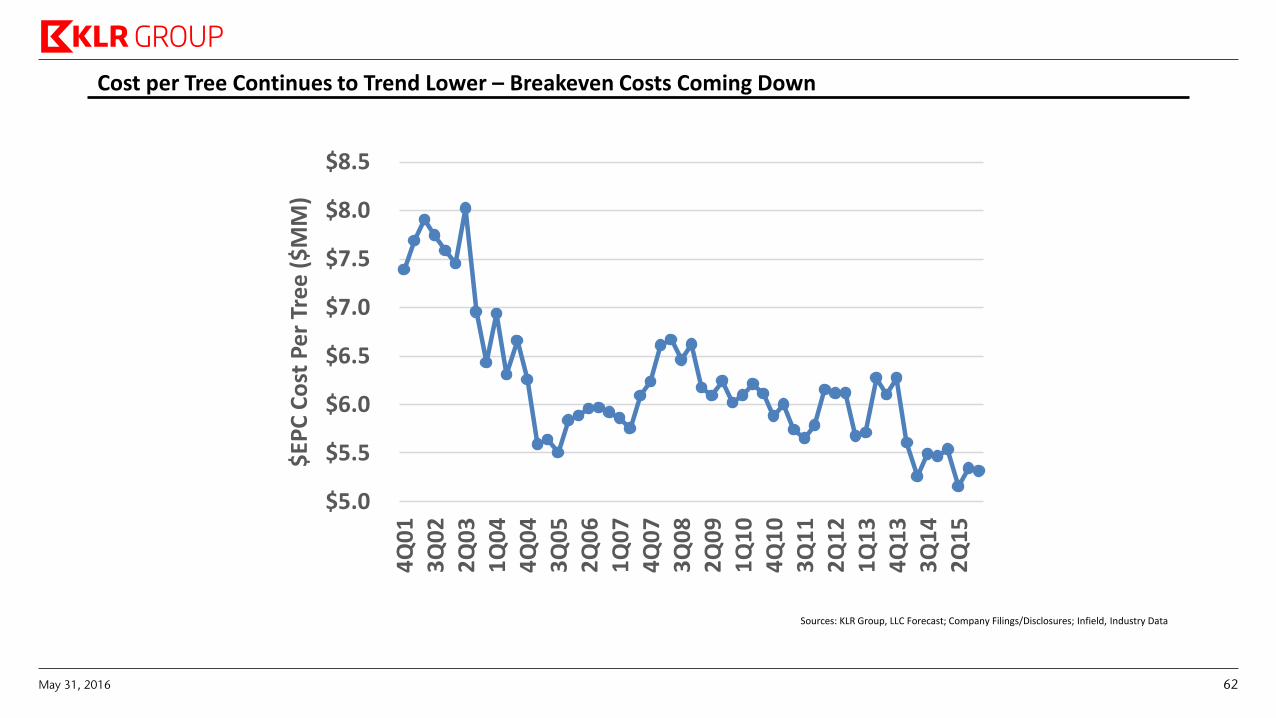
Cost per Tree Continues to Trend Lower – Breakeven Costs Coming Down
$5.0
$5.5
$6.0
$6.5
$7.0
$7.5
$8.0
$8.5
4Q
01
3Q
02
2Q
03
1Q
04
4Q
04
3Q
05
2Q
06
1Q
07
4Q
07
3Q
08
2Q
09
1Q
10
4Q
10
3Q
11
2Q
12
1Q
13
4Q
13
3Q
14
2Q
15
$EP
C C
ost
Per
Tre
e ($
MM
)
Sources: KLR Group, LLC Forecast; Company Filings/Disclosures; Infield, Industry Data
May 31, 2016 62
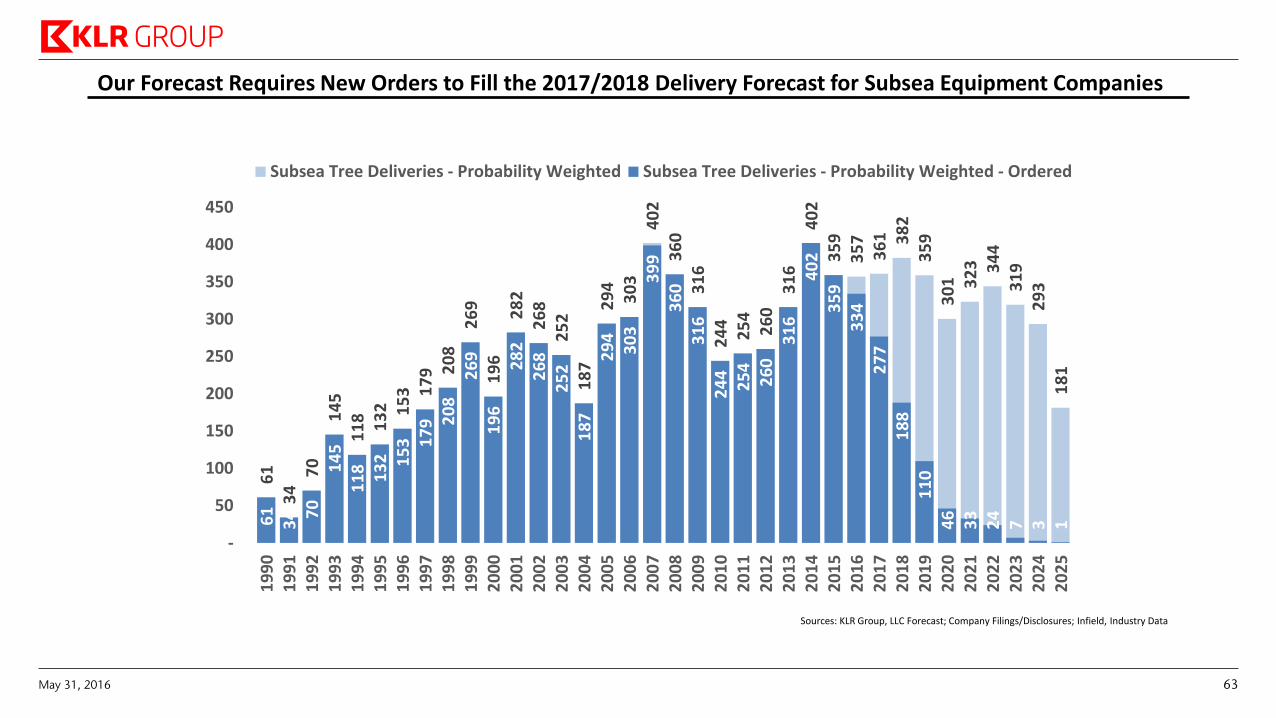
Our Forecast Requires New Orders to Fill the 2017/2018 Delivery Forecast for Subsea Equipment Companies
61
3
4 7
0
14
5
11
8
13
2
15
3 17
9 20
8
26
9
19
6
28
2
26
8
25
2
18
7
29
4
30
3
40
2
36
0
31
6
24
4
25
4
26
0
31
6
40
2
35
9
35
7
36
1
38
2
35
9
30
1
32
3
34
4
31
9
29
3
18
1
61
3
4 70
1
45
1
18
1
32
1
53
17
9 20
8
26
9
19
6
28
2
26
8
25
2
18
7
29
4
30
3
39
9
36
0
31
6
24
4
25
4
26
0
31
6
40
2
35
9
33
4
27
7
18
8
11
0
46
3
3
24
7
3
1
-
50
100
150
200
250
300
350
400
450
19
90
19
91
19
92
19
93
19
94
19
95
19
96
19
97
19
98
19
99
20
00
20
01
20
02
20
03
20
04
20
05
20
06
20
07
20
08
20
09
20
10
20
11
20
12
20
13
20
14
20
15
20
16
20
17
20
18
20
19
20
20
20
21
20
22
20
23
20
24
20
25
Subsea Tree Deliveries - Probability Weighted Subsea Tree Deliveries - Probability Weighted - Ordered
Sources: KLR Group, LLC Forecast; Company Filings/Disclosures; Infield, Industry Data
May 31, 2016 63
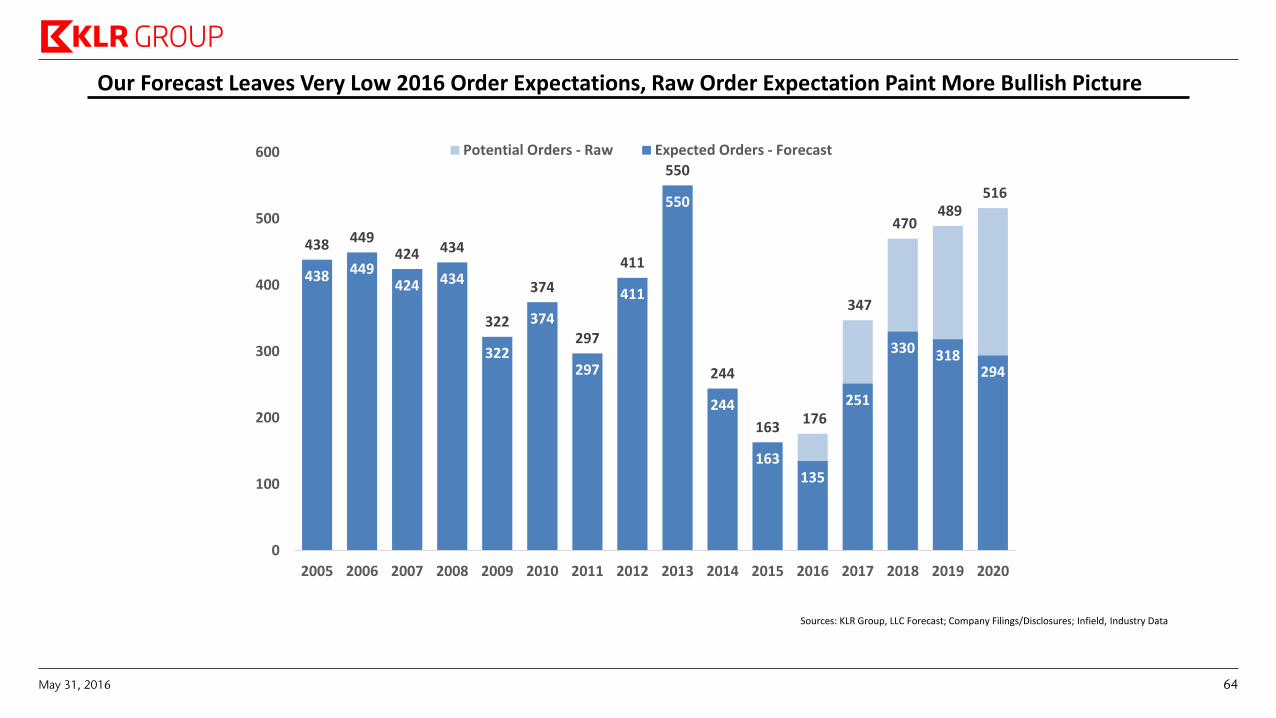
Our Forecast Leaves Very Low 2016 Order Expectations, Raw Order Expectation Paint More Bullish Picture
438 449424 434
322
374
297
411
550
244
163176
347
470 489
516
438 449424 434
322
374
297
411
550
244
163135
251
330 318294
0
100
200
300
400
500
600
2005 2006 2007 2008 2009 2010 2011 2012 2013 2014 2015 2016 2017 2018 2019 2020
Potential Orders - Raw Expected Orders - Forecast
Sources: KLR Group, LLC Forecast; Company Filings/Disclosures; Infield, Industry Data
May 31, 2016 64
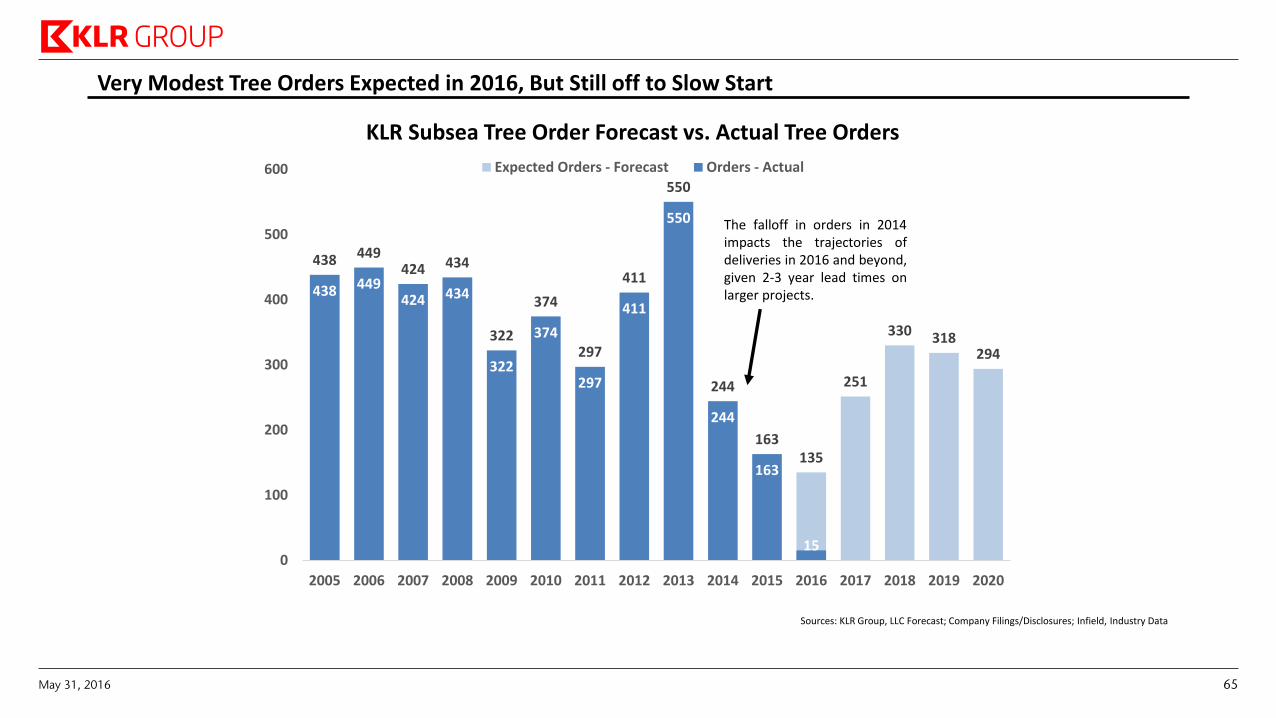
438 449424 434
322
374
297
411
550
244
163135
251
330 318294
438 449424 434
322
374
297
411
550
244
163
150
100
200
300
400
500
600
2005 2006 2007 2008 2009 2010 2011 2012 2013 2014 2015 2016 2017 2018 2019 2020
Expected Orders - Forecast Orders - Actual
Very Modest Tree Orders Expected in 2016, But Still off to Slow Start
KLR Subsea Tree Order Forecast vs. Actual Tree Orders
The falloff in orders in 2014 impacts the trajectories of deliveries in 2016 and beyond, given 2-3 year lead times on larger projects.
Sources: KLR Group, LLC Forecast; Company Filings/Disclosures; Infield, Industry Data
May 31, 2016 65
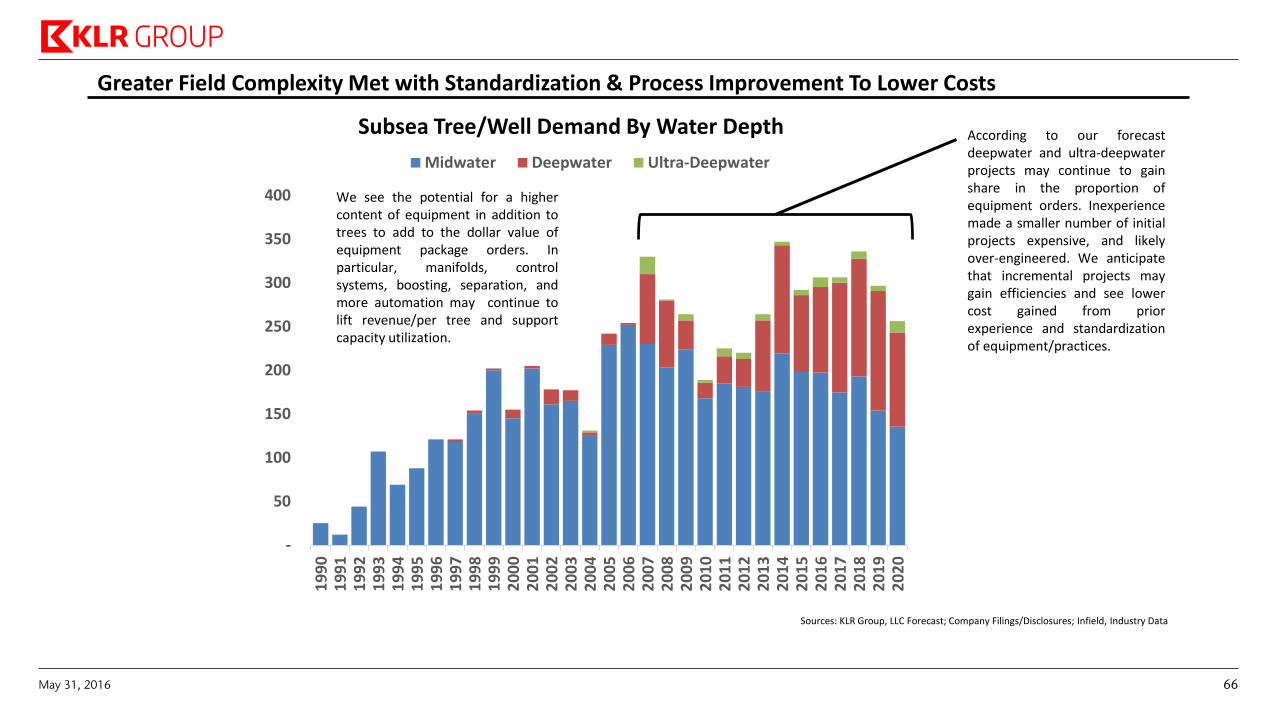
-
50
100
150
200
250
300
350
400
19
90
19
91
19
92
19
93
19
94
19
95
19
96
19
97
19
98
19
99
20
00
20
01
20
02
20
03
20
04
20
05
20
06
20
07
20
08
20
09
20
10
20
11
20
12
20
13
20
14
20
15
20
16
20
17
20
18
20
19
20
20
Midwater Deepwater Ultra-Deepwater
Greater Field Complexity Met with Standardization & Process Improvement To Lower Costs
According to our forecast deepwater and ultra-deepwater projects may continue to gain share in the proportion of equipment orders. Inexperience made a smaller number of initial projects expensive, and likely over-engineered. We anticipate that incremental projects may gain efficiencies and see lower cost gained from prior experience and standardization of equipment/practices.
We see the potential for a higher content of equipment in addition to trees to add to the dollar value of equipment package orders. In particular, manifolds, control systems, boosting, separation, and more automation may continue to lift revenue/per tree and support capacity utilization.
Subsea Tree/Well Demand By Water Depth
Sources: KLR Group, LLC Forecast; Company Filings/Disclosures; Infield, Industry Data
May 31, 2016 66
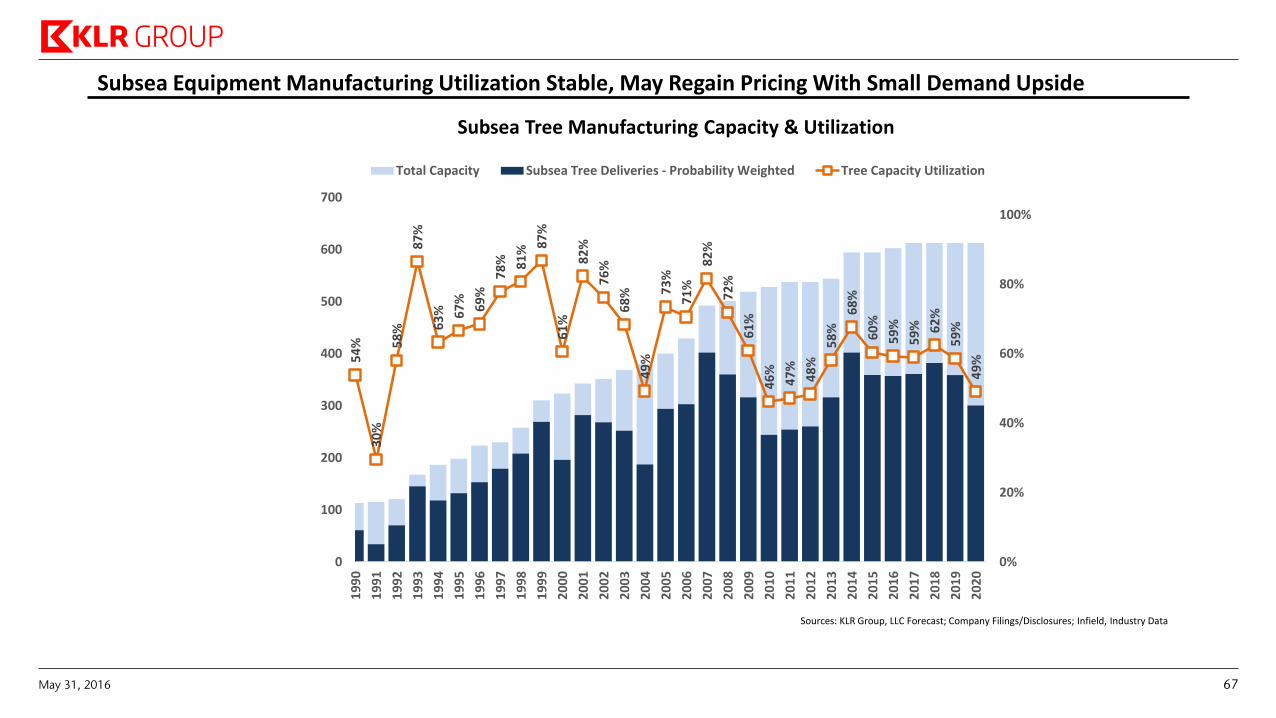
Subsea Equipment Manufacturing Utilization Stable, May Regain Pricing With Small Demand Upside
Subsea Tree Manufacturing Capacity & Utilization
Sources: KLR Group, LLC Forecast; Company Filings/Disclosures; Infield, Industry Data
54
%
30
%
58
%
87
%
63
% 67
%
69
%
78
% 81
% 87
%
61
%
82
%
76
%
68
%
49
%
73
%
71
%
82
%
72
%
61
%
46
%
47
%
48
%
58
%
68
%
60
%
59
%
59
% 62
%
59
%
49
%
0%
20%
40%
60%
80%
100%
0
100
200
300
400
500
600
700
19
90
19
91
19
92
19
93
19
94
19
95
19
96
19
97
19
98
19
99
20
00
20
01
20
02
20
03
20
04
20
05
20
06
20
07
20
08
20
09
20
10
20
11
20
12
20
13
20
14
20
15
20
16
20
17
20
18
20
19
20
20
Total Capacity Subsea Tree Deliveries - Probability Weighted Tree Capacity Utilization
May 31, 2016 67
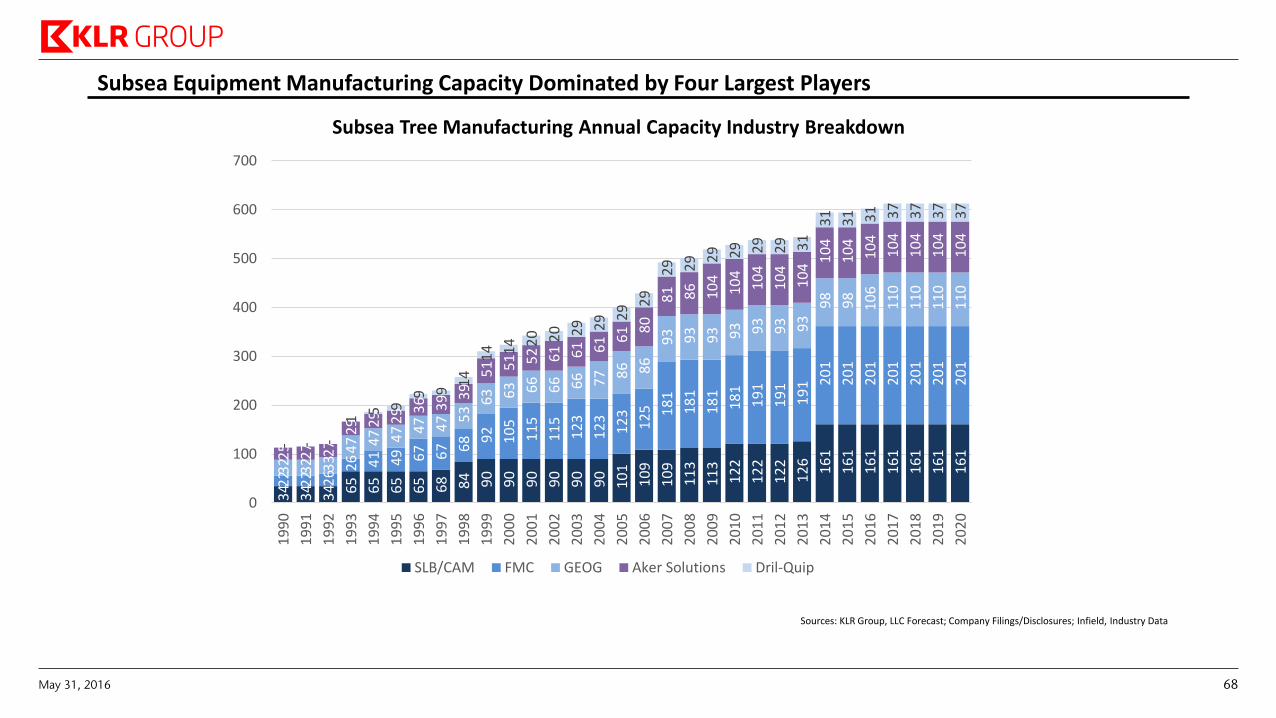
Subsea Equipment Manufacturing Capacity Dominated by Four Largest Players
Subsea Tree Manufacturing Annual Capacity Industry Breakdown
Sources: KLR Group, LLC Forecast; Company Filings/Disclosures; Infield, Industry Data
34
34
34
65
65
65
65
68
84
90
90
90
90
90
90
10
1
10
9
10
9
11
3
11
3
12
2
12
2
12
2
12
6
16
1
16
1
16
1
16
1
16
1
16
1
16
1
22
22
26
26
41
49
67
67
68
92
10
5
11
5
11
5
12
3
12
3
12
3
12
5
18
1
18
1
18
1
18
1
19
1
19
1
19
1 20
1
20
1
20
1
20
1
20
1
20
1
20
1
32
32
33
47
47
47
47
47
53
63
63
66
66
66
77
86
86
93
93
93
93
93
93
93
98
98
10
6
11
0
11
0
11
0
11
0
25
27
27
29
29
29
36
39
39
51
51
52
61
61
61
61
80
81
86
10
4
10
4
10
4
10
4
10
4 1
04
10
4
10
4
10
4
10
4
10
4
10
4
- - -
1 5
9 9
9 1
4
14
14
20
20
29
29
29
29
29
29
29
29
29
29
31
31
31
31
37
37
37
37
0
100
200
300
400
500
600
700
19
90
19
91
19
92
19
93
19
94
19
95
19
96
19
97
19
98
19
99
20
00
20
01
20
02
20
03
20
04
20
05
20
06
20
07
20
08
20
09
20
10
20
11
20
12
20
13
20
14
20
15
20
16
20
17
20
18
20
19
20
20
SLB/CAM FMC GEOG Aker Solutions Dril-Quip
May 31, 2016 68
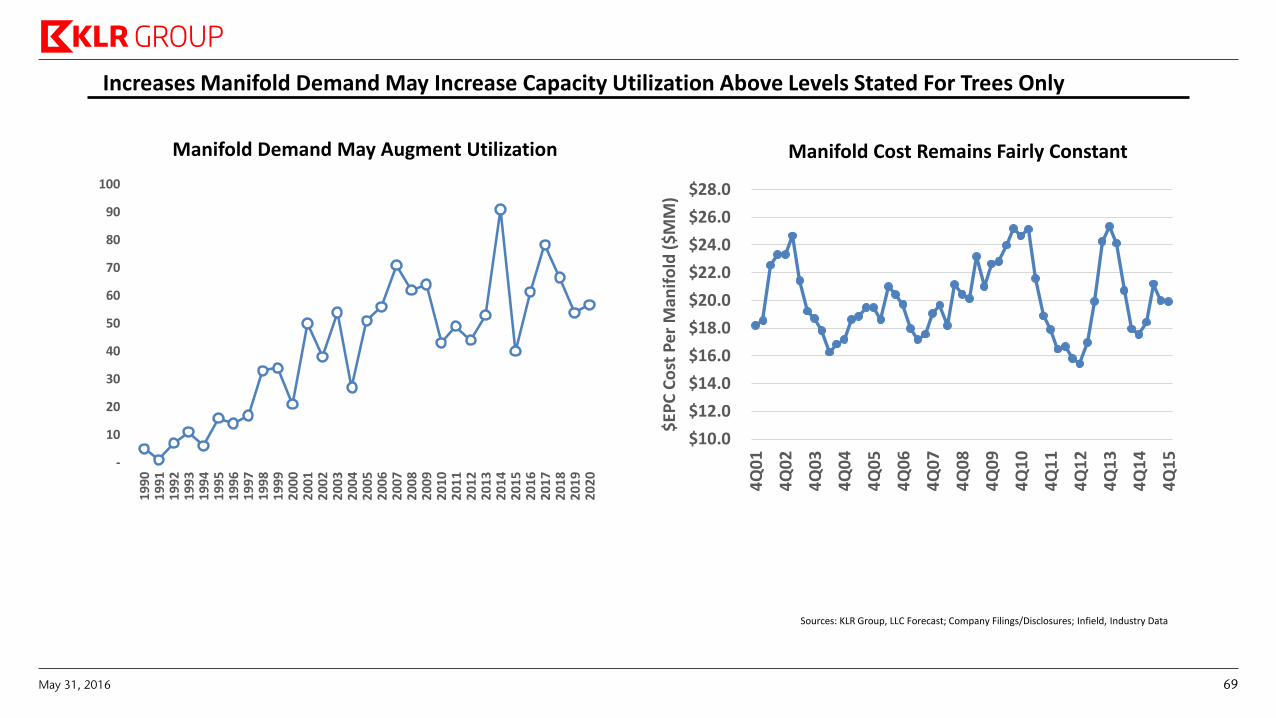
Increases Manifold Demand May Increase Capacity Utilization Above Levels Stated For Trees Only
-
10
20
30
40
50
60
70
80
90
100
19
90
19
91
19
92
19
93
19
94
19
95
19
96
19
97
19
98
19
99
20
00
20
01
20
02
20
03
20
04
20
05
20
06
20
07
20
08
20
09
20
10
20
11
20
12
20
13
20
14
20
15
20
16
20
17
20
18
20
19
20
20
Manifold Demand May Augment Utilization
$10.0
$12.0
$14.0
$16.0
$18.0
$20.0
$22.0
$24.0
$26.0
$28.0
4Q
01
4Q
02
4Q
03
4Q
04
4Q
05
4Q
06
4Q
07
4Q
08
4Q
09
4Q
10
4Q
11
4Q
12
4Q
13
4Q
14
4Q
15
$EP
C C
ost
Per
Man
ifo
ld (
$M
M)
Manifold Cost Remains Fairly Constant
Sources: KLR Group, LLC Forecast; Company Filings/Disclosures; Infield, Industry Data
May 31, 2016 69
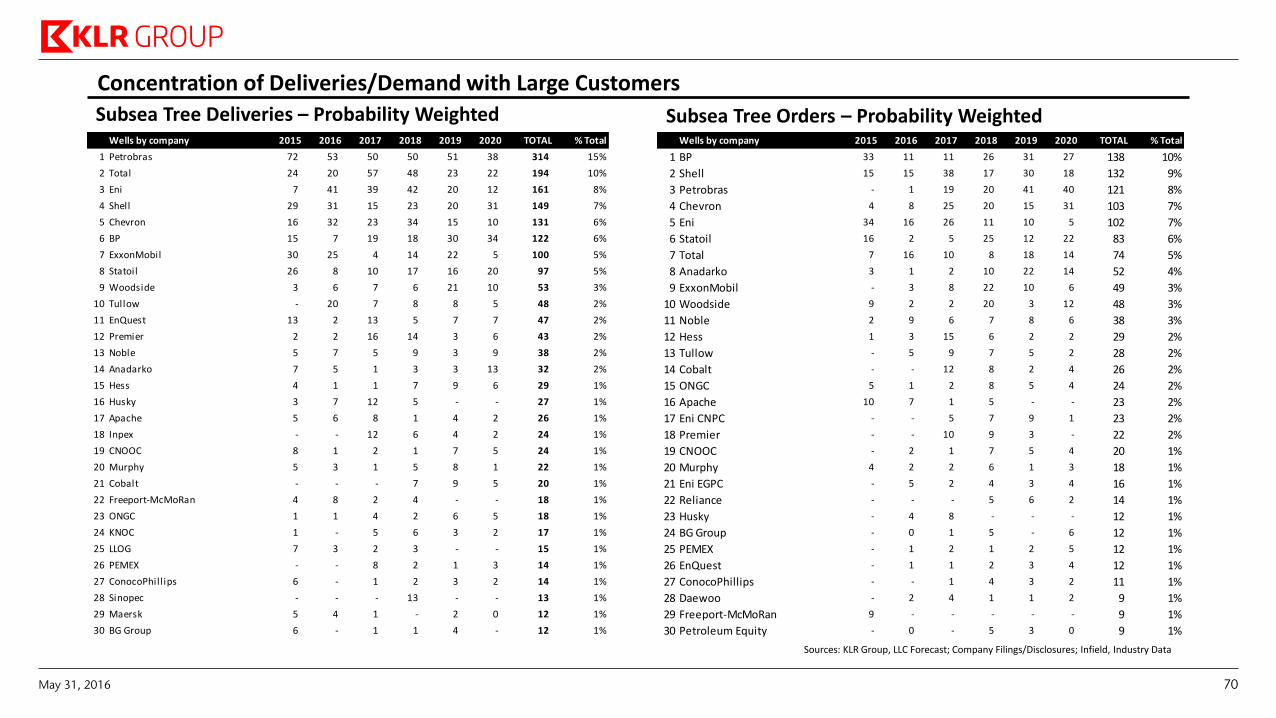
Concentration of Deliveries/Demand with Large Customers
Subsea Tree Deliveries – Probability Weighted Subsea Tree Orders – Probability Weighted Wells by company 2015 2016 2017 2018 2019 2020 TOTAL % Total
1 Petrobras 72 53 50 50 51 38 314 15%
2 Total 24 20 57 48 23 22 194 10%
3 Eni 7 41 39 42 20 12 161 8%
4 Shell 29 31 15 23 20 31 149 7%
5 Chevron 16 32 23 34 15 10 131 6%
6 BP 15 7 19 18 30 34 122 6%
7 ExxonMobil 30 25 4 14 22 5 100 5%
8 Statoil 26 8 10 17 16 20 97 5%
9 Woodside 3 6 7 6 21 10 53 3%
10 Tullow - 20 7 8 8 5 48 2%
11 EnQuest 13 2 13 5 7 7 47 2%
12 Premier 2 2 16 14 3 6 43 2%
13 Noble 5 7 5 9 3 9 38 2%
14 Anadarko 7 5 1 3 3 13 32 2%
15 Hess 4 1 1 7 9 6 29 1%
16 Husky 3 7 12 5 - - 27 1%
17 Apache 5 6 8 1 4 2 26 1%
18 Inpex - - 12 6 4 2 24 1%
19 CNOOC 8 1 2 1 7 5 24 1%
20 Murphy 5 3 1 5 8 1 22 1%
21 Cobalt - - - 7 9 5 20 1%
22 Freeport-McMoRan 4 8 2 4 - - 18 1%
23 ONGC 1 1 4 2 6 5 18 1%
24 KNOC 1 - 5 6 3 2 17 1%
25 LLOG 7 3 2 3 - - 15 1%
26 PEMEX - - 8 2 1 3 14 1%
27 ConocoPhill ips 6 - 1 2 3 2 14 1%
28 Sinopec - - - 13 - - 13 1%
29 Maersk 5 4 1 - 2 0 12 1%
30 BG Group 6 - 1 1 4 - 12 1%
Wells by company 2015 2016 2017 2018 2019 2020 TOTAL % Total
1 BP 33 11 11 26 31 27 138 10%
2 Shell 15 15 38 17 30 18 132 9%
3 Petrobras - 1 19 20 41 40 121 8%
4 Chevron 4 8 25 20 15 31 103 7%
5 Eni 34 16 26 11 10 5 102 7%
6 Statoil 16 2 5 25 12 22 83 6%
7 Total 7 16 10 8 18 14 74 5%
8 Anadarko 3 1 2 10 22 14 52 4%
9 ExxonMobil - 3 8 22 10 6 49 3%
10 Woodside 9 2 2 20 3 12 48 3%
11 Noble 2 9 6 7 8 6 38 3%
12 Hess 1 3 15 6 2 2 29 2%
13 Tullow - 5 9 7 5 2 28 2%
14 Cobalt - - 12 8 2 4 26 2%
15 ONGC 5 1 2 8 5 4 24 2%
16 Apache 10 7 1 5 - - 23 2%
17 Eni CNPC - - 5 7 9 1 23 2%
18 Premier - - 10 9 3 - 22 2%
19 CNOOC - 2 1 7 5 4 20 1%
20 Murphy 4 2 2 6 1 3 18 1%
21 Eni EGPC - 5 2 4 3 4 16 1%
22 Reliance - - - 5 6 2 14 1%
23 Husky - 4 8 - - - 12 1%
24 BG Group - 0 1 5 - 6 12 1%
25 PEMEX - 1 2 1 2 5 12 1%
26 EnQuest - 1 1 2 3 4 12 1%
27 ConocoPhillips - - 1 4 3 2 11 1%
28 Daewoo - 2 4 1 1 2 9 1%
29 Freeport-McMoRan 9 - - - - - 9 1%
30 Petroleum Equity - 0 - 5 3 0 9 1%
Sources: KLR Group, LLC Forecast; Company Filings/Disclosures; Infield, Industry Data
May 31, 2016 70
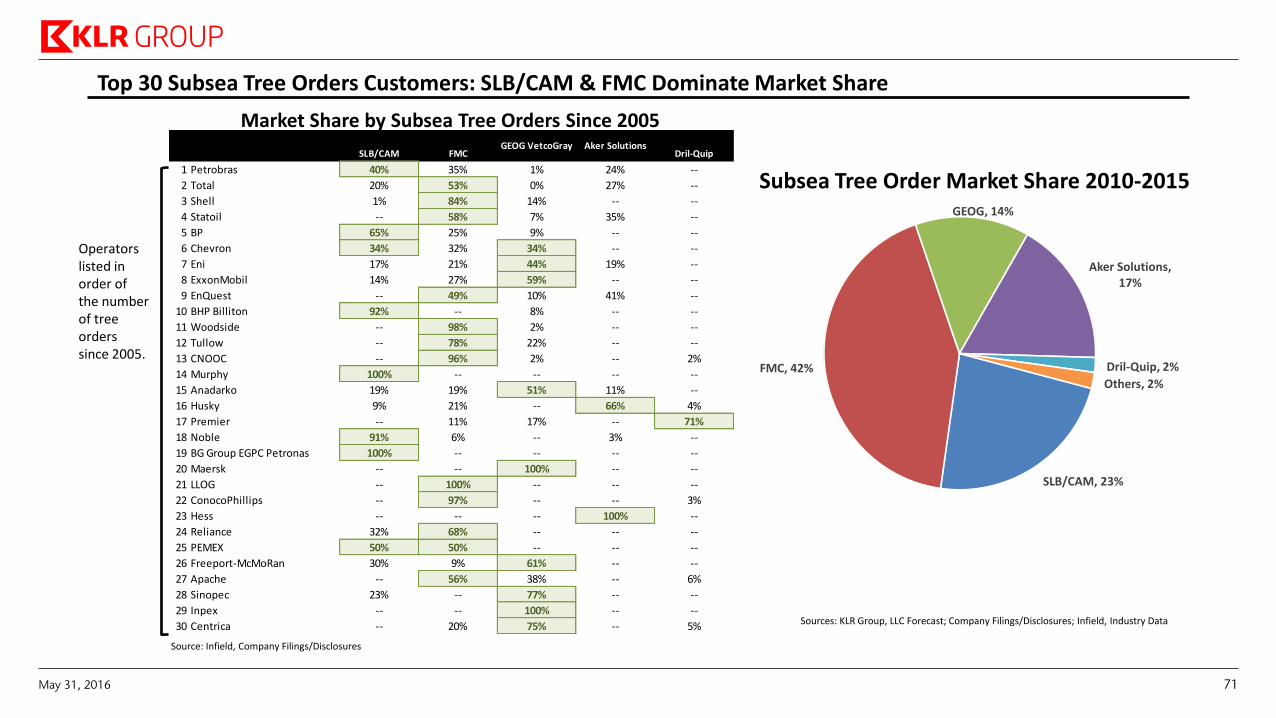
Top 30 Subsea Tree Orders Customers: SLB/CAM & FMC Dominate Market Share
Market Share by Subsea Tree Orders Since 2005
Subsea Tree Order Market Share 2010-2015
Operators listed in order of the number of tree orders since 2005.
Source: Infield, Company Filings/Disclosures
SLB/CAM, 23%
FMC, 42%
GEOG, 14%
Aker Solutions, 17%
Dril-Quip, 2%
Others, 2%
SLB/CAM FMC Dril-Quip
1 Petrobras 40% 35% 1% 24% --
2 Total 20% 53% 0% 27% --
3 Shell 1% 84% 14% -- --
4 Statoil -- 58% 7% 35% --
5 BP 65% 25% 9% -- --
6 Chevron 34% 32% 34% -- --
7 Eni 17% 21% 44% 19% --
8 ExxonMobil 14% 27% 59% -- --
9 EnQuest -- 49% 10% 41% --
10 BHP Billiton 92% -- 8% -- --
11 Woodside -- 98% 2% -- --
12 Tullow -- 78% 22% -- --
13 CNOOC -- 96% 2% -- 2%
14 Murphy 100% -- -- -- --
15 Anadarko 19% 19% 51% 11% --
16 Husky 9% 21% -- 66% 4%
17 Premier -- 11% 17% -- 71%
18 Noble 91% 6% -- 3% --
19 BG Group EGPC Petronas 100% -- -- -- --
20 Maersk -- -- 100% -- --
21 LLOG -- 100% -- -- --
22 ConocoPhillips -- 97% -- -- 3%
23 Hess -- -- -- 100% --
24 Reliance 32% 68% -- -- --
25 PEMEX 50% 50% -- -- --
26 Freeport-McMoRan 30% 9% 61% -- --
27 Apache -- 56% 38% -- 6%
28 Sinopec 23% -- 77% -- --
29 Inpex -- -- 100% -- --
30 Centrica -- 20% 75% -- 5%
GEOG VetcoGray Aker Solutions
Sources: KLR Group, LLC Forecast; Company Filings/Disclosures; Infield, Industry Data
May 31, 2016 71
IMPORTANT DISCLOSURES
Rating SystemKLR Group, LLC employs a five tier rating system for evaluating the potential return associated with owning common equity shares of rated firms. The expectedreturn of any given equity is measured on a quantitative basis in relation to our target price. Since stock prices are volatile on a daily basis KLR will utilize atleast a +/- 5% variance tolerance in determining our ratings. Descriptions of the ratings are as follows:Buy - The common stock of the company is estimated to have over 30% upside to our target price.Accumulate - The common stock of the company is estimated to have 10%-30% upside to our target price.Hold - The common stock of the company is estimated to be within +/-10% of our target price.Reduce - The common stock of the company is estimated to have 10%-30% downside to our target price.Sell - The common stock of the company is estimated to have over 30% downside to our target price.
Risk FactorsMacro:
Sustained weakness in commodity prices. Persistent weakness in commodity prices may negatively impact oilfield service company returns. This risk is magnifiedfor companies with weaker balance sheets and higher near term liabilities.
Access to capital markets: The ability of many oilfield service companies to withstand the downturn hinges on their access to capital. If capital markets beginto close off to the industry it would be difficult for many companies to maintain their existing operating plans.
Foreign exchange volatility. The sector’s international component leaves earnings exposed to foreign exchange volatility.
Climate change regulation. The increased attention on climate change and greenhouse gas (GHG) emissions could lead to new regulations aimed at limitingfuture GHG emissions. If enacted these regulations could impose additional costs for both operators and service providers.
Company Centric:
Contracting risk: The new and rolling contracts across the oil services business may perpetuate lower dayrates and falling contract pricing, even if renegotiationsoccur during the initial phases of a recovery.
Continued oversupply in rig market: Day rates could remain depressed if the rig market remains oversaturated resulting from fewer rig retirements thanforecasted.
Rig productivity gains: If onshore rigs continue to achieve new productivity gains, the demand for onshore rigs could continue to deteriorate, particularly inthe lower end of the onshore rig market. Greater levels of efficiency and productivity gains may
Lumpy Cash Flows: The lumpy nature of the equipment & manufacturing industry could cause a significant lag between the recovery in the oil and gas industryand the improvement in the equipment & manufacturing industry’s cash flow position.
Cost Escalation: Fixed price long term contracts common in the oilfield equipment & manufacturing leave industry participants particularly vulnerable to costincreases. This risk could be magnified for contracts entered into during a low price environment.
Adoption of new technologies: Many proppant providers are relying on new technologies to improve margins. However, there is a risk that the industry maycontinue to prefer lower cost options. Alternatively, the industry could select a single new technology winner with the losers going the way of the Beta Max video.
Other Companies Mentioned in this ReportAtwood Oceanics, Inc.(ATW) - Rating: Accumulate; Price Target: 12.75; Price: 10.56C&J Energy Services, Ltd.(CJES) - Rating: Hold; Price Target: 0.50; Price: 0.50Core Laboratories N.V.(CLB) - Rating: Buy; Price Target: 166.00; Price: 122.25CARBO Ceramics Inc.(CRR) - Rating: Hold; Price Target: 12.75; Price: 12.20Diamond Offshore Drilling Inc(DO) - Rating: Accumulate; Price Target: 28.00; Price: 25.12Dril-Quip, Inc.(DRQ) - Rating: Accumulate; Price Target: 70.00; Price: 61.49ENSCO PLC(ESV) - Rating: Buy; Price Target: 22.00; Price: 9.73Forum Energy Technologies Inc(FET) - Rating: Buy; Price Target: 22.00; Price: 17.15Franks International NV(FI) - Rating: Buy; Price Target: 22.00; Price: 15.92Fairmount Santrol Holdings Inc(FMSA) - Rating: Hold; Price Target: 3.90; Price: 5.37FMC Technologies, Inc.(FTI) - Rating: Buy; Price Target: 43.00; Price: 27.00Flotek Industries Inc(FTK) - Rating: Buy; Price Target: 15.00; Price: 11.77Halliburton Company(HAL) - Rating: Buy; Price Target: 52.00; Price: 42.58Helmerich & Payne, Inc.(HP) - Rating: Buy; Price Target: 83.00; Price: 60.59Nabors Industries Ltd.(NBR) - Rating: Buy; Price Target: 14.00; Price: 9.07Noble Corp plc(NE) - Rating: Buy; Price Target: 20.00; Price: 8.46National-Oilwell Varco, Inc.(NOV) - Rating: Buy; Price Target: 52.00; Price: 32.62Newpark Resources Inc(NR) - Rating: Buy; Price Target: 7.00; Price: 4.53Oceaneering International(OII) - Rating: Accumulate; Price Target: 40.00; Price: 33.51Oil States International, Inc.(OIS) - Rating: Buy; Price Target: 45.00; Price: 32.92Pacific Drilling SA(PACD) - Rating: Hold; Price Target: 1.10; Price: 4.07
May 31, 2016 72
Patterson-UTI Energy, Inc.(PTEN) - Rating: Buy; Price Target: 27.00; Price: 18.60Rowan Companies PLC(RDC) - Rating: Buy; Price Target: 25.00; Price: 16.88Transocean LTD(RIG) - Rating: Buy; Price Target: 19.00; Price: 9.85Seadrill Ltd(SDRL) - Rating: Reduce; Price Target: 3.25; Price: 3.27Schlumberger Limited.(SLB) - Rating: Buy; Price Target: 106.00; Price: 77.17U.S. Silica Holdings Inc(SLCA) - Rating: Hold; Price Target: 26.00; Price: 28.99Superior Energy Services, Inc.(SPN) - Rating: Buy; Price Target: 28.00; Price: 17.46Weatherford International Plc(WFT) - Rating: Accumulate; Price Target: 7.25; Price: 5.56
For ratings and price target history please visit http://www.klrgroup.com/research/disclosure/.
Distribution of RatingsIB Serv./Past 12 Mos.
Rating Count Percent Count PercentBuy 40 54.05 0 0Accumulate 18 24.32 0 0Hold 14 18.92 0 0Reduce 1 1.35 0 0Sell 1 1.35 0 0
Additional DisclosuresKLR Group, LLC is a member of FINRA and SIPC and a registered U.S. Broker-Dealer.
Investment Banking services include, but are not limited to, acting as a manager/co-manager in the underwriting or placement of securities, acting as financialadvisor, and/or providing corporate finance or capital markets-related services to a company or one of its affiliates or subsidiaries within the past 12 months.
Analyst CertificationI, Darren Gacicia, hereby certify that the views expressed in this research report accurately reflect my personal views about the subject company(ies) and its(their) securities and that no part of my compensation was, is, or will be, directly or indirectly, related to the specific recommendations or views expressedby me in this research report.The Firm and/or its affiliates intend(s) to seek compensation from Atwood Oceanics, Inc., C&J Energy Services, Ltd., Core Laboratories N.V., CARBO CeramicsInc., Diamond Offshore Drilling Inc, Dril-Quip, Inc., ENSCO PLC, Forum Energy Technologies Inc, Franks International NV, Fairmount Santrol Holdings Inc,FMC Technologies, Inc., Flotek Industries Inc, Halliburton Company, Helmerich & Payne, Inc., Nabors Industries Ltd., Noble Corp plc, National-Oilwell Varco,Inc., Newpark Resources Inc, Oceaneering International, Oil States International, Inc., Pacific Drilling SA, Patterson-UTI Energy, Inc., Rowan Companies PLC,Transocean LTD, Seadrill Ltd, Schlumberger Limited., U.S. Silica Holdings Inc, Superior Energy Services, Inc. and Weatherford International Plc for investmentbanking services within three months, following publication of the research report.
Any opinions expressed herein are statements of our judgment as of the date of publication and are subject to change without notice.
Reproduction without written permission is prohibited.
The closing prices of securities mentioned in this report are as of May 30 2016. Additional information is available to clients upon written request.For completeresearch report on Atwood Oceanics, Inc., C&J Energy Services, Ltd., Core Laboratories N.V., CARBO Ceramics Inc., Diamond Offshore Drilling Inc, Dril-Quip,Inc., ENSCO PLC, Forum Energy Technologies Inc, Franks International NV, Fairmount Santrol Holdings Inc, FMC Technologies, Inc., Flotek Industries Inc,Halliburton Company, Helmerich & Payne, Inc., Nabors Industries Ltd., Noble Corp plc, National-Oilwell Varco, Inc., Newpark Resources Inc, OceaneeringInternational, Oil States International, Inc., Pacific Drilling SA, Patterson-UTI Energy, Inc., Rowan Companies PLC, Transocean LTD, Seadrill Ltd, SchlumbergerLimited., U.S. Silica Holdings Inc, Superior Energy Services, Inc. and Weatherford International Plc, please call (713) 654-8080.
Readers are advised that this report is issued solely for informational purposes and is not to be construed as an offer to sell or the solicitation of an offer to buy.The information contained herein is based on sources which we believe to be reliable but is not guaranteed by us as being accurate and does not purport tobe a complete statement or summary of the available data. Past performance is no guarantee of future results.
May 31, 2016 73