Embed Size (px)
Citation preview
Weekly Waste Projects Update – week ending 19th
May 2016
Weekly Waste Projects Update: week ending 19th
May 2016 Source: AcuComm Business Database
01
New/Updated Projects Reported (w/e 19th May 2016)
Number
Estimated Value (all projects)
Estimated Value (new projects only)
US$ millions US$ millions
Anaerobic Digestion 5 90 13
Biofuel 6 970 100
Biogas 3 158 -
Gasification - - -
Incineration (with energy recovery) 9 933 458
Incineration (without energy recovery) 1 5 5
Integrated/mixed facilities 3 421 186
Landfill 4 77 71
MBT - - -
Other 1 6 6
Recycling 7 59 30
Waste processing 6 1,781 164
Total 45 4,500 1,033
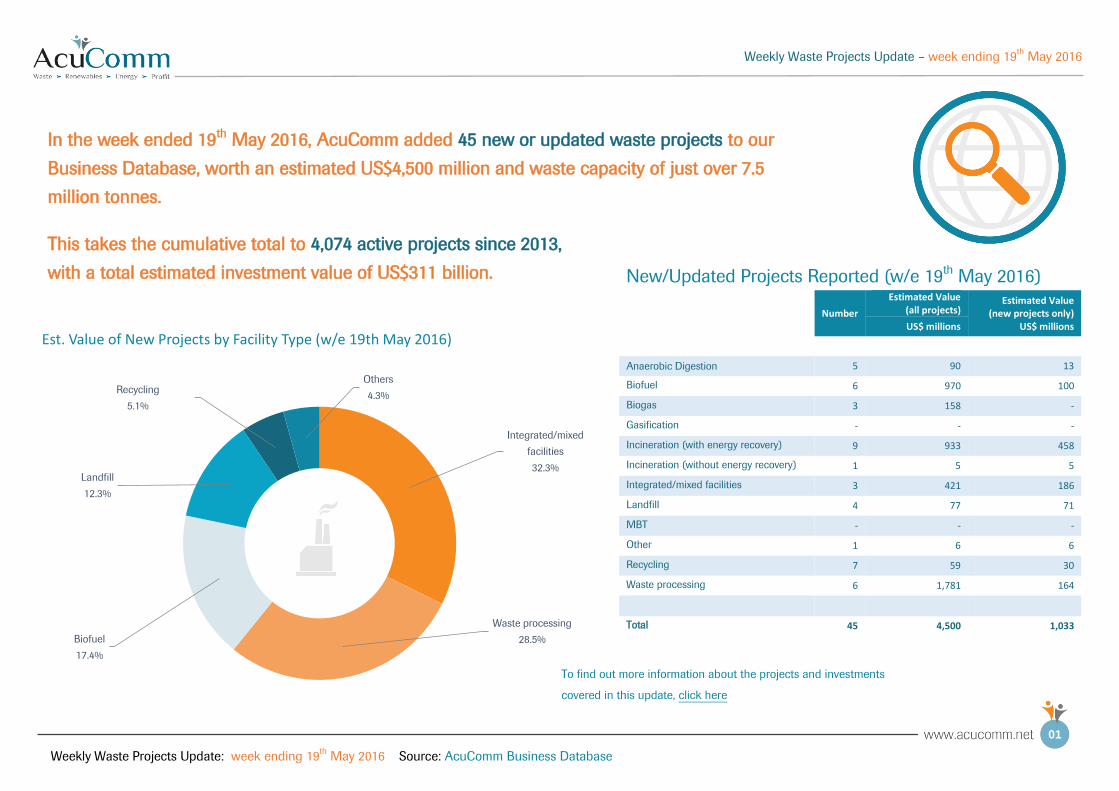
In the week ended 19th May 2016, AcuComm added 45 new or updated waste projects to our
Business Database, worth an estimated US$4,500 million and waste capacity of just over 7.5
million tonnes.
This takes the cumulative total to 4,074 active projects since 2013,
with a total estimated investment value of US$311 billion.
Integrated/mixed
facilities
32.3%
Waste processing
28.5%Biofuel
17.4%
Landfill
12.3%
Recycling
5.1%
Others
4.3%
Est. Value of New Projects by Facility Type (w/e 19th May 2016)
To find out more information about the projects and investments
covered in this update, click here
Weekly Waste Projects Update – week ending 19th
May 2016
Weekly Waste Projects Update: week ending 19th
May 2016 Source: AcuComm Business Database
02
New/Updated Projects Reported (w/e 19th May 2016)
Number Capacity (tonnes) MW
Anaerobic Digestion 5 654,833 8
Biofuel 6 1,346,877 141
Biogas 3 319,447 7
Gasification - - -
Incineration (with energy recovery) 9 2,102,340 253
Incineration (without energy recovery) 1 35,325 -
Integrated/mixed facilities 3 416,763 55
Landfill 4 1,381,011 -
MBT - - -
Other 1 1,600 -
Recycling 7 694,028 -
Waste processing 6 581,695 -
Total 45 7,533,918 465
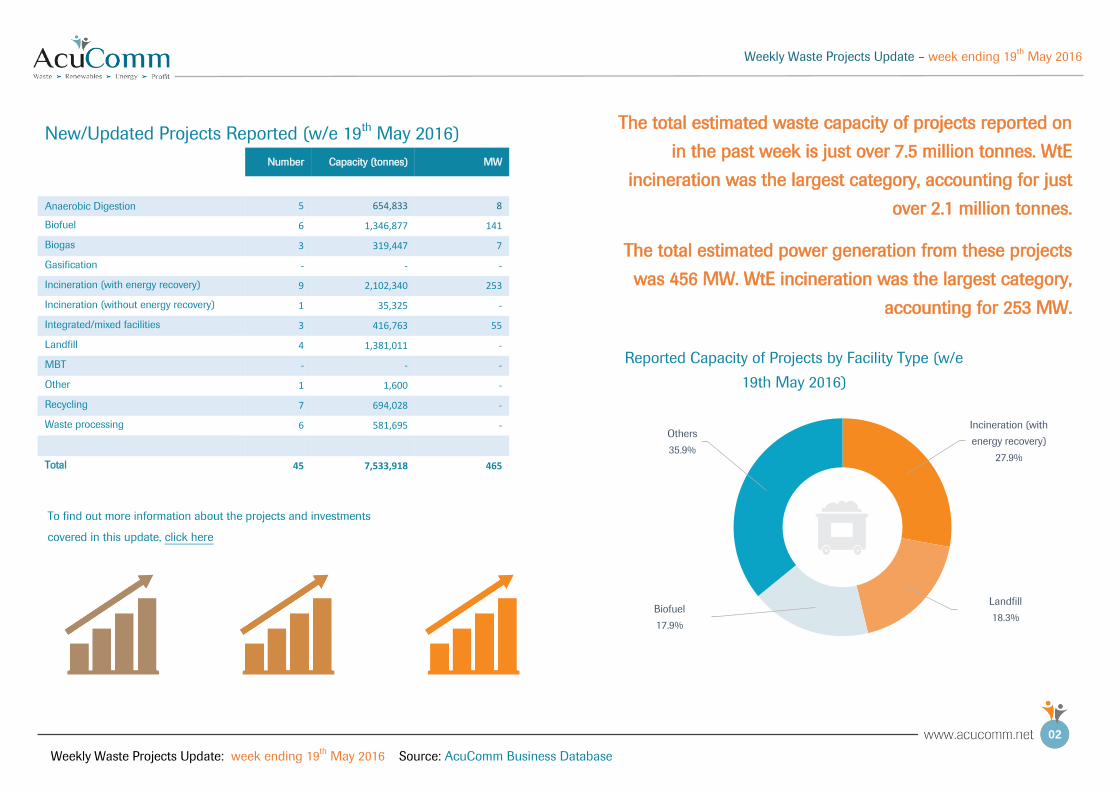
The total estimated waste capacity of projects reported on
in the past week is just over 7.5 million tonnes. WtE
incineration was the largest category, accounting for just
over 2.1 million tonnes.
The total estimated power generation from these projects
was 456 MW. WtE incineration was the largest category,
accounting for 253 MW.
Incineration (with
energy recovery)
27.9%
Landfill
18.3%Biofuel
17.9%
Others
35.9%
Reported Capacity of Projects by Facility Type (w/e
19th May 2016)
To find out more information about the projects and investments
covered in this update, click here
Weekly Waste Projects Update – week ending 19th
May 2016
Weekly Waste Projects Update: week ending 19th
May 2016 Source: AcuComm Business Database
03
New Projects Reported by Waste Types (w/e 19th May 2016)
Number Capacity (tonnes) MW
Animal 1 424,190 2
Clinical - - -
Construction/Demolition - - -
e-Waste - - -
Food 2 46,245 3
Gas - - -
Glass 2 192,769 -
Hazardous 2 36,925 -
Heat - - -
Industrial - - -
Metals - - -
MSW 18 3,967,842 221
Oil - - -
Organic (general/unspecified) 6 1,119,246 68
Other 2 28,470 -
Paper - - -
Plant biomass (non-waste) - - -
Plant biomass (waste) 5 1,243,469 125
Plastics - - -
Radioactive 2 533 -
Rubber - - -
Sewage/wastewater 1 11,597 1
Wood 4 462,633 45
Total 45 7,533,918 465
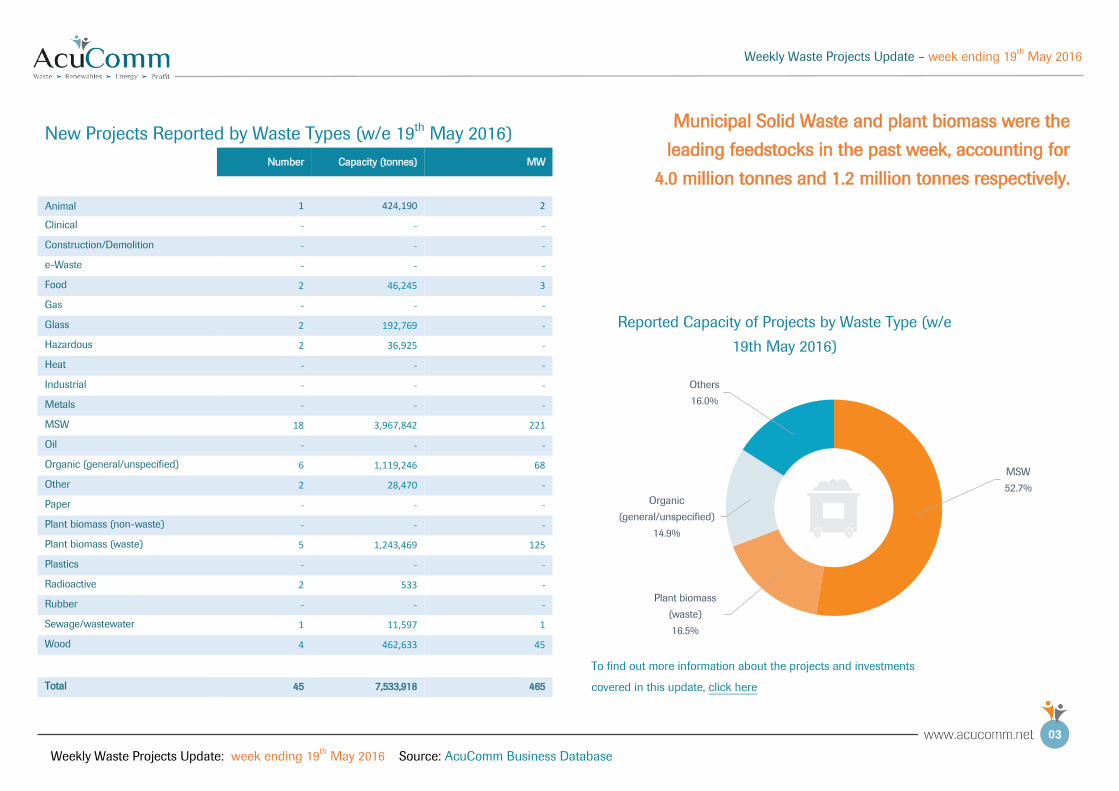
Municipal Solid Waste and plant biomass were the
leading feedstocks in the past week, accounting for
4.0 million tonnes and 1.2 million tonnes respectively.
MSW
52.7%
Plant biomass
(waste)
16.5%
Organic
(general/unspecified)
14.9%
Others
16.0%
Reported Capacity of Projects by Waste Type (w/e
19th May 2016)
To find out more information about the projects and investments
covered in this update, click here
Weekly Waste Projects Update – week ending 19th
May 2016
Weekly Waste Projects Update: week ending 19th
May 2016 Source: AcuComm Business Database
04
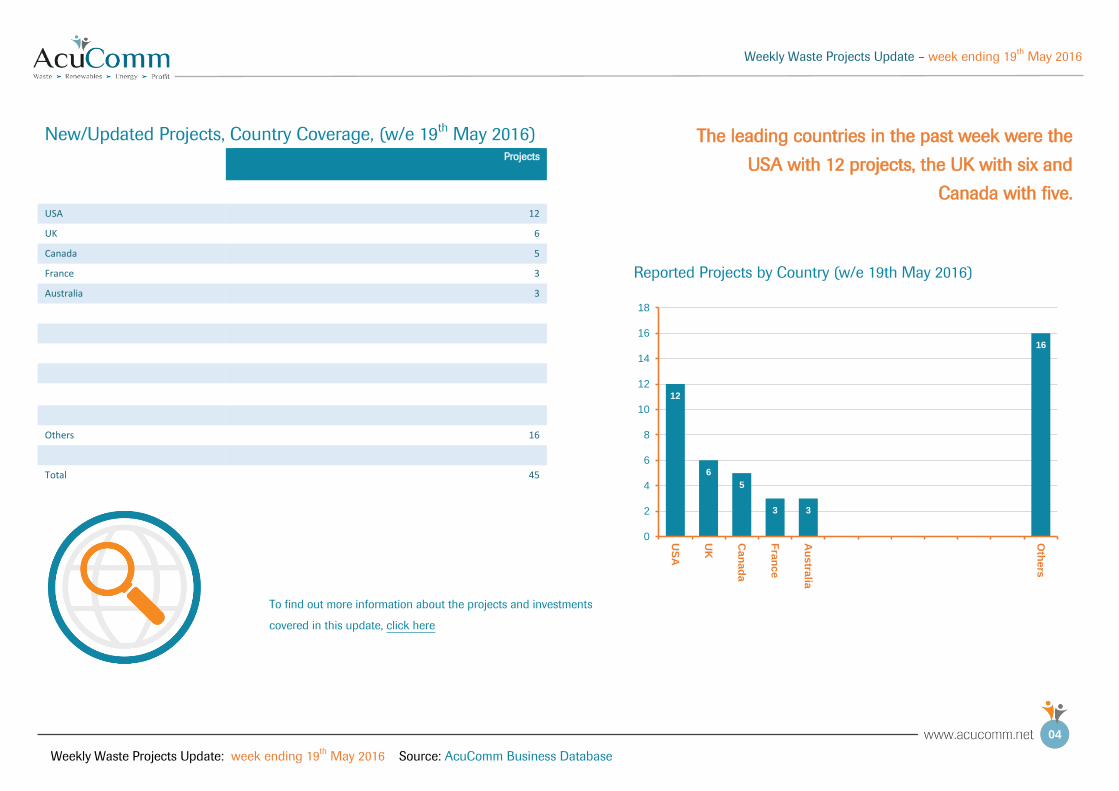
New/Updated Projects, Country Coverage, (w/e 19th May 2016)
Projects
USA 12
UK 6
Canada 5
France 3
Australia 3
Others 16
Total 45
The leading countries in the past week were the
USA with 12 projects, the UK with six and
Canada with five.
12
6
5
3 3
0 0 0 0 0 0
16
0
2
4
6
8
10
12
14
16
18
US
A
UK
Can
ad
a
Fra
nc
e
Au
stra
lia
Oth
ers
Reported Projects by Country (w/e 19th May 2016)
To find out more information about the projects and investments
covered in this update, click here
Weekly Waste Projects Update – week ending 19th
May 2016
Weekly Waste Projects Update: week ending 19th
May 2016 Source: AcuComm Business Database
05
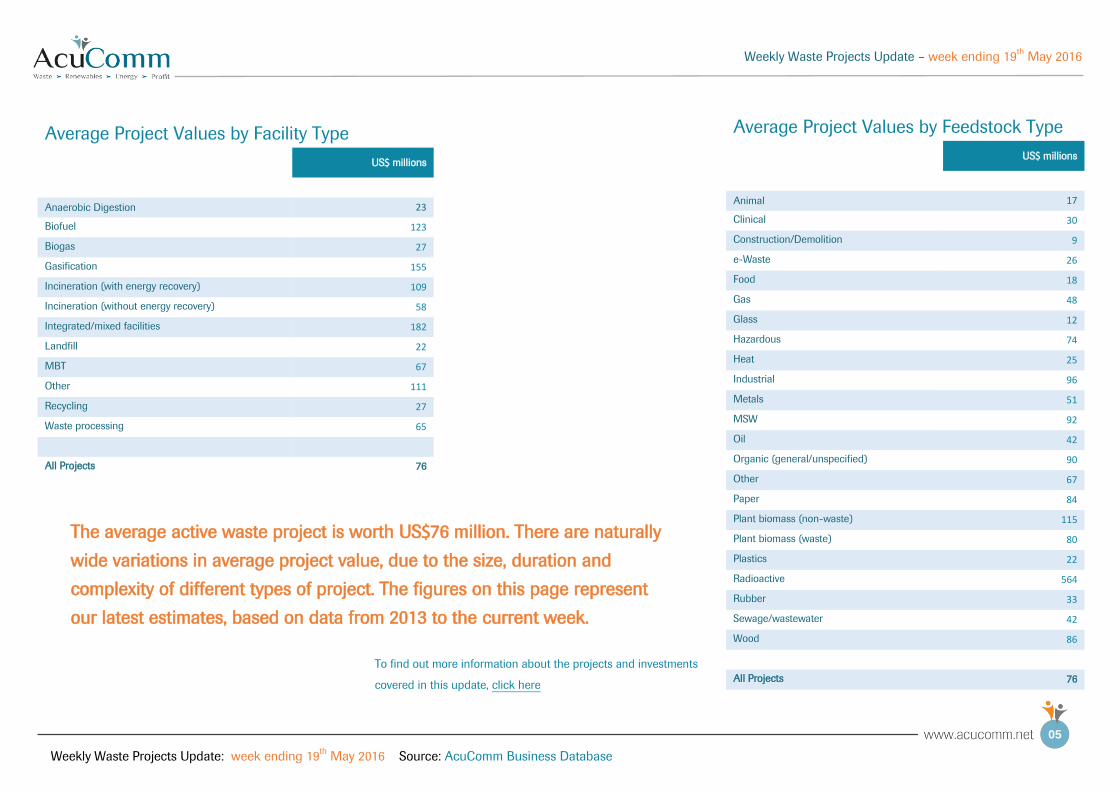
Average Project Values by Facility Type
US$ millions
Anaerobic Digestion 23
Biofuel 123
Biogas 27
Gasification 155
Incineration (with energy recovery) 109
Incineration (without energy recovery) 58
Integrated/mixed facilities 182
Landfill 22
MBT 67
Other 111
Recycling 27
Waste processing 65
All Projects 76
Average Project Values by Feedstock Type
US$ millions
Animal 17
Clinical 30
Construction/Demolition 9
e-Waste 26
Food 18
Gas 48
Glass 12
Hazardous 74
Heat 25
Industrial 96
Metals 51
MSW 92
Oil 42
Organic (general/unspecified) 90
Other 67
Paper 84
Plant biomass (non-waste) 115
Plant biomass (waste) 80
Plastics 22
Radioactive 564
Rubber 33
Sewage/wastewater 42
Wood 86
All Projects 76
The average active waste project is worth US$76 million. There are naturally
wide variations in average project value, due to the size, duration and
complexity of different types of project. The figures on this page represent
our latest estimates, based on data from 2013 to the current week.
To find out more information about the projects and investments
covered in this update, click here
Weekly Waste Projects Update – week ending 19th
May 2016
Weekly Waste Projects Update: week ending 19th
May 2016 Source: AcuComm Business Database
06
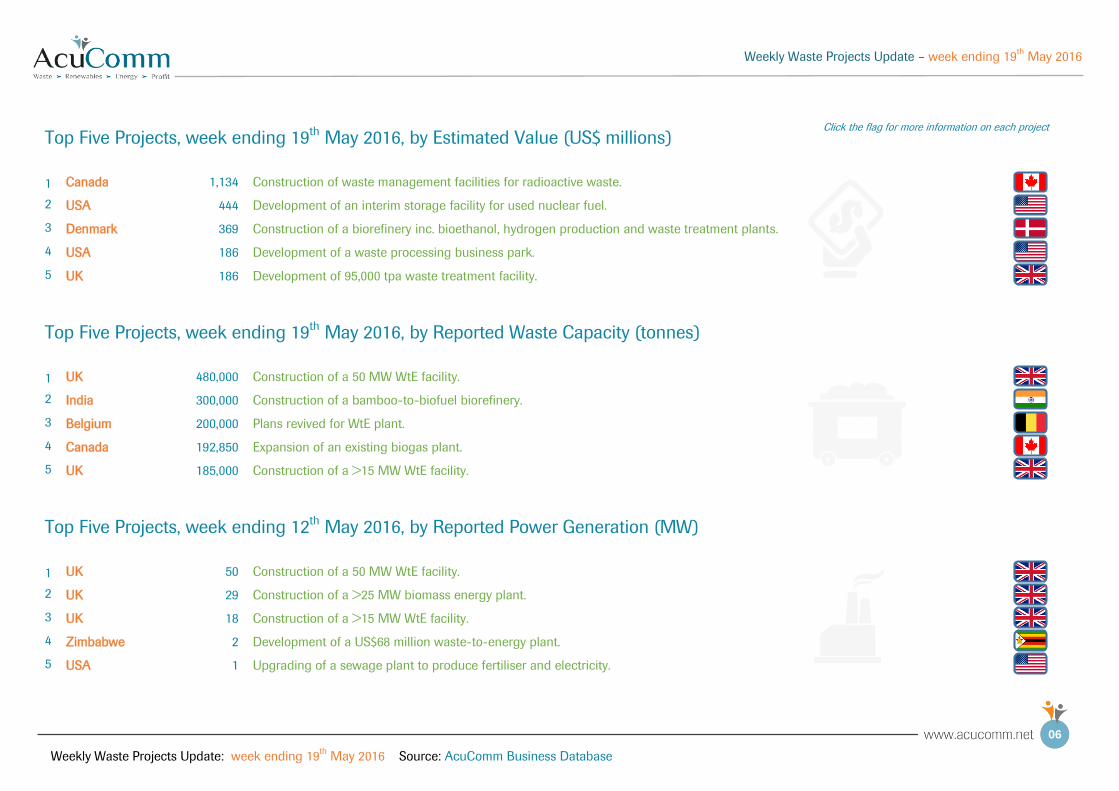
Top Five Projects, week ending 19th May 2016, by Estimated Value (US$ millions) Click the flag for more information on each project
1 Canada 1,134 Construction of waste management facilities for radioactive waste.
2 USA 444 Development of an interim storage facility for used nuclear fuel.
3 Denmark 369 Construction of a biorefinery inc. bioethanol, hydrogen production and waste treatment plants.
4 USA 186 Development of a waste processing business park.
5 UK 186 Development of 95,000 tpa waste treatment facility.
Top Five Projects, week ending 19th May 2016, by Reported Waste Capacity (tonnes)
1 UK 480,000 Construction of a 50 MW WtE facility.
2 India 300,000 Construction of a bamboo-to-biofuel biorefinery.
3 Belgium 200,000 Plans revived for WtE plant.
4 Canada 192,850 Expansion of an existing biogas plant.
5 UK 185,000 Construction of a >15 MW WtE facility.
Top Five Projects, week ending 12th May 2016, by Reported Power Generation (MW)
1 UK 50 Construction of a 50 MW WtE facility.
2 UK 29 Construction of a >25 MW biomass energy plant.
3 UK 18 Construction of a >15 MW WtE facility.
4 Zimbabwe 2 Development of a US$68 million waste-to-energy plant.
5 USA 1 Upgrading of a sewage plant to produce fertiliser and electricity.
Weekly Waste Projects Update – week ending 19th
May 2016
Weekly Waste Projects Update: week ending 19th
May 2016 Source: AcuComm Business Database
07