Embed Size (px)
Citation preview

Stephen Selkowitz Group Leader, Windows and Building Envelope
A Green Building Vision:
Progress and Challenges
Senior Advisor, Building Science
Lawrence Berkeley National Laboratory

1. Framing the Energy/Carbon Challenge
2. Framing the Building Performance Challenge
3. Delivering what we promise
4. Data, Tools, Transparency
5. The California Experiment
6. Do We Need New Research, Technology?
7. The Case for Integrated Systems
8. Evaluating Real-World Systems Performance
Presentation Outline

Lawrence Berkeley National Laboratory
Energy Use Carbon Emissions
Climate Change Sea level rise
????
Greenland Glaciers
Disney World
Antarctic Ice Shelf
+
Rising Sea Level
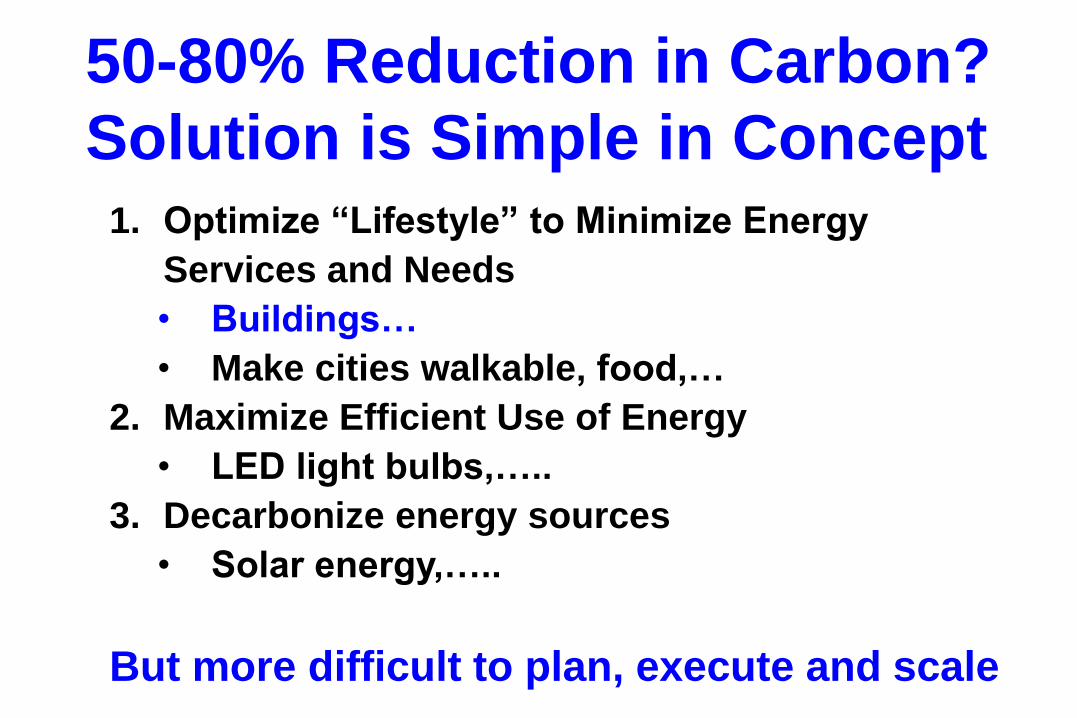
1. Optimize “Lifestyle” to Minimize Energy
Services and Needs
• Buildings…
• Make cities walkable, food,…
2. Maximize Efficient Use of Energy
• LED light bulbs,…..
3. Decarbonize energy sources
• Solar energy,…..
But more difficult to plan, execute and scale
50-80% Reduction in Carbon?
Solution is Simple in Concept

Lawrence Berkeley National Laboratory
~1960 – Early R&D on Low Carbon Energy Supply
Lawrence Berkeley National Laboratory
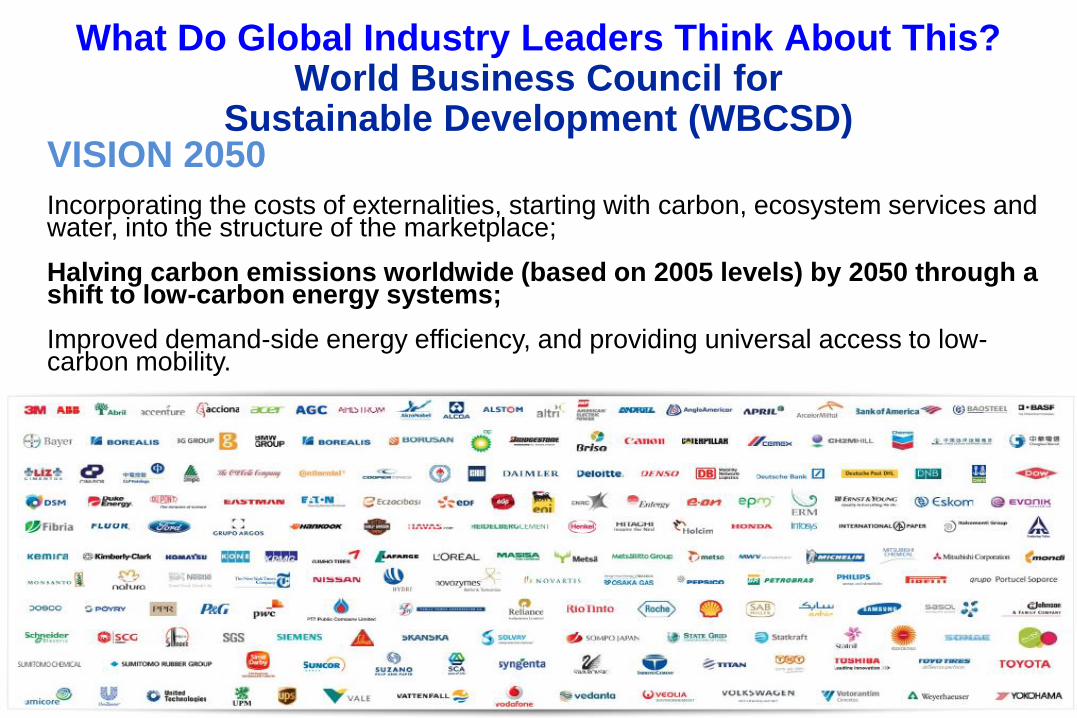
What Do Global Industry Leaders Think About This? World Business Council for
Sustainable Development (WBCSD) VISION 2050 Incorporating the costs of externalities, starting with carbon, ecosystem services and water, into the structure of the marketplace; Halving carbon emissions worldwide (based on 2005 levels) by 2050 through a shift to low-carbon energy systems; Improved demand-side energy efficiency, and providing universal access to low-carbon mobility.

Lawrence Berkeley National Laboratory
Why Focus on Buildings?? Total Building Energy Use; End Use Consumption
Buildings consume 40% of
total U.S. energy • 71% of electricity
•54% of natural gas
No Single End Use Dominates
Building sector has:
Largest Energy Use!
Fastest growth rate!

Lawrence Berkeley National Laboratory
2007 Annual
Energy
Outlook
Forecast
~+30%
2008
1990
-50%
-80% Carbon
U.S. Energy Use: History and Aggressive Future Goals
2030 1973 2005 2050 2020 1950
Goals

Lawrence Berkeley National Laboratory
U.S. Refrigerator Energy Use vs. Time
United States Refrigerator Use v. Time
0
200
400
600
800
1,000
1,200
1,400
1,600
1,800
2,000
19471949
19511953
19551957
19591961
19631965
19671969
19711973
19751977
19791981
19831985
19871989
19911993
19951997
19992001
Ave
rag
e E
ern
gy
Use
per
Un
it S
old
(kW
h p
er y
ear)
0
5
10
15
20
25
Ref
rig
erat
or
volu
me
(cu
bic
fee
t)
Energy Use per Unit
Refrigerator Size
(cubic feet)
Refrigerator Price in 1983 Dollars
$ 1,270
$ 462
Conclusion: Policy + technology + standards works

Lawrence Berkeley National Laboratory
U.S. Building Energy Projections Declining
EIA:
Energy
Information
Agency
AEO:
Annual
Energy
Outlook
Business
As Usual
Best Available
Technology

Lawrence Berkeley National Laboratory
Economic Savings from AEO Data
Lawrence Berkeley National Laboratory
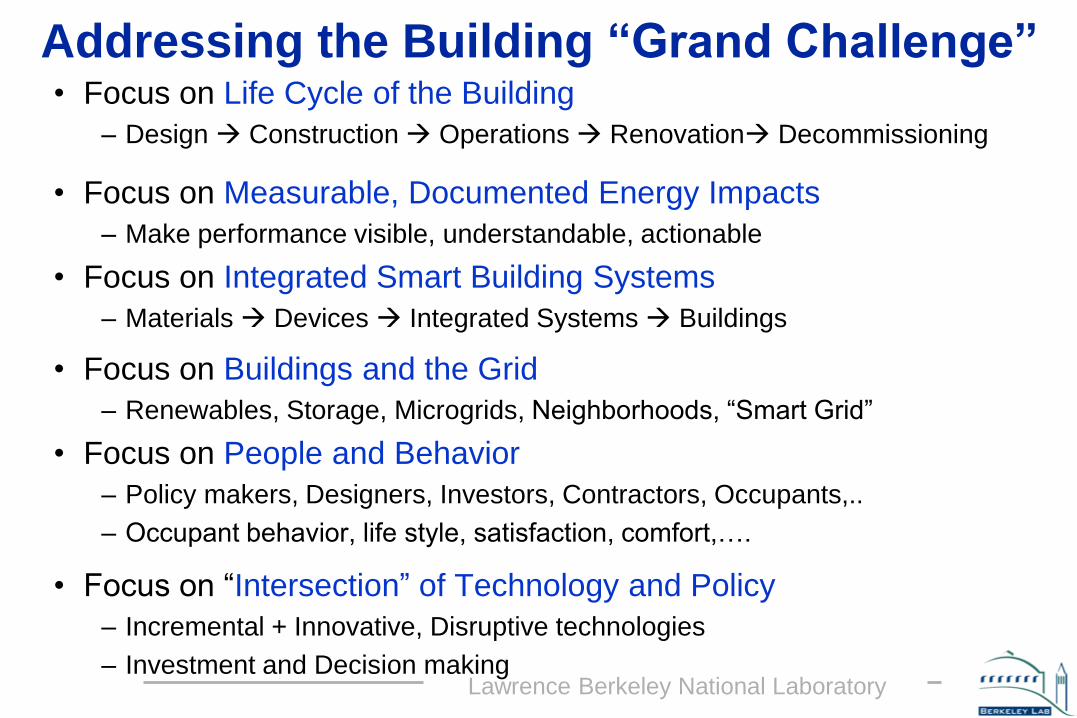
Addressing the Building “Grand Challenge” • Focus on Life Cycle of the Building
– Design Construction Operations Renovation Decommissioning
• Focus on Measurable, Documented Energy Impacts
– Make performance visible, understandable, actionable
• Focus on Integrated Smart Building Systems
– Materials Devices Integrated Systems Buildings
• Focus on Buildings and the Grid
– Renewables, Storage, Microgrids, Neighborhoods, “Smart Grid”
• Focus on People and Behavior
– Policy makers, Designers, Investors, Contractors, Occupants,..
– Occupant behavior, life style, satisfaction, comfort,….
• Focus on “Intersection” of Technology and Policy
– Incremental + Innovative, Disruptive technologies
– Investment and Decision making

Lawrence Berkeley National Laboratory
Significant Impact Comes Only from Comprehensive Balanced Program
To routinely deliver high performance, low-energy buildings
we must find a balance between:
Technology
Process
Solutions fail without this balance
Markets
Economics
Policy People
Innovation

Lawrence Berkeley National Laboratory
• Increase Rate of Adoption of Existing/Emerging Technologies – Operational improvements – Better Design and Selection Guidance – New Market channels – New Voluntary and Mandatory Programs – Education: best use for a particular application (climate, etc.)
• Create Pipeline of New Technology Options and Business Models: – Incremental improvements to technology available today
- Performance enhancements but Cost reductions - New features
– Breakthrough R&D - Innovation- new products, new applications
– Components Integrated Systems – “Net Zero Buildings” – Efficiency + Energy Generation
“Do It Now” vs “Wait and Do It Better Tomorrow” Why Not Do Both!

Lawrence Berkeley National Laboratory
A Framework for Building Performance
1. Predict Performance: Use fully validated simulation models and processes to reliably simulate and optimize a wide range of systems and their interactions.
2. Ensure Actual Performance: Validate/integrate simulation with measurements in testbeds and real buildings.
3. Deploy at Scale: Implement performance prediction tools and smart operations in routine practice
Vision: To design and operate buildings with “guaranteed” energy performance.
Goal: To accurately predict and verify energy performance across the building life cycle, from design to operations

Lawrence Berkeley National Laboratory
Information-Technology based Building Life-Cycle Integration View
Commissioning
Tools & Active Tests
Design
Operations
Design Tools Energy Tools
Retrofit Tools
Automated
Diagnostic
Tools
Commissioning
Construction
Information Monitoring
& Diagnostic System
Local / web-based
Metrics, Program
Requirements
Building
Information
Model
Maintenance &
Operations
Occupancy
Renovation
and
Decommissioning
buildingSMART
Data model

Lawrence Berkeley National Laboratory
The Challenge:
Design Goals vs Measured Performance
Observations:
1. Various building types, ages,
locations
2. Average over all projects is not bad
3. Max over-predict by 120%
4. Max under-predict by 65%
5. Almost all under-predicted
for low energy designs
(red triangle: EUI <= 40)
6. Uncalibrated simulated results
Source: Energy performance of LEED-NC buildings, NBI, 2008
Design EUI (kBtu/ft2)
Measure
d E
UI
(kB
tu/f
t2)
Measured=Design

Lawrence Berkeley National Laboratory
Can We Guarantee Performance??? Measured Performance vs Design Goals
Measured Performance =
– Design Goals x
– Simulation Tool Accuracy x
– Simulator Skill x
– Value Eng’ing “Aftermath” x
– Construction “Artifacts” x
– Schedule “Adjustments” x
– Facility Operations x
– Occupant “Adjustments x
– Weather “Adjustments”
De
sig
n/C
on
str
uc
t
A/E
Te
am
O
pe
rate
Fa
cili
tie
s T
ea
m
What is the Sensitivity/Uncertainty Associated with Each Factor?

Lawrence Berkeley National Laboratory
“guaranteed” Energy Performance
• Can a Design Team Guarantee Energy Use target?
• Design – Bid – Build – Operate….??
• Need new metrics and new business practices
• New Market Drivers:
• Outcome-based codes:
– “Build anything you want but prove that the building energy use is lower than target level after occupancy…”
• More Transparency: Energy Disclosure laws
– “Publicly” disclose your annual energy use!
– European Union implementation
– US: 29 Cities and States now have disclosure laws

Lawrence Berkeley National Laboratory
“All Simulation Models are Wrong,
But Some are Useful”
How do we ensure our tools are useful?
Data, Models and Tools

Lawrence Berkeley National Laboratory
Retro-commissioning
Codes and standards development
Interoperability
Benchmarking
Ratings, Labels
New R&D: Tools and Data
EnergyPlus engine development:
New features to model low energy designs
Speed-up, Technical support and maintenance
EnergyPlus Graphical User Interface
EnergyPlus derivatives: special purpose tools
e.g. COMFEN- façade early design tool
Building Controls Virtual Test Bed – co-simulation, real controls
New Simulation/Data apps:
Design assistance
Real-time performance assessment
Operation/Behavior modeling
Fault Detection and Diagnostics

Lawrence Berkeley National Laboratory
Making Data and Performance Visible Innovation at the State and City Level

Lawrence Berkeley National Laboratory
Quantifying and Exposing Performance:
Disclosure Legislation

Lawrence Berkeley National Laboratory
Meters-> “Big Data” Comes to the Buildings World: Energy Analytics for Buildings
EnergyIQ Benchmarking Tool • Seminal work on building commissioning cost-
benefit analysis of >600 buildings
• Energy Information & Benchmarking Systems for commercial, residential
24
DOE/EERE Building Energy Data Initiatives Actionable information to support investors, owners, operators, designers.
Advanced statistical methods to analyze emerging “big data” from data-rich buildings
and large portfolio datasets
Standard Energy
Efficiency Data (SEED)
platform

Lawrence Berkeley National Laboratory
~ 147 buildings
in 37 states! Zero Net Energy
Buildings Status: 2014
But there are 5 M buildings in US
Can we Scale This? How?

Lawrence Berkeley National Laboratory
Scale and Impact: We Need Both to Achieve Sector-wide Efficiency Goals
Narrow Wide
Shallow
Deep
Dep
th
Breadth
• Incremental change on existing
technology
• Tighten standards; tune up &
retrofit programs
e.g. ESCOs 5-20% Savings
• Major advances in components
• Demonstration projects
• Limited deployment in systems
e.g. Research, Demonstrations
50% to Zero Net Energy
• Systems approach: integrate
advanced components, optimize
energy, comfort, cost
• Capture social equity, health,
comfort, productivity issues
• Private/public partnership - Business
case, risk reduction and credible
third party data
NZEB
Solutions

Lawrence Berkeley National Laboratory
NZEB: Net (Nearly) Zero Energy Buildings
• “Net Zero Energy Buildings” is the right goal
• NZEB = 60-80% savings + renewables
The Reality
The Vision
The Dream
• Just Do It – Set a goal - march toward it
– Its easy, if we commit and apply ourselves
– We have the technology and know-how
• Major National Challenge – Technically attainable - Difficult to achieve in scale
– Shortcomings: Owners? Users? Tools? Construction? Operations?
– Integrated Standards -Deployment-Demonstration-Research
– Issues- Policy, Finance, Design Process, Technology

Lawrence Berkeley National Laboratory
California – Test Case

Lawrence Berkeley National Laboratory
California Path to Net Zero by 2030

Lawrence Berkeley National Laboratory
Develop Path to ZNE Non-Res. Buildings in Title 24- Start with the (technically) “Easiest” Buildings
Source: “The Road to ZNE” (2012, PG&E/HMG), p. 161.

Lawrence Berkeley National Laboratory
Zero Net Energy Buildings in California: Commercial Buildings
60 ZNE commercial buildings since 2007*
• Analysis performed by New Buildings Institute. Includes ZNE Ready and Near ZNE buildings. Not all verified.
SMUD East Campus Operations Center, Doug Norwood
Bacon St. Offices,
SDG&E & Hanna
Gabriel Wells
Architects
DPR Construction San Diego
Corporate Office , Chip Fox
• Building Size
• Building Type
• Design Team Skill
• COST

Lawrence Berkeley National Laboratory
0
100
200
300
400
500
600
700
800
900
Control Green Platinum NZE/LB
What is the Incremental Cost of NZEB?
Construction Cost of Low Rise Office Buildings
statistical analysis
BUILDINGS MEASURED $ / SF Lisa Matthiessen, Peter Morris and Laura Lesniewski

Lawrence Berkeley National Laboratory
NZEB Programs in Context: California Efficiency Plans and Programs

Lawrence Berkeley National Laboratory

Lawrence Berkeley National Laboratory
Current Dialogue re: CA ZNE Building Goals – Are the current ZNE goals the right goals?
– If not, how should they be changed?
- Building type, timing,….
– What should be the various role of the state agencies and teams to address / advance ZNE Comm goals?
- In utility programs? (~$1B/yr)
- In CPUC Updated Strategic Plan?
– Role of Mandatory Standards?
– Role of Utility Incentive and Rebate programs?
– Role of Training and Education: Designers, Contractors,…?
– Role of Innovation and R&D…
- Efficiency but also Risk, Cost

Lawrence Berkeley National Laboratory
Building Innovation “Game Changers”
MATERIALS AND SYSTEMS
• Smart Glass/Dynamic solar control
• High R Windows, Insulation
• Thermal Storage- Envelope, structural
• >200 lumen/watt lighting
• Daylight integration
• Dimmable, Addressable Lighting Controls
• Task Conditioning HVAC
• Climate Integrated HVAC
• HVAC vs comfort and IEQ
• Miscellaneous Electrical Loads
• Demand Response
• Controls infrastructure- sensors, networks
• Building- and Grid- Smart electronics
• Electrical Storage
SYSTEMS: IT, LIFE-CYCLE OPERATIONS
• Building Life Cycle Perspective
• Benchmarks and Metrics
• Building Information Models (BIM)
• Integrated Design Process and Tools
• Building Operating Controls/Platform
• Building Performance Dashboards
• Understanding Occupants/Behavior
• Facility Operations

Lawrence Berkeley National Laboratory
Singapore Likes Glass !

Lawrence Berkeley National Laboratory
1976 Perspective: Code Official’s View of Ideal Window
2014 Perspective: Architect’s View of Ideal Window
Glazing, Windows and Facades: Two Contrasting Views of Energy Efficiency

Lawrence Berkeley National Laboratory
Vision: Windows for Zero-Energy Buildings “Zero Energy Windows”
Energy Losers --> Neutral --> Suppliers
• Heating climates
– Reduce heat losses so that ambient solar energy balances and exceeds loss
– Need lower heat loss technologies
• Cooling climates
– Reduce cooling loads
– Natural Ventilation
– Static control -> dynamic control
• All climates
– Replace electric lighting with daylight
• Electricity supply options?
– Photovoltaics-building skin as power source

Lawrence Berkeley National Laboratory
Optimizing Energy in Integrated Facades
Increased solar
heat gains
Increased lighting
energy use and gains
Minimum energy use
Slopes vary depending on
efficiency of lighting and
HVAC systems Energy Use
Balance Performance issues • Energy
• Demand
• Carbon
• Peak Cooling
• Comfort: visual/thermal
• View
• Appearance
• ……
• Ideal: Integrated approach to
façade-lighting-HVAC building
systems to achieve optimum energy-
efficiency and comfort.
… Its Complicated!!
Key parameters • Climate
• Orientation
• Building Type
• Fenestration area
• Glass type
• Operations
• Daylight
• Shading
• ……

Lawrence Berkeley National Laboratory
An “Intelligent” Façade might….. • Manage thermal loss and gain
• Provide dynamic solar control:
• Provide glare-free daylight
• Provide fresh air to interior, minimize noise
• Enhance occupant health, comfort
• Reduce demand on utility
• Generate power (photovoltaics)

Lawrence Berkeley National Laboratory
Light to Solar Gain Ratio = Tvis / SHGC LSG = 1.0 LSG = 2.0
Tvis
SHGC
6 x cooling load!
2.5 x cooling load! 60%
20%

Lawrence Berkeley National Laboratory
Light to Solar Gain Ratio = Tvis / SHGC LSG = 1.0 LSG = 2.0
Tvis
SHGC
Tvis: .02 .60
SHGC: .09 .5
SMART
GLASS:
Change
properties
based on
needs

Lawrence Berkeley National Laboratory
Smart Coatings for Dynamic Control of Windows Balancing Cooling and Daylighting, View and Glare
• Flexible, optimized control of solar gain and daylight
• Passive control
– Photochromic - light sensitive
– Thermochromic - heat sensitive
• Active control
– Liquid Crystal
– Suspended particle display (SPD)
– Electrochromic
• Active control preferred; but requires wiring windows for power and control
• + Automated blinds, shades, etc…
“OFF”
“ON”

Lawrence Berkeley National Laboratory
Electrochromic “Smart” Windows: Progress Towards the Marketplace
Technology, Design, Integration Challenges
45

Lawrence Berkeley National Laboratory
Exploring Performance of Integrated Shading/Lighting Control Systems
in LBNL Facade Testbed Facility
External Dynamic Shading
Daylight Redirecting Glass
Electrochromic Glass

Lawrence Berkeley National Laboratory
Automated Shading Controls Glare Throughout the Day Time Lapse from Tests in LBNL Façade Test Facility:
Interior Daylight Luminance Patterns with Dynamic Shading
LBNL Façade Test Facility
1 2 3
6 5 4
3 2 1

Lawrence Berkeley National Laboratory
(Day)Lighting: 3 challenges 1. A Daylighted Building Doesn’t Save Energy if the Lights are On
2. Why Do We Only Daylight Outer 3-4 M of space
3. Glare vs Light- Occupant Control of Shades, blinds
Lawrence Berkeley National Laboratory
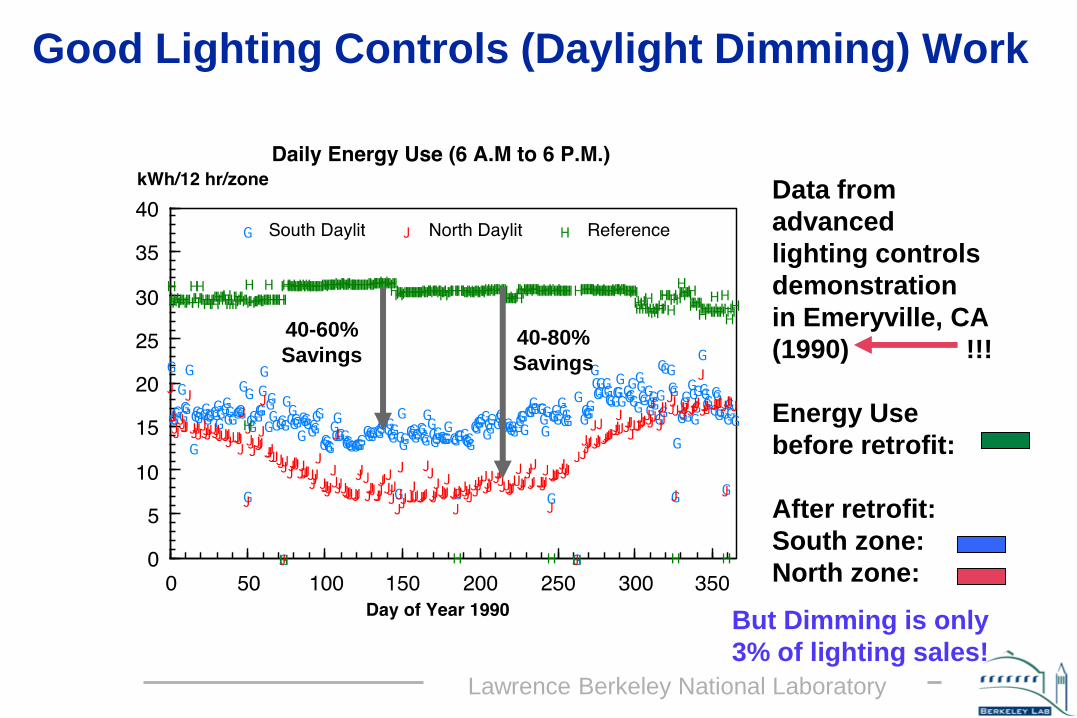
Good Lighting Controls (Daylight Dimming) Work
Data from
advanced
lighting controls
demonstration
in Emeryville, CA
(1990) !!!
Energy Use
before retrofit:
After retrofit:
South zone:
North zone:
40-60%
Savings 40-80%
Savings
But Dimming is only
3% of lighting sales!

Lawrence Berkeley National Laboratory
Holy Grail: Daylight Redirecting Optics “Triple floor space impact w/o Glare”
10'
30'
Equinox
Winter
Diffuse light
Summer
10'
lower window
10m
3m
clerestory Daylight Glazing
provides good, glare-
free daylight 10m from
window wall
Optics, Geometry
optimized for all
seasons, without
moving parts?

Lawrence Berkeley National Laboratory
New Daylighting Technologies and Systems Venetian blind
Prismatic Coating
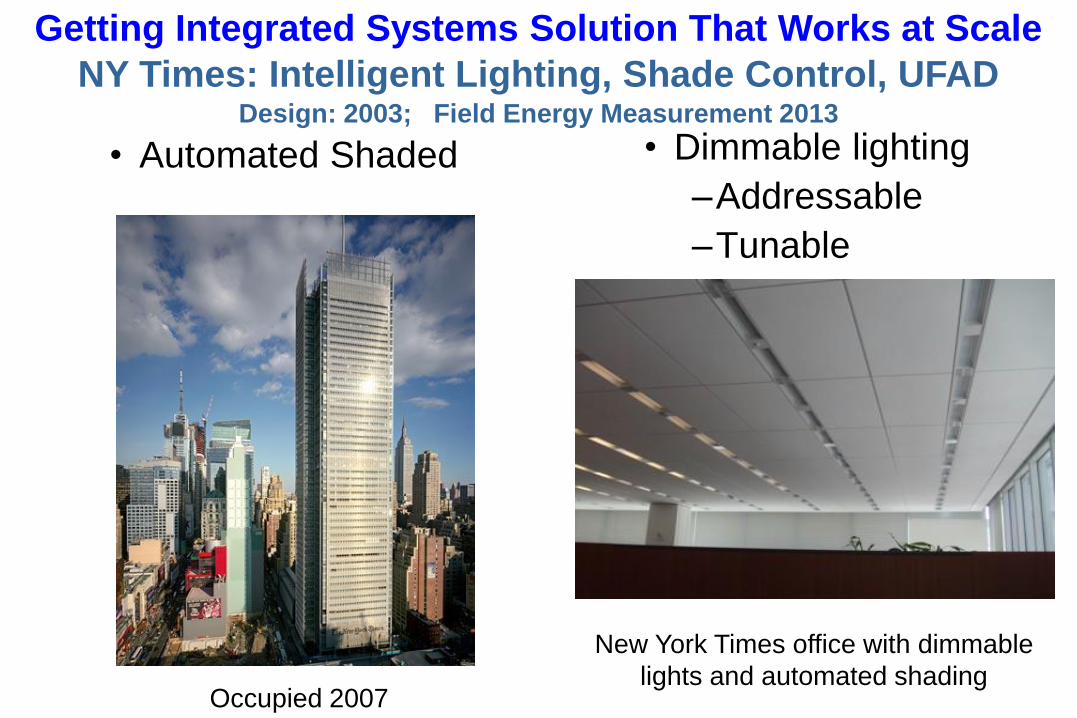
• Dimmable lighting
–Addressable
–Tunable
Getting Integrated Systems Solution That Works at Scale
NY Times: Intelligent Lighting, Shade Control, UFAD Design: 2003; Field Energy Measurement 2013
New York Times office with dimmable
lights and automated shading Occupied 2007
• Automated Shaded

Lawrence Berkeley National Laboratory
Façade Layers Inside to Outside:
External layer: Fixed
-- Shading, light diffusion
Glazing layer: Fixed
-- Low-E, spectrally selective
- thermal control
- solar gain control
-- Frit - solar, glare control
Internal layer: Dynamic
-- Motorized Shade system
-- Solar control
-- Glare control
Floor to Floor:
Façade Layers
floor to desk
desk to head
head to ceiling
plenum
“All Glass Building” but…
Lawrence Berkeley National Laboratory
54
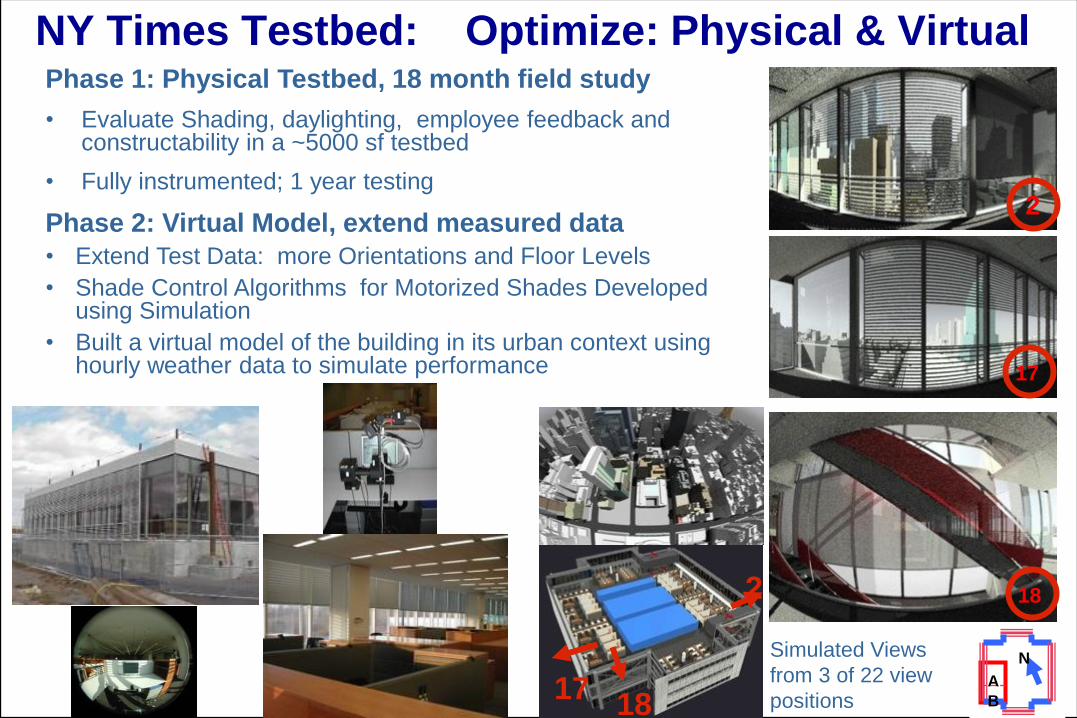
NY Times Testbed: Optimize: Physical & Virtual
2
18 17
Simulated Views
from 3 of 22 view
positions
Phase 1: Physical Testbed, 18 month field study
• Evaluate Shading, daylighting, employee feedback and constructability in a ~5000 sf testbed
• Fully instrumented; 1 year testing
Phase 2: Virtual Model, extend measured data
• Extend Test Data: more Orientations and Floor Levels
• Shade Control Algorithms for Motorized Shades Developed using Simulation
• Built a virtual model of the building in its urban context using hourly weather data to simulate performance
2
17
18
A
B
N

Lawrence Berkeley National Laboratory
55 New York Times Building
Energy Monitoring and Post Occupancy Evaluation
Lighting Control Systems: On/off: Scheduling
Lights On 5am – 10 PM +
Night Cleaning Crew
Off
Off
Time
Power

Lawrence Berkeley National Laboratory
56 New York Times Building
Energy Monitoring and Post Occupancy Evaluation
Lighting Control Systems: On/off: Scheduling, Occupancy
Dimming: Setpoint Tuning, Daylight, Demand Response
56% savings vs previous slide

Lawrence Berkeley National Laboratory
57 The “Headlines” from
The New York Times Building
• 2003: Building designed to save energy, satisfy occupants
• Shading systems and lighting control systems were rigorously developed and evaluated in a full scale test bed
• Owners engaged key systems suppliers via performance specs
• 2013: Systems (dimming, shading, UFAD) worked well; Compared to a similar Code-compliant building:
– 56% lighting energy savings
– 24% total energy savings
– 21-25% reduction in summer peak demand
– Economic Paybacks appear very reasonable
– Overall Occupant Satisfaction is high
• Outcome: “All-glass” building w/ Integrated Building Systems performs better than a prescriptive “code-compliant” building

Lawrence Berkeley National Laboratory
Single component or
isolated system EEM
Current Design and Research Paradigm – Silo Approach
Integrated Building Systems Approach
Multi-system integrated
EEMs

Lawrence Berkeley National Laboratory
Exploring Intelligent Building Control Systems: The “Internet of Things” Collides with the Building Industry…
Task Requirements
User Preferences
Interior Conditions
Weather Conditions
Load Shedding/ Demand Limiting
Signal
Smart Controllers
Lighting Systems
(with dimming ballasts, sensors)
Building Performance (cost, comfort, operations)
Dynamic Window
(active control of daylight,
glare, solar gain)
Energy Information
System
H
V
A
C
Sensors, meters,…

Lawrence Berkeley National Laboratory
System integration Cost/Risk tradeoffs People Buildings “Smart Grid”
Heating
Cooling
Lighting
Peak
Cooling
Load Chiller
Size
Lighting
Design
Strategy
Energy, Peak
Electric
Demand,
Load
Shape
Central Power
Generation
$
$ $
$
$
$
Initial Cost Annual Cost
Office Eq.
Onsite Power
Generation
$

Lawrence Berkeley National Laboratory
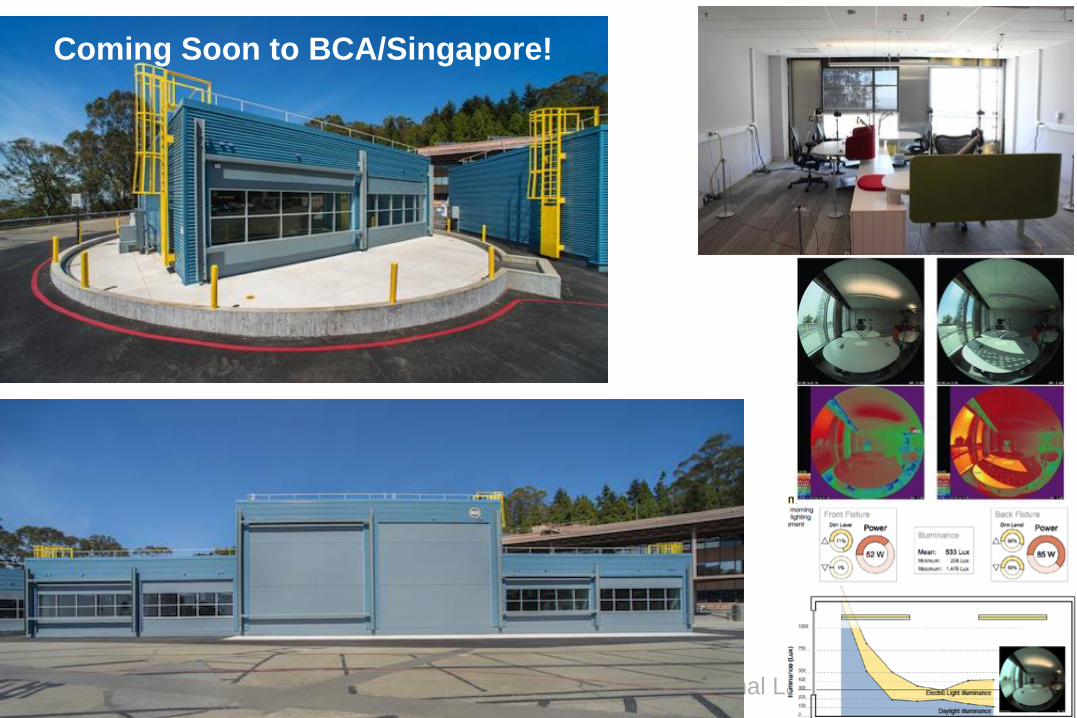
FLEXLAB: Facility for Low Energy EXperiments in Buildings
61
4 Outdoor Testbeds:
3 1-story
1 2-story
3 Indoor Testbeds
Lighting/Plug Load
Sensors/Controls
Design Lab
Data Acquisition,
Monitoring, Control
System
“World’s most advanced building
energy efficiency test bed”

Lawrence Berkeley National Laboratory
Data acquisition
and controls
Interchangeable
HVAC systems:
air- and water-
based
Interchangeable
lighting and
controls
Interchangeable
skylights
Interchangeable
façade elements:
shading, glazing
Granular sensor,
instrumentation and
metering system
Reconfigurable, “Kit-of-Parts”
Lawrence Berkeley National Laboratory
Coming Soon to BCA/Singapore!

Lawrence Berkeley National Laboratory
Build Mutual Interest for Challenge and Opportunities w/ Net Zero Energy/Green Buildings
• NZE/Green Buildings: a necessary and attainable target
• Make high performance and energy efficiency a market advantage, not an extra cost or a risk
• Must Deliver Measurable Savings!
• New Technology, Smarter Design offers:
– New Business Opportunities
– Design freedom and flexibility
– Value-added benefits, e.g. better acoustics
– New performance benefits: e.g. comfort
– Modest/no extra first costs and large annual savings
– Lower impact on global environment
Manufacturer
Architect
Occupant
Owner
Society

Lawrence Berkeley National Laboratory
We must aggressively accelerate and sustain….
1. The learning curve
2. The adoption curve
3. Creation of new partnerships, business models
4. Establishment of new expectations
5. Delivery on performance promises
Defining an Innovation Pathway to the Future

Lawrence Berkeley National Laboratory
“If I had asked people what they wanted, they would have said faster horses.”
Henry Ford
How Do We Move Forward?
“Think Big, Start Small, Act Now” “Lead, Engage, Sustain”
Ask the Right Questions;
Listen Carefully to the Answers
Make Data-Informed Decisions and Act with the Future in Mind

Benefits of High Performance, Green Buildings
Improve
Occupant Comfort,
Satisfaction and
Performance
Add Value,
Reduce Operating
Costs
Reduce Energy,
Greenhouse Gas
Emissions
Occupant Building Owner
Planet

More Information
Stephen Selkowitz E-mail: [email protected] Current information and downloads at: http://btus.lbl.gov/home http://facades.lbl.gov http://flexlab.lbl.gov http://windows.lbl.gov/resources/LBNLresources.pdf http://wem.lbl.gov http://cbs.lbl.gov