Embed Size (px)
Citation preview
Lawrence Berkeley National Laboratory
Pathways toNet Zero Energy Buildings
Stephen SelkowitzDepartment Head, Building Technologies Department
Lawrence Berkeley National [email protected]
510/486-5064
Building Product Manufacturers AllianceRoadmap to Energy Efficiency and Sustainability
Berkeley, CA 12/08/08
Lawrence Berkeley National Laboratory
Outline
1. Energy Efficiency and Buildings - the big picture2. Net Zero Energy Buildings - goals, challenges3. Windows and Integrated Façade Systems4. NY Times building: Automated shading and daylighting5. Intelligent Lighting Systems6. Smart Grid and Demand Response7. Integrated Building Systems8. Performance Benchmarking and Labeling9. Simulation Tools10. Summary
Lawrence Berkeley National Laboratory
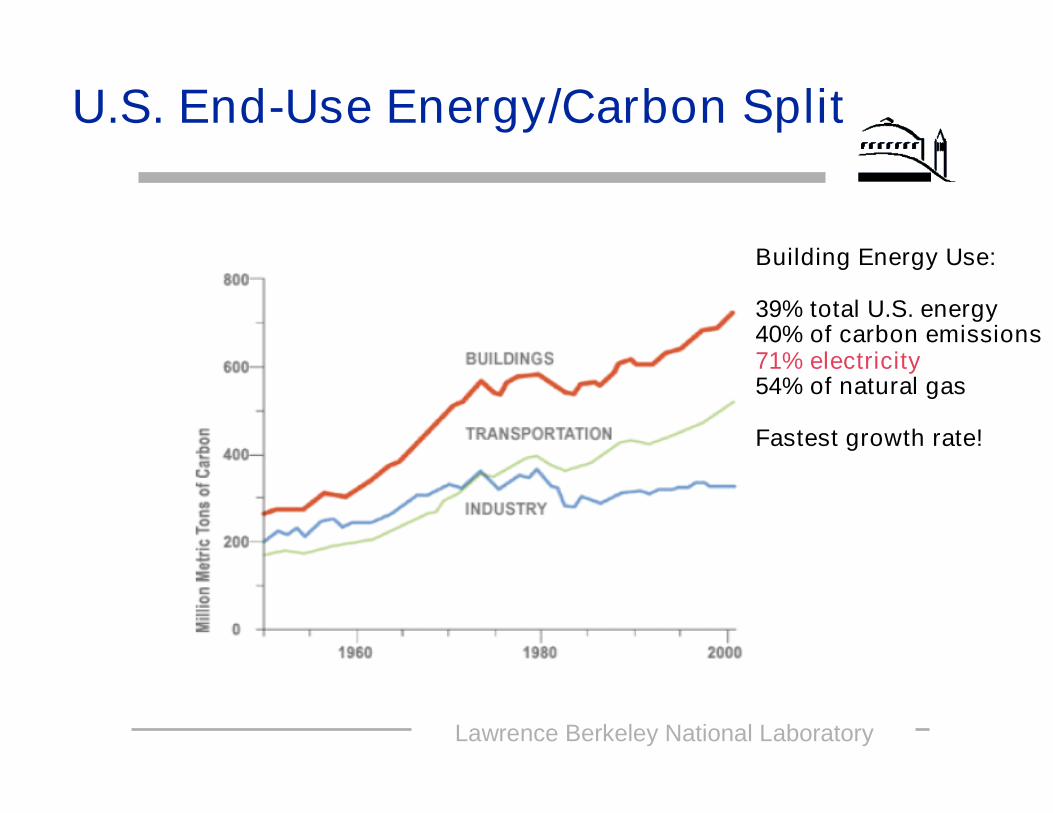
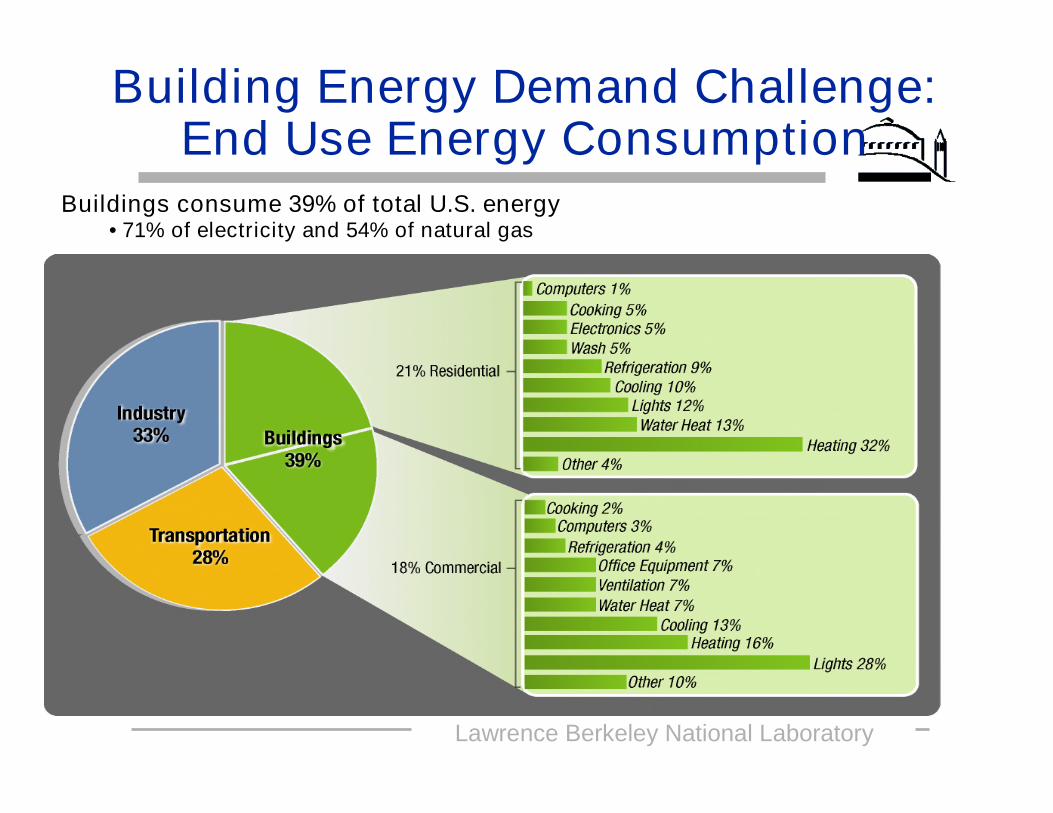
U.S. End-Use Energy/Carbon Split
Building Energy Use:
39% total U.S. energy40% of carbon emissions71% electricity54% of natural gas
Fastest growth rate!
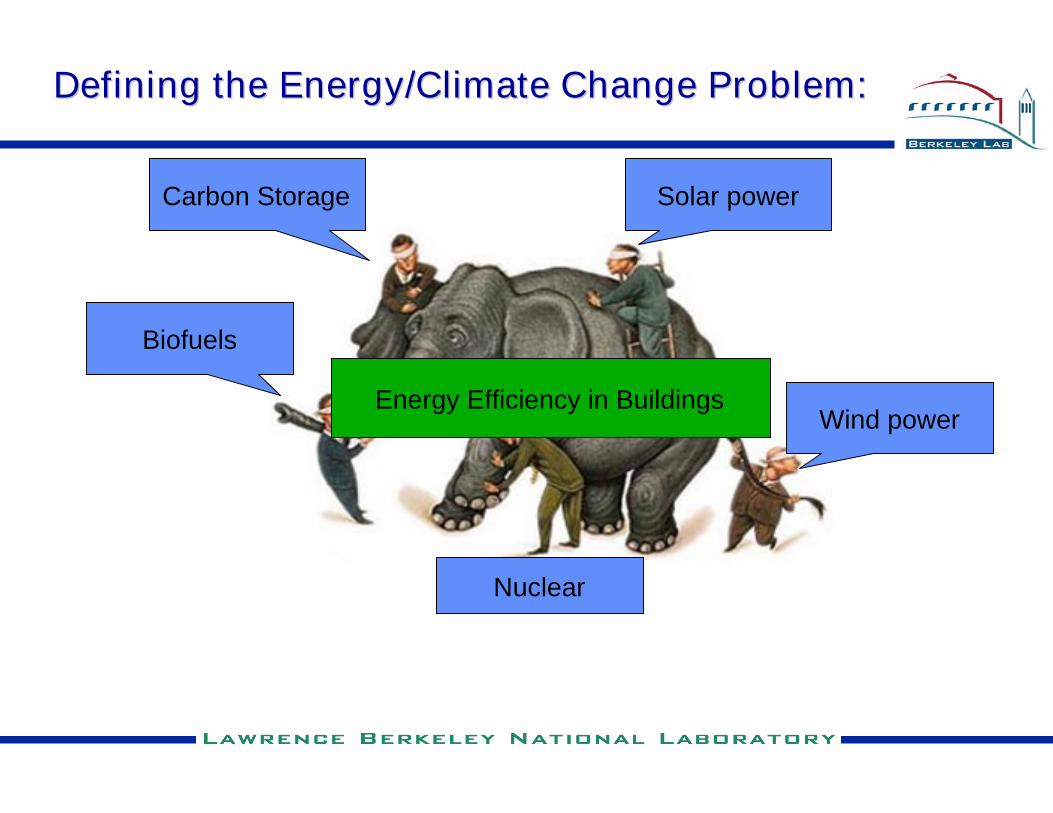
Defining the Energy/Climate Change Problem:Defining the Energy/Climate Change Problem:
Energy Efficiency in Buildings
Nuclear
Biofuels
Wind power
Solar powerCarbon Storage
5
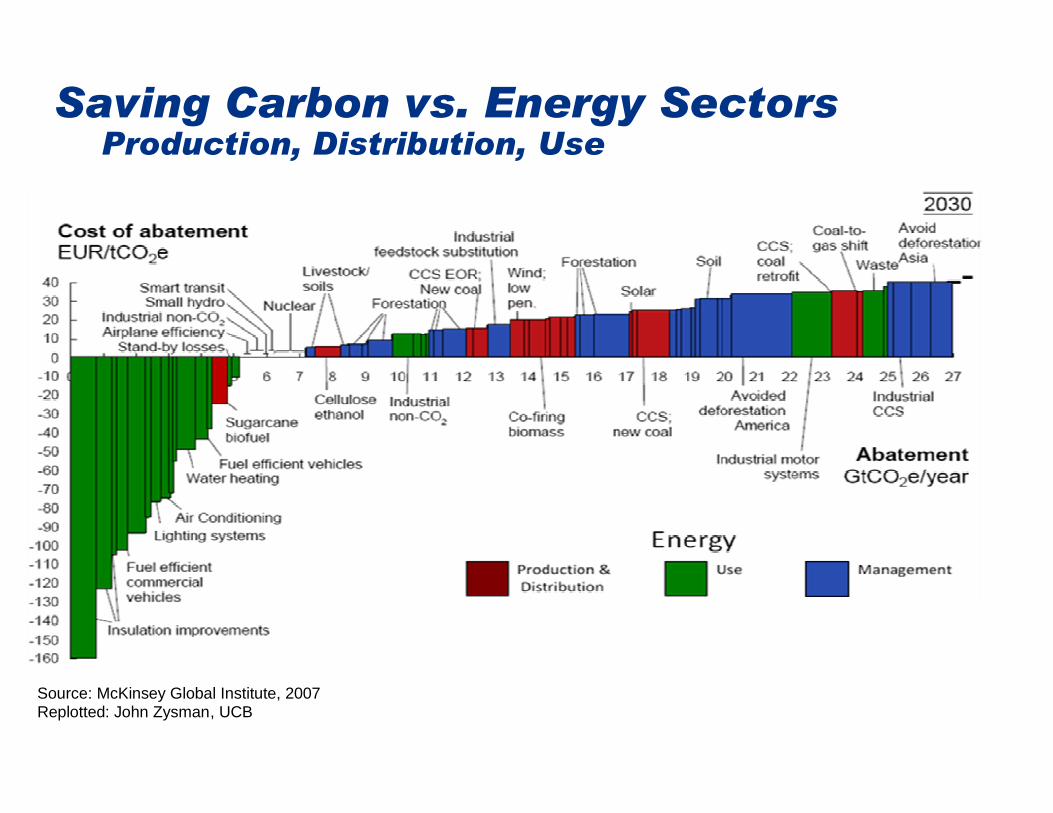
Saving Carbon vs. Energy SectorsProduction, Distribution, Use
Source: McKinsey Global Institute, 2007Replotted: John Zysman, UCB
Lawrence Berkeley National Laboratory
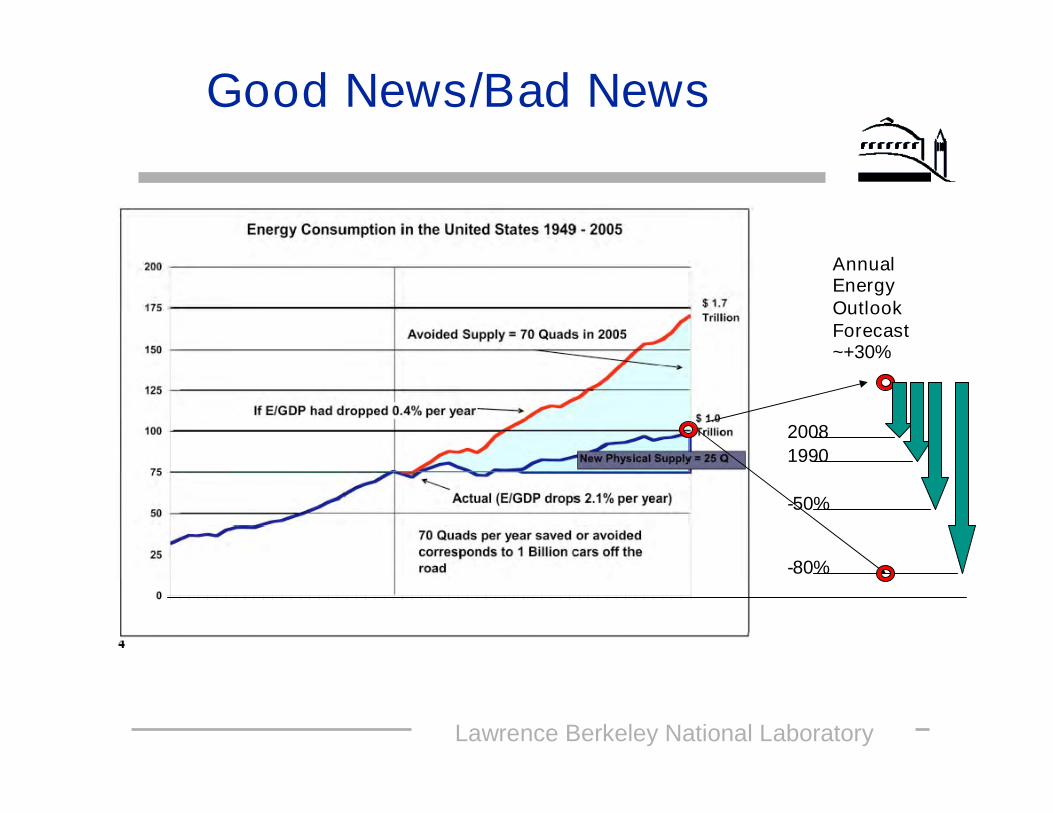
AnnualEnergyOutlookForecast~+30%
20081990
-50%
-80%
Good News/Bad News
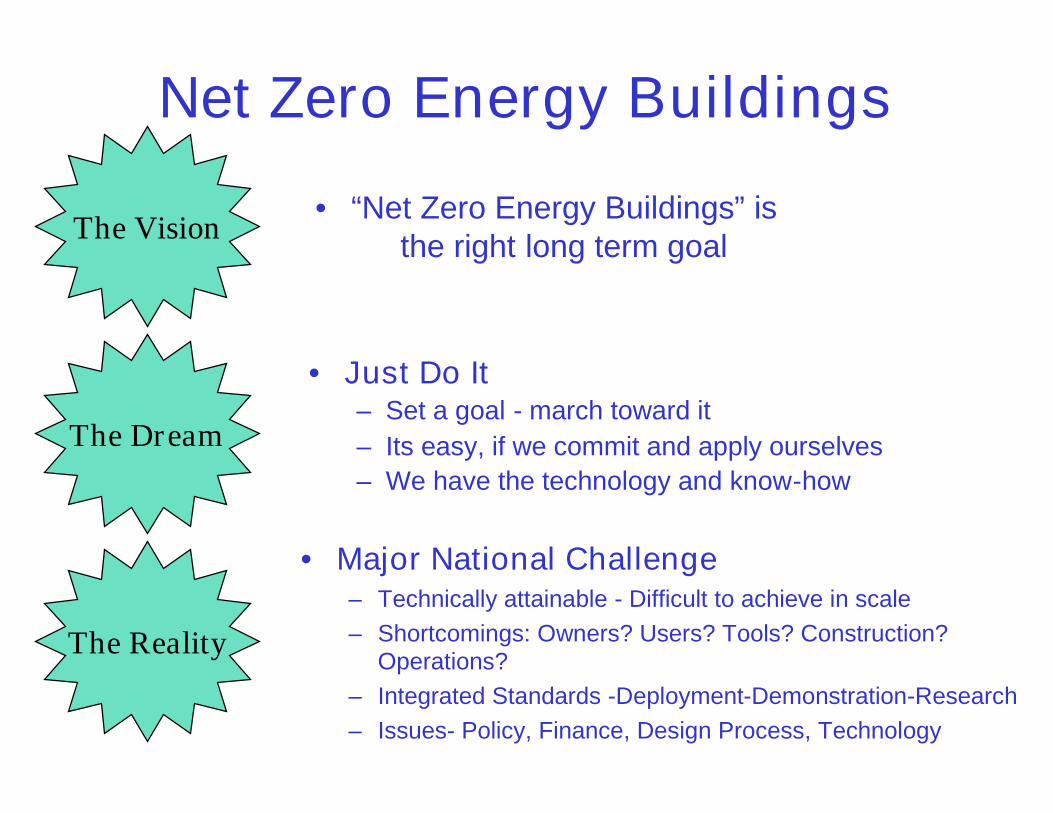
Net Zero Energy Buildings
• “Net Zero Energy Buildings” isthe right long term goal
The Reality
The Vision
The Dream
• Just Do It– Set a goal - march toward it– Its easy, if we commit and apply ourselves– We have the technology and know-how
• Major National Challenge– Technically attainable - Difficult to achieve in scale– Shortcomings: Owners? Users? Tools? Construction?
Operations?– Integrated Standards -Deployment-Demonstration-Research– Issues- Policy, Finance, Design Process, Technology
Lawrence Berkeley National Laboratory
Building Energy Demand Challenge:End Use Energy Consumption
Buildings consume 39% of total U.S. energy• 71% of electricity and 54% of natural gas
Lawrence Berkeley National Laboratory
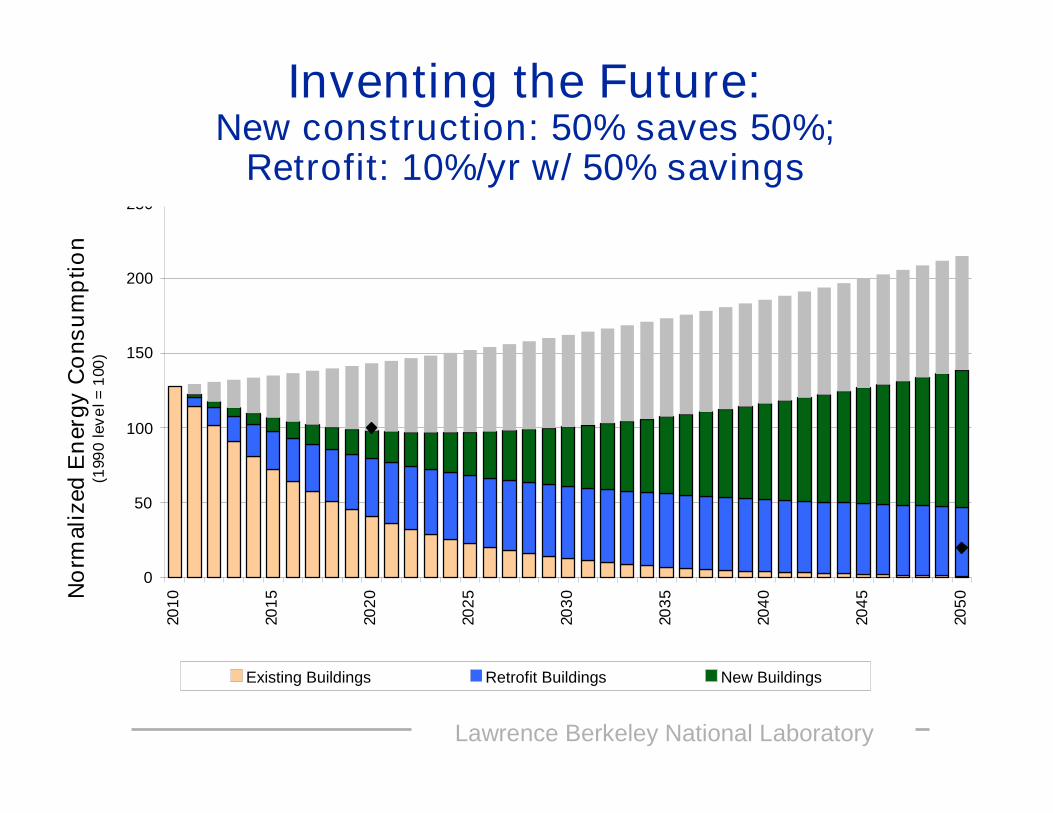
Renovation Focus(1/2 new buildings at 50% improvement, reno rate 10%/yr at 50% improvement)
0
50
100
150
200
250
2010
2015
2020
2025
2030
2035
2040
2045
2050N
orm
aliz
edE
ner
gyC
ons
um
ptio
n(1
990
leve
l=10
0)
Existing Buildings Retrofit Buildings New Buildings
Inventing the Future:New construction: 50% saves 50%;
Retrofit: 10%/yr w/ 50% savings

Lawrence Berkeley National Laboratory
Same as previous, but with higher retrofit rate(new bldgs starting at 60% and getting to 99% better by 2030,
retrofit rate at 10%/yr, retrofits starting at 50% and getting to 80% by 2030)
0
50
100
150
200
250
2010
2015
2020
2025
2030
2035
2040
2045
2050N
orm
aliz
edE
nerg
yC
ons
umpt
ion
(199
0le
vel=
100)
Existing Buildings Retrofit Buildings New Buildings
Inventing the Future: “Ultra Aggressive”New construction: 60% --> 90% in 2030
Retrofit: 10%/yr; 50%--> 80% in 2030
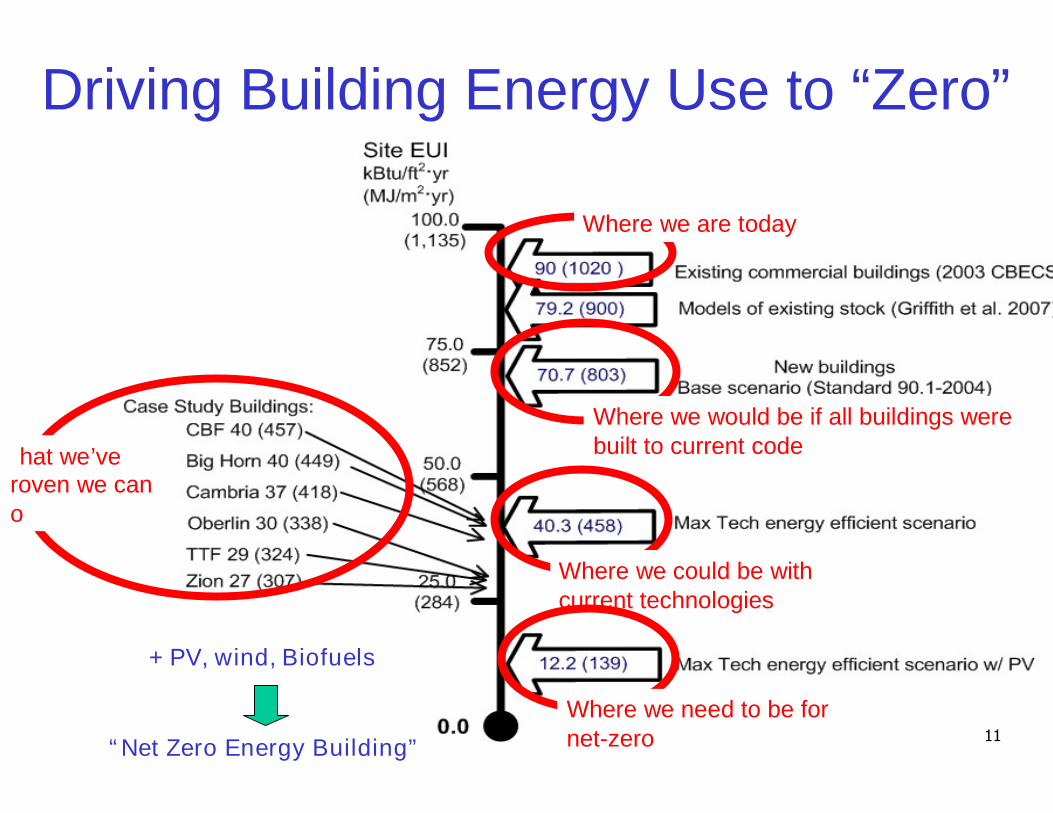
Where we could be withcurrent technologies
Where we would be if all buildings werebuilt to current code
Where we are today
11
Driving Building Energy Use to “Zero”
What we’veproven we cando
Where we need to be fornet-zero“Net Zero Energy Building”
+ PV, wind, Biofuels
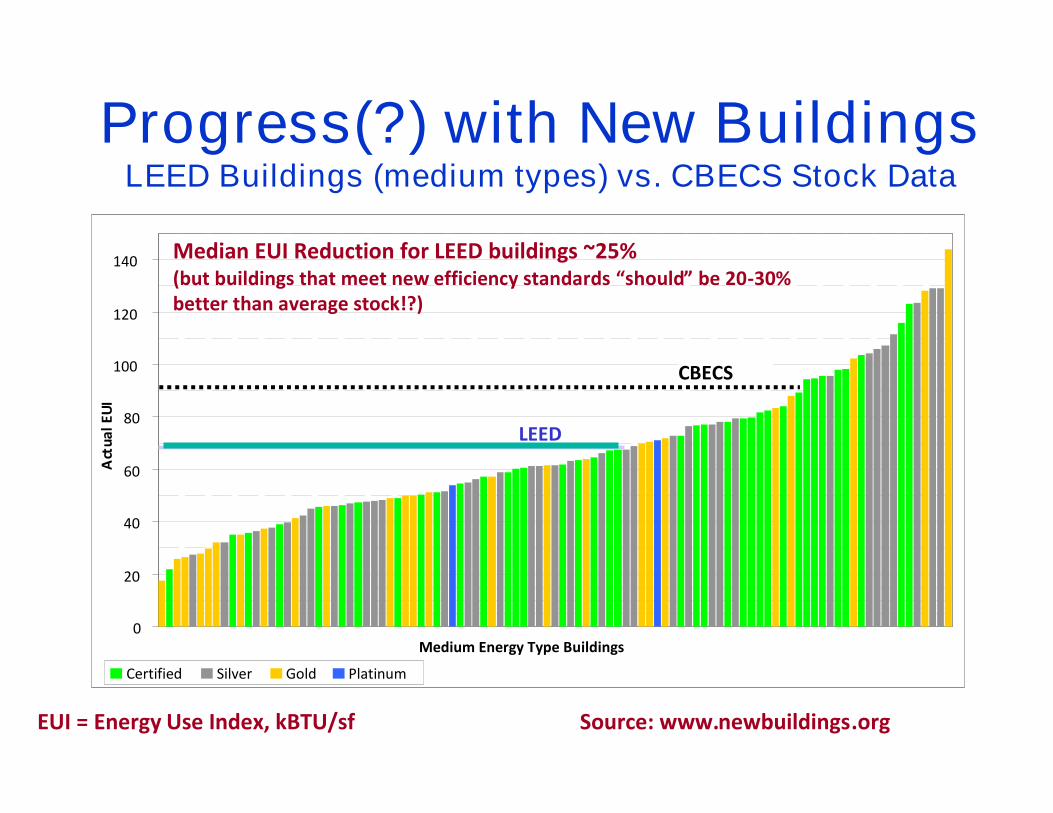
Progress(?) with New BuildingsLEED Buildings (medium types) vs. CBECS Stock Data
0
20
40
60
80
100
120
140
Medium Energy Type Buildings
Act
ualE
UI
Certified Silver Gold Platinum
CBECS
LEED
Median EUI Reduction for LEED buildings ~25%(but buildings that meet new efficiency standards “should” be 20-30%better than average stock!?)
Source: www.newbuildings.orgEUI = Energy Use Index, kBTU/sf
Conclusions• Massive Reductions in Building Energy Use Needed• “Net Zero Energy Buildings” is good long term goal
– Need Interim goals, e.g. 50% savings, etc.• Useful data exists on current energy use
– Variety of metrics, snapshots of energy use• Distinguish between “design intent” and “actual performance”
– Shortcomings: Tools? Users? Construction? Operations?• Very Challenging Goals
– Fragmented, risk averse industry– Technically attainable - but only a few examples come close– Very Difficult to achieve in large scale - 100s out of 5M buildings
• What will it take to Accelerate Progress Towards Goals?
Zero Energy Commercial Buildings:Zero Energy Commercial Buildings:Status and Innovation ChallengeStatus and Innovation Challenge
• For some climates and building types we can design,build and operate a Zero Net Energy Building today— But Complicated, costly, unreliable, requires special
attention,…..
• Research and Technical Innovation Challenge:— How to scale in depth and breadth— How to move from “one of a kind” to standard practice— How to Reduce cost, increase reliability— Address all climates— Address all building types
• Policy, Economic, Political Innovation Challenges
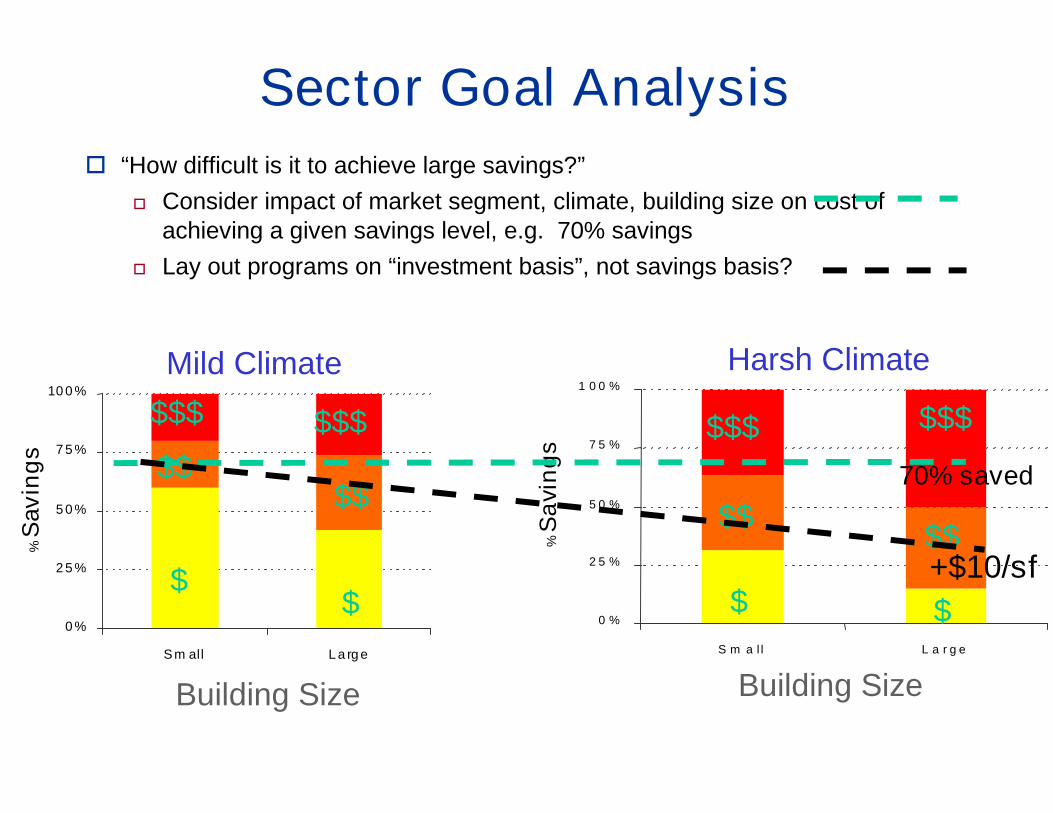
Sector Goal Analysis “How difficult is it to achieve large savings?”
Consider impact of market segment, climate, building size on cost ofachieving a given savings level, e.g. 70% savings
Lay out programs on “investment basis”, not savings basis?
0 %
2 5 %
5 0 %
7 5 %
10 0 %
Sm all L a rg e
%S
avin
gs
0 %
2 5 %
5 0 %
7 5 %
1 0 0 %
S m a l l L a r g e
%S
avi
ng
s
Building Size Building Size
$$$
$$
$
$$$$$$$$$
$$$$
$$
$$$
Mild Climate Harsh Climate
+$10/sf
70% saved
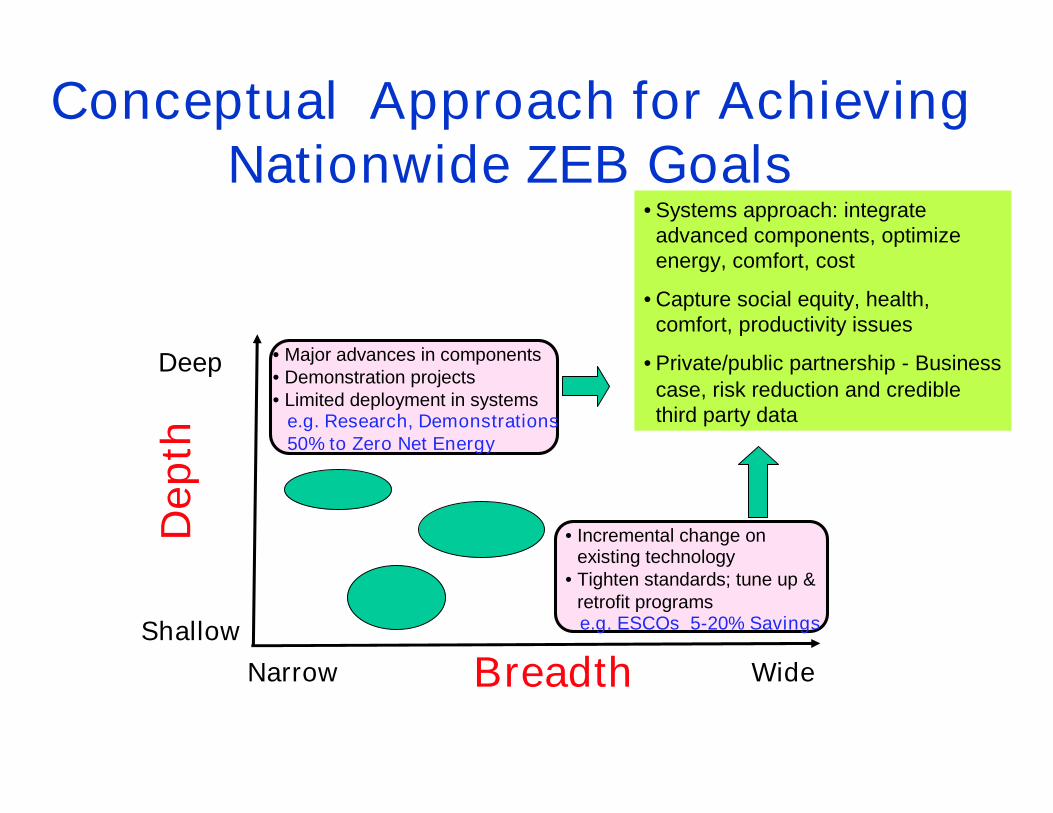
Conceptual Approach for AchievingNationwide ZEB Goals
Narrow Wide
Shallow
Deep
Dep
th
Breadth
• Incremental change onexisting technology
• Tighten standards; tune up &retrofit programse.g. ESCOs 5-20% Savings
• Major advances in components• Demonstration projects• Limited deployment in systems
e.g. Research, Demonstrations50% to Zero Net Energy
• Systems approach: integrateadvanced components, optimizeenergy, comfort, cost
• Capture social equity, health,comfort, productivity issues
• Private/public partnership - Businesscase, risk reduction and crediblethird party data

Lawrence Berkeley National Laboratory
17Projecting Energy Use (and
Carbon) over Time
TotalBuilding Sector
Energy
IndividualBuildingEnergy
Use, EUI
BuildingStock
Owner
StockChangesOver Time
IndividualBuildingEnergy
Use
Type &Size
ClimateLocation SiteBudget
OperationEmergingTechnology
DesignTeam
Use
•New construction•Renovation•Retrofit•Tuneups
•Renovation•Retrofit•Tuneups Construction
Lawrence Berkeley National Laboratory
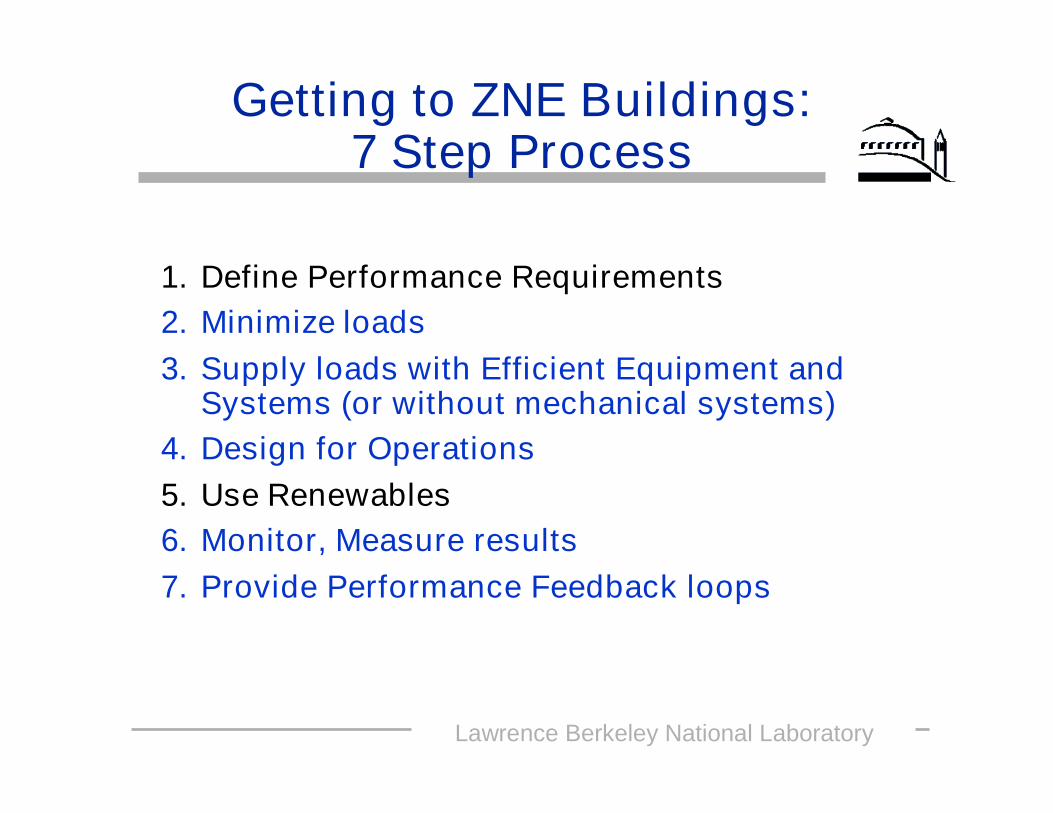
Getting to ZNE Buildings:7 Step Process
1. Define Performance Requirements2. Minimize loads3. Supply loads with Efficient Equipment and
Systems (or without mechanical systems)4. Design for Operations5. Use Renewables6. Monitor, Measure results7. Provide Performance Feedback loops
Lawrence Berkeley National Laboratory
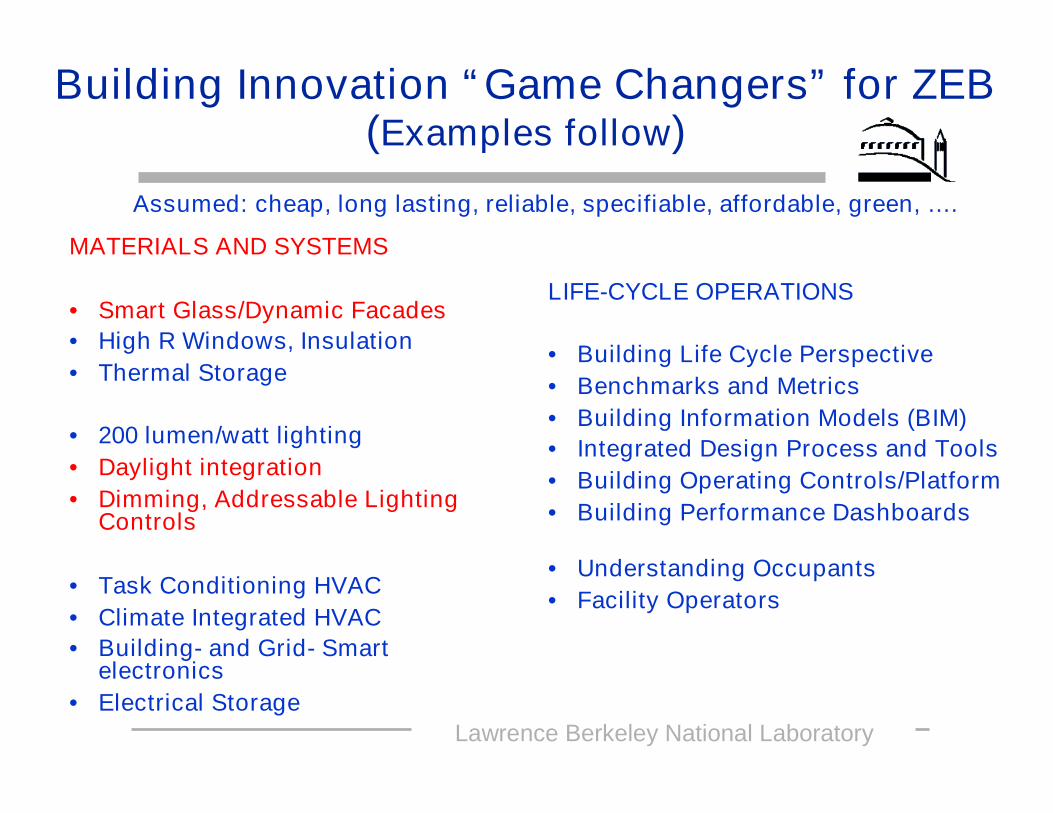
Building Innovation “Game Changers” for ZEB(Examples follow)
MATERIALS AND SYSTEMS
• Smart Glass/Dynamic Facades• High R Windows, Insulation• Thermal Storage
• 200 lumen/watt lighting• Daylight integration• Dimming, Addressable Lighting
Controls
• Task Conditioning HVAC• Climate Integrated HVAC• Building- and Grid- Smart
electronics• Electrical Storage
LIFE-CYCLE OPERATIONS
• Building Life Cycle Perspective• Benchmarks and Metrics• Building Information Models (BIM)• Integrated Design Process and Tools• Building Operating Controls/Platform• Building Performance Dashboards
• Understanding Occupants• Facility Operators
Assumed: cheap, long lasting, reliable, specifiable, affordable, green, ….
Lawrence Berkeley National Laboratory
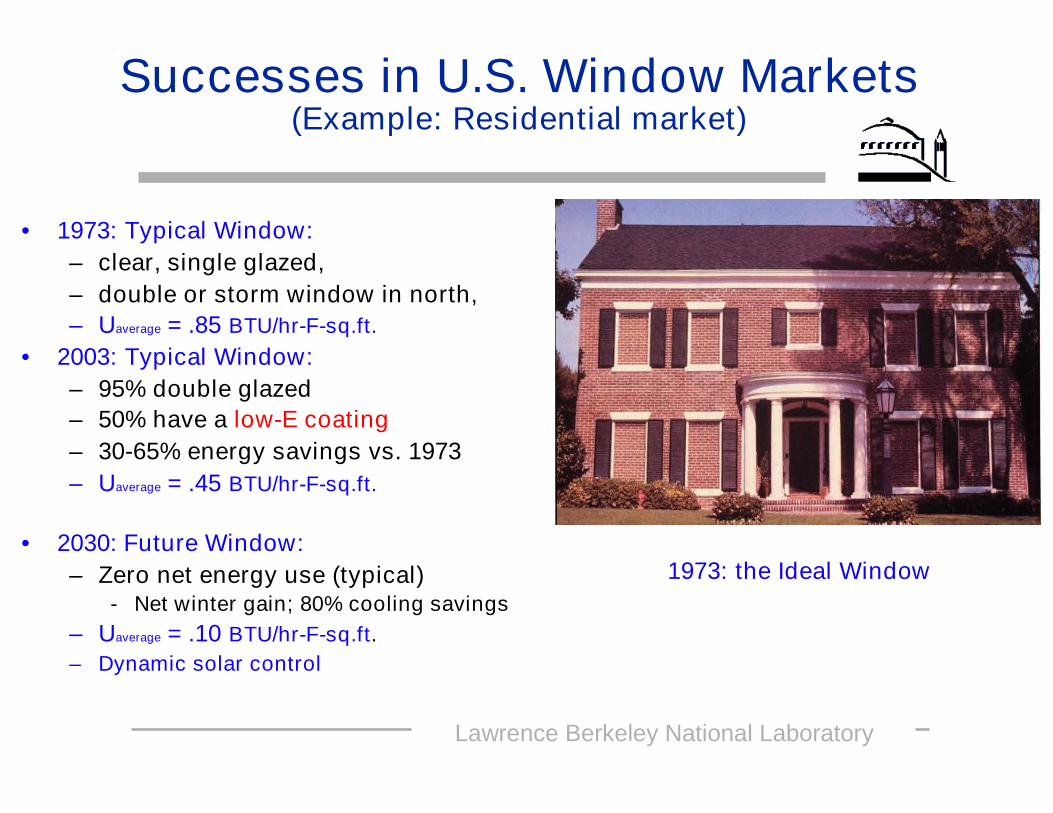
Successes in U.S. Window Markets(Example: Residential market)
• 1973: Typical Window:– clear, single glazed,– double or storm window in north,– Uaverage = .85 BTU/hr-F-sq.ft.
• 2003: Typical Window:– 95% double glazed– 50% have a low-E coating– 30-65% energy savings vs. 1973– Uaverage = .45 BTU/hr-F-sq.ft.
• 2030: Future Window:– Zero net energy use (typical)
- Net winter gain; 80% cooling savings– Uaverage = .10 BTU/hr-F-sq.ft.– Dynamic solar control
1973: the Ideal Window
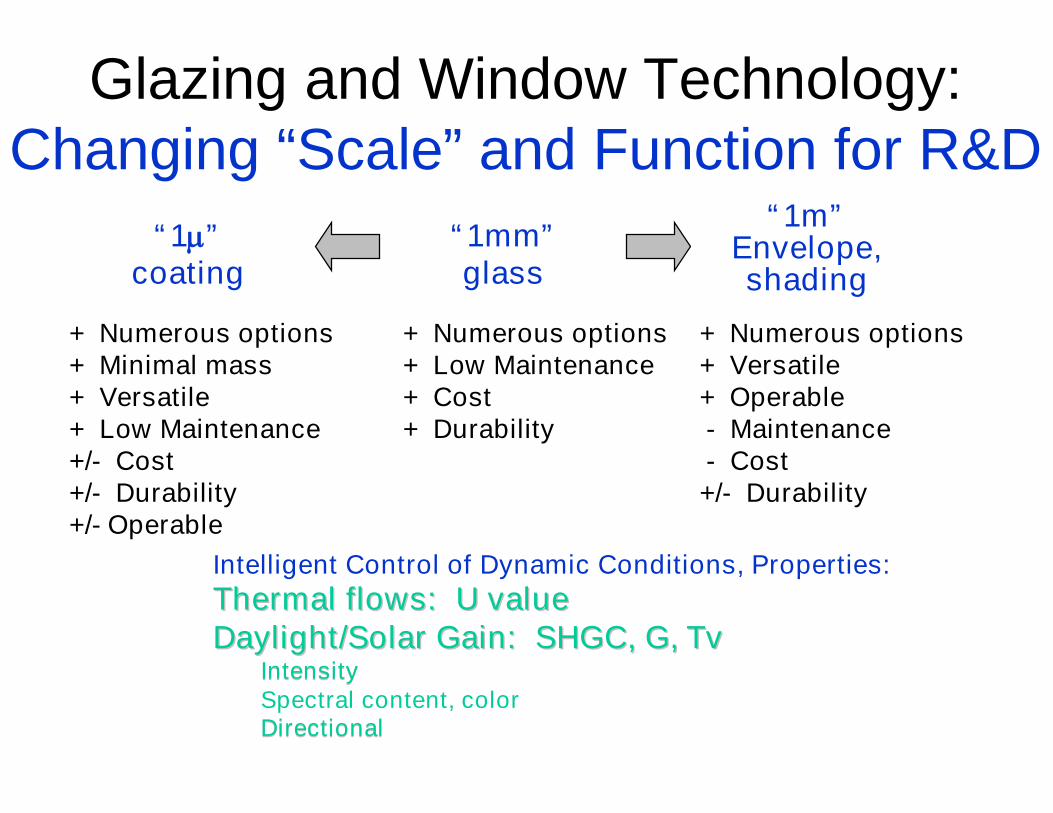
Glazing and Window Technology:Changing “Scale” and Function for R&D
“1mm”glass
“1”coating
“1m”Envelope,shading
+ Numerous options+ Minimal mass+ Versatile+ Low Maintenance+/- Cost+/- Durability+/- Operable
+ Numerous options+ Low Maintenance+ Cost+ Durability
+ Numerous options+ Versatile+ Operable- Maintenance- Cost+/- Durability
Intelligent Control of Dynamic Conditions, Properties:Thermal flows: U valueThermal flows: U valueDaylight/Solar Gain: SHGC, G,Daylight/Solar Gain: SHGC, G, TvTv
IntensityIntensitySpectral content, colorDirectionalDirectional
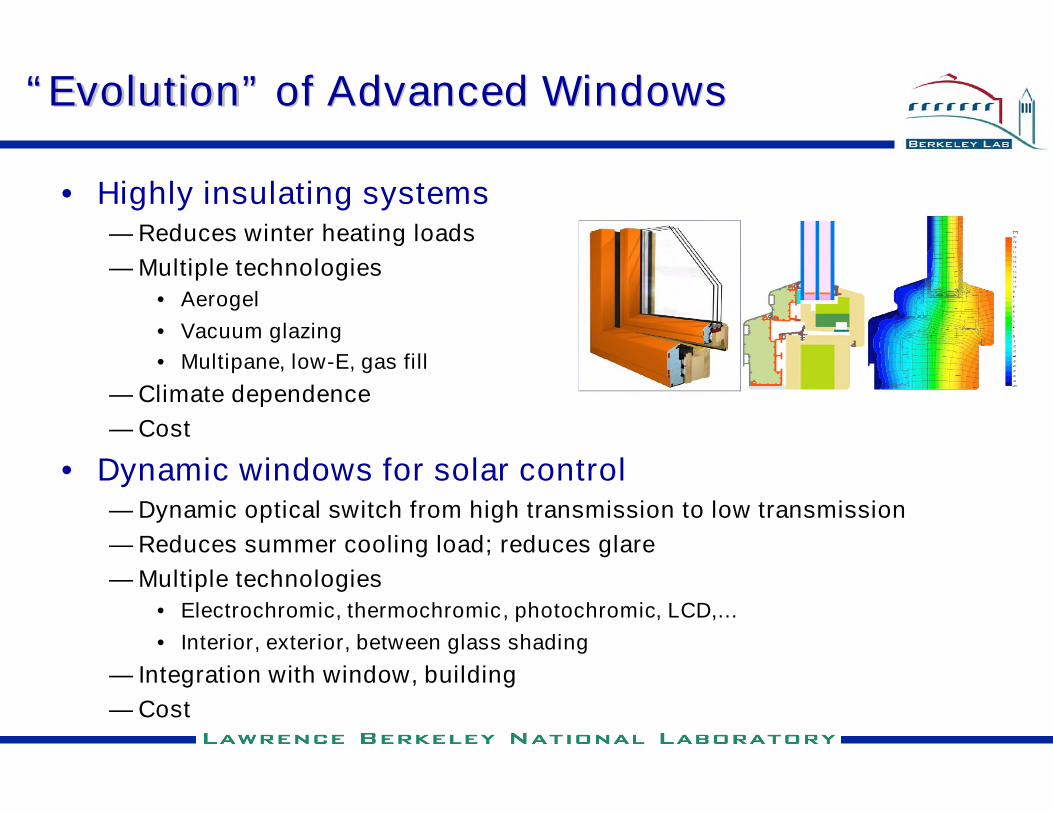
““EvolutionEvolution”” ofof Advanced WindowsAdvanced Windows
• Highly insulating systems— Reduces winter heating loads— Multiple technologies
• Aerogel• Vacuum glazing• Multipane, low-E, gas fill
— Climate dependence— Cost
• Dynamic windows for solar control— Dynamic optical switch from high transmission to low transmission— Reduces summer cooling load; reduces glare— Multiple technologies
• Electrochromic, thermochromic, photochromic, LCD,…• Interior, exterior, between glass shading
— Integration with window, building— Cost
Lawrence Berkeley National Laboratory
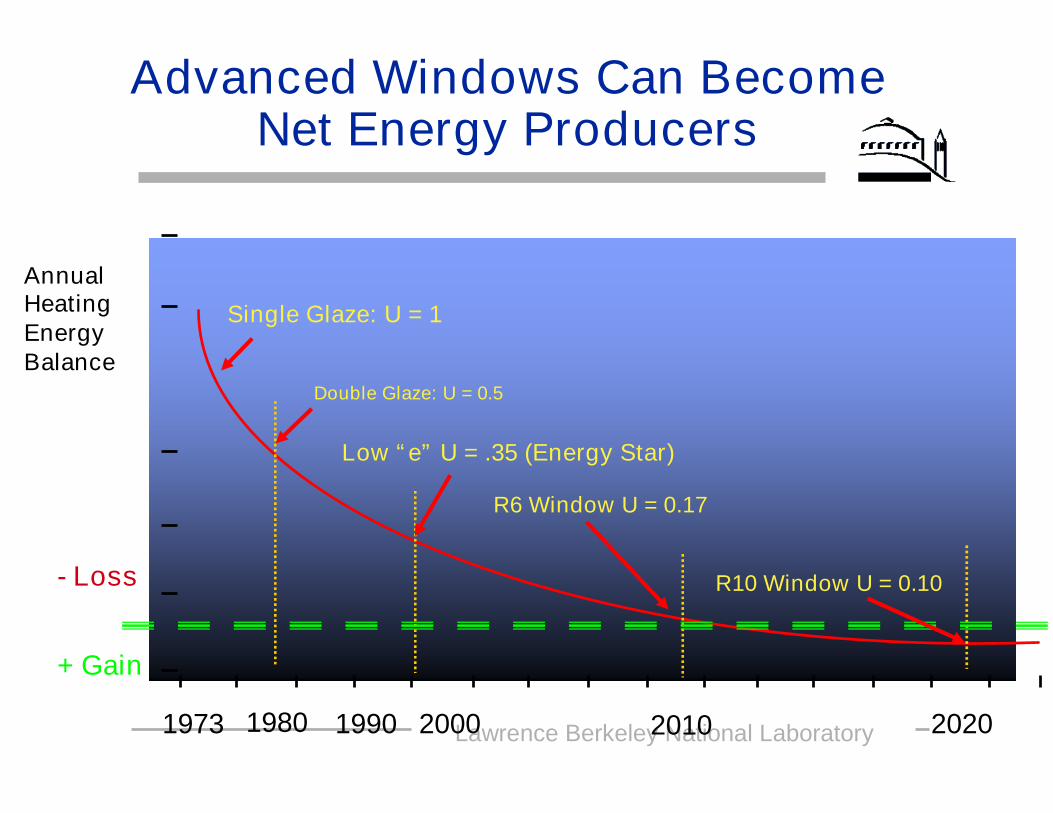
Advanced Windows Can BecomeNet Energy Producers
Double Glaze: U = 0.5
+ Gain
- Loss
1973 1980 2010 2020
Single Glaze: U = 1
1990
Low “e” U = .35 (Energy Star)
2000
R6 Window U = 0.17
R10 Window U = 0.10
AnnualHeatingEnergyBalance
Lawrence Berkeley National Laboratory
24
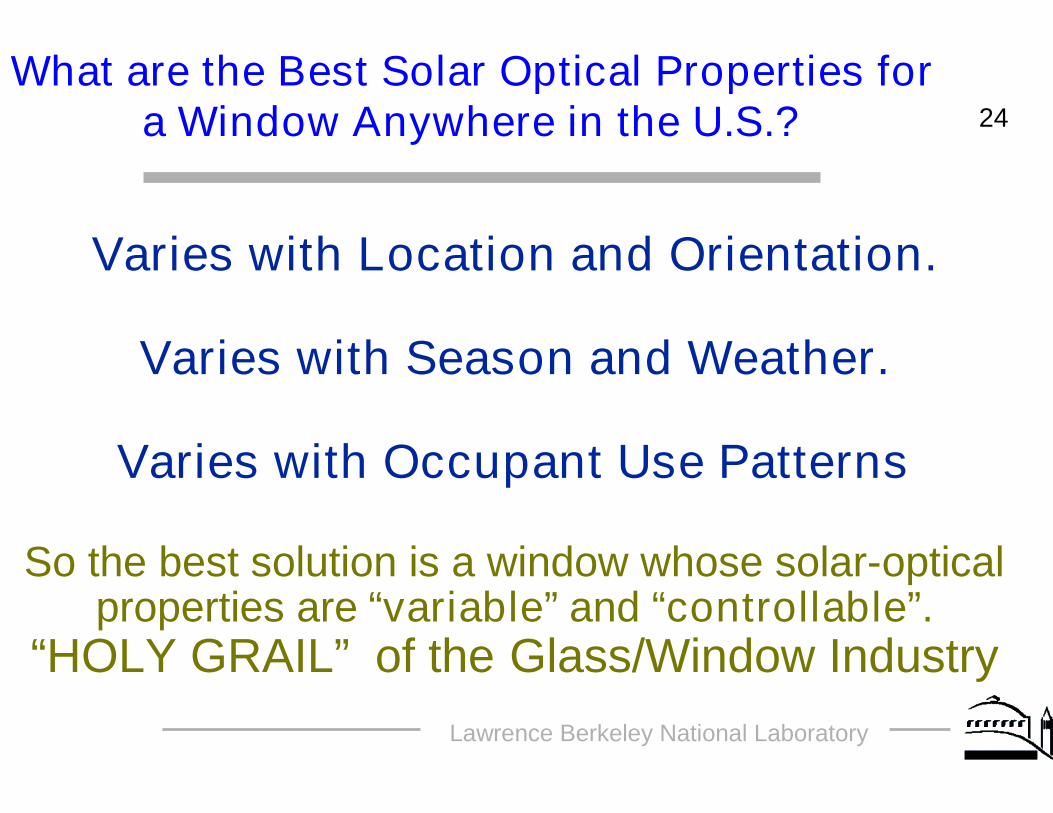
What are the Best Solar Optical Properties fora Window Anywhere in the U.S.?
Varies with Location and Orientation.
Varies with Season and Weather.
Varies with Occupant Use Patterns
So the best solution is a window whose solar-opticalproperties are “variable” and “controllable”.
“HOLY GRAIL” of the Glass/Window Industry
Lawrence Berkeley National Laboratory
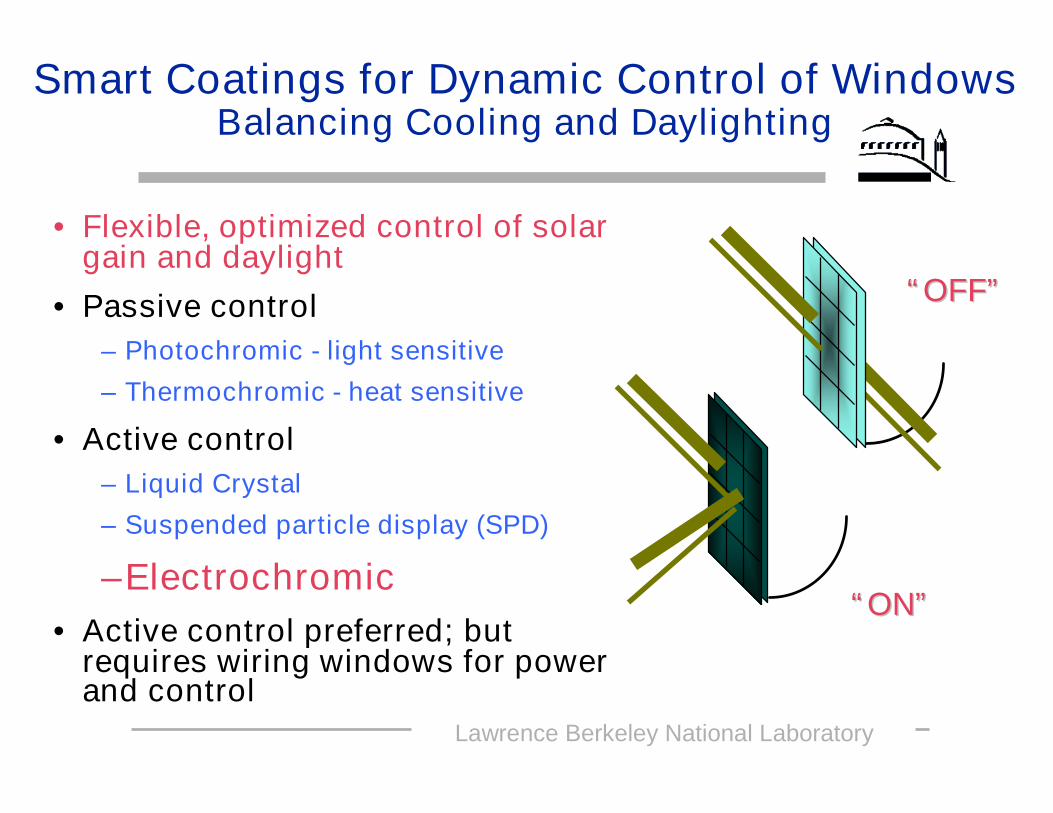
Smart Coatings for Dynamic Control of WindowsBalancing Cooling and Daylighting
• Flexible, optimized control of solargain and daylight
• Passive control– Photochromic - light sensitive
– Thermochromic - heat sensitive
• Active control– Liquid Crystal
– Suspended particle display (SPD)
–Electrochromic• Active control preferred; but
requires wiring windows for powerand control
““OFFOFF””
““ONON””
Lawrence Berkeley National Laboratory
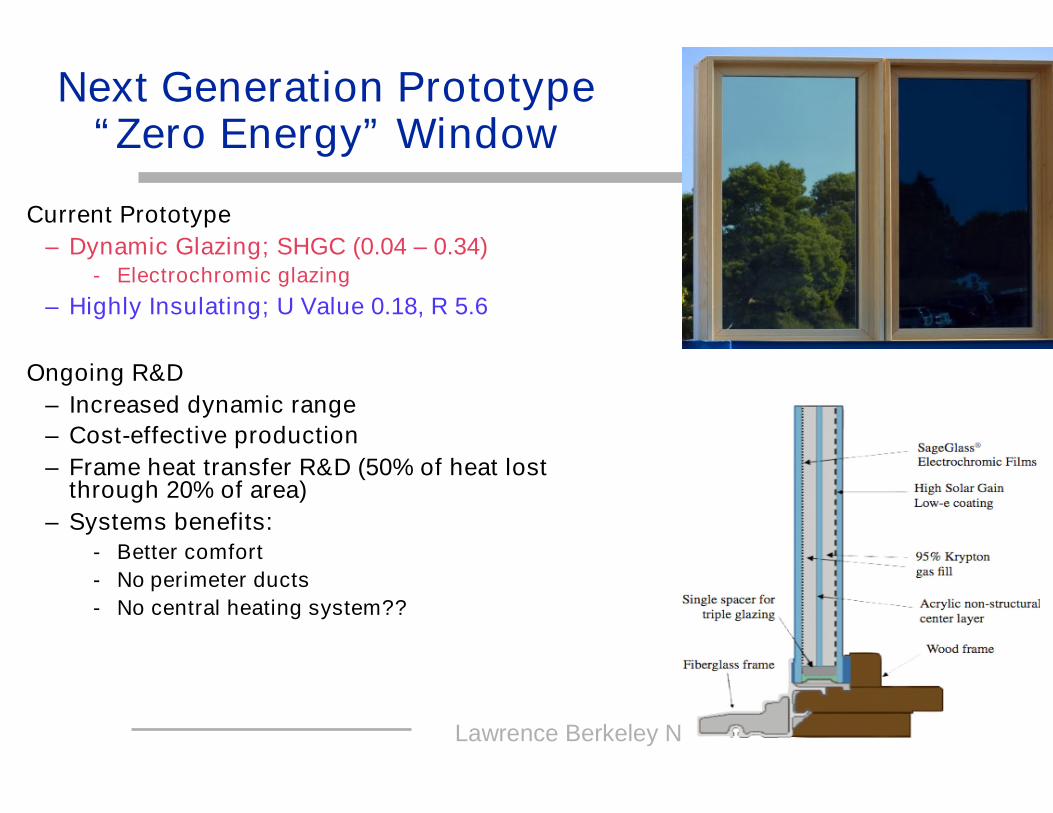
Next Generation Prototype“Zero Energy” Window
•Current Prototype– Dynamic Glazing; SHGC (0.04 – 0.34)
- Electrochromic glazing– Highly Insulating; U Value 0.18, R 5.6
•Ongoing R&D– Increased dynamic range– Cost-effective production– Frame heat transfer R&D (50% of heat lost
through 20% of area)– Systems benefits:
- Better comfort- No perimeter ducts- No central heating system??
Lawrence Berkeley National Laboratory
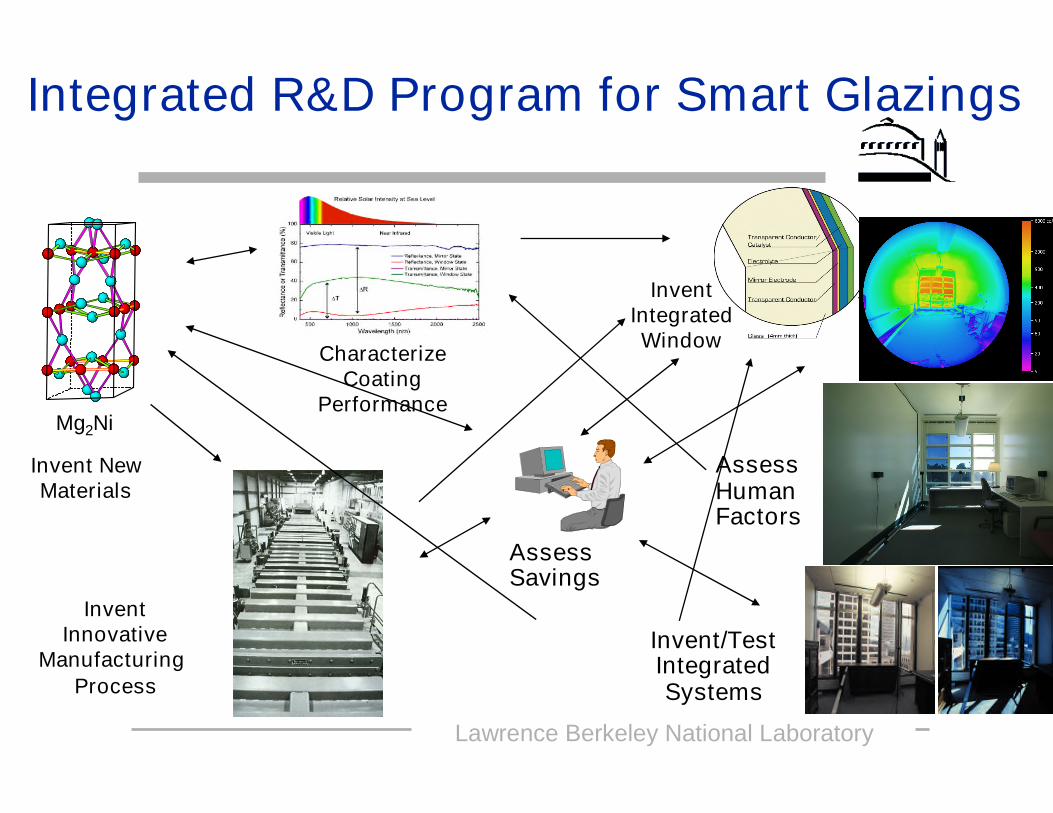
Integrated R&D Program for Smart Glazings
Mg2Ni
Invent NewMaterials
CharacterizeCoating
Performance
InventInnovative
ManufacturingProcess
Invent/TestIntegratedSystems
InventIntegratedWindow
AssessHumanFactors
AssessSavings
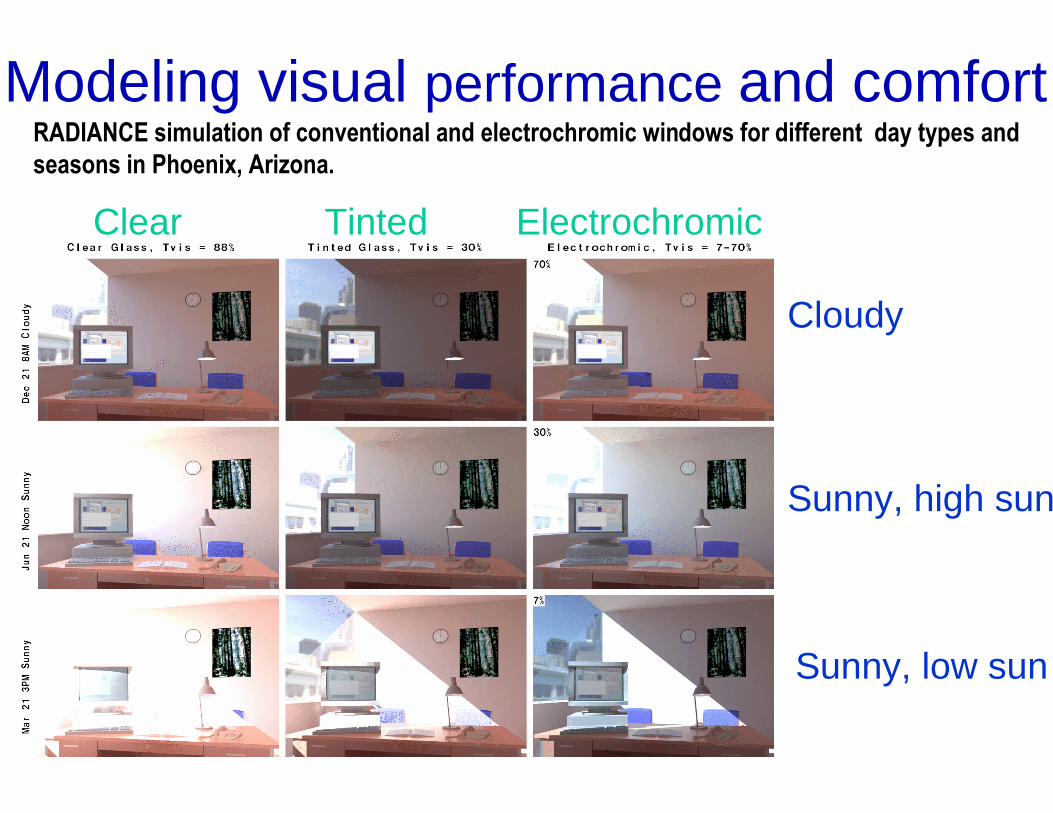
Modeling visual performance and comfortRADIANCE simulation of conventional and electrochromic windows for different day types andseasons in Phoenix, Arizona.
Clear Tinted Electrochromic
Cloudy
Sunny, high sun
Sunny, low sun

Lawrence Berkeley National Laboratory
Field Tests: Smart WindowSwitching on a Partly Cloudy Day
Time EC Fluor10:30 0.38 80% 10:40 0.36 30%
10:50 0.18 40% 11:00 0.11 42%
Lawrence Berkeley National Laboratory
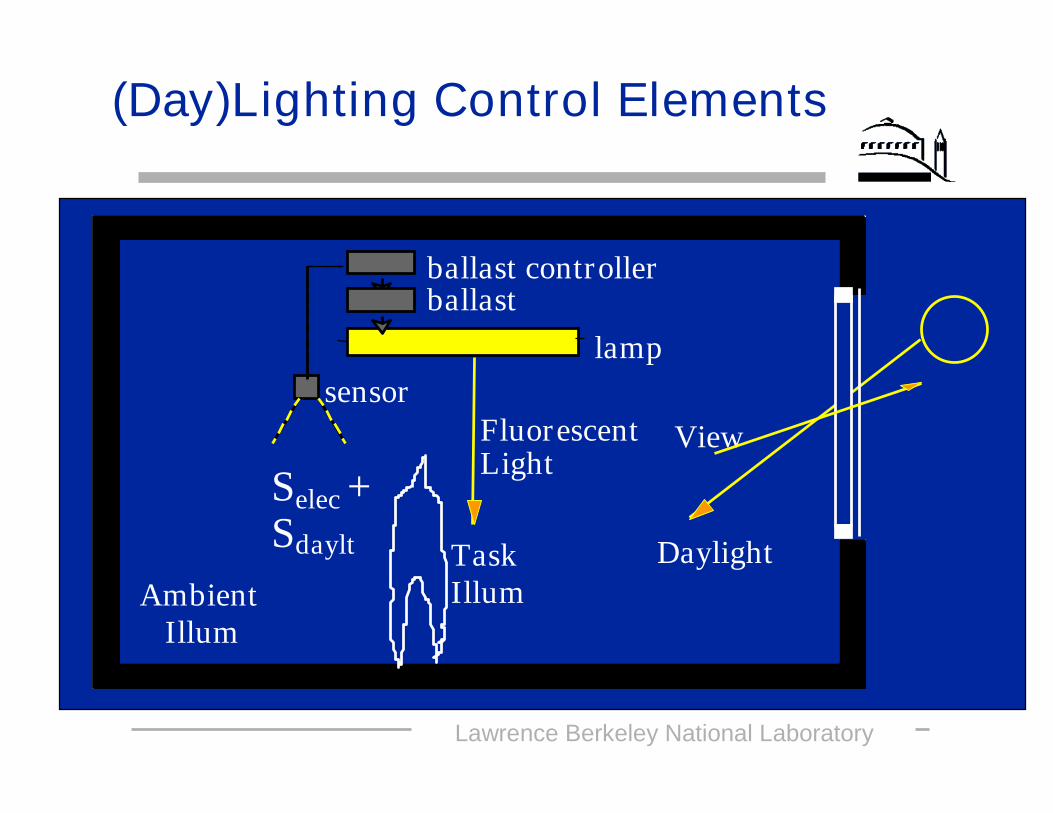
(Day)Lighting Control Elements
Daylight
Selec +Sdaylt Task
Illum
ballast controllerballast
lamp
FluorescentLight
sensor
AmbientIllum
View
Lawrence Berkeley National Laboratory
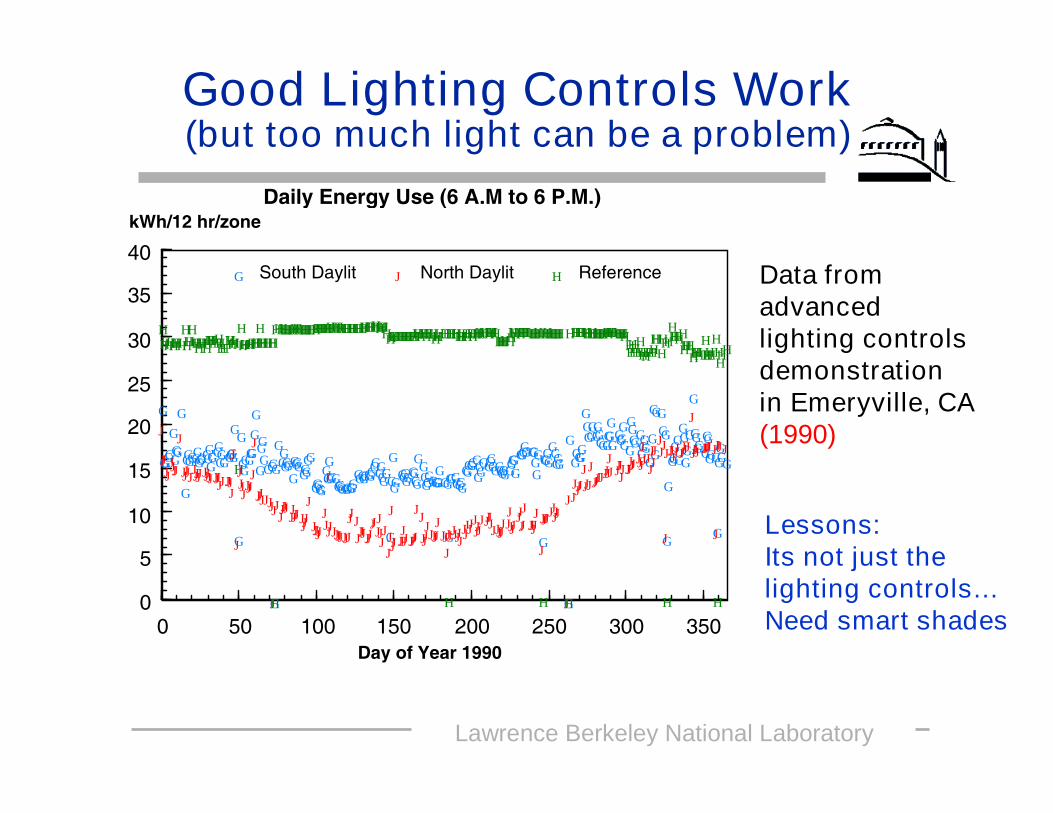
Good Lighting Controls Work(but too much light can be a problem)
G
GGGG
G
GGG
G
G
GGGGGGGGGGG
GGGGG
GGGGGGG
G
G
G
GGGGGG
GG
G
GGGGGG
G
G
GGGGGG
GGGGGGGG
GG
GGGGGGGGGGGGGGGGGGGG
GGGGGGGGGGGGGGG
G
G
G
GGGGGGG
GGGG
GGGGGGGGGG
GGG
G
GGGGGGGGGGGGGGGGGGGGGGGGGGGGG
GGGGGGGGGG
GGG
G
GGGGGGGGG
G
G
GGGGG
GGGGGGGGGGG
GGG
GGGGGGG
GGGGG
GGGGG
G
G
G
GGGG
G
G
GGGGG
GG
GGG
G
GGGGG
GGGGG
G
GGGG
J
JJJJJJJJ
J
JJJJJJJJJJJJJJJJJJJJJJJJ
J
J
JJJJJJJJ
J
JJJJJJJ
J
JJJJJJJ
JJJJJJJJJJ
JJJJJJJ
J
JJJJJJJJJJJJJ
JJJJJJJJJJJJJJ
JJ
J
JJJJJJJJJJJ
JJ
JJJJJJJJ
JJJJJJJJJJJ
JJJJJ
JJJJJJJJJJJJJJ
JJJJJJ
JJJJJJJJJJ
J
JJJJJJJJJ
J
JJJJJJ
JJJJJJJJJJ
JJJJJJJJJJJJJJJ
JJJJJJJJJJJJJ
J
JJJJJJJJJJJ
J
JJJJJJJJJJ
J
JJJJ
HHHHHHHHHH
HHHHHHHHHHHHHHHHHHHHHHHHH
H
HHHHHHHHH
HHHHHHH
H
HHHHHHHHHHHHHHHHHHHHHHHHHHHHHHHHHHHHHHHHHHHHHHHHHHHHHHHHHHHHHHHHHHHHHHHHHHHHHHH
H
HHHHHHHHHHHHHHHHHHHHHHHHHHHHHHHHHHHHHHHHHH
H
HHHHHHHHH
H
HHHHHHHHHHHHHHHHHHHHHHHHHHHHHHH
HHHHHHHH
HHHHH
H
HHHHHHH
HHHHHHHHHHHHHH
H
H
HHHH
0
5
10
15
20
25
30
35
40
0 50 100 150 200 250 300 350
G South Daylit J North Daylit H Reference
Day of Year 1990
kWh/12 hr/zoneDaily Energy Use (6 A.M to 6 P.M.)
Data fromadvancedlighting controlsdemonstrationin Emeryville, CA(1990)
Lessons:Its not just thelighting controls…Need smart shades
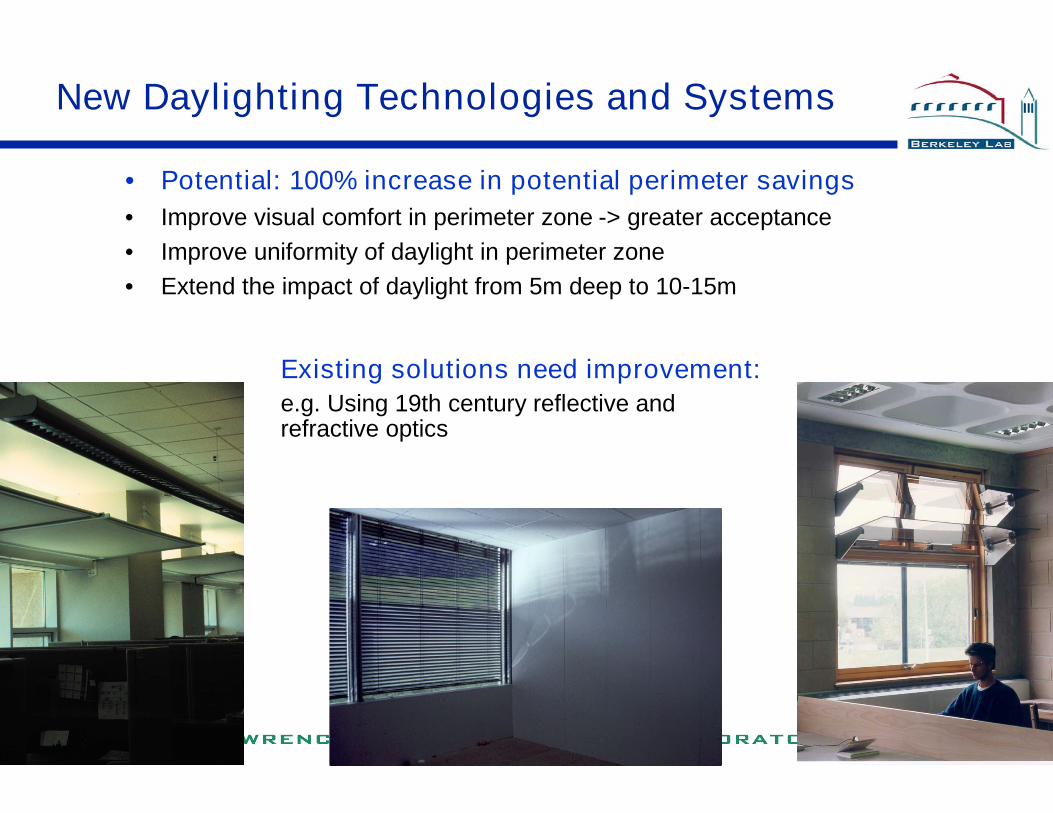
New Daylighting Technologies and Systems
• Potential: 100% increase in potential perimeter savings• Improve visual comfort in perimeter zone -> greater acceptance• Improve uniformity of daylight in perimeter zone• Extend the impact of daylight from 5m deep to 10-15m
Existing solutions need improvement:e.g. Using 19th century reflective andrefractive optics
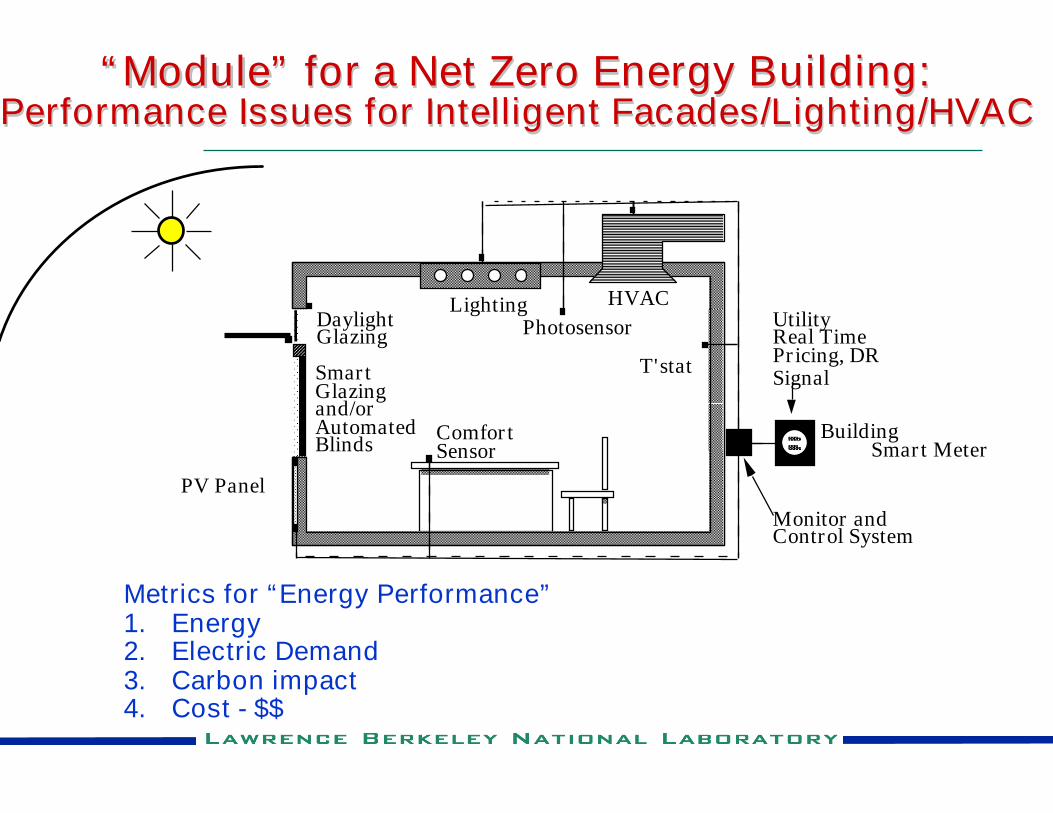
““ModuleModule”” for a Net Zero Energy Building:for a Net Zero Energy Building:Performance Issues for Intelligent Facades/Lighting/HVACPerformance Issues for Intelligent Facades/Lighting/HVAC
HVACLighting
ComfortSensor
UtilityReal TimePricing, DRSignal
BuildingSmart Meter
PV Panel
Monitor andControl System
SmartGlazingand/orAutomatedBlinds
DaylightGlazing Photosensor
T'stat
Metrics for “Energy Performance”1. Energy2. Electric Demand3. Carbon impact4. Cost - $$
Lawrence Berkeley National Laboratory
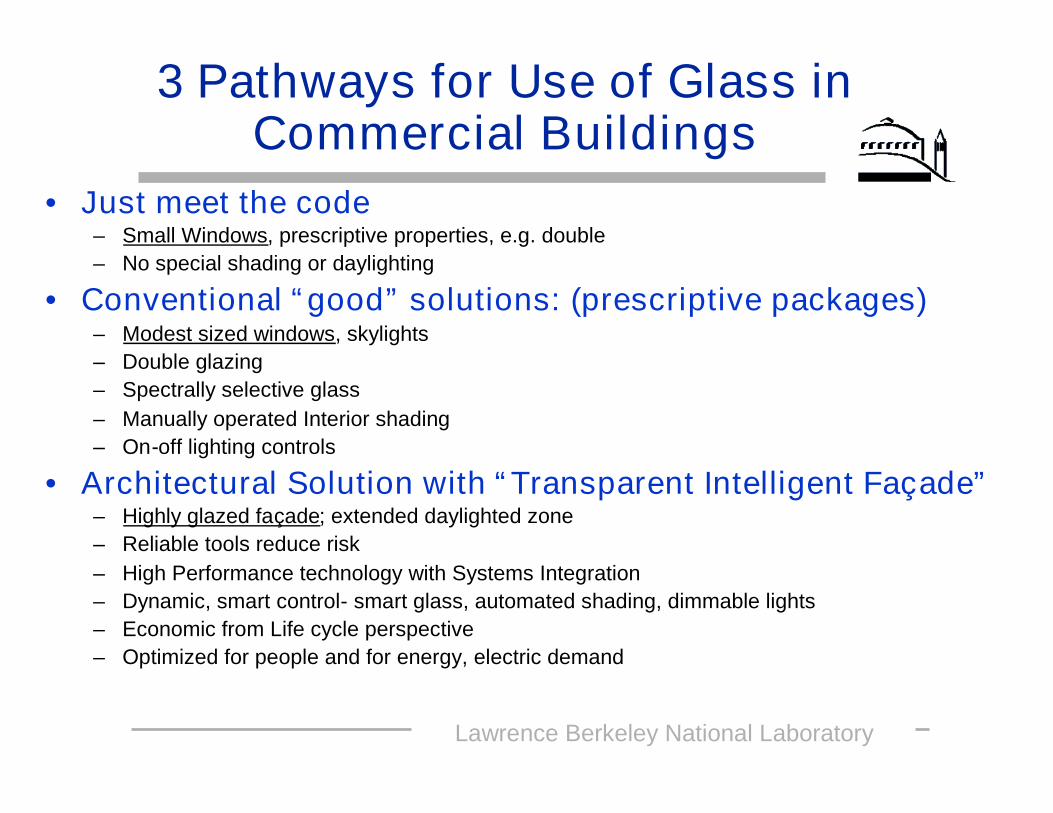
3 Pathways for Use of Glass inCommercial Buildings
• Just meet the code– Small Windows, prescriptive properties, e.g. double– No special shading or daylighting
• Conventional “good” solutions: (prescriptive packages)– Modest sized windows, skylights– Double glazing– Spectrally selective glass– Manually operated Interior shading– On-off lighting controls
• Architectural Solution with “Transparent Intelligent Façade”– Highly glazed façade; extended daylighted zone– Reliable tools reduce risk– High Performance technology with Systems Integration– Dynamic, smart control- smart glass, automated shading, dimmable lights– Economic from Life cycle perspective– Optimized for people and for energy, electric demand
Lawrence Berkeley National Laboratory
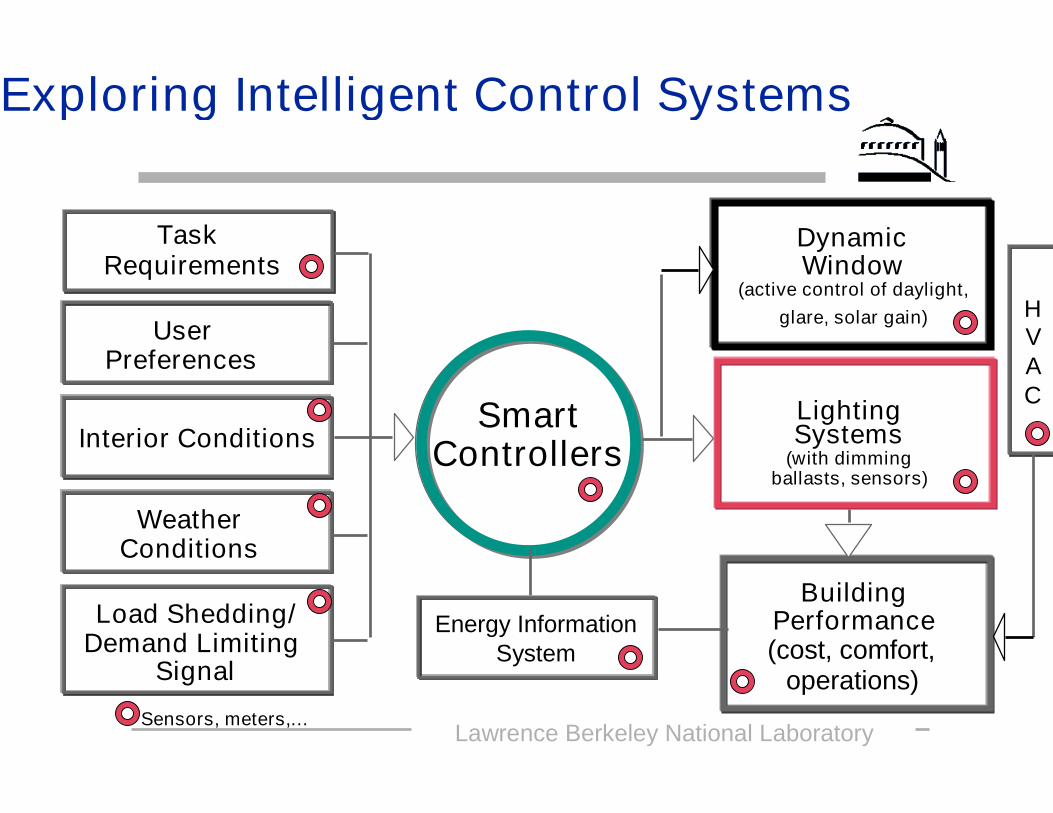
Exploring Intelligent Control Systems
TaskRequirements
UserPreferences
Interior Conditions
WeatherConditions
Load Shedding/Demand Limiting
Signal
SmartControllers
LightingSystems
(with dimmingballasts, sensors)
BuildingPerformance(cost, comfort,
operations)
DynamicWindow
(active control of daylight,glare, solar gain)
Energy InformationSystem
HVAC
Sensors, meters,…
Lawrence Berkeley National Laboratory
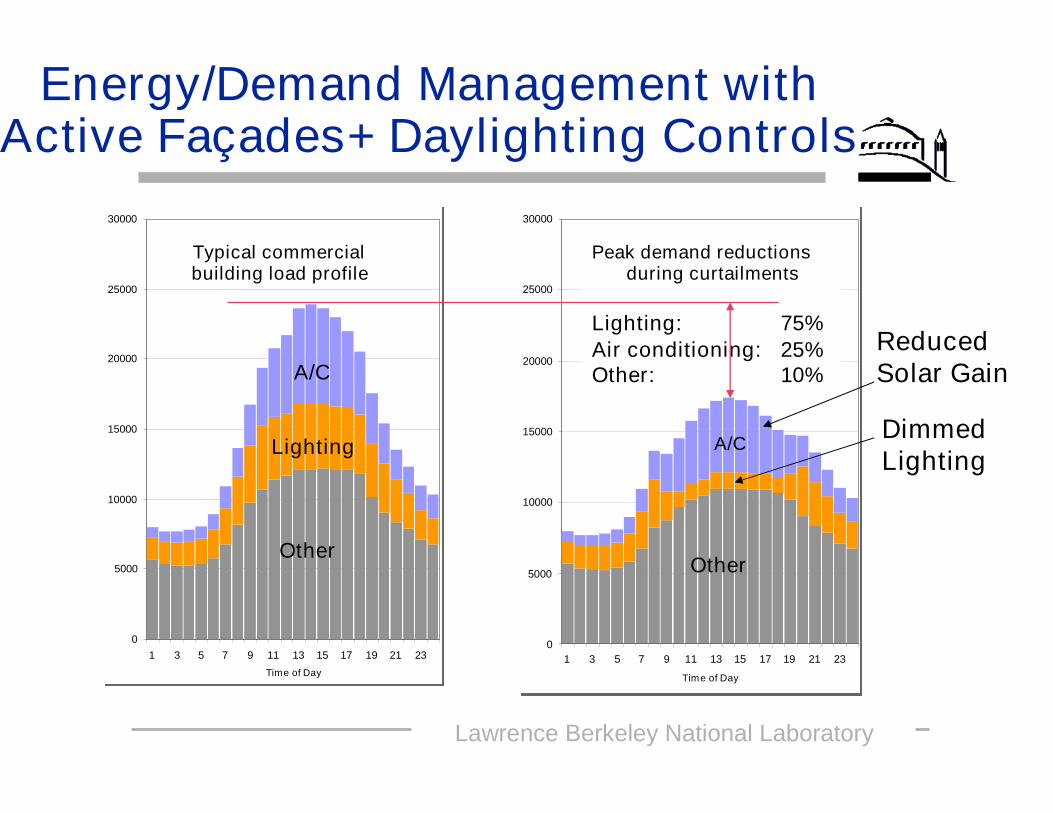
Energy/Demand Management withActive Façades+ Daylighting Controls
0
5000
10000
15000
20000
25000
30000
1 3 5 7 9 11 13 15 17 19 21 23
Time of Day
0
5000
10000
15000
20000
25000
30000
1 3 5 7 9 11 13 15 17 19 21 23
Time of Day
0
5000
10000
15000
20000
25000
30000
1 3 5 7 9 11 13 15 17 19 21 23
Time of Day
0
5000
10000
15000
20000
25000
30000
1 3 5 7 9 11 13 15 17 19 21 23
Time of Day
A/C
Lighting
Other
Typical commercialbuilding load profile
Peak demand reductionsduring curtailments
Lighting: 75%Air conditioning: 25%Other: 10%
A/C
Other
DimmedLighting
ReducedSolar Gain
Lawrence Berkeley National Laboratory
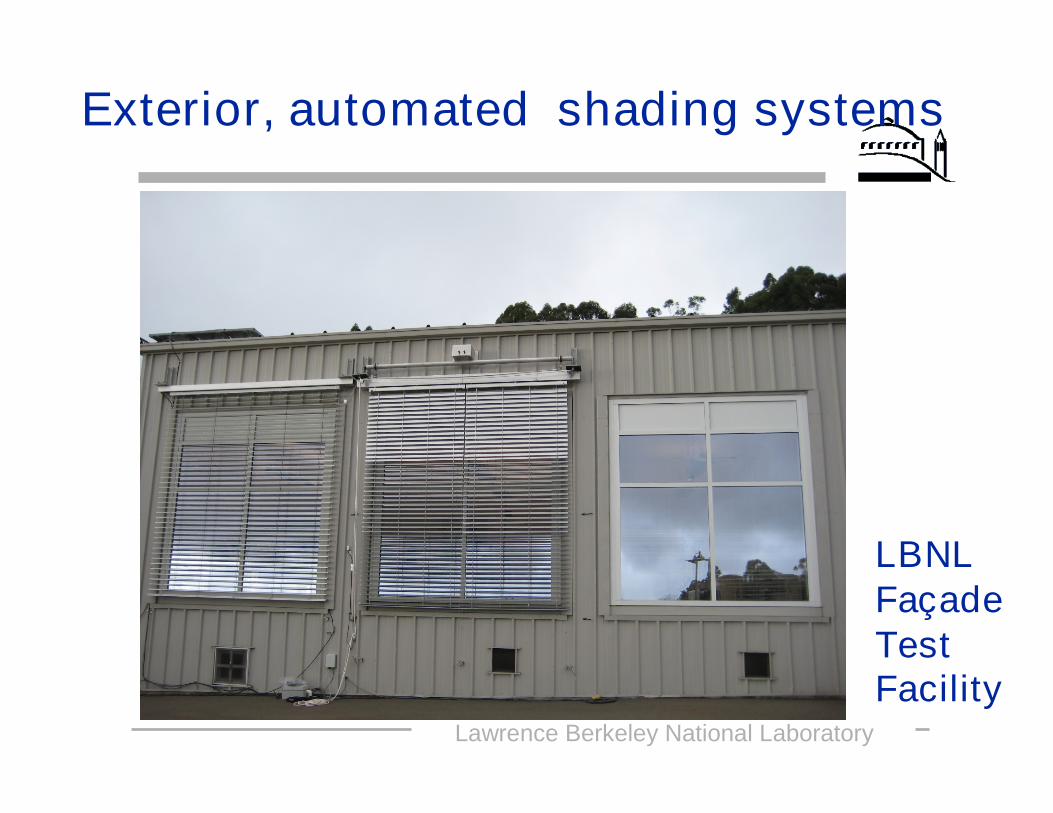
Exterior, automated shading systems
LBNLFaçadeTestFacility

Lawrence Berkeley National Laboratory
Exterior venetian blinds
• Automated exterior blind • Static 3-zone blind with bent slats
Lawrence Berkeley National Laboratory
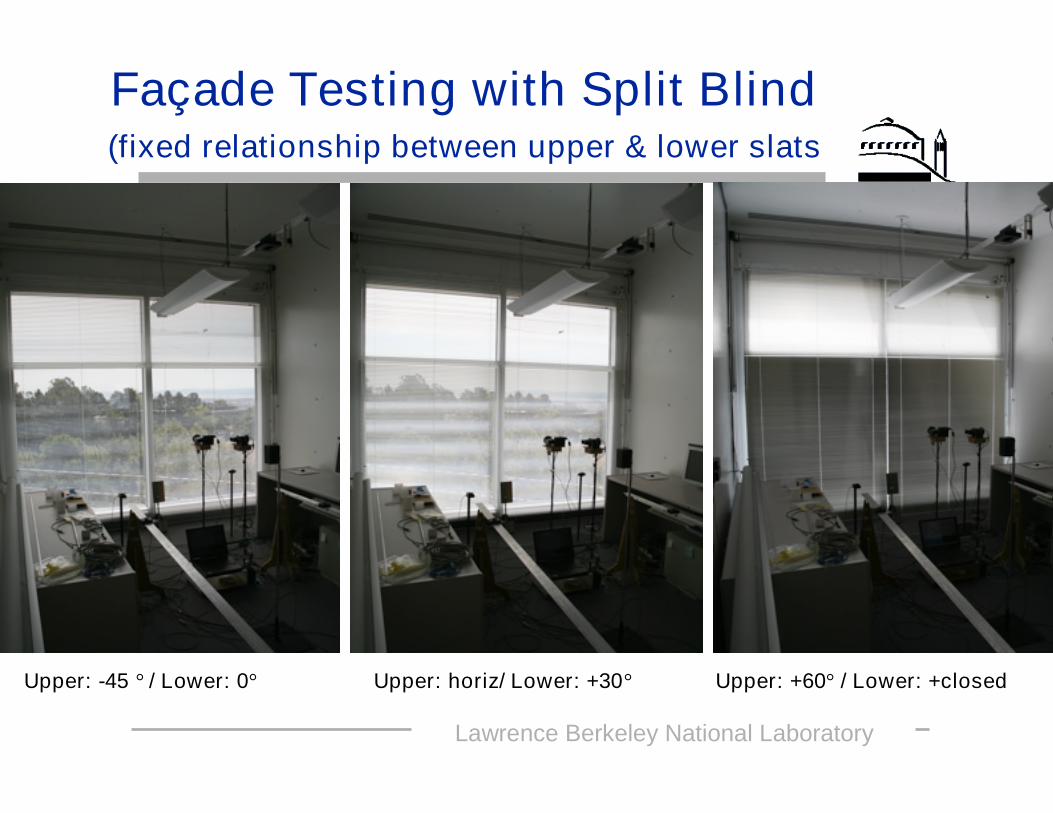
Façade Testing with Split Blind(fixed relationship between upper & lower slats
Upper: horiz/ Lower: +30°Upper: -45 ° / Lower: 0° Upper: +60° / Lower: +closed
Time Lapse Movie: Interior Room Luminanceover the Day with Dynamic Shading Control
QuickTime™and aVideo decompressor
are needed to see this picture.
HighDynamicRange (HDR)time lapseimagery inLBNLFaçade TestFacility
Lawrence Berkeley National Laboratory
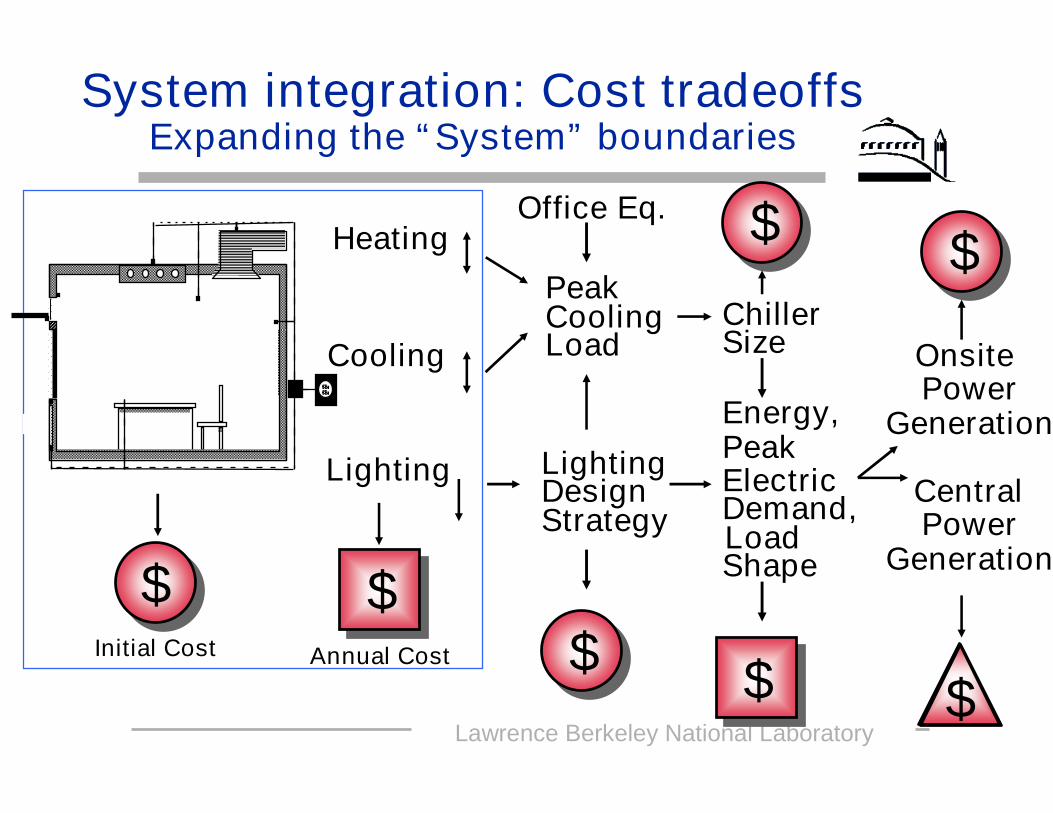
System integration: Cost tradeoffsExpanding the “System” boundaries
Heating
Cooling
Lighting
PeakCoolingLoad
ChillerSize
LightingDesignStrategy
Energy,PeakElectricDemand,LoadShape
CentralPower
Generation$
$ $
$$
$
Initial Cost Annual Cost
Office Eq.
OnsitePower
Generation
$
Lawrence Berkeley National Laboratory
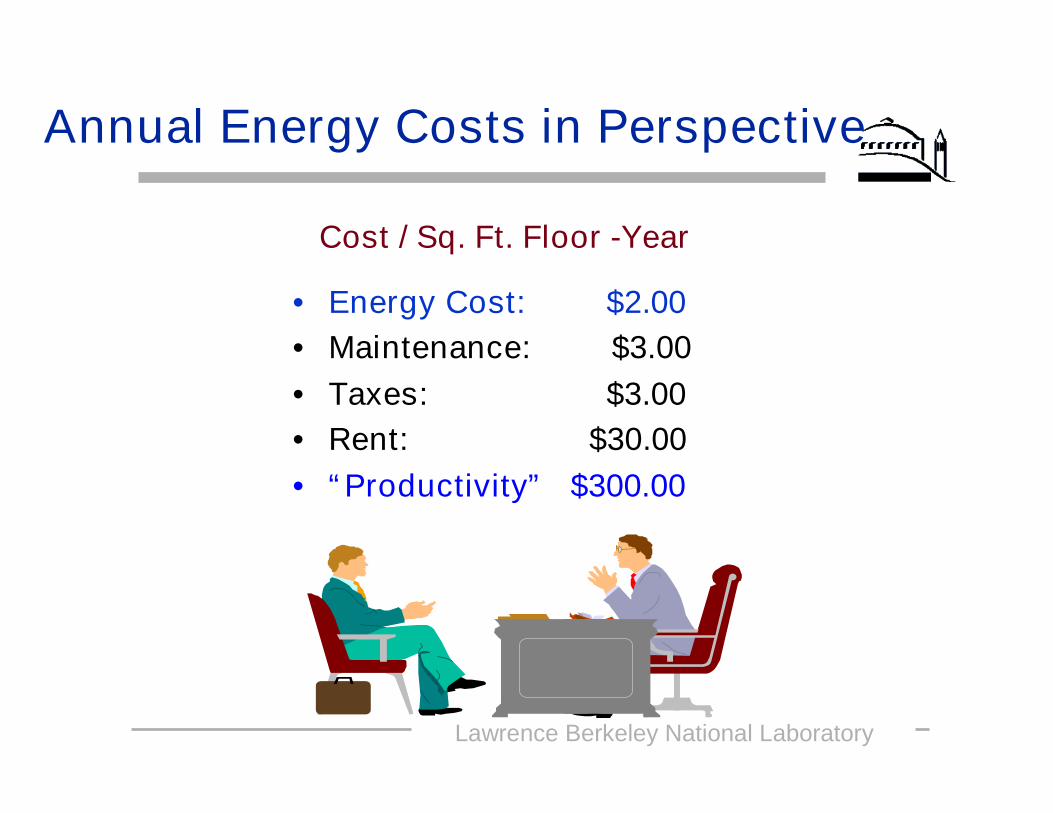
Annual Energy Costs in Perspective
Cost / Sq. Ft. Floor -Year
• Energy Cost: $2.00• Maintenance: $3.00• Taxes: $3.00• Rent: $30.00• “Productivity” $300.00

Lawrence Berkeley National Laboratory
43
Owners program:•Highly glazed façade gives workers views
and allows the city to see “news” at work•But glare, cooling, visibility etc
Need/Goal:•Develop integrated , automated shading
and dimmable lighting system– Affordable, reliable and robust
Challenge:•How to develop a workable integrated
hardware/software solution•How to “guarantee” that such a solution
will work in practice•Scale- Transform the market- push/pull
these solutions toward widespread useSupport
NYSERDA, DOE, CEC, NY Times
Concept ---> RealityThe New York Times HQ Building
Lawrence Berkeley National Laboratory
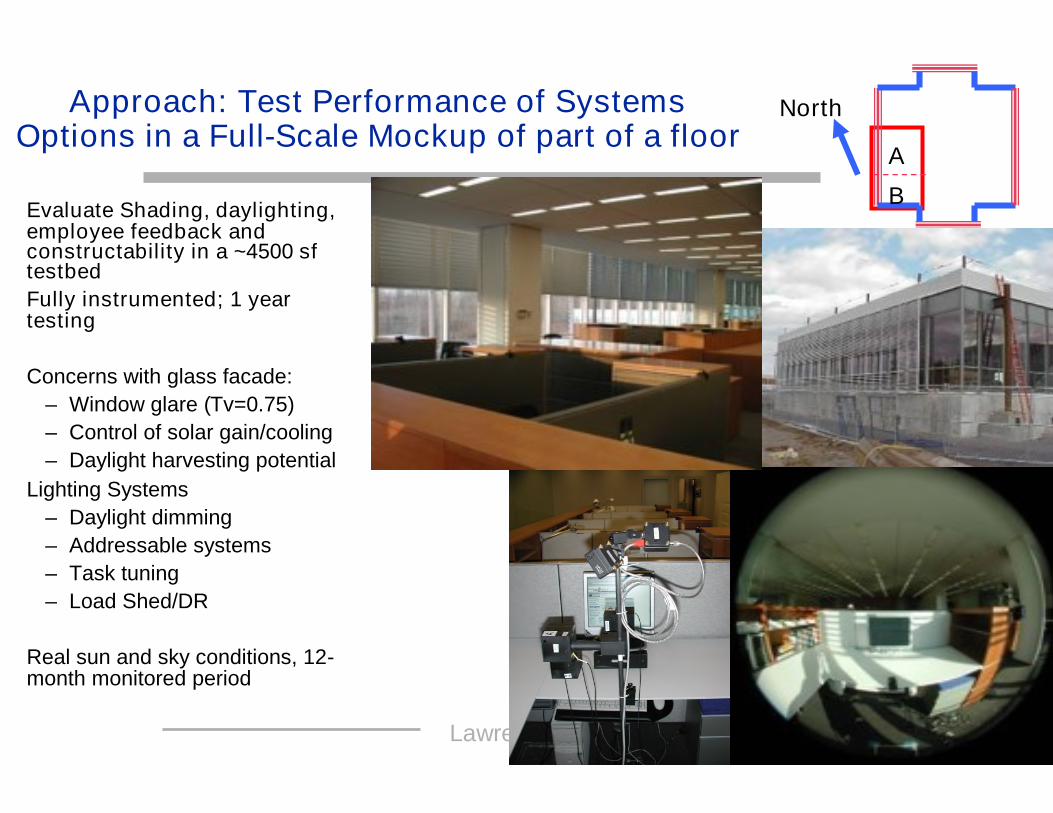
44Approach: Test Performance of SystemsOptions in a Full-Scale Mockup of part of a floor
•Evaluate Shading, daylighting,employee feedback andconstructability in a ~4500 sftestbed
•Fully instrumented; 1 yeartesting
•Concerns with glass facade:– Window glare (Tv=0.75)– Control of solar gain/cooling– Daylight harvesting potential
•Lighting Systems– Daylight dimming– Addressable systems– Task tuning– Load Shed/DR
•Real sun and sky conditions, 12-month monitored period
North
A
B
page 45
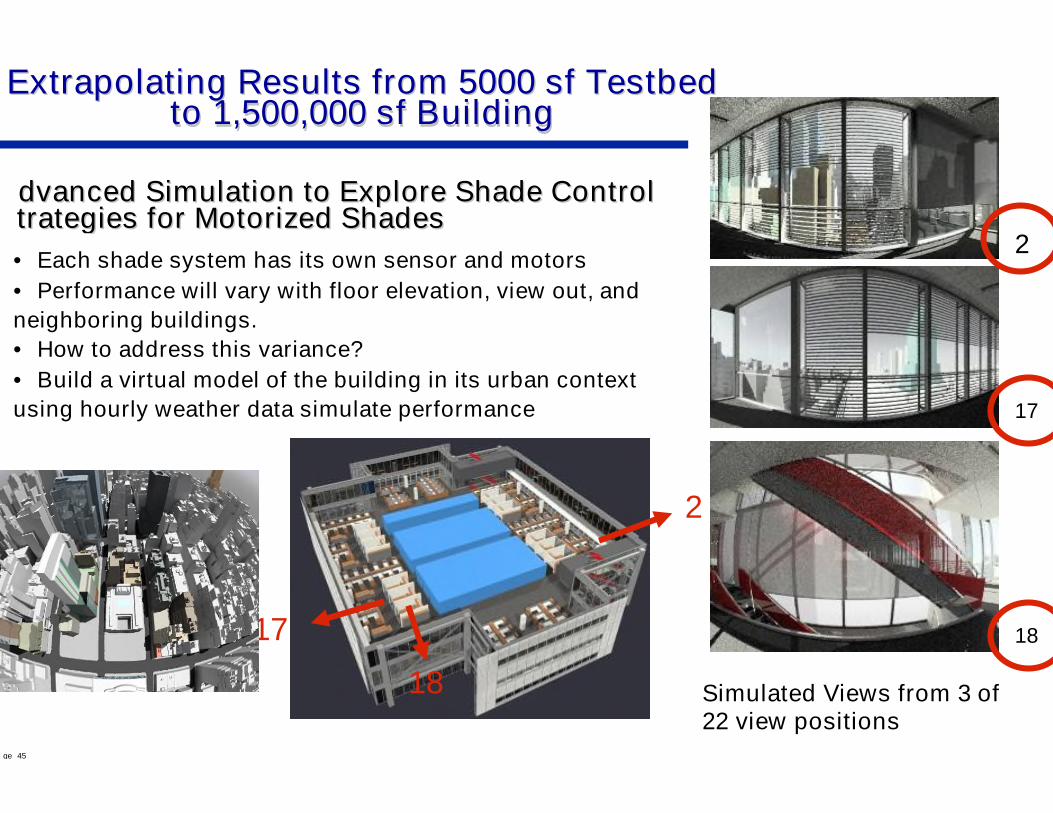
Advanced Simulation to Explore Shade Control Advanced Simulation to Explore Shade ControlStrategies for Motorized Shades Strategies for Motorized Shades
2
17
18
2
18
17
• Each shade system has its own sensor and motors• Performance will vary with floor elevation, view out, andneighboring buildings.• How to address this variance?• Build a virtual model of the building in its urban contextusing hourly weather data simulate performance
Simulated Views from 3 of22 view positions
Extrapolating Results from 5000Extrapolating Results from 5000 sf Testbedsf Testbedto 1,500,000to 1,500,000 sfsf BuildingBuilding
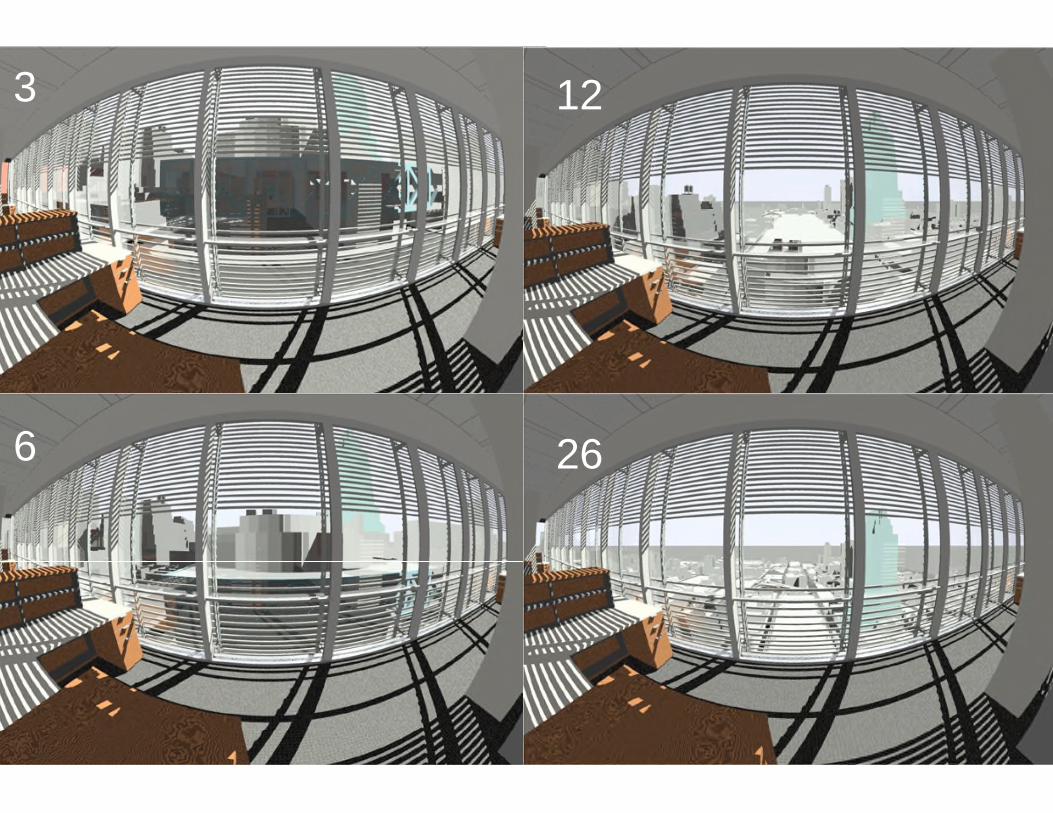
Lawrence Berkeley National LaboratoryVariance in luminance with vertical position
Variance in luminance withvertical position
3 12
6 26

Lawrence Berkeley National Laboratory
The New York Times building:Automated, Motorized Shade Commissioning Tool
being Used to Check Shade Operation
Mobile cart with CCD camera and real time softwaredetermines whether sensor calibration is correct
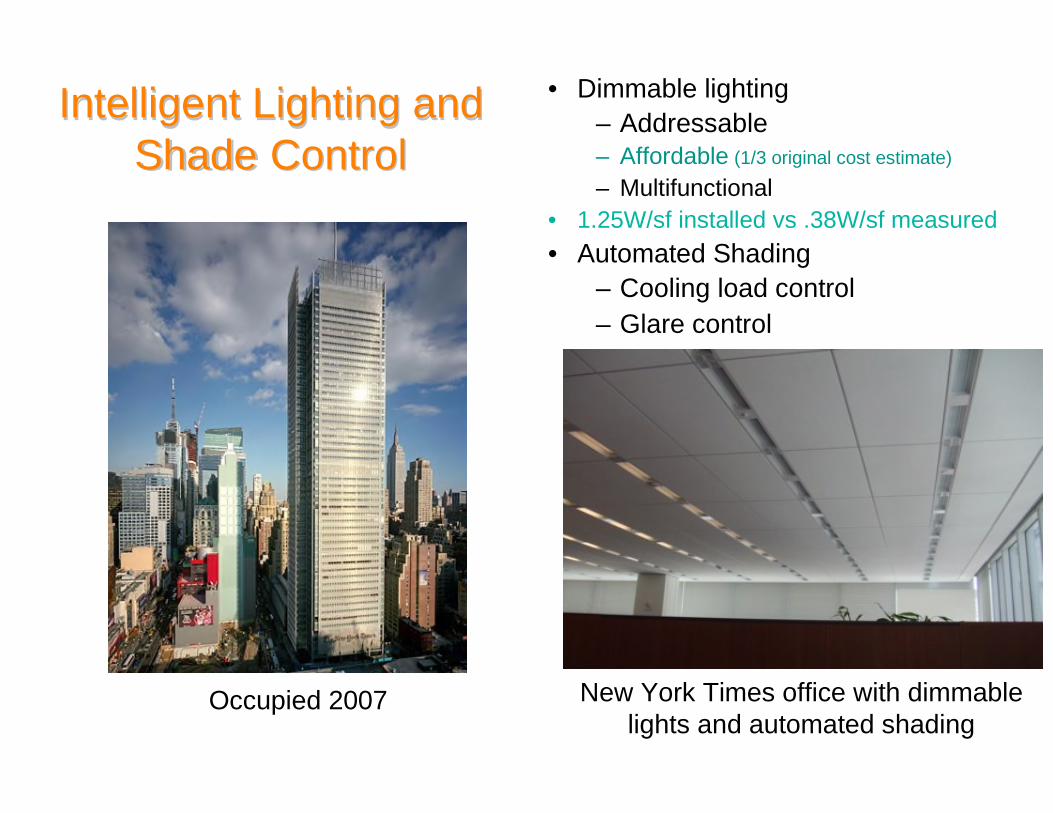
• Dimmable lighting– Addressable– Affordable (1/3 original cost estimate)
– Multifunctional• 1.25W/sf installed vs .38W/sf measured• Automated Shading
– Cooling load control– Glare control
Intelligent Lighting andIntelligent Lighting andShadeShade ControlControl
New York Times office with dimmablelights and automated shading
Occupied 2007

Lawrence Berkeley National Laboratory
Significant Market Outcomes
• Single, largest procurement of automated shades and daylighting controls inthe U.S.
• Tremendous industry response: significant change in product offerings, featuresand capabilities at lower cost
– Dimmable lighting controls:- From: fixed topology 0-10 V systems- To: digitally-addressable, open protocol systems with individual fixture control
capability enables zone reconfiguration, photosensor tuning, demand response,setpoint tuning all via software
– Shading controls:- From simple direct sun control- To direct sun, solar heat gain, glare, view, and daylight control optimization
• Competitive pricing for both material and installation costs• Procurement specifications, tools, and performance evaluation publicly
available
Lawrence Berkeley National Laboratory
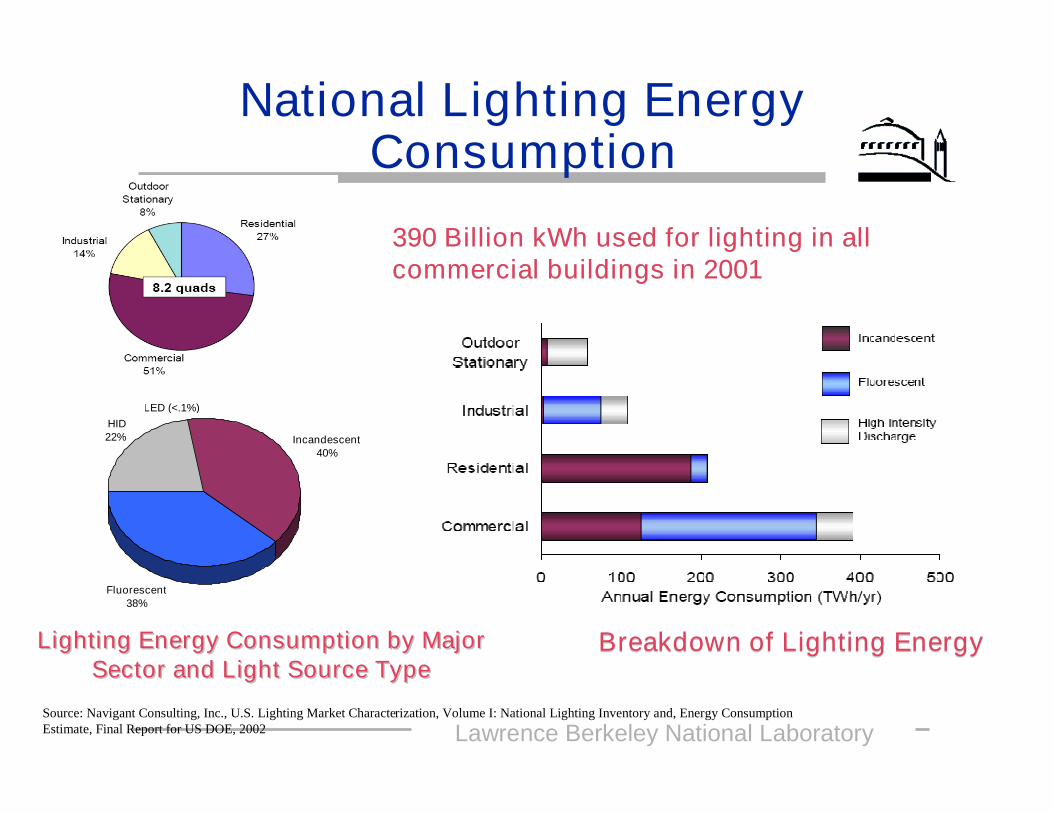
National Lighting EnergyConsumption
Source: Navigant Consulting, Inc., U.S. Lighting Market Characterization, Volume I: National Lighting Inventory and, Energy ConsumptionEstimate, Final Report for US DOE, 2002
Lighting Energy Consumption by MajorLighting Energy Consumption by MajorSector and Light Source TypeSector and Light Source Type
Breakdown of Lighting EnergyBreakdown of Lighting Energy
Incandescent40%
Fluorescent38%
HID22%
LED (<.1%)
390 Billion kWh used for lighting in all390 Billion kWh used for lighting in allcommercial buildings in 2001commercial buildings in 2001
Lawrence Berkeley National Laboratory
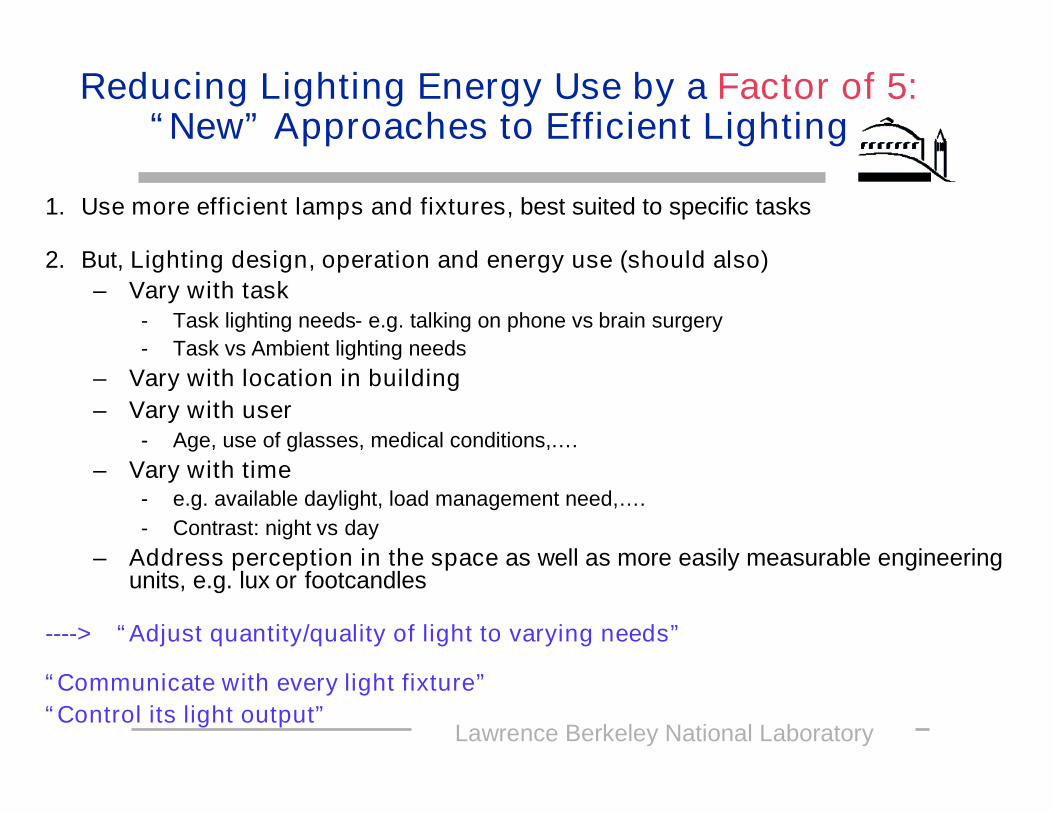
Reducing Lighting Energy Use by a Factor of 5:“New” Approaches to Efficient Lighting
1. Use more efficient lamps and fixtures, best suited to specific tasks
2. But, Lighting design, operation and energy use (should also)– Vary with task
- Task lighting needs- e.g. talking on phone vs brain surgery- Task vs Ambient lighting needs
– Vary with location in building– Vary with user
- Age, use of glasses, medical conditions,….– Vary with time
- e.g. available daylight, load management need,….- Contrast: night vs day
– Address perception in the space as well as more easily measurable engineeringunits, e.g. lux or footcandles
----> “Adjust quantity/quality of light to varying needs”
“Communicate with every light fixture”“Control its light output”
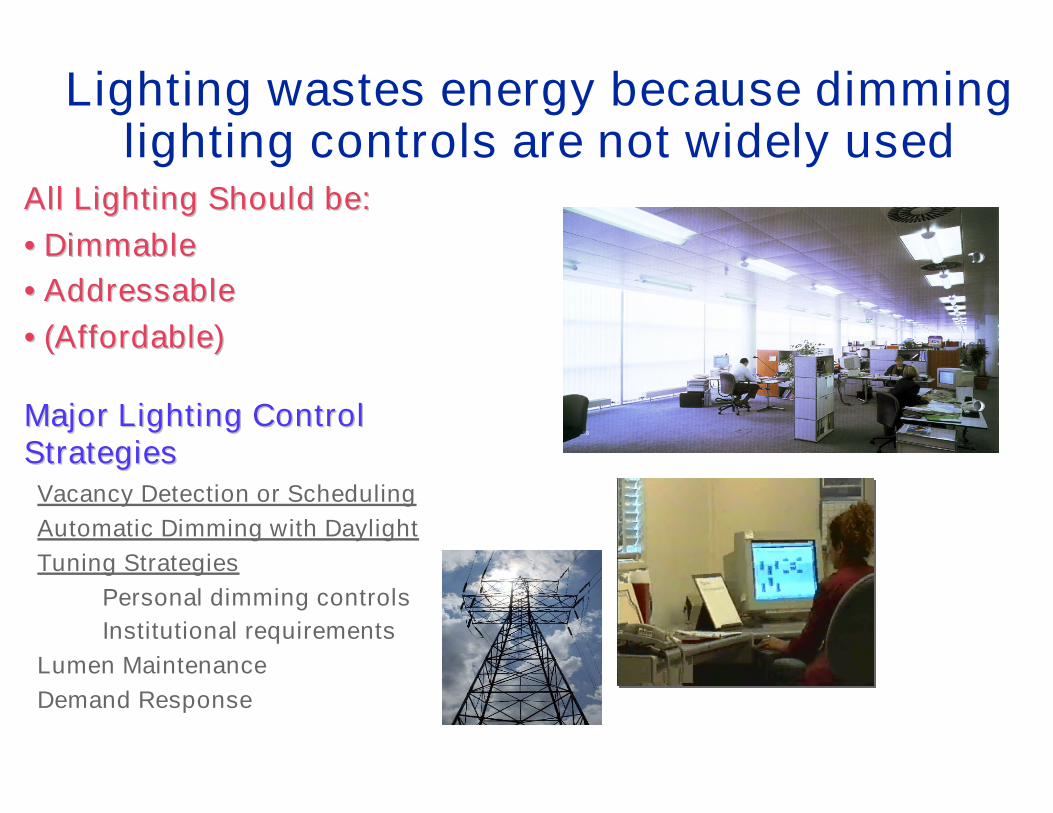
Lighting wastes energy because dimminglighting controls are not widely used
Vacancy Detection or SchedulingAutomatic Dimming with DaylightTuning Strategies
Personal dimming controlsInstitutional requirements
Lumen MaintenanceDemand Response
All Lighting Should be:All Lighting Should be:•• DimmableDimmable•• AddressableAddressable•• (Affordable)(Affordable)
Major Lighting ControlMajor Lighting ControlStrategiesStrategies

Lawrence Berkeley National Laboratory
53Making Lighting Intelligent:
Wireless Control Chips
Single Chip mounted to a boardfor integration with lighting
components
Wireless Control by single-chip mote demonstrated in
ACM & Ballast
Lighting Research Group
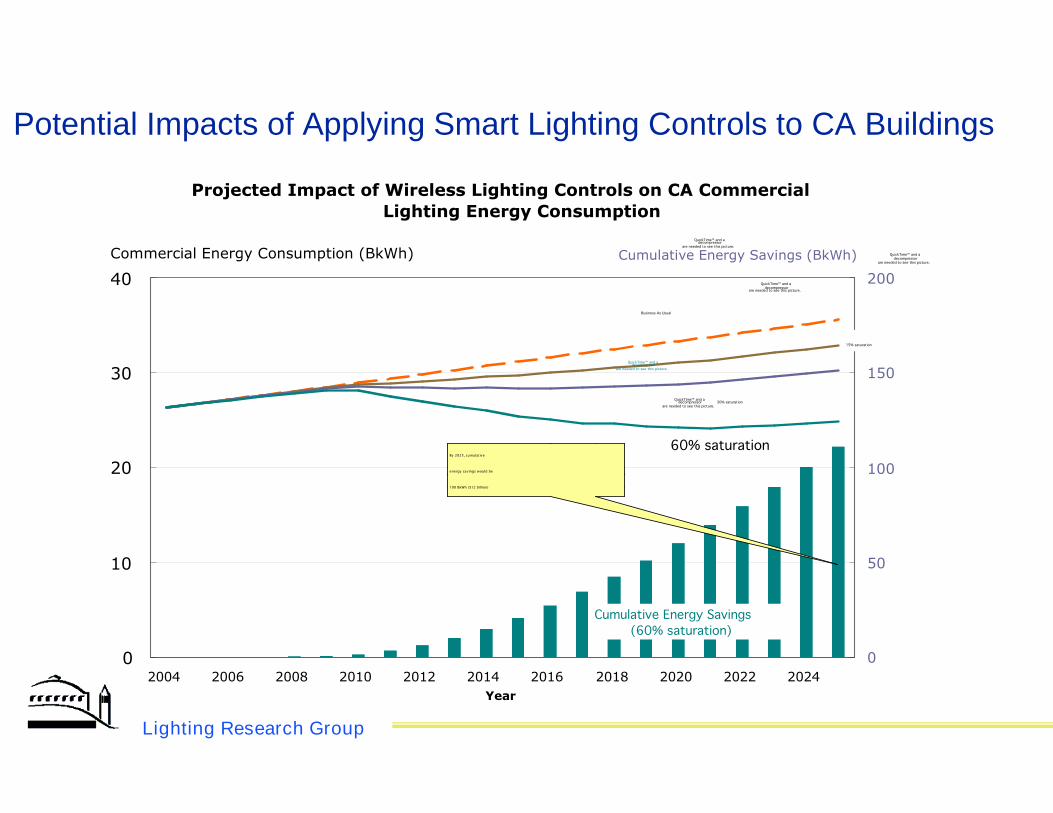
Potential Impacts of Applying Smart Lighting Controls to CA Buildings
Projected Impact of Wireless Lighting Controls on CA CommercialLighting Energy Consumption
0
10
20
30
40
2004 2006 2008 2010 2012 2014 2016 2018 2020 2022 2024Year
0
50
100
150
200
Commercial Energy Consumption (BkWh)
QuickTime™and adecompressor
are needed to see this picture.
60% saturation
QuickTime™and adecompressor
are needed to see this picture.
30% saturation
QuickTime™and adecompressor
are needed to see this picture.
15% saturation
QuickTime™and adecompressor
are needed to see this picture.
Business As Usual
QuickTime™and adecompressor
are needed to see this picture.
Cumulative Energy Savings(60% saturation)
QuickTime™and adecompressor
are needed to see this picture.
By 2025, cumulative
energy savings would be
100 BkWh ($12 billion)
Cumulative Energy Savings (BkWh)
55

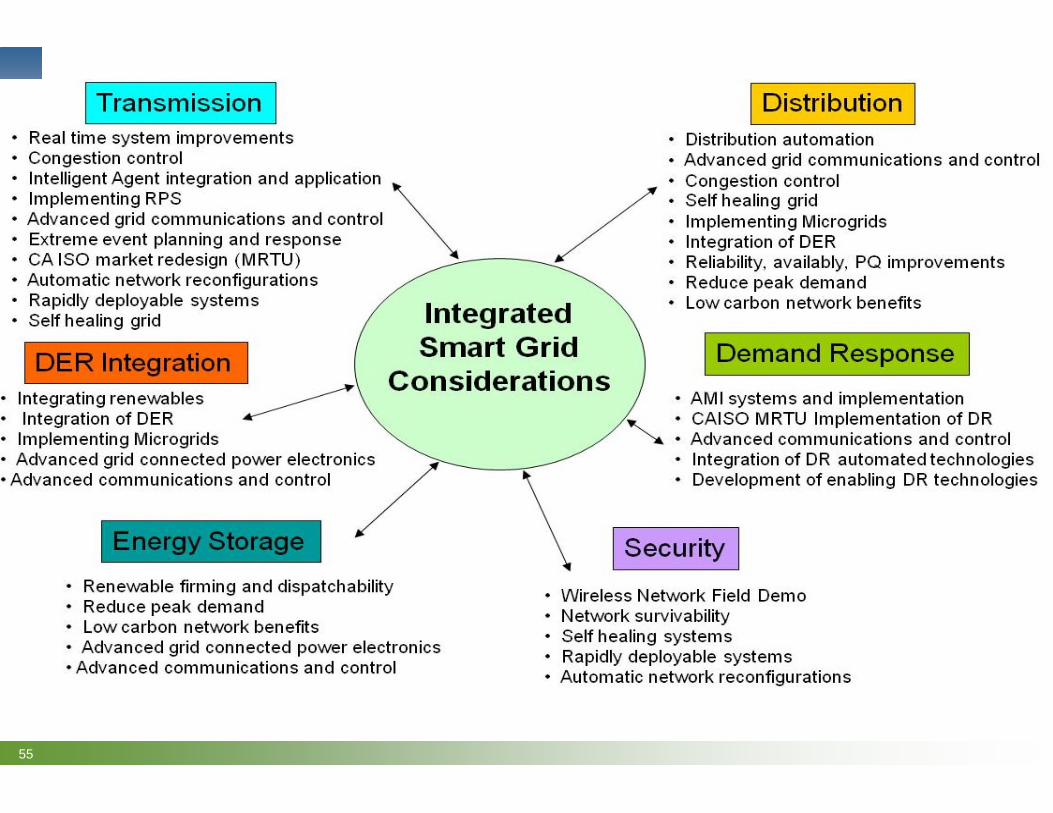
Lawrence Berkeley National Laboratory
Utility Owned Consumer Owned
Automated Demand Response (DR)Server and Software Client
• acknowledgements• price signals• reliability signals
Utility
Utility messagingand settlement
system
DR Program
Comm Dev
CLIENT
IntervalMeter
DRAS
FacilityManagerHTTPS over TCP/IP
HTTPS over TCP/IP(Client/Server - polling)
Auto-DREMCS
Gateway
BacNETLonWorks
ZigbeeEtc.
Lighting
BacNETLonWorks
ZigbeeDALIEtc.CLIENT
LightingControls
HVAC
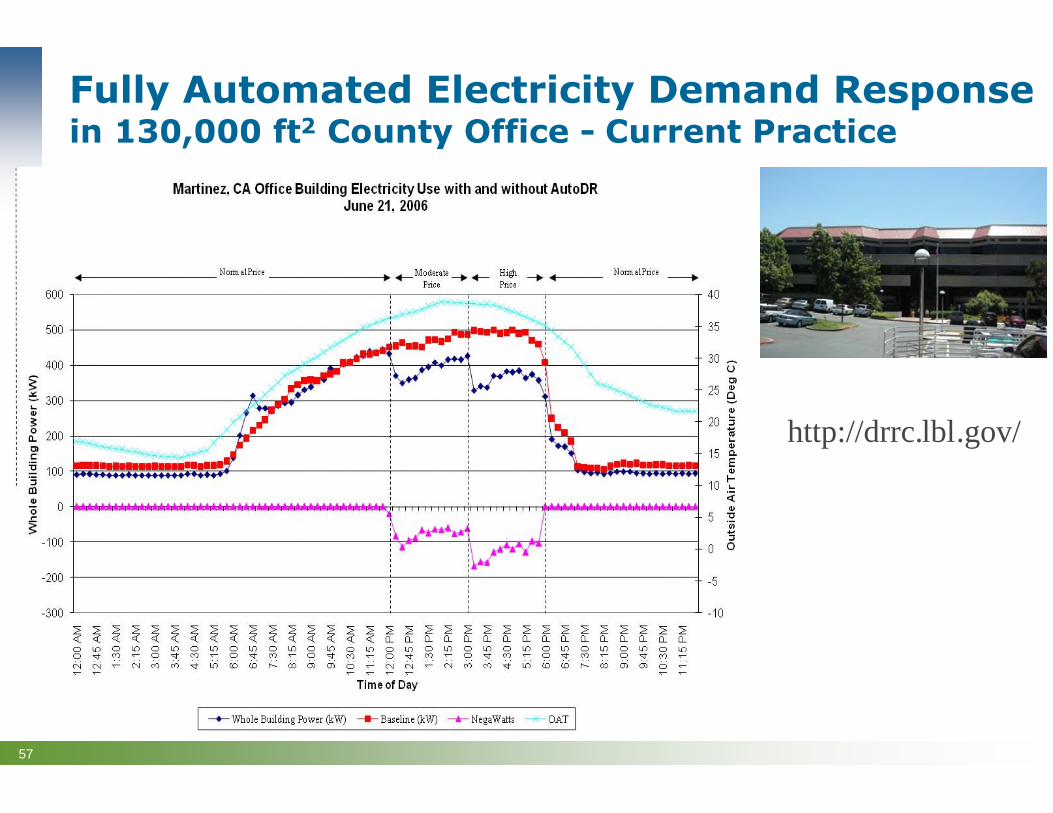
57
Fully Automated Electricity Demand Responsein 130,000 ft2 County Office - Current Practice
http://drrc.lbl.gov/
0.0
0.2
0.4
0.6
0.8
1.0
Markers indicate Years following Retro-commissioning(4 years per project)
Electricity(N=20 projects)
Fuel(N=2)
Steam/Hot Water(N=9)
Chilled Water(N=9)
pre-Cx baseline
year-4
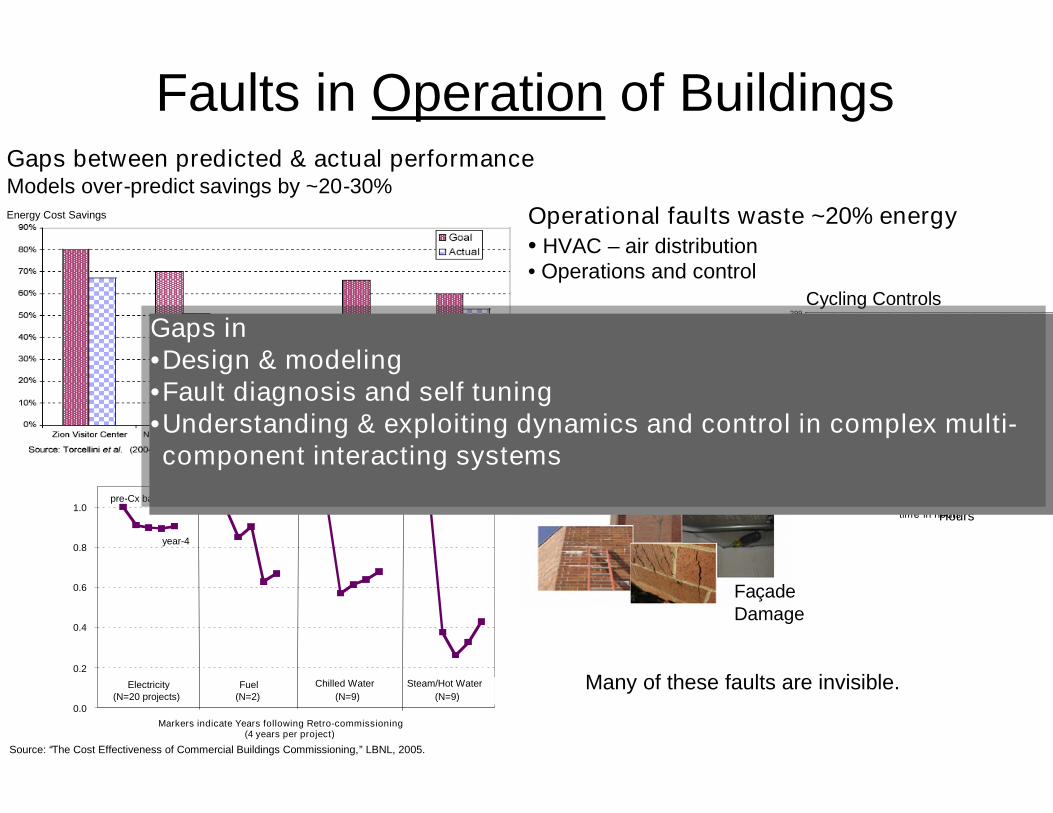
Gaps between predicted & actual performanceModels over-predict savings by ~20-30%
Source: “The Cost Effectiveness of Commercial Buildings Commissioning,” LBNL, 2005.
Faults in Operation of Buildings
Energy Cost Savings
0 1 2 3 4 5 6 7 8293
294
295
296
297
298
299
time in hours
zone
tem
pera
ture
[K]
windowmiddlewallreturn diffreturn duct
Broken Equipment
Cycling Controls
Operational faults waste ~20% energy• HVAC – air distribution• Operations and control
Many of these faults are invisible.
Hours
FaçadeDamage
Gain Changes by factor of10!
Tem
p.[K
]
Gaps in•Design & modeling•Fault diagnosis and self tuning•Understanding & exploiting dynamics and control in complex multi-component interacting systems
Gaps in•Design & modeling•Fault diagnosis and self tuning•Understanding & exploiting dynamics and control in complex multi-component interacting systems
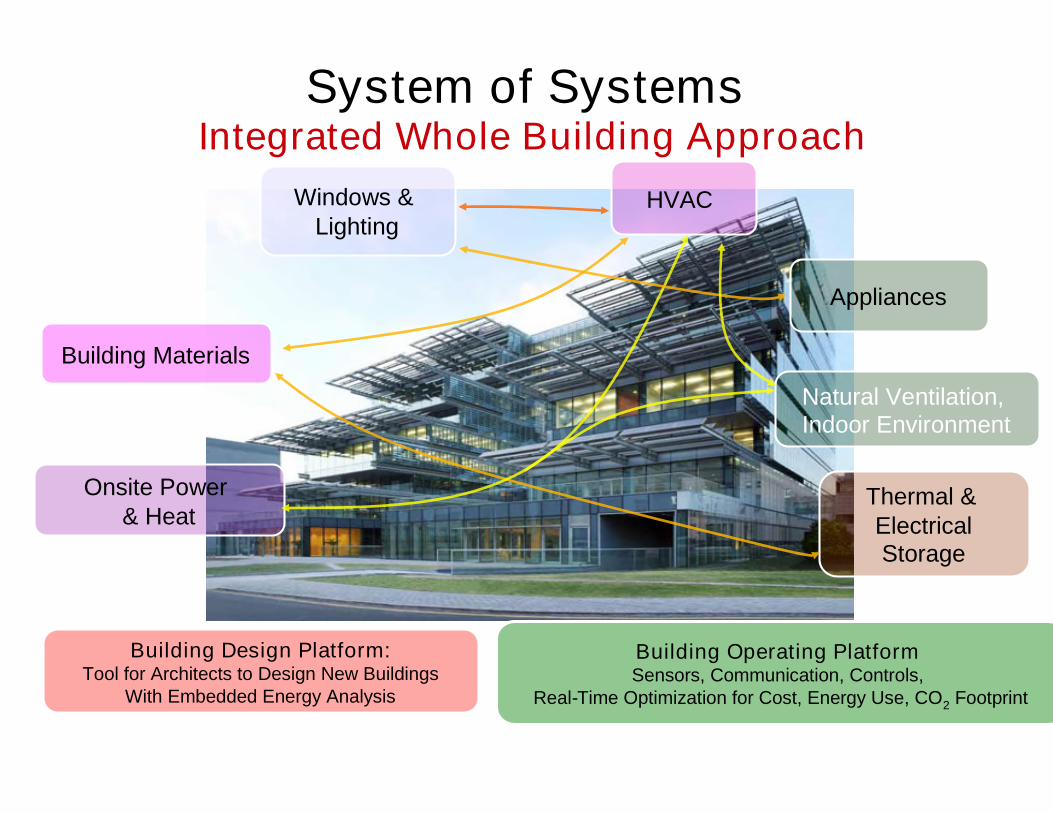
Windows &Lighting
HVAC
Onsite Power& Heat
Natural Ventilation,Indoor Environment
Building Materials
Appliances
Thermal &ElectricalStorage
System of SystemsIntegrated Whole Building Approach
Building Design Platform:Tool for Architects to Design New Buildings
With Embedded Energy Analysis
Building Operating PlatformSensors, Communication, Controls,
Real-Time Optimization for Cost, Energy Use, CO2 Footprint
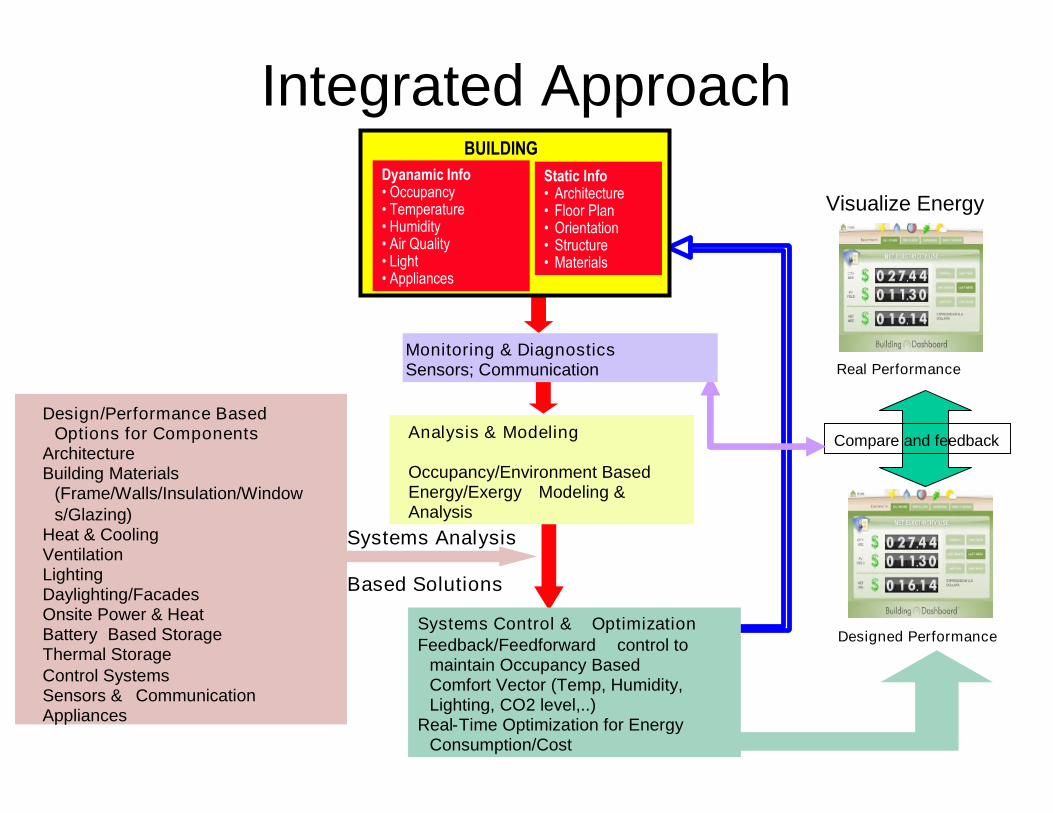
Integrated Approach
Building
Design/Performance BasedOptions for Components
ArchitectureBuilding Materials
(Frame/Walls/Insulation/Windows/Glazing)
Heat & CoolingVentilationLightingDaylighting/FacadesOnsite Power & HeatBattery Based StorageThermal StorageControl SystemsSensors & CommunicationAppliances
Systems Analysis
Based Solutions
Systems Control & OptimizationFeedback/Feedforward control to
maintain Occupancy BasedComfort Vector (Temp, Humidity,Lighting, CO2 level,..)
Real-Time Optimization for EnergyConsumption/Cost
Designed Performance
Compare and feedback
Real Performance
Visualize Energy
Analysis & Modeling
Occupancy/Environment BasedEnergy/Exergy Modeling &Analysis
Monitoring & DiagnosticsSensors; Communication
BUILDINGDyanamic Info• Occupancy• Temperature• Humidity• Air Quality• Light• Appliances
Static Info• Architecture• Floor Plan• Orientation• Structure• Materials
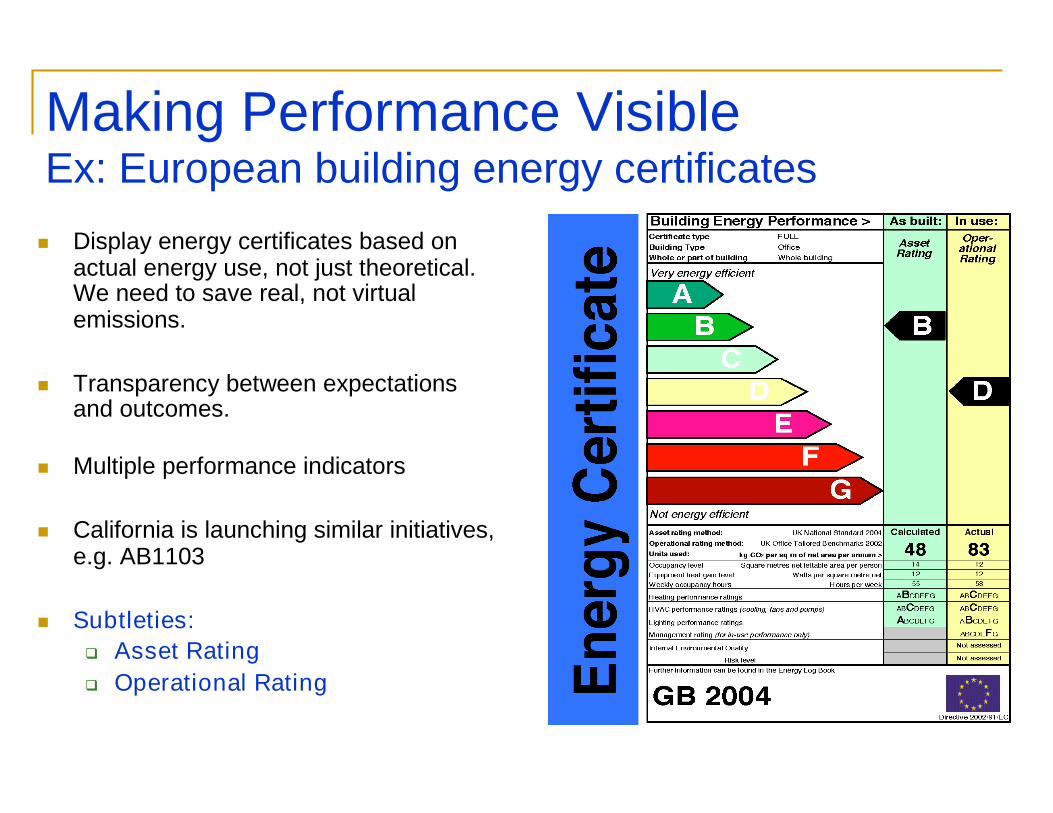
Making Performance VisibleEx: European building energy certificates
Display energy certificates based onactual energy use, not just theoretical.We need to save real, not virtualemissions.
Transparency between expectationsand outcomes.
Multiple performance indicators
California is launching similar initiatives,e.g. AB1103
Subtleties: Asset Rating Operational Rating
Lawrence Berkeley National Laboratory
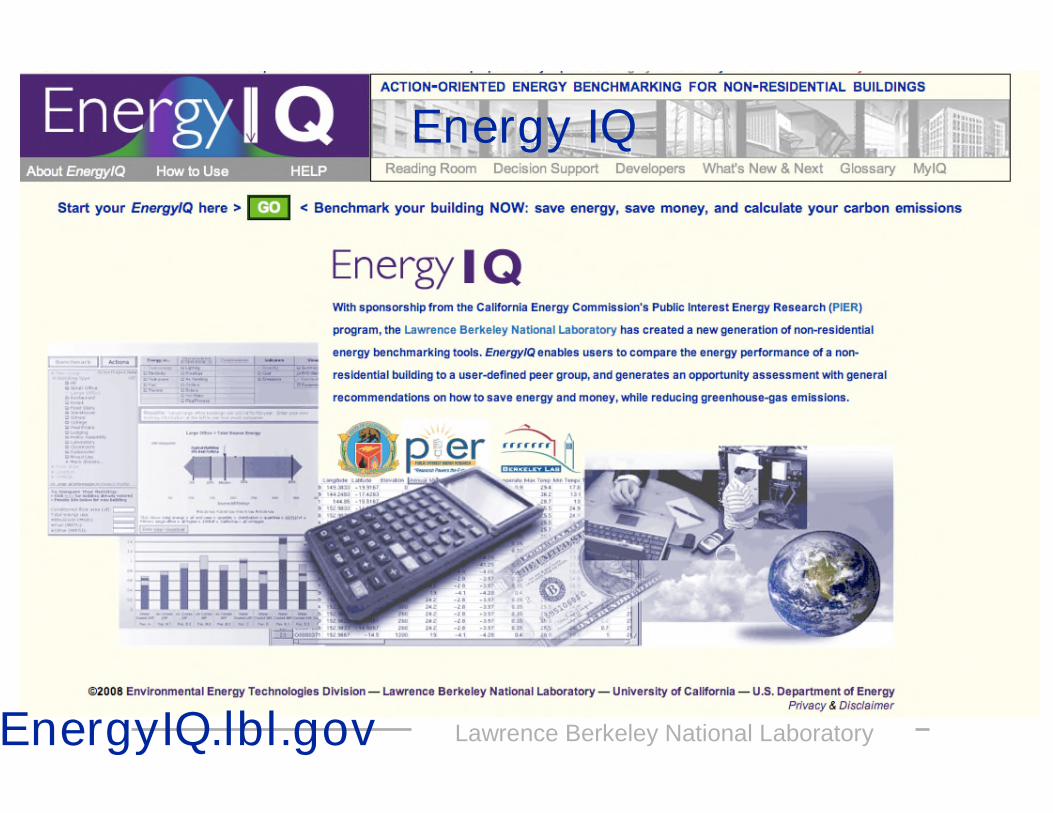
Energy IQ
EnergyIQ.lbl.gov
Lawrence Berkeley National Laboratory
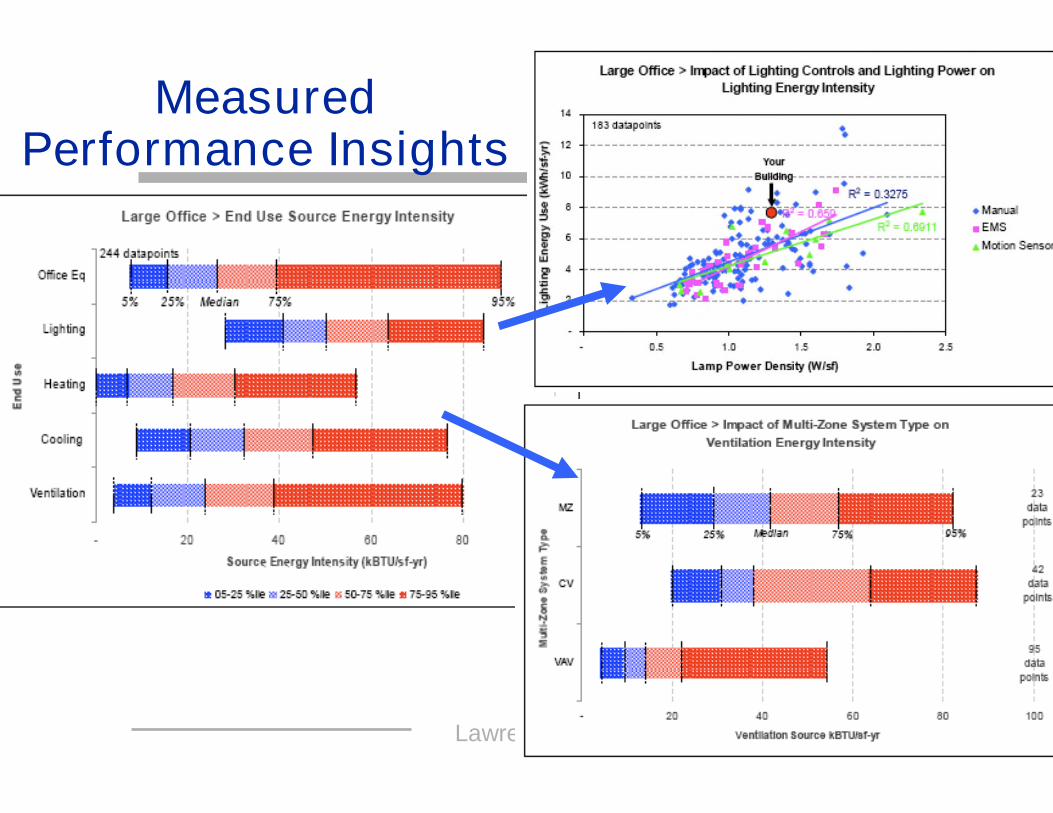
MeasuredPerformance Insights
Lawrence Berkeley National Laboratory
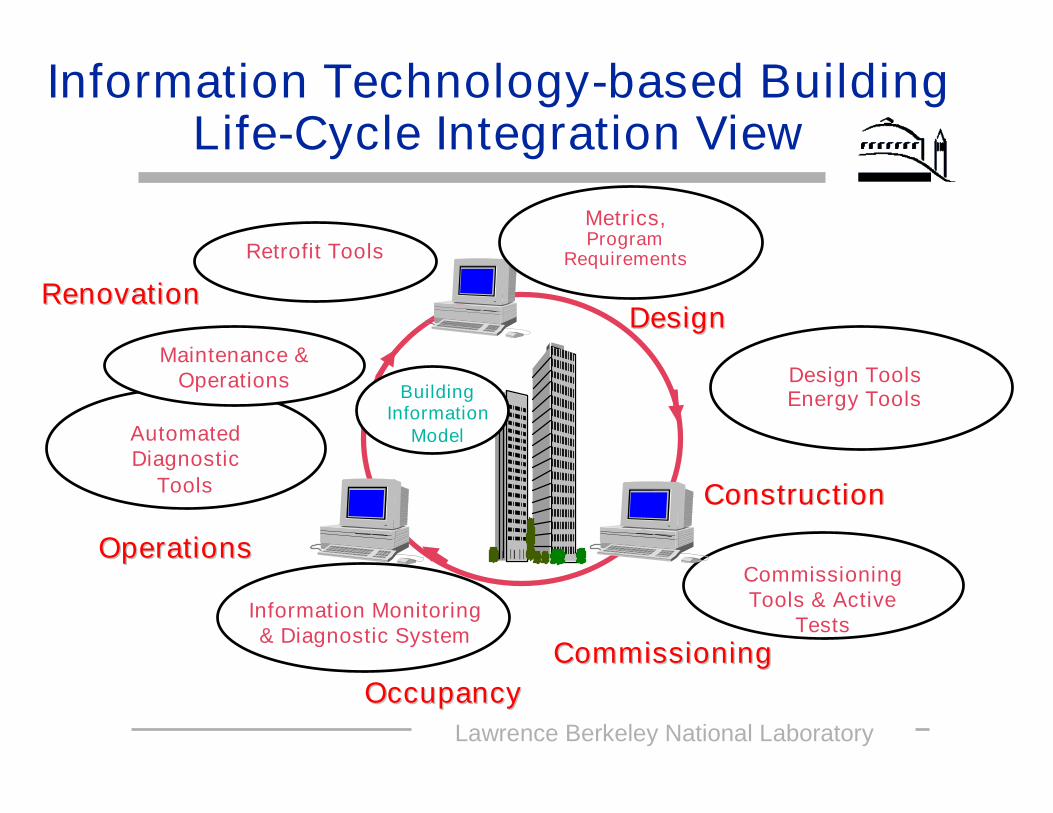
Information Technology-based BuildingLife-Cycle Integration View
CommissioningTools & Active
Tests
DesignDesign
OperationsOperations
Design ToolsEnergy Tools
Retrofit Tools
AutomatedDiagnostic
Tools
CommissioningCommissioning
ConstructionConstruction
Information Monitoring& Diagnostic System
Metrics,Program
Requirements
BuildingInformation
Model
Maintenance &Operations
OccupancyOccupancy
RenovationRenovation
© 2008 NIBS
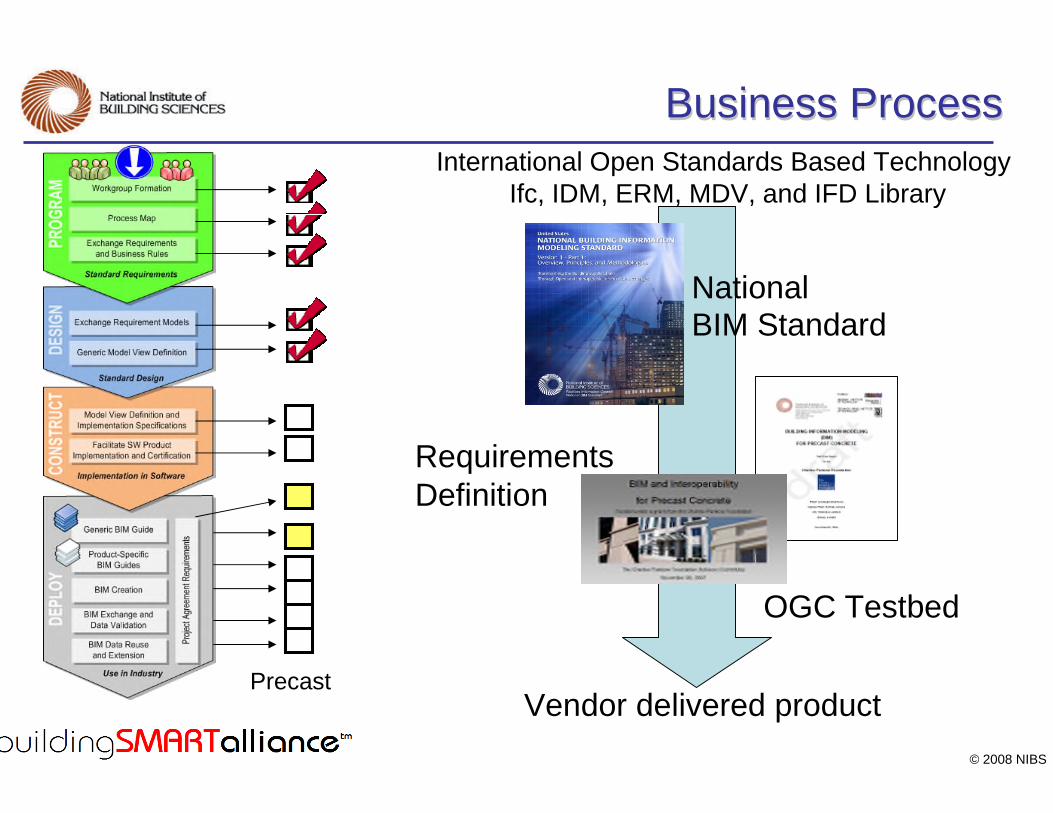
Business ProcessBusiness Process
Vendor delivered product
NationalBIM Standard
RequirementsDefinition
International Open Standards Based TechnologyIfc, IDM, ERM, MDV, and IFD Library
OGC Testbed
Precast
Lawrence Berkeley National Laboratory
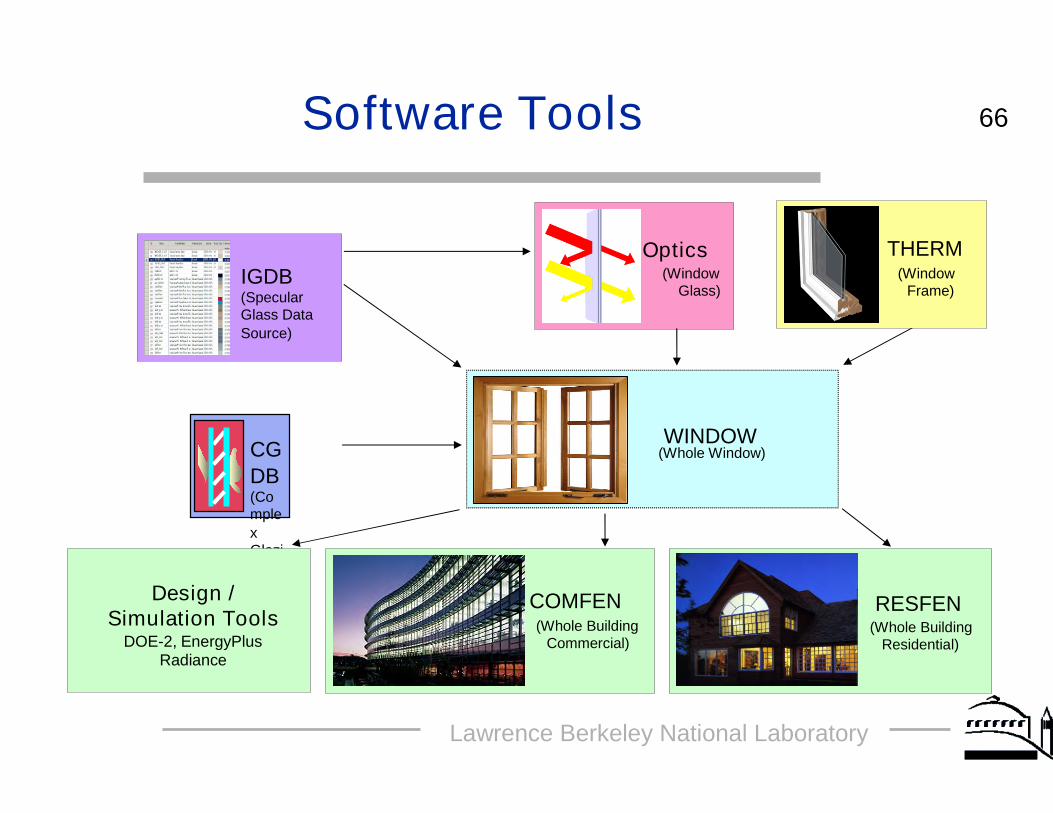
66
CGDB(ComplexGlazingDataBase)
calculationcalculationcalculation
Design /Simulation Tools
DOE-2, EnergyPlusRadiance
IGDB(SpecularGlass DataSource)
Software Tools
Optics(Window
Glass)
RESFEN(Whole Building
Residential)
WINDOW(Whole Window)
COMFEN(Whole Building
Commercial)
THERM(Window
Frame)
Lawrence Berkeley National Laboratory
67
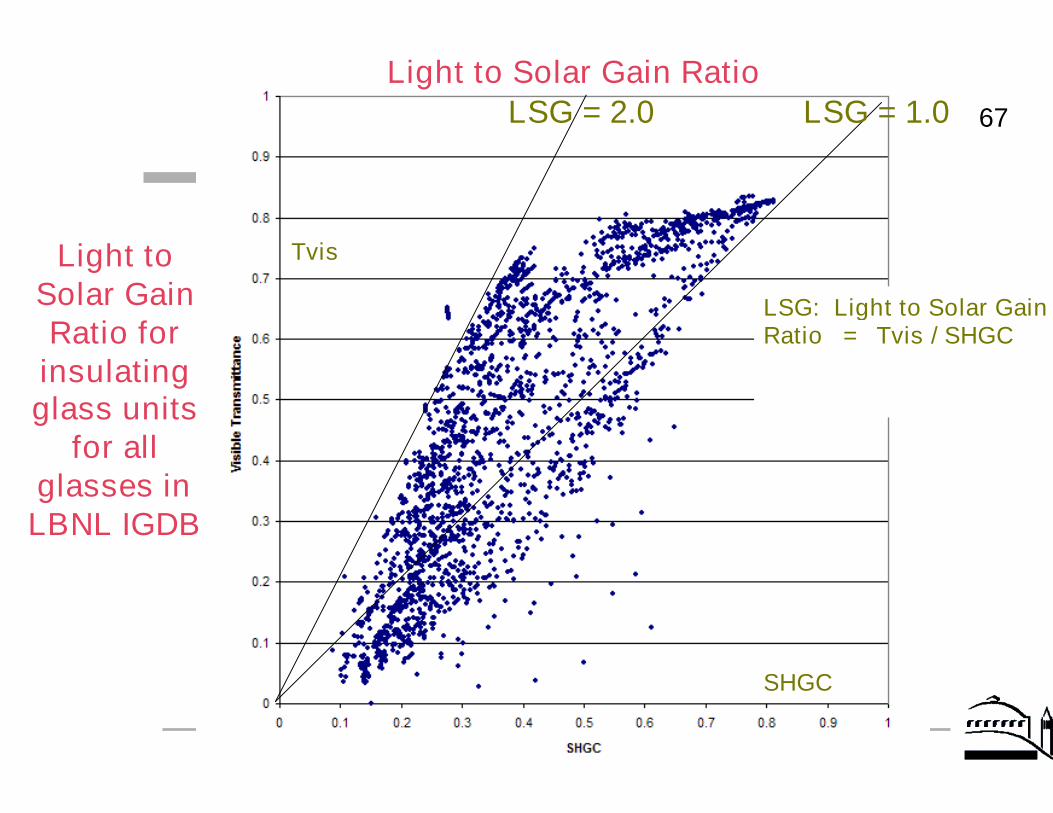
Light to Solar Gain Ratio
Light toSolar GainRatio for
insulatingglass units
for allglasses in
LBNL IGDB
LSG = 1.0LSG = 2.0
LSG: Light to Solar GainRatio = Tvis / SHGC
Tvis
SHGC
Lawrence Berkeley National Laboratory
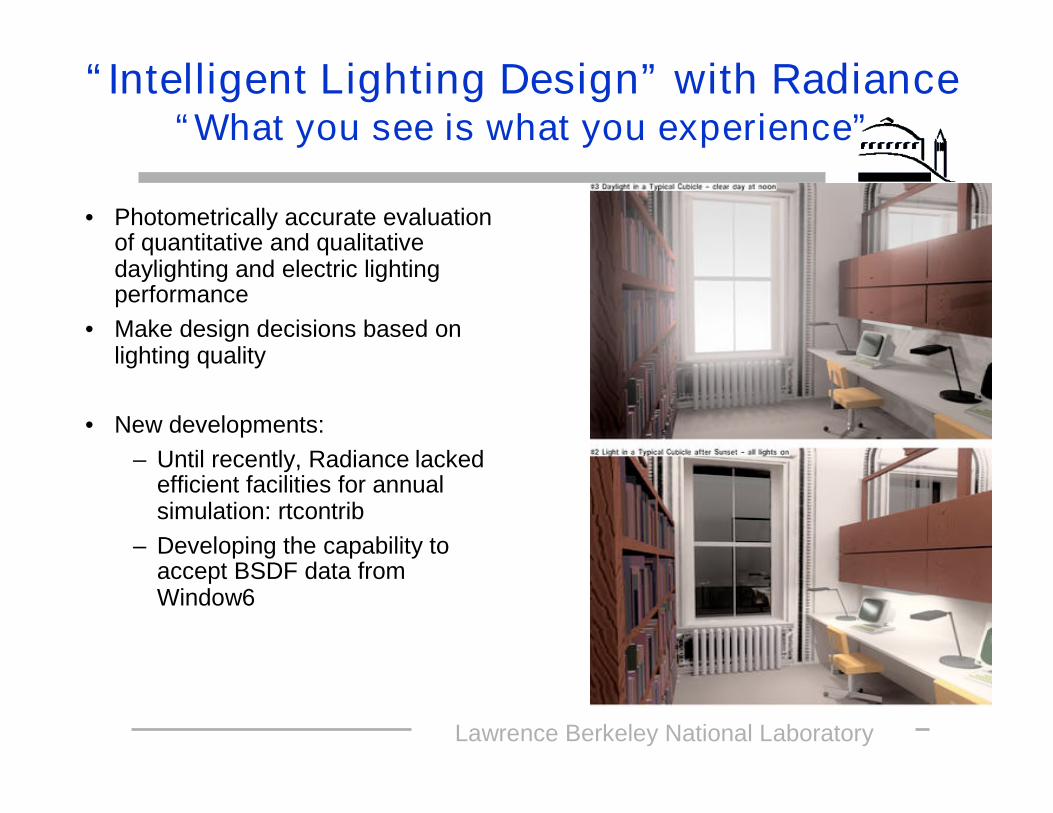
• Photometrically accurate evaluationof quantitative and qualitativedaylighting and electric lightingperformance
• Make design decisions based onlighting quality
• New developments:– Until recently, Radiance lacked
efficient facilities for annualsimulation: rtcontrib
– Developing the capability toaccept BSDF data fromWindow6
“Intelligent Lighting Design” with Radiance“What you see is what you experience”
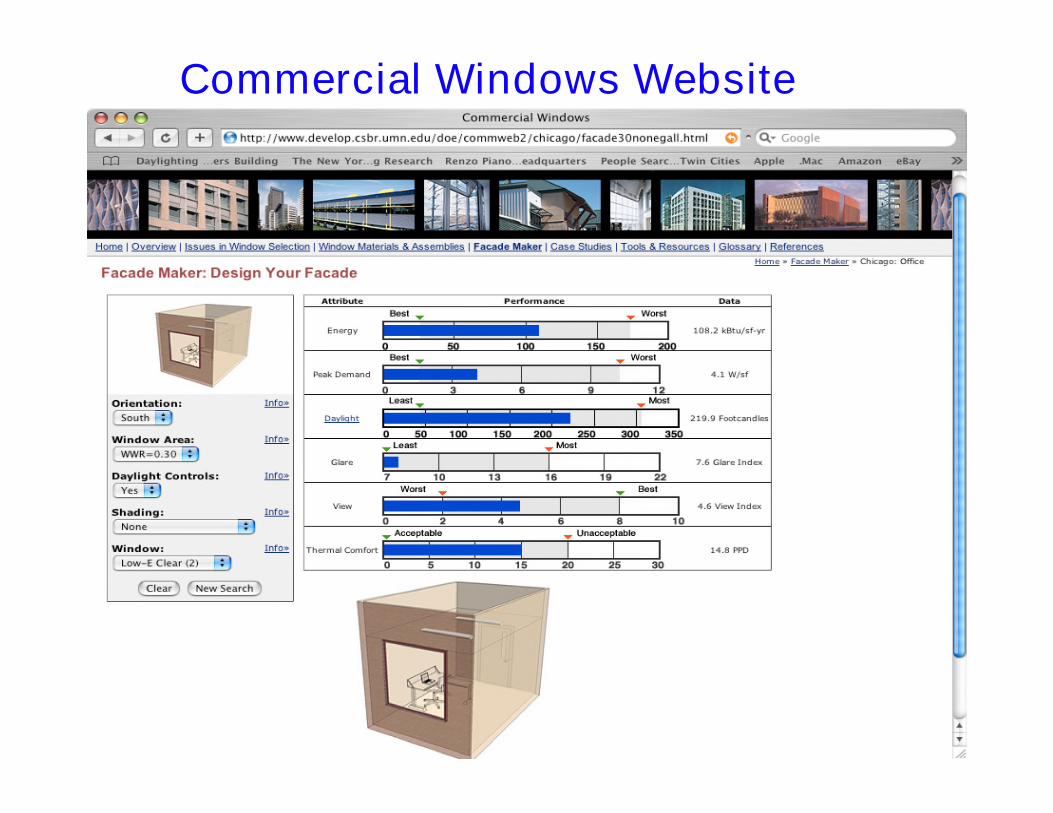
Commercial Windows Website
Lawrence Berkeley National Laboratory
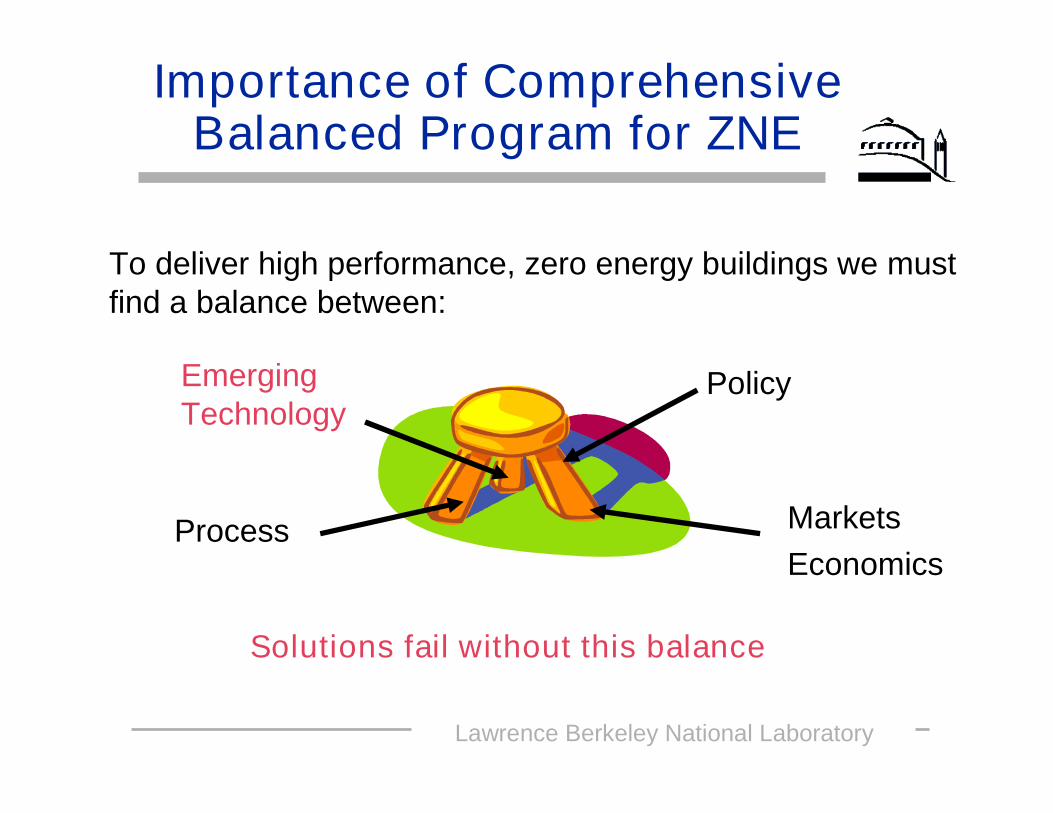
Importance of ComprehensiveBalanced Program for ZNE
To deliver high performance, zero energy buildings we mustfind a balance between:
Process
Solutions fail without this balance
MarketsEconomics
PolicyEmergingTechnology
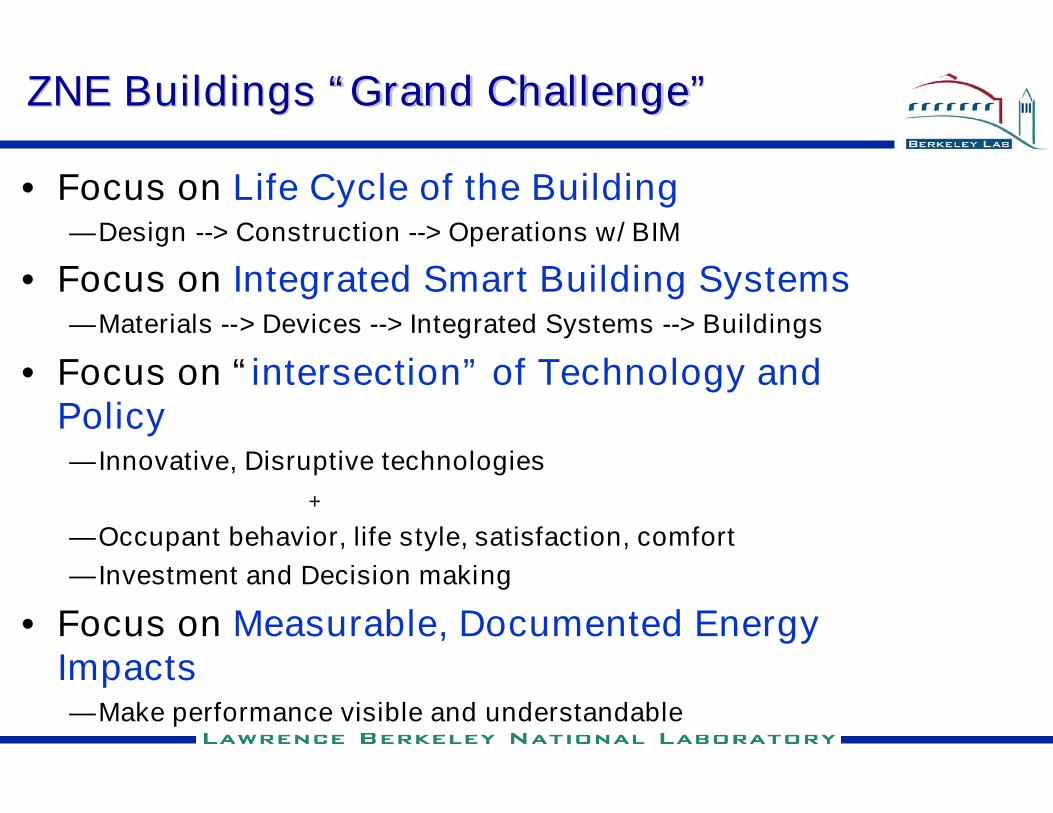
ZNE BuildingsZNE Buildings ““Grand ChallengeGrand Challenge””
• Focus on Life Cycle of the Building—Design --> Construction --> Operations w/ BIM
• Focus on Integrated Smart Building Systems—Materials --> Devices --> Integrated Systems --> Buildings
• Focus on “intersection” of Technology andPolicy— Innovative, Disruptive technologies
+
—Occupant behavior, life style, satisfaction, comfort— Investment and Decision making
• Focus on Measurable, Documented EnergyImpacts—Make performance visible and understandable
page 72
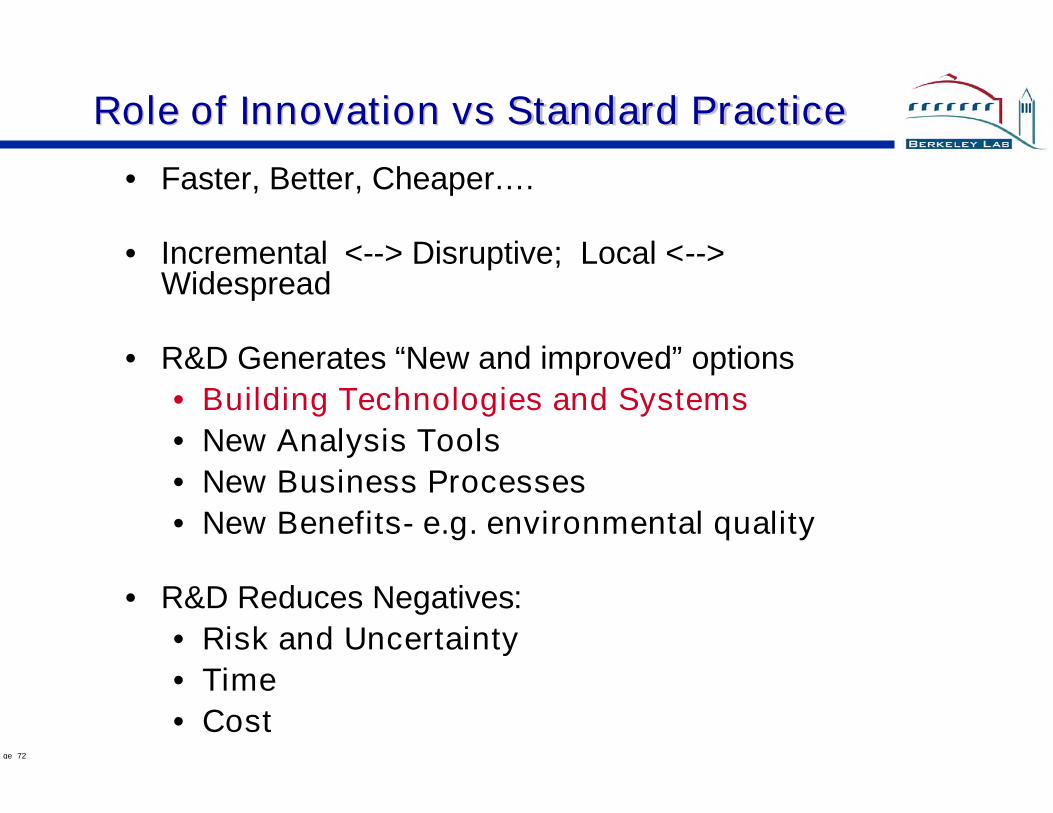
Role ofRole of InnovationInnovation vsvs Standard PracticeStandard Practice
• Faster, Better, Cheaper….
• Incremental <--> Disruptive; Local <-->Widespread
• R&D Generates “New and improved” options• Building Technologies and Systems• New Analysis Tools• New Business Processes• New Benefits- e.g. environmental quality
• R&D Reduces Negatives:• Risk and Uncertainty• Time• Cost
Lawrence Berkeley National Laboratory
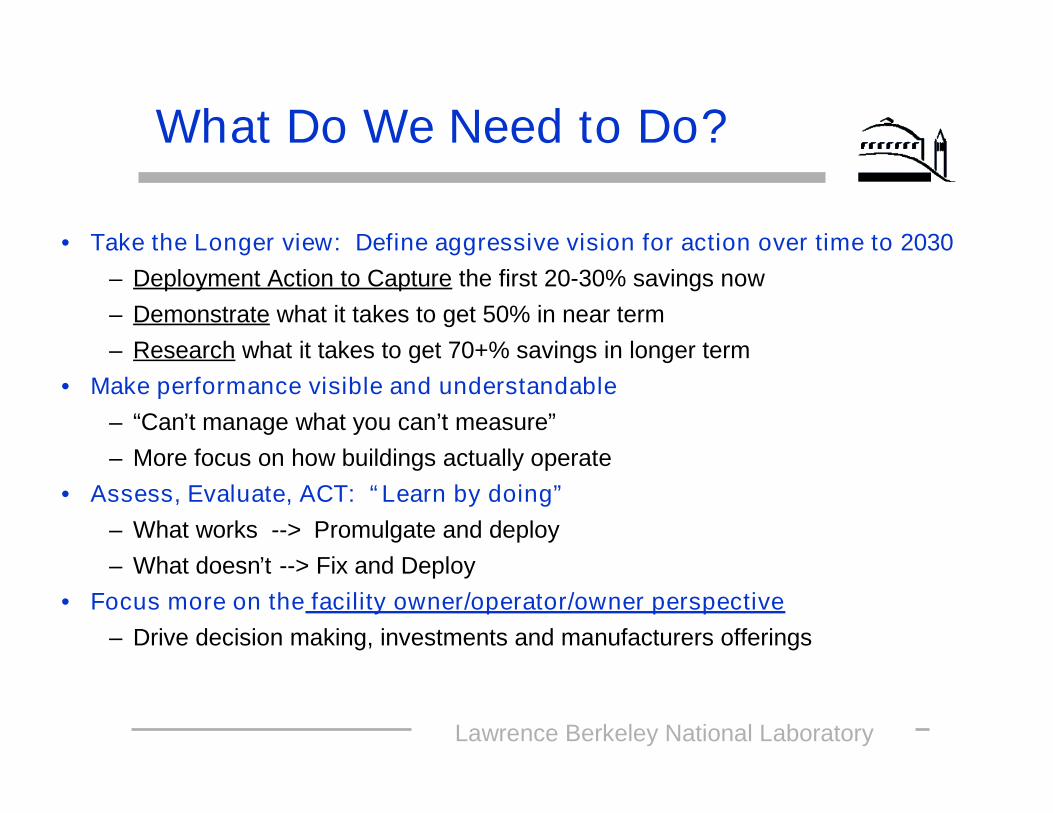
What Do We Need to Do?
• Take the Longer view: Define aggressive vision for action over time to 2030– Deployment Action to Capture the first 20-30% savings now– Demonstrate what it takes to get 50% in near term– Research what it takes to get 70+% savings in longer term
• Make performance visible and understandable– “Can’t manage what you can’t measure”– More focus on how buildings actually operate
• Assess, Evaluate, ACT: “Learn by doing”– What works --> Promulgate and deploy– What doesn’t --> Fix and Deploy
• Focus more on the facility owner/operator/owner perspective– Drive decision making, investments and manufacturers offerings
page 74
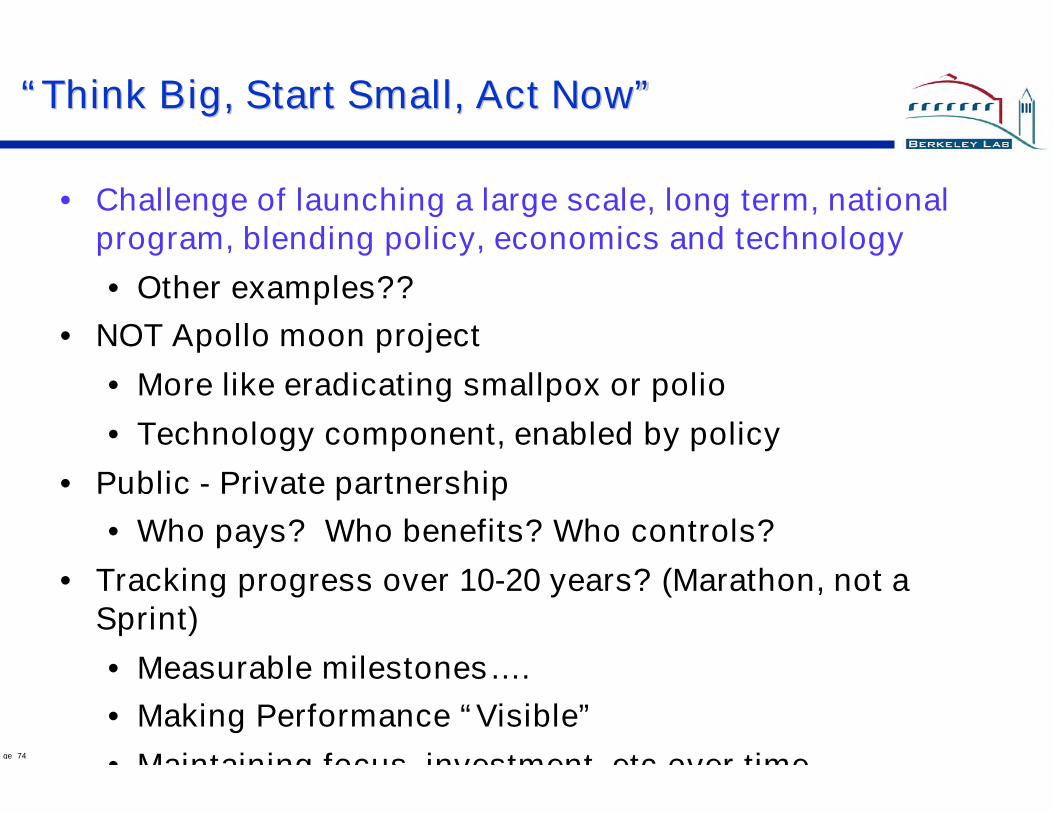
““Think Big, StartThink Big, Start Small, Act NowSmall, Act Now””
• Challenge of launching a large scale, long term, nationalprogram, blending policy, economics and technology
• Other examples??• NOT Apollo moon project
• More like eradicating smallpox or polio
• Technology component, enabled by policy
• Public - Private partnership• Who pays? Who benefits? Who controls?
• Tracking progress over 10-20 years? (Marathon, not aSprint)
• Measurable milestones….• Making Performance “Visible”
• Maintaining focus, investment, etc over time
Lawrence Berkeley National Laboratory
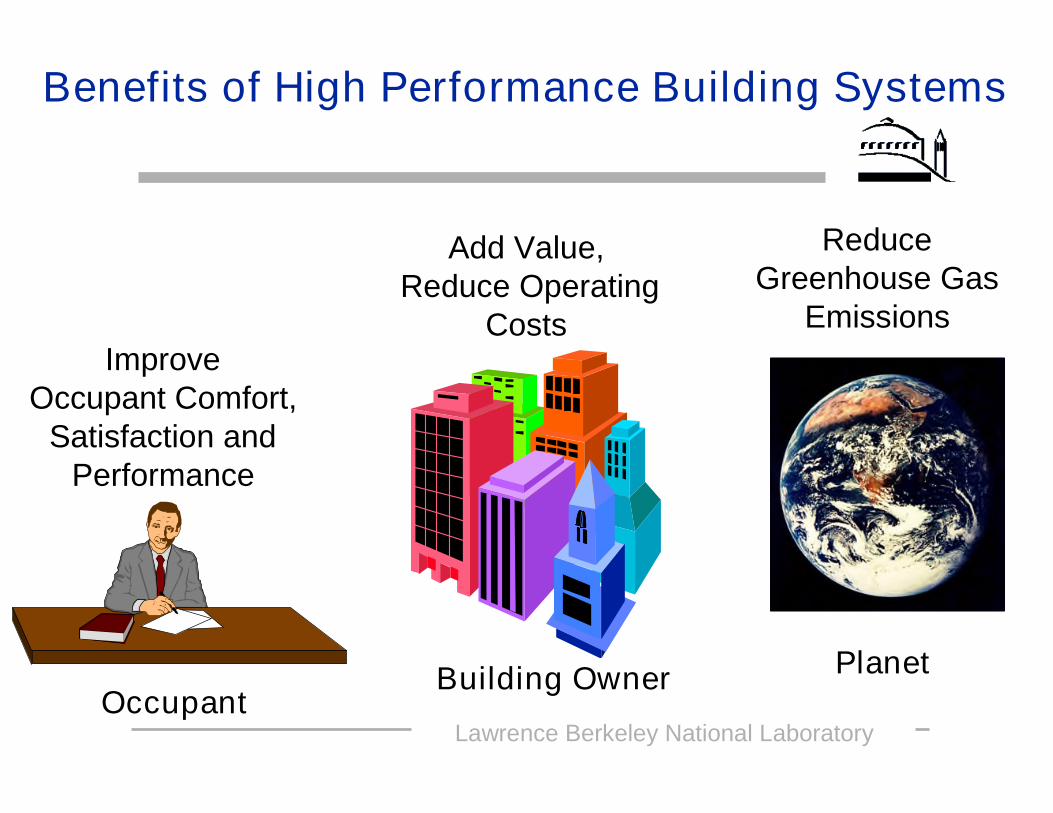
Benefits of High Performance Building Systems
ImproveOccupant Comfort,
Satisfaction andPerformance
Add Value,Reduce Operating
Costs
ReduceGreenhouse Gas
Emissions
OccupantBuilding Owner Planet