Embed Size (px)
Citation preview
Final Report
Analysis of Indo Thai Securities’ IPO
Prepared by-
Abhishek Moonat
1 | P a g e
Acknowledgement
I have taken efforts in this project. However, it would not have been possible without the kind
support and help of many individuals and organizations. I would like to extend my sincere
thanks to all of them.
I am highly indebted to Prof. Tirthank Shah and Prof. Abhay Raja for their guidance and
constant supervision as well as for providing necessary information regarding the project &
also for their support in completing the project.
I would like to express my gratitude towards my parents & my workplace mentor Mr. Tarun
Jain for their kind co-operation and encouragement which help me in completion of this
project.
I would like to express my special gratitude and thanks to all my professors for giving me
such attention and time.
My thanks and appreciations also go to my colleague in developing the project and people
who have willingly helped me out with their abilities.
2 | P a g e
Table of Contents 1. Introduction to Indian IPO market ...................................................................................................... 3
Developments in Indian IPO market- .................................................................................................. 3
2. Company’s Introduction ..................................................................................................................... 3
DB (International) Stock Brokers ........................................................................................................... 4
3. Risk Factors ......................................................................................................................................... 4
4. Reasons for Introduction of IPO .......................................................................................................... 5
5. Financial Performance- ....................................................................................................................... 6
6. Change in shareholding pattern .......................................................................................................... 8
7. Share Price Performance .................................................................................................................... 9
8. Conclusion ......................................................................................................................................... 11
3 | P a g e
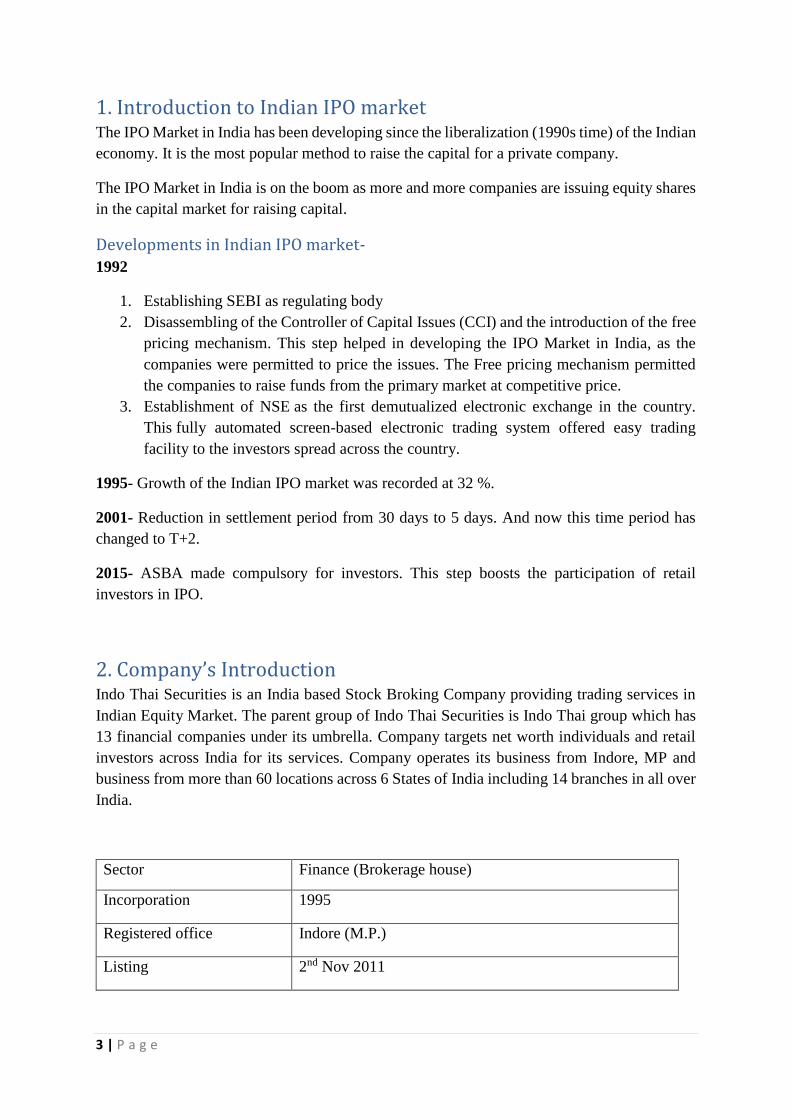
1. Introduction to Indian IPO market The IPO Market in India has been developing since the liberalization (1990s time) of the Indian
economy. It is the most popular method to raise the capital for a private company.
The IPO Market in India is on the boom as more and more companies are issuing equity shares
in the capital market for raising capital.
Developments in Indian IPO market-
1992
1. Establishing SEBI as regulating body
2. Disassembling of the Controller of Capital Issues (CCI) and the introduction of the free
pricing mechanism. This step helped in developing the IPO Market in India, as the
companies were permitted to price the issues. The Free pricing mechanism permitted
the companies to raise funds from the primary market at competitive price.
3. Establishment of NSE as the first demutualized electronic exchange in the country.
This fully automated screen-based electronic trading system offered easy trading
facility to the investors spread across the country.
1995- Growth of the Indian IPO market was recorded at 32 %.
2001- Reduction in settlement period from 30 days to 5 days. And now this time period has
changed to T+2.
2015- ASBA made compulsory for investors. This step boosts the participation of retail
investors in IPO.
2. Company’s Introduction Indo Thai Securities is an India based Stock Broking Company providing trading services in
Indian Equity Market. The parent group of Indo Thai Securities is Indo Thai group which has
13 financial companies under its umbrella. Company targets net worth individuals and retail
investors across India for its services. Company operates its business from Indore, MP and
business from more than 60 locations across 6 States of India including 14 branches in all over
India.
Sector Finance (Brokerage house)
Incorporation 1995
Registered office Indore (M.P.)
Listing 2nd Nov 2011
4 | P a g e
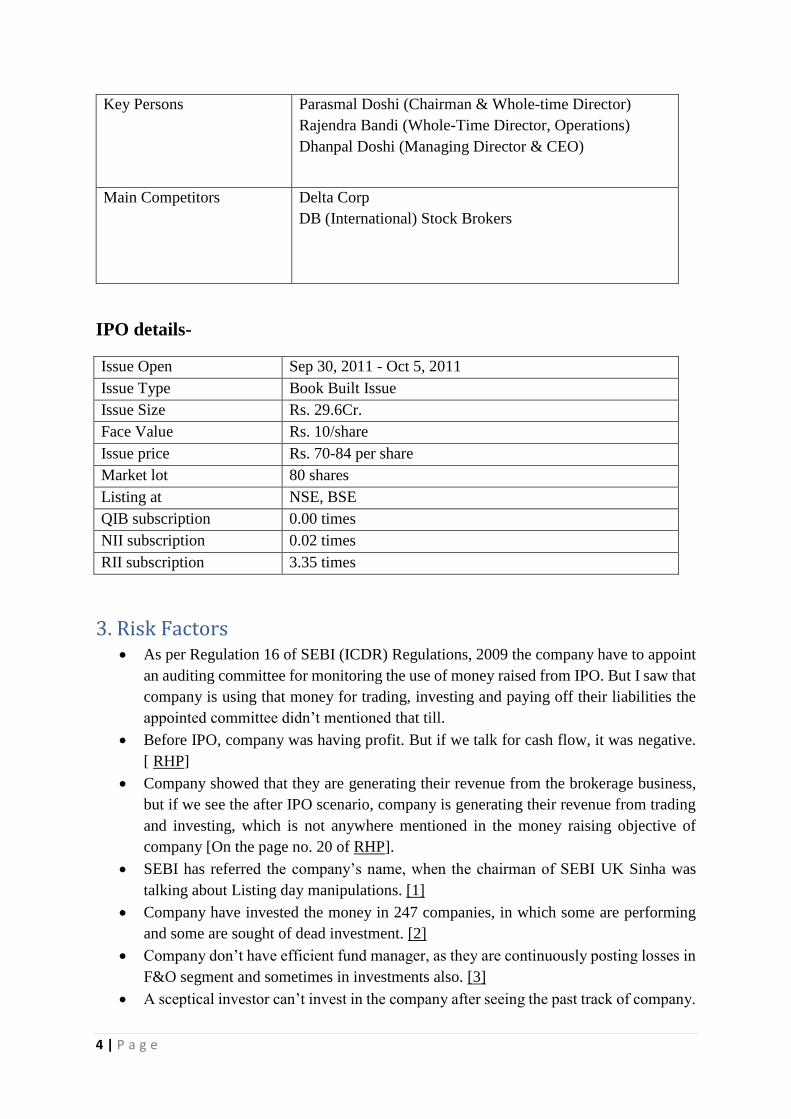
Key Persons Parasmal Doshi (Chairman & Whole-time Director)
Rajendra Bandi (Whole-Time Director, Operations)
Dhanpal Doshi (Managing Director & CEO)
Main Competitors Delta Corp
DB (International) Stock Brokers
IPO details-
Issue Open Sep 30, 2011 - Oct 5, 2011
Issue Type Book Built Issue
Issue Size Rs. 29.6Cr.
Face Value Rs. 10/share
Issue price Rs. 70-84 per share
Market lot 80 shares
Listing at NSE, BSE
QIB subscription 0.00 times
NII subscription 0.02 times
RII subscription 3.35 times
3. Risk Factors As per Regulation 16 of SEBI (ICDR) Regulations, 2009 the company have to appoint
an auditing committee for monitoring the use of money raised from IPO. But I saw that
company is using that money for trading, investing and paying off their liabilities the
appointed committee didn’t mentioned that till.
Before IPO, company was having profit. But if we talk for cash flow, it was negative.
[ RHP]
Company showed that they are generating their revenue from the brokerage business,
but if we see the after IPO scenario, company is generating their revenue from trading
and investing, which is not anywhere mentioned in the money raising objective of
company [On the page no. 20 of RHP].
SEBI has referred the company’s name, when the chairman of SEBI UK Sinha was
talking about Listing day manipulations. [1]
Company have invested the money in 247 companies, in which some are performing
and some are sought of dead investment. [2]
Company don’t have efficient fund manager, as they are continuously posting losses in
F&O segment and sometimes in investments also. [3]
A sceptical investor can’t invest in the company after seeing the past track of company.
5 | P a g e
QIBs didn’t applied in this IPO and it get closed at a loss of 69% from the issue price.
And now NIIs also withdrawn their money from this company.
4. Reasons for Introduction of IPO Expansion and upgradation of our Existing Branches and Set up Network of Branches
Purchase of Office space for Mumbai regional office
Purchase & set up of Office space for Corporate office
Brand Building & Advertising
Augmenting Long Term Working Capital Requirement
General Corporate Purpose
6 | P a g e
5. Financial Performance-
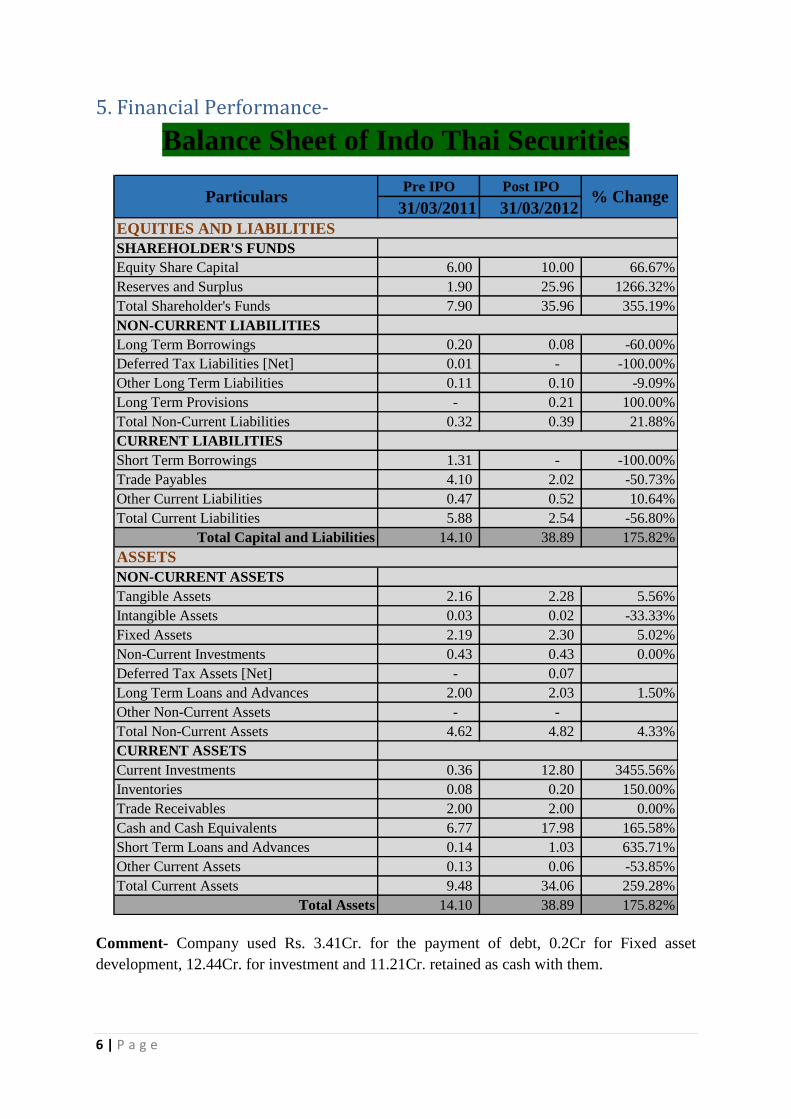
Balance Sheet of Indo Thai Securities
Comment- Company used Rs. 3.41Cr. for the payment of debt, 0.2Cr for Fixed asset
development, 12.44Cr. for investment and 11.21Cr. retained as cash with them.
Pre IPO Post IPO
31/03/2011 31/03/2012
EQUITIES AND LIABILITIES
SHAREHOLDER'S FUNDS
Equity Share Capital 6.00 10.00 66.67%
Reserves and Surplus 1.90 25.96 1266.32%
Total Shareholder's Funds 7.90 35.96 355.19%
NON-CURRENT LIABILITIES
Long Term Borrowings 0.20 0.08 -60.00%
Deferred Tax Liabilities [Net] 0.01 - -100.00%
Other Long Term Liabilities 0.11 0.10 -9.09%
Long Term Provisions - 0.21 100.00%
Total Non-Current Liabilities 0.32 0.39 21.88%
CURRENT LIABILITIES
Short Term Borrowings 1.31 - -100.00%
Trade Payables 4.10 2.02 -50.73%
Other Current Liabilities 0.47 0.52 10.64%
Total Current Liabilities 5.88 2.54 -56.80%
Total Capital and Liabilities 14.10 38.89 175.82%
NON-CURRENT ASSETS
Tangible Assets 2.16 2.28 5.56%
Intangible Assets 0.03 0.02 -33.33%
Fixed Assets 2.19 2.30 5.02%
Non-Current Investments 0.43 0.43 0.00%
Deferred Tax Assets [Net] - 0.07
Long Term Loans and Advances 2.00 2.03 1.50%
Other Non-Current Assets - -
Total Non-Current Assets 4.62 4.82 4.33%
CURRENT ASSETS
Current Investments 0.36 12.80 3455.56%
Inventories 0.08 0.20 150.00%
Trade Receivables 2.00 2.00 0.00%
Cash and Cash Equivalents 6.77 17.98 165.58%
Short Term Loans and Advances 0.14 1.03 635.71%
Other Current Assets 0.13 0.06 -53.85%
Total Current Assets 9.48 34.06 259.28%
Total Assets 14.10 38.89 175.82%
% ChangeParticulars
ASSETS
7 | P a g e
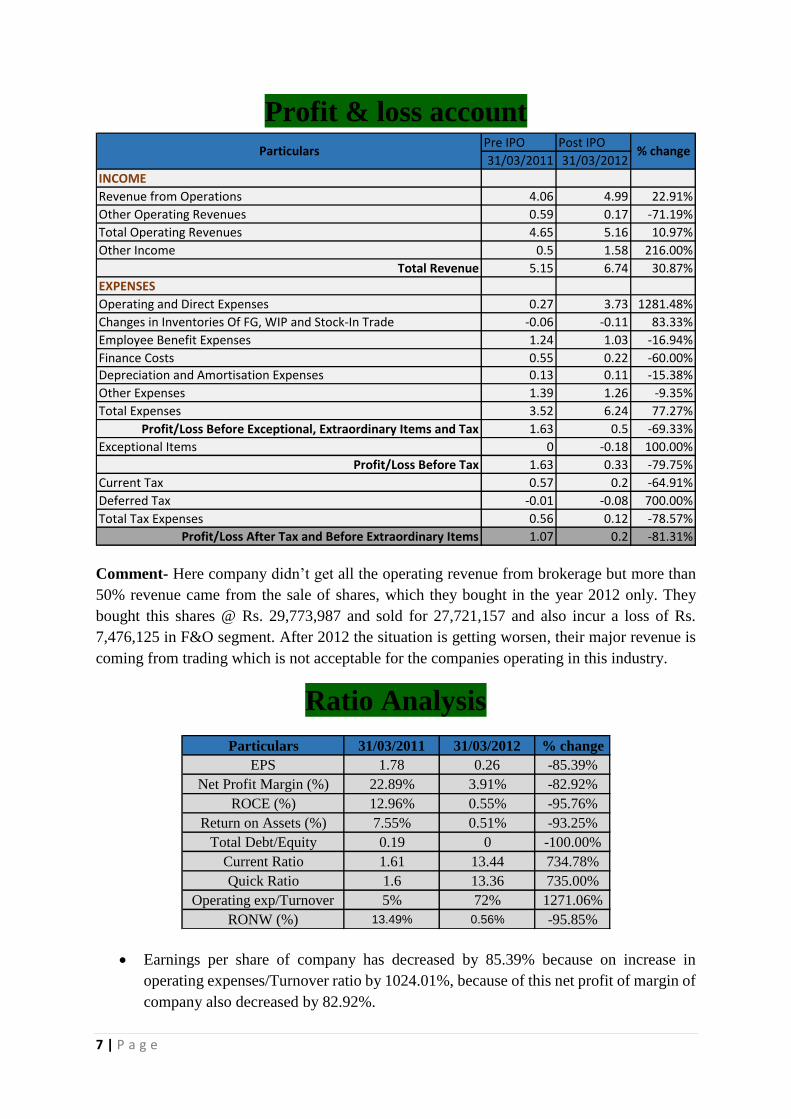
Profit & loss account
Comment- Here company didn’t get all the operating revenue from brokerage but more than
50% revenue came from the sale of shares, which they bought in the year 2012 only. They
bought this shares @ Rs. 29,773,987 and sold for 27,721,157 and also incur a loss of Rs.
7,476,125 in F&O segment. After 2012 the situation is getting worsen, their major revenue is
coming from trading which is not acceptable for the companies operating in this industry.
Ratio Analysis
Earnings per share of company has decreased by 85.39% because on increase in
operating expenses/Turnover ratio by 1024.01%, because of this net profit of margin of
company also decreased by 82.92%.
Pre IPO Post IPO
31/03/2011 31/03/2012
INCOME
Revenue from Operations 4.06 4.99 22.91%
Other Operating Revenues 0.59 0.17 -71.19%
Total Operating Revenues 4.65 5.16 10.97%
Other Income 0.5 1.58 216.00%
Total Revenue 5.15 6.74 30.87%
EXPENSES
Operating and Direct Expenses 0.27 3.73 1281.48%
Changes in Inventories Of FG, WIP and Stock-In Trade -0.06 -0.11 83.33%
Employee Benefit Expenses 1.24 1.03 -16.94%
Finance Costs 0.55 0.22 -60.00%
Depreciation and Amortisation Expenses 0.13 0.11 -15.38%
Other Expenses 1.39 1.26 -9.35%
Total Expenses 3.52 6.24 77.27%
Profit/Loss Before Exceptional, Extraordinary Items and Tax 1.63 0.5 -69.33%
Exceptional Items 0 -0.18 100.00%
Profit/Loss Before Tax 1.63 0.33 -79.75%
Current Tax 0.57 0.2 -64.91%
Deferred Tax -0.01 -0.08 700.00%
Total Tax Expenses 0.56 0.12 -78.57%
Profit/Loss After Tax and Before Extraordinary Items 1.07 0.2 -81.31%
Particulars % change
Particulars 31/03/2011 31/03/2012 % change
EPS 1.78 0.26 -85.39%
Net Profit Margin (%) 22.89% 3.91% -82.92%
ROCE (%) 12.96% 0.55% -95.76%
Return on Assets (%) 7.55% 0.51% -93.25%
Total Debt/Equity 0.19 0 -100.00%
Current Ratio 1.61 13.44 734.78%
Quick Ratio 1.6 13.36 735.00%
Operating exp/Turnover 5% 72% 1271.06%
RONW (%) 13.49% 0.56% -95.85%
8 | P a g e
Company reduced their debt equity ratio by 100%. As they paid off their all the debt.
Liquidity position of company is good as they have current investment and cash reserve
with them.
ROA of company gets reduced by 93.25% as they have invested more money in assets
but not able to generate revenue from that.
ROEC also get reduced by 95.76%. Because profit of company is decreased, even after
employing more capital.
6. Change in shareholding pattern
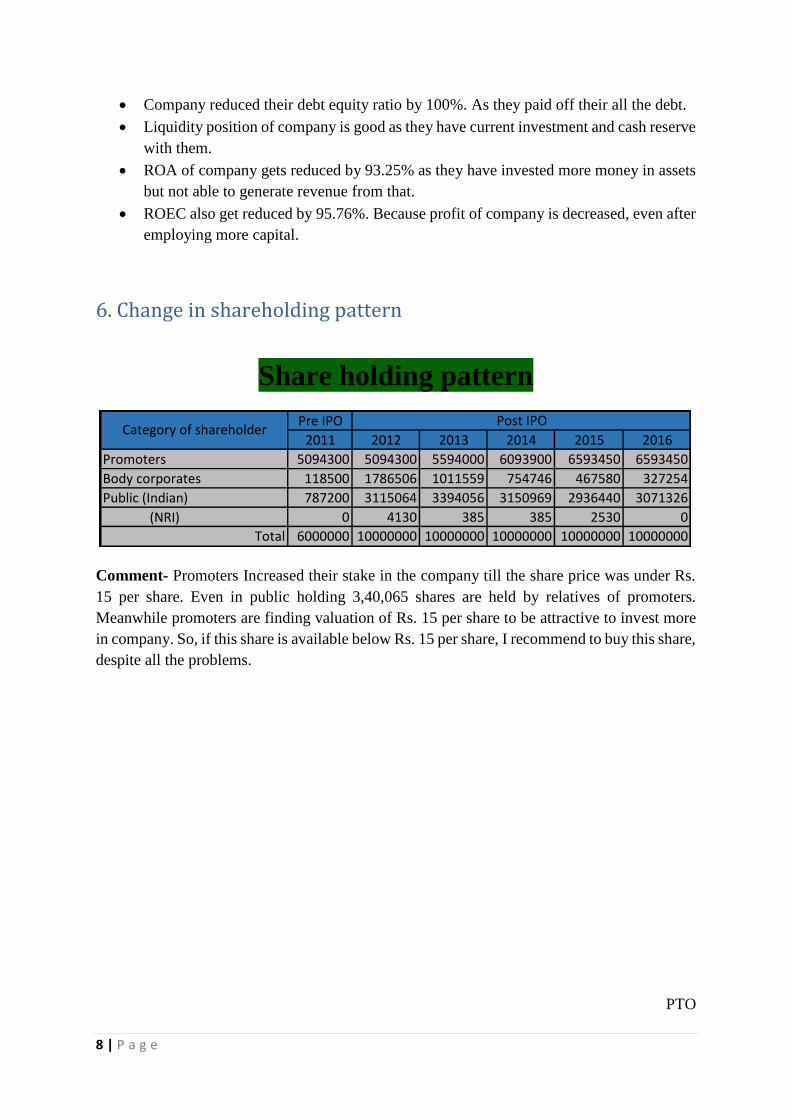
Share holding pattern
Comment- Promoters Increased their stake in the company till the share price was under Rs.
15 per share. Even in public holding 3,40,065 shares are held by relatives of promoters.
Meanwhile promoters are finding valuation of Rs. 15 per share to be attractive to invest more
in company. So, if this share is available below Rs. 15 per share, I recommend to buy this share,
despite all the problems.
PTO
Pre IPO
2011 2012 2013 2014 2015 2016
Promoters 5094300 5094300 5594000 6093900 6593450 6593450
Body corporates 118500 1786506 1011559 754746 467580 327254
Public (Indian) 787200 3115064 3394056 3150969 2936440 3071326
(NRI) 0 4130 385 385 2530 0
Total 6000000 10000000 10000000 10000000 10000000 10000000
Category of shareholderPost IPO
9 | P a g e
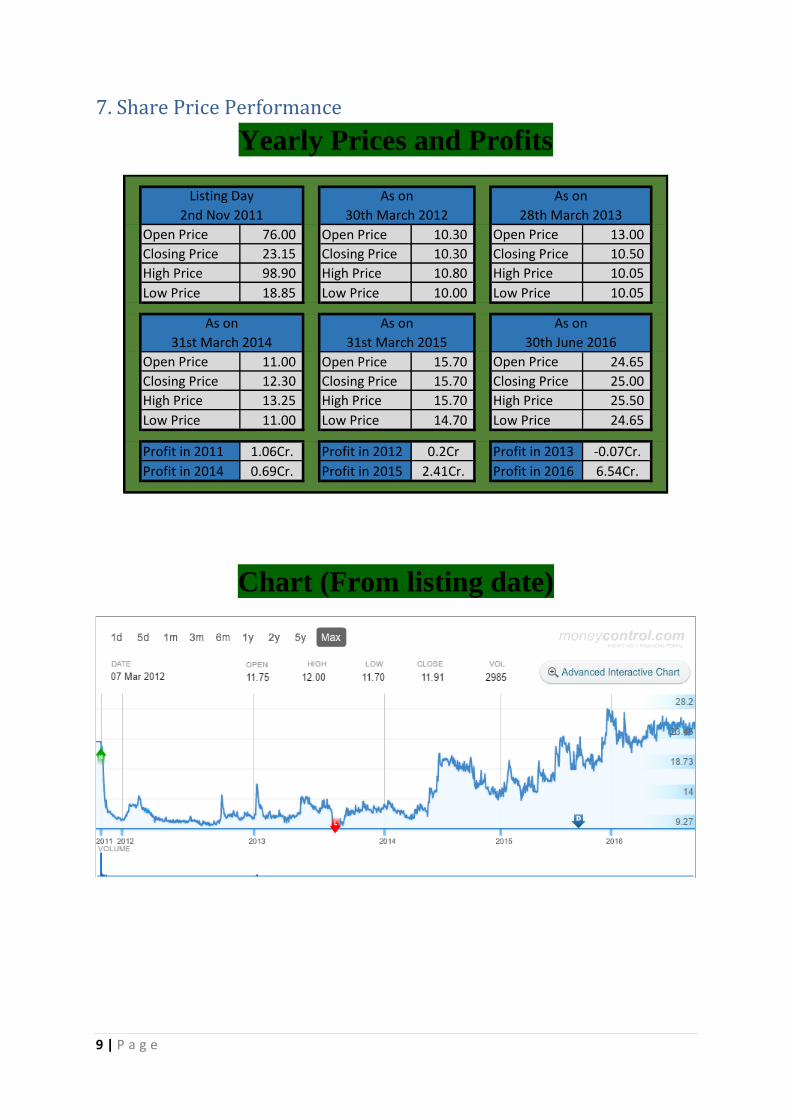
7. Share Price Performance
Yearly Prices and Profits
Chart (From listing date)
Open Price 76.00 Open Price 10.30 Open Price 13.00
Closing Price 23.15 Closing Price 10.30 Closing Price 10.50
High Price 98.90 High Price 10.80 High Price 10.05
Low Price 18.85 Low Price 10.00 Low Price 10.05
Open Price 11.00 Open Price 15.70 Open Price 24.65
Closing Price 12.30 Closing Price 15.70 Closing Price 25.00
High Price 13.25 High Price 15.70 High Price 25.50
Low Price 11.00 Low Price 14.70 Low Price 24.65
Profit in 2011 1.06Cr. Profit in 2012 0.2Cr Profit in 2013 -0.07Cr.
Profit in 2014 0.69Cr. Profit in 2015 2.41Cr. Profit in 2016 6.54Cr.
Listing Day
2nd Nov 2011
As on
30th March 2012
As on
28th March 2013
As on
31st March 2014
As on
31st March 2015
As on
30th June 2016
10 | P a g e
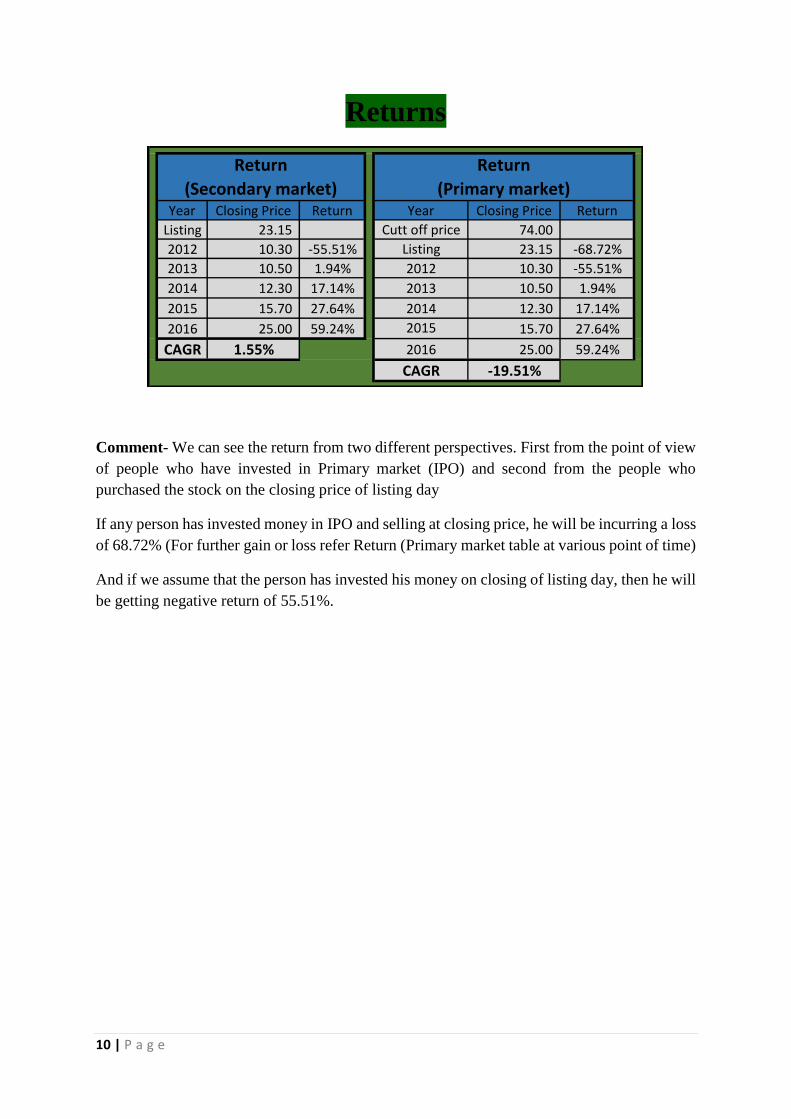
Returns
Comment- We can see the return from two different perspectives. First from the point of view
of people who have invested in Primary market (IPO) and second from the people who
purchased the stock on the closing price of listing day
If any person has invested money in IPO and selling at closing price, he will be incurring a loss
of 68.72% (For further gain or loss refer Return (Primary market table at various point of time)
And if we assume that the person has invested his money on closing of listing day, then he will
be getting negative return of 55.51%.
Year Closing Price Return Year Closing Price Return
Listing 23.15 Cutt off price 74.00
2012 10.30 -55.51% Listing 23.15 -68.72%
2013 10.50 1.94% 2012 10.30 -55.51%
2014 12.30 17.14% 2013 10.50 1.94%
2015 15.70 27.64% 2014 12.30 17.14%
2016 25.00 59.24% 2015 15.70 27.64%
CAGR 1.55% 2016 25.00 59.24%
CAGR -19.51%
Return
(Primary market)
Return
(Secondary market)
11 | P a g e
8. Conclusion If we see the company in a prima facie manner, then we can say that company is able to
implement their turnaround strategy successfully but actual situation is totally different.
If we rigorously analyse the company, we can see that major part of company’s revenue comes
from trading in stocks. But, As the company is not investment company, it is expected to
generate revenue from brokerage.
Company has invested the money in dead shares and also it is continuously incurring losses in
F&O trading. So, here we can interpret that company is high risky and we can see lack of
expertise in fund managers.
If we see company’s past track, then also we will see misrepresentations. When company went
for IPO, they shown their objective as expansion orientated. But they used most of the funds
for two purposes. First is for trading & investing in securities and second is for paying off their
liabilities. Which is not shown in their list of objectives.
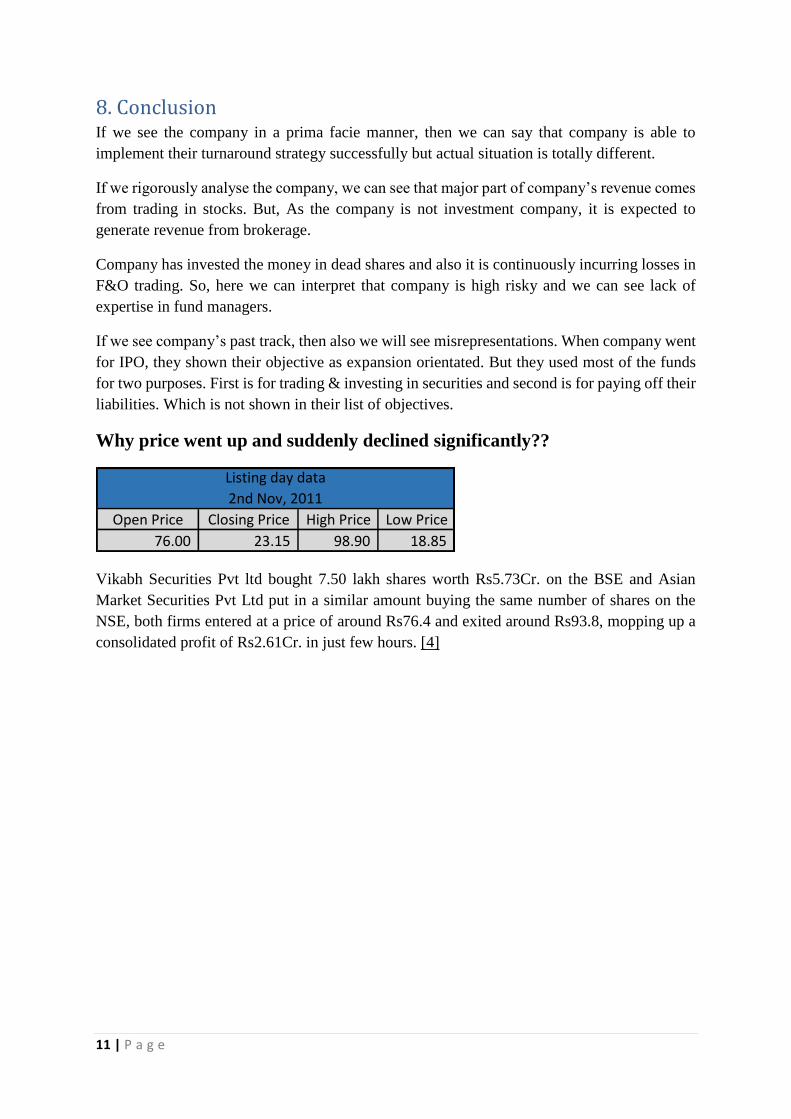
Why price went up and suddenly declined significantly??
Vikabh Securities Pvt ltd bought 7.50 lakh shares worth Rs5.73Cr. on the BSE and Asian
Market Securities Pvt Ltd put in a similar amount buying the same number of shares on the
NSE, both firms entered at a price of around Rs76.4 and exited around Rs93.8, mopping up a
consolidated profit of Rs2.61Cr. in just few hours. [4]
Open Price Closing Price High Price Low Price
76.00 23.15 98.90 18.85
Listing day data
2nd Nov, 2011