Embed Size (px)
Citation preview
8/8/2019 Indo Thai FTA
http://slidepdf.com/reader/full/indo-thai-fta 1/141
A Feasibility Study on A Free Trade Agreement
between India and Thailand
Dr. Ram Upendra Das*Dr. Somchai Ratanakomut**Dr. Sothitorn Mallikamas**
Prepared for
Joint Working GroupOn
India-Thailand Free Trade Agreement (Ministry of Commerce, Govt. of India
and
Ministry of Commerce, Govt. of Thailand)
December 2002
______________ * Research and Information System for the Non-Aligned and Other Developing Countries(RIS), New Delhi, India.** Faculty of Economics, Chulalongkorn University, Bangkok, Thailand.
8/8/2019 Indo Thai FTA
http://slidepdf.com/reader/full/indo-thai-fta 2/141
Acknowledgement
Authors are grateful for the insightful guidance that they received during the course of the study from V.R. Panchamukhi, L.K. Ponappa, Nagesh Kumar, S.S. Kapur,Kanissorn Navanugraha, A. Sajjanhar, Srirat Rastapana, Chana Kanaratanadilok, G.Ray,K.B.L. Mathur, J.C. Sharma, Vichai Maneesuwansin, A. Singh, K.C. Rout,Twaan Jaroenthai, Pithaya Boonying and R.S. Ratna. Authors would also like to thank G. Sidhu, P. Prapavong, U. Chittasevi, S. Tonggool and P. Wongmongkol, for their kindsupport.
Thanks are also due to J.P. Doonga for administrative support andBalwant Singh Bisht for secretarial assistance.
However, the usual disclaimer applies.
2
8/8/2019 Indo Thai FTA
http://slidepdf.com/reader/full/indo-thai-fta 3/141
Contents
Executive Summary
Chapter 1
Introduction
1.1. Background1.2. Scope and Structure of the Study1.3. Objectives of the Study1.4. Analytical and Methodological Issues
Chapter 2
India-Thailand Trade and Investment Relations
2.1. Indian Economy2.2. Thai Economy2.3. Overview of Bilateral Trade and Investment Relations2.4. India’s Exports to Thailand
2.4.1. Overview2.4.2. Merchandise Exports and Barriers : Key Sectors
2.5. Thailand’s Exports to India2.5.1. Overview2.5.2. Merchandise Exports and Barriers : Key Sectors
2.6. Investment Links Including Joint Ventures2.6.1. Indian Investment in Thailand2.6.2. Thai Investment in India2.6.3. Barriers to Bilateral Investment Flows
2.6.3.1. Indian Perspective2.6.3.2. Thai Perspective
2.7. Economic Cooperation2.7.1. Bilateral Cooperation2.7.2. Regional and Subregional Economic Cooperation
Chapter 3
Analytical and Methodological Issues
3.1. Analytical Framework 3.2 The Model and Assumptions3.3. The Macro Impact on India and Thailand3.4. Sectoral Impacts3.5. Impact not captured by the Model
3
8/8/2019 Indo Thai FTA
http://slidepdf.com/reader/full/indo-thai-fta 4/141
Chapter 4
Impact of Preferential Liberalisation under a Free Trade Agreement
4.1. Introduction4.2. Merchandise Trade: Impact and Potential Areas of Cooperation
4.2.1 Macroeconomic Impact under FTA: CGE Modelling Results4.2.2 Potential Areas of Trade Expansion4.2.3 Revenue Loss
4.3. Impact on Services Trade and Potential Areas of Trade Expansion4.3.14.3.2
Impact on Services TradePotential Areas of Services Trade Expansion
4.4. Investments and Private Sector Linkages
Chapter 5
Sectoral Analysis of the Impact of Preferential Liberalisation
5.1 Sectoral Impacts of FTA: Based on GTAP-CGE Analysis5.1.1 Sectoral Impacts: India5.1.2 Sectoral Impacts: Thailand
5.2. Impact on Select Sectors: Explorations at a Disaggregated Level
Chapter 6
Possible Benefits of Cooperation in Other Areas
6.1. Fisheries and Aqua culture6.2. Information, Communication and Space Technology6.3. Biotechnology6.4. Finance and Banking6.5. Tourism6.6. Infrastructure Development6.7. Healthcare Services6.8. Construction
Chapter 7
Recommended Architecture of India-Thailand Free Trade Agreement
7.1. Objectives and Principles
7.2. Scope and Coverage7.3. Rules of Origin7.4. Trade Facilitation7.5. Institutional Mechanism
Chapter 8
Conclusions
4
8/8/2019 Indo Thai FTA
http://slidepdf.com/reader/full/indo-thai-fta 5/141
Executive Summary
1. India and Thailand share age-old bonds of cultural affinity, commercial interests and
common perceptions on various issues. These geographically proximate neighbours need
to take advantages of the conducive setting or the context that is provided by the history
and geography between them for mutually beneficial economic cooperation.
Whether it is the economics of neighbourhood or the importance of cooperation in the
competitive global environment the economic logic suggests that both the countries must
strengthen their economic ties in the realms of trade, investment, technology and human
resources. The complementarities on different dimensions need to be exploited so as to
jointly take advantage of the globalisation process in a more effective and WTO-consistent manner.
2. In an effort to promote trade and investment cooperation between the two countries, a
Joint Working Group (JWG) was set up at the behest of the Prime Ministers of both the
countries for getting a Feasibility Study conducted on India-Thailand FTA. The First
JWG Meeting was held in New Delhi, India during April 2002. At this meeting, the JWG
adopted its Terms of Reference and finalized the broad structure of the feasibility study.
The meeting also agreed on a work programme. The present study is the outcome of this process, which has been deliberated upon extensively in subsequent three JWG meetings,
including the fourth and final one held at Bangkok on 22-24 December 2002.
3. The focus of the present study is to find out if the India-Thailand FTA is a feasible
proposition. Chapter 1 provides a brief introduction, including the background, scope and
objectives of the study. The prevailing trade and investment relations between India and
Thailand are analysed in Chapter 2. Chapter 3 dwells upon the analytical and
methodological issues underlying the study including the technical details of the
modelling exercise for assessing the impact of the FTA. Chapter 4 assesses the impact of
preferential liberalisation under the FTA at the macro level both with the help of a
computable general equilibrium (CGE) model and also through some other techniques
and its sectoral impacts are analysed in Chapter 5. The potential benefits of cooperation in
other sectors are analysed in Chapter 6. A broad architecture of the FTA is recommended
in Chapter 7. Chapter 8 provides an overview of the findings of the study.
5
8/8/2019 Indo Thai FTA
http://slidepdf.com/reader/full/indo-thai-fta 6/141
4. The study probes into the following central question: Is a Free Trade Agreement between
India and Thailand feasible? On the basis of a number of analytical criteria an answer to
this question has been sought. An FTA would be feasible if:
it enhances market access for both the countries in a mutually beneficial manner.
it results in cheaper import from the partner country which can help improve the
competitiveness of both domestic production and exports.
it promotes downstream production activities.
there are significant trade complementarities.
trade complementarities are not very high due to relatively less diversified export
structures and similarity in production structures, which in turn, provide the scope
for intra-industry trade. the potential for trade exists because of the possibility to trade with each other in
lower unit value items that are being exported by one country to the world but not
to the partner country and the partner country is importing those items from the
rest of the world but not from its counterpart and this results in significant costs of
non-cooperation.
due to the FTA, domestic sectors are not adversely affected in a significant
manner on account of import competition.
it does not entail significant output contraction in any of the two countries.
it does not have significant tariff revenue loss in different items.
5. India and Thailand are developing economies with both commonalties and differences in
their economic progress. The economic policy strategies adopted by them have made
them amenable to take advantage of global integration. In this context, possibilities of
bilateral economic cooperation especially in the form of an FTA are immense. It has also
been noticed that albeit the bilateral trade and investment linkages between the two
countries are quite low their dynamism in recent years is noteworthy. The relative
importance of each other in the trading space has been observed to be meagre which is
indicative of the fact that the potentials for greater trade linkages are yet to be tapped. In
terms of trade composition, significant scope for diversification in the bilateral trade
basket is noticed and it is in this context that the proposed FTA appears desirable, the
feasibility of which is assessed subsequently. In terms of the barriers to trade, it is
observed that countries face both tariffs as well as non-tariff barriers on their bilateral
trade.
6
8/8/2019 Indo Thai FTA
http://slidepdf.com/reader/full/indo-thai-fta 7/141
In the area of investment too, the bilateral linkages need strengthening and their sectoral
composition need to be broadened. In this regard, bridging information gap, removing
procedural bottlenecks and overcoming infrastructural constraints need to be addressed.
6. It is concluded in the Study that the FTA between India and Thailand is feasible, desirableand mutually beneficial. This understanding has been arrived at by assessing the macro
impact of the FTA with the help of a CGE modelling exercise using the GTAP
framework; identification and measurement of potentials of trade expansion on the basis
of analysing trade complementarity, production similarity, potential intra-industry trade,
costs of non-cooperation and the extent of revenue loss under the proposed free trade
regime; potentials of services trade and possibilities of investment expansion.
7. The broad highlights of the Study are as following:
First, the results of CGE modelling exercise have been supplemented with a
disaggregated level sectoral analysis in order to overcome the limitations of
different empirical approaches. It was found that the proposed FTA would result
in increased market access.
Second, FTA would improve production competitiveness in both countries.
Third, high potentials of trade cooperation were observed empirically in the
domain of intra-industry trade due to production similarities.
Fourth, there are immense potentials for maximising mutual benefits through
enhanced cooperation in trade in lower unit value items.
Fifth, implications of revenue loss were also analysed empirically and it was
found that the proposed FTA would not entail significant revenue losses. It was
also noted that the revenue losses were expected to be outweighed by significantly
larger gains in trade expansion, production, investment and overall development.
Sixth, it was also noted that there was rich potential for economic cooperation in
various identified areas like fisheries and aqua-culture, information,
communication and space technology, biotechnology, finance and banking,
tourism, healthcare, construction services and infrastructure development.
8. The Study also deals with the possible architecture of the proposed FTA and recommends
on its plausible objectives and principles; scope, rules of origin, trade facilitation and
institutional mechanism.
9. The overall conclusion of the Study is that the proposed FTA is desirable, feasible and
mutually beneficial.
7
8/8/2019 Indo Thai FTA
http://slidepdf.com/reader/full/indo-thai-fta 8/141
Chapter 1
Introduction
1.1 Background
India and Thailand share age-old bonds of cultural affinity, commercial interests and
common perceptions on various issues. These geographically proximate neighbours need to
take advantages of the conducive setting or the context that is provided by the history and
geography between them for mutually beneficial economic cooperation.
Whether it is the economics of neighbourhood or the importance of cooperation in the
competitive global environment the economic logic suggests that both the countries must
strengthen their economic ties in the realms of trade, investment, technology and human
resources. The complementarities on different dimensions need to be exploited so as to
jointly take advantage of the globalisation process in a more effective and WTO-consistent
manner.
India and Thailand are both considered as developing countries with significant
differences in geographical areas and population. India has the total land area more than 6
times larger than Thailand i.e. the total land area of India is 3,287,263 sq. km., whereas
Thailand has a total land area of 513,114.6 sq. km. According to the latest statistics, Indian
population is over1 billion while the population figure in Thailand is only about 60 Million.
Bilateral trade between India and Thailand is presently at a low level. Both imports
and exports between these two countries are small and mainly characterized by intermediate
products necessary for the production of final products. In the year 1990, the total bilateral
trade was about US Dollar 621 Million. By the year 2000, it increased to about US Dollar
1,169 Million.
In an effort to promote trade and investment cooperation between the two countries,
there were, recently, several state visits from Thailand. In July 2001, Thailand’s foreign
minister paid an official visit to India followed by two visits of Thailand’s Prime Minister
Mr. Thaksin Shinawatra in November 2001 and February 2002. After an initiation of the idea
to pursue the study on the feasibility of a Free Trade Agreement (FTA) by the Indian Prime
Minister Mr. Atal Bihari Vajpayee and the Thai Prime Minister the First Joint Working
Group (JWG) Meeting in New Delhi, India was held in April 2002. The Indian delegation
was led by Mr. S. S. Kapur, Joint Secretary, Department of Commerce, Government of India,
8
8/8/2019 Indo Thai FTA
http://slidepdf.com/reader/full/indo-thai-fta 9/141
and the Thai delegation was led by Ms. Srirat Rastapana, Deputy Director General,
Department of Business Economics, Ministry of Commerce, Government of Thailand. The
JWG Meeting agreed on getting a feasibility study conducted on the India-Thailand Free
Trade Agreement.The Second JWG Meeting was held in Petchburi, Thailand during 26-27 August,
2002. The Indian delegation was led by Mr. S. S. Kapur, Joint Secretary, Department of
Commerce, Government of India, and the Thai delegation was led by Mr. C.
Kanaratanadilok, Assistant Director General, Department of Business Economics, Ministry of
Commerce, Government of Thailand. During the Meeting the study was presented and
discussed in detail. The Indian and Thai drafts of some of the Chapters of the study were
merged. The research study teams were asked to continue their work by incorporating the
suggestions that had emerged during the Meeting.
The Third JWG Meeting was held in New Delhi, India during 13-14 November, 2002.
The Indian delegation was led by Mr. S. S. Kapur, Joint Secretary, Department of Commerce,
Government of India, and the Thai delegation was led by Mr. K. Navanugraha, Deputy
Permanent Secretary, Ministry of Commerce, Government of Thailand. In this Meeting the
complete study was presented and discussed chapter-by-chapter. The research teams were
mandated to finalise the study by taking into account the deliberations of the Meeting. The
Thai side proposed to launch negotiations on FTA Agreement and circulated a paper on
Thailand’s proposal to launch negotiations for Free Trade Agreement between Thailand and
India.
1.2 Scope and Structure of the Study
Against this background, the focus of the present study is to find out if the India-
Thailand FTA is a feasible proposition. Chapter 1 provides a brief introduction, including the
background, scope and objectives of the study. The prevailing trade and investment relations
between India and Thailand are analysed in Chapter 2. Chapter 3 dwells upon the analytical
and methodological issues underlying the study including the technical details of the
modelling exercise assessing the impact of the FTA. Chapter 4 assesses the impact of
preferential liberalisation under the FTA at the macro level both with the help of a
computable general equilibrium (CGE) model and also through some other techniques and its
sectoral impacts are analysed in Chapter 5. The potential benefits of cooperation in other
sectors are analysed in Chapter 6. The architecture of the FTA is recommended in Chapter 7.
Chapter 8 provides an overview of the broad conclusions of the study
9
8/8/2019 Indo Thai FTA
http://slidepdf.com/reader/full/indo-thai-fta 10/141
1.3 Objectives of the study
The study has three main objectives:
a. To analyze and assess the benefits and costs both quantitatively and qualitatively of entering into a preferential and bilateral free trade agreement consistent with, and
supportive of, the multilateral trading system.
b. To explore not only preferential trade, but also a number of other potential areas to
develop closer economic relations.
c. To render possible and suitable suggestions on the architecture of the FTA.
More specifically, the study probes into the following central question: Is a Free
Trade Agreement between India and Thailand Feasible? On the basis of a number of
analytical criteria an answer to this question has been sought. A FTA would be feasible if:
it enhances market access for both the countries in a mutually beneficial manner.
it results in cheaper import from the partner country which can help improve the
competitiveness of both domestic production and exports.
it promotes downstream production activities.
there are significant trade complementarities.
trade complementarities are not very high due to relatively less diversified export
structures and similarity in production structures, which in turn, provide the scope
for intra-industry trade.
the potential for trade exists because of the possibility to trade with each other in
lower unit value items that are being exported by one country to the world but not
to the partner country and the partner country is importing those items from the
rest of the world but not from its counterpart and this results in significant costs of
non-cooperation.
due to the FTA, domestic sectors are not adversely affected in a significant
manner on account of cheaper imports.
it does not entail significant output contraction in any of the two countries.
it does not result in significant revenue losses.
Criteria such as above need to be probed in order to conclude as to whether the FTA
between India and Thailand is feasible, desirable and mutually beneficial. The present study
10
8/8/2019 Indo Thai FTA
http://slidepdf.com/reader/full/indo-thai-fta 11/141
seeks to explore these dimensions both analytically and empirically in the subsequent
chapters.
1.4 Analytical and Methodological IssuesThe study on exploring the prospects of India-Thailand FTA needs to posit ‘ freeing of
trade’ in a proper analytical perspective. It also should recognise the limitations of various
techniques that are applied to assess the impact of tariff liberalisation. Therefore, an attempt
is made here to understand the implications of reduction of trade barriers in the backdrop of
certain analytical and methodological issues. This has been undertaken on the following
dimensions viz. (i) trade as an instrument of development (ii) trade facilitation in conjunction
with trade liberalisation (iii) role of rules of origin under FTA (iv) assessing the implications
of trade liberalisation with the help of Computable General Equilibrium (CGE) modelling
and (v) exploiting trade complementarities. These are discussed and analysed in Chapter 3 in
detail.
Against this background, the Study examines the feasibility of the proposed India-
Thailand Free Trade Agreement as per the chapter-scheme outlined above.
11
8/8/2019 Indo Thai FTA
http://slidepdf.com/reader/full/indo-thai-fta 12/141
Chapter 2
India-Thailand Trade and Investment Relations
Introduction
This Chapter presents an overview of the Indian and the Thai economy as well as of
bilateral trade and investment relations between India and Thailand. It further examines the
existing trade linkages between India and Thailand in a greater detail including an analysis of
the tariff and non-tariff barriers that the exports of each country face in the partner country.
Similarly, investment links between the countries under consideration are analysed and some
barriers to investment in the countries concerned are highlighted.
2.1 Indian Economy
A snapshot view of the macro indicators present a moderate picture of the Indian
economy. India’s GDP has been increasing over the last few decades. It has recorded an
annual average growth rate of above 5 percent approximately during the last decade (Table
1). However, its Gross National Income per capita which stood at around US Dollar 450 in
year 2000 is considerably lower than Thailand’s Gross National Income per capita which was
US Dollar 2000 in the same year (World Bank, 2002).
As for the structure of GDP, the share of agriculture, which used to be the highest in
earlier decades, has fallen tremendously and its place has been taken over by the services
sector. In recent years, services sector has occupied almost half of the GDP . Manufacturing
and agriculture sectors share the rest, almost equally, at the present juncture (Table 2). The
services sector includes trade, transport, storage and communication; financing, insurance,
real estate & business services and public administration, defence & other services.
India has been lacking in terms of achieving high savings and investment ratios as
compared to other developing countries of the South-east Asian region. India’s savings and
investment have stood at 23.4 percent (2000-01) and 24 percent (2000-01), respectively.
Inflation rate has come down in recent times and has touched a low of 1.3 percent in
2001-02. However, fiscal deficit as a percentage of GDP stood at 5.1 percent (2001-02).
More recently, exports have been growing at a faster rate than imports. Current account
balance as a percentage of GDP stood at 0.5 percent (2000-01). The debt-service ratio has
declined from 35.3 percent in 1990-91 to 17.1 in 2000-01.
12
8/8/2019 Indo Thai FTA
http://slidepdf.com/reader/full/indo-thai-fta 13/141
Policy Framework
In recent times, Indian economy has embarked upon trade and investment
liberalisation. Indicators of these are the falling tariff and non-tariff barriers and enhancementin the limits for the participation of the foreign direct investment in the economy. These
liberal external policy measures have been accompanied by various internal liberalisation
measures, which together have resulted in procedural simplification. Foreign exchange
regime has also undergone significant changes with more liberal norms set in place to
facilitate different economic activities and external economic linkages. However, Indian
policy-making exercise has also been characterised by a cautious approach towards issues
like capital account convertibility. A profile of the last year’s economic reforms package
provides an idea about the prevailing direction of economic policy making process in India
and it amply demonstrates that the policy regime is quite conducive for more intensive
integration with global economy. It is in this context that the FTA between India and
Thailand needs to be posited.
Economic Reforms in 2001-2002
During the last year the Indian economy continued the economic reforms process by
initiating a set of wide-ranging measures. The range and content of these measures
demonstrate the commitment of the policy makers in India to put the economy on a high
growth and development path and also to make Indian economy capable of integrating with
the global economy.
The proposed FTA between India and Thailand needs to be approached with the
understanding that due to the recent economic reforms, Indian economy has become quite
amenable to more intensive economic integration with a country like Thailand. This fact is
substantiated by highlighting the major features of economic reforms pertaining to 2001-02that are summarized below (Government of India, 2002):
I. Structural Reform Initiatives
Some of the measures that were initiated last year have addressed the imperatives of
structural reforms in the Indian economy. These include reduction in interest rates;
disinvestment of government equity in select public sector undertakings like VSNL, IBP,
CMC, HTL, PPL, BALCO and certain ITDC hotels; removal of licensing requirements and
restrictions on storage and movement of wheat, rice, sugar, edible oilseeds and edible oils;
13
8/8/2019 Indo Thai FTA
http://slidepdf.com/reader/full/indo-thai-fta 14/141
dereservation of fourteen items from the list of items reserved for exclusive manufacture by
the small scale sector etc.
II. Fiscal ReformsIn the area of fiscal policy, the following measures were initiated: downsizing some of
the departments; rationalisation of excise duty structure by having only a single rate of 16
percent; reduction of peak level of customs duty from 38.5 percent to 35 percent with the
abolition of surcharge on customs duty; exemption from antidumping and safeguard duties
for goods imported by 100 percent EOUs and units in FTZs and SEZs etc.
III. Infrastructure
For upgrading the infrastructural facilities the government adopted the following
measures which are important from the point of view of FDI inflows as infrastructure is a
major determinant of it: rationalisation and extension of tax-holidays for infrastructure
projects to 15 to 20 years; extension of five-year tax holiday and 30 percent deduction of
profits for the next five years to internet service providers and broadband networks;
enhancement of budgetary allocations for the Pradhan Mantri Gram Sadak Yojana (PMGSY)
for speeding up connectivity of rural roads; extension of PMGY scheme to cover rural
electrification; launching of National Highway Development Project etc.
IV. Capital and Money Markets
Capital and Money Markets were characterised by the introduction of trading in index
options, options on individual securities and stock futures. The aggregate limit for FII
portfolio investment was enhanced to 49 percent and subsequently upto sectoral ceiling.
V. External Sector
Within the ambit of external sector, trade liberalisation and promotion measures
included removal of Quantitative Restrictions (QRs) on Balance-of-Payments (BOPs)
grounds by dismantling restrictions on the remaining 715 items. Agri-economic Zones were
set up for promoting agricultural exports on the basis of specific products and geographical
areas. A Market Access Initiative (MAI) scheme was also introduced to boost exports.
Moreover, interest rates on export credit were rationalised A special financial package was
introduced for large value exports (annual exports of over Rs. 100 crore) of selected products.
14
8/8/2019 Indo Thai FTA
http://slidepdf.com/reader/full/indo-thai-fta 15/141
On the capital account too, steps to integrate the economy with the rest of the world
were visible. FDI up to 49 percent from all sources were permitted in the private banking
sector. In addition, 100 percent FDI was permitted for B-to-B e-commerce, courier services,
oil-refining, hotel and tourism sector, drugs and pharmaceuticals, Mass Rapid TransportSystems including associated commercial development of real estate. Foreign investors were
permitted to set up 100 percent operating subsidiaries without the condition of disinvesting a
minimum of 25 percent equity to Indian entities. Offshore Venture Capital Funds/Companies
were allowed to invest in domestic venture capital undertakings. FDI up to 100 percent was
permitted with prior approval of the Government for development of integrated townships.
It is amply clear that the policy making process in India is quite in tune with the
global realities and it has made the economy conducive for more intensive integration with
the global and regional economies. This also demonstrates that the proposed FTA with
Thailand is feasible at least on the ground that, at the first stage, the macro policy regime is
amenable for it and it would facilitate the setting up of the FTA.
Overall, the economic fundamentals of the economy are strong and it is on the
threshold of taking advantages of the global integration process. This has positive
implications for the proposed bilateral FTA between India and Thailand.
2.2 Thai Economy
Thai economy could be described as a developing country with relatively high degree
of openness. Starting in early 1960s, industrialisation in Thailand has transformed the
agriculture-dependent economy into an economy with diversified manufacturing production
bases and high degrees of linkages with the international market. The industrialisation policy
started with the strategy of import substitution or inward looking policy and later turned to
emphasise more on export market.
During the last ten years, it is observed that the share of agriculture in total GNP has
been a little lower than 10 percent (except for the year 1998 when the share jumped to about
11.16 percent). For the rest of period, the share has been stable between 8.66 percent and 9.72
percent (Table 3). In 1993, agricultural production was US Dollar 10,824 Million whereas the
total GNP for Thailand was US Dollar 123,195 Million. In 2001, the figure for agricultural
production and total GNP were US Dollar 9,806 Million and US Dollar 113,272 Million,
respectively.
Because of Thailand’s long experience in industrialisation, the main economic
activities are in the manufacturing sector. At present the share of manufacturing production is
15
8/8/2019 Indo Thai FTA
http://slidepdf.com/reader/full/indo-thai-fta 16/141
more than 30 percent of the total GNP. Combination of both agriculture and manufacturing
production accounts for less than 50 percent of the GNP.
The services sector is now playing an important role in the Thai economy with the
total share higher than 50 percent of GNP. Some of the important sub-sectors in terms of GNP contribution are wholesale and retail trade, transport and communication, construction,
financial sector, public administration and education. It could be observed that after the crisis
the share of construction and finance has become significantly smaller.
Before the financial crisis, the Thai economy grew at a high rate, for example, in
1994, 1995 and 1996, the GDP rate of growth was 9.0 percent, 9.2 percent and 5.9 percent,
respectively. The growth became negative during 1997 and 1998. In 1999, the economy
started to register positive growth again, however, the positive rate dropped in 2001.
Thai economy has slowed down in 2001, due mainly to the adverse impact of global
economic slump on the external sector. GDP growth in 2001 was 1.8 percent - decreasing
from 4.4 percent and 4.6 percent in 1999 and 2000, respectively. Part of the contraction in
foreign demand was partially offset by domestic stimulus from the government sector and
measures to boost private spending. 1
During its currency and financial crisis in 1997, Thailand was regarded as the origin
of the contagious effect of the crisis to several other Asian economies. “Tom Yam Kung
disease” became well known to economists around the world. It took sometime before Thai
Government decided to change the macroeconomic policy to pull the economy out of the
recession. The government turned to expansionary fiscal and monetary policy while
maintaining the exchange rate at about 38 Baht a US Dollar which later drifted to about 44
Baht a dollar. As a result of exchange rate depreciation, international reserve soon came back
to about the same level as before the crisis. However, it cannot be concluded that the Thai
economy has fully recovered from the crisis.
Due to the crisis, the Thai Baht had significantly depreciated against the US Dollar
and the currencies of other developed trading partners. This created some disruption in
international trade. Total imports that used to be higher than total exports dropped. Since
1998, Thailand’s balance of trade account has been in surplus.
Thailand has gone through substantial reforms in many areas such as banking and
finance, debt restructuring, social safety net support, tax incentives and tax reform, legal
amendment, public enterprise privatization and foreign ownership requirement.
1 Bank of Thailand Report on Economic Condition in 2001 and Outlook for 2002.
16
8/8/2019 Indo Thai FTA
http://slidepdf.com/reader/full/indo-thai-fta 17/141
It seems that Thailand’s economic strategy has been to engage more intensely with
the global market. In order to perform in the world market the Thai economy has to succeed
in the process of adjustments. Another economic strategy could be to diversify in terms of
markets and suppliers across the globe as well as within the Asian region in order to competein the global market. It is in this context, that the Thailand-India economic cooperation needs
to be viewed.
2.3 Overview of Bilateral Trade and Investment Relations
The bilateral trade and investment linkages between India and Thailand have shown
dynamism in recent years. Nevertheless, the linkages are quite lesser than their potential
when analysed either in absolute terms or in relation to their relative importance for the other.
It has been observed that both the countries are not very important trade and
investment partners for each other as of today. However, our analysis, especially in Chapter
3, suggests that there does exist tremendous potential to expand the bilateral economic
linkages.
2.4 India’s Exports to Thailand
2.4.1 Overview
Export Dynamism
India’s exports to Thailand have displayed growth dynamism in recent years. It has
increased from US Dollar 201 Million (1990) to US Dollar 547 Million (2000) – registering a
172 percent increase over the decade. The average annual growth rate has been 16 percent
over the decade, 28.9 percent during 1998-99, and 16.88 percent during 1999-2000 (Table 4).
As imports have been lower than exports, India has maintained a situation of trade surplus
vis-à-vis Thailand.
Relative Importance as Export Destination
The relative importance of each other in the trading space is meagre as noticed from
Table 4. Thailand as a destination for India’s exports barely accounts for over 1 percent of
India’s total exports. Similar is the situation of India from the point of view of Thailand’s
export destination. Thailand as a source of India’s imports and India as a source of Thailand’s
imports display similar relative importance for each other. This is indicative of the fact that
the potentials for greater trade linkages are yet to be tapped.
17
8/8/2019 Indo Thai FTA
http://slidepdf.com/reader/full/indo-thai-fta 18/141
Composition of Exports
India’s principal exports to Thailand are jewellery, chemicals, products extracted from
vegetable oils, iron and steel, fresh shrimps and prawns, pharmaceutical products, metals
waste and scrap, lubricating oil for hydraulic brake etc. It is evident from the export basket
that a fresh policy impetus needs to be provided for boosting India’s exports in sectors such
as textiles and clothing, engineering goods, paper products, processed food, metal
manufactures, etc. Even the export levels of major items mentioned above also need to be
enhanced (see Tables 5 and 6) by setting in place an appropriate policy regime and in this
context the proposed FTA could serve as a catalyst to the already displayed India’s export
dynamism vis-à-vis Thailand. Its feasibility is analysed in subsequent chapters. From the
observations such as above, what comes out is that it is desirable.
2.4.2 Merchandise Exports and Barriers: Key Sectors
Indian exports are facing both tariff and non-tariff barriers. As revealed by Table 7 the
import-weighted average tariff rates in Thailand for different sectors at HS 6-digit level was
on an average 9.43 percent. Commodities that face high tariff include crops n.e.c. (52.07
percent), fishing (38 percent), poultry and seafood (31.28 percent), wearing apparel (27.65
percent), oil seeds (20.50 percent) and veg., fruits and nuts (17.78 percent). This could be
one of the reasons for the low levels of exports from India to Thailand. This is supported by
the fact that there are several product groups in which Indian exports are significant and
Thailand’s tariff rates are high (Mehta, 2002). These product groups are identified as fish and
crustaceans (Chap. 3); edible fruit and nuts (Chap. 8); coffee, tea, spices etc (Chap. 9); articles
of apparel and clothing accessories (Chap. 62); etc. However, there are other reasons as well
like the non-tariff barriers and information gap as highlighted in this study that also could be
hindering India’s exports growth.
In this context, non-tariff barriers also need to be addressed. This builds a case for
closer cooperation between India and Thailand on harmonisation of health and other
standards, especially health standards as mere tariff liberalisation under the FTA might not be
sufficient to engender export growth. India and Thailand could enter into an agreement for
this as part of the FTA. Such an initiative has an added merit in the context of WTO
Agreements on Technical Barriers to Trade and the SPS Agreement. Bilateral cooperation
could help evolving joint positions at the WTO.
It has been highlighted that Indian exports, especially in food and fishery products are
facing stiff barriers in the developed countries on account of WTO agreements. The problem
18
8/8/2019 Indo Thai FTA
http://slidepdf.com/reader/full/indo-thai-fta 19/141
is compounded as the export consignments are not only rejected on the grounds of non-
conformity to standards but are also being destroyed. Such a situation could also be true for
Thailand (Sareen, 2002). Therefore, one of the ways in which the issue of liberalisation of
non-tariff barriers could be tackled is through cooperation on various WTO and non –WTOagreements relating to standards. It also throws open another dimension of cooperation
whereby Indian institution like the Export Inspection Council (EIC) could enter into an
agreement with its Thai counterpart in order to harmonise the standards of the two countries
for exporting activities.
Apart from the tariff and non-tariff barriers Indian exports also face tremendous
constraints in terms of inadequate information flows, lack of adequate trade finance facilities,
procedural delays, etc. For instance, it is worth highlighting that not only that there is a lack
of information about trade partners but the quality of information available is also quite poor.
Hence, there is an urgent need to evolve a grading/rating system for exporters/importers so as
to improve the reliability of trade partners.
Thus, a comprehensive view of trade barriers needs to be taken in the proposed FTA
to augment export levels significantly vis-à-vis Thailand.
2.5 Thailand’s Exports to India
2.5.1 Overview
Export Dynamism
Thailand’s exports to India have displayed growth dynamism in recent years. In fact
they have been more dynamic than India’s exports to Thailand. It has increased from US
Dollar 63 Million (1991) to US Dollar 566 Million (2000) – registering a 798 percent
increase over the decade in contrast to India’s figure of 172 percent during 1990-2000. The
annual growth rate has been 57 percent during 1998-99, and 27 percent during 1999-2000
(Table 4). As imports have been more than exports, Thailand has maintained a situation of
trade deficit vis-à-vis India.
Relative Importance as Export Destination
The relative importance of each other in the trading space is meagre as noticed from
Table 4. India as a destination for Thailand’s exports accounts for less than 1 percent of
Thailand’s’s total exports. The situation of Thailand from the point of view of India’s export
19
8/8/2019 Indo Thai FTA
http://slidepdf.com/reader/full/indo-thai-fta 20/141
destination is no different as highlighted earlier. India as a source of Thailand’s imports
displays similar relative importance for Thailand. The redeeming feature is that although the
bilateral trade between India and Thailand is rather small it has been continuously expanding
at a relatively high rate. This is somewhat indicative of the fact that the potentials for greater
trade linkages are yet to be tapped – an aspect which has been analysed in subsequent
Chapters.
Composition of Exports
Thailand’s principal exports to India are computers and components; automobiles and
auto parts; synthetic fibres; iron and steel products; textiles; chemicals; rubber and rubber
products; gems and jewellery. However, their volume is still quite low and requires policy
attention for further augmentation as well as diversification.
2.5.2 Merchandise Exports and Barriers: Key Sectors
India’s import-weighted average tariff rate imposed on the imports from Thailand is
24.63 percent. These tariff rates are high in most sectors Table 7. Thailand’s commodities
that face high import tariffs include forestry (45 percent), mineral products n.e.c. (42.03
percent), sugar (40.92 percent), oil seeds (40 percent), textiles (38.62 percent) and motor
vehicles and parts (34.94 percent). At present some other categories of Thailand’s exports are
facing high Indian trade barriers, namely, food and other agricultural products including meat
products, rice, wheat, maize, copra, coconut oil, sugar; carbon black; chemicals; rubber and
rubber products; textile; second hand capital goods; second hand vehicles, etc.
In this context, the issue of non-tariff barriers needs to be tackled.
2.6 Investment Links including Joint Ventures
Just as in the case of trade, the investment links also between India and Thailand have
remained far below their potentials and a policy regime addressing this issue could provide an
impetus to bilateral investment flows. A brief profile of the two-way investment links is
given below.
2.6.1 Indian Investment in Thailand
Thailand has remained, in a relative sense, an important investment destination for
Indian joint ventures in the ASEAN region (Table 8) but it has not been a significant
20
8/8/2019 Indo Thai FTA
http://slidepdf.com/reader/full/indo-thai-fta 21/141
destination in India’s total joint ventures (JVs) abroad. In the case of Indian wholly-owned
subsidiaries (WOS) in Thailand the present scenario is disappointing (Table 9). There is
hardly any Indian presence in Thailand in terms of WOS. Therefore, steps need to be taken so
as to augment Indian joint ventures and wholly-owned subsidiaries in Thailand. One such
step could be to liberalise trade on a fast track basis in items that are produced with the help
of Indian JVs or WOS in Thailand.
Three observations could be made on the nature of Indian investments in Thailand.
First, the number of Indian investment projects has not picked up in recent times. Second,
Indian investment in absolute terms has fallen since 1998 (Table 10). Third, the shares of
Indian and Thai investments in Indian projects have also remained stagnant in recent years.
In terms of its sectoral composition Indian investments have been rather concentrated
mainly in manufacturing sector (Table11). In the services sector its presence has been almost
insignificant. Therefore, efforts are required to diversify the Indian investment in Thailand.
The major Indian groups who have invested in Thailand are the Aditya Birla Group,
Ballarpur Industries, Baroda Rayon Group, Usha Martin Industries, Ranbaxy Laboratories,
Lupin Laboratories and Indo Rama, although some have since withdrawn (e.g. Ballarpur). At
present, there are 26 Indian joint ventures operating in Thailand of which two Indian
companies viz. NIIT and APTECH have started their operations more recently in software
development and computer education. The potential areas for Indian investment in Thailand
are IT services and software, pharmaceuticals, herbal based medicine and cosmetics, dairy
development and products, manufacturing of machine tools, and iron and steel products,
human resource development etc. (Embassy of India, 2002).
2.6.2 Thai Investment in India
As for Thailand’s investment in India the existing scenario presents a dismal picture.
During the period 1991-2001 Thailand accounted for a mere 0.01 percent of India’s total
investment space (Table 12). The number of foreign collaboration approvals was 112 of
which 38 were technology collaborations and 74 had foreign direct investment. The total FDI
approvals from Thailand between 1991 to May 2002 were US Dollar 782.7 Million. Thailand
ranked eighteenth among the foreign countries and third among ASEAN countries in terms of
investment approvals in the period 1991 to May 2002 (Embassy of India, 2002).
21
8/8/2019 Indo Thai FTA
http://slidepdf.com/reader/full/indo-thai-fta 22/141
From Table 13 it is discernible that Thai investment in India has been falling steeply
in recent years. This needs to be examined as investments from other countries have been
taking place in India. Perhaps it is the effect of the Thai crisis and it is expected that it will
find its optimum level in due course. In terms of sectoral distribution of Thai investments it isobserved that it is quite concentrated (Table 14). In sectors such as minerals and ceramics and
chemicals the Thai investment presence in India is nil. The major sectors in which Thai
investment in India has been approved are telecom, tourism, food processing, chemicals and
electrical equipment as their shares in total FDI approved have been 54, 25, 15, 4, and 1
percent, respectively.
However, some policy measures in the case of Indian investment in Thailand need to
be applied in this case as well and they are expected to provide an impetus to FDI from
Thailand in India. In addition, barriers to investment flows also need to be addressed.
2.6.3 Barriers to Bilateral Investment Flows
Investment flows are often restricted due to various barriers, of which some are in the
domain of policy and others relate to the level of development itself. Some of these barriers
are mentioned below.
2.6.3.1 Indian Perspective
One major constraint coming in the way of Indian investors is in terms of information
gap regarding policy guidelines, potential sectors, prospective collaborators, etc. Indian
investors find it difficult to locate a reliable counterpart. Procedural bottlenecks also act as
barriers. Recruitment of staff in Thailand has reportedly also not been smooth. In our view
some of the trade liberalisation measures and rules of origin could provide a boost to Indian
investments in Thailand.
Similarly, despite the fact that Indian investment climate has become more liberal of
late, procedural hurdles even in the case of automatic routes have acted as major barriers.
Information gap acts as a constraint for Thailand’s investments in India too. However, it is
worth mentioning that infrastructural bottlenecks have proved to be the main constraint in
India in terms of attracting FDI from Thailand. Therefore, steps could be taken to facilitate
Thai investment in the infrastructure sector itself.
2.6.3.2 Thai Perspective
22
8/8/2019 Indo Thai FTA
http://slidepdf.com/reader/full/indo-thai-fta 23/141
There are some investment- barriers that need to be eliminated to facilitate foreign
investments from Thailand to India that are enlisted below:
(a) Lack of standardised procedures: Due to lack of standardised procedures, on certain
occasions, different interpretations of rules and procedures occur. This gives rise to
procedural delays.
(b) Lack of intra-and inter-state harmonisation of rules: India is divided into different States
and each state has its own authority to introduce investment promotion regimes. Such a
situation often results in possibilities of double taxation.
(c) Difficulty in loan approval for foreign projects: Procedural complexities and lack of
standardised banking norms hinder approval of loans for foreign projects.
(d) Paucity of adequate information exchange: The Office of the Board of Investment of
Thailand has launched a joint venture program, which focuses on facilitating foreign
investments seeking Thai joint venture partners. Through this programme, not even a
single joint venture between Thailand and India has been reported till now.
One important policy step to address investment barriers is reflected in the fact that
both countries have agreed to set up a Joint Venture Centre. This is supposed to facilitate
commercial and investment tie-ups between Thailand and India, especially in the areas of
road construction, tourism, food processing and other areas of interests (Embassy of India,
2002).
2.7 Economic Cooperation
Economic cooperation has emerged as an important modality in the age of heightened
competition. It can be at various levels that are not mutually exclusive. At one end of the
spectrum is multilateral economic cooperation like the WTO and at the other end is the
bilateral economic cooperation with regional and subregional cooperation mechanisms falling
in between.
India and Thailand interact with each other at all the levels of economic cooperation.
A profile of these interactions is presented below.
2.7.1 Bilateral Cooperation
Economic relations between Thailand and India expanded during the past decade. The
trend towards globalization, the liberalization of the Indian economy, and Thailand’s export-
23
8/8/2019 Indo Thai FTA
http://slidepdf.com/reader/full/indo-thai-fta 24/141
oriented development strategy helped open up new economic opportunities during the first
half of the 1990s. During the latter half of the decade, convergence of the “Look East” and
“Look West” policies of India and Thailand, respectively also set the scene for the emergence
of regional cooperation.
To strengthen the cooperation process between India and Thailand several high level
mutual visits have taken place in both the countries. HRH Crown Prince Maha
Vajiralongkorn visited India in April 1992 for 15 days and again for four days in December
1998. HRH Princess Maha Chakri Sirindhorn visited India in March 1987 for 17 days
followed by a visit to the Andaman and Nicobar Islands in December, 1996, becoming the
first foreign dignitary to have been invited to visit these islands. She paid private visits to
Kushinagar on March 30, 2001 and to New Delhi/Rajasthan during April 2-13, 2001.
Former Indian Prime Minister Mr. P.V. Narasimha Rao’s visit to Thailand in April
1993 set the stage for a substantive consolidation of bilateral relations.
Dr. Thaksin Shinawatra, Prime Minister of Thailand, paid a state visit to India during 26-29
November 2001. He and the Indian Prime Minister Mr. A. B. Vajpayee mooted the idea of a
Joint Working Group (JWG) to study the feasibility of India–Thailand bilateral FTA. He
again paid a one-day working visit to New Delhi on 1st February 2002 as a follow up on
various decisions taken during his November visit to boost bilateral cooperation. Morerecently, in November 2002, Indian Prime Minister Mr. A. B. Vajpayee visited Thailand and
reinforced the bilateral ties and also emphasised the need for exploring the possibilities of the
bilateral FTA.
A joint commission for Bilateral Cooperation at the level of Foreign Ministers was
established in 1989 and since then 3 meetings have already taken place, the last one in
January 1996, for which the External Affairs Minister, Mr. Pranab Mukerjee visited
Bangkok. The Thai delegation was led by the Foreign Minister M.R. Kasem S. Kasemsri.
The next meeting is to be held in New Delhi soon (Embassy of India, 2002).
Foreign Secretary-level consultations took place in Bangkok in June 1996 when
Mr. K. Raghunath, the then Secretary (East) led the Indian delegation. The Thai delegation
was led by the Permanent Secretary Mr. M.R. Thep Devakula. Seventh round of
consultations were held in New Delhi on 23rd November 2001 in which the Thai delegation
was led by Dr. Tej Bunnag, Permanent Secretary and the Indian delegation was headed by
Mr. Shashank, Secretary (ER).
24
8/8/2019 Indo Thai FTA
http://slidepdf.com/reader/full/indo-thai-fta 25/141
The India-Thailand Joint Trade Committee (JTC), set up in 1986, is the official forum
for discussing trade-related problems and issues. The Joint Business Council, chaired
alternatively by the Federation of Indian Chambers of Commerce and Industry (FICCI) and
the Board of Trade of Thailand (BOT), continues to work together to promote dialogue
between the two business communities.
Bilateral Agreements
India and Thailand have been interacting intensively on various dimensions. A
modest programme of bilateral cooperation in the field of science and technology has been in
existence in the form of collaboration programme between CSIR-TISTR (Council of
Scientific and Industrial Research-Thailand Institute of Scientific and Technology Research).
A project-oriented plan is being implemented. A working programme has been signed in
February 1997 between CSIR and TISTR during a visit to India by the Governor of TISTR.
The dairy sector has also been identified as offering promising possibilities of
mutually beneficial cooperation. 35 Thai farmers, experts and officials from the dairy sector
have recently visited India with the invitation of the National Dairy Development Board
(NDDB). Collaboration also exists with the Asian Institute of Technology, Bangkok. The
Electronics Design Laboratory (EDL) was set up at Chulalongkorn University, Bangkok with
the Government of India assistance.
Some of the important bilateral agreements between the two countries are enlisted
below.
1. An Agreement regarding establishing a Joint Commission was signed in March 1989.
Three meetings, at Foreign Minister level, have since been held.
2. Bilateral Air Services Agreement was concluded in 1969, although Air India had been
operating regular flights as early as 1954.
3. A Cultural Agreement was signed in 1977.
4. An Agreement on the De-Limitation of the Sea Bed Boundary between the two
countries in the Andaman Sea was signed on June 22, 1978.
5. An Agreement on the De-Limitation of the Sea Bed Boundary between India,
Thailand, Myanmar tri-junction point 7 in the Andaman Sea was signed on October
27, 1993.
6. A Convention of Avoidance of Double Taxation was concluded in March 1985.
7. A Joint Trade Committee was established in 1985. Eight meetings have since been
held.
25
8/8/2019 Indo Thai FTA
http://slidepdf.com/reader/full/indo-thai-fta 26/141
8. An Agreement setting up a Joint Business Council was signed in 1989. Two meetings
have since been held.
9. A Memorandum of Understanding on Co-operation between the Indian Council for
Cultural Relations and International Studies Centre of Thailand was signed inSeptember 1994.
10. Agreement on Peaceful Uses of Nuclear Energy, signed in 2000.
11. Bilateral Investment Promotion and Protection Agreement (BIPPA) signed July 2000,
ratified (and effective) July 2001.
12. MOU on Cooperation on Information Technology and Services, signed November
2001.
13. Agreement on Cooperation in the Exploration and Use of Outer Space for Peaceful
Purposes, signed February 2002.
14. Agreement on Scientific, Technical and Environmental Cooperation, and Transfer of
Technology, signed February 2002.
15. A Memorandum of Understanding on Agricultural Cooperation is at the final stage of
negotiations (Embassy of India, 2002).
16. An Agreement on Cooperation in Tourism is under discussion (Embassy of India,
2002).
2.7.2 Regional and Subregional Economic Cooperation
Geographical proximity is an important determinant of regional and subregional
cooperation. India and Thailand are members of intra-regional groupings such as the SAARC
and ASEAN. It was not until the latter half of the 1990s that the inter-regional initiatives
were undertaken. This process began with the formation of BIMST-EC, the Mekong Ganga
Cooperation (MGC), and the Indian Ocean Rim Association for Regional Cooperation (IOR-
ARC). Meanwhile, ASEAN-India relations had already begun at a sectoral level in 1992.
These processes of economic cooperation are briefly discussed below.
BIMST-EC
The Bangladesh-India-Sri Lanka-Thailand Economic Cooperation (BIST-EC)
Declaration was signed in June 1997. By December 1997, Myanmar was also included in the
grouping which became BIMST-EC. The objective of this grouping is to foster social andeconomic development for member countries by promoting cooperation and mutual
26
8/8/2019 Indo Thai FTA
http://slidepdf.com/reader/full/indo-thai-fta 27/141
assistance in trade, agriculture, industry, transportation and infrastructure. The BIMST-EC
mechanism consists of senior officials’ and ministerial meetings; a separate economic senior
officials and ministers meetings overseeing economic issues; and working groups to direct
the implementation in each sector of cooperation. International organizations such as the
ESCAP and the ADB also provide financial and technical inputs.
At the First meeting of Economic/Trade Ministers of BIMST-EC held in Bangkok in
August, 1998, it was agreed that BIMST-EC should aim and strive to develop into a Free
Trade Agreement, and should focus on activities that facilitate trade, increase investment and
promote technical cooperation among member countries.
The Second Trade Ministers meeting held on 26-27 April, 2000 in New Delhi decided
to constitute an Inter-Governmental Group consisting of officials dealing with international
trade to prepare a concept paper on the possible approaches towards a Free Trade
Arrangement in BIMST-EC region. The First Meeting of this Inter-Governmental Group was
held in New Delhi on 5-6 February, 2001 wherein the Concept Paper on Possible Approaches
Towards a Preferential Trading Arrangement Leading to a Free Trade Area in BIMST-EC
Region was prepared.
At the Third BIMST-EC Trade/Economic Ministers’ Meeting held on 15th February,
2001 in Yangon, Myanmar, the Ministers stressed the importance of a time-bound work
program for establishing Free Trade Area and acknowledged the efforts of the Inter-
Government Group (IGG) for preparing the Concept Paper and had agreed the setting up of a
Group of Experts (GOE) led by the government officials which should include members of
the academia and the private sector.
The Fourth ministerial meeting held in Yangon in December 2001 had made a
number of institutional decisions to expedite the decision making process. Ministerial
meetings would henceforth be scheduled in February each year, and elevated from deputy to
foreign minister level; senior officials meetings would be held twice a year (prior to the
ministerial meeting, and in September). Membership would remain static for the time being.
The First meeting of the GOE was held during 17-18th January, 2002, in New Delhi
and the second meeting of the GOE was held during 24-25 June, 2002. At the GOE meeting,
all Member countries agreed that the “Negative List” approach is preferable while moving
towards a Free Trade Area in the BIMST-EC region. The Report of the GOE shall be
considered at the next BIMST-EC Trade and Economic Ministers meeting proposed to be
held in Colombo (Ministry of Commerce, 2002).
27
8/8/2019 Indo Thai FTA
http://slidepdf.com/reader/full/indo-thai-fta 28/141
It is only to be expected that with the formal acceptance of the report of the GOE; the
Trade and Economic Ministers will take further decision in regard to the work required to be
done for having a Draft Treaty framework for a FTA in the BIMST-EC region within a fixed
timeframe, and thereafter to have negotiations for exchange of concessions and modalities for
this purpose completed speedily. Having a FTA in the BIMST-EC region is expected to give
further thrust and dynamism to the trade and economic relations among all member countries
(Ministry of Commerce, 2002).
Mekong Ganga Cooperation
The Foreign Ministers of Cambodia, India, Lao PDR, Myanmar, Thailand and
Vietnam agreed to establish Mekong Ganga Cooperation during the sidelines of the ASEAN
PMC in Bangkok in July 2000. The first Ministerial Conference was held in Vientiane in
November the same year, and it was agreed that the grouping would focus on cooperation in
four key sectors; namely, tourism, culture, human resource development, and transportation
linkages.
In subsequent meetings of MGC senior officials and ministers, working groups
chaired by a member country, were set up to coordinate and implement cooperation in each
of the identified areas: tourism (Thailand), culture (Cambodia), human resource development
(India), transportation (Lao PDR). A working group on action plan chaired by Vietnam was
assigned the task of following up on the implementation of the other four working groups.
The roadmap for the direction of cooperation under the MGC is included in the Hanoi
Plan of Acton (HPA), adopted during the 2nd MGC Ministerial Meeting in July 2001. This
document, effective for six years from 2001-2007, provides the basis for implementation of
activities during the six years under the mentioned four working groups. It also provides a
review of the plan’s implementation every two years. Another consequence of the 2nd MGC
Ministerial Meeting is the establishment of an MGC fund to provide financial support for the
planned projects and activities.
ASEAN-India Relations
India and ASEAN established a sectoral dialogue partnership in 1992, and later
elevated the relations to a full dialogue partnership in 1995. Current relations cover broad
ranges of issues of mutual interests; including politics, economics, trade, science and
technology, and development. Interaction is made through various channels such as the PMC
(Post Ministerial Conference), Senior Officials Meeting Consultation, the ASEAN-India Joint
28
8/8/2019 Indo Thai FTA
http://slidepdf.com/reader/full/indo-thai-fta 29/141
Cooperation Commission (AIJCC), Working Group on Trade and Investment, Working
Group on Science and Technology. ASEAN-India Fund was set up to finance cooperation
projects. India is also a member of the ASEAN Regional Forum (ARF), which deals with
political and security issues in the East Asian region.Initiated to cover wide areas of interest, which ranged from human resource
development to various subsectors of science and technology cooperation, in May 2002
ASEAN-India joint projects concluded 3 joint collaboration projects in the areas of human
resource development, science and technology, and plant biotechnology, with 16 more
projects underway. India also generously provides over 100 scholarships a year for human
resource development, and continues to make substantive contributions towards ASEAN
development, especially among its newer members.
ASEAN-India economic relations have acquired a new dynamism in the recent past.
An ASEAN-India Economic Linkages Task Force (AIELTF) has been set up with the
mandate to prepare a draft framework agreement for setting out the road map for achieving
greater economic integration. AIELTF is to follow a building block approach with the long
term objective of setting up a Regional Trade and Investment Area (RTIA) and is required to
submit its recommendations along with a draft framework agreement through the ASEAN-
India SEOM for further consideration by the ASEAN-India Trade and Economic Ministers at
the next annual meeting in September 2003.
The First ASEAN Senior Economic Officials Meeting (SEOM) – India Consultations,
were held in Manila on 7th August, 2002 which was followed by the First ASEAN Economic
Ministers (AEM) – India consultations in Brunei Darussalam on 15th September, 2002. The
Senior Economic Officials decided that an ASEAN-India Expert Group be set up which shall
study and recommend measures to further enhance ASEAN Trade and Economic
Cooperation and Integration towards closer economic partnership. The Expert Group should
adopt a building block approach to the discussions by focussing on specific areas where clear
and concrete outcomes could be achieved. The Senior Economic Officials also prepared a
draft Terms of Reference of this Expert Group for further consideration and approval by the
Ministers at the AEM-India consultations.
At the AEM-India consultations in Brunei, all ASEAN countries agreed to India’s
proposal of having a “draft framework agreement” and the “building block approach” within
the TOR of the Expert Group. It was also decided to establish “ASEAN-India Economic
Linkages Task Force” instead of Expert Group, which should submit its recommendations
including a draft framework agreement to the next AEM-India consultations in 2003 through
29
8/8/2019 Indo Thai FTA
http://slidepdf.com/reader/full/indo-thai-fta 30/141
Senior Economic Officials for further consideration and follow-up action. Another important
decision which emanated from the First AEM-India consultations is that Regional Trade and
Investment Area (RTIA) should be the long term objective with issues relating to trade and
investment promotion and facilitation being addressed in short term.At the ASEAN-India Summit held on 5 November 2002 in Phnom Penh, in addition
to deepening the existing cooperation, the future direction for expanding relations between
ASEAN and India was discussed. The Prime Minister of India stated that some progress
towards greater economic integration has been made in terms of setting up of the Task Force
to recommend measures to mutually increase market access, facilitate trade and promote
investment. He also indicated India’s keenness to have an India-ASEAN FTA within a ten-
year time frame.
IOR-ARC
The Indian Ocean Rim Association for Regional Cooperation (IOR-ARC) was
established during the first meeting of the Indian Ocean Rim Initiative Meeting in Mauritius
1995, of which India is one of the founding member countries. The association expanded its
membership by 7 countries in 1996, and added another 5 countries including Thailand in
1999 to bring its current strength to 19 countries.
From its inception, it is viewed as a largely trade facilitating body for countries
bordering on the Indian Ocean. Current activities of the body continue to work towards
promoting trade and investments as well as related economic infrastructures such as a
payment system, exchange of trade related problems, enhancement of technology information
capabilities and so on. The association adopts a three pronged approach by including:
official, private and academic sectors.
While current cooperation and joint projects are in the initial stages, a great deal of
groundwork has been done to pave the way for cooperation in the future.
\
30
8/8/2019 Indo Thai FTA
http://slidepdf.com/reader/full/indo-thai-fta 31/141
Chapter 3
Analytical and Methodological Issues
Introduction
One of the ways in which the impact of FTA on different variables is assessed is
through the application of a computable general equilibrium model. It is rather well known
that such models have certain inherent limitations but as long as the results are interpreted by
keeping in view the limitations it is possible to get valuable insights for the policy making
process.
The analytical framework of the study has been laid out in section 3.1. The present
work is based on the application of the GTAP model, as it is one of the most widely used
models. A brief overview of the structure of this model is given in section 3.2 including some
of its assumptions and inherent limitations. The macro impact of the FTA on India and
Thailand are briefly analysed in section 3.3. The dimensions of sectoral impacts are dealt
with in section 3.4 and some implications of the FTA that are not captured in the model are
highlighted in section 3.5.
3.1 Analytical Framework
The study on exploring the prospects of India-Thailand FTA needs to posit ‘ freeing of
trade’ in a proper analytical perspective. It also should recognise the limitations of various
techniques that are applied to assess the impact of tariff liberalisation. Therefore, an attempt
is made here to understand the implications of reduction of trade barriers in the backdrop of
certain analytical and methodological issues. This has been undertaken on the following
dimensions viz. (i) trade as an instrument of development (ii) trade facilitation in conjunctionwith trade liberalisation (iii) role of rules of origin under FTA (iv) assessing the implications
of trade liberalisation with the help of Computable General Equilibrium (CGE) modelling
and (v) exploiting trade complementarities.
Trade as an Instrument of Development: An Integrated Approach
It is imperative to treat trade as an instrument of development. It is equally important
to recognise that the causality between trade and development runs in both the directions.
Due to lack of such an understanding often the means to achieve the ultimate aim of
31
8/8/2019 Indo Thai FTA
http://slidepdf.com/reader/full/indo-thai-fta 32/141
development is treated as an end in itself. This results in overemphasis on trade liberalisation
per se.
Clarity regarding the causality between trade and development helps in taking an
integrated approach of trade whereby adequate emphasis is laid on trade-investment linkagesand setting up of trade-creating joint ventures are envisaged. In this kind of a strategy, both
trade augmentation and developmental objectives can be achieved simultaneously as joint
ventures would contribute to output generation, increase in employment and trade creation.
Trade liberalisation in such a context assumes a special meaning. One implication
could be that due to trade liberalisation bilateral investment flows between countries under
consideration could be generated to take advantage of a liberalised trade regime. The other
obvious one could be that due to setting up of trade-creating joint ventures trade flows are
generated.
Similarly, trade liberalisation could be geared in such a way that it is best suited for
taking the benefits of the technological spread-effects in the two countries. This is so because
any trade product represents a particular level of technology. Hence, with trade flows an idea
about the nature of technology embedded in the product is also exchanged. This could
generate a second round of technology flows between the countries entering into a bilateral
trade agreement. This could be an example of trade flows generating trade in technologies.
The converse of this also holds good inasmuch as technological cooperation helps improving
the competitiveness of production and leads to trade creation between the two countries.
There is another angle to this analytical understanding which also needs to be taken
note of. Once an integrated approach to trade is adopted i.e. its linkages to investment and
technology are kept in mind, the bilateral trade cooperation takes the form of a broader
development cooperation. Development cooperation helps building export and technological
capabilities, with the help of investment cooperation. Subsequently, the bilateral partners do
not restrict their cooperation for tapping each other’s trade, investment and technological
space but also jointly target the global economic space.
Thus, there is merit in considering the linkages of trade with investment and
technology, or so to say with development, as in so doing bilateral cooperation does not
remain confined to mere trade liberalisation nor it focuses only on each other’ s markets.
Trade Facilitation with Trade Liberalisation
It is our contention that reduction in trade barriers might neither be a necessary nor a
sufficient condition for propelling trade flows. It is entirely possible that even without trade
32
8/8/2019 Indo Thai FTA
http://slidepdf.com/reader/full/indo-thai-fta 33/141
liberalisation trade flows could be provided an impetus. This issue is analysed a little later in
this section when the issue of the existing trade complementarities is taken up. At the moment
we argue that mere trade liberalisation is not sufficient for generating substantial trade flows
unless broad-based trade facilitation measures are set in place.Some of the trade facilitation measures that are crucial for enhancing trade flows,
inter alia, could be bridging information gap and improving quality of information, removing
procedural hurdles, customs facilitation, improving banking facilities-including trade finance,
harmonising technical standards, undertaking infrastructural improvements etc. Unless these
areas receive adequate attention long term sustained growth in trade could remain an illusive
proposition.
Role of Rules of Origin under FTA
Rules of origin have a significant role to play in a FTA. In recent times, rules of origin
have emerged as significant commercial policy tools, serving various policy objectives.
These rules are applied in both preferential and non-preferential trading regimes. The system
of rules of origin has been a very useful mechanism for the prevention of circumvention of
anti-dumping duties and in determination of countervailing duties, voluntary restraint
arrangements, etc. It has also been used in preventing trade deflection in preferential trading
arrangements and it also plays a developmental role in the partner countries. However, rules
of origin should be designed in a manner that is not trade-restricting. They should not become
trade barriers due to their complex methods of implementation.
There are different methods of determining originating status of products. Whether or
not a product has originated in a particular country is decided if the product has undergone
substantial transformation. In other words, the final product should be distinct from its
constituents. Three kinds of tests are applied to determine this. First, the change in tariff
heading test whereby the tariff heading of the final product is different from the tariff
headings of its components. Second is the percentage test according to which a minimum
percentage of total value addition should be achieved with the help of indigenous inputs. And
third, specified process tests that require a product to undergo certain stipulated processes.
What follows is a profile of some of the effects of rules of origin in a preferential
trading arrangement (Panchamukhi and Das, 2001). Out of the various positive and negative
implications of rules of origin only a few of them are analysed here.
33
8/8/2019 Indo Thai FTA
http://slidepdf.com/reader/full/indo-thai-fta 34/141
A. Positive Effects
There could be three major positive effects that the rules of origin can cast in a
preferential trading arrangement in terms of: (i) preventing trade deflection, (ii) facilitating
value addition, and (iii) augmenting bilateral trade. Each of these is dealt with below.
Preventing Trade Deflection
In any preferential trading arrangement members set their own external tariffs but
give preferential tariff treatment to each other. The divergence between external tariffs of the
members and the regional preferential tariffs is a potential source of trade deflection (Shibata,
1967). In the absence of any rules of origin within the preferential agreement the country with
lowest external tariffs is likely to serve as an entry point into the partner country market for
the goods of the non-member countries. In this sense, rules of origin are important tools for
checking trade deflection from one partner country to another of third country goods. This is
an objective worth pursuing, as these types of trade flows do not forge adequate backward
and forward linkages in the member country that imports these goods first. Therefore,
compliance to rules of origin should form an integral part of any preferential trading
arrangement in order to prevent trade deflection.
Facilitating Value Addition
The three modalities of determining origin of a product aim at substantial
transformation in inputs. Thus, rules of origin together, facilitate value-addition in the
country of manufacturing. Whether it is in the form of meeting a local-content requirement as
a proportion of value-added or changes in tariff heading or a particular processing
requirement, all have a developmental role to play. Providing for value addition norms has
the potential for generating backward and forward linkages in a country adhering to the rules.
Thus, a partner country is prevented from becoming a mere trading country as these
requirements act as a deterrent to assembly kind of production activities. The rules of origin
thus, have important implications for the development of the manufacturing sector as a
whole, which in turn, contributes towards enhancing the export supply capabilities of the
member country. Hence, while devising the rules in any regional grouping the developmental
effects of them must not be overlooked.
Bilateral Trade Expansion
A regional preferential trading arrangement having the provision of cumulative rules
of origin is more liberal than the one not having it. This is because under regional cumulation
34
8/8/2019 Indo Thai FTA
http://slidepdf.com/reader/full/indo-thai-fta 35/141
facility imports by a partner country of the preferential agreement from the other partner are
considered as originating in the importing country and not as imports. It has the potential to
engender intraregional trade flows of different categories of goods among the member
countries. It also has a favourable trade balance effect for the country using the cumulation provision. Moreover, there is a possibility that the first round of trade diversion effects is
converted into trade creation effects in the long run. Each of these effects of cumulation
facility is briefly discussed in Panchamukhi and Das (2001).
B. Negative Effects
Apart from the positive implications of rules of origin, as highlighted above, there are
certain adverse implications, as well that need to be kept in mind. The rules of origin might
(i) inhibit bilateral trade, and (ii) favour high cost and inefficient production.
Constraints on bilateral trade
In a member country of a preferential agreement some sectors could be lacking in the
indigenous supply of natural resources and have underdeveloped industrial base. Their
dependence on imported inputs might pose problems for their adherence to originating-status
norms. This in turn might hinder its bilateral exports within the framework of the preferential
agreement. In such a situation there appears to be a trade-off between the objectives of
preventing trade deflection on one hand and bilateral trade expansion, on the other. Hence,
rules of origin need to be evolved by taking this aspect into account.
Cost Effect
In specific production lines the local-content requirements could enforce substitution
of the imported inputs with often-costlier domestic inputs. The rise in production costs could
adversely influence the competitiveness of products. Increase in costs might well offset the
margin-of-preferences- effect of tariffs under a preferential trading arrangement. This could
ultimately obstruct bilateral trade.
Substitution in favour of high cost inputs makes it easier to meet the origin
requirements if a percentage test is applied. This kind of test would favour enterprises that are
inefficient and production bases that are marked with high wage-cost (Vermulst, 1992).
Therefore, the percentage criterion needs to be carefully devised and judiciously implemented
along with other tests of origin.
35
8/8/2019 Indo Thai FTA
http://slidepdf.com/reader/full/indo-thai-fta 36/141
Summing up, it may be highlighted that the restrictive effects of rules of origin on
bilateral trade arising out of a country’s high import dependence could somewhat be reduced
if countries take greater advantage of the cumulation facility. In addition, the high-cost effect
could be tackled by using the change in tariff heading test more generally than the percentagetest. With these in place it appears that the overall positive effects of rules of origin could
outweigh the negative effects and it would be in the developmental interests of the partners to
abide by origin rules as much as possible.
Assessing the Implications of Trade Liberalisation with the help of CGE Modelling
Apart from the usual limitations of the application of the CGE modelling for
measuring gains from trade liberalisation such as the assumptions of perfect competition,
constant returns to scale, etc. in a comparative static framework, it would be pertinent to take
cognisance of the fact it also does not take into account the various trade facilitation measures
that have been highlighted above. In not doing so, it fails to adequately capture the reality and
therefore its results in terms of the impact of tariff liberalisation need to be interpreted with
caution.
Other limitations include those associated with elasticities. It has been found that the
regression techniques used for computing elasticities are not always meaningful. Elasticities
are also sensitive to time horizon in the dynamic CGE modelling. They are high over the long
run and low over the short run (McDougall, 1993). They are also sensitive to the level of
aggregation of products. Since CGE models are often based on quite aggregate sectoral
specifications the results might be influenced with unrealistic elasticities.
The results also depend to a large extent upon the closure-choice. The selection of
exogenous variables thus needs to be carefully done. By changing the exogenous variables
the results would change irrespective of the schedule of tariffs.
Exploiting Trade Complementarities
Research has shown that in many instances of a pair of countries, a particular country
A exports the same products that are being imported by its prospective partner B from the rest
of the world but not from A. What is more is the fact that the export unit values are much
lower for the products of A as compared to the import unit values of B. This has been found
to be true even when both exports of A and imports of B are valued in CIF terms. This results
in a considerable drain of scarce foreign exchange resources in the case of country B which
can be termed as costs of non-cooperation (Panchamukhi and Das, 1998).
36

8/8/2019 Indo Thai FTA
http://slidepdf.com/reader/full/indo-thai-fta 37/141
Existence of such complementarities can be exploited, bilateral flows augmented and
additional foreign exchange cost could be eliminated through bilateral cooperation. The gains
could be further increased if this trade category is subjected to tariff liberalisation. Instances
such as these suggest that trade liberalisation might not be a necessary condition for increasing trade. However, this is not to deny that all trade could not be covered in this
category alone.
The question is as to why such a situation arises? There could be two prime reasons
for this phenomenon viz. (i) information gap and (ii) low quality of products of A. This is a
matter of further investigation in a specific country-pair scenario.
The preceding discussion has highlighted that the analytical and methodological
issues of India-Thailand FTA need to be clearly borne in mind while analysing the prospects
of trade and development cooperation. This is particularly relevant for evolving the free trade
agreement between the two countries.
3.2 The Model and Assumptions
GTAP is a comparative static, multi-commodity, multi-region CGE model of the
world economy. A region may be either a single country or a composite region consisting of
many countries. Each region produces each commodity, which has its own distinctive variety.
This is imperfectly substitutable with the varieties produced by other regions of the same
commodity. Within each region, each commodity is produced by a single-product industry
with the help of inputs sourced from domestic and global markets. The primary factors are
considered as skilled and unskilled labour, capital, land and natural resources. Each input to a
particular industry has an ad valorem tax associated with it. Further, industry inputs of each
composite commodity and primary factor have technical efficiency terms associated with
them. Thus, in the model one can vary intermediate input taxes, primary factor input taxes
and the efficiency with which inputs are used.
Industries source each primary factor from a fixed regional endowment of that factor.
The supplies of skilled and unskilled labour and capital are perfectly transformable between
industries. On the other hand, land is supplied with a transformation elasticity of 1 and
natural resources with a transformation elasticity so small that its supply to each industry is
essentially fixed. Hence, wages for both the categories of labour and the user price of capital
are uniform across industries However, the rental prices of land and natural resources can
vary from industry to industry. This is definitely a restrictive design.
37
8/8/2019 Indo Thai FTA
http://slidepdf.com/reader/full/indo-thai-fta 38/141
Products of each region are either used as intermediate inputs in production,
consumed as inputs to final demand, or exported. It comes from the standard theory that there
are three categories of final demand: investment, government consumption and private
consumption. Each of these consumes composite commodities that are Constant Elasticity of Substitution (CES) combinations of the domestic and the imported variety, similar to
composite commodity inputs to industries. This is again a restrictive condition. Furthermore,
another restrictive feature of the model is in terms of the fact that composite commodity
inputs to investment are taken as fixed proportion to aggregate real investment. Composite
commodity inputs to government consumption are determined by the maximisation of a
Cobb-Douglas utility function of these inputs, while a constant-difference elasticities (CDE)
utility function is used for private consumption. All these add to the list of unrealistic
assumptions.
Aggregate government and private consumption are determined by the allocation of
net (of depreciation) national income between government consumption, private consumption
and net (of depreciation) saving to maximise a Cobb-Douglas utility function. Therefore,
nominal government consumption, private consumption and net (of depreciation) saving are
each a fixed share of nominal national income. Foreign income flows in GTAP are zero, so
that national income is equal to primary factor returns plus tax revenue minus subsidies.
On the other hand, aggregate investment can be determined by one of the two
mechanisms which can be configured. First, global net saving can be allocated between
regions in fixed shares. Second, elasticities of future expected rates of return with respect to
future capital stocks can be postulated, and in each region determined so as to equalise the
future expected rates of return. It is worth noting that investment does not add to the capital
stock available for productive use, but does add to the future capital stock, which may be
relevant in determining the level of investment.
Exports fall into two categories: commodities that are sold to other regions, and sales
to an international pool of freight and insurance services that is used to convey internationally
traded commodities from source to destination regions. This international pool is a Cobb-
Douglas aggregate of the contributions from all industries in all regions. So the contributions
of most industries will be zero. Only services sectors, such as trade and transport and
insurance, produce outputs that could contribute to such a pool. The quantity of freight and
insurance services used to convey a particular commodity from a source to destination region
is proportional to the quantity of commodity transported, subject to a change in the efficiency
of conveyance for that commodity and trade route.
38
8/8/2019 Indo Thai FTA
http://slidepdf.com/reader/full/indo-thai-fta 39/141
The total regional imports of each commodity is a CES composite of imports of the
commodity from each exporting region. The prices determining the allocation of total imports
among exporters is the domestic market price in the exporting region, plus (minus) export
taxes (subsidies), plus the price of international freight and insurance costs per unit of thecommodity, plus import tariffs. Thus, the choice among sources of imports occurs at the
economy-wide level, while the choice between the domestic and the imported (aggregated
across sources) varieties of each commodity occurs at the level of agents within the economy,
that is, industries and final demands.
A detailed discussion of GTAP Model and further improvements in it in terms of
treating the FDI flows in a more comprehensive manner can be found in Hanslow, Phamduc
and Verikios (2000).
The following sections dwell upon the possible impact on India and Thailand at the
conceptual level.
3.3 The Macro Impact on India and Thailand
On account of tariff liberalisation under the proposed FTA both countries are
expected to benefit primarily on account of price reduction in their imports. On the other
hand, there could be demand-pull effects on their exports due to reduction in the partner
country’s import tariffs. The latter effect would be reinforced by the former in terms of
improved price competitiveness of exports. This is expected to improve the export
competitiveness of the products in the global market as well.
It is obvious that due to higher export demand, domestic activities on the supply side
would get an impetus and resultantly there would be a greater demand for factors of
production in each economy. This may lead to an increase in the factor prices.
Exports of both the countries may increase in each other’s markets, displaying both
trade creation and trade diversion. On the other hand, the impact of FTA may not be
restricted to external demand only. It could have important implications for the internal
demand as well. Higher export income and lower import prices could influence private
consumption in each country, subject to the composition of products that experiences the
price decline. The effect could also be observed in terms of better savings profile.
Investment is also expected to increase due to greater export opportunities. All these, inter
alia, would contribute to the overall welfare gains in the countries.
39
8/8/2019 Indo Thai FTA
http://slidepdf.com/reader/full/indo-thai-fta 40/141
3.4 Sectoral Impacts
Analytically, there is a possibility of both positive and negative effects of FTA at the
sectoral level. The major positive impact that can be experienced by various sectors is in
terms of improved market access and exports in each other’s markets. The other positive
implication could be in terms of lower imported input prices and improved competitiveness
of products.
However, FTA may also entail higher import competition and lead to output
contraction in some sectors. These could be tackled through setting up of trade-creating joint
ventures so as to mitigate the negative effects and strengthen the trade-investment linkages
for tapping the global market as well.
3.5 Impact not captured by the Model
Apart from the macro level and sectoral impacts of the FTA that are highlighted
above it would be pertinent to mention some of the other possible dimensions of analysis
which are usually not captured by a CGE model. Since an analysis of these dimensions is also
important to probe into the question as to whether the FTA is a feasible proposition or not, a
snapshot view of them is provided below.
The FTA might influence the trade and production sectors further if the potentials of
trade expansion are taken into consideration while implementing the FTA. Such impacts
remain un-captured by the model and they are briefly explained now. First, the potential of
trade expansion could be immense in terms of possibilities of tapping the potential intra-
industry trade, i.e. trade between the two countries in the same sector. Second, potentials of
trade expansion in terms of exploiting trade complementarities in products where a country
has a price advantage over its competitors and by not exploiting these the countries incur
substantial costs of non-cooperation. Third, the model also does not capture the impact of
FTA under different tariff liberalisation scenarios at a disaggregated level of product/tariff
lines. Finally, the model also does not capture the possible tariff revenue loss at the
disaggregated level.
Summing Up
It is thus expected that there would be an extensive impact of the proposed FTA on
Indian and Thai economies as a result of increase in economic activities and trade integration.
These would have implications for investment linkages as well. Some domestic adjustmentswould also be required to safeguard the revenue loss effects of the FTA.
40
8/8/2019 Indo Thai FTA
http://slidepdf.com/reader/full/indo-thai-fta 41/141
Chapter 4
Impact of Preferential Liberalisation under a Free Trade Agreement
4.1 Introduction
Recent years have witnessed an increasing trend of globalisation. The technological
revolution especially in the realm of information technology and pursuance of liberal
economic policies by countries the world over have been the two prominent forces that have
intensified the globalisation process. With the advent of the WTO this process has got an
added impetus at the multilateral level. Alongside the phenomenon of globalisation, the world
economy has also witnessed spurts of regional and bilateral economic integration efforts in
the developed and developing regions alike. There is a growing understanding that such
developments in fact prove to be as building blocks to the globalisation and multilateral
liberalisation process.
Both India and Thailand are part of the WTO and at the same time members of
various regional economic cooperation initiatives such as BIMSTEC, Ganga-Mekong
Cooperation, IOR-ARC etc. They also interact on various economic cooperation dimensions
under the Indo-ASEAN cooperation framework. Thus, any intensification of trade and
economic cooperation between India and Thailand at the bilateral level would act as a
catalyst to all the other economic processes to which both are a part.
The main focus of the present chapter is to assess the impact of preferential
liberalisation under a Free Trade Agreement between India and Thailand. This has been
accomplished at two levels. First, by assessing the macro impact with the help of a CGE
modelling exercise using the GTAP framework. Second, potentials of trade expansion are
identified by making explorations into the aspects of trade complementarity, production
similarity, potential intra-industry trade, costs of non-cooperation and the extent of revenue
loss under the proposed free trade regime. The technical details of the CGE model is
presented in Chapter 3 and the sectoral impacts are summarized in Chapter 5. Towards the
end, impact on services sector is analysed and some potentials for trade expansion in this
context are identified.
Some of the conceptual issues that have been in the background of the empirical
exercise of this Chapter are highlighted below.
41
8/8/2019 Indo Thai FTA
http://slidepdf.com/reader/full/indo-thai-fta 42/141
Conceptual Background
Any trade liberalisation efforts entail both some adjustment costs and benefits. In
principle, trade liberalisation might create competitive environment in which domestic
producers would have to adjust themselves. Resource reallocation is a necessary phenomenonthat would provide trading partners with opportunities to gain from changing direction of
trade.
With tariffs getting reduced in the raw materials and intermediate goods segment,
lower cost of production could enhance the competitiveness of the final products. Moreover,
tariff liberalisation provides additional avenues for market access. They also can bring in
dynamism to the downstream activities and at the same time provide an impetus to high value
added production and exports. These effects come about due to different production and
exporting structures of two countries. However, even when production structures are similar
there is ample scope for trade augmentation of the intra-industry variety – a phenomenon
which characterises the major chunk of present-day global trade, contrary to the outcomes of
the Hecksher-Ohlin trade theories.
Furthermore, in order to quantify the benefits from bilateral FTA adequate attention
needs to be paid on the phenomenon of costs of non-cooperation which essentially means
estimating the additional costs incurred by one country by not importing lower unit value
items from the partner country which is on the other hand being exported to the rest of the
world by the latter. Cooperation at the bilateral level thus could result in significant foreign
exchange savings in both the countries. Increased trade in goods also throws open
possibilities of investment and technological cooperation. These are some of the positive
connotations of trade liberalisation.
This is not to deny that trade liberalisation can have certain negative implications as
well. They have fiscal implications in terms of revenue losses. Import competition could also
result in output contraction in some sectors and also at the aggregate macro levels (Sen and
Das, 1992). Subsequently, pressures on foreign exchange reserves increase and they
necessitate cooperation in the realm of banking and financial sector.
Bilateral FTA could be considered as a step forward towards freer trade at the global
level. Therefore, bilateral Free Trade Agreement between India and Thailand could be
considered as WTO-consistent if the conditions laid down in the WTO provisions are adhered
to. In fact, an early learning from the experience of a bilateral FTA in terms of domestic
adjustments could be beneficial for more wide-ranging adjustments that the WTO
Agreements might entail in future.
42
8/8/2019 Indo Thai FTA
http://slidepdf.com/reader/full/indo-thai-fta 43/141
Two most analysed aspects of a FTA are trade creation and trade diversion. By
definition, trade creation is referred to as an efficiency gain that results from the operation of
a free trade area because more efficient firms from a member country displace less efficient
local producers in the domestic market. In this case the increase in efficiency of resource
allocation is transformed into a lower product price and trade, in turn, expands because of this
change in price. The consumers gain from such a situation while the domestic firms have to
face higher levels of competition from partner-country suppliers.
Trade diversion, on the other hand, is referred to as an efficiency loss that results from
the operations of a free trade area because less efficient firms from a member country
displace more efficient producers from a non-member country (Ingram, James C., and Robert
M. Dunn, Jr., (1993).
A bilateral FTA could also help bridge the information gap and higher quality of
information exchange could also significantly enhance the bilateral trade volumes as quite
often countries do not trade with each other due to sheer lack of adequate information
regarding their partner’s trading profiles. This results in considerable costs, which has come
to be known as Costs of Non-cooperation.
It is with this background we move on to assessing the impact of India Thailand FTA,
at the macro level, and identifying the potential areas of trade expansion.
4.2 Merchandise Trade: Impact and Potential Areas of Cooperation
As mentioned above we first present the assessment with the help of CGE model and
subsequently focus on the potentials for trade augmentation.
4.2.1 Macroeconomic Impact under FTA: CGE Modelling Results
This section is to evaluate the economic impact of India-Thailand FTA. An attempt
has been made to quantitatively analyse the impacts of import tariff elimination between
India and Thailand on macroeconomic variables and trade flows. A free trade area will
theoretically improve the welfare of the countries through the benefits of better market access
and cost reduction derived from tariff cuts. However, there might be instances of output
compression in some sectors due to increased import competition. Results of sectoral impact
are presented in Chapter 5.
43
8/8/2019 Indo Thai FTA
http://slidepdf.com/reader/full/indo-thai-fta 44/141
Model & Data
The Global Trade Project (GTAP), a static computable general equilibrium model,
has been used to approximate this potential gain from FTA. This model has been widely used
to analyse a number of international trade policies under different research programmes. Thismodel is constructed by economists at the Purdue University, USA in collaboration with
economists at Monash University, Australia.
It is assumed that the FTA will reduce the tariff rates to zero from the level prevailing
in 1999. Tariff rate data for both countries has been obtained from UNCTAD TRAINS
database.
The Macroeconomic Impact of FTA on India
The results from GTAP simulation show (Tables 15 and 16) that India-Thailand FTA
will lead to a decline in price level due to the reduction of India’s import tariff rates. In
addition, FTA will result in higher demands for India exports due to the reduction of
Thailand’s tariff rates and greater competitiveness of Indian products in the world market.
Higher export demand leads to greater demand for primary inputs such as labor and land. As
the result, average wage rate will increase by 0.07 percent while land rent will increase by
0.15 percent. In addition, the import tariff cut will result in a decline of rental price for
capital and average intermediate input prices. The GDP deflator, the average price level, will
decline by 0.02 percent in India.
Tariff elimination between Thailand and India will boost the India’s total exports by
1.02 percent. The trade creation effect will lead to a rise in India’s exports to Thailand by
42.78 percent. In addition, the exports to other countries will slightly expand due to cost
reduction from import tariff cuts and the resultant strengthening of competitiveness of India’s
products in the world market.
The India-Thailand FTA may also cause trade diversion. India will increase its
import value from Thailand by 113.8 percent while decrease its import value from Japan by
0.94 percent, Indonesia by 1.99 percent and China by 2.11 percent.
The FTA has impacts not only on external demand but also on internal demand.
Higher export income and lower commodity prices will increase private consumption in India
by 0.03 percent. Aggregate savings will rise by 0.04 percent. Private investment is expected
to increase by 0.16 percent, caused mainly by greater export opportunities. Overall, the
welfare of India will improve by US Dollar 74.89 Million.
44
8/8/2019 Indo Thai FTA
http://slidepdf.com/reader/full/indo-thai-fta 45/141
The Macroeconomic Impact of FTA on Thailand
India-Thailand FTA will benefit Thailand mainly through increasing market access in
India’s huge market. A rise in Thailand’s exports increases the demand for primary factors of
production. Wage and rental price of land will rise by 0.39 percent and 0.52 percentrespectively, while the rental price of capital will increase by 0.03 percent. This leads to a
0.09 percent increase in the GDP deflator. The higher demand for Thailand’s export will
raise the export price index by 0.12 percent. (Table 15).
The India-Thailand FTA could result in significant trade creation. It is expected that
there will be 113.87 percent surge in Thailand’s exports to India while Thailand’s imports
from India will rise by 42.78 percent. There will also be an increase in the total exports of
Thailand by 0.52 percent. Due to cheaper products from India and expansion of overall
economy, Thailand’s total imports will increase by 0.66 percent.
On the other hand, the FTA will cause some trade diversion effects. The exports of
Thailand to ASEAN members will decline in the range of 0.29 percent - 0.43 percent. The
exports to China and Japan are expected to drop by 0.53 percent and 0.41 percent,
respectively (Table 16).
The FTA would expand not only Thailand’s external sector but also the internal
sector. Gross domestic investment in Thailand will rise by 0.47 percent while the private
consumption and savings will increase by 0.41 percent and 0.39 percent, respectively. As a
result, the real GDP will increase by 0.34 percent. This would lead to a US dollar 545.2
millions increase in the welfare of the country.
It may be mentioned while summing up that the international trade between India and
Thailand has been limited, regardless of positive factors such as size of economies and
location. The high import tariff is one of important trade barriers between these two
countries. The results of the GTAP simulation show that India-Thailand FTA will increase
both countries’ welfare. The main benefits of FTA are through substantial trade creation
between the two economies. Even though the impact of India-Thailand FTA is positive, the
size of impact is relatively small for both countries. One factor behind limited benefit is the
current small trading activities between India and Thailand. Our study, which is a market
analysis of substantial tariff cut, could underestimate the true impacts of FTA. Therefore,
this analysis has been supplemented with other techniques of impact assessment and that
brings out that there is very high potential for economic gains and trade expansion between
India and Thailand if the FTA is set into place. Moreover, it should be noted that current high
45
8/8/2019 Indo Thai FTA
http://slidepdf.com/reader/full/indo-thai-fta 46/141
tariffs mean high adjustment cost of economies. This analysis does not take this high
adjustment cost into account.
4.2.2 Potential Areas of Trade ExpansionAn attempt has been made here not only to identify the potential areas of cooperation
in the realm of merchandise trade but also to make an assessment of the extent of potential
trade expansion. Our empirical analysis is focussed towards highlighting that even without
tariff liberalisation, tremendous potential exists for trade expansion between India and
Thailand.
On top of it if tariff liberalisation under the proposed FTA is undertaken, obviously
enough the advantages would be much more as the CGE results mentioned above also
suggest. However, tariff liberalisation would entail revenue loss to the respective
governments, therefore, estimates of product-by-product tariff revenue loss has also been
estimated.
The potentials of trade expansion are brought out with the help of computing a Trade
Complementarity Index and a Production Similarity Index. This analysis has been further
extended by computing the intra-industry Trade Index and Costs of Non-cooperation between
the countries under consideration.
Trade Complementarity and Production Similarity
One of the ways of ascertaining potentials of trade cooperation between a pair
countries is by comparing their exports and imports vectors at a point of time and bring out
the matching between the two. A matching such as this between the export supply of one
country and import demand of the partner country can be captured by constructing a Trade
Complementarity Index. One way of undertaking this is by calculating what is known in the
literature is the Cosine Measure (Linnemann, 1992) as given below:
Cos(IxTm) = I EIi . MTi
TiI E2Ii . I M2
Where trade complementarity between India’s exports with Thailand’s imports is given by
Cos(IxTm) , E=Exports to world, M= Imports from world, I=India, T=Thailand, i=product at HS
46
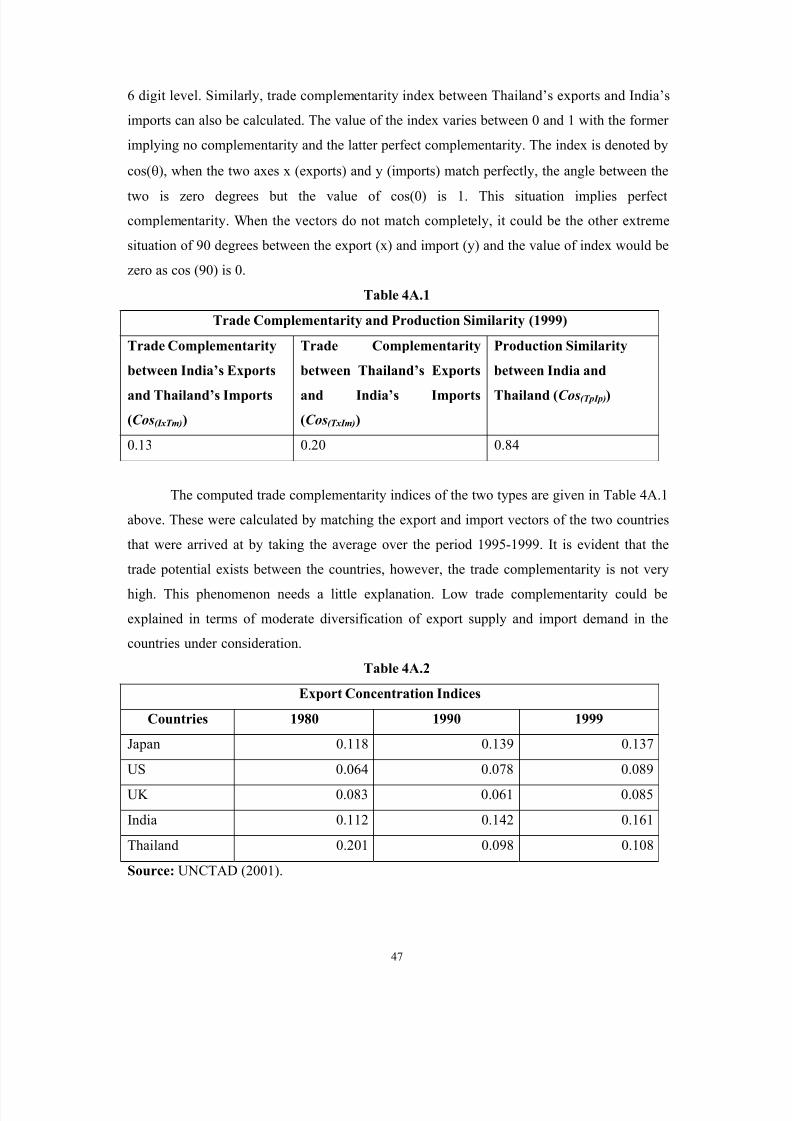
8/8/2019 Indo Thai FTA
http://slidepdf.com/reader/full/indo-thai-fta 47/141
6 digit level. Similarly, trade complementarity index between Thailand’s exports and India’s
imports can also be calculated. The value of the index varies between 0 and 1 with the former
implying no complementarity and the latter perfect complementarity. The index is denoted by
cos(
), when the two axes x (exports) and y (imports) match perfectly, the angle between thetwo is zero degrees but the value of cos(0) is 1. This situation implies perfect
complementarity. When the vectors do not match completely, it could be the other extreme
situation of 90 degrees between the export (x) and import (y) and the value of index would be
zero as cos (90) is 0.
Table 4A.1
Trade Complementarity and Production Similarity (1999)
Trade Complementarity
between India’s Exports
and Thailand’s Imports
(Cos(IxTm))
Trade Complementarity
between Thailand’s Exports
and India’s Imports
(Cos(TxIm))
Production Similarity
between India and
Thailand (Cos(TpIp))
0.13 0.20 0.84
The computed trade complementarity indices of the two types are given in Table 4A.1
above. These were calculated by matching the export and import vectors of the two countries
that were arrived at by taking the average over the period 1995-1999. It is evident that the
trade potential exists between the countries, however, the trade complementarity is not very
high. This phenomenon needs a little explanation. Low trade complementarity could be
explained in terms of moderate diversification of export supply and import demand in the
countries under consideration.
Table 4A.2
Export Concentration Indices
Countries 1980 1990 1999
Japan 0.118 0.139 0.137
US 0.064 0.078 0.089
UK 0.083 0.061 0.085
India 0.112 0.142 0.161
Thailand 0.201 0.098 0.108
Source: UNCTAD (2001).
47
8/8/2019 Indo Thai FTA
http://slidepdf.com/reader/full/indo-thai-fta 48/141
In the event of high trade diversification or high trade concentration in similar
products the complementarity may turn out to be high. Assuming that the export and import
structures of both India and Thailand are moderately diversified at the present juncture, not
very high trade complementarity index is a plausible proposition. This assumption is also notunrealistic as it is corroborated by our observation on export concentration Hirschmann index
of the two countries presented in the above Table 4A.2.
Thus far we know that trade complementarities exist between India and Thailand,
however, it is not very high. We have provided an explanation for this phenomenon. We
probe into the issue further by examining whether the production structures of the two
countries are similar. It may be argued that even if the production structures are similar, the
potentials for trade expansion would be very high. In fact the higher the production similarity
the higher would be the potential for intra-industry trade. One may hasten to add that a
majority of global trade are presently of the intrra-industry variety and not of the inter-
industry type as envisaged in the traditional Hecksher-Ohlin framework of trade theories.
Hence, it is worthwhile to explore the issue of production similarity between the two
countries so as to pin down the argument that potentials for trade expansion of the intra-
industry variety exists. The index of production similarity is calculated by applying the cosine
measure to the production data of the two countries. The table above reveals that our
calculations do suggest that there is immense possibility of intra-industry trade expansion
between the two countries. This is further corroborated by our calculations as analysed
below.
Potential Intra-industry Trade (IIT)
The phenomenon of two countries trading with each other in a particular industry or
sector is known as intra-industry trade as opposed to inter-industry trade. The index of IIT
(Grubel-Llyod Index) is commonly calculated as the following:
IIT Index = 1 – [ | XiA – MiB | ] / [XiA + MiB ]
where X is exports, i is a product and A is exporting country, B is importing country, and M
is imports. The index varies from 0 to 1 with the former implying no IIT and the latter as
maximum IIT. The index is sensitive to the definition of industry. The higher is the level of
aggregation while defining industry the higher would be IIT and vice versa. Therefore, as the
48
8/8/2019 Indo Thai FTA
http://slidepdf.com/reader/full/indo-thai-fta 49/141
literature suggests 4-digit level of SITC classification is close to optimum level on which the
industry bias of the index is minimum.
Thus, we have calculated the IIT at SITC 4 digit level but with a novel application.
Usually, the IIT is calculated for the existing trade flows between partners. We havecalculated the index for India and Thailand for products that are being exported by one
country to the rest of the world but not being imported by another country, instead it is being
imported from the rest of the world. The index in such a situation captures the potentials for
intra-industry trade between the two countries. Thus, low trade complementarities as captured
by the cosine measure and production similarity do not act as a constraint on future trade
flows. Our calculations suggest that there is ample scope for intensifying intra-industry trade
linkages between India and Thailand (Table 17) and this aspect needs to be taken into
account while evaluating the feasibility of an FTA between the two. The tables reveal that
there are several product categories that are displaying high or medium levels of IIT index
implying the rich potential for such trade flows.
There is an added advantage of focussing on potential IIT products as they can
facilitate tremendous amount of foreign exchange savings for the two countries. Having
observed that there is rich potential for trade expansion we extend the analysis further by
calculating the Costs of Non-cooperation by comparing the prices of exports of one country
to the prices of imports of another country – an aspect which has not been captured so far in
our analysis. Such an exercise would also throw light on the extent of trade complementarity
between India and Thailand through a different analytical and methodological route.
Costs of Non-cooperation
A comparison is made of items that India presently exports to the world but not to
Thailand with the same items that are presently being imported by Thailand from world but
not from India at SITC 4-digit level. The results are further reported by identifying the items
that fall in these SITC categories at HS 6-digit level in the case of India and HS 10-digit level
in the case of Thailand along with their respective tariff levels. This has been accomplished
so as to facilitate the policy-making process in terms of identifying items for the annexures of
tariff liberalisation schedules of the proposed FTA. The results suggest that there is immense
potential to augment India’s export of these items to Thailand because these items are being
exported by India to the rest of the world at unit values lower than the unit values of
Thailand’s imports when sourced from the rest of the world. If Thailand sources these items
from India it could amount to a saving of US Dollar 7.9 Billion for Thailand. It may be
49
8/8/2019 Indo Thai FTA
http://slidepdf.com/reader/full/indo-thai-fta 50/141
mentioned that this is without taking into account the proposed tariff liberalisation under the
FTA. If tariff liberalisation is also taken under consideration the competitiveness of India’s
export products would increase further in the Thai market.
On the other hand, India would gain in terms of foreign exchange earning throughincreased exports. Thailand would gain in terms of foreign exchange saving as mentioned
above which would in turn improve Thailand’s competitiveness in its manufacturing process
as several such products under consideration fall in the category of raw materials and semi-
finished goods.
Similarly, it has been worked out as to what kind of gains would be possible by
comparing India’s imports and Thailand’s exports that are taking place vis-à-vis rest of the
world but not bilaterally. It is estimated that India could save US Dollar 4.6 Billion of foreign
exchange if it sources those items from Thailand that are presently not being imported from
Thailand but they are being exported by Thailand to the rest of the World. In this case, there
would be potential increase in Thailand’s exports to India as well. If these products are
subjected to tariff liberalisation there would be improvements in the competitiveness of
Indian products.
4.2.3 Revenue loss
Any analysis of tariff liberalisation under an FTA would be incomplete if an
assessment of its fiscal implications in terms of tariff revenue loss is not made. An attempt
has been made in this section to quantify the expected revenue loss both for India and
Thailand in different sectors at the present level of imports from each other and given the
prevailing tariff structure. The estimation has been carried out at the HS 6- digit level of
disaggregation but the results in the Table 4A.3 below are presented at the sectoral level.
Sectors have been categorised in the following broad categories: Natural Resources,
Agriculture, Agro-industry and Manufacturing. Manufacturing is further sub-divided into
labour-intensive, capital-intensive, technology-intensive and miscellaneous categories. A
classification like this would help formulate the tariff liberalisation schedule in such a manner
which does not imply incurring more costs in terms of revenue losses as compared to the
benefits reaped. It also facilitates preparation of tariff schedules for liberalisation by keeping
in mind the possible developmental imperatives of a particular country. For instance, the
tariff schedule could be evolved by having a balanced mix of products which neither affects
adversely the labour-intensive sectors nor compromises in getting efficiency-enhancing
capital-intensive and technology-intensive imports on liberal terms.
50
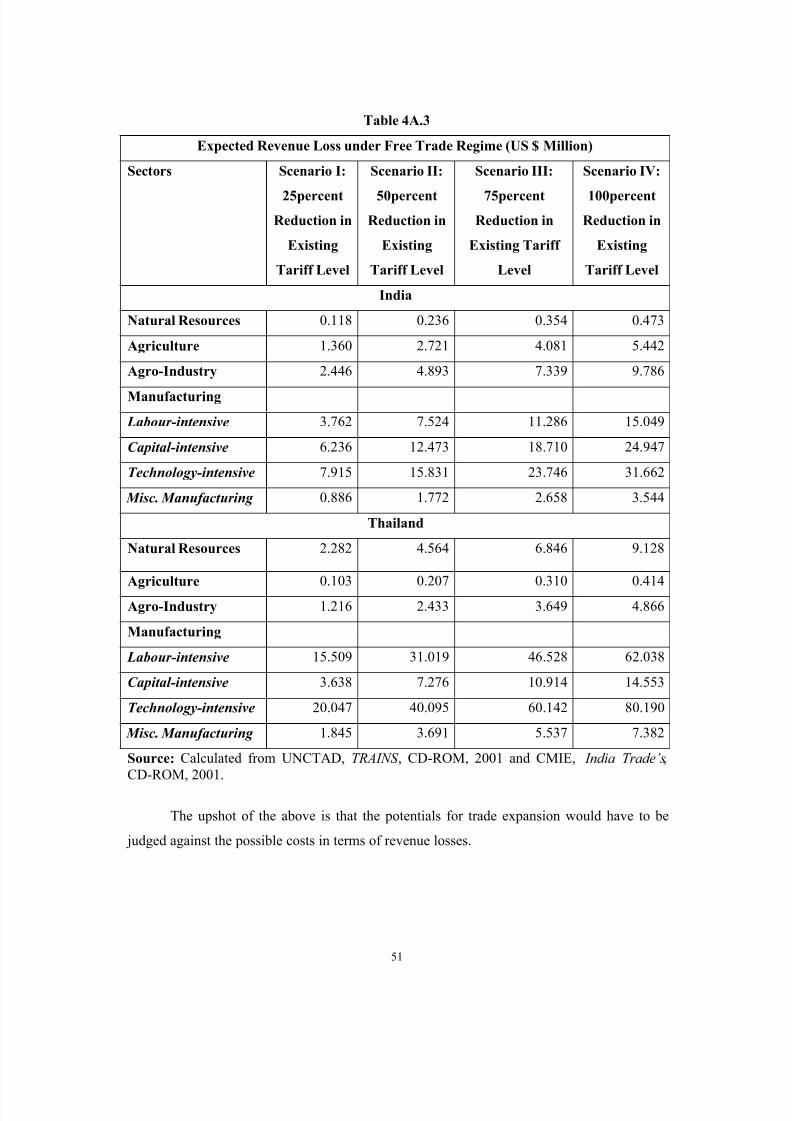
8/8/2019 Indo Thai FTA
http://slidepdf.com/reader/full/indo-thai-fta 51/141
Table 4A.3
Expected Revenue Loss under Free Trade Regime (US $ Million)
Sectors Scenario I:25percent
Reduction in
Existing
Tariff Level
Scenario II:50percent
Reduction in
Existing
Tariff Level
Scenario III:75percent
Reduction in
Existing Tariff
Level
Scenario IV:100percent
Reduction in
Existing
Tariff Level
India
Natural Resources 0.118 0.236 0.354 0.473
Agriculture 1.360 2.721 4.081 5.442
Agro-Industry 2.446 4.893 7.339 9.786
Manufacturing
Labour-intensive 3.762 7.524 11.286 15.049
Capital-intensive 6.236 12.473 18.710 24.947
Technology-intensive 7.915 15.831 23.746 31.662
Misc. Manufacturing 0.886 1.772 2.658 3.544
Thailand
Natural Resources 2.282 4.564 6.846 9.128
Agriculture 0.103 0.207 0.310 0.414
Agro-Industry 1.216 2.433 3.649 4.866
Manufacturing
Labour-intensive 15.509 31.019 46.528 62.038
Capital-intensive 3.638 7.276 10.914 14.553
Technology-intensive 20.047 40.095 60.142 80.190
Misc. Manufacturing 1.845 3.691 5.537 7.382
Source: Calculated from UNCTAD, TRAINS , CD-ROM, 2001 and CMIE, India Trade’s,CD-ROM, 2001.
The upshot of the above is that the potentials for trade expansion would have to be
judged against the possible costs in terms of revenue losses.
51
8/8/2019 Indo Thai FTA
http://slidepdf.com/reader/full/indo-thai-fta 52/141
4.3 Impact on Services Trade and Potential Areas of Trade Expansion
We first present a profile of the likely impact of FTA on services sector and
subsequently identify the potential areas of trade expansion in this sector. A relatively
detailed discussion of some potentials of trade expansion in select sectors is presented inChapter 6.
4.3.1 Impact on Services Trade
Trade liberalisation in the realm of goods has important implications for trade in
services. It is possible to pin down expansion in two types of service trade: (a) expansion in
trade facilitation services and (b) services trade independent of trade in goods. Each type is
discussed briefly below.
Expansion in Trade Facilitation Services
Such services have a two- way linkage with trade in goods. On one hand, if not set in
place they can hinder trade flows and on the other, trade in goods give rise to exchange of
various services of this type. “Trade facilitation is defined as the simplification and
harmonization of international trade procedures, with trade procedures being the activities,
practices and formalities involved in collecting, presenting, communicating and processing
data required for the movement of goods in international trade. This definition relates to a
wide range of activities, such as import and export procedures (customs or licensing
procedures); transport formalities; and payments, insurance and other financial requirements”
(www.unescap.org/itid/publication/chap7_2107.pdf). It is evident that trade in goods under
an FTA would impact the services sector by providing a spurt to several service activities. On
the other hand, these services impact on trade flows inasmuch as they promote the latter.
A category of trade facilitation services is the one that includes supportive export
financing services both at the pre-shipment stage and post-shipment stage. It also includes
services relating to export credit insurance and bank guarantees. Another set includes a set of
services such as packaging, costing, pricing, legal services, market survey and an entire
gamut of consultancy services. An entirely new domain of services that needs to be
mentioned in this context is that related to e-commerce. Furthermore, trade under FTA can
impact favorably on the infrastructural services sector such as those related with aviation,
shipping etc transport services.
52
8/8/2019 Indo Thai FTA
http://slidepdf.com/reader/full/indo-thai-fta 53/141
Services Trade unrelated to Trade in Goods
Under an FTA, certain service sectors’ trade could also be focused upon – especially
that need not necessarily be linked to trade in goods. For instance, software services, R&D
services, medical services, accountancy services, engineering services, legal and other professional services.
Thus it is clear that the impact of FTA in goods would be felt on a wide range of
services both that relate to trade in goods and those that are unrelated to trade in goods.
Overall, they also build a case for setting in place an FTA. In fact it needs to be highlighted
that such services are crucial for making the FTA itself feasible and mutually beneficial for
the partner countries.
One of the areas i.e. educational and cultural services, in which cooperation between
India and Thailand has progressed is described below.
Present Status of Cooperation in the Areas of Educational and Cultural Services
In September 1994, an MOU was signed between the Indian Council for Cultural
Relations (ICCR) and the International Study Centre of Thailand (ISCT), which functions
under the aegis of the Thai Foreign Ministry. The first India-Thai Colloquium under the aegis
of the MOU was held in New Delhi in March 1996, which witnessed a scholarly exchange of
ideas for promoting closer cooperation between the two countries presented by intellectuals
drawn from a range of disciplines. This is expected to be a regular feature hosted alternately
in Thailand and in India. Thailand agreed, during Prime Minister Thaksin’s visit to India in
November 2001, to convene the 2nd India – Thai Colloquium at the earliest.
Cultural exchanges have been taking place supported by the Indian and Thai
governments, India-Thai community and lovers of Indian arts. Since November 1999 seven
dance troupes from India have visited Thailand and one Ramakien troupe from Thailand hasvisited India. In addition, International Conferences on Ramayana and Sanskrit have been
held in Thailand in 2001-2002. The Festival of India in Thailand and a Festival of Thailand in
India was held in 1996 and 1997.
Between mid-nineties till September 2002, around 248 Thai nationals have availed of
various scholarships offered by Government of India. India offers 46 scholarships every year
to Thai students and professionals including 10 under General Scholarship Scheme, 4 under
Cultural Exchange programme, 10 under ITEC, 10 under ASEAN/HRD Project, 10 under Colombo Plan and 2 for Hindi Language. In 2000, approximately 730 student visas to Thai
53
8/8/2019 Indo Thai FTA
http://slidepdf.com/reader/full/indo-thai-fta 54/141
nationals were issued and in the current year until October over 590 student visas had been
issued. Academic exchanges between Thai and Indian Universities have also taken place.
However, since the economic crisis in Thailand there has been a slow down in these
exchanges. A number of MoUs on academic exchanges including exchanges of
lecturers/scholars exist between Thai and Indian Universities. An India Studies Centre was
established at the prestigious Thammasat University of Bangkok in April 1993, with support
of the Thai-Indian community. The Centre is active in holding seminars and discussions on
topics relating to India. Thammasat and Silpakorn University are also holding Hindi classes.
Indian Council for Culture Relations (ICCR) has deputed an Associate Professor for Sanskrit
to the Silpakorn University. India has also been assisting the Asian Institute of Technology
(AIT) by providing an annual grant of Rs. 3 Lakhs and seconding Professors for short-term
courses (Embassy of India, 2002).
4.3.2 Potential Areas of Services Trade Expansion
Addressing this issue in the context of India-Thailand FTA it is possible to pin down a
variety of services sectors where potentials for cooperation exist. Our observations are based
on the discussions and meetings with experts and businessmen and are more qualitative in
nature than quantitative.
The following select services sectors are considered as having rich potentials for trade
between India and Thailand:
1) Tourism
2) Information Technology Services
3) Educational Services
4) Audio-visual Services
5) Banking Services
6) Export Finance and Guarantee Services
7) Aviation and Shipping Services
8) Consultancy Services and International Marketing
9) Health Care Services
10) Construction Services
Potentials of cooperation in some of the services sectors are discussed in a rather
detailed manner in Chapter 6.
54
8/8/2019 Indo Thai FTA
http://slidepdf.com/reader/full/indo-thai-fta 55/141
4.4 Investments and Private Sector Linkages
In terms of the impact of a bilateral FTA on investment flows between the two
countries one may highlight that trade and investment linkages run in both the directions.
While trade flows require an initial investment impetus, investments could also take place totake advantage of a liberal trade regime – an additional dimension to the phenomenon of
tariff-jumping investments. This means that investments from one country could flow to the
partner country to take advantage of certain specific conditions like low labour costs, assured
supplies of inputs or other locational advantages like improved infrastructure and
subsequently export back to home country by taking advantage of tariff liberalisation under
the FTA.
Thus, India-Thailand FTA could generate investments in various areas. It needs to be
highlighted that sectors where the possibilities of import competition is relatively greater and
the likelihood of revenue loss is also more could be targeted for investment cooperation
between the countries. The emphasis is to convert the challenges of competition into
opportunities for cooperation.
Cross-investments (FDI) in the capital account of the balance of payments would also
correct for imbalances on the current account, if any. In addition, investments would
strengthen the private sector interactions between the two countries. It can also provide an
opportunity for public-private sector interface.
Summing up
It may be concluded that the FTA between India and Thailand is feasible, desirable
and mutually beneficial. This understanding has been arrived at by assessing the macro
impact of the FTA with the help of a CGE modelling exercise using the GTAP framework;
identification and measurement of potentials of trade expansion on the basis of analysing
trade complementarity, production similarity, potential intra-industry trade, costs of non-
cooperation and the extent of revenue loss under the proposed free trade regime; potentials of
services trade and possibilities of investment expansion.
55
8/8/2019 Indo Thai FTA
http://slidepdf.com/reader/full/indo-thai-fta 56/141
Chapter 5
Sectoral Analysis of the Impact of Preferential Liberalisation
Introduction
The preceding Chapter dwelled upon the impact of tariff liberalisation on various
macro variables. This was accomplished with the application of the GTAP-CGE model. The
potentials of cooperation in trade, services and investments were also analysed. The overall
scenario emerging out of this empirical exercise has positive connotations for the intensive
bilateral economic cooperation process between India and Thailand.
In this Chapter the sectoral impact of the proposed FTA on different sectors is brought
out. This has been undertaken by adopting two approaches. First, documenting the impact on
sectors which was possible to do with the help of the GTAP data. Since the GTAP database
consists of sectors at a fairly aggregate level – which is also one of its limitations as
highlighted in chapter 3 – we have undertaken a detailed analysis of the FTA impact at HS 6-
digit level for select sectors. The latter approach took into consideration product by product
tariff changes in alternative tariff liberalisation scenarios and estimated the possible increase
in imports in each of the countries under consideration. The results of these two approaches
are presented below and suggest that the FTA between India and Thailand would not cast any
substantial adverse impact on select important sectors in both India and Thailand in terms of
any drastic surge in imports under the liberalised bilateral trade regime.
5.1 Sectoral Impacts of FTA: Based on GTAP-CGE Analysis
Using the GTAP modelling we have arrived at the results of the impact of FTA on
different sectors but they are not classified according to the tariff lines. Results suggest that
there would be both positive and negative impact of FTA but the overall impact would be
positive and the negative impact would not be substantial. In any case, sensitive sectors could
always be subjected to a calibrated tariff liberalisation schedule.
Analytically, the positive impact could be in terms of improved market access, hence
higher exports and lower input costs due to cheaper imports. The negative impact could be in
terms of output-contraction on account of import competition. These FTA-influences are
discussed below for India and Thailand.
56
8/8/2019 Indo Thai FTA
http://slidepdf.com/reader/full/indo-thai-fta 57/141
5.1.1 Sectoral Impacts: India
It is discernible from Table 18 that the GTAP results show both positive and negative
FTA impacts for different sectors. On the positive side, some Indian sectors such as minerals,
poultry and seafood, other food products and metal products are expected to gain fromimproved market access in Thailand due to lower tariff barriers. Sectors such as wearing
apparels and leather products gain from lower input costs of imports due to lower Indian
tariffs. On the negative side, some sectors may experience output-contraction resulting from
import competition such as other crops, textiles, chemicals, rubber and plastic products and
motor vehicles and parts. However, in most cases output-contraction is minimal.
Positive Impacts from Market Access
The sectors that display positive impacts in terms of improved market access for
Indian products in the Thai market include minerals, metal products, poultry and seafood and
other food products.
Minerals gain benefits from Thailand’s tariff reduction. This sector’s exports to
Thailand will increase by 2.10 percent. In addition to a rise in export demand, the output of
mineral sector will expand because of the rise in domestic demand. Expansion in its
downstream industries such as metal products, ferrous metals and other metals increases the
demand for mineral products. Mineral output will expand at the rate of 1.80 percent. Higher
demand leads to a 0.12 percent increase in domestic mineral price. The trade balance for the
products will rise by US Dollar 129.13 Million.
Metal products gain benefits as its exports to Thailand will increase by 1.6 percent.
The output of metal products will expand at the rate of 1.04 percent. The trade balance for the
products will rise by US Dollar 8.47 Million.
Other food products’ exports to Thailand will increase by 3.55 percent. Moreover,
this sector will benefit from reduction of India’s tariff barriers, resulting in the cost reduction
of 0.01 percent and the improvement in sectoral competitiveness. The production of other
food products will expand at the rate of 1.79 percent. The trade balance for the products will
rise by US Dollar 69.68 Million.
Poultry and Seafood products are expected to gain benefits from Thailand’s tariff
reduction. Their exports to Thailand could increase by 3.81 percent. Poultry and seafood
productions will expand at the rate of 3.30 percent. The trade balance for the products will
rise by US Dollar 0.44 Million.
57
8/8/2019 Indo Thai FTA
http://slidepdf.com/reader/full/indo-thai-fta 58/141
Positive Impacts from Lower Cost
Wearing apparel will benefit mainly from lower cost of productions due to India’s
tariff rate cuts. When tariff rates of textiles, chemicals, rubber and plastic products are
reduced, the intermediate input cost for the wearing apparel sector could decline by 0.05 percent. This greater competitiveness will rise the export demand for Indian products by 0.52
percent. Lower product price, improvement in domestic income profiles and higher export
demand are expected to raise the output of wearing apparel by 0.13 percent.
Leather products will also benefit mainly from lower cost of production due to
India’s tariff rate cuts. When tariff rates of its intermediate input sector such as leather-based
products, wearing apparel, chemicals, rubber and plastic products are reduced, the
intermediate input cost for the leather sector would decrease by 0.1 percent. This greater
competitiveness will raise the export demand for the Indian leather products by 1.01 percent.
Such factors would help raise the output of wearing apparel by 0.03 percent.
Negative Impacts due to Import Competition
There are certain sectors that could face output contraction due to increased imports
on account of tariff liberalisation. However, it may be mentioned that the results do not point
towards any significant impact in this regard.
Other crops sector could experience a decline in output due to import competition
from Thai products. India’s tariff reduction could raise imports from Thailand by 16.46
percent. As a result, the output of this sector could drop by 0.38 percent.
In the case of Textiles sector, India’s tariff reduction is expected to increase imports
from Thailand by 8.79 percent. As a result, the output of textiles could drop by 0.21 percent.
Chemicals, rubber, and plastic products are likely to have a slightly lower output
contraction. A cut in India’s tariff will lead to increase in imports from Thailand by only 0.03 percent.
Motor vehicles and parts sector is expected to face a higher competition from
Thailand. A tariff cut in imports of motor vehicles and parts will increase imports from
Thailand by 153.8 percent. However, ironically the output in this sector will decrease by
0.01 percent only.
58
8/8/2019 Indo Thai FTA
http://slidepdf.com/reader/full/indo-thai-fta 59/141
5.1.2 Sectoral Impacts: Thailand
According to the GTAP results of sectoral impacts of FTA for Thailand summarised
in Table 19 just like the Indian case, the FTA could have both positive and negative
implications for different sectors. On the positive side, some sectors such as sugar; textile;leather; chemical, rubber and plastic products; vehicles and parts and electronic equipment
may benefit from more exports to India due to improved market access. Sectors such as
plant based fiber, steel and machinery may expand due to the increased production activities
in their downstream sectors. On the negative side, import competition may cause a decline in
output in sectors such as other minerals, food products and wearing apparel. However, the
negative effects appear to be inconsequential
Positive Impacts from Market Access
It is expected that the Sugar sector could benefit from reduction in India’s import
tariff. As a result, exports to India and production in Thailand of sugar could increase by
3.24 percent and 1.87 percent, respectively.
Other Crops’ exports to India may grow by 0.48 percent and output in this sector
could expand by 0.32 percent.
Textiles will benefit from reduction in India’s tariff rate and an expansion in India’s
wearing apparel sector. Thailand’s export of textiles to India is likely to grow by 175.82
percent, leading to 8.0 percent surge in total textiles export. The production is expected to
expand by 2.36 percent.
Chemicals, Rubber and Plastic products are likely to gain from cut in tariff barriers
due to which Thailand’s export to India could rise by 104 percent. Output expansion of 3.07
percent and a price rise of 0.14 percent are also expected.
Products belonging to the Vehicles and parts sector may benefit from tariff cut and
the exports of Thai automobile industry to India may grow by 153 percent while its total
exports can increase by 8.45 percent. Expectation for production expansion is by 0.56
percent.
Electronic equipments sector is expected to benefit from tariff reduction. Due to
which exports to India may increase by 269.46 percent while the total exports could grow
only by 0.5 percent. In addition, total output of this sector may increase by 0.46 percent.
59
8/8/2019 Indo Thai FTA
http://slidepdf.com/reader/full/indo-thai-fta 60/141
Gains from Expansion of its Downstream & Overall Economy
Plant based fiber sector may grow by 1.25 percent due to an increasing demand from
the textiles sector. Since the textiles sector is likely to gain from higher exports to India,
plant based fiber which is an important intermediate input for textiles, will obtain some benefits from FTA.
Steel sector could grow by 0.68 percent as a result of the production and exports
expansion in vehicles and parts, and metals products.
Negative Impacts due to Import Competition
Minerals sector could experience a decline in output due to import competition.
Tariff reduction may increase import into Thailand by 49.79 percent while the sectoral total
import will rise by 2.74 percent. As a result, the output of minerals may drop by 0.52
percent.
Other food products are likely to have a slightly lower output-contraction caused by
import competition. A cut in Thailand ’s tariff will lead to increase in import of Thailand in
the sector by 1.66 percent while the domestic output may decline by 0.36 percent.
On the other hand, the Wearing and apparel sector is likely to face a higher
competition from Indian products in Thai market. Thailand’s tariff cut in imports, together
with lower cost of production of India’s products will make imports increase from India by
2.74 percent. As a result, the output in this sector could decrease by 0.05 percent.
Summing up it may be reiterated that the positive impact of the FTA in the case of
both India and Thailand appear to be more relevant. The evidence of some output-contraction
effects in both the countries arising due to import competition from the partner country has
come out to be miniscule in most sectors. Nevertheless, in the case of sectors where domestic
production needs to be safeguarded a gradual approach to tariff liberalisation could be
adopted.
5.2 Impact on Select Sectors: Explorations at a Disaggregated Level
As highlighted above, one of the limitations of the GTAP modelling is that the data is
at an aggregated level. In the second approach an attempt has been made to assess the impact
of tariff liberalisation under the India-Thailand FTA on some select sectors at a disaggregated
level. One of the highlights of an empirical exercise as this is in terms of its ability to make
the assessments in different tariff liberalisation scenarios.
60
8/8/2019 Indo Thai FTA
http://slidepdf.com/reader/full/indo-thai-fta 61/141
Sectors included in the analysis for Thailand and India are Agri-Business and
Processed Food, Rubber and Rubber Products, Textiles and Clothing, Gems and Jewellery
and Automobiles and Auto Parts, Organic, Inorganic and Agro Chemicals, Drugs and
Pharmaceuticals, Leather and Leather Products and Iron and Steel.The results of such an exercise suggest that under different tariff liberalisation
scenarios the impact in terms of an increase in imports into the countries under consideration
in the specific sectors would cause any significant concern domestically, by way of upstaging
stiff import competition. The methodology, information about data and the results are
analysed below. The results are analysed in the backdrop of a brief profile of each of these
sectors and some possible areas of cooperation are also identified.
Methodology
The import profiles of select sectors of each country were analysed at HS 6-digit
disaggregated level. The quantity and values of imports by each country from the world at
this level were used to compute unit values of products and subsequently their elasticities.
On the basis of these elasticities, expected increase in bilateral imports in value terms in these
sectors under four scenarios of tariff liberalisation viz. tariff reduction from the existing level
to 50 percent (Scenario I), 25 percent (Scenario II), 10 percent (Scenario III) and 0 percent
(Scenario IV) levels were obtained. The determination of the levels of tariffs under different
scenarios was guided by the fact that the present range of tariff levels pertaining to the sectors
under question was observed to be 60percent - 1percent.
Data
The data was obtained from UNCTAD, Trains, CD-ROM, 2001 in the case of
Thailand and CMIE/DGCIS, India Trades, CD-ROM, 2001. While both the import and tariff
data were available from Trains for Thailand, imports for India were obtained from the
above-mentioned database and the Indian tariff data was taken from the website of the
Central Board of Excise and Customs, Government of India. The data for Thailand’s imports
are of 1999 and tariff pertain to 2000. In the case of India both imports and tariff data are of
2001. It is worth mentioning that while the tariff data for India are at HS 6-digit level, the
tariff data for Thailand are available at HS 10-digit level. Hence, Thailand’s tariff was
converted into 6-digit level for the sake of comparability with the Indian data.
Since the bilateral imports of the two countries are at a nascent stage about 250 tariff
lines could be considered ultimately for the analysis. Out of which those tariff lines were
61
8/8/2019 Indo Thai FTA
http://slidepdf.com/reader/full/indo-thai-fta 62/141
excluded for which either the quantity or the value data was not available. Furthermore,
products with wrong elasticity signs were also excluded. It is a matter of further research to
find explanation for the unexpected elasticity signs.
Results
The results are presented first for Thailand and subsequently for India vis-à-vis
sectors such as agri-business and processed food, automobiles and auto parts, textiles and
clothing, gems and jewellery, drugs and pharmaceuticals, organic, inorganic and agro
chemicals, iron and steel and leather and leather products and rubber and rubber products. It
is worth-mentioning that in the Tables 20 and 21 summarising results have some blank cells
which means that the tariff levels were already lower than the tariff level of the scenario to
which the cell belongs. For instance, empty cells under the Scenario I against the rubber and
rubber products implies that the tariff levels of the products for which this computation was
possible in this sector were already lower than 50 percent level.
Sectoral Impact in India and Thailand
We present below a sector-by-sector analysis of the possible impact in the chosen
sectors of the tariff liberalisation under different scenarios both at the aggregate sector level
and at the level of HS 6-digit disaggregation.
In the case of Thailand, the maximum impact is visible in textiles and clothing sector
followed by leather and leather products, agri-business and processed food, organic,
inorganic and agro-chemicals, rubber and rubber products, iron and steel, automobiles and
auto parts and gems and jewellery (Table 20).
In the case of India, the maximum impact is visible in organic, inorganic and agro
chemicals sector followed by leather and leather products, agri-business and processed food,
iron and steel, textiles and clothing, rubber and rubber products, drugs and pharmaceuticals,
gems and jewellery and automobiles and auto parts in terms of the absolute volume of
imports (Table 21). However, in terms of share of the expected increase in the total imports
from Thailand in a particular sector the impact varies.
Agri-business and Processed Food
Both India and Thailand are well endowed with natural and raw material resources
required for the Agri-Business and Processed Food Sector. The climate is also quite suitable
for the production of agricultural products, fisheries, aqua-culture products and diary
62
8/8/2019 Indo Thai FTA
http://slidepdf.com/reader/full/indo-thai-fta 63/141
products. Both the countries have developed in the areas of foodgrain production, commercial
crop production, plantation crops, horticultural crops, etc. The countries have also succeeded
in terms of flows of agricultural credit as well as in terms of agricultural mechanisation.
A large part of the population is dependent on Agriculture and it has offered immenseemployment opportunities to their peoples. Both India and Thailand are leading producers of
Rice, Maize, Sorghum, Soyabean, Groundnuts, Pineapple, etc. For instance, total world
production of Rice was 598,852 thousand tonnes in 2000 of which production in India was to
the tune of 134,150 thousand tonnes and in Thailand it was 25,608 thousand tonnes. In the
case of Pineapple total world production was 13,504 thousand tonnes in 2000 of which
production in Thailand was to the extent of 2,287 thousand tonnes and in India it was 1,440
thousand tonnes. Both the countries are leading exporters in various spheres of Agri-Business
and Processed Food.
Impact
The potential increase in imports of Thailand in this sector could be US Dollar 13.94
Million if the tariff level in year 2000 is brought down to 50 percent level (Scenario I). It is
evident from Table 20 that this could increase to US Dollar 16.45 Million, 19.33 Million, and
22.77 Million under Scenarios II (25 percent), III (10 percent) and IV (0 percent). The impact
seems to low or moderate as these volumes of import surge account for 7 percent, 9 percent,
19 percent and 23 percent shares in total imports of this sector from India the four scenarios,
respectively.
The products that might experience relatively higher surge in imports from India have
been identified at HS 6-digit level as 030349, 151530, 220830, 230310, 160420, 120740,
030342, 030741 etc. Overall, this sector does not appear to be experiencing very high import
surge on account of tariff liberalisation under the India-Thailand FTA. However, for some of
these products a gradual approach in tariff reduction could be adopted given the impact on
them.
This sector is expected to face import competition in India from the Thai products as
the likely increase in the imports could be in the range of US Dollar 6.56 Million (Scenario
II) to US Dollar 37.84 Million (Scenario IV). In terms of the share of increase in total imports
of this sector from Thailand it is somewhat unusual, ranging between 61percent to 350percent
between Scenarios II and IV. This could be explained by the unusual price and quantity
relationships in this sector’s imports from Thailand which is reflected in large elasticities and
in turn in such shares. Therefore, estimates could only be considered as specific to a
63
8/8/2019 Indo Thai FTA
http://slidepdf.com/reader/full/indo-thai-fta 64/141
particular phase and not as a general phenomenon as also due to lack of adequate data to
calculate alternative elasticities.
Some of the prominent sectors having relatively larger impact are HS 200799,
170490, 180690, 200980. Possible Cooperation
The bilateral trade between India and Thailand pertaining to this sector has been quite
low since the overall bilateral trade between them has not been substantial. The need for
cooperation between India and Thailand in this sector is evident from the fact that both the
countries face somewhat similar challenges in the context of WTO Agreements. The
importance of the sector is such that the proposed FTA between India and Thailand would
have to be oriented in such a way that both the countries experience mutually beneficial gains
for this sector without having any adverse implications in terms of sudden import surge and
output contraction. The proposed FTA could perhaps ensure regular supplies of raw materials
in both the countries, help in jointly withstanding the global competition and assist in jointly
evolving various sanitary and phyto-sanitary measures that have emerged as major non-tariff
barriers in the developed world. Another area for cooperation could be development of
technology on testing and quality control.
Automobiles and Auto Parts
This sector has been a prominent one in both India and Thailand. The Thai
automotive industry has been growing over the past decade. In early 1990s, the government
liberalised the import regime and restructured the tax system that resulted in market
expansion. Many countries focused on investing in Thailand and it is considered the “Detroit
of Asia” (ARGC, 2002). Despite the recent recession after the crisis there are still continuous
flows of foreign investments from the major manufacturers viz. Toyota, Mitsubishi, BMW,
Benz-Chrysler, GM and Ford-Mazda. The total investment is about 100 Billion Baht. The
strengths in auto parts industry are the qualified and skilled labours, large market size and its
strategic location in Asia. After the drop in vehicle market in 1998, growth was recovered by
51 percent (1999), 20.1 percent (2000) and 13.3 percent (2001) with total sales reaching
297,052 units (Bangkok Post, 2002).
The Indian automotive industry is characterised by strong competition among quality-
conscious manufacturers. A large, highly skilled and low cost manufacturing base makes it
amenable to overseas business linkages. Since early 1990s, companies such as Suzuki,
Daewoo, Hyundai, Ford, GM, Honda, Volvo and Toyota have set up manufacturing bases in
64
8/8/2019 Indo Thai FTA
http://slidepdf.com/reader/full/indo-thai-fta 65/141
the market. After the growth of 20 percent between 1993-97 the industry experienced a
slowdown due to global trends. In 2000-2001, production of passenger vehicles was 630,592
units, commercial vehicles 152,079 units, two wheelers 3,929,321 units and three wheelers
around 192,111 units (http://www.tradepartners.gov.uk). The growth in vehicle sector hascaused growth in the auto-component industry.
Impact
The level of potential increase in imports of Thailand form India in this sector is
extremely miniscule. It may rise in the range of US Dollar 0.01 Million to 0.48 Million
between Scenario II and IV. The anaysis was not posssible under Scenario I as the traiff
levels in Thailand were already lesser than 50 percent in this sector. The share of the
expected import surge in total imports of Thailand from India in this sector is almost
insignificant, even in the Scenario of free trade.
At the disaggregated level, the products that can experience the impact relatively
more are HS Codes : 871494, 871493 and 871496. Thus, in this sector, possibilities of import
competition from Indian products appears to be very low.
This sector appears to remain isolated from the FTA impact in India as the expected
increase in import volume falls within the range of US Dollar 0.005 Million (Scenario II) and
0.03 Million (Scenario IV). However, in terms of share the impact is very much visible as the
share ranges between 6.45 percent and 38.70 percent for the II and IV Scenarios.
Only one HS code viz. 871499 is expected to experience the impact. This is so due to
data limitations.
Possible Cooperation
Between India and Thailand there is ample scope for intra-industry trade in both
motor vehicles and auto components segments, as the present level of trade is very small.
Joint ventures, joint efforts for improvement in efficiency, training manpower, etc. could be
possible areas of cooperation.
Textiles and Clothing
Textiles and Clothing sector has been a source of foreign exchange earnings, domestic
income generation, employment generation in both India and Thailand. Both are important
players in the global textiles and clothing market.
This sector is deemed as the largest one in Thailand which has developed through the
import substitution regime and has become an export oriented industry. In Thailand, this
industry contributed on an average more than 10 percent of the total exports and 15 percent of
65
8/8/2019 Indo Thai FTA
http://slidepdf.com/reader/full/indo-thai-fta 66/141
the GDP during the last 5 years. In terms of employment, there are 1.14 Million workers in
this industry which accounted for 26-29 percent of total employment in the manufacturing
sector since 1993 (ARGC, 2002).
In the case of India, this sector adds about 14 percent to industrial production, 45
percent to total national export earnings and 4 percent to GDP. It provides direct employment
to about 35 Million people and is the second largest job provider after agriculture in India
(http://www.tradepartners.gov.uk).
Both India and Thailand have been competing with each other in the global market
and the kind of industrial cooperation that could have taken place between them has not been
undertaken at an intensive level. Even the existing trade linkages are not significant.
Impact
This sector in Thailand is likely to face a stiff competition from Indian products as
revealed by the estimates. Under Scenario II, imports could increase to the extent of US
Dollar 0.04 Million but it could be to the tune of US Dollar 61.07 Million and 363.29 Million
under Scenarios III and IV, respectively. This could be deemed as a significant impact in
terms of the increase in the level of imports. It is significant also in terms of the share of the
increase in imports in total imports from India of textiles and clothing items. The shares
peratining to the four scenarios are 0.047 percent (Scenario II), 61.07 percent (Scenario III)
and 92.57 percent (Scenario IV).
At the disaggreagate level it may be observed that the overall effect in this sector is
generated by only a handful of products. Intense competition may occur in HS products such
as 500310, 520911, 611090, 6110990, 520512 etc. This suggests that although the textiles
and clothing sector would be subject to maximum competition in relation to other sectors that
are under consideration, at the disaggregate level the effect would be concentrated only in a
few product/tariff lines.
This sector is expected to face stiff competition in the Indian market from Thai
products in the domestic maarket as the possible increase in imports could be US Dollar
10.52 Million, 15.24 Million and 24.29 Million under the Scenarios II, III and IV. On the
other hand, due to large values of elasticities, the impact in terms of share in existing level of
imports from Thailand also turns out to be unexpectedly large: 160 percent (Scenario II), 232
percent (Scenario III) and 370.25 percent (Scenario IV).
Some of the products experiencing relatively larger impact are HS 630790, 590320,
540241, 580429, 590700, 600243 etc.
66
8/8/2019 Indo Thai FTA
http://slidepdf.com/reader/full/indo-thai-fta 67/141
Possible Cooperation
Both the countries need to (i) facilitate Indo-Thai joint ventures, (ii) establish fashion
design center targeting higher-end markets which requires joint collaboration in computer-
aided-designing (CAD) and computer-aided-manufacturing (CAM), (iii) establish local brand
names for the international market, (iv) provide local small and medium enterprises adequate
support in management and marketing, (v) cooperate to improve the dying technique for yarn
and fabric production, etc.
Gems and Jewellery
The gems and jewellery industry is another very prominent one in the industrial and
trade space of both India and Thailand. In the case of India it is one of the foremost foreign
exchange earner for the country and accounts for 17 percent of country’s total exports during
2001-2002. In 2000-2001 India exported jems and jewellery items worth US Dollar 7.7
Billion. India’s international market share of diamonds in 55 percent by value; 80 percent by
caratage and 95 percent by pieces (http://www.indiaonestop.com). The range of products
include cut and polished diamnonds, coloured gemstones, gold jewellery, pearls, non-gold
jewellery, synthetic stones, fashion jewellery, etc. Since this sector is highly labour intensive
it has been a major employment generating sector in India.
In the case of Thailand this sector features in the list of top 10 export products with a
proportion of 2.6 percent in total exports and with the production level of 2 Million pieces a
year. This sector employs 1.2 Million workers in Thailand. It needs to be highlighted that 80
percent of the production in value terms are exported, of which, 70 percent is exported in the
form of processed ornaments and the rest in the form of gemstones. Thailand is an important
lapidary centre which allows Thai manufacturers to have a competitive advantage in the
world market (ARGC, 2002). Some of the major items of exports from Thailand are pearl,
non-lapidary jewellery, lapidaries jewellery, ornaments, emulated ornaments, synthetic
jewellery, etc.
Gems and jewellery items are one of the most prominent ones within the ambit of
India-Thailand trade relations. However, the present level of trade is far from its potential.
Some of the items that are traded bilaterally are non-industrial diamonds, precious and semi-
precious stones, articles of jewellery and parts thereof, rubies, sapphires and emeralds
worked, etc.
67
8/8/2019 Indo Thai FTA
http://slidepdf.com/reader/full/indo-thai-fta 68/141
Impact
At the aggregate level, this sector in Thailand is expected to experience an increase of
imports from India to the tune of US Dollar 0.024 Million and 0.047 Million under Scenarios
III and IV. This miniscule absolute sum is also reflected in the value of its meagre share in
total imports from India to Thailand of gems and jewellery items – in the range of 2 – 4
percent.
The meagre impact could be misleading. Due to data related problems such results
have come about. Several Gems and Jewellery products could not be included into
calculations because of lack of quantity data. Moreover, in several cases the impact
assessment could not be made as the elasticity estimates were far from satisfactory. Hence,
only two products viz. HS 710310 and 711311 could be included in the analysis due to data
limitations. It is worth emphasising at this stage itself, even at the cost of digression, that
unless information gap between the countries is bridged both empirical analysis and the
policy making process would be based only on an incomplete understanding of the benefits
and costs of cooperation.
In the case of India, Gems and Jewellery products do not seem to be facing very
significant import competition from Thailand as the likely increase in the import volume
could only be US Dollar 0.30 Million, 1.21 Million and 1.81 Million under II, III and IV
Scenarios. However, with respect to its share in total imports from Thaialnd of gems and
jewellery products the impact does appear to be of some concern as it ranges between 1.85
percent (Scenario II) and 11.13 percent (Scenario IV).
Some of the products experiencing relatively larger impact are HS 710692, 711319,
711790 etc.
Possible Cooperation
The potential areas of cooperation in this sector could include: (i) exchange of skilled
manpower in diamond and stone-cutting, (ii) cooperation to ensure stable supply of raw
materials, (iii) joint development of advance technology, (iv) collaboration in upgradation of
certifying and testing facilities, (v) establishing joint product design centres.
Drugs and Pharmaceuticals
Drugs and pharmaceuticals sector has also developed in both India and Thailand. In
Thailand, there is competition between local manufactures and foreign subsidiaries of
medicines and pharmaceutical products. There are approximately 200 local manufacturers
and about 400 foreign subsidiaries/representatives. This sector has suffered due to the Thai
68
8/8/2019 Indo Thai FTA
http://slidepdf.com/reader/full/indo-thai-fta 69/141
economic crisis. According to one estimate the total size for the pharmaceutical market was
worth 28 Billion Baht in 1999 (ARGC, 2002). It is important to highlight that the local
pharmaceutical industry in Thailand is mainly a formulating industry and does not involve
much R&D. Most of the pharmaceutical ingredients of locally manufactured drugs areimportant. To elaborate, the Thai pharmaceutical market is made up of locally produced
domestic drugs (generic products, which account for an estimated 46 percent of the drugs on
the market), locally produced international brands (about 32 percent of the market), and
imports (22 percent of the market) (www.pacificbridgemedical.com).
The Indian pharmaceutical sector is highly fragmented with over 20,000 registered
units. The leading 250 pharmaceutical companies control 70 percent of the market, with the
market leader Glaxo SKB having only a 5.7 percent market share in 2000. The top 10
companies cover around 31 percent of the pharma market. Because of Government price
controls and the fragmented nature of the market, it is an extremely competitive industry
which has evolved around the opportunities presented in the regulated environment
(www.tradepartners.gov.uk). The industry currently demonstrates wide ranging capability in
the field of drugs and medicines’ manufacture and in terms of technology. In addition to
pharmaceutical formulations the country produces over 350 Active Pharmaceutical
Ingredients which are manufactured from the basic stage. The ancillary industry is also well
developed and an extensive range of pharmaceutical manufacturing equipments is locally
produced. The size of the market in India was estimated at US Dollar 3.8 Billion in 2000.
Indian pharmaceutical sector accounts for 1percent of the global sales in value terms and
8percent in terms of volume.
Drugs and pharmaceuticals are being traded between India and Thailand but not in big
volumes.
Impact
Data limitations prevented an analysis of this sector in the case of Thailand.
However, in the case of India this sector can experience a surge in imports from
Thailand to the extent of US Dollar 0.46 Million, 1.83 Million and 2.74 Million under
Scenarios II, III and IV, respectively. However, the share of expected increase in these
Scenarios could be 0.43 percent, 1.71 percent and 2.57 percent in total imports of these
products from Thailand.
The effect is mainly concentrated in products such as 300290, 300510, 300390 and
300490. Thus, it appears that this sector would remain relatively insulated from the adverse
effect of FTA from the point of view of India.
69
8/8/2019 Indo Thai FTA
http://slidepdf.com/reader/full/indo-thai-fta 70/141
Possible Cooperation
The possible areas of cooperation could include: (i) setting up joint-ventures, (ii)
scientific research, (iii) marketing tie-up with overseas pharmaceutical companies jointly, (iv)
development of products that have gone off-patent, (v) joint studies on WTO TRIPs
Agreement.
Organic, Inorganic and Agro Chemicals
India has a sizeable domestic chemicals market. It is not only large but quite
diversified and mature as well. Almost all segments, such as organic chemicals, inorganic
chemicals, agro chemicals, coatings, dyes and pigments, soaps and cosmetics,
pharmaceuticals, fertilisers and speciality chemicals, have a sizeable presence. The size of thechemical industry is estimated at US Dollar 28 Billion. The share of inorganic chemicals is
8percent, organic chemicals 15 percent, drugs and pharmaceuticals 15 percent, soap and
toiletries 11 percent, fertilisers 18 percent, other chemicals 3 percent, etc. The Indian
chemical industry has shown impressive growth over the years and has been among the
fastest growing sectors of the Indian economy. It accounts for about 12.5 percent of the
country’s industrial production, 12 percent of the exports of manufactured goods. The
industry contributes 19 percent of the excise and customs revenue
(www.tradepartners.gov.uk).
Besides the presence of world majors such as Unilever, ICI, Hoechst, Dupont, BASF,
Bayer and Glaxo, there are thousands of large, medium and small scale companies in this
sector. For examples, in dyes and dye intermediates alone there are over 100 small-scale
companies compared to 50 large companies in the organised sector. Most of the small and
medium size plants operate on batch processes, whereas some of large producers have highly
automated continuous process plants.
India is currently the largest manufacturer of pesticides and the second largest
producer of agrochemicals in Asia. India exported chemicals worth Rs. 193,687 Million and
plastics and rubber products worth Rs. 48,607 Million in 2000-2001 which is a reflection the
growing acceptance of Indian chemical products worldwide. The easy availability of raw
materials, a trained and skilled workforce, a technically qualified managerial cadre base and
low production costs have made India an attractive sourcing destination for multinationals.
Many overseas companies are also undertaking collaborative research with local companies
and institutions.
70
8/8/2019 Indo Thai FTA
http://slidepdf.com/reader/full/indo-thai-fta 71/141
The chemicals industry in Thailand has improved the quality of Thai manufactured
goods in many industries ranging from agriculture to textiles and from metal working and
electronics to petrochemicals and ceramics. In so doing, the chemical industry has enabled
the Thai industry to compete in international markets not only in terms of price but alsoquality. Thailand has been exporting chemical products such as cosmetics, albuminoidal
substances, fertilisers, carbon black, solvents, etc. Thailand also has a large petrochemicals
industry producing 1.7 Million tonnes per year of ethylene and 4.15 Million tonnes per year
of plastic resins. Thailand is also an exporter of polyolefins and exports more than 2 Million
tonnes per year of speciality plastic resins. Thailand’s chemical industry continues to attract
significant levels of foreign investment. During the first half of 2000 six projects were
approved in basic chemicals, five projects in other chemicals with total investment in the
chemical sector amounting to US Dollar 500 Million (http://www.boi.go.th).
The trade figures pertaining to this sector are relatively higher than other products as
far as the bilateral trade between India and Thailand is concerned. However, in terms of
absolute levels of trade it is quite low.
Impact
The impact in this sector in Thailand would be miniscule, primarily because already
the prevailing tariff levels are equal to or less than 10 percent category for the products data
was available. The increase in imports could be around US Dollar 7 Million under the
Scenario of free trade: Scenario IV. In terms of the share also the impact appears to be
minimal.
Some of the products experiencing relatively larger impact are HS 292320, 294110,
294150, 281511, 381710, etc.
This sector would be the quite affected in the case of India as it may be subjected to
an upsurge in imports from Thailand to the tune of US Dollar 1.66 Million, 47.24 Million and
131.69 Million under the Scenarios II, III and IV. Nevertheless, the impact is low in terms of
the share of expected increase in India’s total imports in this sector from Thailand as it turns
out to be less than 1percent in Scenario II and III but it is 2.70percent under Scenario IV.
At the HS 6 digit level, some of the products displaying relatively higher impact
include HS codes: 290123, 283650, 283210, 292219, 292221, 293100 etc.
Thus, even this sector does not raise any serious concern in the event of an FTA
coming into being.
71
8/8/2019 Indo Thai FTA
http://slidepdf.com/reader/full/indo-thai-fta 72/141
Possible Cooperation
In this sector the following areas could be studied for possible cooperation: (i)
collaboration in scientific research, (ii) technological and human resource development, (iii)
creation of an industry database and (iv) developing niche markets.
Iron and Steel
There are 150 steel product manufacturers in Thailand with a combined annual
production capacity of 20 Million tonnes and a combined workforce of 20,000. The majority
of industry is made up of downstream manufacturers producing mainly reinforcing bar, wire
rod and section for the construction industry. Many of them import scrap iron for forging into
billets that are re-rolled into steel bars (http://www.tradeport.org). Development of further
upstream production for basic products such as pig iron and sponge iron and intermediate
products such as billets, glooms, and slabs are the areas that need more policy and business
attention. Some of the constraints coming in the way of this sector are unavailability of large
capital fund, inadequate supplies of iron ore, high cost of fuel for smelting, etc. The total
exports from this sector amounted to US Dollar 969.2 Million in 2000
(http://www.thailand.com/exports).
The last decade in India has seen inefficient steel mills with outdated technology
declining while new capacities have come up that possess latest technology and expertise.
The potential demand for steel in India is vast with the per capita steel consumption being
26.7 Kg compared to the global average of 121 Kg in 2000-2001. This offers a huge potential
to steel manufacturers. Finished steel production recorded a growth rate of 7.7percent in
2000-2001 and reached the level of 29.27 Million tonnes (Government of India, 2002). The
production of pig iron at 3.4 Million tonnes recorded a growth rate of 6.8 percent in the same
year. However, the growth of the industry has been slower than expected due to sluggish
demand in the steel consuming sectors, overall economic slowdown in the country,
competition from cheap imports and anti-dumping restrictions raised by developed countries
on India’s exports.
The bilateral relations in this sector are low and the potential has not been tapped as
yet.
Impact
This sector appears to be insulated from the proposed tariff liberalisation under FTA
as far as Thailand is concerned. Imports could increase in this sector in the range of US
72
8/8/2019 Indo Thai FTA
http://slidepdf.com/reader/full/indo-thai-fta 73/141
Dollar 0.51 – 3.36 Million and the shares may be in the range of 0.001 percent - 0.008
percent.
Some of the products experiencing relatively larger impact are HS 722830, 731819,
721129, 722790, etc.
The Indian iron and steel sector could experience an increase in imports on account of
tariff liberalisation under FTA to the extent of US Dollar 9.58 Million, 25.21 Million and
35.63 Million under the three Scenarios depicting reduction in tariff levels to 25 percent, 10
percent and 0 percent (i.e free trade), respectively. Once again it is noticeable that the impact
is marginal as the increased imports would account for equal to or less than 1 percent of the
prevailing level of imports from Thailand to India.
The products of this sector that would be experiencing relatively higher impact
include 721934, 732399, 732690, 721090, 731590, 731815 etc. This sector, in the ultimate
analysis, may not be adversely affected by the FTA.
Overall, the analysis at the disaggregated level for both Thailand and India in the case
of specific sectors suggest that the domestic market in both the countries would not
experience any significant import competition due to any massive upsurge in imports from
the partner country, excepting a few sectors. However, at the individual product level at the
HS 6 digit classification some efforts would be required to calibrate the tariff liberalisation
proposals and setting up of joint ventures in those products could be promoted after
examining all its dimensions. The above exercise has at least identified the products that can
be taken note of within the ambit of trade and investment policy and accordingly the FTA
may be evolved.
Possible Cooperation
Cooperative endeavours may include trade augmentation in raw material and
intermediate goods, reduction of cost in various operations like smelting, joint marketing, etc.
Leather and Leather Products
Due to its labour intensive nature this industry provides employment opportunities to
over 0.2 Million in Thailand. The industry makes value added products out of heights of
cattle through leather tanning industries and thus produces goods like leather shoes, bags,
gloves, etc. There are 20 large leather tanning producers that represent 60 percent of the total
market share. Large tanneries allot about 50 percent of their leather for local consumption
and the remaining is exported worldwide. The Thai tanning industry has a combined annual
production capacity of 150,000 tonnes. More than 90 percent of leather product
73
8/8/2019 Indo Thai FTA
http://slidepdf.com/reader/full/indo-thai-fta 74/141
manufacturers are in the middle and small business. Majority of Thai leather products are
exported. The export value of leather products in 1999 was at 16.95 Billion Baht (ARGC,
2002).
In India, the small scale, cottage and artisan sector account for over 75 percent of the
total production in leather industry. Exports from leather sector account for 4.3 percent of
India’s exports (Government of India, Department of Industrial Development, Annual Report ,
2002).
Impact
In terms of absolute volume of imports this sector in Thailand is likely to experience
moderate impact but in terms of shares the impact would be insignificant. The increase in
imports could be around US Dollar 17 Million, 35 Million and 46 Million under the
Scenarios II, III and IV, however, the respective shares are less than 1percent.
Some of the products experiencing relatively larger impact are HS 420212, 640319,
640620, etc.
As for India, impact in this sector is relatively more as the likely increase in imports
from Thailand comes out to be US Dollar 12.32 Million, 49.29 Million and 73.94 Million
under Scenarios II, III and IV, respectively. In terms of the share of the expected import
increase in India’s total imports in this sector from Thailand the impact is noteworthy as it
turns out to be 2.50 percent, 10.00 percent and 15 percent.
Some of the relatively more prominent products in terms of the impact are 640419,
640199, 640320, 640699 and 640620.
Possible Cooperation
Possible areas for cooperation may include: (i) developing technology for cost
reduction, (ii) improving quality of tanned leather, (iii) training of artisans with exposure to
information technology tools, etc.
Rubber and Rubber Products
While Thailand is the world’s largest producer of Rubber, India too is one of the
largest Rubber producing countries. In both the countries different Rubber products like tyres,
tubes, washers, sheets, gloves, conveyor belts, aprons, rubber moulded goods, automotive
components, etc. are produced on a large scale. Apart from having economies of scale both
the countries are producers of rubber products of international standards.
In Thailand around 800,000 household are engaged in rubber plantation of 12.29
Million rai (i.e. 76.81 Million hectares). There are about 1,745 rubber processing firms.
74
8/8/2019 Indo Thai FTA
http://slidepdf.com/reader/full/indo-thai-fta 75/141
Around 25,00 employees are in primary processing i.e. production of smoked sheets and
rubber liquid and approximately 44,000 employees are in secondary processing such as
rubber wrap, glove, etc. In India the industry has 32 producing units just in the field of tyre
production spread out in 13 states. There are around 220 medium scale units and over 5,500
units in the small scale sector as well as an equal number in the tiny sector with an annual
turnover of over Rs. 12,000 crore. This sector directly employees about 3.5 lakh people
(Government of India, 2001).
One important trend witnessed in this sector is that global manufacturing of rubber
products is shifting its base from the US and the EU markets towards the Asian region due to
cheaper labour costs. One of the modalities through which it is being accomplished is through
Business Process Outsourcing (BPO). The BPO opportunity in this sector is pegged at US
Dollar 100 Billion (Business Line, 2002).
Impact
This sector, in the case of Thailand, does display the possibility of some impact at the
aggregate level though the extent is small. While the expected increase in imports from India
to Thailand could be a mere US Dollar 0.001 Million under Scenario II, it could rise to US
Dollar 4.43 Million and 4.91 Million under Scenario III and IV, respectively. The share of
increased volume of imports in total imports from India of rubber and rubber products could
be in the range of 15 – 17 percent.
In this sector too, the aggregate impact arises due to high concentration of the effect
of tariff liberalisation in just a few tariff lines at HS 6 digit-level. Just one product viz.
401220 exhibits almost all the impact pertaining to this sector. Other products showing little
impact are 400821, 401120 and 401699.
The import increase in India could be in the range of US Dollar 3.04 Million to 18.25
Million between the Scenarios II and IV. In terms of share the impact is very large in
Scenario III and Scenario IV mainly due to rare values of elasticities that came about due to
lack of data availability.
Some of the products experiencing relatively larger impact are 400219, 400299,
400950, 401699 etc.
Possible Cooperation
India and Thailand could establish more intensive trade linkages under the proposed
FTA, set up trade-creating joint ventures to target the global market, undertake joint R&D,
collaborate in the domain of BPOs vis-à-vis developed countries, etc.
75
8/8/2019 Indo Thai FTA
http://slidepdf.com/reader/full/indo-thai-fta 76/141
Summing up
This chapter has demonstrated both with the help of the results obtained from the
CGE modelling and disaggregated sectoral analysis that overall India and Thailand might not
experience any significant upsurge in imports or output contraction due to the proposed FTA between the countries. If at all, there are notable positive implications in terms of improved
market access, enhanced product competitiveness due to lower costs and an impetus to
downstream production and exporting activities in various sectors in both the countries. It is
worth mentioning that some of the results obtained on the basis of the CGE Approach and the
disaggregated sectoral analysis are bound to be somewhat different because of the difference
in methodologies.
However, specific products and sectors do require addressing the concerns that get
raised on account of likely imports-surge and for such specific products a gradual approach
towards tariff liberalisation is warranted. Alongside, sectors in which both countries are likely
to compete with each other could be considered for joint venture and investment cooperation
and trade of the intra-industry variety may be focused upon.
On the basis of the analysis presented in this Chapter one can reiterate that the
proposed FTA between India and Thailand is not only feasible but also mutually beneficial to
a large extent provided certain adjustment costs are taken into account while setting it in
place.
76
8/8/2019 Indo Thai FTA
http://slidepdf.com/reader/full/indo-thai-fta 77/141
Chapter 6
Possible Benefits of Cooperation in Other Areas
Introduction
As it has been observed in the previous chapters although the present level of
economic linkages between India and Thailand are limited the potentials of trade expansion
are immense. There could also be cases wherein more intensive investment cooperation could
be possible however, a more detailed study of it could be taken up. Viewing trade in the
wider framework of development the study also attempts to identify other dimensions of
cooperation, including investment and technology, in select sectors so as to take advantage of
the trade-development linkages. The sectors chosen for exploring the potentials of
cooperation between India and Thailand in this context include fisheries and aquaculture;
information, communication and space technology; biotechnology; finance and banking;
tourism; and infrastructure development. This chapter investigates into these areas and tries
to identify the dimensions on which bilateral cooperation could bring in mutual benefits.
6.1 Fisheries and Aquaculture
Both India and Thailand have had a prominent fisheries and aquaculture sector. They
have great potentials in developing this sector through bilateral cooperation. Both countries
have long coastal areas that can be jointly promoted so as to make this sector more dynamic
in terms of production and exports.
Total output from this sector is higher in India than Thailand. It can be observed from
Tables 22 and 23 that the distribution of total output from this sector has been almost equal
between marine and inland sources however, in the case of Thailand the marine sector outputis higher than India and in the case of inland source the situation is reverse. This is due to
relatively large land area in India. Nevertheless, it appears that in the Indian case marine
sources could be exploited more with the help of Thai cooperation, considering that the
fisheries sector on the whole has been one of the major sources of foreign exchange earnings
for Thailand.
For marine fisheries, the Indian Government policy has been to subsidise the poor
fishermen for motorising their traditional crafts. This helped increase the fishing areas andfrequency of operation. The result has been an increase in total catch and earnings of
77
8/8/2019 Indo Thai FTA
http://slidepdf.com/reader/full/indo-thai-fta 78/141
fishermen. The Government has also been operating a scheme of reimbursing the central
excise duty on oil used by fishing vessels below 20 meters length to offset the operational
costs. These measures among others have helped the fish production in India.
In the case of Thailand, shrimp production has received policy attention. Even withsome environmental implications, shrimp farms in Thailand have created significant amount
of production both for domestic consumption and for exports. In Thailand, shrimp farm areas
spread over several provinces (Table 24) and tend to produce some negative impact on rice
farming. Recently, the Government has expressed some concern over the land use issue and
came up with some measures to deal with the shrimp farm’s environmental impacts.
The Indian Government’s scheme in aquaculture has been to utilize the brackishwater
area for shrimp culture. At present, approximately 22,857 hectares have been developed for
shrimp culture. Presently, 39 Brackishwater Fish Farmers Developed Agencies (BFDAs)
functioning in the coastal areas of the country provide a package of technical, financial and
extension support to shrimp farmers. Guidelines prepared for sustainable development and
management of brackishwater aquaculture have been circulated to all concerned States and
other agencies. The guidelines incorporate measures for mitigating the adverse impact of
shrimp farming on the coastal eco-system. An aquaculture authority has been established
under the Environment Protection Act to control the coastal aquaculture and to ensure that the
aquaculture activities are carried out in an environment- friendly and sustainable manner.
Thus, cooperation in the environmental implications of shrimp farming could be another area
of bilateral cooperation. This could also promote bilateral intra-industry trade between the
coulntries.
Potential Bilateral Cooperation
Cooperation in scientific research and development in the area of aquaculture and
fisheries, both inland and marine, could enhance the capability of production and trade for
both countries. This could provide avenues for bilateral trade, investment and technology
flows between the countries.
6.2 Information, Communication and Space Technology
Recent information technology revolution has brought to the fore various aspects of
developmental challenges that need to be taken cognizance of. First, information has become
a crucial input into most of the economic activities. Second, asymmetry between haves and
have-nots of the information has also increased and it is considered that such an asymmetry
78
8/8/2019 Indo Thai FTA
http://slidepdf.com/reader/full/indo-thai-fta 79/141
could result into the continuation of the gap between the developed and developing countries.
Thirdly, this gap is due to the nature, quality and the ability to process information. The
technologies that are required for information processing are also mainly in the hands of the
developed countries and this has manifested itself in what has come to be known as ‘digital
divide’. Therefore, digital divide is in terms of access to information per se as well as control
over information and communication technologies (ICT). Since a major part of the ICT is
used via the space, capability to acquire and use space technologies also become crucial for
bridging the present phenomenon of digital divide.
In a scenario wherein India and Thailand have acquired considerable capability in the
software and hardware sectors, respectively various dimensions of cooperation could be
contemplated which could help both the countries facing the challenges of digital divide at
the global level. In this regard, the potentials, a priori, are immense. The following areas in
the information and communications technologies could be considered both for trade and
investment (joint ventures): consumer electronic goods, electronic instruments, office
equipments, medical equipments, telecom equipments, computer hardware, software services
and telecom services and projects. Cooperation in these areas would also facilitate trade in
goods as envisaged in the India-Thailand FTA through improved competitiveness of products
and checking delays both at the firm level and the policy level.
Out of the whole gamut of electronic and software products Thailand has not emerged
as a major destination for India’s exports (Table 25). It features prominently in the case of
India’s exports of transformers in the electronic components, head stack, switching mode
power supply in the computer hardware sector (Table 26). Thailand does not feature
significantly as a destination in the area of consumer electronic, telecommunications
equipments and even computer software exports from India. These trends are contrary to
popular perceptions that India has comparative advantage only in the software sector and not
in the hardware sector. Perhaps, in the latter there is scope for promoting intra-industry trade
with Thailand. A fresh impetus in the realm of the FTA is needed for not only boosting trade
in this sector but also investment promotion.
In terms of space technology a lot more can be done to strengthen the partnership
between India and Thailand. For instance, one of the international cooperation programmes
of the Indian Space Research Organisation (ISRO) is conducted through the Centre for Space
Science and Technology Education in Asia and the Pacific (CSSTEAP) which is sponsored
by the United Nations. The centre is established with a view to promote space technology
cooperation in the Asia-Pacific region with a view to space technology capability building.
79
8/8/2019 Indo Thai FTA
http://slidepdf.com/reader/full/indo-thai-fta 80/141
Present Status of Cooperation
A Memorandum of Understanding (MoU) on Cooperation in Information Technology
& Science was signed on 28-11-2001 in New Delhi. As a follow-up to the MoU, the Indo-
Thai Information Technology Joint Task Force was set up and is scheduled to meet soon.
The Agreement on Cooperation in the Exploration & Use of Outer Space for Peaceful
Purposes envisages cooperation in the fields of Space Science, Exploration of Outer Space,
Monitoring of the Earth’s Environment for Outer Space and Remote Sensing of the Earth,
Plan and conduct Joint Space Projects of Mutual Benefit and interest, Training Personnel,
Exchange of Scientists and facilitate their participation in Joint Research Activities and
Projects, Exchange of Documentation, Equipment, Experimental Data, Scientific Information
and Literature etc. Joint Symposia and Conference, Joint use of Launch Vehicles and any
other area of cooperation to be determined by both sides. Executing Organisation are the
Indian Space Research Organisation (ISRO) and the Geo-Informatics and Space Technology
Development Agency (GSTDA). The executing Organisation may set up Joint Working
Groups, if deemed necessary for more detailed management of individual aspects of joint
activities etc. (Embassy of India, 2002).
Potential Bilateral Cooperation
The following policy steps could be initiated for strengthening cooperation between
India and Thailand in Information, Communication and Space Technology to meet the
challenges of digital divide:
1. Create an online database on trade, investment and technology partners in
India and Thailand.
2. Trade, investment and technological cooperation could be explored in sectors
such as consumer electronic goods, electronic instruments, office equipments,
medical equipments, telecom equipments, computer hardware, software
services and telecom services and projects.
3. Joint ventures in the software sector to tap the global market and intra-industry
trade and investment in the hardware sector need to be accorded strategic
focus.
80
8/8/2019 Indo Thai FTA
http://slidepdf.com/reader/full/indo-thai-fta 81/141
6.3 Biotechnology
The biotechnology revolution has opened up new vistas of opportunities, especially in
the agriculture sector, in developed and developing countries alike. In the case of developing
countries, often with limited scope for extending land area for agri-production, biotechresearch and applications have promised enhanced production levels, productivity growth,
employment opportunities, lower food prices etc. However, developments such as these have
also been associated with the concerns relating to bio-safety and more recently, with the
WTO Agreements coming in force, they have heightened a quest for preserving the
traditional knowledge-systems in the developing countries.
As for the status of biotechnology in India and Thailand it is not possible to do justice
to this subject at this stage. However, a brief profile is presented here, that too only on some
dimensions. In the case of India, the major institutions that are engaged in promotion of
biotechnology research are Department of Science and Technology (DST), Council of
Scientific and Industrial Research (CSIR), Department of Biotechnology (DBT), Indian
Council of Medical Research (ICMR), Indian Council of Agriculture Research (ICAR),
University Grants Commission (UGC), Department of Scientific and Industrial Research
(DSIR) etc. Just to provide the rigour of their activities on an illustrative basis the proposed
role of DBT in promoting industrial application of biotech is given in the box below.
Changing Role of DBT
In recent times, DBT has taken up a proactive role in promotion of industry. DBT
proposed a single window application-processing cell as part of a new regulatory system for
the domestic biotechnology sector. The move formed part of the recent recommendations on
biotechnology sector made by the Confederation of Indian Industry (CII). Besides
recommending setting up of a single window application-processing cell at DBT, CII had
also suggested a fixed time frame of 150 days for clearing new biotech proposals
In this regard, CII had recommended a process whereby a new application would be
sent by the single window agency to the Review Committee on Genetic Manipulation
(RCGM), which in turn would be required to submit a scientific evaluation report within 60
days of receiving the applications. This report will be submitted to the relevant approval
committee, identified by the end product category. For example, in case of agricultural
products, it would go to the Genetic Engineering Approval Committee (GEAC), in case of
pharmaceutical products to the Drugs & Pharma Approval Committee (DPAC), and in case
81
8/8/2019 Indo Thai FTA
http://slidepdf.com/reader/full/indo-thai-fta 82/141
of food products to the Biotech Foods Approval Committee (BFAC). The
GEAC/DPAC/BFAC would be required to accord approval or rejection within 90 days of
receiving the evaluation report from RCGM. In case of rejection of the application, the
applicants will also have the right to appeal to the concerned approval committee. CII had
also suggested that any additional information required by RCGM for completeness of the
application form would have to be called for within 30 days of receipt of the application.
Besides DBT, the recommendations were submitted by CII to 14 other agencies, including
seven ministries. Most of the recommendations submitted by CII have been accepted by
DBT.
Source: Chaturvedi (2002).
In terms of the sectoral diffusion of biotech companies in India it is discernible from
Table 27 that their activities are quite concentrated in agriculture followed by health
biotechnology.
While India has been actively engaged in biotech research it has also kept the bio-
safety concerns at the forefront, especially in the wake of WTO Agreements on TRIPs and
the Biosafety Protocol. The concerns have taken into account the interests of the farming
community and the protection of the environment.
One major issue that has been widely debated is the perceived threat from
biotechnology “from the larger involvement of the private sector as a provider of seeds and
other planting material in Indian agriculture, where achieving food security was set as the
basic objective. The direction of public sector research was in keeping with this objective:
both food crops and commercial crops formed a part of the research agenda. But while public
sector research took a balanced view, private sector showed keen interest in the commercial
crops, giving very little attention to the corps linked with the food security of a developing
country. These seeds, better known now as ‘terminator seeds’, were aimed at preventing
farmers from re-using the seeds obtained from a year’s harvest” Dhar (2001).
The issue of safe handling of GMOs in research, application and technology transfer
has been yet another vast area of debate and intensive policy making process in India
(Chaturvedi, 2002). Moreover, extensive efforts are on for the preservation of traditional
knowledge.
Biotechnology has grown over the years in Thailand too. This sector has grown
steadily since 1983 (see Table 28 for an illustration). Thailand has a good research
82
8/8/2019 Indo Thai FTA
http://slidepdf.com/reader/full/indo-thai-fta 83/141
infrastructure for the biotech explorations (Damrongchai, 2002). The conventional research in
plant and animal breeding, agronomy, animal husbandry, soil science etc. has culminated into
sophisticated research in biotech, cellular and molecular biology and biosafety.
A comparison of the crop biotechnology R&D in India and Thailand is made in Table29 (Hautea, 2002). It shows that there exists both complementarity and similarity in efforts.
Both complementarities and similarities provide for different avenues for bilateral
cooperation by way of R&D collaborations, exchange of research scientists, etc. However,
these aspects require more in-depth investigations.
Present Status of Cooperation
A modest programme of bilateral cooperation in the field of science and technology
has been in existence in the form of collaboration programme between CSIR-TISTR (Council
of Scientific and Industrial Research – Thailand Institute of Scientific and Technological
Research). A project-oriented plan is being implemented. A new working programme for two
years was signed in December 1999 between CSIR and TISTR during a visit to India by a
six-member TISTR delegation. The areas identified for cooperation were Biotechnology,
Herbal Drug & medicinal plants, food technology, fire research, eco-toxicity assessment,
glass blowing, metrology and standards and building materials. High-level exchanges have
taken place between CSIR & TISTR. The head of the Institute of Science, Technology and
Development Studies (ISTAD) visited TISTR in April 2000 for discussions regarding joint
projects and again in November 2000 for discussions with the TISTR delegation to India to
review the existing CSIR-TISTR S&T Programme and identified areas for cooperation. The
areas are Ethics in Biotechnology, exchange of Science books and journals. The Thai side
showed interest in CD-ROMs on Medicinal & Aromatic Plants. Training and research at
National Physical Laboratory and Centre for Biotechnology were also discussed. Setting up
of a Fire Research Facility at TISTR with CSIR assistance is under consideration (Embassy
of India, 2002).
Potential Bilateral Cooperation
The following areas could be studied in greater detail for possible bilateral
cooperation: (i) R&D collaboration (ii) Bio-safety (iii) Preservation of traditional knowledge
(iv) Common positions in multilateral fora.
83
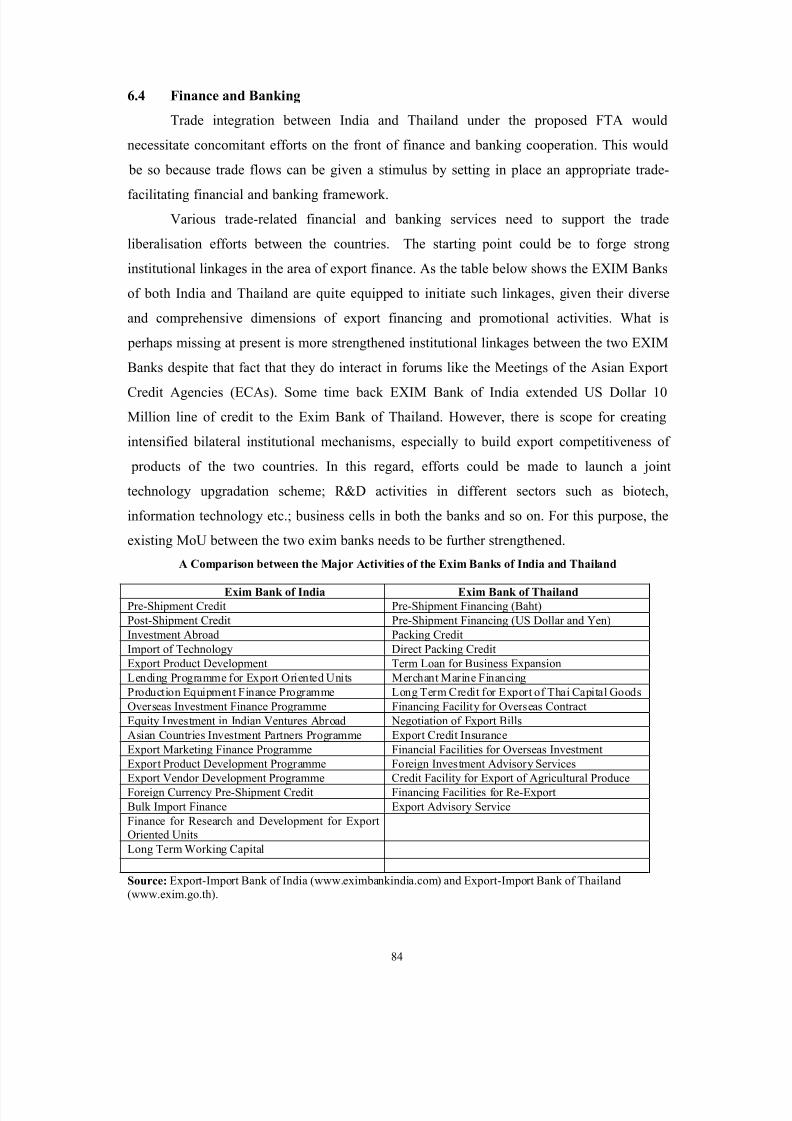
8/8/2019 Indo Thai FTA
http://slidepdf.com/reader/full/indo-thai-fta 84/141
6.4 Finance and Banking
Trade integration between India and Thailand under the proposed FTA would
necessitate concomitant efforts on the front of finance and banking cooperation. This would
be so because trade flows can be given a stimulus by setting in place an appropriate trade-facilitating financial and banking framework.
Various trade-related financial and banking services need to support the trade
liberalisation efforts between the countries. The starting point could be to forge strong
institutional linkages in the area of export finance. As the table below shows the EXIM Banks
of both India and Thailand are quite equipped to initiate such linkages, given their diverse
and comprehensive dimensions of export financing and promotional activities. What is
perhaps missing at present is more strengthened institutional linkages between the two EXIM
Banks despite that fact that they do interact in forums like the Meetings of the Asian Export
Credit Agencies (ECAs). Some time back EXIM Bank of India extended US Dollar 10
Million line of credit to the Exim Bank of Thailand. However, there is scope for creating
intensified bilateral institutional mechanisms, especially to build export competitiveness of
products of the two countries. In this regard, efforts could be made to launch a joint
technology upgradation scheme; R&D activities in different sectors such as biotech,
information technology etc.; business cells in both the banks and so on. For this purpose, the
existing MoU between the two exim banks needs to be further strengthened.
A Comparison between the Major Activities of the Exim Banks of India and Thailand
Exim Bank of India Exim Bank of Thailand
Pre-Shipment Credit Pre-Shipment Financing (Baht)
Post-Shipment Credit Pre-Shipment Financing (US Dollar and Yen)
Investment Abroad Packing Credit
Import of Technology Direct Packing Credit
Export Product Development Term Loan for Business Expansion
Lending Programme for Export Oriented Units Merchant Marine Financing
Production Equipment Finance Programme Long Term Credit for Export of Thai Capital Goods
Overseas Investment Finance Programme Financing Facility for Overseas ContractEquity Investment in Indian Ventures Abroad Negotiation of Export Bills
Asian Countries Investment Partners Programme Export Credit Insurance
Export Marketing Finance Programme Financial Facilities for Overseas Investment
Export Product Development Programme Foreign Investment Advisory Services
Export Vendor Development Programme Credit Facility for Export of Agricultural Produce
Foreign Currency Pre-Shipment Credit Financing Facilities for Re-Export
Bulk Import Finance Export Advisory Service
Finance for Research and Development for ExportOriented Units
Long Term Working Capital
Source:Export-Import Bank of India (www.eximbankindia.com) and Export-Import Bank of Thailand
(www.exim.go.th).
84
8/8/2019 Indo Thai FTA
http://slidepdf.com/reader/full/indo-thai-fta 85/141
In terms of the present status of the banking relations between the countries it is found
that is at a very preliminary stage and there is ample scope for bilateral cooperation. As
revealed by Tables 30 and 31 the presence of Indian banks in Thailand and Thai banks in
India is almost negligible. However, this is not to suggest that potentials for cooperation donot exist in this sector. The Indian policy regime has of late become quite conducive for
promoting FDI in the banking sector (see box below) and the Thai banks could take
advantage of that so as to facilitate the trade integration process as envisaged in the proposed
FTA.
Foreign Direct Investment in the Banking Sector in India
The norms relating to foreign direct investment (FDI) in the Indian banking sector are
governed by the overall foreign investment policy as well as guidelines laid down by the
Reserve Bank under various statutory provisions.
Limit for FDI under Automatic Route in Private Sector Banks
a) FDI up to 49 percent from all sources is permitted in private sector banks under the
automatic route, subject to conformity with the guidelines issued by the Reserve Bank
from time to time.
b) Initial Public Offerings (IPOs), private placements, ADRs/GDRs and acquisition of
shares from existing shareholders are included for the purpose of determining the above
mentioned FDI ceiling under the automatic route.
c) Issue of fresh shares under the automatic route is not available to those foreign investors
who have a financial or technical collaboration in the same or allied field. This category
of investors requires FIPB approval.
d) The automatic route is not applicable to transfer of existing shares in a banking company
from residents to non-residents. This category of investors requires approval of FIPB,
followed by "in principle" approval of the Reserve Bank. The "fair price" for transfer of
existing shares is determined by the Reserve Bank, broadly on the basis of SEBI
guidelines for listed shares and the erstwhile Controller of Capital Issues (CCI) guidelines
for unlisted shares. After receipt of "in principle" approval, the resident seller can receive
funds and apply to the Reserve Bank for obtaining final permission for transfer of shares.
e) Under the Insurance Act, the maximum foreign investment in an insurance company has
been fixed at 26 percent. Application for foreign investment in banks which have joint
venture/subsidiary in insurance sector should be made to the Reserve Bank. Such
85
8/8/2019 Indo Thai FTA
http://slidepdf.com/reader/full/indo-thai-fta 86/141
applications will be considered by the Reserve Bank in consultation with Insurance
Regulatory and Development Authority (IRDA).
f) Foreign banks having branch presence in India are eligible for FDI in the private sector
banks subject to the overall cap of 49 percent with the approval of the Reserve Bank.
Limit for FDI in Public Sector Banks
FDI and portfolio investment in nationalised banks is subject to overall statutory limits of 20
percent. The same ceiling would also apply in respect of investments in the State Bank of
India and its associate banks. The norms also include provisions relating to (i) voting rights of
foreign investors, (ii) approval of the Reserve Bank and reporting requirements, (iii)
conformity with SEBI Regulations and Companies Act Provisions and (iv) disinvestment by
foreign investors.
Source: Reserve Bank of India (2002).
In India, foreign banks were so far allowed to set up branches but not subsidiaries.
The Union Budget 2002-03 announced the elimination of this restriction to allow foreign
banks to set up subsidiaries in India. A foreign bank could choose either to set up a subsidiary
or have branch presence. Such subsidiaries will have to adhere to all banking regulations,
including priority sector lending norms, applicable to other domestic banks. Necessary
amendments to the Banking Regulation Act, 1949 to relax the maximum ceiling of voting
rights of 10 percent for such subsidiaries would be brought about. Guidelines in this regard
are being worked out by the Reserve Bank of India (RBI, 2002).
With the policy reforms several financial services can also be rendered. As on
30.06.2002, 41 foreign banks are operating 203 branches in India. Foreign banks are also
permitted to set up Representative offices in India. At present 25 foreign banks are having
representative offices in India. They are required to give their applications to Reserve Bank
of India which are considered in consultation with Government of India, representative
Offices cannot undertake any commercial activities or earn profit, all their expenses are to be
met out of inward remittances received from abroad.
Representative offices are permitted to undertake the specific type of work which
includes liaison work, correspondent banking, loan syndication, risk management for
companies engaged in raising money overseas, International trade finance such as
86
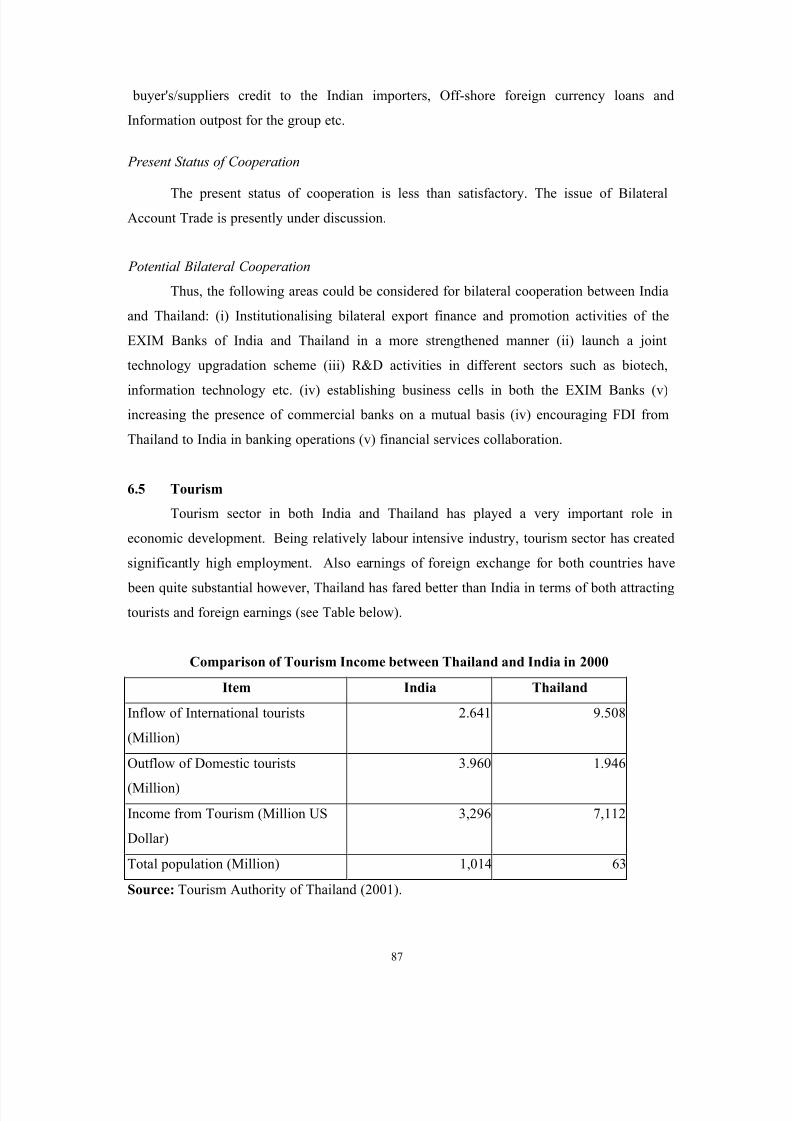
8/8/2019 Indo Thai FTA
http://slidepdf.com/reader/full/indo-thai-fta 87/141
buyer's/suppliers credit to the Indian importers, Off-shore foreign currency loans and
Information outpost for the group etc.
Present Status of Cooperation
The present status of cooperation is less than satisfactory. The issue of Bilateral
Account Trade is presently under discussion.
Potential Bilateral Cooperation
Thus, the following areas could be considered for bilateral cooperation between India
and Thailand: (i) Institutionalising bilateral export finance and promotion activities of the
EXIM Banks of India and Thailand in a more strengthened manner (ii) launch a joint
technology upgradation scheme (iii) R&D activities in different sectors such as biotech,
information technology etc. (iv) establishing business cells in both the EXIM Banks (v)
increasing the presence of commercial banks on a mutual basis (iv) encouraging FDI from
Thailand to India in banking operations (v) financial services collaboration.
6.5 Tourism
Tourism sector in both India and Thailand has played a very important role in
economic development. Being relatively labour intensive industry, tourism sector has created
significantly high employment. Also earnings of foreign exchange for both countries have
been quite substantial however, Thailand has fared better than India in terms of both attracting
tourists and foreign earnings (see Table below).
Comparison of Tourism Income between Thailand and India in 2000
Item India Thailand
Inflow of International tourists
(Million)
2.641 9.508
Outflow of Domestic tourists
(Million)
3.960 1.946
Income from Tourism (Million US
Dollar)
3,296 7,112
Total population (Million) 1,014 63
Source: Tourism Authority of Thailand (2001).
87
8/8/2019 Indo Thai FTA
http://slidepdf.com/reader/full/indo-thai-fta 88/141
For India, tourism has emerged as in instrument for employment generation and
poverty alleviation. During 1999-2000, direct employment in the tourism sector was
estimated to be 15.50 Million. Tourism also promotes national integration and international
understanding and gives support to local handicrafts and cultural activities. Tourism in India
has grown substantially over the last three decades. Foreign tourist arrivals during 2000 were
2,641,157. However, India’s share in the world tourist market during 2000 was a mere 0.38
percent. Foreign exchange earnings from tourism during 2000 were estimated at 140,475
Million Rupees.
In order to further accelerate the development of tourism in India, the policy thrusts
given for tourism promotion are on development of infrastructure; product development and
diversification; development of eco-adventure sports and wildlife tourism; exploring new
source markets; environmental protection and cultural preservation of national heritage;
launching of national image building and marketing plans in key markets; providing
inexpensive accommodation in different tourist centres; streamlining of facilitation
procedures at airports; human resource development; creating awareness and public
participation; and facilitating private sector participation in development of infrastructure,
etc.
The hotel sector is one of the most important segments of the tourism industry with
high potential for employment generation and foreign exchange earnings. To give impetus to
this sector, the government provides tax benefits and other incentives. The industrial policy
has now placed hotels and tourism related activities as a priority industry. Foreign
investment and collaborations are now facilitated under the new economic policy. Automatic
approval is available for foreign equity investment up to 100 percent in hotel and tourism
sector.
India has bilateral air services agreements with 96 countries as on 31 May 2001.
India and Thailand also have tourists exchanges but the level of tourists flow from Thailand
to India has been relatively low as compared to western tourists (Table 32).
The Bilateral Agreement on Aviation between India and Thailand comprises 3
national airlines, namely, Air India, Indian Airlines and Thai Airlines. The Agreement has
fixed the maximum capacity at 4,1 00 seats per week from each side. Including the operation
of other airlines, there are 44 direct flights operating between Bangkok and destinations in
India. This includes, 22 flights per week for Calcutta, 30 flights per week for New Delhi, 15
88
8/8/2019 Indo Thai FTA
http://slidepdf.com/reader/full/indo-thai-fta 89/141
flights per week for Madras, 31 flights per week for Mumbai, 2 flights per week for
Bangalore, and 2 flights per week for Guwahati.
Visa on arrival for maximum stay of 15 days is allowed for Indian nationals at Thai
International port of entry including Bangkok, Chiangmai, Phuket, Had Yai, Utaphao, MaeSai and Chiang Saen.
Present Status of Cooperation
A draft Agreement on Tourism Cooperation between India and Thailand is under
negotiation. Apart from the draft agreement, the Indian Mission in Thailand has been making
efforts to promote tourism especially in the Northeastern states of India after the
commencement of direct Air India biweekly flight between Guwahati and Bangkok in April2002. In addition, efforts are also being made to promote tourism to Buddhist circuits in
India. Both Thailand and India have also decided to open tourist offices in New Delhi and
Bangkok, respectively to strengthen cooperation in tourism. Thai Tourist Office has already
started functioning from the Thai Embassy in New Delhi.
It is important to note that Indian Airlines flights between Bangkok and Gaya have
commenced as recently as on December 18, 2002 in an effort to link the Indian and Thai
Centres on the Map of Buddhism.
Potential Bilateral Cooperation
India has great potential in historical, cultural and eco-tourism. This also includes
Buddhist Circuit Tourism, Asian Highways and Capital Cities Tour. Thailand would also
benefit from greater aviation link with India and could promote Thailand as a gateway for
India into ASEAN countries. Increase in the travel service and air transport between
Thailand and India would help promoting tourism for both countries. Joint tourism
promotion, charter flight agreement, eco-and cultural tourism, development of tourism
infrastructure such as hotel, restaurant and travel services, air tourism safety, avoidance of
double taxation, tourism facilitation, business traveller privilege and development of national
tourism standards could be some of the potential areas of cooperation.
6.6 Infrastructure Development
Infrastructure development is considered as a key to enhance the economicdevelopment in general and economic cooperation in particular. Without adequate
89
8/8/2019 Indo Thai FTA
http://slidepdf.com/reader/full/indo-thai-fta 90/141
infrastructural facilities trade augmentation between two countries is not possible even if
tariffs are liberalised. Similarly, developed infrastructural services have emerged as an
important determinant of FDI inflows. There could be several subsectors of the infrastructure
sector that need to be focused upon for achieving developmental objectives. But in thecontext of India-Thailand FTA, highway and seaport facilities are considered relatively more
important.
Highways
In India, the development of National Highways is done through. budgetary support.
The supporting funds are also available from funding agencies such as the World Bank, the
Asian development Bank etc. As far as the Indian transport system is concerned, recently
there has been a major shift in the pattern of demand for transport service as the
transportation mode is changing from railways to the road sector. However, according to the
National Highways Authority of India, about 40 percent of habitations are not connected by
good roads. Therefore, there seems to be existing some potential demand for roads in India.
On the other hand, Thailand has made substantial progress in terms of creating highway
infrastructure. The complementarity may be tapped by inviting Thai FDI into the road sector
in India for which the FDI regime in India is quite conducive. A detailed study on this aspect
is warranted. This would contribute to facilitating trade flows not only between India and
Thailand but also to other countries from India.
Seaport
India has about 5,600 kilometers of main coastline serviced by 12 major ports and
181 other ports. The major ports are under the purview of the Central Government, while
other ports come under the jurisdictions of the respective State governments.
It is reported that about 90percent of Indian international trade operates through
seaports. The major seaports in India are as follows: Mumbai, Calcutta, Haldia, Cochin,
Kochi, Kandla, Chennai, Mormugao, Jawahar Lal Nehru (Nhava Sheva), Paradip, Tuticorin,
Visakhapatnam, Ennore and New Mangalore. Of these ports, Mumbai Jawahar Lal Nehru,
Kandla, Mormugao, New Mangalore and Cochin port are on West coast, while Calcutta,
Haldia, Paradip, Visakhapatnam, Chennai, Ennore and Tuticorin, are on east coast. With
growing, international trade, there seems to be future potential demand for development of
these seaports together with industrial estates and in-land container depots.
90
8/8/2019 Indo Thai FTA
http://slidepdf.com/reader/full/indo-thai-fta 91/141
Present Status of Cooperation
It was decided to establish trilateral transport and other linkages between India-
Thailand and Myanmar. Pursuant to this the India-Myanmar-Thailand Foreign Ministers met
during 5th
-6th
April 2002 in Yangon. It was agreed to construct a highway to connect India-
Myanmar-Thailand to promote cooperation between Southeast Asia and South Asia. The road
from Moreh in India to Mae Sot in Thailand through Bagan in Myanmar is to be completed
within two years. Two Task Forces have been set up: one on financing to be chaired by
Thailand and the other on technical matters to be chaired by India (Embassy of India, 2002).
Potential Bilateral Cooperation
Since Thailand is relatively well endowed with highways the potential cooperation between Thailand and India might be in terms of private sector joint ventures in road
construction projects. Other possible areas could be reconstruction of weak bridges;
modernisation of road construction technology for speedy execution; road quality assurance;
engineering measures to improve road safety, etc.
Potential cooperation in seaport related development might be in the areas of
containerisation of sea transport and seaport management as well as management of industrial
estate and free trade zones. Other areas could include coastal shipping development, ship
building technology, ship repair, in-land water transport and public enterprise privatisation.
6.7 Healthcare
Healthy citizens and healthy communities have emerged as important determinants of
economic development. Health care sector displays advancement on some dimensions and
underdevelopment on other dimensions in both India and Thailand. Some of these
dimensions are analysed below, in the context of which, potentials for cooperation between
India and Thailand are highlighted.
The broad health indicators suggest that Thailand has made tremendous progress in
this sector. It has been able to reduce infant mortality, improve immunisation rates and
increase life expectancy. Health care in Thailand is financed primarily through the
programmes such as (i) voluntary health insurance, (ii) mandatory programmes, (iii) social
welfare programmes, and (iv) fringe benefits. Considerable progress has been made in terms
of checking the growing incidence of HIV spread.
91
8/8/2019 Indo Thai FTA
http://slidepdf.com/reader/full/indo-thai-fta 92/141
However, there are several dimensions on which this sector has not been able to
succeed as it should have. First, gains in terms of improved health indicators have not been
equitably distributed around 40percent of Thai population does not have access to adequate
healthcare, primarily in rural areas (World Bank, 1999). Second, it has been observed that
various financing schemes are not rationalised. Consequently, some people are covered by
several different programmes while others received no coverage at all. According to an
estimate around 23 Million people are not covered by any financing schemes. Third, children
in Thailand have been found vulnerable to poor nutrition.
There has been a significant progress in various aspects of health care in India. Some
of the states like Kerala, Maharasthra, Punjab, etc. have made considerable progress in terms
of the health indicators like the infant mortality rate, life expectancy, crude death rate, etc.
Impressive strides have been made in recent years in the realm of state-of-the-art hospitals in
the country. These hospitals use the latest technical equipments and provide services of
highly skilled medical personnel. Since these services are often available at competitive
prices patients from all over the world come to India for specialised treatment. All India
Institute of Medical Sciences (AIIMS, New Delhi) is considered as a leading medical
university in Asia (www.healthlibrary.com).
However, health care sector deserves priority attention due to a plethora of unattained
objectives. First, the advancements made in this sector in India has been uneven and
restricted to a few states. Second, during the last few years there has been rising incidence of
communicable diseases. Third, the country also lacks in terms of addressing adequately the
health problems that arise due to the modernisation process like heart diseases, accidents,
traumas, etc. Fourth, optimising the existing rural health infrastructure throughout the country
is yet another major challenge in the Indian context. The country also lacks in terms of a
health management information system. Fifth, the country also lacks in terms of handling the
health related impact of developmental projects that include incidence of pesticide poisoning,
pollution, gradual degradation of ground water and emergence of Malaria. And finally,
village schools do not have adequate sanitation and safe drinking water facilities.
Potential Bilateral Cooperation
Against this background of progress and underdevelopment in India and Thailand
with respect to the health care sector some potential areas for cooperation between the two
countries can be identified: (a) launching a Joint Health Programme to increase coverage of
population, (b) initiating a Joint Health Investment Programme for extending health care
92
8/8/2019 Indo Thai FTA
http://slidepdf.com/reader/full/indo-thai-fta 93/141
provisions to village schools with special focus on nutrition, sanitation and safe drinking
water facilities, (c) increasing trade in health services, (d) setting in place low-cost health
management information system, (e) starting a scheme for handling health related impact of
developmental projects.
6.8 Construction
It is an obvious fact that availability of infrastructure services serves as an important
determinant of economic development. In the various infrastructure sectors such as
telecommunications, power, railways, roads, ports, airports etc., construction industry plays
a crucial role. Construction industry, among other activities, meets the needs of
housing/dwelling units, railway lines, roads, bridges etc. Being a labour intensive industry itis one of the biggest employers in developing countries demanding for unskilled labours on
one hand and qualified architects, on the other. The construction industry is an important
indicator of economic buoyancy in any country. A boom in construction industry would not
only mean many more jobs but growth in other important sectors of economy, like steel and
cement as well.
A close look at this industry suggests that there is scope for cooperation in this
industry between India and Thailand. While in recent years India has witnessed growth in this
sector, Thailand has confronted with a slowdown – especially, after the economic crisis of the
late nineties. There are complementarities that provide avenues for cooperation. The
infrastructural weaknesses in India and relatively developed infrastructure in Thailand present
a situation of complementarity at one dimension. The recent trends of growth and slowdown
in India and Thailand, respectively in this industry also display complementarities at another
dimension.
Construction stocks have been growing since the last year or so in India (Business
Line, 2002). This is attributed to, among other things, the Government's renewed thrust on
infrastructure spend and the Golden Quadrilateral road project. Most companies recorded a
higher growth in turnover. For instance, Hindustan Construction posted a 27 percent rise in
turnover. For L&T, the total value of projects on hand as of March 2002 was 26 percent
higher than in the previous year, and for Hindustan Construction, it jumped by 38 percent.
‘These statistics clearly indicate a demand pick up in the industry. The industry contributes a
little over 5 percent of the country's GDP and 37 percent of all investments. But if one takes
into account the multiplier effect it has on other core sectors such as cement, steel, housing
93
8/8/2019 Indo Thai FTA
http://slidepdf.com/reader/full/indo-thai-fta 94/141
finance and also on employment generation, the contribution might go up to 10 percent. At
present, the demand is primarily from the road development housing sectors’ (Business Line,
2002).
The Government's mega Golden Quadrilateral and other highway projects havethrown up fresh opportunities for construction companies. Also, in the past few years, the
housing sector has attracted chunk of the investments. According to the CMIE estimates,
construction in the household sector rose significantly, from 44 percent to 53 percent of the
total construction activity in the country during 1995-2000. The annual average growth rate
of the construction sector for the next three-four years is projected at about 7.4 percent.
Though the potential for growth appears significant, certain constraints need to be
taken note of. Road projects, which constitute a significant portion of the orders, are a low-
value-added activity. On the other hand, due to intense competition both domestic and
international players are compelled to bid low prices. Another problem is the financing of
such huge projects. The projections are based on the assumption of increased participation by
the private sector through the `public-private partnership' and foreign investments. However,
it is in this context that there appears to be scope for cooperation between India and Thailand.
In the case of Thailand, although this industry has witnessed growth, the aftermath of
the recent crisis is far from over. This is reflected in the trends perceived in the demand for
construction materials like glass, cement, ceramic tiles etc. For instance, during 1999-2000,
all Thai glass companies have decreased their production by 40-50 percent (ARGC, 2002).
One reason has been the sluggish domestic market and another reason has been increased
competition both by domestic and foreign companies.
The cement industry in Thailand has made critical adjustments since the crisis. Faced
with foreign debts and decreasing domestic demand the industry has encountered huge losses.
Investments plans to raise productivity have retarded. Competition has increased
tremendously. Domestic demand for cement in 1998 and 1999 was only 20.65 and 19.0
Million tons respectively compared to 36.0 Million tons in 1997 (ARGC, 2002).
Consequently, domestic manufacturers are targetting the export market.
In the case of ceramic tiles, the total production capacity was 1.89 Million metric tons
in 1999 whereas the actual production was only 1.42 Million metric tons – which is about 75
percent of the overall capacity. The production of mosaic tiles has been decreasing due to
high production costs (ARGC, 2002).
The facts mentioned above are pointers to the fact that producers in the construction
industry in Thailand have been facing problems of overproduction. They are trying to
94
8/8/2019 Indo Thai FTA
http://slidepdf.com/reader/full/indo-thai-fta 95/141
diversify to the export markets. On the other hand, India needs more investments in its
infrastructure sector as a whole and construction industry in particular. The growth climate in
this industry in India is also promising.
Potential Bilateral CooperationAgainst this backdrop, the following areas for cooperation in this industry could be
contemplated: (a) Increasing trade in construction materials between India and Thailand, (b)
Setting up joint ventures to enhance competitive capabilities and meet financial requirements,
(c) Exchanging construction technologies suited for the local needs and (d) Cooperating in
terms of skilled human resources in the areas of managerial, scientific and architectural
expertise.
Summing Up
This chapter has highlighted although briefly the possible benefits of cooperation
between India and Thailand in select areas. Most of the cooperation initiatives have the
potential to contribute to the efficacy of the prospective bilateral FTA. However, cooperation
in these areas can also be viewed separately from the FTA process – although these areas
have potential for generating trade flows between the countries of a variety of products.
95
8/8/2019 Indo Thai FTA
http://slidepdf.com/reader/full/indo-thai-fta 96/141
Chapter 7
Recommended Architecture of the
India –Thailand Free Trade Agreement (ITFTA)
Introduction
The preceding chapters have demonstrated both analytically and empirically that the
India-Thailand FTA is a feasible proposition, as it would entail mutually beneficial trade
linkages between them. However, the architecture of the FTA could be such that it posits the
trade integration process in a wider developmental framework so that the trade-initiatedimpulses are brought in synergy with investment and technology flows. The FTA also needs
to take into account the conceptual basis and empirical results of the present study at the
stage of its implementation. One prime objective of the FTA should be to maintain its WTO-
consistency.
The present chapter, in this context, pins down the objectives and principles of the
FTA. It also lays down recommendations for its scope and coverage. Under any FTA, rules
of origin play an important role in the event of tariff liberalisation, hence, the basis for
evolving the ITFTA rules of origin have also been laid down. Towards the end, this chapter
suggests some strategies for addressing some of the adjustment issues. This chapter draws
upon an earlier work on similar subject (Panchamukhi and Das, 1999) and other prevailing
trade agreements in both the developing and developed regions.
WTO-Consistency
It is rather well-known that if a WTO member enters into a regional integration
arrangement with another member or a group of members in a manner which grants more
favourable conditions to its partners it departs from the principle of non-discrimination as
defined in Article I of GATT, Article II of GATS etc. (www.wto.org). However, a departure is
permitted and it is WTO-consistent under the following three sets of rules:
1. Paragraphs 4 to 10 of Article XXIV of GATT (as clarified in the Understanding on the
Interpretation of Article XXIV of the GATT 1994) provide for formation of customs
unions and free-trade areas covering trade in goods.
96
8/8/2019 Indo Thai FTA
http://slidepdf.com/reader/full/indo-thai-fta 97/141
2. Enabling clause which refers to preferential trade arrangements in trade in goods between
developing country members.
3. Article V of GATS which governs the trade in services under regional trading
arrangements for both developed and developing countries.
Two points are discernible from the above-mentioned rules. First, developing
countries can take recourse to all of the above three sets of rules but developed countries can
receive advantage under the 1st and 3rd sets of rules. Second, the underlying rules in 1st and
2nd sets pertain to trade in goods and the 3rd set relates to trade in services. Thus, the policy
makers dealing with the subject of ITFTA would have to make two decisions: First, whether
the ITFTA needs to cover trade in both goods and services and second, whether the ITFTA
needs to be notified to the WTO under the Article XXIV or the enabling clause if the scope of
the agreement covers only trade in goods. These decisions have important implications for
the scope of the proposed ITFTA as well as its modalities of negotiations.
The Article XXIV of GATT requires that a free trade agreement like the one
envisaged here, among other things, needs to cover substantially all the trade, obviously in
goods (paragraph 8 (b) of Art. XXIV). Similarly, if services were included in the scope of
agreement it would require substantial sectoral coverage and elimination of substantially all
discrimination (paras 1(a) and (b), respectively of Art. V of GATS). However, some
flexibility in the application of these paras of the GATS is granted to developing countries in
accordance to their level of development (para 3(a) and (b) of Art. V of GATS).
However, under the enabling clause reduction or elimination of tariffs and non-tariffs
are provided among developing countries as far as goods are concerned (paras 1 and 2 (c) of
the enabling clause).
7.1 Objectives and Principles
It may be proposed that in laying down the objectives and principles of the ITFTA,
two criteria need to be taken into consideration. First, the national level developmental
imperatives and second, its WTO-consistency could be the two prime dimensions on which
the FTA could be raised. The objectives and principles need also to reflect the predicaments
of the scope and coverage of the ITFTA which could be envisaged in as comprehensive a
manner as possible, so as to avoid amendments at later stages of its implementation.
97
8/8/2019 Indo Thai FTA
http://slidepdf.com/reader/full/indo-thai-fta 98/141
Objectives
The objectives of the proposed Agreement could be to achieve sustained development
and welfare of the people of the Contracting States through:
(1) expanding bilateral trade between the countries in accordance with and building onother multilateral, regional and bilateral rights and obligations of the Contracting
States;
(2) utilising trade integration for strengthening integration in other spheres such as
investment, technology, labour market, manufacturing etc. for raising export supply
capabilities and achieving global competitive standards;
(3) aiming at all-encompassing economic integration measures that could provide greater
opportunities for employment, better working conditions and help securing higher
living standards for their peoples;
(4) augmenting freer trade, especially in goods that embody different technology levels so
as to achieve trade creation, particularly through its technological spread effects;
(5) encouraging complementarity between different sectors of the Contracting States
through a harmonious blend of competition and cooperation; and
(6) establishing common standards for exports originating in the Contracting States in
line with international standards.
Principles
The Agreement could be governed in accordance with the following principles:
(1) The Contracting States shall grant to the goods and services of other Contracting
Parties treatment no less favourable than that accorded to products of any other
country in accordance with the relevant articles of the WTO/GATT.
(2) The Contracting States shall adhere to the national treatment principle of the
WTO/GATT.
(3) Bilateral integration through this Agreement shall be accomplished through principles
of non-discrimination, overall reciprocity and mutuality of advantages ensuring
equitable distribution of benefits among the Contracting States keeping in mind their
different stages of economic development;
(4) Trade Liberalisation would be achieved through the principles of transparency,
gradualism, flexibility and balance.
98
8/8/2019 Indo Thai FTA
http://slidepdf.com/reader/full/indo-thai-fta 99/141
7.2 Scope and Coverage
(1) The Agreement could cover all trade in goods among the Contracting States except
for a negative list;
(2) The Agreement could consist of arrangements relating to tariffs, non-tariffs, para-
tariffs, and direct trade measures;
(3) It could also include measures relating to state trading and government procurement.
7.3 Rules of Origin
The rules of origin need to be evolved by taking into account their various economic
effects as analysed in Chapter 3, especially by keeping their developmental role in a regime
of trade liberalisation. Originating products need to be defined in terms of substantial
transformation that they undergo in the partner country. This could be achieved by adhering
to the three tests as analysed in Chapter 3 viz. change in tariff heading; percentage test and
specific process test.
The first test could be applied at HS 4-digit which is neither too aggregated nor
disaggregated level. The second test could be at 50 percent domestic value addition since
logically, any final product with less that half of contribution from indigenous sources
perhaps cannot be considered as originating in the country of manufacture. For the
calculation of the domestic content appropriate method needs to be evolved. The ITFTA
could also consider incorporating a provision of bilateral cumulation mechanism as well on
the lines of regional cumulation provisions under a regional arrangement. The third test could
be applied on a case-by-case basis.
7.4 Trade Facilitation Measures
Adjustments would be required in this area as mere tariff liberalisation would not be
sufficient to augment bilateral trade. Countries may evolve and set in place trade facilitation
measures in the following areas:
(a) Bridging information gap and improving the quality of information.
(b) Vertical integration of exporting activities.
(c) Customs cooperation for harmonisation of rules, procedure, classification and
documentation.
(d) Banking facilitation, specially, trade finance including credit, guarantee and
insurance.
99
8/8/2019 Indo Thai FTA
http://slidepdf.com/reader/full/indo-thai-fta 100/141
(e) Taxation.
(f) Harmonisation of standards and technical barriers to trade.
7.5 Institutional Mechanism
The administration and implementation of the proposed Agreement could be
undertaken by setting in place a well-defined institutional framework.
Summing Up
This chapter has dealt with the possible architecture of the proposed ITFTA and
recommended on its plausible objectives and principles, scope, rules of origin, trade
facilitation and institutional mechanism by emphasising on the WTO-consistency of the FTA.
100
8/8/2019 Indo Thai FTA
http://slidepdf.com/reader/full/indo-thai-fta 101/141
Chapter 8
Conclusion
Recognising that the age-old bonds of cultural and historical affinity and the
advantages of geographical proximity provide the adequate base for stregthening economic
cooperation process between India and Thailand, the present study posed before it the
question whether a Free Trade Agreement between them is a feasible proposition. It was
hypothesised that the present low levels of trade and investment linkages between the two
countries perhaps could be due to hitherto untapped possibilities of economic cooperation. It
was also observed that the present policy regimes in both the countries are quite conducive to
more intensive bilateral economic integration and a process as this could prove to be a
building block for other subregional, regional and global economic integration processes of
which both are a part. The study thus, focused on finding the potentials of trade expansion
between India and Thailand.
The study estimated the potentials of trade augmentation by analysing the trade
complementarity and production similarity profiles, possibilities of intra-industry trade and
costs of non-cooperation. Having observed rich potentials of trade expansion and significant
costs of non-cooperation both analytically and empirically, the study moved on to assessing
the impact of a Free Trade Agreement between India and Thaialnd on their respective major
macroeconomic variables with the help of a CGE modelling exercise using the GTAP. The
results suggest that both the countries are expected to gain in terms of macroeconmic
performance, including export growth. As it was not possible to accomplish it with the help
of the model, estimates were also made with respect to the possible revenue loss under
different tariff liberalisation scenarios for different categories of products so as to facilitate
the policy-making process at the time of the implementation of the prospective FTA.
The impact analysis with the help of the CGE model was further extended to different
sectors. Since a very disaggregated level empiricism was not possible in this regard, efforts
were made to do so without using the model. Both the modelling exercise and the
disaggregated analysis show that the impact of the proposed FTA would not be adverse for
the domestic production activities. However, at the HS 6-digit level there would be items that
101
8/8/2019 Indo Thai FTA
http://slidepdf.com/reader/full/indo-thai-fta 102/141
could be affected relatively more than others and in case as these a calibrated tariff
liberalisation schedule and setting up of joint venture are recommended.
The study also explored the possibilities of cooperation in several other important
areas that included sectors such as fisheries and aquaculture; information, communication and
space technology; biotechnology, finance and banking; tourism; and infrastructure
development. It was concluded that these areas offer mutually beneficial avenues for
cooperation between the two countries.
Finally, the study dwells upon a possible architecture of India-Thailand FTA and
makes recommendations with regard to its objectives and principles; scope and coverage;
rules of origin; and strategies for addressing adjustment issues. In so doing, the study took
into account the national developmental imperatives of the two countries and WTO-
consistencey of the proposed FTA.
Overall, the findings of the study help concluding that the proposed Free Trade
Agreement between India and Thailand is feasible, desirable and mutually beneficial . If
not implemented timely both the countries would continue to incur significant costs of
non-cooperation.
102
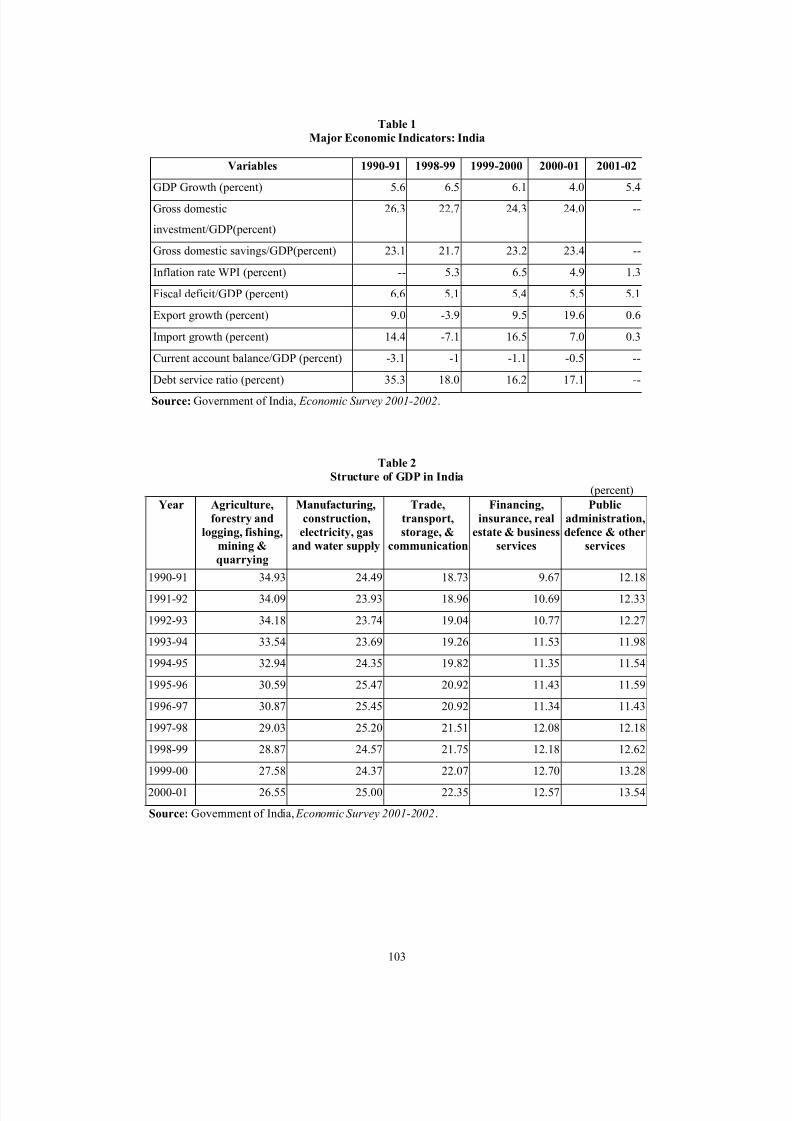
8/8/2019 Indo Thai FTA
http://slidepdf.com/reader/full/indo-thai-fta 103/141
Table 1
Major Economic Indicators: India
Variables 1990-91 1998-99 1999-2000 2000-01 2001-02
GDP Growth (percent) 5.6 6.5 6.1 4.0 5.4
Gross domestic
investment/GDP(percent)
26.3 22.7 24.3 24.0 --
Gross domestic savings/GDP(percent) 23.1 21.7 23.2 23.4 --
Inflation rate WPI (percent) -- 5.3 6.5 4.9 1.3
Fiscal deficit/GDP (percent) 6.6 5.1 5.4 5.5 5.1
Export growth (percent) 9.0 -3.9 9.5 19.6 0.6
Import growth (percent) 14.4 -7.1 16.5 7.0 0.3
Current account balance/GDP (percent) -3.1 -1 -1.1 -0.5 --
Debt service ratio (percent) 35.3 18.0 16.2 17.1 --
Source: Government of India, Economic Survey 2001-2002.
Table 2
Structure of GDP in India(percent)
Year Agriculture,
forestry and
logging, fishing,mining &
quarrying
Manufacturing,
construction,
electricity, gasand water supply
Trade,
transport,
storage, &communication
Financing,
insurance, real
estate & businessservices
Public
administration,
defence & otherservices
1990-91 34.93 24.49 18.73 9.67 12.18
1991-92 34.09 23.93 18.96 10.69 12.33
1992-93 34.18 23.74 19.04 10.77 12.27
1993-94 33.54 23.69 19.26 11.53 11.98
1994-95 32.94 24.35 19.82 11.35 11.54
1995-96 30.59 25.47 20.92 11.43 11.59
1996-97 30.87 25.45 20.92 11.34 11.431997-98 29.03 25.20 21.51 12.08 12.18
1998-99 28.87 24.57 21.75 12.18 12.62
1999-00 27.58 24.37 22.07 12.70 13.28
2000-01 26.55 25.00 22.35 12.57 13.54
Source: Government of India, Economic Survey 2001-2002 .
103
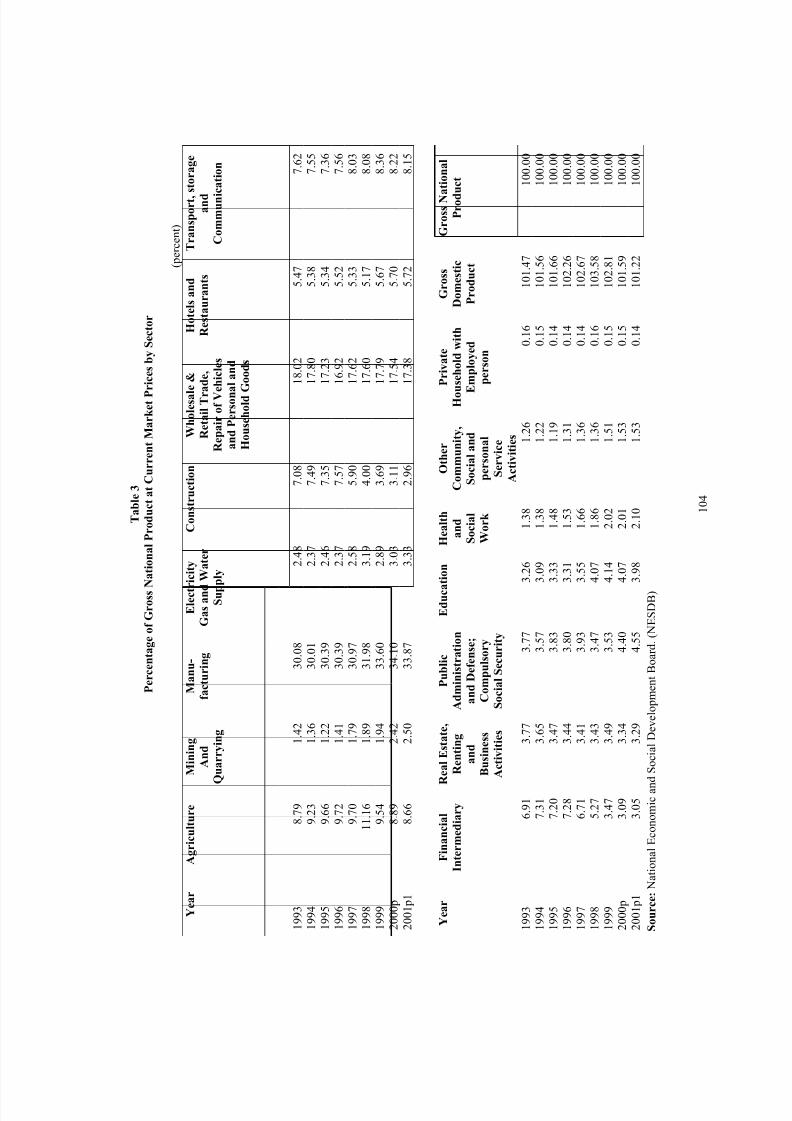
8/8/2019 Indo Thai FTA
http://slidepdf.com/reader/full/indo-thai-fta 104/141
T a b l e 3
P e r c e n t a g e o f G r o s s N a t i o n a l P r
o d u c t a t C u r r e n t M a r k e t P r i c e s b y
S e c t o r
( p e r c e n t )
Y e a r
A g r i c u l t u r e
M i n i n g
A n d
Q u a r r y i n g
M a n u -
f a c t u r i n g
E l e c t r i c i t y
G a s a n d W a t e r
S u p p l y
C
o n s t r u c t i o n
W h o l e s a l e &
R e t a i l T r a d e ,
R e p a i r o f V e h i c l e s
a n d P e r s o n a l a n d
H o u s e h o l d G o o d s
H o t e l s a n d
R e s t a u r a n t s
T r a n s p o r t , s t o r
a g e
a n d
C o m m u n i c a t i o n
1 9 9 3
8 . 7 9
1 . 4 2
3 0 . 0 8
2 . 4 8
7 . 0 8
1 8 . 0 2
5 . 4 7
7 . 6 2
1 9 9 4
9 . 2 3
1 . 3 6
3 0 . 0 1
2 . 3 7
7 . 4 9
1 7 . 8 0
5 . 3 8
7 . 5 5
1 9 9 5
9 . 6 6
1 . 2 2
3 0 . 3 9
2 . 4 6
7 . 3 5
1 7 . 2 3
5 . 3 4
7 . 3 6
1 9 9 6
9 . 7 2
1 . 4 1
3 0 . 3 9
2 . 3 7
7 . 5 7
1 6 . 9 2
5 . 5 2
7 . 5 6
1 9 9 7
9 . 7 0
1 . 7 9
3 0 . 9 7
2 . 5 8
5 . 9 0
1 7 . 6 2
5 . 3 3
8 . 0 3
1 9 9 8
1 1 . 1 6
1 . 8 9
3 1 . 9 8
3 . 1 9
4 . 0 0
1 7 . 6 0
5 . 1 7
8 . 0 8
1 9 9 9
9 . 5 4
1 . 9 4
3 3 . 6 0
2 . 8 9
3 . 6 9
1 7 . 7 9
5 . 6 7
8 . 3 6
2 0 0 0 p
8 . 8 9
2 . 4 2
3 4 . 1 0
3 . 0 3
3 . 1 1
1 7 . 5 4
5 . 7 0
8 . 2 2
2 0 0 1 p 1
8 . 6 6
2 . 5 0
3 3 . 8 7
3 . 3 3
2 . 9 6
1 7 . 3 8
5 . 7 2
8 . 1 5
Y e a r
F i n a n c i a l
I n t e r m e d i a r y
R e a l E s t a t e ,
R e n t i n g
a n d
B u s i n e s s
A c t i v i t i e s
P u b l i c
A
d m i n i s t r a t i o n
a n d D e f e n s e ;
C o m p u l s o r y
S o c i a l S e c u r i t y
E d u c a t i o n
H e a l t h
a n
d
S o c i a l
W o r k
O t h e r
C o m m u n i t y ,
S o c i a l a n d
p e r s o n a l
S e r v i c e
A c t i v i t i e s
P r i v a t e
H o u s e h o l d
w i t h
E m p l o y e d
p e r s o n
G r o s s
D o m e s t i c
P r o d u c t
G r o s s N a t i o n a l
P r o d u c t
1 9 9 3
6 . 9 1
3 . 7 7
3 . 7 7
3 . 2 6
1 . 3 8
1 . 2 6
0 . 1 6
1 0 1 . 4 7
1 0 0 . 0 0
1 9 9 4
7 . 3 1
3 . 6 5
3 . 5 7
3 . 0 9
1 . 3 8
1 . 2 2
0 . 1 5
1 0 1 . 5 6
1 0 0 . 0 0
1 9 9 5
7 . 2 0
3 . 4 7
3 . 8 3
3 . 3 3
1 . 4 8
1 . 1 9
0 . 1 4
1 0 1 . 6 6
1 0 0 . 0 0
1 9 9 6
7 . 2 8
3 . 4 4
3 . 8 0
3 . 3 1
1 . 5 3
1 . 3 1
0 . 1 4
1 0 2 . 2 6
1 0 0 . 0 0
1 9 9 7
6 . 7 1
3 . 4 1
3 . 9 3
3 . 5 5
1 . 6 6
1 . 3 6
0 . 1 4
1 0 2 . 6 7
1 0 0 . 0 0
1 9 9 8
5 . 2 7
3 . 4 3
3 . 4 7
4 . 0 7
1 . 8 6
1 . 3 6
0 . 1 6
1 0 3 . 5 8
1 0 0 . 0 0
1 9 9 9
3 . 4 7
3 . 4 9
3 . 5 3
4 . 1 4
2 . 0 2
1 . 5 1
0 . 1 5
1 0 2 . 8 1
1 0 0 . 0 0
2 0 0 0 p
3 . 0 9
3 . 3 4
4 . 4 0
4 . 0 7
2 . 0 1
1 . 5 3
0 . 1 5
1 0 1 . 5 9
1 0 0 . 0 0
2 0 0 1 p 1
3 . 0 5
3 . 2 9
4 . 5 5
3 . 9 8
2 . 1 0
1 . 5 3
0 . 1 4
1 0 1 . 2 2
1 0 0 . 0 0
S o u r c e : N
a t i o n a l E c o n o m i c a n d S o c i a l D e v e l o p m e n t B o a r d . ( N E S D B )
1 0 4
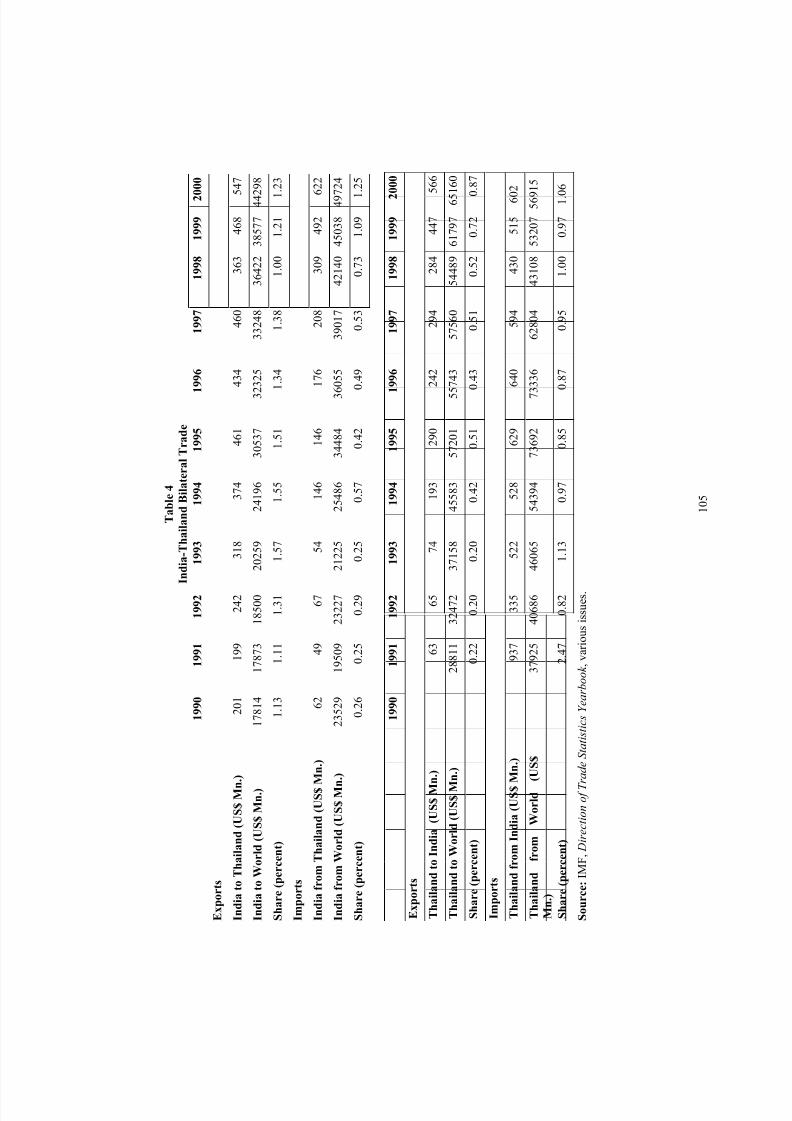
8/8/2019 Indo Thai FTA
http://slidepdf.com/reader/full/indo-thai-fta 105/141
T a b l e 4
I n d i a - T h a i l a n d B i l a t e r a l T r a d e
1 9 9 0
1 9 9 1
1 9 9 2
1 9 9 3
1 9 9 4
1 9 9 5
1 9 9 6
1 9 9 7
1 9 9 8
1 9 9 9
2 0 0 0
E x p o r t s
I n d i a t o T h a i l a n d ( U S $ M n . )
2 0
1
1 9 9
2 4 2
3 1 8
3 7 4
4 6 1
4 3 4
4 6 0
3 6 3
4 6 8
5 4 7
I n d i a t o W o r l d ( U S $ M n . )
1 7 8 1
4
1 7 8 7 3
1 8 5 0 0
2 0 2 5 9
2 4 1 9 6
3 0 5 3 7
3 2 3 2 5
3 3 2 4 8
3 6 4 2 2
3 8 5 7 7
4 4 2 9 8
S h a r e ( p e r c e n t )
1 . 1
3
1 . 1 1
1 . 3 1
1 . 5 7
1 . 5 5
1 . 5 1
1 . 3 4
1 . 3 8
1 . 0 0
1 . 2 1
1 . 2 3
I m p o r t s
I n d i a f r o m T h a i l a n d ( U S $ M n . )
6
2
4 9
6 7
5 4
1 4 6
1 4 6
1 7 6
2 0 8
3 0 9
4 9 2
6 2 2
I n d i a f r o m W o r l d ( U S $ M n . )
2 3 5 2
9
1 9 5 0 9
2 3 2 2 7
2 1 2 2 5
2 5 4 8 6
3 4 4 8 4
3 6 0 5 5
3 9 0 1 7
4 2 1 4 0
4 5 0 3 8
4 9 7 2 4
S h a r e ( p e r c e n t )
0 . 2
6
0 . 2 5
0 . 2 9
0 . 2 5
0 . 5 7
0 . 4 2
0 . 4 9
0 . 5 3
0 . 7 3
1 . 0 9
1 . 2 5
1 9 9 0
1 9 9 1
1 9 9 2
1 9 9 3
1 9 9 4
1 9 9 5
1 9 9 6
1 9 9 7
1 9 9 8
1 9 9 9
2 0 0 0
E x p o r t
s
T h a i l a n d t o I n d i a ( U S $ M n . )
6 3
6 5
7 4
1 9 3
2 9 0
2 4 2
2 9 4
2 8 4
4 4 7
5 6 6
T h a i l a n d t o W o r l d ( U S $ M n . )
2 8 8 1 1
3 2 4 7 2
3 7 1 5 8
4 5 5 8 3
5 7 2 0 1
5 5 7 4 3
5 7 5 6 0
5 4 4 8 9
6 1 7 9 7
6 5 1 6 0
S h a r e ( p e r c e n t )
0 . 2 2
0 . 2 0
0 . 2 0
0 . 4 2
0 . 5 1
0 . 4 3
0 . 5 1
0 . 5 2
0 . 7 2
0 . 8 7
I m p o r t s
T h a i l a n d f r o m I n d i a ( U S $ M n . )
9 3 7
3 3 5
5 2 2
5 2 8
6 2 9
6 4 0
5 9 4
4 3 0
5 1 5
6 0 2
T h a i l a n d
f r o m
W o r l d
( U S $
M n . )
3 7 9 2 5
4 0 6 8 6
4 6 0 6 5
5 4 3 9 4
7 3 6 9 2
7 3 3 3 6
6 2 8 0 4
4 3 1 0 8
5 3 2 0 7 5 6 9 1 5
S h a r e ( p e r c e n t )
2 . 4 7
0 . 8 2
1 . 1 3
0 . 9 7
0 . 8 5
0 . 8 7
0 . 9 5
1 . 0 0
0 . 9 7
1 . 0 6
S o u r c e : I M F , D
i r e c t i o n o f T r a d e S t a t i s t i c s Y e a r b o o k , v a r i o u s i s s u e s .
1 0 5
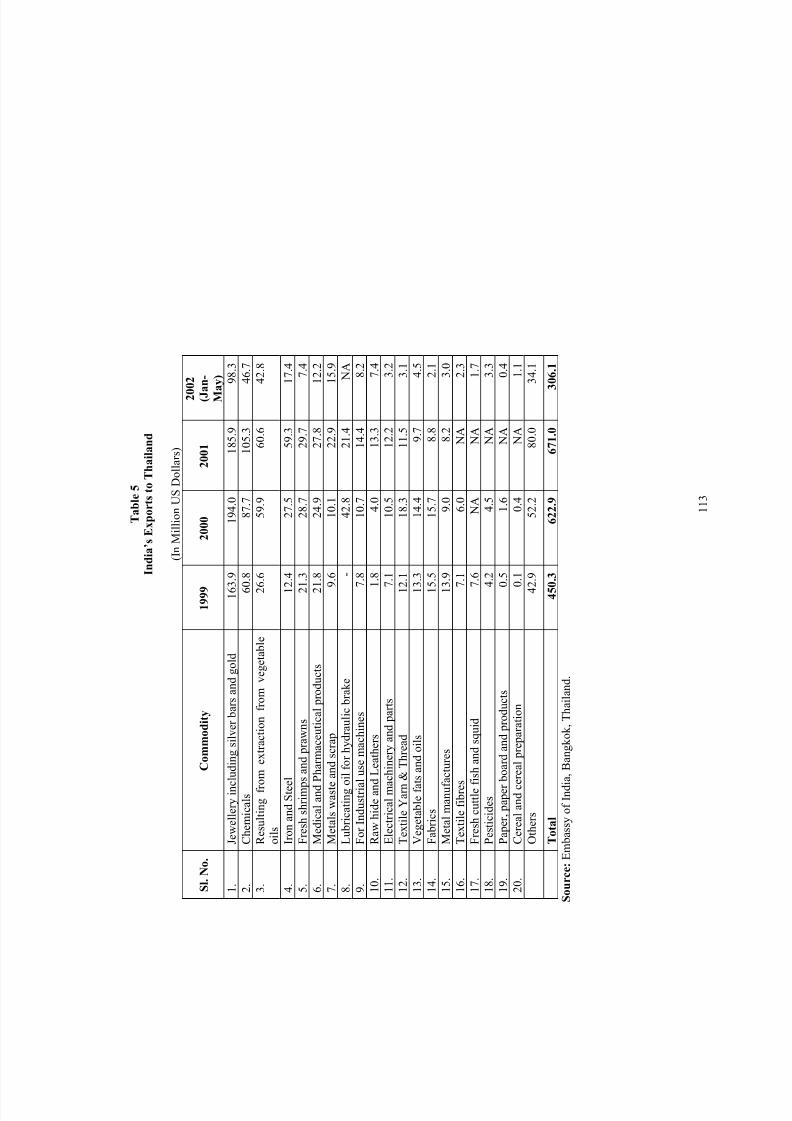
8/8/2019 Indo Thai FTA
http://slidepdf.com/reader/full/indo-thai-fta 106/141
T a b l e 5
I n d i a ’ s E
x p o r t s t o T h a i l a n d
( I n M i l l i o n U S D o l l a r s )
S l . N o .
C o m m o d i t y
1 9 9 9
2 0
0 0
2 0 0 1
2 0 0 2
( J a n -
M a y )
1 .
J e w e l l e r y i n c l u d i n g s i l v e r b a r s a n d g o l d
1 6 3 . 9
1 9 4 . 0
1 8 5 . 9
9 8 . 3
2 .
C h e m i c a l s
6 0 . 8
8 7 . 7
1 0 5 . 3
4 6 . 7
3 .
R e s u l t i n g f r o m e x t r a c t i o n f r o m v e g e t a b l e
o i l s
2 6 . 6
5 9 . 9
6 0 . 6
4 2 . 8
4 .
I r o n a n d S t e e l
1 2 . 4
2 7 . 5
5 9 . 3
1 7 . 4
5 .
F r e s h s h r i m p s a n d p r a w n s
2 1 . 3
2 8 . 7
2 9 . 7
7 . 4
6 .
M e d i c a l a n d P h a r m a c e u t i c a l
p r o d u c t s
2 1 . 8
2 4 . 9
2 7 . 8
1 2 . 2
7 .
M e t a l s w a s t e a n d s c r a p
9 . 6
1 0 . 1
2 2 . 9
1 5 . 9
8 .
L u b r i c a t i n g o i l f o r h y d r a u l i c
b r a k e
-
4 2 . 8
2 1 . 4
N A
9 .
F o r I n d u s t r i a l u s e m a c h i n e s
7 . 8
1 0 . 7
1 4 . 4
8 . 2
1 0
.
R a w h i d e a n d L e a t h e r s
1 . 8
4 . 0
1 3 . 3
7 . 4
1 1
.
E l e c t r i c a l m a c h i n e r y a n d p a r t s
7 . 1
1 0 . 5
1 2 . 2
3 . 2
1 2
.
T e x t i l e Y a r n & T h r e a d
1 2 . 1
1 8 . 3
1 1 . 5
3 . 1
1 3
.
V e g e t a b l e f a t s a n d o i l s
1 3 . 3
1 4 . 4
9 . 7
4 . 5
1 4
.
F a b r i c s
1 5 . 5
1 5 . 7
8 . 8
2 . 1
1 5
.
M e t a l m a n u f a c t u r e s
1 3 . 9
9 . 0
8 . 2
3 . 0
1 6
.
T e x t i l e f i b r e s
7 . 1
6 . 0
N A
2 . 3
1 7
.
F r e s h c u t t l e f i s h a n d s q u i d
7 . 6
N A
N A
1 . 7
1 8
.
P e s t i c i d e s
4 . 2
4 . 5
N A
3 . 3
1 9
.
P a p e r , p a p e r b o a r d a n d p r o d u
c t s
0 . 5
1 . 6
N A
0 . 4
2 0
.
C e r e a l a n d c e r e a l p r e p a r a t i o n
0 . 1
0 . 4
N A
1 . 1
O t h e r s
4 2 . 9
5 2 . 2
8 0 . 0
3 4 . 1
T o t a l
4 5 0 . 3
6 2 2 . 9
3 0 6 . 1
6 7 1 . 0
S o u
r c e : E m b a s s y o f I n d i a , B a n g k o k , T h a i l a n d .
1 1 3
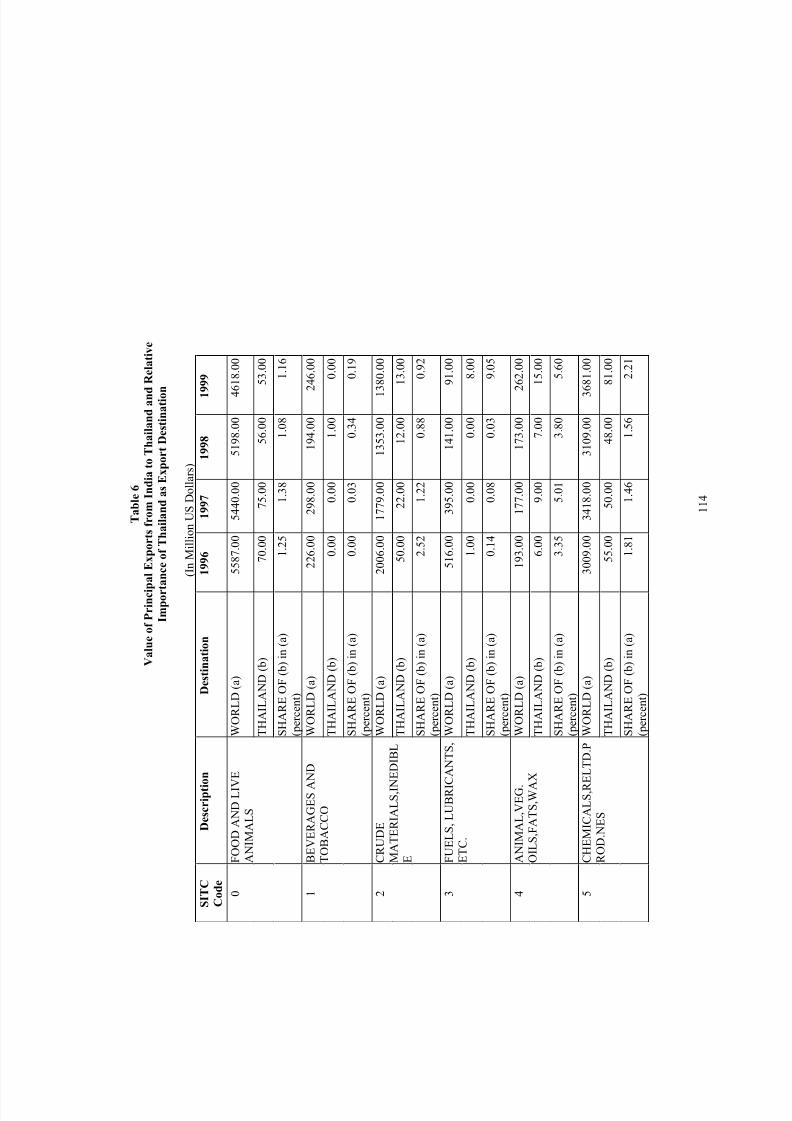
8/8/2019 Indo Thai FTA
http://slidepdf.com/reader/full/indo-thai-fta 107/141
T a b l e 6
V a l u e o f P r i n c i p a l E x p o r t s
f r o m I n d i a t o T h a i l a n d a n d R e l a t i v e
I m p o r t a n c e o f T h a i l a n d a s E x p o r t D e s t i n a t i o n
( I n M i l l i o n U S D o l l a r s )
S I T C C o d e
D e s c r i p t i o n
D e s t i n a t i o n
1 9 9 6
1 9 9 7
1 9 9 8
1 9 9 9
W O R L D ( a )
5 5 8 7 . 0 0
5 4 4 0 . 0 0
5 1 9 8 . 0 0
4 6 1 8 . 0 0
T H A I L A N D ( b )
7 0 . 0 0
7 5 . 0 0
5 6 . 0 0
5 3 . 0 0
0
F O O D A N D L I V E
A N I M A L S
S H A R
E O F ( b ) i n ( a )
( p e r c e n t )
1 . 2 5
1 . 3 8
1 . 0 8
1 . 1 6
W O R L D ( a )
2 2 6 . 0 0
2 9 8 . 0 0
1 9 4 . 0 0
2 4 6 . 0 0
T H A I L A N D ( b )
0 . 0 0
0 . 0 0
1 . 0 0
0 . 0 0
1
B E V E R A G E S A N D
T O B A C C O
S H A R
E O F ( b ) i n ( a )
( p e r c e n t )
0 . 0 0
0 . 0 3
0 . 3 4
0 . 1 9
W O R L D ( a )
2 0 0 6 . 0 0
1 7 7 9 . 0 0
1 3 5 3 . 0 0
1 3 8 0 . 0 0
T H A I L A N D ( b )
5 0 . 0 0
2 2 . 0 0
1 2 . 0 0
1 3 . 0 0
2
C R U D E
M A T E R I A L S , I N E D I B L
E
S H A R
E O F ( b ) i n ( a )
( p e r c e n t )
2 . 5 2
1 . 2 2
0 . 8 8
0 . 9 2
W O R L D ( a )
5 1 6 . 0 0
3 9 5 . 0 0
1 4 1 . 0 0
9 1 . 0 0
T H A I L A N D ( b )
1 . 0 0
0 . 0 0
0 . 0 0
8 . 0 0
3
F U E L S , L U B R I C A N T S ,
E T C .
S H A R
E O F ( b ) i n ( a )
( p e r c e n t )
0 . 1 4
0 . 0 8
0 . 0 3
9 . 0 5
W O R L D ( a )
1 9 3 . 0 0
1 7 7 . 0 0
1 7 3 . 0 0
2 6 2 . 0 0
T H A I L A N D ( b )
6 . 0 0
9 . 0 0
7 . 0 0
1 5 . 0 0
4
A N I M A L , V E G .
O I L S , F A T S , W A X
S H A R
E O F ( b ) i n ( a )
( p e r c e n t )
3 . 3 5
5 . 0 1
3 . 8 0
5 . 6 0
W O R L D ( a )
3 0 0 9 . 0 0
3 4 1 8 . 0 0
3 1 0 9 . 0 0
3 6 8 1 . 0 0
T H A I L A N D ( b )
5 5 . 0 0
5 0 . 0 0
4 8 . 0 0
8 1 . 0 0
5
C H E M I C A L S , R E L T D . P
R O D . N E S
S H A R
E O F ( b ) i n ( a )
( p e r c e n t )
1 . 8 1
1 . 4 6
1 . 5 6
2 . 2 1
1 1 4
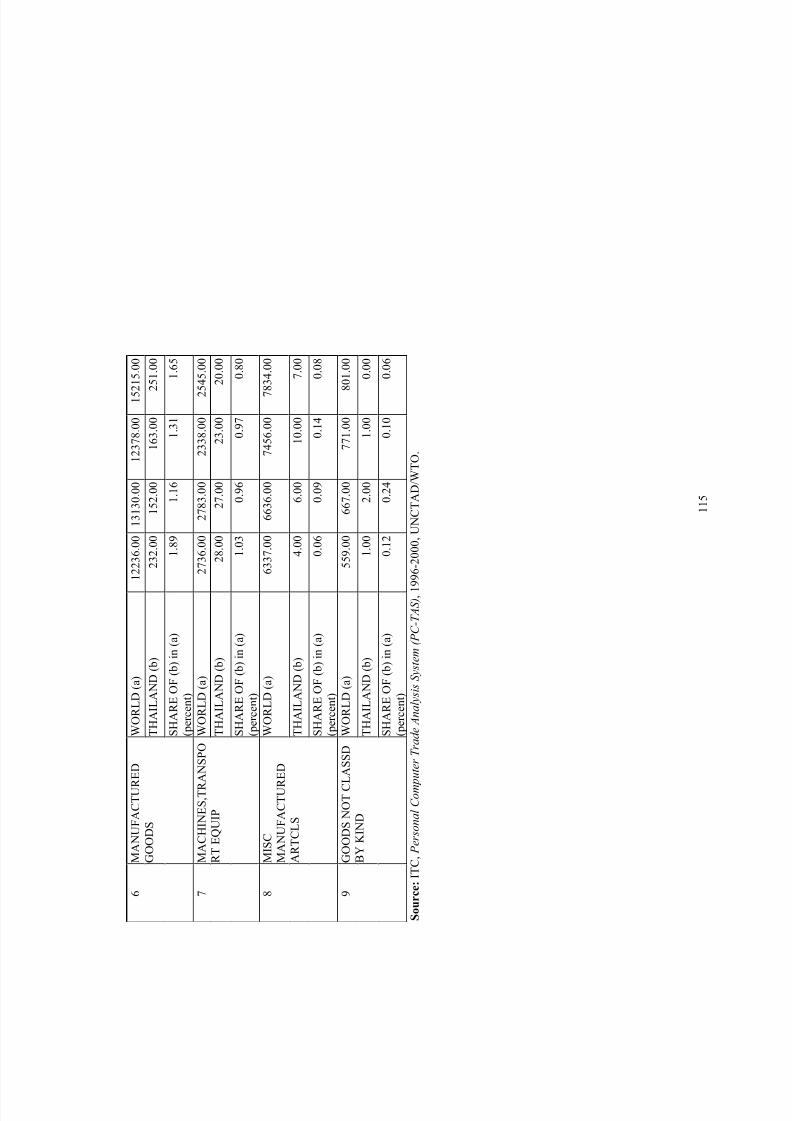
8/8/2019 Indo Thai FTA
http://slidepdf.com/reader/full/indo-thai-fta 108/141
W O R L D ( a )
1 2 2 3 6 . 0 0
1 3 1 3 0 . 0 0
1 2 3 7 8 . 0 0
1 5 2 1 5 . 0 0
T H A I L A N D ( b )
2 3 2 . 0 0
1 5 2 . 0 0
1 6 3 . 0 0
2 5 1 . 0 0
6
M A N U F A C T U R E D
G O O D S
S H A R
E O F ( b ) i n ( a )
( p e r c e n t )
1 . 8 9
1 . 1 6
1 . 3 1
1 . 6 5
W O R L D ( a )
2 7 3 6 . 0 0
2 7 8 3 . 0 0
2 3 3 8 . 0 0
2 5 4 5 . 0 0
T H A I L A N D ( b )
2 8 . 0 0
2 7 . 0 0
2 3 . 0 0
2 0 . 0 0
7
M A C H I N E S , T R A N S P O
R T E Q U I P
S H A R
E O F ( b ) i n ( a )
( p e r c e n t )
1 . 0 3
0 . 9 6
0 . 9 7
0 . 8 0
W O R L D ( a )
6 3 3 7 . 0 0
6 6 3 6 . 0 0
7 4 5 6 . 0 0
7 8 3 4 . 0 0
T H A I L A N D ( b )
4 . 0 0
6 . 0 0
1 0 . 0 0
7 . 0 0
8
M I S C
M A N U F A C T U R E D
A R T C L S
S H A R
E O F ( b ) i n ( a )
( p e r c e n t )
0 . 0 6
0 . 0 9
0 . 1 4
0 . 0 8
W O R L D ( a )
5 5 9 . 0 0
6 6 7 . 0 0
7 7 1 . 0 0
8 0 1 . 0 0
T H A I L A N D ( b )
1 . 0 0
2 . 0 0
1 . 0 0
0 . 0 0
9
G O O D S N O T C L A S S D
B Y K I N D
S H A R
E O F ( b ) i n ( a )
( p e r c e n t )
0 . 1 2
0 . 2 4
0 . 1 0
0 . 0 6
S o u r c e : I T C , P e r s o n a l C o m p u t e r T r a d e A n a l y s i s S y s t e m ( P C - T A S ) , 1 9 9 6 - 2 0 0 0 , U
N C T A D / W T O .
1 1 5
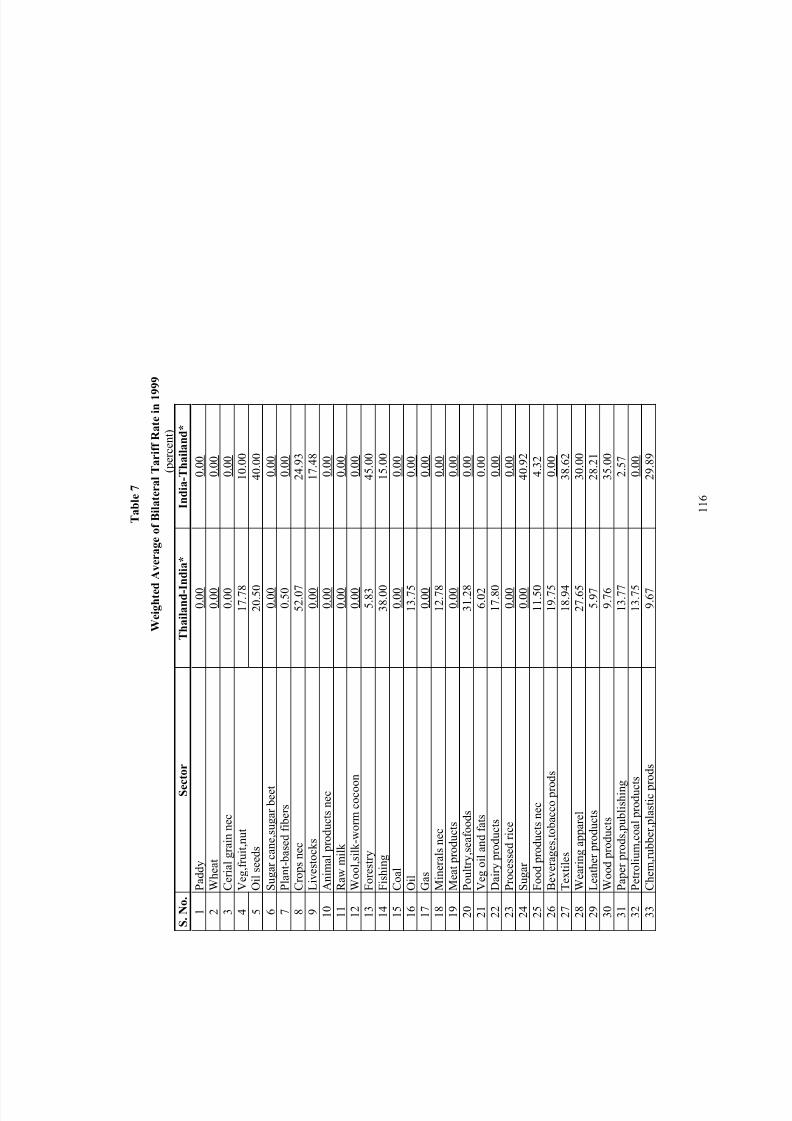
8/8/2019 Indo Thai FTA
http://slidepdf.com/reader/full/indo-thai-fta 109/141
T a b l e 7
W e i g h t e d A v e r a g e o
f B i l a t e r a l T a r i f f R a t e i n 1 9 9 9
( p e r c e n t )
S . N o .
S e c t o r
T h a i l a n d - I n d i a *
I n d i a - T h a i l a n d *
1
P a d d y
0 . 0 0
0 . 0 0
2
W
h e a t
0 . 0 0
0 . 0 0
3
C
e r i a l g r a i n n e c
0 . 0 0
0 . 0 0
4
1 0 . 0 0
1 7 . 7 8
5
V
e g , f r u i t , n u t
O
i l s e e d s
2 0 . 5 0
4 0 . 0 0
6
S u g a r c a n e , s u g a r b e e t
0 . 0 0
0 . 0 0
7
P l a n t - b a s e d f i b e r s
0 . 5 0
0 . 0 0
8
C
r o p s n e c
5 2 . 0 7
2 4 . 9 3
9
L i v e s t o c k s
0 . 0 0
1 7 . 4 8
1 0 A
n i m a l p r o d u c t s n e c
0 . 0 0
0 . 0 0
1 1 R
a w m i l k
0 . 0 0
0 . 0 0
1 2 W
o o l , s i l k - w o r m c o c o o n
0 . 0 0
0 . 0 0
1 3 F o r e s t r y
5 . 8 3
4 5 . 0 0
1 4 F i s h i n g
3 8 . 0 0
1 5 . 0 0
1 5 C
o a l
0 . 0 0
0 . 0 0
1 6 O
i l
1 3 . 7 5
0 . 0 0
1 7 G
a s
0 . 0 0
0 . 0 0
1 8 M
i n e r a l s n e c
1 2 . 7 8
0 . 0 0
1 9 M
e a t p r o d u c t s
0 . 0 0
0 . 0 0
2 0 P o u l t r y , s e a f o o d s
3 1 . 2 8
0 . 0 0
2 1 V
e g o i l a n d f a t s
6 . 0 2
0 . 0 0
2 2 D
a i r y p r o d u c t s
1 7 . 8 0
0 . 0 0
2 3 P r o c e s s e d r i c e
0 . 0 0
0 . 0 0
2 4 S u g a r
0 . 0 0
4 0 . 9 2
2 5 F o o d p r o d u c t s n e c
1 1 . 5 0
4 . 3 2
2 6 B
e v e r a g e s , t o b a c c o p r o d s
1 9 . 7 5
0 . 0 0
2 7 T e x t i l e s
1 8 . 9 4
3 8 . 6 2
2 8 W
e a r i n g a p p a r e l
2 7 . 6 5
3 0 . 0 0
2 9 L e a t h e r p r o d u c t s
5 . 9 7
2 8 . 2 1
3 0 W
o o d p r o d u c t s
9 . 7 6
3 5 . 0 0
3 1 P a p e r p r o d s , p u b l i s h i n g
1 3 . 7 7
2 . 5 7
3 2 P e t r o l i u m , c o a l p r o d u c t s
1 3 . 7 5
0 . 0 0
3 3 C
h e m , r u b b e r , p l a s t i c p r o d s
9 . 6 7
2 9 . 8 9
1 1 6
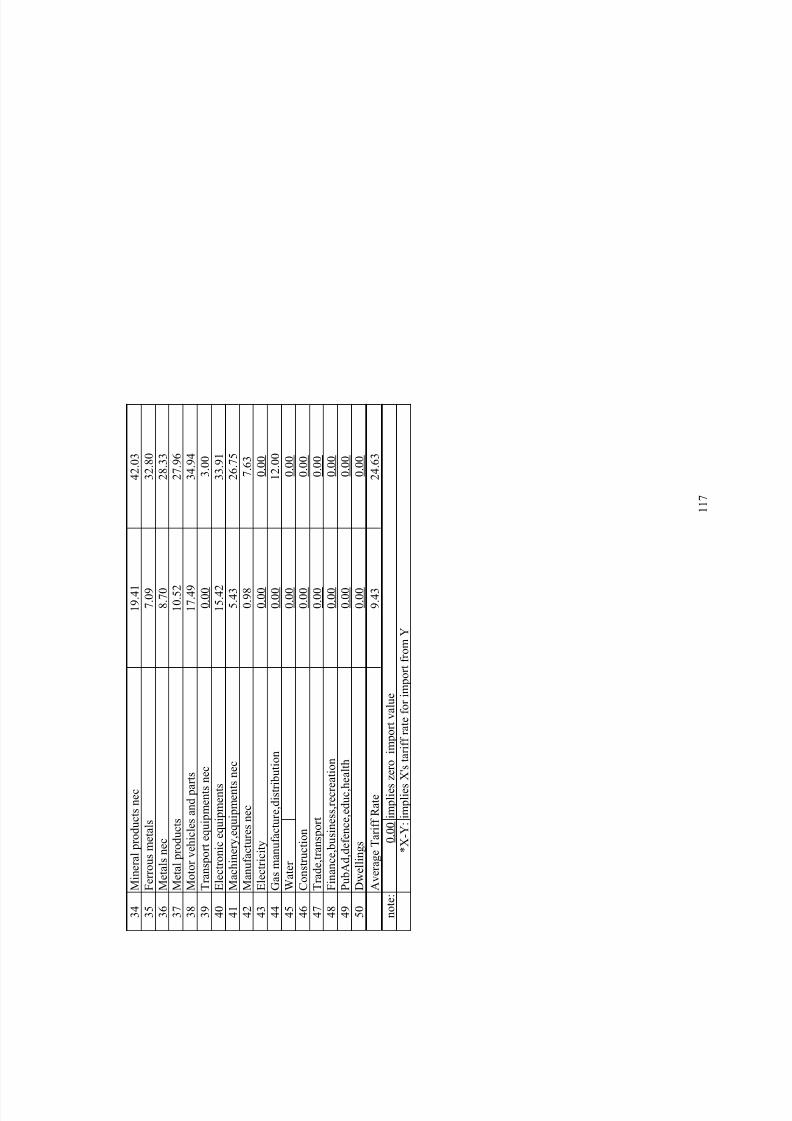
8/8/2019 Indo Thai FTA
http://slidepdf.com/reader/full/indo-thai-fta 110/141
3 4 M
i n e r a l p r o d u c t s n e c
1 9 . 4 1
4 2 . 0 3
3 5 F e r r o u s m e t a l s
7 . 0 9
3 2 . 8 0
3 6 M
e t a l s n e c
8 . 7 0
2 8 . 3 3
3 7 M
e t a l p r o d u c t s
1 0 . 5 2
2 7 . 9 6
3 8 M
o t o r v e h i c l e s a n d p a r t s
1 7 . 4 9
3 4 . 9 4
3 9 T r a n s p o r t e q u i p m e n t s n e c
0 . 0 0
3 . 0 0
4 0 E l e c t r o n i c e q u i p m e n t s
1 5 . 4 2
3 3 . 9 1
4 1 M
a c h i n e r y , e q u i p m e n t s n e c
5 . 4 3
2 6 . 7 5
4 2 M
a n u f a c t u r e s n e c
0 . 9 8
7 . 6 3
4 3 E l e c t r i c i t y
0 . 0 0
0 . 0 0
4 4 G
a s m a n u f a c t u r e , d i s t r i b u t i o n
0 . 0 0
1 2 . 0 0
4 5 W
a t e r
0 . 0 0
0 . 0 0
4 6 C
o n s t r u c t i o n
0 . 0 0
0 . 0 0
4 7 T r a d e , t r a n s p o r t
0 . 0 0
0 . 0 0
4 8 F i n a n c e , b u s i n e s s , r e c r e a t i o n
0 . 0 0
0 . 0 0
4 9 P u b A d , d e f e n c e , e d u c , h e a l t h
0 . 0 0
0 . 0 0
5 0 D
w e l l i n g s
0 . 0 0
0 . 0 0
A
v e r a g e T a r i f f R a t e
9 . 4 3
2 4 . 6 3
n o t e :
0 . 0 0 i m p l i e s z e r o i m p o r t v a l u e
* X - Y : i m p l i e s X ' s t a r i f f r a t e f o
r i m p o r t f r o m Y
1 1 7
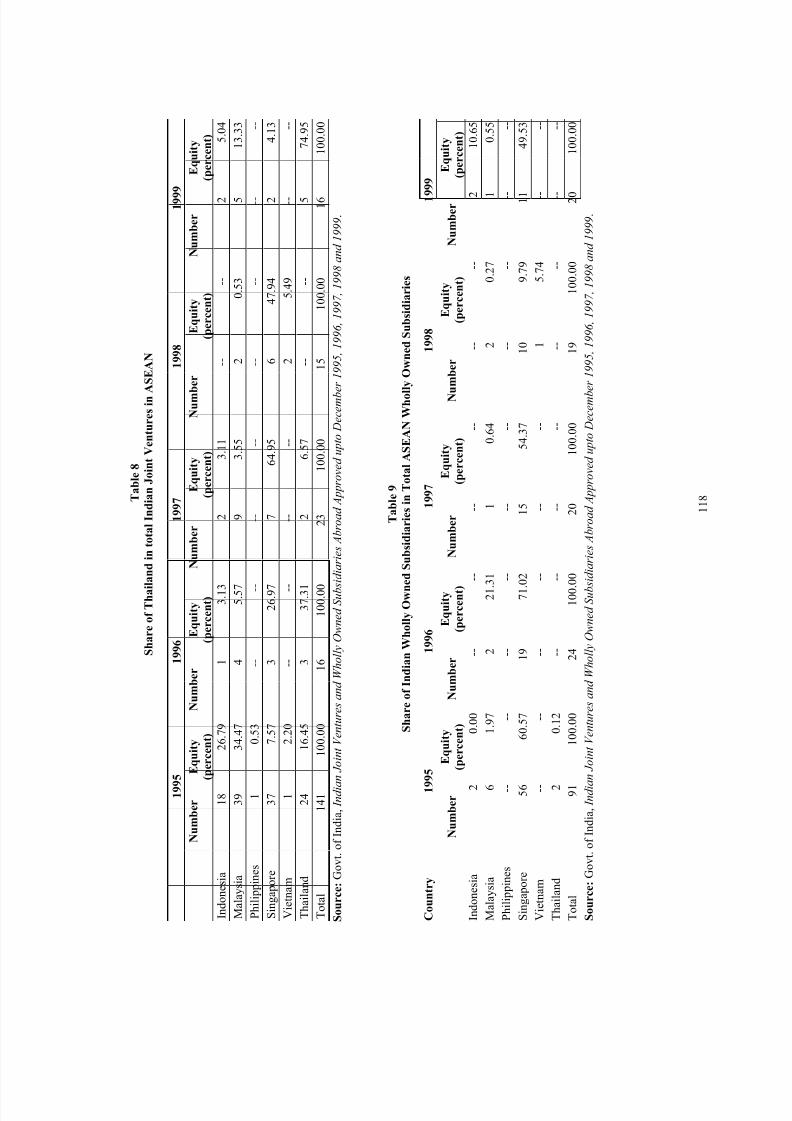
8/8/2019 Indo Thai FTA
http://slidepdf.com/reader/full/indo-thai-fta 111/141
T a b l e 8
S h a r e o f T h a i l a n d i n t o t a
l I n d i a n J o i n t V e n t u r e s i n A S E A N
1 9 9 5
1 9 9 6
1 9 9 7
1 9 9
8
1 9 9 9
N u m b e r
E q u i t y
( p e r c e n t )
N
u m b e r
E q u i t y
( p e r c e n t )
N u m b e r
E q u i t y
( p e r c e n t )
N u m b e r
E q u i t y
( p e r c e n t )
N u m b e r
E q u i t y
( p e r c e n t )
I n d o n e s i a
1 8
2 6 . 7 9
1
3 . 1 3
2
3 . 1 1
- -
- -
2
5 . 0 4
M a l a y s i a
3 9
3 4 . 4 7
4
5 . 5 7
9
3 . 5 5
2
0 . 5 3
5
1 3 . 3 3
P h i l i p p i n e s
1
0 . 5 3
- -
- -
- -
- -
- -
- -
- -
- -
S i n g a p o r e
3 7
7 . 5 7
3
2 6 . 9 7
7
6 4 . 9 5
6
4 7 . 9 4
2
4 . 1 3
V i e t n a m
1
2 . 2 0
- -
- -
- -
- -
2
5 . 4 9
- -
- -
T h a i l a n
d
2 4
1 6 . 4 5
3
3 7 . 3 1
2
6 . 5 7
- -
- -
5
7 4 . 9 5
T o t a l
1 4 1
1 0 0 . 0 0
1 6
1 0 0 . 0 0
2 3
1 0 0 . 0 0
1 5
1 0 0 . 0 0
1 6
1 0 0 . 0 0
S o u r c e :
G o v t . o f I n d i a , I n d i a n J o i n t V e n t u r e s
a n d W h o l l y O w n e d S u b s i d i a r i e s A b r
o a d A p p r o v e d u p t o D e c e m b e r 1 9 9 5 , 1 9 9 6 , 1 9 9 7 , 1 9 9 8 a n d 1 9 9 9 .
T a b l e 9
S h a r e o f I n d i a n W h o l l y O w n e d S u b s i d i a
r i e s i n T o t a l A S E A N W h o l l y O w n e d S u b s i d i a r i e s
S o u r c e : G o v t . o f I n d i a , I n d i a n J o i n t V e n t u r e s a n d W h o l l y O w n e d S u b s i d i a r i e s A b r o a d A p p r o v e d u p t o D e c e m b e r 1 9 9 5 ,
1 9 9 6 , 1 9 9 7 , 1 9 9 8 a n d 1 9 9 9 .
C o u n t r y
1 9 9 5
1 9 9 6
1 9 9 7
1 9 9 8
1 9 9 9
N u m b e r
E q u i t y
( p e r c e n t )
N u m b e r
E q u i t y
( p e r c e n t )
N u m b
e r
E q u i t y
( p e r c e n t )
N u m b e r
E q u i t y
( p e r c e n t )
N u m b e r
E q u i t y
( p e r c e n t )
I n d o n e s
i a
2
0 . 0 0
- -
- -
- -
- -
- -
- -
2
1 0 . 6 5
M a l a y s i a
6
1 . 9 7
2
2 1 . 3 1
1
0 . 6 4
2
0 . 2 7
1
0 . 5 5
P h i l i p p i n e s
- -
- -
- -
- -
- -
- -
- -
- -
- -
- -
S i n g a p o
r e
5 6
6 0 . 5 7
1 9
7 1 . 0 2
1 5
5 4 . 3 7
1
0
9 . 7 9
1 1
4 9 . 5 3
V i e t n a m
- -
- -
- -
- -
- -
- -
1
5 . 7 4
- -
- -
T h a i l a n d
2
0 . 1 2
- -
- -
- -
- -
- -
- -
- -
- -
T o t a l
9 1
1 0 0 . 0 0
2 4
1 0 0 . 0 0
2 0
1 0 0 . 0 0
1
9
1 0 0 . 0 0
2 0
1 0 0 . 0 0
1 1 8
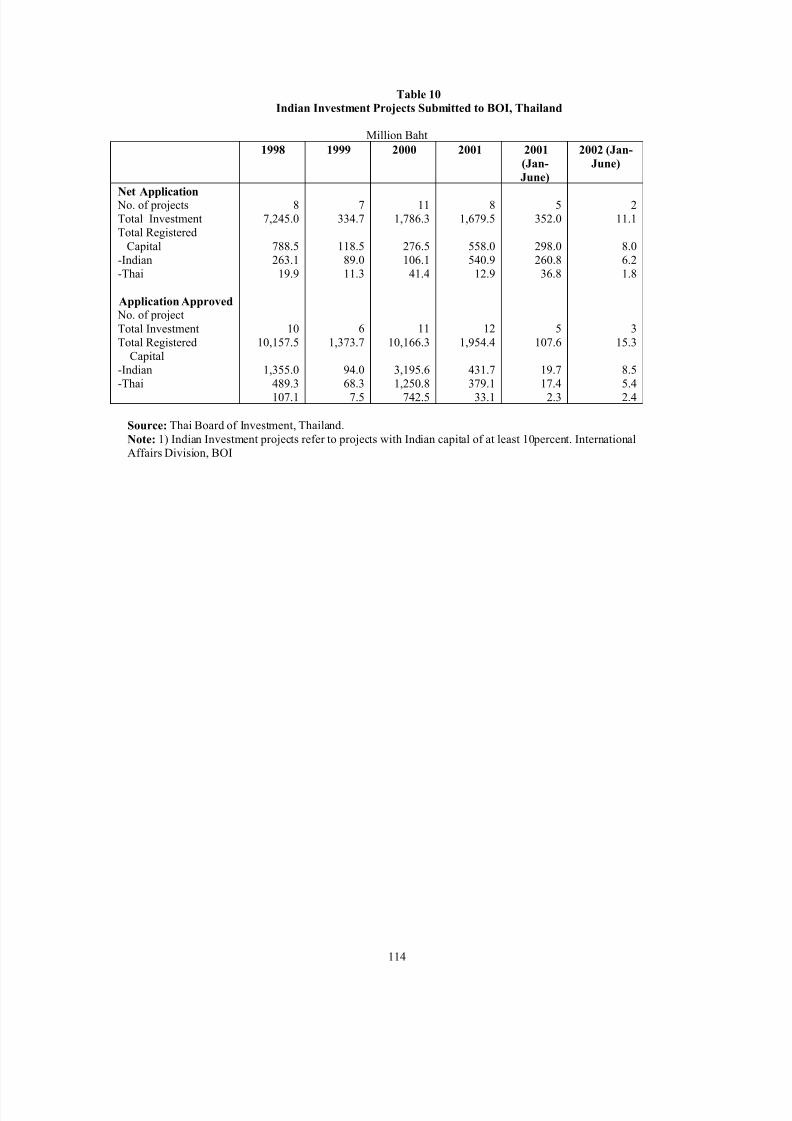
8/8/2019 Indo Thai FTA
http://slidepdf.com/reader/full/indo-thai-fta 112/141
Table 10
Indian Investment Projects Submitted to BOI, Thailand
Million Baht
1998 1999 2000 2001 2001
(Jan-
June)
2002 (Jan-
June)
Net Application No. of projectsTotal InvestmentTotal Registered
Capital-Indian-Thai
Application Approved No. of projectTotal InvestmentTotal Registered
Capital-Indian-Thai
87,245.0
788.5263.1
19.9
1010,157.5
1,355.0489.3107.1
7334.7
118.589.011.3
61,373.7
94.068.3
7.5
111,786.3
276.5106.1
41.4
1110,166.3
3,195.61,250.8
742.5
81,679.5
558.0540.9
12.9
121,954.4
431.7379.1
33.1
5352.0
298.0260.836.8
5107.6
19.717.4
2.3
211.1
8.06.21.8
315.3
8.55.42.4
Source: Thai Board of Investment, Thailand.
Note: 1) Indian Investment projects refer to projects with Indian capital of at least 10percent. InternationalAffairs Division, BOI
114
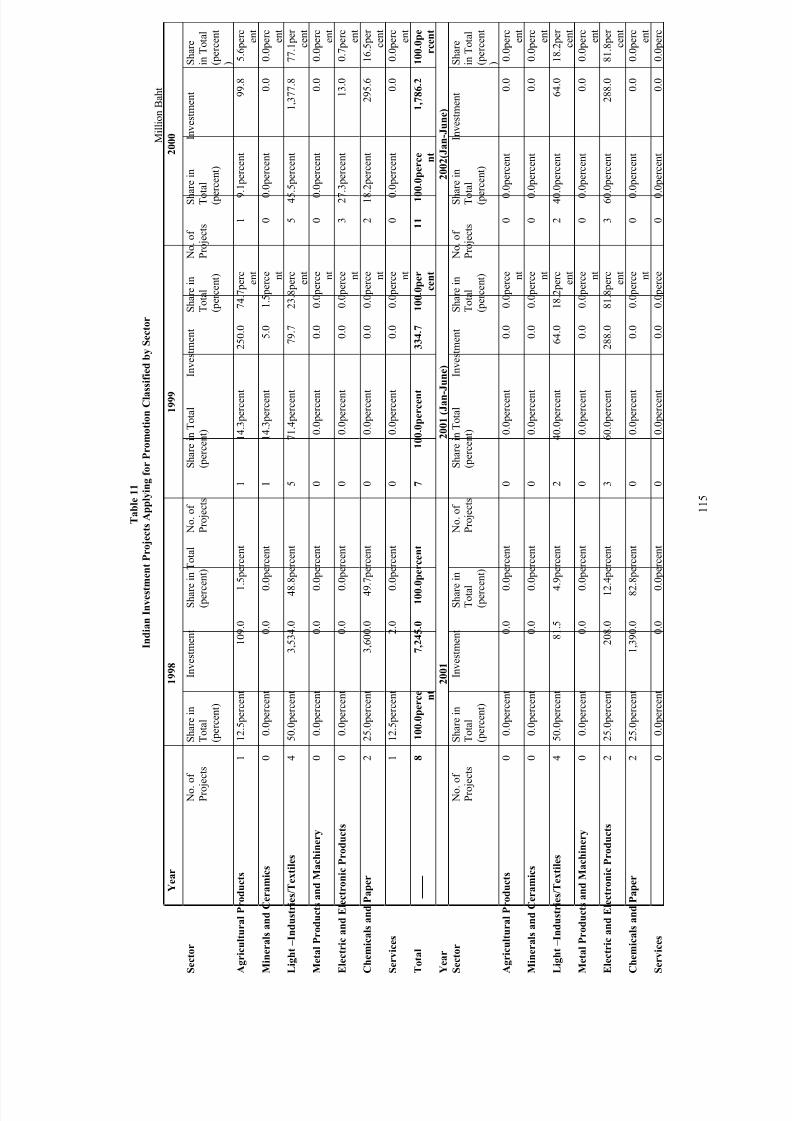
8/8/2019 Indo Thai FTA
http://slidepdf.com/reader/full/indo-thai-fta 113/141
T a b l e 1 1
I n d i a n I n v e s t m e n t P r o j e c t s A p p l y i n g f o r P r o m o t i o n C l a s s i f i e d b y S e c t o r
M i l l i o n B a h t
Y e a r
1 9 9 8
1 9 9 9
2 0 0 0
S e c t o r
N o . o f
P r o j e c t s
S h a r e i n
T o t a l
( p e r c e n t )
I n v e s t m e n t
S h a r e i n T o t a l
( p e r c e n t )
N
o . o f
P
r o j e c t s
S h a r e i n T o t a l
( p e r c e n t )
I n v e s t m e n t
S h a r e i n
T o t a l
( p e r c e n t )
N o . o f
P r o j e c t s
S h a r e i n
T o t a l
( p e r c e n
t )
I n v e s t m e n t
S h a r e
i n T o t a l
( p e r c e n t
)
A g r i c u l t u r a l P r o d u c t s
1
1 2 . 5 p e r c e n t
1 0 9 . 0
1 . 5 p e r c e n t
1
1 4 . 3 p e r c e n t
2 5 0 . 0
7 4 . 7 p e r c e n t
1
9 . 1 p e r c e n t
9 9 . 8
5 . 6 p e r c
e n t
M i n e r a l s a n d C e r a m i c s
0
0 . 0 p e r c e n t
0 . 0
0 . 0 p e r c e n t
1
1 4 . 3 p e r c e n t
5 . 0
1 . 5 p e r c e n t
0
0 . 0 p e r c e n t
0 . 0
0 . 0 p e r c
e n t
L i g h t – I n d u s t r i e s / T
e x t i l e s
4
5 0 . 0 p e r c e n t
3 , 5 3 4 . 0
4 8 . 8 p e r c e n t
5
7 1 . 4 p e r c e n t
7 9 . 7
2 3 . 8 p e r c e n t
5
4 5 . 5 p e r c e n t
1 , 3 7 7 . 8
7 7 . 1 p e r
c e n t
M e t a l P r o d u c t s a n d
M a c h i n e r y
0
0 . 0 p e r c e n t
0 . 0
0 . 0 p e r c e n t
0
0 . 0 p e r c e n t
0 . 0
0 . 0 p e r c e n t
0
0 . 0 p e r c e n t
0 . 0
0 . 0 p e r c
e n t
E l e c t r i c a n d E l e c t r o
n i c P r o d u c t s
0
0 . 0 p e r c e n t
0 . 0
0 . 0 p e r c e n t
0
0 . 0 p e r c e n t
0 . 0
0 . 0 p e r c e n t
3
2 7 . 3 p e r c e n t
1 3 . 0
0 . 7 p e r c
e n t
C h e m i c a l s a n d P a p e r
2
2 5 . 0 p e r c e n t
3 , 6 0 0 . 0
4 9 . 7 p e r c e n t
0
0 . 0 p e r c e n t
0 . 0
0 . 0 p e r c e n t
2
1 8 . 2 p e r c e n t
2 9 5 . 6
1 6 . 5 p e r
c e n t
S e r v i c e s
1
1 2 . 5 p e r c e n t
2 . 0
0 . 0 p e r c e n t
0
0 . 0 p e r c e n t
0 . 0
0 . 0 p e r c e n t
0
0 . 0 p e r c e n t
0 . 0
0 . 0 p e r c
e n t
T o t a l
8
1 0 0 . 0 p e
r c e n t
7 , 2 4 5 . 0
1 0 0 . 0 p e r c e n t
7
1 0 0 . 0 p e r c e n t
3 3 4 . 7
1 0 0 . 0 p e r
c e n t
1 1
1 0 0 . 0 p
e r c e n t
1 , 7 8 6 . 2
1 0 0 . 0 p e
r c e n t
Y e a r
2 0 0 1
2 0 0 1 ( J a n - J u n e )
2 0 0 2 ( J a n - J u n e )
S e c t o r
N o . o f
P r o j e c t s
S h a r e i n
T o t a l
( p e r c e n t )
I n v e s t m e n t
S h a r e i n
T o t a l
( p e r c e n t )
N
o . o f
P
r o j e c t s
S h a r e i n T o t a l
( p e r c e n t )
I n v e s t m e n t
S h a r e i n
T o t a l
( p e r c e n t )
N o . o f
P r o j e c t s
S h a r e i n
T o t a l
( p e r c e n
t )
I n v e s t m e n t
S h a r e
i n T o t a l
( p e r c e n t
)
A g r i c u l t u r a l P r o d u c t s
0
0 . 0 p e r c e n t
0 . 0
0 . 0 p e r c e n t
0
0 . 0 p e r c e n t
0 . 0
0 . 0 p e r c e n t
0
0 . 0 p e r c e n t
0 . 0
0 . 0 p e r c
e n t
M i n e r a l s a n d C e r a m i c s
0
0 . 0 p e r c e n t
0 . 0
0 . 0 p e r c e n t
0
0 . 0 p e r c e n t
0 . 0
0 . 0 p e r c e n t
0
0 . 0 p e r c e n t
0 . 0
0 . 0 p e r c
e n t
L i g h t – I n d u s t r i e s / T
e x t i l e s
4
5 0 . 0 p e r c e n t
8 1 . 5
4 . 9 p e r c e n t
2
4 0 . 0 p e r c e n t
6 4 . 0
1 8 . 2 p e r c e n t
2
4 0 . 0 p e r c e n t
6 4 . 0
1 8 . 2 p e r
c e n t
M e t a l P r o d u c t s a n d
M a c h i n e r y
0
0 . 0 p e r c e n t
0 . 0
0 . 0 p e r c e n t
0
0 . 0 p e r c e n t
0 . 0
0 . 0 p e r c e n t
0
0 . 0 p e r c e n t
0 . 0
0 . 0 p e r c
e n t
E l e c t r i c a n d E l e c t r o
n i c P r o d u c t s
2
2 5 . 0 p e r c e n t
2 0 8 . 0
1 2 . 4 p e r c e n t
3
6 0 . 0 p e r c e n t
2 8 8 . 0
8 1 . 8 p e r c
e n t
3
6 0 . 0 p e r c e n t
2 8 8 . 0
8 1 . 8 p e r
c e n t
C h e m i c a l s a n d P a p e r
2
2 5 . 0 p e r c e n t
1 , 3 9 0 . 0
8 2 . 8 p e r c e n t
0
0 . 0 p e r c e n t
0 . 0
0 . 0 p e r c e n t
0
0 . 0 p e r c e n t
0 . 0
0 . 0 p e r c
e n t
S e r v i c e s
0
0 . 0 p e r c e n t
0 . 0
0 . 0 p e r c e n t
0
0 . 0 p e r c e n t
0 . 0
0 . 0 p e r c e
0
0 . 0 p e r c e n t
0 . 0
0 . 0 p e r c
1 1 5
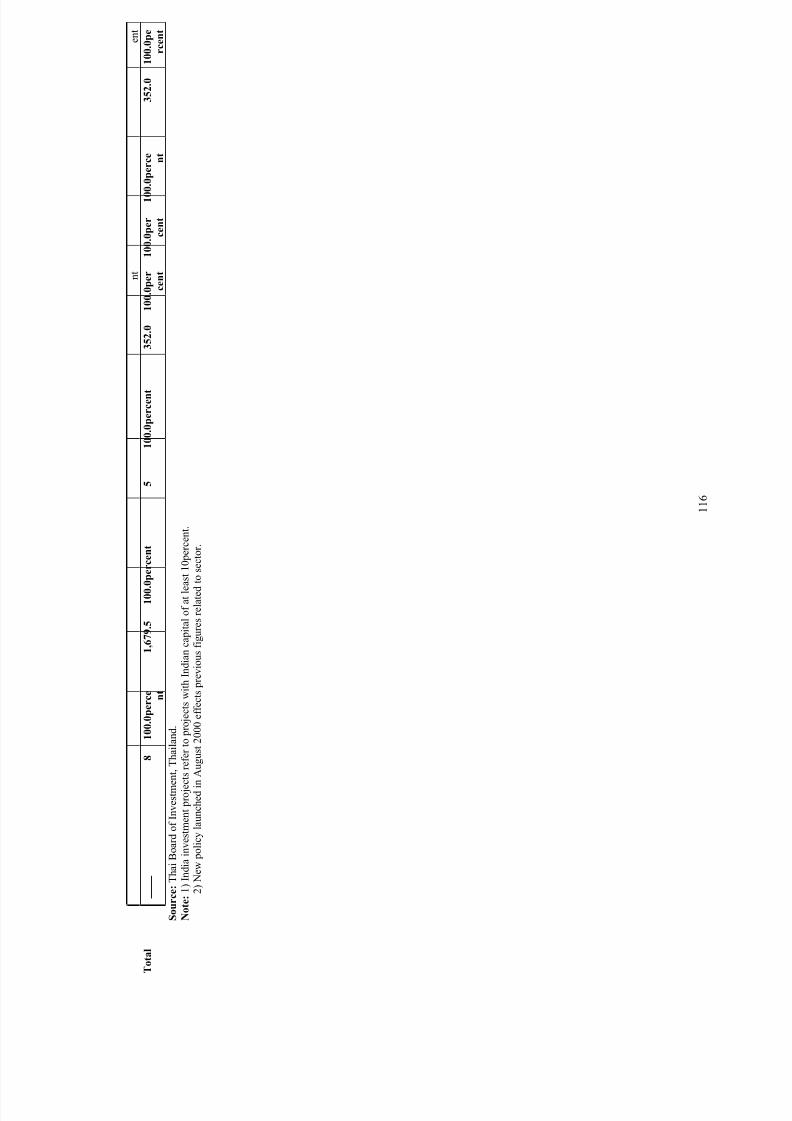
8/8/2019 Indo Thai FTA
http://slidepdf.com/reader/full/indo-thai-fta 114/141
n t
e n t
T o t a l
8
1 0 0 . 0 p e
r c e n t
1 , 6 7 9 . 5
1 0 0 . 0 p e r c e n t
5
1 0 0 . 0 p e r c e n t
3 5 2 . 0
1 0 0 . 0 p e r
c e n t
1 0 0 . 0 p e r
c e n t
1 0 0 . 0 p
e r c e n t
3 5 2 . 0
1 0 0 . 0 p e
r c e n t
S o u r c e :
T h a i B o a r d o f I n v e s t m e n t , T h a i l a n d .
N o t e : 1 )
I n d i a i n v e s t m e n t p r o j e c t s r e f e r t o p r o j e c t s w i t h I n d i a n c a p i t a l o f a t l e a s t 1 0 p e r c e n t .
2 )
N e w p o l i c y l a u n c h e d i n A u g u s t 2 0 0 0 e f f e c t s p r e v i o u s f i g u r e s r e l a t e d t o s e c t o r .
1 1 6
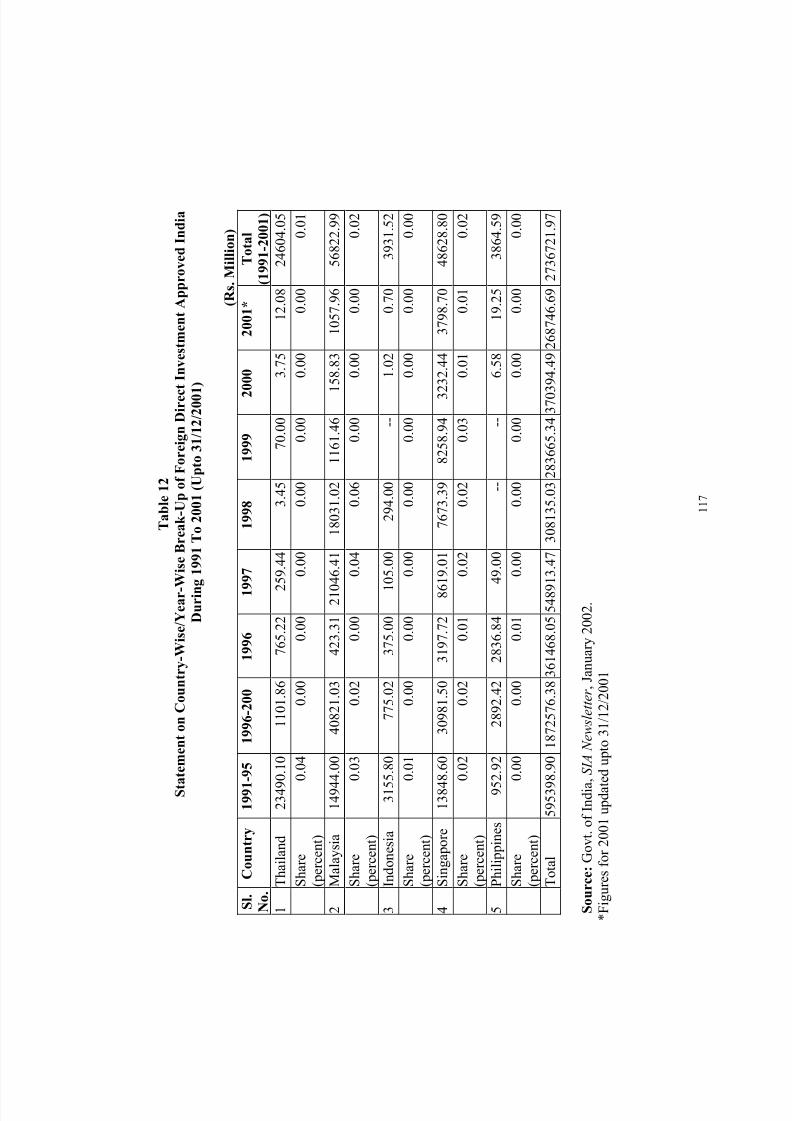
8/8/2019 Indo Thai FTA
http://slidepdf.com/reader/full/indo-thai-fta 115/141
T a b l e 1 2
S t a t e m e n t o n C
o u n t r y - W i s e / Y e a r - W i s e B r e a k - U p o f F o r e i g n D i r e c t I n v e s t m e n t A p p r o v e d I n d i a
D u r i n g 1 9 9 1 T o
2 0 0 1 ( U p t o 3 1 / 1 2 / 2 0 0 1 )
( R s . M i l l i o n )
S l . N o .
C o u n t r y
1 9 9 1 - 9 5
1 9 9 6 - 2
0 0
1 9 9 6
1 9 9 7
1 9 9 8
1 9 9 9
2 0 0 0
2 0 0 1 *
T o t a l
( 1 9 9 1 - 2 0 0 1 )
1 T
h a i l a n d
2 3 4 9 0 . 1 0
1 1 0 1 . 8 6
7 6 5 . 2 2
2 5 9 . 4 4
3 . 4 5
7 0 . 0 0
3 . 7 5
1 2 . 0 8
2 4 6 0 4 . 0 5
S
h a r e
(
p e r c e n t )
0 . 0 4
0 . 0 0
0 . 0 0
0 . 0 0
0 . 0 0
0 . 0 0
0 . 0 0
0 . 0 0
0 . 0 1
2 M
a l a y s i a
1 4 9 4 4 . 0 0
4 0 8 2 1 . 0 3
4 2 3 . 3 1 2 1 0 4 6 . 4 1 1 8 0 3 1 . 0 2
1 1 6 1 . 4 6
1 5 8 . 8 3
1 0 5 7 . 9 6
5 6 8 2 2 . 9 9
S
h a r e
(
p e r c e n t )
0 . 0 3
0 . 0 2
0 . 0 0
0 . 0 4
0 . 0 6
0 . 0 0
0 . 0 0
0 . 0 0
0 . 0 2
3 I
n d o n e s i a
3 1 5 5 . 8 0
7 7 5 . 0 2
3 7 5 . 0 0
1 0 5 . 0 0
2 9 4 . 0 0
- -
1 . 0 2
0 . 7 0
3 9 3 1 . 5 2
S
h a r e
(
p e r c e n t )
0 . 0 1
0 . 0 0
0 . 0 0
0 . 0 0
0 . 0 0
0 . 0 0
0 . 0 0
0 . 0 0
0 . 0 0
4 S
i n g a p o r e
1 3 8 4 8 . 6 0
3 0 9 8 1 . 5 0
3 1 9 7 . 7 2
8 6 1 9 . 0 1
7 6 7 3 . 3 9
8 2 5 8 . 9 4
3 2 3 2 . 4 4
3 7 9 8 . 7 0
4 8 6 2 8 . 8 0
S
h a r e
(
p e r c e n t )
0 . 0 2
0 . 0 2
0 . 0 1
0 . 0 2
0 . 0 2
0 . 0 3
0 . 0 1
0 . 0 1
0 . 0 2
5 P
h i l i p p i n e s
9 5 2 . 9 2
2 8 9 2 . 4 2
2 8 3 6 . 8 4
4 9 . 0 0
- -
- -
6 . 5 8
1 9 . 2 5
3 8 6 4 . 5 9
S
h a r e
(
p e r c e n t )
0 . 0 0
0 . 0 0
0 . 0 1
0 . 0 0
0 . 0 0
0 . 0 0
0 . 0 0
0 . 0 0
0 . 0 0
T
o t a l
5 9 5 3 9 8 . 9 0 1 8 7 2 5 7 6 . 3 8 3 6 1 4 6 8 . 0 5 5 4 8 9 1 3 . 4 7 3 0 8 1 3 5 . 0 3 2 8 3 6 6 5 . 3 4 3 7 0 3 9 4 . 4 9
2 6 8 7 4 6 . 6 9 2 7 3 6 7 2 1 . 9 7
S o u r c e : G o v t . o f I n d i a , S I A N e w s l e t t e r , J a n u a r y 2 0 0 2 .
* F i g u r e s f o r 2 0 0 1 u p d a t e d u p t o 3 1 / 1 2
/ 2 0 0 1
1 1 7

8/8/2019 Indo Thai FTA
http://slidepdf.com/reader/full/indo-thai-fta 116/141
T a b
l e 1 3
T h a i l a n d ’ s I n v e s t m e n t i n I n d i a
V a r i a b l e
1 9 9 1
1 9 9 2
1 9 9 3
1 9 9 4
1 9 9 5
1 9 9 6
1 9 9 7
1 9 9 8
1 9 9 9
2 0 0 0
2 0 0 1
2 0 0 2 *
N o . o f P r o j e c t s
1
7
8
2 0
1 5
2 3
9
6
8
7
7
2
T o t a l I n
v e s t m e n t ( R s .
m n . )
n . a .
2 5
3 6 8 4
1 0 0
1 9 6 8 1
7 7 0
2 5 9
4
7 0
4
1 2
n . a .
F i n a n c i a l ( F ) /
T e c h n i c
a l ( T )
1 ( F )
4 ( F )
3 ( T )
4 ( F )
4 ( T )
1 0 ( F )
1 0 ( T )
1 3 ( F )
2 ( T )
1 9 ( F )
4 ( T )
8 ( F )
1 ( T )
4 ( F )
2 ( T )
6 ( F )
2 ( T )
2 ( F )
5 ( T )
4 ( F )
3 ( T )
2 ( T )
T h a i C a
p i t a l ( p e r c e n t )
0 . 0 0
2 0 . 1 4
2 2 . 5 0
1 6 . 8 5
4 4 . 6 5
4 0 . 1 9
6 0 . 6 7
3 5 . 6 7
1 8 . 7 5
1 0 . 7 1
2 3 . 5 7
n . a .
I n d i a n C a p i t a l
( p e r c e n t )
n . a .
7 9 . 8 6
7 7 . 5 0
8 3 . 1 5
5 5 . 3 5
5 9 . 8 1
3 9 . 3 3
6 4 . 3 3
8 1 . 2 5
8 9 . 2 9
7 6 . 4 3
n . a .
S o u r c e : C a l c u l a t i o n s b a s e d o n D a t a
r e c e i v e d f r o m I n d i a n I n v e s t m e n t C e n
t r e , N e w D e l h i .
N o t e s : ( i ) * D a t a a v a i l a b l e t i l l F e b r u
a r y 2 0 0 2 .
1 1 8
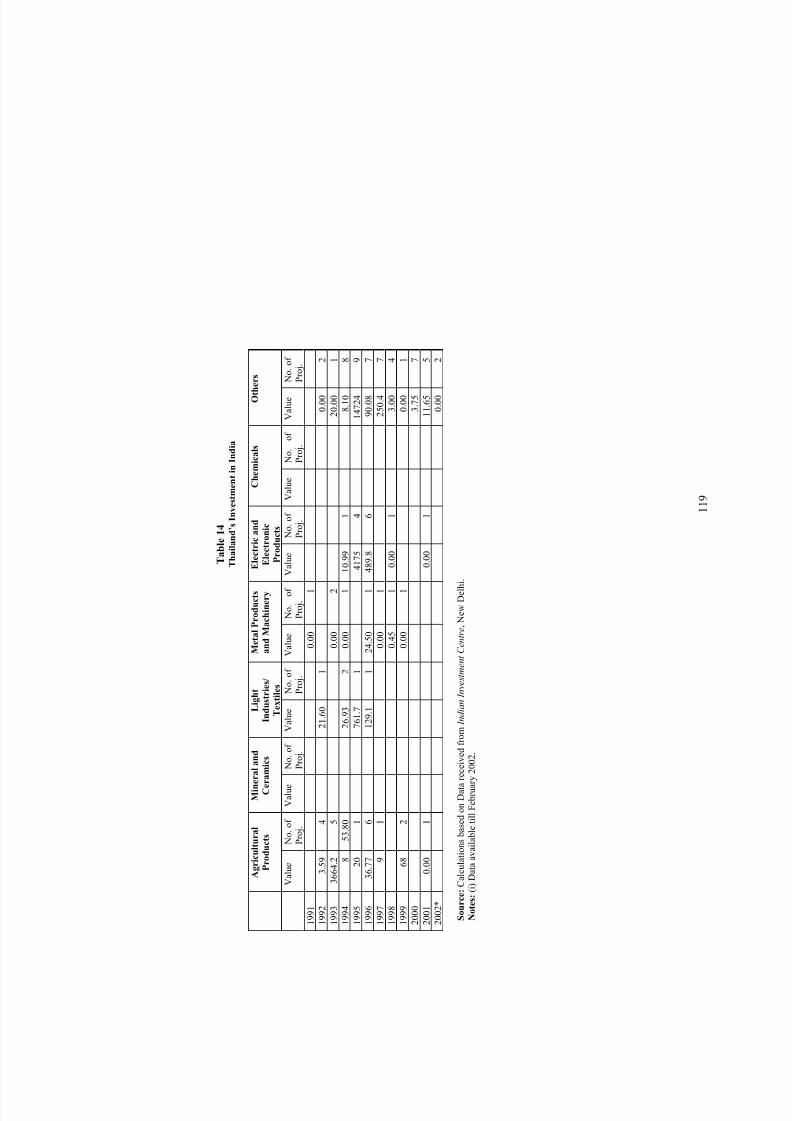
8/8/2019 Indo Thai FTA
http://slidepdf.com/reader/full/indo-thai-fta 117/141
T a b l e 1 4
T h a i l a n d ’ s I n v e s t m e n t i n I n d i a
A g r i c u l t u r a l
P r o d u c t s
M i n e r a l a n d
C e r a m i c s
L
i g h t
I n d u s t r i e s /
T e
x t i l e s
M e t a l P r o d u c t s
a n d M a c h i n e r y
E l e c t r i c a n d
E l e c t r o n i c
P r o d u c t s
C h e m i c a l s
O t h e r s
V a l u e
N o . o f
P r o j .
V a l u e
N o . o f
P r o j .
V a l u e
N o . o f
P r o j .
V a l u e
N o . o f
P r o j .
V a l u e
N o . o f
P r o j .
V a l u e
N o . o f
P r o j .
V a l u e
N o . o f
P r o j .
1 9 9 1
0 . 0 0
1
1 9 9 2
3 . 5 9
4
2 1 . 6 0
1
0 . 0 0
2
1 9 9 3
3 6 6 4 . 2
5
0 . 0 0
2
2 0 . 0 0
1
1 9 9 4
8
5 3 . 8 0
2 6 . 9 3
2
0 . 0 0
1
1 0 . 9 9
1
8 . 1 0
8
1 9 9 5
2 0
1
7 6 1 . 7
1
4 1 7 5
4
1 4 7 2 4
9
1 9 9 6
3 6 . 7 7
6
1 2 9 . 1
1
2 4 . 5 0
1
4 8 9 . 8
6
9 0 . 0 8
7
1 9 9 7
9
1
0 . 0 0
1
2 5 0 . 4
7
1 9 9 8
0 . 4 5
1
0 . 0 0
1
3 . 0 0
4
1 9 9 9
6 8
2
0 . 0 0
1
0 . 0 0
1
2 0 0 0
3 . 7 5
7
2 0 0 1
0 . 0 0
1
0 . 0 0
1
1 1 . 6 5
5
2 0 0 2 *
0 . 0 0
2
S o u r c e : C
a l c u l a t i o n s b a s e d o n D a t a r e c e i v e d f r o m I n d i a
n I n v e s t m e n t C e n t r e , N e w D e l h i .
N o t e s : ( i )
D a t a a v a i l a b l e t i l l F e b r u a r y 2 0 0 2 .
1 1 9
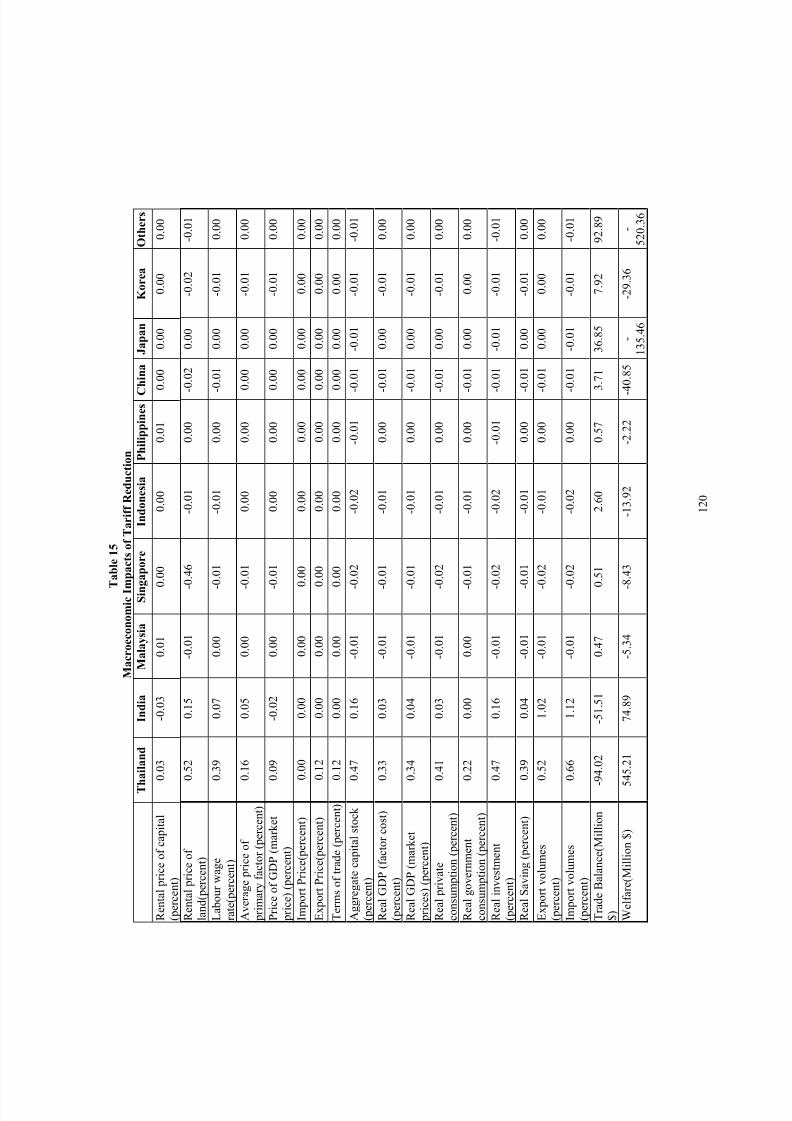
8/8/2019 Indo Thai FTA
http://slidepdf.com/reader/full/indo-thai-fta 118/141
1 2 0
J
a p a n
K o r e a
T a b l e 1 5
M a c r o e c o n o m i c I m p a c t s o f T
a r i f f R e d u c t i o n
T h a i l a n d
I n d
i a
M a l a y s i a
S i n g a p o r e
I n d o n e s i a
P h i l i p p i n e s C h i n a
O t h e r s
R e n t a l p
r i c e o f c a p i t a l
( p e r c e n t )
0 . 0 3
- 0
3
0 . 0 1
0 0
0 0
0 1
0 0
0 0
0 0
0 0
. 0
0 .
0 .
0 .
0 .
0 .
0 .
0 .
R e n t a l p
r i c e o f
l a n d ( p e r c e n t )
0 . 5 2
0 . 1
5
1
6
1
0 0
2
0 0
2
1
- 0 . 0
- 0 . 4
- 0 . 0
0 .
- 0 . 0
0 .
- 0 . 0
- 0 . 0
L a b o u r w a g e
r a t e ( p e r c e n t )
0 . 3 9
0 . 0
7
0 0
1
1
0 0
1
0 0
1
0 0
0 .
- 0 . 0
- 0 . 0
0 .
- 0 . 0
0 .
- 0 . 0
0 .
A v e r a g e p r i c e o f
p r i m a r y
f a c t o r ( p e r c e n t )
0 . 1 6
0 . 0
5
0 0
1
0 0
0 0
0 0
0 0
1
0 0
0 .
- 0 . 0
0 .
0 .
0 .
0 .
- 0 . 0
0 .
P r i c e o f
G D P ( m a r k e t
p r i c e ) ( p e r c e n t )
0 . 0 9
- 0
2
0 . 0 0
1
0 0
0 0
0 0
0 0
1
0 0
. 0
- 0 . 0
0 .
0 .
0 .
0 .
- 0 . 0
0 .
I m p o r t P r i c e ( p e r c e n t )
0 . 0 0
0 . 0
0
0 . 0 0
0 . 0 0
0 . 0 0
0 . 0 0
0 . 0 0
0 . 0 0
0 . 0 0
0 . 0 0
E x p o r t P r i c e ( p e r c e n t )
0 . 1 2
0 . 0
0
0 . 0 0
0 . 0 0
0 . 0 0
0 . 0 0
0 . 0 0
0 . 0 0
0 . 0 0
0 . 0 0
T e r m s o
f t r a d e ( p e r c e n t )
0 . 1 2
0 . 0
0
0 . 0 0
0 . 0 0
0 . 0 0
0 . 0 0
0 . 0 0
0 . 0 0
0 . 0 0
0 . 0 0
A g g r e g a t e c a p i t a l s t o c k
( p e r c e n t )
0 . 4 7
0 . 1
6
1
2
2
1
1
1
1
- 0 . 0
- 0 . 0
- 0 . 0
- 0 . 0
- 0 . 0 1
- 0 . 0
- 0 . 0
- 0 . 0
R e a l G D
P ( f a c t o r c o s t )
( p e r c e n t )
0 . 3 3
0 . 0
3
1
1
1
0 0
1
0 0
1
0 0
- 0 . 0
- 0 . 0
- 0 . 0
0 .
- 0 . 0
0 .
- 0 . 0
0 .
R e a l G D
P ( m a r k e t
p r i c e s ) ( p e r c e n t )
0 . 3 4
0 . 0
4
1
1
1
0 0
1
0 0
1
0 0
- 0 . 0
- 0 . 0
- 0 . 0
0 .
- 0 . 0
0 .
- 0 . 0
0 .
R e a l p r i v a t e
c o n s u m p t i o n ( p e r c e n t )
0 . 4 1
0 . 0
3
1
2
1
0 0
1
0 0
1
0 0
- 0 . 0
- 0 . 0
- 0 . 0
0 .
- 0 . 0
0 .
- 0 . 0
0 .
R e a l g o v e r n m e n t
c o n s u m p t i o n ( p e r c e n t )
0 . 2 2
0 . 0
0
0 0
1
1
0 0
1
0 0
0 0
0 0
0 .
- 0 . 0
- 0 . 0
0 .
- 0 . 0
0 .
0 .
0 .
R e a l i n v
e s t m e n t
( p e r c e n t )
0 . 4 7
0 . 1
6
1
2
2
1
1
1
1
- 0 . 0
- 0 . 0
- 0 . 0
- 0 . 0
- 0 . 0 1
- 0 . 0
- 0 . 0
- 0 . 0
R e a l S a v i n g ( p e r c e n t )
0 . 3 9
0 . 0
4
- 0 . 0 1
- 0 . 0 1
- 0 . 0 1
0 . 0 0
- 0 . 0 1
0 . 0 0
- 0 . 0 1
0 . 0 0
E x p o r t v o l u m e s
( p e r c e n t )
0 . 5 2
1 . 0
2
1
2
1
0 0
1
0 0
0 0
0 0
- 0 . 0
- 0 . 0
- 0 . 0
0 .
- 0 . 0
0 .
0 .
0 .
I m p o r t v o l u m e s
( p e r c e n t )
0 . 6 6
1 . 1
2
1
2
2
0 0
1
1
1
- 0 . 0
- 0 . 0
- 0 . 0
0 .
- 0 . 0 1
- 0 . 0
- 0 . 0
- 0 . 0
T r a d e B
a l a n c e ( M i l l i o n
$ )
- 9 4 . 0 2
- 5
4 7
5 1
6 0
5 7
7 1
5
9 2
9
1 . 5 1
0 .
0 .
2 .
0 .
3 .
3 6 . 8
7 .
9 2 . 8
W e l f a r e
( M i l l i o n $ )
5 4 5 . 2 1
7 4 . 8 9
- 5 . 3 4
- 8 . 4 3
-
- 1 3 . 9 2
- 2 . 2 2
- 4 0 . 8 5
-
1
3 5 . 4 6
- 2 9 . 3 6
5 2 0 . 3 6
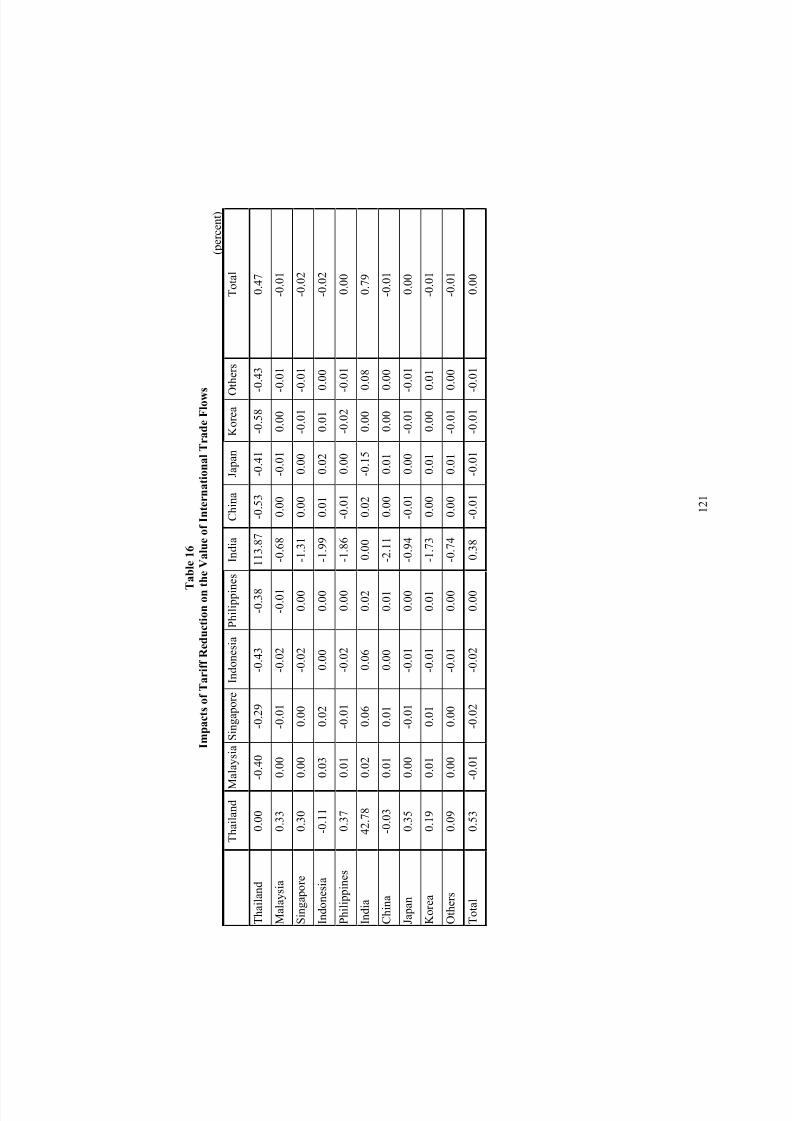
8/8/2019 Indo Thai FTA
http://slidepdf.com/reader/full/indo-thai-fta 119/141
T a b l e 1 6
I m p a c t s
o f T a r i f f R e d u c t i o n o n t h e V a l u e o f I n t e r n a t i o n a l T r a d e F l o w s
( p e r c e n t )
T h a i l a n d
M a l a y s i a S i n g a p o r e I n d o n e s i a P h i l i p p i n e s
I n d i a
C h i n a
J a p a n
K o r e a
O t h e r s
T o t a l
T h a i l a n d
0 . 0 0
- 0 . 4 0
- 0 . 2 9
- 0 . 4 3
- 0 . 3 8
1 1 3 . 8 7
- 0 . 5 3
- 0 . 4 1
- 0 . 5 8
- 0 . 4 3
0 . 4 7
M a l a y s i a
0 . 3 3
0 . 0 0
- 0 . 0 1
- 0 . 0 2
- 0 . 0 1
- 0 . 6 8
0 . 0 0
- 0 . 0 1
0 . 0 0
- 0 . 0 1
- 0 . 0 1
S i n g a p o r e
0 . 3 0
0 . 0 0
0 . 0 0
- 0 . 0 2
0 . 0 0
- 1 . 3 1
0 . 0 0
0 . 0 0
- 0 . 0 1
- 0 . 0 1
- 0 . 0 2
I n d o n e s i
a
- 0 . 1 1
0 . 0 3
0 . 0 2
0 . 0 0
0 . 0 0
- 1 . 9 9
0 . 0 1
0 . 0 2
0 . 0 1
0 . 0 0
- 0 . 0 2
P h i l i p p i n
e s
0 . 3 7
0 . 0 1
- 0 . 0 1
- 0 . 0 2
0 . 0 0
- 1 . 8 6
- 0 . 0 1
0 . 0 0
- 0 . 0 2
- 0 . 0 1
0 . 0 0
I n d i a
4 2 . 7 8
0 . 0 2
0 . 0 6
0 . 0 6
0 . 0 2
0 . 0 0
0 . 0 2
- 0 . 1 5
0 . 0 0
0 . 0 8
0 . 7 9
C h i n a
- 0 . 0 3
0 . 0 1
0 . 0 1
0 . 0 0
0 . 0 1
- 2 . 1 1
0 . 0 0
0 . 0 1
0 . 0 0
0 . 0 0
- 0 . 0 1
J a p a n
0 . 3 5
0 . 0 0
- 0 . 0 1
- 0 . 0 1
0 . 0 0
- 0 . 9 4
- 0 . 0 1
0 . 0 0
- 0 . 0 1
- 0 . 0 1
0 . 0 0
K o r e a
0 . 1 9
0 . 0 1
0 . 0 1
- 0 . 0 1
0 . 0 1
- 1 . 7 3
0 . 0 0
0 . 0 1
0 . 0 0
0 . 0 1
- 0 . 0 1
O t h e r s
0 . 0 9
0 . 0 0
0 . 0 0
- 0 . 0 1
0 . 0 0
- 0 . 7 4
0 . 0 0
0 . 0 1
- 0 . 0 1
0 . 0 0
- 0 . 0 1
T o t a l
0 . 5 3
- 0 . 0 1
- 0 . 0 2
- 0 . 0 2
0 . 0 0
0 . 3 8
- 0 . 0 1
- 0 . 0 1
- 0 . 0 1
- 0 . 0 1
0 . 0 0
1 2 1
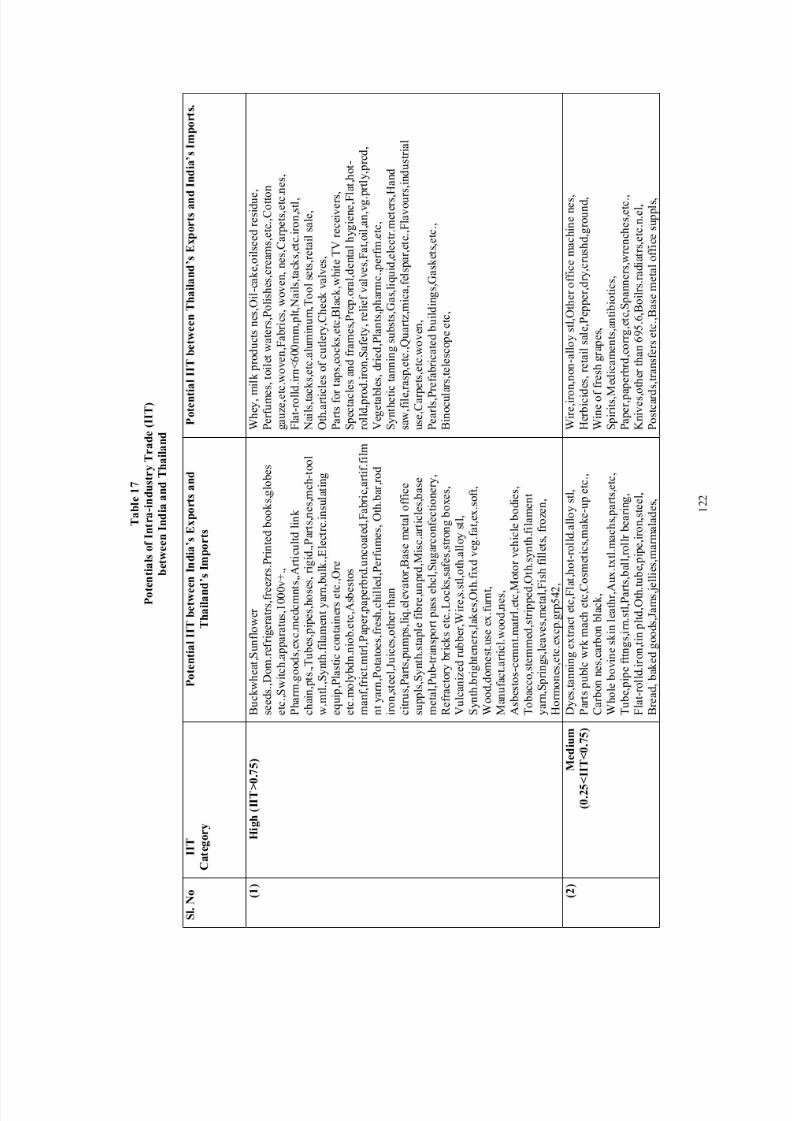
8/8/2019 Indo Thai FTA
http://slidepdf.com/reader/full/indo-thai-fta 120/141
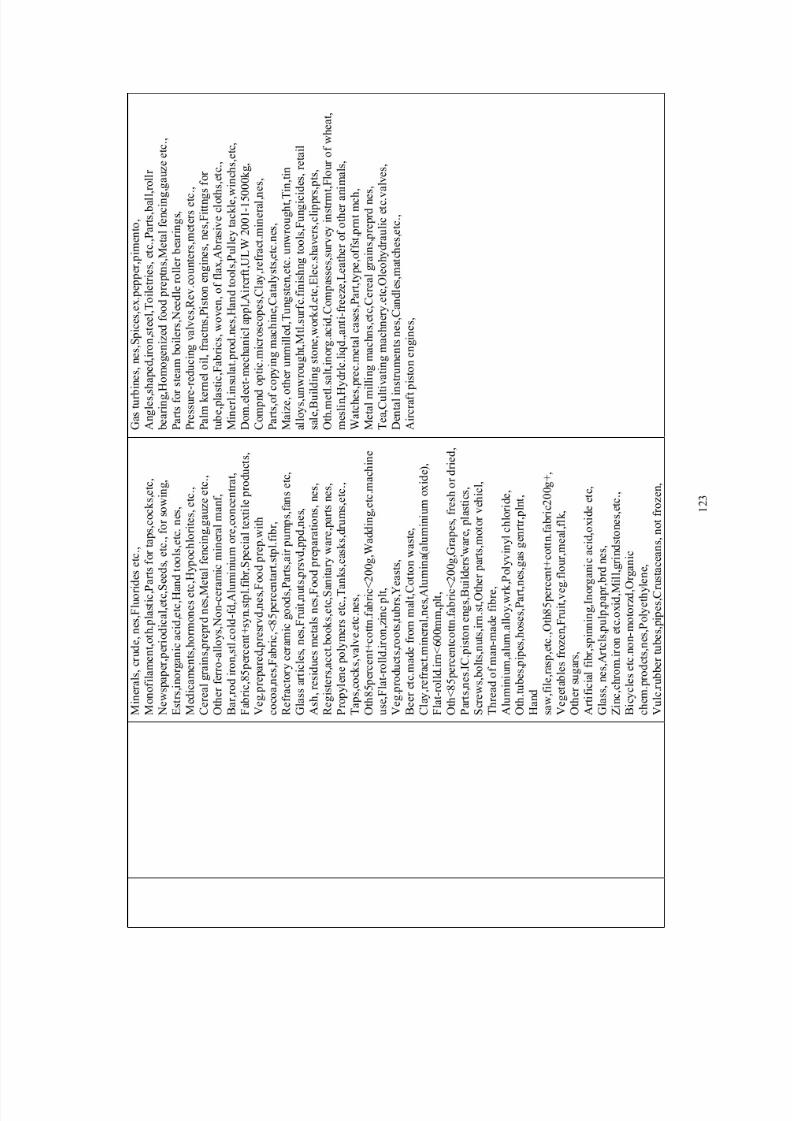
8/8/2019 Indo Thai FTA
http://slidepdf.com/reader/full/indo-thai-fta 121/141
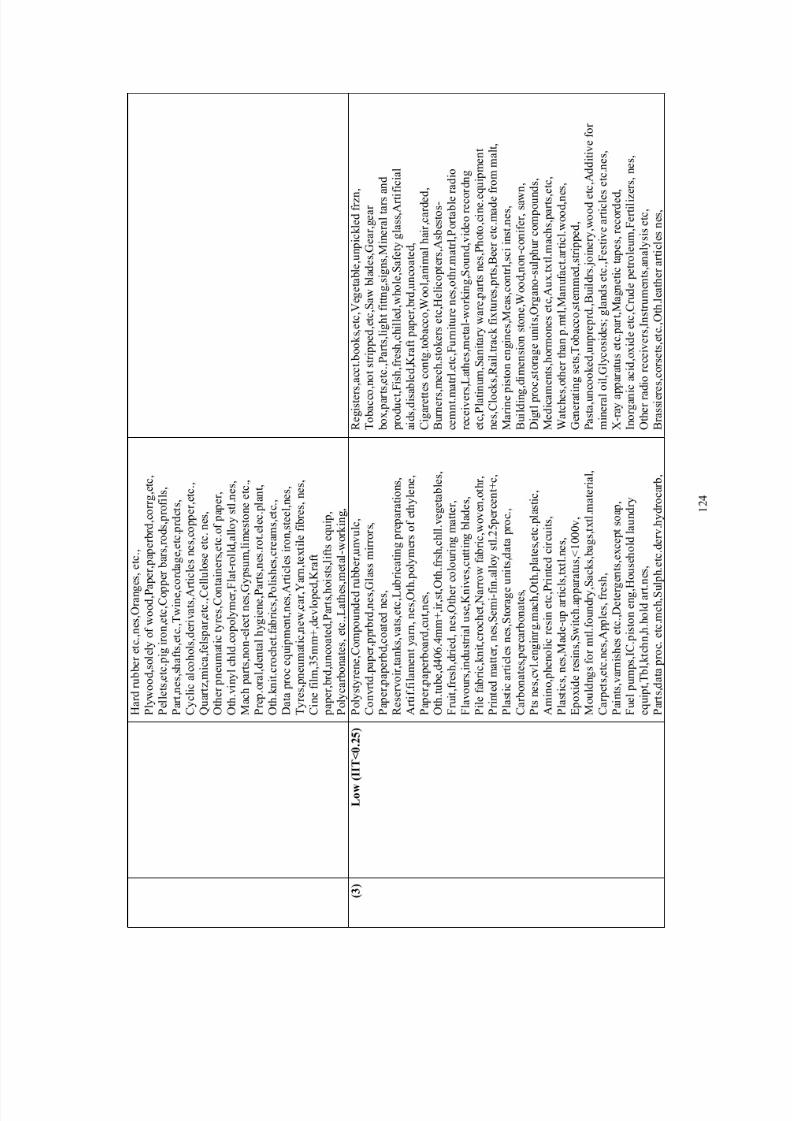
8/8/2019 Indo Thai FTA
http://slidepdf.com/reader/full/indo-thai-fta 122/141
8/8/2019 Indo Thai FTA
http://slidepdf.com/reader/full/indo-thai-fta 123/141
P o
r t l a n d c e m e n t , e t c . , P r i n t i n g i n k ,
I n
s u l t d w i r e , e t c . c o n d c t r , P a r t s , t e l e c o m m
u n . e q u i p t ,
A c r y l i c p o l y m e r s , S t a r c h e s , i n u l i n , g l u t e n ,
M
i l k c o n c e n t d . , s w e e t e n e d , C o p p e r
p l a t e , e t c . 1 5 m m + t h , S p i c e s , e x . p e p p e r , p i m e n t o ,
B o v i n e m e a t , f r o z e n , P o l y a m i d e s ,
O t h . n o n - f e r r . o r e , c o n c n t r , A r t c l s . c e r a m i c m a t r l , n e s ,
E l e c t r i c a l c a p a c i t o r s , O t h e r s t y r e n e p o l y
m e r s ,
P l
s t c s h e e t e t c . s e l f - a d h , E l e c . c o n t r o l p a n e l s e t c . ,
O t h . f o o t w e a r , l t h r . u p p e r s , C o t t o n l i n t e r s ,
R i c e , m i l l e d , s e m i - m i l l e d ,
S h i p s , b o a t s , o t h r . v e s s e l s , T r u n k s , s u i t - c a s e s , e t c . ,
P o r t l a n d c e m e n t , e t c . , V e g . p r o d u c t s , r o o t s , t u b r s ,
S i l v e r , M i l k e x . c o n c e n t d . s w e e t n d , B i r d s ' e g g s , i n s h e l l ,
F i s h , f r o z e n e x . f i l l e t s , C r u s t a c e a n s , f r o z e n ,
M o l l u s c s , B u c k w
h e a t e t c . u n m i l l e d , C e r e a l
g r o a t , m e a l , p e l l t s , M i x e s , d o u g h s f o r 0 4 8 . 4 ,
V e g e t a b l e s f r o z e
n , O r a n g e s , e t c . , A p p l e s , f r e s h , G r a p e s , f r e s h o r
d r i e d , N a t u r a l h o n e y , C o f f e e , n o t r o a s t e d , C o c o a b e a n s ,
C o c o a p o w d e r , s w e e t e n e d , O t h . c o c o a p r e p . l e s s 2 k g . ,
B r a n , s h a r p s , o t h . r e s i d u e s , V e g e t a b l e r e s i d u e s , w a s t e ,
Y e a s t s , F e r m e n t e
d b e v e r a g e s , n e s ,
T o b a c c o r e f u s e , O
t h . m a n u f a c t u r e d t o b a c c o , W h o l e b o v
i n . h i d e < 8 k g
d r y , S h e e p s k i n , e x c p t . f u r s k i n , G r o u n d n u t s ( p e a n u t s ) , S e
s a m e
( s e s a m u m ) s e e d s
, O i l s e e d s , e t c . n e s ,
R e c l m d . u n h d . r u b b e r ; w a s t e , F u e l w o o d , w o o d c h a r c o a l ,
W o o d , c o n i f , w o r k e d , s h a p e d , W o o d , n o n - c o n i f . w r k d , s h p d ,
R a w s i l k ( n o t t h r
o w n ) , C o t t o n , n o t c a r d e d , c o m b e d , C o t t o n , c a r d e d o r
c o m b e d , F l a x , w a
s t e f l a x , W o o l , g r e a s y , O t h e r w o o l ,
u n p r o c e s s e d , N a t u r a l c a l c . p h o s p h a t e s , S a n d s , n a t r l . n o t
m t l . b r n g , I n d u s t r i a l d i a m o n d s , N a t u r a l a b r a s i v e s , n e s ,
S o d i u m c h l o r i d e , e t c . , W a s t e , s c r a p o f c a s t i r o n ,
A l u m i n a ( a l u m i n i u m o x i d e ) , O t h . n o n - f e r r . o r e , c o n c n t r ,
P r e c . m e t a l w a s t e
, s c r a p , V e g . m a t e r i a l , f o r p l a i t n g , P r o p a
n e ,
l i q u e f i e d , A n i m a l o i l , f a t , g r e a s . n e s , C o t t o n s e e d o i l , f r a c t i o n ,
S u n f l o w e r s e e d o i l , e t c . , S e s a m e o i l , f r a c t i o n s ,
C o c o n u t o i l , f r a c
t i o n s , C a s t o r o i l , f r a c t i o n s , W a x e s , a n i m a l , v e g .
o r i g i n , H a l o g e n . d
e r v . h y d r o c a r b o n , S u l p h . e t c . d e r v . h y d r o c a r b ,
C y c l i c a l c o h o l s , d e r i v a t s , O t h r . o r g a n o - i n o r g a n . c o m p ,
A l d e h y d e , e t c . f n c
t . c m p n d s , E s t r s , i n o r g a n i c a c i d , e t c ,
O t h e r c h e m i c a l e
l e m e n t s , F l u o r i d e s e t c . ,
C h l o r i d e , b r o m i d e , i o d i d e s , H y p o c h l o r i t e s , e t c . , N i t r i t e s ; n i t r a t e s ,
M e t a l l i c a c i d s a l t s , e t c , D y e s , t a n n i n g e x t r a c t e t c ,
V e g . a l k a l o i d s , e x
c . g r p 5 4 2 , H o r m o n e s , e t c . e x c p . g r p 5 4 2 ,
P o t a s s i c c h e m . f e
r t i l i z e r , W a s t e , e t h y l e n e p o l y m e r s ,
T u b e , n o t r e i n f . n o f t t n g s , M o n o f i l a m e n t , o t h . p l a s t i c ,
D e t o n a t o r s , f u s e s
e t c . , F i r e w o r k s , f l a r e s , e t c . ,
W o o d - , r e s i n - b a s e c h e m . p r , L e a t h e r b e l t i n g e t c . , S a d d l e
r y a n d
h a r n e s s , O t h . f o r m
s u n v u l c d . r u b b e r , P a c k i n g s , p a l l e t s e t c . ,
W o o d , d o m e s t . u s
e e x . f u r n t , C o n v r t d . p a p e r , p p r b r d , n e s ,
1 2 5
8/8/2019 Indo Thai FTA
http://slidepdf.com/reader/full/indo-thai-fta 124/141
S t a t i o n e r y , e t c . , F a b r i c , < 8 5 p e r c e n t a r t . s t p l . f i b r , P i l e , c h n l
l e . f a b r c , m -
m a d e , F a b r i c , w o o l , f n e . h a i r , n e s , F a b r i c , w v n . j u t e , o t h . t x t l ,
F a b r i c , w o v e n g l a s s f i b r e , G i m p e d y a r n , e t c . ,
T a r p a u l i n s , s a i l s , a w n i n g s , B l a n k e t s , t r a v e l l i n g r u g s ,
C a s t , r o l l e d g l a s s , s h e e t s , O r n a m e n t a l c e r a m i c a r t c l ,
P i g i r o n , e t c . p r i m
r y . f o r m , F e r r o - m a n g a n e s e , O t h e r f e r r o
- a l l o y s ,
I n g o t s o f i r o n o r
s t e e l , S e m i - f i n i s h . i r o n , s t e e l ,
S e m i - f i n . a l l o y s t l . 2 5 p e r c e n t + c , F l a t - r o l l e d . h i - s p e e d s t l , F l a t , h o t -
r o l l d . a l l o y s t l , F l t
, c o l d - r o l l d . a l l o y s t l , N i c k e l , n c k l . a l l o y , u n w r g t ,
N i c k e l , n i c k e l a l l o y , w r k d , L e a d , l e a d a l l o y s , w o r k e d ,
C o b a l t , c a d m i u m , e t c . u n w r t , N a i l s , t a c k s , e t c . c o p p e r ,
H . h o l d a p p l i a n c s
, e t c . n e s , C h a i n , i r o n , s t e e l , A r t i c l e s
c o b a l t , e t c . , n e s , A r t i c l s . t u n g s t e n , e t c . n e s , S t e a m , s u p e r - h e a t
b o i l e r s , A u x . b o i l r p l a n t , c o n d e n s r , S t e a m , v a p o u r t u r b i n e s ,
P a r t s f o r s t e a m t u r b i n e s , R e a c t i o n
e n g i n e s , H y d r l c . t u r b i n e , w t r . w h e e l , N u c l e a r r e a c t o r s , p t s
n e s ,
D a i r y m a c h i n e r y
e t c . p r t s , P a p e r , p u l p , m a k i n g m a c h r y ,
O t h . p r i n t n g , a n c i l l . m a c h s , B o o k b i n d i n g m a c h n e r y , p r t ,
M c h - t l , w r k n g m t l , n o l a t h s , U n i t h e a d , d r i l l , e t c . m a c h ,
R o t a r y p u m p s , n
e s , T a p e r d r o l l e r b e a r n g e t c , S p h e r i c a l r o l l e r
b e a r n g s , O t h e r c y
l . r o l l e r b e a r i n g , T y p e w r i t r s , w d - p r o c m
a c h s ,
M o t o r v e h . r a d i o
r e c e i v e r , P u b - t r a n s p o r t p a s s v e h c l ,
R o a d t r a c t o r , s e m
i t r a i l e r , M o t o r v e h i c l e c h a s s i s ,
M o t o r v e h i c l e b o
d i e s , M o t o r c y c l e s e t c . , T r a i l e r s , t r a n s p o r t
g o o d s , T r a n s p o r t
c o n t a i n e r s , O t h r . l o c o m o t i v e s , t e n d e r s ,
A i r c r f t e t c . U L W < = 2 0 0 0 k g , T u g s a n d p u s h e r c r a f t ,
I l l u m i n a t e d s i g n s e t c . , H a n d b a g s , n e s , T r a v e l g o o d s n e s ,
O v e r c o a t s , o u t e r w
e a r , e t c . , J a c k e t s a n d b l a z e r s ,
U n d e r w e a r , n i g h t w e a r e t c . , O v e r c o a t s , o t h . c o a t s e t c . ,
S u i t s a n d e n s e m b l e s , J a c k e t s , S k i r t s & d i v i d e d s k i r t s ,
T r o u s e r s , b r e e c h e s e t c . , U n d e r w e a r , n i g h t w e a r e t c . ,
O v e r c o a t s , o u t e r w
e a r e t c . , U n d e r w e a r , n i g h t w e a r e t c . ,
J e r s y s , p u l l o v r s , e t c . k n i t , S w i m w e a r , O t h . g a r m e n t s , n o t k
n i t t e d ,
O t h e r g a r m e n t s k n i t t e d , H o s i e r y , e t c . k n i t t e d , L e a t h e r
a p p a r e l , a c c e s s r s , A r t i c l e s , a c c e s s o r i e s . f u r ,
H e a d g e a r , f i t t i n g s , n e s , F o o t w e a r , w . m e t a l t o e - c a p ,
F o o t w e a r , n e s , N o
n - o p t i c . m i c r o s c o p e e t c , L i q . c r y s t a l
d e v c s ; l a s e r s , M e d
i c a l , b a r b e r ' s f u r n t r e ,
P h o t o f i l m f l a t u n e x p o s d , P h o t o f i l m r o l l u n e x p o s d ,
1 2 6
8/8/2019 Indo Thai FTA
http://slidepdf.com/reader/full/indo-thai-fta 125/141
P h o t o p a p e r e t c . u n e x p o s d , A r m d . f i g h t . v e h c l , w e a p o n s ,
B o m b , m i n e s , m i s
s l . a m m . e t c , N o n - m i l i t a r y a r m s , F a i r g r o u n d
a m u s e m n t s e t c , H
a n d p a i n t n g s , d r a w n g e t c ,
O t h r . a r t i c l e s , p r e c . m e t a l , C a r v e d , m o u l d e d g o o d s n e s ,
M a n u f a c t u r e d g o
o d s , n e s . ,
1 2 7
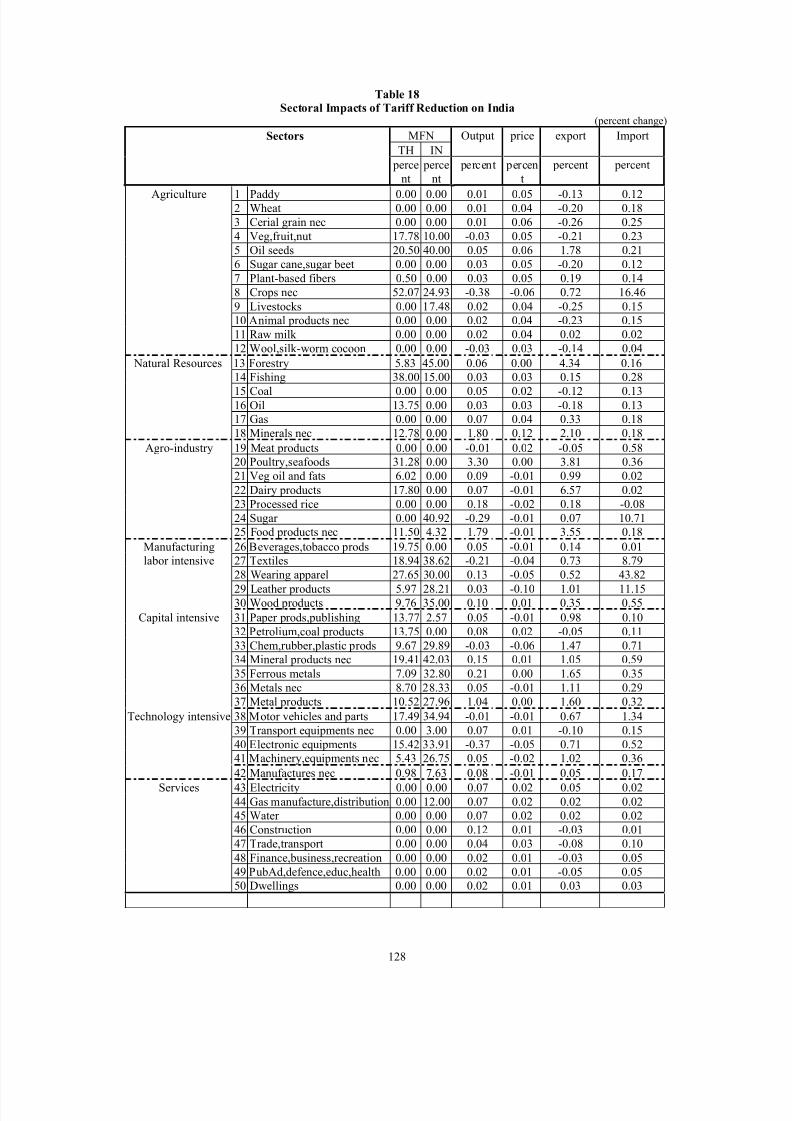
8/8/2019 Indo Thai FTA
http://slidepdf.com/reader/full/indo-thai-fta 126/141
Table 18Sectoral Impacts of Tariff Reduction on India
Sectors MFN Output price export
(percent change)
Import
TH IN
perce
nt
perce
nt
percent percen
t
percent percent
Agriculture 1 Paddy 0.00 0.00 0.01 0.05 -0.13 0.12
2 Wheat 0.00 0.00 0.01 0.04 -0.20 0.18
3 Cerial grain nec 0.00 0.00 0.01 0.06 -0.26 0.25
4 Veg,fruit,nut 17.78 10.00 -0.03 0.05 -0.21 0.23
5 Oil seeds 20.50 40.00 0.05 0.06 1.78 0.21
6 Sugar cane,sugar beet 0.00 0.00 0.03 0.05 -0.20 0.12
7 Plant-based fibers 0.50 0.00 0.03 0.05 0.19 0.14
8 Crops nec 52.07 24.93 -0.38 -0.06 0.72 16.46
9 Livestocks 0.00 17.48 0.02 0.04 -0.25 0.1510 Animal products nec 0.00 0.00 0.02 0.04 -0.23 0.15
11 Raw milk 0.00 0.00 0.02 0.04 0.02 0.02
12 Wool,silk-worm cocoon 0.00 0.00 -0.03 0.03 -0.14 0.04 Natural Resources 13 Forestry 5.83 45.00 0.06 0.00 4.34 0.1614 Fishing 38.00 15.00 0.03 0.03 0.15 0.28
15 Coal 0.00 0.00 0.05 0.02 -0.12 0.13
16 Oil 13.75 0.00 0.03 0.03 -0.18 0.1317 Gas 0.00 0.00 0.07 0.04 0.33 0.18
18 Minerals nec 12.78 0.00 1.80 0.12 2.10 0.18
Agro-industry 19 Meat products 0.00 0.00 -0.01 0.02 -0.05 0.5820 Poultry,seafoods 31.28 0.00 3.30 0.00 3.81 0.36
21 Veg oil and fats 6.02 0.00 0.09 -0.01 0.99 0.02
22 Dairy products 17.80 0.00 0.07 -0.01 6.57 0.02
23 Processed rice 0.00 0.00 0.18 -0.02 0.18 -0.08
24 Sugar 0.00 40.92 -0.29 -0.01 0.07 10.71
25 Food products nec 11.50 4.32 1.79 -0.01 3.55 0.18Manufacturing 26 Beverages,tobacco prods 19.75 0.00 0.05 -0.01 0.14 0.01
27 Textiles 18.94 38.62 -0.21 -0.04 0.73 8.79
28 Wearing apparel 27.65 30.00 0.13 -0.05 0.52 43.82
29 Leather products 5.97 28.21 0.03 -0.10 1.01 11.15
labor intensive
30 Wood products 9.76 35.00 0.10 0.01 0.35 0.55
Paper prods,publishing 13.77 2.57 0.05 -0.01 0.98 0.10
32 Petrolium,coal products 13.75 0.00 0.08 0.02 -0.05 0.11
33 Chem,rubber,plastic prods 9.67 29.89 -0.03 -0.06 1.47 0.7134 Mineral products nec 19.41 42.03 0.15 0.01 1.05 0.59
35 Ferrous metals 7.09 32.80 0.21 0.00 1.65 0.35
36 Metals nec 8.70 28.33 0.05 -0.01 1.11 0.29
Capital intensive
37 Metal products 10.52 27.96 1.04 0.00 1.60 0.32
38 Motor vehicles and parts 17.49 34.94 -0.01 -0.01 0.67 1.34
39 Transport equipments nec 0.00 3.00 0.07 0.01 -0.10 0.15
40 Electronic equipments 15.42 33.91 -0.37 -0.05 0.71 0.5241 Machinery,equipments nec 5.43 26.75 0.05 -0.02 1.02 0.36
Technology intensive
42 Manufactures nec 0.98 7.63 0.08 -0.01 0.05 0.17
Services 43 Electricity 0.00 0.00 0.07 0.02 0.05 0.02
44 Gas manufacture,distribution 0.00 12.00 0.07 0.02 0.02 0.0245 Water 0.00 0.00 0.07 0.02 0.02 0.02
46 Construction 0.00 0.00 0.12 0.01 -0.03 0.01
47 Trade,transport 0.00 0.00 0.04 0.03 -0.08 0.10
48 Finance,business,recreation 0.00 0.00 0.02 0.01 -0.03 0.05
49 PubAd,defence,educ,health 0.00 0.00 0.02 0.01 -0.05 0.05
50 Dwellings 0.00 0.00 0.02 0.01 0.03 0.03
31
128
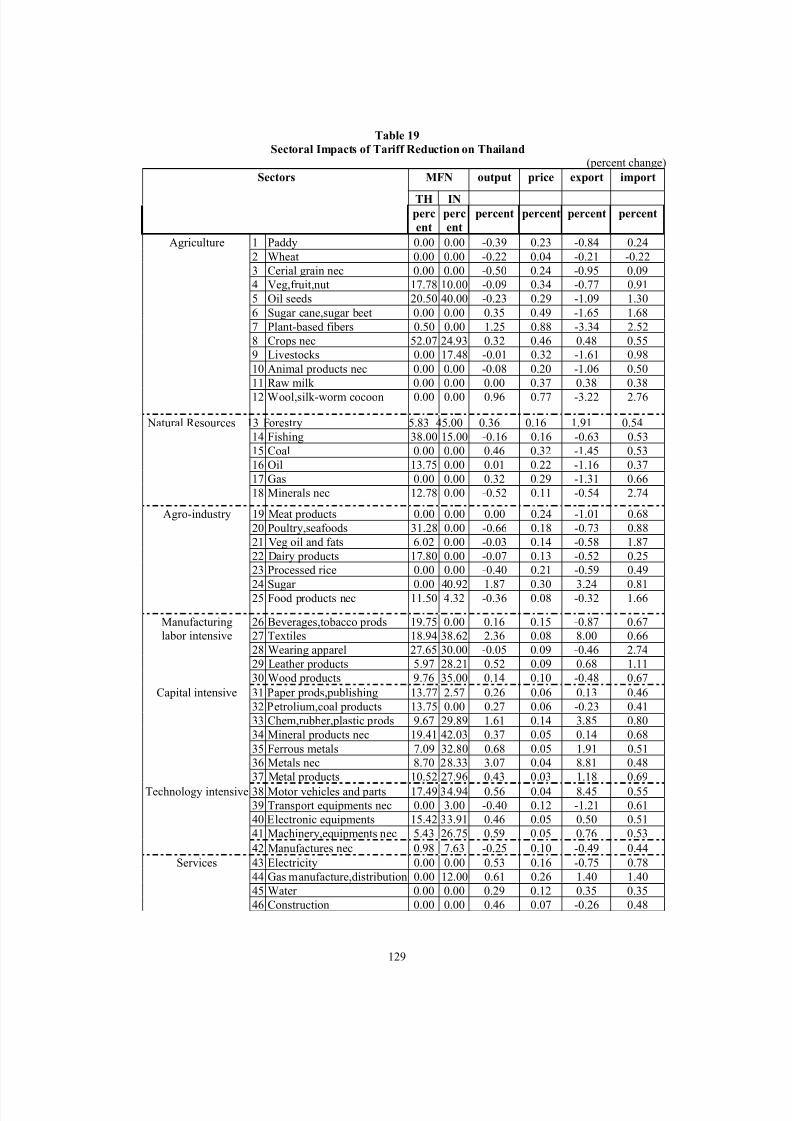
8/8/2019 Indo Thai FTA
http://slidepdf.com/reader/full/indo-thai-fta 127/141
Table 19
Sectoral Impacts of Tariff Reduction on Thailand(percent change)
MFN output price export importSectors
TH IN
perc
ent
perc
ent
percent percent percent percent
Agriculture 1 Paddy 0.00 0.00 -0.39 0.23 -0.84 0.24
2 Wheat 0.00 0.00 -0.22 0.04 -0.21 -0.22
3 Cerial grain nec 0.00 0.00 -0.50 0.24 -0.95 0.094 Veg,fruit,nut 17.78 10.00 -0.09 0.34 -0.77 0.91
5 Oil seeds 20.50 40.00 -0.23 0.29 -1.09 1.30
6 Sugar cane,sugar beet 0.00 0.00 0.35 0.49 -1.65 1.68
7 Plant-based fibers 0.50 0.00 1.25 0.88 -3.34 2.52
8 Crops nec 52.07 24.93 0.32 0.46 0.48 0.55
9 Livestocks 0.00 17.48 -0.01 0.32 -1.61 0.9810 Animal products nec 0.00 0.00 -0.08 0.20 -1.06 0.50
11 Raw milk 0.00 0.00 0.00 0.37 0.38 0.38
12 Wool,silk-worm cocoon 0.00 0.00 0.96 0.77 -3.22 2.76
Natural Resources 13 Forestry 5.83 45.00 0.36 0.16 1.91 0.54
14 Fishing 38.00 15.00 -0.16 0.16 -0.63 0.53
15 Coal 0.00 0.00 0.46 0.32 -1.45 0.53
16 Oil 13.75 0.00 0.01 0.22 -1.16 0.37
17 Gas 0.00 0.00 0.32 0.29 -1.31 0.66
18 Minerals nec 12.78 0.00 -0.52 0.11 -0.54 2.74
Agro-industry 19 Meat products 0.00 0.00 0.00 0.24 -1.01 0.68
20 Poultry,seafoods 31.28 0.00 -0.66 0.18 -0.73 0.8821 Veg oil and fats 6.02 0.00 -0.03 0.14 -0.58 1.87
22 Dairy products 17.80 0.00 -0.07 0.13 -0.52 0.2523 Processed rice 0.00 0.00 -0.40 0.21 -0.59 0.49
24 Sugar 0.00 40.92 1.87 0.30 3.24 0.81
25 Food products nec 11.50 4.32 -0.36 0.08 -0.32 1.66
26 Beverages,tobacco prods 19.75 0.00 0.16 0.15 -0.87 0.6727 Textiles 18.94 38.62 2.36 0.08 8.00 0.66
28 Wearing apparel 27.65 30.00 -0.05 0.09 -0.46 2.74
29 Leather products 5.97 28.21 0.52 0.09 0.68 1.11
Manufacturinglabor intensive
30 Wood products 9.76 35.00 0.14 0.10 -0.48 0.67
31 Paper prods,publishing 13.77 2.57 0.26 0.06 0.13 0.46
32 Petrolium,coal products 13.75 0.00 0.27 0.06 -0.23 0.4133 Chem,rubber,plastic prods 9.67 29.89 1.61 0.14 3.85 0.80
34 Mineral products nec 19.41 42.03 0.37 0.05 0.14 0.68
35 Ferrous metals 7.09 32.80 0.68 0.05 1.91 0.5136 Metals nec 8.70 28.33 3.07 0.04 8.81 0.48
Capital intensive
37 Metal products 10.52 27.96 0.43 0.03 1.18 0.69
38 Motor vehicles and parts 17.49 34.94 0.56 0.04 8.45 0.5539 Transport equipments nec 0.00 3.00 -0.40 0.12 -1.21 0.61
40 Electronic equipments 15.42 33.91 0.46 0.05 0.50 0.51
41 Machinery,equipments nec 5.43 26.75 0.59 0.05 0.76 0.53
Technology intensive
42 Manufactures nec 0.98 7.63 -0.25 0.10 -0.49 0.44
43 Electricity 0.00 0.00 0.53 0.16 -0.75 0.78
44 Gas manufacture,distribution 0.00 12.00 0.61 0.26 1.40 1.40
45 Water 0.00 0.00 0.29 0.12 0.35 0.35
Services
46 Construction 0.00 0.00 0.46 0.07 -0.26 0.48
129

8/8/2019 Indo Thai FTA
http://slidepdf.com/reader/full/indo-thai-fta 128/141
47 Trade,transport 0.00 0.00 0.14 0.11 -0.33 0.57
48 Finance,business,recreation 0.00 0.00 0.18 0.11 -0.44 0.53
49 PubAd,defence,educ,health 0.00 0.00 0.14 0.29 -1.11 0.76
50 Dwellings 0.00 0.00 0.36 0.07 0.36 0.36
130
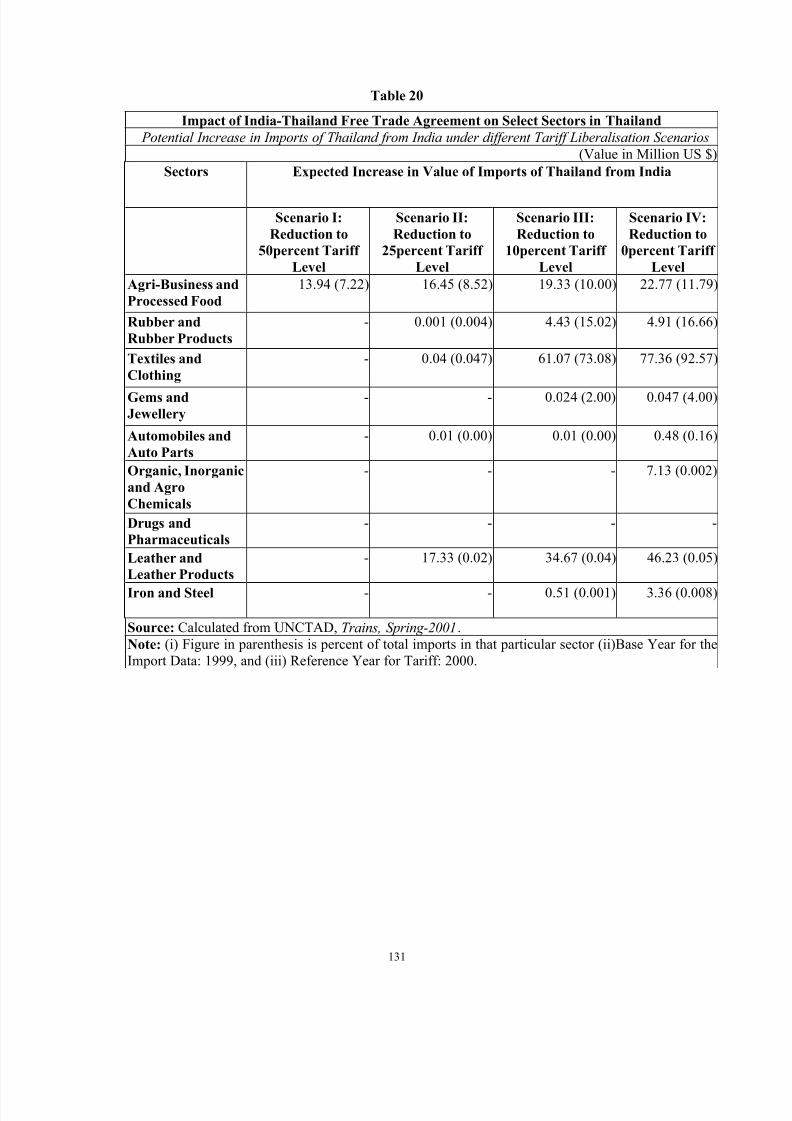
8/8/2019 Indo Thai FTA
http://slidepdf.com/reader/full/indo-thai-fta 129/141
Table 20
Impact of India-Thailand Free Trade Agreement on Select Sectors in Thailand
Potential Increase in Imports of Thailand from India under different Tariff Liberalisation Scenarios
(Value in Million US $)
Sectors Expected Increase in Value of Imports of Thailand from India
Scenario I:
Reduction to
50percent Tariff
Level
Scenario II:
Reduction to
25percent Tariff
Level
Scenario III:
Reduction to
10percent Tariff
Level
Scenario IV:
Reduction to
0percent Tariff
Level
Agri-Business and
Processed Food
13.94 (7.22) 16.45 (8.52) 19.33 (10.00) 22.77 (11.79)
Rubber and
Rubber Products
- 0.001 (0.004) 4.43 (15.02) 4.91 (16.66)
Textiles andClothing
- 0.04 (0.047) 61.07 (73.08) 77.36 (92.57)
Gems and
Jewellery
- - 0.024 (2.00) 0.047 (4.00)
Automobiles and
Auto Parts
- 0.01 (0.00) 0.01 (0.00) 0.48 (0.16)
Organic, Inorganic
and Agro
Chemicals
- - - 7.13 (0.002)
Drugs and
Pharmaceuticals
- - - -
Leather and
Leather Products
- 17.33 (0.02) 34.67 (0.04) 46.23 (0.05)
Iron and Steel - - 0.51 (0.001) 3.36 (0.008)
Source: Calculated from UNCTAD, Trains, Spring-2001.
Note: (i) Figure in parenthesis is percent of total imports in that particular sector (ii)Base Year for theImport Data: 1999, and (iii) Reference Year for Tariff: 2000.
131
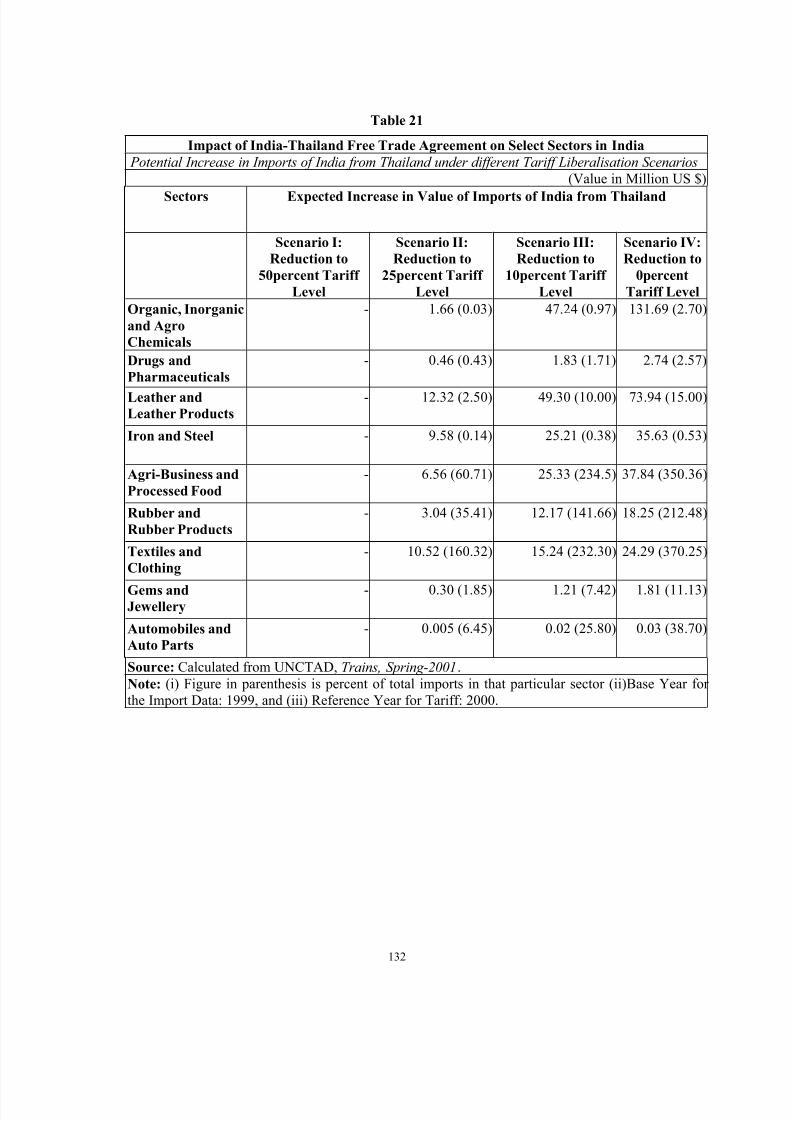
8/8/2019 Indo Thai FTA
http://slidepdf.com/reader/full/indo-thai-fta 130/141
Table 21
Impact of India-Thailand Free Trade Agreement on Select Sectors in India
Potential Increase in Imports of India from Thailand under different Tariff Liberalisation Scenarios
(Value in Million US $)Sectors Expected Increase in Value of Imports of India from Thailand
Scenario I:
Reduction to
50percent Tariff
Level
Scenario II:
Reduction to
25percent Tariff
Level
Scenario III:
Reduction to
10percent Tariff
Level
Scenario IV:
Reduction to
0percent
Tariff Level
Organic, Inorganic
and Agro
Chemicals
- 1.66 (0.03) 47.24 (0.97) 131.69 (2.70)
Drugs and
Pharmaceuticals
- 0.46 (0.43) 1.83 (1.71) 2.74 (2.57)
- 12.32 (2.50) 49.30 (10.00) 73.94 (15.00)
Iron and Steel - 9.58 (0.14) 25.21 (0.38) 35.63 (0.53)
Agri-Business and
Processed Food
- 6.56 (60.71) 25.33 (234.5) 37.84 (350.36)
Rubber and
Rubber Products
- 3.04 (35.41) 12.17 (141.66) 18.25 (212.48)
Textiles and
Clothing
- 10.52 (160.32) 15.24 (232.30) 24.29 (370.25)
Gems and
Jewellery
- 0.30 (1.85) 1.21 (7.42) 1.81 (11.13)
Automobiles and
Auto Parts
- 0.005 (6.45) 0.02 (25.80) 0.03 (38.70)
Source: Calculated from UNCTAD, Trains, Spring-2001.
Note: (i) Figure in parenthesis is percent of total imports in that particular sector (ii)Base Year for the Import Data: 1999, and (iii) Reference Year for Tariff: 2000.
Leather and
Leather Products
132
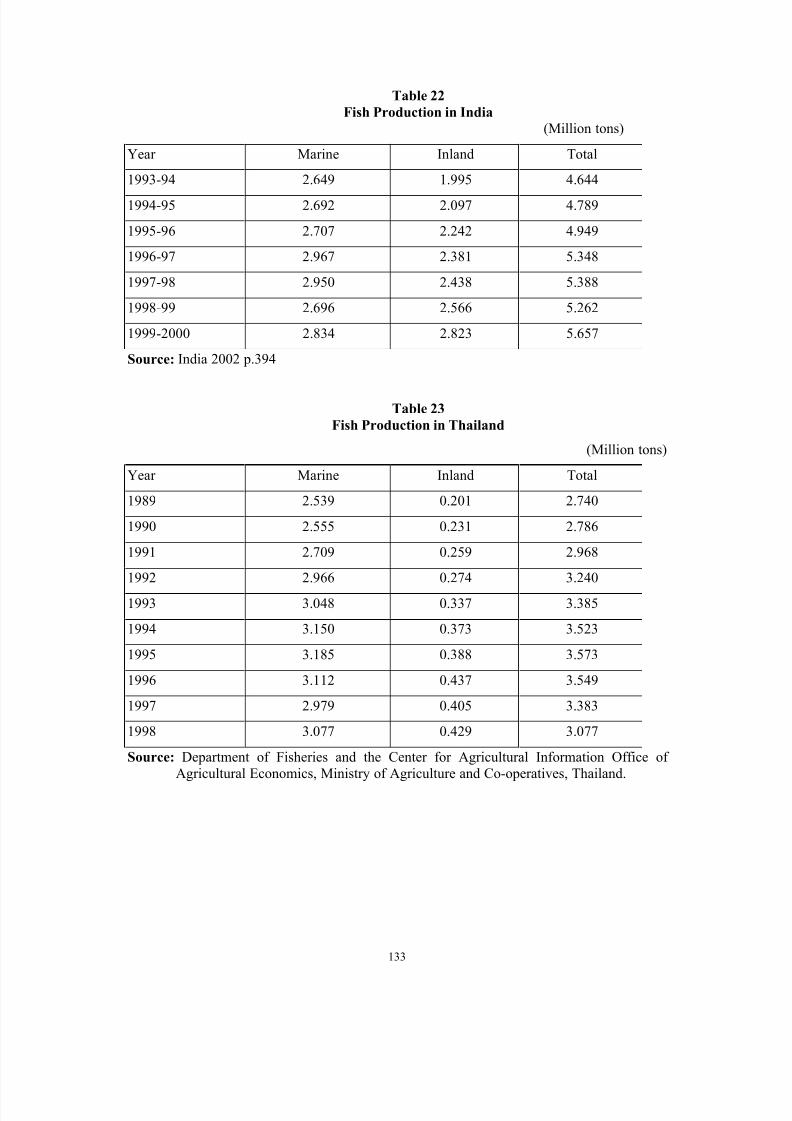
8/8/2019 Indo Thai FTA
http://slidepdf.com/reader/full/indo-thai-fta 131/141
Table 22
Fish Production in India
(Million tons)
Year Marine Inland Total
1993-94 2.649 1.995 4.644
1994-95 2.692 2.097 4.789
1995-96 2.707 2.242 4.949
1996-97 2.967 2.381 5.348
1997-98 2.950 2.438 5.388
1998-99 2.696 2.566 5.262
1999-2000 2.834 2.823 5.657
Source: India 2002 p.394
Table 23
Fish Production in Thailand
(Million tons)
Year Marine Inland Total
1989 2.539 0.201 2.740
1990 2.555 0.231 2.7861991 2.709 0.259 2.968
1992 2.966 0.274 3.240
1993 3.048 0.337 3.385
1994 3.150 0.373 3.523
1995 3.185 0.388 3.573
1996 3.112 0.437 3.549
1997 2.979 0.405 3.3831998 3.077 0.429 3.077
Source: Department of Fisheries and the Center for Agricultural Information Office of Agricultural Economics, Ministry of Agriculture and Co-operatives, Thailand.
133
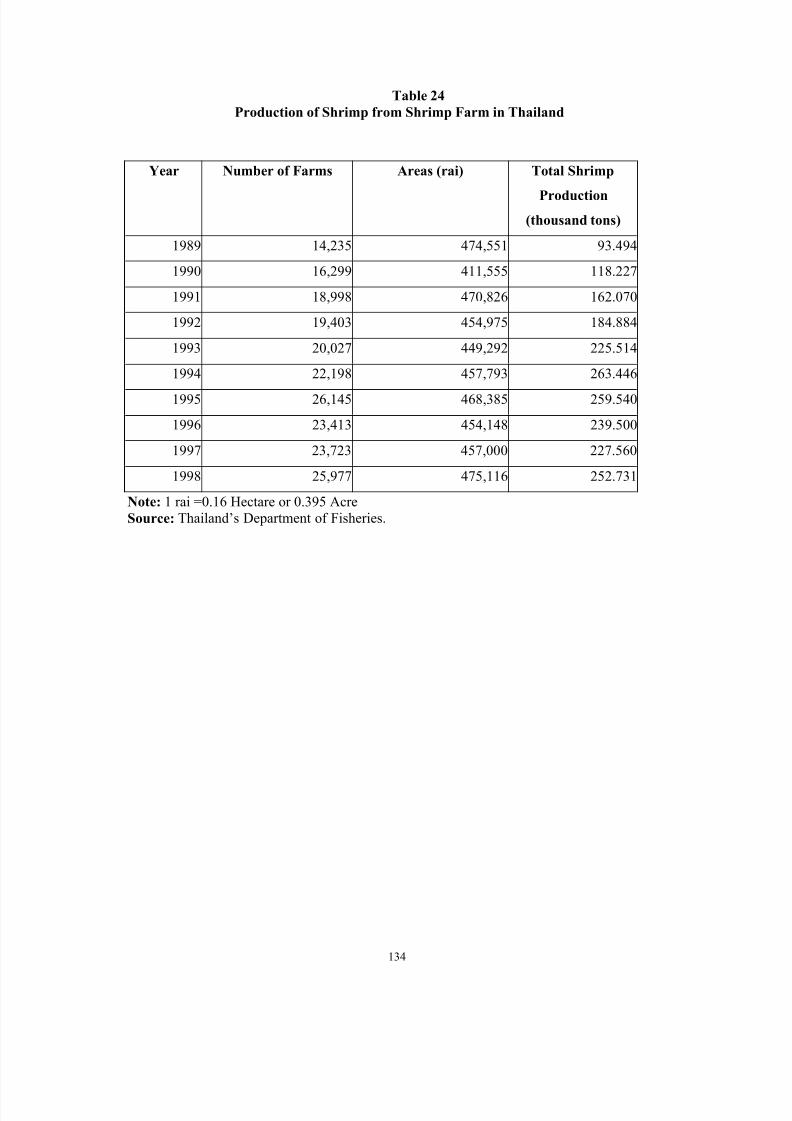
8/8/2019 Indo Thai FTA
http://slidepdf.com/reader/full/indo-thai-fta 132/141
Table 24
Production of Shrimp from Shrimp Farm in Thailand
Year Number of Farms Areas (rai) Total ShrimpProduction
(thousand tons)
1989 14,235 474,551 93.494
1990 16,299 411,555 118.227
1991 18,998 470,826 162.070
1992 19,403 454,975 184.884
1993 20,027 449,292 225.5141994 22,198 457,793 263.446
1995 26,145 468,385 259.540
1996 23,413 454,148 239.500
23,723 457,000 227.560
1998 25,977 475,116 252.731
1997
Note: 1 rai =0.16 Hectare or 0.395 AcreSource: Thailand’s Department of Fisheries.
134
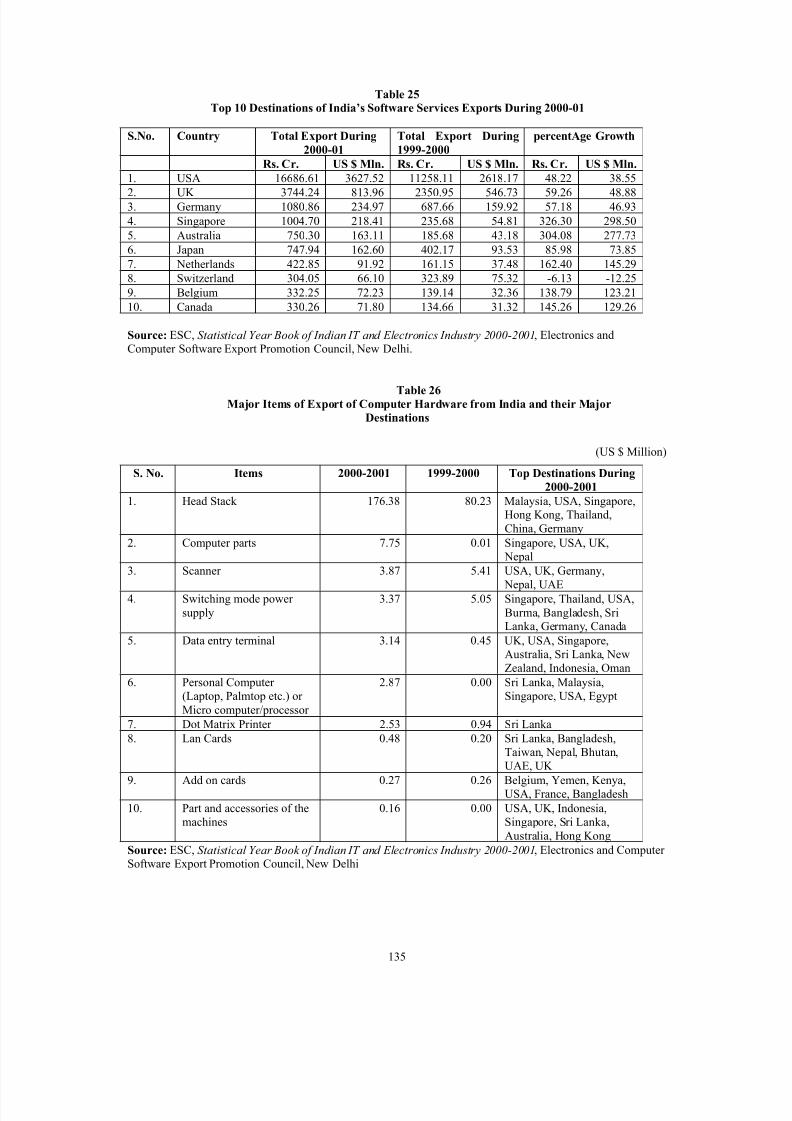
8/8/2019 Indo Thai FTA
http://slidepdf.com/reader/full/indo-thai-fta 133/141
Table 25Top 10 Destinations of India’s Software Services Exports During 2000-01
S.No. Country Total Export During
2000-01
Total Export During
1999-2000
percentAge Growth
Rs. Cr. US $ Mln. Rs. Cr. US $ Mln. Rs. Cr. US $ Mln.
1. USA 16686.61 3627.52 11258.11 2618.17 48.22 38.552. UK 3744.24 813.96 2350.95 546.73 59.26 48.88
3. Germany 1080.86 234.97 687.66 159.92 57.18 46.93
4. Singapore 1004.70 218.41 235.68 54.81 326.30 298.50
5. Australia 750.30 163.11 185.68 43.18 304.08 277.73
6. Japan 747.94 162.60 402.17 93.53 85.98 73.85
7. Netherlands 422.85 91.92 161.15 37.48 162.40 145.29
8. Switzerland 304.05 66.10 323.89 75.32 -6.13 -12.25
9. Belgium 332.25 72.23 139.14 32.36 138.79 123.21
10. Canada 330.26 71.80 134.66 31.32 145.26 129.26
Source: ESC, Statistical Year Book of Indian IT and Electronics Industry 2000-2001, Electronics and
Computer Software Export Promotion Council, New Delhi.
Table 26
Major Items of Export of Computer Hardware from India and their Major
Destinations
(US $ Million)
S. No. Items 2000-2001 1999-2000 Top Destinations During
2000-2001
1. Head Stack 176.38 Malaysia, USA, Singapore,Hong Kong, Thailand,
China, Germany
80.23
2. Computer parts 7.75 0.01 Singapore, USA, UK, Nepal
3. Scanner 3.87 5.41 USA, UK, Germany, Nepal, UAE
Switching mode power supply
3.37 5.05 Singapore, Thailand, USA,Burma, Bangladesh, SriLanka, Germany, Canada
5. Data entry terminal 3.14 0.45 UK, USA, Singapore,Australia, Sri Lanka, NewZealand, Indonesia, Oman
6. Personal Computer (Laptop, Palmtop etc.) or
Micro computer/processor
2.87 0.00 Sri Lanka, Malaysia,Singapore, USA, Egypt
7. Dot Matrix Printer 2.53 0.94 Sri Lanka
8. Lan Cards 0.48 0.20 Sri Lanka, Bangladesh,Taiwan, Nepal, Bhutan,UAE, UK
Add on cards 0.27 0.26 Belgium, Yemen, Kenya,USA, France, Bangladesh
10. Part and accessories of themachines
USA, UK, Indonesia,Singapore, Sri Lanka,Australia, Hong Kong
0.16 0.00
4.
9.
Source: ESC, Statistical Year Book of Indian IT and Electronics Industry 2000-2001, Electronics and Computer Software Export Promotion Council, New Delhi
135
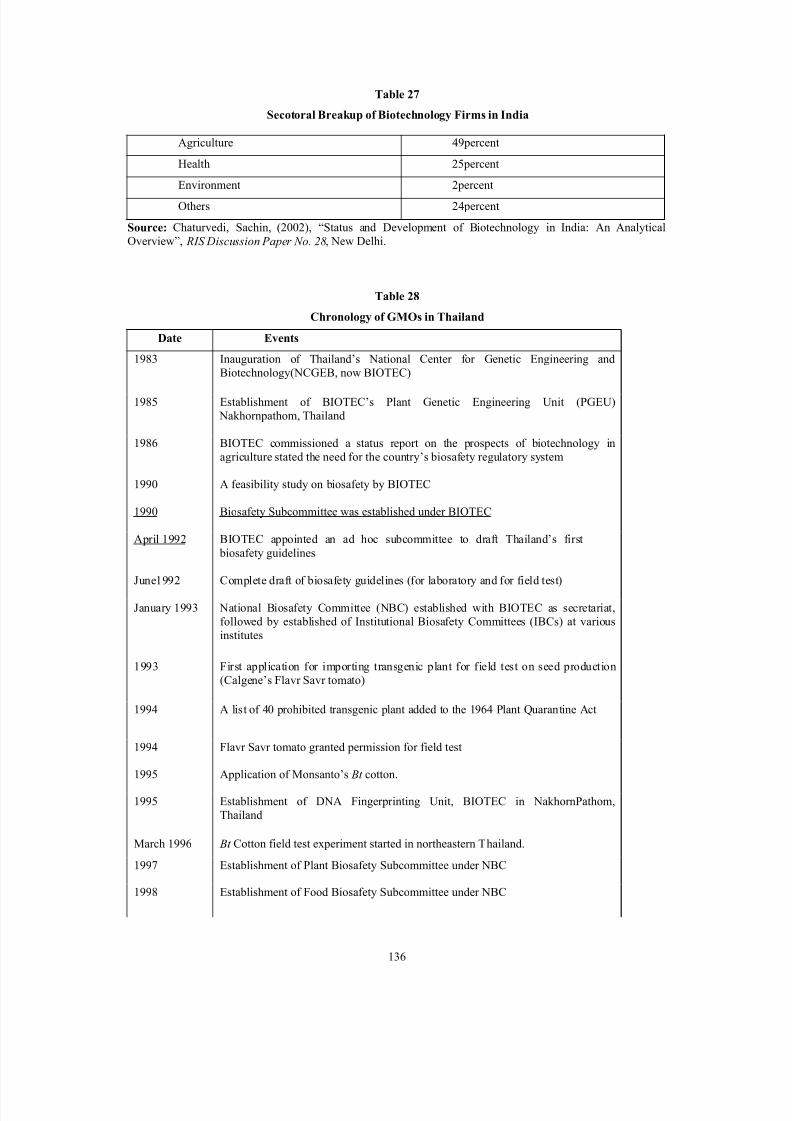
8/8/2019 Indo Thai FTA
http://slidepdf.com/reader/full/indo-thai-fta 134/141
Table 27
Secotoral Breakup of Biotechnology Firms in India
Agriculture 49percent
Health 25percent
2percent
Others 24percent
Environment
Source: Chaturvedi, Sachin, (2002), “Status and Development of Biotechnology in India: An AnalyticalOverview”, RIS Discussion Paper No. 28, New Delhi.
Table 28
Chronology of GMOs in Thailand
Date Events
1983 Inauguration of Thailand’s National Center for Genetic Engineering andBiotechnology(NCGEB, now BIOTEC)
1985 Establishment of BIOTEC’s Plant Genetic Engineering Unit (PGEU) Nakhornpathom, Thailand
1986 BIOTEC commissioned a status report on the prospects of biotechnology inagriculture stated the need for the country’s biosafety regulatory system
1990 A feasibility study on biosafety by BIOTEC
1990 Biosafety Subcommittee was established under BIOTEC
April 1992 BIOTEC appointed an ad hoc subcommittee to draft Thailand’s first biosafety guidelines
January 1993 National Biosafety Committee (NBC) established with BIOTEC as secretariat,followed by established of Institutional Biosafety Committees (IBCs) at variousinstitutes
1993 First application for importing transgenic plant for field test on seed production(Calgene’s Flavr Savr tomato)
1994 A list of 40 prohibited transgenic plant added to the 1964 Plant Quarantine Act
1994 Flavr Savr tomato granted permission for field test
1995 Application of Monsanto’s Bt cotton.
1995 Establishment of DNA Fingerprinting Unit, BIOTEC in NakhornPathom,Thailand
March 1996 Bt Cotton field test experiment started in northeastern Thailand.
1998 Establishment of Food Biosafety Subcommittee under NBC
June1992 Complete draft of biosafety guidelines (for laboratory and for field test)
1997 Establishment of Plant Biosafety Subcommittee under NBC
136
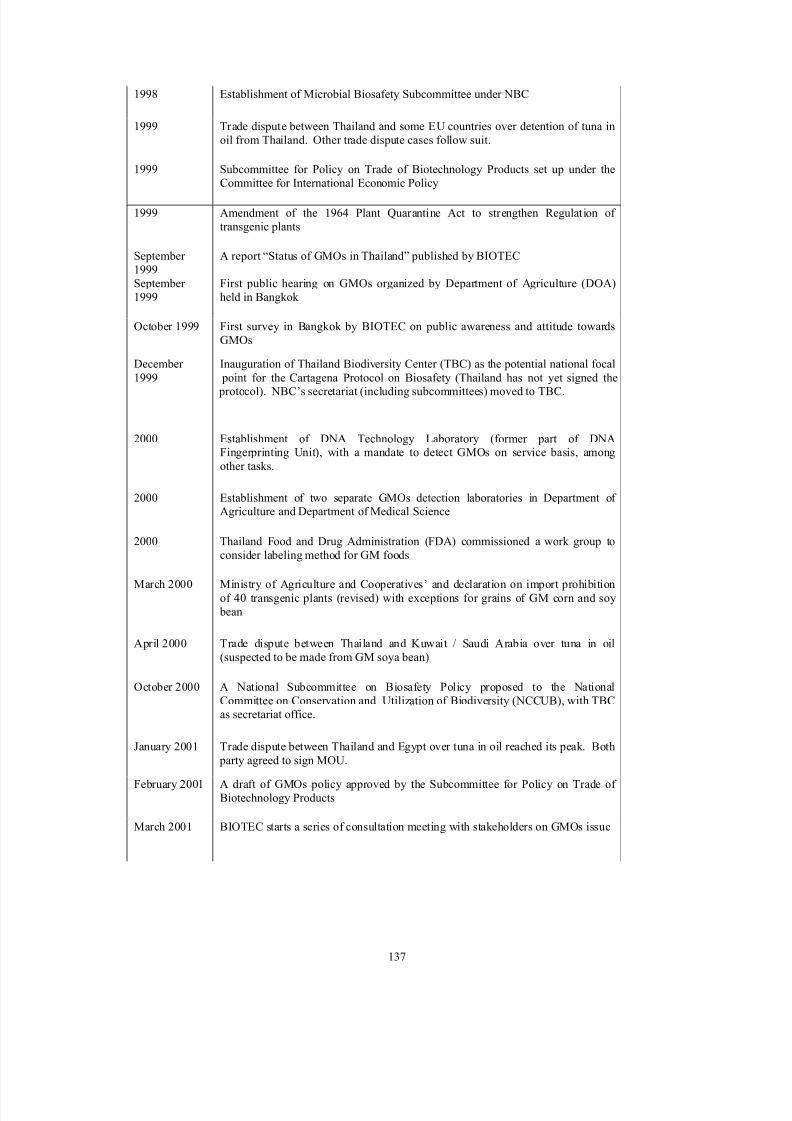
8/8/2019 Indo Thai FTA
http://slidepdf.com/reader/full/indo-thai-fta 135/141
1998 Establishment of Microbial Biosafety Subcommittee under NBC
1999 Trade dispute between Thailand and some EU countries over detention of tuna inoil from Thailand. Other trade dispute cases follow suit.
1999 Subcommittee for Policy on Trade of Biotechnology Products set up under theCommittee for International Economic Policy
1999 Amendment of the 1964 Plant Quarantine Act to strengthen Regulation of transgenic plants
A report “Status of GMOs in Thailand” published by BIOTEC
September 1999
First public hearing on GMOs organized by Department of Agriculture (DOA)held in Bangkok
First survey in Bangkok by BIOTEC on public awareness and attitude towardsGMOs
December 1999
Inauguration of Thailand Biodiversity Center (TBC) as the potential national focal point for the Cartagena Protocol on Biosafety (Thailand has not yet signed the protocol). NBC’s secretariat (including subcommittees) moved to TBC.
2000 Establishment of DNA Technology Laboratory (former part of DNAFingerprinting Unit), with a mandate to detect GMOs on service basis, amongother tasks.
2000 Establishment of two separate GMOs detection laboratories in Department of Agriculture and Department of Medical Science
2000 Thailand Food and Drug Administration (FDA) commissioned a work group toconsider labeling method for GM foods
March 2000 Ministry of Agriculture and Cooperatives’ and declaration on import prohibitionof 40 transgenic plants (revised) with exceptions for grains of GM corn and soy
bean
April 2000 Trade dispute between Thailand and Kuwait / Saudi Arabia over tuna in oil(suspected to be made from GM soya bean)
September 1999
October 1999
October 2000 A National Subcommittee on Biosafety Policy proposed to the NationalCommittee on Conservation and Utilization of Biodiversity (NCCUB), with TBCas secretariat office.
January 2001 Trade dispute between Thailand and Egypt over tuna in oil reached its peak. Both party agreed to sign MOU.
February 2001 A draft of GMOs policy approved by the Subcommittee for Policy on Trade of Biotechnology Products
March 2001 BIOTEC starts a series of consultation meeting with stakeholders on GMOs issue
137
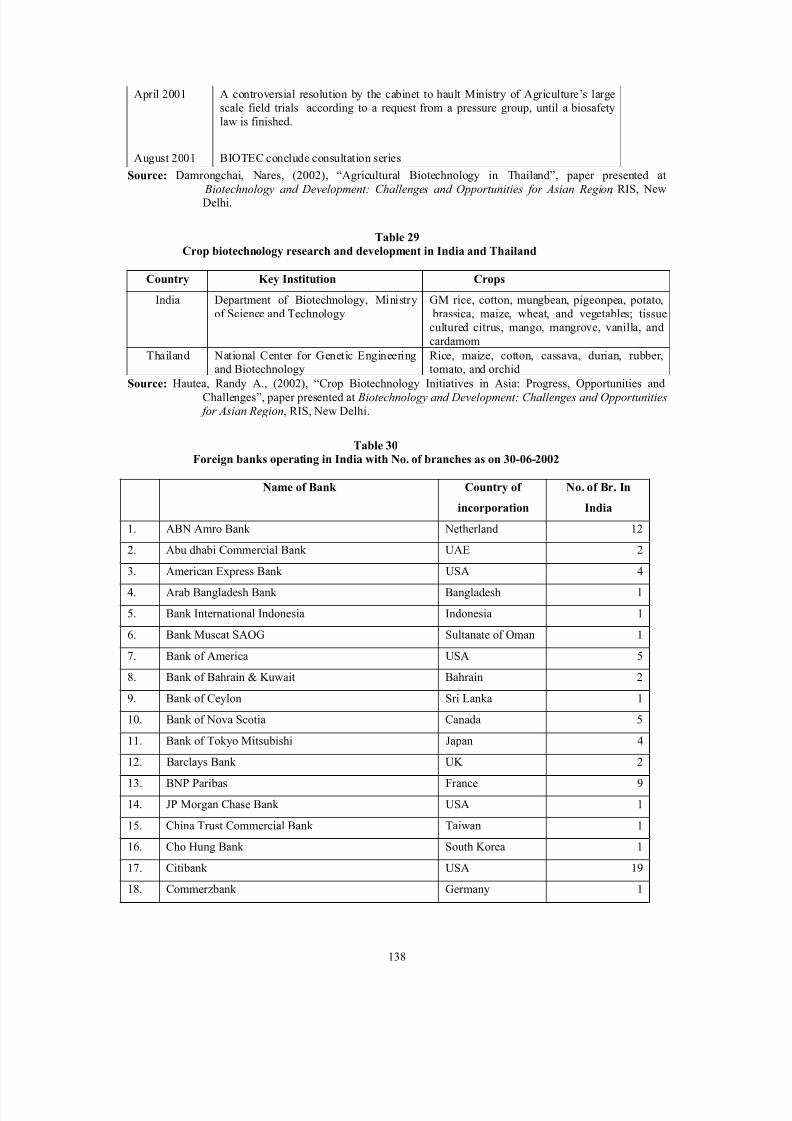
8/8/2019 Indo Thai FTA
http://slidepdf.com/reader/full/indo-thai-fta 136/141
April 2001 A controversial resolution by the cabinet to hault Ministry of Agriculture’s largescale field trials according to a request from a pressure group, until a biosafetylaw is finished.
August 2001 BIOTEC conclude consultation series
Source: Damrongchai, Nares, (2002), “Agricultural Biotechnology in Thailand”, paper presented at Biotechnology and Development: Challenges and Opportunities for Asian Region, RIS, NewDelhi.
Table 29
Crop biotechnology research and development in India and Thailand
Country Key Institution Crops
India Department of Biotechnology, Ministryof Science and Technology
GM rice, cotton, mungbean, pigeonpea, potato, brassica, maize, wheat, and vegetables; tissuecultured citrus, mango, mangrove, vanilla, andcardamom
Thailand National Center for Genetic Engineeringand Biotechnology
Rice, maize, cotton, cassava, durian, rubber,tomato, and orchid
Source: Hautea, Randy A., (2002), “Crop Biotechnology Initiatives in Asia: Progress, Opportunities andChallenges”, paper presented at Biotechnology and Development: Challenges and Opportunities for Asian Region, RIS, New Delhi.
Table 30
Foreign banks operating in India with No. of branches as on 30-06-2002
No. of Br. In
India
Name of Bank Country of
incorporation
1. ABN Amro Bank Netherland 122. Abu dhabi Commercial Bank UAE 2
3. American Express Bank USA 4
4. Arab Bangladesh Bank Bangladesh 1
5. Bank International Indonesia Indonesia 1
6. Bank Muscat SAOG Sultanate of Oman 1
7. Bank of America USA 5
8. Bank of Bahrain & Kuwait Bahrain 2
9. Bank of Ceylon Sri Lanka 1
10. Bank of Nova Scotia Canada 5
11. Bank of Tokyo Mitsubishi Japan 4
12. Barclays Bank UK 2
13. BNP Paribas France 9
14. JP Morgan Chase Bank USA 1
15. China Trust Commercial Bank Taiwan 1
16. Cho Hung Bank South Korea 1
17. Citibank USA 19
18. Commerzbank Germany 1
138
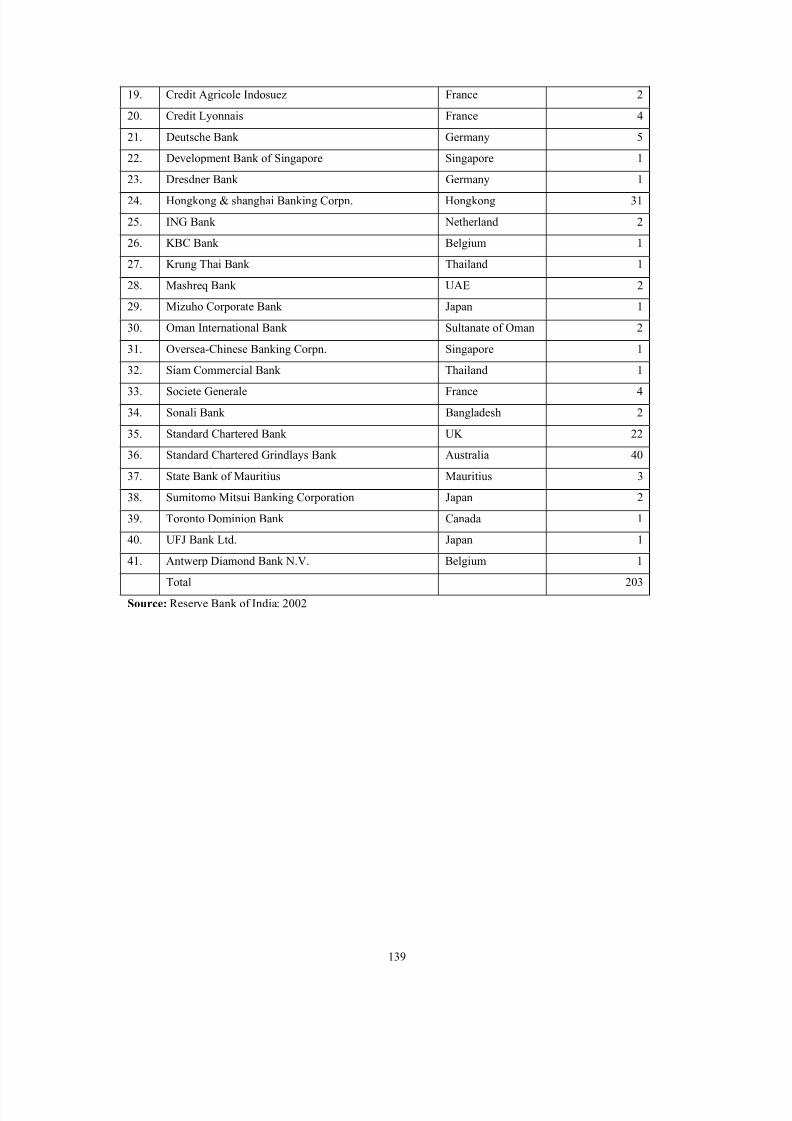
8/8/2019 Indo Thai FTA
http://slidepdf.com/reader/full/indo-thai-fta 137/141
19. Credit Agricole Indosuez France 2
20. Credit Lyonnais France 4
21. Deutsche Bank Germany 5
22. Development Bank of Singapore Singapore 1
23. Dresdner Bank Germany 1
24. Hongkong & shanghai Banking Corpn. Hongkong 31
25. ING Bank Netherland 2
26. KBC Bank Belgium 1
27. Krung Thai Bank Thailand 1
28. Mashreq Bank UAE 2
29. Mizuho Corporate Bank Japan 1
30. Oman International Bank Sultanate of Oman 2
31. Oversea-Chinese Banking Corpn. Singapore 132. Siam Commercial Bank Thailand 1
33. Societe Generale France 4
34. Sonali Bank Bangladesh 2
35. Standard Chartered Bank UK 22
36. Standard Chartered Grindlays Bank Australia 40
37. State Bank of Mauritius Mauritius 3
38. Sumitomo Mitsui Banking Corporation Japan 2
39. Toronto Dominion Bank Canada 1
40. UFJ Bank Ltd. Japan 1
41. Antwerp Diamond Bank N.V. Belgium 1
Total 203
Source: Reserve Bank of India: 2002
139
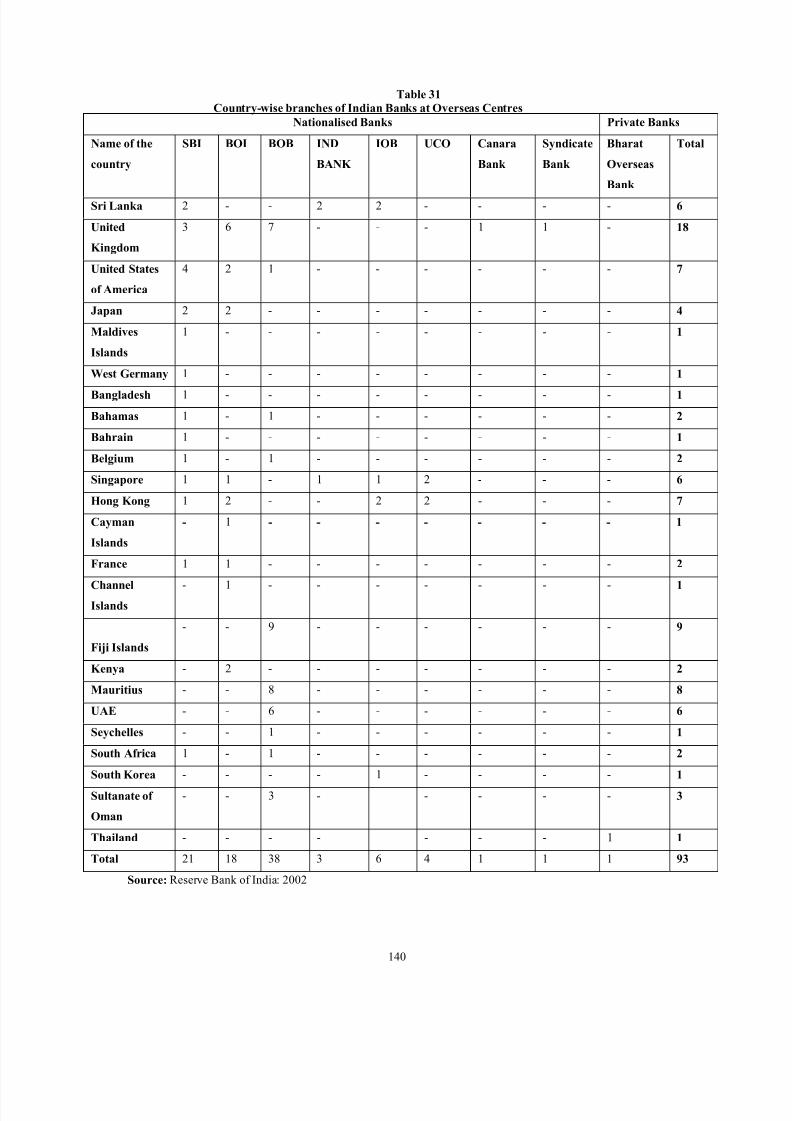
8/8/2019 Indo Thai FTA
http://slidepdf.com/reader/full/indo-thai-fta 138/141
Table 31
Country-wise branches of Indian Banks at Overseas Centres
Nationalised Banks Private Banks
Name of the
country
SBI BOI BOB IND
BANK
IOB UCO Canara
Bank
Syndicate
Bank
Bharat
Overseas
Bank
Total
Sri Lanka 2 - - 2 2 - - - - 6
United
Kingdom
3 6 7 - - - 1 1 - 18
United States
of America
4 2 1 - - - - - - 7
Japan 2 2 - - - - - - - 4
Maldives
Islands
1 - - - - - - - - 1
West Germany 1 - - - - - - - - 1
Bangladesh 1 - - - - - - - - 1
Bahamas 1 - 1 - - - - - - 2
Bahrain 1 - - - - - - - - 1
Belgium 1 - 1 - - - - - - 2
Singapore 1 1 - 1 1 2 - - - 6
Hong Kong 1 2 - - 2 2 - - - 7
Cayman
Islands
- 1 - - - - - - - 1
France 1 1 - - - - - - - 2
Channel
Islands
- 1 - - - - - - - 1
Fiji Islands
- - 9 - - - - - - 9
Kenya - 2 - - - - - - - 2
Mauritius - - 8 - - - - - - 8
UAE - - 6 - - - - - - 6
Seychelles - - 1 - - - - - - 1
South Africa 1 - 1 - - - - - - 2
South Korea - - - - 1 - - - - 1
Sultanate of
Oman
- - 3 - - - - - 3
Thailand - - - - - - - 1 1
Total 21 18 38 3 6 4 1 1 1 93
Source: Reserve Bank of India: 2002
140
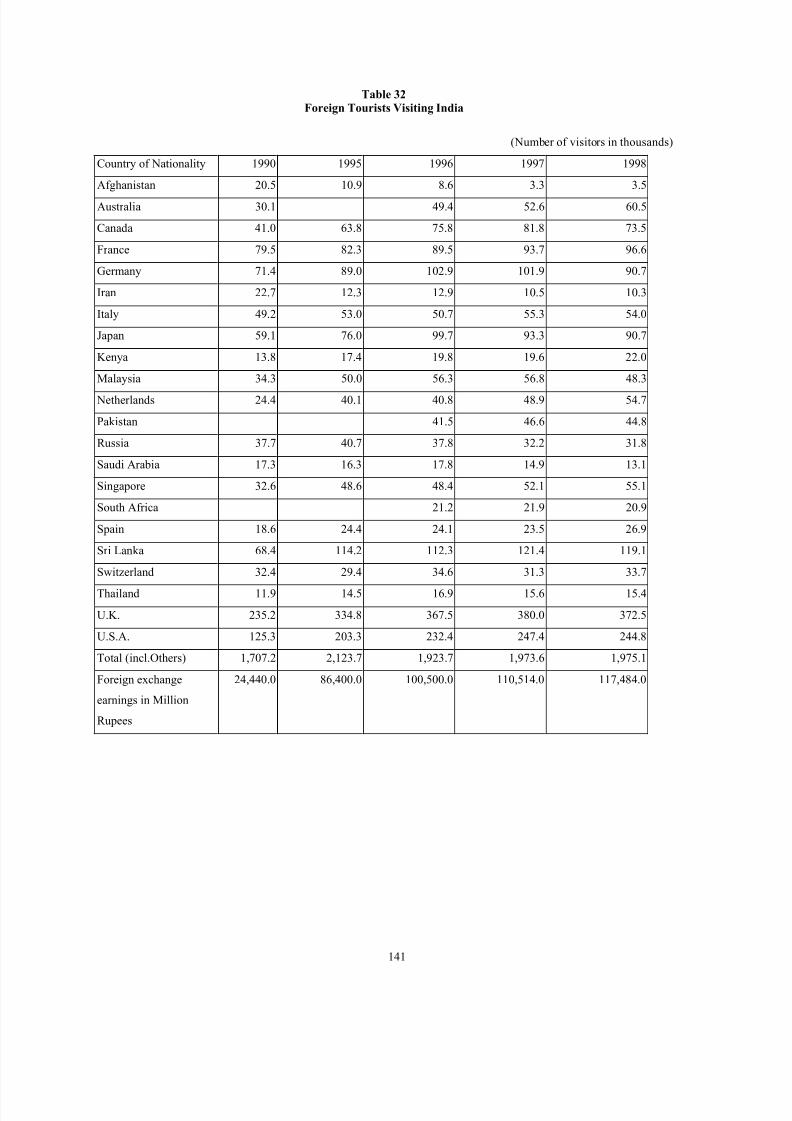
8/8/2019 Indo Thai FTA
http://slidepdf.com/reader/full/indo-thai-fta 139/141
Table 32Foreign Tourists Visiting India
(Number of visitors in thousands)
Country of Nationality 1990 1995 1996 1997 1998
Afghanistan 20.5 10.9 8.6 3.3 3.5
Australia 30.1 49.4 52.6 60.5
Canada 41.0 63.8 75.8 81.8 73.5
France 79.5 82.3 89.5 93.7 96.6
Germany 71.4 89.0 102.9 101.9 90.7
Iran 22.7 12.3 12.9 10.5 10.3
Italy 49.2 53.0 50.7 55.3 54.0
Japan 59.1 76.0 99.7 93.3 90.7
Kenya 13.8 17.4 19.8 19.6 22.0
Malaysia 34.3 50.0 56.3 56.8 48.3
Netherlands 24.4 40.1 40.8 48.9 54.7
Pakistan 41.5 46.6 44.8
Russia 37.7 40.7 37.8 32.2 31.8
Saudi Arabia 17.3 16.3 17.8 14.9 13.1
Singapore 32.6 48.6 48.4 52.1 55.1
South Africa 21.2 21.9 20.9
Spain 18.6 24.4 24.1 23.5 26.9Sri Lanka 68.4 114.2 112.3 121.4 119.1
Switzerland 32.4 29.4 34.6 31.3 33.7
Thailand 11.9 14.5 16.9 15.6 15.4
U.K. 235.2 334.8 367.5 380.0 372.5
U.S.A. 125.3 203.3 232.4 247.4 244.8
Total (incl.Others) 1,707.2 2,123.7 1,923.7 1,973.6 1,975.1
Foreign exchange
earnings in Million
Rupees
24,440.0 86,400.0 100,500.0 110,514.0 117,484.0
141
8/8/2019 Indo Thai FTA
http://slidepdf.com/reader/full/indo-thai-fta 140/141
References:
Advanced Research Group of Companies (ARGC), (2002), Thailand Industry Outlook 2000-2001.
Ingram, James C., and Robert M. Dunn, Jr., (1993), International Economics, 3John Wiley & Son, Inc. New York.
Panchamukhi, V.R. and Das, Ram Upendra, (1998), “Costs of Non-Cooperation within theSAARC Region: Some Estimates”, Paper prepared for Ministry of Commerce, Government
of India.
Ariff, Mohamed, et.al., (1996), AFTA in the Changing International Economy, Institute of Southeast Asian Studies, Singapore.
Business Line, (2002), “Rubber Sector Eyes Process Outsourcing”, October 30.
Chaturvedi, Sachin, (2002), “Status and Development of Biotechnology in India: AnAnalytical Overview”, Discussion Paper No. 28, RIS, New Delhi.
Damrongchai, Nares, (2002), “Agricultural Biotechnology in Thailand”, paper presented atthe Conference on Biotechnology and Development: Challenges and Opportunities for Asian
Region, RIS, New Delhi.
Dhar, Biswajit, (2001), “Perceptions on the Adoption of Biotechnology in India”, Discussion Paper No. 21, RIS, New Delhi.
Embassy of India, (2002), “India-Thailand Relations”, Bangkok.
Government of India, (2001), Annual Report, 1999-2000, Ministry of Commerce andIndustry.
Government of India, (2002), Economic Survey 2001-02.
Hautea, Randy A., (2002), “Crop Biotechnology Initiatives in Asia: Progress, Opportunitiesand Challenges”, paper presented at the Conference on Biotechnology and Development:
Challenges and Opportunities for Asian Region, RIS, New Delhi.
Hill, Ronald, (2002), Southeast Asia: People, Land and Economy. Allen & Unwin, Canberra,Australia.
rd Edition,
Linnemann, Hans, (ed.) (1992), South-South Trade Preferences, Indo-Dutch Studies onDevelopment Alternatives, Sage.
Mehta, Rajesh, (2002), “Potential of India’s Bilateral Free Trade Agreements: A Case Studyof India and Thailand”, Discussion Paper No. 24, RIS, New Delhi.
Ministry of Commerce, (2002), “India’s Economic Relations with Thailand”, Government of India.
142
8/8/2019 Indo Thai FTA
http://slidepdf.com/reader/full/indo-thai-fta 141/141
Panchamukhi, V.R. and Das, Ram Upendra, (1999), “Draft SAFTA Agreement and Rules of Origin under SAFTA”, Prepared for Ministry of Commerce, Government of India.
Panchamukhi, V.R. and Das, Ram Upendra, (2001), “Conceptual and Policy Issues in Rulesof Origin: Implications for SAPTA and SAFTA”, South Asia Economic Journal , Volume 2,
Number 2, July-December, Sage, New Delhi.
Panchamukhi, V.R. and Das, Ram Upendra, (2001), “Economic Reforms, RegionalIntegration and Labour Markets in the South Asian Region”, South Asia Economic Journal ,Volume 2, Number 1, January-June, Sage, New Delhi.
Philip, King, (2000), International Economics and International Economic Policy: A Reader ,Third Edition, Irwin, McGraw-Hill, Boston.
Reserve Bank of India, Annual Report , 2001-02.
Sareen, S., (2002), “International Food Safety Regulations and Processed Food Exports”,Paper presented at RIS Seminar, New Delhi.
Sen, Sunanda and Das, Ram Upendra, (1992), "Import Liberalisation as a Tool of EconomicPolicy in India since Mid-Eighties", Economic and Political Weekly, Volume XXVII,
Number 12, March 21, 1992, pp. 585-594.
Shibata (1967) as cited in James (1997) "APEC and Preferential Rules of Origin: StumblingBlocks for Liberalization of Trade?” Journal of World Trade, Vol. 31, No.3, June.
UNCTAD, Handbook of Statistics, 2001.
Vermulst, Edwin A. (1992), Rules of Origin as Commercial Policy Instruments-Revisited",