Embed Size (px)
Citation preview

SBI Magnum Balanced Fund

Introduction
WHAT IS BALANCED FUND?
CHARACTERISTICS OF EQUITY & DEBT
SBI MAGNUM BALANCED FUND
ASSET ALLOCATION
PERFORMANCE
SYNOPSIS
PORTFOLIO HOLDINGS
PERFORMANCE OF OTHER SCHEMES MANAGED BY FUND MANAGERS
FUND MANAGER BIOGRAPHIES
ABOUT SBI FM
DISCLAIMER
A balanced fund aims to balance the risk & return of the portfolio byinvesting in more than one asset class. Generally these funds haveallocation to asset classes such as equity & debt. Equity & debt assetsclasses in the fund endeavour to:
Equity
• To provide capital appreciation
• To generate returns above inflation
Debt
• To provide stability in the portfolio
• To generate consistent income from coupons
What is balanced fund?
Balanced fund aims to strike a balance between growth & stability

Characteristics of Equity & Debt
• Equity returns can be volatile. There are can be period of up-markets
and down markets
• Debt returns are less volatile and stable over long horizon
• A balanced portfolio of debt and equity derives stability from its debt
component and growth opportunities from the equity component
Data as on 31.10.2017 Source: MFI, internal calculationPast performance may or may not be sustained in the future.
0%
5%
10%
15%
20%
25%
1 Year 3 Year 5 Year 10 Year
Pe
rce
nta
ge
Period
Returns
Crisil Composite Bond Fund Index Crisil Balanced Fund Index Nifty

Characteristics of Equity & Debt
• Volatility of the debt asset class is relative low in comparison to the
equity asset class across different investment horizons
• Low volatility comes with low returns
• A balanced portfolio of debt and equity can reduce the volatility while
increasing the expected return
Data as on 31.10.2017 Source: MFI, internal calculation
0%
5%
10%
15%
20%
25%
30%
1 Year 3 Year 5 Year 10 Year
Pe
rce
nta
ge
Period
Volatility
Crisil Composite Bond Fund Index Crisil Balanced Fund Index Nifty

This product is suitable for investors who are
seeking*:
Long term investment
Investment in a mix of debt and equity through
stocks of high growth companies and relatively safe
portfolio of debt to provide both long term capital
appreciation and liquidity.
*Investors should consult their financial advisers if in
doubt about whether the product is suitable for them.
INTRODUCING
Riskometer

Date of Inception31/12/1995
BenchmarkCrisil Balanced Fund –
Aggressive Index
Fund ManagerMr. R. Srinivasan-EquityMr. Dinesh Ahuja - Debt
Investment Plans
Direct Plan&
Regular Plan
Investment Options
Growth&
Dividend(Payout, Re-investment &
Transfer Facility)
FUND FEATURES
Investment Objective
To provide investors long term capital appreciation along with the liquidity of an open-endedscheme by investing in a mix of debt and equity. The scheme will invest in a diversifiedportfolio of equities of high growth companies and balance the risk through investing the restin a relatively safe portfolio of debt.
Investment Amount
Minimum investmentsRs. 1000 & in multiples of
Re. 1
Additional investmentsRs. 1000 & in multiples of
Re. 1
SIPRs. 100 / month – 60 monthsRs. 500 / month – 12 monthsRs. 1000 / month – 6 months
Rs. 1500 / quarter – 4 quarters
SBI Magnum Balanced Fund
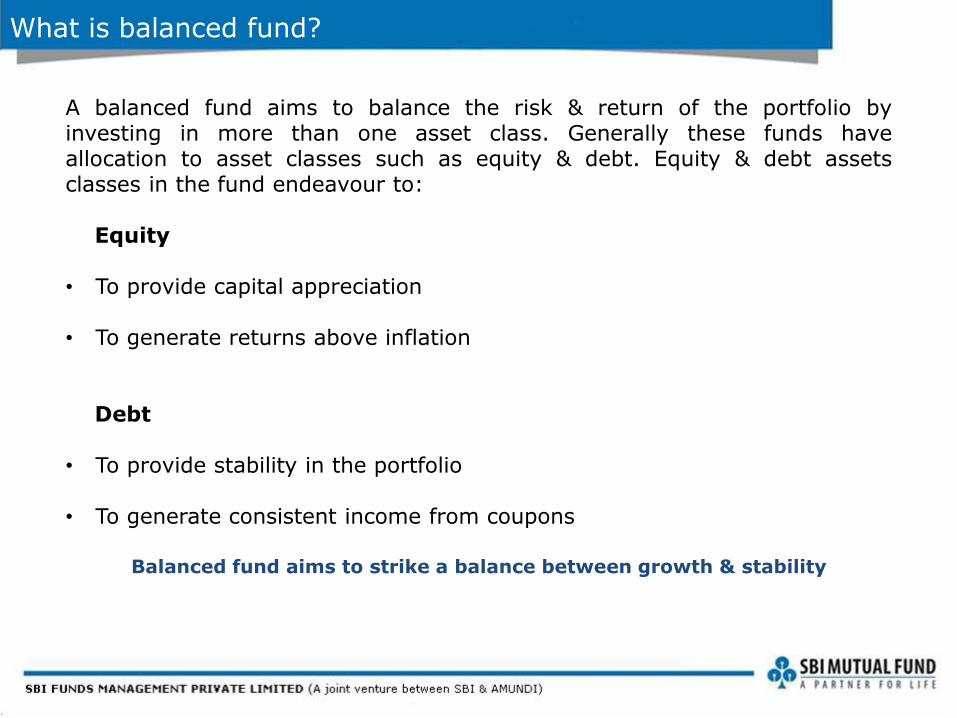
#Source: CRISIL Fund Analyser*Portfolio Turnover = lower of total sale or total purchasefor the last 12 months upon Avg. AUM of trailing twelvemonths.Risk Free rate : FBIL OVERNIGHT MIBOR RATE (6.00% ason 31/October/2017). Basis for Ratio Calculation : 3 yearmonthly data
QUANTITATIVE ANALYSIS
Standard deviation# 9.81%
Beta# 0.94
Sharpe ratio# 0.69
Portfolio Turnover* 0.16
QUANT DATA OF DEBT PORTION
Yield to Maturity 7.18%
Modified Duration 4.25
Average Maturity 6.60 Years
Fund Philosophy
• Invests in a mix of equity & debtsecurities
• Exposure in equity is atleast 50%and exposure in debt & moneymarket securities can be upto 50%
• Equity portion is invested in adiversified portfolio of large & midcaps
• Debt portion is invested ininvestment grade securities withactive duration management
SBI Magnum Balanced Fund

SBI Magnum Balanced Fund: Asset allocation
Allocation between equity and debt & money market is stable
Equity and Debt & Money Market Allocation
0
20
40
60
80
100
120
Oct
-15
No
v-1
5
Dec
-15
Jan
-16
Feb
-16
Mar
-16
Ap
r-1
6
May
-16
Jun
-16
Jul-
16
Au
g-1
6
Sep
-16
Oct
-16
No
v-1
6
Dec
-16
Jan
-17
Feb
-17
Mar
-17
Ap
r-1
7
May
-17
Jun
-17
Jul-
17
Au
g-1
7
Sep
-17
Oct
-17
Per
cen
tage
Equity Debt & Money market
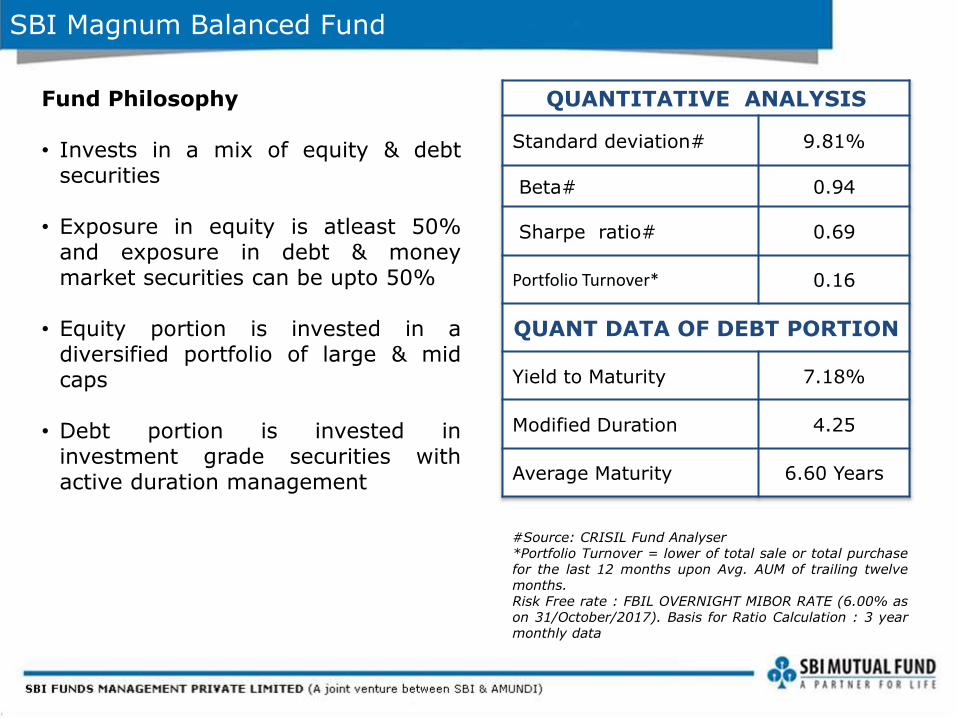
In last two years Mid & Small cap indices has outperformed large cap index
In last two years average Mid & Small cap exposure out of total equity exposure was 48.35%.
This was one of the factor for outperformance of the fund in last two years
SBI Magnum Balanced Fund: Active management within Equity asset class
Equity portion into market cap exposureMovement of major indices
Average has been calculated by taking month end exposure for last 24 months
Data as on 31.10.2017 Source: NSE
0
20
40
60
80
100
Oct
-15
De
c-1
5
Feb
-16
Ap
r-1
6
Jun
-16
Au
g-1
6
Oct
-16
De
c-1
6
Feb
-17
Ap
r-1
7
Jun
-17
Au
g-1
7
Oct
-17
Pe
rce
nta
ge
Large Cap Mid Cap Small Cap
60
80
100
120
140
160
180
Jan
-15
Feb
-15
Mar
-15
May
-15
Jun
-15
Jul-
15
Sep
-15
Oct
-15
No
v-1
5Ja
n-1
6Fe
b-1
6M
ar-1
6M
ay-1
6Ju
n-1
6Ju
l-1
6Se
p-1
6O
ct-1
6N
ov-
16
Jan
-17
Feb
-17
Mar
-17
May
-17
Jun
-17
Au
g-1
7Se
p-1
7O
ct-1
7Nifty 50 Nifty Free Float Midcap 100
Nifty Free Float Smallcap 100

SBI Magnum Balanced Fund: Active management within Debt asset class
Debt portion is managed dynamically based on interest rate view, inflation & credit risk
In last two years, yields have moved in a trending way
Dynamic allocation between of debt & money market portion into debt & cash has helped fund to outperform in last two years
Movement of major government securities yields Debt & money market portion into debt & cash exposure
Data as on 31.10.2017 Source: Bloomberg
0
20
40
60
80
100
Oct
-15
De
c-1
5
Feb
-16
Ap
r-1
6
Jun
-16
Au
g-1
6
Oct
-16
De
c-1
6
Feb
-17
Ap
r-1
7
Jun
-17
Au
g-1
7
Oct
-17
Pe
rce
nta
ge
Debt Cash
5
6
7
8
9
Jan
-15
May
-15
Sep
-15
Jan
-16
May
-16
Oct
-16
Feb
-17
Jun
-17
Oct
-17
Pe
rce
nta
ge
91 Day 1 Year 10 Year

Portfolio Holdings
Top 10 Holdings
Stock/Bond Name % of Total AUM
GOVERNMENT OF INDIA11.66
CCIL-CLEARING CORPORATION OF INDIA LTD (CBLO) 8.21
HDFC BANK LTD.6.79
BHARTI AIRTEL LTD.4.47
STATE BANK OF INDIA4.40
ICICI BANK LTD.3.42
KOTAK MAHINDRA BANK LTD.3.25
SUNDARAM CLAYTON LTD.2.47
SUNDARAM FINANCE LTD.2.47
DIVI'S LABORATORIES LTD.2.33
Data as on 31.10.2017
27.78
6.18
5.49
4.90
4.79
3.98
3.88
3.83
3.03
2.25
FINANCIAL SERVICES
SERVICES
PHARMA
TELECOM
INDUSTRIAL…
IT
ENERGY
CONSUMER GOODS
AUTOMOBILE
METALS
Top 10 Holdings (Sector)
Synopsis
A balanced allocation of equity & debt
Backed by a robust investment management process
Endeavour to bring both - Growth from equity and Stability from debt
Active management within each asset class
The equity portion is dynamically managed based on a bottom up approach.
The debt portion switches actively among government debt, corporate debt and money market instruments based on interest rate view, inflation & credit risk.

• Mr. Navneet Munot - Chief Investment Officer
Navneet joined SBIFM as Chief Investment Officer in 2008. In his role Navneet is responsible for
overseeing investments across asset classes worth over $29.10 billion. His prior stint was with Morgan
Stanley Investment Management as Executive Director and head- multi strategy boutique. Prior to that,
Navneet was the Chief Investment Officer - Fixed Income and Hybrid Funds at Birla Sun Life Asset
Management Company Ltd. Navneet had been associated with the financial services business of the Birla
group for 14 years and worked in various areas such as fixed income, equities and foreign exchange.
Navneet holds masters in accountancy and business statistics from the University of Ajmer and is a
Chartered Accountant from ICAI. He is a charter holder of the CFA Institute USA and CAIA Institute USA.
He is also an FRM charter holder of Global Association of Risk professionals (GARP).
Mr. R. Srinivasan – Fund Manager Equity portion
Mr. Srinivasan joined SBI Funds Management as a Senior Fund Manager in May 2009, now heads
equities and also directly manages a few funds. He has an experience of over 20 years in capital
markets having worked with FCH, Principal PNB, Oppenheimer & Co, Indosuez WI Carr and Motilal
Oswal, among others. Srinivasan is a post graduate in commerce and has done his MFM from the
University of Bombay.
Mr. Dinesh Ahuja - Fund Manager Debt portion
Dinesh joined SBI Funds Management Pvt. Ltd. as a fixed income portfolio manager in 2010. Prior to
joining SBI Funds Management Pvt. Ltd. Dinesh was a portfolio manager at L&T Asset Management and
Reliance Group for four years. Dinesh started his career in 1998 as a fixed income dealer on the sell
side. Thereafter he worked in leading broking outfits for eight years before moving on the buy side in
2006. Dinesh is a commerce graduate and has completed his Masters in Management Studies from
Mumbai University
Biographies

15
SBI Funds Management Private Limited
*Source: SBI Analyst Presentation as on end December2016. USD 1 = INR 67.95
# Source : Amundi website as on end December 2016
63% 37%
India’s premier and largest bank with over 200 years
experience (Estd: 1806)
Asset base of USD 465bn*
Pan-India network of ~23,737 branches and
59,108 ATM’s as at end of December 2016
Servicing over 299 million customers
Only Indian bank in Fortune 500 list; ranked among
the top 100 banks in the world
Global leader in asset management
Backed by Credit Agricole and listed in Euronext
Paris
More than 2,000 institutional clients and distributors
in 30 countries
Over 100 million retail clients via its partner
networks
€1,083 billion AuM as at end of December 2016
Ranking N° 1 in Europe, Top 10 worldwide #

SBI FM: Strengths Transforms To Experience
Established in 1987: A leading asset manager in India
Broad Investor
Base
AUM INR 1,68,816
Cr
Wide Distribution
NetworkExperienced Investment
Team
ExtensiveProductRange
INR 188,030 Crores* AAUM in mutual funds
Asset management across mutual funds,segregated managed accounts, domesticadvisory & offshore advisory business
Multiple asset classes ranging from equitiesand debt, money market to ETFs andstructured funds
Investment team of 35 professionals withstrong track record
Broad customer base with ~ 5.10 million foliosrelated to individual, corporate and institutionalinvestors
* Quarterly average September 2017

Disclaimer
Mutual Fund investments are subject to market risks, read all scheme related documents carefully.
This presentation is for information purposes only and is not an offer to sell or a solicitation to buy any mutual fundunits/securities. These views alone are not sufficient and should not be used for the development or implementation ofan investment strategy. It should not be construed as investment advice to any party. All opinions and estimatesincluded here constitute our view as of this date and are subject to change without notice. Neither SBI FundsManagement Private Limited, nor any person connected with it, accepts any liability arising from the use of thisinformation. The recipient of this material should rely on their investigations and take their own professional advice