Embed Size (px)
Citation preview


*Investors should consult their financial advisers if in doubt about whether the product is suitable for them.
Product Labeling
This product is suitable for investors who are seeking*:
Riskometer
Long term capital appreciation.
Investments in high growth companies
along with the liquidity of an open-ended
scheme through investments primarily in
equities.

Introduction
WHY LARGE CAP? INVESTMENT MANAGEMENT PROCESS SBI MAGNUM EQUITY FUND CURRENT PORTFOLIO HOLDING FUND STATISTICS SYNOPSIS PERFORMANCE FUND MANAGER BIOGRAPHIES
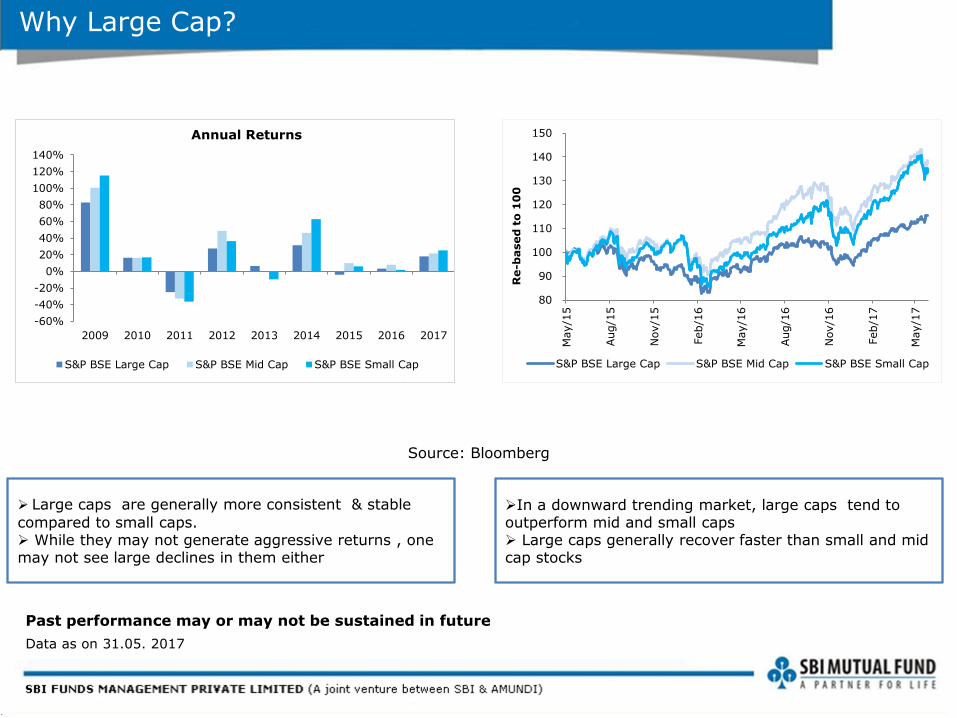
Why Large Cap?
Large caps are generally more consistent & stable
compared to small caps. While they may not generate aggressive returns , one may not see large declines in them either
Source: Bloomberg
Past performance may or may not be sustained in future
Data as on 31.05. 2017
In a downward trending market, large caps tend to outperform mid and small caps Large caps generally recover faster than small and mid cap stocks
-60%
-40%
-20%
0%
20%
40%
60%
80%
100%
120%
140%
2009 2010 2011 2012 2013 2014 2015 2016 2017
Annual Returns
S&P BSE Large Cap S&P BSE Mid Cap S&P BSE Small Cap
80
90
100
110
120
130
140
150
May/1
5
Aug/1
5
Nov/1
5
Feb/1
6
May/1
6
Aug/1
6
Nov/1
6
Feb/1
7
May/1
7
Re-b
ased
to
10
0
S&P BSE Large Cap S&P BSE Mid Cap S&P BSE Small Cap

Investment Management Process
Stock Universe
Quant Screening
Investment Universe
Fundamental analysis
Fund Mandate Risk Controls Portfolio
A robust investment management process for portfolio construction to provide diversification as well as maintain a balance of risk: return
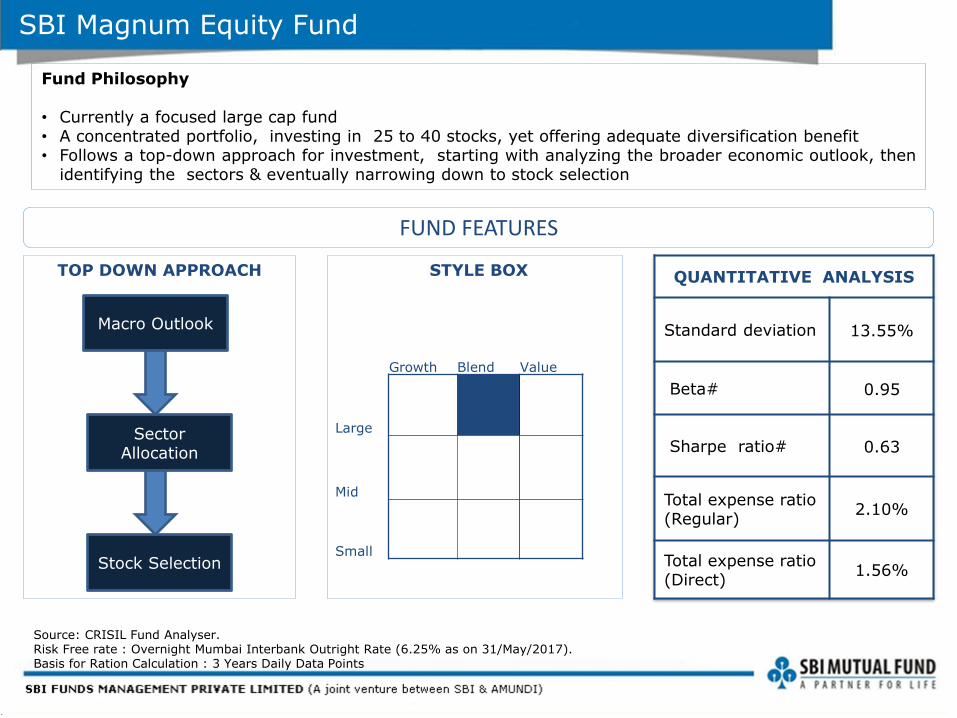
SBI Magnum Equity Fund
Macro Outlook
Sector Allocation
Stock Selection
TOP DOWN APPROACH STYLE BOX
FUND FEATURES
Growth Blend Value
Large
Mid
Small
Source: CRISIL Fund Analyser. Risk Free rate : Overnight Mumbai Interbank Outright Rate (6.25% as on 31/May/2017). Basis for Ration Calculation : 3 Years Daily Data Points
QUANTITATIVE ANALYSIS
Standard deviation 13.55%
Beta# 0.95
Sharpe ratio# 0.63
Total expense ratio (Regular)
2.10%
Total expense ratio (Direct)
1.56%
Fund Philosophy • Currently a focused large cap fund • A concentrated portfolio, investing in 25 to 40 stocks, yet offering adequate diversification benefit • Follows a top-down approach for investment, starting with analyzing the broader economic outlook, then
identifying the sectors & eventually narrowing down to stock selection

SBI Magnum Equity Fund: Portfolio Holdings
Data as on 31.05.2017
Top Sectors (%) Top 10 Holdings
Stock Name % of Total AUM
HDFC BANK LTD. 9.83
ICICI BANK LTD. 7.97
ITC LTD. 7.22
STATE BANK OF INDIA 6.33
INFOSYS LTD. 5.25
HCL TECHNOLOGIES LTD. 5.19
RELIANCE INDUSTRIES LTD. 4.58
KOTAK MAHINDRA BANK LTD. 4.24
BHARTI AIRTEL LTD. 3.36
LARSEN & TOUBRO LTD. 3.35 36.54
14.39
11.15
9.17
6.06
5.20
4.32
3.36
3.35
1.95
FINANCIAL SERVICES
IT
ENERGY
CONSUMER GOODS
PHARMA
SERVICES
AUTOMOBILE
TELECOM
CONSTRUCTION
MEDIA & ENTERTAINMENT

Record Date Dividend
(in Rs./ Unit)
NAV (on the day of declaration
of dividend)
29-Apr-16 (Regular Plan) 4.50 27.48
29-Apr-16 (Direct Plan) 5.00 32.32
24-Apr-15 (Regular Plan) 6.00 31.75
24-Apr-15 (Direct Plan) 7.00 36.76
02-May-14 (Regular Plan) 4.00 27.88
14-Dec-12 4.00 32.22
28-Jan-11 3.50 28.44
31-Dec-09 5.00 29.27
07-Nov-07 5.00 36.61
Fund Statistics
FUND MANAGER Mr. R. SRINIVASAN
INCEPTION DATE JAN 01, 1991
BENCHMARK NIFTY 50 Index
Past performance may not be sustained in the future. Pursuant to payment of dividend, the NAV of Dividend option of scheme/plan would fall to the extent of payout and statutory levy, if applicable.
Face Value Rs. 10/-
Dividend History

Synopsis
Large caps are relatively consistent & stable compared to mid & small cap
SBI Magnum Equity Fund backed by robust investment management process
SBI Magnum Equity Fund: focused large cap fund investing into 25-40 stocks
Follows a top-down approach of investing

Past performance may or may not be sustained in future. Returns (in %) other than since inception are absolute, calculated for dividend option and in INR are point-to-point (PTP) returns calculated on a standard investment of 10,000/-. It is assumed that dividends declared under the scheme have been reinvested at the then prevailing NAV. Growth option introduced on 27/11/2006. Additional benchmark as prescribed by SEBI for equity schemes is used for comparison purposes. Performance of dividend plan for investor would be net of dividend distribution tax as applicable. Performance calculated for Regular Plan.
Performance
31/12/2015 to 30/12/2016
31/12/2014 to 31/12/2015
31/12/2013 to 31/12/2014
Since Inception
Absolute Returns (%) CAGR
Returns (%) PTP Returns
(INR)
SBI Magnum Equity Fund 4.51 2.43 42.65 14.42 332,896
Nifty 50 Index (Scheme Benchmark) 3.01 -4.06 31.39 13.29 256,648
S&P BSE Sensex (Additional Benchmark) 1.95 -5.03 29.89 13.45 266,462
-10
0
10
20
30
40
50
31/12/2015 to30/12/2016
31/12/2014 to31/12/2015
31/12/2013 to31/12/2014
Since Inception
SBI Magnum Equity Fund - Reg Plan - Dividend
Scheme Benchmark: - Nifty 50
Additional Benchmark: - S&P BSE Sensex

Performance of Schemes Managed by R. Srinivasan
31/12/15 to 30/12/16
31/12/14 to 31/12/15
31/12/13 to 31/12/14
Since Inception
Absolute Returns (%) CAGR Returns (%) PTP Returns (INR)
SBI Contra Fund 2.40 -0.10 47.66 19.34 220,670 S&P BSE 100 Index (Scheme Benchmark)
3.57 -3.25 32.28 12.45 77,983
S&P BSE Sensex (Additional Benchmark)
1.95 -5.03 29.89 10.97 61,830
Past performance may or may not be sustained in future. Returns (in %) other than since inception are absolute, calculated for dividend option and in INR are point-to-point (PTP) returns calculated on a standard investment of 10,000/-. It is assumed that dividends declared under the scheme have been reinvested at the then prevailing NAV. Growth option introduced on 06/05/2005. Additional benchmark as prescribed by SEBI for equity schemes is used for comparison purposes. Performance of dividend plan for investor would be net of dividend distribution tax as applicable. Performance calculated for Regular Plan
31/12/15 to 30/12/16
31/12/14 to 31/12/15
31/12/13 to
31/12/14 Since Inception
Absolute Returns (%) CAGR
Returns (%)
PTP Returns
(INR)
SBI Emerging Businesses Fund
2.22 4.33 58.02 20.10 94,987
S&P BSE 500 Index (Scheme Benchmark)
3.78 -0.82 36.96 13.83 49,160
S&P BSE Sensex (Additional Benchmark)
1.95 -5.03 29.89 13.59 47,879
Past performance may or may not be sustained in future. Returns (in %) other than since inception are absolute, calculated for growth option and in INR are point-to-point (PTP) returns calculated on a standard investment of 10,000/-. Additional benchmark as prescribed by SEBI for equity schemes is used for comparison purposes. Performance calculated for Regular Plan.
31/12/15 to 30/12/16
31/12/14 to 31/12/15
31/12/13 to 31/12/14
Since Inception
Absolute Returns (%) CAGR
Returns (%)
PTP Returns (INR)
SBI Magnum Global Fund
-2.00 7.92 66.56 14.54 205,545
S&P BSE Midcap Index (Scheme Benchmark)
4.69 8.04 54.37 N.A. N.A.
S&P BSE Sensex (Additional Benchmark)
1.95 -5.03 29.89 8.56 62,197
Past performance may or may not be sustained in future. Returns (in %) other than since inception are absolute, calculated for dividend option and in INR are point-to-point (PTP) returns calculated on a standard investment of 10,000/-. It is assumed that dividends declared under the scheme have been reinvested at the then prevailing NAV. Growth option introduced on 27/06/2005. Additional benchmark as prescribed by SEBI for long-term equity schemes is used for comparison purposes. Performance calculated for Regular Plan. Performance of dividend plan for investor would be net of dividend distribution tax as applicable.

Performance of Schemes Managed by R. Srinivasan
Performance of Scheme Managed by R. Srinivasan & Dinesh Ahuja
31/12/15 to 30/12/16
31/12/14 to 31/12/15
31/12/13 to 31/12/14
Since Inception
Absolute Returns (%) CAGR
Returns (%) PTP Returns (INR)
SBI Small and Midcap Fund – Growth
1.29 20.56 110.66 18.73 35,098
S&P BSE Small Cap Index (Scheme Benchmark)
1.77 6.76 69.24 7.33 16,769
S&P BSE Sensex (Additional Benchmark)
1.95 -5.03 29.89 7.05 16,453
Past performance may or may not be sustained in future. Returns (in %) other than since inception are absolute, calculated for growth option and in INR are point-to-point (PTP) returns calculated on a standard investment of 10,000/-. Additional benchmark as prescribed by SEBI for equity schemes is used for comparison purposes. Performance calculated for Regular Plan
31/12/15 to 30/12/16
31/12/14 to 31/12/15
31/12/13 to 31/12/14
Since Inception
Absolute Returns (%) CAGR
Returns (%) PTP Returns (INR)
SBI Magnum Balanced Fund – Growth
3.70 7.36 43.24 15.92 230,437
Crisil Balanced Fund Index (Scheme Benchmark)
6.66 0.48 25.34 N.A. N.A.
S&P BSE Sensex (Additional Benchmark)
1.95 -5.03 29.89 9.90 74,315
Past performance may or may not be sustained in future. Returns (in %) other than since inception are absolute, calculated for dividend option and in INR are point-to-point (PTP) returns calculated on a standard investment of 10,000/-. It is assumed that dividends declared under the scheme have been reinvested at the then prevailing NAV. Growth option introduced on 25/05/2005. Additional benchmark as prescribed by SEBI for equity schemes is used for comparison purposes. Performance calculated for Regular Plan Performance of dividend plan for investor would be net of dividend distribution tax as applicable. Performance calculated for Regular Plan

13
NAV of the Schemes managed by the Fund Manager
Performance of Schemes Managed by R. Srinivasan
Scheme Name 31/03/2017 31/03/2016 31/03/2015 31/03/2014
SBI Magnum Equity Fund - Growth 86.0038 72.7772 75.4111 53.9569
SBI Emerging Businesses Fund - Growth
107.2962 90.0162 91.3274 59.3896
SBI Magnum Global Fund 94 - Growth 145.9724 126.6779 135.0365 81.3419
SBI Contra Fund - Growth 99.9558 83.5901 89.9794 61.9512
SBI Small & Midcap Fund - Growth 40.8611 31.268 28.777 15.1537
SBI Magnum Balanced Fund - Growth 109.1553 94.7017 94.9637 66.1133

• Mr. Navneet Munot
Navneet joined SBIFM as Chief Investment Officer in 2008. In his role Navneet is responsible for
overseeing investments across asset classes worth over $29.10 billion. His prior stint was with
Morgan Stanley Investment Management as Executive Director and head- multi strategy boutique.
Prior to that, Navneet was the Chief Investment Officer - Fixed Income and Hybrid Funds at Birla
Sun Life Asset Management Company Ltd. Navneet had been associated with the financial services
business of the Birla group for 14 years and worked in various areas such as fixed income, equities
and foreign exchange.
Navneet holds masters in accountancy and business statistics from the University of Ajmer and is a
Chartered Accountant from ICAI. He is a charter holder of the CFA Institute USA and CAIA Institute
USA. He is also an FRM charter holder of Global Association of Risk professionals (GARP).
• Mr. R. Srinivasan
Mr. Srinivasan joined SBI Funds Management as a Senior Fund Manager in May 2009, now heads
equities and also directly manages a few funds. He has an experience of nearly 20 years in capital
markets having worked with FCH, Principal PNB, Oppenheimer & Co, Indosuez WI Carr and Motilal
Oswal, among others. Srinivasan is a post graduate in commerce and has done his MFM from the
University of Bombay.
Biographies
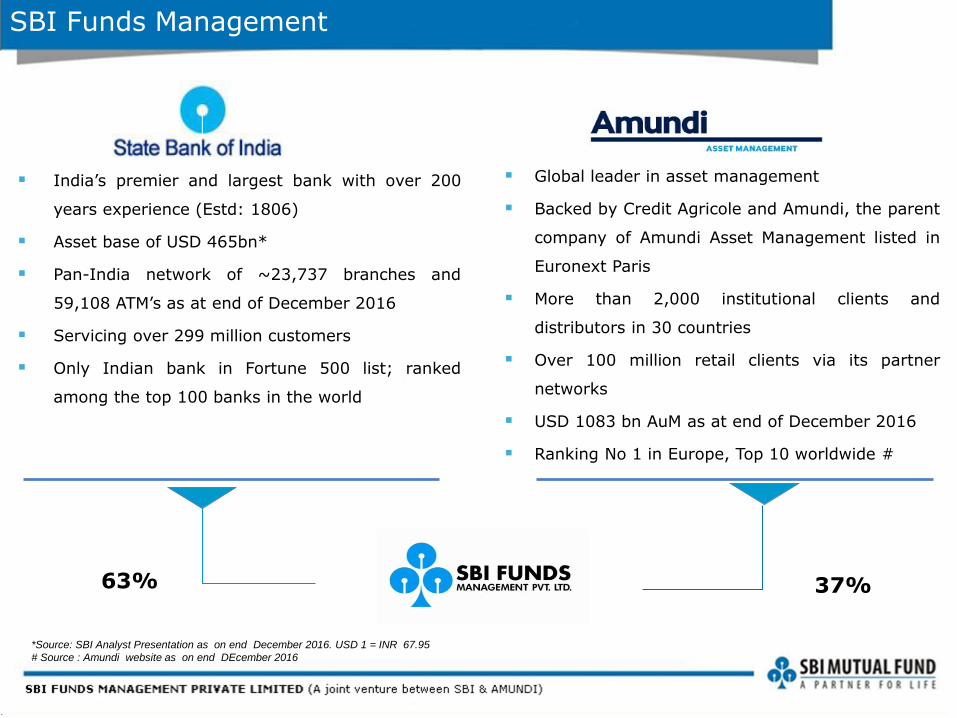
SBI Funds Management
63% 37%
India’s premier and largest bank with over 200
years experience (Estd: 1806)
Asset base of USD 465bn*
Pan-India network of ~23,737 branches and
59,108 ATM’s as at end of December 2016
Servicing over 299 million customers
Only Indian bank in Fortune 500 list; ranked
among the top 100 banks in the world
Global leader in asset management
Backed by Credit Agricole and Amundi, the parent
company of Amundi Asset Management listed in
Euronext Paris
More than 2,000 institutional clients and
distributors in 30 countries
Over 100 million retail clients via its partner
networks
USD 1083 bn AuM as at end of December 2016
Ranking No 1 in Europe, Top 10 worldwide #
*Source: SBI Analyst Presentation as on end December 2016. USD 1 = INR 67.95
# Source : Amundi website as on end DEcember 2016

SBI Funds Management: India’s First Bank Sponsored Funds
A leading asset manager in India
Broad
Investor
Base
AUM
USD 14.09 bn
Wide
Distribution
Network
Experienced
Investment
Team
Extensive
Product
Range
Broad
Investor
Base
AAUM
Rs. 1,57,025 crs
Wide
Distribution
Network
Experienced
Investment
Team
Extensive
Product
Range
INR 1,57,025 Crores* AAUM in mutual funds
Asset management across mutual funds, segregated managed accounts, domestic advisory & offshore advisory business
Multiple asset classes ranging from equities and debt, money market to ETFs and structured funds
Investment team of 35 professionals with strong track record
Broad customer base with ~ 5.10 million folios related to individual, corporate and institutional investors
* Quarterly average March 2017

SBIFM: A Complete Framework
Expertise
Highly experienced team
Strong industry relations
Complete in-house research
Processes
Structured & Disciplined
Rigorous investment templates
Agility with Flexibility
Risk Management
Six member team
Coherent monitoring
Group Advantage
25 years of experience
Both domestic and international strengths
Investors trust

Disclaimer
Mutual Fund investments are subject to market risks, read all scheme related documents carefully. This presentation is for information purposes only and is not an offer to sell or a solicitation to buy any mutual fund units/securities. The views expressed herein are based on the basis of internal data, publicly available information & other sources believed to be reliable. Any calculations made are approximations meant as guidelines only, which need to be confirmed before relying on them. These views alone are not sufficient and should not be used for the development or implementation of an investment strategy. It should not be construed as investment advice to any party. All opinions and estimates included here constitute our view as of this date and are subject to change without notice. Neither SBI Funds Management Private Limited, SBI Mutual Fund nor any person connected with it, accepts any liability arising from the use of this information. The recipient of this material should rely on their investigations and take their own professional advice