Embed Size (px)
Citation preview

Investment update–May, 2014

From the Managing Director’s Desk
After delivering a superior performance in March, the Indian equity markets started off the
new FY 2014-15 on a positive note but could not hold on to their gains; as a result,
domestic equity indices ended flat in April. The CNX Nifty fell 0.12% while the BSE Sensex
rose 0.14%. The S&P BSE Sectoral indices ended mixed in April.
IIP (India's Index of Industrial Production) contracted 1.9% in February, the lowest in nine
months, mainly due to contraction of the capital goods sector; it had logged an upwardly
revised 0.8% in January and 0.6% a year ago. Core sector growth slowed to 2.5% in March
from 7% in the same month a year ago, and 4.5% last month, as output of crude oil, natural
gas and fertilizer declined. India's trade deficit stood at $10.51 bn in March, the highest
since October 2013, and up from $8.13 bn in February. Data from the RBI showed that
total foreign direct investment inflows into India in February rose 1% on year to $3.022 bn
from $2.991 bn a year ago.
The S&P BSE Healthcare index was the top performer, rising 6.68% followed by S&P BSE
Capital Goods and S&P BSE BANKEX indices posted moderate gains of 0.89% and 0.92%,
respectively, due to long rollovers to the May futures and options contracts in the sectors
shares. The S&P BSE Realty was among the worst hit, down 4.88%, following profit taking in
realty shares.
The International Monetary Fund (IMF) said that India's growth could recover to 5.4% in the
current fiscal year and to 6.4% in the next year to March 2016 due to stronger global
growth, an improvement in export competitiveness and implementation of the recently-
approved investment projects. At home, the National Council of Applied Economic
Research (NCAER) projected a 5.1-5.5% economic growth in 2014-15 for India.
After easing for three consecutive months, domestic inflation increased slightly in March,
led up by an increase in food prices. Retail inflation measured by the consumer price index
(CPI) rose to 8.31% in March from 8.03% in February, while wholesale price index (WPI)
inflation rose to a three-month high of 5.70%.
The markets in May are expected to be guided by FII investments, domestic macro-
economic data and the outcome of the general elections. Short-term volatility is highly
likely on the poll results.
The current equity market scenario is largely driven by hopes of a favorable outcome to
the ongoing elections and FII inflows. Both these sentiments are likely to drive markets
inflows until the election results are announced in May. It is important to note that the
market trend might reverse if the election outcome is not in sync with Investor sentiments.
Besides, probability of the US Fed increasing the interest rates and the state of the Chinese
economy will also influence future market trends. Hence, investors are advised to weigh
all these factors plus their own personal profile (risk profile and returns expectations)
before investing. Ideally, use the systematic investment plan (SIP) to invest in equity
mutual funds.
Dinesh Kumar KharaMD & CEO
With iSIP, you can start a SIP from the convenience of your home. Just log onto our website
and start an SIP online. It's economical and doesn't involve any paperwork. Our Flexi-STP
plan allows you to take advantage of movements in the market by investing more when the
markets are low and less when markets are on a higher side, so you get more benefits. We
will continue to invest in a mix of technology that will help you invest and manage your
investments effortlessly.
We would love to hear from you on our dedicated customer care numbers 1-800-425-5425
(MTNL/BSNL users only) and 080-26599420 from Monday to Saturday (8am to 10pm) and
please do feel free to write to us on with any aspect of our
business that you think we can improve on. Alternatively you can also visit your nearest
Investor Service Centre / Investor Service Desk for any assistance or give us a missed call
on 1800 270 0060 and we would be happy to get in touch with you.
Best Regards,
Managing Director & Chief Executive Officer
Dinesh Kumar Khara
Market Overview
Navneet MunotED & CIO
While foreign investors have pumped in $ 5 billion into equities since the beginning of calendar
year, domestic institutions have been net sellers. Sensex returns of around 5% in this calendar
year can largely be attributed to improvement in macro situation and attractiveness of India
relative to other emerging markets. Investors have concerns about China's growth story,
geopolitical issue of Russia-Ukraine and political and macro challenges in several other emerging
markets. Bond yields across the world have been declining with yields in peripheral Europe, high-
yield category etc falling to record lows. Strong investor demand, persistent low inflation and
dovish signals from large central banks like US Federal reserve, European central bank and Bank
of Japan have led to bullish trend in most of the segments of global fixed income markets. Unless
the political mandate turns out to be extremely fractured, we believe that Indian markets have the
potential to get lot more flows from global investors given the liquidity situation and relative
valuation.
The Sensex ended almost flat in the month of April and the trend of mid and small cap indices
outperforming the large cap index continued. Over the last 5 years, foreign investors have
invested $ 90 billion and bulk of it has chased selective large cap stocks creating a big valuation
gap between the 'defensives' and 'cyclicals' and also between large and mid and small cap stocks.
This valuation gap has been getting corrected over the last 6 months with outperformance of
cyclicals and also of mid and small caps. Given our view of bottoming of macro and corporate
fundamentals and in the backdrop of investor's positioning, there is still tremendous potential of
alpha generation by broad basing the investible universe.
The earnings season is on and thus far it has broadly been in line with expectations. The benefits
of weaker currency are accruing to sectors like IT, healthcare, textiles and engineering exporters.
The street now estimates earnings growth of 9.4% and 15.2% for FY14 and FY15 respectively.
We maintain our view that macro fundamentals have bottomed with visible improvements in the
external sector and early signs of recovery in the domestic growth. The collective efforts of the
government and RBI in stabilizing the external sector have delivered good results. With decline in
current account deficit and improvement in capital flows, Forex reserves have gone up from $
275 to 310 billion and the currency has stabilized quite well. The IIP data is yet to show an upturn,
however, deeper dive reveals that inventory levels are declining while construction companies
are seeing build up in the order books after a very long period. There are near term challenges
such as fiscal constraints, possibility of a poor monsoon impacting the growth and inflation
outlook and stress in the bank's balance sheet. However, a new government has the opportunity
to unleash the growth potential by leveraging the structural strengths notwithstanding these
near term challenges. The self-inflicted pain of low growth – high inflation syndrome can be
corrected through better governance and right policy mix. Building physical and social
infrastructure would surely be a major focus area for the new government. The next leg of growth
has to be driven by reviving the investment cycle and boosting domestic savings that are
channelized into productive financial assets. We believe incremental flows and concurrent
firmness in currency would enable a positive reflexivity to the economic cycle for India. The
current rally has a potential to gain sustained momentum when the local investors start
increasing equity allocations.
Everyone is awaiting the election verdict on May 16th. Market is expecting a growth-friendly
alliance to come to power. Going by the history, markets are likely to witness heightened
volatility. Amidst the high decibel levels, we retain our focus on bottom up stock picking. We
continue to stick to our belief to back businesses that have positioned themselves to benefit from
economic revival through a well configured franchise, toned balance sheet and financial

structure through the downturn, quality assets and competitive advantage to expand the exports
footprint.
RBI in its April 1 monetary policy meeting maintained the status quo on policy rates with the
broad direction of policy setting influenced by the Dr Urjit Patel committee recommendations.
The policy stance underscores the disinflation "glide path" of achieving 8% CPI inflation by
January 2015 and 6% by January 2016. Based on the current evolution of CPI inflation trends, RBI
is likely to maintain a status quo on policy rates. In this context, a more directional stance on
rates would primarily be dependent on the new government's fiscal stance, with external sector
developments also influencing the outlook on inflation. A more proactive liquidity management
as seen in the last few months with term repo being the primary instrument would ensure that the
overnight rates remain in line with the prevailing policy stance and also the short end of the curve
remains well anchored in the absence of any additional liquidity premium.
Unlike past years, short-term rates didn't ease significantly in April since this year rates were well
behaved even heading into end of March with RBI comforting markets with regular term repo
auctions.
The resumption of the government borrowing schedule was expected to result in yields
remaining under pressure. Good investor appetite at higher absolute yields following the initial
spike in yields, light market positioning and also replacement demand have however led to bond
yields retracing from the highs. Long term government bond yields have also been supported by
the lack of issuances in the corporate bond space following the notification of the Companies Act
2013. Even as yields corrected by about 30bps intra- month from the highs, government bond
yields remained almost flat over the month.
Even as market positioning builds up leading up to the election verdict, a directional move in
bond yields would be dependent on a more consistent and durable easing in CPI inflation and
also the fiscal stance. Near term uncertainties surround the outlook on both. The Union Budget to
be presented post the new government assuming office would provide better clarity regarding
the prospects of fiscal deficit trends and the likely market borrowings for funding the same. The
recent up move in global soft commodities and also the uncertainty surrounding the South West
Monsoon could lead to markets repricing near term CPI inflation expectations. We expect that
post the election verdict, the near term challenge would continue to be the evolving demand
supply balance as the bulk of the bond maturities are frontloaded in the first 2 months of this
fiscal.
We had been maintaining a cautious outlook on rates in view of the RBI policy stance and also the
near-term challenges on the absorption of the government borrowing. A strong commitment on
fiscal consolidation and concrete measures to ease supply side constraints by the new
government could change the outlook as global backdrop is favorable for the bond market. We
would continue to watch the events on the domestic political and global fronts which can have
any bearing on the interest rates.
Navneet Munot
Executive Director & CIO – SBI Funds Management Private Limited
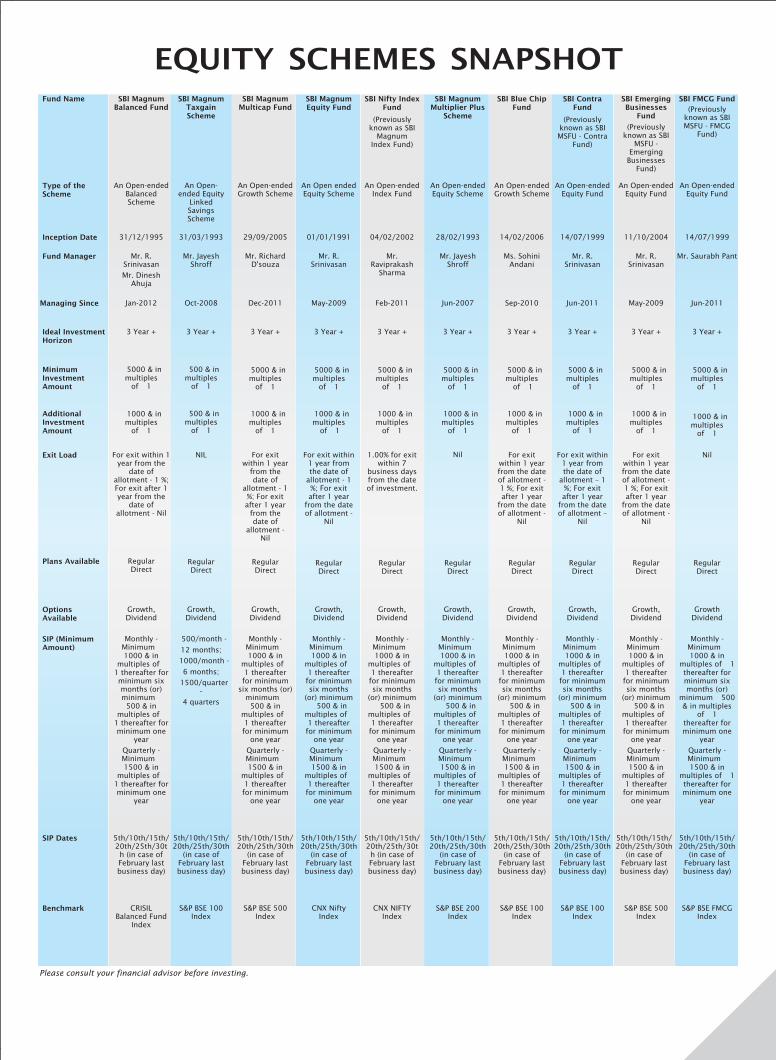
EQUITY SCHEMES SNAPSHOT
Please consult your financial advisor before investing.
Fund Name
Type of theScheme
Inception Date
Fund Manager
SBI MagnumBalanced Fund
An Open-endedBalancedScheme
31/12/1995
Mr. R.Srinivasan
Mr. DineshAhuja
SBI MagnumTaxgainScheme
SBI MagnumMulticap Fund
An Open-endedGrowth Scheme
29/09/2005
Mr. RichardD'souza
SBI MagnumEquity Fund
An Open endedEquity Scheme
01/01/1991
Mr. R.Srinivasan
SBI Nifty IndexFund
An Open-endedIndex Fund
04/02/2002
Mr.Raviprakash
Sharma
SBI MagnumMultiplier Plus
Scheme
An Open-endedEquity Scheme
28/02/1993
Mr. JayeshShroff
SBI Blue ChipFund
An Open-endedGrowth Scheme
14/02/2006
Ms. SohiniAndani
SBI EmergingBusinesses
Fund
An Open-endedEquity Fund
11/10/2004
Mr. R.Srinivasan
SBI ContraFund
An Open-endedEquity Fund
14/07/1999
Mr. R.Srinivasan
Managing Since
Ideal InvestmentHorizon
MinimumInvestmentAmount
AdditionalInvestmentAmount
Jan-2012
3 Year +
` 5000 & inmultiples
of ` 1
``
500 & inmultiples
of 1
``
5000 & inmultiples
of 1
``
5000 & inmultiples
of 1
``
5000 & inmultiples
of 1
``
5000 & inmultiples
of 1
``
5000 & inmultiples
of 1
``
1000 & inmultiples
of 1
``
500 & inmultiples
of 1
``
1000 & inmultiples
of 1
``
1000 & inmultiples
of 1
``
1000 & inmultiples
of 1
``
5000 & inmultiples
of 1
``
1000 & inmultiples
of 1
``
5000 & inmultiples
of 1
``
1000 & inmultiples
of 1
``
1000 & inmultiples
of 1
``
1000 & inmultiples
of 1
An Open-ended Equity
LinkedSavingsScheme
31/03/1993
Mr. JayeshShroff
Oct-2008
3 Year +
Dec-2011
3 Year +
May-2009
3 Year +
Feb-2011
3 Year +
Jun-2007
3 Year +
Sep-2010
3 Year +
May-2009
3 Year +
Jun-2011
3 Year +
Exit Load For exit within 1year from the
date ofallotment - 1 %;For exit after 1year from the
date ofallotment - Nil
NIL For exitwithin 1 year
from thedate of
allotment - 1%; For exitafter 1 year
from thedate of
allotment -Nil
For exit within1 year fromthe date of
allotment - 1%; For exitafter 1 year
from the dateof allotment -
Nil
1.00% for exitwithin 7
business daysfrom the dateof investment.
Nil For exitwithin 1 yearfrom the dateof allotment -1 %; For exitafter 1 year
from the dateof allotment -
Nil
For exitwithin 1 yearfrom the dateof allotment -1 %; For exitafter 1 year
from the dateof allotment -
Nil
For exit within1 year fromthe date of
allotment – 1%; For exitafter 1 year
from the dateof allotment –
Nil
OptionsAvailable
Growth,Dividend
Growth,Dividend
Growth,Dividend
Growth,Dividend
Growth,Dividend
Growth,Dividend
Growth,Dividend
Growth,Dividend
Growth,Dividend
SIP (MinimumAmount)
Monthly -Minimum1000 & in
multiples of1 thereafter forminimum sixmonths (or)minimum
500 & inmultiples of
1 thereafter forminimum one
year
Quarterly -Minimum1500 & in
multiples of1 thereafter forminimum one
year
``
``
``
`
`
`
500/month -
12 months;
1000/month -
6 months;
1500/quarter-
4 quarters
Monthly -Minimum1000 & in
multiples of1 thereafterfor minimum
six months (or)minimum
500 & inmultiples of1 thereafterfor minimum
one year
Quarterly -Minimum1500 & in
multiples of1 thereafterfor minimum
one year
``
``
``
Monthly -Minimum1000 & in
multiples of1 thereafterfor minimumsix months
(or) minimum500 & in
multiples of1 thereafterfor minimum
one year
Quarterly -Minimum1500 & in
multiples of1 thereafterfor minimum
one year
``
``
``
Monthly -Minimum1000 & in
multiples of1 thereafterfor minimumsix months
(or) minimum500 & in
multiples of1 thereafterfor minimum
one year
Quarterly -Minimum1500 & in
multiples of1 thereafterfor minimum
one year
``
``
``
Monthly -Minimum1000 & in
multiples of1 thereafterfor minimumsix months
(or) minimum500 & in
multiples of1 thereafterfor minimum
one year
Quarterly -Minimum1500 & in
multiples of1 thereafterfor minimum
one year
``
``
``
Monthly -Minimum1000 & in
multiples of1 thereafterfor minimumsix months
(or) minimum500 & in
multiples of1 thereafterfor minimum
one year
Quarterly -Minimum1500 & in
multiples of1 thereafterfor minimum
one year
``
``
``
Monthly -Minimum1000 & in
multiples of1 thereafterfor minimumsix months
(or) minimum500 & in
multiples of1 thereafterfor minimum
one year
Quarterly -Minimum1500 & in
multiples of1 thereafterfor minimum
one year
``
``
``
Monthly -Minimum1000 & in
multiples of1 thereafterfor minimumsix months
(or) minimum500 & in
multiples of1 thereafterfor minimum
one year
Quarterly -Minimum1500 & in
multiples of1 thereafterfor minimum
one year
``
``
``
SIP Dates 5th/10th/15th/20th/25th/30th (in case ofFebruary lastbusiness day)
5th/10th/15th/20th/25th/30th
(in case ofFebruary lastbusiness day)
5th/10th/15th/20th/25th/30th
(in case ofFebruary lastbusiness day)
5th/10th/15th/20th/25th/30th
(in case ofFebruary lastbusiness day)
5th/10th/15th/20th/25th/30th (in case ofFebruary lastbusiness day)
5th/10th/15th/20th/25th/30th
(in case ofFebruary lastbusiness day)
5th/10th/15th/20th/25th/30th
(in case ofFebruary lastbusiness day)
5th/10th/15th/20th/25th/30th
(in case ofFebruary lastbusiness day)
5th/10th/15th/20th/25th/30th
(in case ofFebruary lastbusiness day)
Benchmark CRISILBalanced Fund
Index
S&P BSE 100Index
S&P BSE 500Index
CNX NiftyIndex
CNX NIFTYIndex
S&P BSE 200Index
S&P BSE 100Index
S&P BSE 500Index
S&P BSE 100Index
(Previouslyknown as SBIMSFU - Contra
Fund)
(Previouslyknown as SBI
MSFU -Emerging
BusinessesFund)
RegularDirect
RegularDirect
RegularDirect
RegularDirect
RegularDirect
RegularDirect
RegularDirect
RegularDirect
RegularDirect
Plans Available
(Previouslyknown as SBI
MagnumIndex Fund)
SBI FMCG Fund
An Open-endedEquity Fund
14/07/1999
Mr. Saurabh Pant
Jun-2011
3 Year +
Nil
GrowthDividend
5th/10th/15th/20th/25th/30th
(in case ofFebruary lastbusiness day)
S&P BSE FMCGIndex
(Previouslyknown as SBIMSFU - FMCG
Fund)
RegularDirect
``
5000 & inmultiples
of 1
``
1000 & inmultiples
of 1
Monthly -Minimum1000 & in
multiples of 1thereafter forminimum sixmonths (or)
minimum 500& in multiples
of 1thereafter forminimum one
year
Quarterly -Minimum1500 & in
multiples of 1thereafter forminimum one
year
``
``
``

EQUITY SCHEMES SNAPSHOTFund Name
Type of theScheme
Inception Date
Fund Manager
IdealInvestmentHorizon
MinimumInvestmentAmount
AdditionalInvestmentAmount
Exit Load
OptionsAvailable
SIP Dates
Benchmark
SBI IT Fund
An Open-endedEquity Fund
14/07/1999
Mr. AnupUpadhyay
Jun-2011
3 Year +
Nil
GrowthDividend
5th/10th/15th/20th/25th/30th
(in case ofFebruary lastbusiness day)
S&P BSE - ITIndex
SBI PharmaFund
An Open-endedEquity Fund
14/07/1999
Mr. TanmayaDesai
Jun-2011
3 Year +
Nil
Growth,Dividend
5th/10th/15th/20th/25th/30th (in case ofFebruary lastbusiness day)
S&P BSEHEALTH CARE
Index
SBI MagnumCOMMA Fund
An Open-endedEquity Scheme
08/08/2005
Mr. Ajit Dange
Feb-2011
3 Year +
For exit within1 year fromthe date of
allotment - 1%; For exitafter 1 year
from the dateof allotment -
Nil
Growth,Dividend
5th/10th/15th/20th/25th/30th (in case ofFebruary lastbusiness day)
CNXCommodities
Index
SBI MagnumGlobal Fund
An Open-endedGrowth Scheme
30/09/1994
Mr. R. Srinivasan
May-2009
3 Year +
For exit within1 year from the
date ofallotment - 1 %;For exit after 1year from the
date ofallotment - Nil
Growth,Dividend
5th/10th/15th/20th/25th/30th
(in case ofFebruary lastbusiness day)
S&P BSE MidcapIndex (w.e.f.
April 01, 2014)Old Benchmark:
CNX MidcapIndex
SBI MagnumMidcap Fund
An Open-endedGrowth Scheme
29/03/2005
Ms. SohiniAndani
July-2010
3 Year +
For exit within1 year from the
date ofallotment - 1 %;For exit after 1year from the
date ofallotment - Nil
Growth,Dividend
5th/10th/15th/20th/25th/30th
(in case ofFebruary lastbusiness day)
S&P BSE MidcapIndex (w.e.f.
April 01, 2014)Old Benchmark:
CNX MidcapIndex
SBI ArbitrageOpportunities
Fund
An Open-endedEquity Scheme
03/11/2006
Mr. Neeraj Kumar
Oct-2012
1 Year +
For exit within7 business daysfrom the dateof allotment -
0.25%; For exitafter 7 businessdays from the
date ofallotment - Nil
Growth,Dividend
5th/10th/15th/20th/25th/30th
(in case ofFebruary lastbusiness day)
CRISIL LiquidFund Index
SBIInfrastructure
Fund
An Open-endedGrowth Scheme
06/07/2007
Mr. Ajit Dange
Jun-2011
3 Year +
For exit within 1year from the
date ofallotment - 1 %;For exit after 1year from the
date ofallotment - Nil
Growth,Dividend
5th/10th/15th/20th/25th/30th
(in case ofFebruary lastbusiness day)
CNXInfrastructure
Index
SBI PSU Fund
An Open-endedEquity Fund
07/07/2010
Mr. Ajit Dange
Feb-2012
3 Year +
For exitwithin 1 yearfrom the dateof allotment -1%; For exitafter 1 year
from the dateof allotment -
Nil
Growth,Dividend
5th/10th/15th/
20th/25th/30th (in case ofFebruary lastbusiness day)
S&P BSE PSUINDEX
Managing Since
(Previouslyknown as SBI
MSFU - IT Fund)
(Previouslyknown as SBI
MSFU - PharmaFund)
(Previouslyknown as SBIInfrastructureFund- Series 1)
SBI EDGE Fund SBI SMALL ANDMIDCAP FUND*
An Open-endedHybrid Scheme
An Open-endedEquity Scheme
08/10/2012 09/09/2009
Mr. DineshBalachandran
Mr. Ruchit Mehta
Mr. R. Srinivasan
Oct - 2012 Nov - 2013
3 Year + 3 Year +
For exit within 1year from the dateof allotment - 1%;
For exit after 1 yearfrom the date ofallotment - Nil
For exit within 1year from the dateof allotment - 1%;
For exit after 1 yearfrom the date ofallotment - Nil
5th/10th/15th/20th/25th/30th (in
case of Februarylast business day)
5th/10th/15th/20th/25th/30th (in
case of Februarylast business day)
S&P BSE Sensex33%, Crisil
Composite BondFund Index 33%,Price of Gold 33%
S&P BSE Small CapIndex
RegularDirect
RegularDirect
RegularDirect
RegularDirect
RegularDirect
RegularDirect
RegularDirect
RegularDirect
Plans Available RegularDirect
RegularDirect
Please consult your financial advisor before investing.
Fund invests instocks of
commoditybased companies
Growth,Dividend
Growth,Dividend
``
5000 & inmultiples of 1
``
5000 & inmultiples of 1
``
5000 & inmultiples of 1
``
5000 & inmultiples of 1
``
5000 & inmultiples of 1
``
5000 & inmultiples of 1
``
5000 & inmultiples of 1
``
5000 & inmultiples of 1
``
5000 & inmultiples of 1
` 5000/- and inmultiples of ` 1
``
1000 & inmultiples of 1
``
1000 & inmultiples of 1
``
1000 & inmultiples of 1
``
1000 & inmultiples of 1
``
1000 & inmultiples of 1
``
1000 & inmultiples of 1
``
1000 & inmultiples of 1
``
1000 & inmultiples of 1
``
1000 & inmultiples of 1
``
1000 & inmultiples of 1
SIP (MinimumAmount)
Monthly -Minimum1000 & in
multiples of 1thereafter forminimum sixmonths (or)
minimum 500& in multiples
of 1thereafter forminimum one
year
Quarterly -Minimum1500 & in
multiples of 1thereafter forminimum one
year
``
``
``
Monthly -Minimum1000 & in
multiples of 1thereafter forminimum sixmonths (or)
minimum 500& in multiples
of 1thereafter forminimum one
year
Quarterly -Minimum1500 & in
multiples of 1thereafter forminimum one
year
``
``
``
Monthly -Minimum1000 & in
multiples of 1thereafter forminimum sixmonths (or)
minimum 500& in multiples
of 1 thereafterfor minimum
one year
Quarterly -Minimum1500 & in
multiples of 1thereafter forminimum one
year
``
``
``
Monthly -Minimum1000 & in
multiples of 1thereafter forminimum sixmonths (or)
minimum 500& in multiples
of 1thereafter forminimum one
year
Quarterly -Minimum1500 & in
multiples of 1thereafter forminimum one
year
``
``
``
Monthly -Minimum1000 & in
multiples of 1thereafter forminimum sixmonths (or)
minimum 500& in multiples
of 1 thereafterfor minimum
one year
Quarterly -Minimum1500 & in
multiples of 1thereafter forminimum one
year
``
``
``
Monthly -Minimum1000 & in
multiples of 1thereafter forminimum sixmonths (or)
minimum 500& in multiples of
1 thereafterfor minimum
one year
Quarterly -Minimum1500 & in
multiples of 1thereafter forminimum one
year
``
``
``
Monthly -Minimum 1000& in multiples of
1 thereafter forminimum sixmonths (or)
minimum 500& in multiples of
1 thereafter forminimum one
year
Quarterly -Minimum 1500& in multiples of
1 thereafter forminimum one
year
``
``
``
Monthly -Minimum 1000& in multiples of
1 thereafter forminimum sixmonths (or)
minimum 500& in multiples of
1 thereafter forminimum one
year
Quarterly -Minimum 1500& in multiples of
1 thereafter forminimum one
year
``
``
``
Monthly -Minimum1000 & in
multiples of 1thereafter forminimum sixmonths (or)
minimum 500& in multiples
of 1 thereafterfor minimum
one year
Quarterly -Minimum1500 & in
multiples of 1thereafter forminimum one
year
``
``
``
Monthly -Minimum1000 & in
multiples of 1thereafter forminimum sixmonths (or)
minimum 500& in multiples
of 1 thereafterfor minimum
one year
Quarterly -Minimum1500 & in
multiples of 1thereafter forminimum one
year
``
``
``
*Pursuant to acquisition of Daiwa Industry Leaders Fund (DILF) from Daiwa Mutual Fund, w.e.f. Nov 16, 2013 the name of the scheme was changed to SBI Small & Midcap Fund.
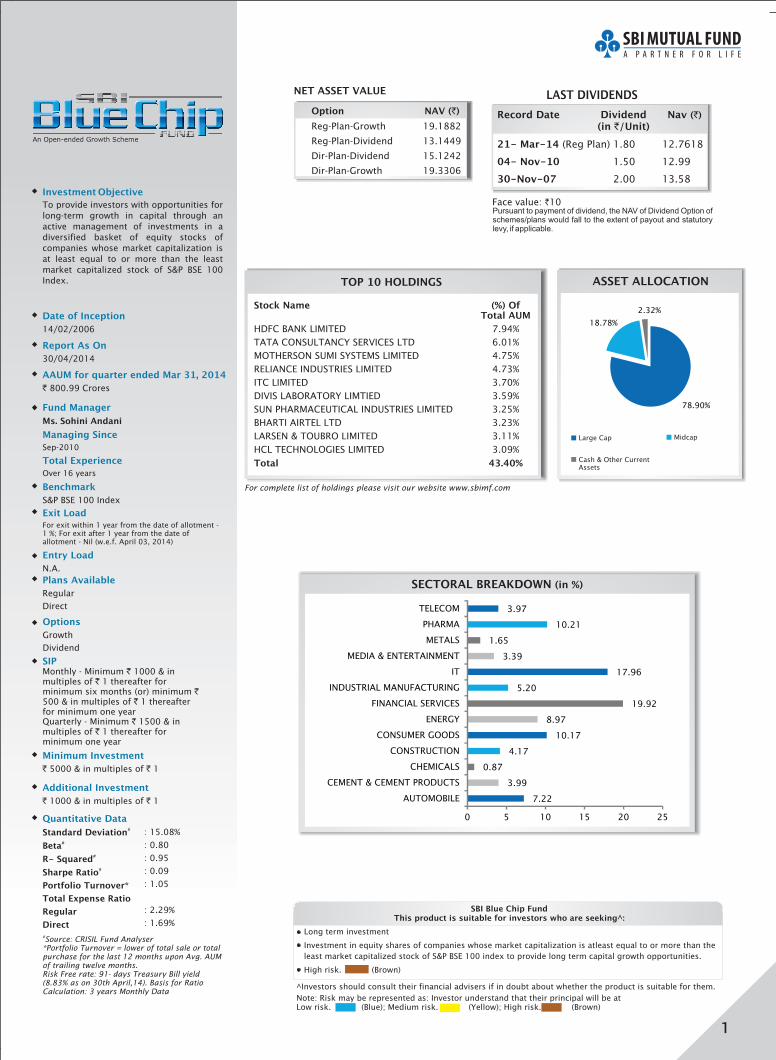
Investment Objective
To provide investors with opportunities for
long-term growth in capital through an
active management of investments in a
diversified basket of equity stocks of
companies whose market capitalization is
at least equal to or more than the least
market capitalized stock of S&P BSE 100
Index.
Date of Inception
14/02/2006
Entry Load
N.A.
Options
Growth
Dividend
Exit LoadFor exit within 1 year from the date of allotment -1 %; For exit after 1 year from the date ofallotment - Nil (w.e.f. April 03, 2014)
Quantitative Data
Standard Deviation
Beta
R- Squared
Sharpe Ratio
Portfolio Turnover
Total Expense Ratio
Regular
Direct
#
#
#
#
*
:
:
: 0.95
: 0.09
:
15.08%
0.80
1.05
: 2.29%
: 1.69%
Fund Manager
Ms. Sohini Andani
Sep-2010
Managing Since
Total Experience
Over 16 years
Benchmark
S&P BSE 100 Index
#Source: CRISIL Fund Analyser
*Portfolio Turnover = lower of total sale or totalpurchase for the last 12 months upon Avg. AUMof trailing twelve months.Risk Free rate: 91- days Treasury Bill yield(8.83% as on 30th April,14). Basis for RatioCalculation: 3 years Monthly Data
Report As On
30/04/2014
TOP 10 HOLDINGS
For complete list of holdings please visit our website www.sbimf.com
Stock Name (%) OfTotal AUM
HDFC BANK LIMITED 7.94
TATA CONSULTANCY SERVICES LTD 6.01
MOTHERSON SUMI SYSTEMS LIMITED 4.75
RELIANCE INDUSTRIES LIMITED 4.73
ITC LIMITED 3.70
DIVIS LABORATORY LIMTIED 3.59
SUN PHARMACEUTICAL INDUSTRIES LIMITED 3.25
BHARTI AIRTEL LTD 3.23
LARSEN & TOUBRO LIMITED 3.11
HCL TECHNOLOGIES LIMITED 3.09
%
%
%
%
%
%
%
%
%
%
Total 43.40%
ASSET ALLOCATION
SECTORAL BREAKDOWN (in %)
AAUM for quarter ended 2014Mar 31,
` 800.99 Crores
Plans Available
Regular
Direct
Option NAV ( )`
Reg-Plan-Growth 19.1882
Reg-Plan-Dividend 13.1449
Dir-Plan-Dividend 15.1242
Dir-Plan-Growth 19.3306
NET ASSET VALUE
Record Date Dividend Nav(in /Unit)
21- Mar-14
04- Nov-10
30-Nov-07
( )`
`
(Reg Plan) 1.80 12.7618
1.50 12.99
2.00 13.58
LAST DIVIDENDS
Face value: 10`
Large Cap Midcap
Cash & Other CurrentAssets
SBI Blue Chip FundThis product is suitable for investors who are seeking^:
• Long term investment
Investment in equity shares of companies whose market capitalization is atleast equal to or more than the
least market capitalized stock of S&P BSE 100 index to provide long term capital growth opportunities.
High risk. (Brown)
•
•
^Investors should consult their financial advisers if in doubt about whether the product is suitable for them.
Pursuant to payment of dividend, the NAV of Dividend Option ofschemes/plans would fall to the extent of payout and statutorylevy, if applicable.
Note: Risk may be represented as: Investor understand that their principal will be atLow risk. (Blue); Medium risk. (Yellow); High risk. (Brown)
Minimum Investment
` `5000 & in multiples of 1
Additional Investment
` `1000 & in multiples of 1
SIPMonthly - Minimum 1000 & inmultiples of 1 thereafter forminimum six months (or) minimum500 & in multiples of 1 thereafterfor minimum one yearQuarterly - Minimum 1500 & inmultiples of 1 thereafter forminimum one year
`
`
`
`
`
`
1
78.90%
18.78%
2.32%
7.22
3.99
0.87
4.17
10.17
8.97
19.92
5.20
17.96
3.39
1.65
10.21
3.97
0 5 10 15 20 25
AUTOMOBILE
CEMENT & CEMENT PRODUCTS
CHEMICALS
CONSTRUCTION
CONSUMER GOODS
ENERGY
FINANCIAL SERVICES
INDUSTRIAL MANUFACTURING
IT
MEDIA & ENTERTAINMENT
METALS
PHARMA
TELECOM
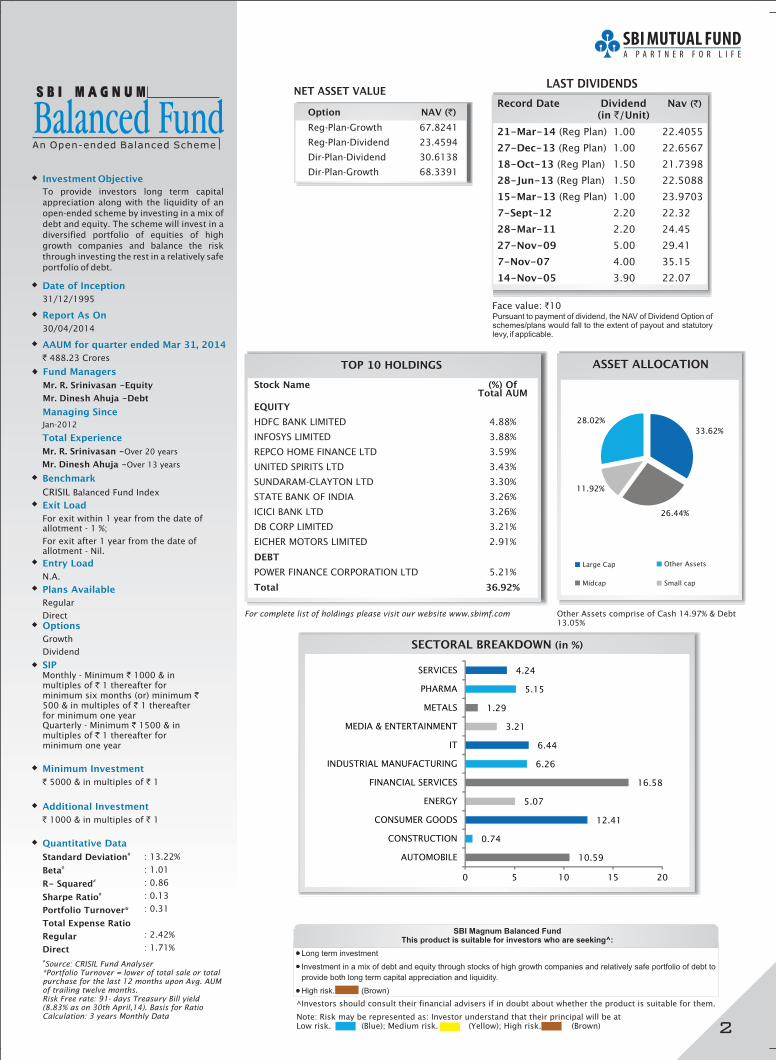
Investment Objective
To provide investors long term capital
appreciation along with the liquidity of an
open-ended scheme by investing in a mix of
debt and equity. The scheme will invest in a
diversified portfolio of equities of high
growth companies and balance the risk
through investing the rest in a relatively safe
portfolio of debt.
Date of Inception
31/12/1995
Entry Load
N.A.
Options
Growth
Dividend
Exit Load
For exit within 1 year from the date ofallotment - 1 %;
For exit after 1 year from the date ofallotment - Nil.
Quantitative Data
Standard Deviation
Beta
R- Squared
Sharpe Ratio
Portfolio Turnover
Total Expense Ratio
Regular
Direct
#
#
#
#
*
: 13.22%
: 1.01
: 0.86
: 0.13
: 0.31
: 2.42%
: 1.71%
Fund Managers
Mr. R. Srinivasan -Equity
Mr. Dinesh Ahuja
Mr. R. Srinivasan -
Mr. Dinesh Ahuja -
-Debt
Managing Since
Total Experience
Jan-2012
Over 20 years
Over 13 years
Benchmark
CRISIL Balanced Fund Index
#Source: CRISIL Fund Analyser
*Portfolio Turnover = lower of total sale or totalpurchase for the last 12 months upon Avg. AUMof trailing twelve months.Risk Free rate: 91- days Treasury Bill yield(8.83% as on 30th April,14). Basis for RatioCalculation: 3 years Monthly Data
Report As On
30/04/2014
For complete list of holdings please visit our website www.sbimf.com
ASSET ALLOCATION
SECTORAL BREAKDOWN (in %)
AAUM for quarter ended Mar 31, 2014
` 488.23 Crores
Large Cap Other Assets
Midcap Small cap
Stock Name (%) OfTotal AUM
EQUITY
DEBT
Total 36.92%
HDFC BANK LIMITED 4.88%
INFOSYS LIMITED 3.88%
REPCO HOME FINANCE LTD 3.59%
UNITED SPIRITS LTD 3.43%
SUNDARAM-CLAYTON LTD 3.30%
STATE BANK OF INDIA 3.26%
ICICI BANK LTD 3.26%
DB CORP LIMITED 3.21%
EICHER MOTORS LIMITED 2.91%
POWER FINANCE CORPORATION LTD 5.21%
TOP 10 HOLDINGS
Plans Available
Regular
Direct
Option NAV ( )`
Reg-Plan-Growth 67.8241
Reg-Plan-Dividend 23.4594
Dir-Plan-Dividend 30.6138
Dir-Plan-Growth 68.3391
NET ASSET VALUERecord Date Dividend Nav
(in /Unit)
21-Mar-14
27-Dec-13
18-Oct-13
28-Jun-13
15-Mar-13
7-Sept-12
28-Mar-11
27-Nov-09
7-Nov-07
14-Nov-05
( )`
`
(Reg Plan) 1.00 22.4055
(Reg Plan) 1.00 22.6567
(Reg Plan) 1.50 21.7398
(Reg Plan) 1.50 22.5088
(Reg Plan) 1.00 23.9703
2.20 22.32
2.20 24.45
5.00 29.41
4.00 35.15
3.90 22.07
LAST DIVIDENDS
Face value: 10`
Other Assets comprise of Cash 14.97% & Debt13.05%
SBI Magnum Balanced FundThis product is suitable for investors who are seeking^:
• Long term investment
Investment in a mix of debt and equity through stocks of high growth companies and relatively safe portfolio of debt to
provide both long term capital appreciation and liquidity.
High risk. (Brown)
•
•
^Investors should consult their financial advisers if in doubt about whether the product is suitable for them.
Pursuant to payment of dividend, the NAV of Dividend Option ofschemes/plans would fall to the extent of payout and statutorylevy, if applicable.
Note: Risk may be represented as: Investor understand that their principal will be atLow risk. (Blue); Medium risk. (Yellow); High risk. (Brown)
Minimum Investment
` `5000 & in multiples of 1
Additional Investment
` `1000 & in multiples of 1
SIPMonthly - Minimum 1000 & inmultiples of 1 thereafter forminimum six months (or) minimum500 & in multiples of 1 thereafterfor minimum one yearQuarterly - Minimum 1500 & inmultiples of 1 thereafter forminimum one year
`
`
`
`
`
`
2
33.62%
26.44%
11.92%
28.02%
10.59
0.74
12.41
5.07
16.58
6.26
6.44
3.21
1.29
5.15
4.24
0 5 10 15 20
AUTOMOBILE
CONSTRUCTION
CONSUMER GOODS
ENERGY
FINANCIAL SERVICES
INDUSTRIAL MANUFACTURING
IT
MEDIA & ENTERTAINMENT
METALS
PHARMA
SERVICES
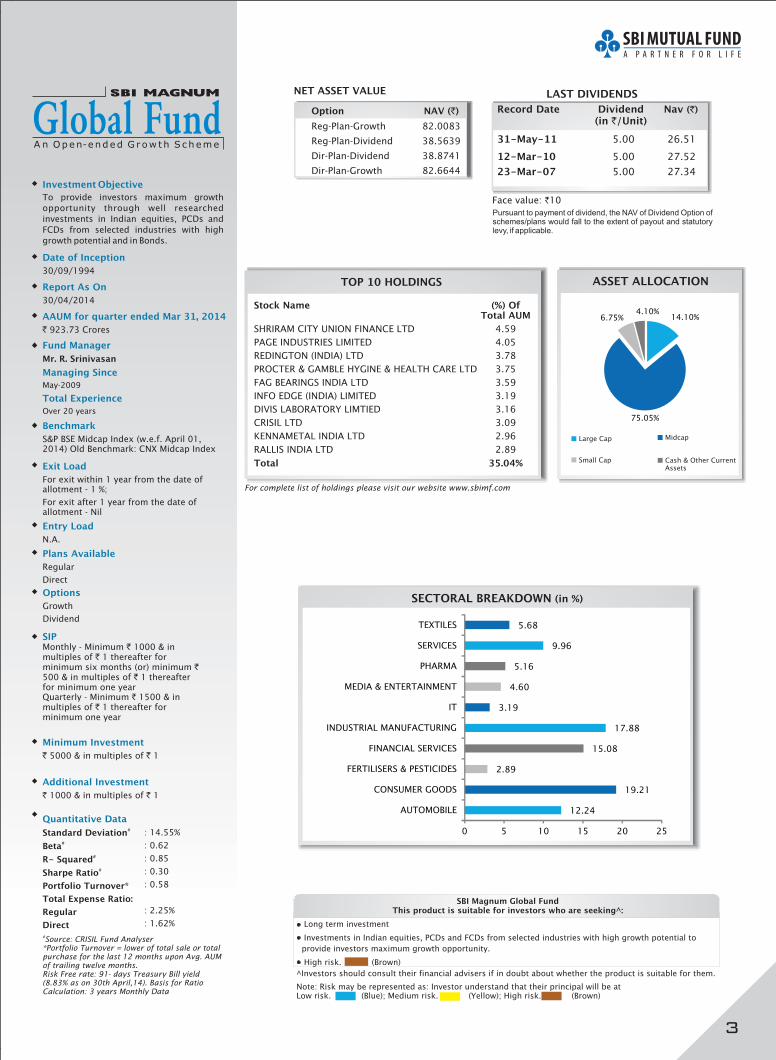
Investment Objective
To provide investors maximum growth
opportunity through well researched
investments in Indian equities, PCDs and
FCDs from selected industries with high
growth potential and in Bonds.
Date of Inception
30/09/1994
Entry Load
N.A.
Options
Growth
Dividend
Exit Load
For exit within 1 year from the date ofallotment - 1 %;
For exit after 1 year from the date ofallotment - Nil
Quantitative Data
Standard Deviation
Beta
R- Squared
Sharpe Ratio
Portfolio Turnover
Total Expense Ratio:
Regular
Direct
#
#
#
#
*
: 14.55%
: 0.62
: 0.85
: 0.30
: 0.58
: 2.25%
: 1.62%
Fund Manager
Mr. R. Srinivasan
May-2009
Over 20 years
Managing Since
Total Experience
Benchmark
S&P BSE Midcap Index (w.e.f. April 01,2014) Old Benchmark: CNX Midcap Index
#Source: CRISIL Fund Analyser
*Portfolio Turnover = lower of total sale or totalpurchase for the last 12 months upon Avg. AUMof trailing twelve months.Risk Free rate: 91- days Treasury Bill yield(8.83% as on 30th April,14). Basis for RatioCalculation: 3 years Monthly Data
Report As On
30/04/2014
TOP 10 HOLDINGS
For complete list of holdings please visit our website www.sbimf.com
Stock Name (%) OfTotal AUM
SHRIRAM CITY UNION FINANCE LTD 4.59
PAGE INDUSTRIES LIMITED 4.05
REDINGTON (INDIA) LTD 3.78
PROCTER & GAMBLE HYGINE & HEALTH CARE LTD 3.75
FAG BEARINGS INDIA LTD 3.59
INFO EDGE (INDIA) LIMITED 3.19
DIVIS LABORATORY LIMTIED 3.16
CRISIL LTD 3.09
KENNAMETAL INDIA LTD 2.96
RALLIS INDIA LTD 2.89
Total 35.04%
ASSET ALLOCATION
MidcapLarge Cap
Small Cap
AAUM for quarter ended 2014Mar 31,
` 923.73 Crores
Plans Available
Regular
Direct
Option NAV ( )`
Reg-Plan-Growth 82.0083
Reg-Plan-Dividend 38.5639
Dir-Plan-Dividend 38.8741
Dir-Plan-Growth 82.6644
NET ASSET VALUE
SECTORAL BREAKDOWN (in %)
31-May-11
12-Mar-10
23-Mar-07
5.00 26.51
5.00 27.52
5.00 27.34
LAST DIVIDENDS
Record Date Dividend Nav(in /Unit)
( )`
`
Face value: 10`
SBI Magnum Global FundThis product is suitable for investors who are seeking^:
• Long term investment
Investments in Indian equities, PCDs and FCDs from selected industries with high growth potential to
provide investors maximum growth opportunity.
High risk. (Brown)
•
•
^Investors should consult their financial advisers if in doubt about whether the product is suitable for them.
Pursuant to payment of dividend, the NAV of Dividend Option ofschemes/plans would fall to the extent of payout and statutorylevy, if applicable.
Note: Risk may be represented as: Investor understand that their principal will be atLow risk. (Blue); Medium risk. (Yellow); High risk. (Brown)
Minimum Investment
` `5000 & in multiples of 1
Additional Investment
` `1000 & in multiples of 1
SIPMonthly - Minimum 1000 & inmultiples of 1 thereafter forminimum six months (or) minimum500 & in multiples of 1 thereafterfor minimum one yearQuarterly - Minimum 1500 & inmultiples of 1 thereafter forminimum one year
`
`
`
`
`
`
Cash & Other CurrentAssets
3
14.10%
75.05%
6.75%4.10%
12.24
19.21
2.89
15.08
17.88
3.19
4.60
5.16
9.96
5.68
0 5 10 15 20 25
AUTOMOBILE
CONSUMER GOODS
FERTILISERS & PESTICIDES
FINANCIAL SERVICES
INDUSTRIAL MANUFACTURING
IT
MEDIA & ENTERTAINMENT
PHARMA
SERVICES
TEXTILES
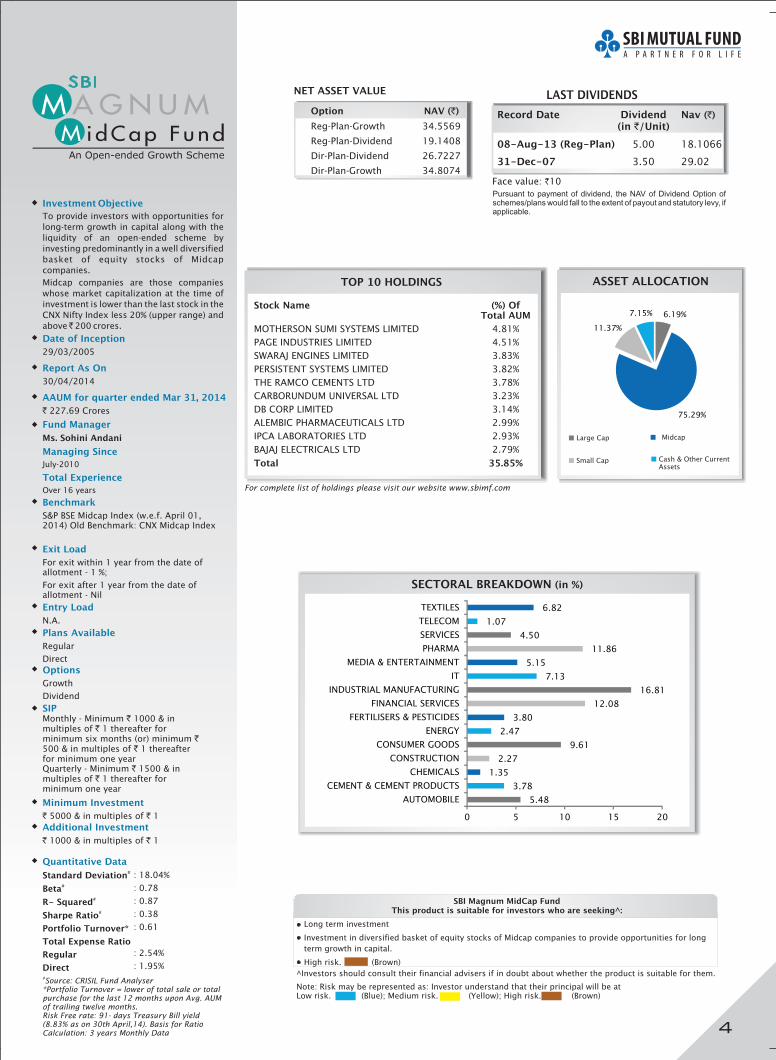
Investment Objective
To provide investors with opportunities for
long-term growth in capital along with the
liquidity of an open-ended scheme by
investing predominantly in a well diversified
basket of equity stocks of Midcap
companies.
Midcap companies are those companies
whose market capitalization at the time of
investment is lower than the last stock in the
CNX Nifty Index less 20% (upper range) and
above 200 crores.`
Date of Inception
29/03/2005
Entry Load
N.A.
Options
Growth
Dividend
Exit Load
For exit within 1 year from the date ofallotment - 1 %;
For exit after 1 year from the date ofallotment - Nil
Quantitative Data
Standard Deviation
Beta
R- Squared
Sharpe Ratio
Portfolio Turnover
Total Expense Ratio
Regular
Direct
#
#
#
#
*
Fund Manager
Ms. Sohini Andani
Over 16 years
Managing Since
Total Experience
July-2010
Benchmark
S&P BSE Midcap Index (w.e.f. April 01,2014) Old Benchmark: CNX Midcap Index
#Source: CRISIL Fund Analyser
*Portfolio Turnover = lower of total sale or totalpurchase for the last 12 months upon Avg. AUMof trailing twelve months.Risk Free rate: 91- days Treasury Bill yield(8.83% as on 30th April,14). Basis for RatioCalculation: 3 years Monthly Data
Report As On
30/04/2014
TOP 10 HOLDINGS
For complete list of holdings please visit our website www.sbimf.com
Stock Name (%) OfTotal AUM
MOTHERSON SUMI SYSTEMS LIMITED 4.81
PAGE INDUSTRIES LIMITED 4.51
SWARAJ ENGINES LIMITED 3.83
PERSISTENT SYSTEMS LIMITED 3.82
THE RAMCO CEMENTS LTD 3.78
CARBORUNDUM UNIVERSAL LTD 3.23
DB CORP LIMITED 3.14
ALEMBIC PHARMACEUTICALS LTD 2.99
IPCA LABORATORIES LTD 2.93
BAJAJ ELECTRICALS LTD 2.79%
%
%
%
%
%
%
%
%
%
Total 35.85%
ASSET ALLOCATION
SECTORAL BREAKDOWN (in %)
AAUM for quarter ended Mar 31, 2014
` 227.69 Crores
Large Cap
Small Cap
Midcap
Cash & Other CurrentAssets
: 18.04%
: 0.78
: 0.87
: 0.38
: 0.61
: 2.54%
: 1.95%
Plans Available
Regular
Direct
Option NAV ( )`
Reg-Plan-Growth 34.5569
Reg-Plan-Dividend 19.1408
Dir-Plan-Dividend 26.7227
Dir-Plan-Growth 34.8074
NET ASSET VALUE
Record Date Dividend Nav(in /Unit)
08-Aug-13 (Reg-Plan)
31-Dec-07
( )`
`
5.00 18.1066
3.50 29.02
LAST DIVIDENDS
Face value: 10`
SBI Magnum MidCap FundThis product is suitable for investors who are seeking^:
• Long term investment
Investment in diversified basket of equity stocks of Midcap companies to provide opportunities for long
term growth in capital.
High risk. (Brown)
•
•
^Investors should consult their financial advisers if in doubt about whether the product is suitable for them.
Pursuant to payment of dividend, the NAV of Dividend Option ofschemes/plans would fall to the extent of payout and statutory levy, ifapplicable.
Note: Risk may be represented as: Investor understand that their principal will be atLow risk. (Blue); Medium risk. (Yellow); High risk. (Brown)
Minimum Investment
` `5000 & in multiples of 1
Additional Investment
` `1000 & in multiples of 1
SIPMonthly - Minimum 1000 & inmultiples of 1 thereafter forminimum six months (or) minimum500 & in multiples of 1 thereafterfor minimum one yearQuarterly - Minimum 1500 & inmultiples of 1 thereafter forminimum one year
`
`
`
`
`
`
4
6.19%
75.29%
11.37%
7.15%
5.48
3.78
1.35
2.27
9.61
2.47
3.80
12.08
16.81
7.13
5.15
11.86
4.50
1.07
6.82
0 5 10 15 20
AUTOMOBILE
CEMENT & CEMENT PRODUCTS
CHEMICALS
CONSTRUCTION
CONSUMER GOODS
ENERGY
FERTILISERS & PESTICIDES
FINANCIAL SERVICES
INDUSTRIAL MANUFACTURING
IT
MEDIA & ENTERTAINMENT
PHARMA
SERVICES
TELECOM
TEXTILES
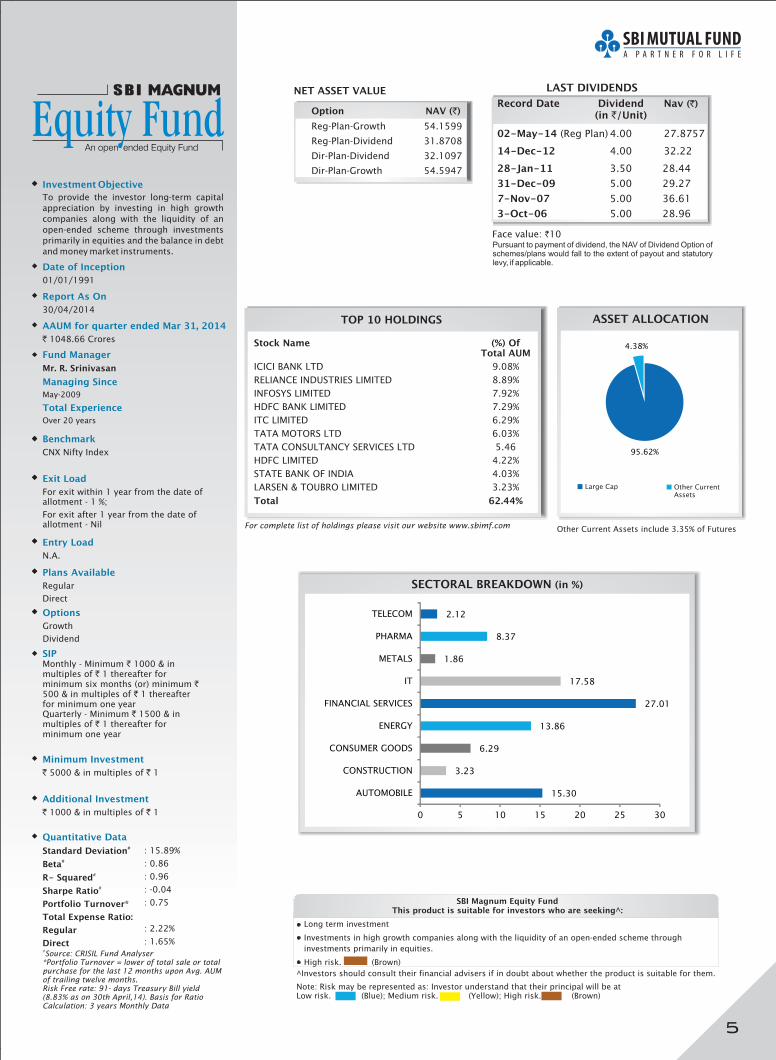
Investment Objective
To provide the investor long-term capital
appreciation by investing in high growth
companies along with the liquidity of an
open-ended scheme through investments
primarily in equities and the balance in debt
and money market instruments.
Date of Inception
01/01/1991
Entry Load
N.A.
Plans Available
Regular
Direct
Options
Growth
Dividend
SIPMonthly - Minimum 1000 & inmultiples of 1 thereafter forminimum six months (or) minimum500 & in multiples of 1 thereafterfor minimum one yearQuarterly - Minimum 1500 & inmultiples of 1 thereafter forminimum one year
`
`
`
`
`
`
Minimum Investment
` `5000 & in multiples of 1
Exit Load
For exit within 1 year from the date ofallotment - 1 %;
For exit after 1 year from the date ofallotment - Nil
Additional Investment
` `1000 & in multiples of 1
Quantitative Data
Standard Deviation
Beta
R- Squared
Sharpe Ratio
Portfolio Turnover
Total Expense Ratio:
Regular
Direct
#
#
#
#
*
: 15.89%
: 0.86
: 0.96
: -0.04
: 0.75
: 2.22%
: 1.65%
Fund Manager
Mr. R. Srinivasan
Managing Since
Total Experience
May-2009
Over 20 years
Benchmark
CNX Nifty Index
#Source: CRISIL Fund Analyser
*Portfolio Turnover = lower of total sale or totalpurchase for the last 12 months upon Avg. AUMof trailing twelve months.Risk Free rate: 91- days Treasury Bill yield(8.83% as on 30th April,14). Basis for RatioCalculation: 3 years Monthly Data
Report As On
30/04/2014
TOP 10 HOLDINGS
For complete list of holdings please visit our website www.sbimf.com
Stock Name (%) OfTotal AUM
ICICI BANK LTD 9.08
RELIANCE INDUSTRIES LIMITED 8.89
INFOSYS LIMITED 7.92
HDFC BANK LIMITED 7.29
ITC LIMITED 6.29
TATA MOTORS LTD 6.03
TATA CONSULTANCY SERVICES LTD 5.46
HDFC LIMITED 4.22
STATE BANK OF INDIA 4.03
LARSEN & TOUBRO LIMITED 3.23%
%
%
%
%
%
%
%
%
Total 62.44%
ASSET ALLOCATIONAAUM for quarter ended Mar 31, 2014
` 1048.66 Crores
Pursuant to payment of dividend, the NAV of Dividend Option ofschemes/plans would fall to the extent of payout and statutorylevy, if applicable.
Large Cap Other CurrentAssets
Option NAV ( )`
Reg-Plan-Growth 54.1599
Reg-Plan-Dividend 31.8708
Dir-Plan-Dividend 32.1097
Dir-Plan-Growth 54.5947
NET ASSET VALUE
SECTORAL BREAKDOWN (in %)
02-May-14
28-Jan-11
31-Dec-09
7-Nov-07
3-Oct-06
(Reg Plan) 4.00 27.8757
3.50 28.44
5.00 29.27
5.00 36.61
5.00 28.96
14-Dec-12 4.00 32.22
LAST DIVIDENDS
Record Date Dividend Nav(in /Unit)
( )`
`
Face value: 10`
SBI Magnum Equity FundThis product is suitable for investors who are seeking^:
• Long term investment
Investments in high growth companies along with the liquidity of an open-ended scheme through
investments primarily in equities.
High risk. (Brown)
•
•
^Investors should consult their financial advisers if in doubt about whether the product is suitable for them.
Note: Risk may be represented as: Investor understand that their principal will be atLow risk. (Blue); Medium risk. (Yellow); High risk. (Brown)
Other Current Assets include of Futures3.35%
5
95.62%
4.38%
15.30
3.23
6.29
13.86
27.01
17.58
1.86
8.37
2.12
0 5 10 15 20 25 30
AUTOMOBILE
CONSTRUCTION
CONSUMER GOODS
ENERGY
FINANCIAL SERVICES
IT
METALS
PHARMA
TELECOM
An open ended Equity Fund
Investment Objective
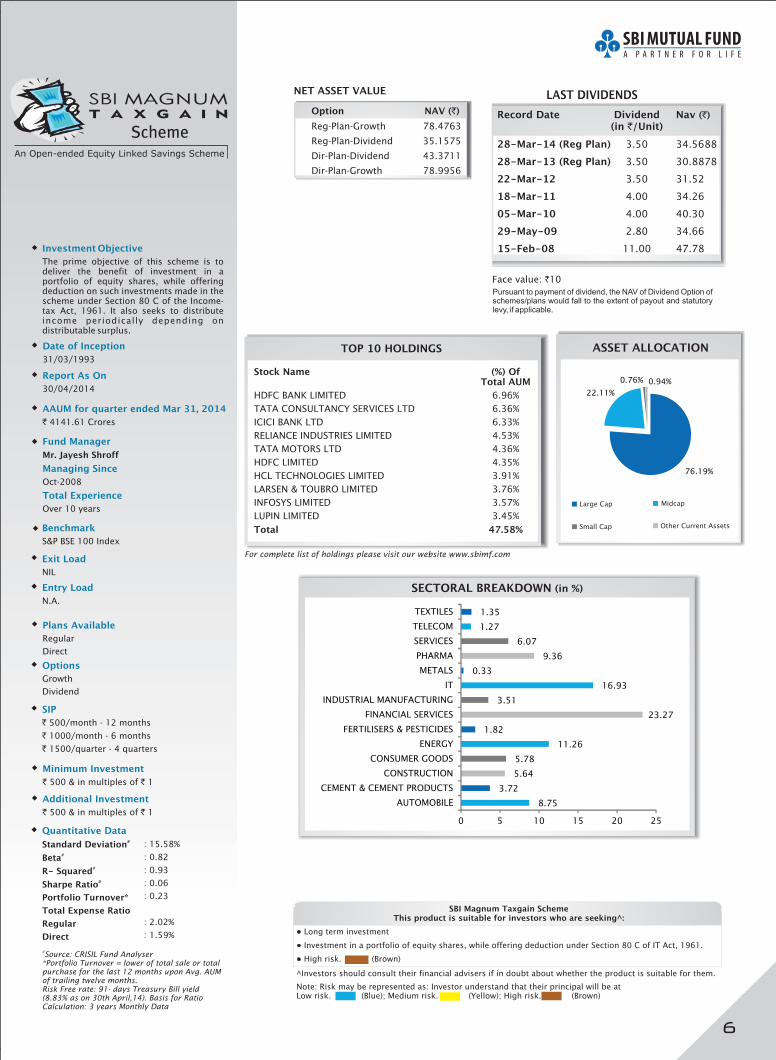
The prime objective of this scheme is todeliver the benefit of investment in aportfolio of equity shares, while offeringdeduction on such investments made in thescheme under Section 80 C of the Income-tax Act, 1961. It also seeks to distributeincome periodically depending ondistributable surplus.
Date of Inception
31/03/1993
Entry Load
N.A.
Options
Growth
Dividend
SIP
`
`
`
500/month - 12 months
1000/month - 6 months
1500/quarter - 4 quarters
Exit Load
NIL
Quantitative Data
Standard Deviation
Beta
R- Squared
Sharpe Ratio
Portfolio Turnover
Total Expense Ratio
Regular
Direct
#
#
#
#
*
:
:
: 0.93
: 0.06
:
: 2.02%
: 1.59%
15.58%
0.82
0.23
Fund Manager
Mr. Jayesh Shroff
Oct-2008
Over 10 years
Managing Since
Total Experience
Benchmark
S&P BSE 100 Index
#Source: CRISIL Fund Analyser
*Portfolio Turnover = lower of total sale or totalpurchase for the last 12 months upon Avg. AUMof trailing twelve months.Risk Free rate: 91- days Treasury Bill yield(8.83% as on 30th April,14). Basis for RatioCalculation: 3 years Monthly Data
Report As On
30/04/2014
TOP 10 HOLDINGS
For complete list of holdings please visit our website www.sbimf.com
Stock Name (%) OfTotal AUM
HDFC BANK LIMITED 6.96
TATA CONSULTANCY SERVICES LTD 6.36
ICICI BANK LTD 6.33
RELIANCE INDUSTRIES LIMITED 4.53
TATA MOTORS LTD 4.36
HDFC LIMITED 4.35
HCL TECHNOLOGIES LIMITED 3.91
LARSEN & TOUBRO LIMITED 3.76
INFOSYS LIMITED 3.57
LUPIN LIMITED 3.45%
%
%
%
%
%
%
%
%
%
Total 47.58%
ASSET ALLOCATION
Large Cap
Small Cap
Midcap
Other Current Assets
SECTORAL BREAKDOWN (in %)
AAUM for quarter ended Mar 31, 2014
` 4141.61 Crores
Plans Available
Regular
Direct
Option NAV ( )`
Reg-Plan-Growth 78.4763
Reg-Plan-Dividend 35.1575
Dir-Plan-Dividend 43.3711
Dir-Plan-Growth 78.9956
NET ASSET VALUE
Record Date Dividend Nav(in /Unit)
28-Mar-14 (Reg Plan)
28-Mar-13 (Reg Plan)
22-Mar-12
18-Mar-11
05-Mar-10
29-May-09
15-Feb-08
( )`
`
3.50 34.5688
3.50 30.8878
3.50 31.52
4.00 34.26
4.00 40.30
2.80 34.66
11.00 47.78
LAST DIVIDENDS
Face value: 10`
SBI Magnum Taxgain SchemeThis product is suitable for investors who are seeking^:
• Long term investment
Investment in a portfolio of equity shares, while offering deduction under Section 80 C of IT Act, 1961.
High risk. (Brown)
•
•
^Investors should consult their financial advisers if in doubt about whether the product is suitable for them.
Pursuant to payment of dividend, the NAV of Dividend Option ofschemes/plans would fall to the extent of payout and statutorylevy, if applicable.
Note: Risk may be represented as: Investor understand that their principal will be atLow risk. (Blue); Medium risk. (Yellow); High risk. (Brown)
Minimum Investment
` `500 & in multiples of 1
Additional Investment
` `500 & in multiples of 1
6
76.19%
22.11%
0.76% 0.94%
8.75
3.72
5.64
5.78
11.26
1.82
23.27
3.51
16.93
0.33
9.36
6.07
1.27
1.35
0 5 10 15 20 25
AUTOMOBILE
CEMENT & CEMENT PRODUCTS
CONSTRUCTION
CONSUMER GOODS
ENERGY
FERTILISERS & PESTICIDES
FINANCIAL SERVICES
INDUSTRIAL MANUFACTURING
IT
METALS
PHARMA
SERVICES
TELECOM
TEXTILES
TOP 10 HOLDINGS
For complete list of holdings please visit our website www.sbimf.com
Stock Name (%) OfTotal AUM
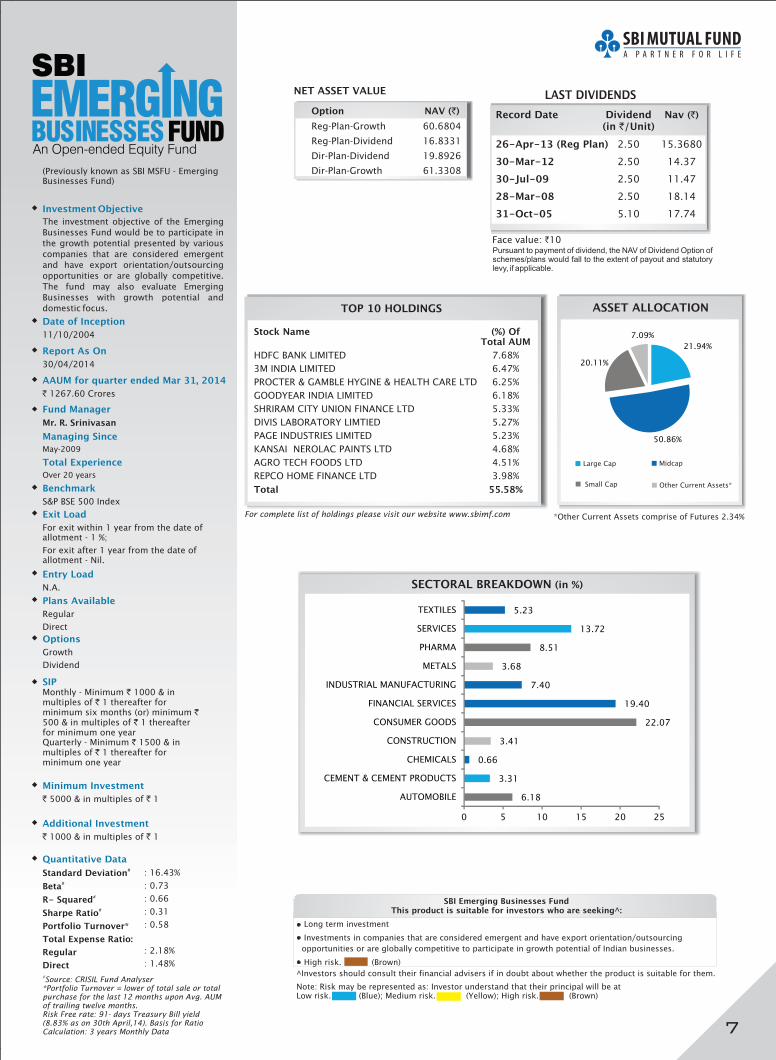
HDFC BANK LIMITED 7.68
3M INDIA LIMITED 6.47
PROCTER & GAMBLE HYGINE & HEALTH CARE LTD 6.25
GOODYEAR INDIA LIMITED 6.18
SHRIRAM CITY UNION FINANCE LTD 5.33
DIVIS LABORATORY LIMTIED 5.27
PAGE INDUSTRIES LIMITED 5.23
KANSAI NEROLAC PAINTS LTD 4.68
AGRO TECH FOODS LTD 4.51
REPCO HOME FINANCE LTD 3.98%
%
%
%
%
%
%
%
%
%
Total 55.58%
ASSET ALLOCATION
Investment Objective
The investment objective of the Emerging
Businesses Fund would be to participate in
the growth potential presented by various
companies that are considered emergent
and have export orientation/outsourcing
opportunities or are globally competitive.
The fund may also evaluate Emerging
Businesses with growth potential and
domestic focus.
Date of Inception
11/10/2004
Entry Load
N.A.
Options
Growth
Dividend
Exit Load
For exit within 1 year from the date ofallotment - 1 %;
For exit after 1 year from the date ofallotment - Nil.
Quantitative Data
Standard Deviation
Beta
R- Squared
Sharpe Ratio
Portfolio Turnover
Total Expense Ratio:
Regular
Direct
#
#
#
#
*
: 16.43%
: 0.73
: 0.66
: 0.31
: 0.58
: 2.18%
: 1.48%
Fund Manager
Mr. R. Srinivasan
Managing Since
Total Experience
May-2009
Over 20 years
Benchmark
S&P BSE 500 Index
#Source: CRISIL Fund Analyser
*Portfolio Turnover = lower of total sale or totalpurchase for the last 12 months upon Avg. AUMof trailing twelve months.Risk Free rate: 91- days Treasury Bill yield(8.83% as on 30th April,14). Basis for RatioCalculation: 3 years Monthly Data
Report As On
30/04/2014
AAUM for quarter ended Mar 31, 2014
` 1267.60 Crores
An Open-ended Equity Fund
Plans Available
Regular
Direct
(Previously known as SBI MSFU - EmergingBusinesses Fund)
Option NAV ( )`
Reg-Plan-Growth 60.6804
Reg-Plan-Dividend 16.8331
Dir-Plan-Dividend 19.8926
Dir-Plan-Growth 61.3308
NET ASSET VALUE
SECTORAL BREAKDOWN (in %)
Record Date Dividend Nav(in /Unit)
26-Apr-13 (Reg Plan)
30-Mar-12
30-Jul-09
28-Mar-08
31-Oct-05
( )`
`
2.50 15.3680
2.50 14.37
2.50 11.47
2.50 18.14
5.10 17.74
LAST DIVIDENDS
Face value: 10`
Midcap
Other Current Assets*
Large Cap
Small Cap
SBI Emerging Businesses FundThis product is suitable for investors who are seeking^:
• Long term investment
Investments in companies that are considered emergent and have export orientation/outsourcing
opportunities or are globally competitive to participate in growth potential of Indian businesses.
High risk. (Brown)
•
•
^Investors should consult their financial advisers if in doubt about whether the product is suitable for them.
Pursuant to payment of dividend, the NAV of Dividend Option ofschemes/plans would fall to the extent of payout and statutorylevy, if applicable.
Note: Risk may be represented as: Investor understand that their principal will be atLow risk. (Blue); Medium risk. (Yellow); High risk. (Brown)
Minimum Investment
` `5000 & in multiples of 1
Additional Investment
` `1000 & in multiples of 1
SIPMonthly - Minimum 1000 & inmultiples of 1 thereafter forminimum six months (or) minimum500 & in multiples of 1 thereafterfor minimum one yearQuarterly - Minimum 1500 & inmultiples of 1 thereafter forminimum one year
`
`
`
`
`
`
*Other Current Assets comprise of Futures 2.34%
7
21.94%
50.86%
20.11%
7.09%
6.18
3.31
0.66
3.41
22.07
19.40
7.40
3.68
8.51
13.72
5.23
0 5 10 15 20 25
AUTOMOBILE
CEMENT & CEMENT PRODUCTS
CHEMICALS
CONSTRUCTION
CONSUMER GOODS
FINANCIAL SERVICES
INDUSTRIAL MANUFACTURING
METALS
PHARMA
SERVICES
TEXTILES

Investment Objective
To provide the investors maximum growth
opportunity through equity investments in
stocks of growth oriented sectors of the
economy. There are four sub-funds
dedicated to specific investment themes viz.
Information Technology, Pharmaceuticals,
FMCG, Contrarian (investment in stocks
currently out of favour) and Emerging
Businesses.
Date of Inception
14/07/1999
Entry Load
N.A.
Options
Growth
Dividend
Exit Load
Nil
Quantitative Data
Standard Deviation
Beta
R- Squared
Sharpe Ratio
Portfolio Turnover
Total Expense Ratio:
Regular
Direct
#
#
#
#
*
: 14.63%
: 0.86
: 0.88
: 0.89
: 0.69
: 2.57%
: 1.92%
Fund Manager
Mr. Saurabh Pant
Jun-2011
Managing Since
Total Experience
Over 5 years
Benchmark
S&P BSE FMCG Index
#Source: CRISIL Fund Analyser
*Portfolio Turnover = lower of total sale or totalpurchase for the last 12 months upon Avg. AUMof trailing twelve months.Risk Free rate: 91- days Treasury Bill yield(8.83% as on 30th April,14). Basis for RatioCalculation: 3 years Monthly Data
Report As On
30/04/2014
TOP 10 HOLDINGS
For complete list of holdings please visit our website www.sbimf.com
Stock Name (%) OfTotal AUM
ITC LIMITED 42.05%
UNITED SPIRITS LTD 11.07
COLGATE PALMOLIVE INDIA LIMITED 7.20
VST INDUSTRIES LTD 6.13
PROCTER & GAMBLE HYGINE & HEALTH CARE LTD 6.08
KANSAI NEROLAC PAINTS LTD 4.85
AGRO TECH FOODS LTD 4.47
EMAMI LIMITED 3.15
JYOTHY LABORATORIES LTD 2.57
HINDUSTAN UNILEVER LIMITED 2.27
%
%
%
%
%
%
%
%
%
Total 89.84%
SECTORAL BREAKDOWN (in %)
AAUM for quarter ended Mar 31, 2014
` 214.80 Crores
An Open-ended Equity Fund
Plans Available
Regular
Direct
(Previously known as SBI MSFU - FMCGFund)
Option NAV ( )`
Reg-Plan-Growth 57.2098
Reg-Plan-Dividend 48.6340
Dir-Plan-Dividend 57.7102
Dir-Plan-Growth 58.0743
NET ASSET VALUE
Record Date Dividend Nav(in /Unit)
17-May-13 Reg Plan
3-Mar-06
( )`
`
8.00 46.0416
6.00 22.05
LAST DIVIDENDS
Face value: 10`
SBI FMCG FundThis product is suitable for investors who are seeking^:
• Long term investment
Equity Investments in stock of FMCG sector of the economy to provide sector specific growth
opportunities.
High risk. (Brown)
•
•
^Investors should consult their financial advisers if in doubt about whether the product is suitable for them.
ASSET ALLOCATION
Large Cap
Small Cap
Midcap
Cash & Other CurrentAssets
Pursuant to payment of dividend, the NAV of Dividend Option ofschemes/plans would fall to the extent of payout and statutorylevy, if applicable.
Note: Risk may be represented as: Investor understand that their principal will be atLow risk. (Blue); Medium risk. (Yellow); High risk. (Brown)
Minimum Investment
` `5000 & in multiples of 1
Additional Investment
` `1000 & in multiples of 1
SIPMonthly - Minimum 1000 & inmultiples of 1 thereafter forminimum six months (or) minimum500 & in multiples of 1 thereafterfor minimum one yearQuarterly - Minimum 1500 & inmultiples of 1 thereafter forminimum one year
`
`
`
`
`
`
8
97.69
0 20 40 60 80 100 120
CONSUMER GOODS
64.76%
24.42%
8.51%2.31%

Investment Objective
To provide the investors maximum growth
opportunity through equity investments in
stocks of growth oriented sectors of the
economy. There are four sub-funds
dedicated to specific investment themes viz.
Information Technology, Pharmaceuticals,
FMCG, Contrarian (investment in stocks
currently out of favour) and Emerging
Businesses.
Date of Inception
14/07/1999
Entry Load
N.A.
Options
Growth
Dividend
Exit Load
Nil
Quantitative Data
Standard Deviation
Beta
R- Squared
Sharpe Ratio
Portfolio Turnover
Total Expense Ratio:
Regular
Direct
#
#
#
#
*
: 12.21%
: 0.87
: 0.88
: 1.01
: 0.68
: 2.56%
: 1.76%
Fund Manager
Mr. Tanmaya Desai
Jun-2011
Managing Since
Total Experience
Over 5 years
Benchmark
S&P BSE HEALTH CARE Index
#Source: CRISIL Fund Analyser
*Portfolio Turnover = lower of total sale or totalpurchase for the last 12 months upon Avg. AUMof trailing twelve months.Risk Free rate: 91- days Treasury Bill yield(8.83% as on 30th April,14). Basis for RatioCalculation: 3 years Monthly Data
Report As On
30/04/2014
TOP 10 HOLDINGS
For complete list of holdings please visit our website www.sbimf.com
Stock Name (%) OfTotal AUM
SUN PHARMACEUTICAL INDUSTRIES LIMITED 24.62%
DR.REDDY'S LABORATORIES LIMITED 12.30%
LUPIN LIMITED 11.58%
DIVIS LABORATORY LIMTIED 7.47%
IPCA LABORATORIES LTD 5.81%
CADILLA HEALTHCARE LIMITED 5.30%
GLENMARK PHARMACEUTICAL LIMITED 4.58%
RANBAXY LABORATORIES LIMITED 4.09%
AUROBINDO PHARMA LIMITED 3.73%
ALEMBIC PHARMACEUTICALS LTD 3.09%
Total 82.58%
ASSET ALLOCATION
Cash & Other CurrentAssets
SECTORAL BREAKDOWN (in %)
AAUM for quarter ended Mar 31, 2014
` 205.63 Crores
An Open-ended Equity Fund
Plans Available
Regular
Direct
(Previously known as SBI MSFU - PharmaFund)
Option NAV ( )`
Reg-Plan-Growth 82.7536
Reg-Plan-Dividend 68.4043
Dir-Plan-Dividend 68.9007
Dir-Plan-Growth 83.5436
NET ASSET VALUE
SBI Pharma FundThis product is suitable for investors who are seeking^:
• Long term investment
Equity Investments in stock of Pharmaceuticals sector of the economy to provide sector specific growth
opportunities.
High risk. (Brown)
•
•
^Investors should consult their financial advisers if in doubt about whether the product is suitable for them.
Note: Risk may be represented as: Investor understand that their principal will be atLow risk. (Blue); Medium risk. (Yellow); High risk. (Brown)
Minimum Investment
` `5000 & in multiples of 1
Additional Investment
` `1000 & in multiples of 1
SIPMonthly - Minimum 1000 & inmultiples of 1 thereafter forminimum six months (or) minimum500 & in multiples of 1 thereafterfor minimum one yearQuarterly - Minimum 1500 & inmultiples of 1 thereafter forminimum one year
`
`
`
`
`
`
Large Cap
Small Cap
9
98.12
0 20 40 60 80 100 120
PHARMA
75.83%
15.29%
4.85%4.03%
Investment Objective
To provide the investors maximum growth
opportunity through equity investments in
stocks of growth oriented sectors of the
economy. There are four sub-funds
dedicated to specific investment themes viz.
Information Technology, Pharmaceuticals,
FMCG, Contrarian (investment in stocks
currently out of favour) and Emerging
Businesses.
Date of Inception
14/07/1999
Entry Load
N.A.
Options
Growth
Dividend
Exit Load
Nil
Quantitative Data
Standard Deviation
Beta
R- Squared
Sharpe Ratio
Portfolio Turnover
Total Expense Ratio
Regular
Direct
#
#
#
#
*
: 22.14%
: 0.86
: 0.98
: 0.34
: 0.72
: 2.70%
: 2.14%
Fund Manager
Mr. Anup Upadhyay
Jun-2011
Managing Since
Total Experience
Over 5 years
Benchmark
S&P BSE - IT Index
#Source: CRISIL Fund Analyser
*Portfolio Turnover = lower of total sale or totalpurchase for the last 12 months upon Avg. AUMof trailing twelve months.Risk Free rate: 91- days Treasury Bill yield(8.83% as on 30th April,14). Basis for RatioCalculation: 3 years Monthly Data
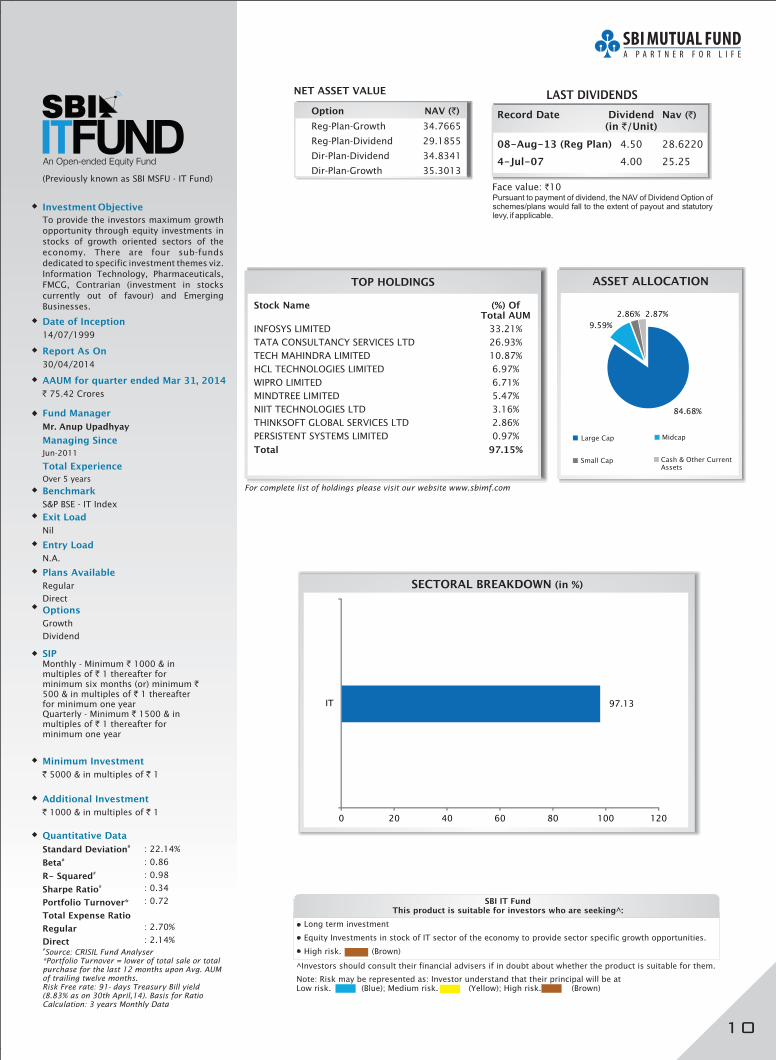
Option NAV ( )`
Reg-Plan-Growth 34.7665
Reg-Plan-Dividend 29.1855
Dir-Plan-Dividend 34.8341
Dir-Plan-Growth 35.3013
NET ASSET VALUE
Report As On
30/04/2014
SECTORAL BREAKDOWN (in %)
TOP HOLDINGS
For complete list of holdings please visit our website www.sbimf.com
Stock Name (%) OfTotal AUM
INFOSYS LIMITED 33.21
TATA CONSULTANCY SERVICES LTD 26.93
TECH MAHINDRA LIMITED 10.87
HCL TECHNOLOGIES LIMITED 6.97
WIPRO LIMITED 6.71
MINDTREE LIMITED 5.47%
NIIT TECHNOLOGIES LTD 3.16
THINKSOFT GLOBAL SERVICES LTD 2.86
PERSISTENT SYSTEMS LIMITED 0.97%
%
%
%
%
%
%
%
Total 97.15%
ASSET ALLOCATION
AAUM for quarter ended Mar 31, 2014
` 75.42 Crores
An Open-ended Equity Fund
Plans Available
Regular
Direct
(Previously known as SBI MSFU - IT Fund)
Record Date Dividend Nav(in /Unit)
08-Aug-13 (Reg Plan)
4-Jul-07
( )`
`
4.50 28.6220
4.00 25.25
LAST DIVIDENDS
Face value: 10`
SBI IT FundThis product is suitable for investors who are seeking^:
• Long term investment
Equity Investments in stock of IT sector of the economy to provide sector specific growth opportunities.
High risk. (Brown)
•
•
^Investors should consult their financial advisers if in doubt about whether the product is suitable for them.
Pursuant to payment of dividend, the NAV of Dividend Option ofschemes/plans would fall to the extent of payout and statutorylevy, if applicable.
Note: Risk may be represented as: Investor understand that their principal will be atLow risk. (Blue); Medium risk. (Yellow); High risk. (Brown)
Minimum Investment
` `5000 & in multiples of 1
Additional Investment
` `1000 & in multiples of 1
SIPMonthly - Minimum 1000 & inmultiples of 1 thereafter forminimum six months (or) minimum500 & in multiples of 1 thereafterfor minimum one yearQuarterly - Minimum 1500 & inmultiples of 1 thereafter forminimum one year
`
`
`
`
`
`
10
Cash & Other CurrentAssets
Large Cap
Small Cap
97.13
0 20 40 60 80 100 120
IT
84.68%
9.59%
2.86% 2.87%
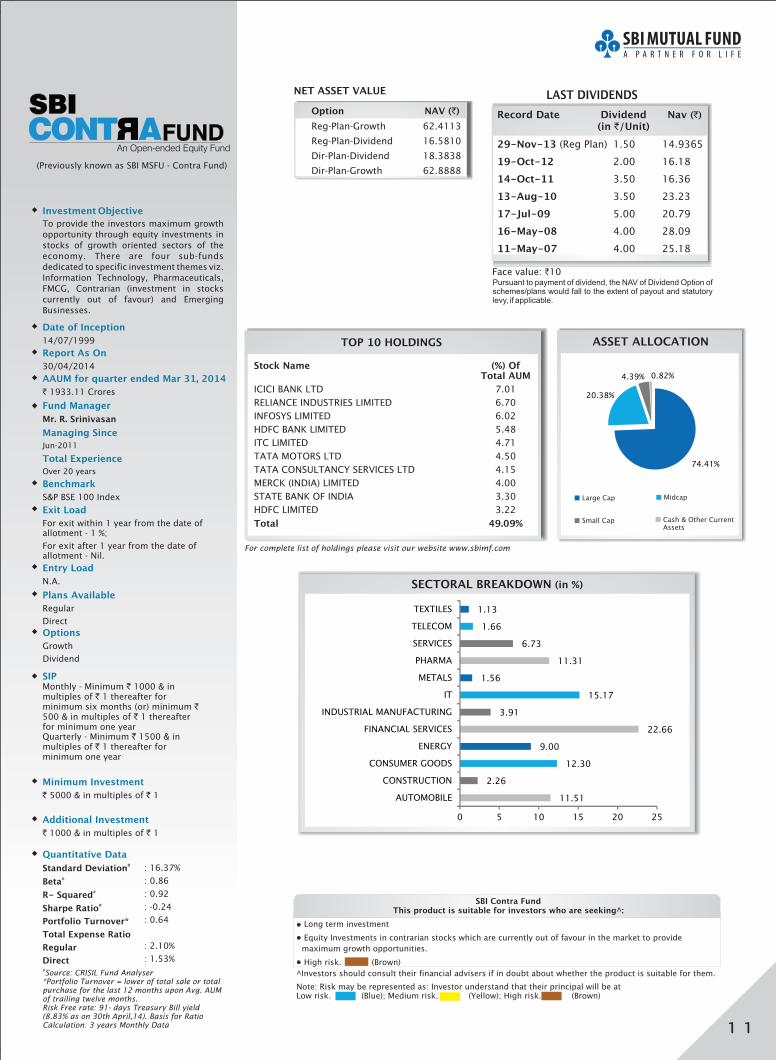
Investment Objective
To provide the investors maximum growth
opportunity through equity investments in
stocks of growth oriented sectors of the
economy. There are four sub-funds
dedicated to specific investment themes viz.
Information Technology, Pharmaceuticals,
FMCG, Contrarian (investment in stocks
currently out of favour) and Emerging
Businesses.
Date of Inception
14/07/1999
Entry Load
N.A.
Options
Growth
Dividend
Exit Load
For exit within 1 year from the date ofallotment - 1 %;
For exit after 1 year from the date ofallotment - Nil.
Quantitative Data
Standard Deviation
Beta
R- Squared
Sharpe Ratio
Portfolio Turnover
Total Expense Ratio
Regular
Direct
#
#
#
#
*
:
:
:
: -0.24
: 0.64
: 2.10%
: 1.53%
16.37%
0.86
0.92
Fund Manager
Mr. R. Srinivasan
Jun-2011
Managing Since
Total Experience
Over 20 years
Benchmark
S&P BSE 100 Index
#Source: CRISIL Fund Analyser
*Portfolio Turnover = lower of total sale or totalpurchase for the last 12 months upon Avg. AUMof trailing twelve months.Risk Free rate: 91- days Treasury Bill yield(8.83% as on 30th April,14). Basis for RatioCalculation: 3 years Monthly Data
Option NAV ( )`
Reg-Plan-Growth 62.4113
Reg-Plan-Dividend 16.5810
Dir-Plan-Dividend 18.3838
Dir-Plan-Growth 62.8888
NET ASSET VALUE
Report As On
30/04/2014
TOP 10 HOLDINGS
For complete list of holdings please visit our website www.sbimf.com
Stock Name (%) OfTotal AUM
ICICI BANK LTD 7.01
RELIANCE INDUSTRIES LIMITED 6.70
INFOSYS LIMITED 6.02
HDFC BANK LIMITED 5.48
ITC LIMITED 4.71
TATA MOTORS LTD 4.50
TATA CONSULTANCY SERVICES LTD 4.15
MERCK (INDIA) LIMITED 4.00
STATE BANK OF INDIA 3.30
HDFC LIMITED 3.22
Total 49.09%
ASSET ALLOCATION
Large Cap
Small Cap
Midcap
Cash & Other CurrentAssets
SECTORAL BREAKDOWN (in %)
AAUM for quarter ended Mar 31, 2014
` 1933.11 Crores
An Open-ended Equity Fund
Plans Available
Regular
Direct
(Previously known as SBI MSFU - Contra Fund)
Record Date Dividend Nav(in /Unit)
29-Nov-13
19-Oct-12
14-Oct-11
13-Aug-10
17-Jul-09
16-May-08
11-May-07
( )`
`
(Reg Plan) 1.50 14.9365
2.00 16.18
3.50 16.36
3.50 23.23
5.00 20.79
4.00 28.09
4.00 25.18
LAST DIVIDENDS
Face value: 10`
SBI Contra FundThis product is suitable for investors who are seeking^:
• Long term investment
Equity Investments in contrarian stocks which are currently out of favour in the market to provide
maximum growth opportunities.
High risk. (Brown)
•
•
^Investors should consult their financial advisers if in doubt about whether the product is suitable for them.
Pursuant to payment of dividend, the NAV of Dividend Option ofschemes/plans would fall to the extent of payout and statutorylevy, if applicable.
Note: Risk may be represented as: Investor understand that their principal will be atLow risk. (Blue); Medium risk. (Yellow); High risk. (Brown)
Minimum Investment
` `5000 & in multiples of 1
Additional Investment
` `1000 & in multiples of 1
SIPMonthly - Minimum 1000 & inmultiples of 1 thereafter forminimum six months (or) minimum500 & in multiples of 1 thereafterfor minimum one yearQuarterly - Minimum 1500 & inmultiples of 1 thereafter forminimum one year
`
`
`
`
`
`
11
74.41%
20.38%
4.39% 0.82%
11.51
2.26
12.30
9.00
22.66
3.91
15.17
1.56
11.31
6.73
1.66
1.13
0 5 10 15 20 25
AUTOMOBILE
CONSTRUCTION
CONSUMER GOODS
ENERGY
FINANCIAL SERVICES
INDUSTRIAL MANUFACTURING
IT
METALS
PHARMA
SERVICES
TELECOM
TEXTILES
Investment Objective
To provide investors with opportunities for
long-term growth in capital along with the
liquidity of an open-ended scheme through
an active management of investments in a
diversified basket of equity stocks spanning
the entire market capitalization spectrum
and in debt and money market instruments.
Date of Inception
29/09/2005
Entry Load
N.A.
Options
Growth
Dividend
Exit Load
For exit within 1 year from the date ofallotment - 1 %;
For exit after 1 year from the date ofallotment - Nil
Quantitative Data
Standard Deviation
Beta
R- Squared
Sharpe Ratio
Portfolio Turnover
Total Expense Ratio
Regular
Direct
#
#
#
#
*
:
:
:
: -0.09
: 0.56
17.55%
0.93
0.96
: 2.52%
: 1.87%
Fund Manager
Mr. Richard D'souza
Dec-2011
Over 19 years
Managing Since
Total Experience
Benchmark
S&P BSE 500 Index
#Source: CRISIL Fund Analyser
*Portfolio Turnover = lower of total sale or totalpurchase for the last 12 months upon Avg. AUMof trailing twelve months.Risk Free rate: 91- days Treasury Bill yield(8.83% as on 30th April,14). Basis for RatioCalculation: 3 years Monthly Data
Report As On
30/04/2014
TOP 10 HOLDINGS
For complete list of holdings please visit our website www.sbimf.com
Stock Name (%) OfTotal AUM
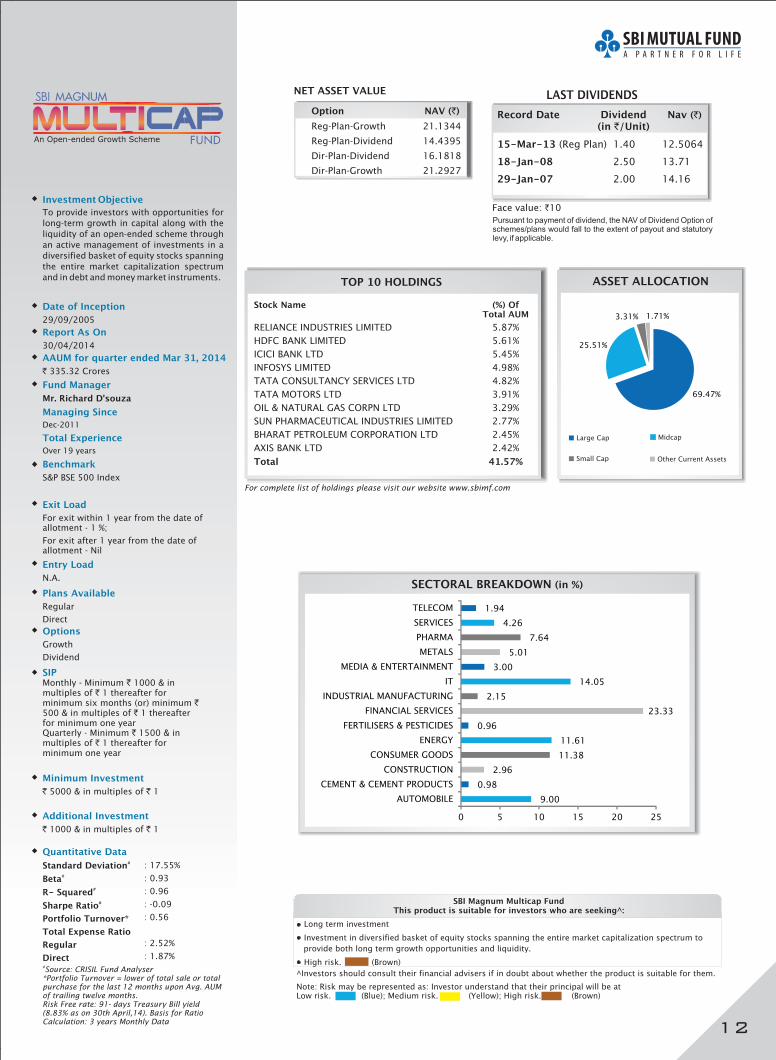
RELIANCE INDUSTRIES LIMITED 5.87
HDFC BANK LIMITED 5.61
ICICI BANK LTD 5.45
INFOSYS LIMITED 4.98
TATA CONSULTANCY SERVICES LTD 4.82
TATA MOTORS LTD 3.91
OIL & NATURAL GAS CORPN LTD 3.29
SUN PHARMACEUTICAL INDUSTRIES LIMITED 2.77
BHARAT PETROLEUM CORPORATION LTD 2.45
AXIS BANK LTD 2.42%
%
%
%
%
%
%
%
%
%
Total 41.57%
ASSET ALLOCATION
SECTORAL BREAKDOWN (in %)
AAUM for quarter ended Mar 31, 2014
` 335.32 Crores
Large Cap
Small Cap
Midcap
Other Current Assets
Plans Available
Regular
Direct
Option NAV ( )`
Reg-Plan-Growth 21.1344
Reg-Plan-Dividend 14.4395
Dir-Plan-Dividend 16.1818
Dir-Plan-Growth 21.2927
NET ASSET VALUE
Record Date Dividend Nav(in /Unit)
15-Mar-13
18-Jan-08
29-Jan-07
( )`
`
(Reg Plan) 1.40 12.5064
2.50 13.71
2.00 14.16
LAST DIVIDENDS
Face value: 10`
SBI Magnum Multicap FundThis product is suitable for investors who are seeking^:
• Long term investment
Investment in diversified basket of equity stocks spanning the entire market capitalization spectrum to
provide both long term growth opportunities and liquidity.
High risk. (Brown)
•
•
^Investors should consult their financial advisers if in doubt about whether the product is suitable for them.
Pursuant to payment of dividend, the NAV of Dividend Option ofschemes/plans would fall to the extent of payout and statutorylevy, if applicable.
Note: Risk may be represented as: Investor understand that their principal will be atLow risk. (Blue); Medium risk. (Yellow); High risk. (Brown)
Minimum Investment
` `5000 & in multiples of 1
Additional Investment
` `1000 & in multiples of 1
SIPMonthly - Minimum 1000 & inmultiples of 1 thereafter forminimum six months (or) minimum500 & in multiples of 1 thereafterfor minimum one yearQuarterly - Minimum 1500 & inmultiples of 1 thereafter forminimum one year
`
`
`
`
`
`
12
69.47%
25.51%
3.31% 1.71%
9.00
0.98
2.96
11.38
11.61
0.96
23.33
2.15
14.05
3.00
5.01
7.64
4.26
1.94
0 5 10 15 20 25
AUTOMOBILE
CEMENT & CEMENT PRODUCTS
CONSTRUCTION
CONSUMER GOODS
ENERGY
FERTILISERS & PESTICIDES
FINANCIAL SERVICES
INDUSTRIAL MANUFACTURING
IT
MEDIA & ENTERTAINMENT
METALS
PHARMA
SERVICES
TELECOM
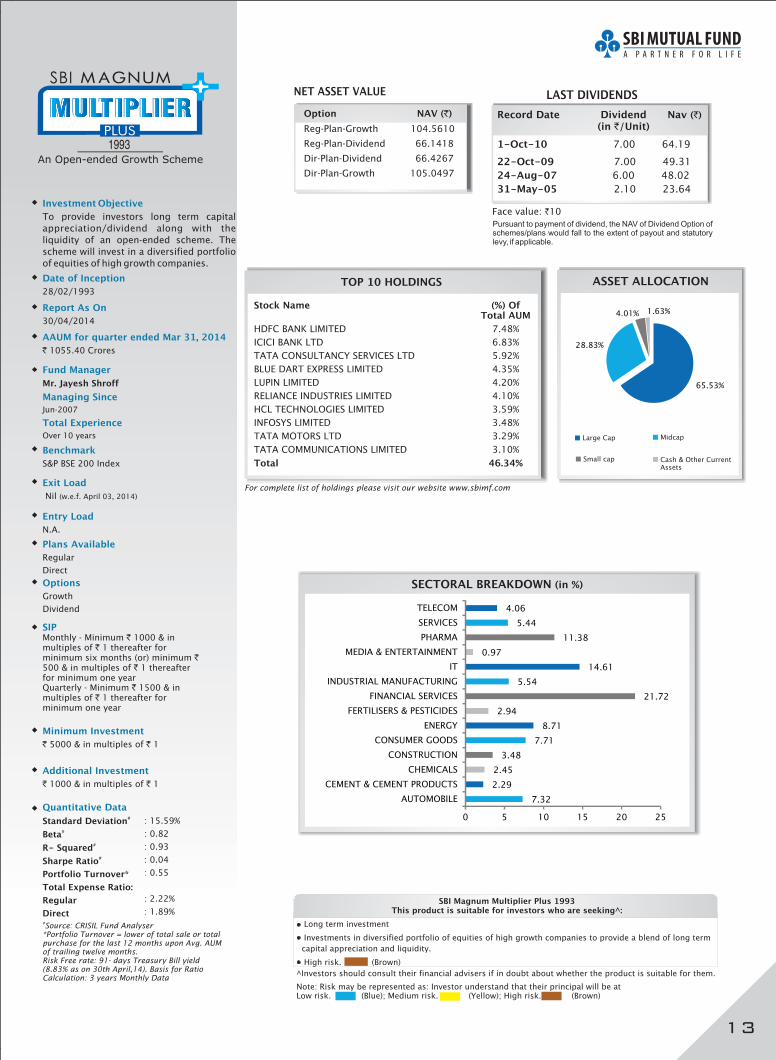
Investment Objective
To provide investors long term capital
appreciation/dividend along with the
liquidity of an open-ended scheme. The
scheme will invest in a diversified portfolio
of equities of high growth companies.
Date of Inception
28/02/1993
Entry Load
N.A.
Options
Growth
Dividend
Exit Load
Nil (w.e.f. April 03, 2014)
Quantitative Data
Standard Deviation
Beta
R- Squared
Sharpe Ratio
Portfolio Turnover
Total Expense Ratio:
Regular
Direct
#
#
#
#
*
:
:
:
: 0.04
:
15.59%
0.82
0.93
0.55
: 2.22%
: 1.89%
Fund Manager
Mr. Jayesh Shroff
Jun-2007
Managing Since
Total Experience
Over 10 years
Benchmark
S&P BSE 200 Index
#Source: CRISIL Fund Analyser
*Portfolio Turnover = lower of total sale or totalpurchase for the last 12 months upon Avg. AUMof trailing twelve months.Risk Free rate: 91- days Treasury Bill yield(8.83% as on 30th April,14). Basis for RatioCalculation: 3 years Monthly Data
Report As On
30/04/2014
TOP 10 HOLDINGS
For complete list of holdings please visit our website www.sbimf.com
Stock Name (%) OfTotal AUM
HDFC BANK LIMITED 7.48
ICICI BANK LTD 6.83
TATA CONSULTANCY SERVICES LTD 5.92
BLUE DART EXPRESS LIMITED 4.35
LUPIN LIMITED 4.20
RELIANCE INDUSTRIES LIMITED 4.10
HCL TECHNOLOGIES LIMITED 3.59
INFOSYS LIMITED 3.48
TATA MOTORS LTD 3.29
TATA COMMUNICATIONS LIMITED 3.10%
%
%
%
%
%
%
%
%
%
Total 46.34%
ASSET ALLOCATION
Large Cap Midcap
Small cap Cash & Other CurrentAssets
SECTORAL BREAKDOWN (in %)
AAUM for quarter ended Mar 31, 2014
` 1055.40 Crores
Plans Available
Regular
Direct
Option NAV ( )`
Reg-Plan-Growth 104.5610
Reg-Plan-Dividend 66.1418
Dir-Plan-Dividend 66.4267
Dir-Plan-Growth 105.0497
NET ASSET VALUE
Record Date Dividend Nav(in /Unit)
1-Oct-10
22-Oct-09
24-Aug-07
31-May-05
( )`
`
7.00 64.19
7.00 49.31
6.00 48.02
2.10 23.64
LAST DIVIDENDS
Face value: 10`
SBI Magnum Multiplier Plus 1993This product is suitable for investors who are seeking^:
• Long term investment
Investments in diversified portfolio of equities of high growth companies to provide a blend of long term
capital appreciation and liquidity.
High risk. (Brown)
•
•
^Investors should consult their financial advisers if in doubt about whether the product is suitable for them.
Pursuant to payment of dividend, the NAV of Dividend Option ofschemes/plans would fall to the extent of payout and statutorylevy, if applicable.
Note: Risk may be represented as: Investor understand that their principal will be atLow risk. (Blue); Medium risk. (Yellow); High risk. (Brown)
Minimum Investment
` `5000 & in multiples of 1
Additional Investment
` `1000 & in multiples of 1
SIPMonthly - Minimum 1000 & inmultiples of 1 thereafter forminimum six months (or) minimum500 & in multiples of 1 thereafterfor minimum one yearQuarterly - Minimum 1500 & inmultiples of 1 thereafter forminimum one year
`
`
`
`
`
`
13
65.53%
28.83%
4.01% 1.63%
7.32
2.29
2.45
3.48
7.71
8.71
2.94
21.72
5.54
14.61
0.97
11.38
5.44
4.06
0 5 10 15 20 25
AUTOMOBILE
CEMENT & CEMENT PRODUCTS
CHEMICALS
CONSTRUCTION
CONSUMER GOODS
ENERGY
FERTILISERS & PESTICIDES
FINANCIAL SERVICES
INDUSTRIAL MANUFACTURING
IT
MEDIA & ENTERTAINMENT
PHARMA
SERVICES
TELECOM
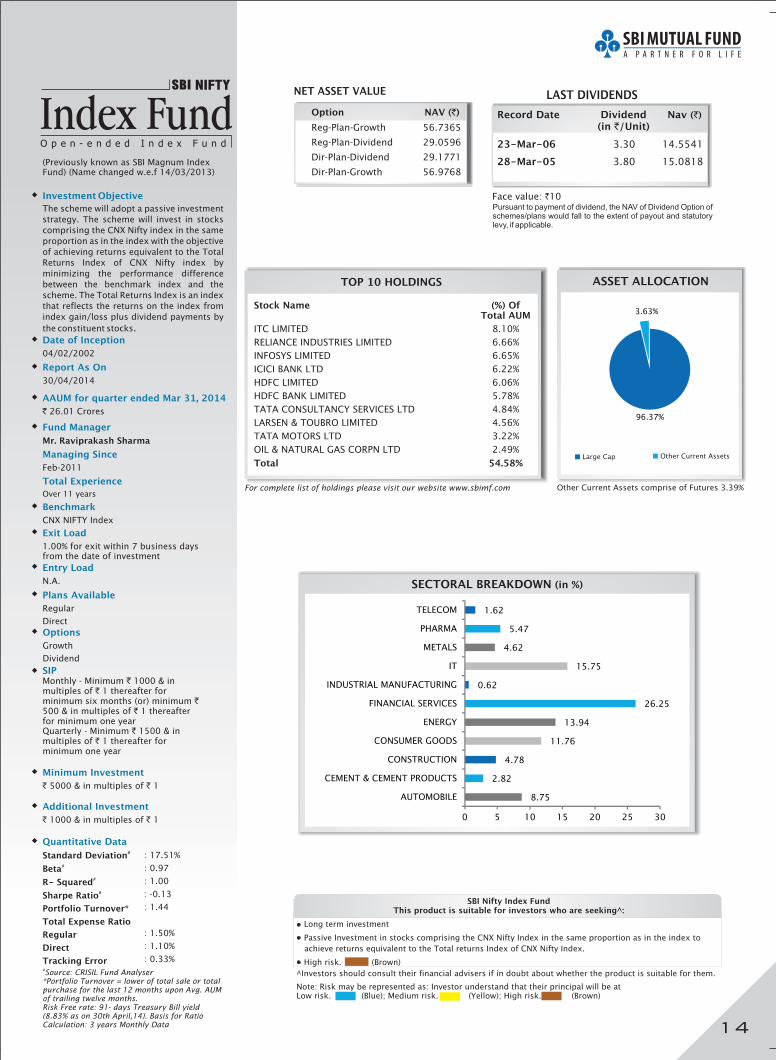
Date of Inception
04/02/2002
Investment Objective
The scheme will adopt a passive investment
strategy. The scheme will invest in stocks
comprising the CNX Nifty index in the same
proportion as in the index with the objective
of achieving returns equivalent to the Total
Returns Index of CNX Nifty index by
minimizing the performance difference
between the benchmark index and the
scheme. The Total Returns Index is an index
that reflects the returns on the index from
index gain/loss plus dividend payments by
the constituent stocks.
Entry Load
N.A.
Options
Growth
Dividend
Exit Load
1.00% for exit within 7 business daysfrom the date of investment
Quantitative Data
Standard Deviation
Beta
R- Squared
Sharpe Ratio
Portfolio Turnover
Total Expense Ratio
Regular
Direct
Tracking Error
#
#
#
#
*
: 17.51%
: 0.97
: 1.00
: -0.13
: 1.44
: 1.50%
: 1.10%
: 0.33%
Fund Manager
Mr. Raviprakash Sharma
Feb-2011
Managing Since
Total Experience
Over 11 years
Benchmark
CNX NIFTY Index
#Source: CRISIL Fund Analyser
*Portfolio Turnover = lower of total sale or totalpurchase for the last 12 months upon Avg. AUMof trailing twelve months.Risk Free rate: 91- days Treasury Bill yield(8.83% as on 30th April,14). Basis for RatioCalculation: 3 years Monthly Data
Report As On
30/04/2014
TOP 10 HOLDINGS
For complete list of holdings please visit our website www.sbimf.com
Stock Name (%) OfTotal AUM
ITC LIMITED 8.10
RELIANCE INDUSTRIES LIMITED 6.66
INFOSYS LIMITED 6.65
ICICI BANK LTD 6.22
HDFC LIMITED 6.06
HDFC BANK LIMITED 5.78
TATA CONSULTANCY SERVICES LTD 4.84
LARSEN & TOUBRO LIMITED 4.56
TATA MOTORS LTD 3.22
OIL & NATURAL GAS CORPN LTD 2.49%
%
%
%
%
%
%
%
%
%
Total 54.58%
ASSET ALLOCATION
SECTORAL BREAKDOWN (in %)
AAUM for quarter ended 2014Mar 31,
` 26.01 Crores
Plans Available
Regular
Direct
(Previously known as SBI Magnum InFund) (Name changed w.e.f 14/03/2013)
dex
Option NAV ( )`
Reg-Plan-Growth 56.7365
Reg-Plan-Dividend 29.0596
Dir-Plan-Dividend 29.1771
Dir-Plan-Growth 56.9768
NET ASSET VALUE
Other Current Assets comprise of Futures 3.39%
Record Date Dividend Nav(in /Unit)
23-Mar-06
28-Mar-05
( )`
`
3.30 14.5541
3.80 15.0818
LAST DIVIDENDS
Face value: 10`
SBI Nifty Index FundThis product is suitable for investors who are seeking^:
• Long term investment
Passive Investment in stocks comprising the CNX Nifty Index in the same proportion as in the index to
achieve returns equivalent to the Total returns Index of CNX Nifty Index.
High risk. (Brown)
•
•
^Investors should consult their financial advisers if in doubt about whether the product is suitable for them.
Pursuant to payment of dividend, the NAV of Dividend Option ofschemes/plans would fall to the extent of payout and statutorylevy, if applicable.
Note: Risk may be represented as: Investor understand that their principal will be atLow risk. (Blue); Medium risk. (Yellow); High risk. (Brown)
Minimum Investment
` `5000 & in multiples of 1
Additional Investment
` `1000 & in multiples of 1
SIPMonthly - Minimum 1000 & inmultiples of 1 thereafter forminimum six months (or) minimum500 & in multiples of 1 thereafterfor minimum one yearQuarterly - Minimum 1500 & inmultiples of 1 thereafter forminimum one year
`
`
`
`
`
`
14
Large Cap Other Current Assets
96.37%
3.63%
8.75
2.82
4.78
11.76
13.94
26.25
0.62
15.75
4.62
5.47
1.62
0 5 10 15 20 25 30
AUTOMOBILE
CEMENT & CEMENT PRODUCTS
CONSTRUCTION
CONSUMER GOODS
ENERGY
FINANCIAL SERVICES
INDUSTRIAL MANUFACTURING
IT
METALS
PHARMA
TELECOM

Investment Objective
To generate opportunities for growth along
with possibility of consistent returns by
investing predominantly in a portfolio of
stocks of companies engaged in the
commodity business within the following
sectors - Oil & Gas, Metals, Materials &
Agriculture and in debt & money market
instruments.
Date of Inception
08/08/2005
Entry Load
N.A.
Options
Growth
Dividend
Exit Load
For exit within 1 year from the date ofallotment - 1 %;
For exit after 1 year from the date ofallotment - Nil.
Quantitative Data
Standard Deviation
Beta
R- Squared
Sharpe Ratio
Portfolio Turnover
Total Expense Ratio
Regular
Direct
#
#
#
#
*
: 19.80%
: 0.82
: 0.91
: -0.74
: 0.60
: 2.55%
: 1.94%
Fund Manager
Mr. Ajit Dange
Over 16 years
Managing Since
Total Experience
Feb-2011
Benchmark
CNX Commodities Index
#Source: CRISIL Fund Analyser
*Portfolio Turnover = lower of total sale or totalpurchase for the last 12 months upon Avg. AUMof trailing twelve months.Risk Free rate: 91- days Treasury Bill yield(8.83% as on 30th April,14). Basis for RatioCalculation: 3 years Monthly Data
Report As On
30/04/2014
TOP 10 HOLDINGS
For complete list of holdings please visit our website www.sbimf.com
Stock Name (%) OfTotal AUM
RELIANCE INDUSTRIES LIMITED 7.76
NTPC LIMITED 7.72
OIL & NATURAL GAS CORPN LTD 6.76
TATA STEEL LTD 4.99
COAL INDIA LIMITED 4.84
USHA MARTIN LIMITED 4.58
SAGAR CEMENTS LIMITED 3.99
OIL INDIA LIMITED 3.96
SESA STERLITE LIMITED 3.84
GUJARAT MINERAL DEVLOPMENT CORPORATION 3.79%
%
%
%
%
%
%
%
%
%
Total 52.23%
ASSET ALLOCATION
AAUM for quarter ended 2014Mar 31,
` 232.18 Crores
Plans Available
Regular
Direct
Option NAV ( )`
Reg-Plan-Growth 19.7812
Reg-Plan-Dividend 13.3597
Dir-Plan-Dividend 13.4762
Dir-Plan-Growth 19.9324
NET ASSET VALUE
SECTORAL BREAKDOWN (in %)
Record Date Dividend Nav(in /Unit)
15-Mar-10
25-Jul-08
27-Nov-06
( )`
`
3.00 16.01
2.00 17.14
1.50 16.18
LAST DIVIDENDS
Face value: 10`
Large Cap
Small Cap
Midcap
Cash & Other CurrentAssets
SBI Magnum Comma Fund
•
•
This product is suitable for investors who are seeking^:
• Long term investment
Equity Investments in a portfolio of stocks of companies engaged in the commodity business within Oil &
Gas, Metals, Materials and Agriculture Sectors of the economy to provide growth and possibility of
consistent returns.
High risk. (Brown)
^Investors should consult their financial advisers if in doubt about whether the product is suitable for them.
Pursuant to payment of dividend, the NAV of Dividend Option ofschemes/plans would fall to the extent of payout and statutorylevy, if applicable.
Note: Risk may be represented as: Investor understand that their principal will be atLow risk. (Blue); Medium risk. (Yellow); High risk. (Brown)
Minimum Investment
` `5000 & in multiples of 1
Additional Investment
` `1000 & in multiples of 1
SIPMonthly - Minimum 1000 & inmultiples of 1 thereafter forminimum six months (or) minimum500 & in multiples of 1 thereafterfor minimum one yearQuarterly - Minimum 1500 & inmultiples of 1 thereafter forminimum one year
`
`
`
`
`
`
15
57.64%
17.42%
22.25%
2.69%
11.18
3.13
5.53
36.29
9.56
32.56
0 10 20 30 40
CEMENT & CEMENT PRODUCTS
CHEMICALS
CONSUMER GOODS
ENERGY
FERTILISERS & PESTICIDES
METALS
Other Current Assets comprise of Futures 0.45%
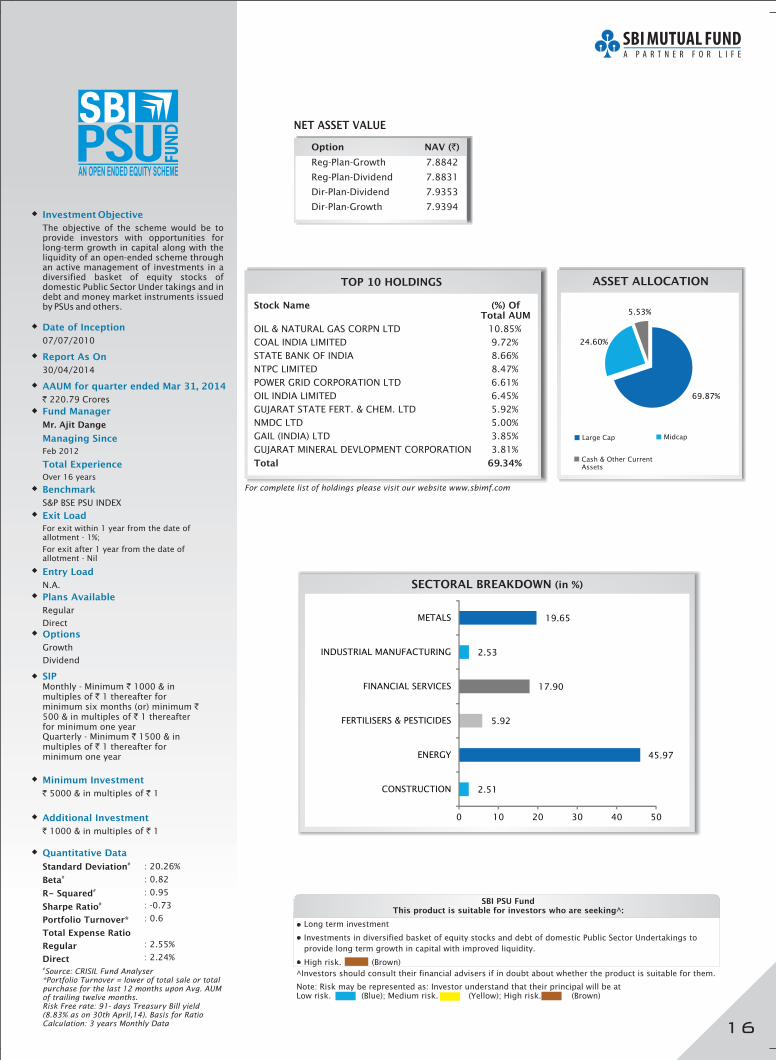
Investment Objective
The objective of the scheme would be toprovide investors with opportunities forlong-term growth in capital along with theliquidity of an open-ended scheme throughan active management of investments in adiversified basket of equity stocks ofdomestic Public Sector Under takings and indebt and money market instruments issuedby PSUs and others.
Date of Inception
07/07/2010
Entry Load
N.A.
Options
Growth
Dividend
Exit Load
For exit within 1 year from the date ofallotment - 1%;
For exit after 1 year from the date ofallotment - Nil
Quantitative Data
Standard Deviation
Beta
R- Squared
Sharpe Ratio
Portfolio Turnover
Total Expense Ratio
Regular
Direct
#
#
#
#
*
: 20.26%
: 0.82
: 0.95
: -0.73
: 0.6
: 2.55%
: 2.24%
Fund Manager
Mr. Ajit Dange
Over 16 years
Managing Since
Total Experience
Feb 2012
Benchmark
S&P BSE PSU INDEX
#Source: CRISIL Fund Analyser
*Portfolio Turnover = lower of total sale or totalpurchase for the last 12 months upon Avg. AUMof trailing twelve months.Risk Free rate: 91- days Treasury Bill yield(8.83% as on 30th April,14). Basis for RatioCalculation: 3 years Monthly Data
Report As On
30/04/2014
SECTORAL BREAKDOWN (in %)
TOP 10 HOLDINGS
For complete list of holdings please visit our website www.sbimf.com
Stock Name (%) OfTotal AUM
OIL & NATURAL GAS CORPN LTD 10.85
COAL INDIA LIMITED 9.72
STATE BANK OF INDIA 8.66
NTPC LIMITED 8.47
POWER GRID CORPORATION LTD 6.61
OIL INDIA LIMITED 6.45
GUJARAT STATE FERT. & CHEM. LTD 5.92
NMDC LTD 5.00
GAIL (INDIA) LTD 3.85
GUJARAT MINERAL DEVLOPMENT CORPORATION 3.81%
%
%
%
%
%
%
%
%
%
Total 69.34%
ASSET ALLOCATION
AAUM for quarter ended 2014Mar 31,
` 220.79 Crores
Large Cap Midcap
Cash & Other CurrentAssets
Plans Available
Regular
Direct
Option NAV ( )`
Reg-Plan-Growth 7.8842
Reg-Plan-Dividend 7.8831
Dir-Plan-Dividend 7.9353
Dir-Plan-Growth 7.9394
NET ASSET VALUE
SBI PSU FundThis product is suitable for investors who are seeking^:
• Long term investment
Investments in diversified basket of equity stocks and debt of domestic Public Sector Undertakings to
provide long term growth in capital with improved liquidity.
High risk. (Brown)
•
•
^Investors should consult their financial advisers if in doubt about whether the product is suitable for them.
Note: Risk may be represented as: Investor understand that their principal will be atLow risk. (Blue); Medium risk. (Yellow); High risk. (Brown)
Minimum Investment
` `5000 & in multiples of 1
SIPMonthly - Minimum 1000 & inmultiples of 1 thereafter forminimum six months (or) minimum500 & in multiples of 1 thereafterfor minimum one yearQuarterly - Minimum 1500 & inmultiples of 1 thereafter forminimum one year
`
`
`
`
`
`
Additional Investment
` `1000 & in multiples of 1
16
69.87%
24.60%
5.53%
2.51
45.97
5.92
17.90
2.53
19.65
0 10 20 30 40 50
CONSTRUCTION
ENERGY
FERTILISERS & PESTICIDES
FINANCIAL SERVICES
INDUSTRIAL MANUFACTURING
METALS
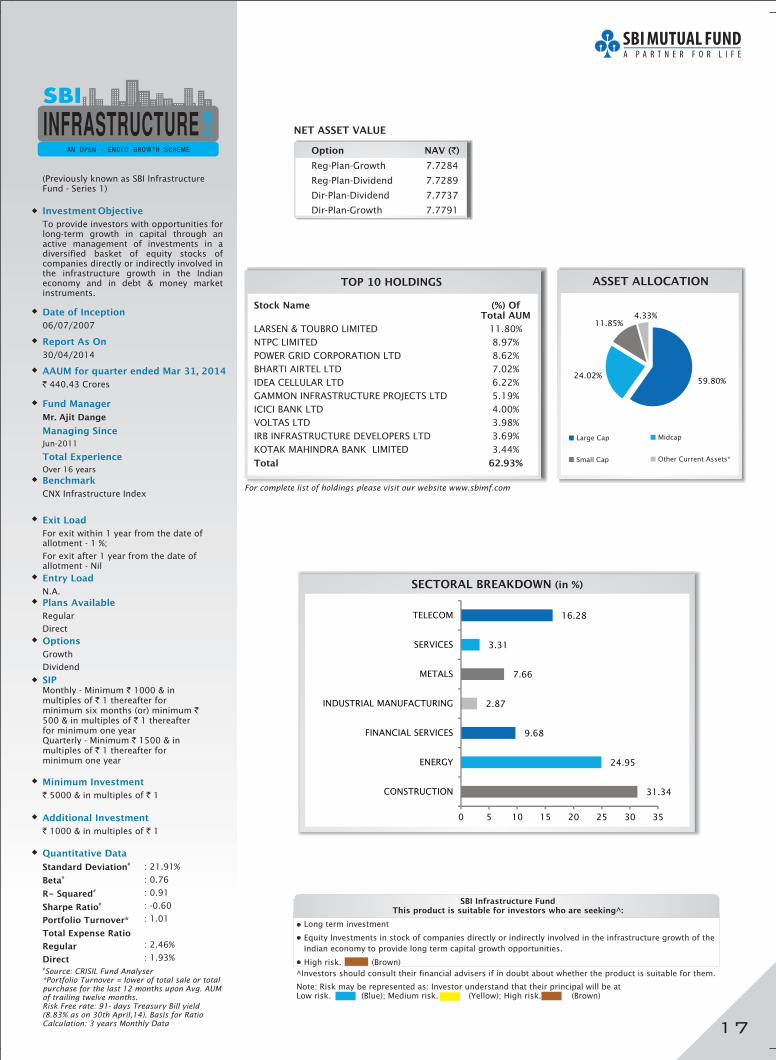
Investment Objective
To provide investors with opportunities forlong-term growth in capital through anactive management of investments in adiversified basket of equity stocks ofcompanies directly or indirectly involved inthe infrastructure growth in the Indianeconomy and in debt & money marketinstruments.
Date of Inception
06/07/2007
Fund Manager
Mr. Ajit Dange
Jun-2011
Managing Since
Total Experience
Over 16 years
Benchmark
CNX Infrastructure Index
Entry Load
N.A.
Options
Growth
Dividend
Exit Load
For exit within 1 year from the date ofallotment - 1 %;
For exit after 1 year from the date ofallotment - Nil
Quantitative Data
Standard Deviation
Beta
R- Squared
Sharpe Ratio
Portfolio Turnover
Total Expense Ratio
Regular
Direct
#
#
#
#
*
: 21.91%
: 0.76
: 0.91
: -0.60
: 1.01
: 2.46%
: 1.93%#Source: CRISIL Fund Analyser
*Portfolio Turnover = lower of total sale or totalpurchase for the last 12 months upon Avg. AUMof trailing twelve months.Risk Free rate: 91- days Treasury Bill yield(8.83% as on 30th April,14). Basis for RatioCalculation: 3 years Monthly Data
Report As On
30/04/2014
TOP 10 HOLDINGS
For complete list of holdings please visit our website www.sbimf.com
Stock Name (%) OfTotal AUM
LARSEN & TOUBRO LIMITED 11.80%
NTPC LIMITED 8.97%
POWER GRID CORPORATION LTD 8.62%
BHARTI AIRTEL LTD 7.02%
IDEA CELLULAR LTD 6.22%
GAMMON INFRASTRUCTURE PROJECTS LTD 5.19%
ICICI BANK LTD 4.00%
VOLTAS LTD 3.98%
IRB INFRASTRUCTURE DEVELOPERS LTD 3.69%
KOTAK MAHINDRA BANK LIMITED 3.44%
Total 62.93%
ASSET ALLOCATION
Large Cap Midcap
Other Current Assets*Small Cap
SECTORAL BREAKDOWN (in %)
AAUM for quarter ended 2014Mar 31,
` 440.43 Crores
AN OPEN - ENDED GROWTH SCHEME
Plans Available
Regular
Direct
(Previously known as SBI InfrastructureFund - Series 1)
Option NAV ( )`
Reg-Plan-Growth 7.7284
Reg-Plan-Dividend 7.7289
Dir-Plan-Dividend 7.7737
Dir-Plan-Growth 7.7791
NET ASSET VALUE
SBI Infrastructure FundThis product is suitable for investors who are seeking^:
• Long term investment
Equity Investments in stock of companies directly or indirectly involved in the infrastructure growth of the
Indian economy to provide long term capital growth opportunities.
High risk. (Brown)
•
•
^Investors should consult their financial advisers if in doubt about whether the product is suitable for them.
Note: Risk may be represented as: Investor understand that their principal will be atLow risk. (Blue); Medium risk. (Yellow); High risk. (Brown)
Minimum Investment
` `5000 & in multiples of 1
SIPMonthly - Minimum 1000 & inmultiples of 1 thereafter forminimum six months (or) minimum500 & in multiples of 1 thereafterfor minimum one yearQuarterly - Minimum 1500 & inmultiples of 1 thereafter forminimum one year
`
`
`
`
`
`
Additional Investment
` `1000 & in multiples of 1
17
59.80%24.02%
11.85%4.33%
31.34
24.95
9.68
2.87
7.66
3.31
16.28
0 5 10 15 20 25 30 35
CONSTRUCTION
ENERGY
FINANCIAL SERVICES
INDUSTRIAL MANUFACTURING
METALS
SERVICES
TELECOM

Investment Objective
To provide capital appreciation and regular
income for unit holders by identifying
profitable arbitrage opportunities between
the spot and derivative market segments as
also through investment of surplus cash in
debt and money market instruments.
Date of Inception
03/11/2006
Entry Load
N.A.
Options
Growth
Dividend
Exit Load
For exit within 7 business days from thedate of allotment - 0.25%;
For exit after 7 business days from thedate of allotment - Nil
Fund Manager
Mr. Neeraj Kumar
Oct-2012
Managing Since
Total Experience
Over 15 years
Benchmark
CRISIL Liquid Fund Index
Quantitative Data
Standard Deviation
Beta
R- Squared
Sharpe Ratio
Portfolio Turnover
Total Expense Ratio
Regular
Direct
#
#
#
#
*
: 0.69%
: 0.10
: 0.01
: -0.36
: 10.64
: 1.32%
: 0.84%#Source: CRISIL Fund Analyser
*Portfolio Turnover = lower of total sale or totalpurchase for the last 12 months upon Avg. AUMof trailing twelve months.Risk Free rate: 91- days Treasury Bill yield(8.83% as on 30th April,14). Basis for RatioCalculation: 3 years Monthly Data
Report As On
30/04/2014
SECTORAL BREAKDOWN (in %)
TOP 10 HOLDINGS
For complete list of holdings please visit our website www.sbimf.com
Stock Name (%) OfTotal AUM
UNITED SPIRITS LTD 10.47%
HDFC BANK LIMITED 9.75%
RELIANCE INDUSTRIES LIMITED 8.57%
LUPIN LIMITED 8.40%
CENTURY TEXTILES AND INDUSTRIES LIMITED 8.34%
GRASIM INDUSTRIES LIMITED 5.94%
PUNJAB NATIONAL BANK 3.62%
TATA STEEL LTD 2.14%
BANK OF INDIA 1.74%
TATA GLOBAL BEVERAGES LIMITED 1.27%
Total 60.24%
ASSET ALLOCATION
AAUM for quarter ended 2014Mar 31,
` 116.06 Crores
Plans Available
Regular
Direct
Option NAV ( )`
Reg-Plan-Growth 17.5870
Reg-Plan-Dividend 12.8606
Dir-Plan-Dividend 12.9663
Dir-Plan-Growth 17.6715
NET ASSET VALUE
Total Assets comprise of Futures 66.72%
Record Date Dividend Nav(in /Unit)
15-Apr-14
15-Apr-14
26-Mar-12
19-May-10
17-Dec-09
6-Aug-09
( )`
`
(Reg Plan) 0.60 12.8082
(Dir Plan) 0.60 12.9109
1.40 12.5830
0.10 10.9591
0.10 10.8844
0.15 10.8483
LAST DIVIDENDS
Face value: 10`
Other Current Assets
SBI Arbitrage Opportunities FundThis product is suitable for investors who are seeking^:
• Short term investment
Investments to exploit profitable arbitrage opportunities between the spot and derivative market segments
to provide capital appreciation and regular income.
High risk. (Brown)
•
•
^Investors should consult their financial advisers if in doubt about whether the product is suitable for them.
Large Cap Midcap
Pursuant to payment of dividend, the NAV of Dividend Option ofschemes/plans would fall to the extent of payout and statutorylevy, if applicable.
Note: Risk may be represented as: Investor understand that their principal will be atLow risk. (Blue); Medium risk. (Yellow); High risk. (Brown)
Minimum Investment
` `5000 & in multiples of 1
Additional Investment
` `1000 & in multiples of 1
SIPMonthly - Minimum 1000 & inmultiples of 1 thereafter forminimum six months (or) minimum500 & in multiples of 1 thereafterfor minimum one yearQuarterly - Minimum 1500 & inmultiples of 1 thereafter forminimum one year
`
`
`
`
`
`
18
55.40%
10.89%
33.71%
0.95
14.28
11.74
9.66
16.21
0.54
3.33
8.40
1.18
0 5 10 15 20
AUTOMOBILE
CEMENT & CEMENT PRODUCTS
CONSUMER GOODS
ENERGY
FINANCIAL SERVICES
IT
METALS
PHARMA
TELECOM

Investment Objective
The investment objective of the fund is to
generate growth & capital appreciation by
investing in Equity, Gold ETF and Debt &
Money market instruments.
Date of Inception
08/10/2012
Entry Load
Not Applicable
Exit Load
For exit within one year from the date ofallotment -1%
For exit after one year from the date ofallotment – Nil
Fund Manager
Mr. Dinesh Balachandran (For Debt & GoldETF) &
Mr. Ruchit Mehta (Equity & Equity ETF).
Mr. Dinesh Balachandran
Mr. Ruchit Mehta
Over 11 years
Over 7 years
Managing Since
Total Experience
Oct - 2012
Benchmark
S&P BSE Sensex 33%, Crisil BondFund Index 33%, Price of Gold 33%
Composite
Option NAV ( )`
SBI EDGE FUND-REG-PLAN-DIV 11.7639
SBI EDGE FUND-DIR-PLAN-DIV 11.8209
SBI EDGE FUND-DIR-PLAN-GR 13.3376
SBI EDGE FUND-REG-PLAN-GR 13.2752
NET ASSET VALUE
Report As On
30/04/2014
TOP HOLDINGS
For complete list of holdings please visit our website www.sbimf.com
Stock Name (%) OfTotal AUM
GOLD ETF
SBI MF 36.19%
DEBT
EQUITY
Total 75.44%
STATE GOVERNMENT OF TAMIL NADU 17.82%
ITC LIMITED 3.30%
INFOSYS LIMITED 2.89%
RELIANCE INDUSTRIES LIMITED 2.89%
ICICI BANK LTD 2.67%
HDFC LIMITED 2.61%
HDFC BANK LIMITED 2.57%
TATA CONSULTANCY SERVICES LTD 2.46%
LARSEN & TOUBRO LIMITED 2.04%
RATINGS BREAKDOWN
AAUM for quarter ended , 2014Mar 31
` 13.25 Crores
Plans Available
Regular
Direct
Options
Growth
Dividend
NCA(Incl. Cash,Deposits)
Quantitative Data
Total Expense Ratio
Regular
Direct
: 1.68%
: 1.40%
ASSET CLASS BREAKDOWN (in %)
SBI EDGE FundThis product is suitable for investors who are seeking^:
• Long term capital appreciation and current income
nvestment in equity and equity related instruments, Gold ETF, as well as fixed income securities (debt and
money market securities).
edium risk.
• I
• M (Yellow)
^Investors should consult their financial advisers if in doubt about whether the product is suitable for them.
Note: Risk may be represented as: Investor understand that their principal will be atLow risk. (Blue); Medium risk. (Yellow); High risk. (Brown)
Minimum Investment
` `5000 & in multiples of 1
Additional Investment
` `1000 & in multiples of 1
SIPMonthly - Minimum 1000 & inmultiples of 1 thereafter forminimum six months (or) minimum500 & in multiples of 1 thereafterfor minimum one yearQuarterly - Minimum 1500 & inmultiples of 1 thereafter forminimum one year
`
`
`
`
`
`
SBI EDGE Fund is created restructuring SBI Magnum Income Plus Fund – Savings Plan & Merging SBI Magnum NRIInvestment Fund – Flexi Asset Plan into SBI EDGE Fund
19
SOV,AAA and Equivalent
17.82%
12.16%
17.82
33.83
36.19
12.16
0 5 10 15 20 25 30 35 40
DATED GOVT SECURITIES
EQUITY SHARES
GOLD ETF
NCA/CBLO/REVERSE REPO
Scheme has invested upto 70.02% in other assets(other than fixed income assets)
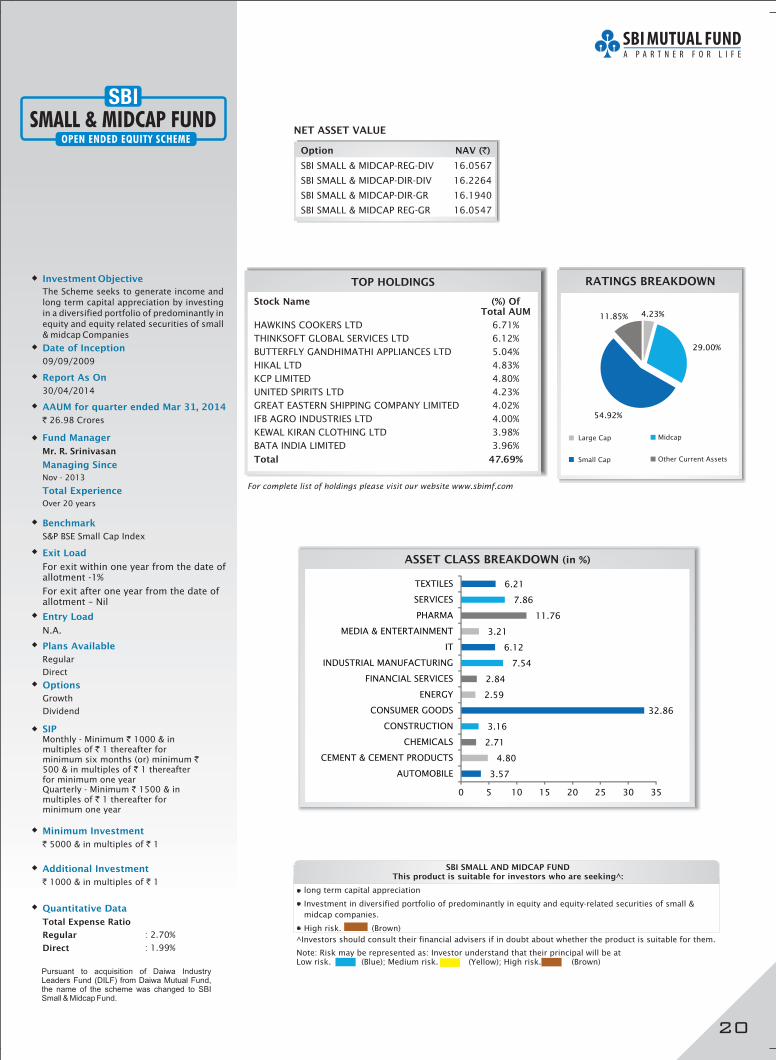
Investment Objective
The Scheme seeks to generate income and
long term capital appreciation by investing
in a diversified portfolio of predominantly in
equity and equity related securities of small
& midcap Companies
Date of Inception
09/09/2009
Entry Load
N.A.
Exit Load
For exit within one year from the date ofallotment -1%
For exit after one year from the date ofallotment – Nil
Fund Manager
Mr. R. Srinivasan
Over 20 years
Managing Since
Total Experience
Nov - 2013
Benchmark
S&P BSE Small Cap Index
Option NAV ( )`
SBI SMALL & MIDCAP-REG-DIV 16.0567
SBI SMALL & MIDCAP-DIR-DIV 16.2264
SBI SMALL & MIDCAP-DIR-GR 16.1940
SBI SMALL & MIDCAP REG-GR 16.0547
NET ASSET VALUE
Report As On
30/04/2014
TOP HOLDINGS
For complete list of holdings please visit our website www.sbimf.com
Stock Name (%) OfTotal AUM
Total 47.69%
HAWKINS COOKERS LTD 6.71%
THINKSOFT GLOBAL SERVICES LTD 6.12%
BUTTERFLY GANDHIMATHI APPLIANCES LTD 5.04%
HIKAL LTD 4.83%
KCP LIMITED 4.80%
UNITED SPIRITS LTD 4.23%
GREAT EASTERN SHIPPING COMPANY LIMITED 4.02%
IFB AGRO INDUSTRIES LTD 4.00%
KEWAL KIRAN CLOTHING LTD 3.98%
BATA INDIA LIMITED 3.96%
RATINGS BREAKDOWN
AAUM for quarter ended , 2014Mar 31
` 26.98 Crores
Plans Available
Regular
Direct
Options
Growth
Dividend
Quantitative Data
Total Expense Ratio
Regular
Direct
: 2.70%
: 1.99%
ASSET CLASS BREAKDOWN (in %)
SBI SMALL AND MIDCAP FUNDThis product is suitable for investors who are seeking^:
• long term capital appreciation
risk.
• Investment in diversified portfolio of predominantly in equity and equity-related securities of small &
midcap companies.
• High (Brown)
^Investors should consult their financial advisers if in doubt about whether the product is suitable for them.
Note: Risk may be represented as: Investor understand that their principal will be atLow risk. (Blue); Medium risk. (Yellow); High risk. (Brown)
Minimum Investment
` `5000 & in multiples of 1
Additional Investment
` `1000 & in multiples of 1
SIPMonthly - Minimum 1000 & inmultiples of 1 thereafter forminimum six months (or) minimum500 & in multiples of 1 thereafterfor minimum one yearQuarterly - Minimum 1500 & inmultiples of 1 thereafter forminimum one year
`
`
`
`
`
`
Large Cap Midcap
Other Current AssetsSmall Cap
20
Pursuant to acquisition of Daiwa IndustryLeaders Fund (DILF) from Daiwa Mutual Fund,the name of the scheme was changed to SBISmall & Midcap Fund.
3.57
4.80
2.71
3.16
32.86
2.59
2.84
7.54
6.12
3.21
11.76
7.86
6.21
0 5 10 15 20 25 30 35
AUTOMOBILE
CEMENT & CEMENT PRODUCTS
CHEMICALS
CONSTRUCTION
CONSUMER GOODS
ENERGY
FINANCIAL SERVICES
INDUSTRIAL MANUFACTURING
IT
MEDIA & ENTERTAINMENT
PHARMA
SERVICES
TEXTILES
4.23%
29.00%
11.85%
54.92%


Debt and Liquid Schemes SnapshotFund Name
Type of theScheme
Inception Date
Fund Manager
Managing Since
IdealInvestmentHorizon
MinimumInvestmentAmount
AdditionalInvestmentAmount
Exit Load
OptionsAvailable
SIP (MinimumAmount)
SIP Dates
Benchmark
Please consult your financial advisor before investing.
*Monthly Income is not assured and is subject to the availability of distributable surplus.
SBI Ultra ShortTerm Debt Fund
An Open-endedIncome Scheme
27/7/2007
Mr. RajeevRadhakrishnan
Jun-2008
1 Week +
``
5,000 & inmultiples of 1
``
1,000 & inmultiples of 1
NIL
Growth,Dividend
Monthly - Minimum1000 & in
multiples of 1thereafter forminimum sixmonths (or)
minimum 500 & inmultiples of 1thereafter for
minimum one year
Quarterly -Minimum 1500 &in multiples of 1
thereafter forminimum one year
``
``
``
5th/10th/15th/20th/25th/30th (in
case of Februarylast business day)
CRISIL LiquidFund Index
SBI Short TermDebt Fund
An Open-endedIncome Scheme
27/7/2007
Mr. RajeevRadhakrishnan
Jun-2008
6 Month +
``
5,000 & inmultiples of 1
``
1,000 & inmultiples of 1
For exit within 90days from the date
of allotment -0.25%, For exit
after 90 Days fromthe date of
allotment - Nil
Growth,Dividend
Monthly - Minimum1000 & in
multiples of 1thereafter forminimum sixmonths (or)
minimum 500 & inmultiples of 1thereafter for
minimum one year
Quarterly -Minimum 1500 &in multiples of 1
thereafter forminimum one year
``
``
``
5th/10th/15th/20th/25th/30th (in
case of Februarylast business day)
CRISIL ShortTerm Bond Fund
Index
SBI MagnumMonthly Income
Plan*
An Open-endedDebt Fund
09/04/2001
Mr. Ruchit Mehta-Equity
Mr. Dinesh Ahuja-Debt
July-2011
1 Year +
``
5,000 & inmultiples of 1
``
1,000 & inmultiples of 1
For exit within 1year from the dateof allotment
For 10% ofinvestment : Nil
For remaininginvestment: 1.00%For exit after oneyear from the dateof allotment – Nil(w.e.f. February 13,2014)
•
•
Growth,Dividend
Monthly - Minimum1000 & in
multiples of 1thereafter forminimum sixmonths (or)
minimum 500 & inmultiples of 1thereafter for
minimum one year
Quarterly -Minimum 1500 &in multiples of 1
thereafter forminimum one year
``
``
``
5th/10th/15th/20th/25th/30th (in
case of Februarylast business day)
CRISIL MIPBlended Index
SBI PremierLiquid Fund
An Open-endedLiquid Fund
24/11/2003
Mr. RajeevRadhakrishnan
May-2010
1 Day +
``
50,000 & inmultiples of 1
``
10,000 & inmultiples of 1
NIL
Growth,Dividend
N.A.
N.A.
CRISIL LiquidFund Index
SBI MagnumChildren's
Benefit Plan
An Open-endedIncome Scheme
21/02/2002
Mr. RajeevRadhakrishnan
Jun-2008
3 Year +
``
5,000 & inmultiples of 1
``
1,000 & inmultiples of 1
Within 1 year :3%,Within 2 years
:2%, Within 3 year:1%, above 3years: NIL.
Growth
Monthly - Minimum1000 & in
multiples of 1thereafter forminimum sixmonths (or)
minimum 500 & inmultiples of 1thereafter for
minimum one year,Quarterly -
Minimum 1500 &in multiples of 1
thereafter forminimum one year
``
``
``
5th/10th/15th/20th/25th/30th (in
case of Februarylast business day
CRISIL MIPBlended Index
SBI MagnumIncome Fund
An Open-endedDebt Fund
25/11/1998
Mr. Dinesh Ahuja
Jan-2011
1 Year +
``
5,000 & inmultiples of 1
``
1,000 & inmultiples of 1
For exit within 1year from the dateof allotment
For 10% ofinvestment : Nil
For remaininginvestment: 1.00%For exit after oneyear from the dateof allotment – Nil(w.e.f. February 13,2014)
•
•
Growth,Dividend
Bonus
Monthly - Minimum1000 & in
multiples of 1thereafter forminimum sixmonths (or)
minimum 500 & inmultiples of 1thereafter for
minimum one year,Quarterly -
Minimum 1500 &in multiples of 1
thereafter forminimum one year
``
``
``
5th/10th/15th/20th/25th/30th (in
case of Februarylast business day)
CRISILComposite Bond
Fund Index
SBI MagnumGilt Fund -Short Term
An Open-endedGilt Fund
30/12/2000
Mr. Dinesh Ahuja
Jan-2011
6 Month +
``
5,000 & inmultiples of 1
``
1,000 & inmultiples of 1
CDSC - 0.15% forexit within 15 days
from the date ofinvestment
Growth,Dividend
Monthly - Minimum1000 & in
multiples of 1thereafter forminimum sixmonths (or)
minimum 500 & inmultiples of 1thereafter for
minimum one yearQuarterly -
Minimum 1500 &in multiples of 1
thereafter forminimum one year
``
``
``
5th/10th/15th/20th/25th/30th (in
case of Februarylast business day)
I-Sec Si-BEXIndex
RegularDirect
RegularDirect
RegularDirect
RegularDirect
RegularDirect
RegularDirect
RegularDirect
Plans Available
SBI MagnumGilt Fund - LT
An Open-endedGilt Fund
30/12/2000
Mr. Dinesh Ahuja
Jan-2011
1 Year +
``
5,000 & inmultiples of 1
``
1,000 & inmultiples of 1
For exit within15 days from thedate of allotment- 0.25%; For exit
after 15 daysfrom the date ofallotment - Nil
Growth,Dividend
Monthly -Minimum 1000 &in multiples of 1
thereafter forminimum sixmonths (or)
minimum 500 &in multiples of 1
thereafter forminimum one year
Quarterly -Minimum 1500 &in multiples of 1
thereafter forminimum one year
``
``
``
5th/10th/15th/20th/25th/30th
(in case ofFebruary lastbusiness day)
I-Sec Li-BEXIndex
RegularDirect
21
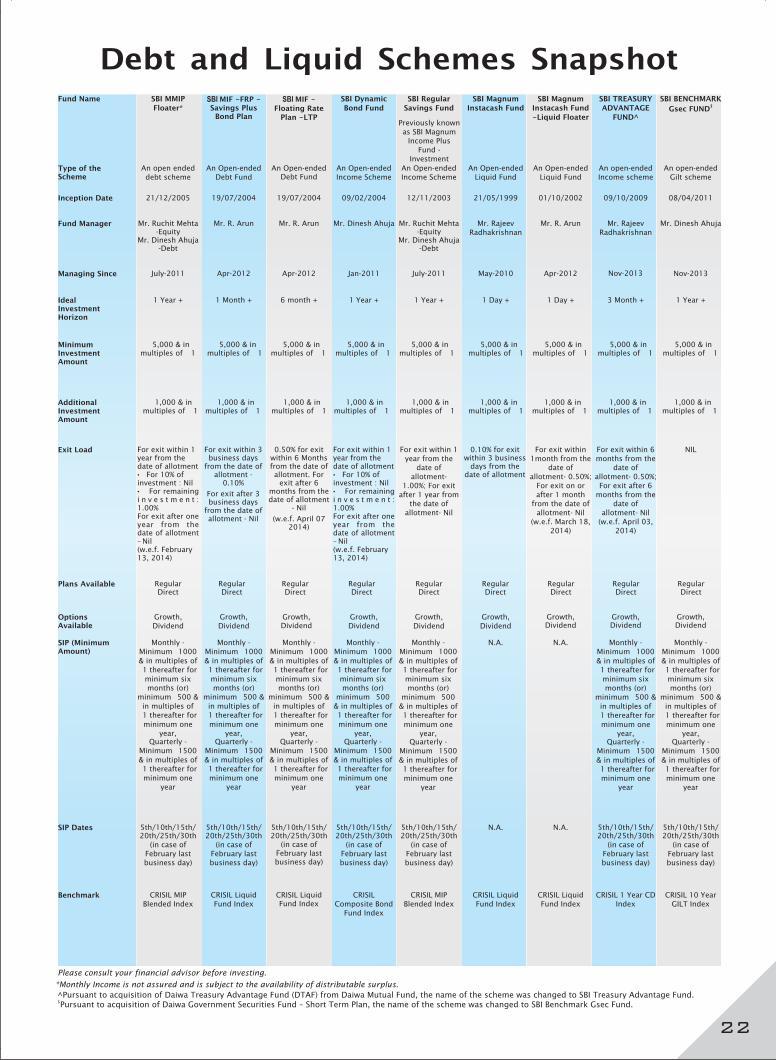
Debt and Liquid Schemes Snapshot
22
Please consult your financial advisor before investing.
Fund Name
Type of theScheme
Inception Date
Fund Manager
Managing Since
IdealInvestmentHorizon
MinimumInvestmentAmount
AdditionalInvestmentAmount
Exit Load
OptionsAvailable
SIP (MinimumAmount)
SIP Dates
Benchmark
SBI MMIPFloater*
An open endeddebt scheme
21/12/2005
Mr. Ruchit Mehta-Equity
Mr. Dinesh Ahuja-Debt
July-2011
1 Year +
``
5,000 & inmultiples of 1
``
1,000 & inmultiples of 1
For exit within 1year from thedate of allotment
For 10% ofinvestment : Nil
For remainingi n v e s t m e n t :1.00%For exit after oneyear from thedate of allotment– Nil(w.e.f. February13, 2014)
•
•
Growth,Dividend
Monthly -Minimum 1000
& in multiples of1 thereafter for
minimum sixmonths (or)
minimum 500 &
in multiples of1 thereafter for
minimum oneyear,
Quarterly -Minimum 1500
& in multiples of1 thereafter for
minimum oneyear
`
`
`
`
`
`
5th/10th/15th/20th/25th/30th
(in case ofFebruary lastbusiness day)
CRISIL MIPBlended Index
SBI MIF -FRP -Savings Plus
Bond Plan
An Open-endedDebt Fund
19/07/2004
Mr. R. Arun
Apr-2012
1 Month +
``
5,000 & inmultiples of 1
``
1,000 & inmultiples of 1
For exit within 3business days
from the date ofallotment -
0.10%
For exit after 3business days
from the date ofallotment - Nil
Growth,Dividend
Monthly -Minimum 1000
& in multiples of1 thereafter for
minimum sixmonths (or)
minimum 500 &
in multiples of1 thereafter for
minimum oneyear,
Quarterly -Minimum 1500
& in multiples of1 thereafter for
minimum oneyear
`
`
`
`
`
`
5th/10th/15th/20th/25th/30th
(in case ofFebruary lastbusiness day)
CRISIL LiquidFund Index
SBI MIF -Floating Rate
Plan -LTP
An Open-endedDebt Fund
19/07/2004
Mr. R. Arun
Apr-2012
6 month +
``
5,000 & inmultiples of 1
``
1,000 & inmultiples of 1
0.50% for exitwithin 6 Monthsfrom the date ofallotment. For
exit after 6months from thedate of allotment
- Nil
(w.e.f. April 072014)
Growth,Dividend
Monthly -Minimum 1000
& in multiples of1 thereafter for
minimum sixmonths (or)
minimum 500 &
in multiples of1 thereafter for
minimum oneyear,
Quarterly -Minimum 1500
& in multiples of1 thereafter for
minimum oneyear
`
`
`
`
`
`
5th/10th/15th/20th/25th/30th
(in case ofFebruary lastbusiness day)
CRISIL LiquidFund Index
SBI DynamicBond Fund
An Open-endedIncome Scheme
09/02/2004
Mr. Dinesh Ahuja
Jan-2011
1 Year +
``
5,000 & inmultiples of 1
``
1,000 & inmultiples of 1
For exit within 1year from thedate of allotment
For 10% ofinvestment : Nil
For remainingi n v e s t m e n t :1.00%For exit after oneyear from thedate of allotment– Nil(w.e.f. February13, 2014)
•
•
Growth,Dividend
Monthly -Minimum 1000
& in multiples of1 thereafter for
minimum sixmonths (or)
minimum 500
& in multiples of1 thereafter for
minimum oneyear,
Quarterly -Minimum 1500
& in multiples of1 thereafter for
minimum oneyear
`
`
`
`
`
`
5th/10th/15th/20th/25th/30th
(in case ofFebruary lastbusiness day)
CRISILComposite Bond
Fund Index
SBI RegularSavings Fund
An Open-endedIncome Scheme
12/11/2003
Mr. Ruchit Mehta-Equity
Mr. Dinesh Ahuja-Debt
July-2011
1 Year +
``
5,000 & inmultiples of 1
``
1,000 & inmultiples of 1
For exit within 1year from the
date ofallotment-
1.00%; For exitafter 1 year from
the date ofallotment- Nil
Growth,Dividend
Monthly -Minimum 1000
& in multiples of1 thereafter for
minimum sixmonths (or)
minimum 500
& in multiples of1 thereafter for
minimum oneyear,
Quarterly -Minimum 1500
& in multiples of1 thereafter for
minimum oneyear
`
`
`
`
`
`
5th/10th/15th/20th/25th/30th
(in case ofFebruary lastbusiness day)
CRISIL MIPBlended Index
SBI MagnumInstacash Fund
An Open-endedLiquid Fund
Previously knownas SBI Magnum
Income PlusFund -
Investment
21/05/1999
Mr. RajeevRadhakrishnan
May-2010
1 Day +
``
5,000 & inmultiples of 1
``
1,000 & inmultiples of 1
0.10% for exitwithin 3 business
days from thedate of allotment
Growth,Dividend
N.A.
N.A.
CRISIL LiquidFund Index
RegularDirect
RegularDirect
RegularDirect
RegularDirect
RegularDirect
RegularDirect
Plans Available
*Monthly Income is not assured and is subject to the availability of distributable surplus.
An Open-endedLiquid Fund
01/10/2002
Mr. R. Arun
Apr-2012
1 Day +
``
5,000 & inmultiples of 1
``
1,000 & inmultiples of 1
For exit within1month from the
date ofallotment- 0.50%;
For exit on orafter 1 month
from the date ofallotment- Nil
(w.e.f. March 18,2014)
Growth,Dividend
N.A.
N.A.
CRISIL LiquidFund Index
RegularDirect
SBI MagnumInstacash Fund-Liquid Floater
An open-endedIncome scheme
09/10/2009
Mr. RajeevRadhakrishnan
Nov-2013
3 Month +
``
5,000 & inmultiples of 1
``
1,000 & inmultiples of 1
For exit within 6months from the
date ofallotment- 0.50%;For exit after 6
months from thedate of
allotment- Nil(w.e.f. April 03,
2014)
Growth,Dividend
Monthly -Minimum 1000
& in multiples of1 thereafter for
minimum sixmonths (or)
minimum 500 &
in multiples of1 thereafter for
minimum oneyear,
Quarterly -Minimum 1500
& in multiples of1 thereafter for
minimum oneyear
`
`
`
`
`
`
5th/10th/15th/20th/25th/30th
(in case ofFebruary lastbusiness day)
CRISIL 1 Year CDIndex
RegularDirect
SBI TREASURYADVANTAGE
FUND^
An open-endedGilt scheme
08/04/2011
Mr. Dinesh Ahuja
Nov-2013
1 Year +
``
5,000 & inmultiples of 1
``
1,000 & inmultiples of 1
NIL
Growth,Dividend
Monthly -Minimum 1000
& in multiples of1 thereafter for
minimum sixmonths (or)
minimum 500 &
in multiples of1 thereafter for
minimum oneyear,
Quarterly -Minimum 1500
& in multiples of1 thereafter for
minimum oneyear
`
`
`
`
`
`
5th/10th/15th/20th/25th/30th
(in case ofFebruary lastbusiness day)
CRISIL 10 YearGILT Index
RegularDirect
SBI BENCHMARK
Gsec FUND$
^Pursuant to acquisition of Daiwa Treasury Advantage Fund (DTAF) from Daiwa Mutual Fund, the name of the scheme was changed to SBI Treasury Advantage Fund.$Pursuant to acquisition of Daiwa Government Securities Fund – Short Term Plan, the name of the scheme was changed to SBI Benchmark Gsec Fund.
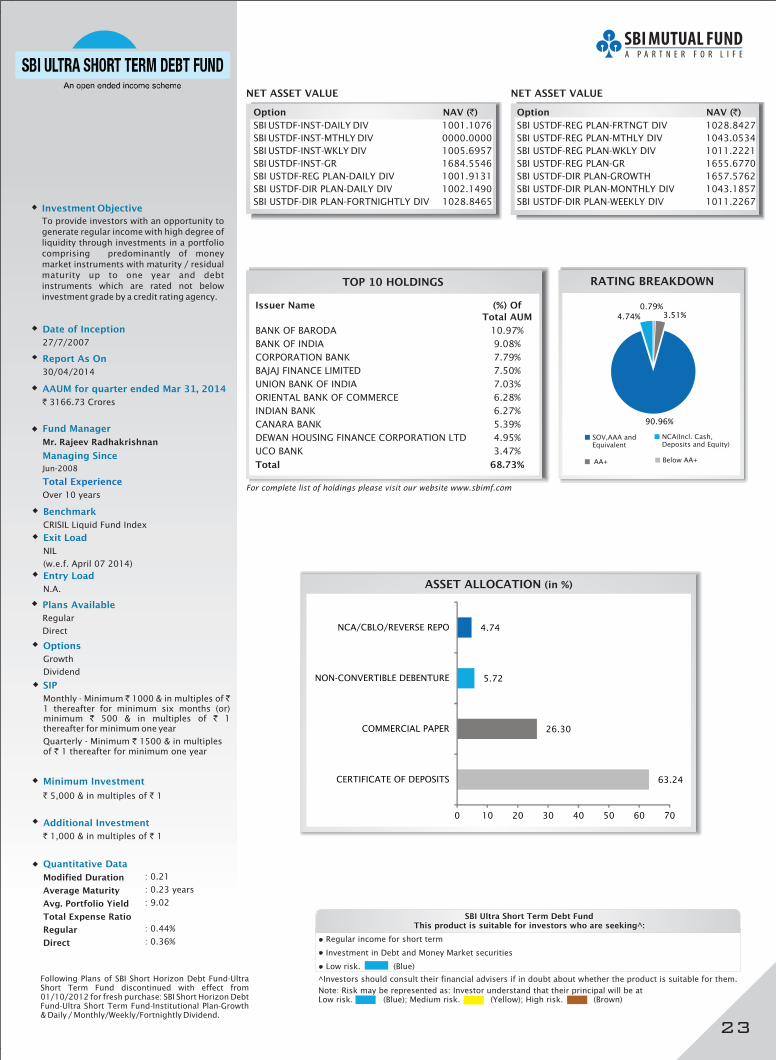
Investment Objective
To provide investors with an opportunity to
generate regular income with high degree of
liquidity through investments in a portfolio
comprising predominantly of money
market instruments with maturity / residual
maturity up to one year and debt
instruments which are rated not below
investment grade by a credit rating agency.
Date of Inception
27/7/2007
Fund Manager
Mr. Rajeev Radhakrishnan
Jun-2008
Managing Since
Total Experience
Over 10 years
Entry Load
N.A.
Exit Load
NIL
(w.e.f. April 07 2014)
Benchmark
CRISIL Liquid Fund Index
NET ASSET VALUE NET ASSET VALUE
Report As On
30/04/2014
ASSET ALLOCATION (in %)
RATING BREAKDOWN
AAUM for quarter ended Mar 31, 2014
` 3166.73 Crores
TOP 10 HOLDINGS
For complete list of holdings please visit our website www.sbimf.com
Options
Growth
Dividend
SIP
Monthly - Minimum 1000 & in multiples of1 thereafter for minimum six months (or)minimum 500 & in multiples of 1thereafter for minimum one year
Quarterly - Minimum 1500 & in multiplesof 1 thereafter for minimum one year
` `
` `
`
`
Minimum Investment
` `5,000 & in multiples of 1
Additional Investment
` `1,000 & in multiples of 1
Quantitative Data
Modified Duration
Average Maturity
Avg. Portfolio Yield
Total Expense Ratio
Regular
Direct
: 0.21
: 0.23 years
: 9.02
: 0.44%
: 0.36%
Following Plans of SBI Short Horizon Debt Fund-UltraShort Term Fund discontinued with effect from01/10/2012 for fresh purchase: SBI Short Horizon DebtFund-Ultra Short Term Fund-Institutional Plan-Growth& Daily / Monthly/Weekly/Fortnightly Dividend.
Plans Available
Regular
Direct
SBI Ultra Short Term Debt FundThis product is suitable for investors who are seeking^:
• Regular income for short term
nvestment in Debt and Money Market securities• I
• Low risk. (Blue)
^Investors should consult their financial advisers if in doubt about whether the product is suitable for them.
Note: Risk may be represented as: Investor understand that their principal will be atLow risk. (Blue); Medium risk. (Yellow); High risk. (Brown)
Issuer Name (%) Of
Total AUM
Total 68.73%
BANK OF BARODA 10.97%
BANK OF INDIA 9.08%
CORPORATION BANK 7.79%
BAJAJ FINANCE LIMITED 7.50%
UNION BANK OF INDIA 7.03%
ORIENTAL BANK OF COMMERCE 6.28%
INDIAN BANK 6.27%
CANARA BANK 5.39%
DEWAN HOUSING FINANCE CORPORATION LTD 4.95%
UCO BANK 3.47%
Option NAV ( )`
SBI USTDF-INST-DAILY DIV 1001.1076
SBI USTDF-INST-MTHLY DIV 0000.0000
SBI USTDF-INST-WKLY DIV 1005.6957
SBI USTDF-INST-GR 1684.5546
SBI USTDF-REG PLAN-DAILY DIV 1001.9131
SBI USTDF-DIR PLAN-DAILY DIV 1002.1490
SBI USTDF-DIR PLAN-FORTNIGHTLY DIV 1028.8465
Option NAV ( )`
SBI USTDF-REG PLAN-FRTNGT DIV 1028.8427
SBI USTDF-REG PLAN-MTHLY DIV 1043.0534
SBI USTDF-REG PLAN-WKLY DIV 1011.2221
SBI USTDF-REG PLAN-GR 1655.6770
SBI USTDF-DIR PLAN-GROWTH 1657.5762
SBI USTDF-DIR PLAN-MONTHLY DIV 1043.1857
SBI USTDF-DIR PLAN-WEEKLY DIV 1011.2267
23
NCA(Incl. Cash,Deposits and Equity)
SOV,AAA andEquivalent
AA+ Below AA+
0.79%3.51%
90.96%
4.74%
63.24
26.30
5.72
4.74
0 10 20 30 40 50 60 70
CERTIFICATE OF DEPOSITS
COMMERCIAL PAPER
NON-CONVERTIBLE DEBENTURE
NCA/CBLO/REVERSE REPO
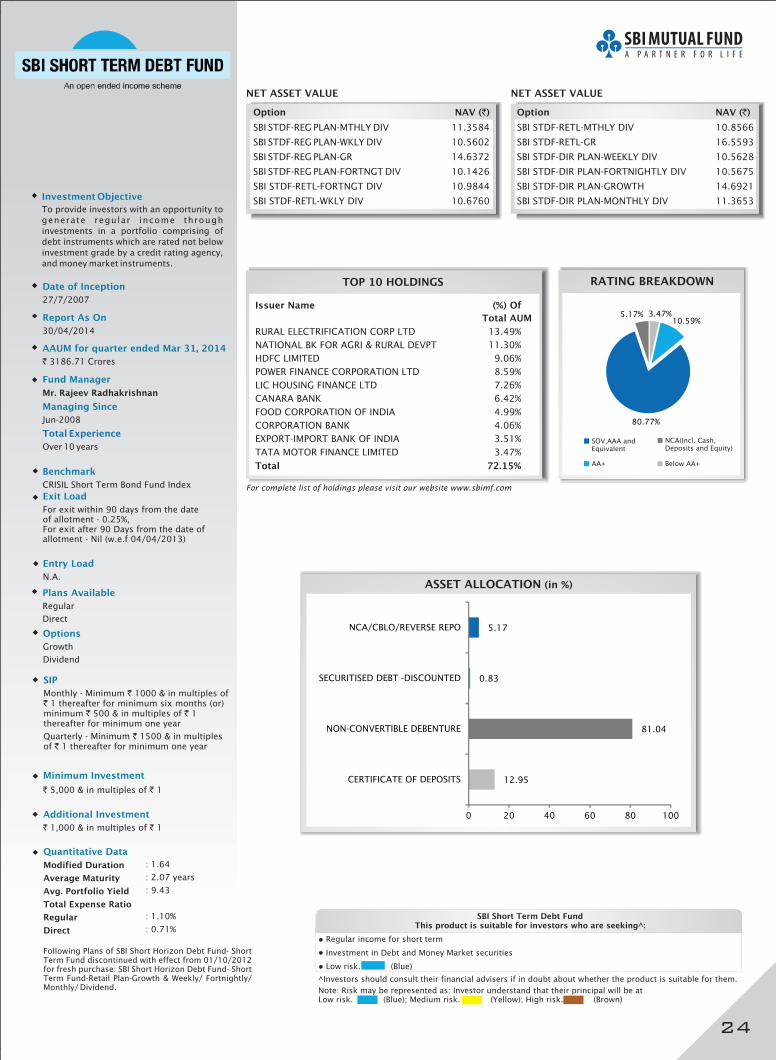
Investment Objective
To provide investors with an opportunity to
generate regular income through
investments in a portfolio comprising of
debt instruments which are rated not below
investment grade by a credit rating agency,
and money market instruments.
Date of Inception
27/7/2007
Fund Manager
Mr. Rajeev Radhakrishnan
Jun-2008
Managing Since
Total Experience
Over 10 years
Entry Load
N.A.
Options
Growth
Dividend
SIP
Monthly - Minimum 1000 & in multiples of1 thereafter for minimum six months (or)
minimum 500 & in multiples of 1thereafter for minimum one year
Quarterly - Minimum 1500 & in multiplesof 1 thereafter for minimum one year
`
`
` `
`
`
Minimum Investment
` `5,000 & in multiples of 1
Exit Load
For exit within 90 days from the dateof allotment - 0.25%,For exit after 90 Days from the date ofallotment - Nil (w.e.f 04/04/2013)
Additional Investment
` `1,000 & in multiples of 1
Benchmark
CRISIL Short Term Bond Fund Index
Quantitative Data
Modified Duration
Average Maturity
Avg. Portfolio Yield
Total Expense Ratio
Regular
Direct
: 1.64
: 2.07
: 9.43
: 1.10%
: 0.71%
years
Report As On
30/04/2014
ASSET ALLOCATION (in %)
TOP 10 HOLDINGS
For complete list of holdings please visit our website www.sbimf.com
RATING BREAKDOWN
AAUM for quarter ended Mar , 201431
` 3186.71 Crores
Following Plans of SBI Short Horizon Debt Fund- ShortTerm Fund discontinued with effect from 01/10/2012
: SBI Short Horizon Debt Fund- ShortTerm Fund-Retail Plan-Growth & Weekly/ Fortnightly/Monthly/ Dividend.
for fresh purchase
Plans Available
Regular
Direct
NET ASSET VALUE NET ASSET VALUE
NCA(Incl. Cash,Deposits and Equity)
SOV,AAA andEquivalent
AA+ Below AA+
SBI Short Term Debt FundThis product is suitable for investors who are seeking^:
• Regular income for short term
nvestment in Debt and Money Market securities• I
• Low risk. (Blue)
^Investors should consult their financial advisers if in doubt about whether the product is suitable for them.
Note: Risk may be represented as: Investor understand that their principal will be atLow risk. (Blue); Medium risk. (Yellow); High risk. (Brown)
Issuer Name (%) Of
Total AUM
Total 72.15%
RURAL ELECTRIFICATION CORP LTD 13.49%
NATIONAL BK FOR AGRI & RURAL DEVPT 11.30%
HDFC LIMITED 9.06%
POWER FINANCE CORPORATION LTD 8.59%
LIC HOUSING FINANCE LTD 7.26%
CANARA BANK 6.42%
FOOD CORPORATION OF INDIA 4.99%
CORPORATION BANK 4.06%
EXPORT-IMPORT BANK OF INDIA 3.51%
TATA MOTOR FINANCE LIMITED 3.47%
Option NAV ( )`
SBI STDF-REG PLAN-MTHLY DIV 11.3584
SBI STDF-REG PLAN-WKLY DIV 10.5602
SBI STDF-REG PLAN-GR 14.6372
SBI STDF-REG PLAN-FORTNGT DIV 10.1426
SBI STDF-RETL-FORTNGT DIV 10.9844
SBI STDF-RETL-WKLY DIV 10.6760
Option NAV ( )`
SBI STDF-RETL-MTHLY DIV 10.8566
SBI STDF-RETL-GR 16.5593
SBI STDF-DIR PLAN-WEEKLY DIV 10.5628
SBI STDF-DIR PLAN-FORTNIGHTLY DIV 10.5675
SBI STDF-DIR PLAN-GROWTH 14.6921
SBI STDF-DIR PLAN-MONTHLY DIV 11.3653
24
3.47%10.59%
80.77%
5.17%
12.95
81.04
0.83
5.17
0 20 40 60 80 100
CERTIFICATE OF DEPOSITS
NON-CONVERTIBLE DEBENTURE
SECURITISED DEBT -DISCOUNTED
NCA/CBLO/REVERSE REPO
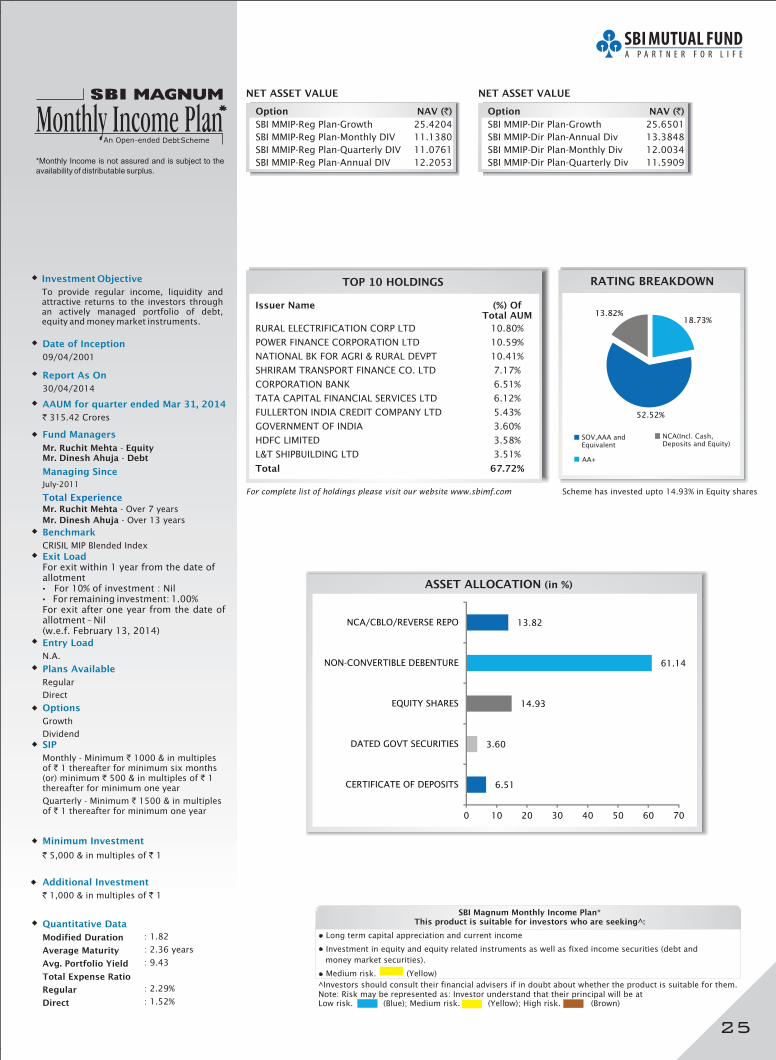
Investment Objective
To provide regular income, liquidity andattractive returns to the investors throughan actively managed portfolio of debt,equity and money market instruments.
Date of Inception
09/04/2001
*Monthly Income is not assured and is subject to the
availability of distributable surplus.
Fund Managers
Mr. Ruchit Mehta EquityMr. Dinesh Ahuja Debt
--
Managing Since
July-2011
Over 7 years
Over 13 years
Total ExperienceMr. Ruchit Mehta
Mr. Dinesh Ahuja
-
-
Entry Load
N.A.
Options
Growth
Dividend
SIP
Monthly - Minimum 1000 & in multiplesof 1 thereafter for minimum six months(or) minimum 500 & in multiples of 1thereafter for minimum one year
Quarterly - Minimum 1500 & in multiplesof 1 thereafter for minimum one year
`
`
` `
`
`
Minimum Investment
` `5,000 & in multiples of 1
Exit LoadFor exit within 1 year from the date ofallotment
For 10% of investment : NilFor remaining investment: 1.00%
For exit after one year from the date ofallotment – Nil(w.e.f. February 13, 2014)
•
•
Additional Investment
` `1,000 & in multiples of 1
Benchmark
CRISIL MIP Blended Index
Quantitative Data
Modified Duration
Average Maturity
Avg. Portfolio Yield
Total Expense Ratio
Regular
Direct
: 1.82
: 2.36
: 9.43
: 2.29%
: 1.52%
years
Report As On
30/04/2014
ASSET ALLOCATION (in %)
TOP 10 HOLDINGS
For complete list of holdings please visit our website www.sbimf.com Scheme has investe upto 14.93% in Equity sharesd
RATING BREAKDOWN
SOV,AAA andEquivalent
NCA(Incl. Cash,Deposits and Equity)
AA+
AAUM for quarter ended Mar , 201431
` 315.42 Crores
Plans Available
Regular
Direct
NET ASSET VALUE NET ASSET VALUE
SBI Magnum Monthly Income Plan*This product is suitable for investors who are seeking^:
• Long term capital appreciation and current income
nvestment in equity and equity related instruments as well as fixed income securities (debt and
money market securities).
edium risk. (Yellow)
• I
• M
^Investors should consult their financial advisers if in doubt about whether the product is suitable for them.Note: Risk may be represented as: Investor understand that their principal will be atLow risk. (Blue); Medium risk. (Yellow); High risk. (Brown)
Issuer Name (%) OfTotal AUM
Total 67.72%
RURAL ELECTRIFICATION CORP LTD 10.80%
POWER FINANCE CORPORATION LTD 10.59%
NATIONAL BK FOR AGRI & RURAL DEVPT 10.41%
SHRIRAM TRANSPORT FINANCE CO. LTD 7.17%
CORPORATION BANK 6.51%
TATA CAPITAL FINANCIAL SERVICES LTD 6.12%
FULLERTON INDIA CREDIT COMPANY LTD 5.43%
GOVERNMENT OF INDIA 3.60%
HDFC LIMITED 3.58%
L&T SHIPBUILDING LTD 3.51%
Option NAV ( )
SBI MMIP-Reg Plan-Growth 25.4204
SBI MMIP-Reg Plan-Monthly DIV 11.1380
SBI MMIP-Reg Plan-Quarterly DIV 11.0761
SBI MMIP-Reg Plan-Annual DIV 12.2053
` Option NAV ( )
SBI MMIP-Dir Plan-Growth 25.6501
SBI MMIP-Dir Plan-Annual Div 13.3848
SBI MMIP-Dir Plan-Monthly Div 12.0034
SBI MMIP-Dir Plan-Quarterly Div 11.5909
`
25
18.73%
52.52%
13.82%
6.51
3.60
14.93
61.14
13.82
0 10 20 30 40 50 60 70
CERTIFICATE OF DEPOSITS
DATED GOVT SECURITIES
EQUITY SHARES
NON-CONVERTIBLE DEBENTURE
NCA/CBLO/REVERSE REPO
Debt

Investment Objective
To provide attractive returns to the Magnumholders either through periodic dividends orthrough capital appreciation through anactively managed portfolio of debt andmoney market instruments.
Date of Inception
24/11/2003
Fund Manager
Mr. Rajeev Radhakrishnan
May-2010
Managing Since
Total Experience
Over 10 years
Entry Load
N.A.
Options
Growth
Dividend
SIP
N.A.
Minimum Investment
` `50,000 & in multiples of 1
Exit Load
NIL
Additional Investment
` `10,000 & in multiples of 1
Benchmark
CRISIL Liquid Fund Index
Quantitative Data
Modified Duration
Average Maturity
Avg. Portfolio Yield
Total Expense Ratio
Regular
Direct
: 0.06
: 0.07
: 9.16
: 0.20%
: 0.12%
years
NET ASSET VALUE NET ASSET VALUE
Report As On
30/04/2014
ASSET ALLOCATION (in %)
TOP 10 HOLDINGS
For complete list of holdings please visit our website www.sbimf.com
RATING BREAKDOWN
AAUM for quarter ended Mar , 201431
` 17217.73 Crores
SOV,AAA andEquivalent
NCA(Incl. Cash,Deposits and Equity)
Following Plans of SBI Premier Liquid Funddiscontinued with effect from 01/10/2012
: SBI Premier Liquid Fund –Institutional Plan –Growth & Dividend / Weekly &Fortnightly Dividend.
forfresh purchase
Plans Available
Regular
Direct
An Open-ended Liquid Scheme
SBI Premier Liquid FundThis product is suitable for investors who are seeking^:
• Regular income for short term
nvestment in Debt and Money Market securities• I
• Low risk. (Blue)
^Investors should consult their financial advisers if in doubt about whether the product is suitable for them.
Note: Risk may be represented as: Investor understand that their principal will be atLow risk. (Blue); Medium risk. (Yellow); High risk. (Brown)
Issuer Name (%) OfTotal AUM
Total 30.60%
IDBI BANK 5.02%
ICICI BANK LTD 4.11%
ANDHRA BANK 4.08%
SESA STERLITE LIMITED 3.52%
CORPORATION BANK 2.74%
INDIAN OVERSEAS BANK 2.28%
PUNJAB NATIONAL BANK 2.28%
ADITYA BIRLA NUVO LIMITED 2.27%
BAJAJ FINANCE LIMITED 2.26%
TATA CAPITAL FINANCIAL SERVICES LTD 2.04%
Option NAV ( )`
SBI SPLF-REG PLAN-DAILY-DIV 1003.2500
SBI SPLF-REG PLAN-FORTNGT-DIV 1012.8520
SBI SPLF-REG PLAN-GR 2030.9450
SBI SPLF-REG PLAN-WEEKLY DIV 1062.1011
SBI SPLF-INST-DAILY-DIV 1003.2500
SBI SPLF-INST-FORTNGT-DIV 2049.9980
Option NAV ( )`
SBI SPLF-INST-GR 2049.9980
SBI SPLF-INST-WKLY-DIV 1061.3912
SBI SPLF-DIR PLAN-DAILY DIV 1003.2500
SBI SPLF-DIR PLAN-GROWTH 2032.6321
SBI SPLF-DIR PLAN-WEEKLY DIV 1062.1102
SBI SPLF-DIR PLAN FORTNIGHTLY DIV 1012.8609
26
83.84%
16.16%
36.80
46.12
0.92
4.76
11.40
0 10 20 30 40 50
CERTIFICATE OF DEPOSITS
COMMERCIAL PAPER
TREASURY BILLS
SHORT TERM DEPOSITS
NCA/CBLO/REVERSE REPO
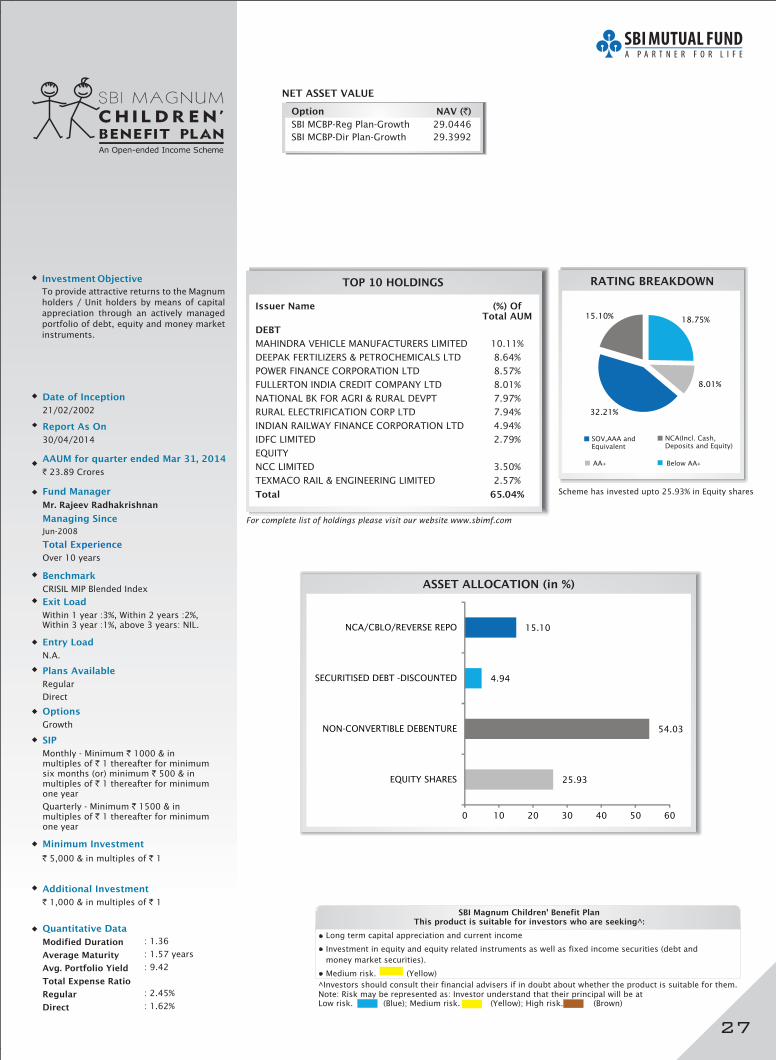
Investment Objective
To provide attractive returns to the Magnum
holders / Unit holders by means of capital
appreciation through an actively managed
portfolio of debt, equity and money market
instruments.
Date of Inception
21/02/2002
Fund Manager
Mr. Rajeev Radhakrishnan
Jun-2008
Managing Since
Total Experience
Over 10 years
Entry Load
N.A.
Options
Growth
SIP
Monthly - Minimum 1000 & inmultiples of 1 thereafter for minimumsix months (or) minimum 500 & inmultiples of 1 thereafter for minimumone year
Quarterly - Minimum 1500 & inmultiples of 1 thereafter for minimumone year
`
`
`
`
`
`
Minimum Investment
` `5,000 & in multiples of 1
Exit Load
Within 1 year :3%, Within 2 years :2%,Within 3 year :1%, above 3 years: NIL.
Additional Investment
` `1,000 & in multiples of 1
Benchmark
CRISIL MIP Blended Index
Quantitative Data
Modified Duration
Average Maturity
Avg. Portfolio Yield
Total Expense Ratio
Regular
Direct
: 1.36
: 1.57
: 9.42
: 2.45%
: 1.62%
years
NET ASSET VALUE
Report As On
30/04/2014
ASSET ALLOCATION (in %)
RATING BREAKDOWN
AAUM for quarter ended Mar , 201431
` 23.89 Crores
TOP 10 HOLDINGS
For complete list of holdings please visit our website www.sbimf.com
SOV,AAA andEquivalent
NCA(Incl. Cash,Deposits and Equity)
AA+ Below AA+
Plans Available
Regular
Direct
SBI Magnum Children' Benefit PlanThis product is suitable for investors who are seeking^:
• Long term capital appreciation and current income
nvestment in equity and equity related instruments as well as fixed income securities (debt and
money market securities).
• I
• Medium risk. (Yellow)
^Investors should consult their financial advisers if in doubt about whether the product is suitable for them.Note: Risk may be represented as: Investor understand that their principal will be atLow risk. (Blue); Medium risk. (Yellow); High risk. (Brown)
Issuer Name (%) OfTotal AUM
DEBT
Total 65.04%
MAHINDRA VEHICLE MANUFACTURERS LIMITED 10.11%
DEEPAK FERTILIZERS & PETROCHEMICALS LTD 8.64%
POWER FINANCE CORPORATION LTD 8.57%
FULLERTON INDIA CREDIT COMPANY LTD 8.01%
NATIONAL BK FOR AGRI & RURAL DEVPT 7.97%
RURAL ELECTRIFICATION CORP LTD 7.94%
INDIAN RAILWAY FINANCE CORPORATION LTD 4.94%
IDFC LIMITED 2.79%
EQUITY
NCC LIMITED 3.50%
TEXMACO RAIL & ENGINEERING LIMITED 2.57%
Option NAV ( )
SBI MCBP-Reg Plan-Growth 29.0446
SBI MCBP-Dir Plan-Growth 29.3992
`
27
Scheme has investe upto 25.93% in Equity sharesd
18.75%
8.01%
32.21%
15.10%
25.93
54.03
4.94
15.10
0 10 20 30 40 50 60
EQUITY SHARES
NON-CONVERTIBLE DEBENTURE
SECURITISED DEBT -DISCOUNTED
NCA/CBLO/REVERSE REPO

Investment Objective
To provide the investors an opportunity to
earn, in accordance with their requirements,
through capital gains or through regular
dividends, returns that would be higher than
the returns offered by comparable
investment avenues through investment in
debt & money market securities.
Date of Inception
25/11/1998
Fund Manager
Mr. Dinesh Ahuja
Jan-2011
Over 13 years
Managing Since
Total Experience
Entry Load
N.A.
Options
Growth
Dividend
Bonus
SIP
Monthly - Minimum 1000 & inmultiples of 1 thereafter for minimumsix months (or) minimum 500 & inmultiples of 1 thereafter for minimumone year
Quarterly - Minimum 1500 & inmultiples of 1 thereafter for minimumone year
`
`
`
`
`
`
Minimum Investment
` `5,000 & in multiples of 1
Exit Load
For exit within 1 year from the date ofallotment
For 10% of investment : NilFor remaining investment: 1.00%
For exit after one year from the date ofallotment – Nil(w.e.f. February 13, 2014)
•
•
Additional Investment
` `1,000 & in multiples of 1
Benchmark
CRISIL Composite Bond Fund Index
Quantitative Data
Modified Duration
Average Maturity
Avg. Portfolio Yield
Total Expense Ratio
Regular
Direct
: 2.47
: 3.14
: 9.06
: 1.77%
: 1.59%
years
NET ASSET VALUE NET ASSET VALUE
Report As On
30/04/2014
TOP 10 HOLDINGS
For complete list of holdings please visit our website www.sbimf.com
RATING BREAKDOWN
ASSET ALLOCATION (in %)
AAUM for quarter ended Mar , 201431
` 4611.05 Crores
Plans Available
Regular
Direct
SBI Magnum Income FundThis product is suitable for investors who are seeking^:
• Regular income for medium term
nvestment in Debt and Money Market securities• I
• Low risk. (Blue)
^Investors should consult their financial advisers if in doubt about whether the product is suitable for them.
Note: Risk may be represented as: Investor understand that their principal will be atLow risk. (Blue); Medium risk. (Yellow); High risk. (Brown)
Issuer Name (%) OfTotal AUM
Total 76.06%
POWER FINANCE CORPORATION LTD 15.90%
HDFC LIMITED 10.69%
CORPORATION BANK 10.23%
LIC HOUSING FINANCE LTD 8.38%
CANARA BANK 8.28%
RURAL ELECTRIFICATION CORP LTD 7.58%
GOVERNMENT OF INDIA 5.83%
GOVERNMENT OF INDIA 3.36%
EXPORT-IMPORT BANK OF INDIA 3.21%
RESERVE BANK OF INDIA 2.60%
Option NAV ( )`
SBI MIF - Reg Plan-BONUS 18.2241
SBI - Reg Plan-DIV 11.2842
SBI - Reg Plan-GR 30.0763
SBI MIF - Reg Plan-QTR DIV 11.9747
MIF
MIF
Option NAV ( )`
SBI MIF - Dir Plan-DIV 11.8453
SBI - Dir Plan-GR 30.1793
SBI - Dir Plan-QTR DIV 12.0453
SBI MIF - Dir Plan- 18.3225
MIF
MIF
BONUS
NCA(Incl. Cash,Deposits and Equity)
SOV,AAA andEquivalent
AA+ Below AA+
28
0.68%8.81%
81.49%
9.02%
18.51
3.36
5.83
60.68
2.60
9.02
0 10 20 30 40 50 60 70
CERTIFICATE OF DEPOSITS
DATED GOVT SECURITIES
INFLATION INDEXED BONDS
NON-CONVERTIBLE DEBENTURE
TREASURY BILLS
NCA/CBLO/REVERSE REPO
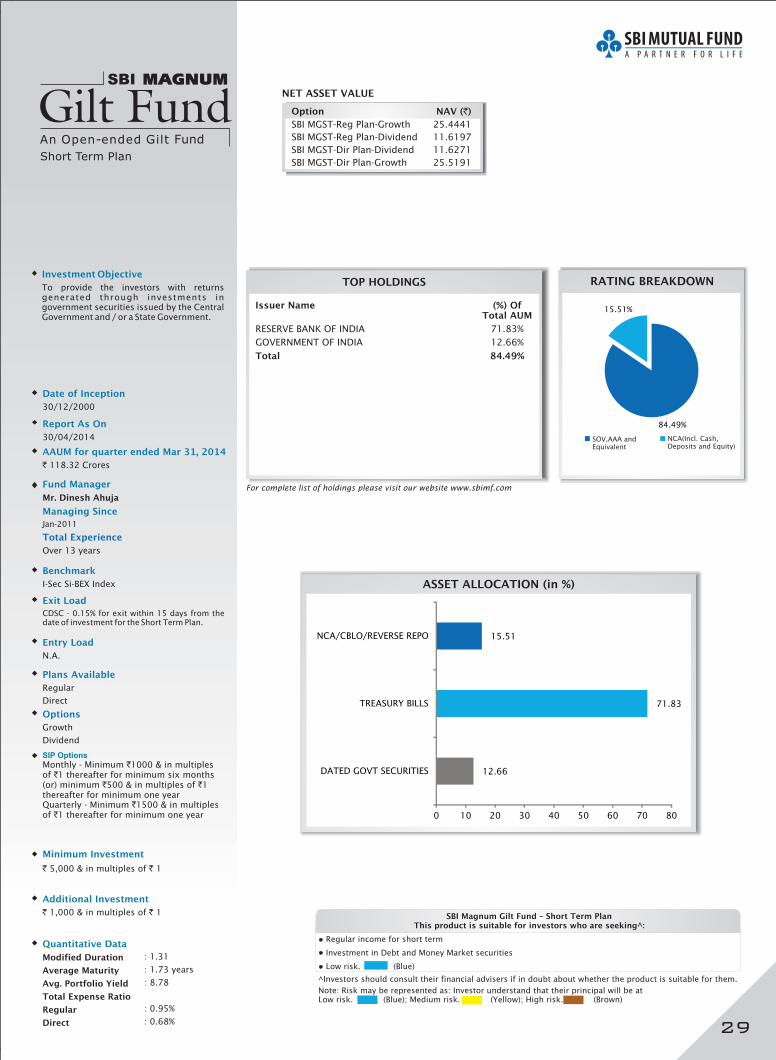
Investment Objective
To provide the investors with returnsgenerated through investments ingovernment securities issued by the CentralGovernment and / or a State Government.
Date of Inception
30/12/2000
Fund Manager
Mr. Dinesh Ahuja
Jan-2011
Over 13 years
Managing Since
Total Experience
Entry Load
N.A.
SIP Options
Monthly - Minimum 1000 & in multiplesof 1 thereafter for minimum six months(or) minimum 500 & in multiples of 1thereafter for minimum one yearQuarterly - Minimum 1500 & in multiplesof 1 thereafter for minimum one year
`
`
` `
`
`
Minimum Investment
` `5,000 & in multiples of 1
Exit Load
CDSC - 0.15% for exit within 15 days from thedate of investment for the Short Term Plan.
Additional Investment
` `1,000 & in multiples of 1
Benchmark
I-Sec Si-BEX Index
Quantitative Data
Modified Duration
Average Maturity
Avg. Portfolio Yield
Total Expense Ratio
Regular
Direct
: 1.31
: 1.73
: 8.78
: 0.95%
: 0.68%
years
Short Term Plan
NET ASSET VALUE
Report As On
30/04/2014
TOP HOLDINGS
For complete list of holdings please visit our website www.sbimf.com
RATING BREAKDOWN
SOV,AAA andEquivalent
NCA(Incl. Cash,Deposits and Equity)
AAUM for quarter ended Mar , 201431
` 118.32 Crores
Plans Available
Regular
Direct
Options
Growth
Dividend
SBI Magnum Gilt Fund – Short Term PlanThis product is suitable for investors who are seeking^:
• Regular income for short term
nvestment in Debt and Money Market securities• I
• Low risk. (Blue)
^Investors should consult their financial advisers if in doubt about whether the product is suitable for them.
ASSET ALLOCATION (in %)
Note: Risk may be represented as: Investor understand that their principal will be atLow risk. (Blue); Medium risk. (Yellow); High risk. (Brown)
Issuer Name (%) OfTotal AUM
Total 84.49%
RESERVE BANK OF INDIA 71.83%
GOVERNMENT OF INDIA 12.66%
Option NAV ( )
SBI MGST-Reg Plan-Growth 25.4441
SBI MGST-Reg Plan-Dividend 11.6197
SBI MGST-Dir Plan-Dividend 11.6271
SBI MGST-Dir Plan-Growth 25.5191
`
29
84.49%
15.51%
12.66
71.83
15.51
0 10 20 30 40 50 60 70 80
DATED GOVT SECURITIES
TREASURY BILLS
NCA/CBLO/REVERSE REPO
Fund
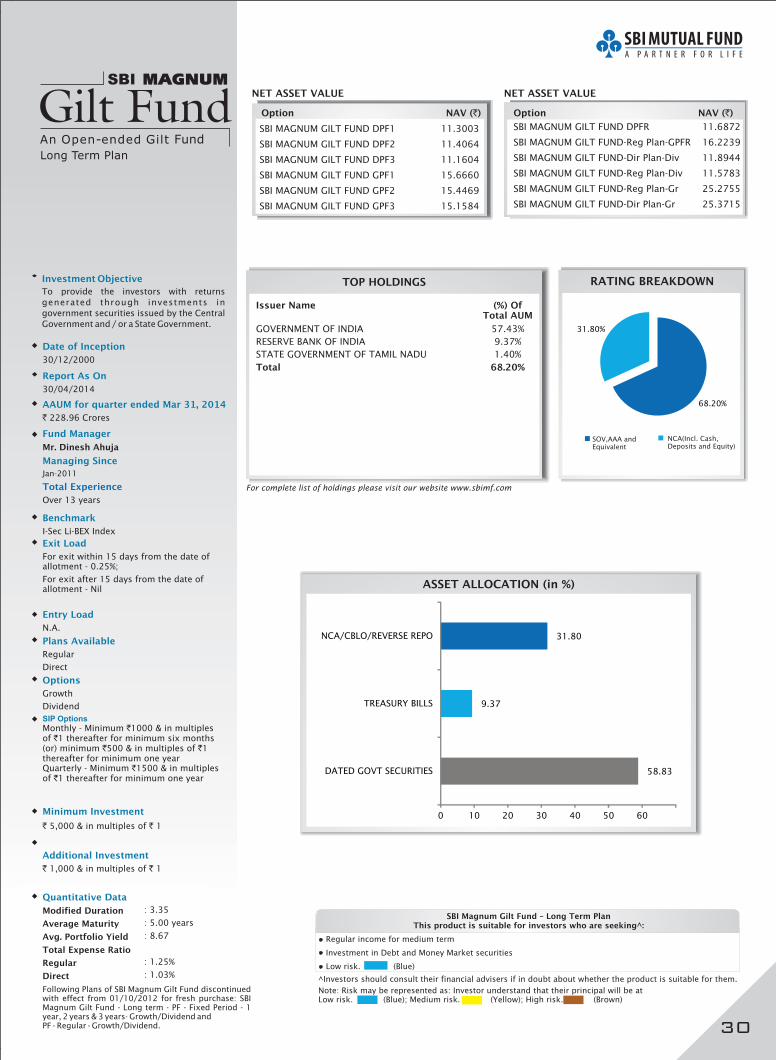
Investment Objective
To provide the investors with returns
generated through investments in
government securities issued by the Central
Government and / or a State Government.
Long Term Plan
NET ASSET VALUE NET ASSET VALUE
TOP HOLDINGS
For complete list of holdings please visit our website www.sbimf.com
ASSET ALLOCATION (in %)
Date of Inception
30/12/2000
Fund Manager
Mr. Dinesh Ahuja
Jan-2011
Managing Since
Total Experience
Over 13 years
Benchmark
I-Sec Li-BEX Index
Exit Load
For exit within 15 days from the date ofallotment - 0.25%;
For exit after 15 days from the date ofallotment - Nil
Entry Load
N.A.
Report As On
30/04/2014
AAUM for quarter ended Mar , 201431
` 228.96 Crores
SIP Options
Monthly - Minimum 1000 & in multiplesof 1 thereafter for minimum six months(or) minimum 500 & in multiples of 1thereafter for minimum one yearQuarterly - Minimum 1500 & in multiplesof 1 thereafter for minimum one year
`
`
` `
`
`
Minimum Investment
` `5,000 & in multiples of 1
Additional Investment
` `1,000 & in multiples of 1
Quantitative Data
Modified Duration
Average Maturity
Avg. Portfolio Yield
Total Expense Ratio
Regular
Direct
: 3.35
: 5.00
: 8.67
: 1.25%
: 1.03%
years
Following Plans of SBI Magnum Gilt Fund discontinuedwith effect from 01/10/2012 : SBI
Gilt Fund - Long term - PF - Fixed Period - 1year, 2 years & 3 years- Growth/Dividend andPF - Regular - Growth/Dividend.
for fresh purchaseMagnum
Plans Available
Regular
Direct
Option NAV ( )` Option NAV ( )`
Options
Growth
Dividend
SBI Magnum Gilt Fund – Long Term PlanThis product is suitable for investors who are seeking^:
• Regular income for medium term
• Investment in Debt and Money Market securities
• Low risk. (Blue)
^Investors should consult their financial advisers if in doubt about whether the product is suitable for them.
Note: Risk may be represented as: Investor understand that their principal will be atLow risk. (Blue); Medium risk. (Yellow); High risk. (Brown)
Issuer Name (%) OfTotal AUM
Total 68.20%
GOVERNMENT OF INDIA 57.43%
RESERVE BANK OF INDIA 9.37%
STATE GOVERNMENT OF TAMIL NADU 1.40%
SBI MAGNUM GILT FUND DPF1 11.3003
SBI MAGNUM GILT FUND DPF2 11.4064
SBI MAGNUM GILT FUND DPF3 11.1604
SBI MAGNUM GILT FUND GPF1 15.6660
SBI MAGNUM GILT FUND GPF2 15.4469
SBI MAGNUM GILT FUND GPF3 15.1584
SBI MAGNUM GILT FUND DPFR 11.6872
SBI MAGNUM GILT FUND-Reg Plan-GPFR 16.2239
SBI MAGNUM GILT FUND-Dir Plan-Div 11.8944
SBI MAGNUM GILT FUND-Reg Plan-Div 11.5783
SBI MAGNUM GILT FUND-Reg Plan-Gr 25.2755
SBI MAGNUM GILT FUND-Dir Plan-Gr 25.3715
30
RATING BREAKDOWN
SOV,AAA andEquivalent
NCA(Incl. Cash,Deposits and Equity)
68.20%
31.80%
58.83
9.37
31.80
0 10 20 30 40 50 60
DATED GOVT SECURITIES
TREASURY BILLS
NCA/CBLO/REVERSE REPO
Fund
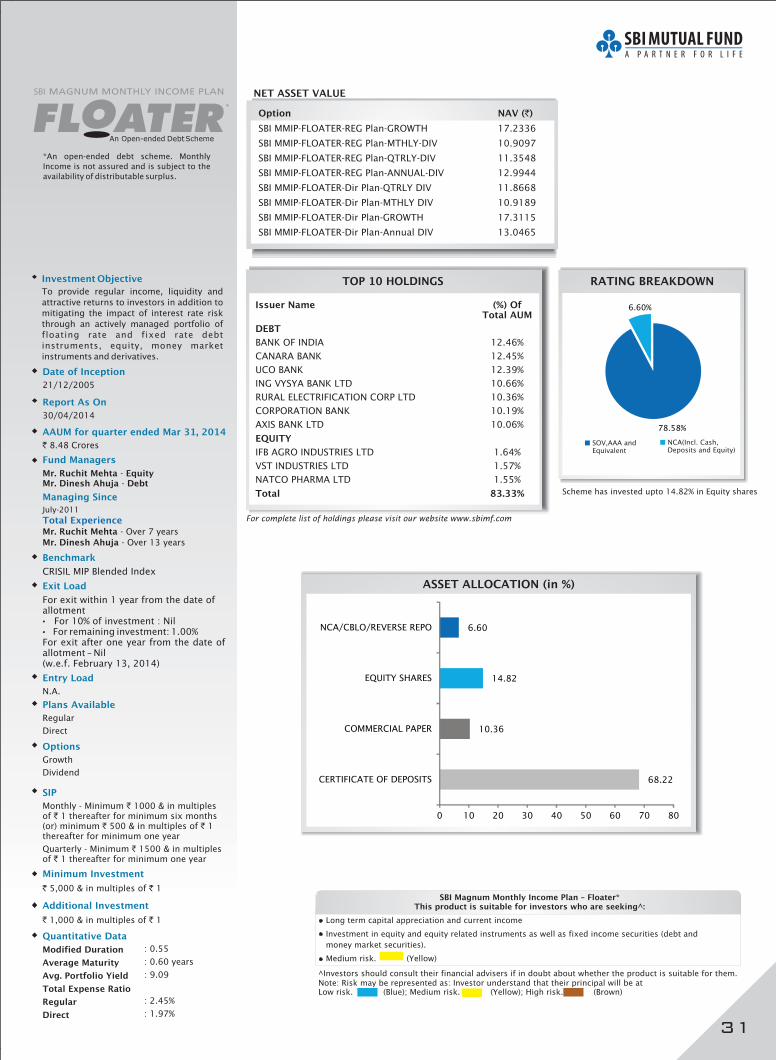
Investment Objective
To provide regular income, liquidity and
attractive returns to investors in addition to
mitigating the impact of interest rate risk
through an actively managed portfolio of
floating rate and fixed rate debt
instruments, equity, money market
instruments and derivatives.
Date of Inception
21/12/2005
Fund Managers
Mr. Ruchit Mehta EquityMr. Dinesh Ahuja Debt
--
Managing Since
July-2011
Over 7 years
Over 13 years
Total ExperienceMr. Ruchit MehtaMr. Dinesh Ahuja
-
-
Entry Load
N.A.
Options
Growth
Dividend
SIP
Monthly - Minimum 1000 & in multiplesof 1 thereafter for minimum six months(or) minimum 500 & in multiples of 1thereafter for minimum one year
Quarterly - Minimum 1500 & in multiplesof 1 thereafter for minimum one year
`
`
` `
`
`
Minimum Investment
` `5,000 & in multiples of 1
Exit Load
For exit within 1 year from the date ofallotment
For 10% of investment : NilFor remaining investment: 1.00%
For exit after one year from the date ofallotment – Nil(w.e.f. February 13, 2014)
•
•
Additional Investment
` `1,000 & in multiples of 1
Benchmark
CRISIL MIP Blended Index
Quantitative Data
Modified Duration
Average Maturity
Avg. Portfolio Yield
Total Expense Ratio
Regular
Direct
: 0.55
: 0.60
: 9.09
: 2.45%
: 1.97%
years
*An open-ended debt scheme. Monthly
Income is not assured and is subject to the
availability of distributable surplus.
NET ASSET VALUE
Report As On
30/04/2014
TOP 10 HOLDINGS
For complete list of holdings please visit our website www.sbimf.com
RATING BREAKDOWN
SOV,AAA andEquivalent
NCA(Incl. Cash,Deposits and Equity)
ASSET ALLOCATION (in %)
AAUM for quarter ended Mar , 201431
` 8.48 Crores
Plans Available
Regular
Direct
SBI Magnum Monthly Income Plan – Floater*This product is suitable for investors who are seeking^:
• Long term capital appreciation and current income
nvestment in equity and equity related instruments as well as fixed income securities (debt and
money market securities).
• I
• Medium risk. (Yellow)
^Investors should consult their financial advisers if in doubt about whether the product is suitable for them.Note: Risk may be represented as: Investor understand that their principal will be atLow risk. (Blue); Medium risk. (Yellow); High risk. (Brown)
*
Issuer Name (%) OfTotal AUM
DEBT
EQUITY
Total 83.33%
BANK OF INDIA 12.46%
CANARA BANK 12.45%
UCO BANK 12.39%
ING VYSYA BANK LTD 10.66%
RURAL ELECTRIFICATION CORP LTD 10.36%
CORPORATION BANK 10.19%
AXIS BANK LTD 10.06%
IFB AGRO INDUSTRIES LTD 1.64%
VST INDUSTRIES LTD 1.57%
NATCO PHARMA LTD 1.55%
Option NAV ( )`
SBI MMIP-FLOATER-REG Plan-GROWTH 17.2336
SBI MMIP-FLOATER-REG Plan-MTHLY-DIV 10.9097
SBI MMIP-FLOATER-REG Plan-QTRLY-DIV 11.3548
SBI MMIP-FLOATER-REG Plan-ANNUAL-DIV 12.9944
SBI MMIP-FLOATER-Dir Plan-QTRLY DIV 11.8668
SBI MMIP-FLOATER-Dir Plan-MTHLY DIV 10.9189
SBI MMIP-FLOATER-Dir Plan-GROWTH 17.3115
SBI MMIP-FLOATER-Dir Plan-Annual DIV 13.0465
31
Scheme has investe upto 14.82% in Equity sharesd
78.58%
6.60%
68.22
10.36
14.82
6.60
0 10 20 30 40 50 60 70 80
CERTIFICATE OF DEPOSITS
COMMERCIAL PAPER
EQUITY SHARES
NCA/CBLO/REVERSE REPO
Debt
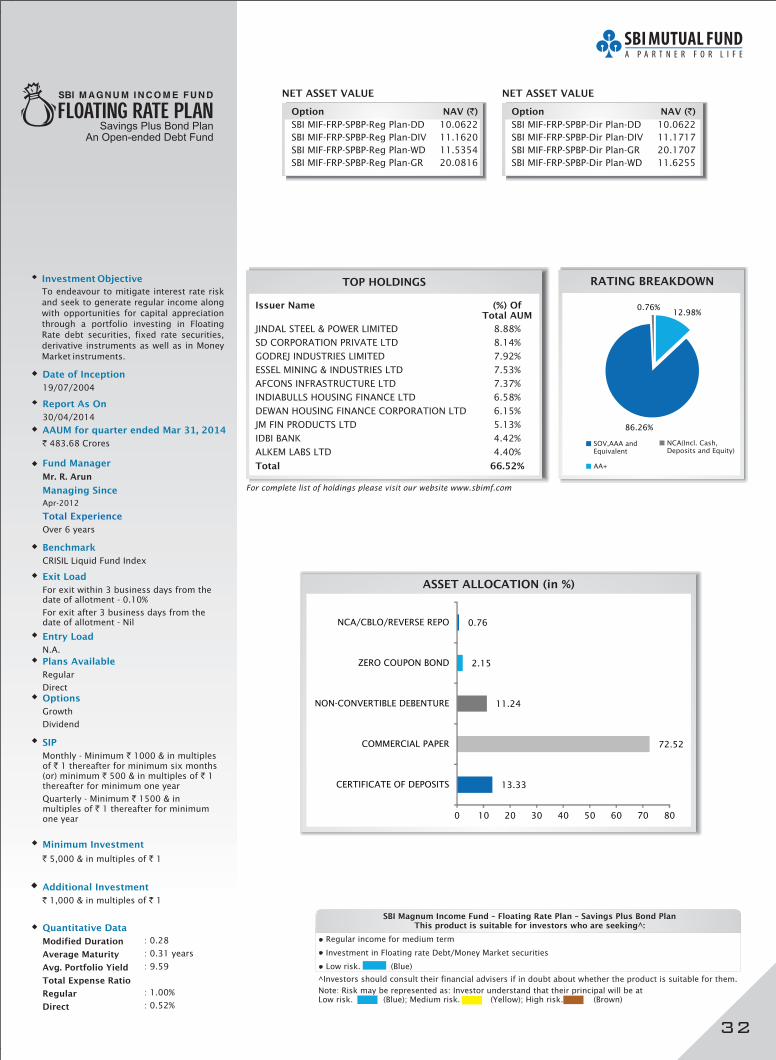
Investment Objective
To endeavour to mitigate interest rate risk
and seek to generate regular income along
with opportunities for capital appreciation
through a portfolio investing in Floating
Rate debt securities, fixed rate securities,
derivative instruments as well as in Money
Market instruments.
Date of Inception
19/07/2004
Savings Plus Bond Plan
Fund Manager
Mr. R. Arun
Managing Since
Apr-2012
Over 6 years
Total Experience
Entry Load
N.A.
Options
Growth
Dividend
SIP
Monthly - Minimum 1000 & in multiplesof 1 thereafter for minimum six months(or) minimum 500 & in multiples of 1thereafter for minimum one year
Quarterly - Minimum 1500 & inmultiples of 1 thereafter for minimumone year
`
`
` `
`
`
Minimum Investment
` `5,000 & in multiples of 1
Exit Load
For exit within 3 business days from thedate of allotment - 0.10%
For exit after 3 business days from thedate of allotment - Nil
Additional Investment
` `1,000 & in multiples of 1
Benchmark
CRISIL Liquid Fund Index
: 0.28
: 0.31
: 9.59
: 1.00%
: 0.52%
years
Quantitative Data
Modified Duration
Average Maturity
Avg. Portfolio Yield
Total Expense Ratio
Regular
Direct
NET ASSET VALUE NET ASSET VALUE
Report As On
30/04/2014
TOP HOLDINGS
For complete list of holdings please visit our website www.sbimf.com
RATING BREAKDOWN
ASSET ALLOCATION (in %)
AAUM for quarter ended Mar , 201431
` 483.68 Crores SOV,AAA andEquivalent
AA+
NCA(Incl. Cash,Deposits and Equity)
Plans Available
Regular
Direct
An Open-ended Debt Fund
SBI Magnum Income Fund – Floating Rate Plan – Savings Plus Bond PlanThis product is suitable for investors who are seeking^:
• Regular income for medium term
nvestment in Floating rate Debt/Money Market securities• I
• Low risk. (Blue)
^Investors should consult their financial advisers if in doubt about whether the product is suitable for them.
Note: Risk may be represented as: Investor understand that their principal will be atLow risk. (Blue); Medium risk. (Yellow); High risk. (Brown)
Issuer Name (%) OfTotal AUM
Total 66.52%
JINDAL STEEL & POWER LIMITED 8.88%
SD CORPORATION PRIVATE LTD 8.14%
GODREJ INDUSTRIES LIMITED 7.92%
ESSEL MINING & INDUSTRIES LTD 7.53%
AFCONS INFRASTRUCTURE LTD 7.37%
INDIABULLS HOUSING FINANCE LTD 6.58%
DEWAN HOUSING FINANCE CORPORATION LTD 6.15%
JM FIN PRODUCTS LTD 5.13%
IDBI BANK 4.42%
ALKEM LABS LTD 4.40%
Option NAV ( )
SBI MIF-FRP-SPBP-Reg Plan-DD 10.0622
SBI MIF-FRP-SPBP-Reg Plan-DIV 11.1620
SBI MIF-FRP-SPBP-Reg Plan-WD 11.5354
SBI MIF-FRP-SPBP-Reg Plan-GR 20.0816
` Option NAV ( )
SBI MIF-FRP-SPBP-Dir Plan-DD 10.0622
SBI MIF-FRP-SPBP-Dir Plan-DIV 11.1717
SBI MIF-FRP-SPBP-Dir Plan-GR 20.1707
SBI MIF-FRP-SPBP-Dir Plan-WD 11.6255
`
32
12.98%
86.26%
0.76%
13.33
72.52
11.24
2.15
0.76
0 10 20 30 40 50 60 70 80
CERTIFICATE OF DEPOSITS
COMMERCIAL PAPER
NON-CONVERTIBLE DEBENTURE
ZERO COUPON BOND
NCA/CBLO/REVERSE REPO
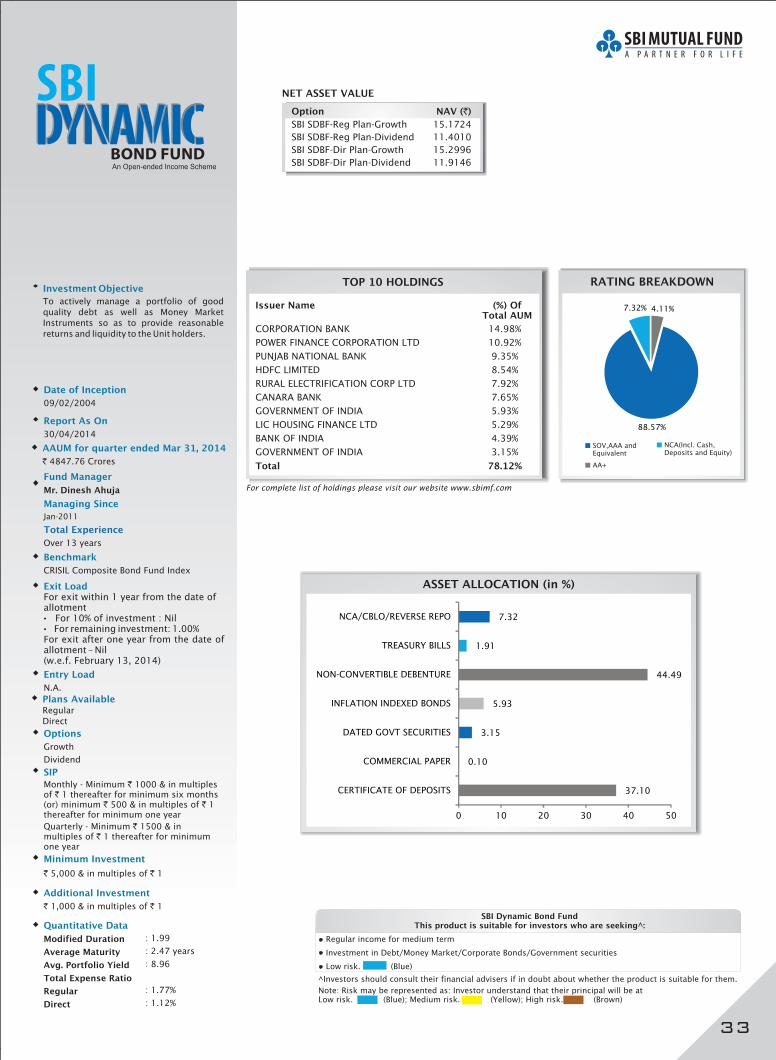
Investment Objective
To actively manage a portfolio of good
quality debt as well as Money Market
Instruments so as to provide reasonable
returns and liquidity to the Unit holders.
Date of Inception
09/02/2004
Fund Manager
Mr. Dinesh Ahuja
Jan-2011
Over 13 years
Managing Since
Total Experience
Entry Load
N.A.
Options
Growth
Dividend
SIP
Monthly - Minimum 1000 & in multiplesof 1 thereafter for minimum six months(or) minimum 500 & in multiples of 1thereafter for minimum one year
Quarterly - Minimum 1500 & inmultiples of 1 thereafter for minimumone year
`
`
` `
`
`
Minimum Investment
` `5,000 & in multiples of 1
Exit LoadFor exit within 1 year from the date ofallotment
For 10% of investment : NilFor remaining investment: 1.00%
For exit after one year from the date ofallotment – Nil(w.e.f. February 13, 2014)
•
•
Additional Investment
` `1,000 & in multiples of 1
Benchmark
CRISIL Composite Bond Fund Index
Quantitative Data
Modified Duration
Average Maturity
Avg. Portfolio Yield
Total Expense Ratio
Regular
Direct
: 1.99
: 2.47
: 8.96
: 1.77%
: 1.12%
years
NET ASSET VALUE
Report As On
30/04/2014
TOP 10 HOLDINGS
For complete list of holdings please visit our website www.sbimf.com
RATING BREAKDOWN
SOV,AAA andEquivalent
NCA(Incl. Cash,Deposits and Equity)
ASSET ALLOCATION (in %)
AA+
AAUM for quarter ended Mar , 201431
` 4847.76 Crores
Plans AvailableRegular
Direct
An Open-ended Income Scheme
SBI Dynamic Bond FundThis product is suitable for investors who are seeking^:
• Regular income for medium term
nvestment in Debt/Money Market/Corporate Bonds/Government securities• I
• Low risk. (Blue)
^Investors should consult their financial advisers if in doubt about whether the product is suitable for them.
Note: Risk may be represented as: Investor understand that their principal will be atLow risk. (Blue); Medium risk. (Yellow); High risk. (Brown)
Issuer Name (%) OfTotal AUM
Total 78.12%
CORPORATION BANK 14.98%
POWER FINANCE CORPORATION LTD 10.92%
PUNJAB NATIONAL BANK 9.35%
HDFC LIMITED 8.54%
RURAL ELECTRIFICATION CORP LTD 7.92%
CANARA BANK 7.65%
GOVERNMENT OF INDIA 5.93%
LIC HOUSING FINANCE LTD 5.29%
BANK OF INDIA 4.39%
GOVERNMENT OF INDIA 3.15%
Option NAV ( )
SBI SDBF-Reg Plan-Growth 15.1724
SBI SDBF-Reg Plan-Dividend 11.4010
SBI SDBF-Dir Plan-Growth 15.2996
SBI SDBF-Dir Plan-Dividend 11.9146
`
33
4.11%7.32%
88.57%
37.10
0.10
3.15
5.93
44.49
1.91
7.32
0 10 20 30 40 50
CERTIFICATE OF DEPOSITS
COMMERCIAL PAPER
DATED GOVT SECURITIES
INFLATION INDEXED BONDS
NON-CONVERTIBLE DEBENTURE
TREASURY BILLS
NCA/CBLO/REVERSE REPO
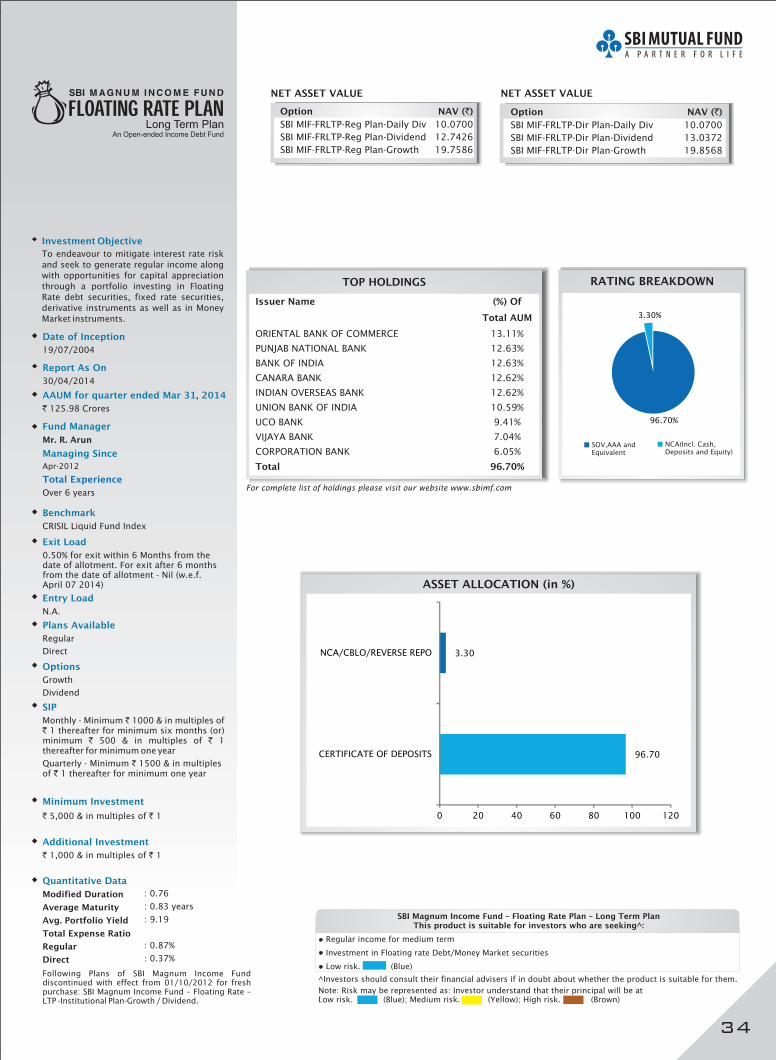
Investment Objective
To endeavour to mitigate interest rate risk
and seek to generate regular income along
with opportunities for capital appreciation
through a portfolio investing in Floating
Rate debt securities, fixed rate securities,
derivative instruments as well as in Money
Market instruments.
Date of Inception
19/07/2004
Fund Manager
Mr. R. Arun
Managing Since
Apr-2012
Over 6 years
Total Experience
Entry Load
N.A.
Exit Load
0.50% for exit within 6 Months from thedate of allotment. For exit after 6 monthsfrom the date of allotment - Nil (w.e.f.April 07 2014)
Benchmark
CRISIL Liquid Fund Index
NET ASSET VALUE NET ASSET VALUE
Report As On
30/04/2014
TOP HOLDINGS
For complete list of holdings please visit our website www.sbimf.com
RATING BREAKDOWN
SOV,AAA andEquivalent
NCA(Incl. Cash,Deposits and Equity)
ASSET ALLOCATION (in %)
AAUM for quarter ended Mar , 201431
` 125.98 Crores
Options
Growth
Dividend
SIP
Monthly - Minimum 1000 & in multiples of1 thereafter for minimum six months (or)
minimum 500 & in multiples of 1thereafter for minimum one year
Quarterly - Minimum 1500 & in multiplesof 1 thereafter for minimum one year
`
`
` `
`
`
Minimum Investment
` `5,000 & in multiples of 1
Additional Investment
` `1,000 & in multiples of 1
Quantitative Data
Modified Duration
Average Maturity
Avg. Portfolio Yield
Total Expense Ratio
Regular
Direct
: 0.76
: 0.83
: 9.19
: 0.87%
: 0.37%
years
Following Plans of SBI Magnum Income Funddiscontinued with effect from 01/10/2012
: SBI Magnum Income Fund – Floating Rate –LTP -Institutional Plan-Growth / Dividend.
for freshpurchase
Plans Available
Regular
Direct
An Open-ended Income Debt Fund
SBI Magnum Income Fund – Floating Rate Plan – Long Term PlanThis product is suitable for investors who are seeking^:
• Regular income for medium term
nvestment in Floating rate Debt/Money Market securities• I
• Low risk. (Blue)
^Investors should consult their financial advisers if in doubt about whether the product is suitable for them.
Note: Risk may be represented as: Investor understand that their principal will be atLow risk. (Blue); Medium risk. (Yellow); High risk. (Brown)
Issuer Name (%) Of
Total AUM
Total 96.70%
ORIENTAL BANK OF COMMERCE 13.11%
PUNJAB NATIONAL BANK 12.63%
BANK OF INDIA 12.63%
CANARA BANK 12.62%
INDIAN OVERSEAS BANK 12.62%
UNION BANK OF INDIA 10.59%
UCO BANK 9.41%
VIJAYA BANK 7.04%
CORPORATION BANK 6.05%
Option NAV ( )
SBI MIF-FRLTP-Reg Plan-Daily Div 10.0700
SBI MIF-FRLTP-Reg Plan-Dividend 12.7426
SBI MIF-FRLTP-Reg Plan-Growth 19.7586
` Option NAV ( )
SBI MIF-FRLTP-Dir Plan-Daily Div 10.0700
SBI MIF-FRLTP-Dir Plan-Dividend 13.0372
SBI MIF-FRLTP-Dir Plan-Growth 19.8568
`
34
96.70%
3.30%
96.70
3.30
0 20 40 60 80 100 120
CERTIFICATE OF DEPOSITS
NCA/CBLO/REVERSE REPO
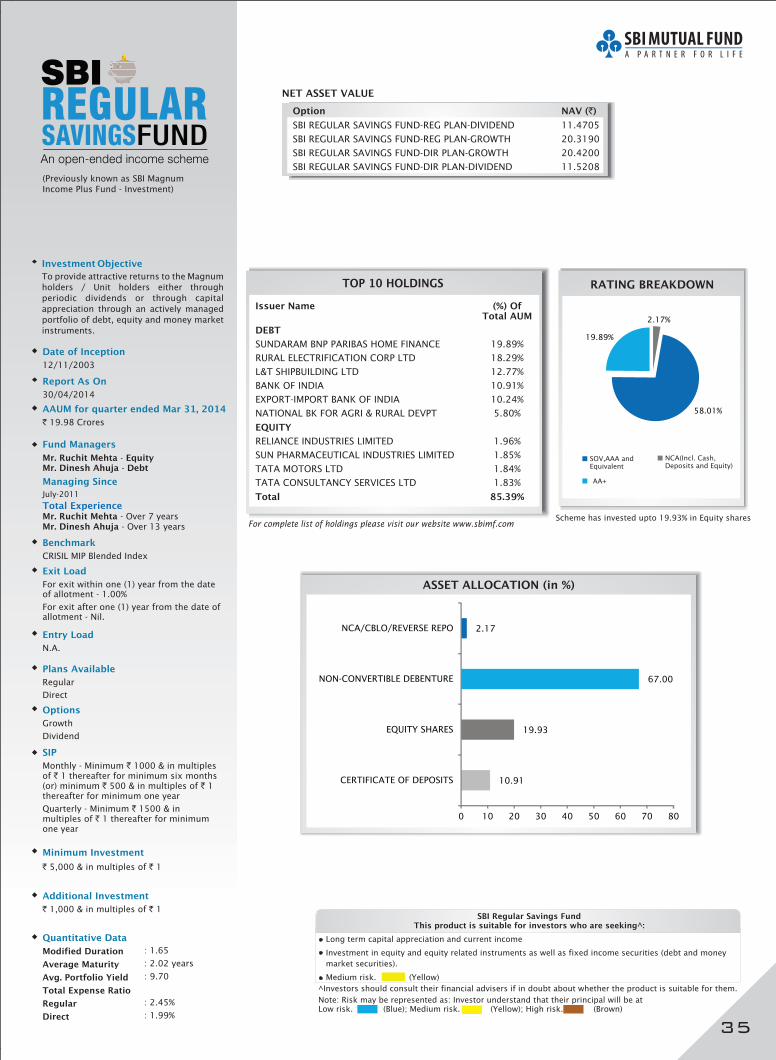
Investment Objective
To provide attractive returns to the Magnum
holders / Unit holders either through
periodic dividends or through capital
appreciation through an actively managed
portfolio of debt, equity and money market
instruments.
Date of Inception
12/11/2003
Fund Managers
Mr. Ruchit Mehta EquityMr. Dinesh Ahuja Debt
--
Managing Since
July-2011
Total ExperienceMr. Ruchit MehtaMr. Dinesh Ahuja
--Over 7 yearsOver 13 years
Entry Load
N.A.
Options
Growth
Dividend
SIP
Monthly - Minimum 1000 & in multiplesof 1 thereafter for minimum six months(or) minimum 500 & in multiples of 1thereafter for minimum one year
Quarterly - Minimum 1500 & inmultiples of 1 thereafter for minimumone year
`
`
` `
`
`
Minimum Investment
` `5,000 & in multiples of 1
Exit Load
For exit within one (1) year from the dateof allotment - 1.00%
For exit after one (1) year from the date ofallotment - Nil.
Additional Investment
` `1,000 & in multiples of 1
Benchmark
CRISIL MIP Blended Index
Quantitative Data
Modified Duration
Average Maturity
Avg. Portfolio Yield
Total Expense Ratio
Regular
Direct
: 1.65
: 2.02
: 9.70
: 2.45%
: 1.99%
years
NET ASSET VALUE
Report As On
30/04/2014
TOP 10 HOLDINGS
For complete list of holdings please visit our website www.sbimf.com
RATING BREAKDOWN
ASSET ALLOCATION (in %)
AAUM for quarter ended Mar , 201431
` 19.98 Crores
SOV,AAA andEquivalent
NCA(Incl. Cash,Deposits and Equity)
AA+
An open-ended income scheme
(Previously known as SBI MagnumIncome Plus Fund - Investment)
Plans Available
Regular
Direct
SBI Regular Savings FundThis product is suitable for investors who are seeking^:
• Long term capital appreciation and current income
• Investment in equity and equity related instruments as well as fixed income securities (debt and money
market securities).
• Medium risk. (Yellow)
^Investors should consult their financial advisers if in doubt about whether the product is suitable for them.
Note: Risk may be represented as: Investor understand that their principal will be atLow risk. (Blue); Medium risk. (Yellow); High risk. (Brown)
Issuer Name (%) OfTotal AUM
DEBT
EQUITY
Total 85.39%
SUNDARAM BNP PARIBAS HOME FINANCE 19.89%
RURAL ELECTRIFICATION CORP LTD 18.29%
L&T SHIPBUILDING LTD 12.77%
BANK OF INDIA 10.91%
EXPORT-IMPORT BANK OF INDIA 10.24%
NATIONAL BK FOR AGRI & RURAL DEVPT 5.80%
RELIANCE INDUSTRIES LIMITED 1.96%
SUN PHARMACEUTICAL INDUSTRIES LIMITED 1.85%
TATA MOTORS LTD 1.84%
TATA CONSULTANCY SERVICES LTD 1.83%
Option NAV ( )`
SBI REGULAR SAVINGS FUND-REG PLAN-DIVIDEND 11.4705
SBI REGULAR SAVINGS FUND-REG PLAN-GROWTH 20.3190
SBI REGULAR SAVINGS FUND-DIR PLAN-GROWTH 20.4200
SBI REGULAR SAVINGS FUND-DIR PLAN-DIVIDEND 11.5208
35
Scheme has investe upto 19.93% in Equity sharesd
10.91
19.93
67.00
2.17
0 10 20 30 40 50 60 70 80
CERTIFICATE OF DEPOSITS
EQUITY SHARES
NON-CONVERTIBLE DEBENTURE
NCA/CBLO/REVERSE REPO
2.17%
58.01%
19.89%

Investment Objective
To provide the investors an opportunity to
earn returns through investment in debt &
money market securities, while having the
benefit of a very high degree of liquidity.
Date of Inception
21/05/1999
Fund Manager
Mr. Rajeev Radhakrishnan
May-2010
Managing Since
Total Experience
Over 10 years
Entry Load
N.A.
Options
Growth
Dividend
SIP
N.A.
Minimum Investment
` `5,000 & in multiples of 1
Exit Load
0.10% for exit within 3 business days fromthe date of allotment
Additional Investment
` `1,000 & in multiples of 1
Benchmark
CRISIL Liquid Fund Index
Quantitative Data
Modified Duration
Average Maturity
Avg. Portfolio Yield
Total Expense Ratio
Regular
Direct
: 0.07
: 0.07
: 9.25
: 0.28%
: 0.18%
years
NET ASSET VALUE NET ASSET VALUE
Report As On
30/04/2014
TOP 10 HOLDINGS
For complete list of holdings please visit our website www.sbimf.com
ASSET ALLOCATION (in %)
AAUM for quarter ended Mar , 201431
` 3528.09 Crores
Plans Available
Regular
Direct
RATING BREAKDOWN
SOV,AAA andEquivalent
NCA(Incl. Cash,Deposits and Equity)
SBI Magnum InstaCash FundThis product is suitable for investors who are seeking^:
• Regular income for short term
nvestment in Debt and Money Market securities• I
• Low risk. (Blue)
^Investors should consult their financial advisers if in doubt about whether the product is suitable for them.
Note: Risk may be represented as: Investor understand that their principal will be atLow risk. (Blue); Medium risk. (Yellow); High risk. (Brown)
Issuer Name (%) OfTotal AUM
Total 64.98%
ANDHRA BANK 10.71%
UCO BANK 9.78%
ALLAHABAD BANK 7.16%
SIDBI LIMITED 7.11%
MAHINDRA & MAHIDRA FIN. SER. LTD 7.08%
INDUSIND BANK LTD 5.35%
DENA BANK 5.33%
TITAN COMPANY LIMITED 5.31%
ICICI BANK LTD 3.58%
ECL FINANCE LTD 3.56%
Option NAV ( )`
SBI MICF-Reg Plan-Cash Plan 2858.5527
SBI MICF-Reg Plan-Weekly Div 1078.6359
SBI MICF-Reg Plan-Daily Div 1675.0300
Option NAV ( )
SBI MICF-Dir Plan-Cash 2861.1986
SBI MICF-Dir Plan-Daily Div 1675.0300
SBI MICF-Dir Plan-Weekly Div 1078.6479
`
NET ASSET VALUE
36
83.80%
16.20%
47.24
36.56
12.47
3.73
0 10 20 30 40 50
CERTIFICATE OF DEPOSITS
COMMERCIAL PAPER
SHORT TERM DEPOSITS
NCA/CBLO/REVERSE REPO
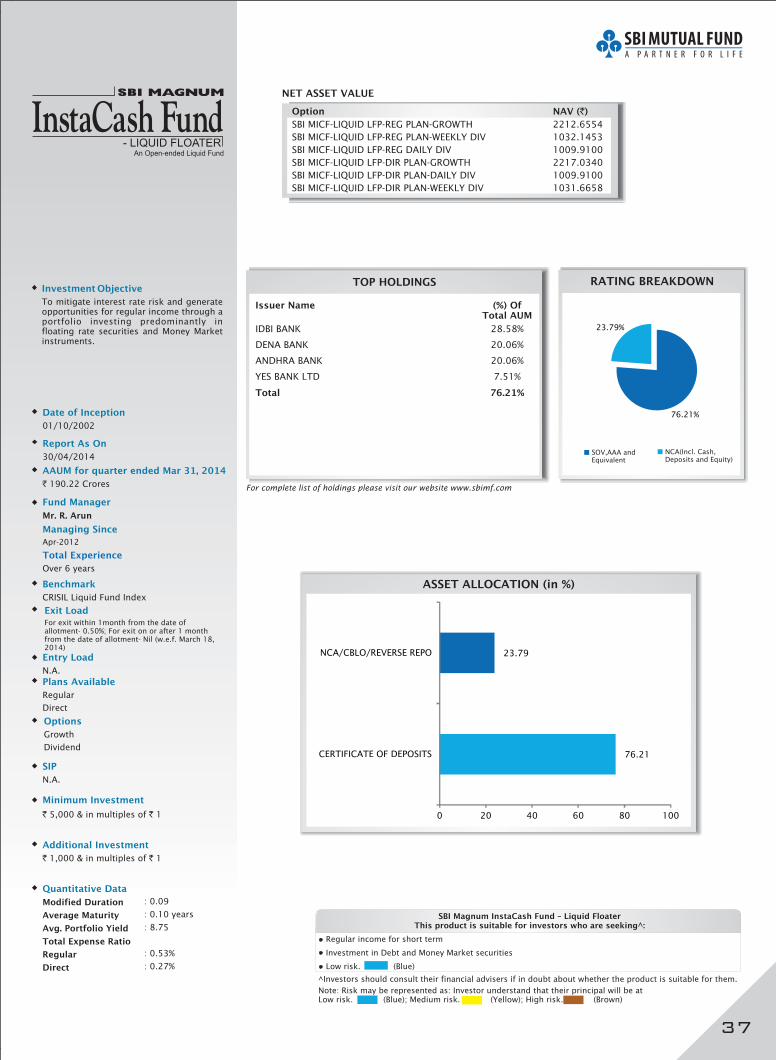
Investment Objective
To mitigate interest rate risk and generateopportunities for regular income through aportfolio investing predominantly infloating rate securities and Money Marketinstruments.
Date of Inception
01/10/2002
Fund Manager
Mr. R. Arun
Managing Since
Apr-2012
Total Experience
Over 6 years
Entry Load
N.A.
Options
Growth
Dividend
SIP
N.A.
Minimum Investment
` `5,000 & in multiples of 1
Exit LoadFor exit within 1month from the date ofallotment- 0.50%; For exit on or after 1 monthfrom the date of allotment- Nil (w.e.f. March 18,2014)
Additional Investment
` `1,000 & in multiples of 1
Benchmark
CRISIL Liquid Fund Index
Quantitative Data
Modified Duration
Average Maturity
Avg. Portfolio Yield
Total Expense Ratio
Regular
Direct
: 0.09
: 0.10
: 8.75
: 0.53%
: 0.27%
years
Option NAV ( )`
SBI MICF-LIQUID LFP-REG PLAN-GROWTH 2212.6554
SBI MICF-LIQUID LFP-REG PLAN-WEEKLY DIV 1032.1453
SBI MICF-LIQUID LFP-REG DAILY DIV 1009.9100
SBI MICF-LIQUID LFP-DIR PLAN-GROWTH 2217.0340
SBI MICF-LIQUID LFP-DIR PLAN-DAILY DIV 1009.9100
SBI MICF-LIQUID LFP-DIR PLAN-WEEKLY DIV 1031.6658
NET ASSET VALUE
Report As On
30/04/2014
TOP HOLDINGS
For complete list of holdings please visit our website www.sbimf.com
RATING BREAKDOWN
ASSET ALLOCATION (in %)
AAUM for quarter ended Mar , 201431
` 190.22 Crores
Plans Available
Regular
Direct
An Open-ended Liquid Fund
SBI Magnum InstaCash Fund – Liquid FloaterThis product is suitable for investors who are seeking^:
• Regular income for short term
nvestment in Debt and Money Market securities• I
• Low risk. (Blue)
^Investors should consult their financial advisers if in doubt about whether the product is suitable for them.
Note: Risk may be represented as: Investor understand that their principal will be atLow risk. (Blue); Medium risk. (Yellow); High risk. (Brown)
Issuer Name (%) OfTotal AUM
Total 76.21%
IDBI BANK 28.58%
DENA BANK 20.06%
ANDHRA BANK 20.06%
YES BANK LTD 7.51%
SOV,AAA andEquivalent
NCA(Incl. Cash,Deposits and Equity)
37
76.21%
23.79%
76.21
23.79
0 20 40 60 80 100
CERTIFICATE OF DEPOSITS
NCA/CBLO/REVERSE REPO
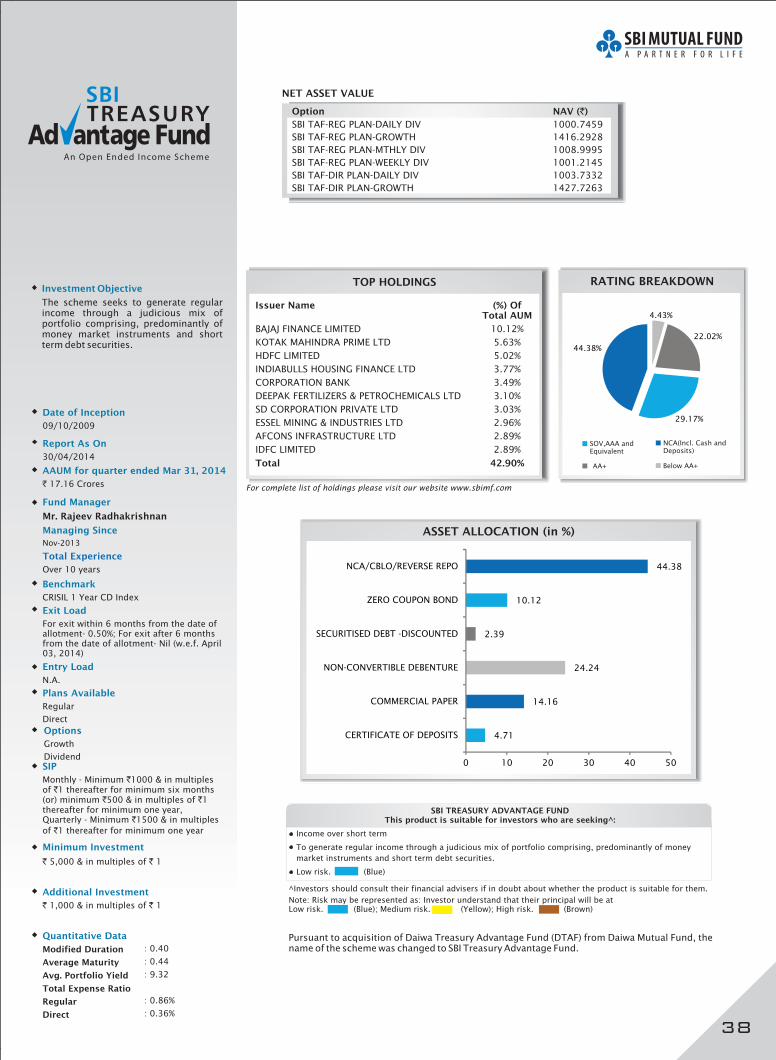
Investment Objective
The scheme seeks to generate regularincome through a judicious mix ofportfolio comprising, predominantly ofmoney market instruments and shortterm debt securities.
Date of Inception
09/10/2009
Fund Manager
Mr. Rajeev Radhakrishnan
Managing Since
Nov-2013
Total Experience
Over 10 years
Entry Load
N.A.
Options
Growth
DividendSIP
Monthly - Minimum 1000 & in multiplesof 1 thereafter for minimum six months(or) minimum 500 & in multiples of 1thereafter for minimum one year,Quarterly - Minimum 1500 & in multiples
of 1 thereafter for minimum one year
`
`
` `
`
`
Minimum Investment
` `5,000 & in multiples of 1
Exit Load
For exit within 6 months from the date ofallotment- 0.50%; For exit after 6 monthsfrom the date of allotment- Nil (w.e.f. April03, 2014)
Additional Investment
` `1,000 & in multiples of 1
Benchmark
CRISIL 1 Year CD Index
Quantitative Data
Modified Duration
Average Maturity
Avg. Portfolio Yield
Total Expense Ratio
Regular
Direct
: 0.40
: 0.44
: 9.32
: 0.86%
: 0.36%
Option NAV ( )`
SBI TAF-REG PLAN-DAILY DIV 1000.7459
SBI TAF-REG PLAN-GROWTH 1416.2928
SBI TAF-REG PLAN-MTHLY DIV 1008.9995
SBI TAF-REG PLAN-WEEKLY DIV 1001.2145
SBI TAF-DIR PLAN-DAILY DIV 1003.7332
SBI TAF-DIR PLAN-GROWTH 1427.7263
NET ASSET VALUE
Report As On
30/04/2014
TOP HOLDINGS
For complete list of holdings please visit our website www.sbimf.com
RATING BREAKDOWN
ASSET ALLOCATION (in %)
AAUM for quarter ended Mar , 201431
` 17.16 Crores
Plans Available
Regular
Direct
Issuer Name (%) OfTotal AUM
Total 42.90%
BAJAJ FINANCE LIMITED 10.12%
KOTAK MAHINDRA PRIME LTD 5.63%
HDFC LIMITED 5.02%
INDIABULLS HOUSING FINANCE LTD 3.77%
CORPORATION BANK 3.49%
DEEPAK FERTILIZERS & PETROCHEMICALS LTD 3.10%
SD CORPORATION PRIVATE LTD 3.03%
ESSEL MINING & INDUSTRIES LTD 2.96%
AFCONS INFRASTRUCTURE LTD 2.89%
IDFC LIMITED 2.89%
SBI TREASURY ADVANTAGE FUNDThis product is suitable for investors who are seeking^:
• Income over short term
• To generate regular income through a judicious mix of portfolio comprising, predominantly of money
market instruments and short term debt securities.
Low risk. (Blue)
^Investors should consult their financial advisers if in doubt about whether the product is suitable for them.
Note: Risk may be represented as: Investor understand that their principal will be atLow risk. (Blue); Medium risk. (Yellow); High risk. (Brown)
38
Pursuant to acquisition of Daiwa Treasury Advantage Fund (DTAF) from Daiwa Mutual Fund, thename of the scheme was changed to SBI Treasury Advantage Fund.
SOV,AAA andEquivalent
NCA(Incl. Cash andDeposits)
Below AA+AA+
4.43%
22.02%
29.17%
44.38%
4.71
14.16
24.24
2.39
10.12
44.38
0 10 20 30 40 50
CERTIFICATE OF DEPOSITS
COMMERCIAL PAPER
NON-CONVERTIBLE DEBENTURE
SECURITISED DEBT -DISCOUNTED
ZERO COUPON BOND
NCA/CBLO/REVERSE REPO
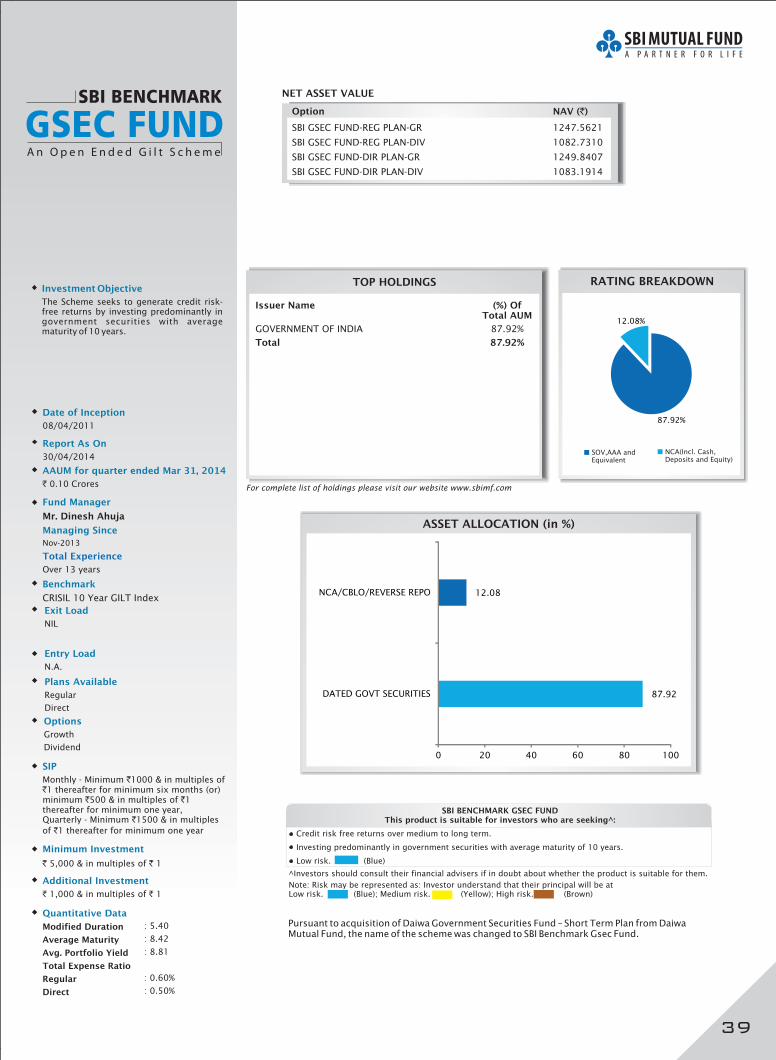
Investment Objective
The Scheme seeks to generate credit risk-free returns by investing predominantly ingovernment securities with averagematurity of 10 years.
Date of Inception
08/04/2011
Fund Manager
Mr. Dinesh Ahuja
Managing Since
Nov-2013
Total Experience
Over 13 years
Entry Load
N.A.
Options
Growth
Dividend
SIP
Monthly - Minimum 1000 & in multiples of1 thereafter for minimum six months (or)
minimum 500 & in multiples of 1thereafter for minimum one year,Quarterly - Minimum 1500 & in multiples
of 1 thereafter for minimum one year
`
`
` `
`
`
Minimum Investment
` `5,000 & in multiples of 1
Exit Load
NIL
Additional Investment
` `1,000 & in multiples of 1
Benchmark
CRISIL 10 Year GILT Index
Quantitative Data
Modified Duration
Average Maturity
Avg. Portfolio Yield
Total Expense Ratio
Regular
Direct
: 5.40
: 8.42
: 8.81
: 0.60%
: 0.50%
Option NAV ( )`
SBI GSEC FUND-REG PLAN-GR 1247.5621
SBI GSEC FUND-REG PLAN-DIV 1082.7310
SBI GSEC FUND-DIR PLAN-GR 1249.8407
SBI GSEC FUND-DIR PLAN-DIV 1083.1914
NET ASSET VALUE
Report As On
30/04/2014
TOP HOLDINGS
For complete list of holdings please visit our website www.sbimf.com
RATING BREAKDOWN
ASSET ALLOCATION (in %)
AAUM for quarter ended Mar , 201431
` 0.10 Crores
Plans Available
Regular
Direct
Issuer Name (%) OfTotal AUM
Total 87.92%
GOVERNMENT OF INDIA 87.92%
SBI BENCHMARK GSEC FUNDThis product is suitable for investors who are seeking^:
• Credit risk free returns over medium to long term.
• Investing predominantly in government securities with average maturity of 10 years.
• Low risk. (Blue)
^Investors should consult their financial advisers if in doubt about whether the product is suitable for them.
Note: Risk may be represented as: Investor understand that their principal will be atLow risk. (Blue); Medium risk. (Yellow); High risk. (Brown)
SOV,AAA andEquivalent
NCA(Incl. Cash,Deposits and Equity)
39
Pursuant to acquisition of Daiwa Government Securities Fund – Short Term Plan from DaiwaMutual Fund, the name of the scheme was changed to SBI Benchmark Gsec Fund.
87.92%
12.08%
87.92
12.08
0 20 40 60 80 100
DATED GOVT SECURITIES
NCA/CBLO/REVERSE REPO

Comparative Performance for all Schemes
Funds Managed by Mr. R. Srinivasan
Since Inception
Absolute Returns(%)
CAGRReturns (%)
PTP Returns(INR)
Absolute Returns(%)
Absolute Returns(%)
SBI Magnum Equity Fund
CNX Nifty Index (SchemeBenchmark)
S&P BSE SENSEX(Additional Benchmark)
Past performance may or may not be sustained in future. Returns (in %) other than since inception are absolute,calculated for dividend option and in INR are point-to-point (PTP) returns calculated on a standard investment of 10,000/-.It is assumed that dividends declared under the scheme have been reinvested at the then prevailing NAV. Growth optionintroduced on 27/11/2006. Additional benchmark as prescribed by SEBI for equity schemes is used for comparisonpurposes. Performancecalculated for Regular Plan
Performance of dividend plan for investor would be net of dividend distribution tax as applicable.
Since Inception
SBI Magnum Global Fund
Absolute Returns(%)
CAGRReturns (%)
PTP Returns(INR)
S&P BSE Midcap Index(Scheme Benchmark)
S&P BSE SENSEX(Additional Benchmark)
Absolute Returns(%)
Absolute Returns(%)
Past performance may or may not be sustained in future. Returns (in %) other than since inception are absolute,calculated for dividend option and in INR are point-to-point (PTP) returns calculated on a standard investment of 10,000/-.It is assumed that dividends declared under the scheme have been reinvested at the then prevailing NAV. Growth optionintroduced on 27/06/2005. Additional benchmark as prescribed by SEBI for equity schemes is used for comparisonpurposes. Performancecalculated for Regular Plan
Performance of dividend plan for investor would be net of dividend distribution tax as applicable.
Since Inception
SBI Emerging BusinessesFund - Growth
Absolute Returns(%)
CAGRReturns (%)
PTP Returns(INR)
S&P BSE 500 Index(Scheme Benchmark)
S&P BSE SENSEX(Additional Benchmark)
Absolute Returns(%)
Absolute Returns(%)
Past performance may or may not be sustained in future. Returns (in %) other than since inception are absolute,calculated for growth option and in INR are point-to-point (PTP) returns calculated on a standard investment of 10,000/-.Additional benchmark as prescribed by SEBI for equity schemes is used for comparison purposes. Performancecalculated for Regular Plan
Since Inception
SBI Contra Fund
Absolute Returns(%)
CAGRReturns (%)
PTP Returns(INR)
S&P BSE 100(Scheme Benchmark)
S&P BSE SENSEX(Additional Benchmark)
Absolute Returns(%)
Absolute Returns(%)
Past performance may or may not be sustained in future. Returns (in %) other than since inception are absolute,calculated for dividend option and in INR are point-to-point (PTP) returns calculated on a standard investment of 10,000/-.It is assumed that dividends declared under the scheme have been reinvested at the then prevailing NAV. Growth optionintroduced on 06/05/2005. Additional benchmark as prescribed by SEBI for equity schemes is used for comparisonpurposes. Performancecalculated for Regular Plan
Performance of dividend plan for investor would be net of dividend distribution tax as applicable.
Managing SinceMay-2009
Managing SinceMay-2009
Managing SinceMay-2009
Managing SinceJun-2011
16.21 8.68 -2.95 14.51 232718
17.98 7.31 -9.23 13.99 210196
18.85 8.23 -10.50 14.30 224028
26.68 10.10 9.19 13.92 127117
16.36 -4.02 -4.09 N.A. N.A.
18.85 8.23 -10.50 8.85 52292
10.46 20.71 12.39 20.53 59390
17.08 4.81 -9.11 14.68 36950
18.85 8.23 -10.50 15.72 40255
9.43 9.63 -7.16 20.52 156763
18.11 6.84 -9.23 13.21 62367
18.85 8.23 -10.50 11.83 51984
28 Mar 2013 - 30 Mar 2012 - 31 2011 -31 Mar 2014 28 Mar 2013 30 2012
MarMar
28 Mar 2013 - 30 Mar 2012 - 31 Mar 2011 -31 Mar 2014 28 Mar 2013 30 Mar 2012
28 Mar 2013 - 30 Mar 2012 - 31 Mar 2011 -31 Mar 2014 28 Mar 2013 30 Mar 2012
28 Mar 2013 - 30 Mar 2012 - 31 Mar 2011 -31 Mar 2014 28 Mar 2013 30 Mar 2012
Since Inception
SBI Magnum Multiplier PlusScheme 1993
Absolute Returns(%)
CAGRReturns (%)
PTP Returns(INR)
S&P BSE 200 Index(Scheme Benchmark)
S&P BSE SENSEX(Additional Benchmark)
Absolute Returns(%)
Absolute Returns(%)
Past performance may or may not be sustained in future. Returns (in %) other than since inception are absolute,calculated for dividend option and in INR are point-to-point (PTP) returns calculated on a standard investment of 10,000/-.It is assumed that dividends declared under the scheme have been reinvested at the then prevailing NAV. Growth optionintroduced on 25/05/2005. Additional benchmark as prescribed by SEBI for equity schemes is used for comparisonpurposes. Performancecalculated for Regular Plan
Performance of dividend plan for investor would be net of dividend distribution tax as applicable.
Funds Managed by Mr. Jayesh Shroff
Since Inception
SBI Magnum TaxgainScheme
Absolute Returns(%)
CAGRReturns (%)
PTP Returns(INR)
S&P BSE 100 Index(Scheme Benchmark)
S&P BSE SENSEX(Additional Benchmark)
Absolute Returns(%)
Absolute Returns(%)
Past performance may or may not be sustained in future. Returns (in %) other than since inception are absolute,calculated for dividend option and in INR are point-to-point (PTP) returns calculated on a standard investment of 10,000/-.It is assumed that dividends declared under the scheme have been reinvested at the then prevailing NAV. Growth optionintroduced on 07/05/2007. Additional benchmark as prescribed by SEBI for equity schemes is used for comparisonpurposes. Performancecalculated for Regular Plan
Performance of dividend plan for investor would be net of dividend distribution tax as applicable.
Since Inception
SBI Magnum Balanced Fund
Absolute Returns(%)
CAGRReturns (%)
PTP Returns(INR)
CRISIL Balanced FundIndex (Scheme Benchmark)
S&P BSE SENSEX(Additional Benchmark)
Absolute Returns(%)
Absolute Returns(%)
Past performance may or may not be sustained in future. Returns (in %) other than since inception are absolute,calculated for dividend option and in INR are point-to-point (PTP) returns calculated on a standard investment of 10,000/-.It is assumed that dividends declared under the scheme have been reinvested at the then prevailing NAV. Growth optionintroduced on 19/01/2005. Additional benchmark as prescribed by SEBI for equity schemes is used for comparisonpurposes. Performancecalculated for Regular Plan
Performance of dividend plan for investor would be net of dividend distribution tax as applicable.
Funds Managed by Mr. R. Srinivasan & Mr. Dinesh Ahuja
Managing SinceJan-2012
Managing SinceJun-2007
Managing SinceOct-2008
21.24 15.68 -6.67 15.84 151473
13.39 8.19 -3.17 N.A. N.A.
18.85 8.23 -10.50 10.42 62481
25.91 6.38 -1.84 13.85 154492
17.19 6.03 -9.28 11.12 92480
18.85 8.23 -10.50 10.80 87066
23.55 7.30 -2.86 16.33 240197
18.11 6.84 -9.23 12.24 113220
18.85 8.23 -10.50 11.48 98163
28 Mar 2013 - 30 Mar 2012 - 31 Mar 2011 -31 Mar 2014 28 Mar 2013 30 Mar 2012
28 Mar 2013 - 30 Mar 2012 - 31 Mar 2011 -31 Mar 2014 28 Mar 2013 30 Mar 2012
28 Mar 2013 - 30 Mar 2012 - 31 Mar 2011 -31 Mar 2014 28 Mar 2013 30 Mar 2012
Since Inception
SBI Small & Midcap Fund
Absolute Returns(%)
CAGRReturns (%)
PTP Returns(INR)
S&P BSE Small Cap Index(Scheme Benchmark)
S&P BSE SENSEX(Additional Benchmark)
Absolute Returns(%)
Absolute Returns(%)
Past performance may or may not be sustained in future. Returns (in %) other than since inception are absolute,calculated for growth option and in INR are point-to-point (PTP) returns calculated on a standard investment of 10,000/-.Additional benchmark as prescribed by SEBI for equity schemes is used for comparison purposes. Performancecalculated for Regular Plan
Managing SinceNov-2013
26.07 10.38 -8.49 9.55 15154
21.83 -12.44 -18.92 -0.34 9845
18.85 8.23 -10.50 7.38 13833
28 Mar 2013 - 30 Mar 2012 - 31 Mar 2011 -31 Mar 2014 28 Mar 2013 30 Mar 2012
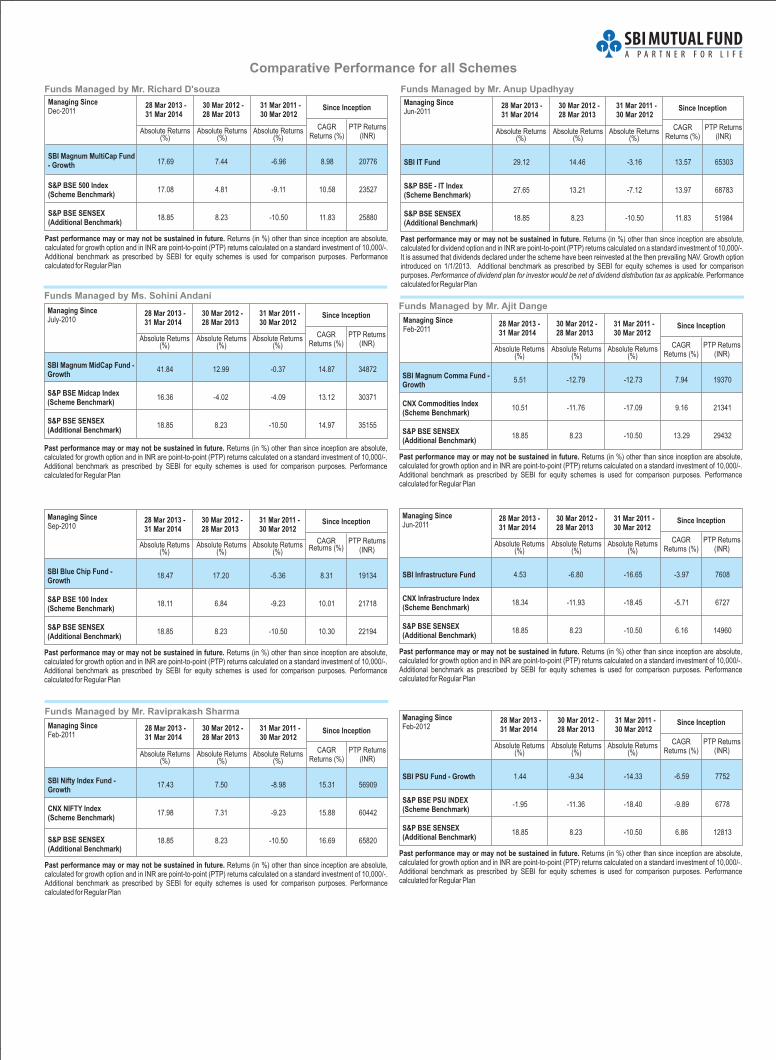
Comparative Performance for all Schemes
Funds Managed by Mr. Ajit Dange
Since Inception
SBI Magnum Comma Fund -Growth
Absolute Returns(%)
CAGRReturns (%)
PTP Returns(INR)
CNX Commodities Index(Scheme Benchmark)
S&P BSE SENSEX(Additional Benchmark)
Absolute Returns(%)
Absolute Returns(%)
Past performance may or may not be sustained in future. Returns (in %) other than since inception are absolute,calculated for growth option and in INR are point-to-point (PTP) returns calculated on a standard investment of 10,000/-.Additional benchmark as prescribed by SEBI for equity schemes is used for comparison purposes. Performancecalculated for Regular Plan
Managing SinceFeb-2011
5.51 -12.79 -12.73 7.94 19370
10.51 -11.76 -17.09 9.16 21341
18.85 8.23 -10.50 13.29 29432
28 Mar 2013 - 30 Mar 2012 - 31 Mar 2011 -31 Mar 2014 28 Mar 2013 30 Mar 2012
Since Inception
SBI Infrastructure Fund
Absolute Returns(%)
CAGRReturns (%)
PTP Returns(INR)
CNX Infrastructure Index(Scheme Benchmark)
S&P BSE SENSEX(Additional Benchmark)
Absolute Returns(%)
Absolute Returns(%)
Past performance may or may not be sustained in future. Returns (in %) other than since inception are absolute,calculated for growth option and in INR are point-to-point (PTP) returns calculated on a standard investment of 10,000/-.Additional benchmark as prescribed by SEBI for equity schemes is used for comparison purposes. Performancecalculated for Regular Plan
Managing SinceJun-2011
4.53 -6.80 -16.65 -3.97 7608
18.34 -11.93 -18.45 -5.71 6727
18.85 8.23 -10.50 6.16 14960
28 Mar 2013 - 30 Mar 2012 - 31 Mar 2011 -31 Mar 2014 28 Mar 2013 30 Mar 2012
Since Inception
SBI PSU Fund - Growth
Absolute Returns(%)
CAGRReturns (%)
PTP Returns(INR)
S&P BSE PSU INDEX(Scheme Benchmark)
S&P BSE SENSEX(Additional Benchmark)
Absolute Returns(%)
Absolute Returns(%)
Past performance may or may not be sustained in future. Returns (in %) other than since inception are absolute,calculated for growth option and in INR are point-to-point (PTP) returns calculated on a standard investment of 10,000/-.Additional benchmark as prescribed by SEBI for equity schemes is used for comparison purposes. Performancecalculated for Regular Plan
Managing SinceFeb-2012
1.44 -9.34 -14.33 -6.59 7752
-1.95 -11.36 -18.40 -9.89 6778
18.85 8.23 -10.50 6.86 12813
28 Mar 2013 - 30 Mar 2012 - 31 Mar 2011 -31 Mar 2014 28 Mar 2013 30 Mar 2012
Since Inception
SBI Magnum MidCap Fund -Growth
Absolute Returns(%)
CAGRReturns (%)
PTP Returns(INR)
S&P BSE Midcap Index(Scheme Benchmark)
S&P BSE SENSEX(Additional Benchmark)
Absolute Returns(%)
Absolute Returns(%)
Past performance may or may not be sustained in future. Returns (in %) other than since inception are absolute,calculated for growth option and in INR are point-to-point (PTP) returns calculated on a standard investment of 10,000/-.Additional benchmark as prescribed by SEBI for equity schemes is used for comparison purposes. Performancecalculated for Regular Plan
Since Inception
SBI Blue Chip Fund -Growth
Absolute Returns(%)
CAGRReturns (%)
PTP Returns(INR)
S&P BSE 100 Index(Scheme Benchmark)
S&P BSE SENSEX(Additional Benchmark)
Absolute Returns(%)
Absolute Returns(%)
Past performance may or may not be sustained in future. Returns (in %) other than since inception are absolute,calculated for growth option and in INR are point-to-point (PTP) returns calculated on a standard investment of 10,000/-.Additional benchmark as prescribed by SEBI for equity schemes is used for comparison purposes. Performancecalculated for Regular Plan
Since Inception
SBI Nifty Index Fund -Growth
Absolute Returns(%)
CAGRReturns (%)
PTP Returns(INR)
CNX NIFTY Index(Scheme Benchmark)
S&P BSE SENSEX(Additional Benchmark)
Absolute Returns(%)
Absolute Returns(%)
Past performance may or may not be sustained in future. Returns (in %) other than since inception are absolute,calculated for growth option and in INR are point-to-point (PTP) returns calculated on a standard investment of 10,000/-.Additional benchmark as prescribed by SEBI for equity schemes is used for comparison purposes. Performancecalculated for Regular Plan
Funds Managed by Mr. Raviprakash Sharma
Managing SinceFeb-2011
Managing SinceJuly-2010
Managing SinceSep-2010
Funds Managed by Ms. Sohini Andani
17.43 7.50 -8.98 15.31 56909
17.98 7.31 -9.23 15.88 60442
18.85 8.23 -10.50 16.69 65820
18.47 17.20 -5.36 8.31 19134
18.11 6.84 -9.23 10.01 21718
18.85 8.23 -10.50 10.30 22194
41.84 12.99 -0.37 14.87 34872
16.36 -4.02 -4.09 13.12 30371
18.85 8.23 -10.50 14.97 35155
28 Mar 2013 - 30 Mar 2012 - 31 Mar 2011 -31 Mar 2014 28 Mar 2013 30 Mar 2012
28 Mar 2013 - 30 Mar 2012 - 31 Mar 2011 -31 Mar 2014 28 Mar 2013 30 Mar 2012
28 Mar 2013 - 30 Mar 2012 - 31 Mar 2011 -31 Mar 2014 28 Mar 2013 30 Mar 2012
Funds Managed by Mr. Anup Upadhyay
Since Inception
SBI IT Fund
Absolute Returns(%)
CAGRReturns (%)
PTP Returns(INR)
S&P BSE - IT Index(Scheme Benchmark)
S&P BSE SENSEX(Additional Benchmark)
Absolute Returns(%)
Absolute Returns(%)
Past performance may or may not be sustained in future. Returns (in %) other than since inception are absolute,calculated for dividend option and in INR are point-to-point (PTP) returns calculated on a standard investment of 10,000/-.It is assumed that dividends declared under the scheme have been reinvested at the then prevailing NAV. Growth optionintroduced on 1/1/2013. Additional benchmark as prescribed by SEBI for equity schemes is used for comparisonpurposes. Performancecalculated for Regular Plan
Performance of dividend plan for investor would be net of dividend distribution tax as applicable.
Managing SinceJun-2011
29.12 14.46 -3.16 13.57 65303
27.65 13.21 -7.12 13.97 68783
18.85 8.23 -10.50 11.83 51984
28 Mar 2013 - 30 Mar 2012 - 31 Mar 2011 -31 Mar 2014 28 Mar 2013 30 Mar 2012
Funds Managed by Mr. Richard D'souza
Since Inception
SBI Magnum MultiCap Fund- Growth
Absolute Returns(%)
CAGRReturns (%)
PTP Returns(INR)
S&P BSE 500 Index(Scheme Benchmark)
S&P BSE SENSEX(Additional Benchmark)
Absolute Returns(%)
Absolute Returns(%)
Past performance may or may not be sustained in future. Returns (in %) other than since inception are absolute,calculated for growth option and in INR are point-to-point (PTP) returns calculated on a standard investment of 10,000/-.Additional benchmark as prescribed by SEBI for equity schemes is used for comparison purposes. Performancecalculated for Regular Plan
Managing SinceDec-2011
17.69 7.44 -6.96 8.98 20776
17.08 4.81 -9.11 10.58 23527
18.85 8.23 -10.50 11.83 25880
28 Mar 2013 - 30 Mar 2012 - 31 Mar 2011 -31 Mar 2014 28 Mar 2013 30 Mar 2012
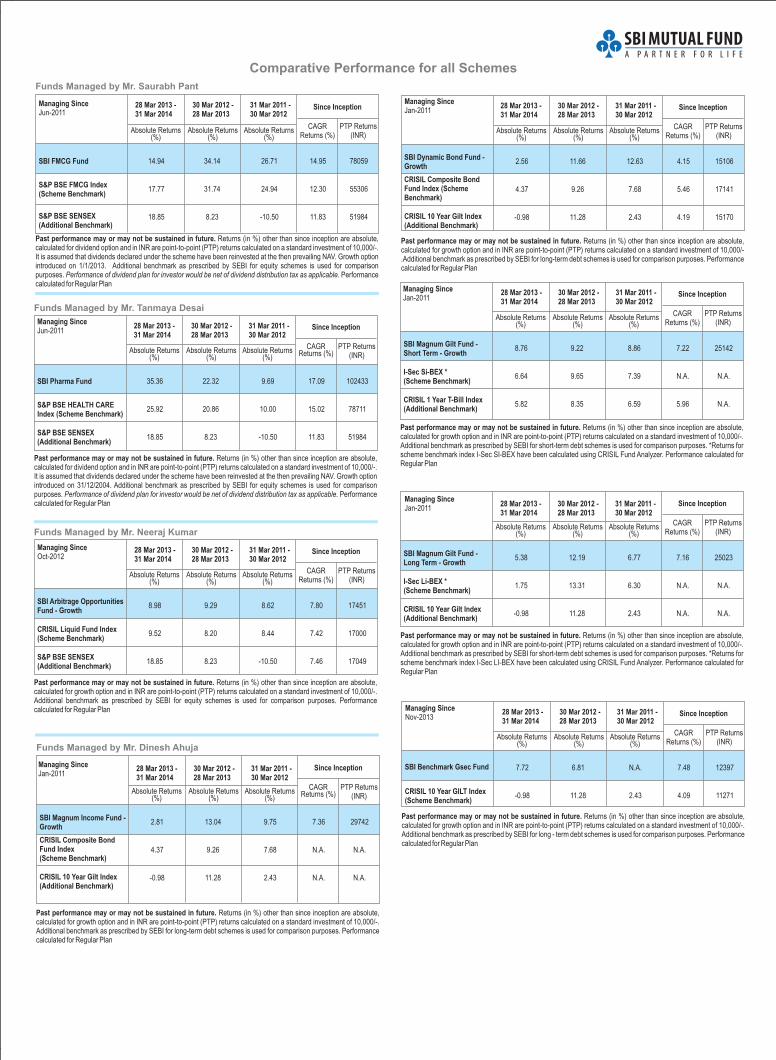
Comparative Performance for all Schemes
Since Inception
SBI Pharma Fund
Absolute Returns(%)
CAGRReturns (%)
PTP Returns(INR)
S&P BSE HEALTH CAREIndex (Scheme Benchmark)
S&P BSE SENSEX(Additional Benchmark)
Absolute Returns(%)
Absolute Returns(%)
Past performance may or may not be sustained in future. Returns (in %) other than since inception are absolute,calculated for dividend option and in INR are point-to-point (PTP) returns calculated on a standard investment of 10,000/-.It is assumed that dividends declared under the scheme have been reinvested at the then prevailing NAV. Growth optionintroduced on 31/12/2004. Additional benchmark as prescribed by SEBI for equity schemes is used for comparisonpurposes. Performancecalculated for Regular Plan
Performance of dividend plan for investor would be net of dividend distribution tax as applicable.
Funds Managed by Mr. Tanmaya Desai
Managing SinceJun-2011
Since Inception
SBI Arbitrage OpportunitiesFund - Growth
Absolute Returns(%)
CAGRReturns (%)
PTP Returns(INR)
CRISIL Liquid Fund Index(Scheme Benchmark)
S&P BSE SENSEX(Additional Benchmark)
Absolute Returns(%)
Absolute Returns(%)
Past performance may or may not be sustained in future. Returns (in %) other than since inception are absolute,calculated for growth option and in INR are point-to-point (PTP) returns calculated on a standard investment of 10,000/-.Additional benchmark as prescribed by SEBI for equity schemes is used for comparison purposes. Performancecalculated for Regular Plan
Funds Managed by Mr. Neeraj Kumar
Managing SinceOct-2012
Funds Managed by Mr. Dinesh Ahuja
Since Inception
SBI Magnum Income Fund -Growth
Absolute Returns(%)
CAGRReturns (%)
PTP Returns(INR)
CRISIL Composite BondFund Index(Scheme Benchmark)
CRISIL 10 Year Gilt Index(Additional Benchmark)
Absolute Returns(%)
Absolute Returns(%)
Past performance may or may not be sustained in future. Returns (in %) other than since inception are absolute,calculated for growth option and in INR are point-to-point (PTP) returns calculated on a standard investment of 10,000/-.Additional benchmark as prescribed by SEBI for long-term debt schemes is used for comparison purposes. Performancecalculated for Regular Plan
Managing SinceJan-2011
35.36 22.32 9.69 17.09 102433
25.92 20.86 10.00 15.02 78711
18.85 8.23 -10.50 11.83 51984
8.98 9.29 8.62 7.80 17451
9.52 8.20 8.44 7.42 17000
18.85 8.23 -10.50 7.46 17049
2.81 13.04 9.75 7.36 29742
4.37 9.26 7.68 N.A. N.A.
-0.98 11.28 2.43 N.A. N.A.
28 Mar 2013 - 30 Mar 2012 - 31 Mar 2011 -31 Mar 2014 28 Mar 2013 30 Mar 2012
28 Mar 2013 - 30 Mar 2012 - 31 Mar 2011 -31 Mar 2014 28 Mar 2013 30 Mar 2012
28 Mar 2013 - 30 Mar 2012 - 31 Mar 2011 -31 Mar 2014 28 Mar 2013 30 Mar 2012
Since Inception
SBI Dynamic Bond Fund -Growth
Absolute Returns(%)
CAGRReturns (%)
PTP Returns(INR)
CRISIL Composite BondFund Index (SchemeBenchmark)
CRISIL 10 Year Gilt Index(Additional Benchmark)
Absolute Returns(%)
Absolute Returns(%)
Past performance may or may not be sustained in future. Returns (in %) other than since inception are absolute,calculated for growth option and in INR are point-to-point (PTP) returns calculated on a standard investment of 10,000/-.Additional benchmark as prescribed by SEBI for long-term debt schemes is used for comparison purposes. Performancecalculated for Regular Plan
Managing SinceJan-2011
2.56 11.66 12.63 4.15 15106
4.37 9.26 7.68 5.46 17141
-0.98 11.28 2.43 4.19 15170
28 Mar 2013 - 30 Mar 2012 - 31 Mar 2011 -31 Mar 2014 28 Mar 2013 30 Mar 2012
Since Inception
SBI Magnum Gilt Fund -Long Term - Growth
Absolute Returns(%)
CAGRReturns (%)
PTP Returns(INR)
I-Sec Li-BEX *(Scheme Benchmark)
CRISIL 10 Year Gilt Index(Additional Benchmark)
Absolute Returns(%)
Absolute Returns(%)
Past performance may or may not be sustained in future. Returns (in %) other than since inception are absolute,calculated for growth option and in INR are point-to-point (PTP) returns calculated on a standard investment of 10,000/-.Additional benchmark as prescribed by SEBI for short-term debt schemes is used for comparison purposes. *Returns forscheme benchmark index I-Sec LI-BEX have been calculated using CRISIL Fund Analyzer. Performance calculated forRegular Plan
Since Inception
SBI Magnum Gilt Fund -Short Term - Growth
Absolute Returns(%)
CAGRReturns (%)
PTP Returns(INR)
I-Sec Si-BEX *(Scheme Benchmark)
CRISIL 1 Year T-Bill Index(Additional Benchmark)
Absolute Returns(%)
Absolute Returns(%)
Past performance may or may not be sustained in future. Returns (in %) other than since inception are absolute,calculated for growth option and in INR are point-to-point (PTP) returns calculated on a standard investment of 10,000/-.Additional benchmark as prescribed by SEBI for short-term debt schemes is used for comparison purposes. *Returns forscheme benchmark index I-Sec SI-BEX have been calculated using CRISIL Fund Analyzer. Performance calculated forRegular Plan
Managing SinceJan-2011
Managing SinceJan-2011
8.76 9.22 8.86 7.22 25142
6.64 9.65 7.39 N.A. N.A.
5.82 8.35 6.59 5.96 N.A.
5.38 12.19 6.77 7.16 25023
1.75 13.31 6.30 N.A. N.A.
-0.98 11.28 2.43 N.A. N.A.
28 Mar 2013 - 30 Mar 2012 - 31 Mar 2011 -31 Mar 2014 28 Mar 2013 30 Mar 2012
28 Mar 2013 - 30 Mar 2012 - 31 Mar 2011 -31 Mar 2014 28 Mar 2013 30 Mar 2012
Since Inception
SBI Benchmark Gsec Fund
Absolute Returns(%)
CAGRReturns (%)
PTP Returns(INR)
CRISIL 10 Year GILT Index(Scheme Benchmark)
Absolute Returns(%)
Absolute Returns(%)
Past performance may or may not be sustained in future. Returns (in %) other than since inception are absolute,calculated for growth option and in INR are point-to-point (PTP) returns calculated on a standard investment of 10,000/-.Additional benchmark as prescribed by SEBI for long - term debt schemes is used for comparison purposes. Performancecalculated for Regular Plan
Managing SinceNov-2013
7.72 6.81 N.A. 7.48 12397
-0.98 11.28 2.43 4.09 11271
28 Mar 2013 - 30 Mar 2012 - 31 Mar 2011 -31 Mar 2014 28 Mar 2013 30 Mar 2012
Past performance may or may not be sustained in future. Returns (in %) other than since inception are absolute,calculated for dividend option and in INR are point-to-point (PTP) returns calculated on a standard investment of 10,000/-.It is assumed that dividends declared under the scheme have been reinvested at the then prevailing NAV. Growth optionintroduced on 1/1/2013. Additional benchmark as prescribed by SEBI for equity schemes is used for comparisonpurposes. Performancecalculated for Regular Plan
Performance of dividend plan for investor would be net of dividend distribution tax as applicable.
Funds Managed by Mr. Saurabh Pant
Since Inception
SBI FMCG Fund
Absolute Returns(%)
CAGRReturns (%)
PTP Returns(INR)
S&P BSE FMCG Index(Scheme Benchmark)
S&P BSE SENSEX(Additional Benchmark)
Absolute Returns(%)
Absolute Returns(%)
Managing SinceJun-2011
14.94 34.14 26.71 14.95 78059
17.77 31.74 24.94 12.30 55306
18.85 8.23 -10.50 11.83 51984
28 Mar 2013 - 30 Mar 2012 - 31 Mar 2011 -31 Mar 2014 28 Mar 2013 30 Mar 2012
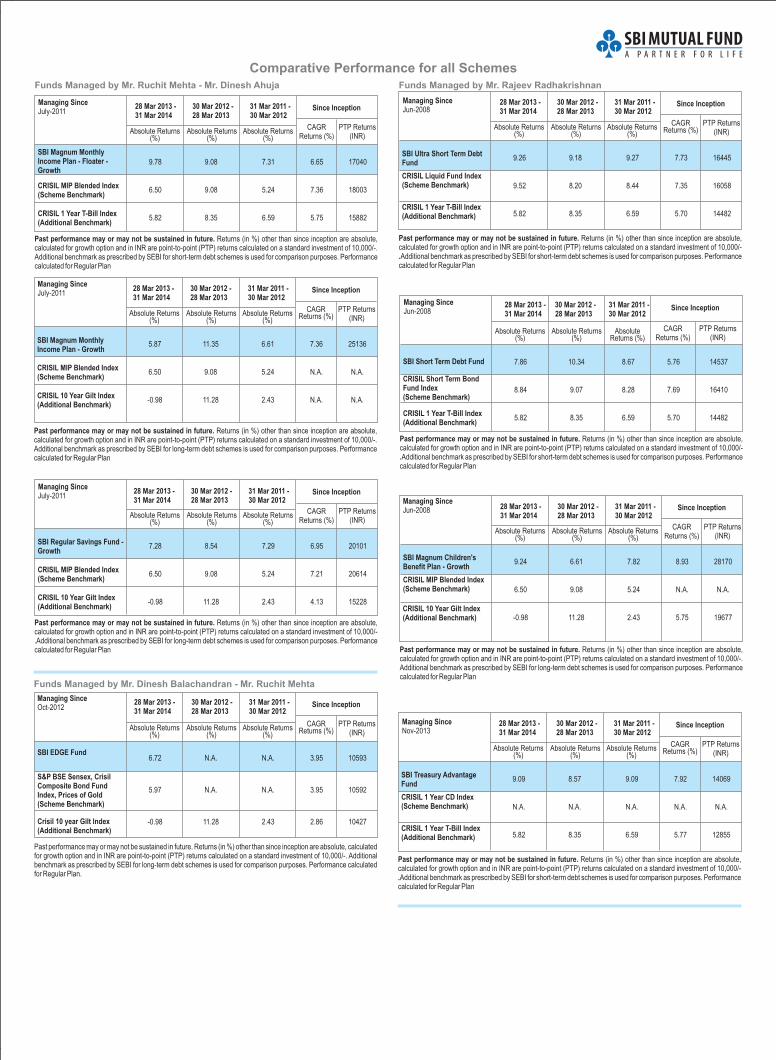
Funds Managed by Mr. Ruchit Mehta - Mr. Dinesh Ahuja
Since Inception
SBI Magnum MonthlyIncome Plan - Floater -Growth
Absolute Returns(%)
CAGRReturns (%)
PTP Returns(INR)
CRISIL MIP Blended Index(Scheme Benchmark)
CRISIL 1 Year T-Bill Index(Additional Benchmark)
Absolute Returns(%)
Absolute Returns(%)
Past performance may or may not be sustained in future. Returns (in %) other than since inception are absolute,calculated for growth option and in INR are point-to-point (PTP) returns calculated on a standard investment of 10,000/-.Additional benchmark as prescribed by SEBI for short-term debt schemes is used for comparison purposes. Performancecalculated for Regular Plan
Managing SinceJuly-2011
9.78 9.08 7.31 6.65 17040
6.50 9.08 5.24 7.36 18003
5.82 8.35 6.59 5.75 15882
28 Mar 2013 - 30 Mar 2012 - 31 Mar 2011 -31 Mar 2014 28 Mar 2013 30 Mar 2012
Comparative Performance for all Schemes
Since Inception
SBI Regular Savings Fund -Growth
Absolute Returns(%)
CAGRReturns (%)
PTP Returns(INR)
CRISIL MIP Blended Index(Scheme Benchmark)
CRISIL 10 Year Gilt Index(Additional Benchmark)
Absolute Returns(%)
Absolute Returns(%)
Past performance may or may not be sustained in future. Returns (in %) other than since inception are absolute,calculated for growth option and in INR are point-to-point (PTP) returns calculated on a standard investment of 10,000/-.Additional benchmark as prescribed by SEBI for long-term debt schemes is used for comparison purposes. Performancecalculated for Regular Plan
Managing SinceJuly-2011
7.28 8.54 7.29 6.95 20101
6.50 9.08 5.24 7.21 20614
-0.98 11.28 2.43 4.13 15228
28 Mar 2013 - 30 Mar 2012 - 31 Mar 2011 -31 Mar 2014 28 Mar 2013 30 Mar 2012
Since Inception
SBI Ultra Short Term DebtFund
Absolute Returns(%)
CAGRReturns (%)
PTP Returns(INR)
CRISIL Liquid Fund Index(Scheme Benchmark)
CRISIL 1 Year T-Bill Index(Additional Benchmark)
Absolute Returns(%)
Absolute Returns(%)
Past performance may or may not be sustained in future.
.
Returns (in %) other than since inception are absolute,calculated for growth option and in INR are point-to-point (PTP) returns calculated on a standard investment of 10,000/-Additional benchmark as prescribed by SEBI for short-term debt schemes is used for comparison purposes. Performance
calculated for Regular Plan
Funds Managed by Mr. Rajeev Radhakrishnan
Managing SinceJun-2008
9.26 9.18 9.27 7.73 16445
9.52 8.20 8.44 7.35 16058
5.82 8.35 6.59 5.70 14482
28 Mar 2013 - 30 Mar 2012 - 31 Mar 2011 -31 Mar 2014 28 Mar 2013 30 Mar 2012
Since Inception
SBI Magnum MonthlyIncome Plan - Growth
Absolute Returns(%)
CAGRReturns (%)
PTP Returns(INR)
CRISIL MIP Blended Index(Scheme Benchmark)
CRISIL 10 Year Gilt Index(Additional Benchmark)
Absolute Returns(%)
Absolute Returns(%)
Past performance may or may not be sustained in future. Returns (in %) other than since inception are absolute,calculated for growth option and in INR are point-to-point (PTP) returns calculated on a standard investment of 10,000/-.Additional benchmark as prescribed by SEBI for long-term debt schemes is used for comparison purposes. Performancecalculated for Regular Plan
Managing SinceJuly-2011
5.87 11.35 6.61 7.36 25136
6.50 9.08 5.24 N.A. N.A.
-0.98 11.28 2.43 N.A. N.A.
28 Mar 2013 - 30 Mar 2012 - 31 Mar 2011 -31 Mar 2014 28 Mar 2013 30 Mar 2012
Since Inception
SBI Short Term Debt Fund
Absolute Returns(%)
CRISIL Short Term BondFund Index(Scheme Benchmark)
CRISIL 1 Year T-Bill Index(Additional Benchmark)
Absolute Returns(%)
PTP Returns(INR)
Past performance may or may not be sustained in future.
.
Returns (in %) other than since inception are absolute,calculated for growth option and in INR are point-to-point (PTP) returns calculated on a standard investment of 10,000/-Additional benchmark as prescribed by SEBI for short-term debt schemes is used for comparison purposes. Performancecalculated for Regular Plan
Since Inception
SBI Magnum Children'sBenefit Plan - Growth
Absolute Returns(%)
CAGRReturns (%)
PTP Returns(INR)
CRISIL MIP Blended Index(Scheme Benchmark)
CRISIL 10 Year Gilt Index(Additional Benchmark)
Absolute Returns(%)
Absolute Returns(%)
Past performance may or may not be sustained in future. Returns (in %) other than since inception are absolute,calculated for growth option and in INR are point-to-point (PTP) returns calculated on a standard investment of 10,000/-.Additional benchmark as prescribed by SEBI for long-term debt schemes is used for comparison purposes. Performancecalculated for Regular Plan
AbsoluteReturns (%)
Managing SinceJun-2008
Managing SinceJun-2008
CAGRReturns (%)
7.86 10.34 8.67 5.76 14537
8.84 9.07 8.28 7.69 16410
5.82 8.35 6.59 5.70 14482
9.24 6.61 7.82 8.93 28170
6.50 9.08 5.24 N.A. N.A.
-0.98 11.28 2.43 5.75 19677
28 Mar 2013 - 30 Mar 2012 - 31 Mar 2011 -31 Mar 2014 28 Mar 2013 30 Mar 2012
28 Mar 2013 - 30 Mar 2012 - 31 Mar 2011 -31 Mar 2014 28 Mar 2013 30 Mar 2012
Since Inception
SBI Treasury AdvantageFund
Absolute Returns(%)
CAGRReturns (%)
PTP Returns(INR)
CRISIL 1 Year CD Index(Scheme Benchmark)
CRISIL 1 Year T-Bill Index(Additional Benchmark)
Absolute Returns(%)
Absolute Returns(%)
Past performance may or may not be sustained in future.
.
Returns (in %) other than since inception are absolute,calculated for growth option and in INR are point-to-point (PTP) returns calculated on a standard investment of 10,000/-Additional benchmark as prescribed by SEBI for short-term debt schemes is used for comparison purposes. Performance
calculated for Regular Plan
Managing SinceNov-2013
9.09 8.57 9.09 7.92 14069
N.A. N.A. N.A. N.A. N.A.
5.82 8.35 6.59 5.77 12855
28 Mar 2013 - 30 Mar 2012 - 31 Mar 2011 -31 Mar 2014 28 Mar 2013 30 Mar 2012
Since Inception
SBI EDGE Fund
Absolute Returns(%)
CAGRReturns (%)
PTP Returns(INR)
S&P BSE Sensex, CrisilComposite Bond FundIndex, Prices of Gold(Scheme Benchmark)
Crisil 10 year Gilt Index(Additional Benchmark)
Absolute Returns(%)
Absolute Returns(%)
Past performance may or may not be sustained in future. Returns (in %) other than since inception are absolute, calculatedfor growth option and in INR are point-to-point (PTP) returns calculated on a standard investment of 10,000/-. Additionalbenchmark as prescribed by SEBI for long-term debt schemes is used for comparison purposes. Performance calculatedfor Regular Plan.
Managing SinceOct-2012
6.72 N.A. N.A. 3.95 10593
5.97 N.A. N.A. 3.95 10592
-0.98 11.28 2.43 2.86 10427
28 Mar 2013 - 30 Mar 2012 - 31 Mar 2011 -31 Mar 2014 28 Mar 2013 30 Mar 2012
Funds Managed by Mr. Dinesh Balachandran - Mr. Ruchit Mehta
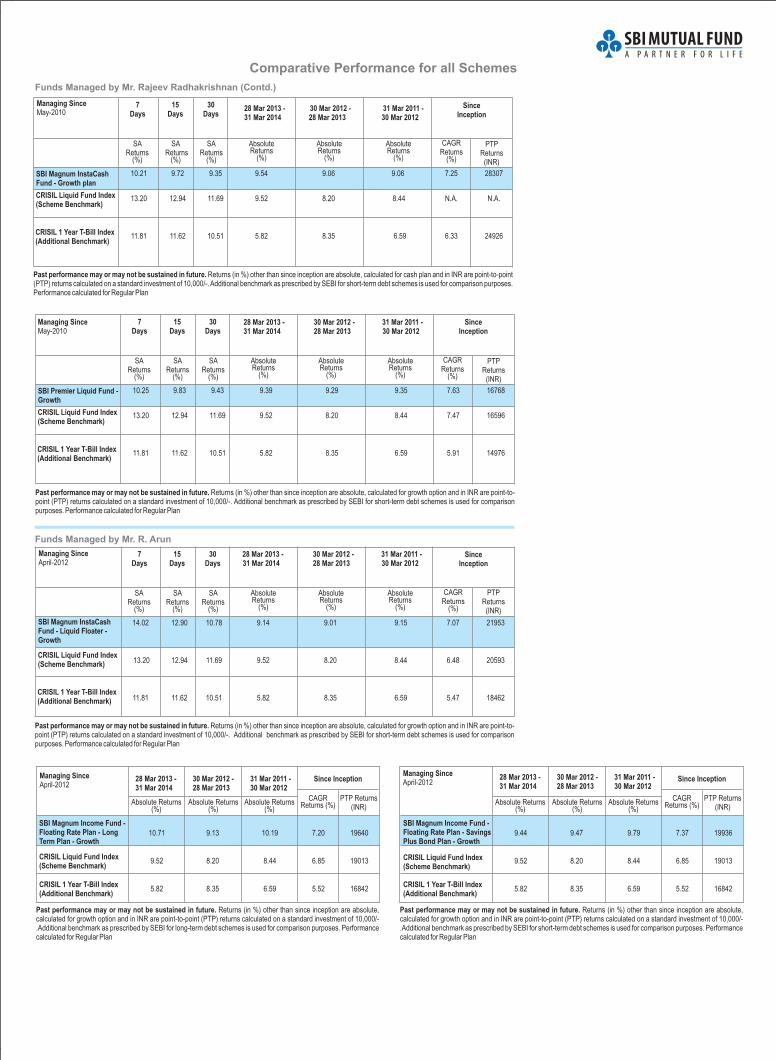
Comparative Performance for all Schemes
Since Inception
SBI Magnum Income Fund -Floating Rate Plan - SavingsPlus Bond Plan - Growth
Absolute Returns(%)
CAGRReturns (%)
PTP Returns(INR)
CRISIL Liquid Fund Index(Scheme Benchmark)
CRISIL 1 Year T-Bill Index(Additional Benchmark)
Absolute Returns(%)
Absolute Returns(%)
Past performance may or may not be sustained in future. Returns (in %) other than since inception are absolute,calculated for growth option and in INR are point-to-point (PTP) returns calculated on a standard investment of 10,000/-.Additional benchmark as prescribed by SEBI for short-term debt schemes is used for comparison purposes. Performancecalculated for Regular Plan
Managing SinceApril-2012
SBI
Growth
Magnum InstaCashFund - Liquid Floater -
CRISIL Liquid Fund Index(Scheme Benchmark)
CRISIL 1 Year T-Bill Index(Additional Benchmark)
7Days
SAReturns
(%)
15Days
SAReturns
(%)
30Days
SAReturns
(%)
AbsoluteReturns
(%)
AbsoluteReturns
(%)
AbsoluteReturns
(%)
PTPReturns
(INR)
CAGRReturns
(%)
Past performance may or may not be sustained in future.benchmark as prescribed by SEBI for short-term debt schemes is used for comparison
purposes.
Returns (in %) other than since inception are absolute, calculated for growth option and in INR are point-to-point (PTP) returns calculated on a standard investment of 10,000/-. Additional
Performance calculated for Regular Plan
SinceInception
Managing SinceApril-2012
Funds Managed by Mr. R. Arun
Since Inception
Absolute Returns(%)
CAGRReturns (%)
PTP Returns(INR)
Absolute Returns(%)
Absolute Returns(%)
Past performance may or may not be sustained in future. Returns (in %) other than since inception are absolute,calculated for growth option and in INR are point-to-point (PTP) returns calculated on a standard investment of 10,000/-.Additional benchmark as prescribed by SEBI for long-term debt schemes is used for comparison purposes. Performancecalculated for Regular Plan
SBI Magnum Income Fund -Floating Rate Plan - LongTerm Plan - Growth
CRISIL Liquid Fund Index(Scheme Benchmark)
CRISIL 1 Year T-Bill Index(Additional Benchmark)
Managing SinceApril-2012
14.02 12.90 10.78 9.14 9.01 9.15 7.07 21953
13.20 12.94 11.69 9.52 8.20 8.44 6.48 20593
11.81 11.62 10.51 5.82 8.35 6.59 5.47 18462
10.71 9.13 10.19 7.20 19640
9.52 8.20 8.44 6.85 19013
5.82 8.35 6.59 5.52 16842
9.44 9.47 9.79 7.37 19936
9.52 8.20 8.44 6.85 19013
5.82 8.35 6.59 5.52 16842
28 Mar 2013 - 30 Mar 2012 - 31 Mar 2011 -31 Mar 2014 28 Mar 2013 30 Mar 2012
28 Mar 2013 - 30 Mar 2012 - 31 Mar 2011 -31 Mar 2014 28 Mar 2013 30 Mar 2012
28 Mar 2013 - 30 Mar 2012 - 31 Mar 2011 -31 Mar 2014 28 Mar 2013 30 Mar 2012
SBI Premier Liquid Fund -Growth
CRISIL Liquid Fund Index(Scheme Benchmark)
CRISIL 1 Year T-Bill Index(Additional Benchmark)
7Days
SAReturns
(%)
15Days
SAReturns
(%)
30Days
SAReturns
(%)
AbsoluteReturns
(%)
AbsoluteReturns
(%)
AbsoluteReturns
(%)
PTPReturns
(INR)
CAGRReturns
(%)
SinceInception
Managing SinceMay-2010
10.25 9.83 9.43 9.39 9.29 9.35 7.63 16768
13.20 12.94 11.69 9.52 8.20 8.44 7.47 16596
11.81 11.62 10.51 5.82 8.35 6.59 5.91 14976
28 Mar 2013 - 30 2012 - 31 2011 -31 2014 28 2013 30 2012
Mar MarMar Mar Mar
Past performance may or may not be sustained in future.benchmark as prescribed by SEBI for short-term debt schemes is used for comparison
purposes.
Returns (in %) other than since inception are absolute, calculated for growth option and in INR are point-to-point (PTP) returns calculated on a standard investment of 10,000/-. Additional
Performance calculated for Regular Plan
Funds Managed by Mr. Rajeev Radhakrishnan (Contd.)
SBIGrowth plan
Magnum InstaCashFund -
CRISIL Liquid Fund Index(Scheme Benchmark)
CRISIL 1 Year T-Bill Index(Additional Benchmark)
7Days
10.21 9.72 9.35 9.54 9.06 9.06 7.25 28307
13.20 12.94 11.69 9.52 8.20 8.44 N.A. N.A.
11.81 11.62 10.51 5.82 8.35 6.59 6.33 24926
SAReturns
(%)
15Days
SAReturns
(%)
30Days
SAReturns
(%)
AbsoluteReturns
(%)
AbsoluteReturns
(%)
AbsoluteReturns
(%)
PTPReturns
(INR)
CAGRReturns
(%)
Past performance may or may not be sustained in future. Returns (in %) other than since inception are absolute, calculated for cash plan and in INR are point-to-point(PTP) returns calculated on a standard investment of 10,000/-. benchmark as prescribed by SEBI for short-term debt schemes is used for comparison purposes.AdditionalPerformance calculated for Regular Plan
SinceInception
Managing SinceMay-2010
28 Mar 2013 - 30 Mar 2012 - 31 Mar 2011 -31 Mar 2014 28 Mar 2013 30 Mar 2012
Disclaimer for data from CRISIL'S FUNDANALYSER:
Disclaimer:
Disclaimer of SBI Nifty Index Fund:
Mutual Fund Investments are subject to market risks, read all scheme related documents carefully.
Asset Management Company:
Trustee Company:
Registered Office:
CRISILhas taken due care and caution in compilation of
the Data contained in the CRISIL'S FUND ANALYSER. The Data in the CRISIL'S FUND ANALYSER has been
obtained by CRISIL from sources, which it considers reliable. However, CRISIL does not guarantee the
accuracy, adequacy or completeness of any Data in the CRISIL'S FUND ANALYSER and is not responsible for
any errors or omissions or for the results obtained from the use of such Data. CRISIL especially states that it has
no financial liability whatsoever to the users of CRISIL'S FUND ANALYSER. CRISIL or any of its directors/
employees/ representatives does not accept any liability for any direct or consequential loss arising from the use
of the Data contained in the CRISIL'S FUND ANALYSER or any data generated from the CRISIL'S FUND
ANALYSER.
This investment update is for information purpose only and is not an offer to sell or a solicitation to
buy any mutual fund units/securities. These views alone are not sufficient and should not be used for the
development or implementation of an investment strategy. It should not be construed as investment advice to any
party.All opinions and estimates included in this schemes guide constitute our view as of this date and are subject
to change without notice. Neither SBI Funds Management Private Limited, nor any person connected with it,
accepts any liability arising from the use of this information. The recipient of this material should rely on their own
investigations and take professional advice on their own.
In the preparation of the material contained in this document, the AMC has used information that is publicly
available, including information developed in-house. Information gathered and material used in this document is
believed to be from reliable sources published by third parties. While such publications are believed to be reliable,
however, neither the AMC, its officers, the trustees, the Fund nor any of their affiliates or representatives assume
any responsibility of the accuracy, reasonableness and/or completeness of any information. For data referred to
of any third party in this material no such party will assume any liability for the same. Further, all opinion included in
this newsletter are as of date and are subject to change without any notice. All recipients of this material should
seek appropriate professional advice and carefully read the scheme information document/ statement of
additional information and before dealing and or transacting in any of the products referred to in this material
make their own investigation.The Fund, the AMC and Trustees and any of its directors, officers, employees and
other personnel shall not liable for any loss, damage of any nature, including but not limited to direct, indirect,
punitive, special, exemplary, consequential, as also any loss of profit in any way arising from the use of this
material in any manner whatsoever. The recipient alone shall be fully responsible/are liable for any decision taken
on the basis of this material.
“The “SBI Nifty Index Fund” offered by “SBI Funds Management Private
Limited” is not sponsored, endorsed, sold or promoted by India Index Services & Products Limited (IISL) and its
affiliates. IISL do not make any representation or warranty, express or implied (including warranties of
merchantability or fitness for particular purpose or use) and disclaims all liability to the owners of “SBI Nifty Index
Fund” or any member of the public regarding the advisability of investing in securities generally or in the “SBI Nifty
Index Fund” linked to CNX Nifty Index or particularly in the ability of the CNX Nifty Index to track general stock
market performance in India. Please read the full Disclaimers in relation to the CNX Nifty Index in the Scheme
Information Document.”
SBI Funds Management Private Limited (A joint venture between SBI &
AMUNDI) CIN Nos: U65990MH1992PTC065289. SBI Mutual Fund Trustee Company
Private Limited 9th Floor, Crescenzo, C-38 & 39, G
Block, Bandra-Kurla Complex, Bandra (East), Mumbai 400 051. Tel.: 022-61793000 E-mail :
[email protected] • www. sbimf.com
CIN Nos: U65991MH2003PTC138496.

INVESTOR SERVICE CENTRES / INVESTOR SERVICE DESKS / INVESTOR SERVICE POINTS
NORTH
SOUTH
EAST
WEST
Investor Service Centres:
Investor Service Desks:
Investor Service Points:
Investor Service Centres:
Investor Service Desks:
Investor Service Centres:
Investor Service Desks:
Investor Service Centres:
Investor Service Desks:
Investor Service Points:
Chandigarh: (0172) 2709728 • Gurgaon: (0124) 4200828 • Jaipur: (0141) 2740016 /2740061 • Kanpur: (0512) 2331631 • Lucknow: 522 2286741, 2286742 • Ludhiana: (0161)2449849 • New Delhi: (011)23466666
Aligarh: (0571) 2402017 • Ambala: (0171) 2653400 • Bathinda: (0164) 2218415 • Dehradun:(0135) 2651719 • Dhanbad: (0326) 2301545 • Dharamshala: (01892) 225814 • Faizabad • Faridabad: (0129) 4030661 •Ferozepur: 9855008415 • Ghaziabad: 0120-2797582 Gorakhpur: (0551) 03378 • Gulbarga: 9980872463 • Haldwani:9412084061 • Hissar: 01662 238415 Hosiharpur: 0188-2228415 • Jabalpur: (0761) 2450542 Jalandhar: (0181)2238415 • Jammu: (0191) 2474975 • Jhansi: 0510-2330298 • Jodhpur: (0291) 2611928,(0291) 2611929 • Leh:09469468778 • Meerut: 9719998894 • Moradabad: (0591) 2411411 • Muzzaffarpur: 9473199059 • Panchakula:9592008415 • Panipat: (0180) 2648415 • Pathankot: 08872008415 • Patiala: 0175-2300058 • Rohtak: (0126) 2258415 •Saharanpur: 0132-2720789 • Shimla: (0177) 2807608 • Sonepat: 011- 23466666 • Udaipur: 9928191961 • Varanasi:0542-2222492
Nehru Place (Delhi): (011) 26224606 • Noida: (0120) 4232214 • Pitam Pura (Delhi): (011)23751974
Bangalore: 080-25580014 / 25580051 / 22122507 / 22272284 / 22123784 • Chennai: (044)2854 3382 / 3383, 044 2854 3384 / 3385 • Coimbatore: (0422) 2541666 • Ernakulam: (0484) 2318886,2318886,2323489• Hyderabad: (040) 24756241 • Thrivanthapuram: 0471-4011590 / 4011591 / 4011592 • Vijayawada: 0866 2436113 /2438217
Bareilly: 7830111140 • Belgaum: 0831-2422463 • Bellary: 08392-271775 • Calicut: 04952768270, 4020079 • Cuttack: 0671-2422972 • Davangere: 08192-231463 • Guntur: 0863-2211022 • Hubli: 0836-2368477 • Kannur 0497-2708180 • Kollam: na • Kottayam: 9562008100 • Kurnool: 07680004555 • Madurai:(0452)4374242 • Mangalore: (0824)2222463 • Mysore: (0821)4242919 • Nellore: 0861-2338688 • Pondichery:9445196934 • Rajahmundry: (0883)2434002 • Salem: 0427-4552289 • Shimoga: 8182222463 • Thiruchirapalli: 0431-4000667 • Thrissur: 8129354324 • Thrissur: 0487-2445700 • Tinsukia: 03742332365 • Tirunelveli: 0462 4220023 •Tirupati (0877)6450828 • Vellore: 0416-2225005 • Vishakapatnam: 0891-3293018 • Warangal: 0870-2430307
Bhubaneshwar: (0674) 2392401/501 • Guwahati: (0361) 2463704 • Kolkata: 22882342 /22883767 / 22883768 • Patna: (0612) 3242047 • Raipur: (0771) 2543355 / 4263256 • Ranchi: (0651) 2213413
Agartala: (0381) 2384107 • Asansol: 09800241133 • Balasore: (0678) 2262646 • Bhagalpur:(0641) 2420661 • Bhilai: (0788) 2273261 / 2272344 • Bokaro: 9304823011 • Bokaro: (06542) 232561 • Burdwan:09830896180 • Darbhanga: (0627) 2245004 • Dimapur: (0386) 2224267 • Durgapur: 2544191 / 192 • Gaya: (0631)2222405 • Hazaribagh: (06546) 270415 • Imphal: (0385) 2443689 • Itanagar: (0360) 2292416 • Jamshedpur: (0657)2440446 • Jorhat: (0376) 2932558 • Kalyani: 09830896180 • Kharagpur: (03222) 225592 • Malda: 09832499374 • PortBlair: 03192-230506 • Rourkela: (0661) 2400299 • Sambalpur: (0663) 2410001 • Shillong: 9436730174 • Silchar: (0384)2221109 • Siliguri: (0353) 2537065 • Sriganganagar: 9829067384
Ahmedabad: (079) 26423060 / 26463090 • Bhopal: (0755) 2557341 • Goa: (0832) 2235283 /6642475 • Indore: (0731) 2541141 • Mumbai: (022) 66532800 • Nagpur: (0712) 6458368 • Pune: (020) 25670961 • Surat:(0261) 2462764 / 3994800 / 6646555 • Vadodara: (0265) 2323010
Agra: (0562) 32555061 / 4008091 • Ajmer: (0145)2426284 • Allahabad: (0532) 2261028 •Alwar: (0144) 2332035 • Amravati: 08600017448 • Amritsar:(0183) 2221755 • Anand: (02692) 243210 • Aurangabad:(0240) 3244781 • Bavnagar: (0278) 2523788 • Bharuch: (02642) 247550 • Bhilwara: (0148) 2240122 • Bhuj: (02832)250900 • Bilaspur: (07752) 495006 • Gandhidham: (02836) 233615 • Gwalior (0751) 2447272 • Jalgaon: 09422283450 •Jamnagar: (0288) 2660104 • Junagadh: (0285) 2670350 • Kolhapur: (0231) 2680880 • Korba: 09826159729 • Kota:(0744) 2390631 • Margao: 09881148869 • Mehsana: (02762) 233872 • Nadiad: (0268) 2560110 • Nashik: (0253)6575888 / 2232553 • Navsari: (02637) 242266 • Raipur: (0771) 2543355 / 4263256 • Rajkot: (0281) 2239437 • Ratlam:07748800554 • Sagar: (0758) 2241367 • Solapur: 09226389292 • Srinagar: (0194) 2474864 • Valsad: (02632) 245440 •Vapi: (0260) 2400480
Borivali (Mumbai): (022) 28927551 / 28922741 • Chinchwad: (020) 27355721 • Kalyan: (0251)2311850 / 2311980 • Thane: (022) 25401690 / 25414594 • Vashi: (022) 27810371 / 27810368
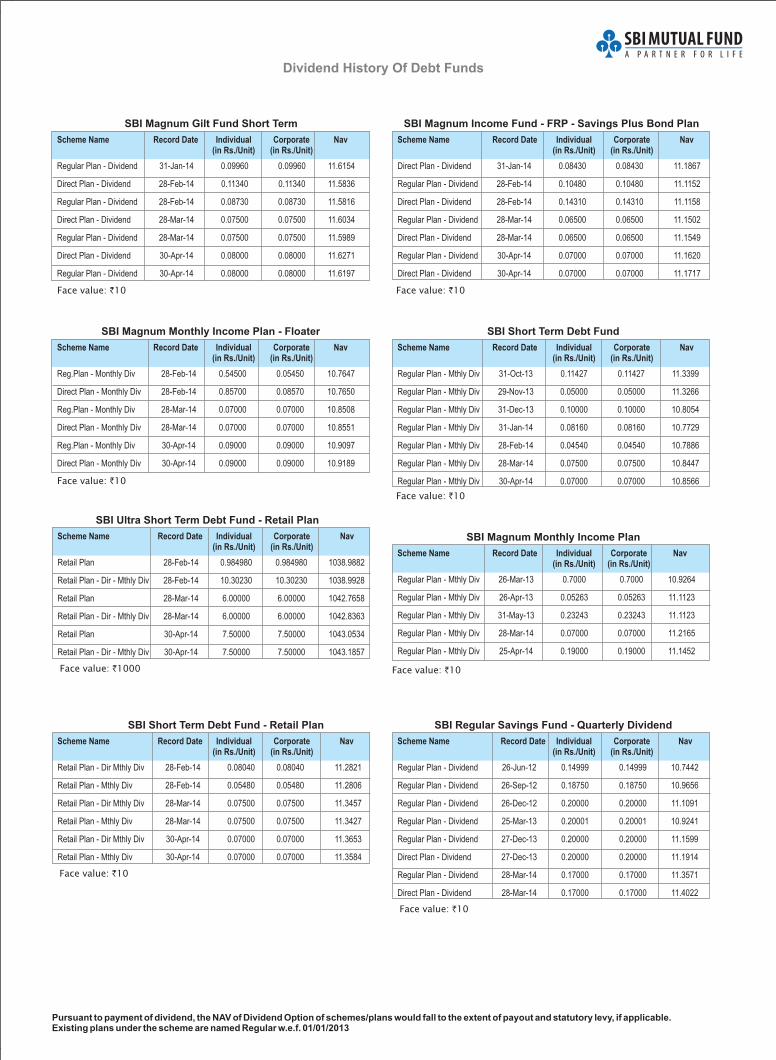
Dividend History Of Debt Funds
Pursuant to payment of dividend, the NAV of Dividend Option of schemes/plans would fall to the extent of payout and statutory levy, if applicable.Existing plans under the scheme named Regular w.e.f. 01/01/2013are
SBI Magnum Gilt Fund Short Term
31-Jan-14 0.09960 0.09960 11.6154
28-Feb-14 0.11340 0.11340 11.5836
28-Feb-14 0.08730 0.08730 11.5816
28-Mar-14 0.07500 0.07500 11.6034
28-Mar-14 0.07500 0.07500 11.5989
30-Apr-14 0.08000 0.08000 11.6197
30-Apr-14 0.08000 0.08000 11.6271
Scheme Name Record Date Individual Corporate Nav(in Rs./Unit) (in Rs./Unit)
Regular Plan - Dividend
Direct Plan - Dividend
Regular Plan - Dividend
Direct Plan - Dividend
Regular Plan - Dividend
Direct Plan - Dividend
Regular Plan - Dividend
Face value: 10`
SBI Regular Savings Fund - Quarterly Dividend
26-Jun-12 0.14999 0.14999 10.7442
26-Sep-12 0.18750 0.18750 10.9656
26-Dec-12 0.20000 0.20000 11.1091
25-Mar-13 0.20001 0.20001 10.9241
27-Dec-13 0.20000 0.20000 11.1599
27-Dec-13 0.20000 0.20000 11.1914
28-Mar-14 0.17000 0.17000 11.3571
28-Mar-14 0.17000 0.17000 11.4022
Scheme Name Record Date Individual Corporate Nav(in Rs./Unit) (in Rs./Unit)
Regular Plan - Dividend
Regular Plan - Dividend
Regular Plan - Dividend
Regular Plan - Dividend
Regular Plan - Dividend
Direct Plan - Dividend
Regular Plan - Dividend
Direct Plan - Dividend
Face value: 10`
SBI Magnum Income Fund - FRP - Savings Plus Bond Plan
31-Jan-14 0.08430 0.08430 11.1867
28-Feb-14 0.10480 0.10480 11.1152
28-Feb-14 0.14310 0.14310 11.1158
28-Mar-14 0.06500 0.06500 11.1502
28-Mar-14 0.06500 0.06500 11.1549
30-Apr-14 0.07000 0.07000 11.1620
30-Apr-14 0.07000 0.07000 11.1717
Scheme Name Record Date Individual Corporate Nav(in Rs./Unit) (in Rs./Unit)
Direct Plan - Dividend
Regular Plan - Dividend
Direct Plan - Dividend
Regular Plan - Dividend
Direct Plan - Dividend
Regular Plan - Dividend
Direct Plan - Dividend
SBI Magnum Monthly Income Plan
26-Mar-13 0.7000 0.7000 10.9264
26-Apr-13 0.05263 0.05263 11.1123
31-May-13 0.23243 0.23243 11.1123
28-Mar-14 0.07000 0.07000 11.2165
25-Apr-14 0.19000 0.19000 11.1452
Scheme Name Record Date Individual Corporate Nav(in Rs./Unit) (in Rs./Unit)
Regular Plan - Mthly Div
Regular Plan - Mthly Div
Regular Plan - Mthly Div
Regular Plan - Mthly Div
Regular Plan - Mthly Div
Face value: 10`
Face value: 10`
SBI Magnum Monthly Income Plan - Floater
28-Feb-14 0.54500 0.05450 10.7647
28-Feb-14 0.85700 0.08570 10.7650
28-Mar-14 0.07000 0.07000 10.8508
28-Mar-14 0.07000 0.07000 10.8551
30-Apr-14 0.09000 0.09000 10.9097
30-Apr-14 0.09000 0.09000 10.9189
Scheme Name Record Date Individual Corporate Nav(in Rs./Unit) (in Rs./Unit)
Reg.Plan - Monthly Div
Direct Plan - Monthly Div
Reg.Plan - Monthly Div
Direct Plan - Monthly Div
Reg.Plan - Monthly Div
Direct Plan - Monthly Div
Face value: 10`
SBI Short Term Debt Fund
31-Oct-13 0.11427 0.11427 11.3399
29-Nov-13 0.05000 0.05000 11.3266
31-Dec-13 0.10000 0.10000 10.8054
31-Jan-14 0.08160 0.08160 10.7729
28-Feb-14 0.04540 0.04540 10.7886
28-Mar-14 0.07500 0.07500 10.8447
30-Apr-14 0.07000 0.07000 10.8566
Scheme Name Record Date Individual Corporate Nav(in Rs./Unit) (in Rs./Unit)
Regular Plan - Mthly Div
Regular Plan - Mthly Div
Regular Plan - Mthly Div
Regular Plan - Mthly Div
Regular Plan - Mthly Div
Regular Plan - Mthly Div
Regular Plan - Mthly Div
Face value: 10`
SBI Ultra Short Term Debt Fund - Retail Plan
28-Feb-14 0.984980 0.984980 1038.9882
28-Feb-14 10.30230 10.30230 1038.9928
28-Mar-14 6.00000 6.00000 1042.7658
28-Mar-14 6.00000 6.00000 1042.8363
30-Apr-14 7.50000 7.50000 1043.0534
30-Apr-14 7.50000 7.50000 1043.1857
Scheme Name Record Date Individual Corporate Nav(in Rs./Unit) (in Rs./Unit)
Retail Plan
Retail Plan - Dir - Mthly Div
Retail Plan
Retail Plan - Dir - Mthly Div
Retail Plan
Retail Plan - Dir - Mthly Div
Face value: 1000`
SBI Short Term Debt Fund - Retail Plan
28-Feb-14 0.08040 0.08040 11.2821
28-Feb-14 0.05480 0.05480 11.2806
28-Mar-14 0.07500 0.07500 11.3457
28-Mar-14 0.07500 0.07500 11.3427
30-Apr-14 0.07000 0.07000 11.3653
30-Apr-14 0.07000 0.07000 11.3584
Scheme Name Record Date Individual Corporate Nav(in Rs./Unit) (in Rs./Unit)
Retail Plan - Dir Mthly Div
Retail Plan - Mthly Div
Retail Plan - Dir Mthly Div
Retail Plan - Mthly Div
Retail Plan - Dir Mthly Div
Retail Plan - Mthly Div
Face value: 10`
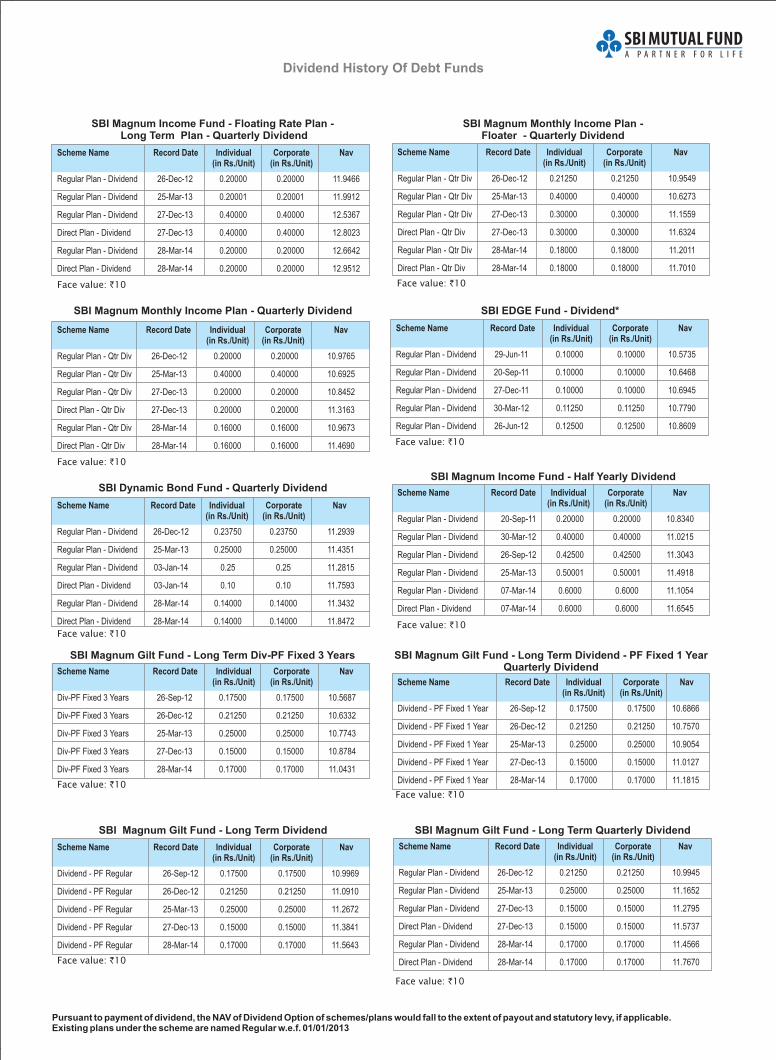
Dividend History Of Debt Funds
26-Dec-12 0.20000 0.20000 11.9466
25-Mar-13 0.20001 0.20001 11.9912
27-Dec-13 0.40000 0.40000 12.5367
27-Dec-13 0.40000 0.40000 12.8023
28-Mar-14 0.20000 0.20000 12.9512
28-Mar-14 0.20000 0.20000 12.6642
Scheme Name Record Date Individual Corporate Nav(in Rs./Unit) (in Rs./Unit)
Regular Plan - Dividend
Regular Plan - Dividend
Regular Plan - Dividend
Direct Plan - Dividend
Regular Plan - Dividend
Direct Plan - Dividend
SBI Magnum Monthly Income Plan - Quarterly Dividend
26-Dec-12 0.20000 0.20000 10.9765
25-Mar-13 0.40000 0.40000 10.6925
27-Dec-13 0.20000 0.20000 10.8452
27-Dec-13 0.20000 0.20000 11.3163
28-Mar-14 0.16000 0.16000 11.4690
28-Mar-14 0.16000 0.16000 10.9673
Scheme Name Record Date Individual Corporate Nav(in Rs./Unit) (in Rs./Unit)
Regular Plan - Qtr Div
Regular Plan - Qtr Div
Regular Plan - Qtr Div
Direct Plan - Qtr Div
Regular Plan - Qtr Div
Direct Plan - Qtr Div
SBI Magnum Income Fund - Floating Rate Plan -Long Term Plan - Quarterly Dividend
Face value: 10`
Face value: 10`
26-Dec-12 0.23750 0.23750 11.2939
25-Mar-13 0.25000 0.25000 11.4351
03-Jan-14 0.25 0.25 11.2815
03-Jan-14 0.10 0.10 11.7593
28-Mar-14 0.14000 0.14000 11.8472
28-Mar-14 0.14000 0.14000 11.3432
Scheme Name Record Date Individual Corporate Nav(in Rs./Unit) (in Rs./Unit)
Regular Plan - Dividend
Regular Plan - Dividend
Regular Plan - Dividend
Direct Plan - Dividend
Regular Plan - Dividend
Direct Plan - Dividend
SBI Dynamic Bond Fund - Quarterly Dividend
Face value: 10`
SBI Magnum Income Fund - Half Yearly Dividend
20-Sep-11 0.20000 0.20000 10.8340
30-Mar-12 0.40000 0.40000 11.0215
26-Sep-12 0.42500 0.42500 11.3043
25-Mar-13 0.50001 0.50001 11.4918
07-Mar-14 0.6000 0.6000 11.1054
07-Mar-14 0.6000 0.6000 11.6545
Scheme Name Record Date Individual Corporate Nav(in Rs./Unit) (in Rs./Unit)
Regular Plan - Dividend
Regular Plan - Dividend
Regular Plan - Dividend
Regular Plan - Dividend
Regular Plan - Dividend
Direct Plan - Dividend
Face value: 10`
SBI EDGE Fund - Dividend*
29-Jun-11 0.10000 0.10000 10.5735
20-Sep-11 0.10000 0.10000 10.6468
27-Dec-11 0.10000 0.10000 10.6945
30-Mar-12 0.11250 0.11250 10.7790
26-Jun-12 0.12500 0.12500 10.8609
Scheme Name Record Date Individual Corporate Nav(in Rs./Unit) (in Rs./Unit)
Regular Plan - Dividend
Regular Plan - Dividend
Regular Plan - Dividend
Regular Plan - Dividend
Regular Plan - Dividend
Face value: 10`
Pursuant to payment of dividend, the NAV of Dividend Option of schemes/plans would fall to the extent of payout and statutory levy, if applicable.Existing plans under the scheme are named Regular w.e.f. 01/01/2013
SBI Magnum Monthly Income Plan -Floater - Quarterly Dividend
26-Dec-12 0.21250 0.21250 10.9549
25-Mar-13 0.40000 0.40000 10.6273
27-Dec-13 0.30000 0.30000 11.1559
27-Dec-13 0.30000 0.30000 11.6324
28-Mar-14 0.18000 0.18000 11.2011
28-Mar-14 0.18000 0.18000 11.7010
Scheme Name Record Date Individual Corporate Nav(in Rs./Unit) (in Rs./Unit)
Regular Plan - Qtr Div
Regular Plan - Qtr Div
Regular Plan - Qtr Div
Direct Plan - Qtr Div
Regular Plan - Qtr Div
Direct Plan - Qtr Div
Face value: 10`
SBI Magnum Gilt Fund - Long Term Div-PF Fixed 3 Years
26-Sep-12 0.17500 0.17500 10.5687
26-Dec-12 0.21250 0.21250 10.6332
25-Mar-13 0.25000 0.25000 10.7743
27-Dec-13 0.15000 0.15000 10.8784
28-Mar-14 0.17000 0.17000 11.0431
Scheme Name Record Date Individual Corporate Nav(in Rs./Unit) (in Rs./Unit)
Div-PF Fixed 3 Years
Div-PF Fixed 3 Years
Div-PF Fixed 3 Years
Div-PF Fixed 3 Years
Div-PF Fixed 3 Years
Face value: 10`
26-Sep-12 0.17500 0.17500 10.9969
26-Dec-12 0.21250 0.21250 11.0910
25-Mar-13 0.25000 0.25000 11.2672
27-Dec-13 0.15000 0.15000 11.3841
28-Mar-14 0.17000 0.17000 11.5643
Scheme Name Record Date Individual Corporate Nav(in Rs./Unit) (in Rs./Unit)
Dividend - PF Regular
Dividend - PF Regular
Dividend - PF Regular
Dividend - PF Regular
Dividend - PF Regular
SBI Magnum Gilt Fund - Long Term Dividend
Face value: 10`
SBI Magnum Gilt Fund - Long Term Dividend - PF Fixed 1 YearQuarterly Dividend
26-Sep-12 0.17500 0.17500 10.6866
26-Dec-12 0.21250 0.21250 10.7570
25-Mar-13 0.25000 0.25000 10.9054
27-Dec-13 0.15000 0.15000 11.0127
28-Mar-14 0.17000 0.17000 11.1815
Scheme Name Record Date Individual Corporate Nav(in Rs./Unit) (in Rs./Unit)
Dividend - PF Fixed 1 Year
Dividend - PF Fixed 1 Year
Dividend - PF Fixed 1 Year
Dividend - PF Fixed 1 Year
Dividend - PF Fixed 1 Year
Face value: 10`
SBI Magnum Gilt Fund - Long Term Quarterly Dividend
Scheme Name Record Date Individual Corporate Nav(in Rs./Unit) (in Rs./Unit)
26-Dec-12 0.21250 0.21250 10.9945
25-Mar-13 0.25000 0.25000 11.1652
27-Dec-13 0.15000 0.15000 11.2795
27-Dec-13 0.15000 0.15000 11.5737
28-Mar-14 0.17000 0.17000 11.4566
28-Mar-14 0.17000 0.17000 11.7670
Face value: 10`
Regular Plan - Dividend
Regular Plan - Dividend
Regular Plan - Dividend
Direct Plan - Dividend
Regular Plan - Dividend
Direct Plan - Dividend
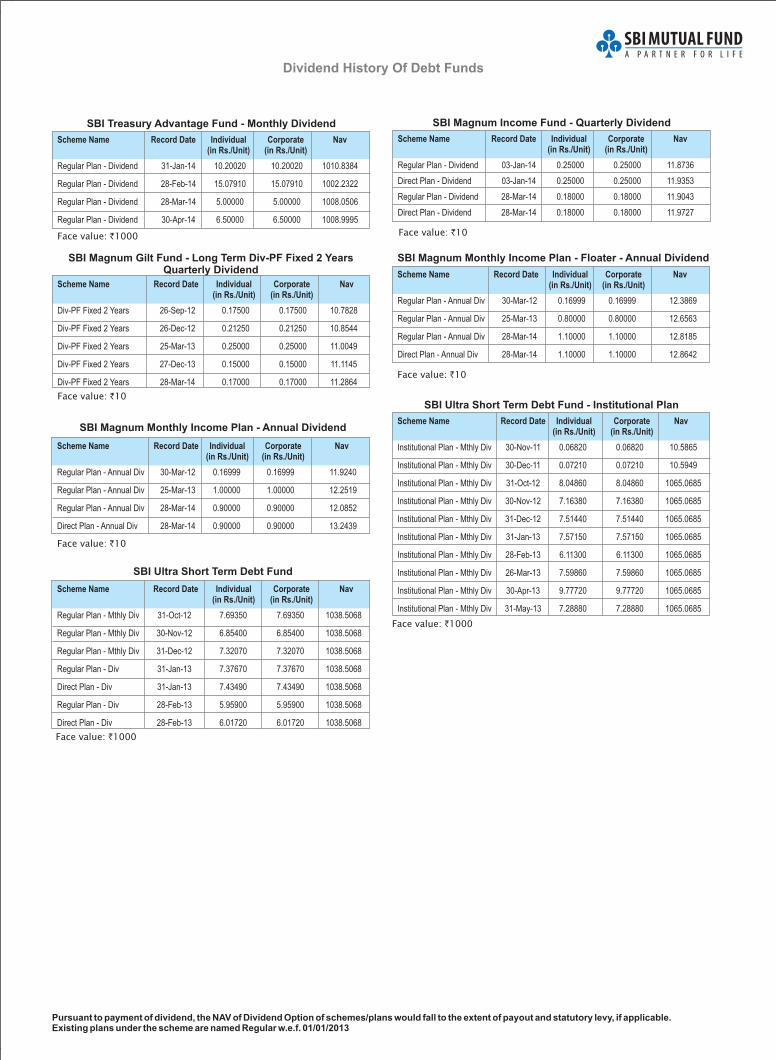
Dividend History Of Debt Funds
SBI Magnum Income Fund - Quarterly Dividend
03-Jan-14 0.25000 11.8736
03-Jan-14 0.25000 11.9353
0.25000
0.25000
28-Mar-14 0.18000 0.18000 11.9043
28-Mar-14 0.18000 0.18000 11.9727
Scheme Name Record Date Individual Corporate Nav(in Rs./Unit) (in Rs./Unit)
Regular Plan - Dividend
Direct Plan - Dividend
Regular Plan - Dividend
Direct Plan - Dividend
Face value: 10`
SBI Magnum Monthly Income Plan - Annual Dividend
30-Mar-12 0.16999 0.16999 11.9240
25-Mar-13 1.00000 1.00000 12.2519
28-Mar-14 0.90000 0.90000 12.0852
28-Mar-14 0.90000 0.90000 13.2439
Scheme Name Record Date Individual Corporate Nav(in Rs./Unit) (in Rs./Unit)
Regular Plan - Annual Div
Regular Plan - Annual Div
Regular Plan - Annual Div
Direct Plan - Annual Div
Face value: 10`
SBI Ultra Short Term Debt Fund - Institutional Plan
30-Nov-11 0.06820 0.06820 10.5865
30-Dec-11 0.07210 0.07210 10.5949
31-Oct-12 8.04860 8.04860 1065.0685
30-Nov-12 7.16380 7.16380 1065.0685
31-Dec-12 7.51440 7.51440 1065.0685
31-Jan-13 7.57150 7.57150 1065.0685
28-Feb-13 6.11300 6.11300 1065.0685
26-Mar-13 7.59860 7.59860 1065.0685
30-Apr-13 9.77720 9.77720 1065.0685
31-May-13 7.28880 7.28880 1065.0685
Scheme Name Record Date Individual Corporate Nav(in Rs./Unit) (in Rs./Unit)
Institutional Plan - Mthly Div
Institutional Plan - Mthly Div
Institutional Plan - Mthly Div
Institutional Plan - Mthly Div
Institutional Plan - Mthly Div
Institutional Plan - Mthly Div
Institutional Plan - Mthly Div
Institutional Plan - Mthly Div
Institutional Plan - Mthly Div
Institutional Plan - Mthly Div
Face value: 1000`
Pursuant to payment of dividend, the NAV of Dividend Option of schemes/plans would fall to the extent of payout and statutory levy, if applicable.Existing plans under the scheme are named Regular w.e.f. 01/01/2013
31-Oct-12 7.69350 7.69350 1038.5068
30-Nov-12 6.85400 6.85400 1038.5068
31-Dec-12 7.32070 7.32070 1038.5068
31-Jan-13 7.37670 7.37670 1038.5068
31-Jan-13 7.43490 7.43490 1038.5068
28-Feb-13 5.95900 5.95900 1038.5068
28-Feb-13 6.01720 6.01720 1038.5068
Scheme Name Record Date Individual Corporate Nav(in Rs./Unit) (in Rs./Unit)
Regular Plan - Mthly Div
Regular Plan - Mthly Div
Regular Plan - Mthly Div
Regular Plan - Div
Direct Plan - Div
Regular Plan - Div
Direct Plan - Div
SBI Ultra Short Term Debt Fund
Face value: 1000`
SBI Treasury Advantage Fund - Monthly Dividend
31-Jan-14 10.20020 10.20020 1010.8384
28-Feb-14 15.07910 15.07910 1002.2322
28-Mar-14 5.00000 5.00000 1008.0506
30-Apr-14 6.50000 6.50000 1008.9995
Scheme Name Record Date Individual Corporate Nav(in Rs./Unit) (in Rs./Unit)
Regular Plan - Dividend
Regular Plan - Dividend
Regular Plan - Dividend
Regular Plan - Dividend
Face value: 1000`
26-Sep-12 0.17500 0.17500 10.7828
26-Dec-12 0.21250 0.21250 10.8544
25-Mar-13 0.25000 0.25000 11.0049
27-Dec-13 0.15000 0.15000 11.1145
28-Mar-14 0.17000 0.17000 11.2864
Scheme Name Record Date Individual Corporate Nav(in Rs./Unit) (in Rs./Unit)
Div-PF Fixed 2 Years
Div-PF Fixed 2 Years
Div-PF Fixed 2 Years
Div-PF Fixed 2 Years
Div-PF Fixed 2 Years
SBI Magnum Gilt Fund - Long Term Div-PF Fixed 2 YearsQuarterly Dividend
Face value: 10`
SBI Magnum Monthly Income Plan - Floater - Annual Dividend
30-Mar-12 0.16999 0.16999 12.3869
25-Mar-13 0.80000 0.80000 12.6563
28-Mar-14 1.10000 1.10000 12.8185
28-Mar-14 1.10000 1.10000 12.8642
Scheme Name Record Date Individual Corporate Nav(in Rs./Unit) (in Rs./Unit)
Regular Plan - Annual Div
Regular Plan - Annual Div
Regular Plan - Annual Div
Direct Plan - Annual Div
Face value: 10`